oil revenues, external debt, and growth in nigeria abstract
TRANSCRIPT

1
Oil revenues, External debt, and Growth in Nigeria
Ibrahim Mohammed Adamu
Department of Economics, Faculty of Social and Management Sciences, Bayero University, Kano, Nigeria.
Correspondence: [email protected]
Abstract: Oil revenues and external debt might have stimulated economic growth in the oil exporting countries via
investment in capital projects. The paper estimated economic growth on oil revenues and external debt after
controlling public investment and population growth over the period 1970-2015. Following the confirmation of the
order of integration, our analysis is based on autoregressive distributed lag bound testing to cointegration approach.
The key findings are that oil revenues and public investment contributes to Nigeria’s economic growth. However,
our findings also indicate that external debt and population growth retards growth. The study suggests that
minimizing fiscal deficits and unnecessarily foreign loans by creating tax avenues through the development of the
non-oil sectors would reduce the dependency syndrome on a single commodity (oil) in Nigeria.
Keywords: Oil revenue; External debt; Economic growth; ARDL.
JEL Classification: Q32, H68, O47.
1. Introduction
Among the oil exporting countries of Africa, Nigeria has substantial crude oil reserves estimated
about 37.1 billion barrels, and being the largest oil exporter in the continent. This has made Nigeria to be
the nineth largest proven crude oil reserves in the World after Venezuela, Saudi Arabia, Iran, Iraq,
Kuwait, United Arab Emirate, Russia and Libya (Organisation Petrolium Exporting Countries, 2016).
In the early 1970s, following the World oil price shocks and the increase in oil production, Nigeria
seemed to be on track of prosperity. Oil windfalls allowed for huge investment plans, and rapidly
increasing government expenditures (Kuijs, 1988). By 1979, Nigeria became a middle income country,
following an increase in oil revenues to USD26 billion (53% of GDP) and a GDP per capita of USD1, 480.
The collapse in the oil prices in the late 1970s made Nigeria vulnerable to macroeconomic shocks as how
reliance the economy had become since oil revenues account about 70 percent of the government
revenues. This causes mounting pressure on the Nigerias fiscal budget, especially in a period of
population explosion, rapid increase in external debt and poor governance (Kuijs, 1988; Okonjo-Iweala
and Osafo-Kwaako, 2007). However, to fill up the oil revenues shortfalls, Nigeria had to obtain different
categories of loans ranging from short, medium to long term from foreign export credit institutions such
as World Bank, International Monetary Fund among others. From USD8.6 billion in 1980, the total
external debt stock rose to USD36.6 billion in 2004 and thereafter, declined to USD3.7 billion as of 2006,
largely due to debt relief of US$18 billion from the Paris club creditors. Of a sudden, the external debt
increased to US$10.7 billion in 2015 (Debt Management Office, 2016). In any case, the huge influx of oil
revenues and external borrowing over the years have not shown any remarkable improvement as the
country’s investments in both physical and social infrastructure are yet to exploit the advantages of the
enormous incomes generated for long term economic growth. Many of the country's indicators remained
very low. For example, available evidence indicates poor infrastructure development to support the
growth process. Hence, life expectancy is low and only less than half of the population is able to have
access to social services such as education and health. Furthermore, over 60 percent of the population are
living on less than USD1 per day (United Nation Development Programm, 2013). In terms of GDP per
capita growth rate, 1.3, 2.7 and 3.5 percent in 1980, 2000, and 2014 are far below the value of 22.2% in 1970
(World Bank, 2015). With this in place, reveals that the bulk of incomes over the years have not add value
to the country’s development indices.
Preprints (www.preprints.org) | NOT PEER-REVIEWED | Posted: 4 December 2017 doi:10.20944/preprints201712.0028.v1
© 2017 by the author(s). Distributed under a Creative Commons CC BY license.
2
The objective of this study is to explore the dynamic effect of oil revenues and external debt on
economic growth in Nigeria. This study is persuaded by the fact that Nigeria’s economic growth has been
driven by oil revenues and probably to be the mainstay for a long time, as currently constitutes a
noteworthy portion of over 90 per cent of foreign exchange earnings and about 83 per cent of government
revenues (Nwaozuzu, 2016). In recent years, Nigeria confronted a challenging macroeconomic crisis. Oil
revenues declined, leading to startling fall in budgetary incomes from oil exports. In spite of a low
benchmark oil price, oil revenues to the country in 2015 were 3.03% lower than anticipated. The nation
lost more than $10 billion in external reserves and depleted its excess crude account. As a result,
government were constrained to cut consumptions in the light of revenue shortages and seeks for
alternative through external borrowing in order to provide fiscal stimulus for the nations budget.
The contribution of this paper is threefold: First, in the light of the review of the existing literature,
this is the first attempt to incorporate external debt within the oil-growth framework in the context of
Nigeria, and I do not know any empirical study that deals with this variables simultaneously at present.
Second, the study mulls over the structural breaks that may occur in the series trend by employing
innovational outlier (IO) test (Perron, 1997), and may enhance the robustness of the unit root tests. Third,
in order to overcome small sample bias, I employ ARDL bounds testing to cointegrating approach
developed by Pesaran et al., (2001) to 45 annual observations spanning from 1970 to 2015.
Following the introduction, section 2 presents literature review, and model, data and econometric
methodology reported in section 3. Section 4 presents the empirical results and discussion while section 6
concludes the paper with policy implications.
2. Literature
2.1 Theory
The poor management of proceeds from resource exports in the majority of resource abundant countries
is ascribed by “Dutch Disease hypothesis” – a circumstance when a country experience a natural resource
boom leading to a sudden influx of foreign exchange earnings and results to real exchange rate
appreciation, which undermine the competitiveness of the tradable sector (see Corden and Neary, 1982;
Corden, 1984; Neary and van Wijnbergin, 1986). In a similar perception, Krugman (1987) viewed resource
boom as a disease when it becomes difficult for the resource abundant country to revive the lagging
sectors following the real exchange rate appreciation, this lower the competitiveness of the tradeable
sectors. Thus, in the long run, the country is at the risk of de-industrialisation, which is a curse to the
country since the lagging sectors are characterized by learning by doing. Sachs and Warner (1995, 2001)
and Auty (2007) pointed out that resource rich country generates a colossal amount of revenues from an
exports of natural resources, however, failed to move the economy forward contrasted with non-resource
abundant countries and results to political instability. Since the resource poor countries focus on wealth
creation while resource abundant countries are centred on rent seeking for. Be that as it may, re-
redistribution of rents among political agents makes these countries rely on primary exports and
undermine the growth potentials.
Nevertheless, it is also perceived that the global oil shocks at different point in time1 has been the
major factor leading to external debt burdens in oil rich countries. Infact, the debt overhang theory
1 The twin oil shocks of 1973 and 1974 increased the crude oil price more than thrice. It later declined slightly between 1975 and
1978, it picked up again from 1979 to 80. However, the 1979 and 1980 oil price windfalls were eroded within the period between 1981
and 1985, as price collapsed by almost 40 percent. By 1986, the price also declined by more than 50 percent. Within the past five
years, the real oil price had fallen from more than a five times multiple of its 1970 value to less than a two times multiple (Gately,
1986).
Preprints (www.preprints.org) | NOT PEER-REVIEWED | Posted: 4 December 2017 doi:10.20944/preprints201712.0028.v1

3
developed by Krugman (1988) and Sachs (1990) viewed that increasing external debt stock have serious
negative effects on per capita GDP growth. Reinhart and Rogoff (2010) pointed out that countries
characterised by high debt burden are likely to experience economic stagnation due to debt service
payments which crowd out domestic investment and affects growth negatively. Pattillo et al., (2011)
argued that a country’s ability for debt repayment rely on the government fiscal effectiveness to absorb
the burden of expenditures. If the source of income (tax base) is insufficient to repay the debt, then the
ability for debt repayment is bounded.
2.2 Relationship between Oil revenue and Economic growth
From the empirical point of view, a plethora of studies have investigated the relationship between
oil revenues and economic growth using distinct data measurement, time frame and methodologies. For
instance, Adedokun (2012) examined the effect of oil export revenues on output growth in Nigeria using
error correction model, and found a positive association between oil revenues and output growth. In a
related study, Evans (2013) investigated the relationship between the Nigeria’s petroleum industry and
per capita income, the result indicates a significant contribution of the Nigerian petroleum industry on per
capita income. Using descriptive analysis, Asekunowo and Olaiya (2012) are interested on why resource
rich countries such as Botswana, Norway and Chile having a diversified economies while Nigeria failed
to improve its economic performance. The study concluded that Nigeria may be lagging behind resulting
from institutional challenges, excessive spending at the expense of foreign borrowing despite the oil
revenues, and some elements of fractionalization, which is another cause of resource curse. Mideksa
(2013) found a positive correlation between oil and gas and per capita GDP for Norwegian economy. It
was estimated that 20 percent of the increase in per capita GDP was influenced by income from oil and
gas export revenues. In a similar study, Mehrara et al., (2010) examined the non-linear relationship
between oil revenues and economic growth for Iran. They found that the response of economic growth to
oil revenues in low regimes were improved than in high regimes of oil revenues. The threshold of oil
revenues in Iran is around 37 per cent. An increase in oil revenues above the threshold level would result
to an adverse effect on the economig growth. What is more, the impact of capital stock on economic
growth in low oil revenues is additionally a great deal more than that in high oil revenues. These results
affirm the resource curse, higher rent-seeking and lower productivity hypothesis, particularly amid boom
periods for oil revenues. Garzak et al., (2012) investigated the relationship between oil export revenues
and government expenditure for the Iranian economy using a wavelet approach over the period 1996
through 2007. They found a highly significant positive relationship between oil revenue and growth. In
the kingdom of Bahrain, Hamdi and Sabia (2013) applied vector error correction model (VECM) to study
the relationship between oil revenue, government expenditure and economic growth. They discovered
response of oil revenue to economic growth was positive and significant, which indicates that oil revenues
have been the major source for government spending to enhance growth. Lorde et al., (2009) found oil has
been the main determinant of economic activity in Trinidad and Tobago. Brunnschweiler (2009)
concluded with a positive and highly significant effect of oil on economic development in transition
economies of the Former Soviet Union (FSU) and Central and Eastern Europe (CEE) between 1990 and
2006. Using the OLS method, Hassan and Abdullah (2015) investigated the impact of oil revenue and the
service GDP of Sudan, found a positive effect of oil revenue on service GDP. A comparative study
between Mexico and Indonesia on policy options implemented during the oil boom era, Usui (1997)
observed that Indonesia implemented good macroeconomic policy framework, which surpass the
occurrence of Dutch disease, while Mexico was unable to utilize the opportunity of the oil boom, which
exerted a negative effect on growth.
2.3 Relationship between External debt and Economic growth
Preprints (www.preprints.org) | NOT PEER-REVIEWED | Posted: 4 December 2017 doi:10.20944/preprints201712.0028.v1
4
Likewise, studies on external debt and economic growth relation has received great attention
among researchers and policy makers since the global debt crisis in 1982. Yet, there has been no concensus
on the exact effect of external debt on growth. Some findings reveals a negative of external debt on
growth, while others found a positive relations. For instance, in a recent study over the period 1970 to
2013, Adamu and Rasiah (2016) found a negative effect of external debt on growth in Nigeria. Using
ARDL bound test, Dauda et al., (2013) examined the impact of external debt on growth in Malaysia, and
reported that accumulation of external debt in Malaysia is associated with an increase in economic growth
up to an optimal level, and further increase of external debt beyond the threshold level affects growth
negatively. For Malawi, Tchereni et al., (2013) investigated foreign debt on economic growth relation from
1975 through 2003. The results indicates a negative and insignificant effect of external debt on growth.
Adegbite et al., (2008) used ordinary least squares and generalised least squares method to examine the
relationship between external debt and growth in Nigeria from 1975 to 2005. They found a negative and
significant effect of external debt and debt service on economic growth. Albeit, at the initial stage the
external debt has affected growth positively, but after the subsequent years it became undesirable.
Similarly, Ayadi and Ayadi (2008) conducted an empirical study on external debt and growth relation in
Nigeria and South Africa. They found a significant as well as negative effect of external debt on growth in
both countries. Unlike Nigeria, South Africa adheres strictly to the use loans, which reduces the
magnitude of the effects on growth.
Contrary to the above findings, Amin and Audu (2006) used annual time series data and
confirmed that external debt influences economic growth in Nigeria while debt service payments crowd
out investment and growth. Frimpong and Oteng-Abayie (2006) used the VECM approach from 1979 to
1999 in Ghana. The study reveals a positive and significant correlation between external debt and
economic growth. This suggests that external debt influenced output growth following the country’s
ability to utilise the available resources for poverty reduction and investment in basic infrastructure
development projects. Bakar and Hassan (2008) also found external debt had a positive and statistically
significant relation with growth in Malaysia over the period 1970-2005. The study concluded that
Malaysia no longer experience debt overhang.
3. Model, Data and Econometric methodology
3.1 Model and Data
The empirical model for the long run relationship to assess the Nigerian economy is specified as follows:
ttttt PGRPUBEDYOLRPCY 43210 lnlnlnln (1)
Where PCYt is per capita GDP, OLRt is the oil revenue (proxied by oil rent), EDYt is the external debt,
PUBt is public investment (as proxy for gross fixed capital formation), and PGRt is population growth.
Accordingly, α0 – α4 are the parameters to be estimated, t and μ are the time period and the error term
while ln indicates variables in logarithmic form. Except per capita GDP and population growth, all
variables are in percentage of GDP. All data were collected from two different databases. Per capita GDP,
oil revenue, external debt and population growth are collected from World Development Indicators,
World Bank while data on public investment were obtained from the World Macroeconomic Research.
The variables included in Eq. (1) are documented and justified in economic literature. For
example, oil revenues have been the major source of income to the Nigerian economy. An increase in oil
revenues directly affects the government expenditure, and stimulate growth. On the other hand, a fall in
the oil price imply decline in oil revenues and may reduces government expenditure and slower growth.
Therefore, the coefficient is expected to be positive. Similarly, excessive foreign borrowing during the oil
Preprints (www.preprints.org) | NOT PEER-REVIEWED | Posted: 4 December 2017 doi:10.20944/preprints201712.0028.v1

5
shocks has also been identified as another factor for poor economic performance. For example, during the
oil boom Nigeria enjoyed credit rating in the International Capital Market (ICM), which allow the country
to borrow heavily to increased expenditure on development projects with anticipation of continued oil
export revenues. As a result much external debt were accumulated much debt (Asekunowo and Olaiya,
2012, Adamu and Rajah, 2016). While high oil revenues allowed governments of the oil exporting
countries to increase their budget on capital projects by providing infrastructure and public services
(Adamu, 2016; Mashayekhi, 1998), therefore, the coefficient of public investment is expected to be
positive. Lastly, the effect of population growth is indeterminate as increase in population can provide
human capital to stimulate economic growth. Conversely, high population growth can divert resources
from capital investment to social services and lower growth (Feder, 1982; Mankiw et al., 1992).
3.3 Unit root test
The study employs two conventional unit root tests – Augmented Dickey Fuller (ADF) (Dickey and
Fuller, 1981) and Phillips and Perron (PP) tests (Phillips and Perron, 1988). The results presented in Table
1 will provide a guide for choosing an appropriate methodology. From Table 1, it is clearly shown that per
capita GDP (PCY), external debt (EDY) and public investment (PUB) are not stationary at level, i.e. I(0),
however, after the first difference they become stationary i.e. I(1). While oil revenue (OLR) and population
growth (PGR) are stationary at level, i.e. I(0). Therefore, all the variables exhibit a mixed order of
integration.
Moreover, For many decades, Nigerian economy has been subjected to economic reforms
following changes in governments leading to structural changes in macroeconomic variables. In this case,
the ADF and PP tests are deficient in providing information on break point. In addition, both tests are
susceptible to loss of power in small samples, especially when errors are serially correlated (Masih and
Masih 2001; Kapetanious et al., 2000). To overcome these problems, I employ test for structural break
using innovation outlier (Perron, 1997), in the following form:
,)(1
1 tit
m
j
ittbtt ycyTDtDUy
(7)
Where ty is the variable of interest, tDU is the dummy variable representing the mean shift at a
particular break point, thus, 1)( tDU if ,Tt otherwise ,0)( tDU TB the break points
and exact periods when the structural break occurred and ∆ is the difference operator. The results are
reported in the third column of Table 1. All the variables order of integration conformed with ADF and PP
tests. This confirmed the robustness of the unit root test with one period point of structural break for each
individual series.
The structural breaks period disclosed by Perron (1997) unit root test (see, Table 1), indicates a
significant changes in the Nigerian economy. For example, in 2001, Nigeria’s per capita GDP picked up
from US$350 to US$457 in 2002, which bring about changes in output growth and general welfare. The
year 1988 coincides with the period when oil prices declined by more than half, which compelled the
country to increase its total debt stock in order to fill up the oil revenue gap. Likewise, between 2005 and
2006, Nigeria witnessed a negotiation with Paris club of creditors on debt relief in which more than 80% of
the Nigeria’s external debt was forgiven under the Highly Indebted Poor Countries (HIPCs) and
Multilateral Debt Relief (MDR) initiatives. As a result, the Nigeria’s external debt reduced drastically from
US$36.6 billion in 2004 to US$3.7 billion as at 2006 (Adamu and Rajah, 2016). The years of 1986 and 1988
are the pick periods of economic reform of fiscal and structural imbalances, declining foreign exchange
following the fall in the oil prices and balance of payment leading to a decline in investment.
Preprints (www.preprints.org) | NOT PEER-REVIEWED | Posted: 4 December 2017 doi:10.20944/preprints201712.0028.v1

6
Table 1- Unit root test
ADF PP P (TB) ADF PP P (TB)
Variabl
e
At Level At first difference
lnPCYt -0.917 -1.228 -4.004 (1991) -5.704*** -5.818*** -5.425 (2002)**
lnOLR t -5.154** -5.832*** -4.791 (1988)*** -6.577*** -9.306*** -6.325 (1988)***
lnEDYt -0.828 -0.974 -3.863 (1996) -5.161*** -5.137*** -9.006 (2006)***
lnPUBt -2.366 -2.545 -3.934 (1984) -6.642*** -6.233*** -8.360 (1986)***
lnPGRt -4.813*** -2.423 -8.738 (1998)*** -6.589*** -2.408 -13.382 (1986)***
Notes: *** and ** indicate 1% and 5% level of significance. Constant and the trend are included in the test
while the break point is in parenthesis indicated by TB. ADF, PP and P stand for Augmented Dickey
Fuller, Phillips-Perron and Perron respectively.
Considering the combination of I(0) and I(1) orders of integration, this allow us to adopt ARDL
bound testing to cointegration approach because of the following advantages: (i) it is appropriate
irrespective of whether the underlying series are integrated of order I(1) or I(0) or mixed (Pesaran et al.,
2001). (ii) Unlike Engle and Granger (1987) and Johansen and Juselius (1990) that consider variables of the
same order of integration, ARDL technique does that, expect all variables are integrated of different order
but not higher than I(1). (iii) it accommodates small samples, particularly between 30 to 80 observations
(Narayan, 2005).
To compute the ARDL bound testing to cointegration approach requires three stages: First, the
long run cointegrating relationship has to be computed using the Wald test (F-test) to decide the joint
significance of the coefficients of the lagged levels of the variables in the unrestricted error correction
model. The null hypothesis is that the coefficients of the lagged variables are equal to zero, which suggests
the none existence of cointegrating relation: ,0: 54321 iiiiinH while the alternative
hypothesis imply at least one of the coefficients is different from zero:
,0: 54321 iiiiiaH for .5,4,3,2,1i Second, the computed Wald value (F-test) of the
ARDL model is compared with the critical values of Pesaran et al., (2001) or Narayan (2005).2 The decision
is that if the computed F value from the ARDL model is greater than upper bound critical value, the null
hypothesis of no long run relationship is rejected and concluded there exists a cointegrating relation, and
contrary to that, indicates the null hypothesis is not rejected and concludes that the cointegrating relation
does not exist. In case where the F value falls in between the upper and lower bound critical values the
result is inconclusive. Third, aspect requires the estimation of the long run and error correction
representation simultaneously. In doing so, I construct an unrestricted error correction model (UECM)
corresponding to Equation (6), which give us the following specification.
k
i
k
i
k
i
tttt
k
i
tt
k
i
tt
tttttt
PGRPUBEDYOLRPCY
PGRPUBEDYOLRPCYPCY
0
1
0 0
15141,3
0
1,2
1
1,1
15141312110
lnlnln
lnlnlnlnlnln
(7)
All variables are defined earlier. ∆ is the first difference operator and k represents the lag length,
respectively.
2 The critical values provided by Narayan (2005) are more preferred over Pesaran et al., (2001) as the former accommodate a sample
size of 30-80 as compared to 500-1000 observations of the latter.
Preprints (www.preprints.org) | NOT PEER-REVIEWED | Posted: 4 December 2017 doi:10.20944/preprints201712.0028.v1
7
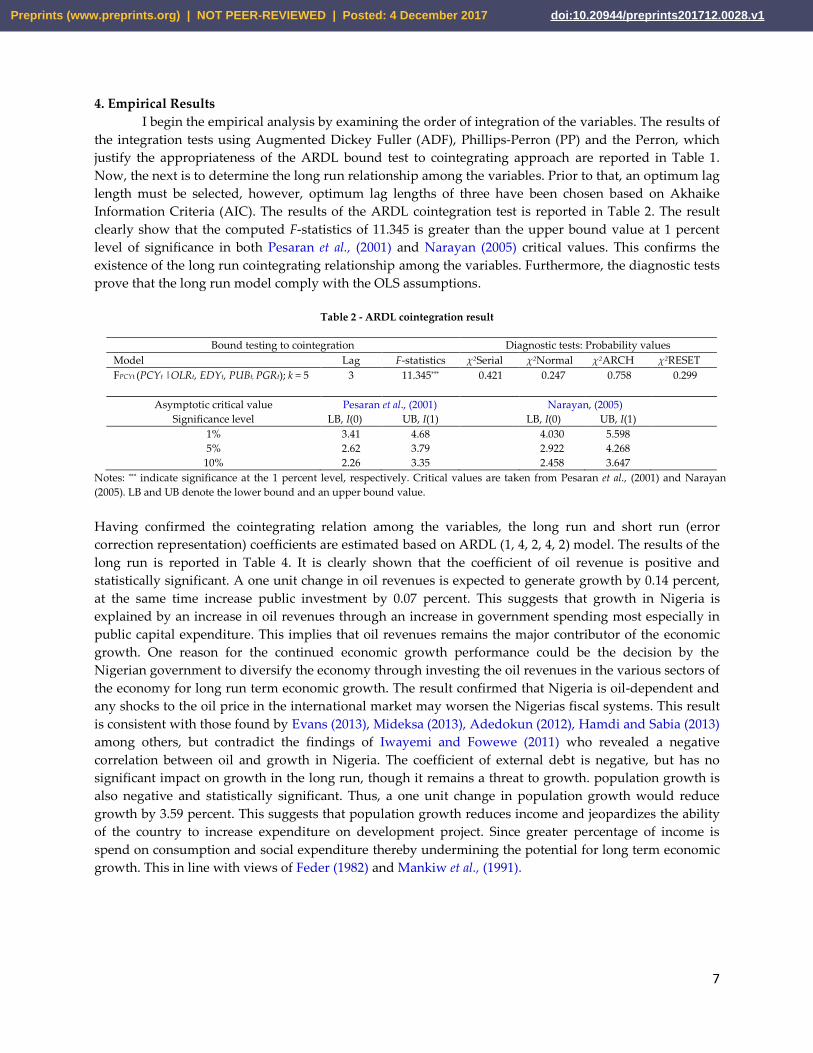
4. Empirical Results
I begin the empirical analysis by examining the order of integration of the variables. The results of
the integration tests using Augmented Dickey Fuller (ADF), Phillips-Perron (PP) and the Perron, which
justify the appropriateness of the ARDL bound test to cointegrating approach are reported in Table 1.
Now, the next is to determine the long run relationship among the variables. Prior to that, an optimum lag
length must be selected, however, optimum lag lengths of three have been chosen based on Akhaike
Information Criteria (AIC). The results of the ARDL cointegration test is reported in Table 2. The result
clearly show that the computed F-statistics of 11.345 is greater than the upper bound value at 1 percent
level of significance in both Pesaran et al., (2001) and Narayan (2005) critical values. This confirms the
existence of the long run cointegrating relationship among the variables. Furthermore, the diagnostic tests
prove that the long run model comply with the OLS assumptions.
Table 2 - ARDL cointegration result
Bound testing to cointegration Diagnostic tests: Probability values
Model Lag F-statistics χ2Serial χ2Normal χ2ARCH χ2RESET
FPCYt (PCYt |OLRt, EDYt, PUBt, PGRt); k = 5 3 11.345*** 0.421 0.247 0.758 0.299
Asymptotic critical value Pesaran et al., (2001) Narayan, (2005)
Significance level LB, I(0) UB, I(1) LB, I(0) UB, I(1)
1% 3.41 4.68 4.030 5.598
5% 2.62 3.79 2.922 4.268
10% 2.26 3.35 2.458 3.647
Notes: *** indicate significance at the 1 percent level, respectively. Critical values are taken from Pesaran et al., (2001) and Narayan
(2005). LB and UB denote the lower bound and an upper bound value.
Having confirmed the cointegrating relation among the variables, the long run and short run (error
correction representation) coefficients are estimated based on ARDL (1, 4, 2, 4, 2) model. The results of the
long run is reported in Table 4. It is clearly shown that the coefficient of oil revenue is positive and
statistically significant. A one unit change in oil revenues is expected to generate growth by 0.14 percent,
at the same time increase public investment by 0.07 percent. This suggests that growth in Nigeria is
explained by an increase in oil revenues through an increase in government spending most especially in
public capital expenditure. This implies that oil revenues remains the major contributor of the economic
growth. One reason for the continued economic growth performance could be the decision by the
Nigerian government to diversify the economy through investing the oil revenues in the various sectors of
the economy for long run term economic growth. The result confirmed that Nigeria is oil-dependent and
any shocks to the oil price in the international market may worsen the Nigerias fiscal systems. This result
is consistent with those found by Evans (2013), Mideksa (2013), Adedokun (2012), Hamdi and Sabia (2013)
among others, but contradict the findings of Iwayemi and Fowewe (2011) who revealed a negative
correlation between oil and growth in Nigeria. The coefficient of external debt is negative, but has no
significant impact on growth in the long run, though it remains a threat to growth. population growth is
also negative and statistically significant. Thus, a one unit change in population growth would reduce
growth by 3.59 percent. This suggests that population growth reduces income and jeopardizes the ability
of the country to increase expenditure on development project. Since greater percentage of income is
spend on consumption and social expenditure thereby undermining the potential for long term economic
growth. This in line with views of Feder (1982) and Mankiw et al., (1991).
Preprints (www.preprints.org) | NOT PEER-REVIEWED | Posted: 4 December 2017 doi:10.20944/preprints201712.0028.v1
8
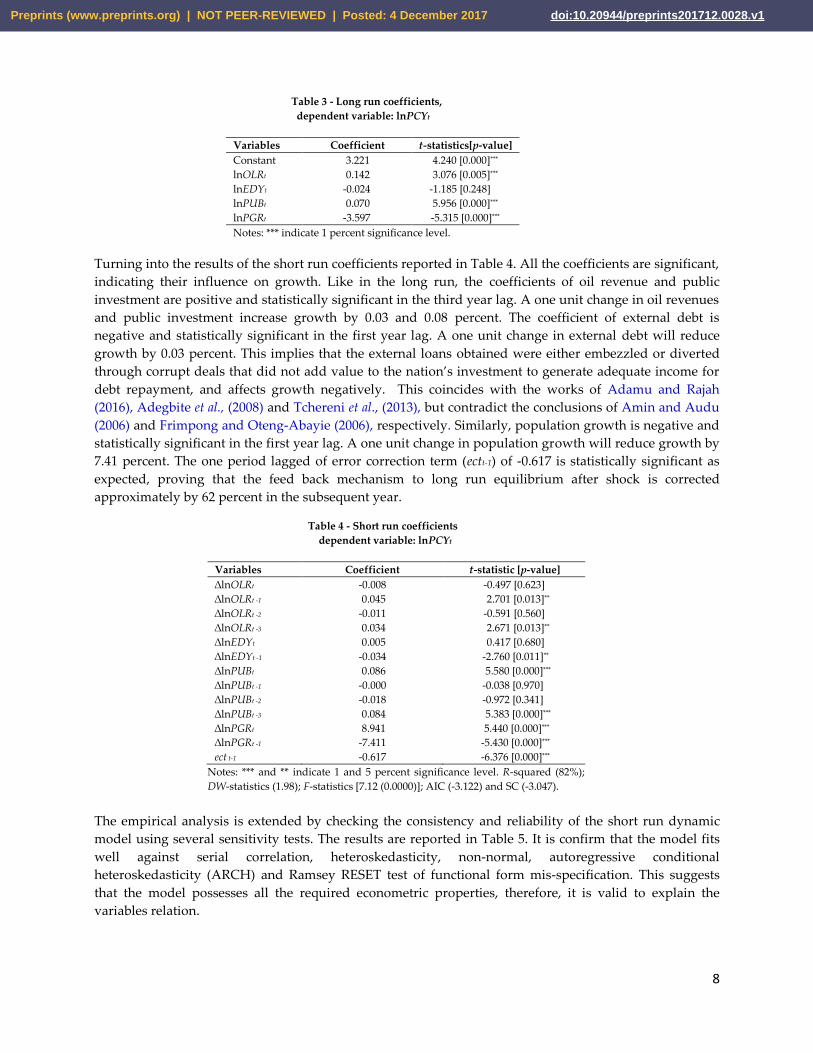
Table 3 - Long run coefficients,
dependent variable: lnPCYt
Variables Coefficient t-statistics[p-value]
Constant 3.221 4.240 [0.000]***
lnOLRt 0.142 3.076 [0.005]***
lnEDYt -0.024 -1.185 [0.248]
lnPUBt 0.070 5.956 [0.000]***
lnPGRt -3.597 -5.315 [0.000]***
Notes: *** indicate 1 percent significance level.
Turning into the results of the short run coefficients reported in Table 4. All the coefficients are significant,
indicating their influence on growth. Like in the long run, the coefficients of oil revenue and public
investment are positive and statistically significant in the third year lag. A one unit change in oil revenues
and public investment increase growth by 0.03 and 0.08 percent. The coefficient of external debt is
negative and statistically significant in the first year lag. A one unit change in external debt will reduce
growth by 0.03 percent. This implies that the external loans obtained were either embezzled or diverted
through corrupt deals that did not add value to the nation’s investment to generate adequate income for
debt repayment, and affects growth negatively. This coincides with the works of Adamu and Rajah
(2016), Adegbite et al., (2008) and Tchereni et al., (2013), but contradict the conclusions of Amin and Audu
(2006) and Frimpong and Oteng-Abayie (2006), respectively. Similarly, population growth is negative and
statistically significant in the first year lag. A one unit change in population growth will reduce growth by
7.41 percent. The one period lagged of error correction term (ectt-1) of -0.617 is statistically significant as
expected, proving that the feed back mechanism to long run equilibrium after shock is corrected
approximately by 62 percent in the subsequent year.
Table 4 - Short run coefficients
dependent variable: lnPCYt
Variables Coefficient t-statistic [p-value]
∆lnOLRt -0.008 -0.497 [0.623]
∆lnOLRt -1 0.045 2.701 [0.013]**
∆lnOLRt -2 -0.011 -0.591 [0.560]
∆lnOLRt -3 0.034 2.671 [0.013]**
∆lnEDYt 0.005 0.417 [0.680]
∆lnEDYt -1 -0.034 -2.760 [0.011]**
∆lnPUBt 0.086 5.580 [0.000]***
∆lnPUBt -1 -0.000 -0.038 [0.970]
∆lnPUBt -2 -0.018 -0.972 [0.341]
∆lnPUBt -3 0.084 5.383 [0.000]***
∆lnPGRt 8.941 5.440 [0.000]***
∆lnPGRt -1 -7.411 -5.430 [0.000]***
ect t-1 -0.617 -6.376 [0.000]***
Notes: *** and ** indicate 1 and 5 percent significance level. R-squared (82%);
DW-statistics (1.98); F-statistics [7.12 (0.0000)]; AIC (-3.122) and SC (-3.047).
The empirical analysis is extended by checking the consistency and reliability of the short run dynamic
model using several sensitivity tests. The results are reported in Table 5. It is confirm that the model fits
well against serial correlation, heteroskedasticity, non-normal, autoregressive conditional
heteroskedasticity (ARCH) and Ramsey RESET test of functional form mis-specification. This suggests
that the model possesses all the required econometric properties, therefore, it is valid to explain the
variables relation.
Preprints (www.preprints.org) | NOT PEER-REVIEWED | Posted: 4 December 2017 doi:10.20944/preprints201712.0028.v1

9
Table 5- Short run consistency and sensitivity tests
Test Null hypothesis Statistics [p-value] Inference
χ2Serial correlation (2) Ho: No serial correlation 0.254 [0.776] Do not reject Ho
χ2Normal Ho: Normality of µ 1.732 [0.293] Do not reject Ho
χ2ARCH (1) Ho: Homoskedasticity 0.065 [0.798] Do not reject Ho
χ2RESET (1) Ho: Model correctly fitted 0.515 [0.477] Do not reject Ho
I also conducted structural stability test using cumulative sum (CUSUM) and the cumulative sum of
square residuals (CUSUMSQ) tests (Brown et al., 1975). The results are shown in Figure 1, which indicates
that the respective bands lie within the 5 percent confidence interval. This suggests that the classical
assumptions are not violated by the residuals.
-20
-15
-10
-5
0
5
10
15
20
86 88 90 92 94 96 98 00 02 04 06 08 10 12 14
+5% Threshold level
-5% Threshold level
-0.4
-0.2
0.0
0.2
0.4
0.6
0.8
1.0
1.2
1.4
86 88 90 92 94 96 98 00 02 04 06 08 10 12 14
+5% Threshold level
-5% Threshold level
Figure 1- Residual plots for CUSUM and CUSUMSQ
Note: The straight lines within the upper and lower bounds represent the critical bound at the 5 percent
significance level.
5. Conclusion
The paper examines the impact of oil revenues and external debt on the Nigerian economy, making use of
autoregressive distributed lag testing to cointegrating approach based on 45 annual observations
spanning from 1970 to 2015. From the empirical estimation, I found oil revenues and pubic investment
promotes economic growth. The result further reveals that external debt and population growth are
negative, which implies that they retard growth. Therefore, the empirical results presented in this paper
suggest that oil revenues has been the source of the Nigerian economic growth from which national
savings is generated for investment. At the same time, the negative effect of external debt indicates poor
management of loans. As a result, debt servicing obligations increases and crowd out resources that are
mean for investment in productive sectors of the economy. This results confirms that even the 2005 debt
relief from the Paris club of creditors to the Nigerian government does not change the adverse effects of
external debt on growth. The policy implications that could be drawn from the findings includes
government efforts to adhere to efficient utilization of the oil proceeds through savings and investment in
the case of falling oil prices. Second, revitalizing the non-oil or lagging sectors could augment revenues
and mitigate the tendencies for further external loans and overcome the Dutch disease syndrome. Third, if
condition warrant for external borrowing, however, emphasis should be given to expenditure on
development projects rather than raising recurrent expenditures, in doing so, adequate supervision has to
be taken to ensure effective implementation of the capital projects to ensure adequate rate of return for
loan repayment.
Conflicts of interest: The author declare no conflict of interest
Preprints (www.preprints.org) | NOT PEER-REVIEWED | Posted: 4 December 2017 doi:10.20944/preprints201712.0028.v1
10
References
Adamu, I. M (2016). Public investment in Nigeria: Does external debt matter. Academic
Journal of Economic Studies, 2(4), 120-138.
Adamu. I. M. and Rajah, R (2016). External debt and Growth Dynamics in Nigeria.
African Development Review, 28(3), 291-303. [10.1111/1467-8268.12206]
Adamu, I. M. and Rasiah, R (2016). On the Determinants of External Debt in Nigeria
(September 10, 2016). Available at SSRN: https://ssrn.com/abstract=2865568 ...
Adedokun, A. J. (2012). Oil export and Economic growth: Descriptive analysis and
Empirical evidence from Nigeria. Pakistan Journal of Social Sciences, 9 (1): 46-58.
Adegbite, E. O., Ayadi, F. S., and Ayadi, O. F (2008), “The Impact of Nigeria's External
Debt on Economic Development”. International Journal of Emerging Market, Vol. 3,
No.3, pp. 285-301.
Amin, A. A., & Audu, I. (2006). External debt, investment and economic growth:
evidence from Nigeria. Central Bank of Nigeria, Economic and Financial Review,
44(1): 81-113.
Auty, R. (2007). Rent Recycling Theory, The Resource Curse, and Development Policy.
Developing Alternatives, 11(1): 7-13.
Ayadi, F. S. and Ayadi, F. O. (2008), “The impact of external debt on economic growth:
A comparative study of Nigeria and South Africa”, Journal of Sustainable
Development in Africa, Vol. 10, No.3, Fall, pp. 234-263.
Bakar, N., & Hassan, S. (2008). Empirical evaluation on external debt of Malaysia.
International Business & Economics Research Journal, 7(2): 95-108.
Brown, R. L., Durbin, J., and Evans, J. M. (1975). Techniques for testing the constancy of
regression relationships over time (with Discussion) Journal of the Royal Statistical
Society, 37: 149–192.
Brunnschweiler, C. N. (2009). Oil and growth in transition countries. CER-ETH Center
of Economic Research at ETH Zurich, Working paper series No. 09/108, Zurich,
Switzerland.
Corden, W. M. (1984). Booming sector and Dutch Disease economics: Survey and
consolidation. Oxford Economic Papers, 36, 359-380.
Corden, W. M., and Neary, J. P. (1982). Booming sector and de-industrialisation in a
small open economy. Economic Journal (92): 825-848. [10.2307/2232670]
Debt Management Office (2016). Annual Report and Statement of Account. Avaialable
at https://www.dmo.gov/.ng/publications/reports/dmo-annual-report-statement-
of-accounts.
Dauda, S. N. M, Ahmad, A. H., & Azman-Saini, W. N. W. (2013). Does External Debt
Contribute to Malaysia Economic Growth?. Economic Research-Ekonomska
Istraživanja, 26(2), 51-68.
Dickey, D. A. and Fuller, W. A. (1981). “Likelihood Ratio Statistics for Autoregressive
Time Series with a Unit Root". Econometrica, 49 (4): 1057-1072. [10.2307/1912517].
Preprints (www.preprints.org) | NOT PEER-REVIEWED | Posted: 4 December 2017 doi:10.20944/preprints201712.0028.v1

11
Engle, R. F. and Granger, C. W. J. (1987). Co-integration and Error Correction:
Representation, Estimation, and Testing. Econometrica, 55 (2): 251-276.
[10.2307/1913236]
Evans, O. (2013). Correlations between the Petroleum Industry and the Per Capita
Income in Nigeria: Cointegration and Error Correction Model Approach.
Munich Personal RePEc Archive (MPRA) paper No. 51650.
Feder, G. (1982). On export and economic growth. Journal of Development Economics, 12,
59-73. [10.1016/0304-3878(83)90031-7]
Frimpong, J. M., & Oteng-Abayie, E. F. (2006). The impact of external debt on economic
growth in Ghana: A cointegration analysis. Journal of Science and Technology, 26
(3): 122-131.
Garzak, M., Azma, F., and Jafari, R. (2012). Relationship between oil revenues and
government expenditure using wavelet analysis method: Evidence from Iran.
Economics and Finance Review, 2 (5): 52-61.
Gately, D. (1986). Lessons from the 1986 Oil Price Collapse. Brookings Paper on Economic
Activity, 2, 237-284.
Hamdi, H. and Sabia, R. (2013). Dynamic relationships between oil revenue,
government spending and economic growth in an oil-dependent economy.
Economic Modelling, 35: 118-125. [10.1016/j.econmod.2013.06.043]
Hassan, K. and Abdullah, A. (2015). Effect of Oil Revenue and the Sudan Economy:
Econometric Model for Services Sector GDP. Procedia Social and Behavioral
Sciences, 172: 223-229.
Iwayemi, A. and Fowowe, B. (2011). Impact of oil price shocks on selected
macroeconomic variables in Nigeria. Energy Policy, 39: 603-612.
[10.1016/j.enpol.2010.10.033]
Johansen, S. and Juselius, K. (1990). Maximum likelihood estimation and inference and
cointegration with application to the demand for money. Oxford Bulletin of
Economics and Statistics, 52: 169-2010. [10.1111/j.1468-0084.1990.mp52002003.x]
Kapetanious, G., Shin, Y., and Snell, A. (2000). Testing for a Unit Root against Nonlinear
STAR Models. Discussion paper series No. 69, Edinburgh School of Economics,
UK.
Krugman, P. (1988). Financing vs Forgiving a debt overhang. Journal of Development
Economics, 29(3): 253-268. Kuijs, L. (1988). Determinants of inflation, exchange rate
and output in Nigeria. IMF working paper No. 98/160. International Monetary
Fund, Washington, D.C.
Lorde, T., Jackman, M., and Thomas, C. (2009). The macroeconomic effects of oil price
fluctuations on a small open oil-producing country:The case of Trinidad and
Tobago. Energy Policy, 37: 2708–2716. [10.1016/j.enpol.2009.03.004]
Mankiw, N. G., Romer, D., and Weil, D. (1992). A Contribution to the Empirics of
Economic Growth. Quarterly Journal of Economics, 107, 407-438. [10.2307/2118477]
Preprints (www.preprints.org) | NOT PEER-REVIEWED | Posted: 4 December 2017 doi:10.20944/preprints201712.0028.v1

12
Mashayekhi, A. N. (1998). Public finance, oil revenue expenditure and economic
performance: a comparative study of four countries. System Dynamics Review, 14
(2-3): 189-219. [10.1177/0144598716631656]
Masih, R., and Masih, A. M. (2001). Long and short term dynamic causal transmission
amongst international stock markets. Journal of international Money and Finance,
20(4), 563-587. [10.1016/s0261-5606(01)00012-2]
Mehrara, M., Maki, M. and Tavakolian, H. (2010). The relationship between oil revenues
and economic growth, using threshold methods (the case of Iran). OPEC Energy
Review, 34 (1): 1-14. [10.1111/j.1753-0237.2010.00172.x]
Mideksa, T. K. (2013). The economic impact of natural resources. Journal of Environmental
Economics and Management, 65: 277-289. [/10.1016/j.jeem.2012.07.005]
Narayan, P. K. (2005). Testing the unit root hypothesis when the alternative is a trend
break stationary process: an application to tourist arrivals in Fiji. Tourism
Economics, 11(3): 351-364.
Nwaozuzu, C (2016). Dwindling oil revenue: Economic implications for governance,
business and development. Avaialable at
http://globalpatriotnews.com/dwindling-oil-revenues-economic-implications-for-
governance-business-and-development-by-prof-chijioke-nwaozuzu/
Oganization of the Petroleum Exporting Countries (2016). Annual Statistical Bulletin.
Available at http://www.opec.org/opec_web/en/publications/337.htm.
Okonjo-Iweala, N., & Osafo-Kwaako, P. (2007). Nigeria's economic reforms: Progress
and challenges. Brookings Global Economy and Development Working Paper No.6.
Pattillo, C., Poirson, H., & Racci, L. A. (2011). External debt and growth. Review of
Economics and Institutions, 2(3): 1-30. [10.5202/rei.v2i3.45]
Perron, P. (1997). Further evidence on breaking trend functions in macroeconomic
variables. Journal of Econometrics, 80: 355-385. [10.1016/s0304-4076(97)00049-3]
Pesaran, M. H., Shin, Y., and Smith, R. J. (2001). Bounds Testing Approaches to the
Analysis of Level Relationships. Journal of Applied Econometrics, 16: 289-326.
[10.1002/jae.616]
Phillips, P., Perron, P. (1988). "Testing for a Unit Root in Time Series Regression”.
Biometrica, 75 (2): 335-346. [10.1093/biomet/75.2.335]
Reinhart, C. M., & Rogoff, K. S. (2010). Growth in a time of debt. American Economic
Review, 100(2): 1-9.
Sachs, J. D. (1990). Introduction to Developing Country Debt and Economic
Performance: The Country Studies -The Country Studies - Argentina, Bolivia,
Brazil, Mexico J. D. Sachs. U.S.A, University of Chicago Press.
Sachs, J. and Warner, A. (1995). Natural resource abundance and Economic growth.
NBER Working Paper No. 5398, National Bureau of Economic Research,
Cambridge, U. K.
Preprints (www.preprints.org) | NOT PEER-REVIEWED | Posted: 4 December 2017 doi:10.20944/preprints201712.0028.v1

13
Sachs, J. and Warner, A. (1997). Natural Resource Abundance and Economic Growth.
Revised Version, Harvard University, Mimeo.
Sachs, J. and Warner, A. (2001). The curse of natural resources. European Economic
Review, 45: 827–838. [10.1016/s0014-2921(01)00125-8]
Tchereni, B. H. M., Sekhampu, T. J., and Ndovi, R. F. (2013), “The impact of foreign debt
on Economic growth in Malawi”, African Development Review, Vol. 25, No.1,
March, pp. 85-90. [10.1111/j.1467-8268.2013.1205.x]
United Nation Development Programm (2013). Nigeria MDGs Report. Avaialable at
http://www.ng.undp.org/content/nigeria/en/home/library/mdg/2013MDGsReport
NG.html.
Usui, N. (1997). Dutch disease and policy adjustments to the oil boom: a comparative
study of Indonesia and Mexico. Resources Policy, 23(4): 151-162. [10.1016/s0301-
4207(97)000023-8]
Van Wijnbergen, S. (1984). The Dutch Disease: A disease after all. Economic Journal, 94:
41-55. [10.2307/2232214]
World Bank (2015). Nigeria Economic Report, No. 1 May. Avaialable at
https://openknowledge.worldbank.org/handle/10986/23581?show=full.
World Bank(2015). World Development Indicators, World Bank. Avaialable at
http://www.databank.worlbank.org/data/reports.aspx?source=worlddevelopmen
t indicators#c_n”.
Preprints (www.preprints.org) | NOT PEER-REVIEWED | Posted: 4 December 2017 doi:10.20944/preprints201712.0028.v1