oil-based technology and economy prospects for the future€¦ · preliminary edition december 2003...
TRANSCRIPT

p r e l i m i n a ry e d i t i o n d e ce m b e r 2 0 0 3 p r e pa r e d f o r d i s cu s s i o n at t h e co n fe r e n ceo i l d e m a n d, p r o d u c t i o n a n d co s t – p r o s p e c t s f o r t h e f u t u r e
oil-based technology and economy
prospects for the futureA s h o r t i n t r o d u c t i o n t o b a s i c i s s u e s a n d a r e v i e w o f o i l d e p l e t i o n p r o j e c t i o n s
d e r i v e d f r o m d i f f e r e n t t h e o r i e s a n d m e t h o d s
co p enh ag en d ecemb er 10 t h 2 0 03

Units used:
Oil:1 barrel of oil = 1 bo = 159 litres1 Mb = 1 million barrel of oil1 Gb = 1 billion barrel of oil = 1,000 million barrel of oil1 Tb = 1 trillion barrel of oil = 1,000 billion barrel of oil1 bn bbl = 1 Gb
Gas:1 m3 of gas = 1 cubic metre of gas1 billion m3 of gas = 1,000 million m3 of gas
Energy:1 J = 1 Joule1 W = 1 Watt = 1 J/sec
1 MJ = 1 million J1 GJ = 1,000 MJ1 TJ = 1,000 GJ1 Wh = 3600 J1 MWh = 1 million Wh1 GWh = 1,000 MWh1 TWh = 1,000 GWh
1 MW = 1,000 W1 GW = 1,000 MW

Foreword
Oil depletion has been a non-issue in energy policy casting and macro-economicforecasting. However, this year the issue has surfaced in the periodicals of the professionalcommunity of oil geologists and oil economists, notably in a series of articles in the Oil &Gas Journal, July - August 2003. Recently, there has also been an increase in the numberof articles on the issue in newspapers and magazines.
Recognising the world economy’s technological dependence on oil and, hence, theserious consequences of a decline in oil production for which the world community istechnologically unprepared, The Danish Board of Technology and The Society of DanishEngineers wish to draw attention to the issue and to the different analyses of oil resourcesand future oil production potentials published by various researchers and institutions. Inpursuance of this objective, our two institutions have jointly commissioned this review andorganised the conference Oil Demand, Production and Cost - Prospects for the Future, tobe held in Copenhagen on December 10th 2003.
The aim of the review is to outline the characteristics of the cheap-oil economy andprovide the participants in the conference and other interested parties with an overview ofdifferent scenarios for the future development in demand and supply, presented by variousexperienced researchers and institutions who base their analyses on differentmethodologies. The evidence thus provided should constitute a structured framework forthe discussion at the conference.
The review has been prepared by Dr. Klaus Illum, ECO Consult. A workgroup has beenset up to critically discuss and revise the review and to organise the conference.The members of the workgroup participate in their individual capacity and do notnecessarily represent the views of their company or institution. The members of theworkgroup are:
Dr. Flemming Getreuer Christiansen, Geological Survey of Denmark and Greenland (GEUS)Dr. Jerome Dean Davis, Roskilde University Center (RUC)Mr. Tage Dræbye, Dræbye Consulting and Management Dr. Poul Dyhr-Mikkelsen, Danfoss ASMr. David Gibson, The General Worker’s Union in Denmark (SID)Dr. Klaus Illum, ECO ConsultDr. Poul Erik Morthorst, Research Center RisøDr. Jan Reffstrup, DONG AS (Danish Oil and Natural Gas)Project managers:Mrs. Gy Larsen, The Danish Board of Technology Mr. Bjarke Fonnesbech Jensen, The Society of Danish Engineers
A draft of the review, approved by the workgroup, was critically reviewed by
Dr. Ali Morteza Samsam Bakhtiari, Senior expert in corporate planning, Directorate of theNational Iranian Oil Company (NIOC), IranDr. Colin J. Campbell, Petroleum Consultant, Chairman and founder of the Association forthe Study of Peak Oil (ASPO), IrelandDr. Donald L. Gautier, Petroleum Geologist, US Geological Survey, Menlo Park, CaliforniaMr. Francis Harper, Exploration Consultant, Former Manager of Reserves & Resources at BP, UKMr. Jean H. Laherrére, Former President of the Exploration Commission of the Comité desTechniciens of the Union Française de l’Industrie Pétrolière, France

The critical comments and corrections received from these prominent experts wereindispensable for the preparation of the review and we sincerely acknowledge theircontributions.
We also extend our thanks to the members of the workgroup for their valuablecontributions.
We trust that this preliminary edition of the review will serve its purpose in providinga point of departure and a framework for an unprejudiced discussion of the crucial oildemand-and-supply issue. After the December 10th conference the review will be revised,taking into account the proceedings of the conference.
Torben KleinChairman of the Danish Board of Technology
Per Ole FrontChairman of the Society of Danish Engineers

Contents
Preface . . . . . . . . . . . . . . . . . . . . . . . . . . . . . . . . . . . . . . . . . . . . . . . . . . . . . . . 1
Summary . . . . . . . . . . . . . . . . . . . . . . . . . . . . . . . . . . . . . . . . . . . . . . . . . . . . . . 5
1. The Cheap-oil Era . . . . . . . . . . . . . . . . . . . . . . . . . . . . . . . . . . . . . . . . . . . 111.1 The oil-world . . . . . . . . . . . . . . . . . . . . . . . . . . . . . . . . . . . . . . . . . . . . 131.2 Towards the end of the windfall energy economy . . . . . . . . . . . . . . . . . 141.3 The aging resource base . . . . . . . . . . . . . . . . . . . . . . . . . . . . . . . . . . . . 17
2. Oil - the Unique Liquid Fuel . . . . . . . . . . . . . . . . . . . . . . . . . . . . . . . . . . . . 192.1 Conventional oil . . . . . . . . . . . . . . . . . . . . . . . . . . . . . . . . . . . . . . . . . . 20
2.1.1 Liquid fossil oil deposits . . . . . . . . . . . . . . . . . . . . . . . . . . . . . . . . 202.1.2 Natural gas liquids (NGL) . . . . . . . . . . . . . . . . . . . . . . . . . . . . . . . 23
2.2 Non-conventional fossil oil . . . . . . . . . . . . . . . . . . . . . . . . . . . . . . . . . . 232.2.1 Heavy oil, extra heavy oil, and tar sand . . . . . . . . . . . . . . . . . . . . . 232.2.2 Oil Shale . . . . . . . . . . . . . . . . . . . . . . . . . . . . . . . . . . . . . . . . . . . . 242.2.3 Synthetic fossil oil . . . . . . . . . . . . . . . . . . . . . . . . . . . . . . . . . . . . . 24
2.3 Oil from biomass . . . . . . . . . . . . . . . . . . . . . . . . . . . . . . . . . . . . . . . . . 242.4 The terms ‘Reserves’ and ‘Resources’ . . . . . . . . . . . . . . . . . . . . . . . . . 25
3. Demand and Supply . . . . . . . . . . . . . . . . . . . . . . . . . . . . . . . . . . . . . . . . . . 273.1 The IEA World Energy Outlook 2002 . . . . . . . . . . . . . . . . . . . . . . . . . 283.2 World energy, technology and climate policy outlook 2030 (WETO) . . 363.3 Options for the reduction of the demand for conventional oil . . . . . . . . 38
3.3.1 Oil demand determinants . . . . . . . . . . . . . . . . . . . . . . . . . . . . . . . . 393.3.2 Ways and means to restrain the demand for conventional oil . . . . . 40
4. Conventional Oil Reserve Assessments . . . . . . . . . . . . . . . . . . . . . . . . . . . . 454.1 Reserve development . . . . . . . . . . . . . . . . . . . . . . . . . . . . . . . . . . . . . . 454.2 Future discoveries and enhanced recovery techniques . . . . . . . . . . . . . . 474.3 Ultimate reserve estimates . . . . . . . . . . . . . . . . . . . . . . . . . . . . . . . . . . 50
4.3.1 Laherrère’s estimates . . . . . . . . . . . . . . . . . . . . . . . . . . . . . . . . . . 514.3.2 Campbell’s estimates . . . . . . . . . . . . . . . . . . . . . . . . . . . . . . . . . . . 544.3.3 USGS’s probabilistic assessments . . . . . . . . . . . . . . . . . . . . . . . . . 564.3.4 The WETO POLES model . . . . . . . . . . . . . . . . . . . . . . . . . . . . . . 59
5. Oil Demand and Reserve Depletion Scenarios . . . . . . . . . . . . . . . . . . . . . . . 635.1 Demand and supply . . . . . . . . . . . . . . . . . . . . . . . . . . . . . . . . . . . . . . . 645.2 Hubbert depletion scenarios . . . . . . . . . . . . . . . . . . . . . . . . . . . . . . . . . 655.3 Campbell’s depletion scenario . . . . . . . . . . . . . . . . . . . . . . . . . . . . . . . 675.3 EIA’s R/P based depletion scenarios . . . . . . . . . . . . . . . . . . . . . . . . . . . 695.5 OILPROSPECTS scenarios . . . . . . . . . . . . . . . . . . . . . . . . . . . . . . . . . 73

6. On the Economy of Oil . . . . . . . . . . . . . . . . . . . . . . . . . . . . . . . . . . . . . . . . 816.1 On the economy of the cheap-oil technology complex . . . . . . . . . . . . . 81
6.1.1 Motorcars . . . . . . . . . . . . . . . . . . . . . . . . . . . . . . . . . . . . . . . . . . . 816.1.2 Speed . . . . . . . . . . . . . . . . . . . . . . . . . . . . . . . . . . . . . . . . . . . . . . 836.1.3 Trucking . . . . . . . . . . . . . . . . . . . . . . . . . . . . . . . . . . . . . . . . . . . . 83
6.2 On the new economy of oil supply . . . . . . . . . . . . . . . . . . . . . . . . . . . . 836.3 Administering a market with low marginal production costs . . . . . . . . . 866.4 Market experiments with the global economy . . . . . . . . . . . . . . . . . . . . 87
1 The graph above is copied from Kenneth S. Deffeyes: Hubbert’s Peak - The ImpendingWorld oil Shortage. Princeton University Press, 2001. (page 6)
1
Preface
The cheap-oil era is a short anomaly in the Earth’s history.In the 20th century the production of liquid and gaseous hydrocarbons from fossil reservoirs
- oil and natural gas - rose towards a peak.In the 21th century production will be declining.
In the course of a century, technologies based on oil as a unique, easily handled fuel haveshaped the world, its human habitats, its transportation infrastructures, its agriculture.The time available to find substitutes for fossil oil and the technologies depending on it
is much shorter.1
From 1900 onward, people have been “crying wolf” when they had done their R/Parithmetic on conventional oil reserves (R) and annual oil production (P) and found that theratio was only 10 years or so. However, as reserves grew at a faster rate than production,the ratio kept growing, being now about 40 years. So far, so good. Today no one disagreesthat the wolf is out there but differences in analyses and opinions as to when it will attackthe sheep still prevail. An R/P ratio of 40 years does not mean that production can besustained at the present level for 40 years. Production will peak and begin declining longbefore the last barrel has been produced. The question is, when is the peak likely to occurand how steep is the decline likely to be ?
In recent years several experienced oil geologists and some economists have sought todraw attention to their analyses of the prospects for the future supply of cheap, conventionaloil, which - according to their findings - is likely to peak within the next ten or fifteen years.If demand continues to grow until the production peak occurs, the following irrevocabledecline in production will have grave social and economic consequences.
Other researchers, notably researchers in the United States Geological Survey (USGS),which is the governmental body responsible for oil and gas research in the US, and the USEnergy Information Administration (EIA) refute the validity of these analyses, claiming thatthe predictions of an imminent peak in conventional oil production are unrealistic. Also the

2
OECD’s Paris-based International Energy Agency (IEA) states in its World Energy Outlook2002 that supply can meet demand at least until 2030, provided that very large investmentsin exploration and the development of production capacity and pipelines are made. Similarprojections are presented by the European Commission in the report World energy,technology and climate policy outlook (WETO, 2003). However, the IEA explicitly statesits concerns regarding the strenuous actions to be taken by governments in order to increaseproduction at such a rate that economic development in the OECD countries as well as inthe transition economies and the developing countries can be sustained.
Any prediction of future demand and production is counterfactual and, therefore,uncertain. However, the functioning of modern societies is so heavily dependent on oil-based technologies and, therefore, on the supply of oil that governments must gain qualifiedinformation about the past and the probable future development in reserves and productioncapacities in order to assess the number of years that may be made available for thesubstitution of oil-based technologies before the decline in the supply of oil sets in.
This review draws attention to the technological and economic characteristics of the briefsingular era in the history of the Earth in which cheap conventional oil has been available inabundant amounts and presents the perspectives for the prospective ending of this era asassessed by various researchers who base their analyses on different methods.
It is recognised that the assessments to be made should not concern the total geologicaldepositions of oil and other fossil hydrocarbons from which oil can be extracted orsynthesised. Assessments of these abundant amounts are practically irrelevant for theassessment of supplies in the next decades. The assessments to be made concern the volumeof the reserves and the production capacities which can be made available in a foreseeablefuture at competitive costs and without unacceptable environmental impacts. Also,governments should assess the compatibility of the global oil consumption rate with climatechange mitigation policies.
No conclusions are drawn in this review. However, it is found that the evidence providedfrom public domain sources, upon which this review is based, warrants the scrupulous andpolitically unbiased assessment of the opportunities to balance global oil demand and oilproduction capacity in the next decades and the consequences of a decline in oil productioncapacity for the economies in the affluent countries and the economic development in thepoor regions.
If the time-horizon for the impending peak in the production of cheap conventional oilis as short as one or two decades or less, the problems involved in handling the situation areof a specific, practical nature. Therefore, economic policies should not rely on general,theoretical assumptions that technological progress will ensure sufficient supplies of oil orsubstitutes for oil. The investments in new, more energy-efficient end-use techniques andnew discovery and recovery techniques, which are needed to postpone the peak, must bespecified and credible quantitative assessments of the results of the application of suchtechniques must be made by engineers and oil geologists. And economists should makegovernments aware of the national and international economic consequences of a peak inoil supply for which governments, industries and consumers are unprepared and spell outeconomic policy conditions required for the implementation of the investments needed inend-use and supply industries in order to mitigate the consequences before the peak occurs.

3
The low cost of conventional oil has allowed the development within a few decades ofa world economy which is based on extravagant and wasteful use of this unique, mostvaluable fuel and thus depletes its precious resource base much faster than long-termeconomic considerations would justify.

4

5
The theoretically and methodologically different approaches to theassessment of oil reserves and future oil production capacitydescribed in this review result in markedly different estimates andforecasts. However, leaders and financial analysts of the oil industry pointto the ever greater cost of matching growing demand with supplyfrom an aging resource base. Depending mainly on developments in the Middle East and thedevelopment of the world economy in the coming years, productionmay peak within one or two decades. It is a question of geology,technology, economy, and political stability. The trouble is that no realistic energy policy strategies for thewarding off of the impacts of a decline in conventional oil supplyare in sight.
Summary
In Chapter 1, the preamble to the review of oil depletion projections, attention is drawnto the unique properties of the technologies and the economy of the historically singularcheap-oil era. Full appreciation of these properties is essential for the comprehension of thewide range of technical and economic problems to be encountered in the transition to thepost-cheap-oil era.
Drawing on elementary oil and gas geology textbooks and other publications for non-specialists, Chapter 2 gives a concise introduction to the terms and concepts of the oilindustry and, concurrently, a few quotations and figures which serve to outline the currentstatus of the industry.
No governments have taken warnings of an impending peak in oil production into accountin their energy security policies. Regarding the development in the world’s energy demandand supply until 2030, the scenarios presented in the International Energy Agency’s WorldEnergy Outlook 2002 (WEO 2002) and the EU commission’s World Energy and TechnologyOutlook 2003 (WETO) constitute authoritative sources of reference. The development indemand and supply in the WEO 2002 and the WETO scenarios is described in Chapter 3. Thedevelopment trends in these scenarios are derived from theoretical, macroeconomic growthmodels. The underlying growth theory implies the following hypothetical assumptions:
the disparities in living standards between affluent countries with a high per capita energyconsumption and poor countries with a population 5 - 6 times bigger and a low per capitaconsumption will not further destabilise international political and economic relations soas to influence economic growth in the affluent countries.economic growth will not for any period of time be disrupted because of shortages inenergy supply, in particular oil and gas supply. It is assumed that the market can ensurethat the oil and gas industry provides sufficient production capacity to meet the growingdemand.a growth in annual CO2 emission by 70 - 100% will not influence the global climate tosuch an extent that climate change will have a significant negative influence on the global economy.

6
Regarding the hypothesis that there will be no shortage in oil supply, publicly availableempirical evidence provided by oil geologists and the oil industry is reviewed in Chapters4 and 5.
Finally, in Chapter 6 some aspects of the particular properties of the oil economy andthe economic conditions for a transition from the present cheap-oil technological complexwith its aging resource base to a much more energy-efficient technological complex aretouched on.
Considering the publicly available empirical evidence concerning the development in oilproduction capacities, the validity of the hypotheses that the market will ensure sufficientsupplies of cheap oil is disputable. Assessments made by the oil industry itself and itsfinancial analysts point to increasing costs of sustaining the present production capacity anddeveloping the additional capacity needed to meet a growing demand (Chapter 5 (box) andsection 6.2). Cost assessments for the investments needed run as high as $100 billion peryear in the period 2003-2010 (see Note below) but currently the industry investsconsiderably less, assessing project profitability on the basis of a normalised crude oil priceof less than $20 per barrel. Apparently, the anticipation of a future oil price at this level isreasoned by an expected surge in the Iraqi oil production capacity, possibly combined withthe belief that demand growth will be slow in the coming years due to a low economicgrowth rate in the OECD countries.
However, even if the industry’s anticipations of future oil prices were adjusted upwards,possibly because the surge in Iraqi capacity is deferred and the Middle East is furtherdestabilised while economic growth is regained elsewhere - however unlikely such acombination of events may seem - it is uncertain that increased investments will bring aboutnew reserves sufficient to compensate for the decline in production from aging oil fields.Empirical evidence provided by independent, experienced oil geologists indicate decliningreserves and production irrespective of increased efforts by the industry to replenish reservesand increase the production capacity.
Figure 1. Discovery and production history and extrapolated future discovery. See alsosection 4.2, fig. 4.3 and 4.4.

7
The crux of the matter is that most of the existing oil reserves are in oil fields found morethan 20 years ago and that since 1980 annual consumption has exceeded annual newdiscoveries, see fig.1. A growth in oil consumption by 1.6% per year, as assumed in IEA’sWorld Energy Outlook 2002, means that the total global consumption in the next 30 yearswill exceed the total consumption in the 20th century by more than 20%. This implies thatproduction capacity (conventional+non-conventional) must be increased by 60% by 2030.
Enhanced recovery techniques (see section 4.2) and reserve revisions, based on theimproved geological mapping of existing fields, will increase reserves in some fields. Thereis, however, no evidence that such techniques will bring about additional reserves at sucha rate that the gap between annual consumption and annual reserve additions will besignificantly reduced. On the contrary, the US oil production history shows that after thepeak in 1970 reserves and production have been irrevocably declining (see section 5.3, fig.5.7) although enhanced recovery techniques have been applied since the 1980s.
When new reserves are no longer added at the rate at which existing reserves aredepleted, production must peak sooner or later. Based on different assumptions as toultimate reserves, future growth in demand, and decline rates after the peak, the EnergyInformation Agency (EIA) of the US Department of Energy has computed a series ofscenarios for the future development in conventional oil production (section 5.3). Two ofthese scenarios are shown in fig. 2. In the one scenario it is assumed that an exponentialgrowth in demand by 2% per year can be sustained until production peaks in 2016. In theother, this demand growth is sustained until 2037, whereupon production drops almostvertically.
Figure 2. US Department of Energy, Energy Information Administration (EIA), 2000. Seealso section 5.3, fig. 5.6.

2 It should be noted that ultimate reserves of 3000 Gb (billion barrels, bbls) are assumed inthese scenarios. To obtain this quantity, new reserves amounting to 80% of the accumulated reserveadditions until 2000, shown in fig. 1, must be added in the next decades. Considering the reserveaddition record for the last 20 years, shown in fig. 1, this implies a dramatic increase in the rate ofreserve additions in the next decades.
8
Such scenarios, which - apart perhaps from the ultimate reserves assumed2 - cannot beruled out as unrealistic, depict a most unfortunate development path: The world economybecomes more and more dependent on conventional oil until the growing demand can nolonger be sustained. This implies that conventional oil remains cheap until the peak occursand that, therefore, few investments in oil-saving measures and alternative energy sourcesare made. Thus, the oil-based economy will be entirely unprepared for the abrupt shift fromgrowth to decline in the production of conventional oil. The longer production can coverdemand, the more the economy becomes dependent on conventional oil, and the steeper thefall will be.
A detailed country-by-country analysis of reserves and production capacities (section4.3.2) results in the scenario forecast shown in fig. 3. Assuming a demand growth of about1.2% per year in the next years, the peak in oil production occurs in 2010. Thereuponproduction declines at a rate of about 2% per year. Although the demand growth rate islower than in fig. 2, the peak occurs earlier. This is because ultimate reserves, in accordancewith fig. 1, are estimated at 1,900 Gb as against 3,000 Gb in fig. 2.
Figure 3. Oil depletion scenario based on detailed country-by-country analyses of reservesand production capacities. Colin J. Campbell, 2003.
Natural gas can replace oil in boilers and vehicles and be cracked into carbon andhydrogen for use in fuel cells, which can replace internal combustion engines. However,long-distance transport (in gas pipelines or in liquified-gas vessels, see section 3.1, Map 2)as well as distribution and storage of gas is more expensive and energy consuming thantransport and storage of oil. And although natural gas production - conventional plus non-
9
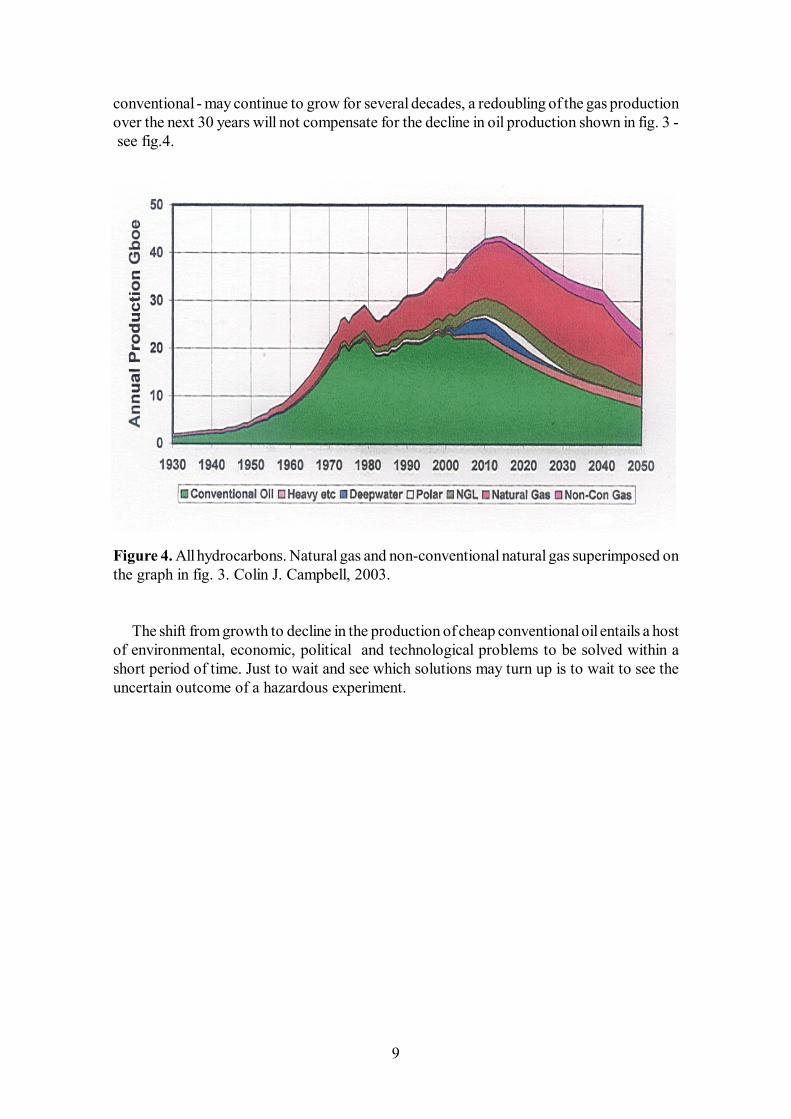
conventional - may continue to grow for several decades, a redoubling of the gas productionover the next 30 years will not compensate for the decline in oil production shown in fig. 3 - see fig.4.
Figure 4. All hydrocarbons. Natural gas and non-conventional natural gas superimposed onthe graph in fig. 3. Colin J. Campbell, 2003.
The shift from growth to decline in the production of cheap conventional oil entails a hostof environmental, economic, political and technological problems to be solved within ashort period of time. Just to wait and see which solutions may turn up is to wait to see theuncertain outcome of a hazardous experiment.
10
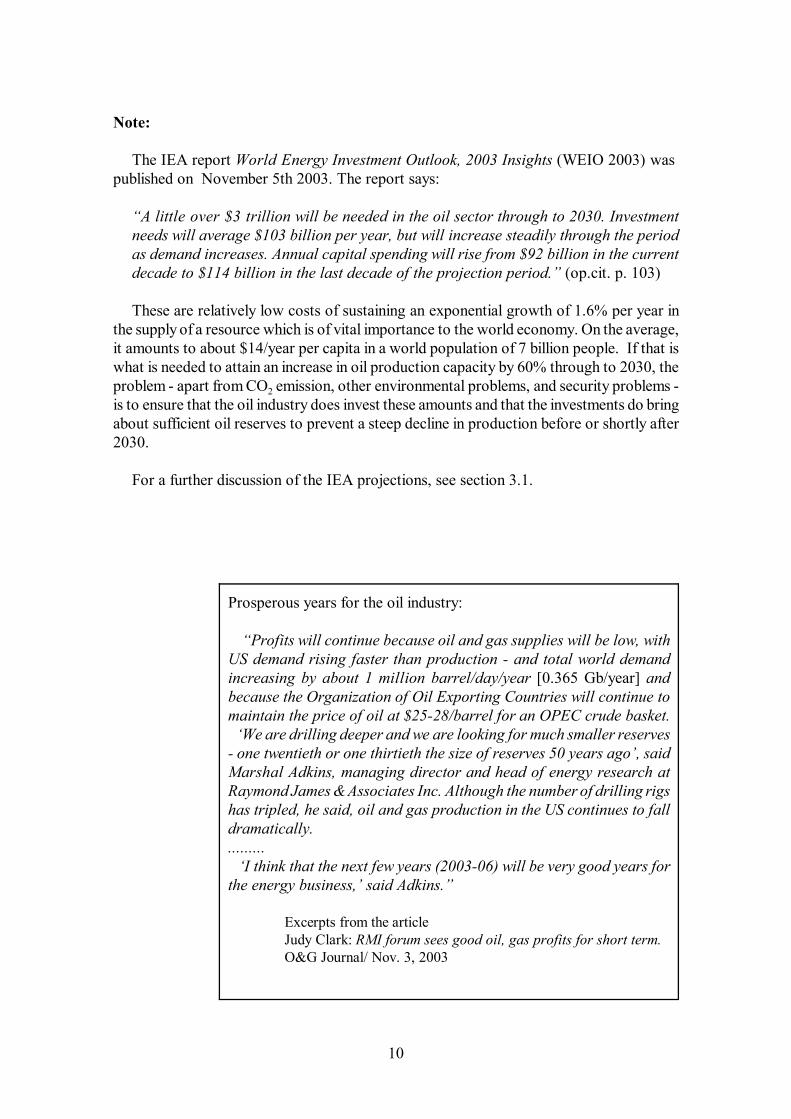
Prosperous years for the oil industry:
“Profits will continue because oil and gas supplies will be low, withUS demand rising faster than production - and total world demandincreasing by about 1 million barrel/day/year [0.365 Gb/year] andbecause the Organization of Oil Exporting Countries will continue tomaintain the price of oil at $25-28/barrel for an OPEC crude basket. ‘We are drilling deeper and we are looking for much smaller reserves- one twentieth or one thirtieth the size of reserves 50 years ago’, saidMarshal Adkins, managing director and head of energy research atRaymond James & Associates Inc. Although the number of drilling rigshas tripled, he said, oil and gas production in the US continues to falldramatically.......... ‘I think that the next few years (2003-06) will be very good years forthe energy business,’ said Adkins.”
Excerpts from the articleJudy Clark: RMI forum sees good oil, gas profits for short term.O&G Journal/ Nov. 3, 2003
Note:
The IEA report World Energy Investment Outlook, 2003 Insights (WEIO 2003) waspublished on November 5th 2003. The report says:
“A little over $3 trillion will be needed in the oil sector through to 2030. Investmentneeds will average $103 billion per year, but will increase steadily through the periodas demand increases. Annual capital spending will rise from $92 billion in the currentdecade to $114 billion in the last decade of the projection period.” (op.cit. p. 103)
These are relatively low costs of sustaining an exponential growth of 1.6% per year inthe supply of a resource which is of vital importance to the world economy. On the average,it amounts to about $14/year per capita in a world population of 7 billion people. If that iswhat is needed to attain an increase in oil production capacity by 60% through to 2030, theproblem - apart from CO2 emission, other environmental problems, and security problems -is to ensure that the oil industry does invest these amounts and that the investments do bringabout sufficient oil reserves to prevent a steep decline in production before or shortly after2030.
For a further discussion of the IEA projections, see section 3.1.

11
1. The Cheap-oil Era
The second half of the 20th century bears no resemblance to any earlier period in thehistory of the Earth. Never before did its population grow from two to six billion. Neverbefore was it a regular experience for millions of people to watch from above the myriadsof motorcars and trucks circulating on motorways around a city when their planeapproached the destination of their holiday or business trip. Never before were so many newurban areas, roads, motorways and airports built. Never before did agricultural and industrialproduction and international trade grow exponentially to the levels of the present economy.And never before did man have the power to exhaust the fish stocks in the seas and tochange the climate.
Obviously, this explosive economic growth, which in all respects has changed the world,was based on abundant supplies of cheap fossil fuels. Coal, mainly for electric powergeneration, oil and gas for the heating of buildings, and petrol and diesel for the millions ofinternal combustion engines in cars, trucks, buses, air planes, tractors, ferries, cargo shipsand fishing boats. Had oil not been found in abundant amounts in the 1950s and 1960s, thebasic infrastructures of the industrialised societies - the physical structures andtransportation networks of the cities, the industrial production networks, the mechanisedagricultural production, etc. - would not have been as they are today. Also, the migrationof millions of people from rural areas to the megalopolises in the third world wasconditioned by oil for the transportation of food and other basic necessities to these huge,overcrowded habitats.
Although there are, naturally, limits to growth on a finite planet, the predominanteconomic growth theories of this singular historic era are based on the axiom that economicgrowth will not be constrained by limitations in the supply of the fossil fuel resources uponwhich the economy is based, in particular the supply of oil. It is recognised that continuedgrowth in the global oil demand will result in accelerated depletion of the so-calledconventional oil reserves, i.e. oil which can easily and cheaply be extracted from oil wells.But economists assume that the market will ensure the smooth transition to so-called non-conventional sources (oil sands and oil shale, conversion of natural gas (gas-to-liquids)) andother chemical energy carriers (natural gas, hydrogen) without major unfortunateconsequences neither for the affluent societies nor for the poor. Thus, in its World EnergyOutlook 2002 the International Energy Agency (IEA) does not foresee any shortage ofliquid fuels before 2030. The report states that “Resources of conventional crude oil andNGLs are adequate to meet the projected increase in demand to 2030, although newdiscoveries will be needed to renew reserves. The importance of non-conventional sourcesof oil, such as oil sands and gas-to-liquids, is nonetheless expected to grow, especially after2020” (op.cit. p. 97).
However, considering the fact that our present economy in all respects depends on thephysical power and mobility provided by petrol and diesel engines and that hundreds ofmillions of people have no immediate alternative to oil for heating their houses, it ishazardous to rely unconditionally on the validity of a continued-growth axiom for whichthere is no empirical evidence. In this singular historic period of transition from growth todecline in conventional oil reserves, the particular geological, economic, demographic andpolitical circumstances which determine the balance between demand and supply of liquidhydrocarbon fuels must be examined with scrutiny.

12
In its World Energy Outlook 2002 the IEA forecasts an increase in oil demand from 26billion barrels in 2000 to 44 billion barrels in 2030, of which only 8 % will be covered bynon-conventional oil. This means that the global economy becomes increasingly dependenton continued supplies of cheap conventional oil - while at the same time the reserves of thischeap conventional oil are depleted at such a rate that a steep decline in the production islikely to occur if not years before then shortly after 2030. Under these circumstances it isquestionable whether liquid fuel production from non-conventional sources can be broughton-stream quickly enough to make up for the decline in conventional oil production.
Regarding demography, wealth distribution and oil demand, the IEA assumes that aglobal economy in which the inequalities between the affluent minority and the poor majorityare perpetuated can be sustained. Today the 1.1 billion people living in the affluent OECDcountries consume 16 billion barrels of oil per year whereas the 4.9 billion living in poorercountries consume 10 billion barrels. In other words, the per capita consumption is 7 timeshigher in the OECD countries than in the rest of the world. In the IEA scenario, this ratiowill be only modestly reduced in the coming decades, the average per capita consumptionbeing 5.7 times higher in the OECD countries than in the rest of the World by 2030 (seesection 3.1, table 3.1). Thus, as long as oil consumption is an indicator of material wealth,the assertion that there will be no oil shortage in the next decades implies that poor peoplesremain poor. Should, for instance, the economy of China continue to grow so that theChinese per capita demand for oil grows to just 50 % of the OECD level by 2030, insteadof the 17 % assumed in the IEA scenario, then the additional demand in that country alonewould amount to 9 billion barrels or a 20 % increase in global demand by 2030.
Another fundamental issue concerning the global economy is climate change. Therationale of the Kyoto agreement on greenhouse gas reductions is to reduce the risks ofeconomic calamities caused by climate change. Therefore, the aim of the agreement is toinitiate the transition to technologies which do not or to a much lesser extent depend onfossil fuels. However, if oil consumption continues to grow, the CO2 emission reductionsrequired to prevent climate change cannot be achieved, in particular because the CO2emission per barrel of non-conventional oil is significantly higher than the emission per barrelof conventional oil. Consequently, unless they are prepared to reduce their oil consumption,the Kyoto signatories are engaging their countries in a futile, expensive exercise. On theother hand, if they do reduce their oil consumption, the lower demand may keep the priceof oil relatively low for a longer period of time. Thus significant CO2 reductions may beattained at low or zero costs for the oil importing countries.
These immediate reflections on the depletion and replacement of oil, on global policiesconcerning the distribution of material wealth, and on economic costs of environmentaldeterioration reveal the complexities, contradictions and inconsistencies encountered in theprocess of technological and economic transition from the short era of cheap oil into a futurewhere the physical power provided by oil will be too expensive to compete with otherpower sources - because of the oil price and because of environmental costs.
In order to comprehend in full the implications of this transition process, the followingfurther reflections on the technological and economic characteristics of the system to betransformed may be of relevance.

13
1.1 The oil-world
Technologies and natural resources are complementary. Coal was needed to fuel thesteam engine and the steam engine was needed to mine and transport coal. Coal and thesteam engine replaced watermills, windmills, horse-drawn coaches, sail ships and humanlabour, thus creating the industrial infrastructures which in turn enabled man to develop thetechnologies needed to exploit another natural resource: crude oil. Yet, had easily accessiblecheap oil not become available from the oil wells in Pennsylvania and Texas in the late 19thcentury, the internal combustion engine would not within a couple of decades have beendeveloped to propel the cars, trucks, ships and aeroplanes, which are basic constituents ofthe present oil-based societies’ technological infrastructure. As it happened, cheap oil andthe internal combustion engine gave rise to an ever-growing demand for cheap oil andengines.
The oil-engine technologies themselves were needed to find and develop new oil fieldswhich ensured that the demand they created was covered by abundant supplies of cheap oil.Also they were needed to find and develop natural gas fields. The world-wide oilprospecting, the drilling, the pumping, and the transport of oil and gas from the wells couldnot have taken place without the oil-engines which propelled the aeroplanes, helicopters, theon-site equipment, the trucks, and the cranes for the laying down of pipelines. Also, theconstruction of huge dam walls for hydropower stations in remote areas could not have beenaccomplished without oil-engines. Moreover, without oil-engine propelled aeroplanes thefirst nuclear bombs would have remained destructive only to those who made them, andwithout the production of nuclear warheads the development of a nuclear power industrywould hardly have been economically feasible. Coal still covers 25 % of the world’s primaryenergy supply - primarily for electric power generation - but without oil it could not be soeasily mined and transported. It should also be recalled that in many towns in the US andEurope the first electric power stations were oil-powered.
Thus, the transition to oil had many more technological ramifications than the transitionto coal which preceded it and laid the grounds for it. Ample power from oil-engines, whichstart at the push of a button, has become available at any place at any time at very low costs.It is Prometheus unbound.
World War II was the first great war in which the mobility of troops, armoury and bombswas provided almost entirely by the oil-fuelled internal combustion engine: in trucks, jeeps,armoured cars, tanks, warships and, most prominently, the fighter and bomber planes.However, while suffering from the attacks by oil-driven war machines, Europe’s civilianswere able to survive without oil. Agriculture was still predominantly horse-powered and thesupply of food did not depend on long-distance transportation of feedstock and agriculturalproducts. Today, half a century later, the situation is different. Without oil the entireeconomy will immediately come to a standstill. Even a modest reduction in supply will makethe economies of the rich countries tremble and a substantial increase in the price of oil willhave a heavy impact on the economies in the rich as well as the poor countries.
The transition to the coal-steam engine era made life easier for those who enjoyed thegoods of industrial production and travelled comfortably in the railway coaches and onboard the steamships. However, life became less easy for those who mined the coal, thosewho shovelled it into the furnaces, and those who carried it on their backs into the stores.With oil its all different. It flows by itself - or assisted by pressure generated by oil-engines -from the wells through pipelines to refineries or tankers which, propelled by oil-engines,

14
transport it to any destination. It is easily distributed and easily stored. It is readily availableas petrol, diesel and fuel-oil everywhere.
1.2 Towards the end of the windfall energy economy
In the short era of cheap oil, all the techniques and technologicalinfrastructures upon which the functioning of present societies isbased have been designed so as to balance investment andmaintenance costs against low costs of oil consumption. When oilprices rise, this balance shifts in favour of other techniques andinfrastructures, meaning that not just some but practically alltechniques and infrastructures must be renewed and restructured.
At the beginning of the 19th century no one could foresee that the coal-basedindustrialisation was to bring about the technologies needed to utilise the then unknown oilresources. And in the second half of the century, when the Diesel and the Otto engine wereinvented, no one knew how much oil could be found to run these engines. It could havebeen much less than the approximately 1.7 trillion barrels found so far. And this planet’stotal endowment of recoverable conventional oil and natural gas liquids could have beenmuch in excess of the 2.3 trillion barrels which it seems likely to obtain at relatively lowcosts. As it is, the world’s conventional oil endowment is a windfall energy asset which ishastily being used - without specific plans for the replacement of oil-based technologiesbeing developed.
Because of low recovery costs, the conventional oil resources have been depleted at amuch faster rate than necessary to provide the goods and services obtained. Had the oilprice been substantially higher, more energy efficient technologies would have beendeveloped and less wasteful local production would have had competitive advantagesagainst goods produced far away. Cars would have done more kilometres per litre andbuildings would have been designed to sustain a comfortable indoor climate at lower oil orgas expenses; railways would have been modernised instead of closed down; energy- savingrecycling would have played a bigger role in industries; and less feedstock and food wouldhave travelled thousands of miles before being consumed.
Thus, in the short era of cheap oil, all the techniques and technological infrastructuresupon which the functioning of present societies is based have been designed so as to balanceinvestment and maintenance costs against low costs of oil consumption. When oil prices rise,this balance shifts in favour of other techniques and infrastructures, meaning that not justsome but practically all techniques and infrastructures must be renewed and restructured.The question is whether this transition will take place smoothly as oil prices rise slowly,allowing the market economy to accommodate to the new conditions. Or whether moreabrupt oil price upswings will cause a self-perpetuating economic recession which willinhibit technological renewal and restructuring.
No economic theory can give a credible answer to this question, simply because there isno empirical evidence upon which the assessment of the validity of economic theoremsconcerning this singular era in the history of economic development can be based.Therefore, attempts to answer the question must be based on specific analyses of the actualcircumstances, based on the best available data on conventional oil reserves; present andpotential future production capacities in the different oil provinces; and alternative demand

3 Presented before the World Wildlife Fund, Fourth International Congress,The Fragile Earth, San Fransisco, 1976.
15
forecasts, resulting from different assumptions as to future technological, social andeconomic development.
In 1976 the geophysicist and social development analyst M. King Hubbert (1903-1989)concluded his paper Exponential Growth as a Transient Phenomenon in Human History3
with the following observations:
“It appears therefore that one of the foremost problems confronting humanity todayis how to make the transition from the precarious state that we are now in to thisoptimum future state by a least catastrophic progression. Our principal impediments atpresent are neither lack of energy or material resources nor of essential physical andbiological knowledge. Our principal constraints are cultural. During the last twocenturies we have known nothing but exponential growth and in parallel we haveevolved what amounts to an exponential-growth culture, a culture so heavily dependentupon the continuance of exponential growth for its stability that it is incapable ofreckoning with problems of nongrowth.
Since the problems confronting us are not intrinsically insoluble, it behooves us,while there is yet time, to begin a serious examination of the nature of our culturalconstraints and of the cultural adjustments necessary to permit us to deal effectivelywith the problems rapidly arising. Provided this can be done before unmanageablecrises arise, there is promise that we could be on the threshold of achieving one of thegreatest intellectual and cultural advances in human history.”
Twelve years later, in 1988, Dr. Hubbert said in an interview:
“Our window of opportunity is slowly closing ... at the same time, it probablyrequires a spiral of adversity. In other words, things have to get worse before they canget better. The most important thing is to get a clear picture of the situation we’re in,and the outlook for the future - exhaustion of oil and gas, that kind of thing - and anappraisal of where we are and what the time scale is. And the time scale is not centuries,it is decades.”
Since then exponential growth has continued for another 15 years and the worldeconomy has year by year become more and more dependent on oil and natural gas. At thesame time, experienced oil and gas geologists have presented quite a ‘clear picture of thesituation we’re in’ and assessed ‘what the time scale is’. On the basis of increasinglydetailed mappings of the Earth’s geological formations and meticulous recordings of thefindings of new oil and gas fields and the development in reserves, they have recorded thehistory of the exploration and discovery of oil and gas reserves and the subsequent depletionof these reserves. Naturally, these recordings do not provide accurate data on thedevelopment in reserves and production - the ultimate yield from any particular oil field canonly be assessed to a certain degree of accuracy and in many cases production potentialforecasts depend on assumptions regarding future investments in oil rigs, recoverytechniques, pipelines, refineries, etc. However, they constitute the only empirical evidencefor the appraisal of the prospects for the future.

4 Peter J. McCabe: Energy Resources - Cornucopia or Empty Barrel ? AAPG Bulletin V.82, No.11 (November 1998)
5 John Mitchell et al.: The New Economy of Oil. Impacts on Business, Geopolitics and Society. Earthscan Publications Ltd, London (2001). Op.cit. p. 46-47.
16
Others, whom Peter J. McCabe of the US Geological Survey refer to as cornucopians4,repudiate the relevance of this pragmatic appraisal of the actual circumstances, which theyrefer to as Neo-Malthusian. They argue that reserves are not fixed but determined by
“the mix of knowledge, technology and investment that sustains the process ofexploration and production sufficiently to meet short- and medium-term demandexpectations. Reserves depend on the interaction of this process, government policiesand, finally, the price people are willing to pay for oil products. Since we cannotknow future technology or prices, we cannot quantify future reserves. This should notbe a concern, since it is the these processes that are important. Ultimately, as[Morris A.] Adelman commented, ‘oil resources are unknown, unknowable andunimportant’ “ 5
The cornucopians subscribe to the frequently cited saying that “the stone age did not endbecause of lack of stones. Likewise, the oil age will not end because of lack of oil”. Historyshows that technologies come and go. As conventional oil becomes too expensive or moreconvenient fuels and technologies become available, it will be replaced by non-conventionaloil, other liquid fuels, electric power or whatever new technologies may turn up. However,few would miss the difference between on the one hand the shift, taking place over hundredsof years, from axes and spearheads made of stone to more effective tools and weapons madeout of bronze, and, on the other, the transition to be accomplished over a few decades ofan eight billion people world economy based on cheap-oil-technologies to an economy basedon other not yet developed technologies.
Yet, the stone age offers an analogy to modern times: Flintstone well suited for tool-making was mined from underground veins. As the miners did not know the extension ofthe veins of relatively easily mined good quality flintstone, one could imagine that they keptproducing the stones at low costs in increasing quantities until one day they suddenly,without warning, came to the end of the veins. Unprepared, because their economistsforesaw continued growth in the cheap-flintstone economy, the tribe faced a suddeneconomic recession as it took time and big investments to open other less easily accessibleveins. Likewise, cheap conventional oil may cover a rising demand for another decade ortwo before a sudden decline in the production occurs. As Peter J. McCabe states:
“... in the long run the supply of fossil fuel is finite, and prices inevitably will riseunless alternate energy sources substitute for fossil energy supplies; however, thereappears to be little reason to suspect that long-term price trends will risesignificantly over the next few decades.” 4.
It is questionable whether under these circumstances the transition to an economy basedon other technologies and fuels will begin early enough to be accomplished smoothly.Growing consumption of cheap oil means increased use of oil-based technologies so thatwhile the conventional reserves are being depleted the economy becomes increasinglydependent on supplies from these reserves.

6 Harry J. Longwell: The Future of the Oil and Gas Industry: Past Approaches, NewChallenges. World Energy, Vol. 5, No. 3, 2002.www.worldenergysource.com/articles/pdf/longwell_WE_v5n3.pdf
7 Matthew R. Simmons is Chairman and Executive Officer of Simmons&CompanyInternational, a specialised energy investment banking firm with offices in the USA and Europe. Thefirm enjoys a leading role as one of the largest energy investment banking groups in the world.
8 Matthew R. Simmons: The World’s Giant Oil Fields. Hubbert Center Newsletter #2002/1.M. King Hubbert Center, Colorado School of Mines. January 2002.
17
1.3 The aging resource base
In an article in World Energy, 2002, Harry J. Longwell, Director and Executive VicePresident of ExxonMobil Corporation, assesses the need for additional oil and gasproduction:
“The catch is that while demand increases, existing production declines. To puta number on it, we expect that by 2010 about half the daily volume needed to meetprojected demand is not on production today - and that’s the challenge facingproducers.
This means industry may need to add some 80 million oil-equivalent barrels perday to production by 2010 to meet projected demand. The cost of doing so couldreach $ 1 trillion, or about $ 100 billion a year. That’s substantially more than theindustry is spending today.”6
Several experienced oil geologists have expressed their concern that considering theevidence provided by reserve additions during the past decade, even such large investmentsmay not bring about the increase in production capacity needed to meet demand. AlsoMatthew R. Simmons7 has drawn attention to reserve assessment and forecast uncertaintiesbecause of a general lack of data on the largest oilfields. In a recent paper8 he presents astudy of oil production in the world’s “giant oilfields”, i.e. fields producing more than100,000 barrels a day. He finds that:
“The world’s 120 largest oilfields produce close to 33 million barrels a day,almost 50% of the world’s crude oil supply. The 62 smallest of these “giant fields”account for 12% of the world’s daily oil supply. In contracts, the fourteen largestaccount for over 20%. The average age of these 14 largest fields is 43.5 years.
Thirty-six giant oilfields that were all discovered more than 40 years ago stillcollectively produce close to 16 million barrels a day. In contrast, twelve giantoilfields found in the past decade together now produce less than one tenth of this,or 1.5 million barrels a day, 2% of the world’s supply. The world clearly has bi-furcated oil supply in terms of both age of our important oilfields and the number ofkey fields propping up our production base. Another 20 to 25 new giant fields havebeen discovered but are still being developed. However, no new field whosedevelopment program is now underway is projected to have daily production inexcess of 250,000 barrels. In sharp contrast, the world’s 19 largest “old giant fields”still produce on average more than 500,000 barrels per day, in spite of an averageage of almost 70 years !”
and notes that:

9 World Energy Outlook 2002, International Energy Agency, 2002, p. 96-97, andWorld Energy Investment Outlook, 2003 Insights. International Energy Agency,November 2003, p.103.
18
“Sooner or later, most of the world’s current population of giant oil fields will allbe in decline. If the world’s future supply needs to result from new fields that aregetting progressively smaller, it could require more than 3,000 new oilfields to befound and developed over the next ten years, compared to slightly more than over400 named new oilfields that were discovered in the past decade.
Until there is far better transparency on the world’s giant oilfield production dataand decline rates, the world can only guess at its future oil supply. There is an urgentneed for better data on all these key fields.”
And he issues a serious warning:
“Proper OPEC oil data would likely shatter the current myth that plentiful quantitiesof cheap oil are abundant throughout the Middle East.”
These analyses are in contrast to the International Energy Agency’s oil productionforecasts. On the basis of the US Geological Survey’s probabilistic conventional oil reserveassessments (see section 4.3.3 ), the IEA assumes that investments in exploration anddevelopment of about $75 billion/year will ensure continued exponential growth inconventional oil production to a level of 40 Gb/year in 2030 as against 27 Gb/year in 2000.9
This means that more than 1,000 Gb will be produced in the period 2000 - 2030, i.e. 40%more than the total global oil production in the 20th century. It also means that the worldeconomy in 2030 will to a much larger extent than today be technologically dependent onoil. Therefore, to avoid serious economic problems, oil production must be sustained at alevel of at least 40 Gb/year for a considerable period of time after 2030, assuming that acontinued increase in demand, partly to satisfy needs in the developing countries, will becovered mainly by non-conventional oil.
For a further discussion of the IEA projections, see section 3.1.
19
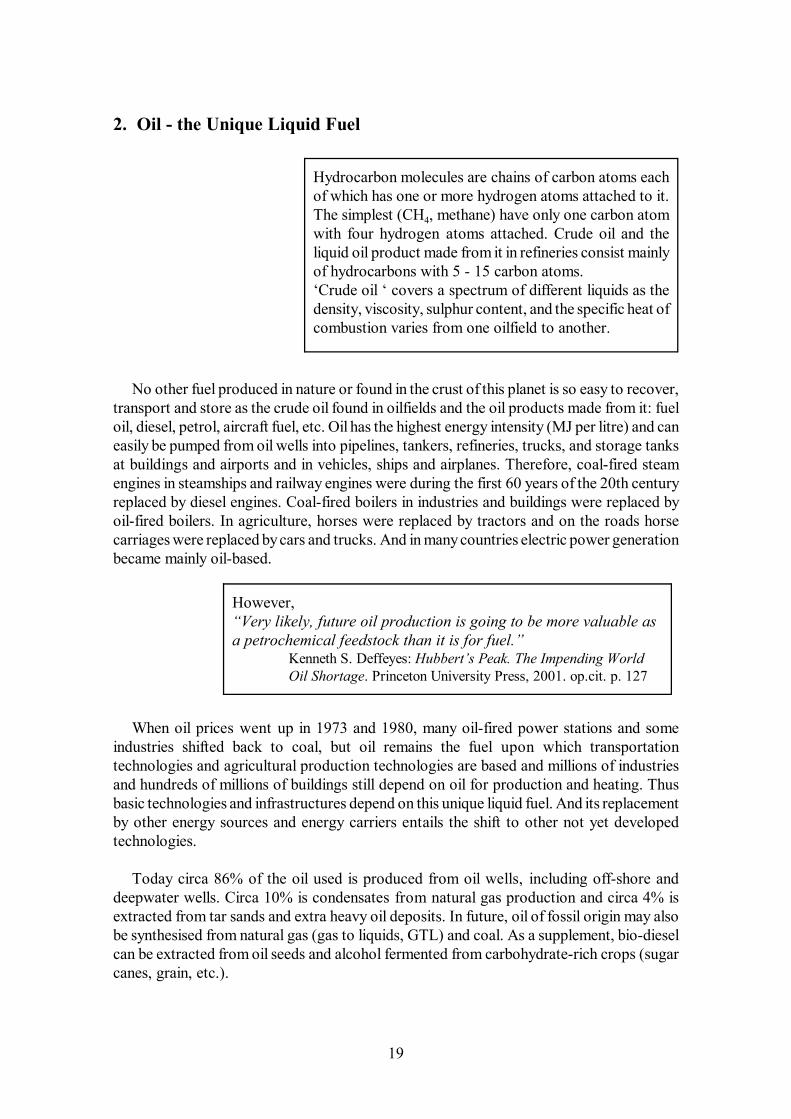
Hydrocarbon molecules are chains of carbon atoms eachof which has one or more hydrogen atoms attached to it.The simplest (CH4, methane) have only one carbon atomwith four hydrogen atoms attached. Crude oil and theliquid oil product made from it in refineries consist mainlyof hydrocarbons with 5 - 15 carbon atoms.‘Crude oil ‘ covers a spectrum of different liquids as thedensity, viscosity, sulphur content, and the specific heat ofcombustion varies from one oilfield to another.
However,“Very likely, future oil production is going to be more valuable asa petrochemical feedstock than it is for fuel.”
Kenneth S. Deffeyes: Hubbert’s Peak. The Impending WorldOil Shortage. Princeton University Press, 2001. op.cit. p. 127
2. Oil - the Unique Liquid Fuel
No other fuel produced in nature or found in the crust of this planet is so easy to recover,transport and store as the crude oil found in oilfields and the oil products made from it: fueloil, diesel, petrol, aircraft fuel, etc. Oil has the highest energy intensity (MJ per litre) and caneasily be pumped from oil wells into pipelines, tankers, refineries, trucks, and storage tanksat buildings and airports and in vehicles, ships and airplanes. Therefore, coal-fired steamengines in steamships and railway engines were during the first 60 years of the 20th centuryreplaced by diesel engines. Coal-fired boilers in industries and buildings were replaced byoil-fired boilers. In agriculture, horses were replaced by tractors and on the roads horsecarriages were replaced by cars and trucks. And in many countries electric power generationbecame mainly oil-based.
When oil prices went up in 1973 and 1980, many oil-fired power stations and someindustries shifted back to coal, but oil remains the fuel upon which transportationtechnologies and agricultural production technologies are based and millions of industriesand hundreds of millions of buildings still depend on oil for production and heating. Thusbasic technologies and infrastructures depend on this unique liquid fuel. And its replacementby other energy sources and energy carriers entails the shift to other not yet developedtechnologies.
Today circa 86% of the oil used is produced from oil wells, including off-shore anddeepwater wells. Circa 10% is condensates from natural gas production and circa 4% isextracted from tar sands and extra heavy oil deposits. In future, oil of fossil origin may alsobe synthesised from natural gas (gas to liquids, GTL) and coal. As a supplement, bio-dieselcan be extracted from oil seeds and alcohol fermented from carbohydrate-rich crops (sugarcanes, grain, etc.).

10 Colin J. Campbell now prefers the term regular oil instead of conventional oil, see section5.3, fig. 5.4.
11 The boundary between conventional and non-conventional fossil oil is drawn differently bydifferent authors. In Colin.J. Campbell: The Coming Oil Crisis (1997), oil in very hostile environment(polar and deepwater), oil in very small accumulations, and oil from enhanced recovery is included innon-conventional oil. In Reserven, Ressourcen und Verfügbarkeit von Energierohstoffen 2002,Bundesanstalt für Geowissenschaften und Rohstoffe, Geozentrum Hannover, conventional oil is definedas oil with a density of 0.8-0.934 g/cm3, including also natural gas liquids.
20
Popular, non-technical and well-illustrated explanations of the geology ofthe formation of oil and gas fields and the methods applied in the explorationof these fields are given in:
C.J. Campbell: The Coming Oil Crisis. Multi-Science Publishing Company& Petroconsultants S.A., 1997.
Kenneth S. Deffeyes: Hubbert’s Peak. The Impending Oil Shortage.Princeton University Press, 2001.
Norman J. Hyne: Nontechnical Guide to Petroleum Geology, Exploration,Drilling and Production. Pennwell Books, 1995.
For technological and economic reasons, a distinction is made between conventional andnon-conventional fossil oil10. Conventional oil is the cheaply recoverable oil produced in thewell-known (conventional) manner from liquid, fossil reservoirs (oil wells) and oil recoveredas natural gas liquids (NGL)11. So far conventional fossil oil has covered the bulk of thedemand. The production of non-conventional fossil oil - i.e. heavy and extra heavy oil, oilfrom tar sands, oil derived from oil shale, and synthetic oil made on the basis of coal ornatural gas - requires other techniques and is more costly in terms of money, energyconsumption in the production process, and environmental impacts. Oil production frombiomass, which is also non-conventional, requires yet other techniques and has othereconomic costs and environmental implications.
Therefore, the coming peak and the subsequent decline in conventional oil productionmarks a shift in the technology and economy of energy supply, even if non-conventionalfossil oil production is allowed to make up for the decline in conventional oil production.However, as long as conventional oil can be produced in sufficient amounts at low costs itwill continue to dominate the market, thus delaying the development of facilities for theproduction of non-conventional fossil oil as well as oil from biomass.
2.1 Conventional oil
2.1.1 Liquid fossil oil deposits
The source of fossil oil and natural gas is organic matter (from algae, plants and animals)mixed with sand and mud in sediments deposited in river beds and estuaries and on seabottoms within a short epoch of the Earth’s history:

21
These sedimentary source rocks are very rare organic rich clays deposited underexceptional conditions of extreme global warming. The bulk of the world’s oil comesfrom just two short epochs 90 and 145 million years ago when the algal growthproliferated. The organic material was preserved only in special geotectonic settings,mainly in rifts of stagnant water low in oxygen. These rifts were later filled up bysands and clays, washed in by rivers and currents. (Colin J. Campbell)
The source rocks were in the course of time buried under other sediments of eroded rocks,chalk deposits, salt horsts, lava, and rock displaced by tectonic movements. As a sourcerock is covered deeper and deeper, its temperature increases. When it is covered to a depthof more than 2,000 metres and less than 5,500 metres its temperature is in the interval 65o
C to 150o C - the so-called oil window - where the formation of oil can take place. At lowerdepths the temperature is too low. At the higher temperatures at greater depths the organicmatter was transformed into natural gas.
The chemical processes in which oil is formed are complex and slow. As oil drops areformed they slowly migrate upwards because their density is lighter than the water fillingthe pores of the source rock. If gas is formed in deeper layers of the source rock, it likewisemigrates upwards. Thus most of the oil and gas eventually escapes or is decomposed at thesurface of overlying water-saturated rocks. Only at places where the oil and/or gas migratingupwards was trapped under a dome or in a fault trap of impenetrable rock did it form an oilor gas field (fig. 2.1).
Figure 2.1 Oil and gas trap in a dome or anticline (left). Formation of a tilted fault blocktrap (right). Norman J. Hyne: Nontechnical Guide to Petroleum Geology, Exploration,Drilling and Production. PenWell Publishing Company, Oklahoma 1995.

12 Jean Laherrère: Future of Oil Supplies. Presentation at the Seminar Centre of Energy Conservation, Zürich, May 7th 2003.
22
Walter Ziegler, Oil geologist and explorer, on the search for oil and gasbasins: “Each successful basin has its source system, by which I mean notonly the rock itself, but the timing of generation and migration. It is athermokinetic process whereby the rocks give up their oil and gas oncritical exposure to heat. In addition, the preservation of the oil and gasformed is vitally important: all oilfields leak over time. So we had tosearch for structures that had been charged in the relatively recentgeological past.”
“It was my good fortune to live during an epoch when petroleumgeology became a science, subject to rigorous scientific discipline. It iswell capable of answering questions about the availability ofhydrocarbon resources on which the modern economy depends. Ourstudies have confirmed beyond any doubt that the globe has a decidedlyfinal potential for oil exploration. The implications are colossal.”
Excerpts from C.J. Campbell: The Coming Oil Crisis, p. 25-26.
This knowledge about the particular geological circumstances under which oil and gaswas formed and deposited in fields in the crust of the Earth enables geologists to point outgeological formations where there is a chance of finding oil or gas. By means of 3-dimensional seismic mapping they can locate areas where source rocks are found at theproper depth under cap rocks which may have prevented the oil and/or gas to escape.
By 2002, 74 380 new field wildcats had been drilled in provinces outside the USA andCanada. The average success ratio was 30%, increasing to 40% over the last 10 yearsbecause of improved discovery methods and techniques. Thus, more than 20 000 fields orfield extensions were discovered, bringing about an estimated 1,700 Gb of recoverablereserves.12
However, the reserves found per 10 000 wildcats drilled have been steadily decliningfrom about 600 Gb found by drilling the first 10 000 wildcats to about 100 Gb found bydrilling the last 10 000. Moreover, the success rates, measured as the findings per 1 000wildcats, are very different for the different regions. In the Middle East, more than 400 Gbwere found by the drilling of about 3 000 wildcats. In Europe, by contrast, it took thedrilling about 20 000 wildcats to find less than 100 Gb. In the US a large number of wildcatswere drilled by prospectors in the early oilrush, everyone hoping to find an oilfield in hisbackyard. Hence, the success rate appears to be very low: more than 300 000 wildcats weredrilled to find about 200 Gb.
These statistics are reflected in fig. 4.3. The biggest discoveries were made in the periodfrom 1930 to 1980. Since then, average annual discovery has been declining in spite ofimproved discovery methods and techniques.

13 Jean Laherrère, personal communication.
23
“Saudi Arabia’s oil is so easily reached that it takes little morethan a pipe stuck in the ground to set it gushing out. To getShell’s tar sand project [in Alberta, Canada] off the ground, bycontrast, required well over 10,000 employees and a hugeindustrial operation ....Shell’s project is already an incredibly complex operation at itscurrent output of below 200,000 barrels a day. But that is a dropin the bucket compared with Saudi Arabia’s daily production ofabout 8 million barrels.” Quotation from the article There’s oil in them tar sands, The Economist June 28th-July 4th 2003.
2.1.2 Natural gas liquids (NGL)
When natural gas from fields with a high temperature and pressure is cooled anddecompressed, some hydrocarbons contained in the gas condensate at the wellhead into oilof a composition resembling low-octane petrol. Other liquids (Natural Gas Plant Liquids(NGPL) are produced in the gas processing plants. Natural Gas Liquids (NGL) comprisecondensate and NGPL. They can be mixed with crude oil and thus contribute to theconventional oil production. (In the US, one quarter of the oil production is NGPL13).They can, however, also be cracked into gas and thus increase the gas production. Thus, theNGL contribution to the conventional oil production depends partly on the production ofnatural gas and partly on the ratios of oil prices to the gas prices at the different productionsites.
2.2 Non-conventional fossil oil
2.2.1 Heavy oil, extra heavy oil, and tar sand
Oil which has migrated over long distances from the source rock to shallow depths hasbeen exposed to bacteria. The bacteria have removed the light molecular components andthus degraded the lighter oil into heavier substances: heavy oil, bitumen, tar or asphalt.Heavy oil and extra heavy oil is by some authors defined as oil with a density of 0.934 - 1.0g/cm3 and > 1.0 g/cm3 respectively. Heavy oil can be pumped to the surface while extraheavy oil, which is heavier than water, requires special recovery techniques: steam injectionor the injection of a solvent which liquefies the oil. Bitumen is oil with a viscosity higherthan 10,000 mPa.
Tar sand is a sandstone which contains very heavy oil (bitumen). Tar sand deposits nearthe surface are mined with huge 400-tonne payload shovels (4-metre tall tyres) and dumpedinto a hot-water mixer where the sand (84 - 92 % by volume) sinks to the bottom. Fromdeeper deposits the bitumen is extracted by the injection of steam into vertical and horizontalmulti-directional wells to create a fluid mix of hot water and bitumen. After recovery, thebitumen is treated with steam to crack it into crude oil.

14 Kerogen is a complex mixture of large molecules containing mainly hydrogen and carbonbut also nitrogen, oxygen, and sulphur.
15 In the so-called Bergius process, developed in Germany during World War I, oil is formedin a process where coal and hydrogen react at a temperature of about 500o C and a pressure of severalhundred bar. Per tonne of coal, about 160 litres of petrol, 190 litres of diesel, and 130 litres of fuel oilcan be produced..
16 International Energy Agency, World Energy Outlook 2002. p. 112
24
Large extra heavy oil and tar sand deposits are found in the Orinoco Belt in Venezuelaand in Alberta, Canada.
The mining of extra heavy oil and tar sand require substantial amounts of water andenergy. For tar sand the energy used in the mining and the subsequent recovery processesequals approximately 25% of the energy gained in the oil produced.
2.2.2 Oil Shale
Oil shales are oil source rocks (clay, fine grained-sand, calcite, etc.) containing organicmaterial - mainly from algae - which were not buried deep enough for the temperature behigh enough for the conversion into oil or gas to take place. At the lower temperatures theorganic material was converted into kerogen14. When heated to about 350o C, kerogenbreaks down into recoverable gaseous and liquid substances resembling petroleum. Oilshale rock is mined in open pits, then crushed and heated. The volume of the waste productsis bigger than the volume of the oil shale mined and the production processes requiresubstantial amounts of energy. Large deposits of oil shale are found in the United States,Brazil, Russia, and Australia.
2.2.3 Synthetic fossil oil
Oil can be synthesised from coal and from natural gas. Based on carbon from coal15,synthetic oil was produced in Germany during World War II and in South Africa during thetrade boycott. Presently, the possibility of producing oil from natural gas (gas to liquid,GTL) at remote sites with no gas-pipeline connections (such as Eastern Siberia) is beingconsidered. However, the energy consumption in the synthesising processes is very high. Inthe GTL process about 45% of the gas used is used to fuel the process itself16.
2.3 Oil from biomass
Oil from biomass can supplement fossil oil. In Denmark, about 1,000 litres (34 GJ) ofbio-diesel can be produced from the rape grown on one hectare. To cover Denmark’spresent annual oil consumption for transport by bio-diesel would take an area twice the sizeof the Denmark’s cultivated area. Hence, oil consumption must be substantially reduced ifoil from biomass is to cover a major portion of the oil consumption.
Alcohol (ethanol) can be produced from crops such as sugar cane, grain, elephant grass).Depending on the crop, the soil and the climate, the yield amounts to 60 - 100 GJ per

17 In this section conventional oil should be interpreted as oil from oil fields, excluding naturalgas liquids (NGL).
18 Colin J. Campbell: Presentation at the Public Hearing on Oil Supply, Copenhagen October30 2002
25
A coal deposit covers a wide area having huge ‘resources’but only at places with thick seams or ease of access do the‘resources’ become ‘reserves’ to be mined. It is largely a matterof concentration. Thus, if prices rise or costs fall then lowerconcentrations become viable ‘reserves’. It is the same withmineral mining. Oil is different because it is a liquid which collected incertain places. It is either there in profitable abundance or it isnot there at all. The oil-water contact in the reservoir is abrupt.So it is not a matter of concentration. The notion of huge‘resources’ being converted to ‘reserves’ as needed is deeplyembedded in economic thinking, but it does not apply toconventional oil. But, of course, the tar sands behave like coal.
Colin J. Campbell
hectare, i.e. 2 - 3 times more than the bio-diesel yield. Alcohol can be added to petrol andthus substitute oil. Also, engines can be designed to run entirely on alcohol.
If the world’s present oil consumption were to be covered by oil and alcohol frombiomass, about one fifth of the land area - i.e. most of the cultivated area - would have tobe allocated to crops for oil and alcohol production. Hence, only when oil consumption hasbeen substantially reduced, can oil and alcohol from biomass cover a significant part of theconsumption.
2.4 The terms ‘Reserves’ and ‘Resources’
In the oil business terminology, the term reserves denotes proven or proven+probablequantities of oil which are deemed economically profitable to produce at the expected futureoil prices, implying that the oil can be recovered by means of known technologies. Inaddition to reserves, resources comprise quantities known or assumed to exist but, fortechnical or economic reasons, not presently recoverable, and additional amounts deemedlikely to be found in promising geological structures. Thus, when new recovery techniquesare developed, new oil fields are found or the oil price goes up, some resource quantitiesmay become reserves.17 The term undiscovered resources refers to quantities which aresupposed to exist and which may possibly become reserves.
Clearly, reserve and - especially - resource assessments are uncertain. Even at the timewhen production from a new oil field begins, it is uncertain how much oil will berecoveredbefore the field is finally closed. Estimated reserves in big oil fields tend to growwhen more production wells are drilled. For small fields the tendency is the opposite18.

19 In the US, oil companies must comply with the SEC (Securities and Exchange Commission)rules, requiring that only proved reserves are reported. In the rest of the world, reported reservesnormally comprise proven+probable reserves.
26
If reported reserve assessments were based strictly on geological surveys, field pressures,viscosities, well flows, and other physical data, the uncertainties would be due to incompletegeological and physical data. However, for various political and financial reasonsgovernments and oil companies may be obliged to or tend to publish reserve volumes whichare bigger or smaller than the volumes found by an objective assessment based on the bestavailable geological and physical data19. Moreover, some countries omit to publish regularrevisions of reserves. For such reasons, public domain data are less reliable than the data keptin the industry’s own databases.
Because most of the present reserves are in thoroughly explored fields discovered morethan 20 years ago, there are reasons to assume that the assessment of present reserves, basedon the industry’s data, are quite accurate.
For a particular oil province or region, the ultimate conventional oil reserve is the totalpotential production from the opening of the first well until the last well is finally closed. Inother words, the ultimate reserve equals:
past production+present reserves+future reserve additions
The ultimate reserve for a province or region equals the area under the curve showingannual production as a function of time (the integral of the production function). Theproduction peak is the maximum value on this curve. Knowing past production year by year,the curve can be drawn up to the present time. Any extrapolation of the curve into the futuremust cover an area equal to the ultimate reserve minus past production. This restriction isan important necessary condition to be met by any prediction of the peak value and the timewhen the peak is likely to occur. Therefore, the ultimate reserve is an essential parameter inany production peak assessment.
Apart from reserve growth due to enhanced recovery techniques, conventional resourcesbecome reserves only when new fields are found and developed. In contrast, to turn non-conventional oil resources such as tar sand and oil shale oil into reserves, no new depositsneed to be found. The known deposits, constituting the resources, are very large. To turnthem into reserves, only government acceptance of the environmental impacts caused by theproduction and large investments in mining and processing plants are required. However,when the more easily accessible layers have been mined, the production costs in terms ofmoney and energy of producing a barrel of oil from these resources grow steeply.

27
At a Global Harvard Business School Conference in Berlin 1999: “A WorldWithout Walls: The Challenges of a Global Economy”, James Wolfenson,head of the World Bank, in a keynote opening address focused on“...the acute need for the affluent population of the globe to never forget theless fortunate parts of the world. As he eloquently stated, there are only 1.2billion people now living in the highly developed countries of the world. 250million are in the United States, 500 million living in the expanded Europeand 350 million in Canada, Mexico and the Pacific Rim countries of theOECD. For this group, affluence is not only on the rise, it has never beenbetter.But Mr. Wolfenson then warned of the risks inherent by overlooking the 4.8billion people living in the less developed or transition economies of theworld. An astonishing 2 billion of these people live on less than $2 a day !One billion live on less than $1 a day ! ..... Mr. Wolfenson warned that it isnot reasonable to even think that we can maintain this great gap between thewell to do and the impoverished for another 50 years.”“In three decades [1970-2000] the rich/poor gap has widened from35/65 to 20/80.”
Quotations from: Revisiting The Limits to Growth: Could The Club ofRome Have Been Correct, After All? An Energy White Paper byMatthew R. Simmons, October 2000.www.sco-intl.com/domino/html/research.nsf
3. Demand and Supply
No countries plan for a decline in global oil production in the next decades. On thecontrary, in its annual World Energy Outlook reports the International Energy Agency (IEA)presents scenarios for the future development of the global economy based on continuedgrowth in fossil fuel consumption in general and oil consumption in particular. In thesescenarios the per capita energy consumption remains much higher in the OECD countriesthan in the developing countries (9 times higher in 2000, 6 times higher in 2030) and theOECD countries become more and more dependent on oil and gas imports from the MiddleEast, Africa, and the FSU.
In a recent report World energy, technology and climate policy outlook 2030 (WETO)the EU Commission presents similar scenarios, based on macroeconomic modelling undercertain assumptions regarding growth in population, economic growth, future costs ofdifferent energy technologies, etc.
The EIA scenarios as well as the WETO scenarios are essentially business-as-usualscenarios with no resource restrictions and no restrictions regarding climate changemitigation. However, comparing the scenarios, it appears that the different modellingmethods and hypotheses applied result in considerable differences in future demand andsupply in the different regions of the world.
As mentioned in the last section of this chapter, curbing inefficient, unnecessary, wastefulor extravagant use of oil is the only way to attain substantial reductions in conventional oildemand which does not involve high economic costs, environmental hazards, and thedepletion of other resources.
20 Regarding oil demand, the report says: “This years WEO [2002] projects a lower growthrate in world oil demand over the next twenty years than was anticipated in WEO 2000. Thisdifference is mainly due to downward revisions to historical data and slower growth rate thanexpected.” (op.cit. WEO 2002, p. 91)
28
3.1 The IEA World Energy Outlook 2002
The IEA begins the Executive Summary of its World Energy Outlook 2002 (WEO 2002)with the following statement:
“This edition of the World Energy Outlook, which sets out the IEA’s latest energyprojections to 2030, depicts a future in which energy use continues to grow inexorably,fossil fuels continue to dominate the energy mix and developing countries fastapproach OECD countries as the largest consumers of commercial energy. TheEarth’s energy resources are undoubtedly adequate to meet rising demand for at leastthe next three decades. But the projections in this Outlook raise serious concerns aboutthe security of energy supplies, investment in energy infrastructure, the threat ofenvironmental damage caused by energy production and use and the unequal access ofthe world’s population to modern energy.
Governments will have to take strenuous action in many areas of energy use andsupply if these concerns are to be met. The core projections presented here are derivedfrom a Reference Scenario that takes into account only those government policies andmeasures that had been adopted by mid-2002. A separate Alternative Policy Scenarioassesses the impact of a range of new energy and environmental policies that OECDcountries are considering adopting as well as a faster deployment of new energytechnologies. Both scenarios confirm the extent of the policy challenges facinggovernments around the world.” (op. cit. WEO 2002, p. 25)
Reasons why the IEA forecasts raise serious concerns and induce the strong appeal togovernments are spelled out in table 3.1 and 3.2 and map 3.1 and 3.2 below:
The disproportionate difference between the per capita energy consumption in the affluentcountries and the developing countries is only modestly reduced from 8.6:1 to 6.3:1 overthe next three decades. Such a scenario should cause serious concerns. The WEO 2000predicted a higher growth rate and higher total consumption in the developing countriesand a lower growth rate and lower total consumption in the OECD countries than theWEO 2002, see table 3.1.20
The global CO2 emission rate continues to grow, from 22.6 billion tonnes in 2000 to 38.2billion tonnes in 2030. Should this in actual fact happen, the Kyoto Protocol efforts arefutile.
In 2030, 77 % of the world’s population, living in oil-importing countries, will depend onthe Middle East for 72 % of their oil imports (see table 3.2). Moreover, export of naturalgas - mostly liquified - from the Middle East to Europe, the USA and the Far East willsurge from 23 billion cubic metres in 2000 to 365 cubic metres in 2030 and gas exportsfrom the FSU to Europe will grow from 112 billion cubic metres in 2000 to 244 in 2030.In IEA’s somewhat euphemistical words: “These developments will push supply securityback to the top of the energy policy agenda” (op. cit. WEO 2002, p. 57).

21 The IEA report World Energy Investment Outlook, 2003 Insights, November 2003, says:“A little over $3 trillion will be needed in the oil sector through to 2030. Investment needswill average $103 billion per year, but will increase steadily through the period as demandincreases. Annual capital spending will rise from $92 billion in the current decade to $114billion in the last decade of the projection period.” (op.cit. p. 103)
29
Considerable investments21 - most in the Middle East and other developing countries -must be made to increase global oil production from 27 Gb in 2000 to 44 Gb in 2030.The IEA observes that “Mobilising this investment in a timely fashion will require thelowering of regulatory and market barriers” (op. cit. WEO 2002, p. 57). Considering theextent to which OECD countries, China, India and other newly industrialised countriesdepend on oil imports from the countries where these investments are to be made (seetable 3.2), it seems likely, however, that the importing countries will not entirely rely onmarket forces to ensure that investments are made in time.
It is a priority for the oil importing countries to keep the oil price low. The IEA expectsthat an increase in the production of conventional oil from 26.7 Gb in 2000 to 40.2 in2030 can be obtained at an oil price well below 30 $/barrel (see table 3.3), assuming thatthe investments required will be profitable at these prices. If the investments required aremade and do bring about the foreseen increase in conventional oil production, thenconventional oil production may peak before or shortly after 2030 and thereupon declinesteeply. If the conventional oil prices are kept low until then, it is questionable whethersufficient investments in non-conventional oil capacity and alternative liquid fuel sourceswill be made in time to avoid a sudden oil shortage.
In the alternative scenario mentioned in the Executive Summary (see quotation above),fossil fuel saving policies (energy savings; renewable energy sources; energy savings inthe transport sector; etc.) under consideration in the OECD countries are taken intoaccount. These savings reduce the CO2 emission from the OECD countries by 16 % andthe global emission by 7 % by 2030 (see table 3.1). OECD oil demand in 2030 is reducedby 8 %. Thus, the fossil fuel saving policies presently considered will not significantlychange the global energy and environment outlook.
Thus the IEA’s serious concerns about
unequal access of the world’s population to modern energyenvironmental damage caused by energy consumptionsecurity of energy supplyinvestments in energy infrastructure
and its appeal to governments to take strenuous action are well reasoned.
Regarding total demand, supply, and reserves, the WEO 2002 projections are shown intables 3.4 and 3.5. Total demand and production of conventional oil is projected to growexponentially (average growth rate 1.33%) from 27 Gb (74 Mb/day) in 2000 to 40 Gb (110Mb/day) in 2030. Thus, total production from 2000 to 2030 amounts to 1,000 Gb or 40%more than the total production in the 20th century.

30
0
10
20
30
40
50
60
'2000' '2005' '2010' '2015' '2020' '2025' '2030' '2035' '2040'
Gb/
year
Demand Prod.total Conv.prod.exist
Non-conventional Conv.prod.new New findings
The WEO 2002 says that “Resources of conventional oil and NGLs are adequate to meetthe projected increase in demand to 2030, although new discoveries will be needed to renewreserves. The importance of non-conventional sources of oil, such as oil sands and gas-to-liquids, is nonetheless expected to grow, especially after 2020.” (op. cit. p.97). The WorldEnergy Investment Outlook 2003 Insights (WEIO 2003) quantifies the new discoveriesneeded: “Some 470 billion barrels of [conventional] oil will have to be found in the nextthree decades, to replace reserves in existing producing fields and to meet growth indemand” (op.cit. p. 107)
Thus, by 2030 50% of the undiscovered resources, namely 470 Gb or 16 Gb/year onaverage, should be discovered and added to the 959 Gb of reserves remaining in 2000 (seetable 3.4), giving a reserve base of 1,430 Gb. However, WEO 2002 does not show howproduction can be balanced against demand in the next decades under these assumptions.
Assume that new findings and reserve additions by means of enhanced recoverytechniques add new reserves to the reserve base at a rate of 17 Gb/year until 2010, thereupondeclining slowly to 13 Gb/year in 2030 (see fig. 3.1) - even though annual reserve additionscurrently average only about 10 Gb/year. Assume also that production from these newreserves come on-stream as needed to balance production and demand as production fromexisting fields declines while non-conventional oil production increases as shown in fig. 3.1and table 3.5. Then, if demand grows as assumed in WEO 2002, production may be balancedagainst demand as shown in fig. 3.1. However, the reserve data used in fig. 3.1 (table 3.4)are from 1996. Therefore, the production peak should occur earlier than 2025.
Figur 3.1 Balancing production against demand using WEO 2002 data (see below).

31
The scenario shown in fig. 3.1 is computed by the OILPROSPECTSprogram, described in Chapter 5 section 5.5 below.
Scenario data:The scenario is based on the following production
and reserve data, aggregated from table 3.4 and 3.5:
Conventional oil Produced Reserves Yet-to-find Production Gb Gb Gb Mb/day in 2000Middle.East 181 512 269 20.4FSU 101 157 140 7.8Latin.America 70 61 102 8.0Africa 40 60 62 5.1North.America 171 32 83 7.7Europe 23 29 30 5.9Asia 39 35 27 3.3Other 91 73 220 15.7
Total 716 959 933 74.0
In this table, 'conventional oil' includes crude oil and NLGsirrespective of place of origin (i.e. deep water and polar isincluded).
Non-conventional oil production (see table 3.5)Mb/day
2000 2005 2010 2020 2030 2075 1.1 2.0 3.0 6.0 10.0 10.0
Total conventional production to date (2000)= 716 GbExisting conventional reserves (2000) = 959 GbUndiscovered conventional reserves (2000) = 933 GbUltimate conventional reserves = 2608 Gb
Non-conventional oil produced before 2000 = 85 GbNon-conventional oil produced 2000-2075 = 347 Gb
In fig. 3.1 ‘New findings’ include reserve additions from new fields and reserve additionsobtained by enhanced recovery techniques. The area below the ‘Conv.prod.exist’ curve(production from existing conventional reserves), extended to infinity, equals existingconventional reserves (959 Gb). Likewise, the area below the ‘Conv.prod.new’ curve(production from new conventional reserves) equals the area below the ‘New findings’ curve(933 Gb). For each of the regions shown in the data table above, production from existingreserves (2000) is assumed to peak when 60% of the region’s ultimate reserves have beenproduced.
The figure shows that even if 470 Gb are added to the conventional oil reserve basebefore 2030 (‘New findings’), as assumed in WEO 2002, it may only be possible to balanceproduction against demand until 2025. This is because the production from new reserves(‘Conv.prod.new’) needed to satisfy demand surpasses ‘New findings’ from 2022 onwards.Thus, as the ‘New’ reserves are depleted production from these reserves begins to decline.The increase in non-conventional production assumed in WEO 2002 is not sufficient to offsetthis decline.
Should production from existing reserves decline less steeply, the industry may defer itsinvestments in the discovery and development of new reserves. In that case, total productionmay still peak by 2025 but then decline more steeply for some years.

32
Table 3.1
IEA, World Energy Outlook 2000/2002, Global Development Scenarios 2000 - 2030
Population, billions 2000 2010 2020 2030
Developing countries 4.9 5.6 6.3 7.0
Transition economies 0.35 0.34 0.33 0.33
OECD countries 1.1 1.15 1.2 1.22
Total 6.4 7.1 7.8 8.6
Energy consumption per capita, kg oil equivalent/year
Reference scenario 2000 2010 2020 2030
Developing countries WEO 2000 660 805 980
WEO 2002 560 670 800 925
Transition economies WEO 2000 2990 3505 4365
WEO 2002 2925 3590 4160 4580
OECD countries WEO 2000 4500 4800 4900
WEO 2002 4800 5200 5500 5800
Oil consumption per capita, kg oil/year
Reference scenario 2000 2010 2020 2030
Developing countries WEO 2000 285 345 410
WEO 2002 220 263 310 355
Transition economies WEO 2000 690 835 1100
WEO 2002 635 765 920 1055
OECD countries WEO 2000 1820 1930 1975
WEO 2002 1970 2080 2170 2275
CO2 emission, billion tonnes/year
Reference scenario WEO 2002 2000 2010 2020 2030
Developing countries 7.8 10.6 14.0 18.1
Transition economies 2.5 3.0 3.4 3.6
Other 12.4 13.8 15.3 16.4
Total 22.6 27.5 32.7 38.2
The Alternative Policy Scenario
(Energy savings in the OECD) Total 22.6 27.1 31.3 35.6

33
Table 3.2
IEA, World Energy Outlook 2002. Oil demand and production 2030
Conventional oil: 40.2 Gb Non-conventional oil: 3.6 Gb
Gb Demand Production Net import Net export
OECD, US and Canada 10.0 4.2 5.8
OECD, Europe 6.0 0.9 5.1
OECD, Pacific 3.8 0.2 3.6
China 4.4 0.8 3.6
India 2.0 0.1 1.9
Other East and South Asia 4.1 0.9 3.2
Importing countries, total 30.3 7.0 23.3
Russia 1.6 3.5 1.9
Other transition economies 1.0 2.0 1.0
Mexico and Latin America 4.7 5.5 0.8
Africa 2.0 5.0 3.0
Middle East 2.8 19.5 16.7
Exporting countries, total 12.0 35.5 23.3
Processing gains 1.1
Bunkers and stock change 1.5
Total 43.7 43.7
Table 3.3
IEA, World Energy Outlook 2002. Oil prices (in year 2000 dollars)
2000 2010 2020 2030
IEA crude oil imports, $/barrel 28 21 25 29

34
Table 3.4 Data from IEA World Energy Outlook 2002, p. 97
IEA World Energy Outlook 2002. Supply forecast
Gb/year 2000 2010 2020 2030
Conventional oil 27.0 31.3 35.9 40.2
Non-conventional oil 0.4 1.1 2.0 3.6
Total supply 27.4 32.4 37.9 43.8
Table 3.5 Summarised data from IEA World Energy Outlook 2002, p. 96

35
Map 3.1. Projected net inter-regional oil trade, 2030 (million barrels/day). IEA, WorldEnergy Outlook 2002.
Map 3.2. Projected net inter-regional gas trade flows, 2030 (billion cubic metres/year).IEA, World Energy Outlook 2002.

22 WETO: World energy, technology and climate policy outlook 2030. EuropeanCommission, Directorate-General for Research. Community Research, 2003. (EUR 20366).http://europa.eu.int/comm/research/
36
“World energy consumption is projected to increase at about1.8%/year between 2000 and 2030. This growth is driven byeconomic and population growth (of respectively 3.1% and1%/year on average), whose impacts are nevertheless moderatedby a decrease in energy intensity of 1.2%/year, due to thecombined effects of structural changes in the economy, oftechnological progress and of energy price increases.”
“Industrialised countries experience a slowdown in their energydemand growth (0.4%/year in the EU). Conversely, the energydemand of developing countries is growing rapidly. In 2030, some55% of the world energy demand is expected to come fromdeveloping countries, compared to 40% now.”
“The world energy system will continue to be dominated byfossil fuels.....Oil remains the main source of energy...”
“....world CO2 emissions are expected to grow rapidly....”
Excerpts from WETO, Key conclusions.
3.2 World energy, technology and climate policy outlook 2030 (WETO)
The WETO report from the European Commission22 presents a reference scenario anda carbon abatement scenario for the development until 2030. These scenarios resemble thescenarios presented in the IEA World Energy Outlook 2002. In the WETO referencescenario the growth in global fossil fuel consumption is a little higher than in the IEAreference scenario and the growth in coal consumption is bigger while the growth in oilconsumption is smaller. Therefore, global CO2 emission grows by 100%, from 22.6 billiontonnes in 2000 to 44.5 billion tonnes in 2030 in the WETO reference scenario, as againsta 70% growth in the IEA reference scenario. In the carbon abatement scenario, the growthin CO2 emission equals the growth in the IEA alternative policy scenario, namely 58%.
There are, however, major differences in regional demand and supply between the WETOand the EIA scenarios. The growth in energy consumption in Europe and North Americain the WETO scenario is only about half the growth in the EIA scenario so that the percapita consumption in these regions is almost unchanged while the per capita consumptionin the developing countries in 2030 is about 30% higher than in the EIA scenario.
There are also major differences regarding regional energy supplies between the WETOand the EIA scenarios, see for instance table 3.4. While the IEA foresees that NorthAmerica in 2030 will import 345 billion m3 from the Middle East, Africa, South America

37
and Indonesia (see Map 3.2 above), this region will import only 73 billion m3 from LatinAmerica and 1 billion m3 from Africa and the Middle East in the WETO scenario.
Differences of this magnitude indicate that different macroeconomic models for thecomputation of global demand and production give significantly different results.Considering the long-term planning and investments needed to facilitate the global gas tradeshown in Map 3.2 and the implications for the global economy, it is important for manycountries to assess which of the two scenarios is most likely to materialize.
Likewise, the future oil trade depicted in Map 3.1 should be compared with the tradeoccurring in the WETO scenarios. However, the WETO report does not give figures for oiltrade between regions.
Gas demand andsupply, North America
Demand Demand Production Import Import %
2000 2030
WETO 662 940 866 74 8
IEA 788 1305 960 345 26
Table 3.4 Gas demand and supply (billion m3) in North America in the WETO and theIEA reference scenarios.WETO, table 5.2, p. 93.IEA WEO 2002, tables 3.7 and 3.8.(Corresponding figures for oil are not found in the WETO report)

23 From the end of World War II until 1973 the price of crude oil declined slightly, averagingapproximately 10 USD/barrel. After the OPEC price hikes in 1973 and 1980, it has since 1985fluctuated between 26 and 13 USD/barrel, averaging approximately 17 USD/barrel. At a crude oil priceof 25 USD/barrel, the total costs of refined oil products consumed in the OECD countries amount toonly about 2% of the present total GDP in these countries.
38
3.3 Options for the reduction of the demand for conventional oil
The objective of a rational energy policy strategy must be toensure that the demand for conventional oil peaks before the peak inconventional oil production occurs.
The least-cost solution is to reduce inefficient, unnecessary,wasteful or extravagant use of oil.
Other options are an upswing in the production of non-conventional fossil oil and oil from biomass and the switching toother fuels and other energy sources. However - any of these optionshave their limitations because of limited resources, economic costs,or environmental hazards.
In the 20th century exponential economic growth to an unprecedented level of materialwealth which took place in industrialised, capitalistic countries. This growth was based ontransportation technologies, construction technologies, and agricultural productiontechnologies whose proliferation depended on access to cheap oil23 in abundant amounts.Therefore, economic growth has been strongly correlated with growth in the consumptionof oil, and it still is.
Had the large but limited conventional oil reserves been used with forethought as aprecious, non-renewable endowment to mankind, consumption would have been muchsmaller and the time allowed for the transition to other energy sources would have beenmuch longer. However, the way the market economy works, the consumption of a cheapcommodity, be it oil or fresh water for drinking or irrigation, is practically unrestricted untilthe sources of cheap supplies begin to dry out. When this happens for conventional oil, thetransition to other energy sources and technologies will be costly because it involves notonly the development of other more expensive energy sources but also the development andimplementation of more energy-efficient technologies and infrastructures so as to reduce theamounts of energy needed.
Clearly, a reduction in the demand for conventional oil or at least in the demand growthrate can be achieved only by
reducing oil demand, and/orincreasing the production of non-conventional fossil oil and oil from biomass.

39
3.3.1 Oil demand determinants
Oil demand is determined by
Quantitative factors: The number of oil-engines and oil boilers in use (in cars, buses,trucks, tractors, ships, aeroplanes, power stations, boiler stations and individual boilers,etc.)Technological efficiencies, measured as average specific oil consumption (litres perkilometre) for vehicles, ships and aeroplanes, and the efficiencies (MJ power or heat perMJ oil consumed) of power stations and boilers.Behavioural consumption factors: The average usage (kilometres per year) of vehicles,ships and aeroplanes, and the consumption of power and heat (GJ per year) produced inoil-fired power stations and boilers.
Assuming that technological efficiencies are not worsening but rather improving, anincrease in oil consumption meansS growth in quantitative factors: people and companies invest in additional oil-fuelled
machinery, and/orS increases in behavioural consumption factors: people and goods travel longer distances
and consume more power and heat.
For national and local governments it means additional investments in infrastructuresneeded to facilitate the increased use of oil-fuelled machinery: roads, parking lots, bridges,airports, etc. Moreover, increased oil consumption requires additional investments intankers, pipelines, and refineries.
Thus, increased oil consumption means widespread investments in oil-based machineryand infrastructures which make the economy more and more technologically dependent onoil. In view of an impending peak in conventional oil production this is a dangerous road tofollow. Because conventional oil is likely to remain the cheaper fuel alternative until thepeak occurs and the decline in production sets in, market incentives will hardly correct thecourse of technological development and consumer preferences so as to ensure the smoothtransition to new technologies. In the absence of goal-directed energy policy measures, thedevelopment and marketing of other energy sources and technologies which can substituteoil and oil-based technologies may be postponed, leaving our societies unprepared for thedecline in conventional oil production.
The objective of a rational energy policy strategy must be to avoid this danger, i.e. toensure that the demand for conventional oil peaks before the peak in conventional oilproduction occurs. In a market economy, such a strategy implies the introduction ofeconomic incentives, regulatory measures, and public information campaigns aimed atreducing the demand for oil and, to the extent that it is deemed environmentally acceptable,to induce the industry to develop the production of non-conventional oil.

24 Hydrogen from electrolytic converters, powered from the electric grid, or from natural gas,biomass, or waste. See also the section Nuclear power, below.
40
3.3.2 Ways and means to restrain the demand for conventional oil
Ways and means to restrain the demand for conventional oil can be divided into threemain categories:
1) Reduction of inefficient, unnecessary, wasteful or extravagant use of oil byS improving technological efficiencies.S reducing behavioural consumption factors.Public awareness of the need to curb demand could create political consensus on thegradual introduction of economic incentives and regulatory measures which partlysubstitute taxation of consumption for taxation of income. If over a period of time heavytaxes were levied on cars doing less than 20 kilometres per litre of petrol in 2010, 30kilometres per litre in 2020, and/or heavier taxes were levied on oil and other energyconsumption, oil consumption in the affluent countries could be substantially reduced atzero social costs and without any noteworthy losses of comfort. Moreover,environmental benefits of reduced emissions of CO2 and air polluting gases could begained at zero costs for the consumer (see section 6.1.1).
2) Reduction of the demand for oil by the replacement of oil-based technologies bytechnologies based on other fuels or electricity.
Oil-based technologies can be replaced by other technologies. However, because noother fuel is so easy to transport and store and because oil-engines are cheap ascompared to other energy converters, the substitutes are much more costly.
Mechanical shaft power from oil-fuelled internal combustion engines can be replacedby electric power from fuel cells, batteries, or power lines. Vehicles driven by fuel cellsfuelled with hydrogen24, natural gas or methanol (synthesised from natural gas) are beingdeveloped by the automobile industry. Cars powered by batteries or by batteries incombination with internal combustion engines or fuel cells (hybrid propulsion units) arealso being developed. Large fuel cells can also replace internal combustion engines inships. However, as long as oil is cheap and fuel cells and batteries expensive, consumersand industries have little incentive to replace oil-fuelled combustion engines by the newelectrochemical energy converters. Moreover, technological infrastructures for theproduction and distribution of hydrogen must be in place before hydrogen-fuelledvehicles can replace a significant number of oil-fuelled vehicles. Hence, a concerted,long-term investment strategy is a precondition for a shift to hydrogen-fuelled vehicles.
Natural gasWhere natural gas can be made available, gas can be substituted for oil in oil-fired
power stations, heating stations, industries, and individual boilers. To reduce fuelconsumption for low-temperature heating, heat from boilers can be replaced by heat fromthe cooling circuits in power generating units (i.e. cogeneration in steam turbine and gasengine power plants or fuel cell plants). Moreover, compressed natural gas in voluminousstorage tanks can replace oil in vehicles driven by ordinary piston engines and natural gascan be converted to methanol or hydrogen for fuel cells replacing oil-engines.

41
However, substantial reductions in oil demand by the substitution of natural gas foroil require large investments in gas pipelines and LNG tankers for the transportation ofgas from the major fields in the Middle East, North Africa, and Siberia to the majorconsumers in the United States, Europe, and the Far East (see Map 3.2). Becauseincreased gas consumption shortens the time until the production of natural gas peaks,these investments only serve to postpone the development of sustainable solutions oneor two decades and the payback time for these investments may be relatively short.
CoalAt the cost of increased CO2 emission, coal can be substituted for oil in power stations
and some industries. However, as oil consumption in power stations account for less than10% of the world’s oil consumption and the transport of coal to many of these stationswill be costly, the reduction in oil consumption attainable by substituting coal for oil islimited.
Nuclear powerElectricity from nuclear power stations can replace any other energy supply. However,
in the foreseeable future nuclear power can in practise only provide a modest reductionin oil demand.
Oil consumption in vehicles can be replaced by hydrogen produced in electrolyticconverters by electric power from nuclear power stations. Assume, for instance,S that hydrogen-fuelled fuel cells in vehicles can obtain an efficiency (kilometres per MJ
of fuel) twice the average efficiency of petrol and diesel engines and S that the world’s oil consumption for transport were to be reduced by 30% of the
present consumption by the replacement of petrol and diesel engines by such fuel cellsThen the construction of about 550 nuclear power stations each of a capacity of 1000MW would be needed.
Were 30% of the present oil consumption in industrial boilers and households also tobe replaced by electric power from nuclear power stations, using efficient electric heatpumps for low-temperature heating, about 250 nuclear power stations of 1000 MWwould be needed.
If also 30% of the oil consumption in oil-fired power stations were to be replaced bynuclear power generation, about 150 nuclear power stations of 1000 MW would beneeded.
In total, about 950 nuclear power stations of 1000 MW would be needed to substitutenuclear power for 30% of the present oil consumption, using efficient technologies forthe utilisation of the electric power generated in these plants. The total additionalcapacity of 950 GW to be commissioned corresponds to 270% of the existing nuclearcapacity of 360 GW worldwide.
In its World Energy Outlook 2002, the International Energy Agency assumes a growthin oil demand of 1.6% per year until 2030. Were this growth to be avoided by thesubstitution of nuclear power for oil, new nuclear power stations of 1000 MW wouldhave to be commissioned at a rate of one station per week in the coming years, increasingto one station every 5 days in 2030.

42
“Because of oil price fluctuations and terrorist threats, the issueof energy security is back on the agenda with renewed focus onnon-conventional resources (NCO) , says Robert Priddle, executivedirector of the International Energy Agency.” “Priddle said that it is important to evaluate whether NCO canmeet the environmental and cost challenges of development.” “Fatih Birol, IEA’s chief economist and head of its economicanalysis division, said that development of NCO reserves could becrucial to meeting supply needs over the longer term. IEAforecasts over the next 30 years are based on the assumption thatcountries would not radically change current energy policies. Thatmeans that oil will remain the dominant energy source and meetabout 40% of world energy needs, Birol said.”
Quotations from the article: IEA Chief: Worldwide energy security favors non-conventional oil. Oil & Gas Journal/Dec. 9, 2002.
Renewable energy sources Sustainable substitutes for oil are electric power from wind turbines, wave and tidal
turbines, photovoltaic panels, and thermal solar power plants and hydrogen producedby power from these sources. However, to facilitate the more than marginal substitutionof renewable energy sources for fossil fuels, the technological infrastructures of local,regional and national energy systems have to be reconstructed.
In contrast to the existing fossil fuel-based energy systems, in which the regulation ofpower and heat generation on an hourly, diurnal, annual basis can be easily handled,energy systems in which these fluctuating energy sources play a major role must haveenergy storage facilities and advanced regulation systems to balance the production ofand the demand for electric power and heat at all times. Moreover, hydrogen should beproduced at rates determined by storage capacities and demand.
The construction of such integrated energy systems (integration of the generation ofelectric power and heat and the production of hydrogen) requires long-term planningwhich transcends the boundaries between fuel markets, electricity markets and heatmarkets and also international boundaries.
3) The substitution of non-conventional fossil oil and oil from biomass for conventional oil
As long as the demand for oil remains high, only the increased production of non-conventional fossil oil can make up for a decline in the production of conventional oil, apartfrom limited contributions from sustainable production of oil from biomass (see section 2.3).The economic costs of non-conventional oil production from the more easily accessiblesediment rocks may not be prohibitive and apart from the development of mining facilitiesand refineries and the laying out of new pipelines, the shift to non-conventional fossil oil hasno technological implications. However, if the price of conventional oil remains low untilthe production peaks, so that conventional oil remains the most competitive alternative, itis questionable whether a sufficient non-conventional production capacity will be in placein time to make up for the decline in conventional oil production.

43
In any case, the environmental impacts of non-conventional oil production will call forproduction restrictions. The local and regional impacts of the water consumption in therecovery processes and the amounts of hazardous waste produced call for nationalregulations. Moreover, the CO2 emission caused by the use of fossil fuels in the productionprocesses, be it oil from tar sand or oil shale or synthetic oil, calls for internationalregulations.

44

25 A discussion of reserve reporting issues is presented in Jean Laherrère: Is USGS 2000Assessments reliable ?”. Published on the cyberconference of the WEC on May 19, 2000.www.dieoff.off/page195.htm.
26 A discussion of reserve assessments is given in Jean Laherrère: Modelling future liquidsproduction from extrapolation of the past and from ultimates. Paper presented at the InternationalWorkshop on Oil Depletion, Uppsala University, Sweden. May 23-24th 2002.
45
4. Conventional Oil Reserve Assessments
Reserve reporting is an intricate business involving not only geological, geophysical andtechnical surveys and assessments but also regulations, political interests, and the oilcompanies’ vested interests. In some countries regulations are imposed in order to preventcompanies from overreporting the reserves, thereby misleading the stock market. However,overreporting may take place. In the mid-1980's the OPEC member countries’ regulationof production quotas in proportion to national reserves was an incentive to overestimatenational reserves. On the other hand, royalties and taxation may influence oil companies’reporting policies.25
At the time when an exploitable reservoir is found and the first wells have been drilledit is uncertain how much will eventually be produced, although modern 3-dimensionalseismic surveys have reduced the uncertainties. Therefore, in the reporting of global,regional or national reserves or the reserve estimates for a particular oil province, adistinction is made between:
Proved reserves: Reserves judged to have a high (90- 95%) probability of occurrence.Probable reserves: Less sure reserves that are likely to occur but fail to qualify as Provedreserves..
Proved+Probable reserves (2P) as reported should be close to theMedian probability (P50) reserves. The probability that the actual recovery turns out tobe higher than the P50 estimate equals the probability that it turns out to be less.26
4.1 Reserve development
Naturally, when a new reserve is first reported, the amount reported differs from theamount that will actually be produced in the lifetime of the field. For large fields, the firstreported public domain data for newly found reserves tend to underestimate the amountsfound. Therefore, in the course of time the data are adjusted upwards. For small fields, thetendency is the opposite: the first reported public domain data tend to overestimate theamounts actually found.
The historical development in global conventional oil reserves - i.e. new volumes addedwhen new fields are discovered, plus/minus current changes in reserve estimates for existingfields, minus consumption - are reported in two different ways, see fig. 4.1.
The lower curves in fig. 4.1 show current reserve estimates reported in variouspublications. The trend is continued reserve growth, although in the later years there is anapparent tendency of a flattening out or decline.
The upper curve show backdated reserve data, ‘backdating’ meaning that when theoriginal reserves in a field are revised, the revised number is registered as the reserveactually added at the time when the field was discovered.

27 Jean Laherrère: Modelling future liquids production from extrapolation of the past andfrom ultimates. Paper presented at the International Workshop on Oil Depletion, Uppsala University,Sweden. May 23-24th 2002.
46
The lower curves data may be highly inaccurate. Yet, in principle, for each year thedifference between the upper curve and the lower curves show the reserves added at laterrevisions of the original reserve estimates. For example, in the year 1970 reserves wereestimated at about 550 Gb. However, in the following years it appeared that the reservesexisting in 1970 were in fact much bigger, namely about 1,100 Gb.
Whether reserves will continue to grow or are already declining is a question of whetherfuture reserve revisions and/or the finding of new oil fields will result in reserve additionsin excess of future consumption. In other words, whether or not the backdated curve whenrevised in 2010 will be lifted enough to meet again the curve showing the current reserveassessment - or whether the current assessment curve will be declining over the next decade.See fig. 4.2.
World's oil remaining reserves from "political" (API, BP, OPEC, World Oil, Oil & Gas Journal) &
technical sources
0
100
200
300
400
500
600
700
800
900
1000
1100
1200
1300
1950 1960 1970 1980 1990 2000 2010
year
API oil P currentBP Review oil P currentOPEC oil P currentWO oil P currentOGJ oil P currenttechnical data O+C "backdated mean"
?
Figure 4.1. Backdated technical data (Conventional Oil+Condensate) as against “political”(public domain) revisions taken on a current basis.(Condensate: see section 2.1.2)27
Most of the known oil fields were discovered before 1980. Reported discoveries in the1990's were only about 10 Gb per year (see fig. 4.3) as against an annual consumption ofabout 25 Gb per year. The 15 Gb per year deficit corresponds to the decline in reserves from2000 to 2010 shown by the backdated curve in fig. 4.1. Thus, reserve growth during thenext decade requires that on the average more than 25 Gb are added every year by revisionsof existing reserves and by new discoveries as against the 10 Gb per year added in the1990's.
At closer inspection, fig. 4.1 shows an abrupt increase in current reserves by the mid-1980's - mainly due to upwards revisions of OPEC countries’ reserves by about 290 Gb atthe time when production quotas proportional to reserves were introduced - followed bya levelling out in the 1990's.

28 http://www.hubbertpeak.com/hubbert/to_nissen.htm
29 http://www.planetark.org October 10 2002.
47
0
200
400
600
800
1000
1200
1400
1950 1960 1970 1980 1990 2000 2010
Rem
aini
ng re
serv
es G
b
'Backdated by 2000' 'A: Backdated by 2010 'B: Backdated by 2010' 'Current by 2000' 'A:Current by 2010'
Case A
Case B
Backdated 2000Backdated 2010
A
Backdated 2010 B
Current
Figure 4.2. Conceivable results of reserve revisions by 2010.Assuming a smooth backdatedreserve development curve- i.e. that a decline until 2000 is not followed by a steep rise from2000 to 2010 - a continued reserve growth until 2010 (Case B) implies that revisions ofreserves found in recent years result in substantial additions. Otherwise, a decline in currentas well as backdated reserves will take place (Case A).
4.2 Future discoveries and enhanced recovery techniques
Since the 1970's discoveries have been declining. In 1982, M.King Hubbert observed that“During the last decade we have seen very large increases in the monetary price of oil.This has stimulated an accelerated program of exploratory drilling and a slightly increasedrate of discovery, but the discoveries per foot of exploratory drilling have continuouslydeclined from an initial rate of about 200 barrels per foot to a present rate of only 8barrels per foot.”28
If the average annual discovery rate of about 10 Gb/year obtained in the last years (seefigure 4.3) can be sustained, additional reserves amounting to about 200 Gb could bediscovered in the next two decades.
Offshore deepwater discoveries (at depths more than 500 metres) seem promising.According to F. Harper of BP (see figure 4.3 reference) deepwater oil reserves reported in1999 amounted to 25 Gb. A Newsletter from World Environment News29 reports global oiland gas deepwater discoveries of 60 Gb - mostly in waters in the Gulf of Mexico and offBrazil and West Africa - and the possible presence of another 40 Gb. Oil is estimated tocomprise two thirds of these amounts.

30 ASPO Newsletter No 18, June 2002. Press report, Boston April 10 2002.
31 Jean-Christophe Servant: The new Gulf oil states. Le Monde Diplomatique, January 2003.
32 As described in more detail in Kenneth S. Deffeyes: Hubbert’s Peak. The Impending WorldOil Shortage. Princeton University Press, 2001. Chapter 5.
33 Hugh Shannon et. al.: A CO2 Infrastructure for the North Sea.http://ior.rml.co.uk/issue4/co2/inco2/summary.htm
48
On the continents, the Caspian oil provinces have given rise to great expectations.However, early estimates that the Caspian provinces could hold as much as 200 Gb weresoon reduced to about 100 Gb and proven reserves may set at only 17 - 33 Gb30. As someof these discoveries were made before 1999, they are included in figure 4.3. Hence, if newdiscoveries amounting in the range of 200 Gb are to be found in the next two decades, otherlarge reserves than the hitherto reported deepwater and Caspian reserves must be discoveredbefore then.
The African oil states of the sub-Saharan African region (Nigeria, Equatorial Guinea,Angola, Sudan) in which the US is now strongly engaged, could become the second largestoil exporting region after the Middle East 31. The South China Sea, where exploration hasbeen delayed because of disputes about exploitation rights between China, Vietnam, andthe Philippines, may hold considerable reserves. However, no major oil company haspushed to gain exploration rights.
Enhanced recovery techniques have increased and will continue to increase reserves. Bymeans of such techniques the pressure driving the oil in the reservoir rock towards the wellsis increased and/or the viscosity of the oil is reduced.The forces which drive the oil from the reservoir rocks into the wells are
the pressure of water below the oil reservoir, and/orin cases where natural gas has accumulated above the oil reservoir, the gas pressure,and/orthe expansion of gas bubbles separating from the oil as the oil flows to the well.32
More oil can be recovered (become reserves) bythe injection of :S steam, CO2 (possibly dissolved in water) or nitrogen into the reservoir rock;S water into the aquifer below the oil-water contact; orS gas into the gas cap above the gas-oil contact, so as to increase the pressure that
drives the oil towards the wells.the injection of chemicals which reduce the viscosity of the oil, thus increasing the speedof the flow towards the wells.
Moreover, enhanced recovery can be achieved byhorizontal drilling, which enlarges the volume of reservoir rock from which oil can berecovered.
The use of these techniques has been profitable since the 1980's. However, enhancedrecovery by means of CO2 injection - a means of CO2 sequestration - requires that CO2 isseparated from the flue gas from power stations or industrial plants and transported to theinjection wells through pipelines. For instance, in a paper A CO2 Infrastructure for the NorthSea by Hugh Sharman33 it is proposed that pipelines for the transportation of CO2 to matureoil fields in the North Sea are laid out from the UK and Denmark.
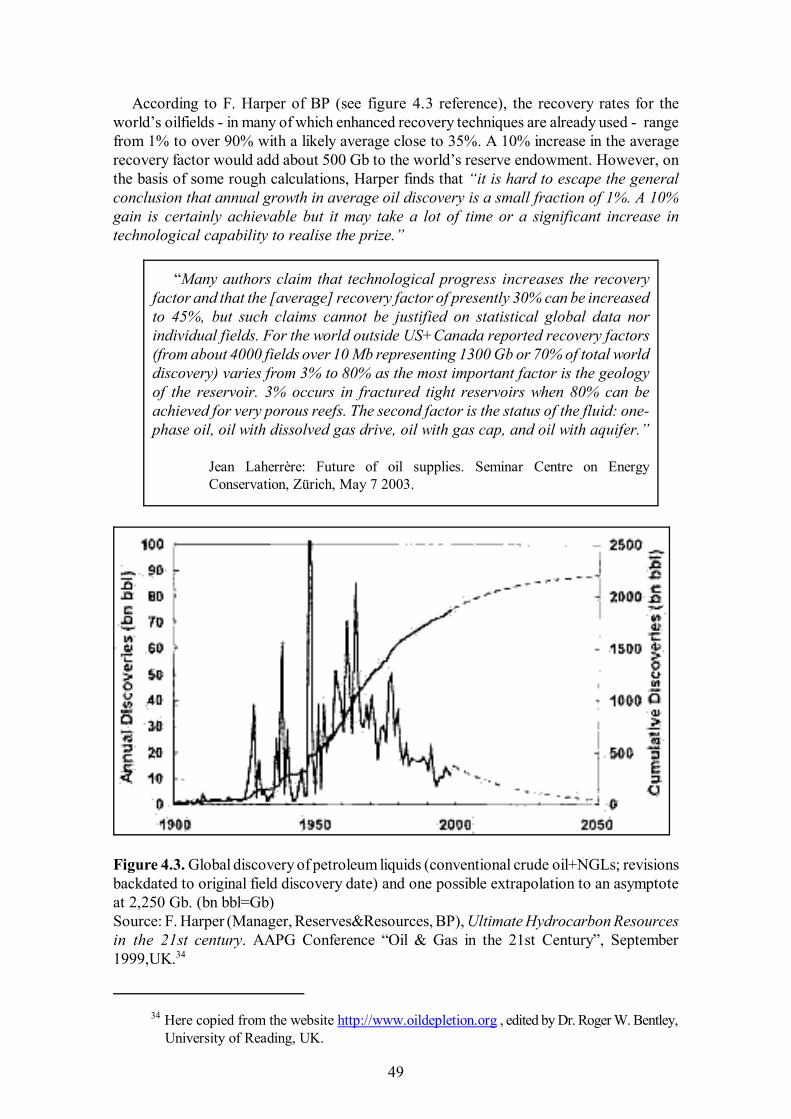
34 Here copied from the website http://www.oildepletion.org , edited by Dr. Roger W. Bentley,University of Reading, UK.
49
“Many authors claim that technological progress increases the recoveryfactor and that the [average] recovery factor of presently 30% can be increasedto 45%, but such claims cannot be justified on statistical global data norindividual fields. For the world outside US+Canada reported recovery factors(from about 4000 fields over 10 Mb representing 1300 Gb or 70% of total worlddiscovery) varies from 3% to 80% as the most important factor is the geologyof the reservoir. 3% occurs in fractured tight reservoirs when 80% can beachieved for very porous reefs. The second factor is the status of the fluid: one-phase oil, oil with dissolved gas drive, oil with gas cap, and oil with aquifer.”
Jean Laherrère: Future of oil supplies. Seminar Centre on EnergyConservation, Zürich, May 7 2003.
According to F. Harper of BP (see figure 4.3 reference), the recovery rates for theworld’s oilfields - in many of which enhanced recovery techniques are already used - rangefrom 1% to over 90% with a likely average close to 35%. A 10% increase in the averagerecovery factor would add about 500 Gb to the world’s reserve endowment. However, onthe basis of some rough calculations, Harper finds that “it is hard to escape the generalconclusion that annual growth in average oil discovery is a small fraction of 1%. A 10%gain is certainly achievable but it may take a lot of time or a significant increase intechnological capability to realise the prize.”
Figure 4.3. Global discovery of petroleum liquids (conventional crude oil+NGLs; revisionsbackdated to original field discovery date) and one possible extrapolation to an asymptoteat 2,250 Gb. (bn bbl=Gb)Source: F. Harper (Manager, Reserves&Resources, BP), Ultimate Hydrocarbon Resourcesin the 21st century. AAPG Conference “Oil & Gas in the 21st Century”, September1999,UK.34
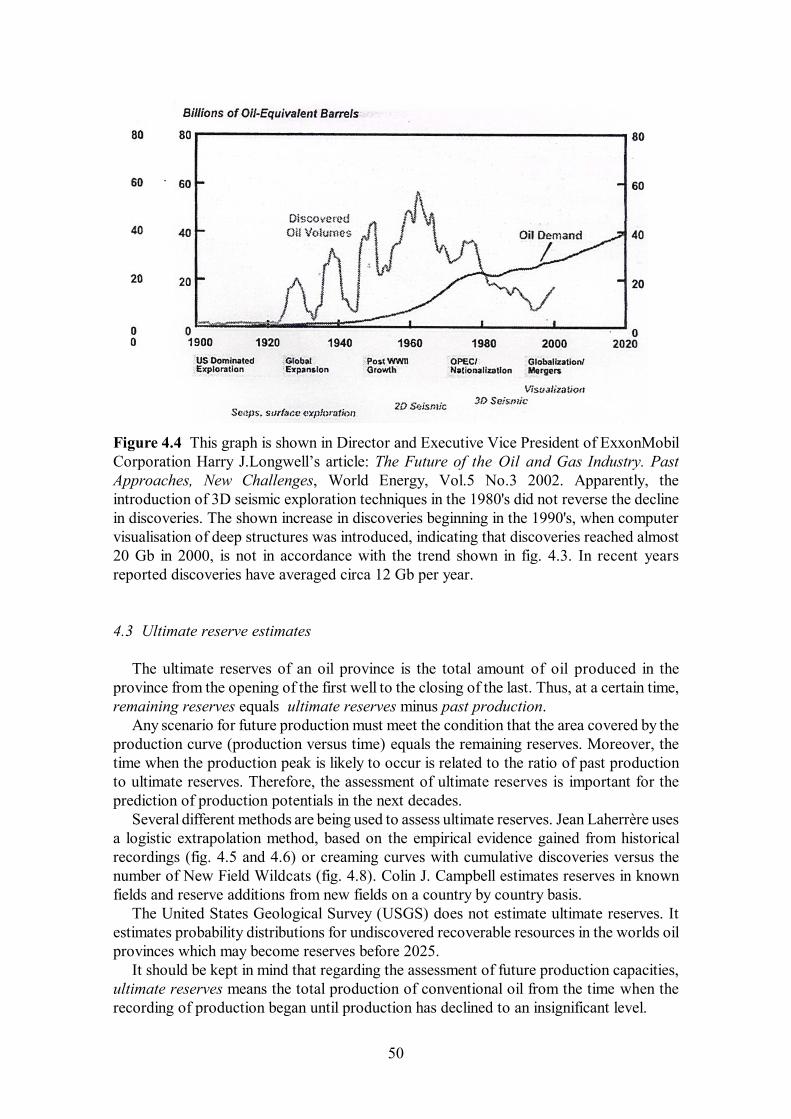
50
Figure 4.4 This graph is shown in Director and Executive Vice President of ExxonMobilCorporation Harry J.Longwell’s article: The Future of the Oil and Gas Industry. PastApproaches, New Challenges, World Energy, Vol.5 No.3 2002. Apparently, theintroduction of 3D seismic exploration techniques in the 1980's did not reverse the declinein discoveries. The shown increase in discoveries beginning in the 1990's, when computervisualisation of deep structures was introduced, indicating that discoveries reached almost20 Gb in 2000, is not in accordance with the trend shown in fig. 4.3. In recent yearsreported discoveries have averaged circa 12 Gb per year.
4.3 Ultimate reserve estimates
The ultimate reserves of an oil province is the total amount of oil produced in theprovince from the opening of the first well to the closing of the last. Thus, at a certain time,remaining reserves equals ultimate reserves minus past production.
Any scenario for future production must meet the condition that the area covered by theproduction curve (production versus time) equals the remaining reserves. Moreover, thetime when the production peak is likely to occur is related to the ratio of past productionto ultimate reserves. Therefore, the assessment of ultimate reserves is important for theprediction of production potentials in the next decades.
Several different methods are being used to assess ultimate reserves. Jean Laherrère usesa logistic extrapolation method, based on the empirical evidence gained from historicalrecordings (fig. 4.5 and 4.6) or creaming curves with cumulative discoveries versus thenumber of New Field Wildcats (fig. 4.8). Colin J. Campbell estimates reserves in knownfields and reserve additions from new fields on a country by country basis.
The United States Geological Survey (USGS) does not estimate ultimate reserves. Itestimates probability distributions for undiscovered recoverable resources in the worlds oilprovinces which may become reserves before 2025.
It should be kept in mind that regarding the assessment of future production capacities,ultimate reserves means the total production of conventional oil from the time when therecording of production began until production has declined to an insignificant level.

35 Figure 4.5, 4.6, 4.7 and 4.8 and figure texts are copied from: Jean Laherrère: Future of oil supplies. Seminar Centre on Energy Conservation, Zürich, May 7 2003.
36 The logistic model shown in fig. 4.5 was first used by M. King Hubbert when in 1956 hepredicted that oil production in the US would peak in 1970, estimating ultimate US reserves at 200 Gb.Production did peak in 1970.
51
4.3.1 Laherrère’s estimates
In broad principle, the method is illustrated by fig. 4.3. The curve showing cumulativediscoveries is extrapolated to a maximum of about 2,250 Gb, which is the estimated ultimatereserve value found in the case shown.
Based on the industry’s technical databases, Jean Laherrère has carried out detailedanalyses of reported reserve and production values for the world’s many oil provinces.Some of his main results are shown in fig. 4.5, 4.6 and 4.7.35 In these figures, discoveriescorrespond to backdated so-called P50 data.
Figure 4.5 World oil + condensate discovery (FSU corrected and excluding extra-heavyoils) with logistic model which fits production after a shift of 32 years.36
The USGS 2000 [see section 4.2.2 below] estimate of the conventional oil+NGL to bediscovered in 2025 being 3 Tb (in fact the published value is more accurate being 3,012 Gb)is plotted on this graph and looks very hard to fit with the past discovery.[Tb= 1,000 Gb. Condensate: condensates from gas wells, not including Natural Gas PlantLiquids (NGPL), see section 2.1.2 above]
Cumulative production lags behind cumulative discovery. Fig. 4.5 shows a time lag of32 years until 1980 when OPEC countries reduced production as demand decreased becauseof the increase in the oil price. Had cumulative production followed the logistic

52
curve, almost all of the ultimate reserves of about 2,000 Gb (2 Tb) would have beenproduced by 2030.
Figure 4.6. World oil+condensate cumulative discovery by field size with logistic model.
Figure 4.7. World cumulative number of fields over 100 Mb (major) The extrapolation ofthe annual/cumulative versus cumulative production (or discovery) can deliver the ultimatewhen the annual curve follows a derivative of the logistic curveFor the US, the extrapolation of the production gives an ultimate of 220 Gb.
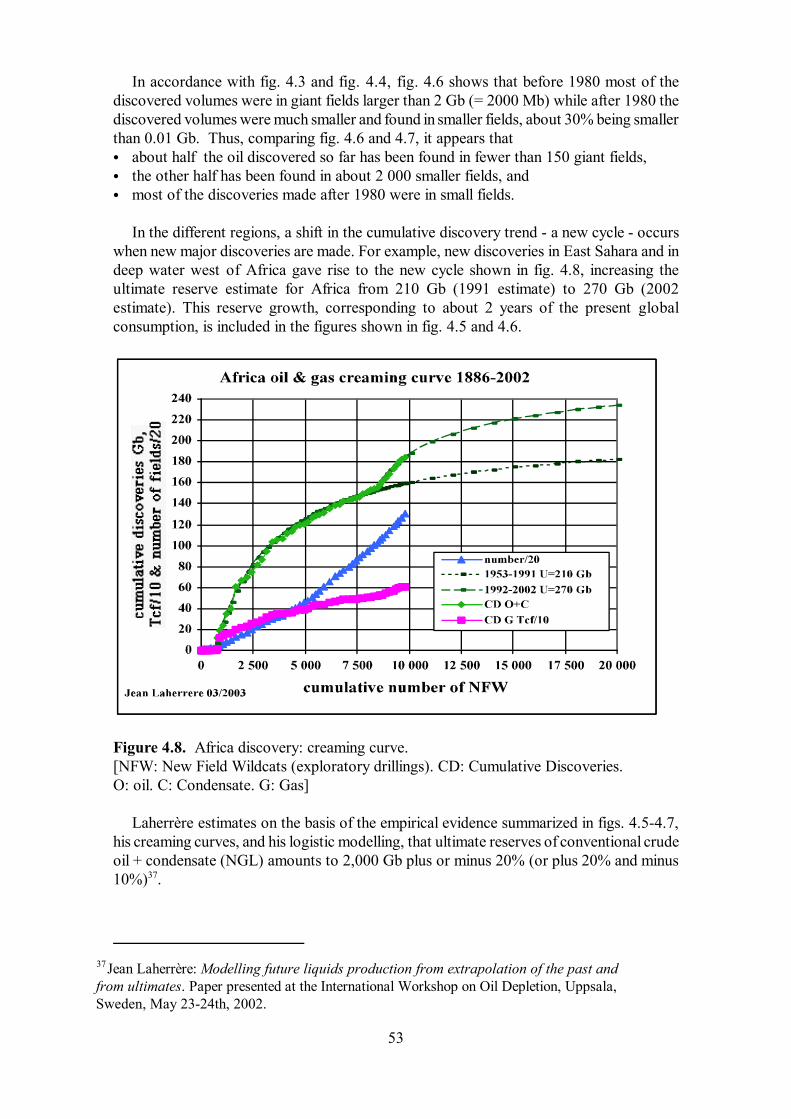
37Jean Laherrère: Modelling future liquids production from extrapolation of the past andfrom ultimates. Paper presented at the International Workshop on Oil Depletion, Uppsala,Sweden, May 23-24th, 2002.
53
In accordance with fig. 4.3 and fig. 4.4, fig. 4.6 shows that before 1980 most of thediscovered volumes were in giant fields larger than 2 Gb (= 2000 Mb) while after 1980 thediscovered volumes were much smaller and found in smaller fields, about 30% being smallerthan 0.01 Gb. Thus, comparing fig. 4.6 and 4.7, it appears that
about half the oil discovered so far has been found in fewer than 150 giant fields,the other half has been found in about 2 000 smaller fields, andmost of the discoveries made after 1980 were in small fields.
In the different regions, a shift in the cumulative discovery trend - a new cycle - occurswhen new major discoveries are made. For example, new discoveries in East Sahara and indeep water west of Africa gave rise to the new cycle shown in fig. 4.8, increasing theultimate reserve estimate for Africa from 210 Gb (1991 estimate) to 270 Gb (2002estimate). This reserve growth, corresponding to about 2 years of the present globalconsumption, is included in the figures shown in fig. 4.5 and 4.6.
Figure 4.8. Africa discovery: creaming curve.[NFW: New Field Wildcats (exploratory drillings). CD: Cumulative Discoveries.O: oil. C: Condensate. G: Gas]
Laherrère estimates on the basis of the empirical evidence summarized in figs. 4.5-4.7,his creaming curves, and his logistic modelling, that ultimate reserves of conventional crudeoil + condensate (NGL) amounts to 2,000 Gb plus or minus 20% (or plus 20% and minus10%)37.
54
4.3.2 Campbell’s estimates
Colin J. Campbell has adjusted public domain reserve data (from World Oil and theOil&Gas Journal) for 64 oil producing countries and estimated future reserve additionsfrom new fields, using available data from the industry’s databases, see table 4.1.
Adding up, he finds :
Conventional crude oil+condensate:Gb
Past production (2002) 873Known reserves (2002) 884New fields 144_____________________________Ultimate global reserve 1900
This estimate is at the lower end of the interval estimated by Jean Laherrère.
As Campbell has emphasized in his speeches and papers, we know that all the numbersare imprecise. However, when for each country the best available data are used for thescrupulous, professional estimation of ultimate reserves, then the relative deviation (in %)of the estimated total from the value actually to materialize is likely to be smaller than therelative deviations of the particular country-values - assuming the same (Gaussian)probability distribution for each country estimate.
Hence, the questioning of the total is the questioning of the particular country-values. Inother words, any assertion that the total is likely to be too high or too low should besupported by the indication of the particular country-values deemed too high or too low.
Campbell uses the industry’s data to adjust the reserves reported in the public domain(in the journals World Oil and Oil&Gas Journal) and to estimate the portion of the actualreserves reported in the public domain. For Russia, for instance (second line in table 4.1),he adjusts the public domain reserve estimates downwards by 4.83 Gb (about 10%) andestimates that only 67% of the actual reserves has been reported in the public domain.Adding past production (121 Gb) and future production from new fields (estimated at 12.9Gb), he estimates Russia’s ultimate reserves to be 200 Gb.
Assertions that these values are unrealistic should be supported by the specification ofthe numbers claimed to be more realistic and the indication of plausible reasons why thenumbers should be changed. For example, if future reserve growth in existing fields inRussia is deemed to add a substantial amount to Campbell’s reserve estimate, thetechnological, geological and economic prerequisites for such additional growth should beindicated for the major oil provinces and the annual growth rates to be expected in the nextdecades should be specified.
Thus, table 4.1 provides a useful framework for the objective, well-reasoned assessmentof the global conventional reserves likely to be accessible within the next decades and therates at which these reserves can be produced. Additional reserves may become accessiblein the more distant future but this is of no consequence for the assessment of the time whenan impending peak is likely to occur.
In section 5.5 below, possible effects of modifications of Campbell’s estimates withrespect to the time of the peak in oil supply and the subsequent decline are examined.

55
Table 4.1 Estimated Past and Future Production by Country and Region.Colin J. Campbell: Forecasting Global Oil Supply. Submission to H.M.Government Consultationon Energy Policy, 2002.
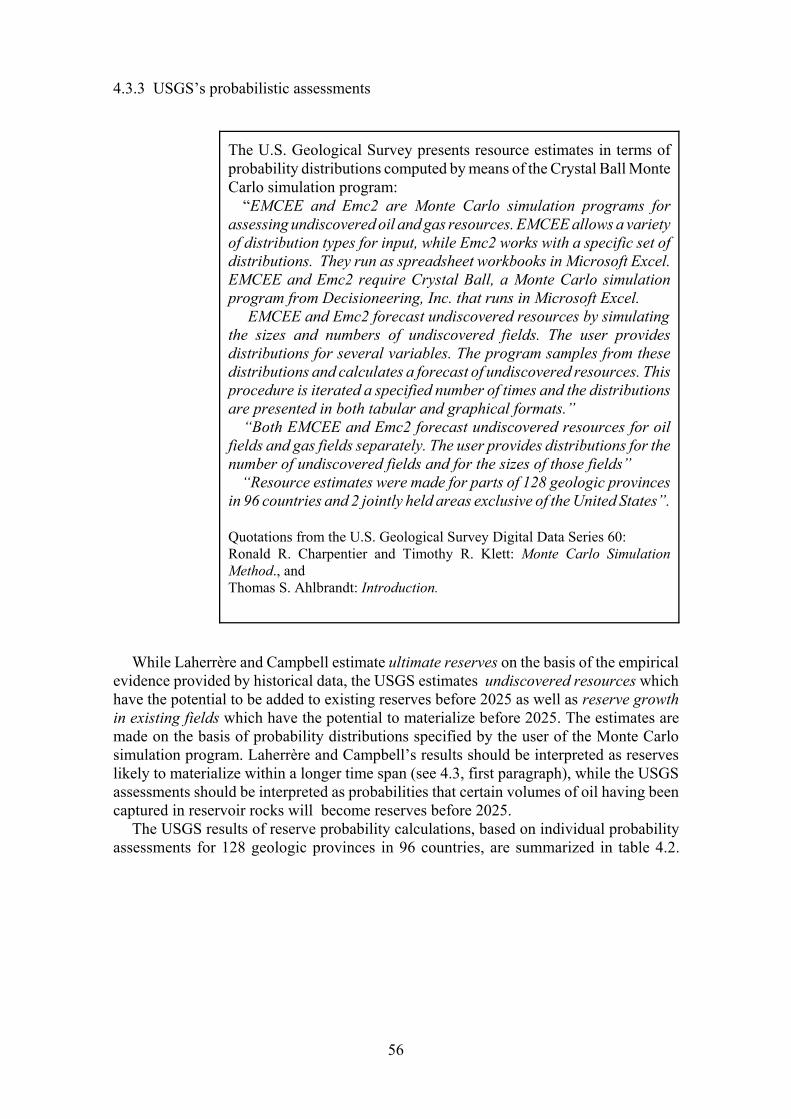
56
The U.S. Geological Survey presents resource estimates in terms ofprobability distributions computed by means of the Crystal Ball MonteCarlo simulation program: “EMCEE and Emc2 are Monte Carlo simulation programs forassessing undiscovered oil and gas resources. EMCEE allows a varietyof distribution types for input, while Emc2 works with a specific set ofdistributions. They run as spreadsheet workbooks in Microsoft Excel.EMCEE and Emc2 require Crystal Ball, a Monte Carlo simulationprogram from Decisioneering, Inc. that runs in Microsoft Excel. EMCEE and Emc2 forecast undiscovered resources by simulatingthe sizes and numbers of undiscovered fields. The user providesdistributions for several variables. The program samples from thesedistributions and calculates a forecast of undiscovered resources. Thisprocedure is iterated a specified number of times and the distributionsare presented in both tabular and graphical formats.” “Both EMCEE and Emc2 forecast undiscovered resources for oilfields and gas fields separately. The user provides distributions for thenumber of undiscovered fields and for the sizes of those fields” “Resource estimates were made for parts of 128 geologic provincesin 96 countries and 2 jointly held areas exclusive of the United States”.
Quotations from the U.S. Geological Survey Digital Data Series 60:Ronald R. Charpentier and Timothy R. Klett: Monte Carlo SimulationMethod., andThomas S. Ahlbrandt: Introduction.
4.3.3 USGS’s probabilistic assessments
While Laherrère and Campbell estimate ultimate reserves on the basis of the empiricalevidence provided by historical data, the USGS estimates undiscovered resources whichhave the potential to be added to existing reserves before 2025 as well as reserve growthin existing fields which have the potential to materialize before 2025. The estimates aremade on the basis of probability distributions specified by the user of the Monte Carlosimulation program. Laherrère and Campbell’s results should be interpreted as reserveslikely to materialize within a longer time span (see 4.3, first paragraph), while the USGSassessments should be interpreted as probabilities that certain volumes of oil having beencaptured in reservoir rocks will become reserves before 2025.
The USGS results of reserve probability calculations, based on individual probabilityassessments for 128 geologic provinces in 96 countries, are summarized in table 4.2.

57
USGS. World PetroleumAssessment 2000
Conventional oil. Billion barrels
P95 P50 P5 Mean
World, excluding United States
Undiscovered 334 607 1107 649
Reserve growth 192 612 1031 612
Existing reserves (1996) 859
Cumulative production (1996) 539
Total 2659
United States
Undiscovered 66 104 83
Reserve growth 76
Existing reserves (1996) 32
Cumulative production (1996) 171
Total 362
World total 2248 3896 3003
Table 4.2 U.S. Geological Survey’s probability assessments of new reserves which havethe potential to be added to existing reserves before 2025.Px: x % probability that at least the shown undiscovered reserves exist and that at least theshown reserve growth will materialise before 2025.Mean: the mean value of the probability distribution.
USGS. World PetroleumAssessment 2000
Conventional oil. Billion barrels Undiscovered reserves
P95 P50 P5 Mean
Middle East and North Africa 73 216 432 230
East Greenland 0 112 47
Iraq 14 45 84
Table 4.3 U.S. Geological Survey’s probability assessments for undiscovered reserves inthree regions. In the East Greenland province there may be nothing, but the USGS findsthat there is a 5% probability (P5) that there is 112 Gb, i.e. 80% more than the North Seareserves (Norway, UK, Denmark, totalling about 62 Gb in 2000).

38 Jean Laherrère: Future of Oil Supply. Paper presented at Seminar Centre of EnergyConversion. Zürich, May 2003.
58
The US is the most mature of the world’s major oil regions. Most of the discoverieswere made before 1940 and most of the oil discovered has already been produced.Therefore, the relative deviation (P5 - P95)/Mean for undiscovered reserves is much lowerfor the US than for the world outside the US. Also, because the P95 and P5 values for theworld’s individual regions are not additive, the relative deviations are higher for theindividual regions outside the US than for the world outside the US as a whole, see forexample table 4.3.
Regarding reserve growth, Laherrère and Campbell have drawn attention to the differentreserve definitions used in the US and the rest of the world and the probable consequencesthe different definitions may have for the USGS assessments. “The US practice has tocomply with the SEC (Securities and Exchange Commission) rules, which recognise onlyProven Reserves, omitting Probable Reserves, whereas in the rest of the world Proven andProbable Reserves are recognised”38 Thus, as the reported reserves for the world outsidethe US include Probable Reserves it should be expected that future reserve growth isrelatively smaller than in the US, where the basis for the growth assessment is lowerbecause Probable Reserves are not included.
In any case, the assessments must be interpreted within the framework of probabilitytheory, which refers to events or samples drawn from an event space specified in terms ofprobabilities assigned to the particular events. For example, one can imagine a bottle-fillingmachine filling different volumes at random into an array of bottles, the volume in eachbottle being larger than or equal to zero and less than or equal to 100 ml. On the basis ofa long series of samples or, alternatively, knowledge about the functioning of the machine,a probability Px may be assigned to the event that a bottle chosen at random contains morethan x ml.
Regarding the amounts of oil “bottled” in a certain province, the “bottle-filling machine”is the complex of biological, chemical and geological processes which have taken placeover the last 150 million years or so and which may have resulted in a certain amount ofoil still being trapped in reservoir rocks. As the processes cannot be repeated, theassignment of a probability to a certain outcome (event) must be based on knowledge about“the functioning of the machine”, i.e. the particular conditions under which the formationand subsequent trapping of oil may have taken place. Moreover, as the probabilityassignments concern only quantities which have the potentials to become reserves before2025, also knowledge about or assumptions as to exploration activities and the results ofthese activities within this period of time must be taken into account.
In the USGS survey, such knowledge about geological conditions and explorationactivities was represented by groups of experts appointed for the different provinces. Foreach province, the group specified probability distributions for the amount of oil trappedin the province, assigning probabilities to the different possible outcomes of the particularcomplex of chemical and geological processes which have taken place in the province overmany millions of years and which are unknown with respect to several decisive parameters.The specified probability distributions were entered into the Monte Carlo simulationprogram and probability distributions for the different regions and for the world outside theUS were computed by multiplying the geological probabilities by accessabilityprobabilities, i.e. probabilities that at least part of the oil to which a geological probabilityis assigned will be politically and technologically open to exploitation. In view of theresults computed, the estimation process was iterated a number of times.

39 IEA, World Energy Outlook 2002 and World Energy Investment Outlook, Insights 2003
40 EIA: Long Term World Oil Supply. www.eia.doe.gov
41 WETO: World energy, technology and climate policy outlook 2030. EuropeanCommission, Directorate-General for Research. Community Research, 2003. (EUR 20366).http://europa.eu.int/comm/research/
59
“The modelling of oil and gas reserves and production is carried out inthree stages in the POLES model.
First, the model simulates the level of oil and gas resources discoveredeach year (cumulated discoveries) as a function of Ultimate RecoverableReserves and of the cumulative drilling effort. URR are not fixed asconsidered usually: they are the product of the oil and gas in place for abase year (from USGS estimates) and of a recovery ratio that increaseswith the price and an autonomous technological trend. The drilling effortis also a function of the price and a trend.
Second, the reserves are equal to the difference between the cumulativediscoveries and this cumulative production for the previous period.
Finally, the model calculates production. For oil, it results from applyinga Reserve on Production ratio in the “price taker” regions, while the“swing producers” balance between the oil demand and supply. For gas,it is derived from the simulated demand”.
WETO: World energy, technology and climate policy outlook 2030.European Commission, Directorate-General for Research. Community Research,2003. (EUR 20366). http://europa.eu.int/comm/research/Op. cit. p. 39, box 4.
Considering the unquantifiable uncertainties pertaining to the probability distributionsthus specified for each of the 128 geological provinces, the uncertainties of the resultssummarized in table 4.2 cannot be estimated.
The International Energy Agency (IEA)39, the US Energy Information Administration(EIA)40, and the European Commission41 base their supply security assessments on theprobabilities presented by the USGS. However, the extent to which IEA’s investmentestimates regarding exploration and development until 2030 are related to the USGSprobability assessments is not evident.
4.3.4 The WETO POLES model

60
In the WETO report it is concluded that:
“Sufficient oil reserves exist worldwide to satisfy the projected demand during thenext decades. However the decline in conventional oil reserves may constitute apreoccupying signal beyond 2030. It is only partially compensated by an increasein the reserves of non-conventional oil. The reserves of natural gas are abundantand expected to increase by around 10%.” (op.cit.p.3, Key Messages)
Although oil production is not determined by reserves but by production capacity, whichdepends on reserves and for each oil field begins to decline when a certain portion of thereserve has been produced, the message conveyed by this conclusion is that conventionaloil production can cover most of the oil demand until and beyond 2030, even if the demandgrows by 70% from 75 Gb in 2000 to 120 Gb in 2030.
The hypothesis upon which this conclusion is based is that reserve growth and newdiscoveries in the next decades is a function of the oil price and an unspecified“technological trend”, representing enhanced recovery technology (see box above).Ultimate Recoverable Reserves (URR) are assumed to grow to 4,500 Gb in 2030 due toan increase in recovery rates from 30-40 % in 2000 to 50-70% in 2030, depending on theregion (p. 38):
“As the production level is increasing during the projection period, the worldReserve to Production [R/P] ratio decreases from 40 years to 18 years: in themodel simulation this is the key driving force explaining the increase in oil pricefrom the end of the current decade onwards.” (op.cit. p.38)
World oil price USD per barrel
2000 2010 2020 2030
WETO (1) 26.5 23.8 28.7 34.9
US-DOE (1) 21.6 22.8
IEA (2) 28 21 25 29
(1): WETO p. 121 (2): IEA, World Energy Outlook 2002, p. 48
Table 4.4 Oil price forecasts. The WETO prices are computed on the basis of thedevelopment in the global R/P ratio, adopting the theoretical assumption that this ratio isthe key driving force for the price development. Yet, although the IEA oil prices areconsiderably lower than the WETO prices from 2010 onwards, global oil productionassumes the same value (120 million barrel per day or 44 Gb per year) in 2030 in the IEAreference scenario and in the WETO reference scenario. This implies that the models usedto compute the two scenarios have inherently different properties.
In essence, the key message is that assuming the hypothesis that Ultimate RecoverableResources grow as a function of an unspecified technology trend and the oil price, whichis a function of the current R/P ratio, a growth in oil demand by 1.6 % per year (from 27Gb per year in 2000 to 44 Gb per year in 2030) can be sustained at the oil prices shown intable 4.4 (WETO).
61
According to the BP Statistical Review of World Energy 2003, the global R/P ratiodeclined from 43 years in 1992 to 41 years in 2002. As the WETO oil price is a decliningfunction of the R/P ratio, the drop in the price from 2000 to 2010 (table 4.4) implies agrowth in the R/P ratio, i.e. a reversal of the trend in the past 10 years. In other words, in theWETO scenario, annual reserve growth in the next decade exceeds annual production bya considerable amount. To achieve such a reserve growth, the past discovery trends shownin figs. 4.3 and 4.4 must take an abrupt upward turn and/or annual reserve growth in existingfields must be substantially increased within a short time-span.
Although the enhanced recovery techniques mentioned in section 4.2 above have beenapplied in the US since the 1980's, the continual decline in production since the peak in1970 has not been reversed, see fig. 5.7 below. The high oil price at the beginning of the1980's (up from 25 $/barrel in 1979 to 38 $/barrel in 1980 and then declining to 30 $/barrelin 1983) was accompanied by a small growth in reserves and production (see fig. 5.7).However, from 1985 onwards the decline in US production has continued even thoughincreasing dependency on oil imports has been a serious concern for the US administrations.
Thus, the US oil production history does not render evidence to the hypothesis thatenhanced recovery techniques will substantially increase reserves and production in the nextdecades with the R/P ratio as the ‘key driving force’. (The US R/P ratio was practicallyconstant in the 1980's when the decline in reserves was arrested). Nor does the evidence sofar gained from the North Sea oilfields support this hypothesis:
“Experience in North America and the North Sea shows that advanced technologycan help arrest declines in production. But there is growing evidence that declinerates are becoming steeper in some regions.” (IEA World Energy Outlook 2002.op.cit. p. 100)
“North Sea production is already in decline and this is unlikely to change.”(ibid. p. 98)
The Oil & Gas Journal (June 11 2003) reports an industry study by the Merryll LynchGlobal Securities Research & Economics Group (see quotations in section 6.2 below),which indicates that the oil industry’s technological opportunities and investment policiesneed not be in accordance with hypothetical assumptions.
The WETO report does not refer to other empirical evidence which supports itshypotheses.

62

42 European Commission: World energy, technology and climate policy outlook 2030(WETO), 2003
63
“The catch is that while demand increases, existingproduction declines. To put a number on it, we expect that by2010 about half the daily volume needed to meet projecteddemand is not on production today - and that’s the challengefacing producers. This means that industry may need to add some 80 millionoil-equivalent barrels per day to production by 2010 to meetprojected demand. The cost of doing so could reach $ 1trillion, or about $ 100 billion a year. That’s substantiallymore than industry is spending today.”
Harry J. Longwell, Director and Executive Vice President ofExxon Mobil Corporation in his article:The Future of the Oil and Gas Industry: Past Approaches, NewChallenges. World Energy, Vol.5 No. 3, 2002.
5. Oil Demand and Reserve Depletion Scenarios
Oil demand is determined by the dependence of the economy on oil-based technologies:oil-driven vehicles, aeroplanes, ships, agricultural machinery, industrial processes, powerstations, oil-fired boilers in buildings and district heating stations. In areas where naturalgas distribution networks exist, natural gas can be substituted for oil in boilers and powerstations at moderate investment costs and in some areas solid biomass fuels or coal maypartly substitute oil in boilers. However, in many areas there are no immediately availablesubstitutes for oil in stationary units and nowhere are infrastructures in place for thedistribution of other fuels than oil for vehicles. Moreover, it takes time to replace thegrowing number of cars (presently about 400 million worldwide, expected to grow to about900 million in 203042) and the millions of trucks and other oil-powered vehicles by newvehicles which can run on other fuels than oil.
Hence, a smooth technological transition to an economy less dependent on oil impliesthe initiation of technological shifts well ahead of the peak in oil production. If oil-basedtechnologies remain the cheapest alternatives until the production peak occurs, thecontinued increase in demand will shorten the time until the peak occurs and make the gapbetween demand and production wider and the decline in production steeper. The worldeconomy will become technologically more and more dependent on oil as the cheap-oil eracomes to an end. This unfortunate development appears in all the different scenariospublished by energy agencies and the industry. Only the estimated time and height of thepeak and the subsequent decline rate differs from one scenario to another.
In the1970's and 1980's, when OPEC curtailed production and introduced productionquotas for its member states, oil demand in the USA and Europe was reduced by shiftingfrom oil to coal or natural gas in many power stations and industries and to natural gas orelectricity for room heating in many buildings. Thus global oil demand plunged by about
43 IEA. World Energy Outlook 2002.
64
2% per year from 1979 to 1985, then resuming growth at a rate averaging about 1.2 % from1985 to 2001 - the growth rate being strongly correlated to the global economic growthrate43. At the same time new non-OPEC oil fields were opened, the North Sea being thebiggest new oil province, reaching almost 25% of the total OPEC production by the year2000.
Today the scope for shifting from oil to coal or natural gas is much smaller. Moreover,demand has grown by about 20% since 1975, the North Sea production is in decline, andthe US production has dropped by about 30% since its peak in 1970. Hence, the options forcounteracting in the short term an unexpected decline in supply are much more limited todaythan they were in the 1970's and 1980's. Therefore, the prospects for future demand andsupply should be examined closely and presented to the public in an intelligible form withreferences to the methods and data upon which the forecasts are based. A subjectivedistinction between ‘optimists’ and ‘pessimists’ is not helpful for the objective discussion.
5.1 Demand and supply
The logical catch is that if a gap between demand and productionoccurs, it is because no economically competitive andenvironmentally acceptable alternatives to conventional oil are inplace. If economically competitive alternatives are in place, thenthere will be no gap.
Any conventional oil production scenario is subject to the following constraints:the area covered by the production curve (past and future production) equals the ultimatereserves as estimated for the scenario in question.cumulative production must follow cumulative discovery with a certain time lag.Depending on demand and/or production restrictions the time lag may vary over time,see for example fig. 4.5.annual global production should equal annual global demand.
Under these objective constraints, scenarios for the future development are preparedunder the axiomatic assumption that economic growth at a rate averaging at least 2% p.a.will continue worldwide, unrestricted by eventual constraints in the supply of oil and naturalgas. The reason for this is not that there is empirical evidence that such growth issustainable. The reason is that without such an economic growth axiom the future becomesincalculable, because nobody can foresee the disruptive consequences that zero or negativeeconomic growth over a longer period of time will have in the capitalistic market economy.If economic growth remains technologically dependent on growth in conventional oil supplyuntil global conventional oil production peaks, then the development following the peak isunpredictable.
It follows that a continuous economic growth scenario implies that the peak inconventional oil production occurs because of a decline in demand and that the subsequentdecline in conventional oil production is determined by the decline in demand, not by adecline in production capacity.

65
“My analyses are based upon the simple fundamental geologic factthat initially there was only a fixed and finite amount of oil in theground, and that, as exploitation proceeds, the amount of oilremaining diminishes monotonically. We do not know how much oilwas present originally or what fraction of this will ultimately berecovered. These are among the quantities that we are trying toestimate.”
“If oil had the price of pharmaceuticals and could be sold in unlimitedquantity, we probably would get all out except the smell. However,there is a different and more fundamental price that is independent ofthe monetary price. That is the energy cost of exploration andproduction.”
Quotations from M. King Hubbert’s response to remarks by David Nissen,Exxon, 1982.www.hubbertpeak.com/hubbert/to_nissen.htm
In spite of this condition, scenarios for the future production of conventional oil are,generally, based on the implicit assumption that production is primarily related toproduction capacity, deviations of demand from production capacity (e.g. figs. 4.5 and 5.3)being considered anomalies.
5.2 Hubbert depletion scenarios
In essence, the message conveyed by M. King Hubbert’s extensive studies of growth anddecline phenomena on this planet, exemplified by population growth in its biologicalsystems - including homo sapiens - and the industrial extraction of minerals and fossil fuels,is shown in fig. 5.1. Regarding biological and physical resources, exponential growth cancontinue only for a limited period of time. Renewable resources, i.e. those regenerated bysolar radiation in annual biological, hydrological and aerodynamic cycles, have upper limits,theoretically determined by the difference in entropy between the insolation and the heatradiation from the Earth to the universe, but in practice set by biological, technological andeconomic constraints. The production of exhaustible resources, such as conventional oil,will peak at a time determined by the marginal costs of producing another tonne or barrelby means of available technologies, as well as by the production capacity which is availableor can be made available early enough to postpone the peak. Regarding oil, these economicconditions are mainly determined by the resources discovered, the amounts alreadyproduced, and the time and money it takes to add resources to the reserve base.
In 1956 Hubbert made his famous prediction that oil production in the US lower 48 stateswould peak around 1970, which indeed it did. His prediction was based on the assumptionthat annual oil production in a region comprising a large number of oil provinces followsa bell-shaped curve, a Hubbert-curve, symmetrical with respect to the peak and covering anarea equal to the ultimate reserves. It follows that the peak occurs when 50% of the ultimatereserves have been produced. Later he drew a Hubbert-curve for world crude oilproduction, assuming ultimate reserves to be 2,000 Gb, see fig. 5.2.

66
Figure 5.1 Three types of growth. (From M. King Hubbert: Exponential Growth as aTransient Phenomenon in Human History, 1974. www.hubbertpeak.com/hubbert/wwf1976)
Figure 5.2 Complete-cycle curve for world crude oil production (ibid., Hubbert, 1974)
The Hubbert-curve corresponds to the derivative of the logistic, S-shaped, productioncurve shown in fig. 4.5.

67
As shown in fig. 5.2, Hubbert expected in 1974 that world conventional crude oilproduction would peak at about 110 million barrels per day (40 Gb per year) by the end ofthe century. However, he did not foresee that the sudden soaring of the oil price at that timewould result in the plummeting of demand and production shown in fig. 5.3. Assumingthat ultimate reserves are 2,150 Gb, as against Hubbert’s estimate of 2,000 Gb, and that thepeak occurs when 50% of the ultimate reserves have been produced, the peak occurs by2012 as shown in fig. 5.3.
Figure 5.3 World conventional oil production for 2150 Gb of ultimate reserves.Jean Laherrère: Future of oil supplies. Seminar Center of Energy Conservation, Zürich,May 7 2003.
5.3 Campbell’s depletion scenario
Campbell’s depletion scenario, shown in fig. 5.4, is based on the data shown in table4.1. In this scenario it is assumed that conventional oil production (called regular oil in fig.5.4) remains constant at a level of about 22 Gb per year (60 million barrels per day) until2010, whereupon it declines irrevocably at a rate of about 2% per year. The time (2008)when the decline in total conventional production sets in is determined by the productioncapacities in Russia and the Middle East, the production in the other regions being indecline before 2008. The Russian production remains almost constant until the decline setsin around 2010. The Middle East production grows by about 50% from 2000 to 2010whereupon it remains constant until the decline sets in by 2025.
The growth in total oil production from 27 Gb/ year in 2003 to 31 Gb/ year in 2010 iscovered by growth in non-conventional (non-regular) production (heavy oil, deepwaterwells, polar oil fields, and natural gas liquids (NGL)). After 2010, total oil productiondeclines at an annual rate of about 2%.


69
“A larger resource base generally leads to a later production peak.World oil resource base estimates have trended upwards over the years,from 600 billion barrels estimated in the early 1940's to as high as 3,900billion barrels estimated this year by the U.S. Geological Survey(USGS).”
“To illustrate the important factors affecting estimates of the peakproduction year, EIA postulated 12 scenarios based on three currentUSGS world conventional oil resource base estimates (2,248, 3,003 and3,896 billion barrels - corresponding to high, mean and low probabilitiesof occurrence) and for world oil production annual growth rates (0, 1, 2and 3 percent)”.
“Using a relatively simple algorithm, peak production years wereestimated.”
“EIA’s relative optimism is based on:(1) use of the current USGS world conventional oil resource estimates,which are both larger and more technically sound than past estimates.(2) use of a methodology for estimating the post-peak production paththat is based on the reserve to production (R/P) ratio observed in theUnited States since oil production peaked in 1970.
Other factors, e.g. choice of different production curve hypotheses,market dynamics, technological advances, and economic policies, couldchange the results, perhaps substantially.”
Excerpts from the executive summary of the EIA presentation “Long TermWorld Oil Supply (A Resource Base/Production Path Analysis” (2000).www.eia.doe.gov
decline in oil supplies may, however, have relatively stronger impacts on the welfare of theaffluent societies.
5.3 EIA’s R/P based depletion scenarios
In the presentation Long Term World Oil Supply, 2000 (www.eia.doe.gov), the USDepartment of Energy’s Energy Information Administration (EIA) presented a number ofscenarios (see examples in figs. 5.5 and 5.6 below) which “illustrate the important factorsaffecting estimates of the peak production year”. The EIA uses a “relatively simplealgorithm” to estimate the year when the peak occurs under different assumptions as toultimate reserves, annual consumption growth rates, and production decline rates after thepeak. Considering the results of these illustrative scenario computations, it declared its“relative optimism” regarding conventional oil supplies in the next decades, see thequotations in the box above.
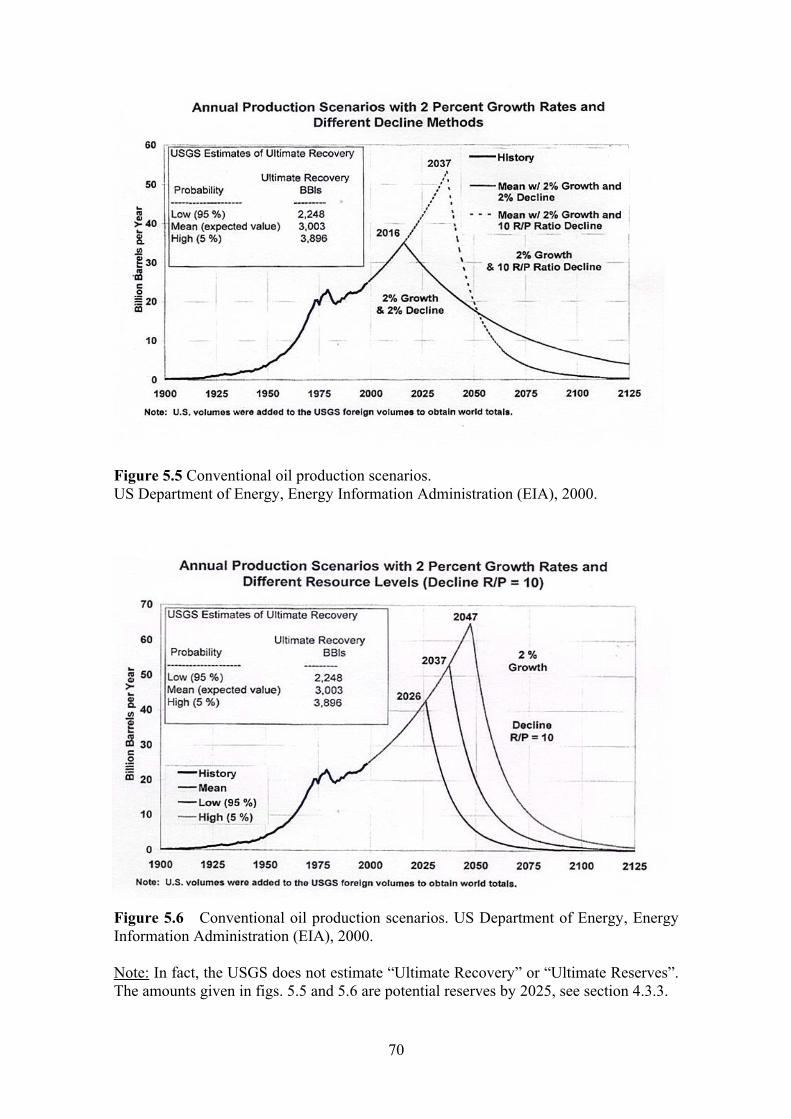
70
Figure 5.5 Conventional oil production scenarios.US Department of Energy, Energy Information Administration (EIA), 2000.
Figure 5.6 Conventional oil production scenarios. US Department of Energy, EnergyInformation Administration (EIA), 2000.
Note: In fact, the USGS does not estimate “Ultimate Recovery” or “Ultimate Reserves”.The amounts given in figs. 5.5 and 5.6 are potential reserves by 2025, see section 4.3.3.

44 It should be noted that in the constant-R/P scenario shown in fig. 5.5, the R/P ratio declinescontinuously from about 85 years in 2000 to about 15 years at peak time in 2037. At the peak adiscontinuity occurs as the ratio suddenly drops to 10 years and remains constant from then onwards. Notechnical or geological reason for such a shift from continuous decline to a constant, lower level is given.
71
In these graphs, the growth curve is the historical production curve extrapolatedexponentially by a certain future growth rate (2% p.a. in the examples shown). The declinecurve is either an exponential decline curve (decline rate 2% in fig. 5.5) or the graph of aconstant R/P function (R/P= 10 in fig. 5.5 and 5.6). The “relatively simple algorithm”computes the time of the peak and the decline curve so that the area under the combinedgrowth and decline curve equals ultimate reserves. In the constant R/P case, the declinefunction P is given as:
P t k R tR t UR CP t
( ) * ( )( ) ( )
== −
peakt t>where is production (Gb/year) at the time (year) ,P t( ) t is a constant (1/year), equal to1/10 in the scenarios shown,k is remaining reserves (Gb),R t( ) is ultimate reserves (Gb), andUR is cumulative production (Gb) from 1900 to .CP t( ) t
Thus, given the growth rate until peak, the decline rate after the peak or the R/P ratio k,the algorithm simply performs an iteration procedure to compute the peak year - i.e. thepoint of intersection between the growth curve and the decline curve - so that the area underthe curves equals ultimate reserves.
Provided that the assumption that global conventional oil consumption continues to growat a constant rate until the peak occurs is realistic, the scenarios illustrate how the followingassumptions and factors influence the peak production year:
the production growth rate before the peak occursthe choice between the hypotheses:(a) that the decline is exponential (constant annual decline percent)(b) the decline function is a constant-R/P functionthe assumed decline rate (a) or the R/P constant (b),the ultimate reserve value
Thus, these scenario computations illustrate that when one adopts different,mathematically simple hypotheses as regards global growth and decline functions anddifferent ultimate reserve estimates, the computations result in peak years ranging from 2016to 2047 in the examples shown in figs. 5.5 and 5.6. As the hypotheses adopted areunverifiable44 and the ultimate recovery estimates range from 2,248 Gb (95% probability)to 3,895 Gb (5% probability), the computational results do not indicate a time intervalwithin which the peak is likely to occur. Naturally, the development in the global

45 The EIA claims that the current USGS conventional oil resource estimates are technicallymore sound than past resource estimates (see the box above). The USGS estimation method isdescribed in section 4.3.3 above. The EIA does not give reasons why it deems this probabilisticmethod technically more sound than other methods which are based on empirical data.
72
conventional oil supply in the next decades cannot be credibly assessed by means of a very simplehypothetical model which describes global development in terms of a few aggregate parameters.45
Regarding the R/P rate assumed in its scenarios, the EIA refers to the decline in USproduction since it peaked in 1970, implying that the decline in world production shouldfollow a constant-R/P decline function with the same R/P rate as in the US. However,comparing the growth-and-decline curve for production in the US 48 Lower States, shownin the same presentation (see fig. 5.7), with the curves computed for world production (figs.5.5 and 5.6), it appears that the curves are topologically different, the curve for the US 48Lower having the shape of a Hubbert-curve, shifted about 12 years from the reserve growth-and-decline curve. Thus, the empirical evidence gained from the recorded development inthe US 48 Lower does not support the constant-R/P hypothesis upon which the EIAscenarios are based.
The implications of the sudden shift from exponential growth to steep decline in the EIAscenarios are noteworthy. The curves depict a world economy becoming technologicallymore and more dependent on conventional oil until, suddenly, a steep decline in the supplyof conventional oil sets in. At that time, no economically competitive alternatives toconventional oil are in place: If competitive alternatives were in place, the demand forconventional oil would not continue to grow exponentially. Thus, the scenarios depict amost unfortunate development resulting in a sudden, steep decline in the supply of aresource upon which the world economy at that time has become even more dependent thanit is today.
Figure 5.7 Conventional oil reserves, currently reported as proved, and production 1945-2000. US Department of Energy, Energy Information Administration (EIA), 2000.

46 The author of the OILPROSPECTS program is Dr. Klaus Illum, ECO Consult, Denmark.e-mail [email protected] .
73
5.5 OILPROSPECTS scenarios
Oil is a basic resource for the world economy. A decline in oil supply for which theeconomy is technologically unprepared will result in unforeseeable disruptions in everysector of the economy. Therefore, governments should not base technological developmentand technological infrastructure policies on scenario projections based on empiricallyunsubstantiated theoretical hypotheses as to future breakthroughs in reserve growth andproduction. Hypothetical breakthroughs which significantly change the trends observed inthe past may occur. However, to rely on their occurrence is hazardous, considering whatis at stake.
Therefore, a scenario model should be consistent with historical evidence and the trendswhich appear from historical recordings, unless there is credible evidence that such trendswill change within the foreseeable future. Moreover, the manner in which basic geologicaland technological conditions for the future development in oil production are representedin the model should be explicitly specified. However, because of the uncertainties of thedata and the hypotheses upon which scenario computations for the future are based, noadditional information can be gained from more sophisticated mathematical models ascompared to simpler models which are consistent and transparent.
Historical evidence and trends concern:Past production in the existing oil provincesThe development in ultimate reserve estimates, includingS reserve growth in existing fieldsS reserve growth by the addition of new fields.
See Chapter 4 above.
Basic geological and technological conditions to be observed concern:Depletion of existing fields. At a certain time, production in an oil field begins to declinebecause of the lowering of the pressure and/or because water accumulated in thereservoir rock below the oil-filled layers reaches the boreholes. In some cases, pressurecan be sustained for a longer time by the injection of pressurized water in the aquiferbelow the water-oil contact, gas in the gas cap above the oil-gas contact, or CO2 into thereservoir rock. Thereby production can be maintained at a level near the peak level foran additional period of time. However, when the pressure eventually begins to dropirrevocably and/or water begins to fill the boreholes, the production drops more steeply.Production in new oil fields. The production from new oil fields follows discovery witha certain time-interval. Production from the fields discovered in a certain year comes on-stream some years later, grows to a peak and then declines. Thus, at a certain time infuture the total production from new fields, i.e. fields discovered after the present time,is the sum of the production functions (production as a function of time) for the newfields discovered before that time.
In order to examine on these grounds the prospect for the future balancing of oil demandand oil supply, a program OILPROSPECTS has been developed for the Danish Board ofTechnology and the Society of Danish Engineers.46

74
The results of the scenario computations should not be interpreted aspredictions. They show what could possibly happen. Meaning that ifdemand develops as specified in the input-data and future reserveadditions and ultimate reserves happen to be as specified, then demandand supply can be balanced as shown by the computational results.Naturally, the results are of little interest if the assumptions made arequite unrealistic. However, the future is unforeseeable and, therefore, itis of interest to examine a range of possible scenarios for the futuredevelopment, based on plausible assumptions. The characteristic feature of the results shown below, is that althoughthe production capacities in the different regions as well as theproduction from new fields follow smooth curves, total productioncapacity suddenly drops steeply. A sudden oil shortage in a world economy in which demand is growingat low oil prices is a possibility which cannot be ruled out.
The OILPROSPECTS program computes scenarios for the future balancing of demandand supply on the basis of a set of variables specifying future demand and potential supplydevelopment. The values of these variables are chosen at runtime. Thus, for any propositionas to the variable values to be assumed, the future balancing of demand and production canbe readily displayed.
Regarding conventional oil, past production, existing reserves, yet-to-find reserves, presentproduction, and production capacities, data can be entered for each country or for regionscomprising a number of countries. In the examples shown below, the world is divided into8 regions.
Non-conventional oil production is in this context oil production which is not includedin the data specifying conventional oil production. It may comprise:S Heavy and extra heavy oil, bitumen (from tar sands) etc.S Deepwater oilS Polar oilS Natural gas liquids (NGL)Present non-conventional oil production and forecasts for future production is specified astotals for the world as a whole.
An input-data file contains values of the following variables:Present global demand and future global demand growth rates. Different growth ratesmay be specified for different periods of time.For each country or region:S Past production (Gb)S Existing reserves (Gb, including reserve growth in existing reserves)S Yet-to-find reserves (Gb)S Present production (million barrels per day)S Maximum production capacity, present and projected future capacities (million barrels
per day). The specification of these values is optional but they should be entered forswing producers.
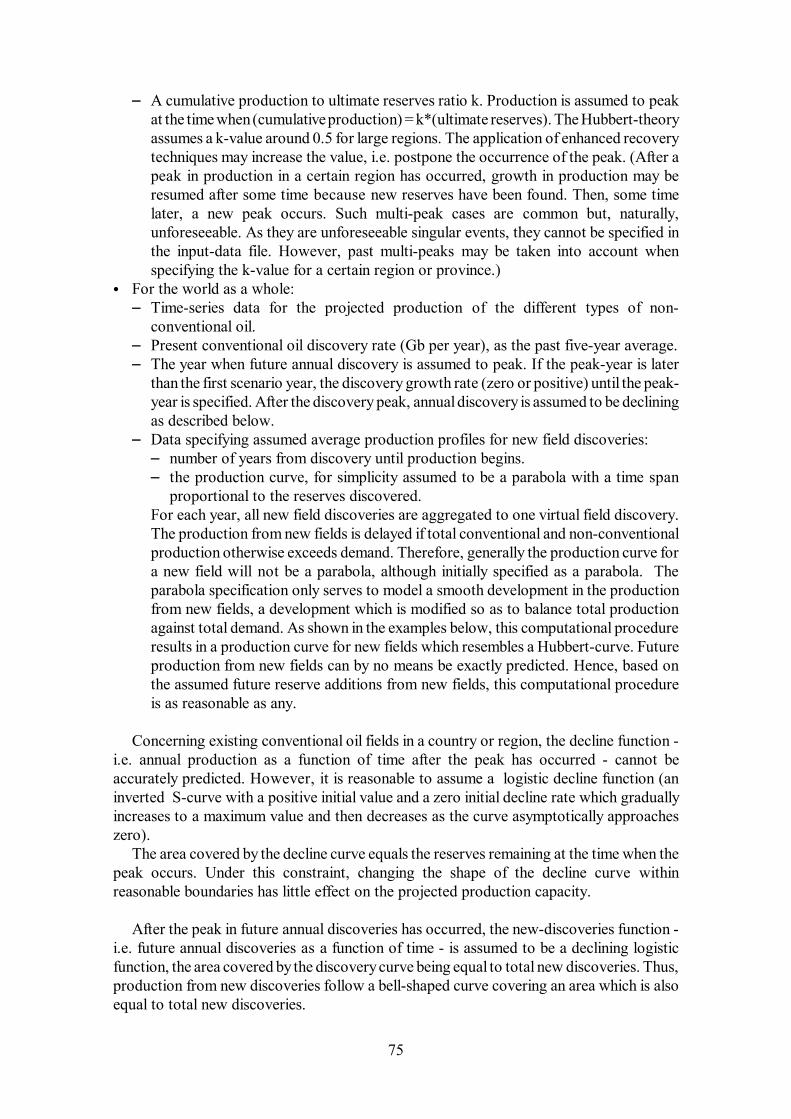
75
S A cumulative production to ultimate reserves ratio k. Production is assumed to peakat the time when (cumulative production) = k*(ultimate reserves). The Hubbert-theoryassumes a k-value around 0.5 for large regions. The application of enhanced recoverytechniques may increase the value, i.e. postpone the occurrence of the peak. (After apeak in production in a certain region has occurred, growth in production may beresumed after some time because new reserves have been found. Then, some timelater, a new peak occurs. Such multi-peak cases are common but, naturally,unforeseeable. As they are unforeseeable singular events, they cannot be specified inthe input-data file. However, past multi-peaks may be taken into account whenspecifying the k-value for a certain region or province.)
For the world as a whole:S Time-series data for the projected production of the different types of non-
conventional oil.S Present conventional oil discovery rate (Gb per year), as the past five-year average.S The year when future annual discovery is assumed to peak. If the peak-year is later
than the first scenario year, the discovery growth rate (zero or positive) until the peak-year is specified. After the discovery peak, annual discovery is assumed to be decliningas described below.
S Data specifying assumed average production profiles for new field discoveries:S number of years from discovery until production begins.S the production curve, for simplicity assumed to be a parabola with a time span
proportional to the reserves discovered. For each year, all new field discoveries are aggregated to one virtual field discovery.The production from new fields is delayed if total conventional and non-conventionalproduction otherwise exceeds demand. Therefore, generally the production curve fora new field will not be a parabola, although initially specified as a parabola. Theparabola specification only serves to model a smooth development in the productionfrom new fields, a development which is modified so as to balance total productionagainst total demand. As shown in the examples below, this computational procedureresults in a production curve for new fields which resembles a Hubbert-curve. Futureproduction from new fields can by no means be exactly predicted. Hence, based onthe assumed future reserve additions from new fields, this computational procedureis as reasonable as any.
Concerning existing conventional oil fields in a country or region, the decline function -i.e. annual production as a function of time after the peak has occurred - cannot beaccurately predicted. However, it is reasonable to assume a logistic decline function (aninverted S-curve with a positive initial value and a zero initial decline rate which graduallyincreases to a maximum value and then decreases as the curve asymptotically approacheszero).
The area covered by the decline curve equals the reserves remaining at the time when thepeak occurs. Under this constraint, changing the shape of the decline curve withinreasonable boundaries has little effect on the projected production capacity.
After the peak in future annual discoveries has occurred, the new-discoveries function -i.e. future annual discoveries as a function of time - is assumed to be a declining logisticfunction, the area covered by the discovery curve being equal to total new discoveries. Thus,production from new discoveries follow a bell-shaped curve covering an area which is alsoequal to total new discoveries.

76
No theoretical hypotheses are inherent in this model, except the assumption that thedecline functions are inverted logistic functions. The information gained from the scenariocomputations is consistent and conditional: If demand growth, existing conventionalreserves, yet-to-find reserves, non-conventional production, etc. assume the values specifiedin the data file, then demand and production will follow the curves shown in the resultgraphs. The sensitivity of the results - the peak-year and the subsequent decline rate - withrespect to the variable values assumed can be examined, simply by running the programwith modified values.
Examples of scenario computation results are shown in figs. 5.8 and 5.9 below. Fig. 5.8shows the results computed from the values shown in the ‘Reserve and ProductionAssumptions’ box. These values correspond to the values given in table 4.1 above. In fig.5.9, demand growth is reduced to 1%/year and existing and yet-to-find reserves areincreased by 20% as compared to the values shown in the box.
In both cases a sharp peak in total oil production occurs. Reducing demand growth from1.6% to 1% and increasing existing and yet-to-find reserves by 20% postpones the peak by5 years and reduces the decline rate after the peak from 1.3 Gb/year or 3.7%/year to 1.1Gb/year or 3.1%/year.
In the different regions, enhanced recovery may postpone the peak and increase reserves.Plausible values representing such enhancements can be entered and effects computed.
The examples shown in figs. 5.8 and 5.9 should not be interpreted as forecasts. They areonly examples which show that the occurrence of a sharp peak followed by a steep declineis consistent with assumptions which cannot be deemed implausible or unrealistic withreference to historical evidence or current reports from the industry.
The declining production curves for existing fields correspond to a post-peak Hubbertcurve and the bell-shaped production curves for new fields resemble a Hubbert curve. Thus,figs. 5.8 and 5.9 illustrate that when Hubbert curves for several domains, here the domainscomprising existing fields and the domain comprising new fields, are superimposed, theresulting production curve need not be a Hubbert curve.

77
Reserve and production assumptions Conventional oil, 2000 Produced Reserves Yet-to-find Production Gb Gb Gb Mb/dayMiddle.East 225 483 43 22.0FSU 176 126 31 11.0Latin.America 102 84 18 8.0Africa 75 81 11 6.7North.America 187 28 7 5.5Europe 40 30 6 6.3Asia 40 28 5 4.0Other 27 22 23 1.6
Total 872 882 144 65.8
Other liquids. Production Mb/day: Heavy oil,etc. Deepwater oil Polar oil NGL Total2000 1.4 1.0 1.1 6.0 9.52005 2.8 5.6 1.2 8.2 17.82010 4 8 2 9 232015 4 6 4 10 252020 5 4 6 11 262025 5 3 5 10 242030 5 3 4 9 212035 5 2 3 9 192040 6 1 2 8 172045 6 1 1 7 142050 6 0 0 6 12
Total conventional production to date (2000)= 872 Gb Existing conventional reserves (2000) = 882 Gb Undiscovered conventional reserves (2000) = 144 Gb
Total: Ultimate conventional reserves = 1898 Gb
Other liquids produced before 2000 = 85 Gb Other liquids produced 2000-2075 = 473 Gb
Total production of liquids until 2075 = 2456 Gb
Initial new-findings rate (in 2000) : 10 Gb/year
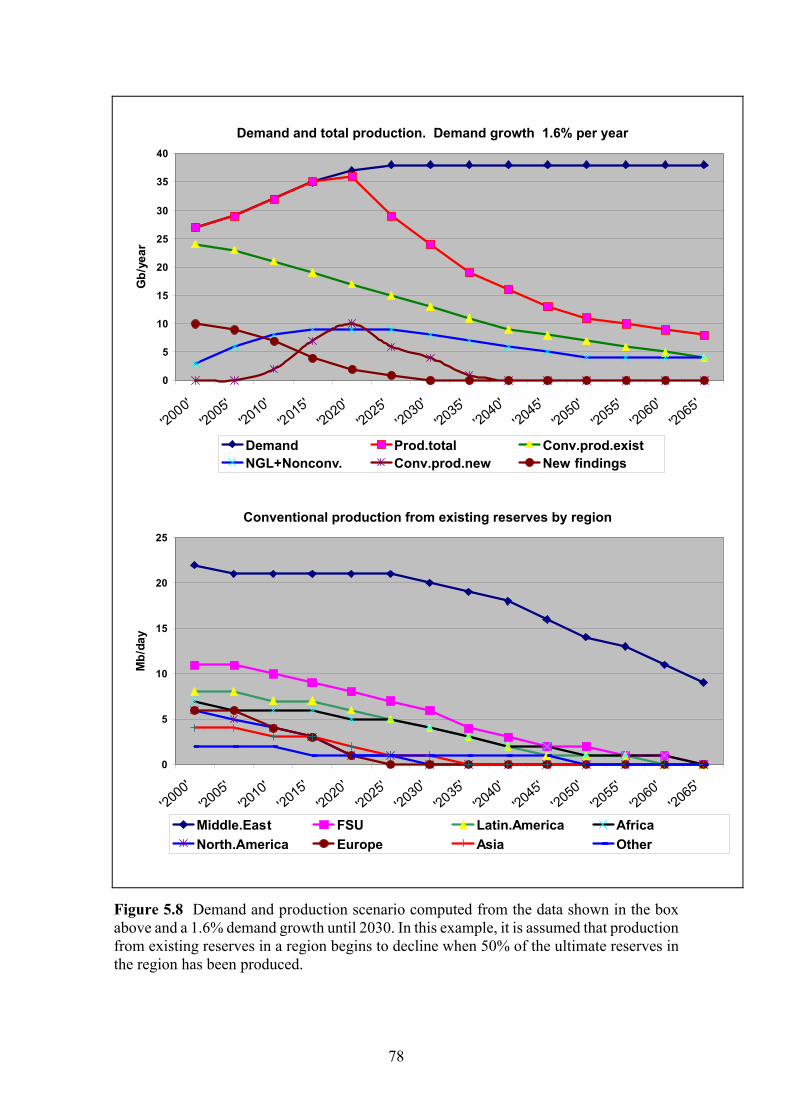
78
Figure 5.8 Demand and production scenario computed from the data shown in the boxabove and a 1.6% demand growth until 2030. In this example, it is assumed that productionfrom existing reserves in a region begins to decline when 50% of the ultimate reserves inthe region has been produced.
Conventional production from existing reserves by region
0
5
10
15
20
25
'2000''2005''2010''2015''2020''2025''2030''2035''2040''2045''2050''2055''2060''2065'
Mb/
day
Middle.East FSU Latin.America Africa North.America Europe Asia Other
Demand and total production. Demand growth 1.6% per year
0
5
10
15
20
25
30
35
40
'2000''2005''2010''2015''2020''2025''2030''2035''2040''2045''2050''2055''2060''2065'
Gb/
year
Demand Prod.total Conv.prod.exist NGL+Nonconv. Conv.prod.new New findings

79
Figure 5.9 Demand and production scenario resulting from a 20% increase of remainingreserves (2000) and new findings as compared to the values given in the box above and areduction in demand growth to 1%.
0
5
10
15
20
25
30
35
40
'2000' '2005' '2010' '2015' '2020' '2025' '2030' '2035' '2040' '2045' '2050' '2055' '2060' '2065'
Gb/
year
Demand Prod.total Conv.prod.exist NGL+Nonconv. Conv.prod.new New findings
Demand growth 1.0% per year. Existing and yet-to-find reserves increased by 20%
0
5
10
15
20
25
'2000
'
'2005
'
'2010
'
'201
5'
'2020'
'2025
'
'2030
'
'203
5'
'2040'
'2045
'
'2050
'
'205
5'
'2060
'
'2065
'
Mb/
day
Middle.East FSU Latin.America Africa North.America Europe Asia Other
Conventional production, existing reserves

80

81
6. On the Economy of Oil
The economy of oil is not only the economy of oil supply. Even though the purchasingof oil from refineries worldwide amounts to only about 2% of the global GDP (thepercentage being a little smaller in the developing countries than in the OECD countries),the economy of oil in the real sense of the term: the utilisation of this precious resource forthe welfare of human societies, concerns every sector of the social economy.
The oil industry is an upstream industry with an annual turnover worldwide second tonone. Its refinery products nourish the second largest industrial complex: the motorcar,lorry and aeroplane industries, including the military hardware industries. When you buya car, you buy not only the vehicle produced in the factory but also what it takes to makeuse of the car for its lifetime: the maintenance provided by the garages into which themotorcar industry branches out; the building and maintenance of roads, bridges, parkinglots etc., mostly paid as taxes, duties and tolls; and the gasoline to be bought at fillingstations, which are the points where the motorcar industry and the oil industry are joined.The same goes for other vehicles and also for aeroplanes, using airports, maintenancehangars and oil bunkers instead of roads, garages and filling stations.
Thus the oil industry and the industries it nourishes form a widely ramified oil-technology complex or rather a cheap-oil technology complex, ‘cheap’ in the sense that theprice of oil has not so far been so high as to be a limiting factor for the proliferation of theproducts of these industries.
6.1 On the economy of the cheap-oil technology complex
Because of the low costs of oil supply, the efficient use of oil has not been a highpriority objective for the technological development of oil-consuming vehicles andmachinery. Of course, the aeroplane industry, whose customers are not private consumersbut the airlines, has sought to reduce fuel consumption per person-kilometre but speed hasa higher priority. Regarding the transportation of goods, cheap diesel oil and access topublic roads and motorways at low costs have given trucking an economic advantage inthe competition with railways and ships.
6.1.1 Motorcars
Assume that the outlet price of a car is 30,000 Euro (the price of a medium size car inDenmark, incl. purchase taxes); that its lifetime is 15 years; that maintenance costs amountto 10,000 Euro, for simplicity assumed to be evenly distributed over its lifetime; that itstotal mileage is 300,000 km; that it does 15 km/litre of petrol; and that the consumer priceof petrol is 1 Euro/litre, making the total cost of petrol 20.000 Euro. Depreciating the coststo present value at an interest rate of 5% p.a., the total consumer costs, excluding othertaxes and insurance, become:

47 The VW Lupo 3L Diesel does 33 km/litre. A modified Renault Twingo, the prototypeTwingo SmILE developed in a project initiated by GRENPEACE, achieved 30 km/litre of petrol.
48 See for example: Ernst von Weizsäcker, Amory B. Lovins, L.Hunter Lovins: Factor Four. Doubling Wealth, Halving Resource Use, Earthscan, 1997, in which the Hypercar is described.
82
Purchase costs 30,000 Euro 59%Maintenance 7,000 - 14%Petrol 14,000 - 27%________________________Total 51,000 Euro (present value)Total petrol consumption 20,000 litres
Suppose that petrol became more heavily taxed so that the consumer price graduallyover, say, 12 years rose to 3 Euro/litre while over the same period of time the purchase taxwas reduced. This would induce consumers to look for more energy-efficient cars. The carindustry might then develop a smaller, lighter, less powerful and less luxurious car with apetrol consumption of 30 km/litre which could be sold for 20,000 Euro, the purchase taxbeing lower and the car cheaper to produce. The cost account could then be:
Purchase costs 20,000 Euro 42%Maintenance 6,000 - 13%Petrol 22,000 - 45%_________________________Total 48,000 Euro (present value)Total petrol consumption 10,000 litres
For most families, the smaller, lighter and less powerful car would serve their dailyneeds for transport at a lower total cost, consuming only half the amount of petrol. Thetaxation revenue would be the same or somewhat higher, in which case taxation of labourcould be reduced. The annual turnover in the motorcar industry would probably be thesame because some families would buy two cars instead of one in order to obtain moretransportation flexibility without increasing their total annual mileage, which would becostly because of the high price of petrol.
A car which does 30 km/litre is a modest achievement for a modern car industry.47 Carsdoing 50 km/litre have already been built48. Moreover, most motorcars on the roadsworldwide today do less than 15 kilometres/litre of petrol. Thus, a 50% reduction of theoil consumption in motorcars is technically possible, even at increasing transportationvolumes (as measured by person-kilometres), and - as illustrated by the examples above -a shift of taxation from purchases and labour to resource consumption could shift consumerpreferences to energy-efficient cars or other less energy-consuming and more healthymeans of transport.
This means that at least 50% of today’s oil consumption in motorcars or 25% of the oilproduced (motorcars consume about 50% of the world’s oil production) does not serve toprovide comfortable, flexible transportation of persons but rather to satisfy a certain vanityattached to the car as a status symbol. A vanity the cultivation of which is affordable aslong as the consumer price of gasoline is low.
83
6.1.2 Speed of long-distance transportation
High speed is a property of the cheap-oil economy. It is a noteworthy coincidence thatthe density of the atmosphere, determining the speed of sound, is such that thecircumference of the Earth corresponds to the distance covered by an airliner travellingat the maximum subsonic speed in about 48 hours. Therefore, a holiday or business flightto the opposite side of the globe takes less than 24 hours. At the current price of jet fuel,quick long-distance holiday and business trips as well as shorter regional trips at this speedare affordable. Hence, the rapid growth in the aeroplane industry, the airport industry andthe tourist industry in the last 40 years - temporarily slowed down after September 11th.
When the oil price grows by a factor two or three, speed becomes more expensive. Onlong-distance routes, slower but more energy-efficient turboprop planes could thus gain acompetitive advantage against the faster jet planes, and on regional intercity routes moderntrains could replace the airlines. Such a transition to more energy-efficient means of long-distance and regional transportation implies major changes in the products offered by theaeroplane industry, the railway industry and the tourist industry.
6.1.3 Trucking
The sections above summarise nothing but trivial observations of well-knowncharacteristics of the cheap-oil economy. However, it is an even more trivial observationthat the trucking of goods across countries and continents, which ensures that the marketprinciple of comparative advantages for distant producers is adhered to, is conditioned bycheap diesel oil. Had diesel not been so cheap, producers of tomatoes, potatoes and applesin Southern Europe would not have comparative advantages as against local producers inNorthern Europe. Milk would not be transported hundreds of kilometres from farms todairies and from there to distant consumers. Flowers for Danish homes would not be raisedin Holland while flowers from Danish nurseries are exported to Germany. Unless, that is,an efficient railway network ensuring that, for example, a container loaded on a train inMadrid would reach Stockholm within 48 hours had been developed. Such railwaynetworks would save substantial amounts of oil, reduce air pollution, curtail trafficcongestion, and lower maintenance costs of motorways and roads. The failure to developsuch railway networks may prove a costly legacy of the cheap-oil era.
6.2 On the new economy of oil supply
Considering the oil industry’s long production line from the exploration anddevelopment of oil fields to the transportation of crude oil in tankers and through pipelinesto refineries and the final distribution to consumers, it is a remarkable achievement of theindustry that it has so far been able to deliver petrol, diesel and fuel oil in time to meet thegrowing demand all over the world. In other words, to ensure the matching of the oilmarket and the growing market for oil-consuming engines and boilers. Only when OPEC’snational oil companies in 1973 restricted their production for political reasons, didtemporary shortage occur.

49 A.M. Samsam Bakhtiari: Middle East oil production to peak within next decade. Oil&GasJournal, July 7, 2003.
84
However, the balancing of investments in the oil industry’s production lines on the onehand and investments in production lines for oil-consuming machinery on the other hastaken place under conditions which will not remain the same in future. As shown in figs.4.3 and 4.4, most of the oil industry’s easily accessible resource base was found between
1920 and 1980 and a substantial part of the present production comes from oil fieldsdeveloped more than 30 years ago (see Matthew R. Simmons, section 1.3 above). Asproduction from this aging resource base of cheap conventional oil begins to decline, theindustry needs to make huge investments to meet future demand (see Harry J. Longwell,section 1.3 above). And, most importantly, when the Middle East swing producers, mainlySaudi Arabia, have exhausted their capacity and therefore no longer can compensate fordisruptions in other countries’ production (such as the disruptions in Venezuela and Iraqthis year), it will become increasingly difficult to ensure that supply meets demand at alltimes.
In a recent article in the Oil&Gas Journal, A.M.Samsam Bakhtiari, the National IranianOil Co. Tehran, suggests that this situation could occur sooner than hitherto expected inspite of - or perhaps because of - investments made to increase the production capacity:
“....even Saudi Arabia has its limits. These came to light during the 2003 war inIraq. Pumping at full capacity, the Saudis could produce only 9.3 million b/d[barrels/day]. This prompted most institutions to downgrade Saudi oil productioncapacity from their lofty heights of 10.5 - 12 million b/d to a more realistic 9.5million b/d, which is now accepted as the fresh standard for Saudi capacity.The Saudi problem is that output heavily relies on its unique Ghawar oil field.And Ghawar’s sustainability is a well-kept secret. The only hint that there mayhave been problems was the drilling of some 200 horizontal wells in 1992-99.Although these new wells ushered in a recovery boom, they are a DamoclesSword hanging over Ghawar’s head. For, as French petroleum consultant JeanH. Laherèrre pointed out: ‘When the water level hits the horizontal well, it isfinished. Ghawar has not yet peaked, but when it will, it is going to be a cliff’.”49
In the same article, Bakhtiari reports from Oman:
“....Oman has been one of the great success stories of the past two decades.During the 1980s, Omani oil production gradually ramped up to 700,000 b/d from300,000 b/d; then during the 1990s it continued to rise, reaching 960,000 b/d by2000.Being outside OPEC’s quota system, Oman could fully open its throttle. And itwas no surprise that new records were set year after year, with Royal Dutch/ShellGroup serving as technical advisor to Petroleum Development Oman I.I.C (PDO)- a joint venture of the government of Oman 60%, Shell 34%, Total SA 4%, andPartex (Oman) Corp. 2% - that controls roughly 94% of Omani oil output.Then, abruptly, at the dawn of the 21st century, everything seemed to unravel forthe PDO. Output began to plunge. Within two years PDO’s black oil productionhad dropped to 703,000 b/d (Shell’s target for 2003) from 840,000 b/d.Interestingly, all this is happening as about half of Omani proved reserves havebeen produced, as Shell said candidly that “the decline...(was) partly because of

85
a poor understanding of reservoirs.PDO pulled out all the stops to reverse the production plunge, applying enhancedoil recovery techniques, including gas injection at both the 181,000 b/d Fahud-Lekhwair and Natih fields and water injection at Saih Rawl. In addition, PDOdrilled horizontal wells and implemented an underbalanced drilling program atNimr and Saih Rawl fields, among others.This application of EOR and advanced drilling technology might allow for someplateauing, but the inevitable decline may be irreversible, especially whenbearing in mind that Campbell’s estimate of Oman’s “yet-to-find” reserves standsat only 1.6 billion barrels.”
With these and other striking observations in the same article, Bakhtiari draws attentionto the new conditions for the oil industry. Where oil has hitherto flowed in abundantamounts from old fields, substantial amounts of money must now be invested in EnhancedOil Recovery techniques (EOR) to sustain the production capacity and gain access toadditional reserves.
Other analysts point out that the replacement of depleted reserves is becoming moreexpensive and that the industry’s expectations of lower oil prices in the coming yearsrender the investments currently made insufficient to meet future demands. The Oil & GasJournal (June 11 2003) reports a recent industry study giving evidence to this assertion:
“The worldwide oil and gas industry faces increasing challenges in replacingreserves and growing production, according to 2002 statistics from the MerryllLynch Global Securities Research & Economics Group. Recently, companies haveannounced missed production targets and have slashed 2003 productionforecasts.......Although technological advances led to lower finding and development costs inthe early 1990's, F&D costs have increased since 1997, Merryll Lynch analystssaid in the May 29 report. Unless capital efficiency improves through renewedtechnology changes similar to those seen in the early 1990's, finding anddevelopment costs are likely to rise because of deteriorating returns within anaging resource base.
‘Companies have already captured most of the benefits from earlier breakthroughtechnologies in mature areas, and are now required to increase their maintenancecapital just to maintain production levels from their established production base’,the report said......Despite the fact that oil prices have averaged over $ 23/bbl since 1997 and $ 28since 2000, the integrated oil companies have established a normalized oil priceof $ 18 - 20/bbl in determining whether they will pursue new projects. Our viewis that a normalized oil price in the $ 24 - 26/bbl range is likely for theforeseeable future.”

50 www.planetark.org/avantgo/dailynewsstory.cfm?newsid=18117
86
Nevertheless, the oil industry is making advances. World Environment News (London,10 October 2002)50 reports on deepwater oil, which could increase global reserves by anamount corresponding to two years’ consumption:
“The global oil industry, armed with ever-improving technology, is drillingdeeper and deeper under the oceans for oil that could provide a welcomecomplement in coming years to OPEC energy, analysts say.About 60 billion barrels of oil equivalent (boe) are proven to lie under the world’sseabeds - mostly in waters off the Gulf of Mexico, Brazil and West Africa - andseismic studies show the possible presence of another 40 billion.Oil equivalents include gas and analysts estimate that two-thirds of the deepwaterreserves comprise crude oil.‘Deepwater oil is the growth play in the oil industry’ said a recent Deutsche Bankreport. ‘We believe deepwater is the lowest risk and best-returning growth playavailable to global oils’.....with better technology, Deutsche Bank estimates average development costshalved from the 1980s to less than 4 $ per barrel which is in line withconventional onshore costs.And last year Unocal broke the three-kilometre barrier at a well in the Gulf ofMexico........Analysts say however that even the largest deepwater fields cannot have the costadvantage of producing conventional oil on land in countries such as Libya andIraq, though taxation structures are usually more attractive than in most OPECstates.And overall deepwater reserves are smaller. This means that deepwater oil is notan alternative but only a short to medium term non-OPEC solution to worldsupply.”
6.3 Administering a market with low marginal production costs
Before 1970, when US oil production peaked, the Texas Railroad Commission wasaccredited the responsibility of regulating US oil production by the issuing of productionquotas so as to prevent the market from being flooded and the oil price to plunge. In otherwords, to administer a market where marginal production costs were close to zero.
In the 1980's and 1990's OPEC has played a similar role on the world market. SaudiArabia, as OPEC’s main swing producer with marginal production costs of about 1 $ perbarrel, ensured that the price of crude oil remained high enough to make exploration anddevelopment of offshore oil fields in the North Sea, the Mexican Gulf and off the WestAfrican coast profitable, yet not so high as to inhibit growth in the world economy.Apparently, a tacit agreement between the US and the House of Saud to this effect ensuredthat US interests in the Gulf’s oil production, as enunciated in the 1980 Carter Doctrine,were not violated. This year Saudi Arabia helped to prevent a surge in the oil price whenthe oil production in Venezuela was disrupted and the invasion of Iraq almost brought thecountry’s production to a standstill.

51 In an article titled One Purely Evil Cartel in Wall Street Journal, July 29 2003, editorial writerClaudia Rosett describes OPEC as “a gang of price-fixing oil-rich thug regimes [who] meet toreinforce assorted terrorist-sponsoring tyrants at high costs to world consumers” and translates theacronym as OPEC: the Outrageous Predatory Energy Cartel.
87
As Saudi Arabia is still the main swing producer, the marginal production costs ofdelivering an additional barrel of crude oil to the world market is presently only 2 - 3 $.However, the average production costs in the world’s oil fields are much higher, the costsbeing about 15 $/barrel in some offshore fields. Moreover, the oil price must be relativelyhigh (more than 20 $/barrel, see table 4.4 above) to make it profitable for the oil industryto attain growth in global production or merely to sustain the production level by meansof enhanced recovery techniques and the exploration and development of new oil fields inhostile and environmentally sensitive areas.
Therefore, although a relatively high price of crude oil means that oil exportingcountries with low marginal production costs gain huge unearned incomes at the expenseof the importing countries, it is a short-sighted strategy to seek to attain a low price by theelimination of the OPEC quota administration of producers with low marginal productioncosts.
As long as producers with low marginal production costs have the capacity to act asswing producers - as in the US before 1970 - their production must be administered byinstitutions such as the Texas Railway Commission and OPEC. Otherwise a plunging oilprice will make the increasingly more costly investments in exploration, development andenhanced recovery techniques unprofitable. This would shorten the time until the peak inconventional oil production occurs and make the decline thereafter steeper.
However, Iraq may be the only country whose capacity as a low-cost swing producercould be increased within a few years. High hopes that unthrottled production in an Iraqoutside OPEC51 would make the oil price plunge to about 15 $/barrel and thus help toaccelerate economic growth were expressed in the autumn 2002. However, as theconsequences of such a low pricefor oil companies operating offshore in the Mexican Gulf,off the coast of West Africa and elsewhere were recognised, these hopes were no longerso loudly pronounced. In the meantime a surge in the Iraqi oil production has beenpostponed for some time. This should be a relief to the oil industry and to the oil-exportingcountries, not the least Russia, whose economic recovery to a large extent depends on itsoil export. For poor oil-importing developing countries it is bad news in the short run.
6.4 Market experiments with the global economy
Governments should ensure that the demand for conventional oil peaks beforeconventional oil production peaks. They should also ensure a substantial decline in the CO2emission. Imagine, as a utopian thought experiment, that to these ends governmentsworldwide bring about a transformation of the cheap-oil technology complex to a muchmore energy-efficient technological complex, along lines such as those stipulated in section6.1 above. The incentives used to induce industries and consumers to engage themselvesin the process could be a shift of taxation from labour to resource consumption, theintroduction of harsh energy efficiency standards, or some kind of rationing of oilconsumption.

88
In a free oil market where the peak has not yet been reached, the decline in demand thusachieved will result in excess production capacity and thereby a decline in the price ofcrude oil. Under these circumstances, few investments in the exploration and developmentof new oil fields (conventional or non-conventional) or enhanced recovery in existing fieldswill be undertaken. Hence, a decline in demand may not significantly postpone the peakand it may not make the decline in production after the peak less steep.
Thus, if the peak is impending, it may occur at about the same time whether or not oil-saving measures are successfully employed. But, of course, if the surge in the oil pricefollowing the peak occured at a lower production level and with less reserves having beendepleted, the higher oil price would render postponed investments in additional productioncapacity profitable. After some years, production capacity might then again becomesufficient to meet demand. However, as there would be no excess capacity it would be aseller’s market where the price would be determined by the producers with the highestmarginal production costs. The situation would be very much the same as today and a newpeak would be imminent.
As a matter of fact, the experiment has already been made. In 1980, after a couple ofdecades with declining oil prices followed by a steep increase in 1973, OPEC staged asurge in the crude oil price, thereby causing a plunge in demand and, consequently, aplunge in production to the same effect as if a peak in production capacity had occurred.Thus, OPEC staged an artificial peak in oil production. The oil industry rushed to find newoil and gas fields outside OPEC; power utilities hastily switched from oil to coal or gas;and many oil boilers were replaced by gas boilers or electric heating. After some years newproducers with production costs much higher than in most OPEC countries came on-stream. And, thanks to OPEC’s production quotas, the market remained a seller’s marketwhere the price only occasionally dropped below the level at which costly offshoreproduction was profitable. From a production level somewhat lower than it would havebeen without the OPEC-staged peak, production is now climbing towards an impendingpeak - which is not artificial.
However, the experiment made in the 1980's is unique. It cannot be repeated with thesame outcome. When the real peak occurs there will hardly be another North Sea andMexican Gulf to be explored and developed within a few years and there are few oil-firedpower stations and boilers to be switched to coal or gas. There will still be oil, but therewill be no swing producers around to adjust the price of oil produced from dwindlingconventional reserves and whatever non-conventional reserves that may come on-stream.Until the peak occurs, a continued growth in demand - meaning that the global economybecomes ever more dependent on a growing cheap-oil technology complex - can be metby supplies of cheap oil from conventional sources. Then, within a short period of time wemay experience a drastic shift in the economy as oil becomes a scarce resource.
Suppose that conventional oil production declines by about 2% or about 0.7 Gb/yearwhile demand grows by 1.5% or 0.5 Gb/year, and that heavy oil from tar sand should closethe gap between demand and conventional oil production. Then 15 tar sand pits of acapacity of 0.08 Gb/year (the capacity of Shell’s tar sand pit in Alberta, see section 2.2.1)with refineries and pipelines would have to be opened every year. If it were technicallypossible and environmentally acceptable to increase the oil production capacity from tarsand at this rate and in such a manner that production could be sustained once the surfacelayers have been mined, it would imply a drastic change in the oil economy.

89
The industry would have to spend large amounts of money on investments in non-conventional oil production. At the same time, as the oil price surges, the national oilcompanies of the OPEC countries would gain large additional unearned profits fromcheaply produced conventional oil. In this context, the outcry against OPEC (see footnoteto section 6.3 on the Wall Street Journal article ‘One Purely Evil Cartel’ above) can beunderstood: The argument is that the private oil industry, not the OPEC countries’s nationaloil industries, should gain these profits so as to obtain the financial means to invest inexpensive non-conventional oil production without having to borrow the petro-dollars (orpetro-Euros as it could be at the time) from the OPEC countries. Thus, when there is nomore swing production capacity, the role of the OPEC countries becomes financial ratherthan regulatory.
Moreover, the increase in oil price would result in a lower or even negative growth indemand. This implies a lower or even negative growth in the world economy as long as theeconomy depends on oil supply to sustain the functioning of the cheap-oil technologycomplex. In the course of a number of years, new technologies and infrastructures drivenby other energy sources may come into place, making the economy less dependent on oil.However, as long as oil is cheap, such new technologies will not be introduced on themarket. Therefore, when the peak occurs, there will be no production lines ready to supplysuch new technologies. Money for these investments will have to be raised at a time ofeconomic recession.
Thus it appears that the shift from growth to decline in the production of cheapconventional oil entails a host of environmental, economic, political and technologicalproblems to be solved within a short period of time. Just to wait and see which solutionsmay turn up is to wait to see the uncertain outcome of a hazardous experiment.
Instead, the international community could seek to reach a fair and just agreement onthe international regulation of oil demand and supply so as to prevent demand fromsurpassing production capacity. Such an agreement should comprise technological energyefficiency and emission standards for vehicles and other oil-consuming hardware to beimplemented within a certain period of time; production and consumption quotas for eachcountry; and realistic long-term strategies for the technological transition to the post-cheap-oil era. Indeed, the coining and implementation of the specific technical, economic andpolitical contents of such an agreement is a difficult task, the accomplishing of whichwould take corporate ingenuity, solidarity and compassion not so far exhibited by theinternational community. However, the alternative to gaining international control of thepresent development of the global oil economy seems to be hazardous.