oil price prospects for 2017/18 - reuters infographicsfingfx.thomsonreuters.com/gfx/ce/3/349/349/oil...
TRANSCRIPT
Oil price prospects for 2017/18 Cyclical recovery
JOHN KEMP REUTERS
9 February 2017
(John Kemp is a Reuters market analyst. The views expressed are his own)
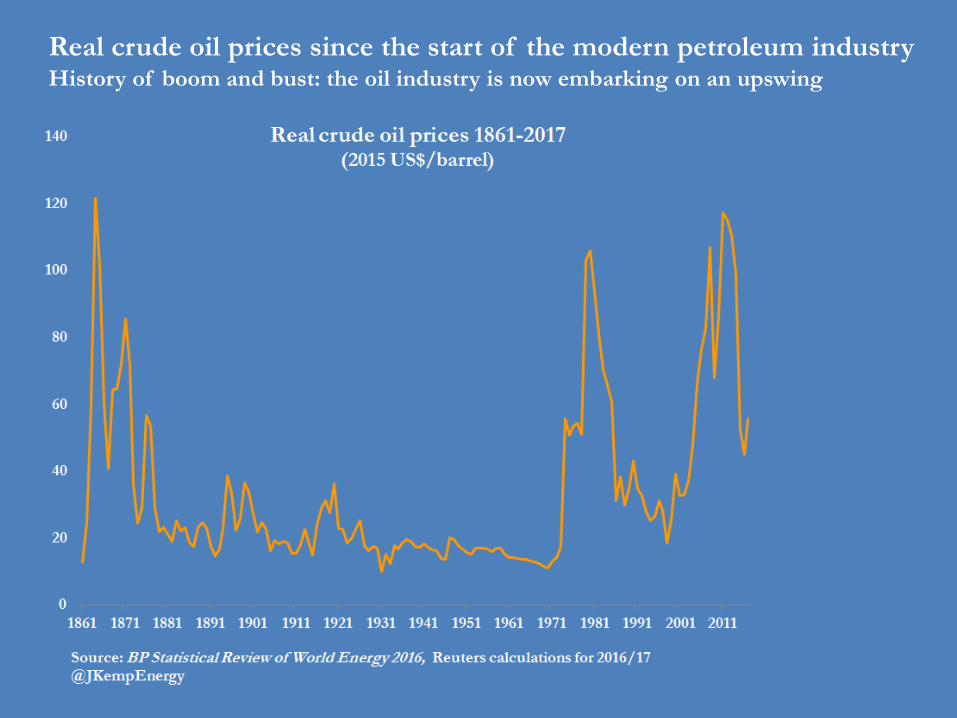
Real crude oil prices since the start of the modern petroleum industry History of boom and bust: the oil industry is now embarking on an upswing

Distribution of real oil prices since the first oil shock in 1973 Brent prices have averaged about $55 so far in 2017 which is slightly above average


Volatility and cyclicality are defining characteristics of oil markets Multiple explanations for the volatility in oil prices (not exclusive)
Inflexibility of supply and demand in the short term (low price elasticity of supply
and demand)
Backward-looking expectations about future prices coupled with lumpiness in
capital investment (cobweb theories)
Positive and negative feedback mechanisms (delay and accelerate adjustments)
Complex adaptive systems exhibiting chaotic behaviour

Crude oil supply responds to price changes but only with a lag Impact of price slump now starting to filter through to production

Feedback mechanisms operate in oil markets and can delay as well as
accelerate process of adjustment
Oil industry is characterised by a multiple feedback loops
Initial conditions Outcomes
Negative feedback loops dampen impact of an initial change and are
therefore stabilising and promote rapid return to “equilibrium”
Positive feedback loops amplify the impact of an initial change and are
therefore destabilising and delay return to “equilibrium”
Feedback concept was popularised by communications experts at Bell
Telephone Laboratory in the 1920s
Long (implicit) history in economics: Adam Smith’s “invisible hand” and
David Hume’s “price-specie-flow” mechanism are both instances of negative
feedback loops
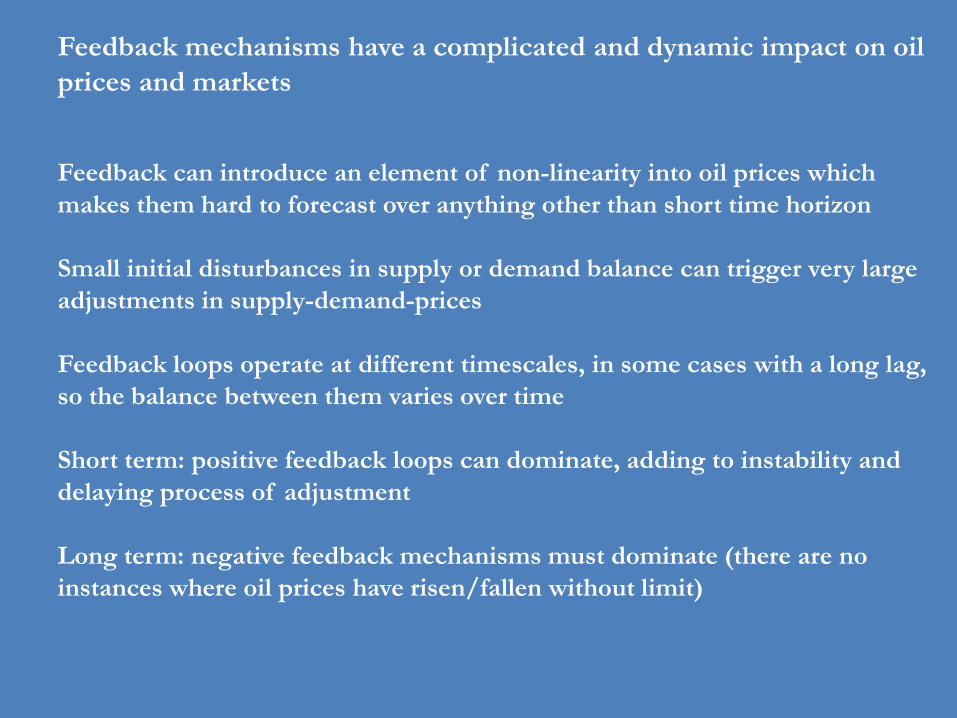
Feedback mechanisms have a complicated and dynamic impact on oil
prices and markets
Feedback can introduce an element of non-linearity into oil prices which
makes them hard to forecast over anything other than short time horizon
Small initial disturbances in supply or demand balance can trigger very large
adjustments in supply-demand-prices
Feedback loops operate at different timescales, in some cases with a long lag,
so the balance between them varies over time
Short term: positive feedback loops can dominate, adding to instability and
delaying process of adjustment
Long term: negative feedback mechanisms must dominate (there are no
instances where oil prices have risen/fallen without limit)

Supply-side Demand-side
Negative feedback
mechanisms
(promote return to
balance)
Capital budgets
Cash flow
Equity finance
Debt finance
Fuel switching
Fuel efficiency
Energy conservation policy
GDP impact in oil-consuming
countries
Positive feedback
mechanisms
(delay return to
balance)
Producers’ revenue needs
Labour costs
Raw material costs
Services contract adjustments
Fiscal terms (taxes and royalties)
GDP impact in oil-producing
countries
Fuel consumption within the
oil industry (drilling, refining,
transportation)
Fuel consumption throughout
the oil supply chain (service
companies and other suppliers)
Examples of feedback mechanisms acting on oil supply and demand Some of the factors which slowed adjustment in 2014-2016 and might now speed it up

OPEC pledged to cut output by 1.17 million b/d averaged over H1 Reported compliance has been high so far with Saudi/GCC leading
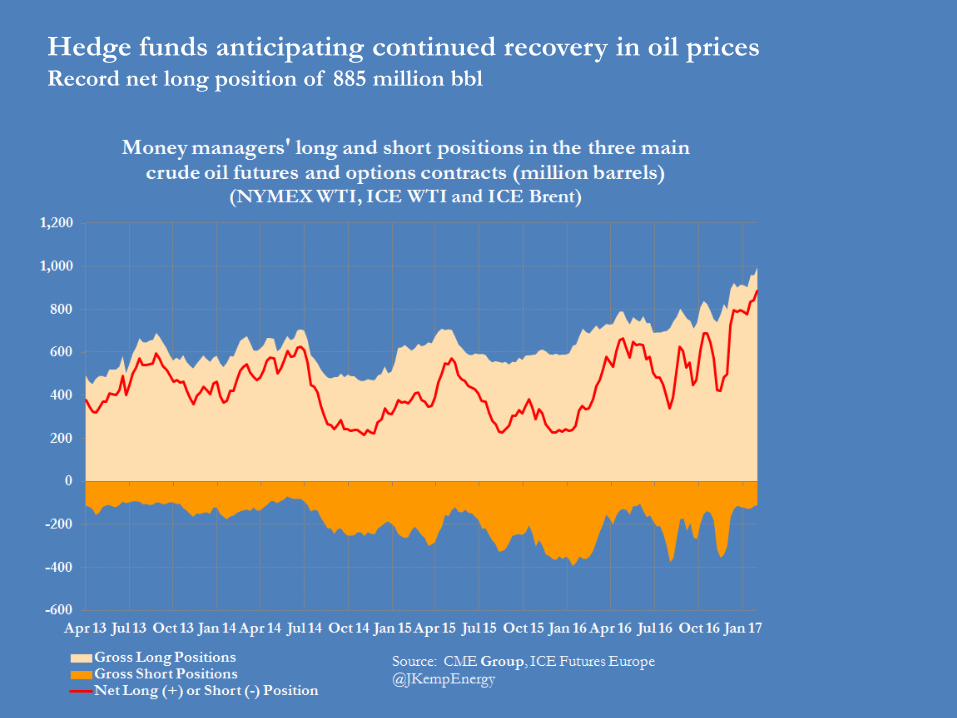
Hedge funds anticipating continued recovery in oil prices Record net long position of 885 million bbl

Hedge funds have potential to increase exposure even further Net long position has notional value of around $48bn, compared with $68bn in 2014

Hedge fund positioning in oil looks somewhat stretched at present Long-short ratio of 9:1 points to some liquidation risk in short term
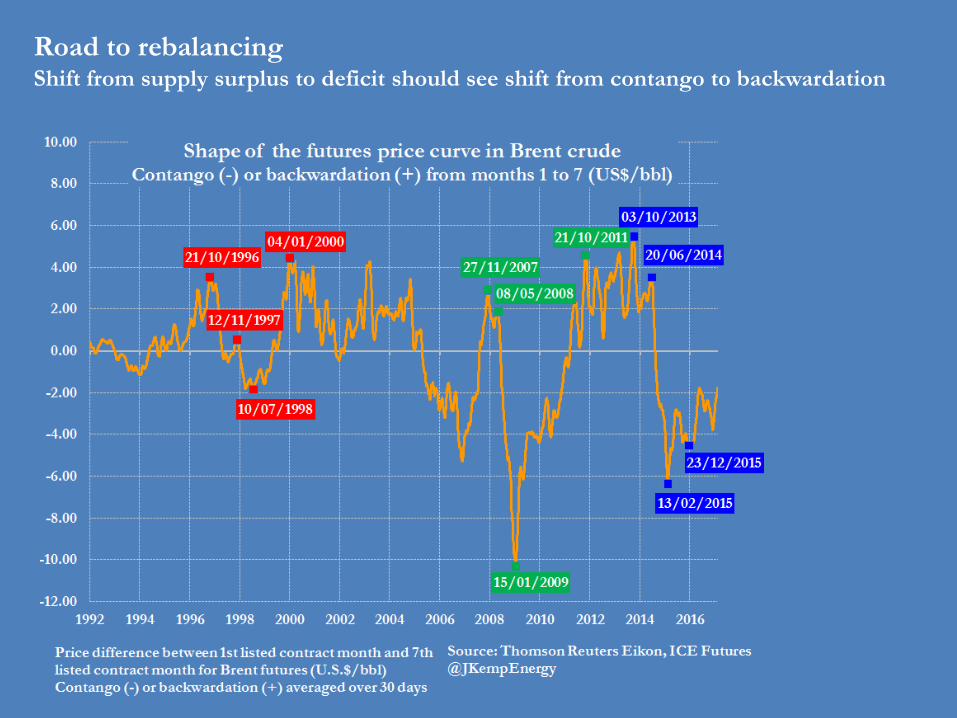
Road to rebalancing Shift from supply surplus to deficit should see shift from contango to backwardation
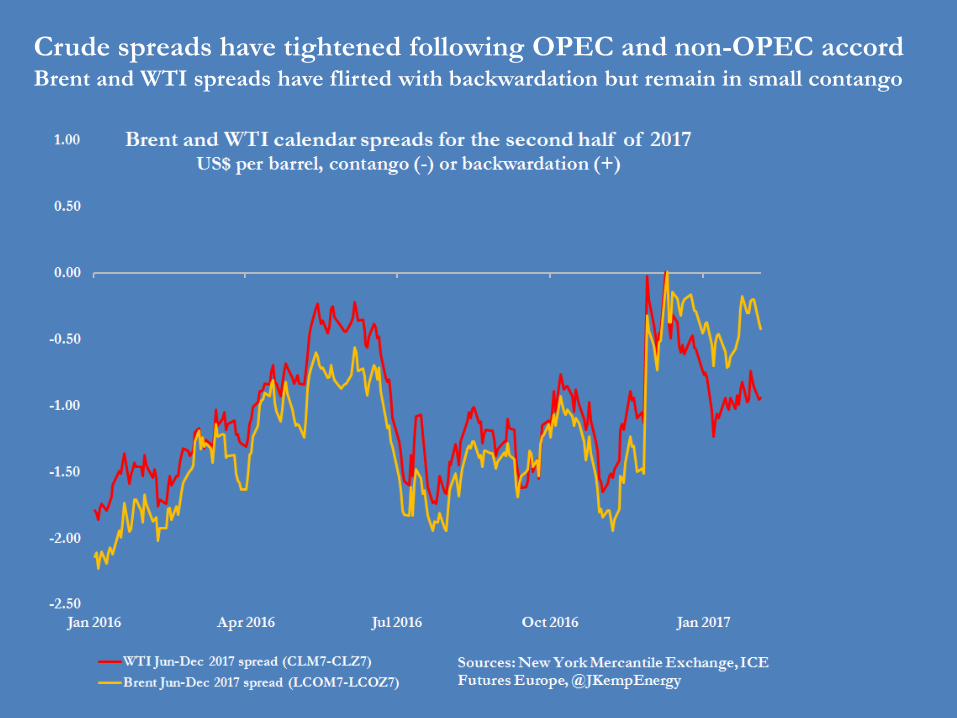
Crude spreads have tightened following OPEC and non-OPEC accord Brent and WTI spreads have flirted with backwardation but remain in small contango

Oil prices exhibit volatility at all time scales as well as phase changes Oil market mostly in “mild” rather than “wild” state recently

Oil prices not especially volatile at the moment Volatility is moderate in dollar terms

U.S. shale producers show signs of strong and sustained recovery Rig count has been growing steadily since hitting cycle low at the end of May 2016

U.S. rig count has risen by around 80% (with focus on the Permian) Oil rigs have risen +85% since May 2016, gas rigs have risen +79% since Aug 2016
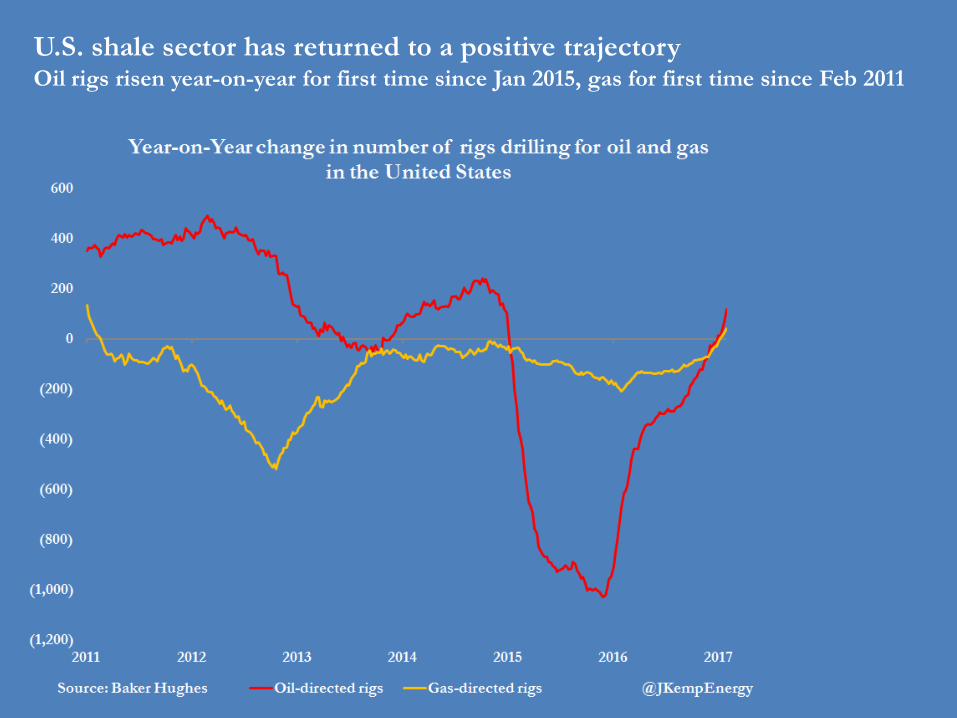
U.S. shale sector has returned to a positive trajectory Oil rigs risen year-on-year for first time since Jan 2015, gas for first time since Feb 2011

U.S. commercial crude inventories remain high, no draw down yet Strong U.S. crude imports in Jan reflect high OPEC and non-OPEC output in H2 2016

U.S. crude stocks are around 38 million bbl above 2016 And around 180 million bbl above 10-year average

U.S. crude stock built faster than normal in Jan Market is no longer slackening but not yet tightening?

U.S. gasoline stocks have risen much faster than normal so far in 2017 Strong refinery production and slack demand after two years of strong growth

U.S. gasoline stocks are tracking similar trajectory to 2016 High level of stockpiles could dampen prices, margins and runs later in the year

U.S. gasoline stocks rose +20 million bbl in first five weeks Far more than the average seasonal gain of +13 million bbl

U.S. distillate stocks rose +8 million bbl in first 5 weeks on mild temps Unusual build at time when stocks would normally be fairly flat

U.S. refinery throughput remains unusually high Product cracks stronger than in Q4 2015 and Q1 2016 which has supported processing

U.S. refinery crude throughput is running 200-400,000 b/d above 2016 Strong supply has pushed gasoline stocks to a seasonal record

U.S. crude imports ran very high during Dec 2016 and Jan 2017 Tankers arriving in Dec/Jan were loaded in Nov/Dec

Current issues
OPEC production cuts and compliance
OPEC compliance is high so far
Saudi/GCC shoulder biggest burden
Saudi returns to swing producer role
Russia phase in
Biggest impact felt in Q3
Compliance fatigue?
Product demand outlook
Demand rotation?
Commodity producers recover?
Global freight recovery?
Growth switch U.S. to emerging markets
Gasoline to diesel
Refining – products, runs and outlook
Persian Gulf production cuts
African recovery
Shale recovery
Lighter, sweeter crude slate
Shortage of heavy grades
Global crude inventories
OPEC targeting cut of -300 million bbl
Forecasters show more balanced market
Contango shrinks but no backwardation
Most tightening in H2 2017 and 2018
Brent-WTI structure
Prospects for border-adjusted tax
Central to tax reform plan
Business community divided
If enacted could push WTI > Brent

Some final thoughts
Oil prices are volatile and cyclical Currently in the cyclical upswing Adjustment process never smooth Adjustment is highly non-linear Oil market is never in “equilibrium” Some of the impacts from the downturn only now filtering through Non-OPEC non-shale supply growth set to slow in 2017/18 Cyclical recovery in commodity-producing emerging markets will boost demand Saudi Arabia has resumed role as swing producer but for how long? U.S. shale production set to rise but could cause renewed slump if it outruns demand Can OPEC maintain compliance and how will it respond to rising U.S. shale output? Global inventories have stopped rising but how quickly will they draw down? Global macroeconomic outlook? Trump’s promised energy renaissance: how will it affect production and prices?