ofi euro high yield - bkb bank – bremer … · 2018-01-18 · ofi asset management - 22 rue...
TRANSCRIPT

ANNUAL REPORT
Financial year to 31 March 2016
Asset Management
OFI EURO HIGH YIELD
Mutual fund Bonds and other debt securities denominated in euros
Marketer OFI ASSET MANAGEMENT - 22 rue Vernier - 75017 Paris
Management Company OFI ASSET MANAGEMENT - 22 rue Vernier - 75017 Paris
Depositary and Custodian SOCIETE GENERALE - 29 Boulevard Haussmann - 75009 Paris
Administrative and accounts management: SOCIETE GENERALE SECURITIES SERVICES NET ASSET VALUE 10 passage de l'Arche - 92081 Paris La Défense
Contents
Management Report
Annual Accounts as at 31 March 2016
Auditor's report

Annual Report
31 March 2016 2
MANAGEMENT DIRECTION Management objective The objective of the Fund is to achieve performance above that of the Merrill Lynch Euro Non-Financial Fixed & Floating Rate High Yield Index, calculated in euros, over the recommended investment horizon. Benchmark The benchmark is the Bank Of America Merrill Lynch Euro Non-Financial Fixed & Floating Rate High Yield Index. This index contains all securities making up the Bank Of America Merrill Lynch Euro Fixed & Floating Rate High Yield Index, to the exclusion of financial securities, and limits the maximum weight of each issuer to 3%. The benchmark is calculated daily in euros. Its Bloomberg code is HEAE. For more information about this index: www.mlx.ml.com. Management strategy The Fund's strategy is to constitute a portfolio mainly exposed to the European High Yield credit markets ("speculative" category). To achieve its objective, the Fund is intended for investment either in High Yield bonds (i.e. the "speculative" or "Speculative Grade" category as opposed to the "Investment Grade" category) denominated in euros and issued by private enterprises in OECD countries, or in forward financial instruments of the credit derivative type (CDS, CDS Indices); these instruments present a high credit risk. The Fund may also take positions in instruments which make it possible to actively manage the credit risk and which shall be of the financed type (bonds or securities) or forward financial contracts (CDS, CDS Indices). Active management is structured around a "bottom up" approach for the selection of securities (i.e extracting the relative value of one signature in relation to another) and "top down" for optimisation of the portfolio (i.e. level of exposure to the High Yield market, allocation by sector or by rating category). Up to 100% of the portfolio's assets is invested in bonds and other debt securities denominated in euros: fixed-rate and/or variable bonds, and/or indexed bonds, and/or convertible bonds, traded on regulated markets. A minimum of 80% of the securities acquired in the portfolio, or failing this their issuers must come under the High Yield category (speculative investment) according to the rating policy implemented by the management company. This debt securities rating policy provides for a single rule in terms of allocation of a long-term rating on bond securities. Under this policy, a rating is determined according to ratings allocated by one or more recognised agencies, and that resulting from the analyses of the management company's Credit Analysis team. Consequently, investment decisions or credit instrument transfer decisions are not mechanically and exclusively based on the criterion of their rating and are based, among other things, on an internal analysis of the credit or market risk. The decision to buy or to assign an asset is also based on other criteria at the manager's discretion. Furthermore, the Fund may also invest up to 20% of its net assets in unrated securities. The foreign exchange risk is covered systematically on the I CHF H units. If this limit is exceeded, including due to market movements, the manager must take any corrective action to once more fulfil its commitments regarding composition of the portfolio within three months at the most. The manager may also invest: - up to 20% of the net assets of the Fund in bonds of companies in emerging countries (non-members of the OECD) issued in euros; - Up to 30% of the assets of the Fund in bonds issued or guaranteed by Member States or enterprises in the OECD denominated in euros,
having a rating or, failing this, that of their issuer, at the time of acquisition, of at least "Investment Grade" according to a weighted average of ratings allocated by the three recognised agencies. If no agency produces any analysis, these securities must benefit from an implied rating equivalent to this level according to the estimates of the management company's Credit Analysis team.
Private enterprise borrowing may represent up to 100% of the net assets of the Fund. The cash in the UCITS will be managed through cash loans/borrowing and repurchase and reverse repurchase transactions against cash. Money market instruments and deposits are considered as a separate investment vehicle but may also serve as an interim investment (NDS, BTF, BTAN, Euro Commercial Paper). These instruments may represent up to 100% of the net assets.
OFI EURO HIGH YIELD Annual Report
31 March 2016 3
The foreign exchange risk is covered systematically. Although the UCITS does not set any limit on maturity per security, the global sensitivity of the portfolio will be between 0 and 10. The Fund may also invest up to 30% in subordinated securities. Within the limits provided for by regulations, the Fund can operate on financial futures contracts (traded on French and foreign regulated and organised markets and/or over-the-counter). In this context, the manager may take positions with a view to hedging against the risk associated with the bonds held in the portfolio - expose the Fund to an interest rate risk - hedge and/or expose the portfolio against or to the risk of distortion of the yield curve - hedge against any subscriptions or redemptions. The manager may use credit derivatives, notably credit default swaps (CDS), to hedge and/or expose the portfolio against or to the risk of difference in remuneration with one or more issuers and/or hedge against the risk of an issuer's defaulting. Risk profile The fund will be mainly invested in financial instruments selected by the management company. These instruments will experience market developments and fluctuations. The UCITS is a UCITS classified as "bonds and other debt securities denominated in euros". The investor is therefore mainly exposed to the risks below, this list not being exhaustive. Capital risk and performance risk The investor is advised that the performance of the UCITS might not conform to his objectives and that his capital might not be returned in full, the UCITS not benefiting from any guarantee or protection of capital invested. Interest rate risk Because of its composition, the UCITS may be subject to an interest rate risk. This risk results from the fact that, in general, the price of debt securities and bonds falls when rates rise. The investor in bonds or other fixed-income securities may record negative performances as a result of fluctuations in interest rates. Credit risk In the case of downgrading of private issuers (for example, of their rating by financial rating agencies), or of public issuers, or their defaulting, the value of private bonds may fall. The net asset value of the UCITS would then be affected by this drop. High Yield risk This is the credit risk applied to what are known as "speculative" securities which present probabilities of default higher than those of Investment Grade securities. In return, they offer higher levels of return, but can, in the case of downgrading of the rating, significantly reduce the net asset value of the UCITS. The unrated signatures which are selected will, for the most part, come under this category in the same way and may present equivalent or greater risks because of their unrated nature. Counterparty risk This is the risk associated with use by the UCITS of futures, OTC instruments and/or resorting to acquisitions and temporary purchase and sale of securities. These transactions concluded with one or more eligible counterparties potentially expose the UCITS to a risk of defaulting of one of these counterparties possibly resulting in failure to pay which will reduce the net asset value. Emerging markets risk The conditions of functioning and supervision of the emerging markets may deviate from standards prevailing on major international markets: information about certain securities may be incomplete and their liquidity more reduced. Evolution in the price of these securities may therefore vary markedly and cause a drop in the net asset value. Consequently, the investor may also be exposed to the following risks: Share risk If the shares to which the portfolio is exposed fall, the net asset value of the fund may fall. The UCITS may also be exposed to convertible bonds; these may show a residual share sensitivity and experience marked fluctuations linked to changes in the prices of the underlying shares. The investor's attention is drawn to the fact that the net asset value of the UCITS will drop in the case of an unfavourable change. Foreign exchange risk Although I CHF H units are systematically hedged against the foreign exchange risk by the manager, this hedging being by imperfect construction, they remain exposed to a residual foreign exchange risk. The foreign exchange risk is the risk of foreign currency variation affecting the value of the stocks held by the UCITS. The investor's attention is drawn to the fact that the net asset value of the UCITS will drop in the case of an unfavourable change in the foreign currency rate other than the euro.

OFI EURO HIGH YIELD Annual Report
31 March 2016 4
METHOD CHOSEN BY THE MANAGEMENT COMPANY TO ASSESS THE GLOBAL RISK OF THE UCI The method applied for calculation of the global risk is the value-at-risk method.
5-day 95% VaR (%) over the financial year
OFI EURO HIGH YIELD
minimum 0.53%
maximum 1.30%
average 0.80%
Leverage on futures instruments as at 31/03/2016
26.29%
CHANGE DURING THE FINANCIAL YEAR Since 13 April 2015, for the IC and ID units, change in method for collecting variable management fees: the outperformance commission was equal to 20% incl. tax of the performance above the Merrill Lynch Euro Non-Financial Fixed & Floating Rate High Yield Index, calculated in euros. In the case of negative absolute performance, when the relative performance of the Fund is positive, this same outperformance
commission shall also be collected but limited to 1.5% of the Net Assets.
From 21 May 2015, the prospectus specifies, regarding Swing Pricing, that application of the swing is at the discretion of the management company in accordance with the OFI Pricing Policy. In accordance with the regulations, the configuration for this mechanism is known only to those persons responsible for its implementation.
Then, on 14 September 2015, abolition of outperformance commission on the I CHF H unit
And lastly, on 21 December 2015, the limit on holding subordinate securities was extended to 30%, compared to 10% previously.
FUTURE CHANGE Nil.
PROCEDURE FOR CHOOSING BROKERS The OFI Group has introduced a procedure for selection and assessment of market brokers, which makes it possible to select, for each category of financial instruments, the best market brokers and to ensure the quality of execution of orders placed on behalf of our UCITS under management.
A multi-criteria valuation is carried out on a half-yearly basis by the OFI Group's Counterparties Brokers Risk Committee. Depending on the circumstances, it takes into consideration several or all of the following criteria: - Monitoring volumes of transactions per market broker - Analysis of the counterparty risk and how this develops (a distinction is made between "brokers" and "bank counterparties"). - Where applicable, the pricing applied. - Feedback of operational incidents detected by the managers or the Middle Office.
By product type, the Committee validates the authorised counterparties with which the OFI Group's management may come to work, and may need to reduce the volumes of orders entrusted to a counterparty or remove it temporarily or permanently from our list of authorised service providers, according to an escalation procedure.
BROKERAGE FEE On the Group's website, at http://www.ofi-am.fr/inout/animations/espaceMIF.php you will find all the measures taken to get to grips with the new regulatory provisions linked to the MIF. It features in particular, the report on brokers' fees in accordance with Article 314-82 of the AMF's General Regulation.
EXERCISE OF VOTING RIGHTS The policy implemented by the management company regarding the exercise of voting rights forms the subject of a report available at the company's website at: http://www.ofi-am.fr/isr_la_recherche_ISR.php

OFI EURO HIGH YIELD Annual Report
31 March 2016 5
ESG criteria The Management Company makes available to the investor information about the procedure for consideration in his investment policy of criteria relating to compliance with environmental, social and governance quality objectives on its website www.ofi_am.fr/actualites.php?art_id=3608
INFORMATION RELATING TO REMUNERATION In the context of application of Alternative Investment Fund Managers Directive 2011/61/EU of 8 June 2011 and the management of alternative investment funds (AIF), the Company has introduced a remuneration policy with the following characteristics:
1. Qualitative elements The Company's remuneration policy has been drawn up by the OFI Group's Strategic Committee. The Strategic Committee is made up of representatives of the Company's shareholders. It fixes the remuneration policy and ensures its
implementation.
The Company's remuneration policy promotes sound effective risk management, in line with, at the same time, the interests of investors, of the
Company and of the AIF managers, and seeks to reduce potential conflicts of interest between the sales personnel and the investors. It conforms to the Company's economic strategy, objectives and values.
The fixed remuneration corresponds to the employee's normal pay for the expected work corresponding to his qualification. The variable remuneration takes into account, in particular, the Company's result, its equity requirements and the quality of management and of the service offered to investors.
Personnel affected by the remuneration policy: all persons involved in risk-taking in terms of the funds or the Company: directors, managers, CIO, control function managers, personnel who are comparable due to their level of variable remuneration sales personnel.
Assessment of performance and risks: this is carried out depending on the personnel concerned.
The performance of managers and those responsible for management is based on quantitative criteria (classification of each fund in a test universe) and qualitative criteria (achievement of objectives, observation of the risk management policy, compliance with internal regulations or external regulations, management process monitoring, contribution of risk-takers to operational risks).
Regarding directors, the criteria applied relate to the company's global performance (growth in operating profit, achievement of strategic objectives, image, reputation, etc.).
For the control functions, the criteria applied relate to the operational, regulatory and reputational risks.
And lastly, the performance of sales personnel is assessed based on traditional criteria, provided that they do not generate any conflicts of interest with the unit-holders: collection, growth in turnover, rate of penetration, campaign successes, new customers, etc.
Variable remuneration budget: based on a global budget, a proportion is allocated to risk-takers, the remainder being allocated to the other personnel concerned. Allocation is then handled by the managers, taking into account the assessment factors described above.
Procedure for payment and measures for adjustment of remuneration: For those persons whose variable remuneration is less than EUR 100,000 or 30% of the fixed salary, this is paid immediately, and in its
entirety in cash.
For the others, the proportion which is not paid in cash is paid in the form of part payments, thus making it possible to adjust risks between the various parties (AIF, AIFM and risk-takers): part payments indexed on a specified basket or a global basket. A proportion (60%) is paid immediately, of which 50% in cash and 10% in indexed part payments, the remaining 40% being paid in the form of part payments, released in equal tranches during the following three years, without any retention period. This allocation may be revised downwards, depending on changes to the quantitative and qualitative criteria during the following years, according to a notion of malus.
2. Qualitative elements The quantitative elements relating to remunerations can be found in the annual report of the AIF management company.

OFI EURO HIGH YIELD Annual Report
31 March 2016 6
MANAGEMENT COMMENTS Economic and financial context for year March 2015 / March 2016
In economic terms, world growth has been rather disappointing, with fears of a slowdown which were ultimately confirmed and at the same time, the potential for acceleration seems very low. The pace of global growth was therefore around 3%, which is an ultimately disappointing figure, since it is markedly lower than initial expectations, which were around 3.5%. In this context of sluggish growth, the drop in commodities and particularly oil, has also contributed to affecting the global confidence of company directors and investors: this downturn has been perceived as a leading indicator of global economic activity. Moreover, this phenomenon also explains the negative dynamics in emerging countries, with major disappointment in some countries such as Brazil (-3.5%) and Russia (-4%). Furthermore, these fears of an international downturn were accentuated once again in the summer of 2015 with China's decision to let its currency fall against the dollar (by 3%). The Eurozone has, overall, conformed to expectations this time, with a rate of growth of around +1.5%: the zone is one of the major beneficiaries of the well-known "alignment of the planets": drop in oil and interest rates and rise in the dollar. In the United States, the statistics published were very volatile, with some very positive figures and other much more disappointing figures. Overall, the US economy achieved a moderate rate in the region of 2.5%, which means the current cycle is one of the longest in history, but also one of the least intense.
In this context, the Central Banks have, logically, remained very accommodating. The European Central Bank (ECB) has, once again, been very active, deciding at the end of the period to take interest rates very clearly into negative territory: the deposit rate was fixed at -0.4%. Furthermore, it also increased its Quantitative Easing (QE) programme, by upping its bond buying by 20 billion each month, bringing this to 80 billion. Eligible bonds were also extended to Investment Grade bonds. And lastly, a bank credit "subsidy" mechanism was decided on, enabling banks to self-finance at 0% for certain types of credit. The Federal Reserve is much further along its monetary policy cycle, contractual or otherwise. It therefore brought an end to its bond buying programme in October, which was no surprise to the markets because of good prior communication. However, it maintained its near-zero deposit rates throughout the period, with a rates rise of just 0.25% in December. The markets understood that the Federal Reserve was taking the risks on the global economy into account in its decisions, which militates in favour of very gradual monetary normalization.
Market volatility on interest rates. Initially, rates were relaxed in spectacular fashion, particularly in the Eurozone. In April, long-term rates reached historically low levels of less than 0.1% over the German 10-year and 0.35% for the corresponding French OAT. During the months that followed, the movement was reversed, and the German 10-year changed to 0.85% and the French OAT, to 1.22%, before finally being relaxed once more from August onwards and intensification of fears of a global downturn: the 10-year Bund thus returned to around 0.10% and around 0.5% on the 10-year OAT. At the same time, peripheral spreads in the Eurozone were greatly reduced, once the Greece episode was over, and they stayed below American rates, with more or less volatility, depending on the political factors arising during the year (elections in Portugal, Spain, etc.). In the end, the performances of "interest rate" assets speak for themselves: these are negative for money investments (-0.16% for an investment referenced to the EONIA) and +0.79% for the Euro MTS Global index representative of Eurozone sovereign bonds. Credit spreads widened on the Investment Grade segment and on the High Yield segment at the end of the period, particularly in the United States with loss of interest of the securities markets associated with the exploitation of shale oil. In the end, the performance of Investment Grade bonds is posted at +0.8% in the Eurozone and that of high yield securities fell by 0.4%. We also note, on currencies, that the dollar fell by 6% against the euro over the period.
European convertible bonds dropped by around 3%, US convertibles by 2%, in dollars. Emerging market bonds were very volatile and experienced high sell-off levels among international investors. The majority of emerging market currencies fell by around 10% for those regarded as the most solid (Korean won, Singapore dollar) to nearly 40% for the Brazilian real or the rouble. This trend was particularly intensified from the summer onwards, and the Bank of China's decision to devalue its currency by 3% against the dollar. In the end, the emerging market bond index fell by 2% for debts in strong currencies but under-performed by 8% for local debts, in euros.
The performances of the main share markets are, globally, markedly negative over this period: the global share index fell by nearly 4% in local currencies, and by around 10% in euros. American shares proved, once again, the most resistant, with growth of 1.8% in the S&P 500 index in dollars and therefore, a drop limited to 4% in euros. Japanese shares lost nearly 11% in yen and in euros. European shares were part of the marked downturn of nearly 13% for the DJ Stoxx 600 index and 13% for the DJ Eurostoxx index (-10% for the CAC 40). The European market, like other markets, was particularly penalised by the banking sector (-30.6%) and commodities (-32%), whilst the energy sector came through in the end, with a drop of just 11.7%. Growth values achieved better performances with growth of nearly 4% in the consumer goods sector (the only sector experiencing growth) and a fall of only 5.2% in the technology sector. And lastly, emerging market shares ended this financial year down 17% in euros

OFI EURO HIGH YIELD Annual Report
31 March 2016 7
Management On 31 March 2016, the net asset value of OFI Yield Euro High was 93.56 compared to a net asset value published on 31 March 2014 of 94.01. The performance of the fund over the period is -0.48% compared to a benchmark (the HEAE published by BofA Merrill Lynch) at -0.40%, i.e. an under-performance of 0.08%. Chiefly, the UCITS suffered (1) from widening of the credit spread in an environment of stable government rates which were however, volatile over the period, (2) partially offset by the high portage (i.e. coupon) existing on high yield bonds.
In fact, the UCITS suffered from its under-exposure to BB rated credit and its over-exposure to B rated credit. Over the period, BB rated credit achieved a performance of -0.2% and B rated credit a performance in the region of -2%. And lastly, the fund was also penalised by a selection of credits having under-performed the benchmark, due to their lack of visibility on their generation of cash flows and also disappointing results (Abengoa, Oi Brazil, Isolux, etc.). The non-financial high yield bond market fell by 125 base points, to close at 530 base points (OAS). The market was characterised by (1) a particularly active primary market with EUR 59 billion in new issues (over 2015 as a calendar year), (2) marked illiquidity in the case of market stress and (3) significant net subscription flows (EUR 4 billion).
With a first half-year marked by strong volatility on Euro sovereign rates, the strained negotiations around management of the Greek sovereign debt and oil at low levels, the second part of the year was penalised by fears on the emerging economies (China and Brazil in particular) and their impacts on commodities prices, the upsurge in difficult specific deals and the divergence between European and American monetary policies (QE at least up to March 2017 versus the first increase in interest rates in the US for 7 years). In this context, European risk assets (HY Euro -0.4%) outperformed their American counterparts (HY Dollar -4%). Commodities prices also experienced a marked downturn over the period: oil (WTI), Copper and iron or (-20% respectively).
Over the period in question, the UCITS did not use any interest rate hedging products. Furthermore, the UCITS also used credit derivatives, CDS, in order to synthetically take long credit exposure on the underlying assets of these instruments. The UCITS also used the market synthetic index commonly known as the Crossover index, in order to hedge against or achieve exposure to the European high yield market. It also used ETF type index products (Exchange Traded Funds) in order to reduce the liquidity risk
INFORMATION RELATIVE TO the ESMA 1/ Temporary purchase and sale or acquisitions transactions on securities (repurchase agreements, loans and borrowing)
As at 31/03/2016, we did not hold any position in temporary purchase and sale or acquisitions on securities (repurchase agreements, loans and borrowing).
2/ Financial contracts (derivatives)
Foreign exchange: Position opens on 31/03/2016:
Underlying Name Quantity Asset value Counterparty CHF versus EUR 2016/04/18 63,995,587.00 - 58,487,716.82 UBS LTD LONDON
Rates: No position on 31/03/2016.
Credit: Position open on 31/03/2016:
Counterparty Nominal Currency CREDIT SUISSE INTERNATIONAL 500,000 EUR
Shares: No position on 31/03/2016.
Commodities: No position on 31/03/2016.

OFI EURO HIGH YIELD Annual Report
31 March 2016 8
Balance sheet as at 31 March 2016 (in euros) BALANCE SHEET ASSETS
31/03/2016 31/03/2015
Net fixed assets - -
Deposits - -
Financial instruments 220,848,367.14 219,891,626.30
Shares and similar securities 0.04 0.48
Traded on a regulated or similar market - -
Not traded on a regulated or similar market 0.04 0.48
Bonds and similar securities 205,346,707.10 199,707,611.11
Traded on a regulated or similar market 205,346,707.10 199,707,611.11
Not traded on a regulated or similar market - -
Debt securities - -
Traded on a regulated market or similar - -
Negotiable debt securities - -
Other debt securities - -
Not traded on a regulated or similar market - -
Mutual funds 15,501,660.00 18,196,872.77
General purpose UCITS and AIF aimed at non-professionals and equivalents in other countries
15,501,660.00 18,196,872.77
Other funds aimed at non-professionals and equivalents in other Member States of the European Union
- -
General purpose professional funds and equivalents in other Member States of the European Union and listed securitisation vehicles
- -
Other professional funds and equivalents in other Member States of the European Union and listed securitisation vehicles
- -
Other non-European vehicles - -
Temporary transactions on securities - -
Receivables representative of securities received under a repurchase agreement
- -
Receivables on securities lent - -
Securities borrowed - -
Securities given under a repurchase agreement - -
Other temporary transactions - -
Financial contracts - 1,987,141.94
Transactions on a regulated or similar market - -
Other transactions - 1,987,141.94
Other financial instruments - -
Receivables 59,601,304.47 63,621,431.99
Currency forward exchange transactions 58,656,597.74 55,631,273.67
Other 944,706.73 7,990,158.32
Financial accounts 10,038,654.25 4,775.78
Liquid assets 10,038,654.25 4,775.78
Assets total 290,488,325.86 283,517,834.07

OFI EURO HIGH YIELD Annual Report
31 March 2016 9
Balance sheet as at 31 March 2016 (in euros) BALANCE SHEET LIABILITIES
31/03/2016 31/03/2015
Equity
Capital 224,470,719.49 201,711,686.36
Previous net capital gains and losses not distributed (a) - -
Carry forward (a) - 12,134.35
Net capital gains and losses for the financial year (a, b) -8,620,162.63 11,261,284.04
Result for the financial year (a, b) 9,431,739.67 8,957,204.92
Equity total 225,282,296.53 221,942,309.67
(= Amount representative of net assets)
Financial instruments 9,823.72 171.13
Purchase and sale transactions on financial instruments - -
Temporary transactions on securities - -
Payables representative of securities given under a repurchase agreement - -
Payables representative of borrowed securities - -
Other temporary transactions - -
Financial contracts 9,823.72 171.13
Transactions on a regulated or similar market - -
Other transactions 9,823.72 171.13
Payables 65,191,641.15 61,548,694.15
Currency forward exchange transactions 58,477,637.16 54,612,583.39
Other 6,714,003.99 6,936,110.76
Financial accounts 4,564.46 26,659.12
Bank credit facilities 4,564.46 26,659.12
Borrowing - -
Liabilities total 290,488,325.86 283,517,834.07
(a) Including accrual accounts
(b) Minus advances paid in respect of the financial year

OFI EURO HIGH YIELD Annual Report
31 March 2016 10
Off-balance sheet (in euros)
31/03/2016 31/03/2015
HEDGING TRANSACTIONS
Commitments on regulated or similar markets - -
OTC commitments - -
Other commitments - -
OTHER TRANSACTIONS
Commitments on regulated or similar markets - -
OTC commitments 500,000.00 21,500,000.00
CREDIT 500,000.00 21,500,000.00
SALE - CREDIT DERIVATIVES - CDS HEIDELBERGCEMEN 250 BP(5) 03/18 NOM
- 1,500,000.00
SALE - CREDIT DERIVATIVES - CDS ITRAXXX EUROP C 266 BP(5) 06/20 JPM
- 15,000,000.00
SALE - CREDIT DERIVATIVES - CDS PEUGEOT SA 491BP - 1,000,000.00
SALE - CREDIT DERIVATIVES - CDS RENAULT 82BP SG - 3,500,000.00
SALE - CREDIT DERIVATIVES - CDS THYSSENKRUPP AG 274 BP 03/19 CSF
500,000.00 500,000.00
Other commitments - -

OFI EURO HIGH YIELD Annual Report
31 March 2016 11
Profit and loss account (in euros)
31/03/2016 31/03/2015
Income on financial transactions
Income on deposits and financial accounts 21.96 210.49
Income on shares and similar securities - -
Income on bonds and similar securities 10,712,025.22 11,061,909.55
Income on debt securities - -
Income on acquisitions and temporary purchase and sale of securities - -
Income on financial contracts - -
Other financial income - -
Total (I) 10,712,047.18 11,062,120.04
Expenses on financial transactions
Expenses on acquisitions and temporary purchase and sale of securities - -
Expenses on financial contracts - -
Expenses on financial receivables 842.62 636.91
Other financial expenses - -
Total (II) 842.62 636.91
Result on financial transactions (I-II) 10,711,204.56 11,061,483.13
Other income (III) - -
Management fee and allocations to amortisation (IV) 1,718,462.74 1,753,221.88
Net figure for the financial year (L. 214-17-1) (I - II + III - IV) 8,992,741.82 9,308,261.25
Adjustment of income for the financial year (V) 438,997.85 -351,056.33
Advances on result paid in respect of the financial year (VI) - -
Result (I - II + III - IV +/- V - VI) 9,431,739.67 8,957,204.92

OFI EURO HIGH YIELD Annual Report
31 March 2016 12
APPENDIX ACCOUNTING RULES AND METHODS The Fund has complied with the accounting rules established by Accounting Standards Authority regulation no. 2014-01 of 14 January 2014 on the accounting plan of UCIs. The rules for valuation are fixed, under its responsibility, by the management company. The accounting currency for the fund is the euro. The currency of denomination of IC and ID units: euro. The currency of denomination of I CHF H units: Swiss franc. The net asset value is calculated every non-holiday trading day, and is dated that same day. The accounts relating to the securities portfolio are kept by reference to the historic cost: entries (purchases or subscriptions) and exits (sales or redemptions) are posted based on the acquisition price. Any exit generates a capital gain or capital loss from sale or redemption and potentially, a redemption bonus. Accrued coupons on negotiable debt securities are considered on the day of the net asset value date. The Fund values its portfolio securities at the actual value, the value resulting from the market value or in the absence of the existence of any market, from financial methods. The entry value-actual value difference generates a capital gain or loss which shall be posted as "difference in estimate of portfolio". Description of methods of valuation of balance sheet entries and fixed-term and conditional transactions. Financial instruments
Equity securities Equity securities admitted for trading on a regulated or similar market are valued based on closing prices. Debt securities Debt securities admitted for trading on a regulated or similar market are valued, under the responsibility of the management company, by comparing the prices of these assets with various sources. Money market instruments
Negotiable debt securities (NDS) with a duration on issue, acquisition or residual duration which is less than three months are valued using a linear method up to maturity at the issue or acquisition price or at the last price applied for their valuation at the market price.
Negotiable debt securities (NDS) with a residual duration of more than three months are valued at the market price at the time of publication of inter-bank market prices.
Unlisted transferable securities Unlisted transferable securities are valued under the responsibility of the management company using methods based on the asset value and the return, taking into consideration the prices applied at the time of recent significant transactions.
UCI Units or shares of UCIs are valued at the last known net asset value on the actual day of calculation of the net asset value. Financial contracts (otherwise known as "futures instruments") within the meaning of Article L.211-1, III of the Monetary and Financial Code.
Financial contracts traded on a regulated or similar market Fixed or conditional futures instruments, traded on European regulated or similar markets are valued at the settlement price, or failing this, based on the closing price.

OFI EURO HIGH YIELD Annual Report
31 March 2016 13
Financial contracts not traded on a regulated or similar market (i.e. traded over-the-counter)
Financial contracts not traded on a regulated or similar market and settled Financial contracts not traded on a regulated or similar market and forming the subject of settlement are valued at the settlement price.
Financial contracts not traded on a regulated or similar market and not settled Financial contracts not traded on a regulated or similar market and forming the subject of settlement are valued as a mark-to-mark model or mark-to-market using prices supplied by the counterparties. Credit Default Swaps are valued mark-to-market, based on the closing price, taking account of the residual life of the financial instrument.
Acquisitions and temporary purchase and sale of securities N/A Deposits Deposits are valued at their book value. Foreign currencies Foreign currencies in cash are valued with the prices published daily on the financial databases used by the management company. Net asset value adjustment method associated with swing pricing with release limit The Fund may experience a drop in its net asset value (NAV) on account of subscription/redemption orders carried out by investors, at a price which does not reflect the readjustment costs associated with the portfolio's investment or disinvestment transactions. To reduce the impact of this dilution and to protect the interests of existing unit-holders, the mutual fund introduces a swing pricing mechanism with a release limit. This mechanism, supported by a swing pricing policy, enables the management company to ensure payment of readjustment costs by those investors requesting subscription or redemption of units in the mutual fund, thus making savings for unit-holders wishing to remain in the fund. If, on a day of calculation of the NAV, the total of net subscription/redemption orders of investors on all unit categories of the mutual fund exceeds a predefined limit, determined on the basis of objective criteria by the management company as a percentage of the fund's net assets, the NAV may be adjusted in an upward or downward direction, to take into account the readjustment costs chargeable respectively, to the net subscription/redemption orders. The NAV of each unit category is calculated separately but any adjustment has, as a percentage, an identical impact on all NAV of the unit categories of the fund. The parameters for costs and the release limit are determined by the management company. These costs are estimated by the management company based on transactions costs, offer-bid spreads and also potential taxes applicable to the mutual fund. Since this adjustment is linked to the net balance of subscriptions/redemptions within the mutual fund, it is not possible to accurately predict whether swing pricing will be applied at a given moment in the future. Therefore, it is no longer possible either to accurately predict how often the management company will have to make such adjustments. Investors are advised that the volatility of the fund's NAV may not reflect exclusively the volatility of the securities held in the portfolio due to the application of swing pricing. The policy for determining swing pricing mechanisms is available on request from the management company. Application of swing pricing is at the management company's discretion in accordance with the OFI pricing policy. In accordance with the regulations, the configuration for this mechanism is known only to those persons responsible for its implementation. Description of off-balance sheet commitments Fixed-term contracts feature off-balance sheet for their market value, a value equal to the price (or the estimate if the transaction is OTC) multiplied by the number of contracts. Conditional transactions are translated as an underlying equivalent of the option (quantity x quota x price of underlying assets potentially translated to fund posting currency). Commitments on interest rate or currency swaps are posted off-balance sheet at the nominal value or, in the absence of a nominal value, for an equivalent amount, at the time of the initial transaction. Credit Default Swaps feature on the off-balance sheet for their nominal value. Description of method followed for posting income from securities with fixed income Result is calculated based on coupons cashed. Coupons accrued on the day of the valuations constitute an element of the valuation difference.
OFI EURO HIGH YIELD Annual Report
31 March 2016 14
Option chosen regarding posting of costs The mutual fund has opted for posting with costs excluded. Description of the method for calculating fixed management fees Management fees are directly charged to the profit and loss account of the UCI, on calculation of each net asset value. The maximum rate applied on the basis of net assets may not be more than 1.00% including tax; all UCI included, for all unit categories. These fees cover all costs charged directly to the UCI, with the exception of transactions costs. Transaction costs include brokerage fees (brokerage, stock market taxes, etc.) and turnover commission. The following may be added to operating and management fees:
outperformance commission. This remunerates the management company once the UCI has exceeded its objectives. It is therefore charged to the UCI;
turnover commission charged to the UCI; Description of the method for calculating variable management fees Variable management fees have been abolished for the I CHF H unit from 14 September 2015 onwards. Variable fees correspond to an outperformance commission. The calculation period for the outperformance commission is the financial year of the UCI. Each time the net asset value is established, the outperformance of the UCI is defined as the positive difference between the net assets of the UCI before consideration of any provision for outperformance commission, and the net assets of a notional UCI achieving a performance corresponding to the Merrill Lynch Euro Non-Financial Fixed & Floating Rate High Yield Index and registering the same pattern of subscriptions and redemptions as the actual UCI. Each time the net asset value is established, the outperformance commission, then defined equal to 20% (including tax) of performance above the Merrill Lynch Euro Non-Financial Fixed & Floating High Yield Index per annum, forms the subject of a provision, or a provision reversal limited to the existing allocation. Such a provision can only be posted on the condition that the net asset value, after consideration after any provision for outperformance commission, is higher than the net asset value at the start of the financial year. In the case of redemptions, the share of the outperformance commission corresponding to the redeemed units is collected by the management company. Apart from redemptions, the outperformance commission is collected by the management company on the end date of each calculation period. The outperformance commission is collected by the management company on the end date of each calculation period. Exceptionally, for the financial year ending in March 2016, variable management fees will be calculated: - from 01/04/2015 to 12/04/2015, based on an outperformance commission defined as equal to 20% incl. tax of the performance above the Merrill Lynch Euro Non-Financial Fixed & Floating Rate High Yield Index, calculated in euros. - then from 13/04/2015, on the last trading day worked in March 2016 based on an outperformance commission defined as equal to 20% incl. tax of the performance above the Merrill Lynch Euro Non-Financial Fixed & Floating Rate High Yield Index, calculated in euros. If the absolute performance of the Fund is negative and the relative performance of the Fund is positive, this same outperformance commission shall also be collected but limited to 1.5% of the Net Assets. A description of the method used for calculation of the outperformance commission is made available to subscribers by the management company. Allocation of distributable sums Distributable amounts relating to the net result:
IC and I CHF H units: Capitalisation ID units: Distribution
Distributable sums relating to capital gains made: IC and I CHF H units: Allocation according to the management company's decision ID units: Allocation according to the management company's decision

OFI EURO HIGH YIELD Annual Report
31 March 2016 15
Evolution of net assets of the UCI (in euros)
31/03/2016 31/03/2015
Net assets at the beginning of the financial year 221,942,309.67 250,962,220.51
Subscriptions (including subscription commission retained by the UCI) 52,239,037.74 59,774,558.29
Redemptions (after deduction of redemption commission retained by the UCI) -41,128,773.23 -100,289,747.57
Capital gains made on deposits and financial instruments 6,211,679.90 14,907,412.29
Capital losses made on deposits and financial instruments -14,653,522.38 -8,315,349.30
Capital gains made on financial contracts 2,354,248.19 -
Capital losses made on financial contracts -45,000.00 -1,274,375.97
Transaction costs -92,559.49 -13,596.22
Exchange differences -2,590,456.20 7,408,578.68
Change in difference in estimate of deposits and financial instruments -1,638,240.96 -7,894,743.06
Difference in estimate financial year N 3,722,199.75
Difference in estimate financial year N-1 5,360,440.71
Change in difference of estimate of financial contracts -1,996,794.53 1,659,015.77
Difference in estimate financial year N -9,823.72
Difference in estimate financial year N-1 1,986,970.81
Distribution in previous financial year on net capital gains and losses - -
Distribution in previous financial year on result -4,312,374.00 -4,289,925.00
Net result for financial year before accrual account 8,992,741.82 9,308,261.25
Advance(s) paid during financial year on net capital gains and losses - -
Advance(s) paid during financial year on result - -
Other elements - -
Net assets at the end of the financial year 225,282,296.53 221,942,309.67

OFI EURO HIGH YIELD Annual Report
31 March 2016 16
Allocation by legal nature
Designation of securities Amount %
Assets
Bonds and similar securities 205,346,707.10 91.22
Indexed bonds - -
Convertible Bonds - -
Equity securities - -
Other bonds 205,346,707.10 91.22
Debt securities - -
Government bonds - -
Treasury notes - -
Certificates of deposit - -
Other debt securities - -
Liabilities
Purchase and sale transactions on financial instruments - -
Shares and similar securities - -
Bonds and similar securities - -
Debt securities - -
Other - -
Off-balance sheet
Rates - -
Shares - -
Credit 500,000.00 0.22
Other - -
Allocation by nature of rate
Fixed rate % Variable rate % Revisable rate % Other %
Assets
Deposits - - - - - - - -
Bonds and similar securities
182,407,631.56 81.03 17,734,353.71 7.88 5,204,721.83 2.31 - -
Debt securities - - - - - - - -
Temporary transactions on securities
- - - - - - - -
Financial accounts - - - - - - 10,038,654.25 4.46
Liabilities
Temporary transactions on securities
- - - - - - - -
Financial accounts - - - - - - 4,564.46 0.00

OFI EURO HIGH YIELD Annual Report
31 March 2016 17
Allocation by nature of rate (continued)
Fixed rate % Variable rate % Revisable rate % Other %
Off-balance sheet
Hedging transactions - - - - - - - -
Other transactions - - - - - - - -
Allocation by residual maturity
< 3 months % ]3 months - 1 year]
% ]1 - 3 years]
% ]3 - 5 years]
% > 5 years %
Assets
Deposits - - - - - - - - - -
Bonds and similar securities
- - 2,362,554.24 1.05 23,781,585.32 10.56 58,564,021.52 26.02 120,638,546.02 53.59
Debt securities - - - - - - - - - -
Temporary transactions on securities
- - - - - - - - - -
Financial accounts 10,038,654.25 4.46 - - - - - - - -
Liabilities
Temporary transactions on securities
- - - - - - - - - -
Financial accounts 4,564.46 0.00 - - - - - - - -
Off-balance sheet
Hedging transactions - - - - - - - - - -
Other transactions - - - - - - - - - -
Allocation by currency
CHF % USD % % %
Assets
Deposits - - - - - - - -
Shares and similar securities
- - 0.04 0.00 - - - -
Bonds and similar securities
- - - - - - - -
Debt securities - - - - - - - -
UCI - - - - - - - -
Temporary transactions on securities
- - - - - - - -
Receivables 58,656,597.74 26.06 - - - - - -
Financial accounts 4,564.83 0.00 - - - - - -

OFI EURO HIGH YIELD Annual Report
31 March 2016 18
Allocation by currency (continued)
CHF % USD % % %
Liabilities
Purchase and sale transactions on financial instruments
- - - - - - - -
Temporary transactions on securities
- - - - - - - -
Payables - - - - - - - -
Financial accounts 4,564.46 0.00 - - - - - -
Off-balance sheet
Hedging transactions - - - - - - - -
Other transactions - - - - - - - -
Sundry debtors and creditors
31/03/2016
Receivables
Currency forward purchase 58,656,597.74
Cash collateral paid 50,275.40
Sale with deferred settlement 426,368.83
Coupons receivable 468,062.50
Total receivables 59,601,304.47
Payables
Currency forward purchase counterparty -58,477,637.16
Provision for fixed management fees payable -151,233.36
Provision for variable management fees payable -14.72
Turnover fee provision -25,571.15
Purchase with deferred settlement -6,526,624.91
Redemptions payable -10,559.85
Total payables -65,191,641.15
Total -5,590,336.68

OFI EURO HIGH YIELD Annual Report
31 March 2016 19
Subscriptions-redemptions
Category of I units
Units issued 136,892.0557
Units redeemed 178,894.8888
Category of I CHF H units
Units issued 119,547.0000
Units redeemed 62,670.0000
Category of D units
Units issued 520,000.0000
Units redeemed 350,000.0000
Commissions
Category of I units
Amount of subscription commission retained 0.00
Amount of redemption commission retained 0.00
Category of I CHF H units
Amount of subscription commission retained 0.00
Amount of redemption commission retained 0.00
Category of D units
Amount of subscription commission retained 0.00
Amount of redemption commission retained 0.00
Management fees
Category of I units
Percentage of fixed management fees 0.80
Performance commission (variable costs) 14.71
Retrocession of management fees -
Category of I CHF H units
Percentage of fixed management fees 0.80
Performance commission (variable costs) -19.93
Retrocession of management fees -
Category of D units
Percentage of fixed management fees 0.80
Performance commission (variable costs) 0.01
Retrocession of management fees -
OFI EURO HIGH YIELD Annual Report
31 March 2016 20
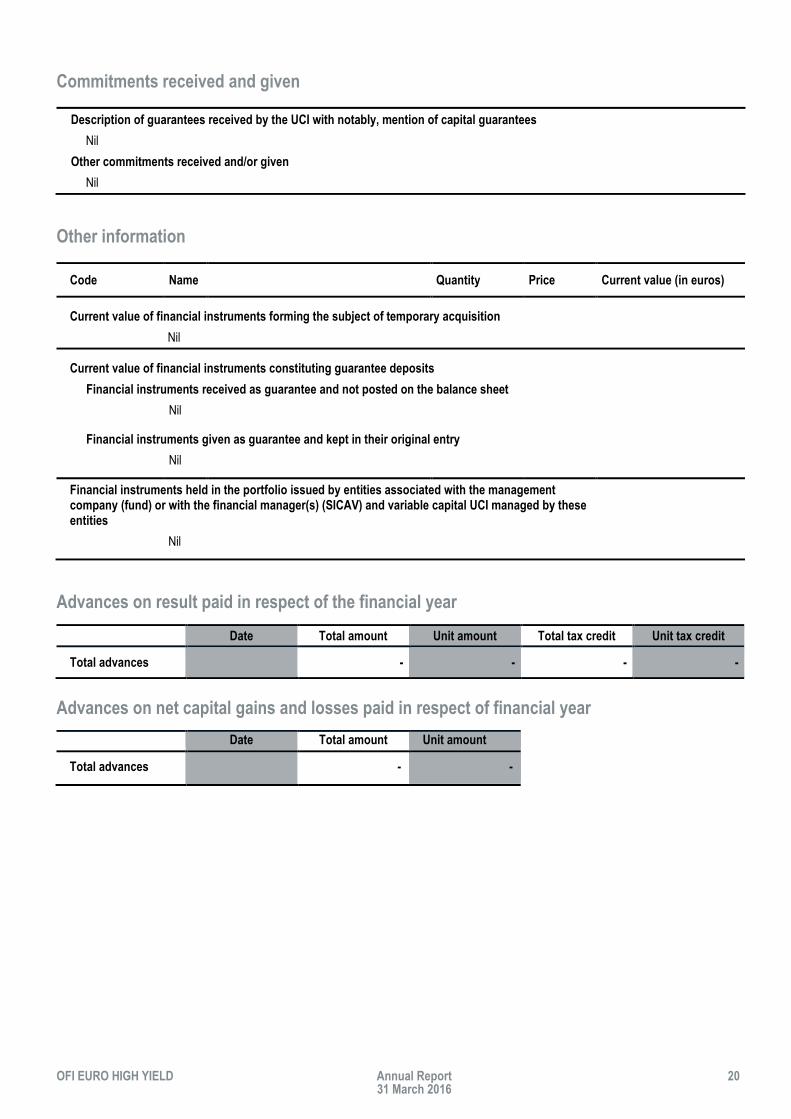
Commitments received and given
Description of guarantees received by the UCI with notably, mention of capital guarantees
Nil
Other commitments received and/or given
Nil
Other information
Code Name Quantity Price Current value (in euros)
Current value of financial instruments forming the subject of temporary acquisition
Nil
Current value of financial instruments constituting guarantee deposits
Financial instruments received as guarantee and not posted on the balance sheet
Nil
Financial instruments given as guarantee and kept in their original entry
Nil
Financial instruments held in the portfolio issued by entities associated with the management company (fund) or with the financial manager(s) (SICAV) and variable capital UCI managed by these entities
Nil
Advances on result paid in respect of the financial year
Date Total amount Unit amount Total tax credit Unit tax credit
Total advances - - - -
Advances on net capital gains and losses paid in respect of financial year
Date Total amount Unit amount
Total advances - -

OFI EURO HIGH YIELD Annual Report
31 March 2016 21
Table showing allocation of distributable amounts relating to the result (in euros)
31/03/2016 31/03/2015
Category of I units
Sums yet to be allocated
Carry forward - -
Profit/loss 2,614,836.08 2,769,165.93
Total 2,614,836.08 2,769,165.93
Allocation
Distribution - -
Carry forward for financial year - -
Capitalisation 2,614,836.08 2,769,165.93
Total 2,614,836.08 2,769,165.93
Information relating to shares or units conferring entitlement to distribution
Number of shares or units - -
Unit distribution - -
Tax credit attached to distribution of result - -
Category of I CHF H units
Sums yet to be allocated
Carry forward - -
Profit/loss 2,480,554.85 2,029,914.33
Total 2,480,554.85 2,029,914.33
Allocation
Distribution - -
Carry forward for financial year - -
Capitalisation 2,480,554.85 2,029,914.33
Total 2,480,554.85 2,029,914.33
Information relating to shares or units conferring entitlement to distribution
Number of shares or units - -
Unit distribution - -
Tax credit attached to distribution of result - -
Category of D units
Sums yet to be allocated
Carry forward - 12,134.35
Profit/loss 4,336,348.74 4,158,124.66
Total 4,336,348.74 4,170,259.01
Allocation
Distribution 4,331,994.00 4,156,274.00
Carry forward for financial year 4,354.74 13,985.01
Capitalisation - -
Total 4,336,348.74 4,170,259.01
Information relating to shares or units conferring entitlement to distribution
Number of shares or units 2,033,800.0000 1,863,800.0000

OFI EURO HIGH YIELD Annual Report
31 March 2016 22
Table showing allocation of distributable amounts relating to the result (in euros) (continued)
31/03/2016 31/03/2015
Unit distribution 2.13 2.23
Tax credit attached to distribution of result - -
Table showing allocation of distributable sums relating to net capital gains and losses (in euros)
31/03/2016 31/03/2015
Category of I units
Sums yet to be allocated
Previous net capital gains and losses not distributed - -
Net capital gains and losses for the financial year -1,795,389.60 1,484,834.13
Advances paid on net capital gains and losses for the financial year - -
Total -1,795,389.60 1,484,834.13
Allocation
Distribution - -
Net capital gains and losses not distributed - -
Capitalisation -1,795,389.60 1,484,834.13
Total -1,795,389.60 1,484,834.13
Information relating to shares or units conferring entitlement to distribution
Number of shares or units 672,992.4811 714,995.3142
Unit distribution - -
Category of I CHF H units
Sums yet to be allocated
Previous net capital gains and losses not distributed - -
Net capital gains and losses for the financial year -3,910,561.87 7,526,986.13
Advances paid on net capital gains and losses for the financial year - -
Total -3,910,561.87 7,526,986.13
Allocation
Distribution - -
Net capital gains and losses not distributed - -
Capitalisation -3,910,561.87 7,526,986.13
Total -3,910,561.87 7,526,986.13
Information relating to shares or units conferring entitlement to distribution
Number of shares or units 505,683.5457 448,806.5457
Unit distribution - -
Category of D units
Sums yet to be allocated
Previous net capital gains and losses not distributed - -
Net capital gains and losses for the financial year -2,914,211.16 2,249,463.78

OFI EURO HIGH YIELD Annual Report
31 March 2016 23
Table showing allocation of distributable sums relating to net capital gains and losses (in euros) (continued)
31/03/2016 31/03/2015
Advances paid on net capital gains and losses for the financial year - -
Total -2,914,211.16 2,249,463.78
Allocation
Distribution - -
Net capital gains and losses not distributed - -
Capitalisation -2,914,211.16 2,249,463.78
Total -2,914,211.16 2,249,463.78
Information relating to shares or units conferring entitlement to distribution
Number of shares or units 2,033,800.0000 1,863,800.0000
Unit distribution - -

OFI EURO HIGH YIELD Annual Report
31 March 2016 24
Table showing results and other characteristic elements of the UCI
during the last five financial years (in euros)
31/03/2016 31/03/2015 31/03/2014 28/03/2013 30/03/2012
Net assets
in EUR 225,282,296.53 221,942,309.67 250,962,220.51 159,931,456.70 158,694,368.98
Number of securities
Category of I units 672,992.4811 714,995.3142 1,083,024.8981 1,475,299.3716 1,594,649.1247
Category of I CHF H units 505,683.5457 448,806.5457 538,106.5457 414,200.0000 494,000.0000
Category of D units 2,033,800.0000 1,863,800.0000 1,825,500.0000 - -
Unit net asset value
Category of I units in EUR 93.56 94.01 90.54 82.29 73.47
Category of I CHF H units in CHF 127.09(1) 128.59(2) 124.23(3) 113.10(4) 101.16(5
Category of D units in EUR 50.84 53.33 53.67(6) - -
Unit distribution on net capital gains and losses (including advances)
Category of I units in EUR - - - - -
Category of I CHF H units in EUR - - - - -
Category of D units in EUR - - - - -
Unit distribution on result (including advances)
Category of I units in EUR - - - - -
Category of I CHF H units in EUR - - - - -
Category of D units in EUR 2.13 2.23 2.35 - -
Unit tax credit transferred to unit-holder (individuals)
Category of I units in EUR - - - - -
Category of I CHF H units in EUR - - - - -
Category of D units in EUR - - - - -
Unit capitalisation
Category of I units in EUR 1.21 5.94 7.87 4.35 4.24
Category of I CHF H units in EUR -2.82 21.29 10.20 4.94 5.12
Category of D units in EUR -1.43 1.20 1.88 - -
(1) Exchange value of the net asset value (in CHF) is EUR 116.46. (2) Exchange value of the net asset value (in CHF) is EUR 123.27. (3) Exchange value of the net asset value (in CHF) is EUR 102.04. (4) Exchange value of the net asset value (in CHF) is EUR 93.01. (5) Exchange value of the net asset value (in CHF) is EUR 84.05. (6) The category of D units was created on 03/05/2013 with a nominal value of EUR 50.00. (7) The unit capitalisation for I and I CHF H units from 31/03/2014 is that of the result and the net capital gains or losses. For previous financial years, the unit capitalisation is only that of the result.

Portfolio inventory as at 31 March 2016
Annual Report
31 March 2016 25
Designation of securities Currency Qty No. or
nominal value Market value
% net assets
Deposits - -
Financial instruments
Shares and similar securities 0.04 -
Traded on a regulated or similar market - -
FORTUNE MANAGEMENT EUR 58,200.00 0.00 0.00
NORTHWESTERN USD 125,000.00 0.00 0.00
Not traded on a regulated or similar market 0.04 -
IT GROUP USD 4,000.00 0.04 0.00
Bonds and similar securities 205,346,707.10 91.22
Traded on a regulated or similar market 205,346,707.10 91.22
ACCOR SA TF-2020 / TV PERPETUAL EUR 2,300,000.00 2,360,592.75 1.05
AGROKOR 9.125% 01/02/2020 EUR 3,000,000.00 3,255,806.25 1.45
AIR FRANCE KLM PERP 49 EUR 1,100,000.00 1,115,028.52 0.50
AIR FRANCE-KLM 6.25% 18/01/2018 EUR 700,000.00 763,944.23 0.34
ALTICE FINANCING SA 5.25% 15/02/2023 EUR 950,000.00 975,400.63 0.43
ALTICE SA 6.25% 15/02/2025 EUR 850,000.00 768,842.71 0.34
ALTICE SA 7.25% 15/05/2022 EUR 2,300,000.00 2,307,056.53 1.02
ARCELORMITTAL 2.875% 06/07/2020 EUR 700,000.00 678,401.27 0.30
ARCELORMITTAL 3% 09/04/2021 EUR 800,000.00 764,552.13 0.34
ARCELORMITTAL 3% 25/03/2019 EUR 1,000,000.00 977,121.92 0.43
ARCELORMITTAL 3.125% 14/01/2022 EUR 1,200,000.00 1,101,979.18 0.49
ARCELORMITTAL TV 29/03/2018 EUR 500,000.00 527,122.60 0.23
ARDAGH FIN 0% 19 EUR 1,562,812.00 1,566,406.47 0.70
ARDAGH PKG FIN/HLDGS 4.25% 15/01/2022 EUR 1,100,000.00 1,131,379.03 0.50
AREVA 3.25% 04/09/2020 EUR 800,000.00 723,371.15 0.32
AREVA 4.625% 05/10/2017 EUR 1,500,000.00 1,529,847.95 0.68
AREVA SA 3.125% 20/03/2023 EUR 800,000.00 660,467.40 0.29
AUTODIS SA 6.50% 01/02/2019 EUR 1,700,000.00 1,605,543.75 0.71
BALL CORP 4.375% 15/12/2023 EUR 3,100,000.00 3,359,370.97 1.49
BUZZI UNICEM 6.25% 28/09/2018 EUR 2,000,000.00 2,327,349.18 1.03
CAMPOFRIO FOOD GROUP SA 3.375% 15/03/2022 EUR 2,500,000.00 2,565,453.13 1.14
CELANESE US 3.25% 15/10/2019 EUR 2,800,000.00 2,967,319.44 1.32
CEMEX SAB DE CV 4.75% 11/01/2022 EUR 1,000,000.00 983,251.39 0.44
CMA CGM SA 7.75% 15/01/2021 EUR 1,000,000.00 843,706.94 0.37
CONSTELLIUM NV 4.625% 15/05/2021 EUR 1,500,000.00 1,211,786.46 0.54
DAKAR FINANCE 9% 15/11/2020 EUR 1,300,000.00 1,322,230.00 0.59
DUFRY FINANCE SCA 4.5% 01/08/2023 EUR 800,000.00 848,140.00 0.38
DUFRY FINANCE SCA 4.5% 15/07/2022 EUR 2,300,000.00 2,446,682.50 1.09
EDF TF/TV PERPETUAL EUR 1,100,000.00 1,061,310.20 0.47
EDF TF/TV PERPETUAL EUR 1,100,000.00 1,105,790.33 0.49
EMPARK FUNDING SA 6.75% 15/12/2019 EUR 1,070,000.00 1,156,603.13 0.51
ENCE ENERGIA Y CELULOSA 5.375% 01/11/2022 EUR 2,000,000.00 2,154,786.11 0.96
ENEL SPA TF/TV 15/01/2075 EUR 4,200,000.00 4,453,801.64 1.98

Portfolio inventory as at 31 March 2016 (continued)
OFI EURO HIGH YIELD Annual Report
31 March 2016 26
Designation of securities Currency Qty No. or
nominal value Market value
% net assets
EPHIOS BONDCO 6.25% 01/07/2022 EUR 1,800,000.00 1,936,162.50 0.86
EUROPCAR GROUPE SA 5.75% 15/06/2022 EUR 2,000,000.00 2,128,019.44 0.95
FAURECIA 3.625% 15/06/2023 EUR 2,000,000.00 1,991,604.17 0.88
FIAT FIN & TRADE 7% 23/03/2017 EUR 500,000.00 529,150.68 0.24
FIAT FINA 5.625% 12/06/2017 EUR 1,500,000.00 1,640,018.24 0.73
FIAT FINANCE & TRADE 4.75% 15/07/2022 EUR 1,500,000.00 1,666,293.44 0.74
FIAT FINANCE & TRADE 6.75% 14/10/2019 EUR 500,000.00 586,952.87 0.26
FIAT FINANCE AND TRADE LTD S.A 4.75% 22/03/2021 EUR 1,500,000.00 1,611,137.67 0.72
FIAT FINANCE&TRADE 6.625% 15/03/2018 EUR 700,000.00 764,281.10 0.34
FINANCIERE GAILLON 8 7% 30/09/2019 EUR 1,000,000.00 1,035,077.78 0.46
GAS NATURAL FENOSA TF-2022 / TV PERPETUEL EUR 3,000,000.00 3,001,959.84 1.33
GAZPROM 3.389% LPN 20/03/2020 EUR 2,000,000.00 2,002,585.48 0.89
GAZPROM CAPITAL 3.7% 25/07/2018 EUR 2,000,000.00 2,094,555.19 0.93
GAZPROM OAO 3.6% 26/02/2021 EUR 1,200,000.00 1,208,685.25 0.54
GAZPROM OAO VIA GAZ CAPITAL SA 3.755% 15/03/2017 EUR 1,800,000.00 1,833,403.56 0.81
GRUPO ANTOLIN DUTCH BV 4.75% 01/04/2021 EUR 500,000.00 519,397.92 0.23
GRUPO ANTOLIN DUTCH BV 5.125% 30/06/2022 EUR 2,700,000.00 2,870,051.25 1.27
HELLENIC TELECOM 3.50% 09/07/2020 EUR 600,000.00 593,411.80 0.26
HOMEVI 6.875% 15/08/2021 EUR 3,500,000.00 3,753,251.74 1.67
HORIZON HOLDINGS I 7.25% 01/08/2023 EUR 500,000.00 533,143.75 0.24
HORIZON HOLDINGS III 5.125% 01/08/2022 EUR 1,800,000.00 1,905,963.75 0.85
INEOS FINANCE PLC 4% 01/05/2023 EUR 1,700,000.00 1,686,400.00 0.75
INEOS GROUP HOLDINGS SA 5.75% 15/02/2019 EUR 800,000.00 826,021.11 0.37
INEOS GRP 6.5% 15/08/2018 EUR 500,000.00 515,623.61 0.23
INTERNATIONAL GAME TECH 4.125% 15/02/2020 EUR 2,200,000.00 2,266,032.08 1.01
INTERNATIONAL GAME TECH 4.75% 15/02/2023 EUR 2,500,000.00 2,554,413.19 1.13
ITALCEMENTI FINANCE SA 6.125% 21/02/2018 EUR 2,300,000.00 2,541,260.89 1.13
IVS GROUP 7.125% 01/04/2020 EUR 4,500,000.00 4,636,321.88 2.06
LA FINANCIERE ATALIAN SA 7.25% 15/01/2020 EUR 1,321,000.00 1,436,071.94 0.64
MERLIN ENTERTAINMENTS PL 2.75% 15/03/2022 EUR 3,100,000.00 3,091,789.31 1.37
NOVAFIVES SAS 4.5% 30/06/2021 EUR 1,700,000.00 1,501,567.50 0.67
NOVALIS SAS 3% 30/04/2022 EUR 1,700,000.00 1,732,186.67 0.77
ONEX WIZARD AC II 7.75% 15/02/2023 EUR 1,100,000.00 1,188,493.47 0.53
OTE PLC 7.875% 07/02/2018 EUR 900,000.00 977,248.56 0.43
PAPREC HOLDING 5.25% 01/04/2022 EUR 3,000,000.00 2,927,512.50 1.30
PETROBRAS 3.75% 14/01/2021 EUR 700,000.00 555,449.43 0.25
PETROBRAS 4.75% 14/01/2025 EUR 800,000.00 583,129.84 0.26
PETROBRAS GBL FINANCE 2.75% 15/01/2018 EUR 2,500,000.00 2,280,777.32 1.01
PETROBRAS GLOBAL FINANCE 4.25% 02/10/2023 EUR 500,000.00 372,841.12 0.17
PETROBRAS INTL 5.875% 07/03/2022 EUR 800,000.00 671,365.48 0.30
PICARD GROUPE SA FRN 01/08/2019 EUR 3,160,000.00 3,198,038.50 1.42
PLAY FINANCE 2 SA 6.5% 01/08/2019 EUR 2,000,000.00 2,109,150.00 0.94
PLAY TOPCO 7.75% 28/02/2020 EUR 1,300,000.00 1,336,185.14 0.59

Portfolio inventory as at 31 March 2016 (continued)
OFI EURO HIGH YIELD Annual Report
31 March 2016 27
Designation of securities Currency Qty No. or
nominal value Market value
% net assets
PORTAVENTURA 7.25% 01/12/2020 EUR 2,000,000.00 2,109,341.67 0.94
SCHAEFFLER FINANCE BV 2.5% 15/05/2020 EUR 2,000,000.00 2,047,805.56 0.91
SCHAEFFLER FINANCE BV 3.25% 15/05/2019 EUR 1,800,000.00 1,852,467.50 0.82
SM MTH AUTO GRP 4.125% 15/07/2021 EUR 3,200,000.00 3,170,406.67 1.41
SOFTBANK CORP 4.625% 15/04/2020 EUR 700,000.00 777,288.26 0.35
SOFTBANK GROUP CORP 4% 30/07/2022 EUR 1,200,000.00 1,272,493.33 0.57
SOFTBANK GROUP CORP 4.75% 30/07/2025 EUR 700,000.00 726,211.11 0.32
SOLVAY FINANCE TF-2019/TV PERP EUR 2,000,000.00 2,076,060.77 0.92
SPCM SA 2.875% 15/06/2023 EUR 3,000,000.00 2,952,314.58 1.31
TECHEM GMBH 6.125% 01/10/2019 EUR 1,000,000.00 1,052,710.42 0.47
TELECOM ITALIA SPA 3.25% 16/01/2023 EUR 1,800,000.00 1,900,647.05 0.84
TELECOM ITALIA SPA 3.625% 19/01/2024 EUR 3,700,000.00 3,933,574.63 1.75
TELECOM ITALIA SPA 4% 21/01/2020 EUR 900,000.00 992,508.69 0.44
TELEFONICA EUROPE BV 4.2% PERPETUAL EUR 3,500,000.00 3,549,350.00 1.58
TELEFONICA EUROPE BV TF/TV PERPETUAL EUR 2,000,000.00 2,030,895.89 0.90
TESCO 3.375% 02/11/2018 EUR 1,400,000.00 1,490,861.15 0.66
THOMAS COOK FINANCE PLC 6.75% 15/06/2021 EUR 1,000,000.00 1,028,937.50 0.46
THYSEENKRUPP AG 3.125% 25/10/2019 EUR 1,000,000.00 1,053,931.97 0.47
THYSSENKRUPP AG 2.750% 08/03/2021 EUR 2,500,000.00 2,530,335.62 1.12
THYSSENKRUPP AG 4% 27/08/2018 EUR 1,400,000.00 1,520,194.21 0.68
TITAN GLOBAL FINANCE 4.25% 10/07/2019 EUR 1,400,000.00 1,413,183.33 0.63
TOTAL SA VAR 31/12/2049PERP EUR 2,400,000.00 2,270,246.56 1.01
TRINSEO OP/FIN 6.375% 01/05/2022 EUR 1,600,000.00 1,664,950.00 0.74
TVN FINANCE CORP 7.375% 15/12/2020 EUR 2,560,000.00 2,255,523.56 1.00
UNITY MEDIA KABELKW GMBH 3.75% 15/01/2027 EUR 2,500,000.00 2,281,322.92 1.01
UNITYMEDIA HESSEN 5.5% 15/09/2022 EUR 1,830,000.00 1,590,660.25 0.71
UNITYMEDIA HESSEN NRW 4% 15/01/2025 EUR 1,800,000.00 1,858,460.00 0.83
UPC HOLDING BV 6.375% 15/09/2022 EUR 2,500,000.00 2,686,661.46 1.19
VERISURE HOLDING AB 6% 01/11/2022 EUR 1,900,000.00 2,070,240.00 0.92
VIRGIN MEDIA FINANCE PLC 4.5% 15/01/2025 EUR 3,000,000.00 2,936,925.00 1.30
VOLKSWAGEN TF-2018/TV PERPETUAL EUR 2,500,000.00 2,474,878.07 1.10
VOLVO TREASURY AB VAR 10/06/2075 EUR 3,000,000.00 3,089,734.43 1.37
WIND ACQUISITION FIN 7% 23/04/2021 EUR 2,500,000.00 2,482,263.89 1.10
WIND ACQUISITION FIN SA 4% 15/07/2020 EUR 3,500,000.00 3,504,122.22 1.56
WORLDPAY FINANCE 3.750% 15/11/2022 EUR 3,100,000.00 3,259,960.00 1.45
XEFIN LUX TV 01/06/2019 EUR 2,000,000.00 2,006,683.33 0.89
ZF NA CAPITAL 2.25% 26/04/2019 EUR 1,800,000.00 1,879,174.92 0.83
ZF NA CAPITAL 2.75% 27/04/2023 EUR 1,300,000.00 1,340,133.42 0.60
ZINC CAPITAL 8.875% 15/05/2018 EUR 1,400,000.00 1,399,814.31 0.62
Not traded on a regulated or similar market - -
PEGASUS SATELLITE 01/03/2007DEFAULTED USD 1,250,000.00 0.00 0.00
Debt securities - -
Traded on a regulated market or similar - -

Portfolio inventory as at 31 March 2016 (continued)
OFI EURO HIGH YIELD Annual Report
31 March 2016 28
Designation of securities Currency Qty No. or
nominal value Market value
% net assets
Negotiable debt securities - -
Other debt securities - -
Not traded on a regulated or similar market - -
Mutual funds 15,501,660.00 6.89
General purpose UCITS and AIF aimed at non-professionals and equivalents in other countries
15,501,660.00 6.89
ISHARES MARKIT IBOXX EURO HIGH YIELD EUR 151,000.00 15,501,660.00 6.89
Other funds aimed at non-professionals and equivalents in other Member States of the European Union
- -
General purpose professional funds and equivalents in other Member States of the European Union and listed securitisation vehicles
- -
Other professional funds and equivalents in other Member States of the European Union and listed securitisation vehicles
- -
Other non-European vehicles - -
Temporary transactions on securities - -
Receivables representative of securities received under a repurchase agreement
- -
Receivables on securities lent - -
Securities borrowed - -
Securities given under a repurchase agreement - -
Payables representative of securities given under a repurchase agreement
- -
Payables representative of borrowed securities - -
Other temporary transactions - -
Purchase and sale transactions on financial instruments - -
Financial contracts -9,823.72 -
Transactions on a regulated or similar market - -
Other transactions -9,823.72 -
CDS THYSSENKRUPP AG 274 BP 03/19 CSF EUR 500,000.00 -9,823.72 0.00
Other financial instruments - -
Receivables 59,601,304.47 26.48
Payables -65,191,641.15 -28.96
Financial accounts 10,034,089.79 4.46
NET ASSETS 225,282,296.53 100.08
4-14, rue Ferrus, 75014 Paris - Tel.: 33 (0) 1 40 40 38 38 - Fax: 33 (0) 1 40 40 38 98 - E-mail: [email protected]
Simplified joint stock company with capital of EUR 2,386,360 - 702 034 802 Companies Register Paris
Independent founder member of
Morison International
Firm of accountants Paris regional professional association Firm of auditors Paris regional professional association
Marie-Françoise Baritaux-ldir Maud Bodin-Veraldi Bruno Dechancé Frédéric Farait Bernard Girodroux-Lavigne
Laurent Guez Stéphane Lambert Pierre Laot Jean-Pierre Larroze Margaret Marti Isabelle Strecker-Hazan Chartered accountants Auditors
OFI EURO HIGH YIELD
Mutual Fund
OFI ASSET MANAGEMENT Société de gestion
20-22, rue Vernier - 75017 PARIS _________
AUDITOR'S REPORT ON THE ANNUAL ACCOUNTS
FINANCIAL YEAR ENDED ON 31 MARCH 2016
To the unit-holders,
In execution of the task entrusted to us by the fund management company, we would like to present to you
our report relating to the financial year ended on 31 March 2016, concerning:
the audit of the annual accounts of the Mutual Fund OFI EURO HIGH YIELD, denominated in euros, as
they are attached to this report;
justification of our assessments;
the specific checks and information provided for by law.
The annual accounts were drawn up by the fund management company. It is our responsibility, based on
our audit, to express an opinion on these accounts.
I. OPINION ON THE ANNUAL ACCOUNTS
We have carried out our audit in accordance with the rules of professional practice applicable in France;
these rules require implementation of measures making it possible to obtain reasonable assurance that the
annual accounts do not contain any significant anomalies. An audit consists of verifying, using spot checks
or other selection methods, the elements justifying amounts and information featuring in the annual
accounts. It also consists of assessing the accounting principles applied, the significant estimates used and
the overall presentation of the accounts. We consider that the elements which we have gathered are
sufficient and appropriate in order to form our opinion.

OFI EURO HIGH YIELD REPORT ON THE ANNUAL ACCOUNTS Financial year ended on 31 March 2016 -2-
We certify that the annual accounts are, in the light of French accounting rules and principles, due and
proper and sincere, and give a faithful image of the result of the operations in the past financial year, and of
the financial situation and assets of the fund at the end of that financial year.
II. JUSTIFICATION OF ASSESSMENTS
Under the provisions of Article L. 823-9 of the Commercial Code relating to the justification of our
assessments, we would like to advise you of the following:
The valuation of the portfolio was carried out according to the methods described in the appendix. We have
reviewed the appropriate nature of these methods, and their correct application.
The assessments made in this way form part of our procedure for auditing annual accounts, considered as
a whole, and have therefore contributed to the formation of our opinion expressed in the first part of this
report.
III. SPECIFIC CHECKS AND INFORMATION
In accordance with the rules of professional practice applicable in France, we also carried out the specific
checks provided for by law.
We do not have any observations to make on the genuine nature or concordance with the annual accounts
of the information given in the annual report and in the documents sent to unit-holders on the financial
situation and the annual accounts.
Done in Paris, on 3 June 2016
The Auditor
APLITEC, represented by
[Signature]
Bruno DECHANCÉ


ADDITIONAL INFORMATION FOR INVESTORS IN GERMANY
OFI Asset Management has notified the Federal Financial Supervisory Authority (Bundesanstalt für
Finanzdienstleistungsaufsicht, BaFin) of its intention to distribute the units IC and ID of the Fund OFI EURO
HIGH YIELD in the Federal Republic of Germany and has been authorized to distribute the units in the Federal
Republic of Germany upon completion of the notification procedure.
Information and Paying Agent
Bremer Kreditbank AG, a bank established under the laws of Germany, having its registered office at
Wachtstrasse 16, 28195 Bremen, registered with the Bremen Trade Registry, number HRB 4188, has
undertaken the function of Information and Paying Agent for the Fund in the Federal Republic of Germany (the
‘’German Information and Paying Agent’’)
Information and Documents
For unit-holders resident in Germany, the following documents are available for inspection in hard copy, free of
charge and upon request at the German Information and Paying Agent:
Prospectus
Key Investor Information Documents
Articles of Incorporation
The latest annual report, and the most recent semi-annual report, if published thereafter
Custody and Administration Agreements
Paying Agency Agreement
Any other information to the Shareholders will be sent to the Shareholders by post. The issue, redemption and
conversion prices of shares will be published on the website: www.ofi-am.fr. Additionally, communications to
investors in Germany will be published in a durable medium, further to the requirements of Article 167 of the
German Investment Code in the following cases: suspension of the redemption of the shares, termination of
the management of the fund or its liquidation, any amendments to the Articles of Incorporation which are
inconstant with the previous investment principles, which affect material investor rights or which relate to
remuneration and reimbursement of expenses that may be paid or made out of the asset pool, merger of the
fund with one or more other funds and the change of the fund into a feeder fund or the modification of a
master fund.
Applications for the redemption and conversion of shares may be sent to the German Information and Paying
Agent. All payments to investors, including redemption proceeds and potential distributions, may, upon
request, be paid through the German Information and Paying Agent.