offshore technology report 2000/ · pdf fileoffshore technology report 2000/018. hse health...
TRANSCRIPT

HSEHealth & Safety
Executive
POD/POS curves fornon-destructive examination
Prepared byVisser Consultancy Limited
for the Health and Safety Executive
OFFSHORE TECHNOLOGY REPORT
2000/018

HSEHealth & Safety
Executive
POD/POS curves fornon-destructive examination
Dr W (Pim) VisserVisser Consultancy Limited
3 Valiant RoadWeybridge
Surrey KT13 932United Kingdom
HSE BOOKS

ii
© Crown copyright 2002Applications for reproduction should be made in writing to:Copyright Unit, Her Majesty’s Stationery Office,St Clements House, 2-16 Colegate, Norwich NR3 1BQ
First published 2002
ISBN 0 7176 2297 5
All rights reserved. No part of this publication may bereproduced, stored in a retrieval system, or transmittedin any form or by any means (electronic, mechanical,photocopying, recording or otherwise) without the priorwritten permission of the copyright owner.
This report is made available by the Health and SafetyExecutive as part of a series of reports of work which hasbeen supported by funds provided by the Executive.Neither the Executive, nor the contractors concernedassume any liability for the reports nor do theynecessarily reflect the views or policy of the Executive.

Table of contents Summary Glossary of terms 1. Introduction 1 2. Main findings 2 3. Fundamental aspects
3.1 Description of defects 5 3.2 Calibration & sizing 5 3.3 Definitions 5 3.4 Inspection methods 6 3.5 Statistics of POD/POS 9 3.6 Codes and guidance 12
4. Six major projects
4.1 PISC II & III 13 4.2 Nordtest 13 4.3 NIL 14 4.4 UCL underwater inspection 15 4.5 ICON 15 4.6 TIP 16
5. Major findings of each project
5.1 Methods of presentation 17 5.2 Principal findings for each project 17 5.3 Overview of principal findings 21 5.4 Differences between surface flaws and buried flaws 21 5.5 Collection of general observations 22
6. Other aspects
6.1 Human factors 23 6.2 Flooded member detection 24 6.3 Acoustic emission 24 6.4 Pipelines 25 6.5 Workmanship 25 6.6 Potential areas for future developments 26
7. References 28 Tables Table 1 Definitions of terms Table 2 Overview of acceptance standards Table 3 Overview of NDT methods and the main NDT projects Table 4 Flow diagram for defect detection and assessment Figures
iii

Appendices Detailed reviews of main projects Appendix A PISC-II and III Appendix B Nordtest Appendix C NIL Appendix D UCL Appendix E ICON Appendix F TIP Appendix G Flooded member detection Appendix H Potential areas for future developments
iv

v
Summary On behalf of the HSE a review has been made of relevant results on POD (probability of detection) and POS (probability of sizing) of defects in welded structures. The aim is to obtain quantitative information on these topics which can subsequently be used in a probabilistic defect assessment and fitness for purpose (FFP) evaluations in the context of the Brite Euram project SINTAP, co-ordinated by British Steel. In total six major projects on non-destructive examination (NDE) were identified as having potential for this information. These projects are in historical order: �� PISC Project on Inspection of Steel Components for nuclear components �� Nordtest a series of Scandinavian projects on fundamental issues in NDE �� NIL a series of Dutch projects on fundamental issues in NDE �� UCL a joint industry project on underwater NDE of offshore structures �� ICON Inter-Calibration of Offshore NDE, a large underwater NDE project �� TIP Topsides Inspection Project on NDE of offshore topsides components The main reports of these six projects have been reviewed in detail. The emphasis of these reviews was on information on POD/POS of surface breaking defects but relevant information on buried defects has been extracted as well. This report does not address the issue of how this information can be used, and which information is still required, to carry out fitness for purpose (FFP) evaluations.

vi
Glossary of terms abbr. explanations ACFM alternating current field measurement ACPD alternating current potential drop AE acoustic emission AEA, UK Atomic Energy Authority ASME American Society of Mechanical Engineers CAF correct acceptance frequency CAP correct acceptance probability CAT computer assisted telemanipulator CRF correct rejection frequency CRP correct rejection probability CRR correct rejection rate CTOD crack tip opening displacement DAC distance amplitude curve DCPD direct current potential drop method DDF(R or T) defect detection frequency (rejectable defects or total number of
defects) DDP defect detection probability DDT defect detection trials DNV Det Norske Veritas DP dye penetrant (technique) DZ defect through wallthickness size EC eddy current EEMUA Engineering Equipment and Materials Users Association ENIQ European Network for Inspection Qualification ESIS European Structural Integrity Society ESZ error in depth sizing ET eddy current testing or techniques FAD failure assessment diagram FBH flat bottom hole FCR false call rate FCRD false call rate related to detection FCRR false call rate related to rejection FDF flaw detection frequency FFP fitness for purpose FMD flooded member detection FTR a single probe TOFD system HSE Health & Safety Executive ICON InterCalibration of Offshore Non-destructive examination IGA intergranular attack IGSCC intergranular stress corrosion cracking IIW International Institute of Welding? ISI in-service inspection ISO International Standards Organisation JIP joint industry project JRC Joint Research Centre (Petten, Ispra)

vii
MaTSU Marine Technology Support Unit MDU mobile display unit MESD mean error of sizing of depth MESL mean error of sizing in length MESZ mean sizing error in z-direction (=depth) MPI magnetic particle inspection NDE non-destructive examination NDT non-destructive testing NIL Nederlands Instituut voor Lastechniek NNDT nil ductility transition temperature OSEL a brand name for MPI equipment OTN Offshore Technical Note (a type of HSE publication) PC personal computer PFM probabilistic fracture mechanics PISC programme for inspection of steel components PMP, NL Projectbureau voor onderzoek aan Materialen en
Produktietechnieken POD probability of detection POS probability of sizing (length or depth) PSA probabilistic safety assessment PSE probabilistic safety evaluation PSI pre-service inspection PV pressure vessel PVRC Pressure Vessel Research Committee PWR pressurised water reactor RMS root mean square ROC response operator characteristic RRT round robin testing or tests RT radiographic technique RTD Röntgen Technische Dienst (Rotterdam) SAFT synthetic aperture focusing technique SC solidification cracking SCC stress corrosion cracking SE UT technique with emitter and receiver separated in the same
body SESD/L standard deviation in depth and length SESZ standard deviation in depth sizing SINTAP Structural INTegrity Assessment Procedure (for European
Industry) SMAW submerged manual metal arc welding SS stainless steel SZ depth sizing T thickness TEL Transportable Environmental Laboratory TIP Topsides Inspection Project TOFD time-of-flight diffraction TWI The Welding Institute UCL University College London UCW ultrasonic creeping wave UMFRAP UMIST developed fracture assessment procedure
viii
UMIST University of Manchester Institute of Science & Technology UT ultrasonic testing or technique VTT Technology Research Centre of Finland

- 1 -
1. Introduction Recently, a large European joint industry project on structural integrity was initiated by British Steel plc as a Brite-Euram Project, No BE 95-1426. The acronym for the project is SINTAP, which stands for Structural INTegrity Assessment Procedure for European industries. The final results of the project will have a bearing on the contents of Eurocodes on steel structures and as such they are beneficial to the whole European steel and construction industry. Task 3 of the project was to do with reliability based defect assessment procedures which takes account of reliability of data inputs, scatter in material properties and consequences of failure of a structure and its component members. Part of this sub task was related to the development of POD (probability of detection) of crack like defects for various non-destructive inspection techniques (NDT). The focal point on this sub task was JRC (1). The purpose of the final results of SINTAP is that these results are suitable for application both to the offshore and the onshore steel construction industry. As far as offshore is concerned: the work at UCL (40) , the ICON project (42) and most recently the TIP project (45), (46), have resulted in recognised findings on POD for a number of inspection methods. These should be supplemented by the review of data and the development of PODs for other components more common in onshore welded fabrication. Data from existing projects will be used to derive suitable requirements for a European procedure. For example, the programme for inspection of steel components (PISC) has generated a large amount of information regarding the effectiveness of different NDE techniques (25), (26). In the preparation of the SINTAP programme it was therefore concluded that the PISC results are very suitable to improve and identify suitable inspection techniques. In addition NIL (Netherlands Institute of Welding) has many reports available on inspection trials and analysis of non-destructive inspection data (34-39). These have also been assessed for SINTAP. In the course of the review also the data generated under Nordtest (28-31), were identified as containing valuable information which has been searched for, found and reviewed. Surface and buried defects should be considered. Buried defects have been addressed by JRC (1), although some findings will also be given here in order to further develop understanding. This report is arranged that fundamental issues are addressed first (Section 3) followed by a summary description of the six projects (Section 4) and their main findings (Section 5). Finally in Section 6 other aspects, such as human factors, FMD and workmanship are addressed. The appendices A-F address the six projects in detail and contain, at the end of each individual appendix, the relevant figures from the main report. Details on FMD are given in Appendix G and potential areas for future developments in Appendix H.

- 2 -
2. Main findings
General �� For the review of POS/POD information six projects have been identified as
providing potential sources of material. �� A ROC diagram, as used in this report, reflects the presentation of an NDE method
using the detection rate of rejectable defects and the false call rate of rejectable defects as the two axes.
�� A ROC diagram is a suitable means of comparing the performance of different NDE methods, provided the same defect library is used for the comparison.
�� Valuable information on the detection of surface breaking and buried defects has been identified: Nordtest, UCL, ICON and TIP for surface breaking defects and PISC, Nordtest and NIL for buried defects.
�� However, as shown later, the number of POD curves with an acceptable confidence level is small.
Special issues �� For manual inspection systems it is noted that in many cases the variations in
performance between different operators on a single system are larger than the variations between the systems.
�� Under ICON the large variation in false call rate for the same system under slightly different conditions was noteworthy.
�� In UT the employment of the higher sensitivity of 20% DAC as compared with the engineering approach of 50% DAC has now been well established. The further enhancing to 10% DAC has no effect on performance.
�� The employment of more than one method, as for example in mechanised UT for pipeline inspection, significantly enhances performance.
�� The POD of small surface breaking defects (i.e. = 1mm deep) is low. �� It has been demonstrated by UCL that the ignoring of interbead cracks does not
affect performance significantly. �� UT is mainly used for the detection of buried defects. Yet UCW is able to detect
surface breaking defects and TOFD methods for the detection of surface breaking defects < 5.0mm deep is under development.
On the presentation of results �� The derivation of POD with confidence levels requires a defect database of some
100 defects. Only a few databases: Nordtest, NIL and UCL complied with this criterion.
�� For surface breaking defects both the ACFM and ACPD systems were found to give acceptable estimates of defect depth.
�� For the defect length estimation of surface breaking defects the accuracy is ±20% (RMS) for MPI and UCW and ±40% (RMS) for ACFM and EC systems.

- 3 -
�� The position and length of buried defects in thin plates are determined with an accuracy of 10mm and 1.5mm (RMS) respectively.
Additional comments on the six main projects �� In addition to the comments made above the following observations on the six
major projects can be made: �� PISC: the benefit of RRT (round robin testing) and the difficulty in correctly sizing
of buried defects is noted. �� Nordtest: the defect library is particularly large; for MPI a POD>80% is found for
defects > 4 mm deep which is much better than the TIP results using MPI. �� NIL: particularly the thin plate project was useful for POD, sizing and location of
defects; the average POD is ± 50%. �� UCL: a high emphasis was placed on consistency and on the size of the database;
therefore for underwater usage the POD curves established this way have an acceptable level of confidence.
�� ICON: this project is characterised by the many different parameters that have been investigated; it demonstrated the suitability for underwater use of a large variety of different NDE methods.
�� TIP: except for the poor results on MPI, the electronic imaging through ET is an advantage over MPI; both ACFM and ET demonstrated the good performance on coated specimens.
The results of these six projects are summarised in Table 3 and in Figures 1-3.
The presentation in the form of summary graphs �� The presentation of results in the form of graphs can be found in Figures 1-20. �� Figures 1-3 provide summaries of results for the two categories: surface breaking
defects and buried defects, in two forms: the POD as a function of defect depth and the ROC diagrams.
�� A number of specific observations from these figures are: • there is a substantial variation of results both between methods and between
individual NDE projects; • the graphs fully illustrate that there is a fair chance of missing surface breaking
defects at or in excess of 5.0mm in depth; therefore the Nordtest curves are too optimistic;
• the observation in PISC that variations between teams are as large as between methods seems to apply to surface breaking defects as well;
• certain discontinuities in the POD curves are caused by the small size of the database;
• for surface breaking defect the POD curves are primarily presented in terms of defect depth; an exception is made for MPI for which also the defect length presentation is given (Figure 1.6).

- 4 -
On workmanship �� Workmanship is a suitable term to qualitatively bridge the gap between the
performance of NDE methods and the acceptability of design tools. �� In other words, good workmanship ensures that properly designed structures
perform well despite a POD of rejectable defects of the order of 60%.
Other issues �� Separate sections have been devoted to four specific issues: human effects, FMD,
AE and pipelines. �� The IIW activities on NDE are addressed by IIW Workgroup V, that meets on a
regular basis, and its developments are reported in its annual report (15). �� With the improvement of NDE methods it is justifiable to adjust the codes for defect
acceptance as well.

- 5 -
3. Fundamental aspects
3.1 Description of defects There are various forms of welding defects and for buried defects the distinction can be made between volumetric and crack like defects. The former can be porosity and inclusions that can suitably be detected using a radiographic technique (RT). However, from a fracture mechanics point of view, crack like defects are more significant. The following five main classes of defects can be identified: porosity, slag inclusion, incomplete penetration, lack of fusion and cracks (47).
3.2 Calibration & sizing A main activity for each project is to determine the actual defects. The two options are destructive testing or the testing by using better equipment and/or a better inspection environment. Both methods are used. Examples will show that for buried defect even the best equipment has difficulty in being precise in the sizing of defects. Hence it is difficult to judge when to reject a defect and the rejection criterion may therefore be dependent on the inspection technique.
3.3 Definitions The following definitions have been developed in the course of the UCL/ICON projects
3.3.1 Classifications A-B & PD6493 for surface breaking defect At the start of the UCL project (40), three principal defect classifications for surface breaking defects had been identified. These were called Classification A for individual defects, Classification B (B & B1) for combined defects in a region and Classification PD6493 for combining closely spaced defects. Diagrams of the first two types of defects can be found in Figure 4.1 and the PD6493 defect coalescence procedure is sketched in Figure 4.2. For buried defects various options are available depending on the size and location of defects; here only PD6493 (8), and ASME (10), are mentioned.
3.3.2 Length ratio for surface breaking defects The characteristic length of a defect is the length of a defect as established in-air with the best possible method. The length ratio is then defined as the measured length under water over the characteristic length. In Ref. 40 a method is presented to calculate the accuracy of the underwater crack lengths as compared with those measured in-air in a consistent manner for the various underwater inspection methods. The final conclusions have been captured in Section 5.2.4.

- 6 -
3.3.3 Spurious indications or false calls Spurious indications are indications obtained during the inspection which do not correspond to actual defects. Spurious indications can be analysed in various ways: as a length, as a percentage of the total weld length, as a number or as a percentage of the number of found defects. False calls, on the other hand, are defined as all defects that are repaired even if, in hindsight, they could have been left unrepaired. The difference between false calls and spurious results is therefore that a false call is either a spurious indication or a defect that could have been left in place. In this report spurious indications are in most cases identified by a percentage: namely the false call rate (FCR). The term false call rate for rejectable defects is also used; these are false calls where the inspector has identified that the defect is most likely a rejectable defect; this is reflected by the term FCRR. Clearly the number of spurious indications should be kept relatively low. Some investigator’s claim a relation between the number of spurious indications to achieve a previously specified level of the POD but this is not confirmed by this report.
3.3.4 Missed defects Missed defects are those crack indications that are not reported by the inspectors. The distribution of the missed defects as a function of length and depth is the basis for the determination of the POD. Particularly important are the missed rejectable defects. In that case the term FCRR: false call rate for rejectable defects, can be used. As shown elsewhere, the ROC diagrams for all defects and for rejectable defects only can be significantly different.
3.3.5 Defect location For surface breaking defects it has been found that the inaccuracy in determining the defect location is dependent on the inaccuracy of the defect length. In this case the defect location is well established provided clear markers on the structure are used. For buried defects this is a main problem area and will be further addressed under NIL results (Section 5.2.3).
3.3.6 Interbead cracks In the generation of fatigue defects some interbead cracks can also be formed. For example, in the UCL library (see Figure 10) there were in total some 19 individual interbead cracks in the database, of which only 5 were deeper than 1.0mm. As illustrated in Ref. 40 only one of these interbead cracks could be classified in the B1 category and this defect was 2.0mm deep. Hence for this database, by ignoring interbead cracks altogether, the average POD would have to be reduced by only 1%. This observation is of significance for MPI, with which a few interbead cracks were missed, and for eddy current methods with which interbead cracks cannot be detected.

- 7 -
3.4 Inspection methods This section provides brief outlines of the various inspection methods that have been used in the execution of the projects; they have been put in alphabetic order. For more detailed descriptions of the methods Reference 2 and 3 could be consulted.
3.4.1 Advanced visual methods The two advanced visual methods for surface flaw detection in welded structures are MPI and the dye penetrant (DP) technique. MPI Magnetic particle inspection (MPI) has been used in air and under water for many years. It is the most commonly used NDT method for detecting surface breaking defects in welds and is easily carried out using equipment that is well proven. If a magnetic flux parallel to the surface of a component encounters a discontinuity then the flux becomes distorted - part of the flux passes through the crack, part is diverted internally around the tip and part bridges the crack at the surface. The bridging flux, termed leakage, attracts ferromagnetic particles that are applied to the surface of the steel in a liquid suspension. The resulting concentration of particles at the crack opening delineates a crack. For underwater applications the normal method of producing the magnetic field is by the use of current carrying coils. The alternative is a magnetic yoke, either using a permanent magnet or a coil; here the fluorescent particles can be made visible under water using ultraviolet light. For surface applications ordinary non-fluorescent light is more common. Dye penetrant (DP) Penetrant methods comprise a range of techniques in which a liquid is put on the surface of the specimen and given time to soak into surface breaking cracks and cavities. After removal of excess liquid the dye in the cracks and cavities is made visible through the application of a developer. The advantage of the dye penetrant technique is that it is simple to use and particularly suitable for field work. It is the prime technique for surface breaking defects in non-magnetisable materials.
3.4.2 Electromagnetic methods Under this heading the following three methods will be discussed: ACPD, ACFM and eddy current methods. ACPD The alternating current potential drop (ACPD) method was developed at UCL as a method of crack depth measurement (5). Underwater ACPD equipment has been produced by OSEL and DnV based on similar principles.

- 8 -
When an alternating electric current flows between two electrodes connected to the surface of a metal, it will tend to flow in a thin layer close to the surface. This current must also follow the profile of a surface breaking crack. This will result in a voltage drop across the crack that can be measured by a suitable probe. The voltage drop is proportional to the depth of the crack and the current in the test-piece. A comparison of the voltage drop across a crack and across a similar uncracked (reference) area will enable an assessment of the crack depth to be made. ACFM The alternating current field measurement (ACFM) is a technique developed by Technical Software Consultants Ltd for underwater use following theoretical studies at UCL. The method has been derived from the ACPD (alternating current potential drop) technique (4,5). The surface conduction current, normally introduced into a component for ACPD, produces a magnetic field in the free space above the metal surface. ACFM perturbations in a uniform magnetic field can be detected with coils parallel or perpendicular to the field or perpendicular to the surface. No electrical contact is required between probe and component, thus making the technique suitable for partially cleaned and coated components. Eddy current methods Eddy current defect detection is based on the principles of electromagnetic induction and is concerned with the interaction of defects in metallic components with the magnetic field generated by a coil carrying an alternating current. When an eddy current inspection probe carrying an alternating current is placed close to or on the surface of a conductor (such as steel) eddy currents are induced in the conductor material due to the alternating flux produced by the coil. The induced eddy currents in turn produce an alternating magnetic flux which opposes the field produced by the current-carrying coil; this effect is detected as a change in the electrical impedance of the coil which can be measured electronically. Alternatively, the effect of the flux produced by the eddy current is detected by monitoring the voltage induced in a second coil similar to the excitation coil. The magnitude of the eddy current (and hence of the response of the instruments) will be affected by cracking, surface pitting, inclusions and micro-structure i.e. all discontinuities.
3.4.3 Radiographic techniques (RT) RT is probably the oldest method for weld inspections. Using a source and a film, a permanent record of defects in a weld or in parent material is obtained. Primarily voluminous defects are detected using RT. Special precautions are required to protect inspectors from radiation hazards. Furthermore, the required strength of the source depends on the wall thickness.
3.4.4 UT and associated methods UT (ultrasonic technique) represents a variety of methods where a high frequency pulse is transmitted and reflections subsequently recorded. The reflected signal is presented

- 9 -
on a cathodic ray screen and records any deviations in the material, either through back wall reflections or from reflections of buried or surface flaws. UT Ultrasonic techniques are well known and there are many publications on this subject. The variations are also large in terms of probe angles frequencies and more recently on DAC level to be used. DAC stands for distance amplitude correction that is well explained in Ref. 3. Historically a 50% DAC level is used but both PISC and Nordtest found substantial improvement for a 20% DAC level. No further improvement for 10% DAC level has been found. UT is a good method to detect crack like defects but it is a disadvantage that for manual systems no permanent electronic or photographic record is given for retention. TOFD The time-of-flight diffraction technique (TOFD) is an ultrasonic technique and relies on the measurement of signal time differences between known paths and those of defects. In the past the method was only used for the library crack characterisation but more recently, through advances in PC computing and new software, it is rapidly extending its field of application (6). TOFD is particularly suitable for measuring the depth of a defect in excess of 5mm although some more recent developments reduce this depth. A permanent record of an inspected weld can be obtained and as such it is a serious competitor for RT, particularly for thicker sections. UCW The ultrasonic creeping wave (UCW) technique operates by using the refracted compression wave from an angled beam ultrasonic transducer to obtain a reflection from a surface crack (7). The creeping wave probes are typically 4 MHz twin crystal probes and can only be used at short ranges. The compression wave is transmitted just below the surface of the material under test. For weld inspection it is used to detect cracks in the weld toe.
3.4.5 Other methods Two other methods are addressed in this report, namely acoustic emission and flooded member detected. These are described in some detail in Section 6.
3.5 Statistics of POD/POS In Table 1 various definitions used in NDE assessments are presented. PISC-II (25) is particularly strong in providing precise definitions. The definitions distinguish between: �� defect detection per team or by the group �� the selection of defects: all defects or rejectable defects
- 10 -
�� acceptance and rejection of defects. Particular attention will be given to POD (probability of detection) as a function of flaw size (length or depth) or CRF or CRP (correct rejection frequency or probability). The word ‘frequency’ is used to reflect the performance of individual teams or procedures whereas ‘probability’ is used to reflect the performance of all teams. The term ‘rate’ is used to overcome the distinction between ‘team’ or ‘teams’. A suitable method of presentation is the ‘correct rejection rate’ (CRR) versus ‘false call rate in rejection’ (FCRR) together with the area of good performance determined by: �� good performance: CRR = 80% and FCRR = 20%
3.5.1 POD POD stand for probability of detection. Yet there is some difference in opinion in the industry as to which POD to use. In ICON and TIP all defects are accounted for whereas PISC concentrates mainly on rejectable defects. This latter criterion is preferred because the missing of rejectable defects provides direct information on unacceptable workmanship whereas the missing of acceptable defects does not provide that information. The differences between these two representations can be quite significant. Therefore it has been decided that the presentation of results in the ROC diagram is for rejectable defects when PISC and NIL data are involved, while for ICON and TIP the norm will be at 1mm deep defects. Otherwise the performance for the 0 - 1mm deep defects appear to characterise the performance, which is incorrect. For the POD curves reference is made to the UCL underwater inspection review report OTN 96 179 (40) and to Nordtest (32). The computerised ICON database allows the printing of POD curves; however, the format of these prints is not ideal and therefore it has been decided to use the POD curves given in Ref. 44 instead. A more crucial element is the number of cracks in the database with which POD curves can reliably be established: 500 were used in Nordtest, 90 in UCL and in many cases 25 in ICON. a. POD with 95% confidence In the past at UCL (40) there was a high emphasis on POD curves with a 95% confidence level. This term is no longer found in the ICON and TIP reports apparently because the database was, in most cases, too small to give realistic answers. The POD curves for UCL are reported in Appendix D and in Figures 11 & 12 using these curves with confidence levels as well. b. On depth or lengths There is a choice in the ICON database to use either lengths or depths as the governing criterion. Although lengths are easier to measure it is more important that deep cracks are found with a high degree of accuracy. Therefore depth will be used primarily as the governing parameter. TIP (45,46) is very useful in offering pictorial diagrams of all the major defects.

- 11 -
c. Defect characterisation (B1 or PD6493) In the ICON database information on surface breaking defects is given either under B1 or PD 6493:1991 (8). The B1 classification reflects the dominant crack in the weld region which is separated from all other defects by 30°, or by 50 or 100mm, whereas under PD6493 adjacent cracks are combined if the separation between two indications is less than the individual lengths of these indications (see Figure 4.2). Since the depth will be used in most of the comparisons there is apparently little distinction in the results whichever criterion in adopted.
3.5.2 POS POS stands for the probability of sizing or the correct sizing of a defect for acceptance/rejection. Although this term is often used it will reflect, in general, the accuracy of estimating the size of a defect. The following information with regards to POS for surface breaking defects will be used: On lengths: The results obtained in OTN 96 179 (40) are used for length
comparisons. On depth: the ACPD calibration curve has been derived in OTN 96 179 (40) using
the information of Ref. 9. In PISC-III sizing has been addressed as well; the efforts are quite substantial; the results, as given in Figure 5, are discussed in Section 5.2.
3.5.3 ROC ROC stands for Response Operator Curve or Characteristics. These parameters are used when the information from a large number of NDE trials is presented in a diagram with the following axes: - horizontal: FCRR = number of spurious rejectable indications
total number of rejectable defects
- vertical: CRR = number of rejectable defects foundtotal number of rejectable defects
The ROC-characteristics provides a single point in the diagram with the above axes. It provides an excellent means to compare various methods when the same database has been used. Examples of this presentation are given in various figures. A diagram of this type will be called a ROC-diagram. A ROC-curve is a possible means to reflect the operator performance: in addition to each finding of a defect the operator has to indicate his confidence that the information is correct. Through some manipulation, the findings of a particular operator can be presented by a curve in this diagram. This method has received a significant amount of attention under NIL (35) but its basis seems to be rather subjective. Therefore no further attention will be given to the response operator curves.

- 12 -
The ROC characteristic does not provide an absolute means for comparison: for example no information on the database itself is provided. Possible criteria for the soundness of the database are: distribution of defects and relevance of the defects.
3.6 Codes and guidance In order to check the significance of the POD of the defects it is recommended to compare the size of these defects with the accepted standards for defect assessment. For that purpose an overview has been made in the form of a table with a column for each individual code and the rows for the types of defects. The codes used to develop Table 2 are: �� two Norwegian codes (NORSOK (11) and DnV (12) for offshore structures) �� two Dutch codes (for pressure vessels) (13) �� two UK codes (EEMUA-158 (14) for offshore structures and BS5500 for pressure
vessels) �� the ASME code for boiler and pressure vessels Section VIII (10). The codes distinguish between inspection for surface defects, using MPI or dye penetrant, and for buried defects employing radiographic and ultrasonic examination. Hence electromagnetic methods (EC or ACFM) are not yet incorporated. The types of defects are: �� porosity and slag inclusions �� incomplete penetration and lack of fusion �� cracks From this table it can be concluded that it is important not only to find the defect, to determine its size but also to characterise the defect. It is here where the inspector’s expertise is of prime importance. Secondly, it is apparent from this table that crack like defects are considered unacceptable under almost all conditions.
- 13 -
4. Six major projects Six major projects have been identified as providing suitable data for this current exercise. These projects are, approximately in historic order, PISC, NORDTEST, NIL, UCL, ICON and TIP. In this chapter these projects will be summarised together with their aims in an abbreviated form. More complete reviews are given in Appendices A-F. A summary of the major achievements, particularly those of interest with regards to POS/POD, is given in Section 5.
4.1 PISC II & III PISC is an acronym for Programme for Inspection of Steel Components. A detailed review of this set of project objectives and achievements can be found in Appendix A. PISC-II was set up to examine in more detail which techniques could provide the desired level of capability in detection and sizing of defects in nuclear pressure vessel components. The work concentrated on RRT (Round Robin Testing) of four thick plates of some 250mm thickness, one curved and two with a nozzle. The results of PISC-II are well reported (25). Some of the comments in the final report identify certain limitations, such as (a) the ratio between manual and automated inspection, (b) the difference between ISI (in-service inspection) and in the tests; and (c) the regular presence of satellite defects. The results had an important effect on defect acceptance to ASME. PISC-III (26) is a follow up of PISC-II to confirm the conclusions under more realistic conditions and to address many other components. Most of the attention focused on typical nuclear reactor components as highlighted by the major parts of the project: �� full scale vessel tests for defect sizing (27) �� defect in dissimilar metal weldments (carbon/stainless steel) in safe end component �� UT in austenitic stainless steel (difficult to inspect using UT) �� IGSCC and IGA in steam generator tubes �� mathematical modelling of NDE/flaw detection �� human reliability.
4.2 Nordtest The Nordtest NDE programme took place from 1984-1990 in the four Scandinavian countries (28-33). A detailed review of this set of programmes can be found in Appendix B. Nordtest consisted of four main parts dealing with: �� NDE systematics (inspection models, important parameters, FFP, case studies)

- 14 -
�� NDE reliability (MPI, penetrant, Eddy current, UT, RT and reliability factors) �� Sizing of defects (testing and evaluating techniques) �� NDE data processing Much information has been developed and various results were presented around 1990 and published as IIW documents (28-31). Other references (32,33) presented the Nordtest data on surface breaking defects in another format and this information has also been used. A high degree of repetition has been chosen for this project as shown in Table 2 for surface breaking defects. In summary, some 300 defects and about 1000 readings were used to develop PODs for MPI and dye penetrants in the 1-5mm defect depth range. The number of Nordtest samples for surface breaking defects is shown in the following table. METHOD MPI PENETRANT MATERIAL STEEL STEEL ALUMINIUM STAINLESS
STEEL NO OF SPECIMENS 67 6 33 33 NO OF DEFECTS 294 31 151 190 TOTAL NO OF INSPECTIONS
977 83 505 499
The advantage of Nordtest is that in this way POD results have been obtained with a better degree of accuracy.
4.3 NIL NIL is the acronym for Nederlands Instituut voor Lastechniek (Dutch Institute of Welding). In the field of NDE it appears that NIL acts as a moderator on the Dutch NDE scene: they provide an organisation and a framework but no expertise in this area. Useful material in a number of areas has been obtained from NIL. The four report titles (34-37) on their main JIP projects in the area of NDE can be summarised as follows. �� Evaluation of some NDE methods for welded connections with defects, �� Optimisation of manual ultrasonic investigations for welded connections with
defects, �� Advanced flaw size measurement in practice, �� Non destructive testing of thin plates. These titles provide a fair reflection on the contents. A detailed review of this set of programmes can be found in Appendix C. Particularly the thin plate project report (37) is useful because of the simplicity of some of the configurations and still deviations from 100% POD were found consistently. More detailed information on the thin-plate project has been found in Ref. 38.

- 15 -
The size of these projects is reflected in the following numbers. The manual UT investigation comprised some 700 defects of which approximately 80% were non-acceptable; 10 inspection teams were employed. Similarly, the thin plate project comprised 240 defects, inspected using nine methods and three different operators each. Finally NIL acts also as the secretariat for IIW (International Institute of Welding) and some information on IIW Workgroup V (15) and on Nordtest was obtained in this way (Section 4.2).
4.4 UCL underwater inspection In the period 1986-1991 UCL (University College London) was heavily involved in NDE for underwater applications. Therefore this UCL work on underwater inspection can be considered as an important predecessor to ICON. More specifically, the Non-Destructive Evaluation (NDE) Centre at UCL has been instrumental in providing data on the probability of detection and of sizing of fatigue cracks using a variety of inspection techniques, which are in historic order: magnetic particle detection, eddy current systems, ultrasonic creeping wave technique and alternating current field measurement. The main recent activities of UCL were on underwater inspection (40) and on topsides inspection (see Section 4.6). A detailed review of this UCL underwater inspection programme can be found in Appendix D. Besides MPI, the review report (40) addresses five other methods (ACFM, three eddy current systems and the ultrasonic creeping wave method). The database, alternatively named the defect library, contained approximately 90 combined B1 type surface breaking fatigue defects in tubular joints. The emphasis of the UCL work was on uncoated joints but also some data on coated nodes have been made available. Much of the ideas on the library of nodal joints and on crack relevance as used under ICON were developed here.
4.5 ICON ICON (InterCalibration of Offshore Non-destructive examination) collected a vast amount of information on NDE of tubular joints in a marine environment (41-44). The emphasis was on realistic laboratory trials but an important part of the project was carried out offshore from the DSV (diving support vessel) Stadive. Many variables both in equipment and in the types of test specimens have been tested in order to establish POD/POS for surface breaking, crack-like defects. A detailed review of this programme can be found in Appendix E. ICON addresses many different aspects on underwater inspection. The main part of the work was to test some eight NDE methods on four different types of samples, using both CAT (= computer assisted telemanipulator) and manual systems (see the table on page E1 of Appendix E for details). The NDE methods were based on MPI, ACFM and eddy current and the samples were tubular joints, welds between different metals, (corroded) tee butt welds and coated specimens. For many investigations only a sub-set

- 16 -
of the UCL model library of nodes was used. Hence only in a few cases the number of datapoints is more than 30. The final report contains much of the concluding results in the form of graphs of this project. An ICON database is also provided which supplies a great deal of information on equipment selection.
4.6 TIP TIP (Topside Inspection Project) was also executed via UCL (45,46). The components inspected for TIP were in line with details that can be found in offshore topsides structural steel, both in the unprotected and the coated condition. A detailed review of this programme can be found in Appendix F. The programme consisted of the following parts: �� various forms of welded plates with realistic rat holes subject to fatigue �� aluminium sprayed and painted components for testing EM methods �� butt welds and T-butt welds using topsides inspection methods. The programme results are based on the inspection findings of four methods (MPI, ACFM and two eddy current systems) and three operators each.

- 17 -
5. Major findings of each project
5.1 Methods of presentation From the review of the various projects a number of forms of representation for POD/POS were found. They can be divided into two categories, namely: �� numerical representation �� graphical representation Both methods will be employed because they can serve different purposes. Secondly attention should be given to definitions. The most important one is whether or not all defects of the crack library are considered or only the rejectable defects. The two sets of terms for the performance diagrams are: �� for the vertical axis: - POD or CRR - probability of detection or correct rejection rate �� for the horizontal axis: - FCRD or FCRR - false call rate in detection or false call rate of rejectable
defects
5.2 Principal findings for each project Rather than presenting all the information in a comprehensive fashion, in this section the principal results obtained in each project will be summarised. The main observations are based on the figures that can be found at the end of this report
5.2.1 PISC II & III The performance in sizing is best illustrated in Figure 5.1. It showed a substantial variation although the figure is composed from results by the best teams using the best methods in a relatively simple structure. Also it is shown in Figure 5.1 that the results for advanced methods and industry methods for crack sizing were not too dissimilar. Furthermore, it is shown that Figure 5.2, with results on all defects, is quite different from Figure 5.3, containing results on rejectable defects only. These figures have been derived using 22 teams. An overall conclusion of PISC III is that, based on ASME, the average detection rate is 60% and the average rejection rate is 70%. This should be compared with the good performance rejection rate of 80%. One of the organisations interviewed for this study for the HSE used a simple expression to characterise performance, namely that a CRR < 50% is poor and >70% is suspect. This simple expression is clearly confirmed by the findings in Figure 5.2.

- 18 -
Much more comprehensive information on PISC-II and PISC-III findings can be found in Appendix A.
5.2.2 Nordtest In Figure 6 major findings on buried defects in the Nordtest programme are summarised. The conclusions of these three figures are: �� the substantial scatter in ultrasonic echo amplitude, independent on weld defect
height �� the large number of datapoints used �� the POD for U20 for defects > 7mm in height is > 90% �� the comparison in performance in detecting planar defects using UT and RT Figure 7.1 contains the POD curves for RT for the different types of defects; this figure confirms the well-known conclusions that porosity and slag inclusions are well recorded using RT, that lack of fusion and cracks are poorly detected, while results on incomplete penetration are in between. Also the Nordtest results on common methods such as MPI and dye penetrant testing as inspection methods for surface breaking flaws should be mentioned here (see Figure 7.2). Note that the MPI method is the method used for onshore applications and that these POD curves are based on over 300 crack specimens. The three parts illustrate: �� the POD for linear and surface flaws (together and separately) �� the effects of inspectors’ competence (see Section 6.1) �� only for flaws deeper than 4mm can a POD > 80% be expected for both methods. Much more comprehensive information on Nordtest findings can be found in Appendix B.
5.2.3 NIL Various observations can be made in the NIL project reports (34-37). The conclusions are supported by Figures 8-9. The conclusions are: �� the large variation in performance of 10 individual UT inspectors is demonstrated �� for TOFD a defect sizing accuracy of 1.5mm (RMS) was measured. �� the location performance in thin plates is ± 10mm (RMS) �� the classification planar versus non-planar for thin plates (6-12mm) is relatively
poor �� there is a marked difference in the diagrams for all defects and rejectable defects. �� the average POD for thin plates (6-12mm) for all methods was of the order of 50% Much more comprehensive information on NIL findings can be found in Appendix C.

- 19 -
5.2.4 UCL
The emphasis of this UCL work (40) was on the development of reliable POD curves and the size of the database was an area of prime concern. The tubular joint library, developed for this purpose, is shown in Figure 10; this library has also been used for ICON. Indeed with approximately 100 B1 defects a reasonably accurate POD curve can be developed. Some examples are given in Figures 11-12. �� it is understood that the UCL database is part of the ICON database �� 90 points are considered adequate. �� the UCL laboratory trials can be put in an ROC diagram; the diagram shows with
one exception a high POD with a substantial variation in false calls. The POD curves in Figures 11-12 are shown for a variety of methods; all these curves are based on a set of some 90 datapoints. Therefore it was considered meaningful, in line with earlier UCL reports, to include the 90% confidence curve as well (see Ref. 40, Appendix B for details). The length accuracy was also determined (40). It can be summarised by the following two statements: �� the length accuracy for MPI and UCW is 20% (RMS) �� the length accuracy for EC and ACFM is 40% (RMS). It was also found that the POD using ACFM and the Harwell eddy current system on coated nodes, with a 1-2mm epoxy coating, was quite similar to the POD using these methods on uncoated nodes. This observation is based on a sample of 20 joints with defects ranging from 2-9mm in depth. The overall conclusion was that, with one exception, MPI, EC, ACFM and UCW can all be used for weld toe crack detection underwater. The exception demonstrates the value of an inspection performance trial. This is confirmed by the performance shown in Figure 13. Much more comprehensive information on UCL findings can be found in Appendix D.
5.2.5 ICON ICON was a large project with variations in many parameters; some 32 different systems have been evaluated. Some of the major findings are given in Figures 14-16 from which the following conclusions can be drawn: �� the various MPI trials show a high POD but a large variety in false calls (Figure 14) �� the non-MPI systems have a performance close to the MPI results in terms of ROC �� the trials at sea show a large variety of false calls; no trend has been observed. �� these results are confirmed by the diagrams taken from Ref. 44 (see Figure 15) �� Figure 16 proves the validity of ACPD and ACFM for crack depth determination

- 20 -
Also the following observation can be made: whenever trials were done at different locations the variation in POD is small but the variation in FCR is large. In quite a number of cases the POD for defects deeper than 1mm is close to 100% (Figure 14). In that case little additional information is provided by the POD curve as determined in Figure 15. Finally, ICON was not always able to comply with the sound UCL rule of having a large number of cracks for establishing POD curves. For example, in some of the cases in Figure 15 the POD curves have been established while the number of defects >1mm deep was no more than 15. The following three overall conclusions can be found in the final report (42): �� CAT deployed techniques using precise tracking (single sensor) for tubulars
(450mm max diameter) and 'pick and place' (array) for plates have been assessed and been shown to be practicable for use offshore deployed from an ROV.
�� For manual (diver) crack detection it has been possible to show that seven systems are suitable for of tubulars. These are, in alphabetical order, ACFM, Cx EC, Lizard EC, MPI (Coil), MPI(Yoke), UCW. The ACFM array had successful laboratory trials but no results were obtained in sea trials due to accidental damage to the equipment.
�� For manual (diver) crack detection on tubulars, tee butts, metal difference, corroded tee butts and coated tubulars ACFM, Cx EC and Lizard EC gave good crack detection performance. The systems also had a low false call rate although considerable variation in operators was observed.
It is also noted that the information on ROC diagrams in Ref. 42 is based on all defects rather than on defects of a depth >1mm. The consequence of this is that the information in the range of 0-1mm defect depth has a substantial detrimental effect on the POD of most methods. Therefore the ROC diagrams in this report have been adjusted for that effect. Much more comprehensive information on ICON findings can be found in Appendix E.
5.2.6 TIP The topsides inspection project (TIP) addressed a number of different aspects. Some of the results are illustrated by the ROC diagrams Figure 17 and 18 developed from the data in Ref. 45 and 46. In addition, the TIP database was used to develop POD curves for the defects in the butt and T-butt welds; the results are given in Figure 19. The performance diagrams are particularly useful for direct comparison but in some cases unexpected results require an explanation. The following conclusions have been derived: �� the poor performance on MPI for the ICON specimens seems to be the result of the
land-based technique together with the distribution of defects in the library �� the EC and ACFM systems performed well for all specimens but there is large
variation in false calls

- 21 -
�� EC and ACFM confirmed the good performance for crack detection in coated specimens.
Other results found in the TIP final reports (45,46) are: �� the electronic recording of EM methods is an advantage over MPI; �� the variations between operators tended to be greater than the difference between the
systems; �� two large defects were not detected with ACFM and one of the EC systems but
detected with the other EC system; these defects were 3.0 and 4.5mm deep; �� with the exception of the aluminium sprayed specimens it was found for EC that the
results for coated and uncoated specimens were similar; �� the results on the small tubular joints using EC were also considered successful; �� most of the spurious indications (or false calls) were less than 20mm long. Much more comprehensive information on TIP findings can be found in Appendix F.
5.3 Overview of principal findings In Section 3 the various inspection methods and in Section 4 the main programmes in the field of NDT for POD/POS have been discussed. In this Section 5 the principal findings of these programmes are given. The findings of the NDE methods in the six major NDE programmes are also summarised in Table 3. In correspondence with Section 3.4 the NDE methods have been divided into methods for surface defect inspection (MPI and DP), methods based on electromagnetic principles (ACPD, ACFM and eddy current methods), radiography (RT) and ultrasonic techniques (UT, TOFD and UCW). The emphasis in Table 3 is on POD (probability of detection) and FCR (false call rate). These findings have been adjusted, as in the associated figures, for insignificant defects. Secondly an effort is made to highlight the level of the average POD and FCR with regards to good performance, as defined by an average POD = 80% and an FCR = 20%. Also, when data are available in a suitable format, the defect size corresponding with a POD of 80% is given as well. Finally, summaries of results in graphical form can be found in Figures 1-3.
5.4 Differences between surface flaws and buried flaws In the process of evaluating the various projects it was noted that there are some marked differences in the description and performance with regards to surface flaws and buried defects. The following is only a short-list of these differences: �� buried crack-like defects are rejectable under many circumstances; �� surface breaking cracks can much more easily be repaired; �� shallow surface cracks can easily be removed through light grinding;

- 22 -
�� the sizing of buried defects, also of volumetric defects, is critical.
5.5 Collection of general observations During the review of the various projects, statements were found which are worthwhile retaining for future reference: �� there is a large variation in performance between teams of inspectors (see Figure
8.1); �� 20% DAC provides a better performance than 50% DAC while 10% DAC does not
improve the results; �� NDE must be used as one of several approaches used in parallel to reduce the
overall probability of failure; �� if two independent NDE systems are used the POD increases substantially as
reflected by the following equation: PODcombined = 1 - (1 - POD1) x (1 - POD2); �� the dead zone in TOFD can be reduced through further computer filtering; �� interbead cracks developed by fatigue occur mostly together with weld toe cracks; �� the fatigue crack aspect ratio ranges from 1:6 to 1:40 with a mean of 1:12. The diagram of Figure 20 provides an overview of the defect detection probability against defect through wall size for some typical defects using UT NDE. The diagram is applicable to nuclear pressure vessels. The distinction is made between smooth planar defects with sharp crack edges, hybrid defects and volumetric defects. It illustrates in another way that smooth crack like defects are difficult to detect unless they are quite substantial in size.

- 23 -
6. Other aspects This section contains a number of miscellaneous topics, namely “human factors”, “flooded member detection”, “acoustic emission”, “pipelines” “workmanship” and “potential areas for future developments”.
6.1 Human factors Human factors are a recognised aspect for all manual inspection methods: but even mechanised UT systems require interpretation and thus also here operator performance should be regularly checked. In each of the projects the effects of human factors is addressed albeit in a variety of ways. The following procedures were considered. �� the inspection of the same defect by many teams (PISC-III, ICON) �� a dedicated study to check the various inspection parameters separately (PISC-III) �� the same defects inspected by three inspectors from three different organisations
(TIP) �� the development of response operator curves (NIL) �� the competition between manual and mechanised inspection tools �� the POD for inspectors of different certification level (Nordtest, see Figure 7.2(c)). PISC-III pays particularly significant attention to human factors (see Appendix A, Action 8). The subject is studied through the detailed monitoring of inspectors in laboratory based, yet realistic, inspection environments. The following are some typical comments: �� the variability of calibration was acceptably small; �� flaw detection frequency (FDF) varied between 65% to 100% between inspectors; �� variability for single inspectors was also due to tiredness (a factor 2 in FDF is
quoted); �� there was initial adjustment but also long shifts had a marked effect; �� also there were a significant number of reporting errors (left for right, etc.); �� typical errors were poor ultrasonic coupling and/or incomplete scanning. The above comments are for UT inspection but, most likely, they apply to other inspection systems as well. At AEA progress is being made to develop computer models of the inspection process. For example, human reliability models (16) can be used to correct predicted POD values for human error using well reported POD studies, such as Nordtest. Also the computer and its screen can be used for the development of training tools.

- 24 -
6.2 Flooded member detection Flooded member detection (FMD) is a technique finding rapid introduction with many North Sea offshore operators of steel offshore platforms. Much information has been obtained from an FMD conference in Aberdeen early 1997; details of this conference can be found in Appendix G. The method employs a yoke with a transmitter and a receiver on either side of a tubular. The received signal is compared with the calculated signal for an empty and a water-filled tubular of the same diameter and wall thickness. This FMD method in terms of POD (detection of (partial) flooding) was investigated as one of the topics in ICON: both UT and RT techniques have been addressed. RT is used in combination with an ROV because of potential radiation hazard whereas UT can be used manually. For UT the following results can be found (42): only when a tubular was for less than 50% filled with water the POD was 70%. For higher levels of water, using a sample of approximately 10 tests under simplified laboratory conditions, the POD was 100% although with some variation in the detected water level (See Table H1 for details). For RT the POD was invariably 100% and also the actual level of the water in the tubular was found. However, because of the ROV a locally complex geometry may prohibit the use of the RT method. The main problem area with FMD is that not all through thickness cracks lead to water filling of a tubular: the tube can already be filled with water or the pressure is too low to cause the water to flow. Yet through thickness defects have been found which could have been missed with other methods.
6.3 Acoustic emission Acoustic emission (AE) is a well-known phenomenon through which crack growth can be measured (3,17). However, in the field of crack detection and sizing of cracks the methods based on AE are of an ad-hoc nature only. The first phenomenon that should be kept in mind is that in order to generate EA at a measurable level the crack growth rate has to exceed a minimum crack growth rate. A very special application was found in NIL (34) where AE was used during welding to check that proper weld defects were generated. Another application of AE is the monitoring of a pressure vessel during its pressure testing: here the location and size of subsurface defects can be identified through the use of an array of receivers using methods similar to those used in geophysics. In summary AE can primarily be used for monitoring a known crack or defect but it is not suitable for defect detection after fabrication of a component. Therefore it is not surprising that no information with regards to POD has been found.

- 25 -
6.4 Pipelines Not only in the fabrication of offshore structures and pressure vessels but also in the construction of onshore and offshore pipelines there is a high emphasis on inspection. Historically, RT was used exclusively because of its known record and because a hard-copy proof of the inspection findings is obtained for future reference. With the development of stronger, PC based inspection techniques, such as TOFD (18), the emphasis is gradually changing towards these UT based, mechanised inspection systems (19). The advantages of a pipeline are that a pipeline is a simple structure and that there is a high degree of repetition, making it worthwhile to develop ad-hoc tools and use duplicate systems. In that case the improvement in defect detection as reflected in the equation in Section 5.4 applies. Mechanised UT has replaced RT on onshore pipelines in certain geographical areas, e.g. Canada and the Netherlands, since about ten years ago. It appeared that mechanised UT had all the advantages of RT: it is time and cost effective and avoids the presence of a radiation hazard. Offshore a certain level of resistance has to be overcome. Due to the expensive lay-barge there is some reluctance to make the step towards a new system. Yet in 1996 the first offshore pipeline was built using mechanised UT (20). The problem with providing POD for mechanised UT is that no data on POD and FCR are available in the public domain. Secondly there are rapid developments making it necessary to go for an ad-hoc approval of the mechanised inspection system. Mechanised UT was part of the last NIL project (See Figures 8.2-9.3) from which it can be concluded that the POD and FCR of rejectable defects are favourable for a mechanised system but that the characterisation (planar or non-planar) is lower than with other methods. On the other hand pipeline project results (21) on root defect evaluation using UT are worth mentioning.
6.5 Workmanship In a number of publications and discussions the term ‘workmanship’ is used. This term is quite helpful in understanding and justifying the classical approach to the structural design of highly stressed structures. For example, in one of the NIL reports the statement was found: inspection is not only to find defects but, more importantly, to signal deviations from workmanship levels. In short the term ‘good workmanship’ can be used whenever inspection is carried out and the defect distribution as found using this inspection is in accordance with the code, e.g. ASME. It is well recognised that the POD for rejectable defects is well below 100% and hence even though the structure complies with the code, because of the inspection results, it does not comply in theory. Secondly, a strength analysis code is used to design the structure under consideration. Application of the code is subject to the condition that the structure will be manufactured using ‘good workmanship’, again without precisely defining what is implied by such an assumption.

- 26 -
The two components, design and fabrication/inspection, are brought together in the pressure test and the operation of the structure and these two parts: the test and the operation, provide the proof that ‘good workmanship’ is acceptable in practice. With new methods more defects are found, i.e. the POD is significantly higher. Yet, from a ‘good workmanship’ point of view, this extra may not be necessary. Therefore it could be justified that, for methods with a high POD and good defect sizing, the defect reject criterion could be somewhat relaxed. It is in this field that advanced defect assessment procedures should assist in the future.
6.6 Potential areas for future developments In order to identify areas for potential future developments in POD/POS it is important to highlight the place of NDT in the overall process of arriving at safe, welded structures. The elements to arrive at safe structures can be put in the following three categories (Table 4): �� design and design codes �� welding and inspection �� defect assessment The following eight potential areas for future developments have been identified (see Appendix H for supporting information): 1. More information should be collected on the number of repairs per metre of
welding. 2. More information on the economics of inspection should be gathered and analysed. 3. Analysis should be carried out to determine the economic advantage in increasing
the correct rejection ratio (CRR) from 60% to 80%.
4. More fundamental work is required in the area of MPI to explain the large difference in POD between onshore and offshore practices.
5. The development of TOFD for the sizing of defects in complex geometries should be stimulated.
6. It is necessary to develop a rational basis for the defect size for defect assessment. 7. There should be more full scale tests to support and give direction to defect
assessment. 8. Historic data on older structures can also be used to calibrate defect assessment
procedures. The topic addressed under items 7-8 of full scale testing and re-assessment of older structures falls outside the scope of the present study. However, it seems to be the only rational basis to ensure that a higher performance in inspection is cost effective and fit-for-purpose. The full scale testing of specimens with known defects has been applied before; for example, in Ref. 22, tubular joints with fatigue cracks were tested to destruction. It has

- 27 -
been demonstrated in these tests that for good quality steel the detrimental effect of defects can be calculated by considering the net effective area only. Hence the effect of small defects on the ultimate capacity of tubular joints is small. Secondly, in the NIL project it was mentioned that it is very well possible to weld structures with pre-determined welding defects. Also JRC-Petten is able to fabricate surface defects of known shape through spark-erosion. Ref. 23 addresses this topic of full scale testing of pipeline structures and the consequences of given Charpy and CTOD values. A similar, more general approach is proposed in Ref. 24.

- 28 -
7. References General 1. Crutzen, S. and Frank, F., SINTAP: Final report on the NDE
effectiveness (draft of 4/8/97). 2. MTD 89/104, Underwater inspection of steel offshore installations:
implementation of a new approach, MTD Publication 89/104 (London), 1989 3. Halmshaw, R., Introduction to the non-destructive testing of welded
joints, 2nd edition, Abington Publishing, Cambridge, ISBN 1 85573 314 5, 1996.
4. Dover, W.D. and Collins, R., Recent advances in the detection and sizing of cracks using alternating current field measurements (ACFM), British Journal of NDT, Vol. 22, No 6, Nov. 1980.
5. Dover, W.D., Collins, R. And Michael, D.H., Review of developments in ACPD and ACFM, British Journal of NDT, Vol.33, No 3, 1991
6. Charlesworth, J.P. and Temple, J.A.G., Engineering applications of ultrasonic time-of-flight diffraction, Research Studies Press, ISBN 0 86380 085 8, 1989.
7. Smith, P.H., Practical application of creeping waves, British Journal of NDT, Vol. 30, No.3, May 1988
8. BSI-PD6493:1991, Guidance on methods for assessing flaws in fusion welded joints, BSI, 1991.
9. OTH 87-263, Study of calibration procedures for accurately quantifying defect sizes in welded tubular joints, HMSO (London), OTH 87-263, 1987
10. ASME 1995 Section XI Appendix VIII. 11. NORSOK standard M-101,Structural steel fabrication, Rev. 3, Sept.
1997 12. DnV code for mobile offshore units, Pt.3 Ch.1 Sec.10, July 1996. 13. Rules for pressure vessels - Assessment of radiographs, T 0111/82-12,
Ultrasonic weld examination, T 0117/82-12, Stoomwezen, the Netherlands. 14. EEMUA 158, Construction specification for fixed offshore structures in
the North Sea, The Engineering Equipment and Materials Users Association, London, Rev. 1994.
15. Siewer, T.A., IIW Commission V, Quality control and quality assurance of welded products, Annual Report 1996/97, IIW Doc. V-1078-97.
16. Wall, M., Modelling of NDT reliability and applying corrections for human factors, European-American workshop - Determination of reliability and validation methods of NDE, Berlin, June 1997.
17. Acoustic Emission, Non-destructive testing handbook 2nd Ed. Vol. 5. Am. Soc. for Non-Destructive Testing, ISBN 0-931403-02-2, 1987.
18. Dijkstra,, F.H., DeRaad, J.A. and Bouma, T., TOFD and acceptance criteria: a perfect team, 14th World Conference on NDT, New Delhi, 1996.
19. DeRaad, J.A. and Dijkstra, F.H., Mechanised UT on girth welds during pipeline construction, 9th Symp. on pipeline research, organised by PRCI, Texas, Oct. 1996.
20. Snel, C., Mechanised pipeline inspection offshore: the first time - Microscan successfully employed (in Dutch), Lastechniek, June 1996.

- 29 -
21. AGA-PRCI, Evaluation of ultrasonic inspection techniques for the root region of girth welds, Report for project AGA PR-220-9123, AGA-PRCI, 1996 (Purchase price US$ 500).
22. Stacey, A., Sharp, J.V. and Nichols, N.W., Static strength assessment of cracked tubular joints, Proc. 15th OMAE Conf., Vol.3, p.211, 1996.
23. Denys, R.M., Strength and toughness requirements for girth welds in overloaded pipelines, Proc. Pipeline Technology, Vol. II, Ed. R. Denys, Elsevier, p.513-521, 1995.
24. Visser W., Potential contradictions in the fracture assessment of steel tubular joints, OMAE-1998 (to be published).
Appendix A PISC-II and III 25. PISC-II: Nichols, R.W. and Crutzen, S., Ultrasonic inspection of heavy
section steel components, The PISC II final report, Elsevier Applied Science, Barking UK, ISBN 1-85166-155-7, 1988.
26. PISC-III: Lessons learned from PISC-III, Report No EUR 16366 EN, Draft, 1/2/96.
27. PISC-III: Evaluation of the sizing results of 12 flaws of the full scale vessel installation, PISC III report No 26 - Action 2 - Phase 1, JRC report No EUR 15371 EN, 1993.
Appendix B Nordtest 28. Førli, O., Development and optimisation of NDT for practical use -
Nordtest NDT programme - project presentation, 5e Nordiska NDT Symposiet Esbo, Finland, IIW Report Number IIW-V-967-91, 1990.
29. Førli, O., Development and optimisation of NDT for practical use - Optimal NDT efforts and use of NDT results, 5e Nordiska NDT Symposiet Esbo, Finland, IIW Report Number IIW-V-968-91, 1990.
30. Førli, O., Development and optimisation of NDT for practical use - Reliability of radiography and ultrasonic testing, 5e Nordiska NDT Symposiet Esbo, Finland, IIW Report Number IIW-V-969-91, 1990.
31. Kauppinen, P. and Sillanpää, J., Reliability of magnetic particle and liquid penetrant inspection, IIW Report Number IIW-V-970-91, 1990.
32. Kauppinen, P. and Sillanpää, J., Reliability of surface inspection techniques for pressurised components, SMIRT 11 Transactions Vol.G No G15/5, Tokyo, August 1991.
33. Kauppinen, P. and Sillanpää, J., Reliability of surface inspection techniques, Proc. 12th World Conf. on Non-Destructive Testing, Elsevier Publ. Amsterdam, 1989SMIRT 11 Transactions Vol.G No G15/5, Tokyo, August 1991.
Appendix C NIL 34. NIL, Evaluation of some non-destructive examination methods for
welded connections with defects, NIL report NDO 86-23, 1986 (in Dutch). 35. NIL, Optimisation of manual ultrasonic investigations for welded
connections with defects, NIL report NDO 90-07, 1990 (in Dutch).

- 30 -
36. NIL, Advanced flaw size measurement in practice, NIL report GF 91-04, 1991 (in Dutch).
37. NIL, Non destructive testing of thin plates, NIL report NDP 93-40, 1995. 38. NIL, NDT of thin plates - evaluation of results, NIL report NDP 93-38
Rev.1, 1995 (in Dutch). 39. NIL, NDT-Regulations, NIL Report NDP 95-85, 1995. Appendix D UCL 40. Visser, W., Dover, W.L. & Rudlin, J.R., Review of UCL underwater
inspection trials, HSE OTN 96 179, 1996. Appendix E ICON 41. Project "ICON", Final Report, Contract No OG/00098/90/FR/UK/IT,
EC*DG XVII*Programme THERMIE, Report No S.94.006.03, Issued by IFREMER, 12/94.
42. Offshore Technology Report OTN-96-150, Intercalibration of offshore NDT (ICON), Commercial in confidence PEN/S/2736, HSE, August 1996.
43. Dover, W.J. and Rudlin, J.R., Defect characterisation and classification for the ICON inspection reliability trials, Proc. 1996 OMAE, Vol. II, p.503-508, 1996.
44. Rudlin, J.R. and Dover, W.D., Performance trends for POD as measured in the ICON project, Proc. 1996 OMAE, Vol. II, p.509-513, 1996.
Appendix F TIP 45. Rudlin, J. and Austin, J., Topside inspection project: Phase I Final
report; Offshore Technology Report OTN 96 169 Nov. 1996 46. Rudlin, J. , Myers, P. and Etube, L., Topside inspection project: Phase II
Final report; Offshore Technology Report OTN 96 169 Nov. 1996 Additional reference 47. IIS/IIW-340-69, Classification of defects in metallic fusion welds with
explanation, 1969.

Tables Table 1 Definitions of terms Table 2 Overview of acceptance standards Table 3 Overview of NDT methods and the main NDT projects Table 4 Flow diagram for defect detection and assessment

In PISC-II (25) a number of definitions on POD related quantities are introduced, as summarised below:
1. Defect detection probability (DDP): DDP = nN
n = the number of teams detecting a particular defect N = the number of teams inspecting a particular zone or nozzle with the defect
2. Defect detection frequency for all flaws (DDF): DDF = dD
d = the number of defects detected D = the total number of intended defects This quantity reflects the success of individual teams or procedures on a set of defects.
3. Defect detection frequency for rejectable defects (DDFR): DDFR = dRR
dR = the number of rejectable defects detected R = the total population of rejectable defects
4. Defect detection frequency for the total number of defects (DDFT): DDFT = dTT
dT = the total number of defects detected T = the total number of all (intended and unintended) defects > 3mm in height
5. Correct rejection probability (CRP): CRP = rN
r = the number of teams detecting a defect and correctly sizing it for rejection N = the number of teams inspecting a particular zone or nozzle with the
rejectable defect
6. Correct acceptance probability (CAP): CAP = aN
a = the number of teams failing to detect or detecting a defect and correctly sizing it for acceptance N = the number of teams inspecting a particular zone or nozzle with the acceptable defect
7. Correct rejection frequency (CRF): CRF = dFR
dF = the number of defects in a group correctly rejected by a team R = the total number of rejectable defects in the group This quantity reflects the success of individual teams or procedures on a set of defects.
8. Correct acceptance frequency (CAF): CAF = dAA
dA = the number of defects in a group correctly accepted by a team A = the total number of acceptable defects in the group This quantity reflects the success of individual teams or procedures on a set of defects. Two other terms, used in this report, are:
9. Probability of detection (POD): POD = ntotalNtotal
ntotal = the total number of defects detected by all teams Ntotal = the total number of possible defects by all teams
10. False call rate (FCR): FCR = ftotalR total
= the total number of false calls Table 1 Definitions of terms
ftotal = the total number of false calls Rtotal = the total number of rejectable defects


Table 2 Simplified overview of acceptance standards in various codes
NORSOK Standard M101 (1997)
DnV-primary Rules mobile units (1996)
DnV-special Rules mobile units (1996)
Stoomwezen (NL) T0111, T0117 (1985,1994)
EEMUA-158 (Rev. 1995)
BS5500 (1995)
ASME Sect. VIII (1995)
MPI/DP surface flaws
not acceptable not accepted not accepted free of relevant linear indications
free of relevant linear indications
RT isolated porosity t/4 and 6mm t/5 and 4mm t/4 and 6mm long: length: t/3 and 20mmround: t/4
long: length: t/3 and 20mm round: t/4 and 4mm
t/4 and ˜4mm t/3 and 6mm
cluster porosity 3mm 2mm 3mm 4mm t and 12.5mm 2% of as isolated pores t/4 and 5mm
scattered porosity 20mm 20mm 25mm t/3 and 20mm 2% of as isolated pores special graphs
slag inclusion width: t/4 and 6mm length: 2t and 50mm
width: t/5 and 4mm length: 2t
width: t/4 and 6mm length: 2t
long: length: t/3 and 20mmround: diam. < t/4
long: length: t/3 and 20mm round: d < t/4 and 4mm
main butt: t/10 and 4mm other welds: t/4 and 4mm
see porosity
incomplete penetration length: t and 25mm not acceptable for full penetration welds
t and 25mm -- not acceptable any size not permitted not permitted
lack of fusion length: t and 25mm not acceptable not acceptable -- not acceptable any size not permitted not permitted
cracks not acceptable not acceptable not acceptable -- not acceptable any size not permitted not permitted
UT general if uncertain and length > 10mm and >100% then
see note on NORSOK
>100%: not acceptable imperfections which produce a response >20%
shall be investigated
porosity repair if it masks other defects
at >50% of ref. level length t/3 and 10mm
at >100% of ref. level length: t/2 and 10mm
width: t/10 or length: ˜ t/2 at >100%: t/3 and 20mm at 50-100%: 2t and 50mm
at 50-100%: if h = 3 then l = 5mm
t/3 and 20mm
slag inclusion if >100%: 2t and 50mm
long.: at 20-50%: if h < 3 then l < t
lack of fusion or incomplete penetration
at >100%: t and 25mm at 50-100%: 2t and 50mm
depending on characterisation: see cracks
depending on characterisation: see cracks
flat imperfections are acceptable in no case at all
(original text)
at >100%: unacceptable at 50-100%: t/3 and 20mm
long.: at 50-100%: if h = 3 then l = 5mm
long.: at 20-50%: if h < 3 then l < t/2
unacceptable regardless of length
cracks unacceptable regardless of size and amplitude
not acceptable at 20% of ref. level
not acceptable at 20% of ref. level
unacceptable any size not acceptable, regardless of amplitude
trans.: at 20-50%: if h < 3 then l < t/3 and 20mm
unacceptable regardless of length
root defects in single sided welding
echo exceeds ref. curve: t and 25mm
-- -- not acceptable -- --
Notes - ‘a and b’ implies ‘not exceeding a and not exceeding
b’ - the table is limited to thicknesses t > 20mm - for NORSOK UT: type of defect to be decided by supplementary NDT
- within 6mm of surface is considered a surface flaw - ‘at >100%’ implies ‘exceeding the reference curve’ - ‘at 50-100%’ (or at 20-50%) implies between 50% and 100% (or between 20% and 50%) of the ref. curve
- ‘long’ stands for longitudinal planar defect - ‘perp’ stands for perpendicular planar defect - ‘round’ stands for rounded defects


Table 3 Overview of the main NDT methods and the main NDT projects for flaw detection
PISC-III (Fig. 2) Nordtest (Fig. 3-4) NIL (Fig. 5-6) UCL (Fig.8-10) ICON (Fig. 11-12) TIP (Fig. 14-15)
MPI (magnetic particle
inspection)
-- An extensive comparison between DP and MPI was carried out. For round surface flaws (welding defects) DP was better but for linear surface flaws (fatigue) MPI is preferred.
-- MPI is used as the prime tool for crack length determination. MPI was one of the best methods for underwater crack detection. The POD for 2mm deep defects was 80% with an FCR of 50%.
MPI showed good results for POD on tubular joints with a large variation in FCR. On the other hand, for metal difference butt welds the POD was well below 50% up to defects of 5mm depth.
The MPI results on topsides components depended strongly on the type of components and the crack library. Results of POD of 80%, 60% and 30% have been reported. MPI can only be applied to bare metal components.
DP (dye
penetrant)
-- Both for MPI and DP an average POD of 80% for 2-3 mm deep defects was found.
-- -- -- DP (dye penetrant) was used on aluminium sprayed TIP samples with (fatigue) defects > 1mm deep. The overall POD was ± 60%.
RT (radiographic
testing)
-- Nordtest showed quantitatively the effectiveness of RT for voluminous defects. RT have difficulty in the detecting lack of fusion and crack like defects. An average POD of 80% for 3 mm deep, volumetric defects was found.
RT is able to give a high confidence in defect classification. An average POD of the order of 50% with a relatively high FCR was comparable with other methods.
-- -- --
ACPD (alternating
current potential
drop)
-- -- -- ACPD is used extensively for depth assessment of known defects. The calibration shows a 10% accuracy in depth (see Figure 13). ACPD with MPI were used for crack characterisation.
ACPD is well established for depth assessment of known defects in offshore applications (see ACPD under UCL).
ACPD with MPI were used for crack characterisation.
ACFM (alternating current field
measurement)
-- -- -- ACFM results on the UCL samples was favourable: all surface defects = 5mm were detected. The POD for 2mm deep defects was 80% with an FCR of 15%.
The favourable performance of ACFM was confirmed under ICON, particularly for the trials at sea. For one of the series of ICON tests the FCR for ACFM was high.
ACFM depth accuracy is comparable to ACPD. The POD and missed defects were close to the 80%/20% target area in the ROC diagram.
EC (eddy current
systems)
-- Although the scope of the project contained EC methods as well no results in the reports reviewed for this project revealed any data on EC methods.
-- A variety of EC systems have been tested. Most were in a development stage and therefore the results were quite varied with a POD of 80% for 3-5mm deep defects.
Under ICON the EC systems had been improved although there was still quite some variation in the performance of the various systems
The EC systems performed well both on bare metal and coated specimens. There was, however, substantial variation in the FCR for some of the systems.
UT (ultrasonic
testing)
The poor POD of UT in past PISC projects led to adaptation of a new inspection strategy in ASME. UT was the main method for defect sizing in thick-walled components.
Nordtest confirmed other UT findings: (a) the benefit of 20% DAC and (b) a 80%m POD for 3mm deep planar defects.
This project confirmed the high variability of POD and false calls. A POD/FCR of 50%/50% performance was obtained rather than the 80%/20% target.
UT was not part of the projects which concentrated on surface flaws.
-- --
TOFD (time of flight
diffraction)
TOFD was used in combination with other methods to arrive at the sizing of known defects.
-- TOFD was applied extensively for the NIL thin plate project. The performance was similar to other UT methods: with POD/FCR ratios of 50%/30% and 80%/50%.
TOFD was used as a calibration method for depth characterisation. The accuracy was similar to that for ACPD and could only be used for deeper defects (>5mm).
-- --
UCW (ultrasonic creeping
wave)
-- -- -- A limited number of tests were carried out. UCW had some difficulty in detecting deep defects under geometrically difficult locations.
Under ICON UCW came out reasonably well in the laboratory trials with a high overall POD and a FCR of 40%.
The results on UCW on coated specimens in TIP was quite varied. Very poor results were noted for complex geometries and good results for butt and T-butt specimens.

DESIGN CODES
Design Codes
assume good workmanship
ignore defectsassume good
materialstructure
for offshore structure
for pressure vessel
no test pressure test
1. Design assumes good workmanship2. Compliance with the code is a sufficient condition for an acceptable structure
WELDING weldingAND
INSPECTIONoptimise
welding to defects
welding procedure
NDToptimise
inspection to reduce
missing of
welder qualification
accept inspected
go for further analysis
inspection procedure
qualification
histogram of defects
missed rejectable
inspector qualification
histogram of rejectable
determine the size of
defects for
NDT ensures good workmanship
DEFECT ASSESSMENT
Defect assessment
assume defect
ignore defect assessment
determine material property
check acceptance of
solutions if unacceptable
accept/reject structure
modify structure
try more advanced methods
How reliable is defect assessment?
Table 4 Flow diagram for defect detection and assessment

TIPeddy current
Figure 1.3 Eddy Current: POD for surface defects Figure 1 Overview of detection of surface defects (1 of 2)
Figures

0%
20%
40%
60%
80%
100%
0.0 1.0 2.0 3.0 4.0 5.0defect depth (mm)
NordtestUCLICON-tubICON-otherTIP
MPI
Figure 1.1 MPI: POD for surface defects
0%
20%
40%
60%
80%
100%
0.0 1.0 2.0 3.0 4.0 5.0defect depth (mm)
UCLICON-tubICON-otherTIP
ACFM
Figure 1.2 ACFM: POD for surface defects
0%
20%
40%
60%
80%
100%
0.0 1.0 2.0 3.0 4.0 5.0defect depth (mm)
UCL (1)UCL (3)ICON-tubICON-otherTIP
eddy current
Figure 1.3 Eddy Current: POD for surface defects Figure 1 Overview of detection of surface defects (1 of 2)
Figures

0%
20%
40%
60%
80%
100%
0.0 1.0 2.0 3.0 4.0 5.0defect depth (mm)
Nordtest (MPI)Nordtest (DP)
dye penetrant
Figure 1.4 Dye Penetrant: POD for surface defects
0%
20%
40%
60%
80%
100%
0.0 1.0 2.0 3.0 4.0 5.0defect depth (mm)
ICONUCL
UCW
Figure 1.5 UCW: POD for surface defects
0%
20%
40%
60%
80%
100%
0 20 40 60 80 100 120defect length (mm)
TIPUCLICON-tubICON-T/butt
Figure 1.6 MPI: defect length dependent POD curves Figure 1 Overview of detection of surface defects (2 of 2)

0%
20%
40%
60%
80%
100%
0% 20% 40% 60% 80% 100%FCR (= false call rate)
UCLICON-tubICON-otherTIPTIP-othergood perf.
MPI
Figure 2.1 MPI: POD versus FCR
0%
20%
40%
60%
80%
100%
0% 20% 40% 60% 80% 100%FCR (= false call rate)
UCLICON-tubICON-otherTIPTIP-othergood perf.
ACFM
Figure 2.2 ACFM POD versus FCR
0%
20%
40%
60%
80%
100%
0% 20% 40% 60% 80% 100%FCR (= false call rate)
UCLICON-tubICON-otherTIPTIP-othergood perf.
eddy current
Figure 2.3 EC POD versus FCR Figure 2 Overview of performance for the detection of surface defects

0%
20%
40%
60%
80%
100%
0.0 2.0 4.0 6.0 8.0 10.0defect depth (mm)
volumetriccracksvolumetric
planar defects with sharp edges
Figure 3.1 Detection of buried defects (PISC, see Fig. 20)
0%
20%
40%
60%
80%
100%
0.0 2.0 4.0 6.0 8.0 10.0
defect depth (mm)
U20R4-cracksR4-volPISC
Figure 3.2 Detection of buried defects (Nordtest)
0%
20%
40%
60%
80%
100%
0% 20% 40% 60% 80% 100%FCRR (= false call rate in rejection)
TOFD-meanmanual UTradiographygammagraphyPISC-UTgood perf.
Figure 3.3 Performance for the detection of buried defects (NIL) Figure 3 Overview of performance for the detection of buried defects

overview
a b c
d
e< 1.0 mm
Classification A
a b c
d
e
Classification B
b
d
e
� 30°cracked region for crack b
cracked region for crack d
cracked region for crack e
Classification B1
b e
cracked region for crack b cracked region for crack e
� 30°
Figure 4.1 Defect classifications
coplanar surface flaws
a1 a2
2 c1
2 c2 c2s
criteria for interaction
for c1 = c2: s = 2 c1
effective dimensions after interaction
a = a2 2 c = 2 c1 + 2 c2 + s
Figure 4.2 PD6493 coplanar surface flaws combination Figure 4 Defect classification and combination for surface braking defects

05
1015
2025
3035
40
0 5 10 15 20 25 30 35 40real size in depth (mm)
advanced industry
Figure 5.1 Sizing performance flaws in full scale vessel (PISC-III) (flaws 1, 2, 7, 11, 12)
0%
20%
40%
60%
80%
100%
0% 20% 40% 60% 80% 100%FCR (false call rate)
8 methodsgood perf.
POD
Figure 5.2 Detection performance by procedure family in dissimilar weld metal assemblies (PISC-III)
0%
20%
40%
60%
80%
100%
0% 20% 40% 60% 80% 100%FCRR (false call rate in rejection)
8 methodsgood perf.
Figure 5.3 Rejection performance by procedure family (PISC-III) dissimilar weld metal assemblies Figure 5 Some typical PISC-III results

Figure 6.1 Scatter diagram of UT echo amplitude versus weld defect height (Nordtest)
Figure 6.2 POD versus defect height for U20 (Nordtest)
Figure 6.3 POD versus defect height for planar weld defects using UT and RT (Nordtest) Figure 6 Some typical NORDTEST results (part 1)

Figure 7.1: POD curves for RT (sensitivity level R4) for different defect types
(a) MPI (MT) and liquid-penetrant (PT) testing of linear and round surface flaws
(b) MPI(MT) and liquid-penetrant (PT) testing of linear surface flaws only
(c) Effect of inspectors’ competence Figure 7.2 Nordtest results on the inspection of surface breaking defects(33) Figure 7 Some typical NORDTEST results (part 2)

Figure 8.1 Performance in rejection by in 15 and 30mm thick plates by 10 UT operators (NIL, double sided inspection)
0%
20%
40%
60%
80%
100%
0% 20% 40% 60% 80% 100%correct planar classification
RotoscanRotomapTiPE (pulse echo)Man-UTRadiographyGammagood perf.
Figure 8.2 NIL: classification performance 6-12mm Figure 8 Some typical NIL results (part 1)

Figure 9.1 NIL: plates 6-12mm (all defects)
0%
20%
40%
60%
80%
100%
0% 20% 40% 60% 80% 100%FCRR (false call rate in rejection)
DSM TOFDMP TOFDRotoTOFDmanual UTradiographygammagraphygood perf.
Figure 9.2 NIL: plates 6-12mm (rejectable defects only)
0%
20%
40%
60%
80%
100%
0% 20% 40% 60% 80% 100%
FCRR (false call rate in rejection)
DSM TOFDMP TOFDRotoTOFDmanual UTradiographygammagraphygood perf.
Figure 9.3 NIL: plates 15mm (rejectable defects only) Figure 9 Some typical NIL results (Part 2)

Figure 10 Confidential node library (UCL/ICON)

crack depth (mm)
0102030405060708090
100
0 5 10 15 20 25 30 35 40
POD
95% conf.
Figure 11.1 MPI: defect depth dependent POD
crack depth (mm)
0102030405060708090
100
0 5 10 15 20 25 30 35 40
POD
POD (rev.)
95% conf.
Figure 11.2 Eddy current inspection:(tool 1): defect depth dependent POD
crack depth (mm)
0102030405060708090
100
0 5 10 15 20 25 30 35 40
POD
POD (rev.)
95% conf.
Figure 11.3 Eddy current inspection (tool 2): defect depth dependent POD Figure 11 Defect depth dependent POD, Classification B1 (UCL) (Part 1)

crack depth (mm)
0102030405060708090
100
0 5 10 15 20 25 30 35 40
POD
95% conf.
Figure 12.1 Eddy current inspection (tool 3):defect depth dependent POD
crack depth (mm)
0102030405060708090
100
0 5 10 15 20 25 30 35 40
POD
95% conf.
Figure 12.2 ACFM defect depth dependent POD
crack depth (mm)
0102030405060708090
100
0 5 10 15 20 25 30 35 40
POD
POD (rev.)
95% conf.
Figure 12.3 UCW defect depth dependent POD (Classification B2) Figure 12 Defect depth dependent POD, Classification B1 (UCL) (Part 2)

UCL: laboratory trials
0%
20%
40%
60%
80%
100%
0% 20% 40% 60% 80% 100%FCR (false call rate)
MPIEC-1EC-2EC-3ACFMUCWgood perf.
Figure 13 Detection performance for UCL trials (1 mm deep defects)

0%
20%
40%
60%
80%
100%
0% 20% 40% 60% 80% 100%FCR (false call rate)
OIS: MPI coils FROSEL: MPI coils UKBG: yoke at seaOIS: coils at seaBG: yoke UKBG: coils UKgood perf.
Figure 14.1 ICON: various MPI trial results (= 1mm deep defects)
0%
20%
40%
60%
80%
100%
0% 20% 40% 60% 80% 100%FCR (false call rate)
Hocking: EC tubulars FRHocking: EC tubulars UKLizard: EC tubulars FR (C)TSC: ACFM tubulars FRTSC: ACFM tubulars UKUCW: tubulars UKgood perf.
Figure 14.2 ICON: non MPI methods (= 1mm deep defects)
0%
20%
40%
60%
80%
100%
0% 20% 40% 60% 80% 100%
FCR (false call rate)
BG: yoke at seaOIS: coils at seaLizard: EC at seaTSC: ACFM tub. at sea
good perf.
Figure 14.3 ICON: trials at sea (= 1mm deep defects) Figure 14 ROC diagrams for various ICON trials (42)

1. Comex Hocking performance trend for geometry (depth) (tubulars and T-butt) Ref. 44 Fig. 2b
tubulars (43 cracks)
tee butt (34 cracks)
2. MPI yoke performance trend for dissimilar metals (depth) (tubulars and metal difference butts) Ref. 44 Fig. 3b
tubulars (20 cracks)
metal diff. butts (35 cracks)
3. ACFM performance trend for corrosion (depth) (tubulars and corroded T-butts) Ref. 44 Fig. 4b
tubulars (43 cracks)
corr. tee butts (31 cracks)
4. Comparison of tank and sea results for MPI coils system (depth) (tank tests and sea trials) Ref. 44 Fig. 6b
MPI freshwater tank (43 cracks)
MPI sea trials (9 cracks)
5. Comparison of CAT and manual results for Comex EC on tubulars (depth) (tubulars and CAT) Ref. 44 Fig. 8b
EC tub. (man.) (51 cracks)
EC tub. (CAT) (7 cracks)
Figure 15 ICON depth dependent POD results (44)

Figure 16.1 ACPD results for three ‘regularly shaped’ defects (12,40)
Figure 16.2 BG and DNV ACPD crack sizing data42
Figure 16.3 ACFM crack sizing data42 Figure 16 Crack depth calibration40,42

0%
20%
40%
60%
80%
100%
0% 20% 40% 60% 80% 100%FCR (= false call rate)
MPIHockingACFMLizardgood perf.
Figure 17.1 TIP Type II/III specimens (> 1mm deep)
0%
20%
40%
60%
80%
100%
0% 20% 40% 60% 80% 100%
FCR (= false call rate)
MPI-ACHockingACFMLizardgood perf.
Figure 17.2 ICON T butt welds cracks (> 1mm deep)
0%
20%
40%
60%
80%
100%
0% 20% 40% 60% 80% 100%FCR (= false call rate)
MPI-PMHockingACFMLizardgood perf.
Figure 17.3 ICON butt welds cracks (> 1mm deep) Figure 17 TIP results for uncoated specimens (Part 1)
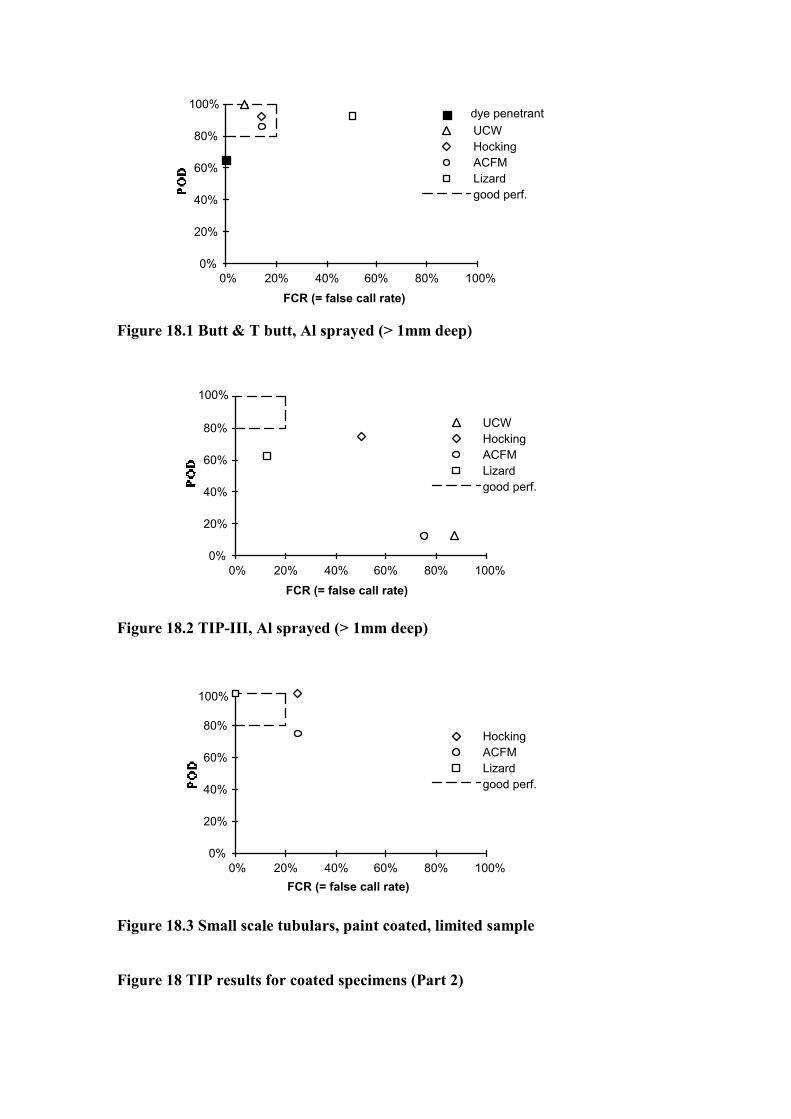
0%
20%
40%
60%
80%
100%
0% 20% 40% 60% 80% 100%FCR (= false call rate)
UCWHockingACFMLizardgood perf.
dye penetrant
Figure 18.1 Butt & T butt, Al sprayed (> 1mm deep)
0%
20%
40%
60%
80%
100%
0% 20% 40% 60% 80% 100%FCR (= false call rate)
UCWHockingACFMLizardgood perf.
Figure 18.2 TIP-III, Al sprayed (> 1mm deep)
0%
20%
40%
60%
80%
100%
0% 20% 40% 60% 80% 100%FCR (= false call rate)
HockingACFMLizardgood perf.
Figure 18.3 Small scale tubulars, paint coated, limited sample Figure 18 TIP results for coated specimens (Part 2)

0%
20%
40%
60%
80%
100%
0.0 2.0 4.0 6.0 8.0 10.0defect depth (mm)
ACFMEC1EC2MPI
Figure 19 POD for TIP butt and T-butt welds
Figure 20 Importance of the defect type and its probability of detection


Appendices: Detailed reviews of main projects Appendix A PISC-II and III Appendix B Nordtest Appendix C NIL Appendix D UCL Appendix E ICON Appendix F TIP Appendix G Flooded member detection Appendix H Potential areas for future developments

- A1 -
APPENDIX A PISC-II & III
PISC-II The full title of PISC-II final report25 is: Nichols, R.W. and Crutzen, S., Ultrasonic inspection of heavy section steel components, The
PISC II final report, Elsevier Applied Science, Barking UK, ISBN 1-85166-155-7, 1988. This report contains useful information on PISC-II and also the scope of work for PISC-III Objective of PISC-I and II tests - The PISC-I objective was to provide an assessment of the capability of a manual ultrasonic
procedure based upon the relevant section of ASME: it showed several shortcomings in the ASME procedure, particularly:
- large variations in performance between teams; - large defects and flaws in close proximity were undersized; - small defects were oversized. - PISC-II was set up to examine in more detail which techniques could provide the desired level of
capability in detection and sizing of defects. Some major conclusions are: - complementary techniques could bring industrially acceptable procedures (e.g. ASME)
to a good level of performance; - results on artificial defects must be validated on real structures containing real defects. - the characteristics of the (buried) defects are important: shape, crack tip aspects,
roughness, tilt angle, position, etc.) - therefore the need for examining real defects in real structures.
PISC-II samples descriptions - Four samples were tested in an RRT fashion. The plates contain many manufactured defects and
are considered representative for ISI. - the types of (fabricated) defects are: microcracks, macrocracks of 20mm or more in the through
thickness direction, long slag inclusions of 3-4 mm equivalent diameter. - The characteristics of these four samples are: - Plate 1:
- a flat plate of the dimensions: 1045 x 1026 x 246mm weight 2200 kg; - it has a two-layer strip cladding surface of 6mm thickness, surface roughness
- Plate 2: - a flat plate of the dimensions: 1520 x 1540 x 262mm weight 4600 kg; - it has a two-layer strip cladding surface of 6-8mm thickness, surface roughness
- Plate 9: - a flat plate of the dimensions: 1950 x 1950 x 200mm weight 6600 kg, with a nozzle; - at has a two-layer strip cladding surface of 6mm thickness, surface roughness
- Plate 3: - a curved plate with a near to real nozzle: 2620 x 2300 x 250mm weight 16t; - the cladding is 5mm thick.
- The following comments can be found in Report No 5 Chapter 15: - Major limitations of the PISC-II programme are - ratio between manual and automated inspection between ISI and in the tests; - the comparison between artificial and real defects - the regular presence of satellite defects - the effect of laboratory conditions rather than real industrial conditions. - Major findings - the benefit of 20% DAC versus 50% DAC (10% DAC would not improve the results) - the addition of the 70° probe and the benefit of supplementary techniques - the benefit of special procedures that combine standard techniques - DDF is defect position independent but the sizing accuracy is position dependent - smooth cracks with sharp crack tips are difficult to find when using procedures at
50% DAC - particularly if the defect is near the clad surface - The recommendation had a substantial bearing on the development of the PISC-III programme.

- A2 -
PISC-III programme The full title of the PISC-III draft final report26 is:
Programme of inspection of steel components, PISC-III Report No 42, Lessons learned from PISC-III, Report No EUR 16366 EN, Draft, 1/2/96
- PISC-III is a follow up of PISC-II to confirm the conclusions under more realistic conditions. It
was a 30 million ECU EU sponsored project. The following parts of the report concerned with POD/POS appear to be particularly useful: - Action 2: Full scale vessel tests - Action 3: Nozzles and dissimilar metal weldments - Action 7: Human reliability in NDE - Action 8: The relation of PISC-III to codes and standards
- These topics will be further reviewed and discussed in the following paragraphs. PISC-III detailed findings General - Classification and sizing of flaws gave more problems than flaw detection - The high level of false calls is noted as a specific problem, especially for some regions of
dissimilar metal welds. - In the Summary it is noted: the effectiveness of eddy current techniques was not able to match
the requirements of some structural integrity engineers (!) - The reasons, when given, for lower effectiveness by some teams could be explained. - NDE never provides 100% answers. Therefore NDE must be used as one of several approaches used in parallel, to reduce the overall
probability of failure. - PISC-III results have shown that capable NDE techniques exist but these will only be met by the
very best teams and techniques. - Reference is made to the realistic geometry test assemblies, as for example now defined in
ASME XI App. VIII. The PISC-III results are useful in developing these test assemblies. Action 2: Full scale vessel tests - 12 realistic flaws were chosen; they could be fully certified (described in detail). - The flaws represented both manufacturing flaws and service induced flaws in the MPA BWR
>100mm thickness. - Eleven teams, using different techniques, assessed these defects. - The difficulty in classifying complex flaws was specifically noted. - For all teams and all flaws: ESZ: mean = -2mm; � = 20.8mm; - From Fig. 6 in the report, using a log depth distribution, the mean value of these flaws is 25mm. - The report states 20% of the flaws are probably unacceptable from struct. int. point of view; - Five methods are compared and based on mean and stand. dev.: - the best: focusing - the poorest: manual computer aided UT at -6dB - in between: three other methods: TOFD, SAFT reconstruction, holography. - Defect depth accuracy is about 25% (see Fig. 6 of the report); insufficient data is provided to
check defect length accuracy. - In Phase 2 a realistic ISI automatic scanner (in the spirit of ASME) was tested using 20% DAC;
the results confirmed the adequacy of the procedure. - Figure A1 is specifically noteworthy: it reflects accuracy of sizing Action 3: Nozzles and dissimilar metal weldments - The title is misleading: Action 3 concentrated on dissimilar welds as found in safe-end
connections to the vessel, where carbon steel and stainless steel are connected. - The topic of nozzle inspection, of interest to offshore structures, is not addressed in the draft
report. - 25 flaws ranging from 10-50% of the local wall thickness were introduced in the nozzle
assemblies. - The following statement is of interest (p.17): It was decided to include in the assessment all flaws above 1 mm size in the depth direction
leading to a total of 47 reference flaws with a range of characteristics and having a good distribution
- 22 teams assessed the flaws in the nozzle assemblies, using a variety of manual and automatic

- A3 -
techniques, including: CW, SW, TOFD and SAFT both from the inside and the outside. - Conclusions
1. only a few teams reached a flaw detection frequency (FDF) of 80%; in addition there were a large number of false calls.
2. the correct rejection frequency was below 70% 3. teams with a high CRF showed a tendency to oversize defects, leading to incorrect
rejection of acceptable defects, and to high false call rates - 2 out of the 20 teams were able to perform successfully judged by all the criteria. - The overall conclusions from Figure 10 in the report are: average detection rate: 60% mean false calls 25% average rejection rate 70% mean false calls in rejection 15% - Good performance is: rejection rate > 80% false calls in rejection < 20% - By taking averages, Table 3 can be summarised as follows:
family FDF CRF CAF FCRD FCRR MESZ SESZ
noise 0.61 0.69 0.92 0.26 0.21 0.8 5.3
10-25% DAC 0.56 0.55 0.89 0.40 0.28 1.2 5.3
50% DAC 0.42 0.33 1.00 0.17 0.17 -1.3 4.7 - This table shows a low level of CRF for 50% DAC and an improvement by a factor 2 if a 20%
DAC is used. - The RRT could not provide a definite answer on the comparison between automatic and manual
techniques. - Each team took account of evidence from more than one technique. - Radiography and UT techniques had a similar performance, but the disadvantages of X-ray were:
higher false call rates and (as applied) were not suitable to making depth-size assessments. - Inspection from the inside and outside gave similar results - Immersion focusing transducers have been shown to have a high effectiveness. - The rejectable flaws were with a few exceptions in the 20-40%T range (Fig. 11 of the report)
and a mean size of about 7mm (for the rejectable flaws about 11mm). - Note that the difficulties had to do with the complex geometries and the dissimilar materials of
the tested assemblies. - Figures A2 & A3 illustrate some of the results. Action 4: Ultrasonic examination of austenitic stainless steel - A substantial part (30%) of the summary report is devoted to this Action 4 - The particular reason for this topic is that steels have a high nickel and chromium content and
are therefore much more difficult to examine by UT than low alloy steels. - It concentrates on welded austenitic pipes and elbows of three types: wrought/wrought welds,
cast wrought welds and cast/cast welds in thicknesses ranging from 11-25mm. Action 5: Steam generator tubes - This is a typical case where concern is in IGSCC (inter granular stress corrosion cracking; crack
like defects) and IGA (inter granular attack; volumetric defects). - The tube material was Inconel 600 with a diameter of 22.22mm and a wall thickness of 1.27mm - SWSCC = secondary water SCC Action 6: Mathematical modelling of NDE/flaw interaction - Three models have been evaluated: - NDTAC in Manchester (UK) for pulse echo UT - AEA at Harwell (UK) for TOFD and other UT methods - GhK at Kassel (Germany) 2D modelling Action 7: Human reliability in NDE - The following line appears in the Summary: “... how to ensure that the high effectiveness
characteristic of the good teams is in fact achieved in the actual industry applications and that the bad teams are either not used or that they are trained to achieve the desired result.”
- A clear difference was demonstrated between skills, knowledge and working practices in

- A4 -
PISC-II. - In order to check human reliability, manual UT inspectors with relevant experience were
observed by skilled observers. Two facilities were used: RS (Reliability Studio) and TEL (Transportable Environmental Laboratory). Tests were on both the steel plates.
- The five main conclusions were: - the variability of calibration was acceptably small; - the flaw detection performance (FDF) varied between 65% to 100% between
inspectors; - variability for single inspectors was also due to tiredness (a factor 2 in FDF is quoted); - there was initial adjustment but also long shifts in the TEL had a marked effect; - the UT simulator proved to be very useful - also there were a significant number of reporting the errors (left for right, etc.); - Suggestions are made to reduce the lowering of NDE effectiveness by human errors: - it is desirable to have some form of indication warning device if high integrity is
required; - the UT simulator is a valuable tool particularly to note poor ultrasonic coupling and/or
incomplete scanning; - long day’s work has an effect on effectiveness; this has implications in trials for
personnel certification and performance demonstration; - be aware that there are also human effects in automated UT .
Action 8: The relation of PISC-III to codes and standards - The contribution by the PISC results in various international activities is mentioned. - Organisations are: ASME XI, ISO, CE, IIW, EMIQ and ENIQ. - Particularly noteworthy is the Performance Demonstration which later became known with the
EC as Inspection Qualification.

- A5 -
Figure A1 Sizing performance flaws in full scale vessel (PISC-III) (flaws 1, 2, 7, 11, 12)
05
1015
2025
3035
40
0 5 10 15 20 25 30 35 40real size in depth (mm)
advanced industry
Figure A2 Detection performance by procedure family (PISC-III)dissimilar metal weld assemblies
0%
20%
40%
60%
80%
100%
0% 20% 40% 60% 80% 100%average false call rate in detection (%)
8 methodsgood perf.
Figure A3 Rejection performance by procedure family (PISC-III)dissimilar metal weld assemblies
0%
20%
40%
60%
80%
100%
0% 20% 40% 60% 80% 100%average false call rate in rejection (%)
8 methodsgood perf.


- B1 -
APPENDIX B NORDTEST PROGRAMME
Introduction - The Nordtest NDE programme took place from 1984 - 1990 in the four Scandinavian countries. - It consisted of four part-projects dealing with:
- NDE systematics (inspection models, important parameters, FFP, case studies) - NDE reliability (MPI, penetrant, eddy current, UT, RT and reliability factors) - Sizing of defects (testing and evaluating techniques) - NDE data processing
- Much information has been developed and various results were presented around 1990. - The Nordtest programme can be summarised as follows:
- 730 embedded weld defects and 635 surface defects - 3400 RT, 4600 UT, 9000 MPI and 9000 penetrant observations - The four main references (IIW documents) on Nordtest will be reviewed here. - There are a few other references which partly duplicate the information or deal with
topics of secondary importance for this project. Observations from a presentation by Førli at JRC - The diagram of UT echo amplitude versus weld defect height is a random scatter (see Fig. B1) - The other diagram is between POD and defect height for UT (U20 = 20% DAC). For example
for h=10mm the POD is 90%(see Figure B2). - The statement on acceptance criteria in Førli’s presentation is interesting; it can be summarised
as follows: - acceptance criteria - will inevitably be different
- for different NDE techniques due to the techniques' physical differences and as the criteria have to be expressed by the physically recordable parameters for each technique
- but may be equivalent - ... if the techniques in the long run detect the same amount of defects of the
same type, size, ... / severity, i.e. have the same probability of detection (and correct sentencing)
- The POD by combining two independent NDE techniques is higher as reflected by the following equation: P = 1 - (1-P1) x (1-P2)
IIW-V-967-91 Nordtest NDT programme28 - The organisation of the programme and the main conclusions can be summarised as follows:
1. A principal output from the project was the preparation of a handbook on defect sizing and the results from the NDT reliability investigations.
2. The inherent incapabilities and inaccuracies of commonly applied NDT techniques have been fully demonstrated.
3. The impact of computers and computing on NDT, from simulation to result evaluation and reporting, has been thoroughly dealt with. This will, and has already to a certain extent, changed the NDT scene.
4. Valuable insight into the systems and optimisation of NDT has been gained, thus assisting in the development of practically applicable tools for fitness-for-purpose.
5. The project must be regarded to have been an integral part of the development in the international NDT community giving access to and contact with other ongoing activities like PISC and Dutch NDT reliability studies.
6. Project results have already directly or indirectly contributed to standardisation work (CEN, ISO/IIW).
7. Valuable competence has been established. 8. Links have been maintained or strengthened between the major NDT companies/
institutions in the Nordic countries, and between these companies and the industry. IIW-V-968-91 Optimal NDT efforts and use of NDT results29 (not much new)
IIW-V-969-91 Reliability of RT and UT30 - Most of the components were of C-MN mild steel with wall thicknesses up to 25mm with some

- B2 -
TK joints and butt-welds in thicker plates (up to 50mm). - This publication deals with buried defects. - The defect type distribution of the 729 defects in 144m weldment is:
- porosity (A) 95 13% - slag inclusion (B) 179 25% - incomplete penetration (D) 75 10% - lack of fusion (C) 248 34% - cracks (E) 121 17% - other types -- 11 2% - total 729 100%
- The defect heights are up to 13mm with 90% of the defects below 5mm. - The average height is 2.5mm. - The average POD for UT and the defect heights corresponding to a POD of 50% are (Fig. B3): - U20 69% 0.5 mm - U50 56% 1.2 mm - U100 36% 3.6 mm - The average POD for RT and the defect heights corresponding to a POD of 50% are (Fig. B3): - R5 55% 1.2 mm - R4 47% 1.8 mm - R3 36% 3.6 mm - R2 16% 11.5 mm - The levels R2-R5 correspond with the IIW degrees (IIW-1952). - In addition to previous graphs Figure B4 showing the POD for different types of defects using
RT (at R4 level) is of interest. IIW-V-970-91 Reliability of magnetic particle and liquid penetrant inspection31 - This reference will be reviewed together with the references 32 and 33 on the same topic by the
same authors. - This publication deals with surface defects. - The text in the IIW publication and the figures in another publication are used. - 14-16 inspection teams were involved - For MPI the participants were free to use whatever they preferred: all chose wet methods but
both fluorescent and coloured penetrants were used. - The samples:
MPI penetrant material Fe Fe Al SS no of specimens 67 6 33 33 no of defects 294 31 151 190 total no of inspections 977 83 505 499
- Overall: less than 50% of the cracks exceeding the acceptance limit of ASME were detected in
the RRT. (Note that the average depth was 2.5mm).

- B3 -
Figure B1 Scatter diagram of UT echo amplitude versus weld defect height (Nordtest)
Figure B2 POD versus defect height for U20 (Nordtest)
Figure B3 POD versus defect height for planar weld defects using UT and RT (Nordtest)

- B4 -
Figure B4: POD curves for RT (sensitivity level R4) for different defect types
(a) MPI (MT) and liquid-penetrant (PT) testing of linear and round surface flaws
(b) MPI(MT) and liquid-penetrant (PT) testing of linear surface flaws only
(c) Effect of inspectors’ competence
Figure B5 Nordtest results on the inspection of surface breaking defects33

- C1 -
APPENDIX C NIL PROJECTS
The titles of four main NIL reports34-37 with regards to POD/POS are: 1. NIL, Evaluation of some non-destructive examination methods for welded connections with
defects, NIL report NDO 86-23, 1986 (in Dutch). 2. NIL, Optimisation of manual ultrasonic investigations for welded connections with defects, NIL
report NDO 90-07, 1990 (in Dutch). 3. NIL, Advanced flaw size measurement in practice, NIL report GF 91-04, 1991 (in Dutch). 4. NIL, Non destructive testing of thin plates, NIL report NDP 93-40, 1995. These reports are the result of a series of joint industry projects supported by, and executed by, Dutch industries. In the following section reviews of these reports will be given with the emphasis on the HSE objectives regarding POD/POS. For the abbreviations used in this note reference is made to the table of abbreviations.
1. Evaluation of some non-destructive examination methods for welded connections with defects (1986)34
p.1 The programme consisted of a series of RRTs for manual UT, mechanised UT, acoustic emission
and radiography. p.4 30 testplates in thicknesses varying from 30-50mm with some 200 welding defects have been
examined. In addition mechanised UT was applied to 150mm thick plates with known defects. - AE was used to guard the welding processes to develop the required welding defects. This was
also an objective of the programme (p.6). - Both the POD and the characterisation of defects were examined. p.5 Disadvantages of manual UT: dependence of the examiner and results not properly recorded. - Part of the work was related to develop procedures to introduce the required welding defects. p.7 This page describes the planning of the welding defects and can be described in two ways: General: - typical welding defects in butt welds - defect lengths 10-100mm and defect depths 2-8mm - the locations of the defects; - distribution of defects (isolated and combined defects) Specific characteristics of the defects: - gas inclusions ±15% - slug inclusions ±25% - poor connections ±15% - lack of fusion ±15% - crack-like defects ±25% p.8 Actual defects: a programme of destructive testing after the RRT was carried out with the
emphasis on (a) defects identified by none or some of the participants and (b) at least one of each type; ±40% of the defects were examined.
- Most of the defects were as planned with the exception of cold cracking. p.9 Radiographic examination - The work was carried out in accordance with DIN 54111 Pt.1. - In the recognition and judgements of defect the film-reader plays an important role; more than
one experienced film-reader was used and the films were offered in an arbitrary sequence. - The readers should indicate for each defect: its location, the type of defect and its acceptance to
ASME. p.10 Gas and slug inclusion and cross-cracking were identified with a high %; lack of fusion and long-
cracking were poorly recognised. - The same applies to the recognition by individual film-readers. There was also a thickness
influence (the % for 30mm were higher than the % for 50mm plate). p.11 300kV and 420kV gave similar results and were better than those for Ir-192 and Co-60 particular

- C2 -
with regards to planar defects. - The picture quality indicator did not provide a measure for the flaw detection. p.12 For the best method (300kV) the characterisation of the defect is on average 85% but particularly
for planar defects the score is low (Comment in the report: these defects are often unacceptable). - In the characterisation (non-acceptance to ASME) there is a marked difference between the
results for 30 and 50mm plates; - lack of fusion, crack like defects: 95% for 30mm and 75% for 50mm p.13 - gas inclusions (range for 4 readers): 45-100% for 30mm and 45-70% for 50mm - slug inclusions (range for 4 readers): 75-100% for 30mm and 70-90% for 50mm - The work did not resolve the issue how to improve the reliability of the film-reader. p.14 Manual UT - 4 procedures and, on average, 2 inspectors (experienced level 2) per procedure were used with
own equipment under favourable circumstances. - For every flaw the following should be reported: location of flaw, echo vs. ref. level, length and
height, characterisation and acceptable. - many reference welding defects are not reported and there are large differences between the
teams: p.15 in 30mm plates: - 55% reported by all and 15% not reported by anybody in 50mm plates: - 45% reported by all and 10% not reported by anybody - no influence in the UT procedure. - the same results are obtained for planar and non-planar defects - Hence, using routine inspection, identification of the type of defect is poor. p.17 The results in Table 5 on reported and non-accepted defects are all below 40%. - Many unacceptable planar defects are not recognised as planar defects. - The location of the defects is within a error of 10mm but difficulties arise with multiple defects. - The conclusion (in 1986) is that manual UT is a doubtful method. p.19 Mechanised UT (note that this report was written in 1986) - Three systems have been tested (P-SCAN, SUTARS and ROTOSCAN) details of the systems are
provided. - Two of the three systems (P-SCAN and ROTOSCAN) report a high percentage of the reference
defects (70-90%); the results of these two are close. - Both methods are sensitive to the defect size: - non-planar defects: 70-100% - small planar defects (<30mm2): 0-35% - large planar defects (>30mm2): 60-100% - The length location is good but the depth location is system dependent (P-SCAN ±5mm,
ROTOSCAN ±10-15mm). - Flaw characterisation is impossible. - The time for preparation was also mentioned as variable but no actual times were reported. p.23 Comparison manual and mechanised UT - The main point is that the efforts for preparation and evaluation for mechanised UT are much
more time consuming than for manual UT. p.25 Comparison radiography and manual UT - For thicknesses in excess of 50mm radiography is becoming less reliable. - Radiography is better in detecting volumetric welding defects by a significant margin. - But RT is less suitable for lack of fusion. - There is a greater uniformity in the reporting by the film-readers than by the UT inspectors. - Also acceptance and rejection of defects using RT is more in line with the current (1986)
acceptability criteria. p.27 Mechanised UT in welds in a 150mm plate. - Two systems have been used and the conclusion is that the detection by tandem technique is
more reliable than using a single probe (tool). p.29 Acoustic emission (AE) - In the context of this project it is used to detect, characterise and reduce the number of defects
during welding. Details are provided. p.33 Final comments and recommendations - Manual UT and radiography are considered to be similarly suitable. - Mechanised UT has a higher POD but the characterisation is equally difficult as with manual UT.

- C3 -
2. Optimisation of manual ultrasonic investigations for welded connections with defects (1990)35
- The report deals with many detailed aspects of the investigation. Therefore only major points
will be summarised in this note. - The prime objective was to identify the reasons for the poor results of the RRT and which
recommendation for changes could be made. - A number of models were developed for the operator, the measurements, the evaluation etc. - The core of the project was the inspection by 10 UT operators on 25 testplates of 15 and 30mm
with 136 flaws. - All operators inspected the testplates once and three of the plates twice (without knowing) - Five different sets of probes were tested - In one of the sub projects the factors were measured that play a role in the detection phase:
coverage of probe scanning, coupling, probe swivel and screen observation. - On p.21 of the report ROC (relative operator characteristics) analysis was further developed. - Poor performance is not the result of a single mistake of the operator but of the combined
negative influence of many factors. - However, manual UT has the potential to perform equally well to mechanised UT. - The characterisation of the flaw type is highly unreliable. - Operators tend to work conservatively. - Recommendations fall under the following categories:
- improvements via changes in the procedure - improvement of probe properties (selection of dedicated probes) - improvement of operator kills - improvement by using additional techniques
- One of the observations is: “routine manual UT weld inspection is clearly not fulfilling the requirements of FFP (fit for purpose).
- The following sentence is worth reporting: - The user should recognise the role of routine UT weld inspection as being a monitoring
tool, thereby reducing discomfort currently present with UT inspectors as well as users. - The report is written qualitatively. Although data are included it requires some efforts to
quantify the findings. - In Figure C1 “HITS” is the percentage of non-acceptable defects which are identified as non-
acceptable; the number of ‘FALSE CALL’ is the number of defects incorrectly identified as non-acceptable.
- These points reflect the performance of 10 individual inspectors. - The following tables summarise the inspection results in terms of numbers and percentages of
defects.
results of UT inspection (in number of defects) total acceptable non-acceptable non-detected
acc. defects 27 77 26 130 non-acc. defects 35 490 57 582
results of UT inspection (in %) total acceptable non-acceptable non-detected
acc. defects 21% 59% 20% 100% non-acc. defects 6% 84% 10% 100%
3. Advanced flaw size measurement in practice (1991)36 - The report provides a clear overview of the findings from an extensive project in which five
techniques, three mobile display units (MDU) and five types of structures were examined. - The five techniques were:

- C4 -
1. FTR is a single probe TOFD 2. TOFD 3. Supersaft 4. ACPD 5. DCPD is a direct current potential drop technique - Supersaft is a modification to SAFT (synthetic aperture focusing technique) in which the data
from several probes of probe positions is recorded, thereby giving the effect of a very large probe.
- The MDUs were from RTD, Nucon IPS and AEA Harwell. - The five types of structures were:
1. flat butt welded plates (10 & 30mm), with U and V welds and intentional defects 2. T shaped samples with K welds (30mm) containing fatigue cracks 3. three tubular T and X joints (D = 200 & 460mm, t = 8 & 16mm) with fatigue cracks and
a notch simulating a weld root defect 4. a split-tee pipe repair with notches in the weld toe (thicknesses: 9mm pipe and 27mm
repair shell). - The main conclusions were:
- FTR is not really suitable because of difficulty in signal interpretation. - TOFD on simple geometries is manually applicable by good level II UT operators. - MDUs did not contribute in signal interpretation - Manual and advanced TOFD were accurate in flaw sizing (RMS deviations 1 - 1.5mm) - Comments were made on various TOFD systems regarding suitability & applications. - e.g. Harwell Zipscan would be suitable for t<15mm because of sampling frequency - for flaw detection with TOFD advanced systems have to be used - The dead zone in TOFD of the upper 3-4mm was mentioned a number of times, but the
back wall accuracy is the same as in the middle. - TOFD on complex geometries requires special equipment and skilled operators. - The accuracy in sizing of Supersaft is similar to TOFD but it gives more info on defect
type. - Supersaft is not (yet) suitable for complex geometries. - DCPD was not a suitable technique. - ACPD as applied in this project on welded plates with non-prepared surface conditions
is not suitable for flaw height measurements. - In the text (p.21) the condition is made: unless reference pieces are of the same surface
condition as the actual components. - The objective of the programme is similar to PISC III Part 1, namely defect sizing.
4. Non destructive testing of thin plates (1995)37 p.1 Summary - The objective of this JIP was:
- To assess the reliability of mechanised UT in comparison with the ‘standard’ NDI techniques (i.e. RT and manual UT) for detection of defects in welds in steel plates in the wall thickness range 6-15mm.
- 11 commercially available NDT methods were evaluated on 21 planar steel welded testplates with 244 artificial, yet highly realistic, defects.
- The standard of the work was in line with RTOD (Dutch rules for pressure vessels - Regels voor Toestellen Onder Druk).
- The evaluation techniques were: - mechanised ultrasonic TOFD (3 systems) - mechanised ultrasonic pulse-echo (4 systems) - manual UT (4 operators) - standard (0°) radiography, gammagraphy and double exposure weld bevel radiography
(3 film readers each) - a few experimental, non-commercial techniques (not further reviewed in this note).
- After inspection all testplates were examined destructively and this information served as the reference point.
- The following quantitative indicators of reliability performance were calculated:

- C5 -
- POD, false call rate, localisation and sizing accuracy, correct rejection rate, false rejection rate, relative-operating-characteristics (ROC)
- a brief assessment was given on the influence of defect depth position and defect classification on the detection frequency.
- The main conclusions were: - the results mechanised UT systems were better than those of the manual systems - the exception is double exposure weld bevel radiography with regards to POD - on localisation there is no preference for manual or mechanised systems - for defect length sizing, the mechanised techniques usually outperform manual
techniques - the reliability with respect to defect sentencing (accept/reject) is poor for all techniques - for the 6-12mm range there is no wall thickness dependency.
p.8 Introduction - The study anticipates on industrial trends towards increased application of mechanised UT, use
of high strength steels as well as the application of FFP based on FM and improved NDT. - The study results seem to be applicable to a much wider range of problems. - NORDTEST project 72-76 is referred to; its objective was a comparison of RT and UT. p.10 Testplates and destructive results - Details of the welding processes are described. - There are a total of 199 defects when chain defects are counted as one or 244 individual defects. - The types of defects are: lack of penetration, lack of fusion, slag and gas inclusions, cracks. p.12 Of these 244 defects 32 were acceptable to RTOD. - From the destructive examination: the defect free regions were indeed defect free and there was a
good agreement between planned and actual defects dimensions. p.13 Techniques, procedures and codes p.15 The standard is to good workmanship criteria (GWS) p.18 Here the “Certainty Rating” for ROC (relative operating characteristic) is described. It refers to
the rating for the inspection results which ranges from 1 (very obvious rejection) to 6 (very obvious acceptance)
p.20 Evaluation of results - The five sections of this chapter are well organised and address, successively:
- reliability parameters - detection - localisation and sizing - acceptance/ejection and ROC (ROC = relative operating characteristic) - effect of defect depth and classifications
- These five topics will be reviewed in this order. p.20 Reliability parameters (taken from PISC III) - The terms: FDF, MFDF, (M)FCRD, MELX, SELX(SX, LZ, SH), (M)CRF, (M)FCRR, ROC - Also da, the ROC related parameter are addressed. - The first parameters are absolute and the last three depend on the chosen acceptance/rejection
criteria. p.21 Detection - The detection rates for 6-12mm can be summarised as follows: - mechanised UT-PE & TOFD 60-80% - manual UT 50% - 0° radiography 65% - double exposure weld bevel RT 95% - False call rates are mainly in the range 10-20% - In these tests there was no correlation between high detection rate and high false call rate. - For 15mm the results were markedly better, except for RT. - The results are illustrated by Figures C2-C5. p.24 Localisation and sizing - The mean location and sizing were quite accurate but the stand. dev. was large. - The performance was independent of thickness (6-12mm) but for 15mm the results are different. - No information is given on the actual sizing distribution. p.28 Acceptance/ejection and ROC - The results are presented in various diagrams to illustrate performance: - correct rejection frequency and false rejection rate per technique - correct rejection frequency versus false call rate in rejection - correct rejection versus detection

- C6 -
- The ideal corner in the diagrams is also indicated (e.g. CRF 80-100%, FCRR 0-20%) p.34 Effect of defect depth and classifications - This section deals with defect depth dependency and technique used. - Classification of planar and non-planar was also attempted but the results are a matter of
interpretation: - the report states that only radiographic methods should be considered - for other methods it is difficult if not impossible p.36 - however, with advanced processing methods a 90% correct classification can be
obtained p.37 Conclusions and recommendations - Except for the previously reported conclusions the following points should be noted:
- sizing is much less reliable than the location reliability - various conclusions are made on defect sentencing - an important conclusion may well be the importance of good workmanship (to ASME
BPV Code Section V, 1989). - A steel backing strip did not affect the results - The report contains many suitable graphs and the data to generate these graphs.
5. Summary part-project report: Evaluation of test results (in Dutch)38 - This report describes the evaluation of the result of the NIL project "NDT of Thin Plate". The
aims and general set-up of this project are given in Appendix 11. - The main goal of the project is: To assess the reliability of mechanised ultrasonic inspection in
comparison with the 'standard' non-destructive inspection techniques (radiography and manual UT) for detection of defects in welds in steel plate in the wall thickness range 6-12 (15) mm
- The following parameters were calculated for all NDE methods applied in the project: - the percentage of defects detected & percentage of false calls - the defect localisation and sizing accuracy - the percentage of correctly & incorrectly rejected defects - ROC (Relative Operating Characteristic)-curve and the related parameter d,,
- In addition the influence of the defect position on detection and the defect characterisation (in terms of planar/non-planar) have been investigated.
- The test specimen are described and the parameters used are defined. The principle of the ROC analysis is discussed as well as the correlation of the actual defects with the reported data. Also the procedure followed during the evaluation is discussed.
Detection - Standard radiography (perpendicular irradiation) ± 65 % detection probability. - Manual ultrasonic testing ± 50 % detection probability. - The probability of detection for mechanised pulse echo systems is highly dependent on the
specific way the system is implemented (50-90 %). - Mechanised systems ensure a high POD (50-90 %) as compared with manual UT (50 %). - Radiographs taken along the weld preparation yield a high probability of defect detection (95%). - The false call rate is highly dependent on the specific system implementation, but does not
correlate with the probability of detection. Accuracy - As a rule of thumb the following accuracies apply for defect localisation and sizing for all
techniques in the wallthickness range under investigation (6-15 mm): - defect localisation + 10 mm - defect length + 15 mm - defect depth (TOFD technique and some mechanised UT systems only) ± 1.5mm - defect height (TOFD technique and some mechanised UT systems only) ± 1.5mm Interpretation Current acceptance criteria based on Good Workmanship are not well suited for application in
combination with modern mechanised UT systems. - Defect characterisation (planar/non-planar) capabilities are limited for all mechanised systems.

- C7 -
- For plates between 6 and 15mm TOFD tends to detect defects that are located close to the surface better than defects located far from the surface. For mechanised pulse echo systems exactly the opposite is the case.
Figure C1 ROC diagram for rejectable defects by 10 UT operators (NIL)
Figure C2 NIL: classification performance 6-12mm
0%
20%
40%
60%
80%
100%
0% 20% 40% 60% 80% 100%correct planar (%)
RotoscanRotomapTiPE (pulse echo)Man-UTRadiographyGammagood perf.

- C8 -
Figure C3 NIL: plates 6-12mm (all defects)
0%
20%
40%
60%
80%
100%
0% 20% 40% 60% 80% 100%FCRD (%)
DSM TOFDMP TOFDRotoTOFDmanual UTradiographygammagraphygood perf.
Figure C4 NIL: plates 6-12mm (rejectable defects only)
0%
20%
40%
60%
80%
100%
0% 20% 40% 60% 80% 100%FCRR (%)
DSM TOFDMP TOFDRotoTOFDmanual UTradiographygammagraphygood perf.
Figure C5 NIL: plates 15mm (rejectable defects only)
0%
20%
40%
60%
80%
100%
0% 20% 40% 60% 80% 100%FCRR (%)
DSM TOFDMP TOFDRotoTOFDmanual UTradiographygammagraphygood perf.

- C9 -
Some points on the NIL reports - The reports contain very useful information - The reports do not distinguish between surface flaws and shallow flaws. - Not only the POD (or FDF) but also defect classification (planar, non-planar) is important - An other report on thin plate testing should be purchased - The types of defect should be characterised according to IIW symbols Aa, Ab, Ba, etc. - There is a constant ‘competition’ between manual and automatic systems which is very healthy. - I like the comment: inspection is not only to find defects but more importantly to signal
deviations from workmanship levels - The reports pay significant attention to ROC as a curve - Various thicknesses of plates have been used with 30-50mm (thick) and 6-125mm (thin) - The validity of the statement that TOFD is not suitable in the upper 3-4mm is in line with the
HSE/DEn findings for defect depth measurements. - The project on thin plates is particularly recommended for further evaluation - The RTOD (toestellen onder druk) for UT and RT examination should be reviewed in more
detail. - whenever possible: - location & sizing performance in x-direction (approx.): ux = 0 mm �x = 10 mm - location & sizing performance in x-direction (approx.): uz = 1 mm �z = 1.5 mm - error in the defect length ±15mm

- D1 -
APPENDIX D UCL UNDERWATER INSPECTION TRIALS
The full title of the report40 is: Visser, W., Dover, W.L. & Rudlin, J.R. Review of UCL underwater inspection trials, HSE OTN 96 179, 1996.
Introduction - The reliability of four different inspection techniques was explored, i.e. magnetic particle
inspection (MPI), three eddy current methods, ultrasonic creeping wave inspection UCW) and alternating current field measurement (ACFM).
- With the completion of the work on ACFM no more methods were envisaged requiring testing through the UCL library. Moreover, in 1991 the emphasis moved to the European ICON project which was even much more comprehensive and included field testing under real offshore conditions.
- It is essential to emphasise that the POD curves produced from this project are a comparison of the underwater nondestructive tests and tests in air using different techniques. Their accuracy is therefore dependent on the accuracy of the in air crack measurement.
- Moreover, this report provides information on the performance of various inspection systems available between 1988 and 1992; care should therefore be taken in extrapolation of the conclusions to current systems.
- The crack details in the library of specimens are treated as confidential material, hence the term ‘confidential library’.
- An important part of the work has to do with the statistics of POD and on the presentation of results. In accordance with the original reports, the total database of some 90 defects has been divided into three groups of some thirty defects each and the POD curves established accordingly. An extension is that curves are given not only for crack lengths but also for crack depths.
- An important point is also to make the results more engineering friendly. Validity of the UCL database and results - Based on a review of the diver inspectors, the environment and other factors, the work can be
fully supported for its practical relevance in relation to underwater, offshore conditions. - The regular library replacement was a procedure by which, through infrequent destructive
testing, quality assurance on lengths and depths of defects in the UCL library was maintained. This testing, albeit on a limited scale, was important to retain confidence in the results.
- The results of the trials in terms of POD only apply to unstiffened tubular joints. Other fatigue prone components, such as stiffened tubular joints, overlapping joints, attachments and single sided closure welds, are not addressed in the project.
UCL library and POD curves - The UCL library comprises some 20 nodes with 80 individual joints, some 100m of weld, and
with some 90 Classification B1 defects ranging in length from 2 - 600mm. This library has been investigated for six different inspection methods or tools. In addition there were 20 coated specimens with defect indications (see Figure D1). This library has also been used for ICON.
- Two classes of POD curves are obtained, namely the mean POD curve and the POD curve with confidence. Originally, during the project, the terminology ‘lower bound estimate of population POD at 95% confidence’ was used. However, this term is rather engineering unfriendly and has been replaced in this report by the terminology ‘the POD with a 95% chance of being higher in practice’.
- The straightforward analysis of the experimental data could result, in some cases, to unexpected trends in terms of the slope of the POD curve. These irregularities are caused by dividing the database into a number of portions based on length/depth intervals. A solution to this problem is also provided.
Inspection methods - The discussion of results on inspection methods, both in this section and in the main report,
follows the historic order. The methods are: magnetic particle inspection, three devices based on the eddy current principles, an ultrasonic creeping wave tool and a probe based on the alternating current field measurement principles.

- D2 -
- The testing at UCL confirmed the adequacy of magnetic particle inspection (MPI) as a suitable
underwater crack detection method. The MPI method resulted in a higher number of spurious results than other methods.
- The AV100 Hocking eddy current device provided acceptable results in terms of POD although it missed one short, relatively deep defect. The method did not detect any of the interbead cracks.
- The results on the EMD-III eddy current device formed a clear example of how to identify,
through the UCL database, the confidence in terms of POD of a method. - The Harwell eddy current system appeared to be a suitable tool for overall crack detection. This
observation was subject to the independent expert review of the POD trial results which improved the overall findings with this prototype system.
- The alternating current field measurement (ACFM) method was suitable for defect detection and establishing defect lengths. Defect depths were also determined with ACFM but the comparison with the laboratory methods showed that the ACFM results did not always agree with its results.
- The underwater creeping wave (UCW) devices were reasonable for crack detection apart for detecting defects at certain positions of angled joints in the library.
Comparison of inspection methods - The data show that the eddy current devices and the ACFM tool gave a much lower number of
spurious results than MPI. On the other hand, MPI and ACFM were much more reliable in determining defect lengths than the lengths which are obtained by application of any of the eddy current devices.
- Fatigue cracks can have large ranges of aspect ratio (depth over length ratio). For example the UCL database shows a range between 1:6 to 1:40 with a mean value of 1:12. Because of this large range this mean value should be used with care.
- When Classification B1 is applied to the UCL database, only 1% of the defects are interbead cracks. Based on this result, and using information from a TWI publication, it could be decided not to inspect for interbead cracks except for some special cases, such as for joints with chord and braces of equal diameter (� = 1.0).
- The POD using ACFM and The Harwell eddy current system on coated nodes, with a 1-2mm epoxy coating, was quite similar to the POD using these methods on uncoated nodes. This observation is based on a sample of 20 joints with defects ranging from 2-9mm in depth.
Other findings - The calibration of ACFM showed an underestimation of the depth by 10%. - The results in terms of depth dependent POD are given in Figure D2. The total number of points
is approximately 90. - The results in terms of POD/FCR are given in Figure D3. - It is shown that only for defects > 10mm can a POD with 95% of 90% or higher be obtained. - The datapoints are given for the higher depths in each interval. - The length accuracy of surface breaking defects was estimated to be as follows:
Accuracy of defect lengths measured underwater
method accuracy MPI 20%
AV100 40% EMD 40%
ACFM 50% UCW 20%
- The coated node tests were carried out on 18 samples, and three techniques (ACFM, eddy
current and UCW). The defect depths were 1.5-9.0mm and a 1-2mm epoxy coating was used. The POD of these methods was high and very similar to those for uncoated nodes.

- D3 -
Figure D1 Confidential node library (UCL/ICON)

- D4 -
crack depth (mm)
0102030405060708090
100
0 5 10 15 20 25 30 35 40
POD
95% conf.
a. MPI defect depth dependent POD
crack depth (mm)
0102030405060708090
100
0 5 10 15 20 25 30 35 40
POD
POD (rev.)
95% conf.
b. Eddy current inspection: Hocking AV100 defect depth dependent POD
crack depth (mm)
0102030405060708090
100
0 5 10 15 20 25 30 35 40
POD
POD (rev.)
95% conf.
c. Eddy current inspection: EMD defect depth dependent POD
Figure D2 (part 1 of 2) Defect depth dependent POD, Classification B1 (UCL)

- D5 -
crack depth (mm)
0102030405060708090
100
0 5 10 15 20 25 30 35 40
POD
95% conf.
d. Eddy current inspection: Harwell defect depth dependent POD
crack depth (mm)
0102030405060708090
100
0 5 10 15 20 25 30 35 40
POD
95% conf.
e. ACFM defect depth dependent POD
crack depth (mm)
0102030405060708090
100
0 5 10 15 20 25 30 35 40
POD
POD (rev.)
95% conf.
f. UCW defect depth dependent POD (Classification B2)
Figure D2 (part 2 of 2)
Defect depth dependent POD, Classification B1 (UCL)

- D6 -
UCL: laboratory trials
0%
20%
40%
60%
80%
100%
0% 20% 40% 60% 80% 100%FCR (%)
MPIEC-AV100EC-EMDEC-HarwellACFMUCWgood perf.
Figure D3 ROC diagram for UCL trials

- E1 -
APPENDIX E INTERCALIBRATION OF OFFSHORE NDT (ICON)
The full title of the final report42 is: InterCalibration of Offshore NDT (ICON), HSE Offshore Technology Report OTN 96 150,
August 1996. Table of contents - The review follows the chapters in the table of contents with the emphasis on quantification of
information. - The table of contents:
Acknowledgement Executive summary 1. Introduction/project objectives 2. General description of the project 3. Presentation of project partners and sponsors 4. Project review 5. Database 6. Procedures and specimen library 7. Results for partial POD trials 8. Intercalibration 9. Results analysis for CAT systems 10. Manual sea trials 11. CAT sea trials 12. Performance trends 13. Quality management 14. ICON project discussion 15. Final summary Appendices: ICON meetings and ICON reports.
- A glossary of terms is included which is essential for documents of this nature. 0. Executive summary - Reference is made to the UCL programme (see Appendix D). - For crack detection the range of trials extended across tubulars up to 450mm diameter, metal
difference butt welds, tee but welds, corroded specimens and coated specimens. - The report claims that it is now possible to choose techniques with a high POD and low False
Call. - The following table summarises all the test combinations:
sample type tubulars metal difference corr. tee butt tee butt coatedtechnique man. CAT man. CAT man. CAT man. CAT man.
ACFM v v v v v v v v v ACFM array v v v v
Cx EC v v v v v Lizard EC v v v v v v MPI (coils) v v v NA MPI (SL) v NA
MPI (yoke) v v v v v NA UCW v v v v v
- Eighteen items of NDT equipment were tested. - POD data show the capability and reliability of the equipment. - PODs for complex situations have been produced - The information allows FM analysis and inspection scheduling. - CAT* systems and related POD on crack detection, also using array systems, are described as
well. (*CAT = Computer Aided Telemanipulator) - The accuracy and reliability of crack sizing was found to be adequate.

- E2 -
1. Introduction/project objectives - Aim 1: to provide a (computerised) database of operational and technical characteristics - Aim 2: to conduct probabilistic assessment of the performance of the techniques - Aim 3: to allow quantitative comparisons between the techniques - Contribution of data to the structural reliability and stochastic fatigue models was an additional
objective. - CAT tests for operating a selected number of tools were also included. 2. General description of the project - ICON uses representative and reproducible test procedures and trials on realistic samples (incl.
operational constraints). - It uses Round Robin Testing, although this term is not found in the report. - The objective of "quantified, statistically sound, performance assessment" has proved to be an
extremely demanding specification, because: - a large database is required; - there are many variations; 3. Presentation of project partners and sponsors - The main parties were: Ifremer, UCL, Technomare, BV, TSC and Cybernetix (on CAT). - There were 9 sponsors. 4. Project review - Task 1: establishing databases for equipment, procedures and performances - Task 2: the laboratory testing of the procedures of the equipment - Task 3: the intercalibration for manual and CAT tools - Task 4: Offshore trials (not reported in this document) 5. Database - A questionnaire was sent to major operators, service companies and inspection equipment
specialists on equipment and typical defects of interest. - The following databases were developed: - the equipment available for subsea tasks - the operating procedures for subsea equipment - the performance of typically used subsea equipment. - 12 types have been identified but: high on the list is cracks at structural joints. ** In addition to crack detection and sizing, crack monitoring is also mentioned. - A comment is made why crack detection is supplemented by GVI and FMD and the use of ROV. - FMD is seen as a safety net. - The equipment list for ICON contains 32 types of equipment. ** There are four pages on the ICON database (p.15-19). This database will be reviewed
separately. 6. Procedures and specimen library 6.1 Confidence level and number of specimens - The establishing of groups (N) and the success rate for the group (S).leads to the point estimate
of POD for each group (S/N). - Historically, and based on polynomial statistics, a group of 29 cracks are required in order to
obtain the POD of 90% with a 95% confidence level. - However, only in a few cases in all the programmes reviewed for SINTAP, including ICON, are
so many defects in a group available. - A distinction is made between full POD trials and partial POD trials. - The latter are aimed at showing performance trends, e.g. how the POD curve could be affected
when the welding of two different steels is investigated. 6.2 Trials procedure - The tests were carried out at three sites (UK, France and Italy) and the following steps were
followed: - choice of NDT techniques and production of schedule - production of specimens for the library and characterisation - classification of cracks in all specimens

- E3 -
- procedure development & confirmation - blind trials - results analysis, review and issuing of final results. - The role of the sponsors is emphasised: - staff time to identify tasks, equipment, procedures, witnessing, reviewing of data 6.4 Specimen library - A recommendation for crack characterisation is made to avoid destructive testing - The library can be summarised as follows:
type no specimen ICON other treatment 1 tubular joints 26 braces 86 braces fatigue cracked 2 tee butt welds 30 welds - fatigue cracked 3 butt welds 30 welds - fatigue cracked 4 plates 3 - variable thickness 5 sealed tubes 10 3 dented/water filled 6 welded tubulars 10 circ. butt welds - root/subsurface defects
- The following details are of interest:
- tubulars: the library consists of 450 cracks (Classification A) - tubulars: length up to 670mm, depth up to 40mm - tubulars total weld length 130m
6.5 Classification of cracks - This is identical with the UCL classification. - In addition the PD6493 classification is introduced (see Figure E1). - The main difference between B1 and PD6493 is that B1 uses the major classification A crack in
the damaged region whereas PD6493 uses the dimensions of a fictitious crack after combination and recombination.
- B1(50), B1(100) and B1(circ) refer to the minimum distance between cracked areas, respectively 50mm, 100mm and 30° over the chord diameter.
- The following definitions are used: - POD is based on an indication of any size in the cracked region - - the length of the defect may be longer or shorter - the defect is underpredicted if the measured length is < 80% of the actual length - the defect is overpredicted if the measured length is > 120% of the actual length - if the measured length is > 500% of the actual length then it is taken as spurious. 6.6 Procedure development - Much attention is paid to this aspect of the project and the testing. 6.7 The following CAT-NDT procedure information was found in the old version of the report:
- Three types of CATs have been employed. Typical characteristics are: - length 2m, weight ±70kg, motion accuracy ± 1cm, repeatability ± 5mm. - 12 different tools were found to be suitable for CAT deployment incl. ACFM, EC,
FMD, MPI, photogrammetry, TOFD and wall thickness. - The tests and validation procedures comprised: - validation of probe holders - verification of weld zone accessibility
7. Results for partial POD trials (17 pages) - This section contains many tables of results. - The tables provide information to allow verification what is meant by ‘partial library’. - The total number of missed defects are given as well, but according to the DOS database these
occur mostly in the range 0-1mm depth and can be disregarded. - The information on missed defects in this range cannot be extracted from these tables. 8. Intercalibration - Intercalibration is a term to reflect ‘comparison of results’ between methods or definitions. - Graphs should be based on the same library. Therefore OSEL MPI (100% of the library) cannot
be put in the same diagram as BG MPI(50% of the library), p.65. - Figure 8.4 of the ICON final report adopts another presentation: the same % of spurious results
and the POD for ‘all cracks’, ‘cracks > 1mm deep’ and ‘cracks > 5mm deep’.

- E4 -
- The depth graphs seem to be more meaningful than the length graphs. - The definitions for capability and reliability are not given in the report but have verbally been
explained: - capability = the % of defects found by any of the investigators using a given system; - reliability = the % of defects found by all investigators using that same system. .- If the number of samples in a group is small the POD curve can show serious discontinuities.
This can be overcome using the method of OTN 96 179. - FMD measurements are covered in Appendix G. - The results of crack detection through a 1.0 or 2.0 mm coating can be summarised as follows: - ACFM 20 out of 20 (crack depth « 1mm ignored) - EC 20 out of 20 (crack depth « 1mm ignored) - UCW 18 out of 20 (two cracks of ±5mm depths missed) - Some typical results are collected in Figures E2 and E3. 15. Final summary - This final summary contains 19 conclusions which have been copied here for the record. 1. The Certifying Authority (Bureau Veritas) role in ICON was to ensure that the production of
equipment performance data was done in a very rigorous manner thus giving high confidence in the use of results, which were certified together with the trial procedures.
2. Thirty two procedures were produced and tested for both manual (diver) techniques and CAT
deployed techniques. 3. Most currently available techniques for crack detection and sizing have been compared across
the same range of specimens. 4. CAT deployed techniques using precise tracking (single sensor) for tubulars (450mm max dia)
and 'pick and place' (array) for plates have been assessed and been shown to be practicable for use offshore deployed from an ROV.
5. Capability and reliability comparisons have been made for several techniques (best and worst
performance) showing the sensitivity to operator. 6. POD success data together with false call data has been produced giving some measure of
reliability operating characteristic (ROC) of NDT systems. 7. New formats for POD data have been produced which are suited to fracture mechanics analysis.
These include plots against crack depth and also crack lengths defined using PD6493 criteria. 8. Data has been produced on the accuracy of crack sizing for surface breaking cracks. 9. For manual (diver) crack detection it has been possible to show that 7 systems are suitable for of
tubulars. These are, in alphabetical order, ACFM, Cx EC, Lizard EC, MPI (Coil), MPI(Yoke), UCW. The ACFM array had successful laboratory trials but no results were obtained in sea trials due to accidental damage to the equipment.
10. For manual (diver) crack detection on tubulars, tee butts, metal difference, corroded tee butts and
coated tubulars. ACFM, Cx EC and Lizard EC gave good crack detection performance. The systems also had a low false call rate although considerable variation in operators was observed.
11. For CAT deployment the number of cracks tested are fewer in number and hence statistical
confidence is much lower than with the manual diver system results. However, ACFM, ACFM array and MPI (Single Leg) all detected over 80% of the cracks inspected with a very low false call ratio for the trials carried out.
12. Crack sizing was found to be accurate with ACPD (TSC) and also possible with ACPD (BG),
ACFM and Lizard in descending order of accuracy. For ACPD (TSC) the overall accuracy of the mean prediction was within +10% with a standard deviation of about 1 mm (see Figure E4).
13. Flooded Member Detection was found to be possible with both ROV and Manual (Diver)
systems. The Tracerco system correctly estimated all fill levels tested, and the Gascosonic and

- E5 -
ROVPROBE equipment both recorded as filled all samples of 50% full or more. 14. Measurement of remaining ligament and wall thickness was found to be possible and accurate
using both manual (diver) and ROV deployment. 15. Anode current measurement using GSCAN was found to be possible with errors limited to about
0.3 amps. 16. Visual inspection using the TV Trackmeter deployed from an ROV, was found to be quite
practical for member sizing. Accuracy was found to be within about 2%. 17. Measurement of dents was found to be quite practical using photogrammetry. Using the Camel
70 sizing within about 10% was possible. 18. Detection of lack of root penetration and simulated erosion/corrosion in circumferentially
welded tubulars was found to be quite practical with TOFD. 33 out of 35 lack of root penetration defects>1mm deep and 20mm long were detected (16 out of 16 >2mm deep), and 9 out of 9 root erosion defects >2mm deep and 30mm long were detected.
19. All the equipment details, procedure, and trials results have been assembled in three databases.
This software package allows the choice of the most suitable equipment on the basis of a chosen task.
coplanar surface flaws
a1 a2
2 c1
2 c2 c2s
criteria for interaction
for c1 = c2: s = 2 c1
effective dimensions
after interaction
a = a2 2 c = 2 c1 + 2 c2 + s
Figure E1 PD6493 coplanar surface flaws combination

- E6 -
ICON: various MPI trial results
0%
20%
40%
60%
80%
100%
0% 20% 40% 60% 80% 100%FCR (%)
OIS: MPI coils FROSEL: MPI coils UKBG: yoke at seaOIS: coils at seaBG: yoke UKBG: coils UKgood perf.
ICON: non-MPI methods
0%
20%
40%
60%
80%
100%
0% 20% 40% 60% 80% 100%FCR (%)
Hocking: EC tubulars FRHocking: EC tubulars UKLizard: EC tubulars FR (C)TSC: ACFM tubulars FRTSC: ACFM tubulars UKUCW: tubulars UKgood perf.
ICON: trials at sea
0%
20%
40%
60%
80%
100%
0% 20% 40% 60% 80% 100%FCR (%)
BG: yoke at seaOIS: coils at seaLizard: EC at seaTSC: ACFM tub. at sea
good perf.
Figure E2 ROC diagrams for various ICON trials42

- E7 -
1. Comex Hocking
performance trend for geometry (depth)
(tubulars and T-butt) Ref. 44 Fig. 2b
2. MPI yoke performance
trend for dissimilar metals (depth)
(tubulars and metal
difference butts) Ref. 44 Fig. 3b
3. ACFM performance trend
for corrosion (depth) (tubulars and corroded T-
butts) Ref. 44 Fig. 4b
4. Comparison of tank and
sea results for MPI coils system (depth)
(tank tests and sea trials) Ref. 44 Fig. 6b
5. Comparison of CAT and
manual results for Comex EC on tubulars (depth)
(tubulars and CAT) Ref. 44 Fig. 8b
Figure E3 ICON depth dependent POD results44

- E8 -
a. ACPD results for three ‘regularly shaped’ defects12,40
b. BG and DNV ACPD crack sizing data42
c. ACFM crack sizing data42
Figure E4 Crack depth calibration40,42

- E9 -
Table: ICON some results for FCR and POD
method total total detected FCR FCR PODall >1mm >1mm all >1mm >1mm
1 OIS: MPI coils FR 52 42 42 17% 21% 100%2 OSEL: MPI coils UK 84 66 65 47% 60% 98%3 BG: yoke at sea 19 15 13 11% 14% 87%4 OIS: coils at sea 19 15 15 58% 73% 100%5 BG: yoke UK 37 26 26 32% 46% 100%6 BG: coils UK 37 26 26 5% 7% 100%7 BG: yoke corr.T (FR/UK) 66 28 20 1% 2% 71%8 BG: yoke metal diff. UK 38 24 14 7% 11% 58%9 BG: yoke 8560 T butt UK 36 26 24 13% 18% 92%
10 BG: yoke UW2 T butt UK 36 26 23 16% 22% 88%11 Hocking: EC tubulars FR 46 39 35 23% 27% 90%12 Hocking: EC tubulars UK 87 68 63 10% 13% 93%13 Lizard: EC tubulars FR(C) 29 20 13 3% 4% 65%14 Lizard: EC at sea 19 15 13 21% 27% 87%15 TSC: ACFM tub. at sea 14 12 12 0% 0% 100%16 TSC: ACFM epoxy coated 12 10 10 8% 10% 100%17 TSC: ACFM tubulars FR 45 37 35 80% 97% 95%18 TSC: ACFM tubulars UK 89 68 67 9% 12% 99%19 TSC: ACFM array UK 9 8 6 0% 0% 75%20 TSC: ACFM CAT FR 13 5 4 38% 99% 80%21 TSC: ACFM corr.T (FR/UK) 52 23 22 13% 29% 96%22 UCW: tubulars UK 75 55 48 29% 40% 87%
Table: UCL: some results for FCR and POD
22 MPI 88 73 71 53% 97%22 EC AV100 92 75 69 8% 92%22 EC EMD 88 71 54 10% 76%22 EC Harwell 92 75 67 25% 89%22 ACFM 92 75 72 15% 96%22 UCW 72 55 50 45% 91%
- E10 -
Some points on ICON: - Vast amount of information. - Many variables both in equipment and in the types of test specimens. - The ROC (reliability operating curve) in ICON is different from PISC: - ICON takes all defects into account - PISC takes only rejectable defects into account In view of the (perceived) acceptance of 1mm deep defects the results for ROC are given using
the number of defects > 1mm deep only. - The three ROC diagrams contain some interesting observations:
- both for MPI and non-MPI methods the variation in FCR between two organisations (10-90%)
- the similarity in results for MPI and non-MPI methods - similar performance between sea trials and land trials - only Lizard on land has an unacceptably low POD of 65% for 20 defects >1mm deep - The UCL findings have been indicated for comparison
- confirming the high FCR for MPI and UCW - the below average performance of EC-EMD 9Which was not part of ICON) - Harwell (then) did much better than Lizard (now)
- From the table with some ROC data the following conclusions can be drawn: - the table contains only 25% of the total number of records
- low POD (POD = 80%) were observed for: - BG yoke corr T (FR/UK) - BG: yoke metal difference (UK) - Lizard: EC tubulars (FR) - TSC: ACFM array (UK)
- a high FCR (FCR » 20%) were observed for: - many (not all) MPI results - TSC: ACFM on tubulars (FR) - TSC ACFM CAT (FR)
- Variation in POD - whenever trials were done at different locations the results were similar - Variation in FCR - large variations in FCRs were observed
- The main tables in the ICON database are for the POD versus defect length or depth. - However, only when the dataset contains more than say 25 defects > 1mm deep can a POD curve
be established. - For the same reason the POD curves with confidence levels have been abolished, probably
because not many of the results had enough datapoints - On the other hand for many methods the POD for defects >1mm is close to 100% hence then no
new information is obtained from a POD curve. - The tables with length comparison were missing from my copy of the ICON database. - Spurious results in the database could be either in number (according to the ROC tables) or in
percentage (according to the ROC graphs. The latter is assumed for the figures in Note 007. Executive summary - Defects are based on the PD6493 method of combining adjacent cracks.

- E11 -
4.2.8 Performance trends - This section comprises both an overview of the tests performed as well as some of the results.
However, results will be based on the ICON database itself. - The two tables on the next page are worth recording: crack detection trials and crack sizing
trials. - The predictions for crack depth from 1-6mm using TSC ACPD on plates and from 6-25mm on
tubulars is good. Additional information on this issue can be found in the UCL review report. 4.3 Intercalibration - This section describes details of the various testsites of the full POD trials, POD as a function of
method and crack length, ROC. - On ROC (reliability operating characterisation): this is more involved than indicated on p.57. ** It is interesting to note that ICON concentrates on POD whereas PISC on probability of
detection and correct rejection. - p.61, in Fig. 12 and 13 information on crack depth sizing is given in the range 4-25mm showing
a small negative bias. - The predictions for crack depth from 1-6mm using TSC ACPD on plates and from 6-25mm on
tubulars is good. Additional information on this issue can be found in the UCL review report. ** It is interesting to note that ICON concentrates on POD whereas PISC on probability of
detection and correct rejection. - p.61, in Fig. 12 and 13 information on crack depth sizing is given in the range 4-25mm showing
a small negative bias. uncoated
tub. tee butts metal diff. corroded T coated nodes sea trials
MPI coils C C C MPI yoke C C C C Comex EC C C C C C Lizard EC C C C C C ACFM C C C C C C ACFM array C C C C C UCW C C C Table 11 Crack detection performance trend trials (p.46, title misleading: crack detection trials) Nodes Plates Tee butts corroded T U11 ACPD C C C BG ACPD C C OSEL- ACPD C DnV ACPD C ACFM C C C C Lizard C C C C ACFM array C C C Table 12 Crack sizing performance trend trials (p.47, title misleading: crack sizing trials)
C = completed - Other tests involve: - measurements of dents - FMD - measurements of sub-surface flaws using TOFD - Crack detection through coating using ACFM and EC for coating thicknesses up to 2mm is also
mentioned. 5. Project management 6. ICON project discussion 6.1 Introduction 6.2 Procedure development 6.3 Capability and reliability

- E12 -
- No proper definitions of these terms have been given in text except that capability is what the equipment can perform and reliability what an operator can perform. From the database:
- capability is the best result for a certain technique; - reliability is the poorest results for a certain technique. 6.4 Quantification of POD performance - All quantifications are on length whereas defect rejection will be on depth (although depth can
only be measured with a limited number of techniques. 6.5 POD performance for FM, inspection scheduling, etc. ** page 83 is missing from this copy of the report. 6.6 CAT system POD quantification - Some useful comments are made on the use of CAT tools, or the execution of tests with CAT. 6.7 ROV CAT inspection for cracks - Some useful comments are made on the use of CAT tools, or the execution of tests with CAT. 6.8 ICON software Appendix 3. List of ICON reports issued - Some 200 reports have been prepared to reflect procedures, trial results etc. Results: some results on FCR (false call rate) and POD (probability of detection) are presented in this
note as well. These are based on findings for defects > 1mm deep. Hence both FCR and POD differ from those in ICON where all defects are counted.

- F1 -
APPENDIX F TOPSIDES INSPECTION PROJECT
PHASE I REPORT45 Executive summary - Defects are based on the PD6493 method of combining adjacent cracks. - Advantages of EM methods over MPI are: - their ability to operate through coatings - the possibility for sizing of crack depth - the electronic recording of the data scan - The main conclusions were: - EM methods performed equally well to MPI
- the variation between operators on each system tended to be greater than the differences between the systems.
- the capability of ACFM and Lizard for depth sizing was similar to ACPD but operator dependent.
1. Introduction - The aim was to check the viability of the methods for more complex geometries as found in
topsides such as ratholes, weld ends, corners, heavy corrosion and coatings, including metal sprayed coatings.
- Five methods were tested: Hocking Phasec, TSC U9, Millstrong Lizard and MPI permanent magnet and AC yoke both using black ink.
- Operator variability was tested by taking three operators from each technique: one from a service company, one from the steering committee and one from the manufacturer.
- The EM probes were still in a state of development with the exception of Hocking for which operational procedures had been developed and approved by CAs.
2. Specimens - The basic configuration was a 1 x 0.4m base plate with a 0.6 x 0.1m vertical attachment plate
with a semi-circular cut-out to simulate a rathole. The plates were 15mm thick BS4360:43A. - Three types were manufactured (see Appendix B of Ref. 45 for details). The main type (Type II)
was with continuous welding and representative for current offshore fabrication practice. The Types I and III are variations with respect to Type II, with Type I not really representative.
- The trials were based on 12 Type I specimens, 9 Type II specimens and 6 Type III specimens. - Three point bending fatigue tests were used to generate fatigue cracks: Type I: 4 longitudinal 11 transverse cracks Type II/III 14 longitudinal 14 transverse cracks - Hence, the main library (Type II/III) contained 28 cracks which is insufficient to develop POD
curves. - In addition, from ICON, T-butt specimens and butt-weld specimens of 20mm thick plates were
also used. 3. Characterisation of TIP crack library - This section describes the procedure to arrive at the crack characterisation, using both MPI and
ACPD. - For the ICON specimens TOFD was also used for defects in excess of 5mm were employed; for
MPI a magnetic yoke was used. 6. Analysis of results from TIP samples - Two defects were poorly detected by both ACFM and Lizard and found by all MPI and Hocking
operators. - These specimens were destructively sectioned and the defects were found to be 3 x 50mm and
4.5 x 80mm (see Figure H3 and H4 of the TIP Phase 1 report for details). - The main results can be found in Figure 6.2 of the TIP Phase 1 report, showing the results for 4
methods and 3 operators. - It is shown that the average PODs are in or quite close to the box of acceptable results. - This was considered to be a good result, particularly for topsides where there is, in general, a

- F2 -
large repetition of detailing and stresses and where defect inspection is relatively cheap once the operator is on the platform.
- Tables with all the details are presented, e.g. on length accuracy. 7. Results for ICON specimens - For the T-butt samples the following conclusions are derived (see Figure F1-F2): - increasing POD leads to increasing FCR - MPI appears to be less successful than EM for these samples - MPI with both AC yoke (AC) and permanent magnet (PM) was poor - Hocking and ACFM had results in the “good performance” box. - Lizard had many spurious indications - For the butt weld specimens (see Figure F1-F2) - the number of cracks deeper than 1mm is relatively small (25). - one consistent operator error on ACFM was identified. - the poor results for MPI with permanent magnet (PM) were confirmed - There is consistency between the inspection results for ICON T-butt and butt joint, confirming
the poor result for MPI and the high FCR for Lizard. - On MPI and Lizard there is no consistency between the TIP results and the ICON results. The
cause may well be the difference in the crack library. 8. Conclusions - EM through epoxy coating gave similar results to MPI on bare metal. - Destructive results showed that MPI and ACPD characterisation were accurate for length and
depth. - Variability between operators was considerable both in reporting cracks and spurious
indications. - Most spurious results reported were less than 20mm long. - The ACFM and Lizard systems were similar to ACPD on crack depth sizing; but this sometimes
depended on the operator. Appendix H Detailed results of TIP samples - Full details of the crack characterisation in Type II/III specimens, both for longitudinal and
transverse cracks, and the number of misses for each method are given. - There is a difference in shape between these two types of cracks: 1:15 for longitudinal cracks
and 1:8 for transverse cracks. - The mean crack depth is greater than 4 mm, hence rather deep compared with the 1mm cut-off.
PHASE II REPORT46 Executive summary - Three specific topics were investigated under TIP-II regarding fatigue crack detection: - on aluminium flame sprayed samples using various techniques - on small scale tubular joints with red oxide coating using EM - on some samples of heavily pitted surfaces using EM. - The conclusions were: - EM was feasible on aluminium sprayed samples but signals were difficult to interpret - UCW worked well under simple geometries - EM worked satisfactorily on the coated tubulars - pitting corrosion (3mm deep) reduced efficiency of EM and increased FCR. 1. Introduction - The reasons for the selection of these samples are given in the introduction:
- Al sprayed coating could affect EM because of different conductivity and ultrasonic signal transmission
- small tubulars have rapidly changing geometries - EM methods allow non-removal of coatings

- F3 -
- corroded surfaces and EM may allow non-removal of rust. - Some work on rusty surfaces has been carried out under ICON (check). 2. Aluminium coated samples - Three types of specimens were used: - butt welded samples (200-300mm long) - T butt samples (250mm long) - TIP-III samples - No thicknesses are given in the figures or in the text - After some investigation it was decided that the introduction of cracks after coating would be the
most realistic option. - The coating was a normally applied coating by Phillips and BG - Seven methods were investigated: those as in TIP-I and UCW and dye penetrant. - AC magnetic yoke was totally unsuccessful on these trials. - On EM methods: the crack detection was not easy: contractors had difficulty in the interpretation
of the signals. - On ACFM: low detection rate and many spurious indications. - On Hocking: good detection but too many spurious indications - On Lizard: the original results were unsatisfactory and a new technique was developed and
results shown here. - On UCW: the results on these simple geometries are quite good, but difficulties are expected
when geometries are more complex. - On dye penetrant: the results are mixed. - The total number of defects was 14 on the seven butt and T butt and 8 on the five TIP samples. - The tables require some study to interpret. 3. Small scale tubular joints - The samples were manufactured from a scrapped crane boom; the thickness of the tubulars was
5mm. - A standard red oxide paint was used. - The samples contained five cracks of which one was 0.4mm deep and three were through
thickness cracks and the fifth crack was 3mm deep. - The results for two EM systems and one ACFM system were mixed: - all systems detected the 3mm deep crack - ACFM detected the 0.4mm deep defect but missed a through thickness crack - the EM systems detected all three through thickness cracks. - No removal of coating is required when applying these EM techniques. 4. Heavily corroded samples - All operators thought the samples were uninspectable because of the heavy degree of corrosion. - The work under ICON using simply rusty surfaces appear to be more realistic.
- F4 -
TIP Type II/III specimens > 1mm deep
0.00
0.20
0.40
0.60
0.80
1.00
0.00 0.20 0.40 0.60 0.80 1.00FCR
MPIHockingACFMLizardgood perf.
ICON T butt welds cracks > 1mm deep
0.00
0.20
0.40
0.60
0.80
1.00
0.00 0.20 0.40 0.60 0.80 1.00FCR
MPI-ACHockingACFMLizardgood perf.
ICON butt welds cracks > 1mm deep
0.00
0.20
0.40
0.60
0.80
1.00
0.00 0.20 0.40 0.60 0.80 1.00FCR
MPI-PMHockingACFMLizardgood perf.
Figure F1 TIP results for uncoated specimens

- F5 -
Butt &T butt, aluminium sprayed, >1mm deep
0.00
0.20
0.40
0.60
0.80
1.00
0.00 0.20 0.40 0.60 0.80 1.00FCR
UCWHockingACFMLizardgood perf.
dye penetrant
TIP-III, aluminium sprayed, >1mm deep
0.00
0.20
0.40
0.60
0.80
1.00
0.00 0.20 0.40 0.60 0.80 1.00FCR
UCWHockingACFMLizardgood perf.
Small scale tubulars, paint coated, limited sample
0.00
0.20
0.40
0.60
0.80
1.00
0.00 0.20 0.40 0.60 0.80 1.00FCR
HockingACFMLizardgood perf.
Figure F2 TIP results for coated specimens

- F6 -
0%
20%
40%
60%
80%
100%
0.0 2.0 4.0 6.0 8.0 10.0defect depth (mm)
ACFMEC1EC2MPI
Figure F3 POD for TIP butt and T-butt welds

- G1 -
APPENDIX G FLOODED MEMBER DETECTION (FMD) This appendix outlines the presentation in Aberdeen on FMD (flooded member detection). This meeting was arranged by the British Institute for Non-Destructive Testing in Aberdeen on Wednesday 26th February 1997. The programme consisted of six presentations and an introduction. In this appendix the salient points on detection methods and confidence are summarised together with findings in the ICON final report)42.
1. Introduction - The essence seems to be on through thickness defects, particularly those generated from the root
of the weld. Other causes could be accidental damage and failure of an anode bracket. Two methods of detection (UT and gamma ray) are in use.
- Furthermore, whenever this method is discussed the structural implications and the planning of inspection should be given adequate attention.
- At the moment some operators only apply visual inspection supplemented by FMD for steel platform underwater inspection.
2. Principles of gamma ray transmission FMD - Gamma ray detection is an old method with ICI. The ROV requirements, the yoke, a detector
and the necessary shielding of the gamma ray source were discussed. The source is very small (2-10 mCurry) and a 3-6m distance should be maintained.
- The accidental event of losing a source should be accounted for although it has not happened to date. The method is accurate but good data on member diameter and thickness should be available. Calibration by 90 degrees rotation of the yoke is required.
- Stability of the ROV in the splash zone was noted as a specific problem. - Debris causes errors but debris is never uniform: hence this can be overcome by taking more
readings in case of doubt.
3. ICON trials on FMD - In ICON for the testing of FMD 30 variations were selected. - The tests comprised clean 0.4-0.5m diameter tubes, randomly filled with water and with or
without CAT (computer assisted (operated) telemanipulator). - UT at 50% water fill resulted in a POD of 100% and 70% at 10% water fill (see Table 8.4 in
Ref. 42 and Table G1). - Radiography: at all levels 100% was obtained. - Corrosion on the inside did not result in a significant change but 15mm debris caused complete
loss of signal (probably UT). - In summary: because of the limit in the library the reliability of FMD in ICON was indicatively
demonstrated.
4. Radiographic FMD - a user's viewpoint - Planning is very important; in particular, information on D, t and thickness transitions of the
tubulars should readily be available. - Secondly, member accessibility (size of yoke) and structural appurtenances (anodes) were
quoted. - Other items that need to be considered are: debris (external), marine growth, intakes and mud
(100-250mm). - Some practical problems were also mentioned, for example: ROVs don't like kelp.
5. Constraints and practical problems and benefits using FMD - Particular problem areas are: tight cracks, coating, sealing by marine growth, difficulty in access
(conductor guide framing) particularly on old platforms, cracks on the leg side (water or grouting in the legs).
- The costs of FMD appear to be attractive: in a two day programme 2000 readings can be made. - A benefit of FMD is that there is a hard copy for later reference. - Only through thickness defects, which have a short remaining life, are detected.

- G2 -
Trial Result
Set Filling 0% 10% 50% 90/100% 0% 9 1 105 3 2 4 1
50% 7 1 90/100% 12
Table G1 FMD results with UT equipment (Table 8.4 in Ref. 42)

- H1 -
APPENDIX H POTENTIAL AREAS FOR FUTURE DEVELOPMENTS
In order to identify areas for potential future developments in POD/POS it is important to highlight the place of NDT in the overall process of arriving at safe, welded structures. The elements to arrive at safe structures can be put in the following three categories (Table H1): - design and design codes - welding and inspection - defect assessment
H.1 Design and design codes For the purpose of this discussion it is assumed that the design is carried out using a set of well-recognised design codes and that the occurrence of design errors can be disregarded. As stated in Section 6.5 the design codes are acceptable only when good workmanship, including the use of good materials, can be assumed. In that case compliance with the code is a sufficient condition for an acceptable structure.
The design code itself is based on historic developments for which any major failure has been checked and, if necessary, incorporated in subsequent revisions of the code.
Hence the only item which requires further attention is the definition of good workmanship in terms of welding and non-destructive inspection which are addressed in the next sections.
H.2 Welding Welding is a well established method of construction. The aim should be, as identified in Table H1, to optimise welding to reduce defects. This is achieved through the detailed description of the welding procedures and a QA plan to ensure that the procedures are complied with in practice. In addition, much attention is paid to welder qualification.
Secondly, once the code for fabrication has been defined then also defect acceptance from NDT is part of the fabrication. Here an economic argument comes in: if the number of defects are too high then the manufacturer has an economic interest in improving welding because the repair of welding defects is a costly process which also has a bearing on the scheduling of the manufacturing.
It is important not only from an economic point of view but also for structural safety to have an indication of the unacceptable defects left in-place. If the CRR (correct rejection rate) is of the order of 60% then the number of repairs per metre of welding provides a good, first order estimate of the number of rejectable defects left in place as well. Therefore:
Item 1: More information should be collected on the number of repairs per metre of welding.
The number of repairs, or rejectable defects left in place, should have a bearing on the defect assessment. It will depend on the type of structure and on the adoption of a manual or automatic welding process.
H.3 Inspection The main objective of this report is on POD/POS of inspection. Historically the main methods for the detection of buried defects are RT and UT. Much effort is put in optimising inspection methods by procedures and to train inspectors and insist on inspector qualification. Much work both in the USA and Europe are ongoing in this area.
In the report a CRR of 60% was quoted as a suitable first approximation for the detection rate of rejectable defects. The question should be asked how the size of rejectable defects are determined. It is based on historic evidence: the detection rate of the rejectable defects should be sufficiently large so that the majority of these defects can be found. Often inspection is directed through economic arguments: i.e. what is the cheapest, accepted inspection method for a certain application. Therefore:
Item 2: More information on the economics of inspection should be gathered and analysed.

- H2 -
The POD can be improved by using two independent methods. In that way the CRR can be improved from say 60% to over 80%, which is a major step. This leads to the following question:
Item 3: Analysis should be carried out to determine the economic advantage in increasing the correct rejection ratio (CRR) from 60% to 80%.
In other words, if a CRR of 60% leads to a structure which is fit-for-purpose then the increase to a POD of 80% is an unnecessary expenditure.
An other item with regards to POD, which should be further addressed, is related to the high variability in POD for MPI. Both in UCL and ICON, where underwater MPI was used, the POD even for small defects was high whereas for TIP and Nordtest the POD for MPI, using land-based methods, showed large variations. Therefore:
Item 4: More fundamental work is required in the area of MPI to explain the large difference in POD between onshore and offshore practices.
If inspection is considered as a QA tool then the fabricated structure, after inspection and repair, is a sufficient condition to ensure that the structure is fit-for-purpose. In other words: in that case NDT ensures good workmanship.
Finally, it is not uncommon to use RT to check for defects and supplement it by UT for the sizing and categorising (reject/accept) of the defect. Particularly the developments of TOFD are worth mentioning: it is the application of geo-science applied to welded structures. It provides an independent method with excellent potential for automation (as for example shown on pipeline inspection) and currently particularly suitable for defect sizing in simple geometries. Therefore:
Item 5: The development of TOFD for the sizing of defects in complex geometries should be stimulated.
This is an ongoing activity for example at NIL.
H.4 Missed rejectable defects For further assessment it is essential to determine a characteristic defect or the maximum associated defect. Historically it is based on expert opinion and it is often the primary variable once the defect assessment procedure (e.g. PD 6493) for a given structure has been adopted.
Item 6: It is necessary to develop a rational basis for the defect size for defect assessment.
It is understood that this is one of the objectives of SINTAP.
H.5 Defect assessment The beauty of defect assessment is that for known defects a criticality evaluation can be carried out and repairs can be avoided on a rational basis. However, the methodology is known to be conservative.
As recently demonstrated on cracked tubular joints, there appears to be a simple alternative to defect assessment, namely to consider the net effective area only. This approach seems justifiable for modern ductile material with proper, modern welding practices. Therefore there is a need for a more rational basis for defect assessment of real structures:
Item 7: There should be more full scale tests to support and give direction to defect assessment.
CTOD is often the basis for defect assessment. However, in the old days with poorer materials and welding practices fully acceptable structures were designed and built based on adequate Charpy values of the material and the welding. This provides a vast database and should be used as well. Hence:
Item 8: Historic data on older structures can also be used to calibrate defect assessment procedures.

- H3 -
H.6 Closing remarks
The topic addressed under items 7-8 of full scale testing and re-assessment of older structures falls outside the scope of the present study. However, it seems to be the only rational basis to ensure that a higher performance in inspection is cost effective and fit-for-purpose.
The full scale testing of specimens with known defects has been applied before; for example, in Ref. 22, tubular joints with fatigue cracks were tested to destruction. It has been demonstrated in these tests that for good quality steel the detrimental effect of defects can be calculated by considering the net effective area only. Hence the effect of small defects on the ultimate capacity of tubular joints is small.
Secondly, in the NIL project it was mentioned that it is very well possible to weld structures with pre-determined welding defects. Also JRC-Petten is able to fabricate surface defects of known shape through spark-erosion. Ref. 23 addresses this topic of full scale testing of pipeline structures and the consequences of given Charpy and CTOD values. A similar, more general approach is proposed in Ref. 24.

DESIGN CODES Design Codes
assume good workmanship
ignore defectsassume good
materialstructure
for offshore structure
for pressure vessel
no test pressure test
1. Design assumes good workmanship2. Compliance with the code is a sufficient condition for an acceptable structure
WELDING weldingAND
INSPECTIONoptimise
welding to defects
welding procedure
NDToptimise
inspection to reduce missing
of rejectable
welder qualification
accept inspected structure
go for further analysis
inspection procedure
qualification
histogram of defects
missed rejectable
inspector qualification
histogram of rejectable
determine the size of defects
for further
NDT ensures good workmanship
DEFECT ASSESSMENT
Defect assessment
assume defectignore defect assessment
determine material
property (CTOD)
check acceptance of
solutions if unacceptable
accept/reject structure
modify structuretry more
advanced methods
How reliable is defect assessment?
Table H1 Flow diagram for defect detection and assessment

Printed and published by the Health and Safety ExecutiveC.50 04/02

OTO 2000/018
£20.00 9 780717 622979
ISBN 0-7176-2297-5