office of the vice chancellor for finance unt system shared services update tasscubo primary members...
Post on 22-Dec-2015
218 views
TRANSCRIPT

OFFICE OF THE VICE CHANCELLOR FOR FINANCE
UNT System Shared Services Update
TASSCUBO Primary Members
Terry PankratzVice Chancellor for Finance
Presented By
October 17, 2011

OFFICE OF THE VICE CHANCELLOR FOR FINANCE
UNT System Shared Services Update
Agenda
• Overview• UNT System Business Service Center (BSC)• UNT System Information Technology Shared Services (ITSS)• CFO Discussions• Questions
2October 17, 2011

OFFICE OF THE VICE CHANCELLOR FOR FINANCE
UNT System Shared Services Update3
Current Trends• According to Shared Services & Outsourcing Network
In 2004, 24% of executives worldwide thought shared services was ‘strategic’ for their business.
In 2011, 89% think it is…
• According to the Deloitte – 2011 Global Shared Services Survey Results 13% of respondents in 2011 are from the Public Sector
(up from 7% in 2009) 85% of shared service centers are less than 10 years old
(A young and growing trend) Top three areas implementing shared services:
—Finance (93%)—Human Resources (60%)—IT (48%)
View the entire survey results at http://www.deloitte.com/assets/Dcom-UnitedStates/Local%20Assets/Documents/IMOs/Shared%20Services/us_sdt_2011GlobalSharedServicesSurveyExecutiveSummary.pdf
October 17, 2011

OFFICE OF THE VICE CHANCELLOR FOR FINANCE
UNT System Shared Services Update4
UNT System Shared Services Goals• Improve efficiency by eliminating unnecessary duplication of
services across the UNT System• Manage business services strategically• Promote the buying power of the UNT System and increase
the ability to leverage resources• Improve quality by continually monitoring customer
expectations and satisfaction and continuous process evaluation and improvement
• Facilitate long-term financial savings by providing more efficient (cost effective) services
October 17, 2011

OFFICE OF THE VICE CHANCELLOR FOR FINANCE
UNT System Shared Services Update5
Guiding Principles
1. Standardize2. Automate3. Co-locate (where advantageous)4. Take care of our employees5. Exceed customer expectations
October 17, 2011

OFFICE OF THE VICE CHANCELLOR FOR FINANCE
UNT System Shared Services Update6
Shared Services Evolutionary StagesImplement
FY 2011-2012Basic
FY 2012-2013Marketplace Advanced
Marketplace
ObjectiveCentralize services,
standardize processes
Reduce costs, automate processes,
implement CI
Provide choice of most effective supplier
Generate revenue and
profits
Consolidation of:•Trans./admin services•Professional/advisory services
Charging for services
Possible external sales?
Separation of governance function?
Services mandated?•Trans./admin services•Professional/advisory services
Entity Department Department Department Separate entity
Adapted from Shared Services: Mining for Corporate Gold” – Barbara Quinn, Robert Cooke, and Andrew Kris
October 17, 2011

OFFICE OF THE VICE CHANCELLOR FOR FINANCE
UNT System Shared Services Update7
UNT System Shared Services Framework
Shared ServicesInformation Technology
AVC / CIO(UNT System IT Services)
Ente
rpris
e Sy
stem
s
IT S
trat
egy
and
Gov
erna
nce
Cam
pus I
T Se
rvic
es
Business Services
AVC for Business Services(UNT System Business Service Center)
Purc
hasi
ng
Paym
ents
Hum
an
Reso
urce
s
Payr
oll
October 17, 2011

OFFICE OF THE VICE CHANCELLOR FOR FINANCE
UNT System Shared Services Update8
Two Interdependent Positions• Associate Vice Chancellor and Chief Information Officer
Develop a System-wide IT Governance process Develop and implement short and long term plans to leverage
technology Improve service quality Reduce costs
• Associate Vice Chancellor for Business Services Start-up the Business Service Center Deliver transaction based services to the campuses Improve service quality Reduce costs
October 17, 2011

OFFICE OF THE VICE CHANCELLOR FOR FINANCE
UNT System Shared Services Update9
How did we get here? March 2008UNT System Board authorized study of shared services
November 2009 Alvarez & Marsal provided initial recommendationsUNT System Board authorized HR and IT implementations
January 2010UNT System Shared Services Council (SSC) met for the first time
June 2010Development of Shared Services Framework began (Accenture)
August 2010Board authorized evaluation beyond HR and ITCampus leaders notified of the role and scope of the new System CIO
position
September 2010Accenture study completed Business Service Center (BSC) recommended by AccentureShared Services expanded to include purchasing, payments and payroll
November 2010BSC Project Implementation Team formed
December 2010The Implementation Team began collecting service and effort data from
departments
January 2011The Implementation Team submitted service recommendations to the SSC Campus leaders notified of role and scope of new AVC for Business Services
February 2011The SSC and Chancellor approved BSC initial servicesLean Six Sigma training began
March 2011BSC roster compiled from existing campus positionsSSC approved soft launch for June 1, 2011
April 2011AVC/System CIO started IT leadership began developing new service delivery model BSC roster finalized -136 campus employees notified
May 2011Welcome Meetings for BSC employees conductedTransition Workshops for BSC employees conducted
June 2011Soft launch of BSC operations June 1, 2011AVC for Business Services startedBSC organizational development beganFY 12 BSC budget presented to stakeholdersProposed shared IT Organization Structure introducedIT Service Delivery Framework introduced
July/August 2011BSC employee onboarding sessions conductedBSC budget finalizedContinuous improvement projects initiated
September 2011IT governance design finalizedPerformance scorecards were developed for BSC and ITBSC goes liveIT conducts soft launch for shared services
October 2011BSC Operations Committee formed
October 17, 2011

OFFICE OF THE VICE CHANCELLOR FOR FINANCE
UNT System Shared Services Update
BSC Strategy Map
10
Improve Employee Skills
Maintain a Motivated Workforce
Continually Improve Key
Processes
Deliver Exceptional Customer
Service
Improve Cost Effectiveness
Leverage Information Technology
Leverage Our Size
CUSTOMER PERSPECTIVE FINANCIAL PERSPECTIVE
INTERNAL PROCESSES
LEARNING AND GROWTH
FINANCIAL PERSPECTIVE CUSTOMER PERSPECTIVE
INTERNAL PROCESSES
LEARNING AND GROWTH
IT Strategy Map
Improve Employee Skills
Maintain a Motivated Workforce
Continually Improve Key
Processes
Deliver Exceptional Customer
Service
Leverage Shared
Licensing
Improve Cost Effectiveness
Consolidate Services
&Facilities
Leverage Current
Technology
October 17, 2011

OFFICE OF THE VICE CHANCELLOR FOR FINANCE
UNT System Shared Services Update11
UNT System Business Service Center (BSC)
October 17, 2011

OFFICE OF THE VICE CHANCELLOR FOR FINANCE
UNT System Shared Services Update12
Before BSC Transition After BSC Transition
Current Campus BSCPayroll 49 0 49Human Resources 74 27 47Purchasing and Payments Services 93 11 82Total 216 38 178
BSC – Services
October 17, 2011
OFFICE OF THE VICE CHANCELLOR FOR FINANCE
UNT System Shared Services Update13
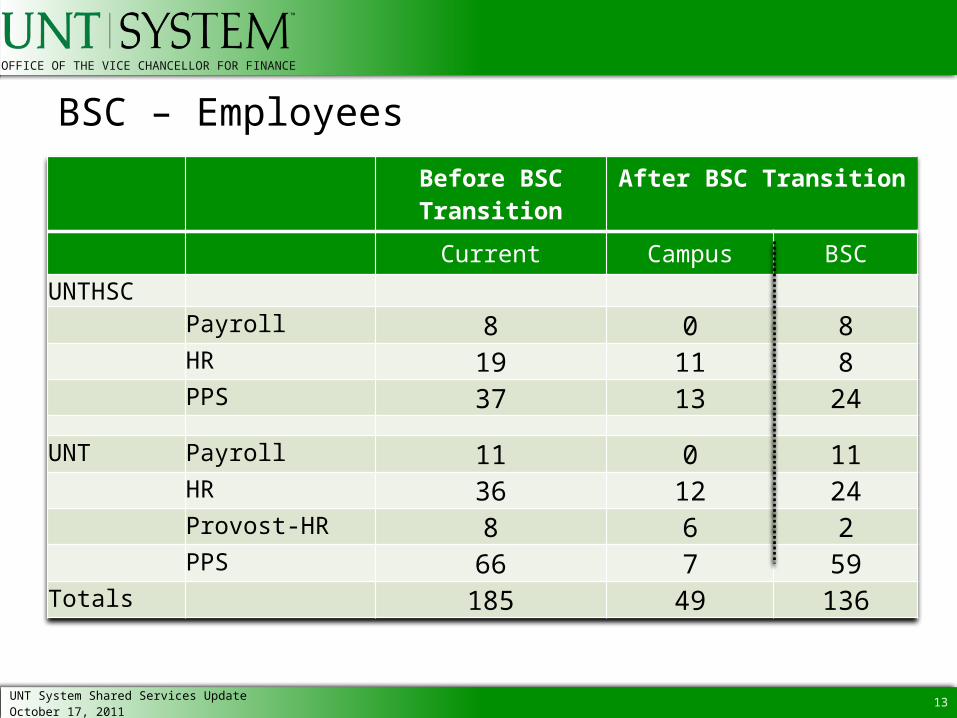
Before BSC Transition
After BSC Transition
Current Campus BSCUNTHSC
Payroll 8 0 8HR 19 11 8PPS 37 13 24
UNT Payroll 11 0 11HR 36 12 24Provost-HR 8 6 2PPS 66 7 59
Totals 185 49 136
BSC – Employees
October 17, 2011

OFFICE OF THE VICE CHANCELLOR FOR FINANCE
UNT System Shared Services Update
BSC FY 2012 Operating Budget
14
Before BSC Transition After BSC Transition
Institution Current Campus BSC UNT System Administration Administrative $214,840 $0 $214,840 PPS $60,528 $0 $60,528 Building Costs $450,000 $0 $450,000
Subtotal $725,368 $0 $725,368 UNT Human Resources $2,260,600 $959,734 $1,300,865 Payroll $705,838 $0 $705,838 Provost – HR $612,118 $512,234 $99,884 PPS $3,281,133 $288,518 $2,992,615
Subtotal $6,859,688 $1,760,486 $5,099,202
UNT Health Science Center Human Resources $1,618,010 $1,123,203 $494,807 Payroll $518,910 $0 $518,910 PPS $2,027,913 $882,303 $1,050,818
Subtotal $4,164,833 $2,005,506 $2,159,327
UNT at Dallas $0 $0 $0 Total $11,749,890 $3,765,993 $7,889,105
October 17, 2011

OFFICE OF THE VICE CHANCELLOR FOR FINANCE
UNT System Shared Services Update15
BSC ScorecardPersp. Goal Strategic Objectives Strategic Measures Freq. Type
FINANCIAL
Facilitate Long-Term Financial Savings
Improve Cost Effectiveness
BSC Operating Budget to Actual Q Lag
BSC Operating Cost per System-wide Total FTE A Lag
BSC Operating Budget as a Percentage of UNT System Operating Budget A Lag
BSC Operating Cost per BSC FTE A Lag
CUSTOMER
Focus on Customer
NeedsDeliver Exceptional Customer Service
% Satisfied with Knowledgebase Content Q Lead
Customer Satisfaction Rate A Lag
INTERNAL
PROCESS
Improve Quality of Services
Leverage Information Technology
Number of Self-Service Applications Q Lead
Knowledgebase Volume Q Lag
Leverage Our SizeContract Spend as a Percentage of Total Spend Q Lead
Savings Through Contract Negotiations Q Lag
Continually Improve Key Processes
Number of Projects Completed Q LeadPercent of Employees Involved in Process Improvement Teams Q Lead
Savings Through Process Improvement Projects Q Lag
LEARNING & GROW
TH
Nurture an Employee-
centric Culture
Improve Employee SkillsTraining Hours Per Employee Q LeadNumber of Employees Leading Project Teams Q LeadPersonal Development Plan Completion % A Lag
Maintain a Motivated Workforce
Employee Retention Rate Q LeadAverage Employee Tenure A LagEmployee Satisfaction Rate A Lag
October 17, 2011

OFFICE OF THE VICE CHANCELLOR FOR FINANCE
UNT System Shared Services Update
BSC Operating Budget and 5 Year Pro Forma
16
Planning YR FY2012 FY2013 FY2014 FY2015 FY2016Operating Revenues: Year 1 Year 2 Year 3 Year 4 Year 5
Transfers-Institutional Assessments: $0 $7,889,105 $7,889,105 $7,889,105 $7,889,105 $7,889,105 Total Operating Revenues $0 $7,889,105 $7,889,105 $7,889,105 $7,889,105 $7,889,105 Operating Expenditures: Employee Related Expenses
Staff Salaries & Wages $435,749 $5,550,708 $4,805,526 $4,661,360 $4,521,519 $4,385,874 Employee Merit/Bonus Pool $0 $55,507 $144,166 $139,841 $135,646 $131,576 M&O + Employee Allowances $502,091 $333,519 $313,508 $294,698 $277,016 $260,395 Employee Benefits $0 $1,642,864 $1,429,520 $1,386,633.99 $1,345,035 $1,304,684
Total Employee Related Expenses $937,840 $7,582,598 $6,692,719 $6,482,533 $6,279,216 $6,082,529 Net Operating Income (Loss) ($937,840) $306,507 $1,196,386 $1,406,573 $1,609,890 $1,806,577 Building Related Expenses
Lease of Building $0 $450,000 $459,000 $468,180 $477,544 $487,094 Utilities $0 $60,000 $61,200 $62,424 $63,672 $64,946 Relocation Expenses $0 $710,000 $0 $0 $0 $0 Continuous Improvement Software $0 $100,000 $100,000 $100,000 $100,000 $100,000
Total Building Related Expenses $0 $1,320,000 $620,200 $630,604 $641,216 $652,040 Total Expenditures $937,840 $8,902,598 $7,312,919 $7,113,137 $6,920,432 $6,734,569 Net Income (Loss) ($937,840) ($1,013,493) $576,186 $775,969 $968,674 $1,154,536 Net Assets:
FY2012 Reserves- Beginning Balance $2,000,000 $1,062,160 $48,667 $624,853 $1,400,822 $2,369,496 Change in Fund Balance ($937,840) ($1,013,493) $576,186 $775,969 $968,674 $1,154,536
Ending Net Assets $1,062,160 $48,667 $624,853 $1,400,822 $2,369,496 $3,524,032
October 17, 2011
OFFICE OF THE VICE CHANCELLOR FOR FINANCE
UNT System Shared Services Update17
UNT SystemInformation Technology Shared
Services (ITSS)
October 17, 2011

OFFICE OF THE VICE CHANCELLOR FOR FINANCE
UNT System Shared Services Update
ITSS Major Initiatives 2011-2012
18
MAY JUN JUL AUG SEP OCT NOV DEC JAN FEB MAR APR
FY 2012 Budget & Allocations
Continuous Improvement (ongoing)
Organizational Splits
Governance Structures
Services Catalog
Process Design and Implementation (ongoing)
Customer Service Metrics
Measures (ongoing)
Updated Strategic IT Plan
Internal Baseline Metrics & First SLA
Marketing, Communications, Change Management & Training
Activity Based Costing Analysis
Maintain & Update Services Catalog
Update Allocation Methods
Organization
Ongoing Measurement & Reporting
Additional SLAs
Ongoing Management of Governance
Towers Watson
October 17, 2011

OFFICE OF THE VICE CHANCELLOR FOR FINANCE
19
IT Services – Organizational Chart (before ITSS)

OFFICE OF THE VICE CHANCELLOR FOR FINANCE
20
Vice Chancellor for Finance
UNT System CIO
Customer Services and Helpdesk
Institution CIO
Campus Based Solutions and Support
Acad. And Research
Computing Support&User Services
Classroom Support
Clinical Systems
Enterprise Applications
Non-Campus Based System Solutions and
Support
IT Internal Business Services
Data Centers and Infrastructure
Communication and Collaboration
Program Management Office
Research and Planning
IT Service Management
Security, Compliance and Disaster Recovery
IT Services – Functional Chart
Centralized Campus Specific

OFFICE OF THE VICE CHANCELLOR FOR FINANCE
UNT System Shared Services Update21
ITSS Catalog Example
October 17, 2011
Business Facing Services
Internal Services
Number Type Service Name1 S Constituent Relationship Management2 S Contributor Relations Information Systems3 S Student Administration Information Systems4 S Financial Information Systems 5 S Human Resources/Payroll Information Systems6 S Learning Management System Service and Support7 S Software Licensing and Contract Management8 S Microsoft Exchange Hosting9 S Database Administration - Oracle
10 S Directory Services Administration11 S EIS Server and Infrastructure Support12 S SAN Storage Administration

OFFICE OF THE VICE CHANCELLOR FOR FINANCE
UNT System Shared Services Update22
IT ScorecardPersp. Goal Strategic Objectives Strategic Measures Freq Type
FINANCIAL
Facilitate Long-Term Financial Savings
Improve Cost Effectiveness
IT Operating Budget to Actual Q LagIT Operating Cost per System-wide Total FTE A LagIT Operating Budget as a Percentage of UNT System Operating Budget A LagIT Operating Cost per IT FTE A Lag
CUSTOMER
Focus on Customer
NeedsDeliver Exceptional Customer Service
Helpdesk Inquiries Resolved Satisfactorily Q Lead
Customer Satisfaction Rate Q Lag
INTERNAL
PROCESS
Improve Quality of Services
Leverage Shared LicensingShared Licensing as a Percentage of Total Possible Q LeadSavings Generated Through Shared Licensing A Lag
Leverage Current Technology
Number of Supported Software Environments Q LeadNumber of Repetitive Tasks Automated with a Tool Q LeadVirtualized Environments as a Percentage of Total Possible Q LagVirtualized Storage as a Percentage of Total Possible Q Lag
Consolidate FacilitiesFacilities Consolidated as a Percentage of Total Possible Q LeadSavings Generated through Facility Consolidation A Lag
Continually Improve Key Processes
Savings Through Process Improvement Projects Q LagPercent of Projects Completed on Time on Budget Q LeadPercent of Employees Involved in Process Improvement Teams Q Lead
LEARNING &
GROWTH
Nurture an Employee-
centric Culture
Improve Employee SkillsTraining Hours Per Employee Q LeadNumber of Employees Leading Project Teams Q LeadPersonal Development Plan Completion % A Lag
Maintain a Motivated WorkforceEmployee Retention Rate Q LeadAverage Employee Tenure A LagEmployee Satisfaction Rate A Lag
October 17, 2011

OFFICE OF THE VICE CHANCELLOR FOR FINANCE
UNT System Shared Services Update23
ITSS Budget
October 17, 2011
• Under development
OFFICE OF THE VICE CHANCELLOR FOR FINANCE
UNT System Shared Services Update24
UNT System Shared ServicesCampus Perspectives
October 17, 2011
Benefits, Challenges, Disruptions, Expectations
Jean Bush, University of North Texas
Michael Mueller, UNT Health Science Center
Wayne Usry, UNT at Dallas

OFFICE OF THE VICE CHANCELLOR FOR FINANCE
UNT System Shared Services Update25
Questions?
October 17, 2011