oculus low res
TRANSCRIPT
7/28/2019 Oculus Low Res
http://slidepdf.com/reader/full/oculus-low-res 1/16

7/28/2019 Oculus Low Res
http://slidepdf.com/reader/full/oculus-low-res 2/16
Keratoconus / Ectasia Detection with the Oculus Pentacam:
Belin / Ambrósio Enhanced Ectasia Display Michael W. Belin, MD, FACS • Stephen S. Khachikian, MD
Application of Pentacam in Anterior Chamber Measurements
for Phakic IOL Surgery Mana Tehrani, MD
Holladay Report on the PentacamJack T. Holladay, M.D., M.S.E.E., F.A.C.S
Michael W. Belin, MD, FACS
Professor & Director – Cornea & Refractive Surgery
Albany Medical College Lions Eye Institute
Albany, New York (USA)
Stephen S. Khachikian, MD
Albany Medical College Lions Eye Institute
Albany, New York (USA)
Mana Tehrani, MD
Department of Ophthalmology,
Johannes Gutenberg-University, Mainz
Private practice - Constance, Germany
Jack T. Holladay, M.D., M.S.E.E., F.A.C.S
Holladay LASIK Institute
Vision Correction Surgery
Bellaire Triangle Building
Bellaire, Texas (USA)
3
8
10
2 New Advances and Technology with Pentacam
Edited, translated and published by Highlights of Ophthalmology. © Copyright. 2008,OCULUS Optikgeräte GmbH. All rights reserved.No part of this publication may be reproduced without written permission. The ideas and opinions expressed in this suplement do not necessarilyreflect those of the editor, the editing board or the publisher, and by no means imply endorsement by the ditor, the editing board or the publisher.
Oculus Optikgeräte GmbH
35549 Wetzlar
GERMANY
Tel. ++49-641-2005-0
Fax ++49-641-2005-295
www.oculus.de
Contributing Authors:

7/28/2019 Oculus Low Res
http://slidepdf.com/reader/full/oculus-low-res 3/16
The early detection of ectatic disease is of paramount
importance to the refractive surgeon. While measurementssuch as aberrometry and curvature can be used in evaluat-
ing a patient for ectatic disease, they are derivatives of ele-
vation.1 With subclinical disease, anterior curvature alone
may not provide enough information to detect an early
corneal abnormality. The goal of the Belin / Ambrósio
Enhanced Ectasia Display is to combine elevation based
and pachymetric corneal evaluation in an all inclusive dis-
play. This gives the clinician a global view of the structure of
the cornea and allows the physician to quickly and effective-
ly screen patients for ectatic disease. The combination of
the pachymetric graphs and indices and the enhanced ele-
vation maps provided by the Belin / Ambrósio EnhancedEctasia Display have increased sensitivity and specificity in
the screening of patients for ectasia.
Elevation Based Topography
The basics and advantages of elevation based topogra-
phy were discussed by Belin and Khachikian in an earlier
issue of HIGHLIGHTS.2 Elevation based Scheimpflug imag-
ing has advantages over Placido based systems in that it
allows for the measurement of both the anterior and posteri-
or corneal surfaces and the computation of a complete
pachymetric map.3 This paper will concentrate on the use of
the enhanced elevation map which makes up half of the new
Keratoconus / Ectasia detection display (Belin / Ambrósio
Enhanced Ectasia Display) available on the Oculus
Pentacam (OCULUS Optikgerate GmbH, Wetzlar, Germany).
Elevation maps are typically viewed by comparing the
data to some standard reference surface (shape). The rea-
son for viewing elevation data in this format is that the actu-
al raw elevation data lacks enough surface variability for an
easy qualitative inspection that would allow the clinician to
separate normal from abnormal corneas. By subtracting a
known shape, however, the differences or variance become
highlighted or exaggerated (Figure 1). This method of depicting elevation data and the subtracted reference shapes com
monly used (best-fit-sphere (BFS)), best-fit-ellipse, and the
best-fit-toric ellipsoid) were first introduced by Dr. Belin in
1990 on the PAR CTS.4
Figure 1. Anterior elevation map of a patient with
keratoconus. The central island of elevation is clearly
visible and itcorresponds to the location of the cone.
This would not be visible if one were not comparing
raw data to a reference surface.
Michael W. Belin, MD, FACS • Stephen S. Khachikian, MD Albany, New York -U.S.A.
New Advances and Technology with Pentacam 3

7/28/2019 Oculus Low Res
http://slidepdf.com/reader/full/oculus-low-res 4/16
For refractive surgery screening and for most clinicalsituations, using a best-fit-sphere gives the most useful
qualitative map (i.e. easiest to read and understand). Fitting
a best-fit-sphere to the central 8.0 mm zone appears best for
clinical interpretation. Since the normal eye is an aspherical,
prolate surface the central 8.0 mm zone yields a reference
surface that allows for subtle identification of both ectatic
disorders and astigmatism.
Enhanced Reference Surface
While the Best-Fit-Sphere (BFS) is qualitatively useful, the
clinician typically assumes that the reference surface (the shape
being subtracted) closely approximates a “normal” cornea.
Some investigators, in the past, have attempted to compare
individual corneas to some “average normal shape.” The prob-
lem here is that there is such variability in corneal shape that the
“normal” or “average” shape does not represent a clinically use-
ful reference surface for individual corneal evaluation. What is
typically not appreciated is that the BFS will be influenced by
any abnormal portion of the cornea. In the case of keratoconus
or ectasia, the cone or apical protrusion will have the effect of
steepening the BFS. This stepened BFS will actually minimize
the elevation difference between the apex of the cone and theBFS. We designed a new screening display (Belin / Ambrósio
Enhanced Ectasia Display) to eliminate this problem.
Our goal was to design a reference surface that more
closely approximates the individual’s normal cornea after
excluding the conical or ectatic region. To do this, we identified
a 4.0 mm optical zone centered on the thinnest portion of the
cornea and excluded it from the reference shape calculation
(exclusion zone). We calculated the new “enhanced BFS” by
utilizing all the valid elevation data from within the 8.0 mm cen-
tral cornea, and outside the exclusion zone (Figure 2). The
resulting new reference surface (“Enhanced BFS”) closely
approximates the more normal peripheral cornea and exagger-
ates any conical protrusion. In abnormal corneas the elevation
map created when using the enhanced BFS will be significantly
different from the map created using the standard BFS as your
reference surface (Figure 3). This elevation difference is minimal
in a normal cornea (Figure 4). With a conical cornea, excluding
the 4.0 mm zone from the BFS calculation eliminates the cone
or steep portion of the cornea and results in a significantly flat-
ter BFS based more on the normal peripheral cornea.
The resulting elevation maps show a significant difference as the
conical portion of the cornea is now more pronounced (i.e.
Figure 2. The image on the left shows a patient with Keratoconus and a large area of abnormal elevation.
The image on the right reflects how this abnormal area of elevation (red circle) is excluded from the BFS calculation.
4 New Advances and Technology with Pentacam

7/28/2019 Oculus Low Res
http://slidepdf.com/reader/full/oculus-low-res 5/16
Figure 3.
Belin/Ambrosio Enhanced
Ectasia Display of a patient
with early keratoconus.
The baseline elevation
maps (top) show the
presence of a mild cone
limited to the posterior
cornea, while the
exclusion map (middle)
enhances the visibility
of the abnormal cone.
The change in elevation
from the baseline to theexclusion map (bottom)
shows a significant change
on the posterior surface
(red) and yet no significant
change (green) on the
anterior surface.
Figure 4.Belin/Ambrosio Enhanced
Ectasia Display
of a normal cornea.
The baseline elevation
maps (top) show normal
corneal elevation map.
The exclusion map (middle)
has a similar appearence.
The change in elevation
from the baseline to the
exclusion map (bottom)
shows almost no change
in elevation (green)
on both anterior and posterior
surfaces.
New Advances and Technology with Pentacam 5

7/28/2019 Oculus Low Res
http://slidepdf.com/reader/full/oculus-low-res 6/16
easier to identify) (Figure 3). The average changes in cornealelevation (when going from standard to enhanced BFS) were as
follows:
Normal eyes showed an avg change in anterior apex
and maximum elevation of 1.86±1.9µm and
1.63±1.4µm.
Keratoconus eyes showed anterior apex and maxi-
mum elevation changes of 20.4±23.1µm and
20.9±21.9µm.
(P<.0001).
Posteriorly, normal eyes showed an average change in
apex and maximum elevation of 2.86±1.9µm and
2.27±1.1µm.
Keratoconus eys showed posterior apex and maxi-
mum elevation changes of 39.9±38.1µm and
45.7±35.9µm.
(P<.0001).
This change (the elevation difference between the standardBFS and the “Enhanced” BFS) appears to have significant prog-
nostic value as all normal eyes tested showed minimal change
while eyes with keratoconus or ectasia showed a significant
increase in elevation values (Figure 5).
Elevation Display Interpretation
Baseline Elevation Maps - We can begin by looking at the
left half of the Belin /Ambrosio ectasia display (Figure 4) where
the elevation data of a normal eye is shown. The first two (upper)
elevation maps (placed side by side) are the standard elevation
maps of the cornea off the standard best fit sphere. This map isdisplayed for the front surface (left map) and back surface (right
map) of the cornea. The radius of curvature of the best fit
sphere (BFS) in millimeters and the diameter of the zone used to
compute the BFS is noted above each map. In this sample map
(Figure 4) the radius of curvature of the Best Fit Sphere for the
front surface of the cornea is 8.07 mm and the radius of curva-
ture of the BFS for the back surface of the cornea is 6.65.
“Float” describes the positioning of the reference surface rela-
tive to the corneal surface. The last number above the elevation
Figure 5.
Bar graph showing
the relative change
in elevation for normal
eyes (green)
and keratoconics (red)
when comparing
elevation measured
with the baseline BFS
and the enhanced BFS.
6 New Advances and Technology with Pentacam
7/28/2019 Oculus Low Res
http://slidepdf.com/reader/full/oculus-low-res 7/16
map is the diameter of the circle (in millimeters) centered on thecorneal apex inside of which valid corneal data is taken to com-
pute the BFS. For the Belin / Ambrosio display this is fixed at
8.0 mm if there is adequate coverage and no extrapolated data.
A poor pentacam image will contain less valid data and there-
fore the diameter of the circle from which data is taken is small-
er. To the left of the elevation map is the number 9 mm. This is
the size of the cornea being displayed. To the right of the map
is the eye being examined, OD or OS. Looking at the color scale
of the map itself, warm colors represent areas of the cornea that
are above the BFS, and cool colors represent areas of the
cornea below the BFS.
Exclusion Maps - Immediately below the standard anteri-
or and posterior elevation maps are the anterior and posterior
exclusion maps. These are enhanced elevation maps, which
display the same elevation data as the baseline maps, but thereference surface is now the “enhanced BFS” rather than the
standard BFS. In these maps (both anterior and posterior) the
best-fit sphere is calculated using all the raw elevation data
located outside a 4mm circle centered on the thinnest point of
the cornea. This area of excluded data is called the exclusion
zone and the map is an exclusion map. The location of the
exclusion zone is indicated by a 4mm red circle and cannot be
modified.
This “exclusion map” may be significantly different from the
baseline elevation map (Figure 3), or it may be very similar
(Figure 4), depending on the relative impact the 4 mm exclusion
zone made to the original (standard) BFS computation. As
noted above, the change in BFS is typically minor for normal
eyes (8.07 to 8.10 for the anterior cornea and 6.65 to 6.70 for
the posterior cornea (Figure 4) ) and more significant for eyes
with ectatic changes (6.66 to 6.80 for the posterior cornea in
(Figure 3).
The bottom 2 maps are difference maps showing the rela-
tive change in elevation from the baseline elevation map to the
exclusion map. The bottom maps contain only 3 colors, each
one corresponding to the amount of elevation change that
occurs when moving between the baseline elevation map and
the exclusion map. The green on the difference map representsa change in elevation (from the baseline to the exclusion map) o
less than 6 microns on the front surface and 10 microns on the
back surface of the cornea. These values are are typically with-
in the range seen in normal eyes, as in this example. Red would
represent areas where the elevation difference between the 2
maps is ≥12 microns anteriorly or 20 microns posteriorly and are
the magnitude typically seen in eyes with known keratoconus
Yellow areas represent a change between 6 and 12 microns fo
the front surface and 10 to 20 microns for the back surface
These eyes fall in the suspicious or suspect zone. In these
examples the difference maps are both all green in the norma
eye (Figure 4) and green for the anterior surface but stronglypositive (red) for the posterior surface for the eye with ectatic
changes more significant on the posterior corneal surface
(Figure 3).
Conclusion
The Belin / Ambrósio Enhanced Ectasia Display is the
first comprehensive refractive surgical screening tool to be fully
elevation based. The goal of the software is to assist the refrac
tive surgeon in identifying those patients who may be at risk fo
post-operative ectasia and/or to assist in the identification of
early or subclinical keratoconus. By utilizing information fromboth the anterior and posterior corneal surfaces, as well as ful
pachymetric data it is hoped to have increased sensitivity with-
out the false positive rates typically associated with curvature
based programs.
REFERENCES
1. Belin MW, Litoff D, Strods SJ, et al: The PAR Technology Cornea
Topography System. Refrac Corneal Surg 8:88-96, 1992.
2. Belin MW, Khachikian SS. Corneal diagnosis and evaluation
with the OCULUS Pentacam. Highlights of Ophthalmology. 2007
35:5-8.
3. Ciolino JB, Khachikian SS, Cortese MJ, Belin MW. Long-term
stability of the posterior cornea after Laser In Situ
Keratomileusis. J Cataract Refract Surg. 2007; 33:1366-70.
4. Belin MW, Litoff D, Strods SJ, et al: The PAR Technology Cornea
Topography System. Refrac Corneal Surg. 1992; 8:88-96.
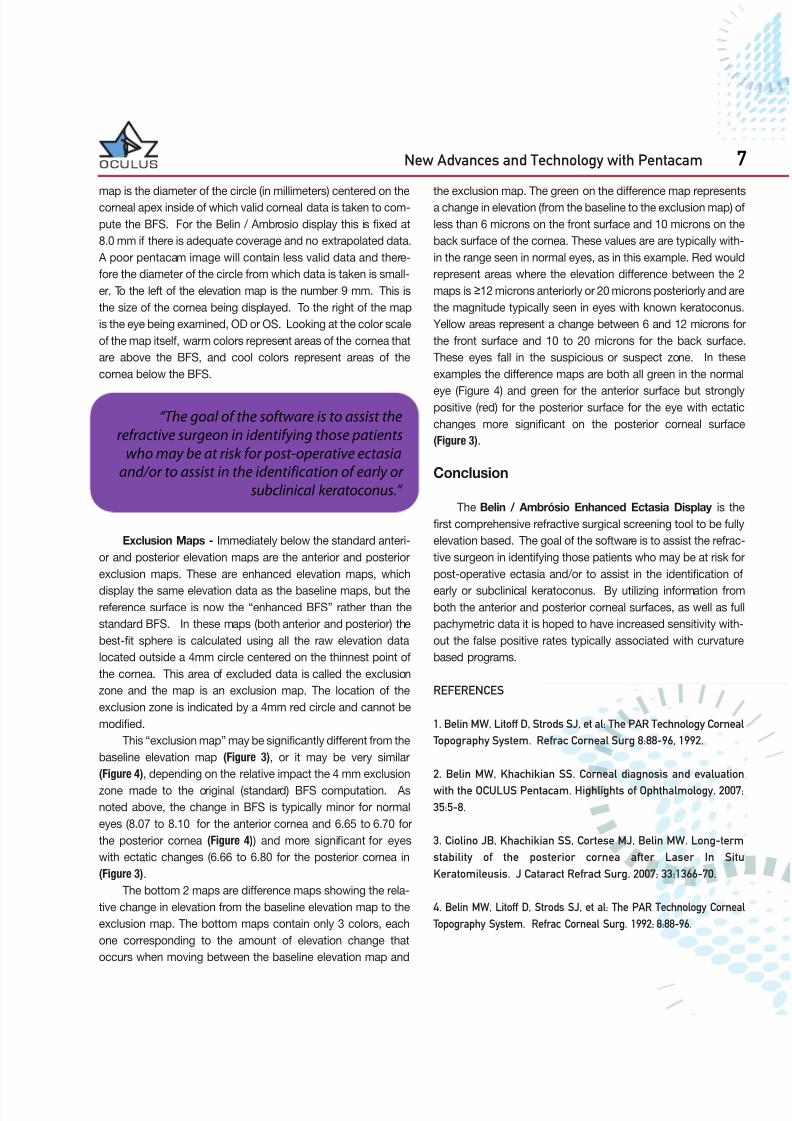
“The goal of the software is to assist the
refractive surgeon in identifying those patients
who may be at risk for post-operative ectasia
and/or to assist in the identification of early or
subclinical keratoconus.”
New Advances and Technology with Pentacam 7

7/28/2019 Oculus Low Res
http://slidepdf.com/reader/full/oculus-low-res 8/16
Phakic intraocular lenses have been established as an
effective and safe surgical option for the correction of myopia,
hyperopia and astigmatism. One of the current available phakicIOLs is the iris-fixated lens for correction of refractive errors.
However performing refractive surgery on healthy eyes
demands high standards in precise patients selection and pre-
operative diagnostic examinations. Of major interest in phakic
IOL implantation remains if safe distances from the phakic IOL
to crucial tissues such as corneal endothelium or crystalline lens
can be respected postoperatively. The lack of an accurate ante-
rior segment analysis and predication of pIOL position after sur-
gery encouraged us to develop a software module applicable to
the new high resolution HR Pentacam.
The Pentacam HR (OCULUS, Wetzlar, Germany) images
the anterior segment of the eye by a rotating Scheimpflug cam-
era non-contact measurement. Two types of the device areavailable on market; the newer one is the Pentacam HR, offer-
ing an increased image resolution. The rotating Scheimpflug
camera provides a series of 50 Scheimpflug images in 2 sec-
onds, showing the anterior segment of the eye from the anteri-
or cornea surface down to the posterior surface of the crys-
talline lens. Out of each of these images 2760 true elevation
points are extracted by the software, obtaining 138.000 true ele-
vation points for each surface, including the center of the
cornea. The software generates a 3D-model of each surface as
a basis for corneal topographic and anterior chamber analysis.
The new Pentacam pIOL-software module simulates the
positioning of a pIOL in the anterior chamber 3D-model and
Figure 1.
Preoperative
anterior chamber
image with simulation
of postoperative
pIOL position.
Mana Tehrani, MDConstance, Germany
8 New Advances and Technology with Pentacam

7/28/2019 Oculus Low Res
http://slidepdf.com/reader/full/oculus-low-res 9/16
makes it visual to the surgeon before surgery . After entering the
patients refraction in the module the software can choose the
required pIOL model out of the integrated lens database. This
pIOL can then be projected in the patients anterior chamber that
has been obtained before by regular Scheimpflug measurement.
The pIOL is automatically aligned on the iris surface, centered
on pupil after being selected from a lens data base. In every sin-gle taken Scheimpflug image the outlines of the simulated
implant are drawn. Moreover from each surface point of the
pIOL the distances to adjacent eye structures are calculated
three dimensionally by the software, which results in real mini-
mum values. These distances are presented both in colour
maps which show every point of the implant in top view and as
minimum space values for critical areas of the pIOL. Besides the
colour maps represent the actual simulated position in the X-Y-
plane relative to the apex and the pupil. The surgeon carries out
the alignment of the pIOL by drag and drop in the colour maps
in every direction. With the help of online refreshed distance val-
ues and images the optimum lens position and axis alignmentwill be defined and the compliance of the minimum distances is
supervised. While the pIOL is moved in X-Y-direction or axis
angle is changed the software assists this process by always
aligning it on the iris surface. Final corrections in height and tilt
will then be carried out by the surgeon for compensating incor-
rect positioning caused by irregular iris spots. Beside projection
of the selected IOL power/type in the patient’s anterior chamber,
the software program gives exact values in mm about the mini-
mal distances between endothelium to IOL optic and haptic, the
minimal distances from the IOL backside to the iris and the min-
imal distance between the backside of the IOL and the crys-
talline lens. In addition distances from the IOL to other tissuescan been read from any point of the implant by going with the
curser on the specific point of the implant.
In a clinical study performed at the Department of
Ophthalmology at the University of Mainz, Germany 44 eyes of
23 patients were included. The average age valued 38 years
(range, 24-61). The implanted pIOL power ranged from +11 to
-22 D with a average power of -8,70 D. 17 eyes received the
foldable model (Artiflex, Ophtec, Groningen; Veriflex, AMO
Santa Ana, USA), 13 eyes the rigid PMMA Model (8 myopic, 5
hyperopic model).
One day before planed surgery a Pentacam HR investiga-
tion using the novel pIOL software module was performed in al
cases. One month after surgery a second investigation was per
formed to compare preoperative simulation values with actua
postoperative distance values. A mean deviation from simula-
tion to postoperative values were detected of 18 µm for the dis-
tance central pIOL optic to corneal endothelium, 56 µm for the
distance peripheral optic to corneal endothelium and 25 µm for
the distance posterior pIOL optic to anterior surface of crys-
talline lens. Finally a mean deviation between simulation and
postoperative position of 31 µm for the distance pIOL haptic to
corneal endothelium could be evaluated.
Additional Features
The changes in anterior segment dimension through aging
process were also considered when developing this module
The annual decrease in anterior chamber depth is also calculat-
ed. This decreasing anterior chamber depth can be predicted by
the software for a selected patient’s age to avoid future compli-
cations. The aging tool can predict the pIOL position up to 30
years in advance.
Another important feature under development is the option
to simulate the toric models (Model A and B) where the surgeon
can decide which model would fit better in the patients anterio
chamber.
Analysis of anterior chamber dimensions via Scheimpflugimaging is an important step to ensure that sufficient distances
between critical tissues are respected postoperatively. In addi-
tion, simulation of the required iris-fixated lens model (including
complete biometric data such as thickness, height etc.) preop-
eratively during patients selection progress represents a power-
ful step toward increasing safety of this surgical option
Especially patients with irregular iris formation, poor central and
peripheral anterior chamber dimensions can benefit from these
additional features in the Pentacam. Moreover the image can
be shown to the patient illustrating why he is not a good candi-
date for iris-fixated IOL implantation.
Figure 2. 3-dimension image showing future location of
pIOL in the anterior chamber.
New Advances and Technology with Pentacam 9

7/28/2019 Oculus Low Res
http://slidepdf.com/reader/full/oculus-low-res 10/16
The Pentacam is the latest technology in Scheimpflug
imaging. It is manufactured by Oculus Optikgeräte
GmbH(Wetzlar, Germany) and differs fundamentally from theOrbscan (Bausch & Lomb, Rochester, NY) by the way in which
it takes image slices of the cornea. The Orbscan takes vertical
image slices that are separated from one another and have no
common point. Thus, the Orbscan cannot re-register for any eye
movement that occurs while it is capturing the images. The
Pentacam maintains the central point (usually close to the
thinnest point) of each meridian in the sample images (Figure 1).
Thus, during the reconstruction of the image, the software can
re-register these central points and eliminate the eye movement.
The second improvement is the resolution of the camera. Just
like digital cameras, the megapixels used in the latest high den-
sity imaging are much greater than cameras just a few yearsago. These two features make the Pentacam’s measurements
significantly more accurate than the prior instruments.
The Scheimpflug images also have a density graph to the
right of the image, which allows the physician to quantitfy visu-
al disturbances in the media. For example, the map of a
cataract (Figure 2) shows the opacities that scatter light and
degrade vision. The clinician can show these maps to the
patient, and document the changes that are occurring to the
patient’s crystalline lens in his chart.
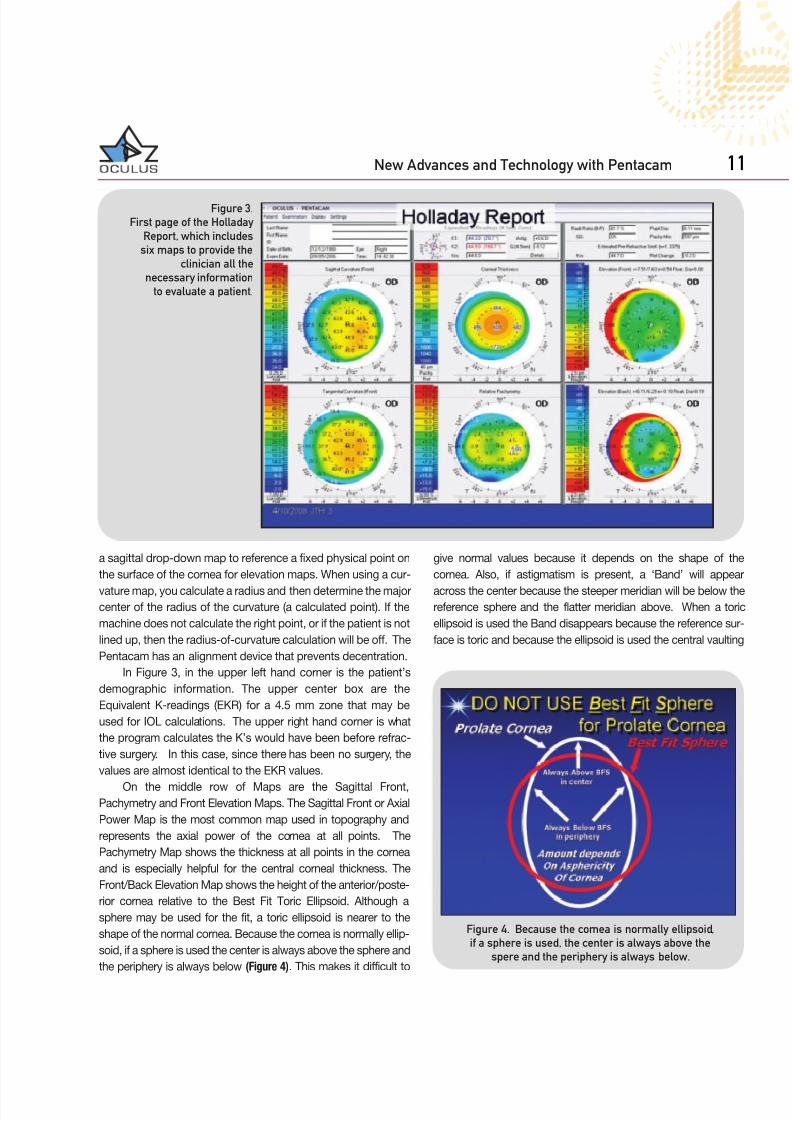
The Holladay Report contains 2 displays. The first page isshown in (Figure 3) and includes 6 maps. These 6 maps have
been chosen because they provide the clinician with all of the
information necessary to evaluate a patient in almost all cases.
The second page (Figure 4) is displayed when the ‘detail’ button
is clicked and displays additional information about the cornea
which is primarily used for IOL calculations after refractive sur-
gery, which will be discussed in detail in the section below.
I like to include curvature maps in my preoperative screen-
ing. It is true that curvature maps are relative to the center of the
earth (primary corneal radius of curvature), and that height maps
are relative to a vertex point on the cornea. The Pentacam uses
Jack Holladay, MD, MSEE, FACSBellaire, Texas - U.S.A.
Figure 1. During reconstruction of the image, Pentacam
maintains the central point of each meridian.
Figure 2. Pentacam map of a cataract with scatter light.
10 New Advances and Technology with Pentacam
7/28/2019 Oculus Low Res
http://slidepdf.com/reader/full/oculus-low-res 11/16
a sagittal drop-down map to reference a fixed physical point on
the surface of the cornea for elevation maps. When using a cur-
vature map, you calculate a radius and then determine the majorcenter of the radius of the curvature (a calculated point). If the
machine does not calculate the right point, or if the patient is not
lined up, then the radius-of-curvature calculation will be off. The
Pentacam has an alignment device that prevents decentration.
In Figure 3, in the upper left hand corner is the patient’s
demographic information. The upper center box are the
Equivalent K-readings (EKR) for a 4.5 mm zone that may be
used for IOL calculations. The upper right hand corner is what
the program calculates the K’s would have been before refrac-
tive surgery. In this case, since there has been no surgery, the
values are almost identical to the EKR values.
On the middle row of Maps are the Sagittal Front,Pachymetry and Front Elevation Maps. The Sagittal Front or Axial
Power Map is the most common map used in topography and
represents the axial power of the cornea at all points. The
Pachymetry Map shows the thickness at all points in the cornea
and is especially helpful for the central corneal thickness. The
Front/Back Elevation Map shows the height of the anterior/poste-
rior cornea relative to the Best Fit Toric Ellipsoid. Although a
sphere may be used for the fit, a toric ellipsoid is nearer to the
shape of the normal cornea. Because the cornea is normally ellip-
soid, if a sphere is used the center is always above the sphere and
the periphery is always below (Figure 4). This makes it difficult to
give normal values because it depends on the shape of the
cornea. Also, if astigmatism is present, a ‘Band’ will appear
across the center because the steeper meridian will be below thereference sphere and the flatter meridian above. When a toric
ellipsoid is used the Band disappears because the reference sur-
face is toric and because the ellipsoid is used the central vaulting
Figure 3.
First page of the Holladay
Report, which includes
six maps to provide the
clinician all the
necessary information
to evaluate a patient.
Figure 4. Because the cornea is normally ellipsoid,
if a sphere is used, the center is always above the
spere and the periphery is always below.
New Advances and Technology with Pentacam 11

7/28/2019 Oculus Low Res
http://slidepdf.com/reader/full/oculus-low-res 12/16
above the reference surface has less variation (Figure 5). The
Tangential Map is the most sensitive for determining the geome-
try of the cornea. Unlike the Sagittal Map, the Tangential Map
Curvatures are relative to the surface, not the axial center of the
surface. A simple analogy would be to consider the earth a sphere
with a radius of 8,000 miles with a hemisphere on the surface that
was 6 miles high (Mount Everest). On the Sagittal Map, the radius
would measure 8,000 and 8,006, since the center of the earth is
the reference, almost no difference is detected. On the Tangential
Map, the Earth would be 8,000 miles, but the hemisphere radius
would be 6 miles, so a very large difference is detected. The
Tangential Map is always the most sensitive measure of the geo-
metric surface. Because of this property the Tangential Map
shows the exact location of the ‘nipple’ of the cone. Notice the
steepest part is at 330 degrees approximately 2 mm from the cen-
ter (white diamond). The Relative Pachymetry Map gives the
thickness of the cornea at that point relative to the normal thick-
ness at that point as a percentage. A normal Map would be 0%
at all points. Even though the cornea gets thicker as we move to
the periphery, if the patients thickness increases normally, the
Map still appears green (0.0%).
Detecting Forme Fruste Keratoconus
Strategy
In Figure 3, we see that the Relative Thinnest Point is -5.0%
thinner than it should be at that point. Note that this point is at
the same location as the nipple on the Tangential Map. Finally,
the Back Elevation Map using the Best Fit Toric Ellipsoid, has a
yellow spot that is +16 microns above the Reference Toric
Ellipsoid, also at the same ‘hot spot’ as the Tangential andRelative Pachymetry Map. Note that this point on the Normal
Pachymetry Map does not show up because the cornea is still
thinnest centrally, so the Relative Thickness is obscured. It is of
interest to note that epithelium of the corneal anterior surface
thins over the nipple, reducing the sensitivity of the diagnosis
from the front surface alone. In this case the anterior surface is
only 10 microns above the Reference Surface (not 16 microns as
on the Back Elevation). Normal epithelial cells are 6 to 8 microns
thick and there are usually 6 to 8 layers of epithelial cells. The
epithelium is ~ 1 epithelial cell thinner over the ‘nipple’.
Summary
The strategy is that when the ‘hot spot’ on the Tangential
Map, Relative Pachymetry Map and Back Elevation Map using
the Toric Ellipsoid are all at the same point, the diagnosis of
Forme Fruste Keratoconus is confirmed.
In our experience:
• Relative Pachymetry Measurements that exceed -3.0% are
significant
• Elevations above 15 microns above the Toric Ellipsoid on the
Back Elevation Map are significant.
• Nipple on tangential map is red and usually above 48 D.
Equivalent K-Readings (EKRs)IOL Calculation for Patients After Refractive
Surgery
When performing IOL calculations, you cannot use height
data, but must use curvature maps to determine the power of the
cornea. Topography does not supply back surface power.
Therefore, the variation in back surface power among the human
population means that K readings that may appear the same
between multiple patients are not exactly the same, because their
posterior curvatures and net powers may be different.For calculating the EKR after LASIK, we first measured 100
consecutive refractive surgery patients who were between 20
and 30 years old with the Pentacam pre- and postoperatively.
Using the historical method, we were able to calculate what their
K-readings should have been postoperatively. The correlation
between the calculated K-reading and the Pentacam measures
EKR was 96%, with 0.56 D standard deviation. Thus, we were
able to predict patients’ postoperative refractive powers within
0.56D. In a second study, 41 RK eyes were evaluated. These
patients underwent cataract surgery and ~ 6 weeks post op, the
refraction was measured and the Pentacam EKR was measured.
Figure 5. Because the ellipsoid is used, the central vaulting
above the reference surface has less variation.
12 New Advances and Technology with Pentacam

7/28/2019 Oculus Low Res
http://slidepdf.com/reader/full/oculus-low-res 13/16
Using the post op refraction, the K-reading was back-calculat-ed using the Holladay IOL Consultant Software. The correlation
of the back-calculated K-reading and the measured EKR was
90% with a standard deviation of 0.94 D. In these studies (J. T.
Holladay, MD and Warren Hill, MD) using LASIK, PRK an RK
patients, the best correlation was found while using the EKR’s
over a 4.5mm zone.
More and more patients who have received a LASIK, PRK
or RK treatment in the past are developing now cataract. But
often we have no information about the pre-op K-readings and
therefore the eg. double-K-method does not work to calculate
the IOL. This problem is well known and several methods have
been tried to get proper K-readings for the calculation of theIOL. Placido based topographers for example are calculating
the refractive power of the cornea with the approximation that
the radii ratio between back/front of the cornea is 82% and con-
stant. This leads to an overall average corneal refractive index of
n=1.3375. This is correct for untreated eyes but after any sur-
face alteration the radii ratio changes. For myopic treatments it
decreases and for hyperopic treatments it increases. Therefore
we have to consider the anterior and posterior curvature to cal-
culate the true corneal power. The specific refractive indices for
cornea and for aqueous have to be used in order to convert cur-
vature into refractive power. Another fact is that Placido based
topographers always have a blind spot in the center and thisarea is interpolated assuming a central steepening. This is cor-
rect for untreated eyes but after myopic treatments it is vice
versa. This causes in wrong curvature and wrong refractive cen-tral corneal power to be reported. But it is essential to measure
the center for accurate corneal measurement especially for the
K-readings. The Pentacam measures though the rotating scan
especially this area very precisely. The Equivalent Keratomete
Readings, EKR’s consider all these effects. Additionally they are
calculated with reference to the pupillary center, not vertex nor
mal (the actual center of the measurement).
Details of the Holladay Report
By clicking the ‘detail’ button on the 1st page (Figure 3), a
second page is displayed (Figure 6). The table in the upper lefdisplays the EKR’s in different zones around the pupil center
Especially for patients with very big or small pupil diameters the
EKR’s can be selected in accordance. The diagram in the lowe
left displays the refractive power distribution of the EKRs in the
selected zone, here the 4.5mm. The example shows a clea
peak. This corresponds well with the upper right diagram which
shows the progression of:
• mean zonal EKR vs. zone diameter in blue
• mean zonal sagittal curvature vs. zone diameter in red
• mean ring sagittal curvature vs ring diameter in green.
The red and the green graph are parallel up to the 4mm -
4.5mm zone around the pupil center. Because of the smarange EKR’s and the clear high peak, a good post-operative out
come can be expected.
New Advances and Technology with Pentacam 13
Figure 6.
Second page of the
Holladay Report.

7/28/2019 Oculus Low Res
http://slidepdf.com/reader/full/oculus-low-res 14/16
In Figures 7 and 8 is a patient who has had LASIK. In Figure8, the refractive power distribution diagram displays a wide
range of refractive power and no clear peak. The diagram in the
upper right hand side shows that the red and green graphs are
not parallel. The ‘knee’ in green shows the edge of the optical
zone and the beginning of the transition zone. The wide varia-tion in corneal power makes the exact EKR power difficult to
predict exactly.
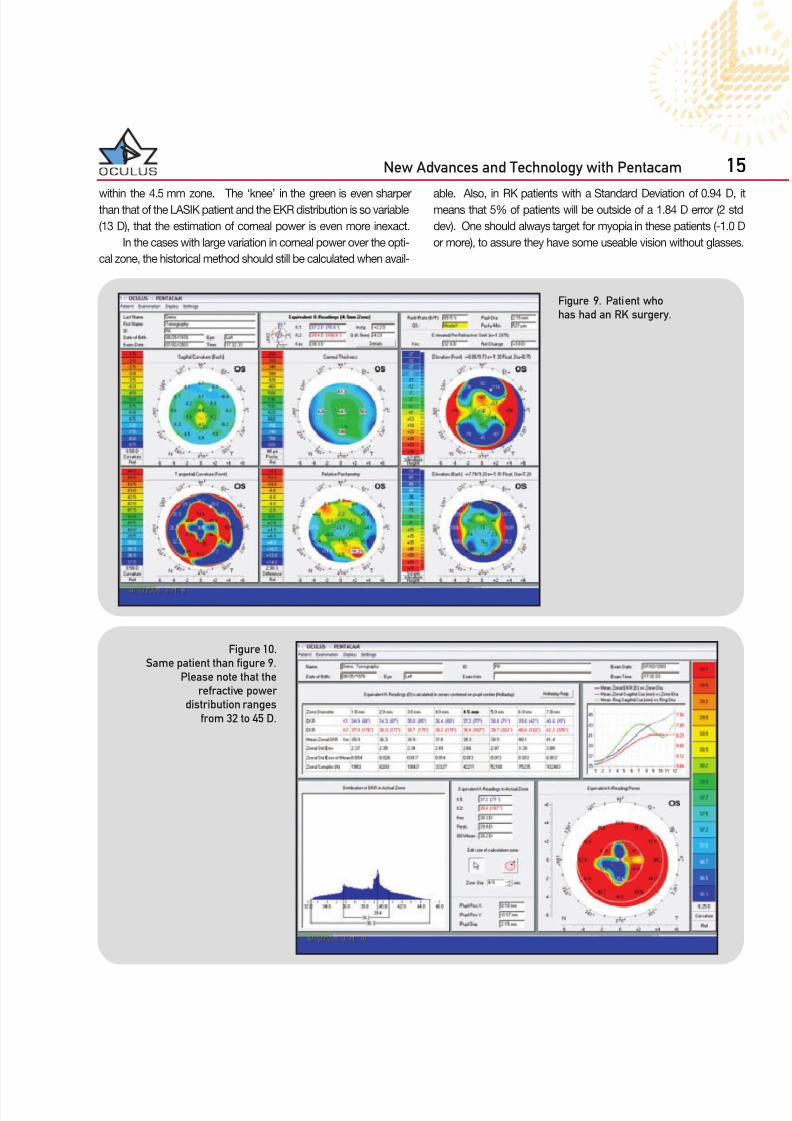
In Figures 9 and 10 is a patient that has had RK. In Figure 10,
the refractive power distribution ranges from 32 to 45 D in power
Figure 7. Patient who has had a
LASIK procedure.
Figure 8.
Same patient than figure 7.
Please notice that the
refractive power
distribution diagram
displays a wide range
of refractive power.
14 New Advances and Technology with Pentacam
7/28/2019 Oculus Low Res
http://slidepdf.com/reader/full/oculus-low-res 15/16
within the 4.5 mm zone. The ‘knee’ in the green is even sharperthan that of the LASIK patient and the EKR distribution is so variable
(13 D), that the estimation of corneal power is even more inexact.
In the cases with large variation in corneal power over the opti-
cal zone, the historical method should still be calculated when avail-
able. Also, in RK patients with a Standard Deviation of 0.94 D, imeans that 5% of patients will be outside of a 1.84 D error (2 std
dev). One should always target for myopia in these patients (-1.0 D
or more), to assure they have some useable vision without glasses
Figure 9. Patient who
has had an RK surgery.
Figure 10.
Same patient than figure 9.
Please note that the
refractive power
distribution ranges
from 32 to 45 D.
New Advances and Technology with Pentacam 15

7/28/2019 Oculus Low Res
http://slidepdf.com/reader/full/oculus-low-res 16/16
Holladay Report – IOL calculationfor post-refractive patients
The Oculus Pentacam HR
3 D p ha k ic I O L s imu la t ion so f t w
inc lud ing ag ing pred ic t ion
• Complete anterior imaging and analysing
• Anterior and posterior topography• Manual white to white analysis
• Complete crystalline lens imaging
• Automatic release for high user independence
• 3D phakic IOL simulation software (optional)
Oculus Optikgeräte GmbH • 35549 Wetzlar • GERMANY