october 2017 volume lxxi number 10
TRANSCRIPT

OCTOBER 2017
VOLUME LXXI NUMBER 10
EDITORIAL COMMITTEEJanak RajGautam Chatterjee Amitava SardarRajiv Ranjan
EDITOR Sunil Kumar
The Reserve Bank of India Bulletin is issued monthly by the Department of Economic and Policy Research, Reserve Bank of India, under the direction of the Editorial Committee.The Central Board of the Bank is not responsible for interpretation and opinions expressed. In the case of signed articles, the responsibility is that of theauthor.
© Reserve Bank of India 2017
All rights reserved.Reproduction is permitted provided an acknowledgment of the source is made.
For subscription to Bulletin, please refer toSection ‘Recent Publications’
The Reserve Bank of India Bulletin can beaccessed at http://www.bulletin.rbi.org.in
Monetary Policy Statement for 2017-18
Fourth Bi-monthly Monetary Policy Statement, 2017-18 1
Monetary Policy Report – October 2017 7
Speech
The Unfinished Agenda: Restoring Public Sector Bank Health in India Viral V. Acharya 81
Articles
Non-Banking Finance Companies in India’s Financial Landscape 91
Consumer Confidence Survey – Q2:2016-17 to Q1:2017-18 105
Press Release
Phillips Curve Relationship in India: Evidence from State-Level Analysis 117
Current Statistics 119
Recent Publications 159
CONTENTS

Monetary Policy StateMent for 2017-18
Fourth Bi-monthly Monetary Policy Statement, 2017-18
Monetary Policy Report – October 2017

RBI Bulletin October 2017 1
Monetary Policy StateMent for 2017-18Fourth Bi-monthly Monetary Policy Statement for 2017-18
further traction and spread, underpinned by domestic
demand. While private consumption benefited from
employment gains, investment rose on the back
of favourable financing conditions. The Euro area
purchasing managers’ index (PMI) for manufacturing
soared to its highest reading in more than six years.
The Japanese economy continued on a path of healthy
expansion despite a downward revision in growth
since March 2017 on weaker than expected capital
expenditure.
3. Among the major emerging market economies
(EMEs), strong growth in Q2 in China was powered
by retail sales, and imports grew at a rapid pace,
suggesting robust domestic demand; investment
activity, however, slowed down. The Brazilian
economy expanded for two consecutive quarters in
Q2 on improving terms of trade, even as the impact
of recession persists on the labour market. Economic
activity in Russia recovered further, supported by
strengthening global demand, firming up of oil prices
and accommodative monetary policy. Although
South Africa has emerged out of recession in Q2, the
economy faces economic and political challenges.
4. The latest assessment by the World Trade
Organisation (WTO) indicates a significant
improvement in global trade in 2017 over the lacklustre
growth in 2016, backed by a resurgence of Asian trade
flows and rising imports by North America. Crude oil
prices hit a two-year high in September on account
of the combined effect of a pick-up in demand,
tightening supplies due to production cuts by the
Organisation of the Petroleum Exporting Countries
(OPEC) and declining crude oil inventories in the
US. Metal prices have eased since mid-September on
weaker than expected Chinese industrial production
data. Bullion prices touched a year’s high in early
September on account of safe-haven demand due to
geo-political tensions, before weakening somewhat in
the second half. Weak non-oil commodity prices and
On the basis of an assessment of the current
and evolving macroeconomic situation at its meeting
today, the Monetary Policy Committee (MPC) decided
to:
• keepthepolicyreporateundertheliquidity
adjustment facility (LAF) unchanged at 6.0
per cent.
Consequently, the reverse repo rate under
the LAF remains at 5.75 per cent, and the marginal
standing facility (MSF) rate and the Bank Rate at 6.25
per cent.
The decision of the MPC is consistent with a
neutral stance of monetary policy in consonance with
the objective of achieving the medium-term target
for consumer price index (CPI) inflation of 4 per cent
within a band of +/- 2 per cent, while supporting
growth. The main considerations underlying the
decision are set out in the statement below.
Assessment
2. Since the MPC’s meeting in August 2017, global
economic activity has strengthened further and
become broad-based. Among advanced economies
(AEs), the US has continued to expand with revised
Q2 GDP growing at its strongest pace in more than two
years, supported by robust consumer spending and
business fixed investment. Recent hurricanes could,
however, weigh on economic activity in the near-
term. In the Euro area, the economic recovery gained
Fourth Bi-monthly Monetary Policy Statement, 2017-18 Resolution of the Monetary Policy Committee (MPC) Reserve Bank of India*
* Released on October 04, 2017.
RBI Bulletin October 20172
Monetary Policy StateMent for 2017-18 Fourth Bi-monthly Monetary Policy Statement for 2017-18
low wage growth kept inflation pressures low in most
AEs and subdued in several EMEs, largely reflecting
country-specific factors.
5. Global financial markets have been driven
mainly by the changing course of monetary policy
in AEs, generally improving economic prospects and
oscillating geo-political factors. Equity markets in most
AEs have continued to rise. In EMEs, equities generally
gained on improved global risk appetite, supported by
upbeat economic data and expectations of a slower
pace of monetary tightening in major AEs. While bond
yields in major AEs moved sideways, they showed
wider variation in EMEs. In currency markets, the US
dollar weakened further and fell to a multi-month low
in September on weak inflation, though it recovered
some lost ground in the last week of September on
a hawkish US Fed stance and tensions around North
Korea. The euro surged to a two and a half year high
against the US dollar towards end-August on positive
economic data, whereas the Japanese yen experienced
sporadic bouts of volatility triggered by geo-political
risks. Emerging market currencies showed divergent
movements and remained highly sensitive to
monetary policies of key AEs. Capital flows to EMEs
have continued, but appear increasingly vulnerable to
the normalisation of monetary policy by the US Fed.
6. On the domestic front, real gross value added
(GVA) growth slowed significantly in Q1 of 2017-18,
cushioned partly by the extensive front-loading of
expenditure by the central government. GVA growth
in agriculture and allied activities slackened quarter-
on-quarter in the usual first quarter moderation, partly
reflecting deceleration in the growth of livestock
products, forestry and fisheries. Industrial sector GVA
growth fell sequentially as well as on a y-o-y basis. The
manufacturing sector – the dominant component of
industrial GVA – grew by 1.2 per cent, the lowest in
the last 20 quarters. The mining sector, which showed
signs of improvement in the second half of 2016-17,
entered into contraction mode again in Q1 of 2017-18,
on account of a decline in coal production and subdued
crude oil production. Services sector performance,
however, improved markedly, supported mainly
by trade, hotels, transport and communication,
which bounced back after a persistent slowdown
throughout 2016-17. Construction picked up pace after
contracting in Q4 of 2016-17. Financial, real estate
and professional services turned around from their
lacklustre performance in the second half of 2016-17.
Of the constituents of aggregate demand, growth in
private consumption expenditure was at a six-quarter
low in Q1 of 2017-18. Gross fixed capital formation
exhibited a modest recovery in Q1 in contrast to a
contraction in the preceding quarter.
7. Turning to Q2, the south-west monsoon, which
arrived early and progressed well till the first week of
July, lost momentum from mid-July to August – the
crucial period for kharif sowing. By end-September,
the cumulative rainfall was deficient by around 5 per
cent relative to the long period average, with 17 per
cent of the geographical area of the country receiving
deficient rainfall. The live storage in reservoirs fell to
66 per cent of the full capacity as compared with 74 per
cent a year ago. The uneven spatial distribution of the
monsoon was reflected in the first advance estimates
of kharif production by the Ministry of Agriculture,
which were below the level of the previous year due
to lower area sown under major crops including rice,
coarse cereals, pulses, oilseeds, jute and mesta.
8. The index of industrial production (IIP) recovered
marginally in July 2017 from the contraction in June
on the back of a recovery in mining, quarrying and
electricity generation. However, manufacturing
remained weak. In terms of the use-based classification,
contraction in capital goods, intermediate goods and
consumer durables pulled down overall IIP growth.
In August, however, the output of core industries
posted robust growth on the back of an uptick in
coal production and electricity generation. The
manufacturing PMI moved into expansion zone in
RBI Bulletin October 2017 3
Monetary Policy StateMent for 2017-18Fourth Bi-monthly Monetary Policy Statement for 2017-18
August and September 2017 on the strength of new
orders.
9. On the services side, the picture remained mixed.
Many indicators pointed to improved performance
even as the services PMI continued in the contraction
zone in August due to low new orders. In the
construction segment, steel consumption was robust.
In the transportation sector, sales of commercial and
passenger vehicles as well as two and three-wheelers,
railway freight traffic and international air passenger
traffic showed significant upticks. However, cement
production, cargo handled at major ports, domestic
air freight and passenger traffic showed weak
performance.
10. Retail inflation measured by year-on-year
change in the consumer price index (CPI) edged up
sequentially in July and August to reach a five month
high, due entirely to a sharp pick up in momentum
as the favourable base effect tapered off in July and
disappeared in August. After a decline in prices in
June, food inflation rebounded in the following two
months, driven mainly by a sharp rise in vegetable
prices, along with the rise in inflation in prepared
meals and fruits. Cereals inflation remained benign,
while deflation in pulses continued for the ninth
successive month. Fuel group inflation remained
broadly unchanged in August even as inflation in
liquefied petroleum gas (LPG), kerosene, firewood
and chips rose. Petroleum product prices tracked the
hardening of international crude oil prices.
11. CPI inflation excluding food and fuel also
increased sharply in July and further in August,
reversing from its trough in June 2017. The increase
was broad-based in both goods and services. Housing
inflation hardened further in August on account of
higher house rent allowances for central government
employees under the 7th central pay commission
award. Inflation in household goods and services
in health, recreation and clothing & footwear sub-
groups increased. Quantitative inflation expectations
of households eased in the September 2017 round
of the Reserve Bank’s survey. However, in terms of
qualitative responses, the proportion of respondents
expecting the general price level to increase by more
than the current rate rose markedly for the three-
month as well as one-year ahead horizons. Farm and
industry input costs picked up in August. Real wages in
the rural and organised sectors continued to edge up.
The Reserve Bank’s industrial outlook survey showed
that corporate pricing power for the manufacturing
sector remained weak. In contrast, firms polled for
the services sector PMI reported a sharp rise in prices
charged.
12. Surplus liquidity in the system persisted
through Q2 even as the build-up in government
cash balances since mid-September 2017 due to
advance tax outflows reduced the size of the surplus
liquidity significantly in the second half of the month.
Currency in circulation increased at a moderate pace
during Q2, by ` 569 billion as against ` 1,964 billion
during Q1, reflecting the usual seasonality. Consistent
with the guidance given in April 2017 on liquidity, the
Reserve Bank conducted open market sales operations
on six occasions during Q2 to absorb ` 600 billion of
surplus liquidity on a durable basis, in addition to
the issuances of treasury bills (of tenors ranging from
312 days to 329 days) under the market stabilisation
scheme (MSS) during April and May of ` 1 trillion.
As a result, net average absorption of liquidity under
the LAF declined from ` 3 trillion in July to ` 1.6
trillion in the second half of September. The weighted
average call rate (WACR), which on an average, traded
below the repo rate by 18 basis points (bps) during
July, firmed up by 5 bps in September on account of
higher demand for liquidity around mid-September in
response to advance tax outflows.
13. Reflecting improving global demand,
merchandise export growth picked up in August 2017
after decelerating in the preceding three months.
Engineering goods, petroleum products and chemicals
RBI Bulletin October 20174
Monetary Policy StateMent for 2017-18 Fourth Bi-monthly Monetary Policy Statement for 2017-18
were the major contributors to export growth in August
2017; growth in exports of readymade garments and
drugs & pharmaceuticals too returned to positive
territory. However, India’s export growth continued
to be lower than that of other emerging economies
such as Brazil, Indonesia, South Korea, Turkey and
Vietnam, some of which have benefited from the
global commodity price rebound. Import growth
remained in double-digits for the eighth successive
month in August and was fairly broad-based. While
the surge in imports of crude oil and coal largely
reflected a rise in international prices, imports of
machinery, machine tools, iron and steel also picked
up. Gold import volume has declined sequentially
since June 2017, though the level in August was more
than twice that of a year ago. The sharper increase
in imports relative to exports resulted in a widening
of the current account deficit in Q1 of 2017-18, even
as net services exports and remittances picked up.
Net foreign direct investment at US$ 10.6 billion in
April-July 2017 was 24 per cent higher than during the
same period of last year. While the debt segment of
the domestic capital market attracted foreign portfolio
investment of US$ 14.4 billion, there were significant
outflows in the equity segment in August-September
on account of geo-political uncertainties and expected
normalisation of Fed asset purchases. India’s foreign
exchange reserves were at US$ 399.7 billion on
September 29, 2017.
Outlook
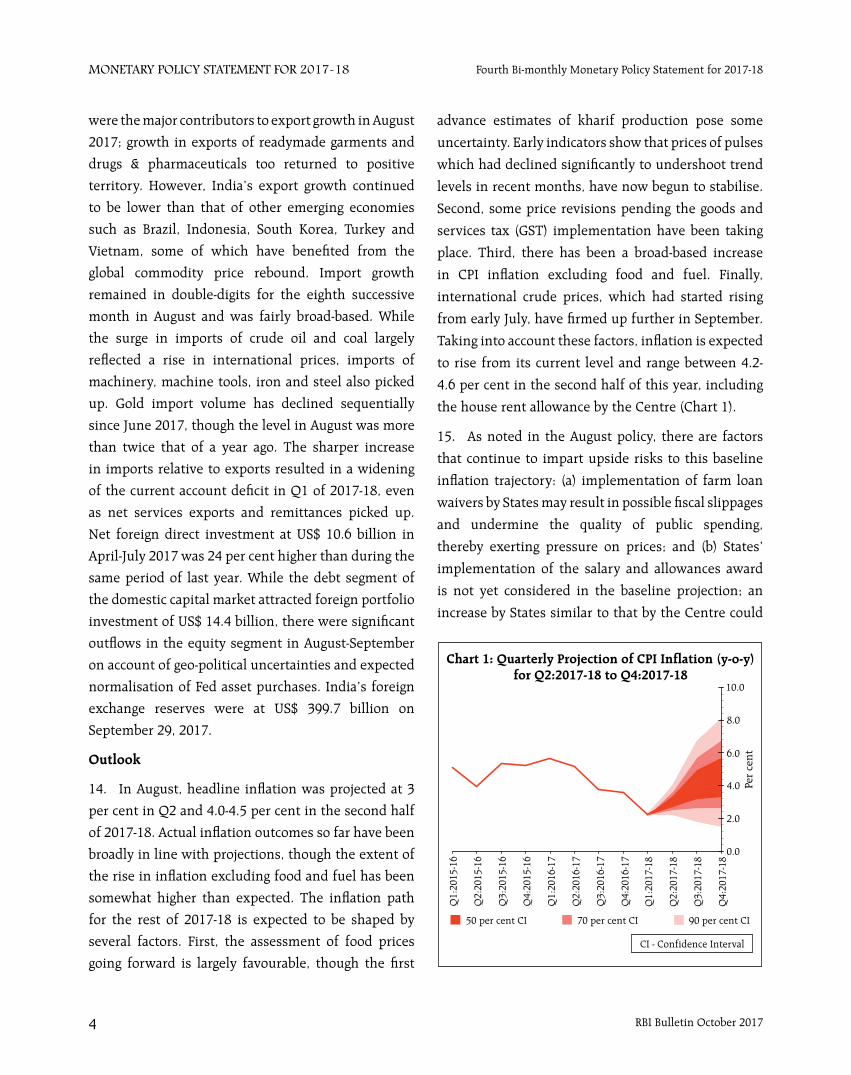
14. In August, headline inflation was projected at 3
per cent in Q2 and 4.0-4.5 per cent in the second half
of 2017-18. Actual inflation outcomes so far have been
broadly in line with projections, though the extent of
the rise in inflation excluding food and fuel has been
somewhat higher than expected. The inflation path
for the rest of 2017-18 is expected to be shaped by
several factors. First, the assessment of food prices
going forward is largely favourable, though the first
advance estimates of kharif production pose some
uncertainty. Early indicators show that prices of pulses
which had declined significantly to undershoot trend
levels in recent months, have now begun to stabilise.
Second, some price revisions pending the goods and
services tax (GST) implementation have been taking
place. Third, there has been a broad-based increase
in CPI inflation excluding food and fuel. Finally,
international crude prices, which had started rising
from early July, have firmed up further in September.
Taking into account these factors, inflation is expected
to rise from its current level and range between 4.2-
4.6 per cent in the second half of this year, including
the house rent allowance by the Centre (Chart 1).
15. As noted in the August policy, there are factors
that continue to impart upside risks to this baseline
inflation trajectory: (a) implementation of farm loan
waivers by States may result in possible fiscal slippages
and undermine the quality of public spending,
thereby exerting pressure on prices; and (b) States’
implementation of the salary and allowances award
is not yet considered in the baseline projection; an
increase by States similar to that by the Centre could
RBI Bulletin October 2017 5
Monetary Policy StateMent for 2017-18Fourth Bi-monthly Monetary Policy Statement for 2017-18
push up headline inflation by about 100 basis points above the baseline over 18-24 months, a statistical effect that could have potential second round effects. However, adequate food stocks and effective supply management by the Government may keep food inflation more benign than assumed in the baseline.
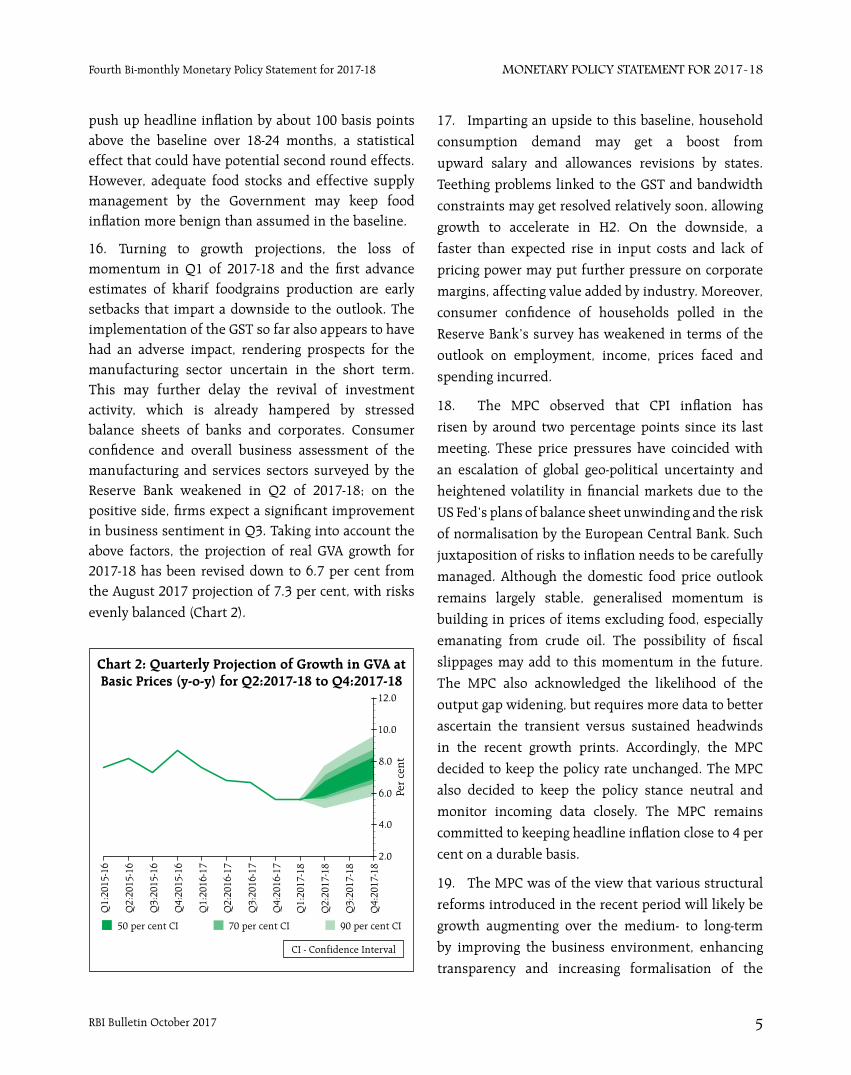
16. Turning to growth projections, the loss of momentum in Q1 of 2017-18 and the first advance estimates of kharif foodgrains production are early setbacks that impart a downside to the outlook. The implementation of the GST so far also appears to have had an adverse impact, rendering prospects for the manufacturing sector uncertain in the short term. This may further delay the revival of investment activity, which is already hampered by stressed balance sheets of banks and corporates. Consumer confidence and overall business assessment of the manufacturing and services sectors surveyed by the Reserve Bank weakened in Q2 of 2017-18; on the positive side, firms expect a significant improvement in business sentiment in Q3. Taking into account the above factors, the projection of real GVA growth for 2017-18 has been revised down to 6.7 per cent from the August 2017 projection of 7.3 per cent, with risks
evenly balanced (Chart 2).
17. Imparting an upside to this baseline, household
consumption demand may get a boost from
upward salary and allowances revisions by states.
Teething problems linked to the GST and bandwidth
constraints may get resolved relatively soon, allowing
growth to accelerate in H2. On the downside, a
faster than expected rise in input costs and lack of
pricing power may put further pressure on corporate
margins, affecting value added by industry. Moreover,
consumer confidence of households polled in the
Reserve Bank’s survey has weakened in terms of the
outlook on employment, income, prices faced and
spending incurred.
18. The MPC observed that CPI inflation has
risen by around two percentage points since its last
meeting. These price pressures have coincided with
an escalation of global geo-political uncertainty and
heightened volatility in financial markets due to the
US Fed’s plans of balance sheet unwinding and the risk
of normalisation by the European Central Bank. Such
juxtaposition of risks to inflation needs to be carefully
managed. Although the domestic food price outlook
remains largely stable, generalised momentum is
building in prices of items excluding food, especially
emanating from crude oil. The possibility of fiscal
slippages may add to this momentum in the future.
The MPC also acknowledged the likelihood of the
output gap widening, but requires more data to better
ascertain the transient versus sustained headwinds
in the recent growth prints. Accordingly, the MPC
decided to keep the policy rate unchanged. The MPC
also decided to keep the policy stance neutral and
monitor incoming data closely. The MPC remains
committed to keeping headline inflation close to 4 per
cent on a durable basis.
19. The MPC was of the view that various structural
reforms introduced in the recent period will likely be
growth augmenting over the medium- to long-term
by improving the business environment, enhancing
transparency and increasing formalisation of the
RBI Bulletin October 20176
Monetary Policy StateMent for 2017-18 Fourth Bi-monthly Monetary Policy Statement for 2017-18
economy. The Reserve Bank continues to work towards
the resolution of stressed corporate exposures in bank
balance sheets which should start yielding dividends
for the economy over the medium term.
20. The MPC reiterated that it is imperative to
reinvigorate investment activity which, in turn, would
revive the demand for bank credit by industry as
existing capacities get utilised and the requirements
of new capacity open up to be financed. Recapitalising
public sector banks adequately will ensure that credit
flows to the productive sectors are not impeded and
growth impulses not restrained. In addition, the
following measures could be undertaken to support
growth and achieve a faster closure of the output gap: a
concerted drive to close the severe infrastructure gap;
restarting stalled investment projects, particularly in
the public sector; enhancing ease of doing business,
including by further simplification of the GST; and
ensuring faster rollout of the affordable housing
program with time-bound single-window clearances
and rationalisation of excessively high stamp duties
by states.
21. Dr. Chetan Ghate, Dr. Pami Dua, Dr. Michael
Debabrata Patra, Dr. Viral V. Acharya and Dr. Urjit R.
Patel were in favour of the monetary policy decision,
while Dr. Ravindra H. Dholakia voted for a policy rate
reduction of at least 25 basis points. The minutes of
the MPC’s meeting will be published by October 18,
2017.
22. The next meeting of the MPC is scheduled on
December 5 and 6, 2017.
RBI Bulletin October 2017 7
Monetary Policy StateMent for 2017-18Monetary Policy Report - October 2017
Inflation is expected to pick up from its recent lows as favourable base effects reverse and enhanced house rent allowances are disbursed to central government employees. Economic activity is expected to recover, with an improvement in the services sector, even as investment activity remains anaemic.
Since the Monetary Policy Report (MPR) of April
2017, the macroeconomic setting for the conduct of
monetary policy has undergone significant shifts.
The gradual firming up of global growth, especially
in advanced economies (AEs), has whetted a renewed
search for returns that has buoyed global financial
markets. Capital flows to emerging market economies
(EMEs) have resumed strongly, albeit with some
differentiation in favour of jurisdictions that have
relatively resilient fundamentals. These flows are
likely to abate to an extent due to the upcoming
unwinding of quantitative easing (QE) by the US
Federal Reserve.
In India, the slowdown of economic activity that
set in from Q1 of 2016-17 and became pronounced in
the second half of the year appears to have extended
into the first half of 2017-18. Looking ahead, some
improvement in services may counterbalance the
persisting weakness in industrial production. Inflation
underwent a dramatic decline, reaching a historic low
in June, but as the prints for July and August portend,
a gradually rising trajectory may take hold over the
rest of 2017-18. Alongside these developments, there
has been an improvement in external viability; the
foreign exchange reserves were around 11.5 months
of imports in September 2017 and over 4 times short-
term external debt.
Monetary Policy Committee: April-August 2017
Against this backdrop, the monetary policy
committee (MPC) met in June and August under its
pre-announced bi-monthly schedule. Following up
on its decision to keep the policy rate unchanged in
April 2017, the MPC maintained status quo in its June
2017 meeting. While taking note of the significant
easing of inflation, the MPC observed that there is
considerable uncertainty around the evolving inflation
trajectory. Accordingly, it persevered with a neutral
stance, while remaining watchful of incoming data,
and noted that premature action risked disruptive
policy reversals later and loss of credibility. In its
August 2017 meeting, the MPC decided to reduce the
policy repo rate by 25 basis points (bps), noting that
(i) the baseline path of headline inflation excluding
the impact of house rent allowances (HRA) awarded
under the recommendation of the seventh central
pay commission (CPC) was likely to fall below the
projection made in June to a little above 4 per cent
by Q4; (ii) inflation excluding food and fuel had
fallen significantly since May after remaining sticky
through 2016-17; (iii) the roll-out of the GST during
July 2017 had been relatively smooth; and (iv) the
monsoon was expected to be normal. It judged,
therefore, that several upside risks to the baseline
inflation path had either reduced or not materialised.
These factors opened up some space for monetary
accommodation, especially after accounting for risks
to the growth outlook.
An interesting development has been the changing
profile of voting in the MPC. After a unanimous vote
in its April meeting, the MPC’s decision in June was
by a majority. While five members voted for keeping
the policy repo rate unchanged, one member voted in
favour of a 50 bps cut in the policy repo rate. In the
August meeting of the MPC, four members voted for a
policy repo rate cut of 25 bps, one member voted for a
cut in the policy repo rate by 50 bps and one member
voted for status quo. These patterns reflect diversity,
individual experiences and intellectual independence.
This development is in consonance with the cross-
country evidence on MPCs with external membership
(Table I.1).
I. Macroeconomic Outlook
RBI Bulletin October 20178
Monetary Policy StateMent for 2017-18 Monetary Policy Report - October 2017
Macroeconomic Outlook
Chapters II and III present analyses of
macroeconomic developments during 2017-18 so far
that explain why inflation and growth of gross value
added (GVA) undershot staff’s projections set out in
the April 2017 MPR. Moving on to the outlook, staff’s
assessment of the likely evolution of domestic and
global macroeconomic and financial conditions over
the forecast horizon remains broadly consistent with
the baseline assumptions made in the April 2017 MPR
(Table I.2).
First, the spatial and temporal distribution of the
south-west monsoon has been uneven and deficient
in some parts of the country, which is expected to lead
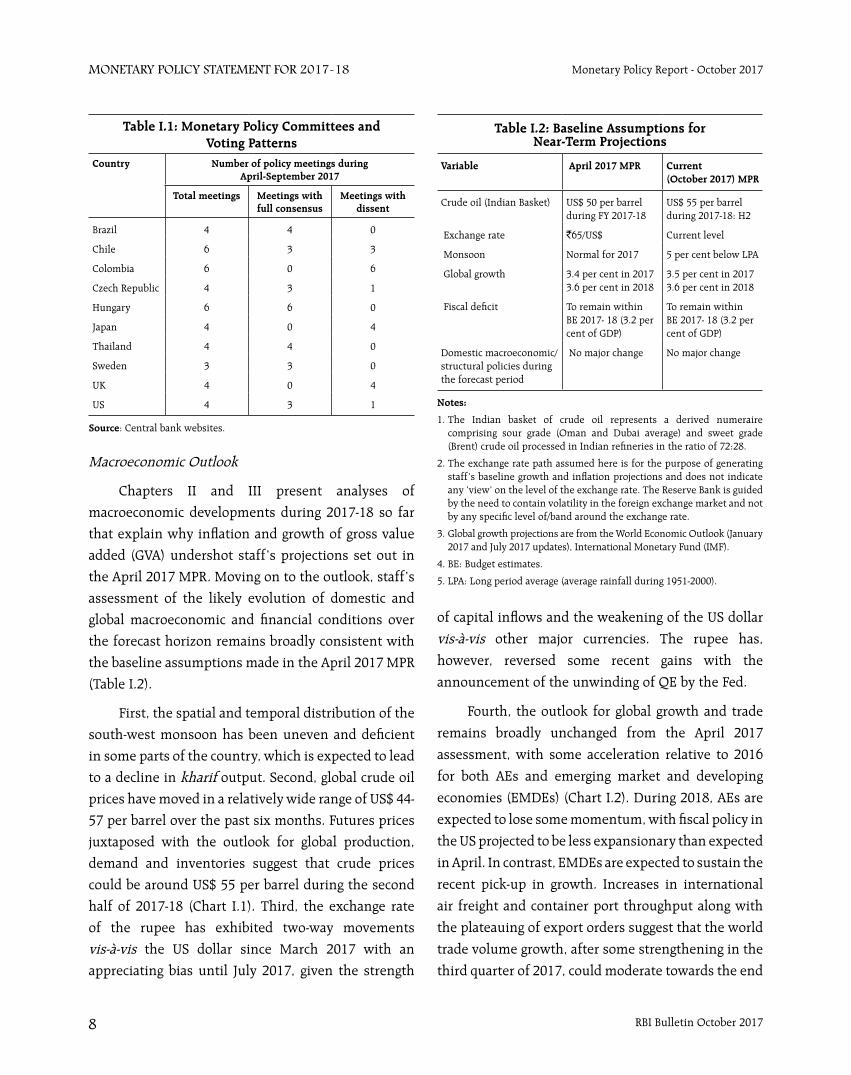
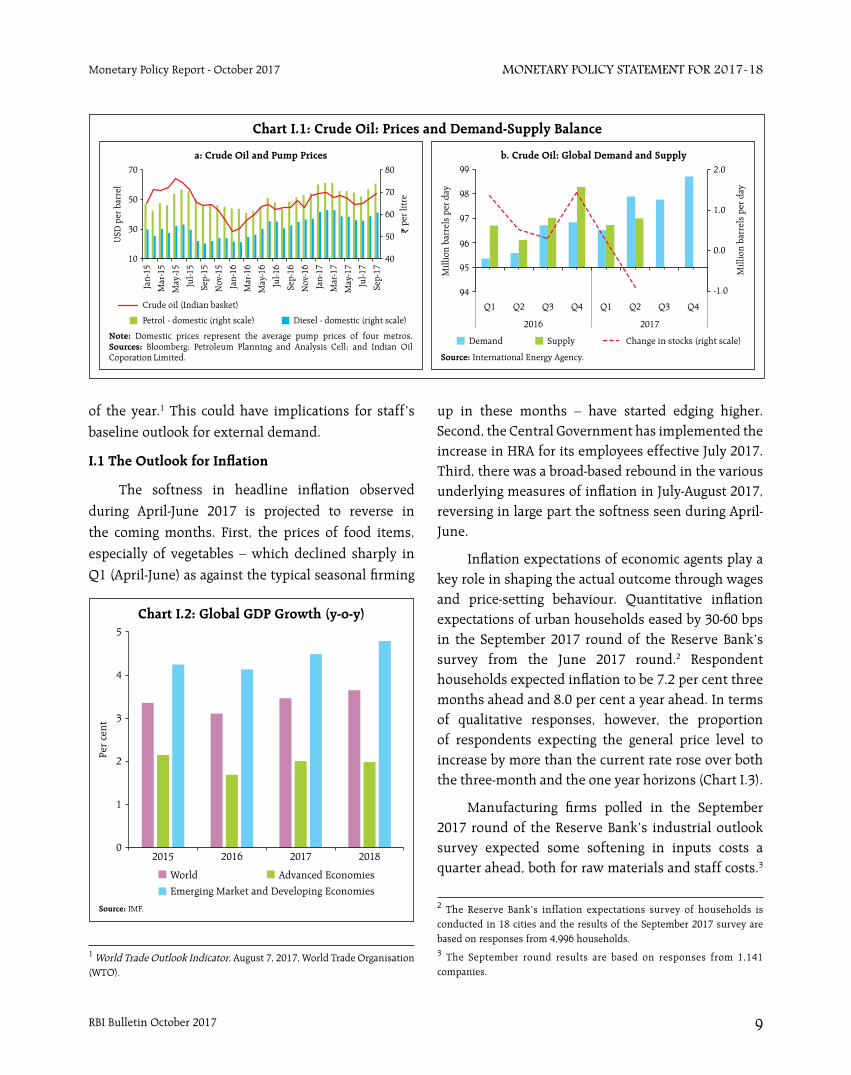
to a decline in kharif output. Second, global crude oil
prices have moved in a relatively wide range of US$ 44-
57 per barrel over the past six months. Futures prices
juxtaposed with the outlook for global production,
demand and inventories suggest that crude prices
could be around US$ 55 per barrel during the second
half of 2017-18 (Chart I.1). Third, the exchange rate
of the rupee has exhibited two-way movements
vis-à-vis the US dollar since March 2017 with an
appreciating bias until July 2017, given the strength
of capital inflows and the weakening of the US dollar
vis-à-vis other major currencies. The rupee has,
however, reversed some recent gains with the
announcement of the unwinding of QE by the Fed.
Fourth, the outlook for global growth and trade
remains broadly unchanged from the April 2017
assessment, with some acceleration relative to 2016
for both AEs and emerging market and developing
economies (EMDEs) (Chart I.2). During 2018, AEs are
expected to lose some momentum, with fiscal policy in
the US projected to be less expansionary than expected
in April. In contrast, EMDEs are expected to sustain the
recent pick-up in growth. Increases in international
air freight and container port throughput along with
the plateauing of export orders suggest that the world
trade volume growth, after some strengthening in the
third quarter of 2017, could moderate towards the end
Table I.1: Monetary Policy Committees and Voting Patterns
Country Number of policy meetings during April-September 2017
Total meetings Meetings with full consensus
Meetings with dissent
Brazil 4 4 0
Chile 6 3 3
Colombia 6 0 6
Czech Republic 4 3 1
Hungary 6 6 0
Japan 4 0 4
Thailand 4 4 0
Sweden 3 3 0
UK 4 0 4
US 4 3 1
Source: Central bank websites.
Table I.2: Baseline Assumptions for Near-Term Projections
Variable April 2017 MPR Current (October 2017) MPR
Crude oil (Indian Basket) US$ 50 per barrel during FY 2017-18
US$ 55 per barrel during 2017-18: H2
Exchange rate `65/US$ Current level
Monsoon Normal for 2017 5 per cent below LPA
Global growth 3.4 per cent in 2017 3.6 per cent in 2018
3.5 per cent in 2017 3.6 per cent in 2018
Fiscal deficit To remain within BE 2017- 18 (3.2 per cent of GDP)
To remain within BE 2017- 18 (3.2 per cent of GDP)
Domestic macroeconomic/structural policies during the forecast period
No major change No major change
Notes:
1. The Indian basket of crude oil represents a derived numeraire comprising sour grade (Oman and Dubai average) and sweet grade (Brent) crude oil processed in Indian refineries in the ratio of 72:28.
2. The exchange rate path assumed here is for the purpose of generating staff’s baseline growth and inflation projections and does not indicate any ‘view’ on the level of the exchange rate. The Reserve Bank is guided by the need to contain volatility in the foreign exchange market and not by any specific level of/band around the exchange rate.
3. Global growth projections are from the World Economic Outlook (January 2017 and July 2017 updates), International Monetary Fund (IMF).
4. BE: Budget estimates.
5. LPA: Long period average (average rainfall during 1951-2000).
RBI Bulletin October 2017 9
Monetary Policy StateMent for 2017-18Monetary Policy Report - October 2017
of the year.1 This could have implications for staff’s
baseline outlook for external demand.
I.1 The Outlook for Inflation
The softness in headline inflation observed
during April-June 2017 is projected to reverse in
the coming months. First, the prices of food items,
especially of vegetables – which declined sharply in
Q1 (April-June) as against the typical seasonal firming
up in these months – have started edging higher. Second, the Central Government has implemented the increase in HRA for its employees effective July 2017. Third, there was a broad-based rebound in the various underlying measures of inflation in July-August 2017, reversing in large part the softness seen during April-June.
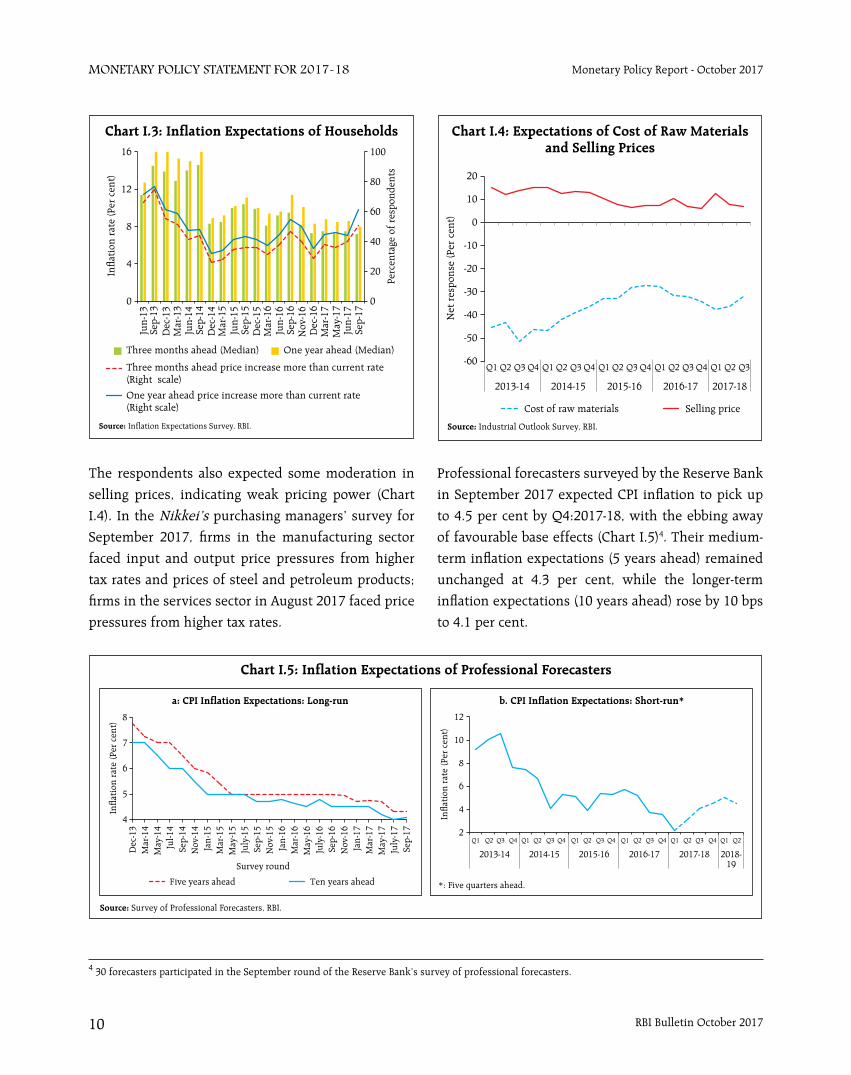
Inflation expectations of economic agents play a key role in shaping the actual outcome through wages and price-setting behaviour. Quantitative inflation expectations of urban households eased by 30-60 bps in the September 2017 round of the Reserve Bank’s survey from the June 2017 round.2 Respondent households expected inflation to be 7.2 per cent three months ahead and 8.0 per cent a year ahead. In terms of qualitative responses, however, the proportion of respondents expecting the general price level to increase by more than the current rate rose over both the three-month and the one year horizons (Chart I.3).
Manufacturing firms polled in the September 2017 round of the Reserve Bank’s industrial outlook survey expected some softening in inputs costs a quarter ahead, both for raw materials and staff costs.3
1 World Trade Outlook Indicator, August 7, 2017, World Trade Organisation (WTO).
2 The Reserve Bank’s inflation expectations survey of households is conducted in 18 cities and the results of the September 2017 survey are based on responses from 4,996 households. 3 The September round results are based on responses from 1,141 companies.
RBI Bulletin October 201710
Monetary Policy StateMent for 2017-18 Monetary Policy Report - October 2017
The respondents also expected some moderation in
selling prices, indicating weak pricing power (Chart
I.4). In the Nikkei’s purchasing managers’ survey for
September 2017, firms in the manufacturing sector
faced input and output price pressures from higher
tax rates and prices of steel and petroleum products;
firms in the services sector in August 2017 faced price
pressures from higher tax rates.
Professional forecasters surveyed by the Reserve Bank
in September 2017 expected CPI inflation to pick up
to 4.5 per cent by Q4:2017-18, with the ebbing away
of favourable base effects (Chart I.5)4. Their medium-
term inflation expectations (5 years ahead) remained
unchanged at 4.3 per cent, while the longer-term
inflation expectations (10 years ahead) rose by 10 bps
to 4.1 per cent.
4 30 forecasters participated in the September round of the Reserve Bank’s survey of professional forecasters.
RBI Bulletin October 2017 11
Monetary Policy StateMent for 2017-18Monetary Policy Report - October 2017
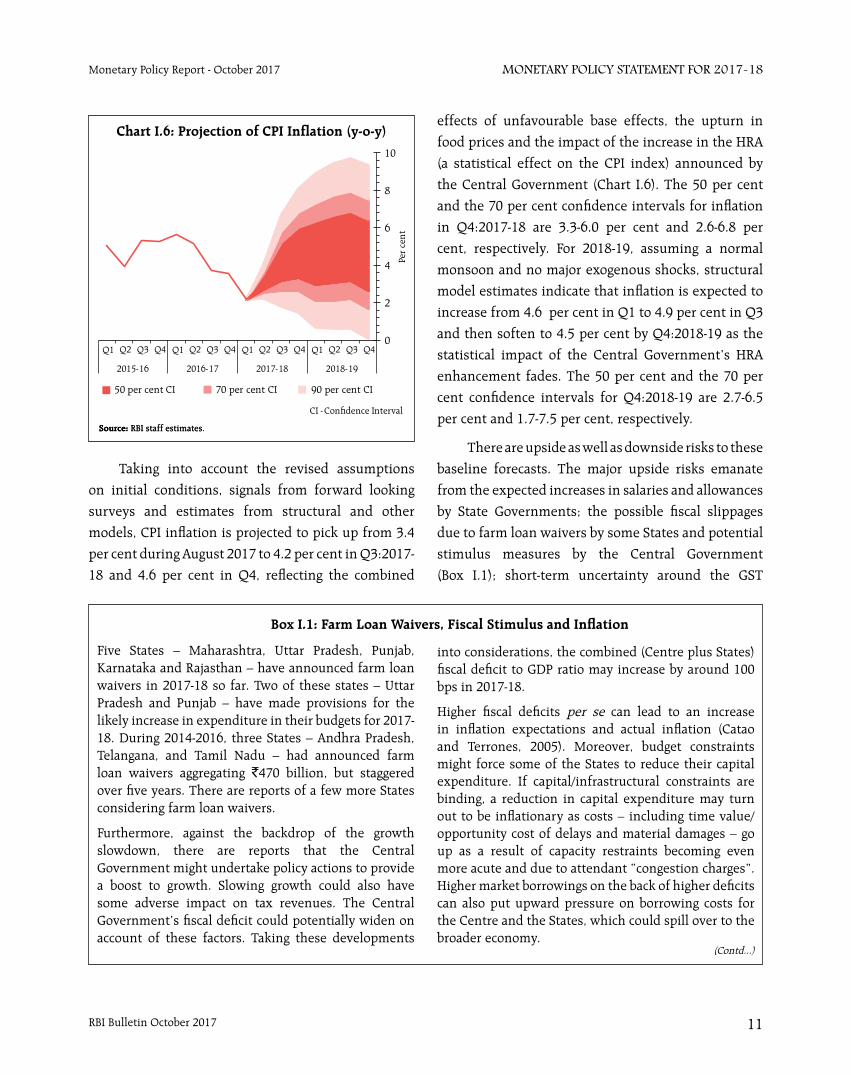
Taking into account the revised assumptions
on initial conditions, signals from forward looking
surveys and estimates from structural and other
models, CPI inflation is projected to pick up from 3.4
per cent during August 2017 to 4.2 per cent in Q3:2017-
18 and 4.6 per cent in Q4, reflecting the combined
effects of unfavourable base effects, the upturn in
food prices and the impact of the increase in the HRA
(a statistical effect on the CPI index) announced by
the Central Government (Chart I.6). The 50 per cent
and the 70 per cent confidence intervals for inflation
in Q4:2017-18 are 3.3-6.0 per cent and 2.6-6.8 per
cent, respectively. For 2018-19, assuming a normal
monsoon and no major exogenous shocks, structural
model estimates indicate that inflation is expected to
increase from 4.6 per cent in Q1 to 4.9 per cent in Q3
and then soften to 4.5 per cent by Q4:2018-19 as the
statistical impact of the Central Government’s HRA
enhancement fades. The 50 per cent and the 70 per
cent confidence intervals for Q4:2018-19 are 2.7-6.5
per cent and 1.7-7.5 per cent, respectively.
There are upside as well as downside risks to these
baseline forecasts. The major upside risks emanate
from the expected increases in salaries and allowances
by State Governments; the possible fiscal slippages
due to farm loan waivers by some States and potential
stimulus measures by the Central Government
(Box I.1); short-term uncertainty around the GST
Five States – Maharashtra, Uttar Pradesh, Punjab, Karnataka and Rajasthan – have announced farm loan waivers in 2017-18 so far. Two of these states – Uttar Pradesh and Punjab – have made provisions for the likely increase in expenditure in their budgets for 2017-18. During 2014-2016, three States – Andhra Pradesh, Telangana, and Tamil Nadu – had announced farm loan waivers aggregating `470 billion, but staggered over five years. There are reports of a few more States considering farm loan waivers.
Furthermore, against the backdrop of the growth slowdown, there are reports that the Central Government might undertake policy actions to provide a boost to growth. Slowing growth could also have some adverse impact on tax revenues. The Central Government’s fiscal deficit could potentially widen on account of these factors. Taking these developments
Box I.1: Farm Loan Waivers, Fiscal Stimulus and Inflation
into considerations, the combined (Centre plus States) fiscal deficit to GDP ratio may increase by around 100 bps in 2017-18.
Higher fiscal deficits per se can lead to an increase in inflation expectations and actual inflation (Catao and Terrones, 2005). Moreover, budget constraints might force some of the States to reduce their capital expenditure. If capital/infrastructural constraints are binding, a reduction in capital expenditure may turn out to be inflationary as costs – including time value/opportunity cost of delays and material damages – go up as a result of capacity restraints becoming even more acute and due to attendant “congestion charges”. Higher market borrowings on the back of higher deficits can also put upward pressure on borrowing costs for the Centre and the States, which could spill over to the broader economy.
(Contd...)
RBI Bulletin October 201712
Monetary Policy StateMent for 2017-18 Monetary Policy Report - October 2017
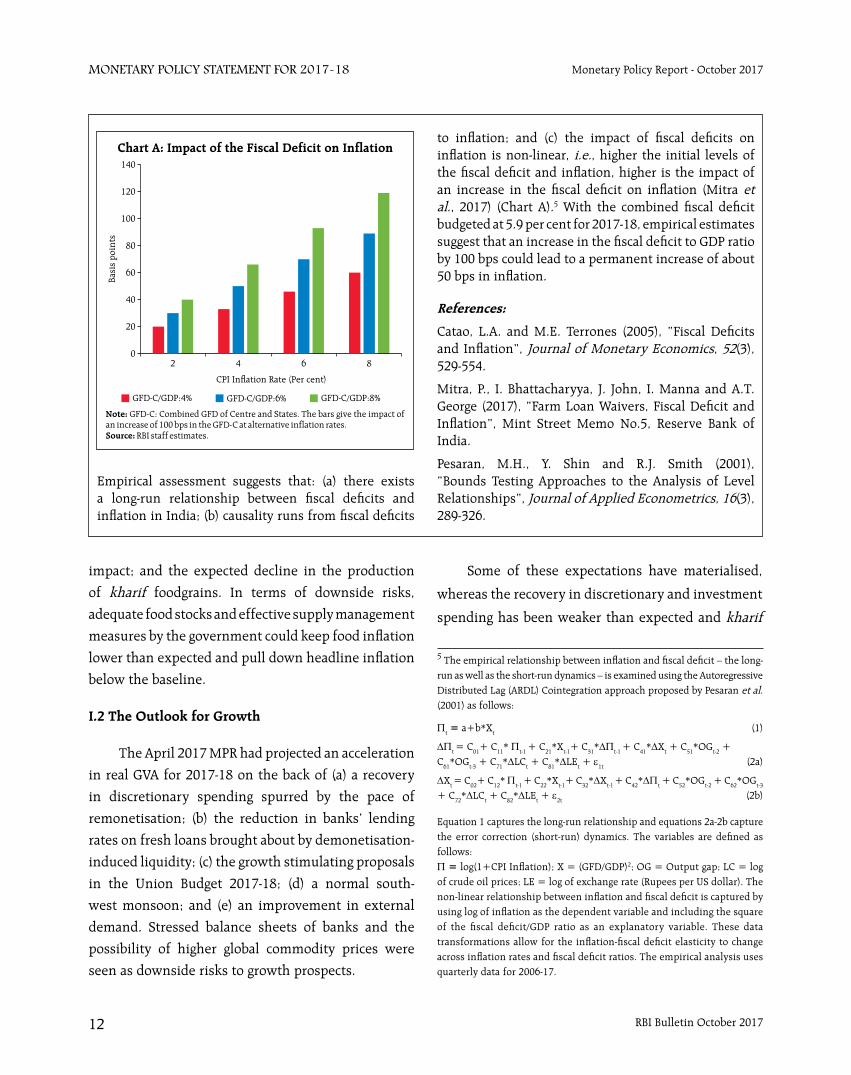
Empirical assessment suggests that: (a) there exists a long-run relationship between fiscal deficits and inflation in India; (b) causality runs from fiscal deficits
to inflation; and (c) the impact of fiscal deficits on inflation is non-linear, i.e., higher the initial levels of the fiscal deficit and inflation, higher is the impact of an increase in the fiscal deficit on inflation (Mitra et al., 2017) (Chart A).5 With the combined fiscal deficit budgeted at 5.9 per cent for 2017-18, empirical estimates suggest that an increase in the fiscal deficit to GDP ratio by 100 bps could lead to a permanent increase of about 50 bps in inflation.
References:
Catao, L.A. and M.E. Terrones (2005), “Fiscal Deficits and Inflation”, Journal of Monetary Economics, 52(3), 529-554.
Mitra, P., I. Bhattacharyya, J. John, I. Manna and A.T. George (2017), “Farm Loan Waivers, Fiscal Deficit and Inflation”, Mint Street Memo No.5, Reserve Bank of India.
Pesaran, M.H., Y. Shin and R.J. Smith (2001), “Bounds Testing Approaches to the Analysis of Level Relationships”, Journal of Applied Econometrics, 16(3), 289-326.
5 The empirical relationship between inflation and fiscal deficit – the long-run as well as the short-run dynamics – is examined using the Autoregressive Distributed Lag (ARDL) Cointegration approach proposed by Pesaran et al. (2001) as follows:
Πt = a+b*Xt (1)
∆Πt = C01+ C11* Πt-1 + C21*Xt-1+ C31*∆Πt-1 + C41*∆Xt + C51*OGt-2 +C61*OGt-3 + C71*∆LCt + C81*∆LEt + ε1t (2a)
∆Xt = C02+ C12* Πt-1 + C22*Xt-1+ C32*∆Xt-1 + C42*∆Πt + C52*OGt-2 + C62*OGt-3
+ C72*∆LCt + C82*∆LEt + ε2t (2b)
Equation 1 captures the long-run relationship and equations 2a-2b capture the error correction (short-run) dynamics. The variables are defined as follows:Π = log(1+CPI Inflation); X = (GFD/GDP)2; OG = Output gap; LC = log of crude oil prices; LE = log of exchange rate (Rupees per US dollar). The non-linear relationship between inflation and fiscal deficit is captured by using log of inflation as the dependent variable and including the square of the fiscal deficit/GDP ratio as an explanatory variable. These data transformations allow for the inflation-fiscal deficit elasticity to change across inflation rates and fiscal deficit ratios. The empirical analysis uses quarterly data for 2006-17.
impact; and the expected decline in the production
of kharif foodgrains. In terms of downside risks,
adequate food stocks and effective supply management
measures by the government could keep food inflation
lower than expected and pull down headline inflation
below the baseline.
I.2 The Outlook for Growth
The April 2017 MPR had projected an acceleration
in real GVA for 2017-18 on the back of (a) a recovery
in discretionary spending spurred by the pace of
remonetisation; (b) the reduction in banks’ lending
rates on fresh loans brought about by demonetisation-
induced liquidity; (c) the growth stimulating proposals
in the Union Budget 2017-18; (d) a normal south-
west monsoon; and (e) an improvement in external
demand. Stressed balance sheets of banks and the
possibility of higher global commodity prices were
seen as downside risks to growth prospects.
Some of these expectations have materialised,
whereas the recovery in discretionary and investment
spending has been weaker than expected and kharif
RBI Bulletin October 2017 13
Monetary Policy StateMent for 2017-18Monetary Policy Report - October 2017
foodgrains production is expected to be lower than
last year in view of the shortfall and irregular rainfall
during the south-west monsoon this year. The
uncertainty about the implementation of GST also
appears to have had some impact on economic activity,
although it is expected to be offset by productivity-
enhancing effects in the medium- and long-run.
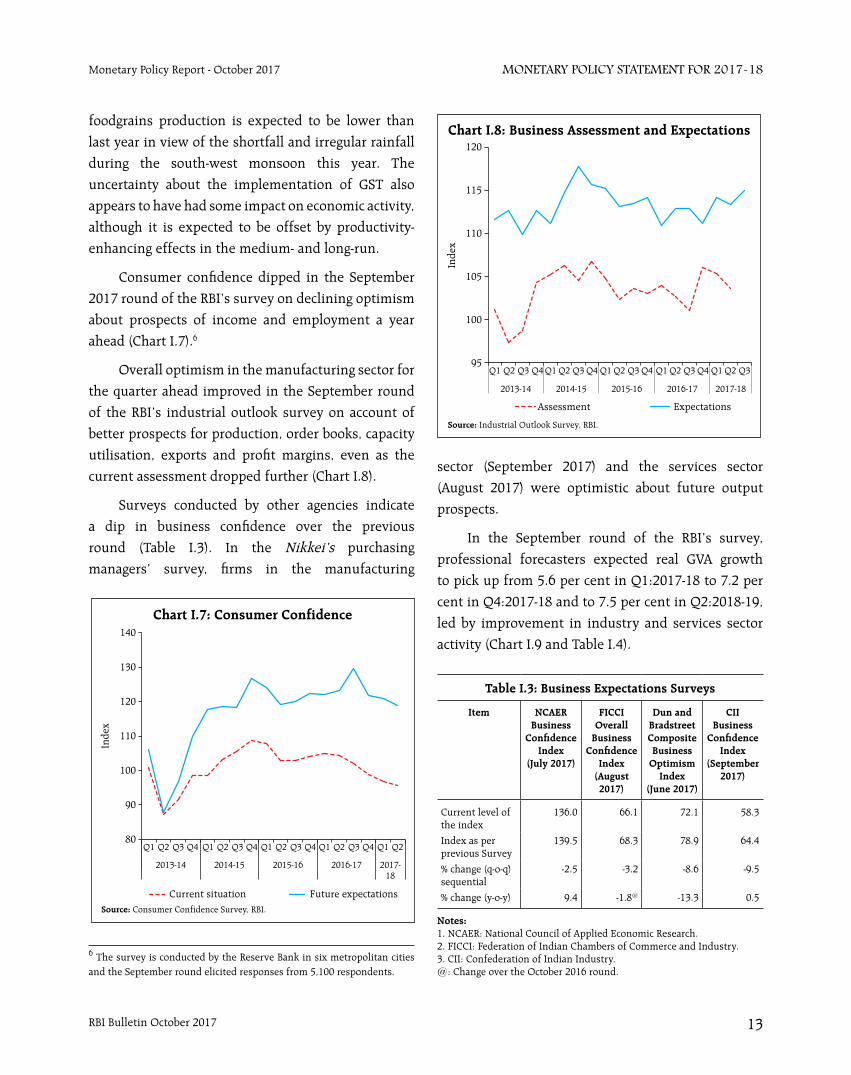
Consumer confidence dipped in the September
2017 round of the RBI’s survey on declining optimism
about prospects of income and employment a year
ahead (Chart I.7).6
Overall optimism in the manufacturing sector for
the quarter ahead improved in the September round
of the RBI’s industrial outlook survey on account of
better prospects for production, order books, capacity
utilisation, exports and profit margins, even as the
current assessment dropped further (Chart I.8).
Surveys conducted by other agencies indicate
a dip in business confidence over the previous
round (Table I.3). In the Nikkei’s purchasing
managers’ survey, firms in the manufacturing
6 The survey is conducted by the Reserve Bank in six metropolitan cities and the September round elicited responses from 5,100 respondents.
sector (September 2017) and the services sector
(August 2017) were optimistic about future output
prospects.
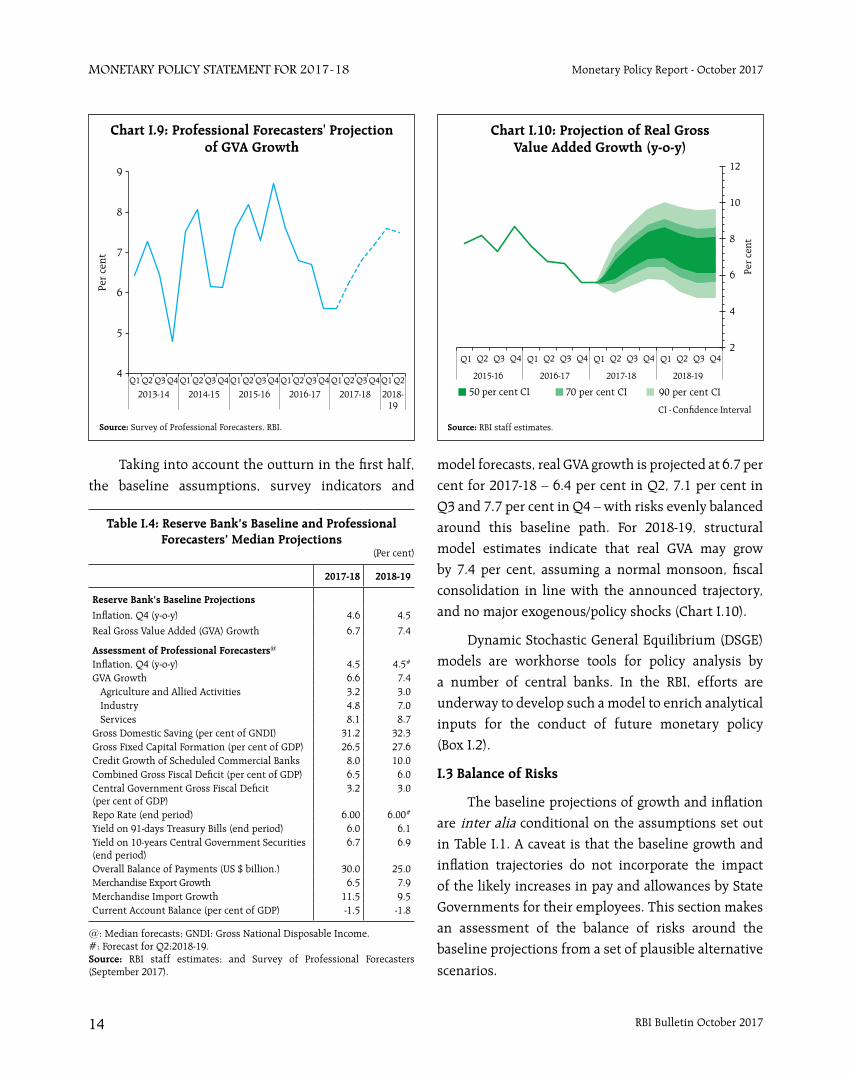
In the September round of the RBI’s survey,
professional forecasters expected real GVA growth
to pick up from 5.6 per cent in Q1:2017-18 to 7.2 per
cent in Q4:2017-18 and to 7.5 per cent in Q2:2018-19,
led by improvement in industry and services sector
activity (Chart I.9 and Table I.4).
Table I.3: Business Expectations Surveys
Item NCAER Business
Confidence Index
(July 2017)
FICCI Overall
Business Confidence
Index(August 2017)
Dun and Bradstreet Composite Business
Optimism Index
(June 2017)
CII Business
Confidence Index
(September 2017)
Current level of the index
136.0 66.1 72.1 58.3
Index as per previous Survey
139.5 68.3 78.9 64.4
% change (q-o-q) sequential
-2.5 -3.2 -8.6 -9.5
% change (y-o-y) 9.4 -1.8@ -13.3 0.5
Notes: 1. NCAER: National Council of Applied Economic Research. 2. FICCI: Federation of Indian Chambers of Commerce and Industry. 3. CII: Confederation of Indian Industry.@: Change over the October 2016 round.
RBI Bulletin October 201714
Monetary Policy StateMent for 2017-18 Monetary Policy Report - October 2017
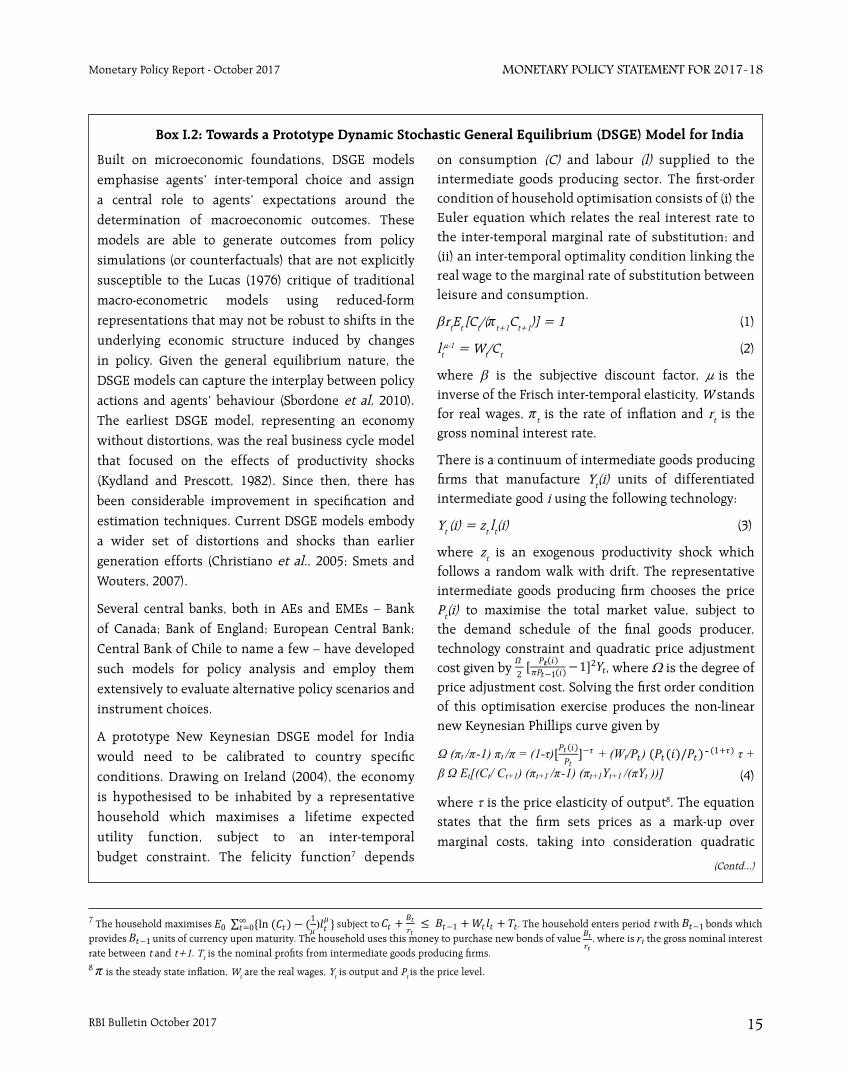
Taking into account the outturn in the first half,
the baseline assumptions, survey indicators and
model forecasts, real GVA growth is projected at 6.7 per cent for 2017-18 – 6.4 per cent in Q2, 7.1 per cent in Q3 and 7.7 per cent in Q4 – with risks evenly balanced around this baseline path. For 2018-19, structural model estimates indicate that real GVA may grow by 7.4 per cent, assuming a normal monsoon, fiscal consolidation in line with the announced trajectory, and no major exogenous/policy shocks (Chart I.10).
Dynamic Stochastic General Equilibrium (DSGE) models are workhorse tools for policy analysis by a number of central banks. In the RBI, efforts are underway to develop such a model to enrich analytical inputs for the conduct of future monetary policy (Box I.2).
I.3 Balance of Risks
The baseline projections of growth and inflation are inter alia conditional on the assumptions set out in Table I.1. A caveat is that the baseline growth and inflation trajectories do not incorporate the impact of the likely increases in pay and allowances by State Governments for their employees. This section makes an assessment of the balance of risks around the baseline projections from a set of plausible alternative
scenarios.
Table I.4: Reserve Bank’s Baseline and Professional Forecasters’ Median Projections
(Per cent)
2017-18 2018-19
Reserve Bank’s Baseline Projections
Inflation, Q4 (y-o-y) 4.6 4.5
Real Gross Value Added (GVA) Growth 6.7 7.4
Assessment of Professional Forecasters@
Inflation, Q4 (y-o-y) 4.5 4.5#
GVA Growth 6.6 7.4 Agriculture and Allied Activities 3.2 3.0 Industry 4.8 7.0 Services 8.1 8.7Gross Domestic Saving (per cent of GNDI) 31.2 32.3Gross Fixed Capital Formation (per cent of GDP) 26.5 27.6Credit Growth of Scheduled Commercial Banks 8.0 10.0Combined Gross Fiscal Deficit (per cent of GDP) 6.5 6.0Central Government Gross Fiscal Deficit (per cent of GDP)
3.2 3.0
Repo Rate (end period) 6.00 6.00#
Yield on 91-days Treasury Bills (end period) 6.0 6.1Yield on 10-years Central Government Securities (end period)
6.7 6.9
Overall Balance of Payments (US $ billion.) 30.0 25.0Merchandise Export Growth 6.5 7.9Merchandise Import Growth 11.5 9.5Current Account Balance (per cent of GDP) -1.5 -1.8
@: Median forecasts; GNDI: Gross National Disposable Income.#: Forecast for Q2:2018-19.Source: RBI staff estimates; and Survey of Professional Forecasters (September 2017).
RBI Bulletin October 2017 15
Monetary Policy StateMent for 2017-18Monetary Policy Report - October 2017
on consumption (C) and labour (l) supplied to the intermediate goods producing sector. The first-order condition of household optimisation consists of (i) the Euler equation which relates the real interest rate to the inter-temporal marginal rate of substitution; and (ii) an inter-temporal optimality condition linking the real wage to the marginal rate of substitution between leisure and consumption.
βrtEt [Ct/( t+1Ct+1)] = 1 (1)
ltµ-1 = Wt/Ct (2)
where β is the subjective discount factor, µ is the inverse of the Frisch inter-temporal elasticity, W stands for real wages, t is the rate of inflation and rt is the gross nominal interest rate.
There is a continuum of intermediate goods producing firms that manufacture Yt(i) units of differentiated intermediate good i using the following technology:
Yt (i) = zt lt(i) (3)
where zt is an exogenous productivity shock which follows a random walk with drift. The representative intermediate goods producing firm chooses the price Pt(i) to maximise the total market value, subject to the demand schedule of the final goods producer, technology constraint and quadratic price adjustment cost given by , where Ω is the degree of price adjustment cost. Solving the first order condition of this optimisation exercise produces the non-linear new Keynesian Phillips curve given by
(4)
where τ is the price elasticity of output8. The equation states that the firm sets prices as a mark-up over marginal costs, taking into consideration quadratic
Built on microeconomic foundations, DSGE models emphasise agents’ inter-temporal choice and assign a central role to agents’ expectations around the determination of macroeconomic outcomes. These models are able to generate outcomes from policy simulations (or counterfactuals) that are not explicitly susceptible to the Lucas (1976) critique of traditional macro-econometric models using reduced-form representations that may not be robust to shifts in the underlying economic structure induced by changes in policy. Given the general equilibrium nature, the DSGE models can capture the interplay between policy actions and agents’ behaviour (Sbordone et al, 2010). The earliest DSGE model, representing an economy without distortions, was the real business cycle model that focused on the effects of productivity shocks (Kydland and Prescott, 1982). Since then, there has been considerable improvement in specification and estimation techniques. Current DSGE models embody a wider set of distortions and shocks than earlier generation efforts (Christiano et al., 2005; Smets and Wouters, 2007).
Several central banks, both in AEs and EMEs – Bank of Canada; Bank of England; European Central Bank; Central Bank of Chile to name a few – have developed such models for policy analysis and employ them extensively to evaluate alternative policy scenarios and instrument choices.
A prototype New Keynesian DSGE model for India would need to be calibrated to country specific conditions. Drawing on Ireland (2004), the economy is hypothesised to be inhabited by a representative household which maximises a lifetime expected utility function, subject to an inter-temporal budget constraint. The felicity function7 depends
Box I.2: Towards a Prototype Dynamic Stochastic General Equilibrium (DSGE) Model for India
7 The household maximises subject to . The household enters period t with bonds which provides units of currency upon maturity. The household uses this money to purchase new bonds of value , where is the gross nominal interest rate between t and t+1. Tt is the nominal profits from intermediate goods producing firms.8 is the steady state inflation, Wt are the real wages, Yt is output and Pt is the price level.
(Contd...)
RBI Bulletin October 201716
Monetary Policy StateMent for 2017-18 Monetary Policy Report - October 2017
price adjustment costs (Mumtaz and Zanetti, 2013). As Ireland (2004) explains, the intermediate firm fixes its mark-up of price Pt(i) over marginal cost in proportion to τ/(τ–1) in the absence of costly price adjustment. With price adjustment cost, a firm’s actual mark-up would deviate from the desired mark-up and gravitate towards the latter over time.
The central bank sets the nominal interest rate according to the Taylor rule:
(5)
where rss and yss are the steady-state interest rate and steady-state output, respectively, and εt is an exogenous policy shock. Equations (1)-(5), along with the market-clearing condition, constitute the system of equations which can be solved using standard DSGE methods. 9
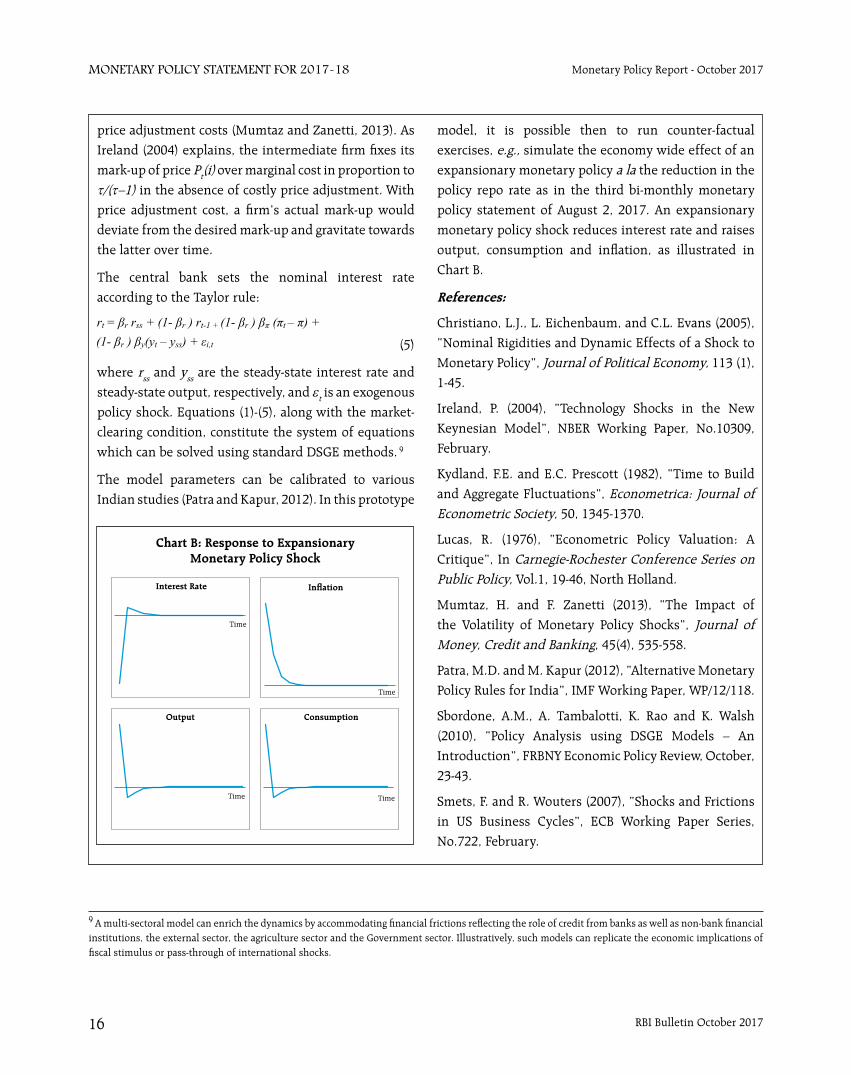
The model parameters can be calibrated to various Indian studies (Patra and Kapur, 2012). In this prototype
model, it is possible then to run counter-factual exercises, e.g., simulate the economy wide effect of an expansionary monetary policy a la the reduction in the policy repo rate as in the third bi-monthly monetary policy statement of August 2, 2017. An expansionary monetary policy shock reduces interest rate and raises output, consumption and inflation, as illustrated in Chart B.
References:
Christiano, L.J., L. Eichenbaum, and C.L. Evans (2005), “Nominal Rigidities and Dynamic Effects of a Shock to Monetary Policy”, Journal of Political Economy, 113 (1), 1-45.
Ireland, P. (2004), “Technology Shocks in the New Keynesian Model”, NBER Working Paper, No.10309, February.
Kydland, F.E. and E.C. Prescott (1982), “Time to Build and Aggregate Fluctuations”, Econometrica: Journal of Econometric Society, 50, 1345-1370.
Lucas, R. (1976), “Econometric Policy Valuation: A Critique”, In Carnegie-Rochester Conference Series on Public Policy, Vol.1, 19-46, North Holland.
Mumtaz, H. and F. Zanetti (2013), “The Impact of the Volatility of Monetary Policy Shocks”, Journal of Money, Credit and Banking, 45(4), 535-558.
Patra, M.D. and M. Kapur (2012), “Alternative Monetary Policy Rules for India”, IMF Working Paper, WP/12/118.
Sbordone, A.M., A. Tambalotti, K. Rao and K. Walsh (2010), “Policy Analysis using DSGE Models – An Introduction”, FRBNY Economic Policy Review, October, 23-43.
Smets, F. and R. Wouters (2007), “Shocks and Frictions in US Business Cycles”, ECB Working Paper Series, No.722, February.
9 A multi-sectoral model can enrich the dynamics by accommodating financial frictions reflecting the role of credit from banks as well as non-bank financial institutions, the external sector, the agriculture sector and the Government sector. Illustratively, such models can replicate the economic implications of fiscal stimulus or pass-through of international shocks.
RBI Bulletin October 2017 17
Monetary Policy StateMent for 2017-18Monetary Policy Report - October 2017
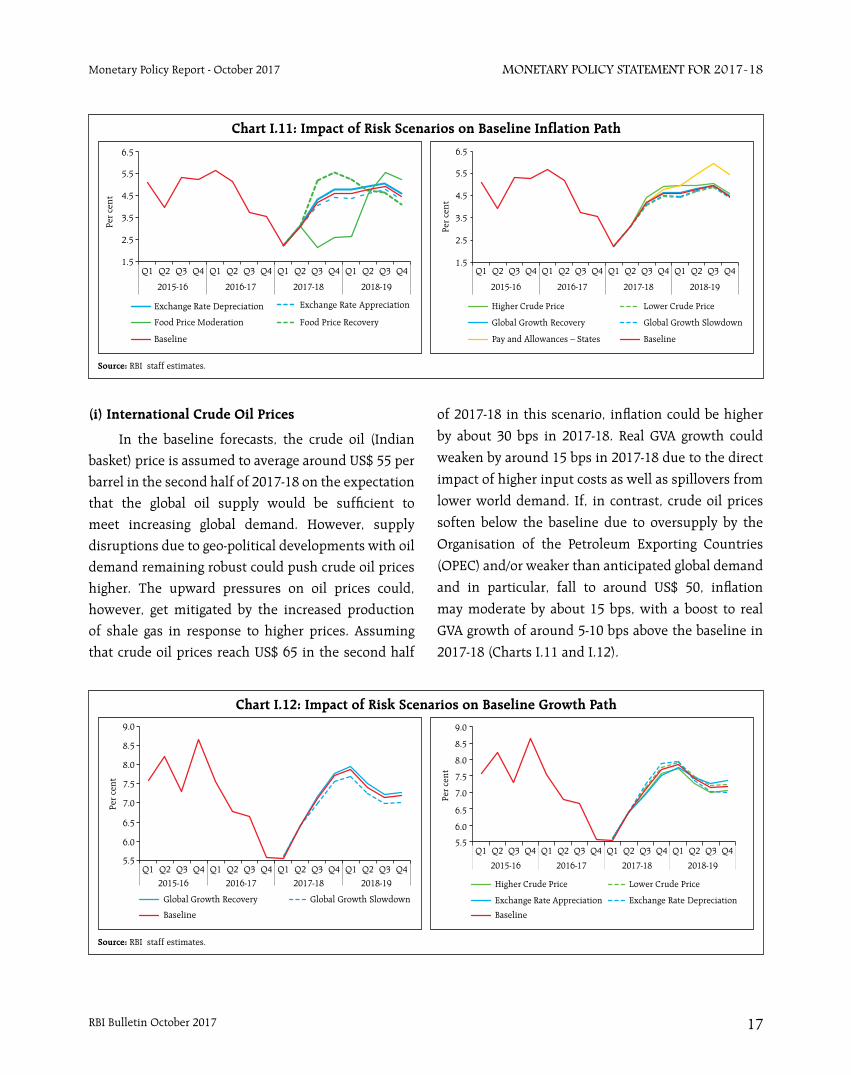
(i) International Crude Oil Prices
In the baseline forecasts, the crude oil (Indian
basket) price is assumed to average around US$ 55 per
barrel in the second half of 2017-18 on the expectation
that the global oil supply would be sufficient to
meet increasing global demand. However, supply
disruptions due to geo-political developments with oil
demand remaining robust could push crude oil prices
higher. The upward pressures on oil prices could,
however, get mitigated by the increased production
of shale gas in response to higher prices. Assuming
that crude oil prices reach US$ 65 in the second half
of 2017-18 in this scenario, inflation could be higher
by about 30 bps in 2017-18. Real GVA growth could
weaken by around 15 bps in 2017-18 due to the direct
impact of higher input costs as well as spillovers from
lower world demand. If, in contrast, crude oil prices
soften below the baseline due to oversupply by the
Organisation of the Petroleum Exporting Countries
(OPEC) and/or weaker than anticipated global demand
and in particular, fall to around US$ 50, inflation
may moderate by about 15 bps, with a boost to real
GVA growth of around 5-10 bps above the baseline in
2017-18 (Charts I.11 and I.12).
RBI Bulletin October 201718
Monetary Policy StateMent for 2017-18 Monetary Policy Report - October 2017
(ii) Global Demand
Global demand is expected to be higher in 2017
and 2018 in the baseline scenario with both upside and
downside risks to the outlook. On the downside, the
expected demand boost from expansionary US fiscal
policy may not materialise, given recent developments
in the US. In China, growth has remained resilient,
but concerns over its sustainability remain in view
of the large overhang of debt. Persisting disconnect
between market participants’ assessment and that
of the US Federal Open Market Committee (FOMC)
over the pace of US monetary policy normalisation
could trigger volatility in financial markets, especially
in view of stretched market valuations. The ensuing
tightening of global financial conditions in a milieu of
inward-looking protectionist tendencies could amplify
downside risks, especially for EMEs. Assuming global
growth turns out to be 50 bps below the baseline,
domestic growth and inflation could fall below the
baseline forecasts by around 20 bps and 10 bps,
respectively. However, reduced political risks in the
euro area could lead to a more sustained and stronger
cyclical rebound, providing a boost to global growth.
Assuming that global growth is higher by 25 bps, real
GVA growth and inflation could turn out to be around
10 bps and 5 bps, respectively, above the baseline.
(iii) Exchange Rate
The exchange rate of the Indian rupee has
exhibited two-way movements vis-à-vis the US dollar
during the first half of 2017-18. Going forward, the
normalisation of monetary policy in the US (and
possibly other central banks in AEs) and protectionist
policies of major AEs and EMEs could lead to some
volatility in the foreign exchange market and downward
pressures on the exchange rate. A depreciation of
the Indian rupee by around 5 per cent relative to the
baseline could raise inflation by around 20 bps in
2017-18, while producing some positive impact on net
exports and growth. On the other hand, in view of the
robust growth prospects of the Indian economy in a
cross-country perspective and the various initiatives
to attract foreign direct investment, India is likely to
remain an attractive destination for foreign investors
and this could lead to an appreciation of the domestic
currency. An appreciation of the Indian rupee by 5 per
cent could soften inflation by around 20 bps but also
deliver a negative impact of 10-15 bps on real GVA
growth.
(iv) Food Inflation
The substantial softening of headline inflation
in the first quarter of 2017-18 reflected the absence
of the usual seasonal pick up in food prices in the
post-winter period, especially pulses and vegetables.
These food price dynamics may have both structural
and cyclical elements, although it is difficult to
disentangle them at this juncture. If the softening in
food inflation observed since the second half of 2016
is largely structural, then the momentum in food
prices in the rest of 2017-18 could be negligible and
headline inflation could be below the baseline by up
to 2 percentage points. If however, low food inflation
turns out to be largely cyclical, food prices are likely to
revert to trend. Assuming that the momentum in the
food prices in the coming months is in line with the
average of the past five years, headline inflation may
turn out to be 100 bps above the baseline.
(v) Pay and Allowances – Implementation by States
The impact of increased salaries and pensions
of Central Government employees in 2016 and the
implementation of HRA effective July 2017 has been
embedded in the baseline forecasts. Assuming that
State Governments implement a similar order of
increase in their pay and allowances, CPI inflation
could go up to 100 bps above the baseline on account
of the direct statistical effect of higher house rents
with possible indirect effects emanating from higher
demand and increase in inflation expectations.
RBI Bulletin October 2017 19
Monetary Policy StateMent for 2017-18Monetary Policy Report - October 2017
(vi) Fiscal Slippage
As noted earlier, there are upside risks to the
Central Government’s fiscal deficit from possible
measures to provide a boost to domestic demand and
from lower tax revenues. Assuming that the Central
Government’s fiscal deficit/GDP ratio widens by 50
bps in 2017-18, inflation could be around 25 bps above
the baseline.
To conclude, the growth outlook is expected to
improve in the second half of 2017-18, although it
could be weighed down by still sluggish investment
and export activity. Higher food prices and the
increase in house rent allowances by the Central
Government for its employees are expected to result
in an increase in headline inflation in the second half
of 2017-18. There are upside risks to the inflation
outlook from (i) the lower kharif foodgrains output;
(ii) farm loan waivers by some State Governments and
possibility of Central Government stimulus; and (iii)
the implementation of higher pay and allowances by
the State Governments for their employees, which
will impact the baseline projections of growth and
inflation as they materialise.
RBI Bulletin October 201720
Monetary Policy StateMent for 2017-18 Monetary Policy Report - October 2017
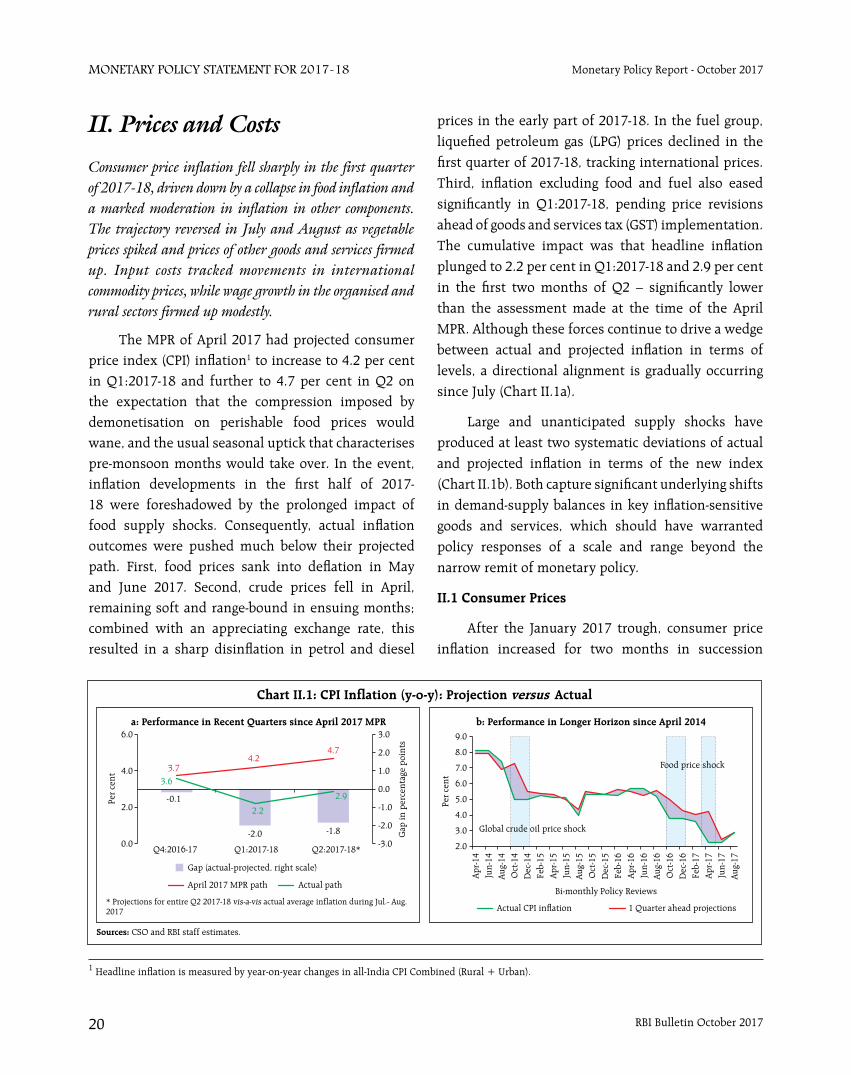
Consumer price inflation fell sharply in the first quarter of 2017-18, driven down by a collapse in food inflation and a marked moderation in inflation in other components. The trajectory reversed in July and August as vegetable prices spiked and prices of other goods and services firmed up. Input costs tracked movements in international commodity prices, while wage growth in the organised and rural sectors firmed up modestly.
The MPR of April 2017 had projected consumer price index (CPI) inflation1 to increase to 4.2 per cent in Q1:2017-18 and further to 4.7 per cent in Q2 on the expectation that the compression imposed by demonetisation on perishable food prices would wane, and the usual seasonal uptick that characterises pre-monsoon months would take over. In the event, inflation developments in the first half of 2017-18 were foreshadowed by the prolonged impact of food supply shocks. Consequently, actual inflation outcomes were pushed much below their projected path. First, food prices sank into deflation in May and June 2017. Second, crude prices fell in April, remaining soft and range-bound in ensuing months; combined with an appreciating exchange rate, this resulted in a sharp disinflation in petrol and diesel
prices in the early part of 2017-18. In the fuel group, liquefied petroleum gas (LPG) prices declined in the first quarter of 2017-18, tracking international prices. Third, inflation excluding food and fuel also eased significantly in Q1:2017-18, pending price revisions ahead of goods and services tax (GST) implementation. The cumulative impact was that headline inflation plunged to 2.2 per cent in Q1:2017-18 and 2.9 per cent in the first two months of Q2 – significantly lower than the assessment made at the time of the April MPR. Although these forces continue to drive a wedge between actual and projected inflation in terms of levels, a directional alignment is gradually occurring since July (Chart II.1a).
Large and unanticipated supply shocks have produced at least two systematic deviations of actual and projected inflation in terms of the new index (Chart II.1b). Both capture significant underlying shifts in demand-supply balances in key inflation-sensitive goods and services, which should have warranted policy responses of a scale and range beyond the narrow remit of monetary policy.
II.1 Consumer Prices
After the January 2017 trough, consumer price inflation increased for two months in succession
II. Prices and Costs
1 Headline inflation is measured by year-on-year changes in all-India CPI Combined (Rural + Urban).
RBI Bulletin October 2017 21
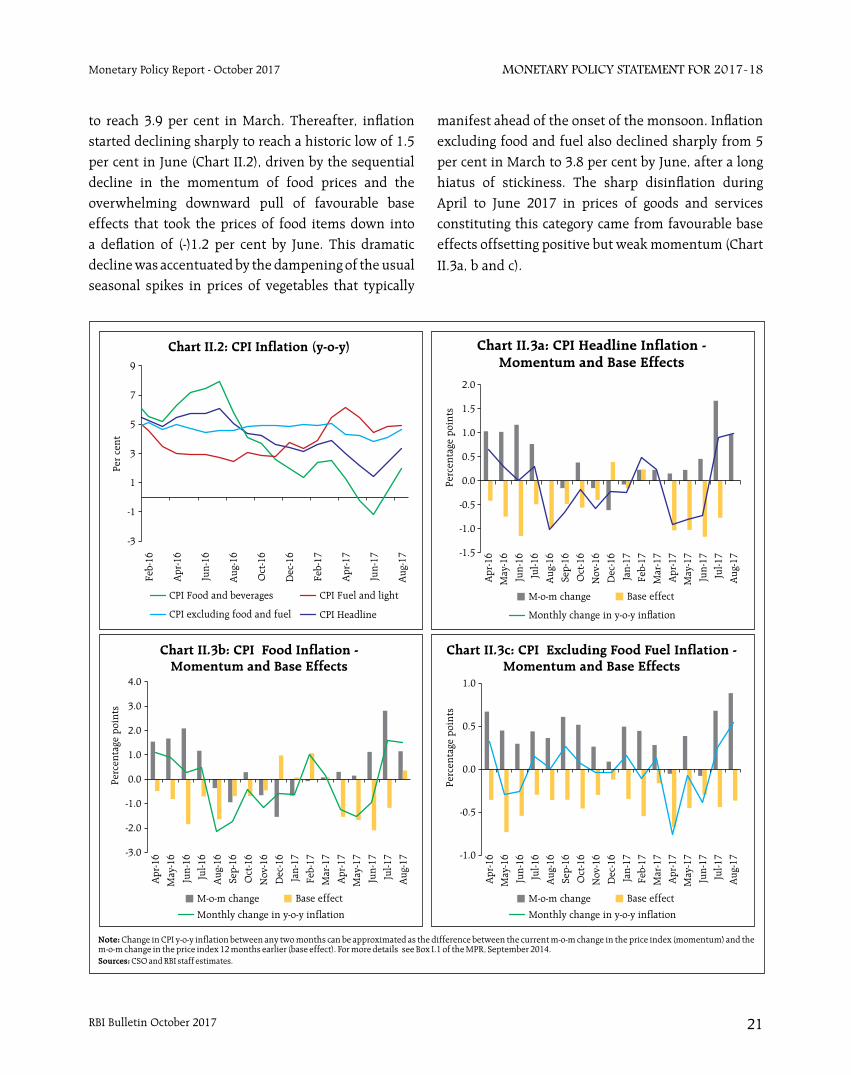
Monetary Policy StateMent for 2017-18Monetary Policy Report - October 2017
to reach 3.9 per cent in March. Thereafter, inflation started declining sharply to reach a historic low of 1.5 per cent in June (Chart II.2), driven by the sequential decline in the momentum of food prices and the overwhelming downward pull of favourable base effects that took the prices of food items down into a deflation of (-)1.2 per cent by June. This dramatic decline was accentuated by the dampening of the usual seasonal spikes in prices of vegetables that typically
manifest ahead of the onset of the monsoon. Inflation excluding food and fuel also declined sharply from 5 per cent in March to 3.8 per cent by June, after a long hiatus of stickiness. The sharp disinflation during April to June 2017 in prices of goods and services constituting this category came from favourable base effects offsetting positive but weak momentum (Chart
II.3a, b and c).
RBI Bulletin October 201722
Monetary Policy StateMent for 2017-18 Monetary Policy Report - October 2017
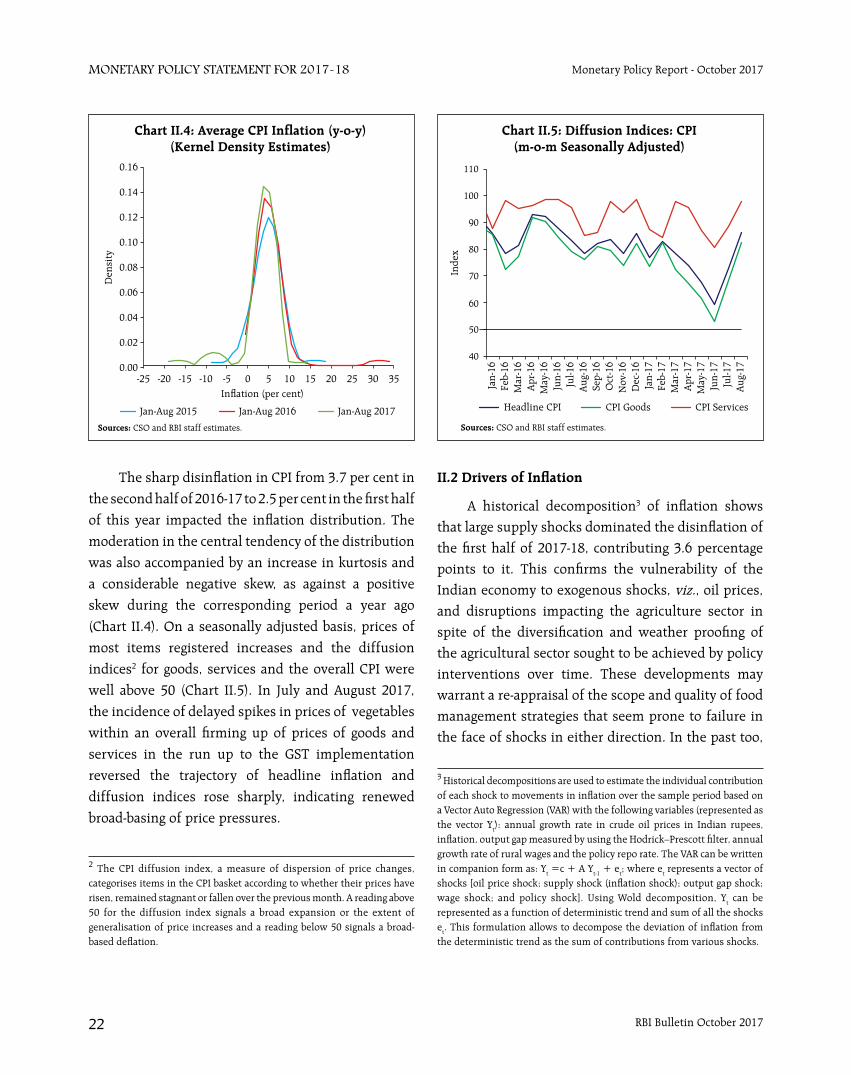
The sharp disinflation in CPI from 3.7 per cent in
the second half of 2016-17 to 2.5 per cent in the first half
of this year impacted the inflation distribution. The
moderation in the central tendency of the distribution
was also accompanied by an increase in kurtosis and
a considerable negative skew, as against a positive
skew during the corresponding period a year ago
(Chart II.4). On a seasonally adjusted basis, prices of
most items registered increases and the diffusion
indices2 for goods, services and the overall CPI were
well above 50 (Chart II.5). In July and August 2017,
the incidence of delayed spikes in prices of vegetables
within an overall firming up of prices of goods and
services in the run up to the GST implementation
reversed the trajectory of headline inflation and
diffusion indices rose sharply, indicating renewed
broad-basing of price pressures.
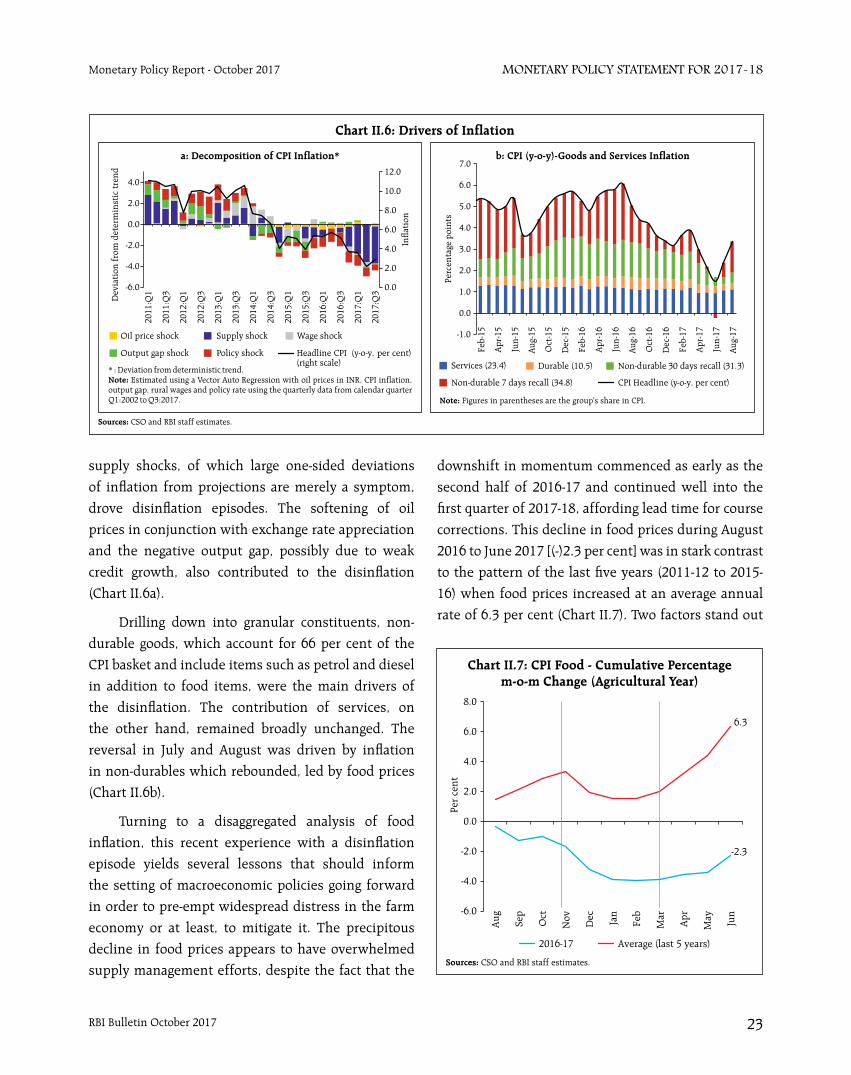
II.2 Drivers of Inflation
A historical decomposition3 of inflation shows that large supply shocks dominated the disinflation of the first half of 2017-18, contributing 3.6 percentage points to it. This confirms the vulnerability of the Indian economy to exogenous shocks, viz., oil prices, and disruptions impacting the agriculture sector in spite of the diversification and weather proofing of the agricultural sector sought to be achieved by policy interventions over time. These developments may warrant a re-appraisal of the scope and quality of food management strategies that seem prone to failure in the face of shocks in either direction. In the past too,
2 The CPI diffusion index, a measure of dispersion of price changes, categorises items in the CPI basket according to whether their prices have risen, remained stagnant or fallen over the previous month. A reading above 50 for the diffusion index signals a broad expansion or the extent of generalisation of price increases and a reading below 50 signals a broad-based deflation.
3 Historical decompositions are used to estimate the individual contribution of each shock to movements in inflation over the sample period based on a Vector Auto Regression (VAR) with the following variables (represented as the vector Yt): annual growth rate in crude oil prices in Indian rupees, inflation, output gap measured by using the Hodrick–Prescott filter, annual growth rate of rural wages and the policy repo rate. The VAR can be written in companion form as: Yt =c + A Yt-1 + et; where et represents a vector of shocks [oil price shock; supply shock (inflation shock); output gap shock; wage shock; and policy shock]. Using Wold decomposition, Yt can be represented as a function of deterministic trend and sum of all the shocks et. This formulation allows to decompose the deviation of inflation from the deterministic trend as the sum of contributions from various shocks.
RBI Bulletin October 2017 23
Monetary Policy StateMent for 2017-18Monetary Policy Report - October 2017
supply shocks, of which large one-sided deviations
of inflation from projections are merely a symptom,
drove disinflation episodes. The softening of oil
prices in conjunction with exchange rate appreciation
and the negative output gap, possibly due to weak
credit growth, also contributed to the disinflation
(Chart II.6a).
Drilling down into granular constituents, non-
durable goods, which account for 66 per cent of the
CPI basket and include items such as petrol and diesel
in addition to food items, were the main drivers of
the disinflation. The contribution of services, on
the other hand, remained broadly unchanged. The
reversal in July and August was driven by inflation
in non-durables which rebounded, led by food prices
(Chart II.6b).
Turning to a disaggregated analysis of food
inflation, this recent experience with a disinflation
episode yields several lessons that should inform
the setting of macroeconomic policies going forward
in order to pre-empt widespread distress in the farm
economy or at least, to mitigate it. The precipitous
decline in food prices appears to have overwhelmed
supply management efforts, despite the fact that the
downshift in momentum commenced as early as the
second half of 2016-17 and continued well into the
first quarter of 2017-18, affording lead time for course
corrections. This decline in food prices during August
2016 to June 2017 [(-)2.3 per cent] was in stark contrast
to the pattern of the last five years (2011-12 to 2015-
16) when food prices increased at an average annual
rate of 6.3 per cent (Chart II.7). Two factors stand out
RBI Bulletin October 201724
Monetary Policy StateMent for 2017-18 Monetary Policy Report - October 2017
in this experience as noteworthy. First, the unusually
low and delayed seasonal upticks in vegetables prices
coincided with larger than usual arrivals in mandis which did not get contemporaneously picked up by
agri-information alerts. Also highly unusual were the
spillovers to prices of vegetables other than the usual
suspects – potatoes; onions; tomatoes – indicating
the extent of dislocation caused by oversupply, since
other vegetables do not typically exhibit significant
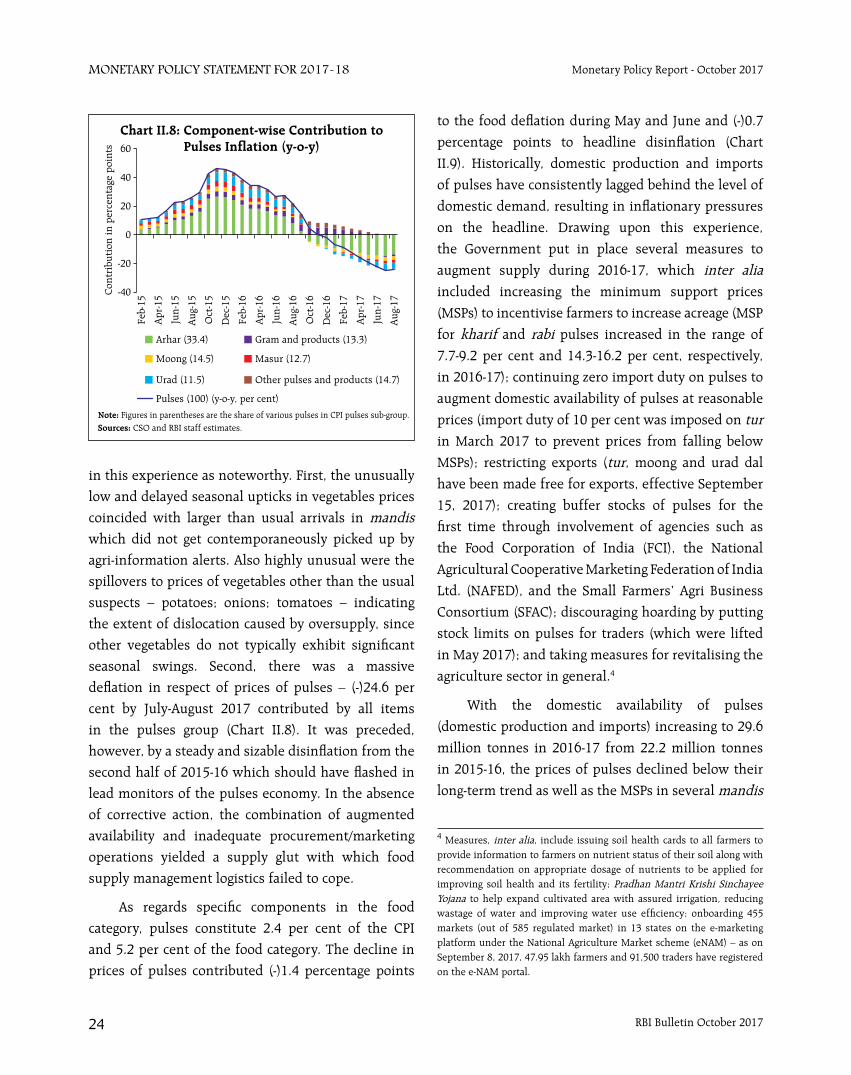
seasonal swings. Second, there was a massive
deflation in respect of prices of pulses – (-)24.6 per
cent by July-August 2017 contributed by all items
in the pulses group (Chart II.8). It was preceded,
however, by a steady and sizable disinflation from the
second half of 2015-16 which should have flashed in
lead monitors of the pulses economy. In the absence
of corrective action, the combination of augmented
availability and inadequate procurement/marketing
operations yielded a supply glut with which food
supply management logistics failed to cope.
As regards specific components in the food
category, pulses constitute 2.4 per cent of the CPI
and 5.2 per cent of the food category. The decline in
prices of pulses contributed (-)1.4 percentage points
to the food deflation during May and June and (-)0.7
percentage points to headline disinflation (Chart
II.9). Historically, domestic production and imports
of pulses have consistently lagged behind the level of
domestic demand, resulting in inflationary pressures
on the headline. Drawing upon this experience,
the Government put in place several measures to
augment supply during 2016-17, which inter alia
included increasing the minimum support prices
(MSPs) to incentivise farmers to increase acreage (MSP
for kharif and rabi pulses increased in the range of
7.7-9.2 per cent and 14.3-16.2 per cent, respectively,
in 2016-17); continuing zero import duty on pulses to
augment domestic availability of pulses at reasonable
prices (import duty of 10 per cent was imposed on tur in March 2017 to prevent prices from falling below
MSPs); restricting exports (tur, moong and urad dal
have been made free for exports, effective September
15, 2017); creating buffer stocks of pulses for the
first time through involvement of agencies such as
the Food Corporation of India (FCI), the National
Agricultural Cooperative Marketing Federation of India
Ltd. (NAFED), and the Small Farmers’ Agri Business
Consortium (SFAC); discouraging hoarding by putting
stock limits on pulses for traders (which were lifted
in May 2017); and taking measures for revitalising the
agriculture sector in general.4
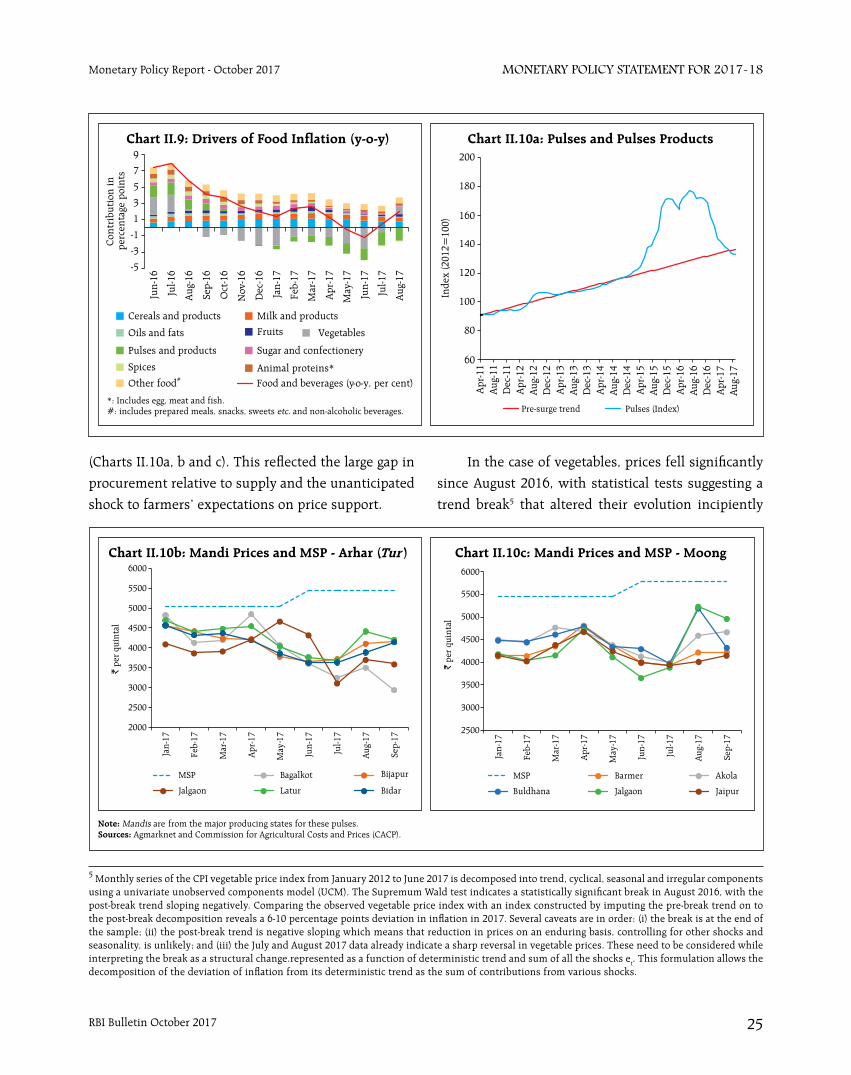
With the domestic availability of pulses
(domestic production and imports) increasing to 29.6
million tonnes in 2016-17 from 22.2 million tonnes
in 2015-16, the prices of pulses declined below their
long-term trend as well as the MSPs in several mandis
4 Measures, inter alia, include issuing soil health cards to all farmers to provide information to farmers on nutrient status of their soil along with recommendation on appropriate dosage of nutrients to be applied for improving soil health and its fertility; Pradhan Mantri Krishi Sinchayee Yojana to help expand cultivated area with assured irrigation, reducing wastage of water and improving water use efficiency; onboarding 455 markets (out of 585 regulated market) in 13 states on the e-marketing platform under the National Agriculture Market scheme (eNAM) – as on September 8, 2017, 47.95 lakh farmers and 91,500 traders have registered on the e-NAM portal.
RBI Bulletin October 2017 25
Monetary Policy StateMent for 2017-18Monetary Policy Report - October 2017
(Charts II.10a, b and c). This reflected the large gap in
procurement relative to supply and the unanticipated
shock to farmers’ expectations on price support.
In the case of vegetables, prices fell significantly
since August 2016, with statistical tests suggesting a
trend break5 that altered their evolution incipiently
5 Monthly series of the CPI vegetable price index from January 2012 to June 2017 is decomposed into trend, cyclical, seasonal and irregular components using a univariate unobserved components model (UCM). The Supremum Wald test indicates a statistically significant break in August 2016, with the post-break trend sloping negatively. Comparing the observed vegetable price index with an index constructed by imputing the pre-break trend on to the post-break decomposition reveals a 6-10 percentage points deviation in inflation in 2017. Several caveats are in order: (i) the break is at the end of the sample; (ii) the post-break trend is negative sloping which means that reduction in prices on an enduring basis, controlling for other shocks and seasonality, is unlikely; and (iii) the July and August 2017 data already indicate a sharp reversal in vegetable prices. These need to be considered while interpreting the break as a structural change.represented as a function of deterministic trend and sum of all the shocks et. This formulation allows the decomposition of the deviation of inflation from its deterministic trend as the sum of contributions from various shocks.
RBI Bulletin October 201726
Monetary Policy StateMent for 2017-18 Monetary Policy Report - October 2017
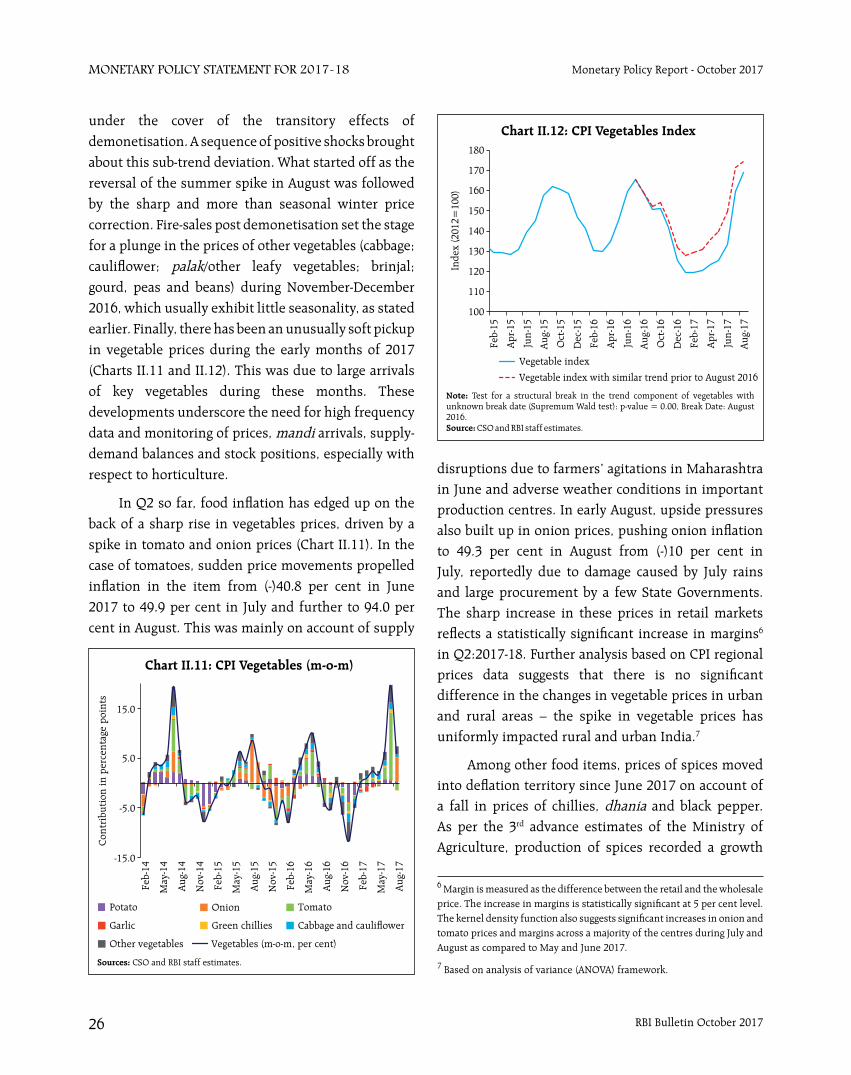
under the cover of the transitory effects of demonetisation. A sequence of positive shocks brought about this sub-trend deviation. What started off as the reversal of the summer spike in August was followed by the sharp and more than seasonal winter price correction. Fire-sales post demonetisation set the stage for a plunge in the prices of other vegetables (cabbage; cauliflower; palak/other leafy vegetables; brinjal; gourd, peas and beans) during November-December 2016, which usually exhibit little seasonality, as stated earlier. Finally, there has been an unusually soft pickup in vegetable prices during the early months of 2017 (Charts II.11 and II.12). This was due to large arrivals of key vegetables during these months. These developments underscore the need for high frequency data and monitoring of prices, mandi arrivals, supply-demand balances and stock positions, especially with respect to horticulture.
In Q2 so far, food inflation has edged up on the back of a sharp rise in vegetables prices, driven by a spike in tomato and onion prices (Chart II.11). In the case of tomatoes, sudden price movements propelled inflation in the item from (-)40.8 per cent in June 2017 to 49.9 per cent in July and further to 94.0 per cent in August. This was mainly on account of supply
6 Margin is measured as the difference between the retail and the wholesale price. The increase in margins is statistically significant at 5 per cent level. The kernel density function also suggests significant increases in onion and tomato prices and margins across a majority of the centres during July and August as compared to May and June 2017.
7 Based on analysis of variance (ANOVA) framework.
disruptions due to farmers’ agitations in Maharashtra in June and adverse weather conditions in important production centres. In early August, upside pressures also built up in onion prices, pushing onion inflation to 49.3 per cent in August from (-)10 per cent in July, reportedly due to damage caused by July rains and large procurement by a few State Governments. The sharp increase in these prices in retail markets reflects a statistically significant increase in margins6 in Q2:2017-18. Further analysis based on CPI regional prices data suggests that there is no significant difference in the changes in vegetable prices in urban and rural areas – the spike in vegetable prices has uniformly impacted rural and urban India.7
Among other food items, prices of spices moved into deflation territory since June 2017 on account of a fall in prices of chillies, dhania and black pepper. As per the 3rd advance estimates of the Ministry of Agriculture, production of spices recorded a growth
RBI Bulletin October 2017 27
Monetary Policy StateMent for 2017-18Monetary Policy Report - October 2017
of 17.4 per cent in 2016-17, up from 14.4 per cent a
year ago. Sugar inflation, which was in double digits
during 2016-17 (averaging 20 per cent), also eased in
2017-18 so far (up to August), largely due to measures
facilitating imports and on expectations of higher
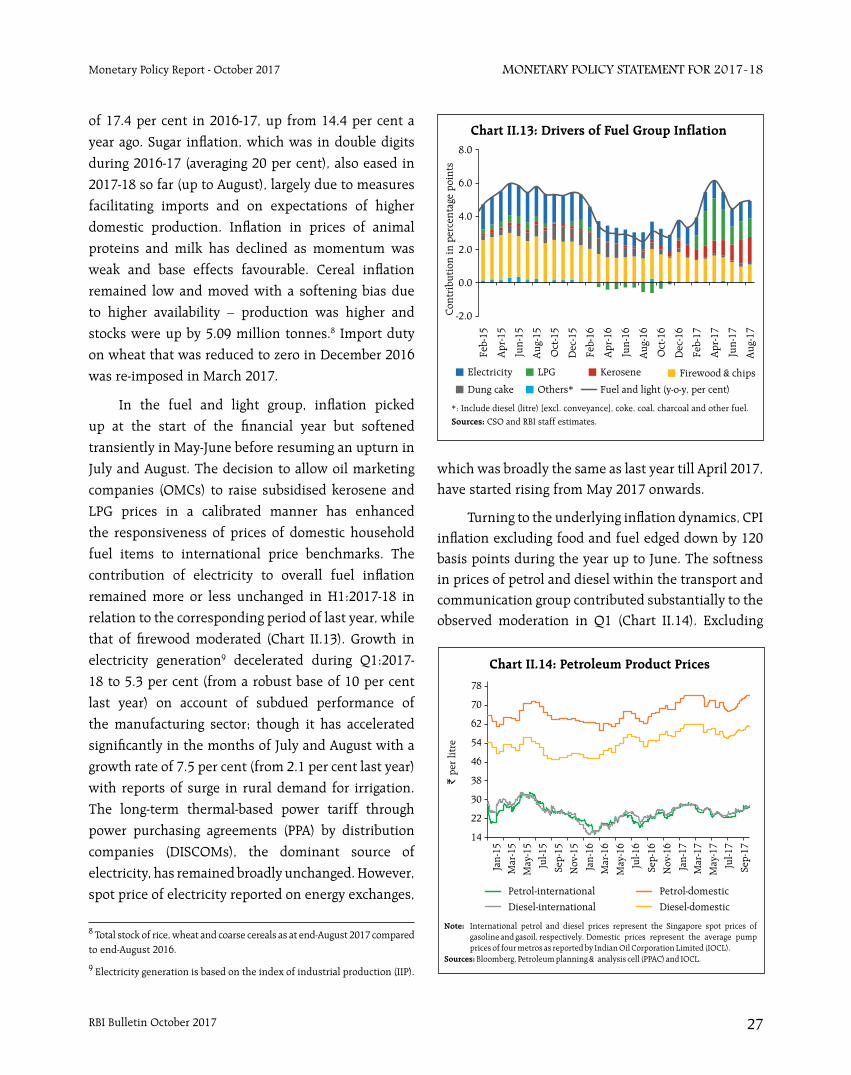
domestic production. Inflation in prices of animal
proteins and milk has declined as momentum was
weak and base effects favourable. Cereal inflation
remained low and moved with a softening bias due
to higher availability – production was higher and
stocks were up by 5.09 million tonnes.8 Import duty
on wheat that was reduced to zero in December 2016
was re-imposed in March 2017.
In the fuel and light group, inflation picked
up at the start of the financial year but softened
transiently in May-June before resuming an upturn in
July and August. The decision to allow oil marketing
companies (OMCs) to raise subsidised kerosene and
LPG prices in a calibrated manner has enhanced
the responsiveness of prices of domestic household
fuel items to international price benchmarks. The
contribution of electricity to overall fuel inflation
remained more or less unchanged in H1:2017-18 in
relation to the corresponding period of last year, while
that of firewood moderated (Chart II.13). Growth in
electricity generation9 decelerated during Q1:2017-
18 to 5.3 per cent (from a robust base of 10 per cent
last year) on account of subdued performance of
the manufacturing sector; though it has accelerated
significantly in the months of July and August with a
growth rate of 7.5 per cent (from 2.1 per cent last year)
with reports of surge in rural demand for irrigation.
The long-term thermal-based power tariff through
power purchasing agreements (PPA) by distribution
companies (DISCOMs), the dominant source of
electricity, has remained broadly unchanged. However,
spot price of electricity reported on energy exchanges,
which was broadly the same as last year till April 2017, have started rising from May 2017 onwards.
Turning to the underlying inflation dynamics, CPI inflation excluding food and fuel edged down by 120 basis points during the year up to June. The softness in prices of petrol and diesel within the transport and communication group contributed substantially to the observed moderation in Q1 (Chart II.14). Excluding
8 Total stock of rice, wheat and coarse cereals as at end-August 2017 compared to end-August 2016.
9 Electricity generation is based on the index of industrial production (IIP).
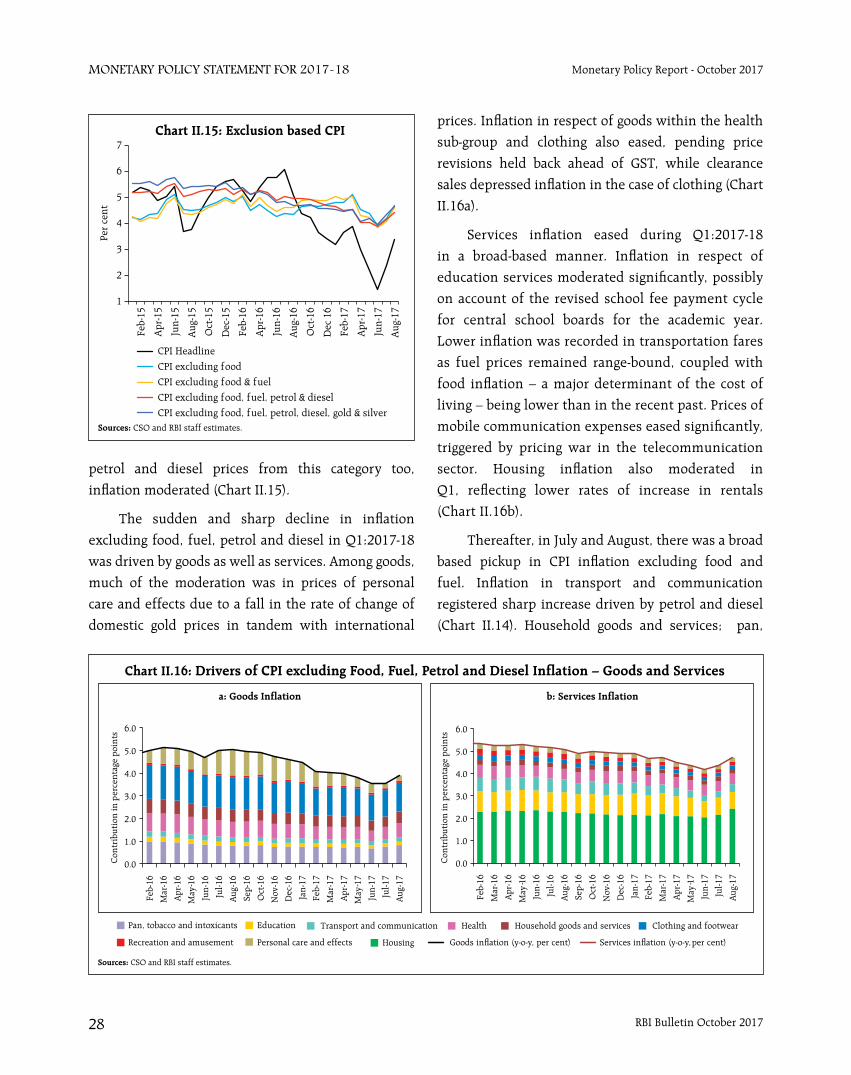
RBI Bulletin October 201728
Monetary Policy StateMent for 2017-18 Monetary Policy Report - October 2017
petrol and diesel prices from this category too,
inflation moderated (Chart II.15).
The sudden and sharp decline in inflation
excluding food, fuel, petrol and diesel in Q1:2017-18
was driven by goods as well as services. Among goods,
much of the moderation was in prices of personal
care and effects due to a fall in the rate of change of
domestic gold prices in tandem with international
prices. Inflation in respect of goods within the health
sub-group and clothing also eased, pending price
revisions held back ahead of GST, while clearance
sales depressed inflation in the case of clothing (Chart
II.16a).
Services inflation eased during Q1:2017-18
in a broad-based manner. Inflation in respect of
education services moderated significantly, possibly
on account of the revised school fee payment cycle
for central school boards for the academic year.
Lower inflation was recorded in transportation fares
as fuel prices remained range-bound, coupled with
food inflation – a major determinant of the cost of
living – being lower than in the recent past. Prices of
mobile communication expenses eased significantly,
triggered by pricing war in the telecommunication
sector. Housing inflation also moderated in
Q1, reflecting lower rates of increase in rentals
(Chart II.16b).
Thereafter, in July and August, there was a broad
based pickup in CPI inflation excluding food and
fuel. Inflation in transport and communication
registered sharp increase driven by petrol and diesel
(Chart II.14). Household goods and services; pan,
RBI Bulletin October 2017 29
Monetary Policy StateMent for 2017-18Monetary Policy Report - October 2017
tobacco and intoxicants; health; recreation; and
clothing and footwear sub-groups also rose. This
partly reflected the hike in the service tax rate under
GST and the impact of GST on certain goods, especially
packaged/processed food; clothing and footwear; and
recreation and amusement services. Housing inflation
reversed with the implementation of house rent
allowance (HRA) increases by the Centre from July.
As a result, all other exclusion based measures also
registered a pickup in Q2 so far (Chart II.15). The GST
was rolled out in July 2017. The assessment at the
current juncture is that price changes are not likely
to have any material impact on headline inflation.
However, in case the price increases show downward
rigidity due to uncertainty in GST implementation,
inflationary impact may emerge (Box II.1).
The goods and services tax (GST) has been implemented from July 1, 2017 with the GST Council broadly approving a five-tier rate structure, viz., 0 per cent for commodities such as fruits, vegetables, milk, handloom, select agricultural implements and newspapers; 5 per cent for coal, sugar, tea, coffee, edible oil, economy air fares among others; 12 per cent for select processed foods among others; 18 per cent for non-durables and most of the services; and 28 per cent for most consumer durable goods and recreation services. Non-processed food items, education, health care, real estate, electricity and fuel items like petrol and diesel are exempted from the GST. A rate of 3 per cent has also been specified for gold. The major indirect taxes that were subsumed under the GST include the excise duty, the service tax, Central sales tax and State value added tax (VAT).
In order to arrive at the direct impact of the GST structure on the CPI, a comparison of the existing excise and State VAT/sales tax rates on CPI items vis-à-vis the GST rate structure is in order. Almost half of the CPI basket comprises food items that attracted zero excise and sales tax and they continue to be taxed at the zero rate under the new GST rate structure. Furthermore, petrol and diesel are outside the purview of the GST on which the existing taxation system (VAT and central excise duty) will continue. Hence, the impact of GST on CPI stems mainly from the tax rate differentials in respect of the remaining elements of the CPI basket.
Box II.1: Impact of GST on CPI Inflation
From an item level mapping of the earlier tax rates and the new GST rate structure, it is observed that among the major sub-groups, much of the increase in prices post-GST is estimated to occur in prepared meals, clothing and footwear and other sub-groups dominated by services such as recreation and amusement. The increase in prices of these items is to a large extent likely to be offset by declines in post-GST goods prices – particularly those in the household goods and services sub-group and personal care and effects as well as in select food sub-groups such as spices and pulses.
Overall, taking into account the weighted contribution of the changes in the major sub-groups, CPI prices could increase by around 10 basis points on account of the new GST rate structure (Chart 1). As such, it is not expected to have any significant impact on CPI inflation. Estimates by other agencies also point to a muted impact of the new GST rate structure on CPI inflation10.
However, as noted in the October 2016 MPR (Box II.I: Inflation Impact of GST – Cross Country Evidence), the cross-country experience shows a one-off increase in prices in the first year following the introduction of GST. This is likely on account of firms choosing to increase prices initially in response to the uncertainties surrounding the implementation of a new tax system and its impact on business processes. Similar behaviour
(contd.)
10 The Economic Survey 2016-17 expects that the impact of GST will be deflationary in nature. While some analysts see CPI inflation recording a marginal uptick on the back of pickup in prices of food and tobacco, and services, few analysts expect that the impact of GST on inflation will depend on a variety of factors such as the efficiency with which the input tax credit mechanism works and producers pass on tax cuts into final prices.
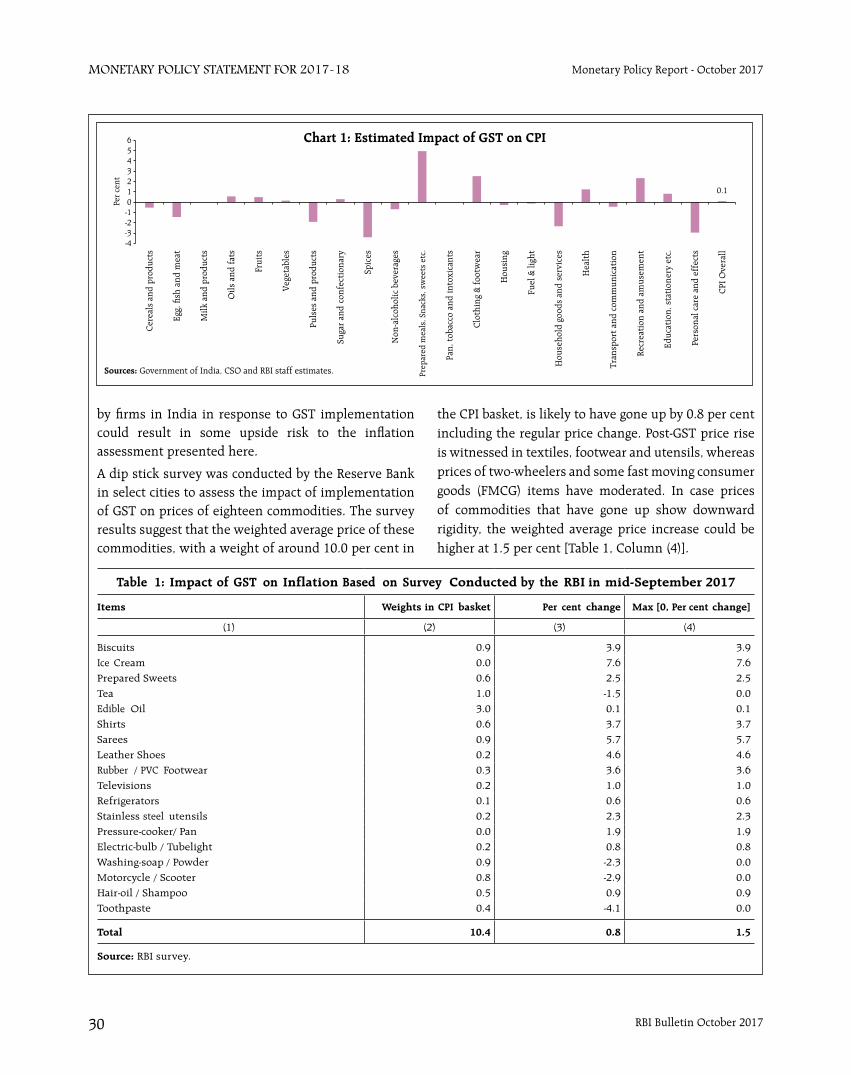
RBI Bulletin October 201730
Monetary Policy StateMent for 2017-18 Monetary Policy Report - October 2017
by firms in India in response to GST implementation could result in some upside risk to the inflation assessment presented here.
A dip stick survey was conducted by the Reserve Bank in select cities to assess the impact of implementation of GST on prices of eighteen commodities. The survey results suggest that the weighted average price of these commodities, with a weight of around 10.0 per cent in
Table 1: Impact of GST on Inflation Based on Survey Conducted by the RBI in mid-September 2017
Items Weights in CPI basket Per cent change Max [0, Per cent change]
(1) (2) (3) (4)
Biscuits 0.9 3.9 3.9
Ice Cream 0.0 7.6 7.6
Prepared Sweets 0.6 2.5 2.5
Tea 1.0 -1.5 0.0
Edible Oil 3.0 0.1 0.1
Shirts 0.6 3.7 3.7
Sarees 0.9 5.7 5.7
Leather Shoes 0.2 4.6 4.6
Rubber / PVC Footwear 0.3 3.6 3.6
Televisions 0.2 1.0 1.0
Refrigerators 0.1 0.6 0.6
Stainless steel utensils 0.2 2.3 2.3
Pressure-cooker/ Pan 0.0 1.9 1.9
Electric-bulb / Tubelight 0.2 0.8 0.8
Washing-soap / Powder 0.9 -2.3 0.0
Motorcycle / Scooter 0.8 -2.9 0.0
Hair-oil / Shampoo 0.5 0.9 0.9
Toothpaste 0.4 -4.1 0.0
Total 10.4 0.8 1.5
Source: RBI survey.
the CPI basket, is likely to have gone up by 0.8 per cent including the regular price change. Post-GST price rise is witnessed in textiles, footwear and utensils, whereas prices of two-wheelers and some fast moving consumer goods (FMCG) items have moderated. In case prices of commodities that have gone up show downward rigidity, the weighted average price increase could be higher at 1.5 per cent [Table 1, Column (4)].
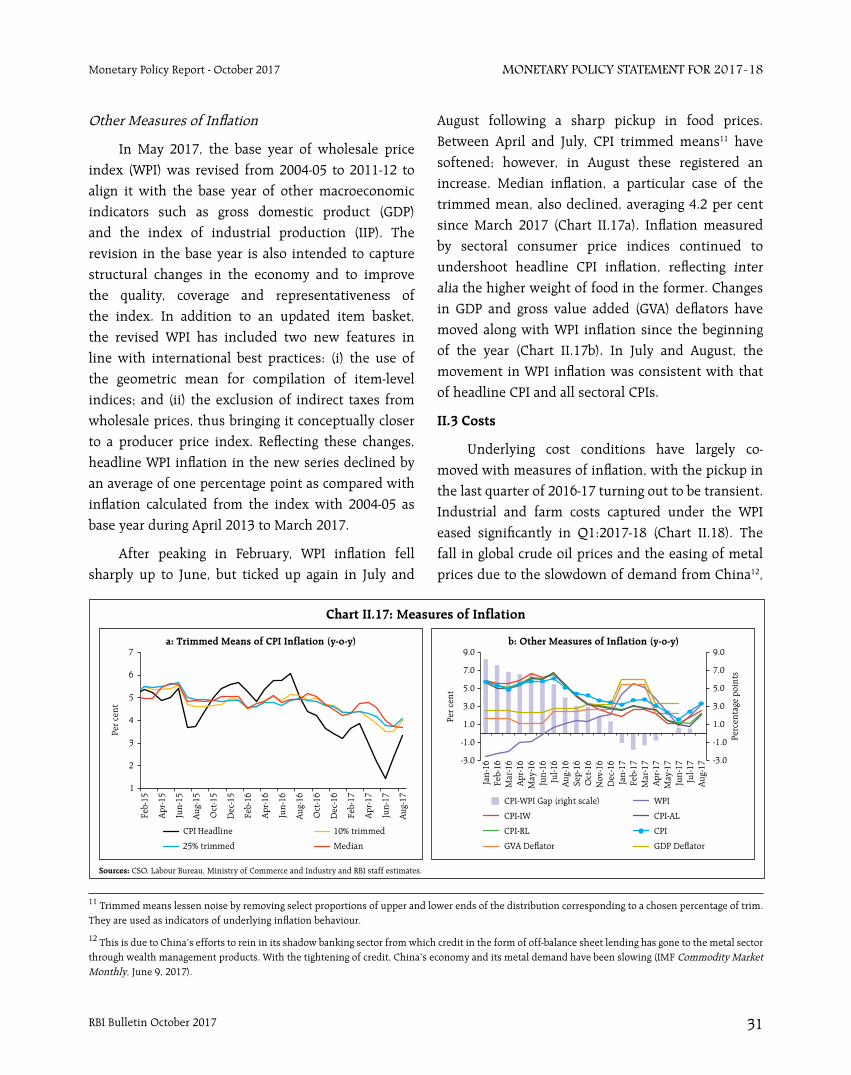
RBI Bulletin October 2017 31
Monetary Policy StateMent for 2017-18Monetary Policy Report - October 2017
Other Measures of Inflation
In May 2017, the base year of wholesale price index (WPI) was revised from 2004-05 to 2011-12 to align it with the base year of other macroeconomic indicators such as gross domestic product (GDP) and the index of industrial production (IIP). The revision in the base year is also intended to capture structural changes in the economy and to improve the quality, coverage and representativeness of the index. In addition to an updated item basket, the revised WPI has included two new features in line with international best practices: (i) the use of the geometric mean for compilation of item-level indices; and (ii) the exclusion of indirect taxes from wholesale prices, thus bringing it conceptually closer to a producer price index. Reflecting these changes, headline WPI inflation in the new series declined by an average of one percentage point as compared with inflation calculated from the index with 2004-05 as base year during April 2013 to March 2017.
After peaking in February, WPI inflation fell sharply up to June, but ticked up again in July and
August following a sharp pickup in food prices. Between April and July, CPI trimmed means11 have softened; however, in August these registered an increase. Median inflation, a particular case of the trimmed mean, also declined, averaging 4.2 per cent since March 2017 (Chart II.17a). Inflation measured by sectoral consumer price indices continued to undershoot headline CPI inflation, reflecting inter alia the higher weight of food in the former. Changes in GDP and gross value added (GVA) deflators have moved along with WPI inflation since the beginning of the year (Chart II.17b). In July and August, the movement in WPI inflation was consistent with that of headline CPI and all sectoral CPIs.
II.3 Costs
Underlying cost conditions have largely co-moved with measures of inflation, with the pickup in the last quarter of 2016-17 turning out to be transient. Industrial and farm costs captured under the WPI eased significantly in Q1:2017-18 (Chart II.18). The fall in global crude oil prices and the easing of metal prices due to the slowdown of demand from China12,
11 Trimmed means lessen noise by removing select proportions of upper and lower ends of the distribution corresponding to a chosen percentage of trim. They are used as indicators of underlying inflation behaviour.
12 This is due to China’s efforts to rein in its shadow banking sector from which credit in the form of off-balance sheet lending has gone to the metal sector through wealth management products. With the tightening of credit, China’s economy and its metal demand have been slowing (IMF Commodity Market Monthly, June 9, 2017).
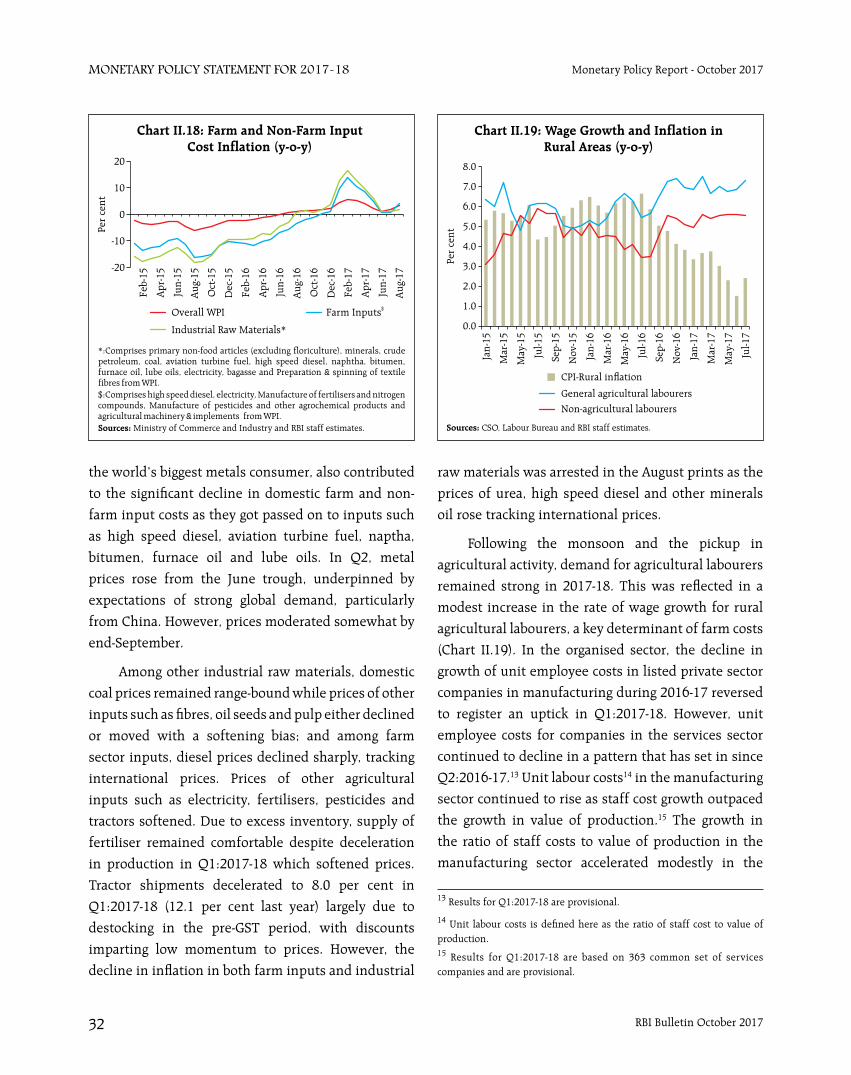
RBI Bulletin October 201732
Monetary Policy StateMent for 2017-18 Monetary Policy Report - October 2017
the world’s biggest metals consumer, also contributed
to the significant decline in domestic farm and non-
farm input costs as they got passed on to inputs such
as high speed diesel, aviation turbine fuel, naptha,
bitumen, furnace oil and lube oils. In Q2, metal
prices rose from the June trough, underpinned by
expectations of strong global demand, particularly
from China. However, prices moderated somewhat by
end-September.
Among other industrial raw materials, domestic
coal prices remained range-bound while prices of other
inputs such as fibres, oil seeds and pulp either declined
or moved with a softening bias; and among farm
sector inputs, diesel prices declined sharply, tracking
international prices. Prices of other agricultural
inputs such as electricity, fertilisers, pesticides and
tractors softened. Due to excess inventory, supply of
fertiliser remained comfortable despite deceleration
in production in Q1:2017-18 which softened prices.
Tractor shipments decelerated to 8.0 per cent in
Q1:2017-18 (12.1 per cent last year) largely due to
destocking in the pre-GST period, with discounts
imparting low momentum to prices. However, the
decline in inflation in both farm inputs and industrial
13 Results for Q1:2017-18 are provisional.
14 Unit labour costs is defined here as the ratio of staff cost to value of production.15 Results for Q1:2017-18 are based on 363 common set of services companies and are provisional.
raw materials was arrested in the August prints as the
prices of urea, high speed diesel and other minerals
oil rose tracking international prices.
Following the monsoon and the pickup in
agricultural activity, demand for agricultural labourers
remained strong in 2017-18. This was reflected in a
modest increase in the rate of wage growth for rural
agricultural labourers, a key determinant of farm costs
(Chart II.19). In the organised sector, the decline in
growth of unit employee costs in listed private sector
companies in manufacturing during 2016-17 reversed
to register an uptick in Q1:2017-18. However, unit
employee costs for companies in the services sector
continued to decline in a pattern that has set in since
Q2:2016-17.13 Unit labour costs14 in the manufacturing
sector continued to rise as staff cost growth outpaced
the growth in value of production.15 The growth in
the ratio of staff costs to value of production in the
manufacturing sector accelerated modestly in the
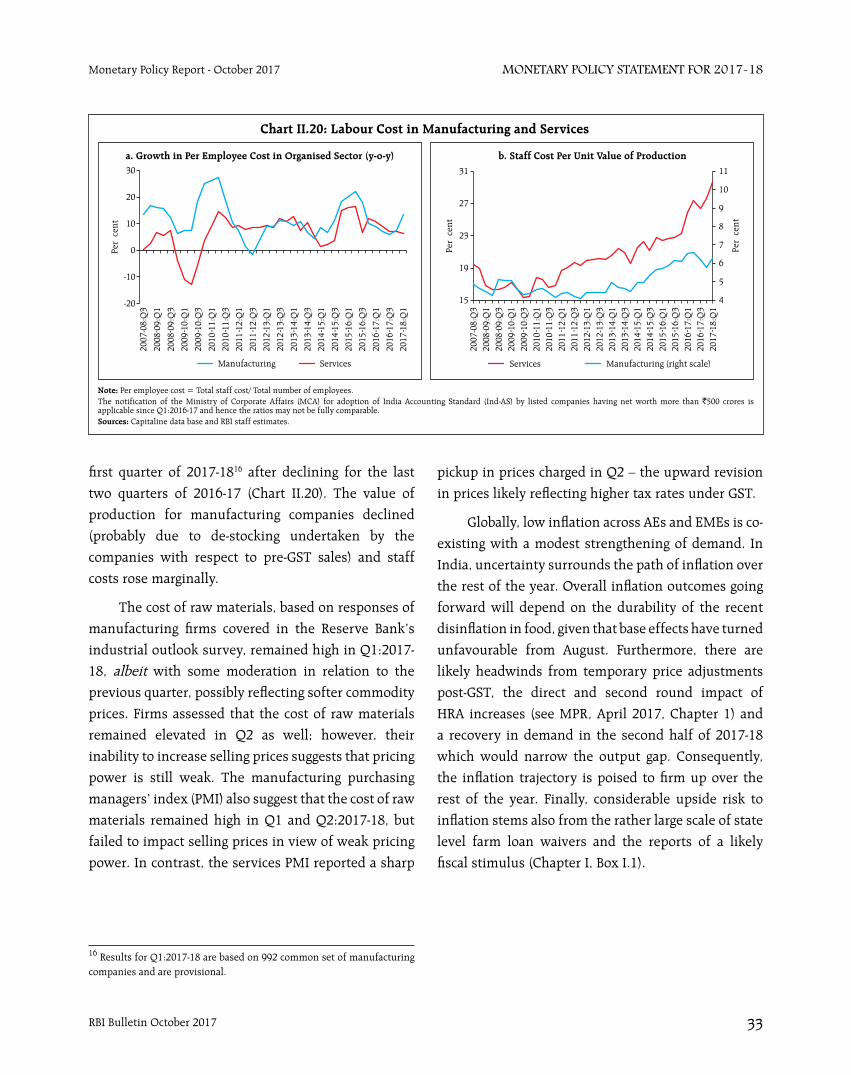
RBI Bulletin October 2017 33
Monetary Policy StateMent for 2017-18Monetary Policy Report - October 2017
16 Results for Q1:2017-18 are based on 992 common set of manufacturing companies and are provisional.
first quarter of 2017-1816 after declining for the last
two quarters of 2016-17 (Chart II.20). The value of
production for manufacturing companies declined
(probably due to de-stocking undertaken by the
companies with respect to pre-GST sales) and staff
costs rose marginally.
The cost of raw materials, based on responses of
manufacturing firms covered in the Reserve Bank’s
industrial outlook survey, remained high in Q1:2017-
18, albeit with some moderation in relation to the
previous quarter, possibly reflecting softer commodity
prices. Firms assessed that the cost of raw materials
remained elevated in Q2 as well; however, their
inability to increase selling prices suggests that pricing
power is still weak. The manufacturing purchasing
managers’ index (PMI) also suggest that the cost of raw
materials remained high in Q1 and Q2:2017-18, but
failed to impact selling prices in view of weak pricing
power. In contrast, the services PMI reported a sharp
pickup in prices charged in Q2 – the upward revision
in prices likely reflecting higher tax rates under GST.
Globally, low inflation across AEs and EMEs is co-
existing with a modest strengthening of demand. In
India, uncertainty surrounds the path of inflation over
the rest of the year. Overall inflation outcomes going
forward will depend on the durability of the recent
disinflation in food, given that base effects have turned
unfavourable from August. Furthermore, there are
likely headwinds from temporary price adjustments
post-GST, the direct and second round impact of
HRA increases (see MPR, April 2017, Chapter 1) and
a recovery in demand in the second half of 2017-18
which would narrow the output gap. Consequently,
the inflation trajectory is poised to firm up over the
rest of the year. Finally, considerable upside risk to
inflation stems also from the rather large scale of state
level farm loan waivers and the reports of a likely
fiscal stimulus (Chapter I, Box I.1).
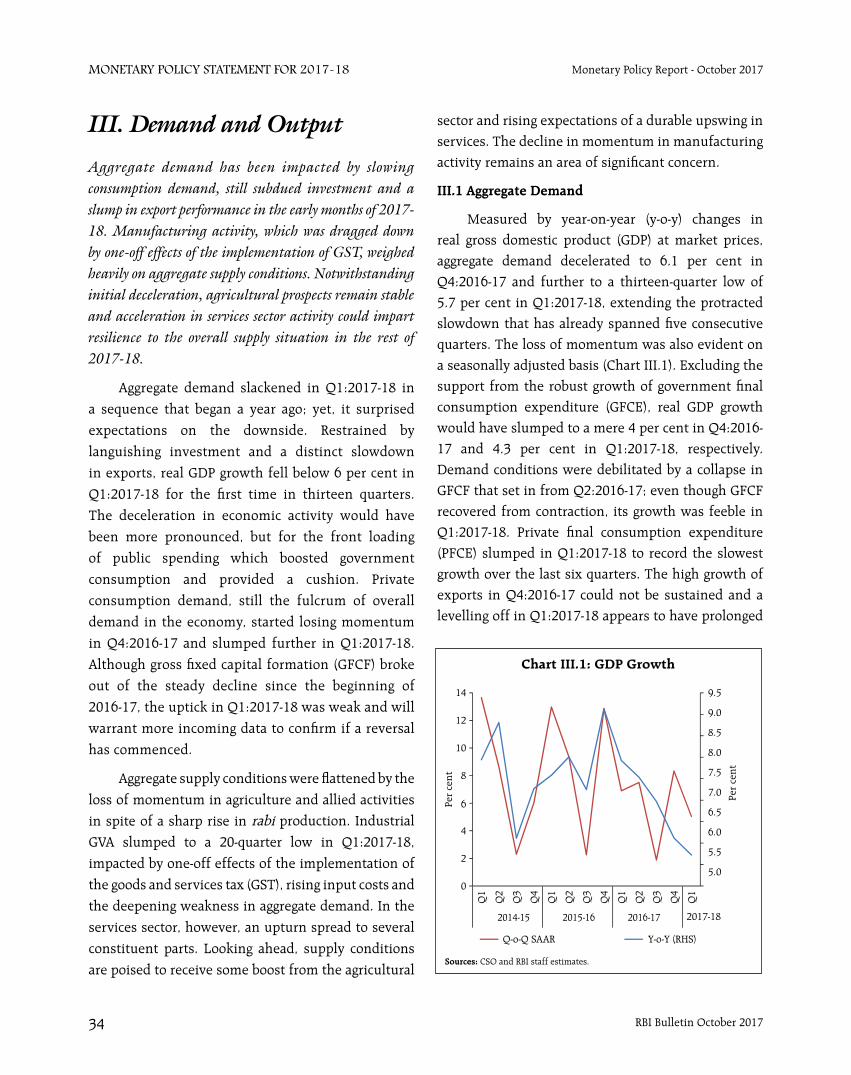
RBI Bulletin October 201734
Monetary Policy StateMent for 2017-18 Monetary Policy Report - October 2017
Aggregate demand has been impacted by slowing consumption demand, still subdued investment and a slump in export performance in the early months of 2017-18. Manufacturing activity, which was dragged down by one-off effects of the implementation of GST, weighed heavily on aggregate supply conditions. Notwithstanding initial deceleration, agricultural prospects remain stable and acceleration in services sector activity could impart resilience to the overall supply situation in the rest of 2017-18.
Aggregate demand slackened in Q1:2017-18 in
a sequence that began a year ago; yet, it surprised
expectations on the downside. Restrained by
languishing investment and a distinct slowdown
in exports, real GDP growth fell below 6 per cent in
Q1:2017-18 for the first time in thirteen quarters.
The deceleration in economic activity would have
been more pronounced, but for the front loading
of public spending which boosted government
consumption and provided a cushion. Private
consumption demand, still the fulcrum of overall
demand in the economy, started losing momentum
in Q4:2016-17 and slumped further in Q1:2017-18.
Although gross fixed capital formation (GFCF) broke
out of the steady decline since the beginning of
2016-17, the uptick in Q1:2017-18 was weak and will
warrant more incoming data to confirm if a reversal
has commenced.
Aggregate supply conditions were flattened by the
loss of momentum in agriculture and allied activities
in spite of a sharp rise in rabi production. Industrial
GVA slumped to a 20-quarter low in Q1:2017-18,
impacted by one-off effects of the implementation of
the goods and services tax (GST), rising input costs and
the deepening weakness in aggregate demand. In the
services sector, however, an upturn spread to several
constituent parts. Looking ahead, supply conditions
are poised to receive some boost from the agricultural
sector and rising expectations of a durable upswing in services. The decline in momentum in manufacturing activity remains an area of significant concern.
III.1 Aggregate Demand
Measured by year-on-year (y-o-y) changes in real gross domestic product (GDP) at market prices, aggregate demand decelerated to 6.1 per cent in Q4:2016-17 and further to a thirteen-quarter low of 5.7 per cent in Q1:2017-18, extending the protracted slowdown that has already spanned five consecutive quarters. The loss of momentum was also evident on a seasonally adjusted basis (Chart III.1). Excluding the support from the robust growth of government final consumption expenditure (GFCE), real GDP growth would have slumped to a mere 4 per cent in Q4:2016-17 and 4.3 per cent in Q1:2017-18, respectively. Demand conditions were debilitated by a collapse in GFCF that set in from Q2:2016-17; even though GFCF recovered from contraction, its growth was feeble in Q1:2017-18. Private final consumption expenditure (PFCE) slumped in Q1:2017-18 to record the slowest growth over the last six quarters. The high growth of exports in Q4:2016-17 could not be sustained and a levelling off in Q1:2017-18 appears to have prolonged
III. Demand and Output
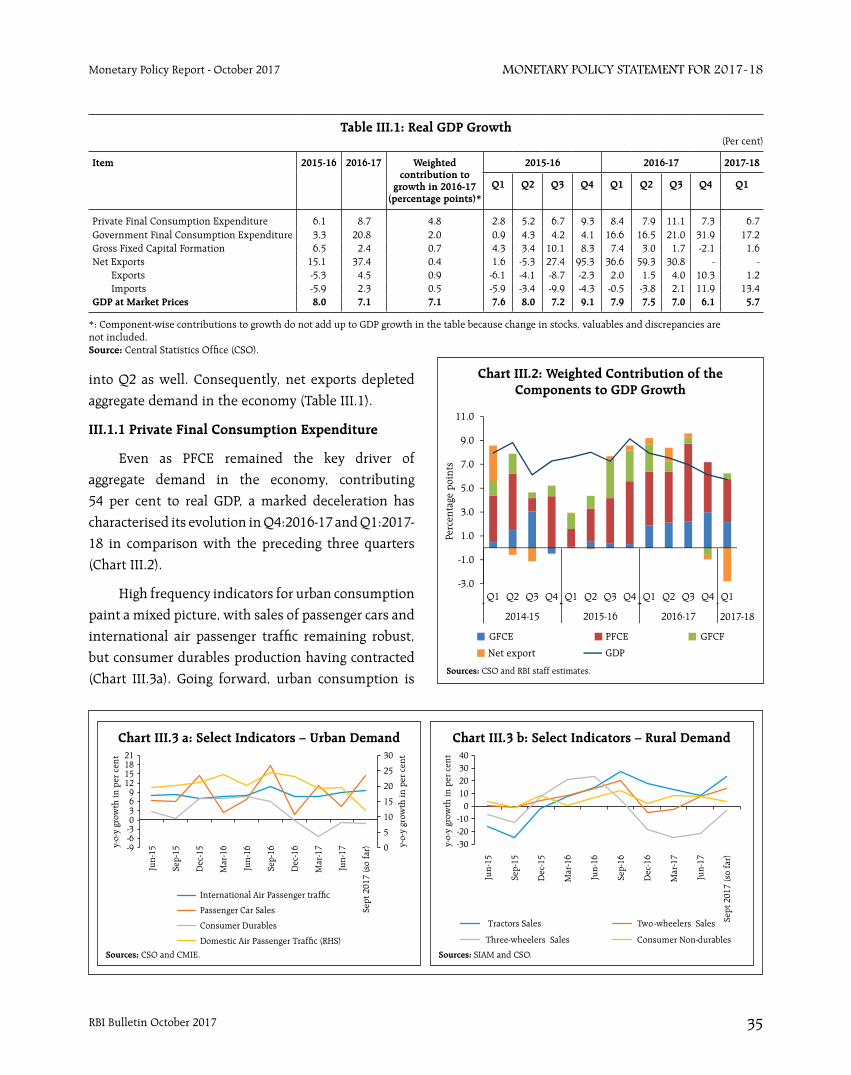
RBI Bulletin October 2017 35
Monetary Policy StateMent for 2017-18Monetary Policy Report - October 2017
into Q2 as well. Consequently, net exports depleted
aggregate demand in the economy (Table III.1).
III.1.1 Private Final Consumption Expenditure
Even as PFCE remained the key driver of
aggregate demand in the economy, contributing
54 per cent to real GDP, a marked deceleration has
characterised its evolution in Q4:2016-17 and Q1:2017-
18 in comparison with the preceding three quarters
(Chart III.2).
High frequency indicators for urban consumption
paint a mixed picture, with sales of passenger cars and
international air passenger traffic remaining robust,
but consumer durables production having contracted
(Chart III.3a). Going forward, urban consumption is
Table III.1: Real GDP Growth(Per cent)
Item 2015-16 2016-17 Weighted contribution to
growth in 2016-17 (percentage points)*
2015-16 2016-17 2017-18
Q1 Q2 Q3 Q4 Q1 Q2 Q3 Q4 Q1
Private Final Consumption Expenditure 6.1 8.7 4.8 2.8 5.2 6.7 9.3 8.4 7.9 11.1 7.3 6.7Government Final Consumption Expenditure 3.3 20.8 2.0 0.9 4.3 4.2 4.1 16.6 16.5 21.0 31.9 17.2Gross Fixed Capital Formation 6.5 2.4 0.7 4.3 3.4 10.1 8.3 7.4 3.0 1.7 -2.1 1.6Net Exports 15.1 37.4 0.4 1.6 -5.3 27.4 95.3 36.6 59.3 30.8 - -
Exports -5.3 4.5 0.9 -6.1 -4.1 -8.7 -2.3 2.0 1.5 4.0 10.3 1.2Imports -5.9 2.3 0.5 -5.9 -3.4 -9.9 -4.3 -0.5 -3.8 2.1 11.9 13.4
GDP at Market Prices 8.0 7.1 7.1 7.6 8.0 7.2 9.1 7.9 7.5 7.0 6.1 5.7
*: Component-wise contributions to growth do not add up to GDP growth in the table because change in stocks, valuables and discrepancies are not included.Source: Central Statistics Office (CSO).
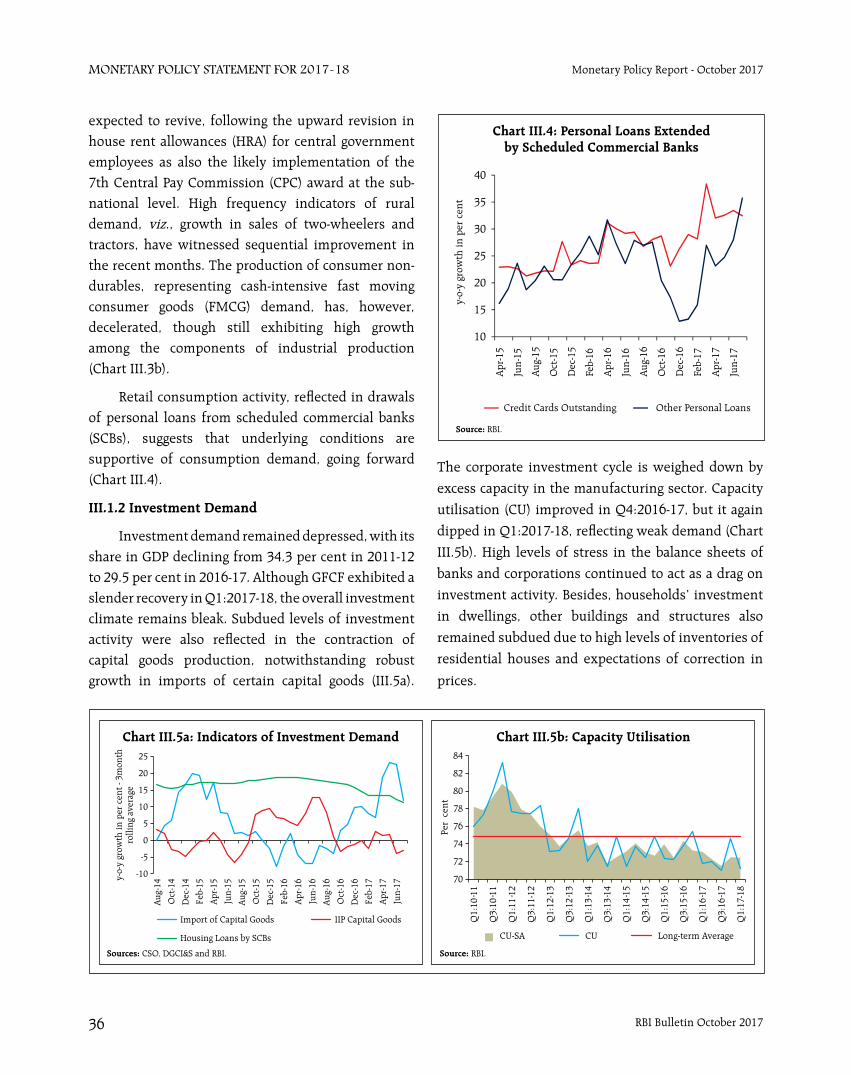
RBI Bulletin October 201736
Monetary Policy StateMent for 2017-18 Monetary Policy Report - October 2017
expected to revive, following the upward revision in house rent allowances (HRA) for central government employees as also the likely implementation of the 7th Central Pay Commission (CPC) award at the sub-national level. High frequency indicators of rural demand, viz., growth in sales of two-wheelers and tractors, have witnessed sequential improvement in the recent months. The production of consumer non-durables, representing cash-intensive fast moving consumer goods (FMCG) demand, has, however, decelerated, though still exhibiting high growth among the components of industrial production (Chart III.3b).
Retail consumption activity, reflected in drawals of personal loans from scheduled commercial banks (SCBs), suggests that underlying conditions are supportive of consumption demand, going forward (Chart III.4).
III.1.2 Investment Demand
Investment demand remained depressed, with its share in GDP declining from 34.3 per cent in 2011-12 to 29.5 per cent in 2016-17. Although GFCF exhibited a slender recovery in Q1:2017-18, the overall investment climate remains bleak. Subdued levels of investment activity were also reflected in the contraction of capital goods production, notwithstanding robust growth in imports of certain capital goods (III.5a).
The corporate investment cycle is weighed down by
excess capacity in the manufacturing sector. Capacity
utilisation (CU) improved in Q4:2016-17, but it again
dipped in Q1:2017-18, reflecting weak demand (Chart
III.5b). High levels of stress in the balance sheets of
banks and corporations continued to act as a drag on
investment activity. Besides, households’ investment
in dwellings, other buildings and structures also
remained subdued due to high levels of inventories of
residential houses and expectations of correction in
prices.
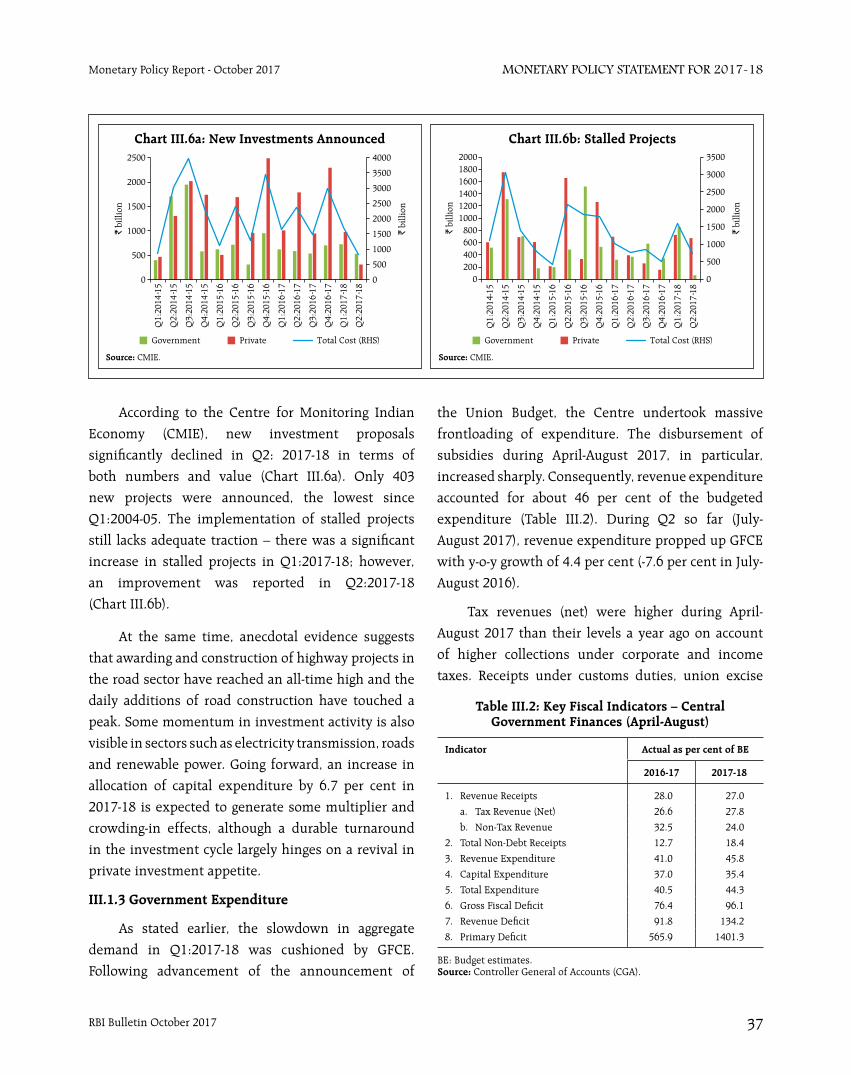
RBI Bulletin October 2017 37
Monetary Policy StateMent for 2017-18Monetary Policy Report - October 2017
According to the Centre for Monitoring Indian
Economy (CMIE), new investment proposals
significantly declined in Q2: 2017-18 in terms of
both numbers and value (Chart III.6a). Only 403
new projects were announced, the lowest since
Q1:2004-05. The implementation of stalled projects
still lacks adequate traction – there was a significant
increase in stalled projects in Q1:2017-18; however,
an improvement was reported in Q2:2017-18
(Chart III.6b).
At the same time, anecdotal evidence suggests
that awarding and construction of highway projects in
the road sector have reached an all-time high and the
daily additions of road construction have touched a
peak. Some momentum in investment activity is also
visible in sectors such as electricity transmission, roads
and renewable power. Going forward, an increase in
allocation of capital expenditure by 6.7 per cent in
2017-18 is expected to generate some multiplier and
crowding-in effects, although a durable turnaround
in the investment cycle largely hinges on a revival in
private investment appetite.
III.1.3 Government Expenditure
As stated earlier, the slowdown in aggregate
demand in Q1:2017-18 was cushioned by GFCE.
Following advancement of the announcement of
the Union Budget, the Centre undertook massive
frontloading of expenditure. The disbursement of
subsidies during April-August 2017, in particular,
increased sharply. Consequently, revenue expenditure
accounted for about 46 per cent of the budgeted
expenditure (Table III.2). During Q2 so far (July-
August 2017), revenue expenditure propped up GFCE
with y-o-y growth of 4.4 per cent (-7.6 per cent in July-
August 2016).
Tax revenues (net) were higher during April-
August 2017 than their levels a year ago on account
of higher collections under corporate and income
taxes. Receipts under customs duties, union excise
Table III.2: Key Fiscal Indicators – Central Government Finances (April-August)
Indicator Actual as per cent of BE
2016-17 2017-18
1. Revenue Receipts 28.0 27.0
a. Tax Revenue (Net) 26.6 27.8
b. Non-Tax Revenue 32.5 24.0
2. Total Non-Debt Receipts 12.7 18.4
3. Revenue Expenditure 41.0 45.8
4. Capital Expenditure 37.0 35.4
5. Total Expenditure 40.5 44.3
6. Gross Fiscal Deficit 76.4 96.1
7. Revenue Deficit 91.8 134.2
8. Primary Deficit 565.9 1401.3
BE: Budget estimates.Source: Controller General of Accounts (CGA).
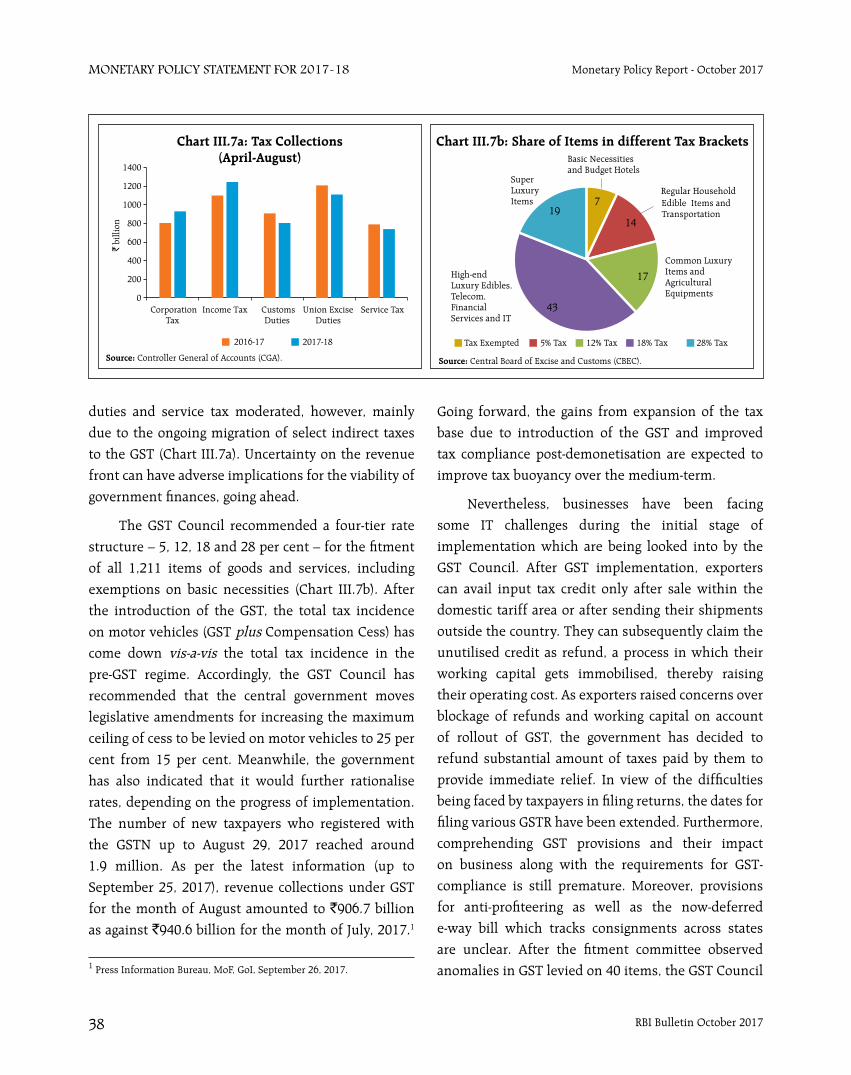
RBI Bulletin October 201738
Monetary Policy StateMent for 2017-18 Monetary Policy Report - October 2017
duties and service tax moderated, however, mainly
due to the ongoing migration of select indirect taxes
to the GST (Chart III.7a). Uncertainty on the revenue
front can have adverse implications for the viability of
government finances, going ahead.
The GST Council recommended a four-tier rate
structure – 5, 12, 18 and 28 per cent – for the fitment
of all 1,211 items of goods and services, including
exemptions on basic necessities (Chart III.7b). After
the introduction of the GST, the total tax incidence
on motor vehicles (GST plus Compensation Cess) has
come down vis-a-vis the total tax incidence in the
pre-GST regime. Accordingly, the GST Council has
recommended that the central government moves
legislative amendments for increasing the maximum
ceiling of cess to be levied on motor vehicles to 25 per
cent from 15 per cent. Meanwhile, the government
has also indicated that it would further rationalise
rates, depending on the progress of implementation.
The number of new taxpayers who registered with
the GSTN up to August 29, 2017 reached around
1.9 million. As per the latest information (up to
September 25, 2017), revenue collections under GST
for the month of August amounted to `906.7 billion
as against `940.6 billion for the month of July, 2017.1
Going forward, the gains from expansion of the tax
base due to introduction of the GST and improved
tax compliance post-demonetisation are expected to
improve tax buoyancy over the medium-term.
Nevertheless, businesses have been facing
some IT challenges during the initial stage of
implementation which are being looked into by the
GST Council. After GST implementation, exporters
can avail input tax credit only after sale within the
domestic tariff area or after sending their shipments
outside the country. They can subsequently claim the
unutilised credit as refund, a process in which their
working capital gets immobilised, thereby raising
their operating cost. As exporters raised concerns over
blockage of refunds and working capital on account
of rollout of GST, the government has decided to
refund substantial amount of taxes paid by them to
provide immediate relief. In view of the difficulties
being faced by taxpayers in filing returns, the dates for
filing various GSTR have been extended. Furthermore,
comprehending GST provisions and their impact
on business along with the requirements for GST-
compliance is still premature. Moreover, provisions
for anti-profiteering as well as the now-deferred
e-way bill which tracks consignments across states
are unclear. After the fitment committee observed
anomalies in GST levied on 40 items, the GST Council 1 Press Information Bureau, MoF, GoI, September 26, 2017.
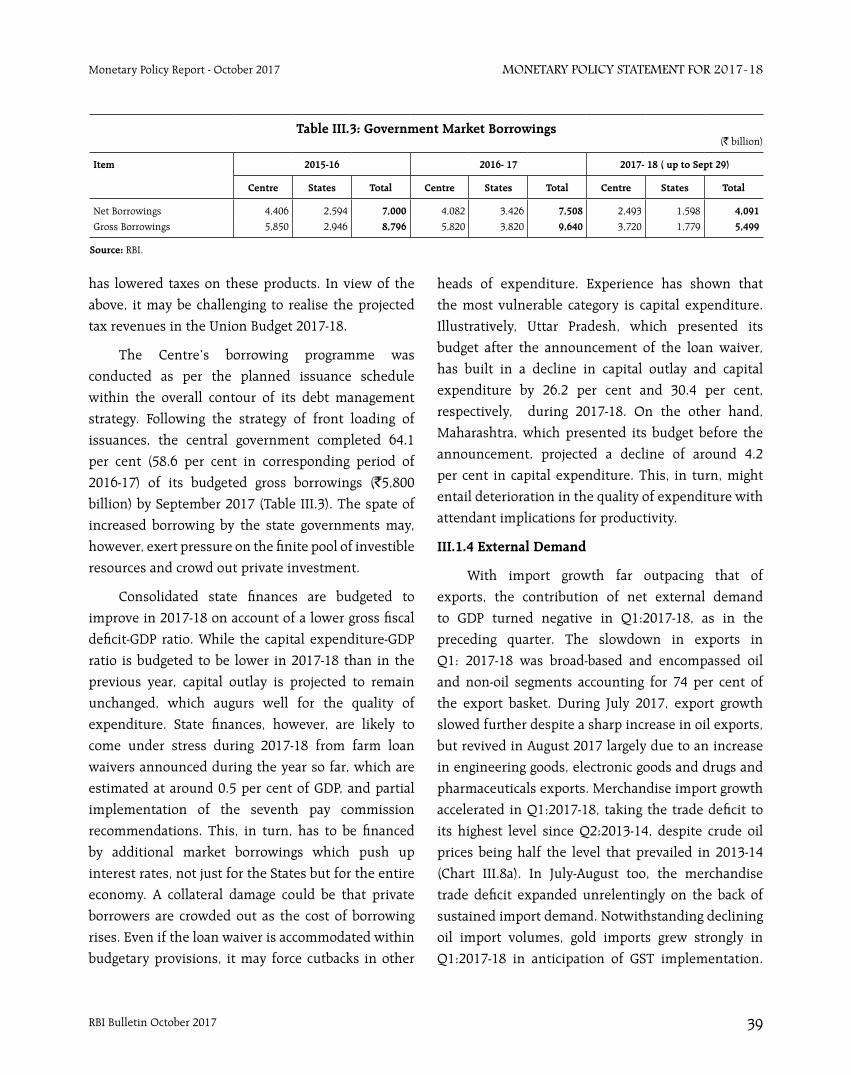
RBI Bulletin October 2017 39
Monetary Policy StateMent for 2017-18Monetary Policy Report - October 2017
has lowered taxes on these products. In view of the
above, it may be challenging to realise the projected
tax revenues in the Union Budget 2017-18.
The Centre’s borrowing programme was
conducted as per the planned issuance schedule
within the overall contour of its debt management
strategy. Following the strategy of front loading of
issuances, the central government completed 64.1
per cent (58.6 per cent in corresponding period of
2016-17) of its budgeted gross borrowings (`5,800
billion) by September 2017 (Table III.3). The spate of
increased borrowing by the state governments may,
however, exert pressure on the finite pool of investible
resources and crowd out private investment.
Consolidated state finances are budgeted to
improve in 2017-18 on account of a lower gross fiscal
deficit-GDP ratio. While the capital expenditure-GDP
ratio is budgeted to be lower in 2017-18 than in the
previous year, capital outlay is projected to remain
unchanged, which augurs well for the quality of
expenditure. State finances, however, are likely to
come under stress during 2017-18 from farm loan
waivers announced during the year so far, which are
estimated at around 0.5 per cent of GDP, and partial
implementation of the seventh pay commission
recommendations. This, in turn, has to be financed
by additional market borrowings which push up
interest rates, not just for the States but for the entire
economy. A collateral damage could be that private
borrowers are crowded out as the cost of borrowing
rises. Even if the loan waiver is accommodated within
budgetary provisions, it may force cutbacks in other
heads of expenditure. Experience has shown that
the most vulnerable category is capital expenditure.
Illustratively, Uttar Pradesh, which presented its
budget after the announcement of the loan waiver,
has built in a decline in capital outlay and capital
expenditure by 26.2 per cent and 30.4 per cent,
respectively, during 2017-18. On the other hand,
Maharashtra, which presented its budget before the
announcement, projected a decline of around 4.2
per cent in capital expenditure. This, in turn, might
entail deterioration in the quality of expenditure with
attendant implications for productivity.
III.1.4 External Demand
With import growth far outpacing that of
exports, the contribution of net external demand
to GDP turned negative in Q1:2017-18, as in the
preceding quarter. The slowdown in exports in
Q1: 2017-18 was broad-based and encompassed oil
and non-oil segments accounting for 74 per cent of
the export basket. During July 2017, export growth
slowed further despite a sharp increase in oil exports,
but revived in August 2017 largely due to an increase
in engineering goods, electronic goods and drugs and
pharmaceuticals exports. Merchandise import growth
accelerated in Q1:2017-18, taking the trade deficit to
its highest level since Q2:2013-14, despite crude oil
prices being half the level that prevailed in 2013-14
(Chart III.8a). In July-August too, the merchandise
trade deficit expanded unrelentingly on the back of
sustained import demand. Notwithstanding declining
oil import volumes, gold imports grew strongly in
Q1:2017-18 in anticipation of GST implementation.
Table III.3: Government Market Borrowings(` billion)
Item 2015-16 2016- 17 2017- 18 ( up to Sept 29)
Centre States Total Centre States Total Centre States Total
Net Borrowings 4,406 2,594 7,000 4,082 3,426 7,508 2,493 1,598 4,091
Gross Borrowings 5,850 2,946 8,796 5,820 3,820 9,640 3,720 1,779 5,499
Source: RBI.
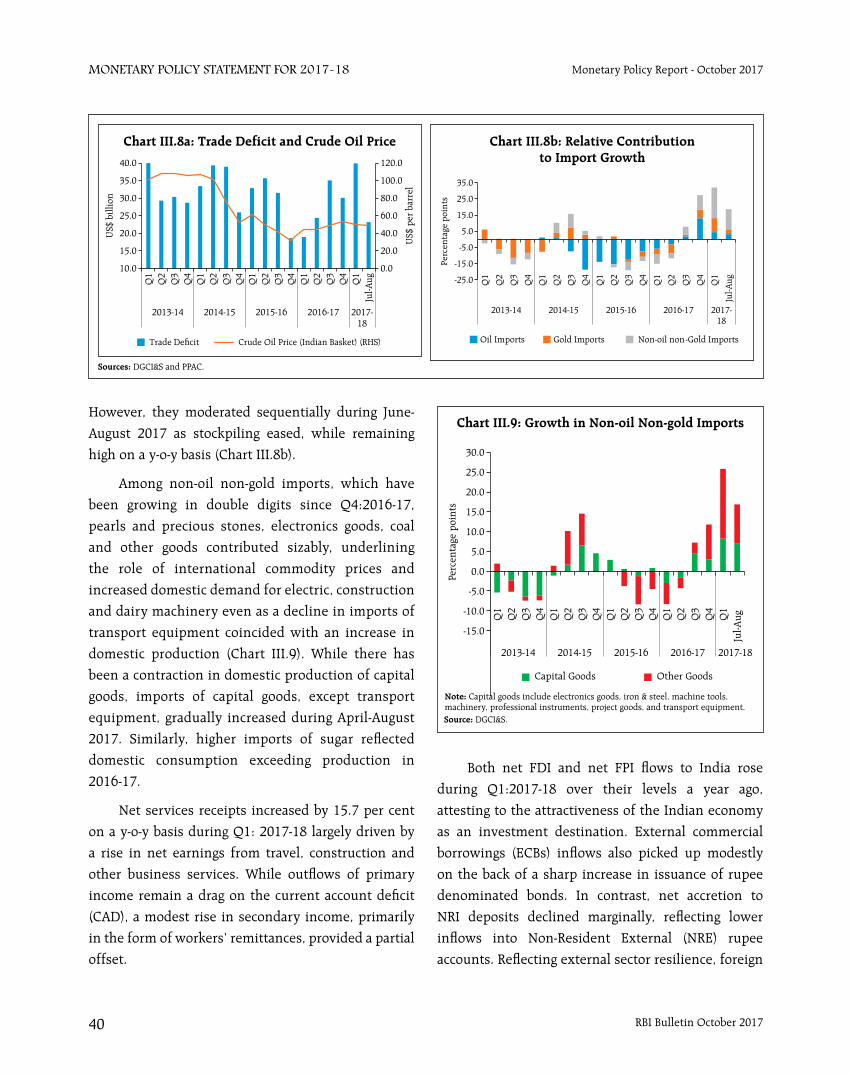
RBI Bulletin October 201740
Monetary Policy StateMent for 2017-18 Monetary Policy Report - October 2017
However, they moderated sequentially during June-
August 2017 as stockpiling eased, while remaining
high on a y-o-y basis (Chart III.8b).
Among non-oil non-gold imports, which have
been growing in double digits since Q4:2016-17,
pearls and precious stones, electronics goods, coal
and other goods contributed sizably, underlining
the role of international commodity prices and
increased domestic demand for electric, construction
and dairy machinery even as a decline in imports of
transport equipment coincided with an increase in
domestic production (Chart III.9). While there has
been a contraction in domestic production of capital
goods, imports of capital goods, except transport
equipment, gradually increased during April-August
2017. Similarly, higher imports of sugar reflected
domestic consumption exceeding production in
2016-17.
Net services receipts increased by 15.7 per cent
on a y-o-y basis during Q1: 2017-18 largely driven by
a rise in net earnings from travel, construction and
other business services. While outflows of primary
income remain a drag on the current account deficit
(CAD), a modest rise in secondary income, primarily
in the form of workers’ remittances, provided a partial
offset.
Both net FDI and net FPI flows to India rose
during Q1:2017-18 over their levels a year ago,
attesting to the attractiveness of the Indian economy
as an investment destination. External commercial
borrowings (ECBs) inflows also picked up modestly
on the back of a sharp increase in issuance of rupee
denominated bonds. In contrast, net accretion to
NRI deposits declined marginally, reflecting lower
inflows into Non-Resident External (NRE) rupee
accounts. Reflecting external sector resilience, foreign

RBI Bulletin October 2017 41
Monetary Policy StateMent for 2017-18Monetary Policy Report - October 2017
exchange reserves reached a level of US$ 399.7 billion
on September 29, 2017 equivalent to 11.5 months of
imports. 2
III.2 Aggregate Supply
The cyclical slowdown that set in at the beginning
of 2016-17 pulled the growth of output measured by
gross value added (GVA) at basic prices down to 5.6 per
cent in Q1:2017-18, flat at the level of the preceding
quarter (Table III.4).
Underlying this subdued performance was the
depressed state of industrial activity, particularly
manufacturing. Although agricultural and allied
activities also decelerated sequentially from Q3:2016-
17, they were in alignment with the typical outturn
in the first quarter of the year. Services sector activity,
however, posted a strong performance, dispelling
the slack that had manifested itself through 2016-
17. In fact, the deceleration of GVA was cushioned
by continuing strong growth in public administration,
defence and other services (PADO) growth, a
constituent of the services sector which has been
buoyed by frontloading of Government expenditure
in Q1:2017-18. Excluding this component, the GVA
growth would have slipped to 5 per cent in Q1:2017-
18 (Chart III.10). However, seasonally adjusted
q-o-q annualised GVA growth suggests a modest
strengthening of momentum in Q1:2017-18 vis-à-vis
Q4:2016-17 (Chart III.11).
2 Calculated using imports of four quarters up to June 2017.
Table III.4: Sector-wise Growth in GVA(Per cent)
Sector Weighted Contribution
2016-17
2015-16 2016-17 2015-16 2016-17 2017-18
Q1 Q2 Q3 Q4 Q1 Q2 Q3 Q4 Q1
Agriculture and Allied Activities 0.8 0.7 4.9 2.4 2.3 -2.1 1.5 2.5 4.1 6.9 5.2 2.3
Industry 1.6 10.2 7.0 7.7 9.2 12.0 11.9 9.0 6.5 7.2 5.5 1.5
Mining and Quarrying 0.1 10.5 1.8 8.3 12.2 11.7 10.5 -0.9 -1.3 1.9 6.4 -0.7
Manufacturing 1.4 10.8 7.9 8.2 9.3 13.2 12.7 10.7 7.7 8.2 5.3 1.2
Electricity, gas, water supply and other utilities 0.2 5.0 7.2 2.8 5.7 4.0 7.6 10.3 5.1 7.4 6.1 7.0
Services 4.3 9.1 6.9 8.9 9.0 9.0 9.4 8.2 7.4 6.4 5.7 7.8
Construction 0.1 5.0 1.7 6.2 1.6 6.0 6.0 3.1 4.3 3.4 -3.7 2.0
Trade, hotels, transport, communication 1.5 10.5 7.8 10.3 8.3 10.1 12.8 8.9 7.7 8.3 6.5 11.1
Financial, real estate and professional services 1.2 10.8 5.7 10.1 13.0 10.5 9.0 9.4 7.0 3.3 2.2 6.4
Public administration, defence and other services 1.4 6.9 11.3 6.2 7.2 7.5 6.7 8.6 9.5 10.3 17.0 9.5
GVA at Basic Prices 6.6 7.9 6.6 7.6 8.2 7.3 8.7 7.6 6.8 6.7 5.6 5.6
Source: Central Statistics Office (CSO).
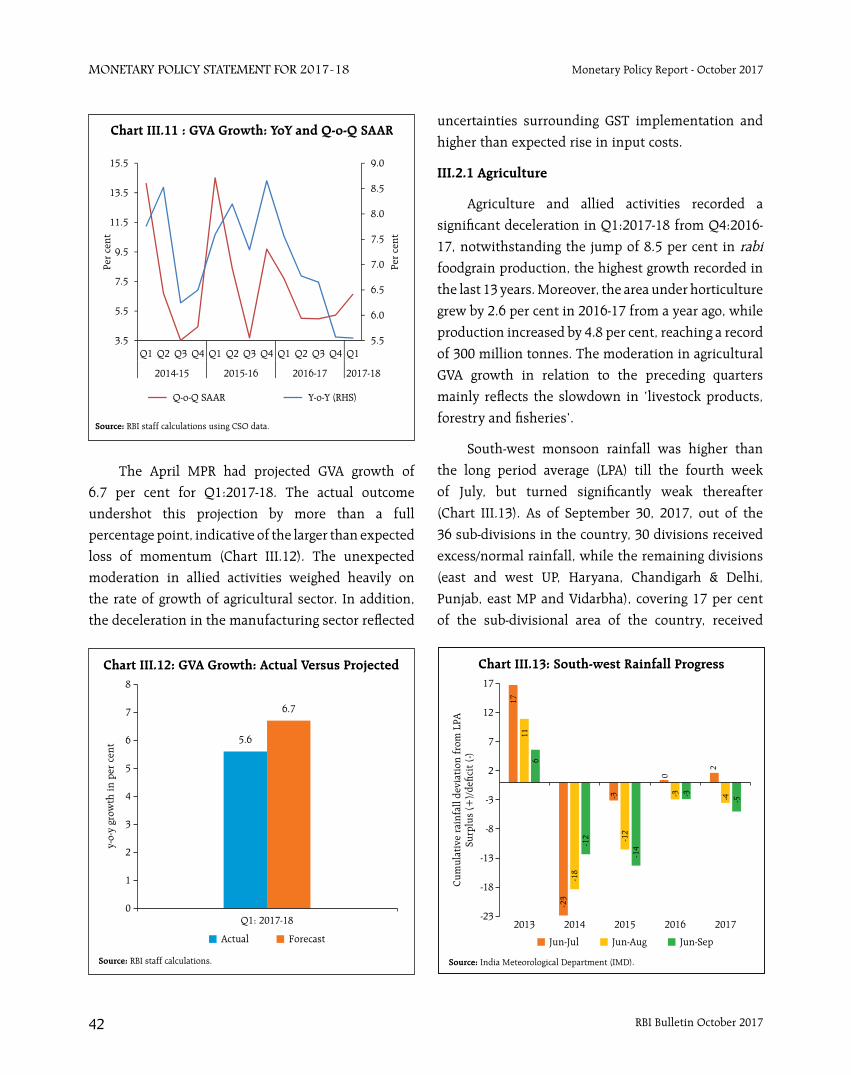
RBI Bulletin October 201742
Monetary Policy StateMent for 2017-18 Monetary Policy Report - October 2017
The April MPR had projected GVA growth of
6.7 per cent for Q1:2017-18. The actual outcome
undershot this projection by more than a full
percentage point, indicative of the larger than expected
loss of momentum (Chart III.12). The unexpected
moderation in allied activities weighed heavily on
the rate of growth of agricultural sector. In addition,
the deceleration in the manufacturing sector reflected
uncertainties surrounding GST implementation and
higher than expected rise in input costs.
III.2.1 Agriculture
Agriculture and allied activities recorded a
significant deceleration in Q1:2017-18 from Q4:2016-
17, notwithstanding the jump of 8.5 per cent in rabi foodgrain production, the highest growth recorded in
the last 13 years. Moreover, the area under horticulture
grew by 2.6 per cent in 2016-17 from a year ago, while
production increased by 4.8 per cent, reaching a record
of 300 million tonnes. The moderation in agricultural
GVA growth in relation to the preceding quarters
mainly reflects the slowdown in ‘livestock products,
forestry and fisheries’.
South-west monsoon rainfall was higher than
the long period average (LPA) till the fourth week
of July, but turned significantly weak thereafter
(Chart III.13). As of September 30, 2017, out of the
36 sub-divisions in the country, 30 divisions received
excess/normal rainfall, while the remaining divisions
(east and west UP, Haryana, Chandigarh & Delhi,
Punjab, east MP and Vidarbha), covering 17 per cent
of the sub-divisional area of the country, received
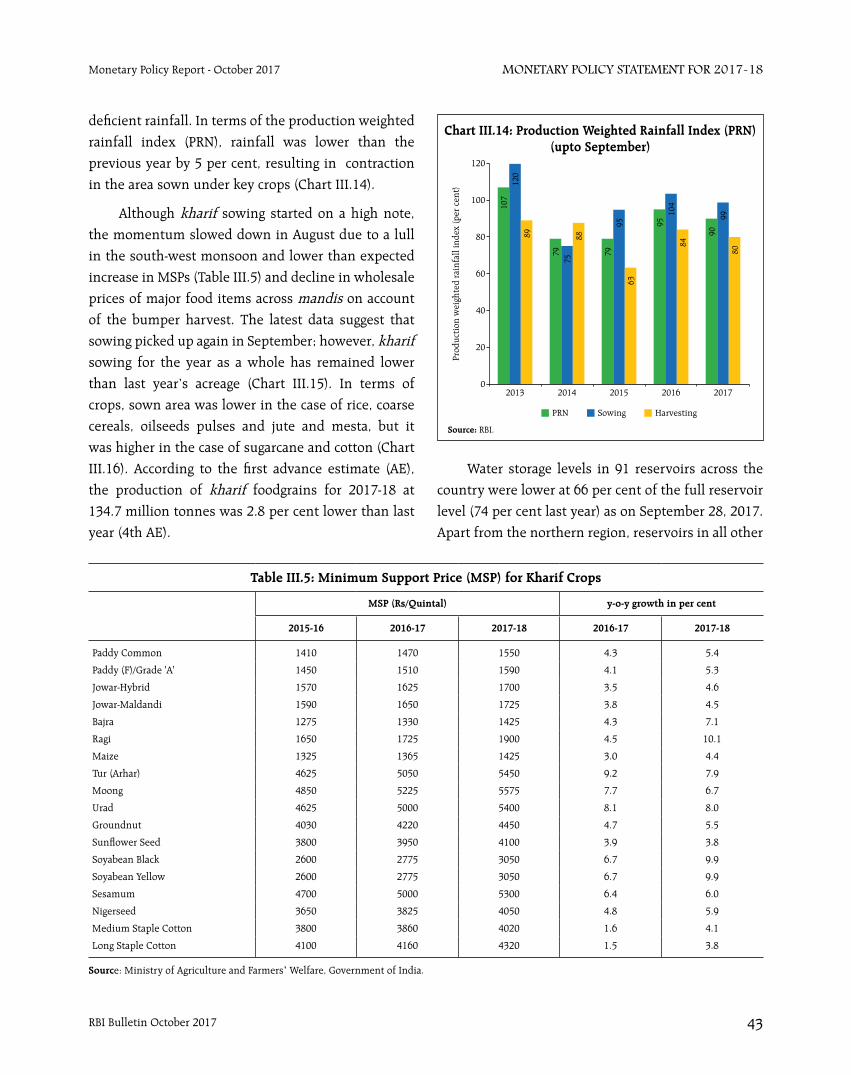
RBI Bulletin October 2017 43
Monetary Policy StateMent for 2017-18Monetary Policy Report - October 2017
deficient rainfall. In terms of the production weighted
rainfall index (PRN), rainfall was lower than the
previous year by 5 per cent, resulting in contraction
in the area sown under key crops (Chart III.14).
Although kharif sowing started on a high note,
the momentum slowed down in August due to a lull
in the south-west monsoon and lower than expected
increase in MSPs (Table III.5) and decline in wholesale
prices of major food items across mandis on account
of the bumper harvest. The latest data suggest that
sowing picked up again in September; however, kharif sowing for the year as a whole has remained lower
than last year’s acreage (Chart III.15). In terms of
crops, sown area was lower in the case of rice, coarse
cereals, oilseeds pulses and jute and mesta, but it
was higher in the case of sugarcane and cotton (Chart
III.16). According to the first advance estimate (AE),
the production of kharif foodgrains for 2017-18 at
134.7 million tonnes was 2.8 per cent lower than last
year (4th AE).
Table III.5: Minimum Support Price (MSP) for Kharif Crops
MSP (Rs/Quintal) y-o-y growth in per cent
2015-16 2016-17 2017-18 2016-17 2017-18
Paddy Common 1410 1470 1550 4.3 5.4
Paddy (F)/Grade 'A' 1450 1510 1590 4.1 5.3
Jowar-Hybrid 1570 1625 1700 3.5 4.6
Jowar-Maldandi 1590 1650 1725 3.8 4.5
Bajra 1275 1330 1425 4.3 7.1
Ragi 1650 1725 1900 4.5 10.1
Maize 1325 1365 1425 3.0 4.4
Tur (Arhar) 4625 5050 5450 9.2 7.9
Moong 4850 5225 5575 7.7 6.7
Urad 4625 5000 5400 8.1 8.0
Groundnut 4030 4220 4450 4.7 5.5
Sunflower Seed 3800 3950 4100 3.9 3.8
Soyabean Black 2600 2775 3050 6.7 9.9
Soyabean Yellow 2600 2775 3050 6.7 9.9
Sesamum 4700 5000 5300 6.4 6.0
Nigerseed 3650 3825 4050 4.8 5.9
Medium Staple Cotton 3800 3860 4020 1.6 4.1
Long Staple Cotton 4100 4160 4320 1.5 3.8
Source: Ministry of Agriculture and Farmers’ Welfare, Government of India.
Water storage levels in 91 reservoirs across the
country were lower at 66 per cent of the full reservoir
level (74 per cent last year) as on September 28, 2017.
Apart from the northern region, reservoirs in all other
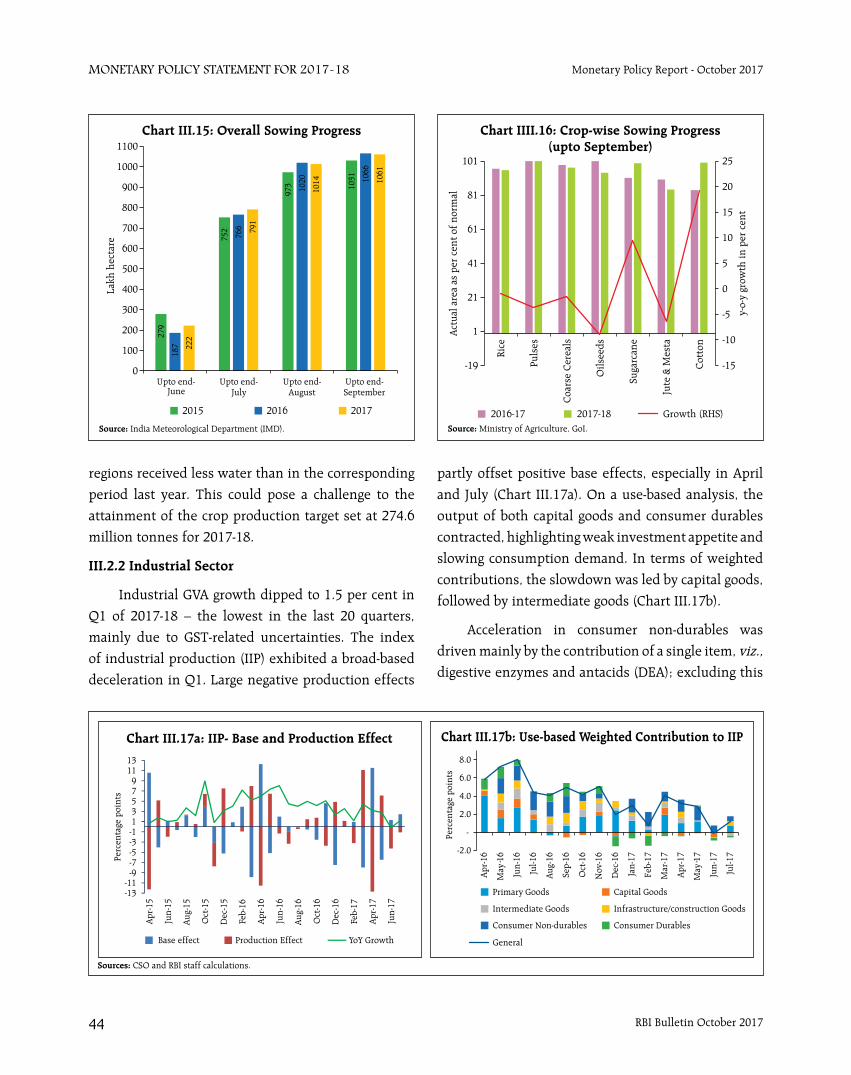
RBI Bulletin October 201744
Monetary Policy StateMent for 2017-18 Monetary Policy Report - October 2017
regions received less water than in the corresponding
period last year. This could pose a challenge to the
attainment of the crop production target set at 274.6
million tonnes for 2017-18.
III.2.2 Industrial Sector
Industrial GVA growth dipped to 1.5 per cent in
Q1 of 2017-18 – the lowest in the last 20 quarters,
mainly due to GST-related uncertainties. The index
of industrial production (IIP) exhibited a broad-based
deceleration in Q1. Large negative production effects
partly offset positive base effects, especially in April
and July (Chart III.17a). On a use-based analysis, the
output of both capital goods and consumer durables
contracted, highlighting weak investment appetite and
slowing consumption demand. In terms of weighted
contributions, the slowdown was led by capital goods,
followed by intermediate goods (Chart III.17b).
Acceleration in consumer non-durables was
driven mainly by the contribution of a single item, viz., digestive enzymes and antacids (DEA); excluding this
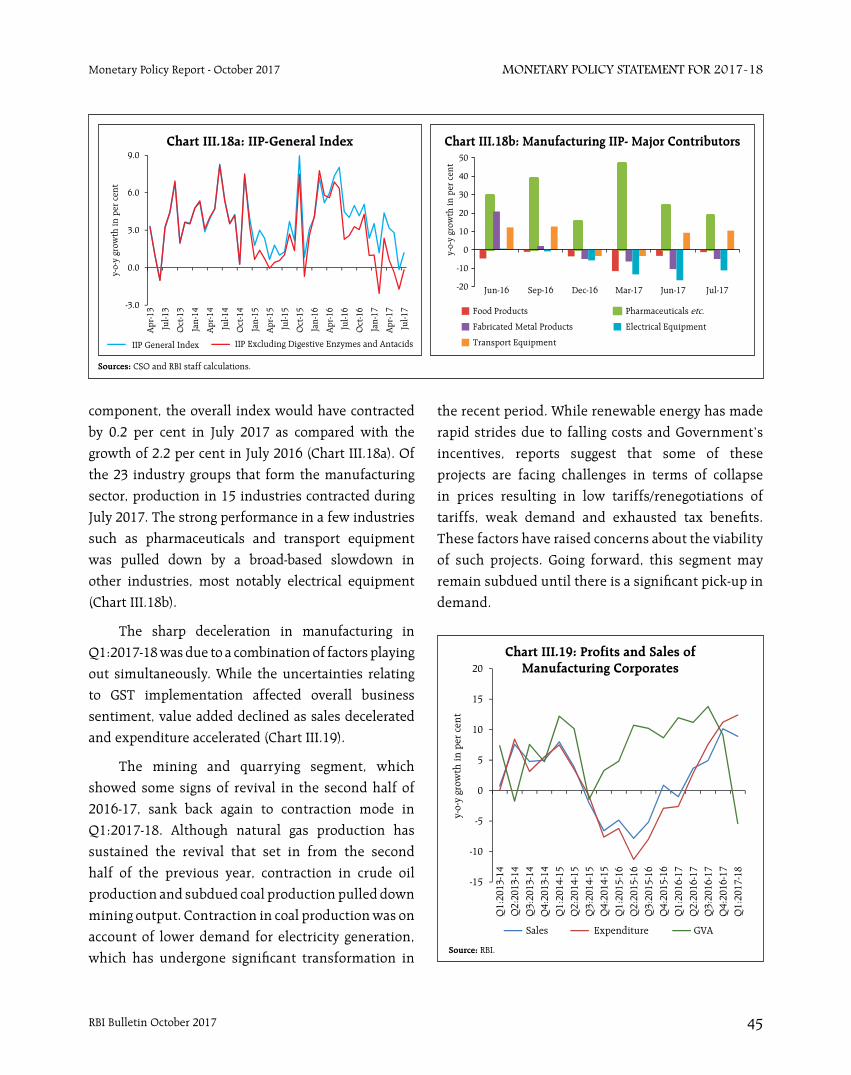
RBI Bulletin October 2017 45
Monetary Policy StateMent for 2017-18Monetary Policy Report - October 2017
component, the overall index would have contracted
by 0.2 per cent in July 2017 as compared with the
growth of 2.2 per cent in July 2016 (Chart III.18a). Of
the 23 industry groups that form the manufacturing
sector, production in 15 industries contracted during
July 2017. The strong performance in a few industries
such as pharmaceuticals and transport equipment
was pulled down by a broad-based slowdown in
other industries, most notably electrical equipment
(Chart III.18b).
The sharp deceleration in manufacturing in
Q1:2017-18 was due to a combination of factors playing
out simultaneously. While the uncertainties relating
to GST implementation affected overall business
sentiment, value added declined as sales decelerated
and expenditure accelerated (Chart III.19).
The mining and quarrying segment, which
showed some signs of revival in the second half of
2016-17, sank back again to contraction mode in
Q1:2017-18. Although natural gas production has
sustained the revival that set in from the second
half of the previous year, contraction in crude oil
production and subdued coal production pulled down
mining output. Contraction in coal production was on
account of lower demand for electricity generation,
which has undergone significant transformation in
the recent period. While renewable energy has made
rapid strides due to falling costs and Government’s
incentives, reports suggest that some of these
projects are facing challenges in terms of collapse
in prices resulting in low tariffs/renegotiations of
tariffs, weak demand and exhausted tax benefits.
These factors have raised concerns about the viability
of such projects. Going forward, this segment may
remain subdued until there is a significant pick-up in
demand.
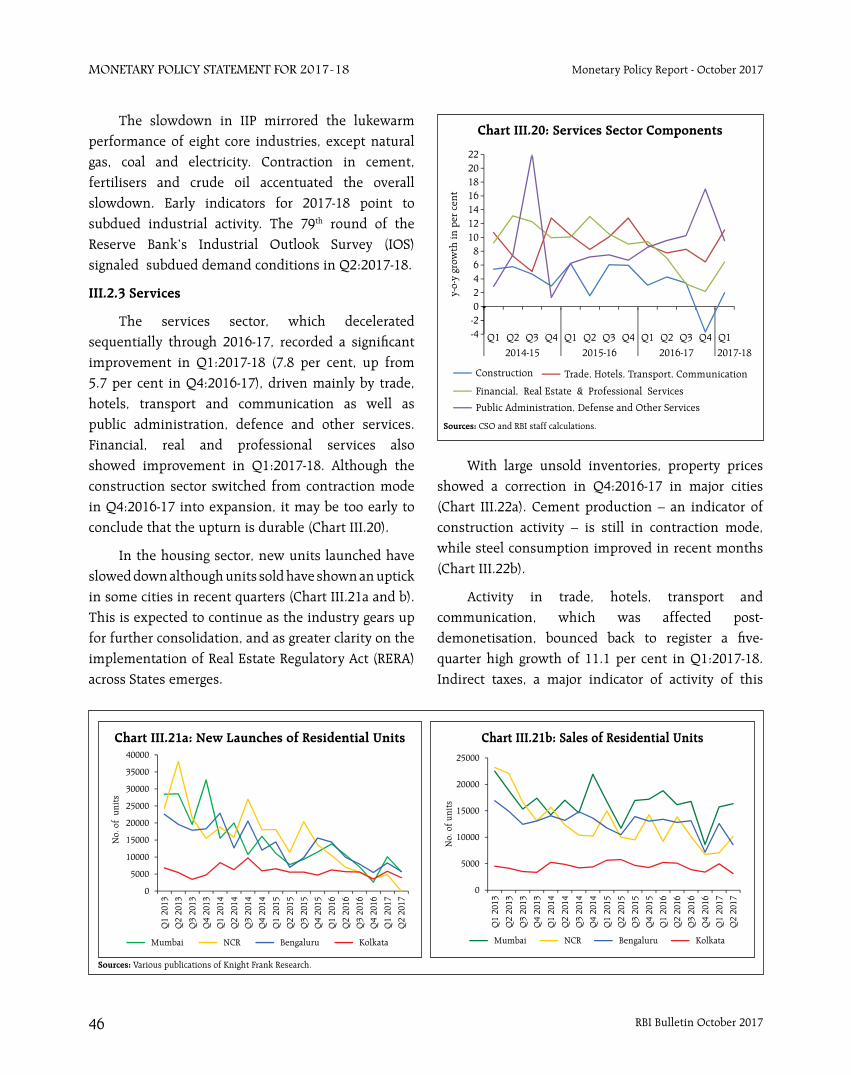
RBI Bulletin October 201746
Monetary Policy StateMent for 2017-18 Monetary Policy Report - October 2017
The slowdown in IIP mirrored the lukewarm performance of eight core industries, except natural gas, coal and electricity. Contraction in cement, fertilisers and crude oil accentuated the overall slowdown. Early indicators for 2017-18 point to subdued industrial activity. The 79th round of the Reserve Bank’s Industrial Outlook Survey (IOS) signaled subdued demand conditions in Q2:2017-18.
III.2.3 Services
The services sector, which decelerated sequentially through 2016-17, recorded a significant improvement in Q1:2017-18 (7.8 per cent, up from 5.7 per cent in Q4:2016-17), driven mainly by trade, hotels, transport and communication as well as public administration, defence and other services. Financial, real and professional services also showed improvement in Q1:2017-18. Although the construction sector switched from contraction mode in Q4:2016-17 into expansion, it may be too early to conclude that the upturn is durable (Chart III.20).
In the housing sector, new units launched have slowed down although units sold have shown an uptick in some cities in recent quarters (Chart III.21a and b). This is expected to continue as the industry gears up for further consolidation, and as greater clarity on the implementation of Real Estate Regulatory Act (RERA) across States emerges.
With large unsold inventories, property prices showed a correction in Q4:2016-17 in major cities (Chart III.22a). Cement production – an indicator of construction activity – is still in contraction mode, while steel consumption improved in recent months (Chart III.22b).
Activity in trade, hotels, transport and communication, which was affected post-demonetisation, bounced back to register a five-quarter high growth of 11.1 per cent in Q1:2017-18. Indirect taxes, a major indicator of activity of this
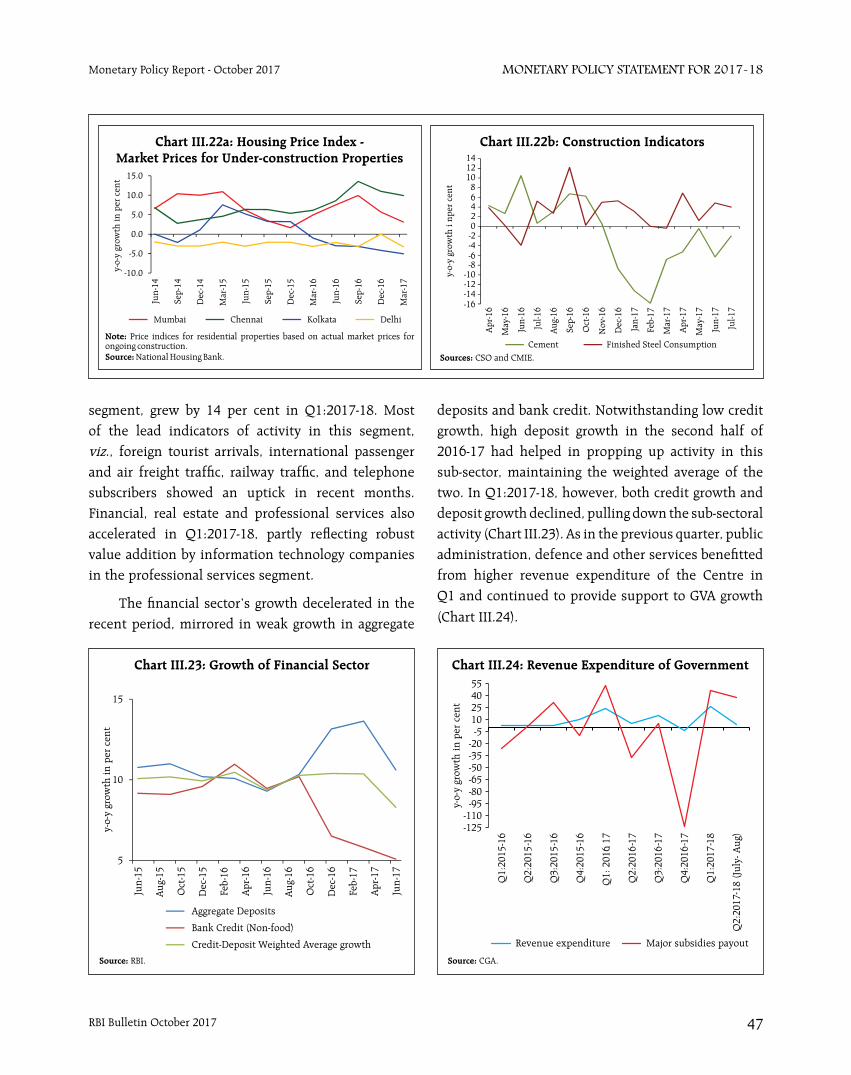
RBI Bulletin October 2017 47
Monetary Policy StateMent for 2017-18Monetary Policy Report - October 2017
segment, grew by 14 per cent in Q1:2017-18. Most of the lead indicators of activity in this segment, viz., foreign tourist arrivals, international passenger and air freight traffic, railway traffic, and telephone subscribers showed an uptick in recent months. Financial, real estate and professional services also accelerated in Q1:2017-18, partly reflecting robust value addition by information technology companies in the professional services segment.
The financial sector’s growth decelerated in the recent period, mirrored in weak growth in aggregate
deposits and bank credit. Notwithstanding low credit growth, high deposit growth in the second half of 2016-17 had helped in propping up activity in this sub-sector, maintaining the weighted average of the two. In Q1:2017-18, however, both credit growth and deposit growth declined, pulling down the sub-sectoral activity (Chart III.23). As in the previous quarter, public administration, defence and other services benefitted from higher revenue expenditure of the Centre in Q1 and continued to provide support to GVA growth
(Chart III.24).
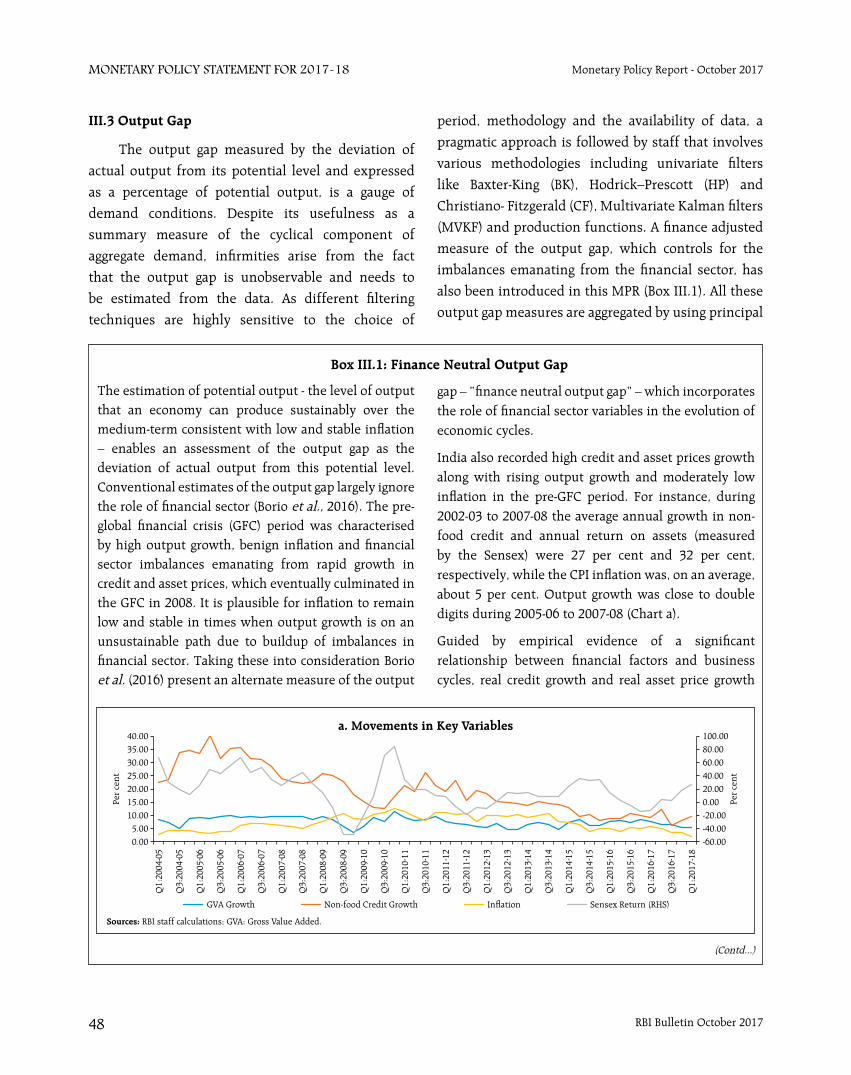
RBI Bulletin October 201748
Monetary Policy StateMent for 2017-18 Monetary Policy Report - October 2017
III.3 Output Gap
The output gap measured by the deviation of
actual output from its potential level and expressed
as a percentage of potential output, is a gauge of
demand conditions. Despite its usefulness as a
summary measure of the cyclical component of
aggregate demand, infirmities arise from the fact
that the output gap is unobservable and needs to
be estimated from the data. As different filtering
techniques are highly sensitive to the choice of
period, methodology and the availability of data, a
pragmatic approach is followed by staff that involves
various methodologies including univariate filters
like Baxter-King (BK), Hodrick–Prescott (HP) and
Christiano- Fitzgerald (CF), Multivariate Kalman filters
(MVKF) and production functions. A finance adjusted
measure of the output gap, which controls for the
imbalances emanating from the financial sector, has
also been introduced in this MPR (Box III.1). All these
output gap measures are aggregated by using principal
(Contd...)
The estimation of potential output - the level of output that an economy can produce sustainably over the medium-term consistent with low and stable inflation – enables an assessment of the output gap as the deviation of actual output from this potential level. Conventional estimates of the output gap largely ignore the role of financial sector (Borio et al., 2016). The pre-global financial crisis (GFC) period was characterised by high output growth, benign inflation and financial sector imbalances emanating from rapid growth in credit and asset prices, which eventually culminated in the GFC in 2008. It is plausible for inflation to remain low and stable in times when output growth is on an unsustainable path due to buildup of imbalances in financial sector. Taking these into consideration Borio et al. (2016) present an alternate measure of the output
Box III.1: Finance Neutral Output Gap
gap – “finance neutral output gap” – which incorporates the role of financial sector variables in the evolution of economic cycles.
India also recorded high credit and asset prices growth along with rising output growth and moderately low inflation in the pre-GFC period. For instance, during 2002-03 to 2007-08 the average annual growth in non-food credit and annual return on assets (measured by the Sensex) were 27 per cent and 32 per cent, respectively, while the CPI inflation was, on an average, about 5 per cent. Output growth was close to double digits during 2005-06 to 2007-08 (Chart a).
Guided by empirical evidence of a significant relationship between financial factors and business cycles, real credit growth and real asset price growth
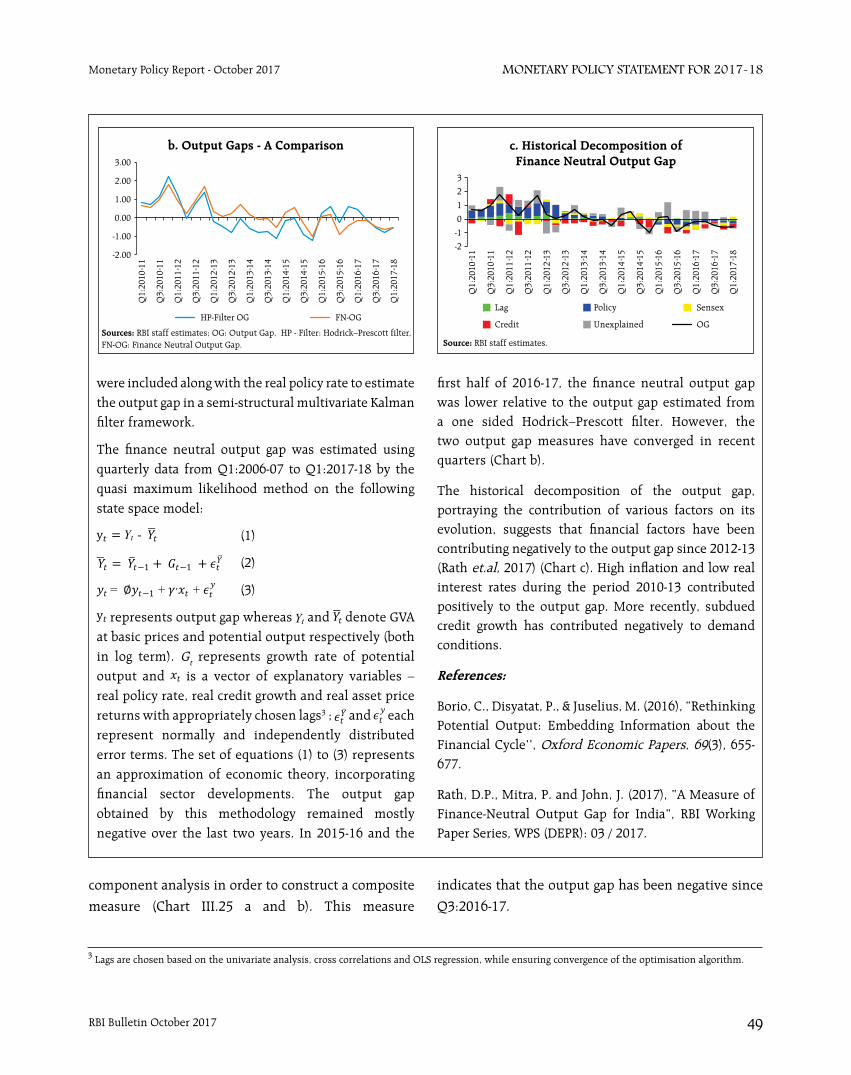
RBI Bulletin October 2017 49
Monetary Policy StateMent for 2017-18Monetary Policy Report - October 2017
were included along with the real policy rate to estimate the output gap in a semi-structural multivariate Kalman filter framework.
The finance neutral output gap was estimated using quarterly data from Q1:2006-07 to Q1:2017-18 by the quasi maximum likelihood method on the following state space model:
(1)
(2)
(3)
represents output gap whereas and denote GVA at basic prices and potential output respectively (both in log term). Gt represents growth rate of potential output and is a vector of explanatory variables – real policy rate, real credit growth and real asset price returns with appropriately chosen lags3 ; and each represent normally and independently distributed error terms. The set of equations (1) to (3) represents an approximation of economic theory, incorporating financial sector developments. The output gap obtained by this methodology remained mostly negative over the last two years. In 2015-16 and the
first half of 2016-17, the finance neutral output gap was lower relative to the output gap estimated from a one sided Hodrick–Prescott filter. However, the two output gap measures have converged in recent quarters (Chart b).
The historical decomposition of the output gap, portraying the contribution of various factors on its evolution, suggests that financial factors have been contributing negatively to the output gap since 2012-13 (Rath et.al, 2017) (Chart c). High inflation and low real interest rates during the period 2010-13 contributed positively to the output gap. More recently, subdued credit growth has contributed negatively to demand conditions.
References:
Borio, C., Disyatat, P., & Juselius, M. (2016), “Rethinking Potential Output: Embedding Information about the Financial Cycle’’, Oxford Economic Papers, 69(3), 655-677.
Rath, D.P., Mitra, P. and John, J. (2017), “A Measure of Finance-Neutral Output Gap for India”, RBI Working Paper Series, WPS (DEPR): 03 / 2017.
3 Lags are chosen based on the univariate analysis, cross correlations and OLS regression, while ensuring convergence of the optimisation algorithm.
component analysis in order to construct a composite
measure (Chart III.25 a and b). This measure
indicates that the output gap has been negative since
Q3:2016-17.
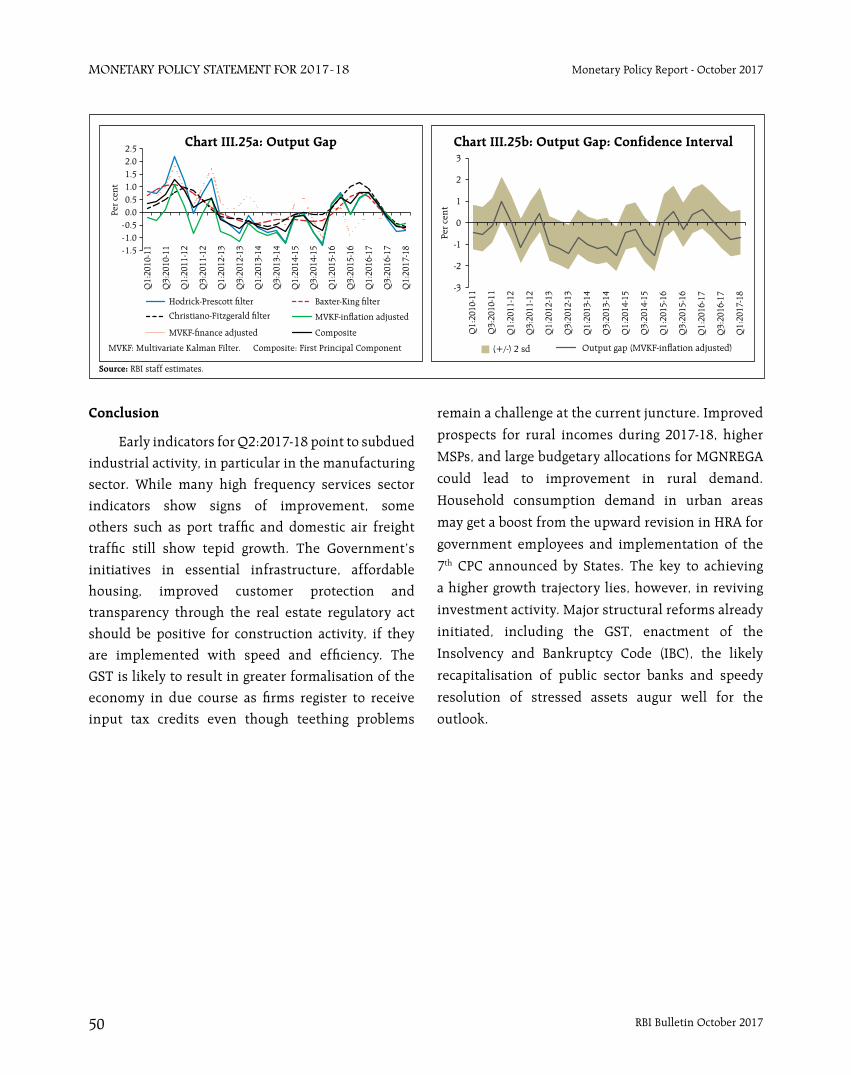
RBI Bulletin October 201750
Monetary Policy StateMent for 2017-18 Monetary Policy Report - October 2017
Conclusion
Early indicators for Q2:2017-18 point to subdued
industrial activity, in particular in the manufacturing
sector. While many high frequency services sector
indicators show signs of improvement, some
others such as port traffic and domestic air freight
traffic still show tepid growth. The Government’s
initiatives in essential infrastructure, affordable
housing, improved customer protection and
transparency through the real estate regulatory act
should be positive for construction activity, if they
are implemented with speed and efficiency. The
GST is likely to result in greater formalisation of the
economy in due course as firms register to receive
input tax credits even though teething problems
remain a challenge at the current juncture. Improved
prospects for rural incomes during 2017-18, higher
MSPs, and large budgetary allocations for MGNREGA
could lead to improvement in rural demand.
Household consumption demand in urban areas
may get a boost from the upward revision in HRA for
government employees and implementation of the
7th CPC announced by States. The key to achieving
a higher growth trajectory lies, however, in reviving
investment activity. Major structural reforms already
initiated, including the GST, enactment of the
Insolvency and Bankruptcy Code (IBC), the likely
recapitalisation of public sector banks and speedy
resolution of stressed assets augur well for the
outlook.
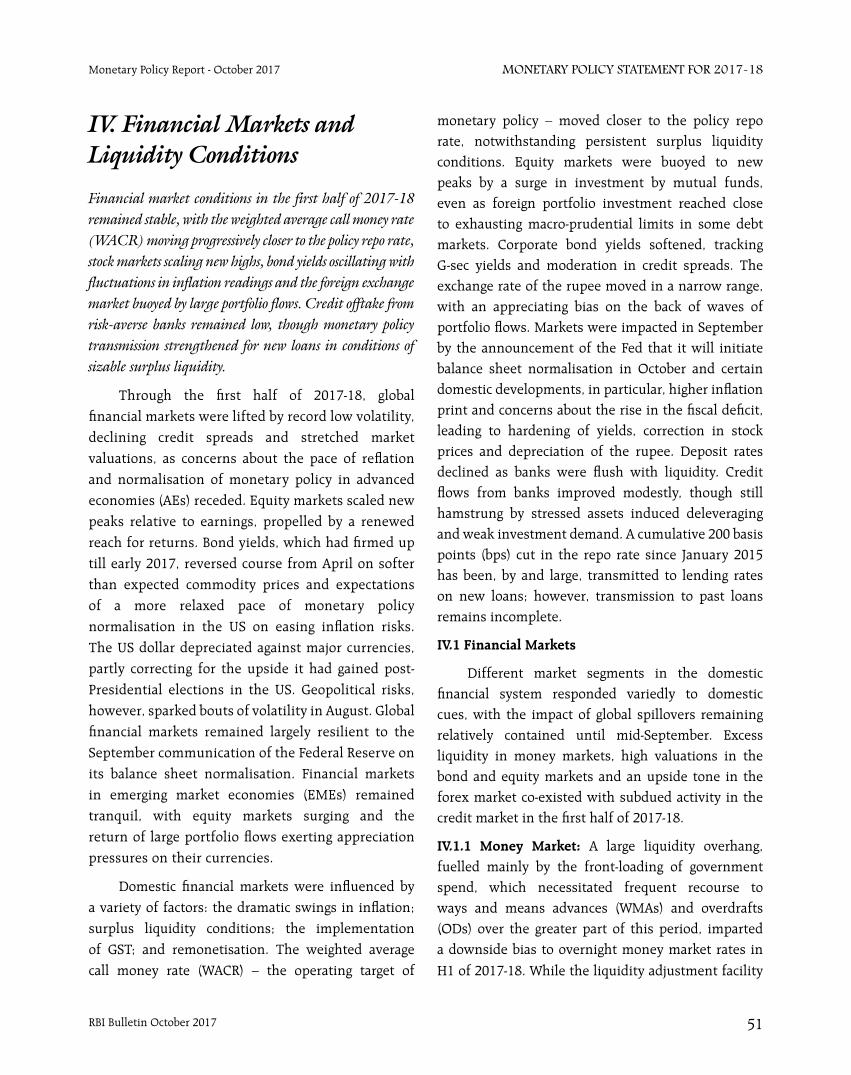
RBI Bulletin October 2017 51
Monetary Policy StateMent for 2017-18Monetary Policy Report - October 2017
Financial market conditions in the first half of 2017-18 remained stable, with the weighted average call money rate (WACR) moving progressively closer to the policy repo rate, stock markets scaling new highs, bond yields oscillating with fluctuations in inflation readings and the foreign exchange market buoyed by large portfolio flows. Credit offtake from risk-averse banks remained low, though monetary policy transmission strengthened for new loans in conditions of sizable surplus liquidity.
Through the first half of 2017-18, global financial markets were lifted by record low volatility, declining credit spreads and stretched market valuations, as concerns about the pace of reflation and normalisation of monetary policy in advanced economies (AEs) receded. Equity markets scaled new peaks relative to earnings, propelled by a renewed reach for returns. Bond yields, which had firmed up till early 2017, reversed course from April on softer than expected commodity prices and expectations of a more relaxed pace of monetary policy normalisation in the US on easing inflation risks. The US dollar depreciated against major currencies, partly correcting for the upside it had gained post-Presidential elections in the US. Geopolitical risks, however, sparked bouts of volatility in August. Global financial markets remained largely resilient to the September communication of the Federal Reserve on its balance sheet normalisation. Financial markets in emerging market economies (EMEs) remained tranquil, with equity markets surging and the return of large portfolio flows exerting appreciation pressures on their currencies.
Domestic financial markets were influenced by a variety of factors: the dramatic swings in inflation; surplus liquidity conditions; the implementation of GST; and remonetisation. The weighted average call money rate (WACR) – the operating target of
monetary policy – moved closer to the policy repo rate, notwithstanding persistent surplus liquidity conditions. Equity markets were buoyed to new peaks by a surge in investment by mutual funds, even as foreign portfolio investment reached close to exhausting macro-prudential limits in some debt markets. Corporate bond yields softened, tracking G-sec yields and moderation in credit spreads. The exchange rate of the rupee moved in a narrow range, with an appreciating bias on the back of waves of portfolio flows. Markets were impacted in September by the announcement of the Fed that it will initiate balance sheet normalisation in October and certain domestic developments, in particular, higher inflation print and concerns about the rise in the fiscal deficit, leading to hardening of yields, correction in stock prices and depreciation of the rupee. Deposit rates declined as banks were flush with liquidity. Credit flows from banks improved modestly, though still hamstrung by stressed assets induced deleveraging and weak investment demand. A cumulative 200 basis points (bps) cut in the repo rate since January 2015 has been, by and large, transmitted to lending rates on new loans; however, transmission to past loans remains incomplete.
IV.1 Financial Markets
Different market segments in the domestic financial system responded variedly to domestic cues, with the impact of global spillovers remaining relatively contained until mid-September. Excess liquidity in money markets, high valuations in the bond and equity markets and an upside tone in the forex market co-existed with subdued activity in the credit market in the first half of 2017-18.
IV.1.1 Money Market: A large liquidity overhang, fuelled mainly by the front-loading of government spend, which necessitated frequent recourse to ways and means advances (WMAs) and overdrafts (ODs) over the greater part of this period, imparted a downside bias to overnight money market rates in
H1 of 2017-18. While the liquidity adjustment facility
IV. Financial Markets and Liquidity Conditions
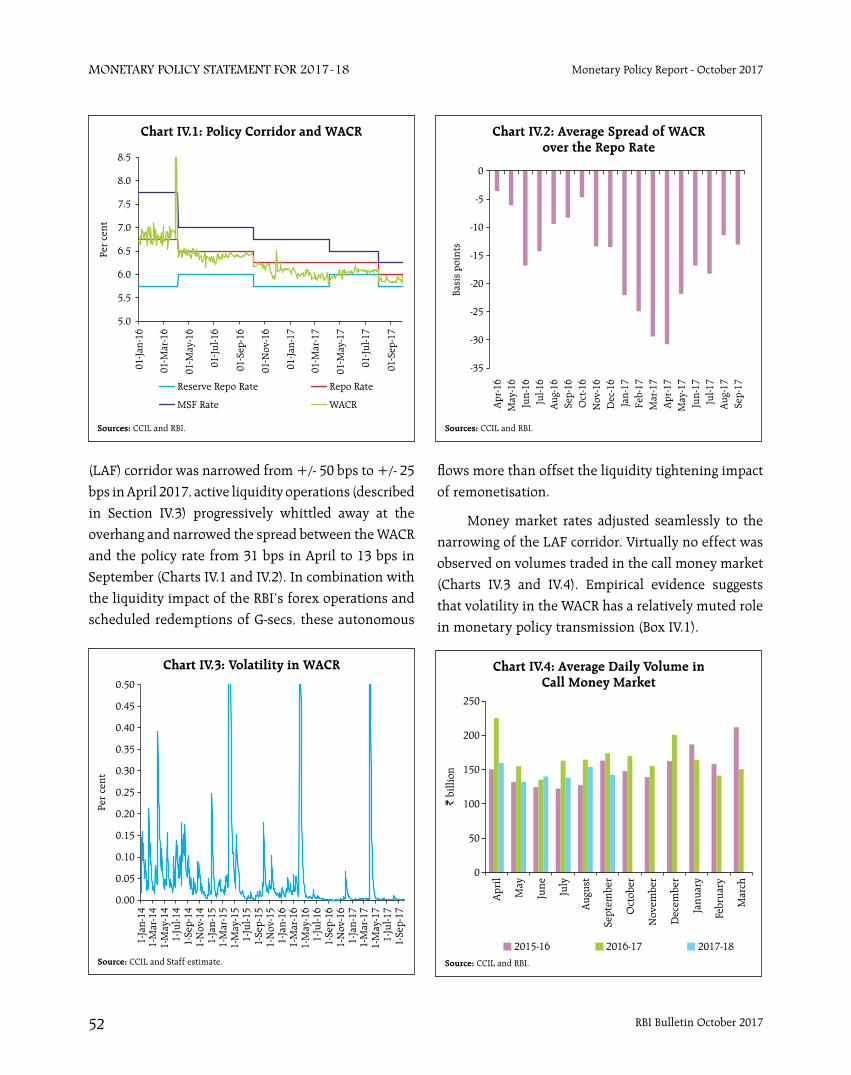
RBI Bulletin October 201752
Monetary Policy StateMent for 2017-18 Monetary Policy Report - October 2017
(LAF) corridor was narrowed from +/- 50 bps to +/- 25
bps in April 2017, active liquidity operations (described
in Section IV.3) progressively whittled away at the
overhang and narrowed the spread between the WACR
and the policy rate from 31 bps in April to 13 bps in
September (Charts IV.1 and IV.2). In combination with
the liquidity impact of the RBI’s forex operations and
scheduled redemptions of G-secs, these autonomous
flows more than offset the liquidity tightening impact
of remonetisation.
Money market rates adjusted seamlessly to the
narrowing of the LAF corridor. Virtually no effect was
observed on volumes traded in the call money market
(Charts IV.3 and IV.4). Empirical evidence suggests
that volatility in the WACR has a relatively muted role
in monetary policy transmission (Box IV.1).
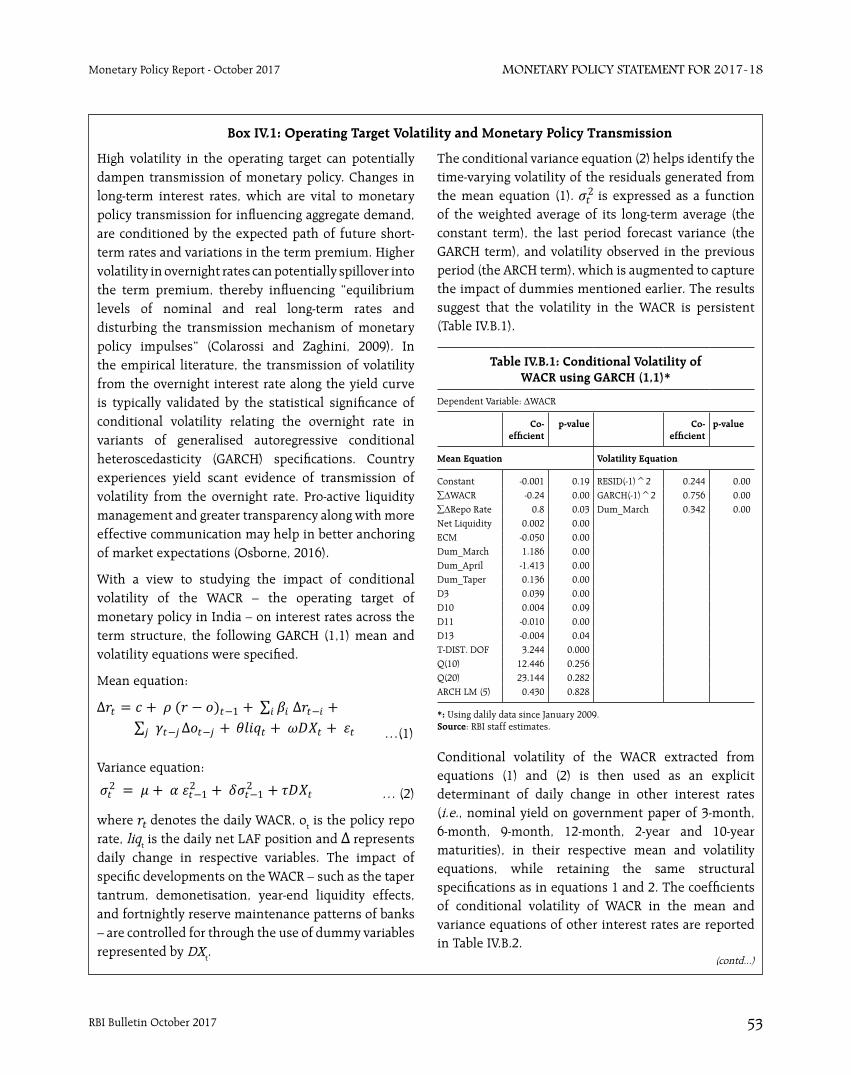
RBI Bulletin October 2017 53
Monetary Policy StateMent for 2017-18Monetary Policy Report - October 2017
Box IV.1: Operating Target Volatility and Monetary Policy Transmission
High volatility in the operating target can potentially dampen transmission of monetary policy. Changes in long-term interest rates, which are vital to monetary policy transmission for influencing aggregate demand, are conditioned by the expected path of future short-term rates and variations in the term premium. Higher volatility in overnight rates can potentially spillover into the term premium, thereby influencing “equilibrium levels of nominal and real long-term rates and disturbing the transmission mechanism of monetary policy impulses” (Colarossi and Zaghini, 2009). In the empirical literature, the transmission of volatility from the overnight interest rate along the yield curve is typically validated by the statistical significance of conditional volatility relating the overnight rate in variants of generalised autoregressive conditional heteroscedasticity (GARCH) specifications. Country experiences yield scant evidence of transmission of volatility from the overnight rate. Pro-active liquidity management and greater transparency along with more effective communication may help in better anchoring of market expectations (Osborne, 2016).
With a view to studying the impact of conditional volatility of the WACR – the operating target of monetary policy in India – on interest rates across the term structure, the following GARCH (1,1) mean and volatility equations were specified.
Mean equation:
…(1)
Variance equation:
… (2)
where denotes the daily WACR, ot is the policy repo rate, liqt is the daily net LAF position and represents daily change in respective variables. The impact of specific developments on the WACR – such as the taper tantrum, demonetisation, year-end liquidity effects, and fortnightly reserve maintenance patterns of banks – are controlled for through the use of dummy variables represented by DXt.
The conditional variance equation (2) helps identify the time-varying volatility of the residuals generated from the mean equation (1). is expressed as a function of the weighted average of its long-term average (the constant term), the last period forecast variance (the GARCH term), and volatility observed in the previous period (the ARCH term), which is augmented to capture the impact of dummies mentioned earlier. The results suggest that the volatility in the WACR is persistent (Table IV.B.1).
(contd...)
Table IV.B.1: Conditional Volatility of WACR using GARCH (1,1)*
Dependent Variable: ∆WACR
Co-efficient
p-value Co-efficient
p-value
Mean Equation Volatility Equation
Constant -0.001 0.19 RESID(-1)^2 0.244 0.00∑∆WACR -0.24 0.00 GARCH(-1)^2 0.756 0.00∑∆Repo Rate 0.8 0.03 Dum_March 0.342 0.00Net Liquidity 0.002 0.00ECM -0.050 0.00Dum_March 1.186 0.00Dum_April -1.413 0.00Dum_Taper 0.136 0.00D3 0.039 0.00D10 0.004 0.09D11 -0.010 0.00D13 -0.004 0.04T-DIST. DOF 3.244 0.000Q(10) 12.446 0.256Q(20) 23.144 0.282ARCH LM (5) 0.430 0.828
*: Using dalily data since January 2009.Source: RBI staff estimates.
Conditional volatility of the WACR extracted from equations (1) and (2) is then used as an explicit determinant of daily change in other interest rates (i.e., nominal yield on government paper of 3-month, 6-month, 9-month, 12-month, 2-year and 10-year maturities), in their respective mean and volatility equations, while retaining the same structural specifications as in equations 1 and 2. The coefficients of conditional volatility of WACR in the mean and variance equations of other interest rates are reported in Table IV.B.2.
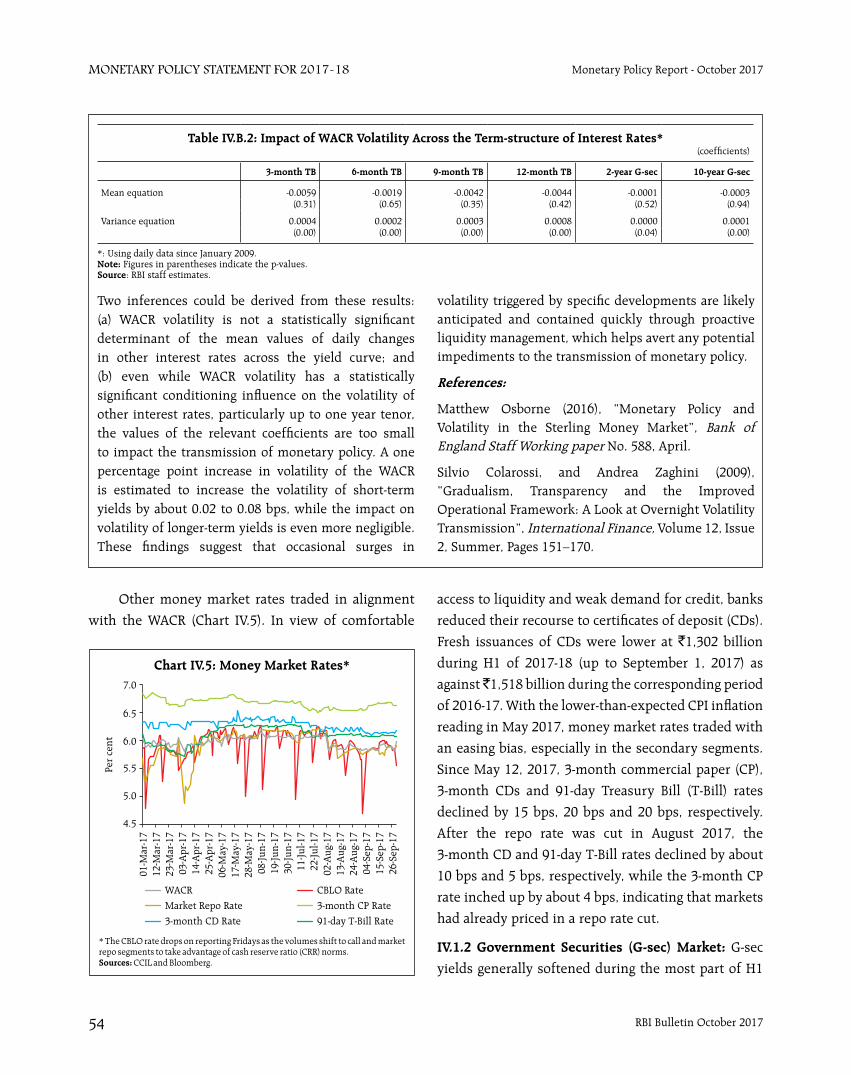
RBI Bulletin October 201754
Monetary Policy StateMent for 2017-18 Monetary Policy Report - October 2017
Two inferences could be derived from these results: (a) WACR volatility is not a statistically significant determinant of the mean values of daily changes in other interest rates across the yield curve; and (b) even while WACR volatility has a statistically significant conditioning influence on the volatility of other interest rates, particularly up to one year tenor, the values of the relevant coefficients are too small to impact the transmission of monetary policy. A one percentage point increase in volatility of the WACR is estimated to increase the volatility of short-term yields by about 0.02 to 0.08 bps, while the impact on volatility of longer-term yields is even more negligible. These findings suggest that occasional surges in
volatility triggered by specific developments are likely anticipated and contained quickly through proactive liquidity management, which helps avert any potential impediments to the transmission of monetary policy.
References:
Matthew Osborne (2016), “Monetary Policy and Volatility in the Sterling Money Market”, Bank of England Staff Working paper No. 588, April.
Silvio Colarossi, and Andrea Zaghini (2009), “Gradualism, Transparency and the Improved Operational Framework: A Look at Overnight Volatility Transmission”, International Finance, Volume 12, Issue 2, Summer, Pages 151–170.
Table IV.B.2: Impact of WACR Volatility Across the Term-structure of Interest Rates* (coefficients)
3-month TB 6-month TB 9-month TB 12-month TB 2-year G-sec 10-year G-sec
Mean equation -0.0059 -0.0019 -0.0042 -0.0044 -0.0001 -0.0003(0.31) (0.65) (0.35) (0.42) (0.52) (0.94)
Variance equation 0.0004 0.0002 0.0003 0.0008 0.0000 0.0001(0.00) (0.00) (0.00) (0.00) (0.04) (0.00)
*: Using daily data since January 2009.Note: Figures in parentheses indicate the p-values. Source: RBI staff estimates.
Other money market rates traded in alignment
with the WACR (Chart IV.5). In view of comfortable
access to liquidity and weak demand for credit, banks
reduced their recourse to certificates of deposit (CDs).
Fresh issuances of CDs were lower at `1,302 billion
during H1 of 2017-18 (up to September 1, 2017) as
against ̀ 1,518 billion during the corresponding period
of 2016-17. With the lower-than-expected CPI inflation
reading in May 2017, money market rates traded with
an easing bias, especially in the secondary segments.
Since May 12, 2017, 3-month commercial paper (CP),
3-month CDs and 91-day Treasury Bill (T-Bill) rates
declined by 15 bps, 20 bps and 20 bps, respectively.
After the repo rate was cut in August 2017, the
3-month CD and 91-day T-Bill rates declined by about
10 bps and 5 bps, respectively, while the 3-month CP
rate inched up by about 4 bps, indicating that markets
had already priced in a repo rate cut.
IV.1.2 Government Securities (G-sec) Market: G-sec
yields generally softened during the most part of H1
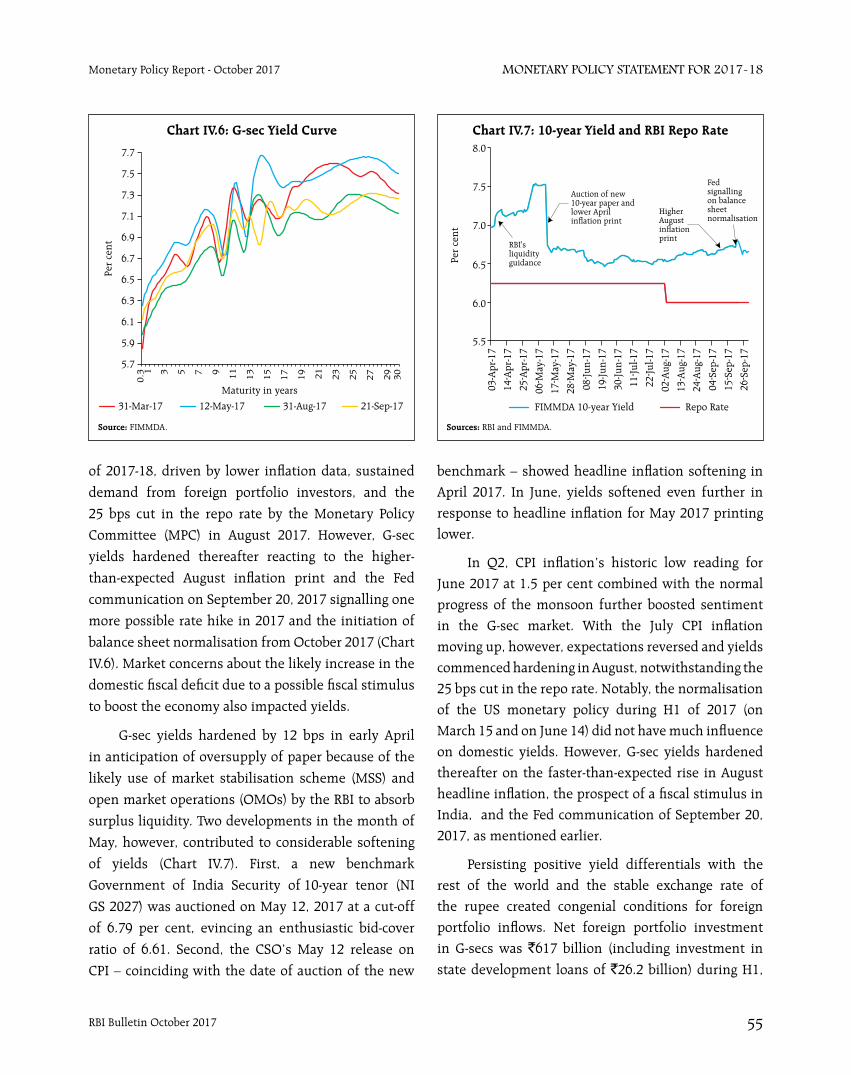
RBI Bulletin October 2017 55
Monetary Policy StateMent for 2017-18Monetary Policy Report - October 2017
of 2017-18, driven by lower inflation data, sustained
demand from foreign portfolio investors, and the
25 bps cut in the repo rate by the Monetary Policy
Committee (MPC) in August 2017. However, G-sec
yields hardened thereafter reacting to the higher-
than-expected August inflation print and the Fed
communication on September 20, 2017 signalling one
more possible rate hike in 2017 and the initiation of
balance sheet normalisation from October 2017 (Chart
IV.6). Market concerns about the likely increase in the
domestic fiscal deficit due to a possible fiscal stimulus
to boost the economy also impacted yields.
G-sec yields hardened by 12 bps in early April
in anticipation of oversupply of paper because of the
likely use of market stabilisation scheme (MSS) and
open market operations (OMOs) by the RBI to absorb
surplus liquidity. Two developments in the month of
May, however, contributed to considerable softening
of yields (Chart IV.7). First, a new benchmark
Government of India Security of 10-year tenor (NI
GS 2027) was auctioned on May 12, 2017 at a cut-off
of 6.79 per cent, evincing an enthusiastic bid-cover
ratio of 6.61. Second, the CSO’s May 12 release on
CPI – coinciding with the date of auction of the new
benchmark – showed headline inflation softening in April 2017. In June, yields softened even further in response to headline inflation for May 2017 printing lower.
In Q2, CPI inflation’s historic low reading for June 2017 at 1.5 per cent combined with the normal progress of the monsoon further boosted sentiment in the G-sec market. With the July CPI inflation moving up, however, expectations reversed and yields commenced hardening in August, notwithstanding the 25 bps cut in the repo rate. Notably, the normalisation of the US monetary policy during H1 of 2017 (on March 15 and on June 14) did not have much influence on domestic yields. However, G-sec yields hardened thereafter on the faster-than-expected rise in August headline inflation, the prospect of a fiscal stimulus in India, and the Fed communication of September 20, 2017, as mentioned earlier.
Persisting positive yield differentials with the rest of the world and the stable exchange rate of the rupee created congenial conditions for foreign portfolio inflows. Net foreign portfolio investment in G-secs was `617 billion (including investment in
state development loans of `26.2 billion) during H1,

RBI Bulletin October 201756
Monetary Policy StateMent for 2017-18 Monetary Policy Report - October 2017
resulting in 99 per cent of the limit for FPI investment
in G-secs being utilised1. FPIs continued to be net
buyers in the debt market in every month during H1
(Chart IV.8).
In the short end of the G-sec market, the impact
of the larger supply of paper – issuances of T-Bills of
`1 trillion under the MSS and of cash management
bills (CMBs) cumulatively aggregating to `2.5 trillion –
was reflected in the hardening of T-Bills rates during
H1 (Chart IV.9).
Issuances of state development loans (SDLs)
remained subdued in Q1 of 2017-18, but picked up in
Q2. The spread of SDLs’ cut-off over the 10-year G-sec
remained in the range of 74-87 bps in September 2017
as compared with 77-81 bps in April 2017 (Chart IV.10).
In H1 of 2017-18, there were no issuances of Ujwal
DISCOM Assurance Yojana (UDAY) bonds in contrast
to 2016-17 when thirteen States issued UDAY bonds
of `1,091 billion as against `990 billion issued by
eight States in the previous year2. The total secondary
market trading volume (face value) of UDAY bonds
1 On September 28, 2017, the limits for FPI investment in G-secs and SDLs for the October-December quarter were increased by `80 billion and `62 billion, respectively.
2 The spread on UDAY bonds during 2016-17 declined to 35-75 bps over the corresponding tenor/10-year FIMMDA G-sec yield as compared with a fixed spread of 75 bps in 2015-16. Approximately 45 per cent of total UDAY bond issuances in 2016-17 were concentrated in Q4. The large volume of SDL issuances, including UDAY, was one of the major factors that resulted in a widening of weighted average spread on SDLs to 83 bps in Q4 of 2016-17.

RBI Bulletin October 2017 57
Monetary Policy StateMent for 2017-18Monetary Policy Report - October 2017
during H1 of 2017-18 (up to September 29, 2017) was
`626 billion.
There is no significant relationship between the
borrowing spreads on SDLs and States’ fiscal deficits
and debt positions. The inter-State spread was, on
average, within 9 bps during H1 of 2017-18 as against
7 bps in 2016-17 and 2015-16. Cost considerations
have drastically reduced the dependence of State
Governments on the National Small Savings Fund
(NSSF). Following the recommendations of the 14th
Finance Commission (FC), all States (barring four3)
have been allowed to be excluded from the NSSF
financing facility beginning 2016-17. The share of
market borrowings, which can be raised at relatively
lower costs, particularly when markets do not
differentiate between States on the basis of their
respective fiscal deficits and debt, has increased,
including for discharging past NSSF liabilities.
IV.1.3 Corporate Bond Market: Corporate bond yields
softened during H1 of 2017-18, tracking the decline
in G-sec yields (Chart IV.11a). The decline in 5-year
AAA corporate yield was, however, interspersed with
occasional spikes at the end of June and in early-July.
The spread of 5-year AAA rated corporate bonds over
5-year G-secs declined by 56 bps, possibly reflecting
improvement in overall credit risk perceptions
on expectation of faster resolution of stressed
assets under the Banking Regulation (Amendment)
Ordinance promulgated on May 4, 2017. The average
daily turnover in the corporate bond market increased
sharply to `73.2 billion during April-August 2017
from `47.5 billion during the corresponding period
of last year. Resources mobilised through issuances
of corporate bonds in the primary market increased
by 7.1 per cent to `2,770 billion during April-August
2017 from `2,588 billion a year ago. Of the total
resources mobilised from the private corporate bond
market, private placements constituted 98.6 per cent
(Chart IV.11b).
Foreign portfolio investment (FPI) in corporate
bonds increased to `2.42 trillion as on September 28,
2017 from ̀ 1.86 trillion at end-March 2017. As a result,
the utilisation of the approved limit rose to 99.2 per
cent from about 76 per cent at end-March 2017. On
September 22, 2017, the Reserve Bank announced
the removal of Masala bonds or rupee denominated
bonds issued overseas from the corporate bond
investment limit effective October 3, 2017. This will
release additional space for investment by FPIs in
corporate bonds. The total investment in Masala bonds
3 Delhi, Madhya Pradesh, Kerala and Arunachal Pradesh.
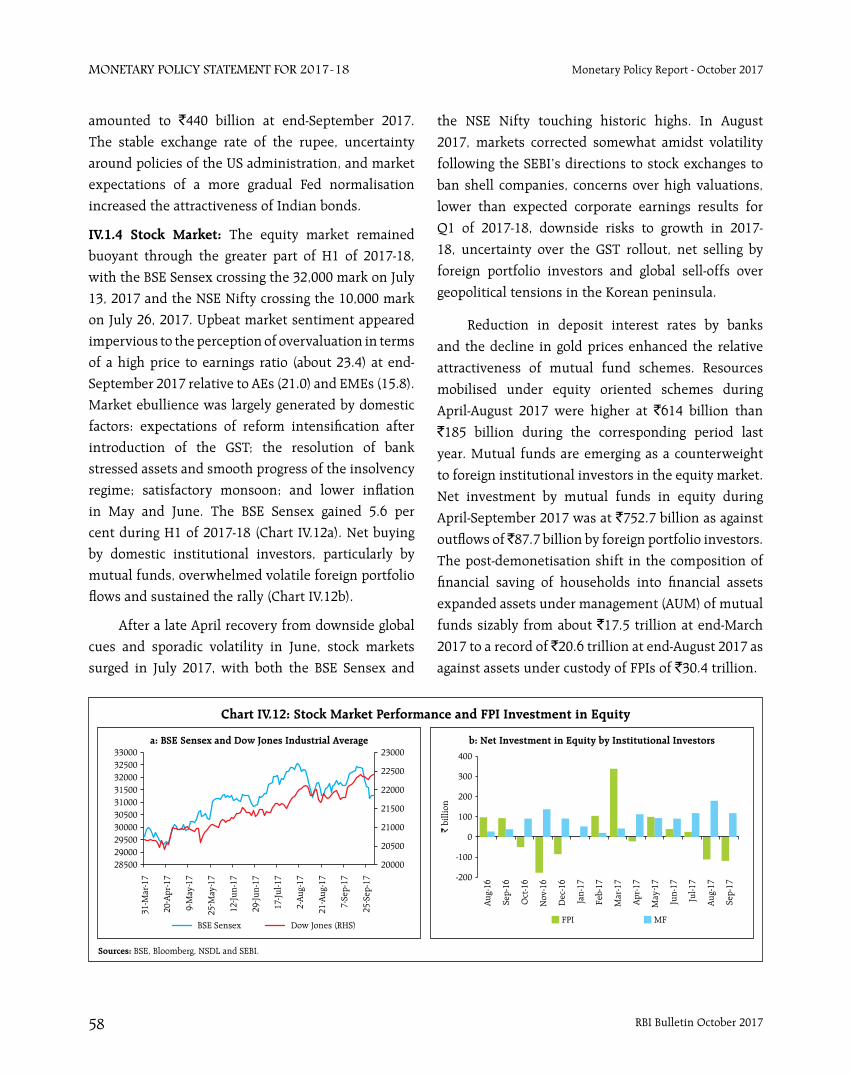
RBI Bulletin October 201758
Monetary Policy StateMent for 2017-18 Monetary Policy Report - October 2017
amounted to `440 billion at end-September 2017.
The stable exchange rate of the rupee, uncertainty
around policies of the US administration, and market
expectations of a more gradual Fed normalisation
increased the attractiveness of Indian bonds.
IV.1.4 Stock Market: The equity market remained
buoyant through the greater part of H1 of 2017-18,
with the BSE Sensex crossing the 32,000 mark on July
13, 2017 and the NSE Nifty crossing the 10,000 mark
on July 26, 2017. Upbeat market sentiment appeared
impervious to the perception of overvaluation in terms
of a high price to earnings ratio (about 23.4) at end-
September 2017 relative to AEs (21.0) and EMEs (15.8).
Market ebullience was largely generated by domestic
factors: expectations of reform intensification after
introduction of the GST; the resolution of bank
stressed assets and smooth progress of the insolvency
regime; satisfactory monsoon; and lower inflation
in May and June. The BSE Sensex gained 5.6 per
cent during H1 of 2017-18 (Chart IV.12a). Net buying
by domestic institutional investors, particularly by
mutual funds, overwhelmed volatile foreign portfolio
flows and sustained the rally (Chart IV.12b).
After a late April recovery from downside global
cues and sporadic volatility in June, stock markets
surged in July 2017, with both the BSE Sensex and
the NSE Nifty touching historic highs. In August
2017, markets corrected somewhat amidst volatility
following the SEBI’s directions to stock exchanges to
ban shell companies, concerns over high valuations,
lower than expected corporate earnings results for
Q1 of 2017-18, downside risks to growth in 2017-
18, uncertainty over the GST rollout, net selling by
foreign portfolio investors and global sell-offs over
geopolitical tensions in the Korean peninsula.
Reduction in deposit interest rates by banks
and the decline in gold prices enhanced the relative
attractiveness of mutual fund schemes. Resources
mobilised under equity oriented schemes during
April-August 2017 were higher at `614 billion than
`185 billion during the corresponding period last
year. Mutual funds are emerging as a counterweight
to foreign institutional investors in the equity market.
Net investment by mutual funds in equity during
April-September 2017 was at `752.7 billion as against
outflows of ̀ 87.7 billion by foreign portfolio investors.
The post-demonetisation shift in the composition of
financial saving of households into financial assets
expanded assets under management (AUM) of mutual
funds sizably from about `17.5 trillion at end-March
2017 to a record of ̀ 20.6 trillion at end-August 2017 as
against assets under custody of FPIs of `30.4 trillion.
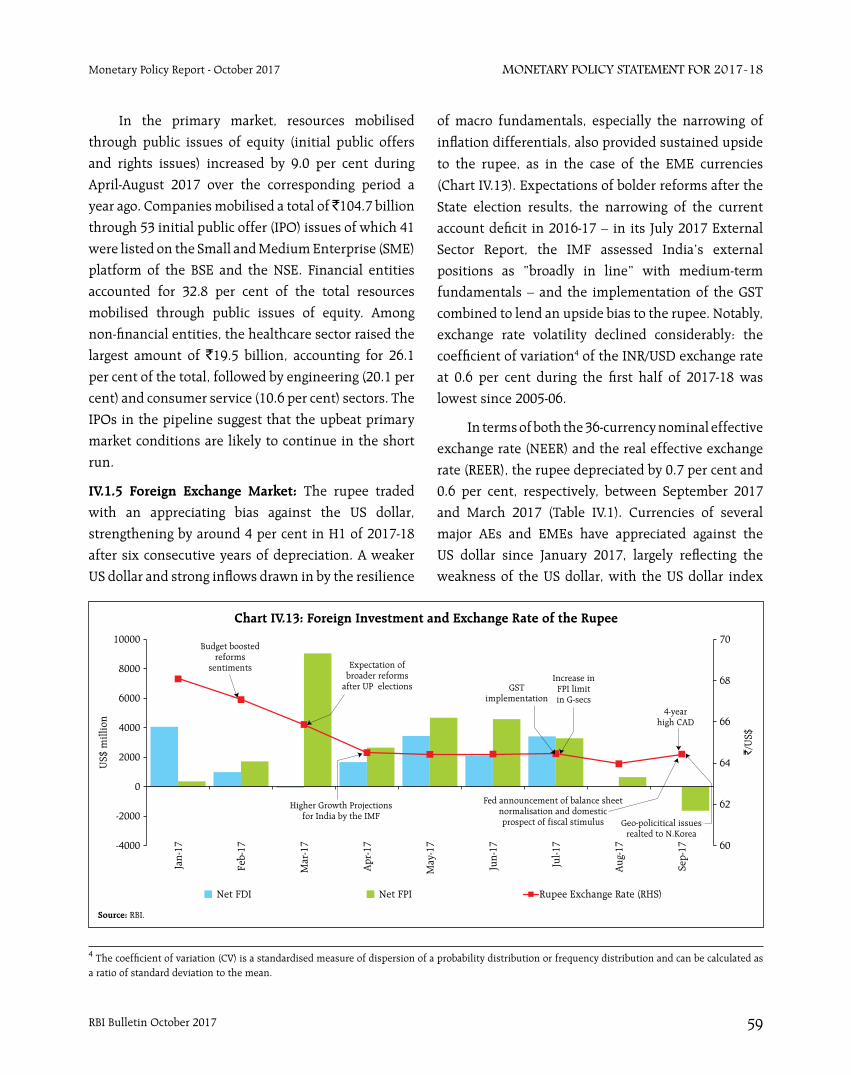
RBI Bulletin October 2017 59
Monetary Policy StateMent for 2017-18Monetary Policy Report - October 2017
In the primary market, resources mobilised
through public issues of equity (initial public offers
and rights issues) increased by 9.0 per cent during
April-August 2017 over the corresponding period a
year ago. Companies mobilised a total of ̀ 104.7 billion
through 53 initial public offer (IPO) issues of which 41
were listed on the Small and Medium Enterprise (SME)
platform of the BSE and the NSE. Financial entities
accounted for 32.8 per cent of the total resources
mobilised through public issues of equity. Among
non-financial entities, the healthcare sector raised the
largest amount of `19.5 billion, accounting for 26.1
per cent of the total, followed by engineering (20.1 per
cent) and consumer service (10.6 per cent) sectors. The
IPOs in the pipeline suggest that the upbeat primary
market conditions are likely to continue in the short
run.
IV.1.5 Foreign Exchange Market: The rupee traded
with an appreciating bias against the US dollar,
strengthening by around 4 per cent in H1 of 2017-18
after six consecutive years of depreciation. A weaker
US dollar and strong inflows drawn in by the resilience
of macro fundamentals, especially the narrowing of
inflation differentials, also provided sustained upside
to the rupee, as in the case of the EME currencies
(Chart IV.13). Expectations of bolder reforms after the
State election results, the narrowing of the current
account deficit in 2016-17 – in its July 2017 External
Sector Report, the IMF assessed India’s external
positions as “broadly in line” with medium-term
fundamentals – and the implementation of the GST
combined to lend an upside bias to the rupee. Notably,
exchange rate volatility declined considerably: the
coefficient of variation4 of the INR/USD exchange rate
at 0.6 per cent during the first half of 2017-18 was
lowest since 2005-06.
In terms of both the 36-currency nominal effective
exchange rate (NEER) and the real effective exchange
rate (REER), the rupee depreciated by 0.7 per cent and
0.6 per cent, respectively, between September 2017
and March 2017 (Table IV.1). Currencies of several
major AEs and EMEs have appreciated against the
US dollar since January 2017, largely reflecting the
weakness of the US dollar, with the US dollar index
4 The coefficient of variation (CV) is a standardised measure of dispersion of a probability distribution or frequency distribution and can be calculated as a ratio of standard deviation to the mean.
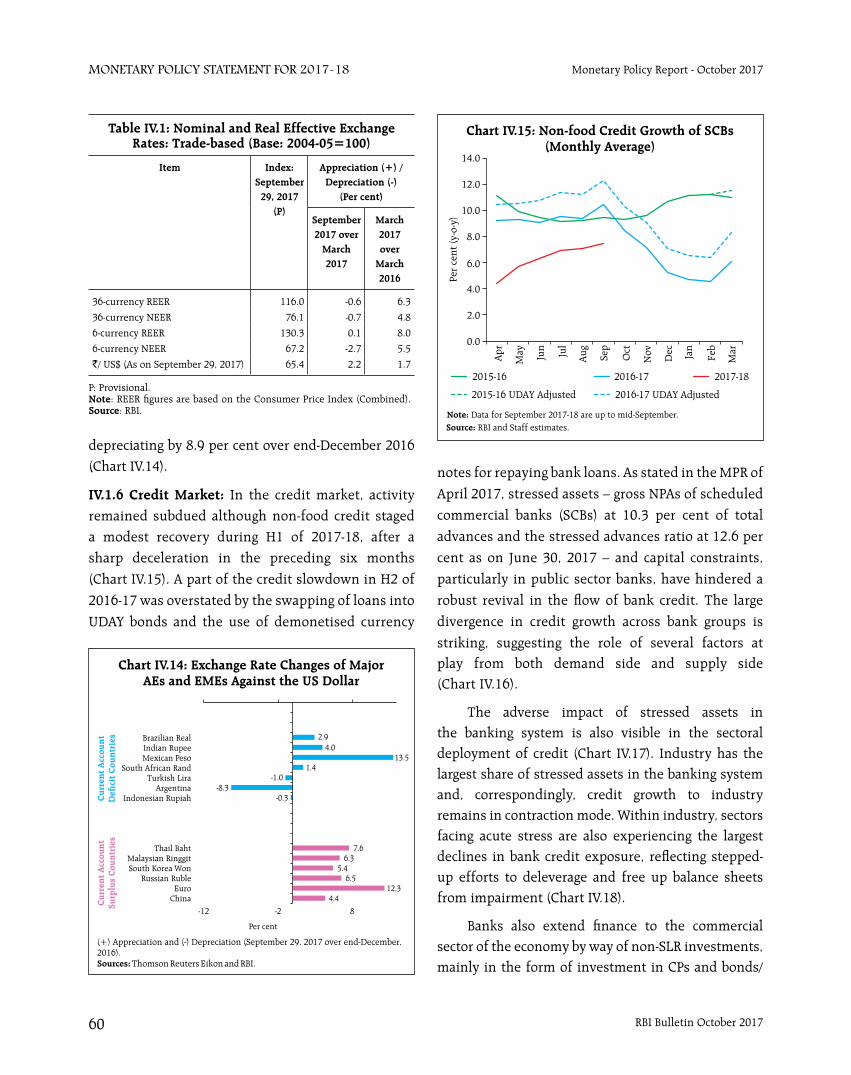
RBI Bulletin October 201760
Monetary Policy StateMent for 2017-18 Monetary Policy Report - October 2017
depreciating by 8.9 per cent over end-December 2016 (Chart IV.14).
IV.1.6 Credit Market: In the credit market, activity remained subdued although non-food credit staged a modest recovery during H1 of 2017-18, after a sharp deceleration in the preceding six months
(Chart IV.15). A part of the credit slowdown in H2 of
2016-17 was overstated by the swapping of loans into
UDAY bonds and the use of demonetised currency
notes for repaying bank loans. As stated in the MPR of
April 2017, stressed assets – gross NPAs of scheduled
commercial banks (SCBs) at 10.3 per cent of total
advances and the stressed advances ratio at 12.6 per
cent as on June 30, 2017 – and capital constraints,
particularly in public sector banks, have hindered a
robust revival in the flow of bank credit. The large
divergence in credit growth across bank groups is
striking, suggesting the role of several factors at play from both demand side and supply side (Chart IV.16).
The adverse impact of stressed assets in the banking system is also visible in the sectoral deployment of credit (Chart IV.17). Industry has the largest share of stressed assets in the banking system and, correspondingly, credit growth to industry remains in contraction mode. Within industry, sectors facing acute stress are also experiencing the largest declines in bank credit exposure, reflecting stepped-up efforts to deleverage and free up balance sheets from impairment (Chart IV.18).
Banks also extend finance to the commercial sector of the economy by way of non-SLR investments, mainly in the form of investment in CPs and bonds/
Table IV.1: Nominal and Real Effective Exchange Rates: Trade-based (Base: 2004-05=100)
Item Index: September
29, 2017 (P)
Appreciation (+) / Depreciation (-)
(Per cent)
September 2017 over
March 2017
March 2017 over
March 2016
36-currency REER 116.0 -0.6 6.3
36-currency NEER 76.1 -0.7 4.8
6-currency REER 130.3 0.1 8.0
6-currency NEER 67.2 -2.7 5.5
`/ US$ (As on September 29, 2017) 65.4 2.2 1.7
P: Provisional.Note: REER figures are based on the Consumer Price Index (Combined).Source: RBI.
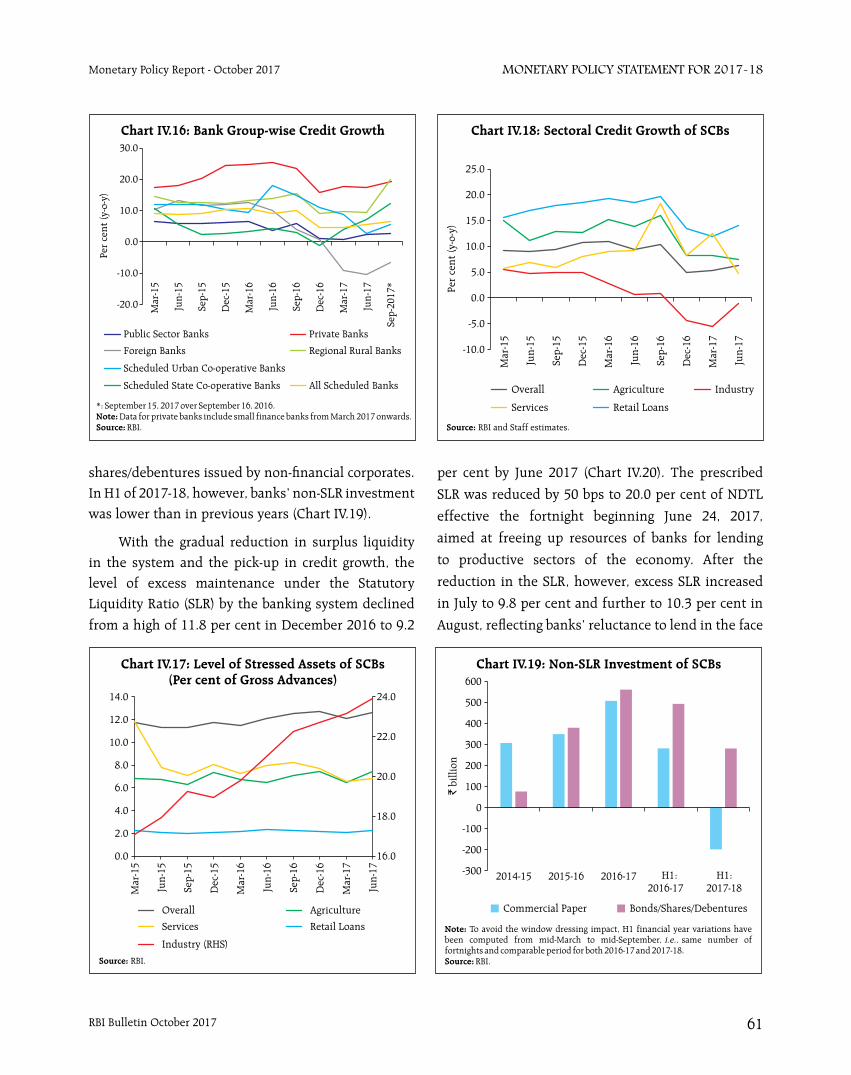
RBI Bulletin October 2017 61
Monetary Policy StateMent for 2017-18Monetary Policy Report - October 2017
shares/debentures issued by non-financial corporates. In H1 of 2017-18, however, banks’ non-SLR investment was lower than in previous years (Chart IV.19).
With the gradual reduction in surplus liquidity in the system and the pick-up in credit growth, the level of excess maintenance under the Statutory Liquidity Ratio (SLR) by the banking system declined
from a high of 11.8 per cent in December 2016 to 9.2
per cent by June 2017 (Chart IV.20). The prescribed
SLR was reduced by 50 bps to 20.0 per cent of NDTL
effective the fortnight beginning June 24, 2017,
aimed at freeing up resources of banks for lending
to productive sectors of the economy. After the
reduction in the SLR, however, excess SLR increased
in July to 9.8 per cent and further to 10.3 per cent in
August, reflecting banks’ reluctance to lend in the face
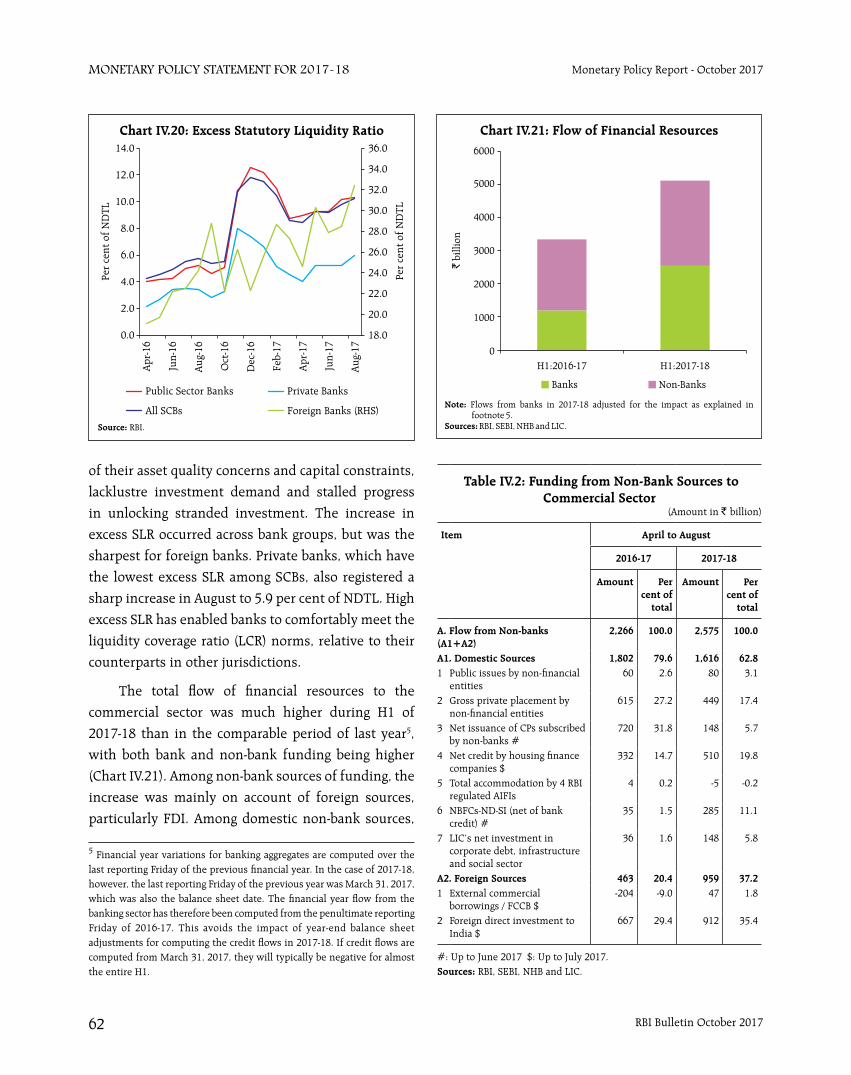
RBI Bulletin October 201762
Monetary Policy StateMent for 2017-18 Monetary Policy Report - October 2017
of their asset quality concerns and capital constraints,
lacklustre investment demand and stalled progress
in unlocking stranded investment. The increase in
excess SLR occurred across bank groups, but was the
sharpest for foreign banks. Private banks, which have
the lowest excess SLR among SCBs, also registered a
sharp increase in August to 5.9 per cent of NDTL. High
excess SLR has enabled banks to comfortably meet the
liquidity coverage ratio (LCR) norms, relative to their
counterparts in other jurisdictions.
The total flow of financial resources to the
commercial sector was much higher during H1 of
2017-18 than in the comparable period of last year5,
with both bank and non-bank funding being higher
(Chart IV.21). Among non-bank sources of funding, the
increase was mainly on account of foreign sources,
particularly FDI. Among domestic non-bank sources,
Table IV.2: Funding from Non-Bank Sources to Commercial Sector
(Amount in ` billion)
Item April to August
2016-17 2017-18
Amount Per cent of
total
Amount Per cent of
total
A. Flow from Non-banks (A1+A2)
2,266 100.0 2,575 100.0
A1. Domestic Sources 1,802 79.6 1,616 62.81 Public issues by non-financial
entities60 2.6 80 3.1
2 Gross private placement by non-financial entities
615 27.2 449 17.4
3 Net issuance of CPs subscribed by non-banks #
720 31.8 148 5.7
4 Net credit by housing finance companies $
332 14.7 510 19.8
5 Total accommodation by 4 RBI regulated AIFIs
4 0.2 -5 -0.2
6 NBFCs-ND-SI (net of bank credit) #
35 1.5 285 11.1
7 LIC’s net investment in corporate debt, infrastructure and social sector
36 1.6 148 5.8
A2. Foreign Sources 463 20.4 959 37.21 External commercial
borrowings / FCCB $-204 -9.0 47 1.8
2 Foreign direct investment to India $
667 29.4 912 35.4
#: Up to June 2017 $: Up to July 2017. Sources: RBI, SEBI, NHB and LIC.
5 Financial year variations for banking aggregates are computed over the last reporting Friday of the previous financial year. In the case of 2017-18, however, the last reporting Friday of the previous year was March 31, 2017, which was also the balance sheet date. The financial year flow from the banking sector has therefore been computed from the penultimate reporting Friday of 2016-17. This avoids the impact of year-end balance sheet adjustments for computing the credit flows in 2017-18. If credit flows are computed from March 31, 2017, they will typically be negative for almost the entire H1.
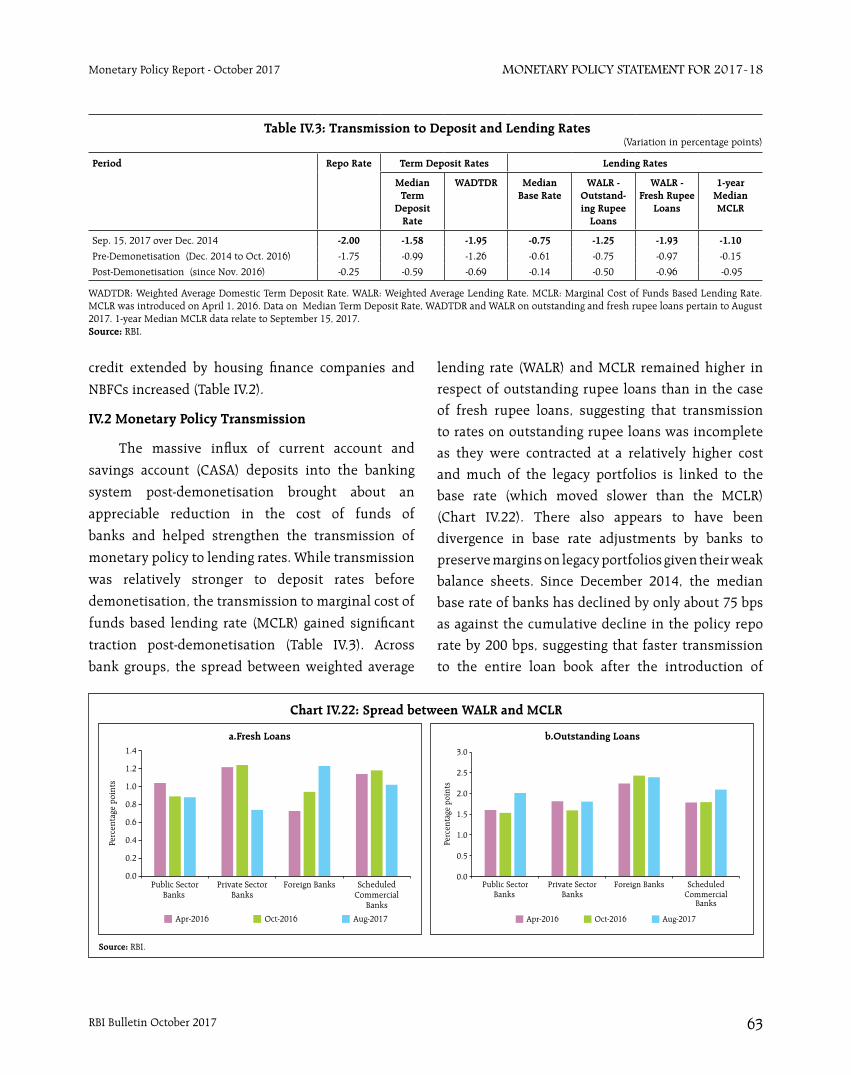
RBI Bulletin October 2017 63
Monetary Policy StateMent for 2017-18Monetary Policy Report - October 2017
credit extended by housing finance companies and
NBFCs increased (Table IV.2).
IV.2 Monetary Policy Transmission
The massive influx of current account and
savings account (CASA) deposits into the banking
system post-demonetisation brought about an
appreciable reduction in the cost of funds of
banks and helped strengthen the transmission of
monetary policy to lending rates. While transmission
was relatively stronger to deposit rates before
demonetisation, the transmission to marginal cost of
funds based lending rate (MCLR) gained significant
traction post-demonetisation (Table IV.3). Across
bank groups, the spread between weighted average
lending rate (WALR) and MCLR remained higher in
respect of outstanding rupee loans than in the case
of fresh rupee loans, suggesting that transmission
to rates on outstanding rupee loans was incomplete
as they were contracted at a relatively higher cost
and much of the legacy portfolios is linked to the
base rate (which moved slower than the MCLR)
(Chart IV.22). There also appears to have been
divergence in base rate adjustments by banks to
preserve margins on legacy portfolios given their weak
balance sheets. Since December 2014, the median
base rate of banks has declined by only about 75 bps
as against the cumulative decline in the policy repo
rate by 200 bps, suggesting that faster transmission
to the entire loan book after the introduction of
Table IV.3: Transmission to Deposit and Lending Rates(Variation in percentage points)
Period Repo Rate Term Deposit Rates Lending Rates
Median Term
Deposit Rate
WADTDR Median Base Rate
WALR - Outstand-ing Rupee
Loans
WALR - Fresh Rupee
Loans
1-year Median MCLR
Sep. 15, 2017 over Dec. 2014 -2.00 -1.58 -1.95 -0.75 -1.25 -1.93 -1.10
Pre-Demonetisation (Dec. 2014 to Oct. 2016) -1.75 -0.99 -1.26 -0.61 -0.75 -0.97 -0.15
Post-Demonetisation (since Nov. 2016) -0.25 -0.59 -0.69 -0.14 -0.50 -0.96 -0.95
WADTDR: Weighted Average Domestic Term Deposit Rate. WALR: Weighted Average Lending Rate. MCLR: Marginal Cost of Funds Based Lending Rate. MCLR was introduced on April 1, 2016. Data on Median Term Deposit Rate, WADTDR and WALR on outstanding and fresh rupee loans pertain to August 2017. 1-year Median MCLR data relate to September 15, 2017.Source: RBI.
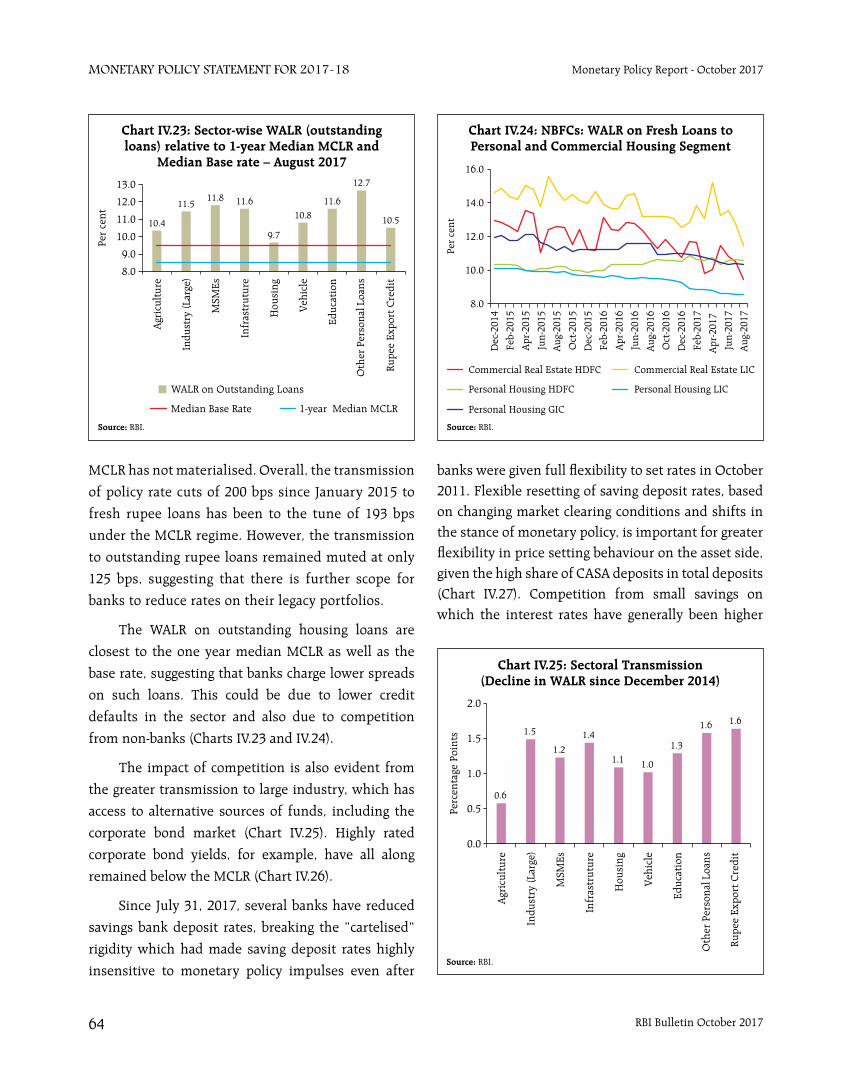
RBI Bulletin October 201764
Monetary Policy StateMent for 2017-18 Monetary Policy Report - October 2017
MCLR has not materialised. Overall, the transmission
of policy rate cuts of 200 bps since January 2015 to
fresh rupee loans has been to the tune of 193 bps
under the MCLR regime. However, the transmission
to outstanding rupee loans remained muted at only
125 bps, suggesting that there is further scope for
banks to reduce rates on their legacy portfolios.
The WALR on outstanding housing loans are
closest to the one year median MCLR as well as the
base rate, suggesting that banks charge lower spreads
on such loans. This could be due to lower credit
defaults in the sector and also due to competition
from non-banks (Charts IV.23 and IV.24).
The impact of competition is also evident from
the greater transmission to large industry, which has
access to alternative sources of funds, including the
corporate bond market (Chart IV.25). Highly rated
corporate bond yields, for example, have all along
remained below the MCLR (Chart IV.26).
Since July 31, 2017, several banks have reduced
savings bank deposit rates, breaking the “cartelised”
rigidity which had made saving deposit rates highly
insensitive to monetary policy impulses even after
banks were given full flexibility to set rates in October 2011. Flexible resetting of saving deposit rates, based on changing market clearing conditions and shifts in the stance of monetary policy, is important for greater flexibility in price setting behaviour on the asset side, given the high share of CASA deposits in total deposits (Chart IV.27). Competition from small savings on which the interest rates have generally been higher
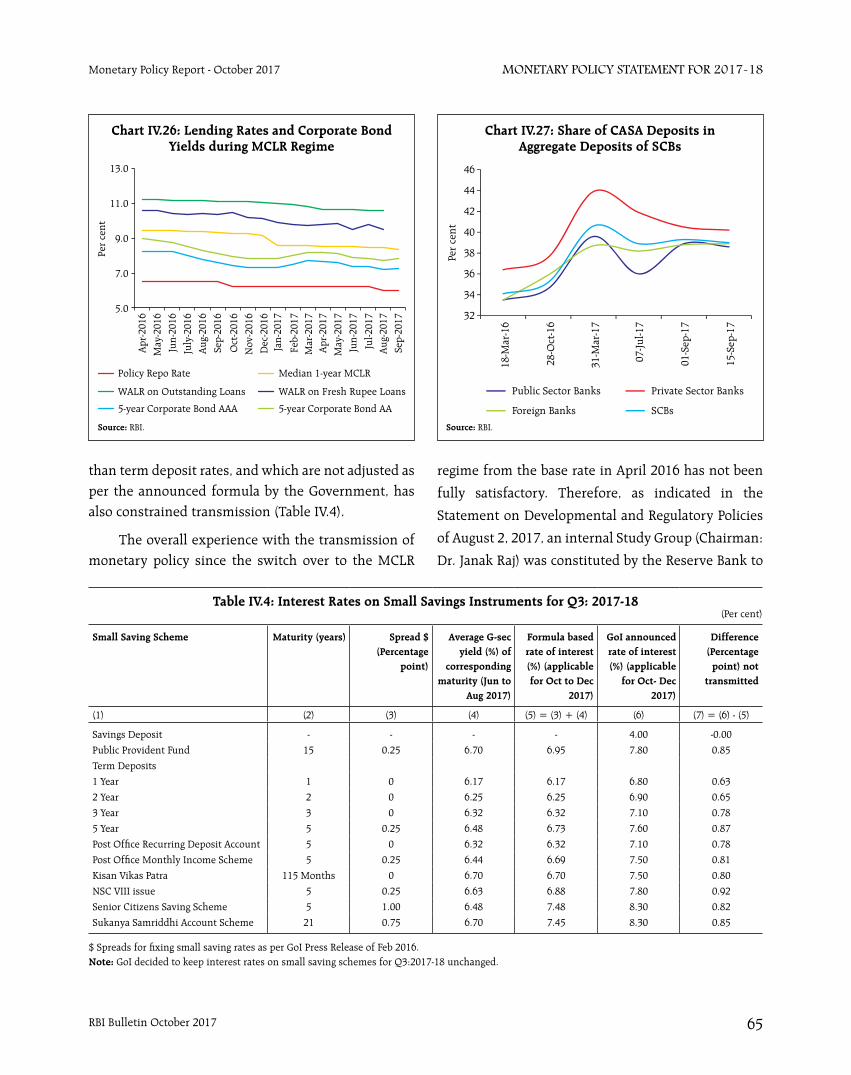
RBI Bulletin October 2017 65
Monetary Policy StateMent for 2017-18Monetary Policy Report - October 2017
than term deposit rates, and which are not adjusted as per the announced formula by the Government, has also constrained transmission (Table IV.4).
The overall experience with the transmission of monetary policy since the switch over to the MCLR
regime from the base rate in April 2016 has not been
fully satisfactory. Therefore, as indicated in the
Statement on Developmental and Regulatory Policies
of August 2, 2017, an internal Study Group (Chairman:
Dr. Janak Raj) was constituted by the Reserve Bank to
Table IV.4: Interest Rates on Small Savings Instruments for Q3: 2017-18(Per cent)
Small Saving Scheme Maturity (years) Spread $ (Percentage
point)
Average G-sec yield (%) of
corresponding maturity (Jun to
Aug 2017)
Formula based rate of interest (%) (applicable for Oct to Dec
2017)
GoI announced rate of interest (%) (applicable
for Oct- Dec 2017)
Difference (Percentage
point) not transmitted
(1) (2) (3) (4) (5) = (3) + (4) (6) (7) = (6) - (5)
Savings Deposit - - - - 4.00 -0.00
Public Provident Fund 15 0.25 6.70 6.95 7.80 0.85
Term Deposits
1 Year 1 0 6.17 6.17 6.80 0.63
2 Year 2 0 6.25 6.25 6.90 0.65
3 Year 3 0 6.32 6.32 7.10 0.78
5 Year 5 0.25 6.48 6.73 7.60 0.87
Post Office Recurring Deposit Account 5 0 6.32 6.32 7.10 0.78
Post Office Monthly Income Scheme 5 0.25 6.44 6.69 7.50 0.81
Kisan Vikas Patra 115 Months 0 6.70 6.70 7.50 0.80
NSC VIII issue 5 0.25 6.63 6.88 7.80 0.92
Senior Citizens Saving Scheme 5 1.00 6.48 7.48 8.30 0.82
Sukanya Samriddhi Account Scheme 21 0.75 6.70 7.45 8.30 0.85
$ Spreads for fixing small saving rates as per GoI Press Release of Feb 2016.Note: GoI decided to keep interest rates on small saving schemes for Q3:2017-18 unchanged.
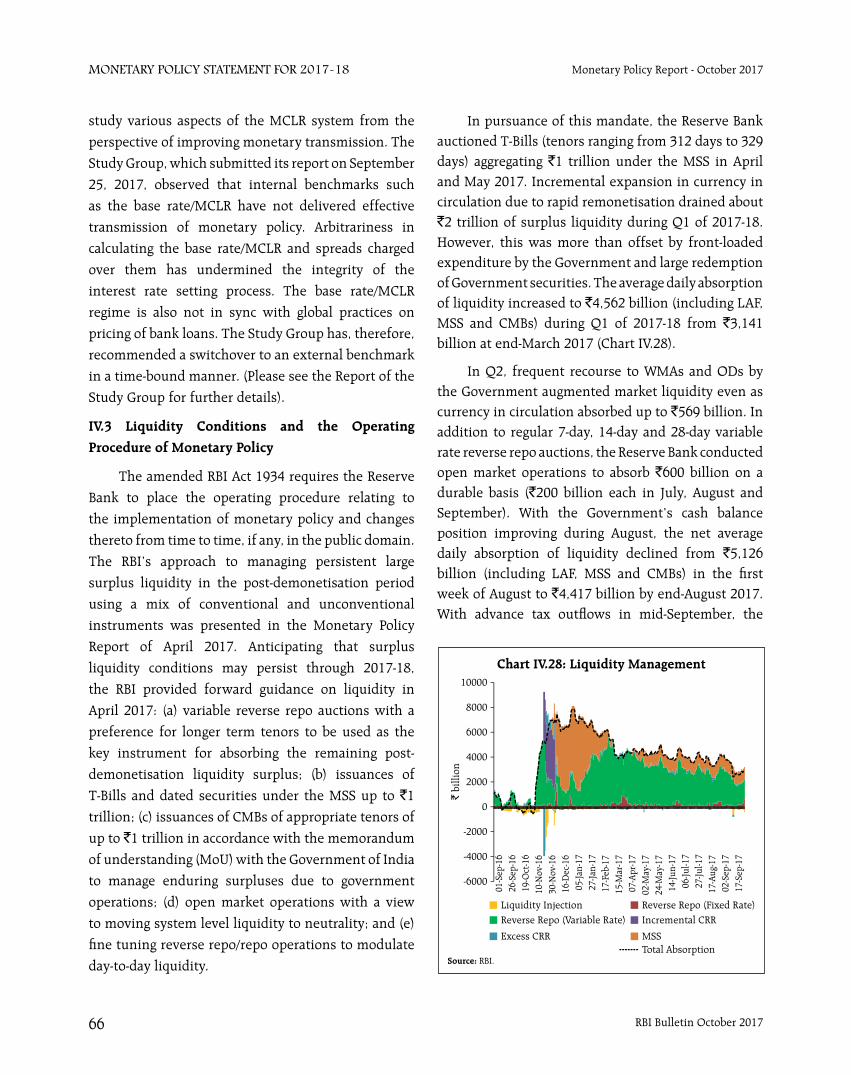
RBI Bulletin October 201766
Monetary Policy StateMent for 2017-18 Monetary Policy Report - October 2017
study various aspects of the MCLR system from the
perspective of improving monetary transmission. The
Study Group, which submitted its report on September
25, 2017, observed that internal benchmarks such
as the base rate/MCLR have not delivered effective
transmission of monetary policy. Arbitrariness in
calculating the base rate/MCLR and spreads charged
over them has undermined the integrity of the
interest rate setting process. The base rate/MCLR
regime is also not in sync with global practices on
pricing of bank loans. The Study Group has, therefore,
recommended a switchover to an external benchmark
in a time-bound manner. (Please see the Report of the
Study Group for further details).
IV.3 Liquidity Conditions and the Operating Procedure of Monetary Policy
The amended RBI Act 1934 requires the Reserve
Bank to place the operating procedure relating to
the implementation of monetary policy and changes
thereto from time to time, if any, in the public domain.
The RBI’s approach to managing persistent large
surplus liquidity in the post-demonetisation period
using a mix of conventional and unconventional
instruments was presented in the Monetary Policy
Report of April 2017. Anticipating that surplus
liquidity conditions may persist through 2017-18,
the RBI provided forward guidance on liquidity in
April 2017: (a) variable reverse repo auctions with a
preference for longer term tenors to be used as the
key instrument for absorbing the remaining post-
demonetisation liquidity surplus; (b) issuances of
T-Bills and dated securities under the MSS up to `1
trillion; (c) issuances of CMBs of appropriate tenors of
up to `1 trillion in accordance with the memorandum
of understanding (MoU) with the Government of India
to manage enduring surpluses due to government
operations; (d) open market operations with a view
to moving system level liquidity to neutrality; and (e)
fine tuning reverse repo/repo operations to modulate
day-to-day liquidity.
In pursuance of this mandate, the Reserve Bank auctioned T-Bills (tenors ranging from 312 days to 329 days) aggregating `1 trillion under the MSS in April and May 2017. Incremental expansion in currency in circulation due to rapid remonetisation drained about `2 trillion of surplus liquidity during Q1 of 2017-18. However, this was more than offset by front-loaded expenditure by the Government and large redemption of Government securities. The average daily absorption of liquidity increased to `4,562 billion (including LAF, MSS and CMBs) during Q1 of 2017-18 from `3,141 billion at end-March 2017 (Chart IV.28).
In Q2, frequent recourse to WMAs and ODs by the Government augmented market liquidity even as currency in circulation absorbed up to `569 billion. In addition to regular 7-day, 14-day and 28-day variable rate reverse repo auctions, the Reserve Bank conducted open market operations to absorb `600 billion on a durable basis (`200 billion each in July, August and September). With the Government’s cash balance position improving during August, the net average daily absorption of liquidity declined from `5,126 billion (including LAF, MSS and CMBs) in the first week of August to `4,417 billion by end-August 2017. With advance tax outflows in mid-September, the
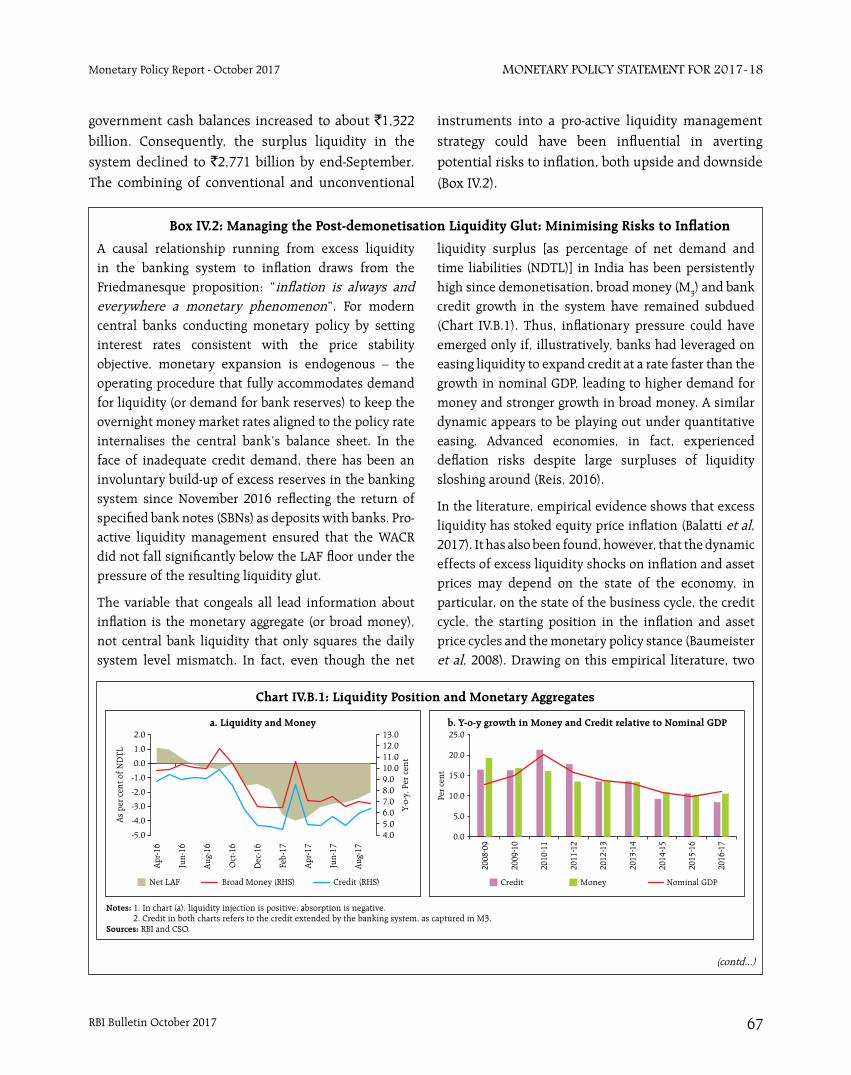
RBI Bulletin October 2017 67
Monetary Policy StateMent for 2017-18Monetary Policy Report - October 2017
A causal relationship running from excess liquidity in the banking system to inflation draws from the Friedmanesque proposition: “inflation is always and everywhere a monetary phenomenon”. For modern central banks conducting monetary policy by setting interest rates consistent with the price stability objective, monetary expansion is endogenous – the operating procedure that fully accommodates demand for liquidity (or demand for bank reserves) to keep the overnight money market rates aligned to the policy rate internalises the central bank’s balance sheet. In the face of inadequate credit demand, there has been an involuntary build-up of excess reserves in the banking system since November 2016 reflecting the return of specified bank notes (SBNs) as deposits with banks. Pro-active liquidity management ensured that the WACR did not fall significantly below the LAF floor under the pressure of the resulting liquidity glut.
The variable that congeals all lead information about inflation is the monetary aggregate (or broad money), not central bank liquidity that only squares the daily system level mismatch. In fact, even though the net
Box IV.2: Managing the Post-demonetisation Liquidity Glut: Minimising Risks to Inflation
liquidity surplus [as percentage of net demand and time liabilities (NDTL)] in India has been persistently high since demonetisation, broad money (M3) and bank credit growth in the system have remained subdued (Chart IV.B.1). Thus, inflationary pressure could have emerged only if, illustratively, banks had leveraged on easing liquidity to expand credit at a rate faster than the growth in nominal GDP, leading to higher demand for money and stronger growth in broad money. A similar dynamic appears to be playing out under quantitative easing. Advanced economies, in fact, experienced deflation risks despite large surpluses of liquidity sloshing around (Reis, 2016).
In the literature, empirical evidence shows that excess liquidity has stoked equity price inflation (Balatti et al, 2017). It has also been found, however, that the dynamic effects of excess liquidity shocks on inflation and asset prices may depend on the state of the economy, in particular, on the state of the business cycle, the credit cycle, the starting position in the inflation and asset price cycles and the monetary policy stance (Baumeister et al, 2008). Drawing on this empirical literature, two
(contd...)
government cash balances increased to about `1,322 billion. Consequently, the surplus liquidity in the system declined to `2,771 billion by end-September. The combining of conventional and unconventional
instruments into a pro-active liquidity management strategy could have been influential in averting potential risks to inflation, both upside and downside
(Box IV.2).
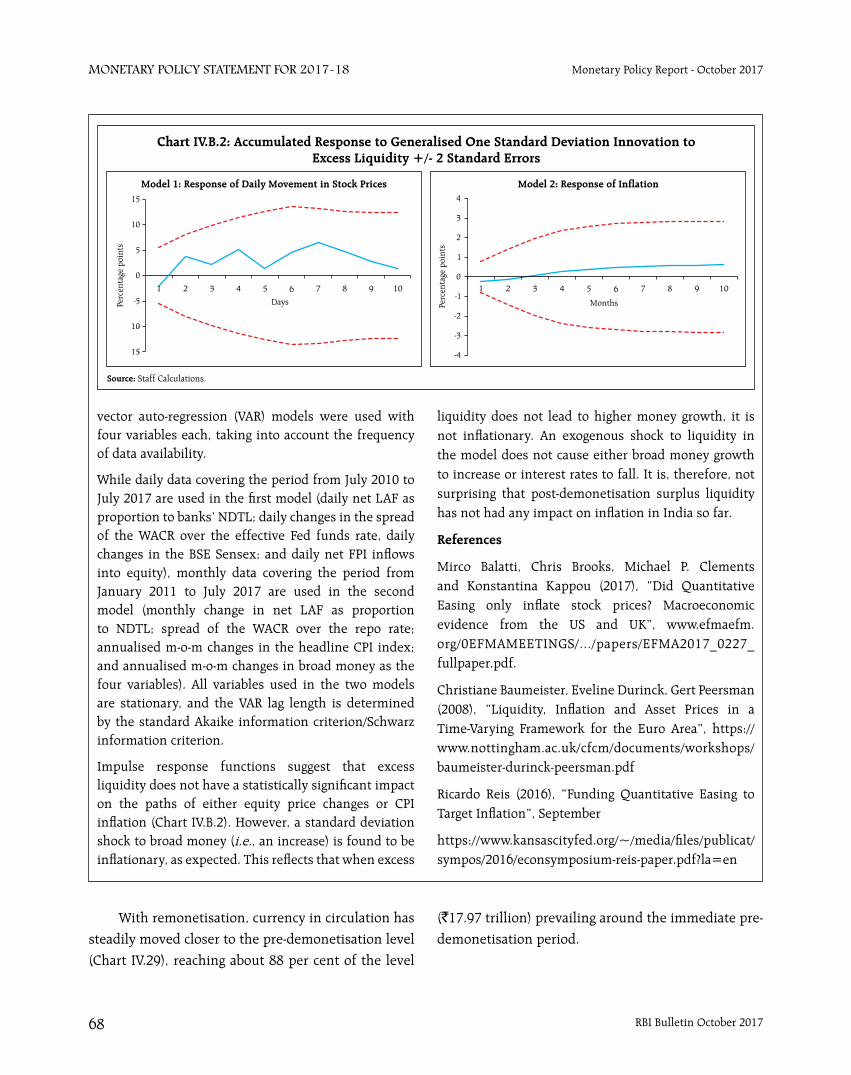
RBI Bulletin October 201768
Monetary Policy StateMent for 2017-18 Monetary Policy Report - October 2017
vector auto-regression (VAR) models were used with four variables each, taking into account the frequency of data availability.
While daily data covering the period from July 2010 to July 2017 are used in the first model (daily net LAF as proportion to banks’ NDTL; daily changes in the spread of the WACR over the effective Fed funds rate, daily changes in the BSE Sensex; and daily net FPI inflows into equity), monthly data covering the period from January 2011 to July 2017 are used in the second model (monthly change in net LAF as proportion to NDTL; spread of the WACR over the repo rate; annualised m-o-m changes in the headline CPI index; and annualised m-o-m changes in broad money as the four variables). All variables used in the two models are stationary, and the VAR lag length is determined by the standard Akaike information criterion/Schwarz information criterion.
Impulse response functions suggest that excess liquidity does not have a statistically significant impact on the paths of either equity price changes or CPI inflation (Chart IV.B.2). However, a standard deviation shock to broad money (i.e., an increase) is found to be inflationary, as expected. This reflects that when excess
liquidity does not lead to higher money growth, it is not inflationary. An exogenous shock to liquidity in the model does not cause either broad money growth to increase or interest rates to fall. It is, therefore, not surprising that post-demonetisation surplus liquidity has not had any impact on inflation in India so far.
References
Mirco Balatti, Chris Brooks, Michael P. Clements and Konstantina Kappou (2017), “Did Quantitative Easing only inflate stock prices? Macroeconomic evidence from the US and UK”, www.efmaefm.org/0EFMAMEETINGS/.../papers/EFMA2017_0227_fullpaper.pdf.
Christiane Baumeister, Eveline Durinck, Gert Peersman (2008), “Liquidity, Inflation and Asset Prices in a Time-Varying Framework for the Euro Area”, https://www.nottingham.ac.uk/cfcm/documents/workshops/baumeister-durinck-peersman.pdf
Ricardo Reis (2016), “Funding Quantitative Easing to Target Inflation”, September
https://www.kansascityfed.org/~/media/files/publicat/sympos/2016/econsymposium-reis-paper.pdf?la=en
With remonetisation, currency in circulation has
steadily moved closer to the pre-demonetisation level
(Chart IV.29), reaching about 88 per cent of the level
(`17.97 trillion) prevailing around the immediate pre-
demonetisation period.
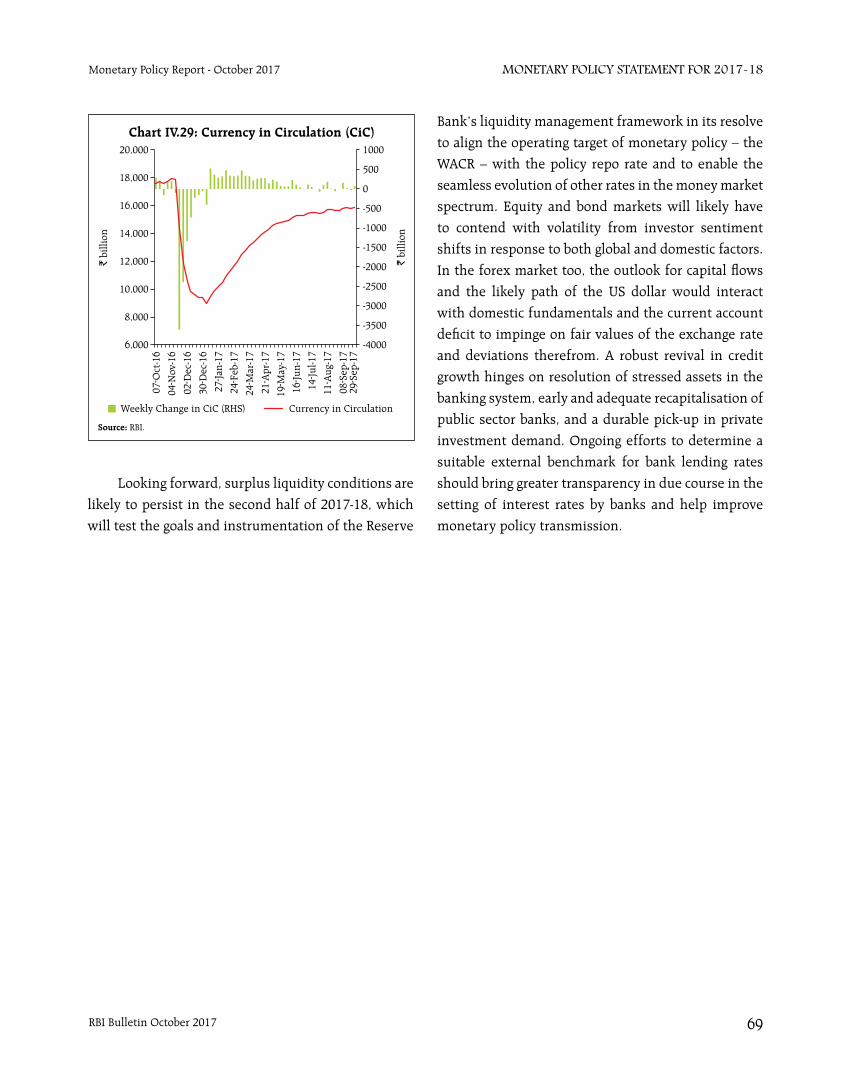
RBI Bulletin October 2017 69
Monetary Policy StateMent for 2017-18Monetary Policy Report - October 2017
Bank’s liquidity management framework in its resolve
to align the operating target of monetary policy – the
WACR – with the policy repo rate and to enable the
seamless evolution of other rates in the money market
spectrum. Equity and bond markets will likely have
to contend with volatility from investor sentiment
shifts in response to both global and domestic factors.
In the forex market too, the outlook for capital flows
and the likely path of the US dollar would interact
with domestic fundamentals and the current account
deficit to impinge on fair values of the exchange rate
and deviations therefrom. A robust revival in credit
growth hinges on resolution of stressed assets in the
banking system, early and adequate recapitalisation of
public sector banks, and a durable pick-up in private
investment demand. Ongoing efforts to determine a
suitable external benchmark for bank lending rates
should bring greater transparency in due course in the
setting of interest rates by banks and help improve
monetary policy transmission.
Looking forward, surplus liquidity conditions are
likely to persist in the second half of 2017-18, which
will test the goals and instrumentation of the Reserve
RBI Bulletin October 201770
Monetary Policy StateMent for 2017-18 Monetary Policy Report - October 2017
Global growth has broadened to encompass several advanced and emerging market economies. World trade has also picked up and is likely to outpace global GDP growth. Inflationary pressures remain subdued across geographies, supported by soft commodity prices.
Since the MPR of April 2017, global growth has
strengthened, spreading to several AEs and some
commodity exporting EMEs as well, lifting the latter
out of recession. Global trade has been buoyed by
gradually firming demand, and exports and imports
have risen in several economies. Crude prices have
firmed up in Q3 on the easing supply glut. Metal prices
have rallied, fuelled by resurgent Chinese demand,
but have moderated in recent weeks. Growing risk
appetite for financial assets led to a fall in bullion
prices to multi-month lows, before a recent rally in
September. Inflation remains below target levels in
many AEs and subdued across several EMEs.
International financial markets have been
buoyed by these global growth prospects and the
accommodative monetary policy stance in major AEs.
Financial markets have remained resilient to geo-
political events and more recently to the US Fed’s
decision to reduce the size of its balance sheet. Equity
markets rallied in most AEs, while some correction has
been witnessed in a few EMEs. Bond yields in major
AEs hardened on expectations of monetary policy
normalisation, but generally declined in EMEs with
softening inflation and neutral or accommodative
policy rates. The US dollar weakened to a multi-month
low in September, while the euro rallied further.
Movements in EME currencies were mixed but with a
general tendency to appreciate.
V.1 Global Economic Conditions
The US economy expanded at a solid pace in
Q2 after a weak performance in Q1. Buoyant labour
market conditions, upbeat consumer confidence,
softer than expected inflation and a robust housing
market supported consumer spending. Industrial
production showed an upswing, while non-
residential investment growth made a turnaround.
Retail sales and business spending suggest that the
growth momentum has been sustained in early Q3.
However, recent hurricanes could temporarily weigh
on economic activity.
In the Euro area, economic recovery has gained
traction and broadened across constituent economies.
GDP growth in Q2 improved over and above the
relatively strong outturn in Q1. Unemployment
fell consistently, and retail sales rose, lifting both
business and consumer sentiment. Strengthening
external demand and receding political uncertainty in
the region supported the recovery.
In Japan, economic expansion accelerated
in Q2 from its modest pace in the previous five
quarters. Domestic demand – both consumption and
investment – rose to a three-year peak. In spite of a
weak currency and stronger global demand, net exports
turned negative as imports rose, indicating resilient
domestic activity. Industrial production accelerated
and the labour market steadily tightened, even as
financial conditions remained highly accommodative
(Table V.1).
Among EMEs, some convergence in growth
dynamics took place during H1:2017 as the economic
performance of large commodity exporting economies
and of several middle-income countries picked up.
In China, growth regained some lost momentum in
Q2, supported by fiscal stimulus and growing global
demand. However, investment slowed down as
lending costs rose and the property market cooled
off, though manufacturing continued to expand
in spite of tighter financial conditions. China’s
debt-fuelled growth remains a potential source of
financial instability, triggering a rating downgrade
by S&P Global Ratings for the first time since 1999.
V. External Environment
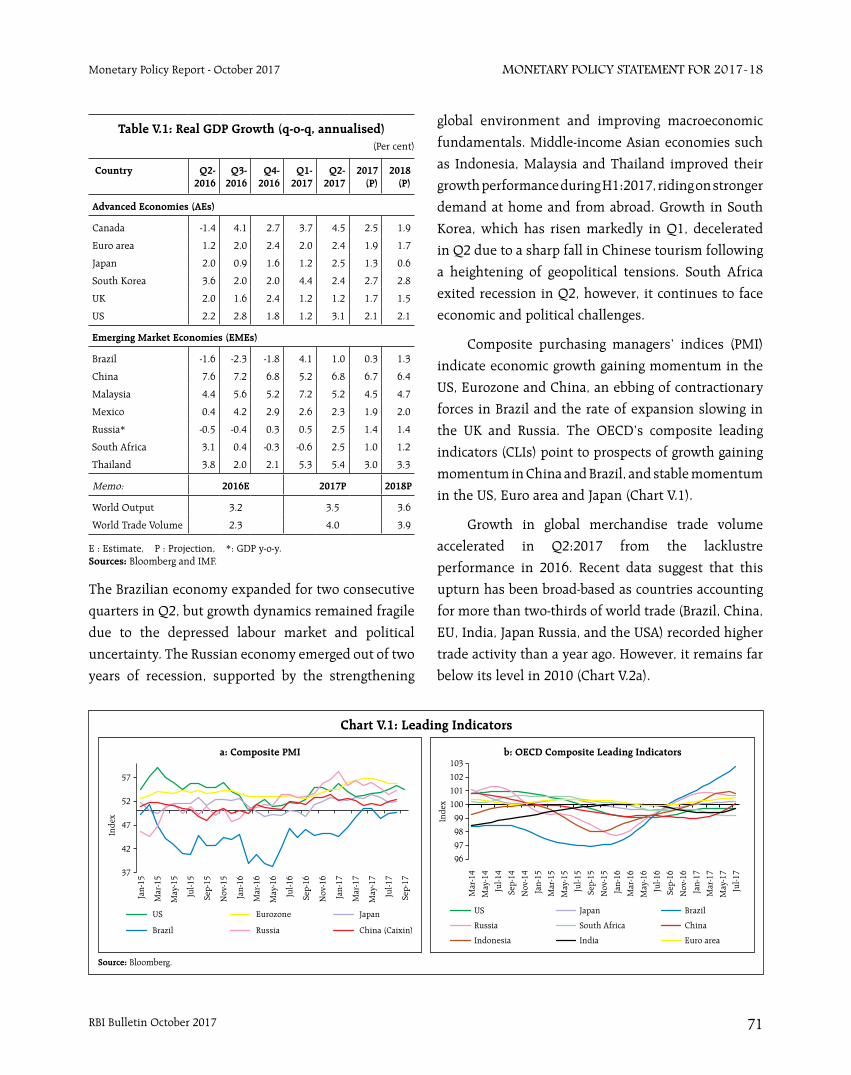
RBI Bulletin October 2017 71
Monetary Policy StateMent for 2017-18Monetary Policy Report - October 2017
The Brazilian economy expanded for two consecutive
quarters in Q2, but growth dynamics remained fragile
due to the depressed labour market and political
uncertainty. The Russian economy emerged out of two
years of recession, supported by the strengthening
global environment and improving macroeconomic
fundamentals. Middle-income Asian economies such
as Indonesia, Malaysia and Thailand improved their
growth performance during H1:2017, riding on stronger
demand at home and from abroad. Growth in South
Korea, which has risen markedly in Q1, decelerated
in Q2 due to a sharp fall in Chinese tourism following
a heightening of geopolitical tensions. South Africa
exited recession in Q2, however, it continues to face
economic and political challenges.
Composite purchasing managers’ indices (PMI)
indicate economic growth gaining momentum in the
US, Eurozone and China, an ebbing of contractionary
forces in Brazil and the rate of expansion slowing in
the UK and Russia. The OECD’s composite leading
indicators (CLIs) point to prospects of growth gaining
momentum in China and Brazil, and stable momentum
in the US, Euro area and Japan (Chart V.1).
Growth in global merchandise trade volume
accelerated in Q2:2017 from the lacklustre
performance in 2016. Recent data suggest that this
upturn has been broad-based as countries accounting
for more than two-thirds of world trade (Brazil, China,
EU, India, Japan Russia, and the USA) recorded higher
trade activity than a year ago. However, it remains far
below its level in 2010 (Chart V.2a).
Table V.1: Real GDP Growth (q-o-q, annualised)(Per cent)
Country Q2-2016
Q3-2016
Q4-2016
Q1-2017
Q2-2017
2017 (P)
2018 (P)
Advanced Economies (AEs)
Canada -1.4 4.1 2.7 3.7 4.5 2.5 1.9
Euro area 1.2 2.0 2.4 2.0 2.4 1.9 1.7
Japan 2.0 0.9 1.6 1.2 2.5 1.3 0.6
South Korea 3.6 2.0 2.0 4.4 2.4 2.7 2.8
UK 2.0 1.6 2.4 1.2 1.2 1.7 1.5
US 2.2 2.8 1.8 1.2 3.1 2.1 2.1
Emerging Market Economies (EMEs)
Brazil -1.6 -2.3 -1.8 4.1 1.0 0.3 1.3
China 7.6 7.2 6.8 5.2 6.8 6.7 6.4
Malaysia 4.4 5.6 5.2 7.2 5.2 4.5 4.7
Mexico 0.4 4.2 2.9 2.6 2.3 1.9 2.0
Russia* -0.5 -0.4 0.3 0.5 2.5 1.4 1.4
South Africa 3.1 0.4 -0.3 -0.6 2.5 1.0 1.2
Thailand 3.8 2.0 2.1 5.3 5.4 3.0 3.3
Memo: 2016E 2017P 2018P
World Output 3.2 3.5 3.6
World Trade Volume 2.3 4.0 3.9
E : Estimate, P : Projection, *: GDP y-o-y. Sources: Bloomberg and IMF.

RBI Bulletin October 201772
Monetary Policy StateMent for 2017-18 Monetary Policy Report - October 2017
Services trade registered some deceleration in
Q2:2017 in major economies (Chart V2.b), except
the US. The World Trade Outlook Indicator (WTOI)
of the World Trade Organisation (WTO) points to a
modest pick-up in global services trade in Q3:2017.
According to the WTO, this would crucially depend
on the performance of travel, financial and business
services, though the recovery in merchandise trade
could also provide some impetus. Multilateral
organisations, viz., the IMF, the World Bank and the
WTO project global trade volume rising in 2017 and
2018. However, major economies could face a tough
policy environment with the imposition of Section
301 of US trade law that allows unilateral imposition
of tariffs which, in turn, could attract geopolitical and
retaliatory repercussions.
V.2 Commodity Prices and Global Inflation
Global commodity prices were affected by
demand and supply imbalances, geopolitical tensions
and commodity-specific factors, including weather
conditions in respect of agricultural commodities.
Commodity prices measured by the Bloomberg
commodity index declined by 1.0 per cent during
April to September 2017, despite some pick-up in late
June-July on the upsurge in Chinese demand. Crude
oil prices declined by over 8.0 percent in Q2:2017 on
account of high inventories, though supply cuts agreed
by the OPEC led to some firming up in May. In late Q3,
Brent crude prices hit a two-year high in September
due to OPEC cuts, declining US crude oil inventories,
adverse climatic conditions and geo-political concerns
(Chart V.3). Although the recent hurricanes in the US
have not impacted crude and gasoline production,
the slowdown in localised refinery activity did cause
supply disruptions for a short duration.
Base metal prices rose by 10.1 per cent during
April to September 2017, led by copper, zinc, nickel,
aluminium and tin, while prices of iron declined.
Metal prices, particularly of copper, have rallied
since mid-July, driven by increased demand from
China where production itself was disrupted as a
fallout of environmental inspections, however, some
moderation was witnessed in recent weeks.
Gold and silver prices fell by about 1 per cent and
9 per cent, respectively, during Q2:2017 on increased
risk appetite that reduced safe haven demand and also
due to the weaker US dollar. During Q3:2017, precious
metal prices, particularly of gold, have shown some
recovery, hitting a 12-month high as tensions sparked
between the US and North Korea.
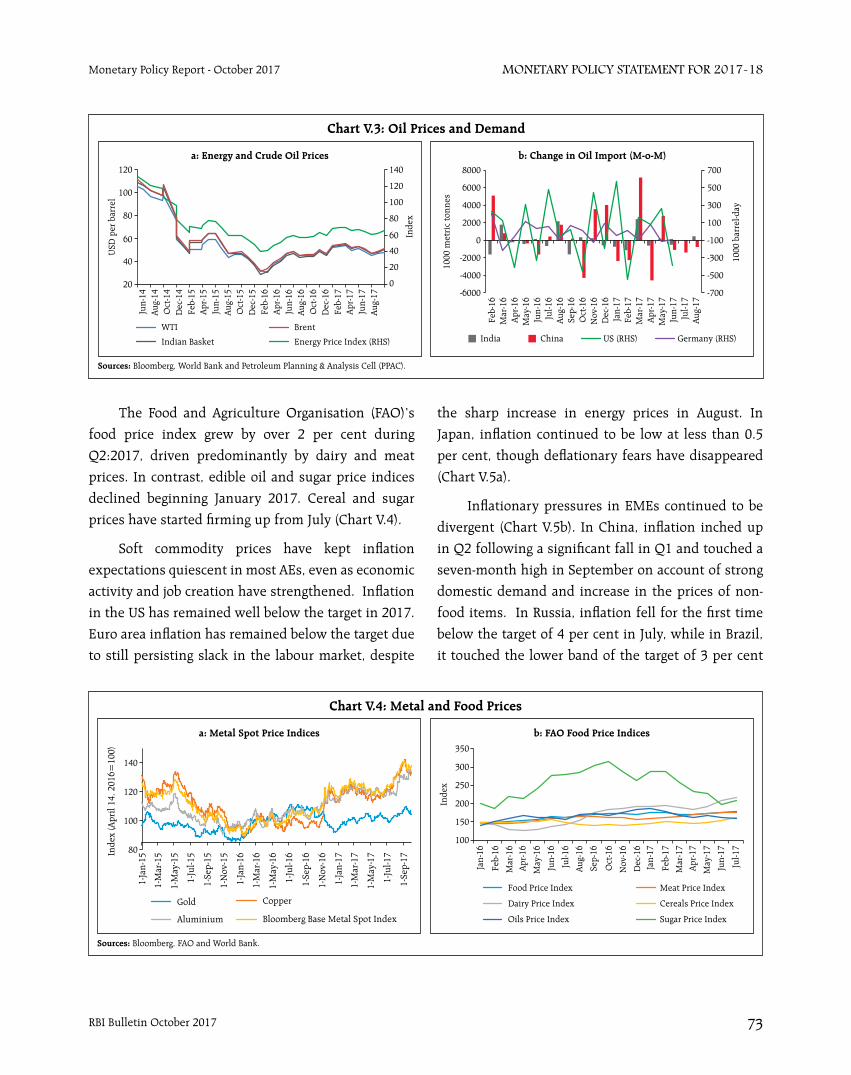
RBI Bulletin October 2017 73
Monetary Policy StateMent for 2017-18Monetary Policy Report - October 2017
The Food and Agriculture Organisation (FAO)’s
food price index grew by over 2 per cent during
Q2:2017, driven predominantly by dairy and meat
prices. In contrast, edible oil and sugar price indices
declined beginning January 2017. Cereal and sugar
prices have started firming up from July (Chart V.4).
Soft commodity prices have kept inflation
expectations quiescent in most AEs, even as economic
activity and job creation have strengthened. Inflation
in the US has remained well below the target in 2017.
Euro area inflation has remained below the target due
to still persisting slack in the labour market, despite
the sharp increase in energy prices in August. In
Japan, inflation continued to be low at less than 0.5
per cent, though deflationary fears have disappeared
(Chart V.5a).
Inflationary pressures in EMEs continued to be
divergent (Chart V.5b). In China, inflation inched up
in Q2 following a significant fall in Q1 and touched a
seven-month high in September on account of strong
domestic demand and increase in the prices of non-
food items. In Russia, inflation fell for the first time
below the target of 4 per cent in July, while in Brazil,
it touched the lower band of the target of 3 per cent
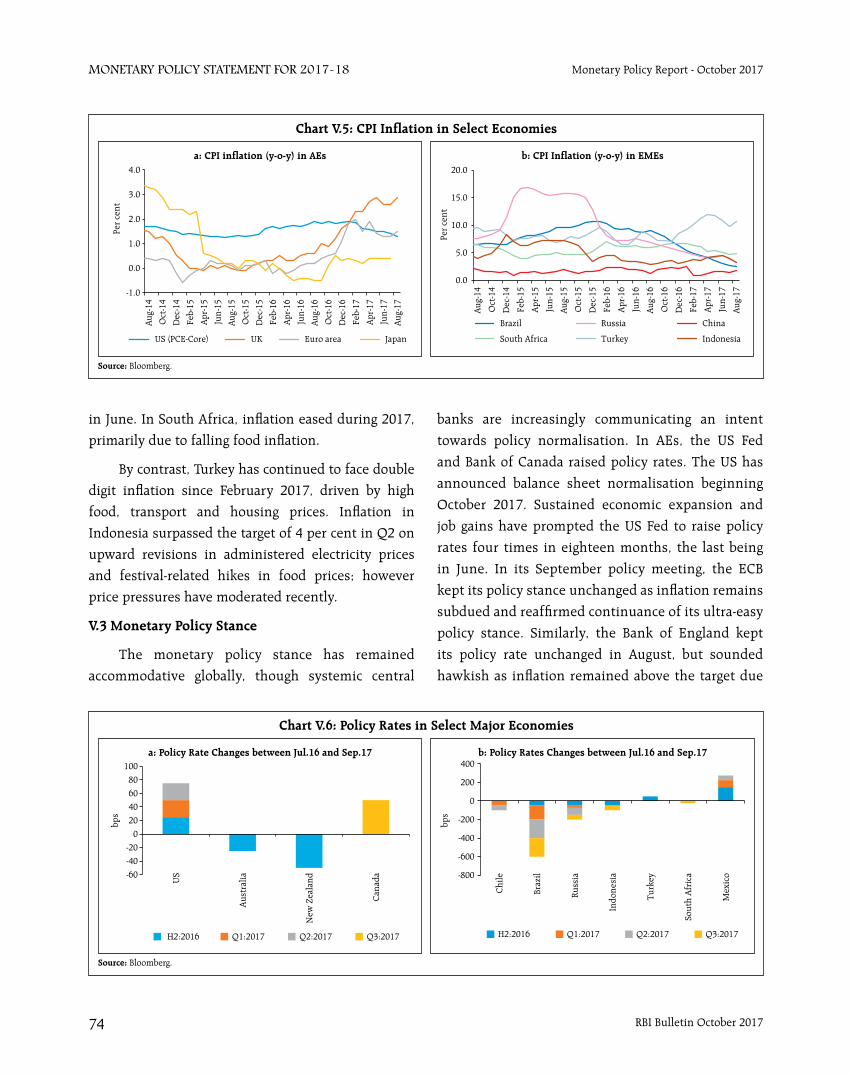
RBI Bulletin October 201774
Monetary Policy StateMent for 2017-18 Monetary Policy Report - October 2017
in June. In South Africa, inflation eased during 2017,
primarily due to falling food inflation.
By contrast, Turkey has continued to face double
digit inflation since February 2017, driven by high
food, transport and housing prices. Inflation in
Indonesia surpassed the target of 4 per cent in Q2 on
upward revisions in administered electricity prices
and festival-related hikes in food prices; however
price pressures have moderated recently.
V.3 Monetary Policy Stance
The monetary policy stance has remained
accommodative globally, though systemic central
banks are increasingly communicating an intent
towards policy normalisation. In AEs, the US Fed
and Bank of Canada raised policy rates. The US has
announced balance sheet normalisation beginning
October 2017. Sustained economic expansion and
job gains have prompted the US Fed to raise policy
rates four times in eighteen months, the last being
in June. In its September policy meeting, the ECB
kept its policy stance unchanged as inflation remains
subdued and reaffirmed continuance of its ultra-easy
policy stance. Similarly, the Bank of England kept
its policy rate unchanged in August, but sounded
hawkish as inflation remained above the target due
RBI Bulletin October 2017 75
Monetary Policy StateMent for 2017-18Monetary Policy Report - October 2017
to a weak currency. The Bank of Japan, however, has
continued with its ultra-accommodative stance as
inflation has remained low with growth still modest
(Chart V.6a).
Even though monetary policy stances remained
diverse in EMEs, several of them either reduced policy
rates or kept them unchanged. In Brazil, the policy
rate was cut for the sixth time in a row in 2017 so far,
as the inflationary situation improved and remained
resilient to political uncertainty, while the currency
strengthened. South Africa cut its policy rate for the
first time in five years in July as the economy slipped
into recession in Q1 while inflation pressures eased.
Russia cut its policy rate four times in 2017 so far, to
support economic recovery, as inflation continued to
decline.
Although China has kept key policy rates
unchanged since October 2015 to control excessive
debt financing, liquidity in the system has been
tightened through measures such as open market
operations. Chile has kept the policy rate unchanged
since the rate cut effected in May to support
economic activity. Indonesia cut its policy rate twice
in Q3 of 2017 on falling inflation and lower current
account deficit. Turkey left its tight monetary policy
stance unchanged as inflation remained elevated.
By contrast, Mexico raised the policy rate in
tandem with the US, given close economic linkages
(Chart V.6b).
V.4 Global Financial Markets
Changing expectations about the course of
monetary policy in AEs and improving economic
prospects influenced risk perceptions of investors and
drove global financial markets. Although markets have
remained relatively calm and stable, the unwinding of
the expansion in Fed’s balance sheet since the global
financial crisis is a potential vortex of tension going
forward. With its massive holdings of government and
mortgage-backed securities (MBS), the Fed is the most
dominant player in the US bond market. Furthermore,
a reduction of the Fed’s balance sheet would echo
growing confidence in the US economy. In turn, this
has some implications for financial markets in EMEs
(Box V.1).
Three rounds of quantitative easing (QE) in the
aftermath of the global financial crisis swelled the
Fed’s balance sheet from US$ 0.7 trillion in 2008 to the current level of US$ 4.2 trillion, consisting of government securities of around US$ 2.0 trillion, mortgage backed securities (MBS) of US$ 1.7 trillion and other assets. This has had large spillover effects on EMEs through capital flows, though they remained smaller in countries with better fundamentals (Chen et al., 2014). With the strengthening of economic growth in the US, the Federal Open Market Committee (FOMC) indicated a state-contingent unwinding of the balance sheet in June 2017 and outlined the broad principle: government securities and MBS would be allowed to roll off without reinvesting in a graduated manner, which would translate to an annual average reduction
Box V.1: Implications of Unwinding of US Fed Balance Sheet
of about US$ 270 billion in government securities and US$ 180 billion in MBS over the next two years. In its meeting held on September 20, 2017, the FOMC announced that it would initiate the balance sheet normalisation programme from October 2017.
A reversal of QE may involve standard channels of transmission. First, long-term bond yields could increase due to a rise in the term premium induced by higher supply for bonds, leading to steepening of the yield curve. The rise in bond yields, along with tightening of financial conditions, would lead to portfolio rebalancing from equity and risky assets to bonds. Second, a combination of portfolio substitution, risk aversion and safe haven demand could cause a rise in bond yields in the US which could, in turn,
(contd.)
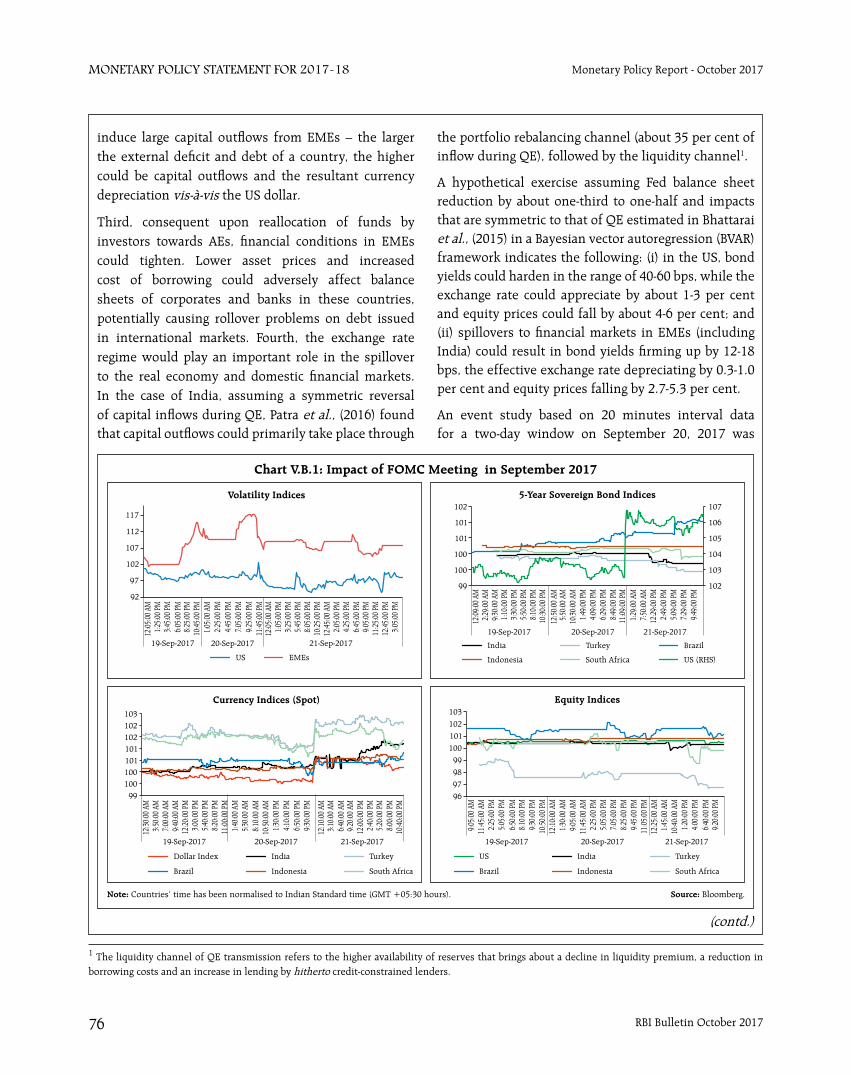
RBI Bulletin October 201776
Monetary Policy StateMent for 2017-18 Monetary Policy Report - October 2017
the portfolio rebalancing channel (about 35 per cent of inflow during QE), followed by the liquidity channel1.
A hypothetical exercise assuming Fed balance sheet reduction by about one-third to one-half and impacts that are symmetric to that of QE estimated in Bhattarai et al., (2015) in a Bayesian vector autoregression (BVAR) framework indicates the following: (i) in the US, bond yields could harden in the range of 40-60 bps, while the exchange rate could appreciate by about 1-3 per cent and equity prices could fall by about 4-6 per cent; and (ii) spillovers to financial markets in EMEs (including India) could result in bond yields firming up by 12-18 bps, the effective exchange rate depreciating by 0.3-1.0 per cent and equity prices falling by 2.7-5.3 per cent.
An event study based on 20 minutes interval data for a two-day window on September 20, 2017 was
1 The liquidity channel of QE transmission refers to the higher availability of reserves that brings about a decline in liquidity premium, a reduction in borrowing costs and an increase in lending by hitherto credit-constrained lenders.
induce large capital outflows from EMEs – the larger the external deficit and debt of a country, the higher could be capital outflows and the resultant currency depreciation vis-à-vis the US dollar.
Third, consequent upon reallocation of funds by investors towards AEs, financial conditions in EMEs could tighten. Lower asset prices and increased cost of borrowing could adversely affect balance sheets of corporates and banks in these countries, potentially causing rollover problems on debt issued in international markets. Fourth, the exchange rate regime would play an important role in the spillover to the real economy and domestic financial markets. In the case of India, assuming a symmetric reversal of capital inflows during QE, Patra et al., (2016) found that capital outflows could primarily take place through
(contd.)
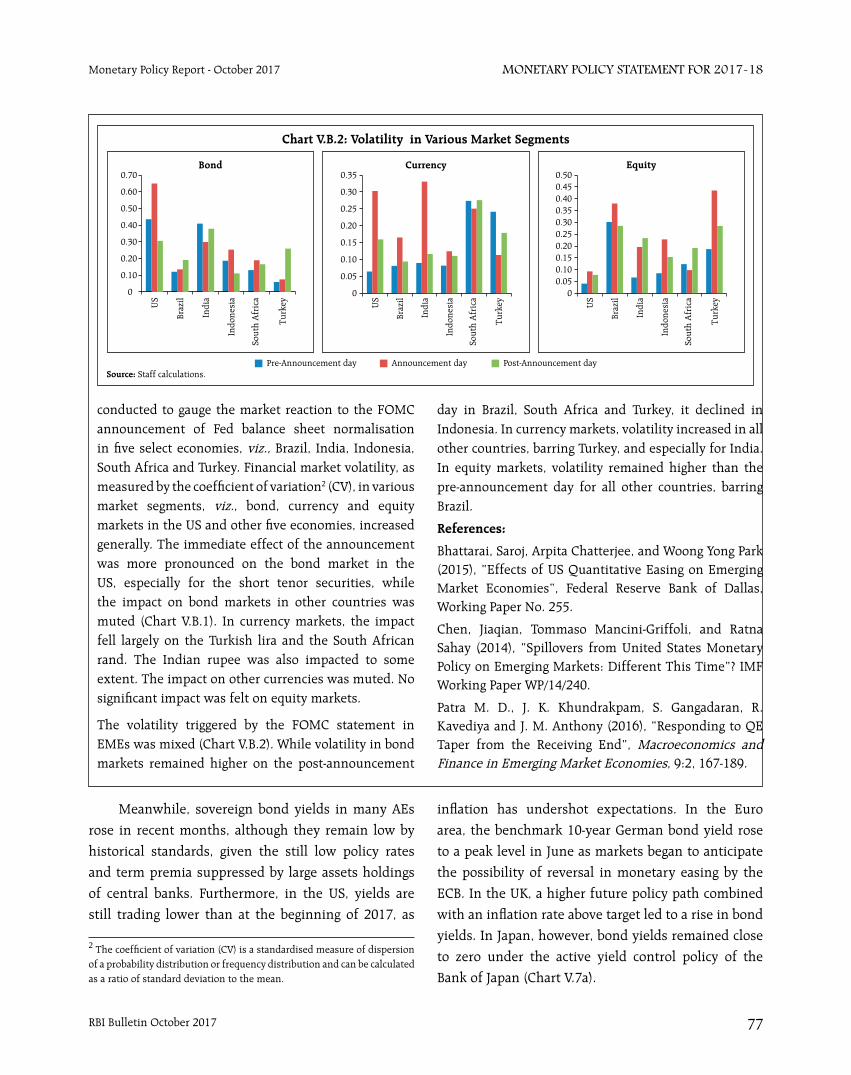
RBI Bulletin October 2017 77
Monetary Policy StateMent for 2017-18Monetary Policy Report - October 2017
Meanwhile, sovereign bond yields in many AEs
rose in recent months, although they remain low by
historical standards, given the still low policy rates
and term premia suppressed by large assets holdings
of central banks. Furthermore, in the US, yields are
still trading lower than at the beginning of 2017, as
inflation has undershot expectations. In the Euro
area, the benchmark 10-year German bond yield rose
to a peak level in June as markets began to anticipate
the possibility of reversal in monetary easing by the
ECB. In the UK, a higher future policy path combined
with an inflation rate above target led to a rise in bond
yields. In Japan, however, bond yields remained close
to zero under the active yield control policy of the
Bank of Japan (Chart V.7a).
2 The coefficient of variation (CV) is a standardised measure of dispersion of a probability distribution or frequency distribution and can be calculated as a ratio of standard deviation to the mean.
conducted to gauge the market reaction to the FOMC announcement of Fed balance sheet normalisation in five select economies, viz., Brazil, India, Indonesia, South Africa and Turkey. Financial market volatility, as measured by the coefficient of variation2 (CV), in various market segments, viz., bond, currency and equity markets in the US and other five economies, increased generally. The immediate effect of the announcement was more pronounced on the bond market in the US, especially for the short tenor securities, while the impact on bond markets in other countries was muted (Chart V.B.1). In currency markets, the impact fell largely on the Turkish lira and the South African rand. The Indian rupee was also impacted to some extent. The impact on other currencies was muted. No significant impact was felt on equity markets.
The volatility triggered by the FOMC statement in EMEs was mixed (Chart V.B.2). While volatility in bond markets remained higher on the post-announcement
day in Brazil, South Africa and Turkey, it declined in Indonesia. In currency markets, volatility increased in all other countries, barring Turkey, and especially for India. In equity markets, volatility remained higher than the pre-announcement day for all other countries, barring Brazil.
References:
Bhattarai, Saroj, Arpita Chatterjee, and Woong Yong Park (2015), “Effects of US Quantitative Easing on Emerging Market Economies”, Federal Reserve Bank of Dallas, Working Paper No. 255.
Chen, Jiaqian, Tommaso Mancini-Griffoli, and Ratna Sahay (2014), “Spillovers from United States Monetary Policy on Emerging Markets: Different This Time”? IMF Working Paper WP/14/240.
Patra M. D., J. K. Khundrakpam, S. Gangadaran, R. Kavediya and J. M. Anthony (2016), “Responding to QE Taper from the Receiving End”, Macroeconomics and Finance in Emerging Market Economies, 9:2, 167-189.
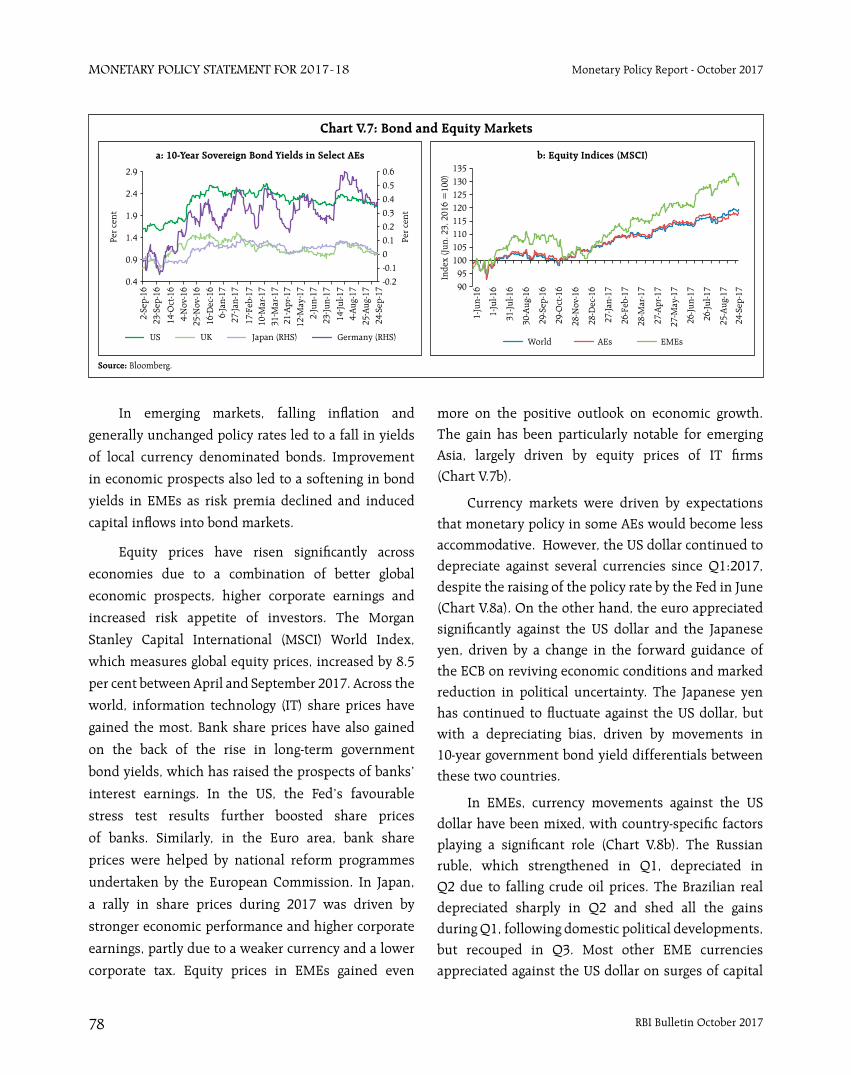
RBI Bulletin October 201778
Monetary Policy StateMent for 2017-18 Monetary Policy Report - October 2017
In emerging markets, falling inflation and
generally unchanged policy rates led to a fall in yields
of local currency denominated bonds. Improvement
in economic prospects also led to a softening in bond
yields in EMEs as risk premia declined and induced
capital inflows into bond markets.
Equity prices have risen significantly across
economies due to a combination of better global
economic prospects, higher corporate earnings and
increased risk appetite of investors. The Morgan
Stanley Capital International (MSCI) World Index,
which measures global equity prices, increased by 8.5
per cent between April and September 2017. Across the
world, information technology (IT) share prices have
gained the most. Bank share prices have also gained
on the back of the rise in long-term government
bond yields, which has raised the prospects of banks’
interest earnings. In the US, the Fed’s favourable
stress test results further boosted share prices
of banks. Similarly, in the Euro area, bank share
prices were helped by national reform programmes
undertaken by the European Commission. In Japan,
a rally in share prices during 2017 was driven by
stronger economic performance and higher corporate
earnings, partly due to a weaker currency and a lower
corporate tax. Equity prices in EMEs gained even
more on the positive outlook on economic growth. The gain has been particularly notable for emerging Asia, largely driven by equity prices of IT firms (Chart V.7b).
Currency markets were driven by expectations that monetary policy in some AEs would become less accommodative. However, the US dollar continued to depreciate against several currencies since Q1:2017, despite the raising of the policy rate by the Fed in June (Chart V.8a). On the other hand, the euro appreciated significantly against the US dollar and the Japanese yen, driven by a change in the forward guidance of the ECB on reviving economic conditions and marked reduction in political uncertainty. The Japanese yen has continued to fluctuate against the US dollar, but with a depreciating bias, driven by movements in 10-year government bond yield differentials between these two countries.
In EMEs, currency movements against the US dollar have been mixed, with country-specific factors playing a significant role (Chart V.8b). The Russian ruble, which strengthened in Q1, depreciated in Q2 due to falling crude oil prices. The Brazilian real depreciated sharply in Q2 and shed all the gains during Q1, following domestic political developments, but recouped in Q3. Most other EME currencies appreciated against the US dollar on surges of capital
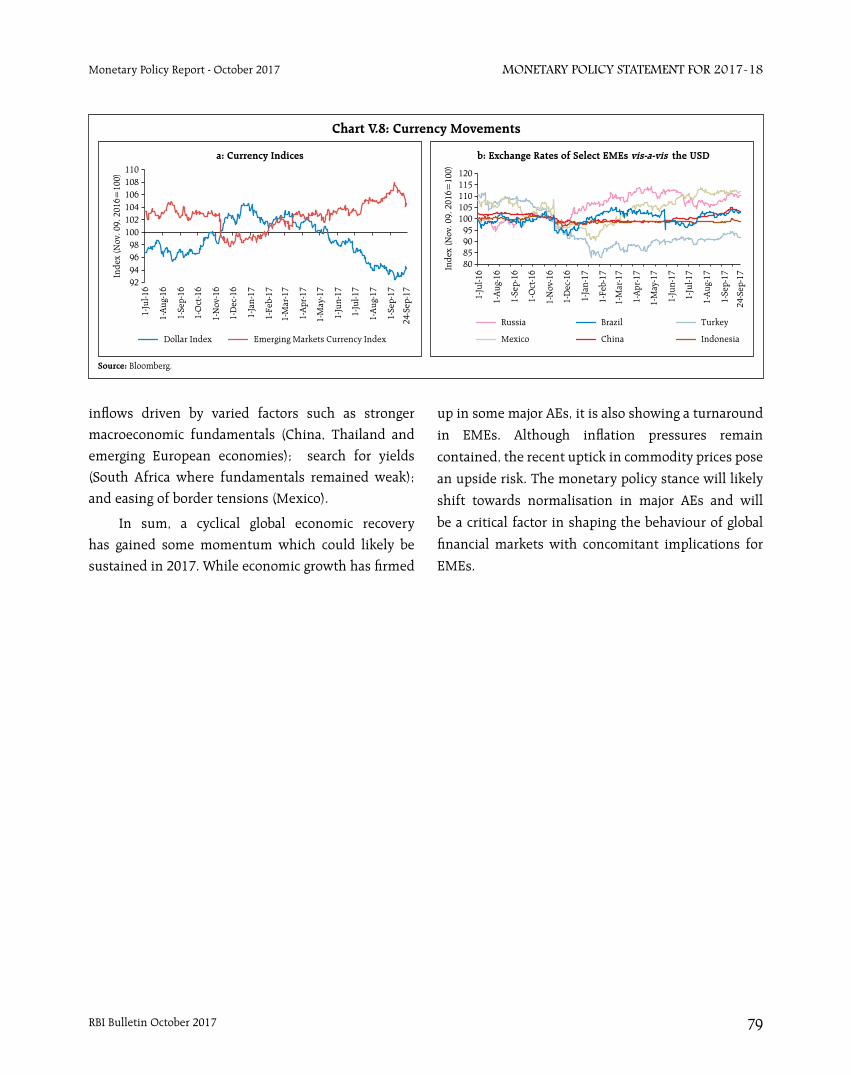
RBI Bulletin October 2017 79
Monetary Policy StateMent for 2017-18Monetary Policy Report - October 2017
inflows driven by varied factors such as stronger
macroeconomic fundamentals (China, Thailand and
emerging European economies); search for yields
(South Africa where fundamentals remained weak);
and easing of border tensions (Mexico).
In sum, a cyclical global economic recovery
has gained some momentum which could likely be
sustained in 2017. While economic growth has firmed
up in some major AEs, it is also showing a turnaround
in EMEs. Although inflation pressures remain
contained, the recent uptick in commodity prices pose
an upside risk. The monetary policy stance will likely
shift towards normalisation in major AEs and will
be a critical factor in shaping the behaviour of global
financial markets with concomitant implications for
EMEs.


Speech
The Unfinished Agenda: Restoring Public Sector Bank Health in India Viral V. Acharya

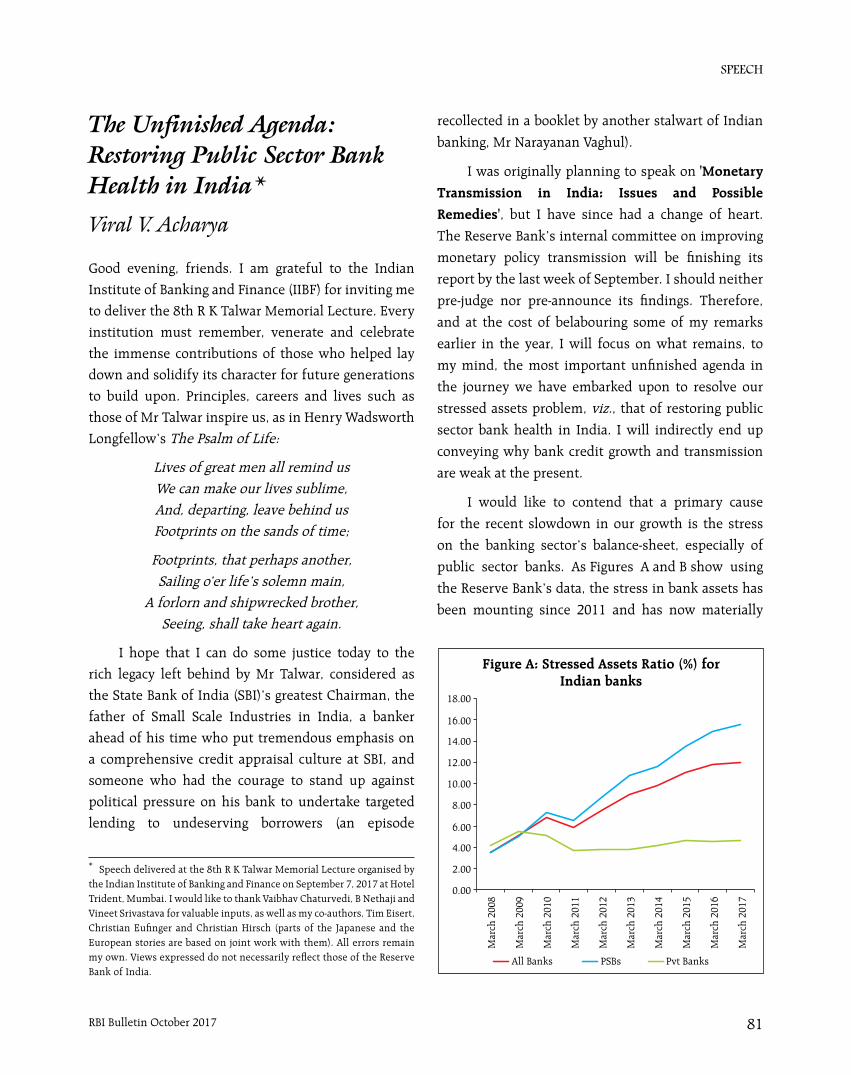
SPEECH
RBI Bulletin October 2017 81
The Unfinished Agenda: Restoring Public Sector Bank Health in India
recollected in a booklet by another stalwart of Indian
banking, Mr Narayanan Vaghul).
I was originally planning to speak on 'Monetary
Transmission in India: Issues and Possible
Remedies', but I have since had a change of heart.
The Reserve Bank’s internal committee on improving
monetary policy transmission will be finishing its
report by the last week of September. I should neither
pre-judge nor pre-announce its findings. Therefore,
and at the cost of belabouring some of my remarks
earlier in the year, I will focus on what remains, to
my mind, the most important unfinished agenda in
the journey we have embarked upon to resolve our
stressed assets problem, viz., that of restoring public
sector bank health in India. I will indirectly end up
conveying why bank credit growth and transmission
are weak at the present.
I would like to contend that a primary cause
for the recent slowdown in our growth is the stress
on the banking sector’s balance-sheet, especially of
public sector banks. As Figures A and B show using
the Reserve Bank’s data, the stress in bank assets has
been mounting since 2011 and has now materially
Good evening, friends. I am grateful to the Indian
Institute of Banking and Finance (IIBF) for inviting me
to deliver the 8th R K Talwar Memorial Lecture. Every
institution must remember, venerate and celebrate
the immense contributions of those who helped lay
down and solidify its character for future generations
to build upon. Principles, careers and lives such as
those of Mr Talwar inspire us, as in Henry Wadsworth
Longfellow’s The Psalm of Life:
Lives of great men all remind us
We can make our lives sublime, And, departing, leave behind us
Footprints on the sands of time;
Footprints, that perhaps another, Sailing o’er life’s solemn main,
A forlorn and shipwrecked brother, Seeing, shall take heart again.
I hope that I can do some justice today to the
rich legacy left behind by Mr Talwar, considered as
the State Bank of India (SBI)’s greatest Chairman, the
father of Small Scale Industries in India, a banker
ahead of his time who put tremendous emphasis on
a comprehensive credit appraisal culture at SBI, and
someone who had the courage to stand up against
political pressure on his bank to undertake targeted
lending to undeserving borrowers (an episode
* Speech delivered at the 8th R K Talwar Memorial Lecture organised by the Indian Institute of Banking and Finance on September 7, 2017 at Hotel Trident, Mumbai. I would like to thank Vaibhav Chaturvedi, B Nethaji and Vineet Srivastava for valuable inputs, as well as my co-authors, Tim Eisert, Christian Eufinger and Christian Hirsch (parts of the Japanese and the European stories are based on joint work with them). All errors remain my own. Views expressed do not necessarily reflect those of the Reserve Bank of India.
The Unfinished Agenda: Restoring Public Sector Bank Health in India*Viral V. Acharya
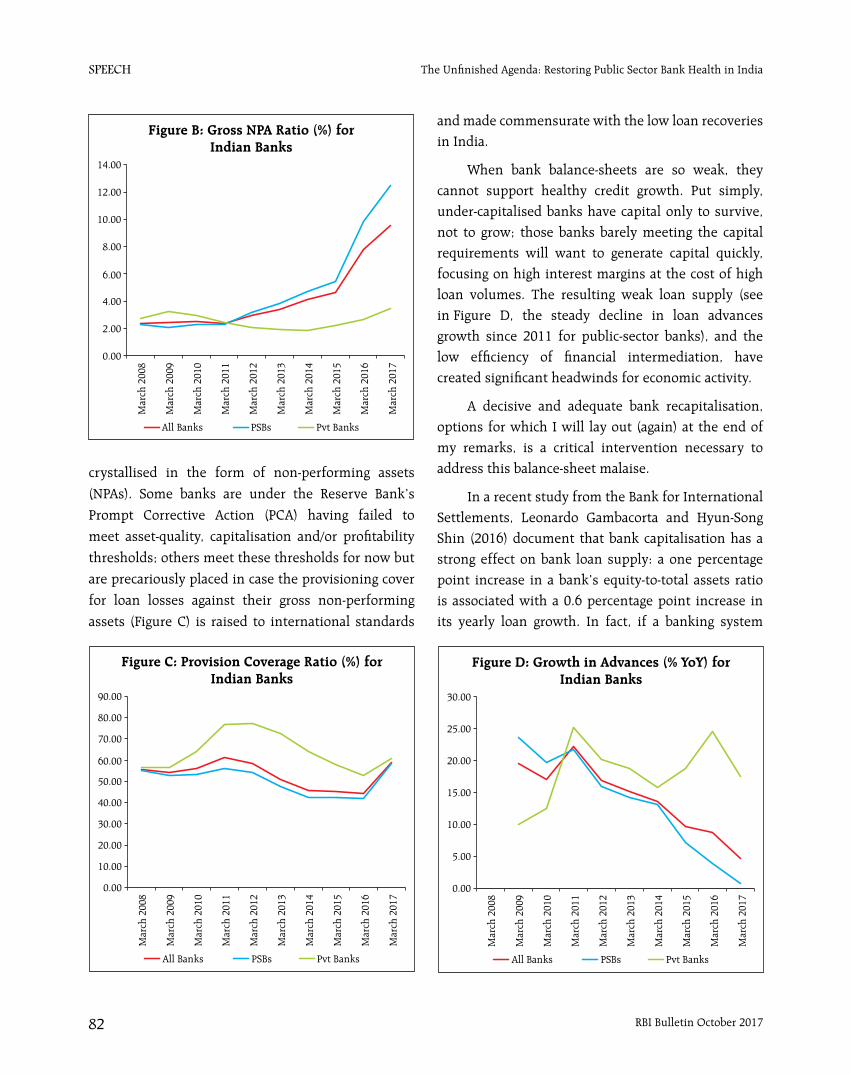
SPEECH
RBI Bulletin October 201782
The Unfinished Agenda: Restoring Public Sector Bank Health in India
crystallised in the form of non-performing assets
(NPAs). Some banks are under the Reserve Bank’s
Prompt Corrective Action (PCA) having failed to
meet asset-quality, capitalisation and/or profitability
thresholds; others meet these thresholds for now but
are precariously placed in case the provisioning cover
for loan losses against their gross non-performing
assets (Figure C) is raised to international standards
and made commensurate with the low loan recoveries in India.
When bank balance-sheets are so weak, they cannot support healthy credit growth. Put simply, under-capitalised banks have capital only to survive, not to grow; those banks barely meeting the capital requirements will want to generate capital quickly, focusing on high interest margins at the cost of high loan volumes. The resulting weak loan supply (see in Figure D, the steady decline in loan advances growth since 2011 for public-sector banks), and the low efficiency of financial intermediation, have created significant headwinds for economic activity.
A decisive and adequate bank recapitalisation, options for which I will lay out (again) at the end of my remarks, is a critical intervention necessary to address this balance-sheet malaise.
In a recent study from the Bank for International Settlements, Leonardo Gambacorta and Hyun-Song Shin (2016) document that bank capitalisation has a strong effect on bank loan supply: a one percentage point increase in a bank’s equity-to-total assets ratio is associated with a 0.6 percentage point increase in its yearly loan growth. In fact, if a banking system
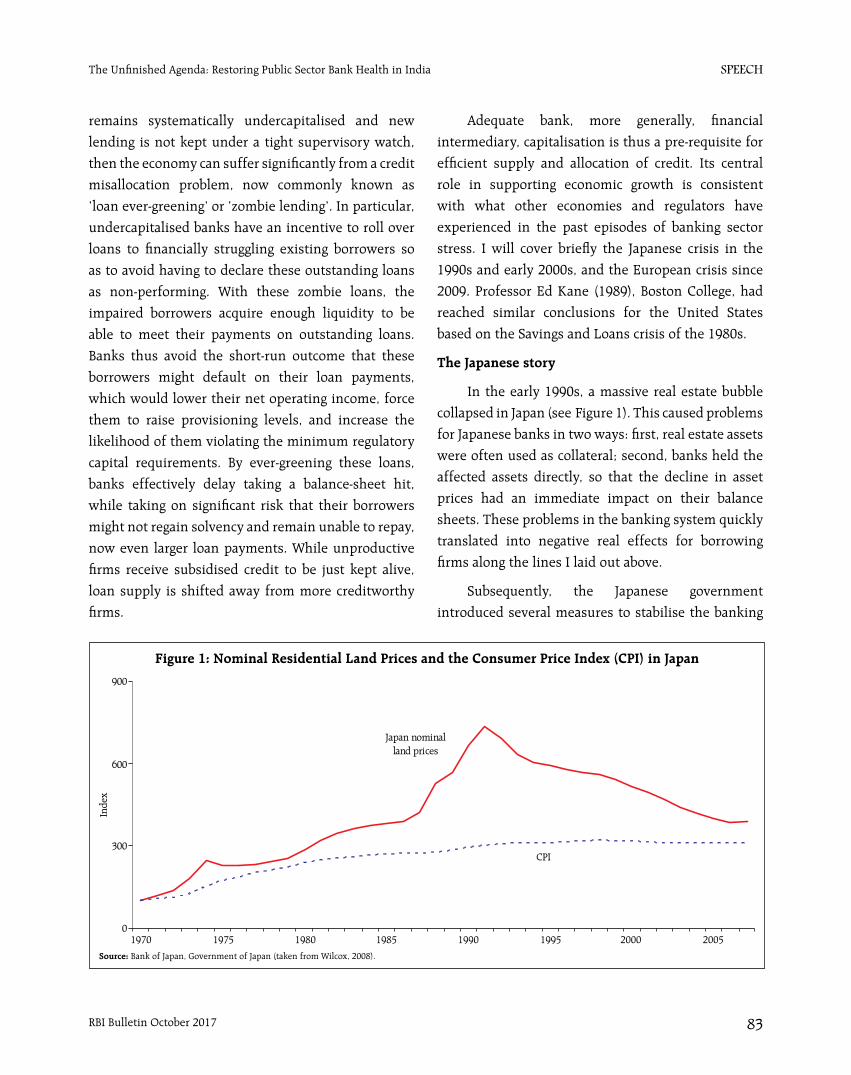
SPEECH
RBI Bulletin October 2017 83
The Unfinished Agenda: Restoring Public Sector Bank Health in India
remains systematically undercapitalised and new
lending is not kept under a tight supervisory watch,
then the economy can suffer significantly from a credit
misallocation problem, now commonly known as
‘loan ever-greening’ or ‘zombie lending’. In particular,
undercapitalised banks have an incentive to roll over
loans to financially struggling existing borrowers so
as to avoid having to declare these outstanding loans
as non-performing. With these zombie loans, the
impaired borrowers acquire enough liquidity to be
able to meet their payments on outstanding loans.
Banks thus avoid the short-run outcome that these
borrowers might default on their loan payments,
which would lower their net operating income, force
them to raise provisioning levels, and increase the
likelihood of them violating the minimum regulatory
capital requirements. By ever-greening these loans,
banks effectively delay taking a balance-sheet hit,
while taking on significant risk that their borrowers
might not regain solvency and remain unable to repay,
now even larger loan payments. While unproductive
firms receive subsidised credit to be just kept alive,
loan supply is shifted away from more creditworthy
firms.
Adequate bank, more generally, financial
intermediary, capitalisation is thus a pre-requisite for
efficient supply and allocation of credit. Its central
role in supporting economic growth is consistent
with what other economies and regulators have
experienced in the past episodes of banking sector
stress. I will cover briefly the Japanese crisis in the
1990s and early 2000s, and the European crisis since
2009. Professor Ed Kane (1989), Boston College, had
reached similar conclusions for the United States
based on the Savings and Loans crisis of the 1980s.
The Japanese story
In the early 1990s, a massive real estate bubble
collapsed in Japan (see Figure 1). This caused problems
for Japanese banks in two ways: first, real estate assets
were often used as collateral; second, banks held the
affected assets directly, so that the decline in asset
prices had an immediate impact on their balance
sheets. These problems in the banking system quickly
translated into negative real effects for borrowing
firms along the lines I laid out above.
Subsequently, the Japanese government
introduced several measures to stabilise the banking
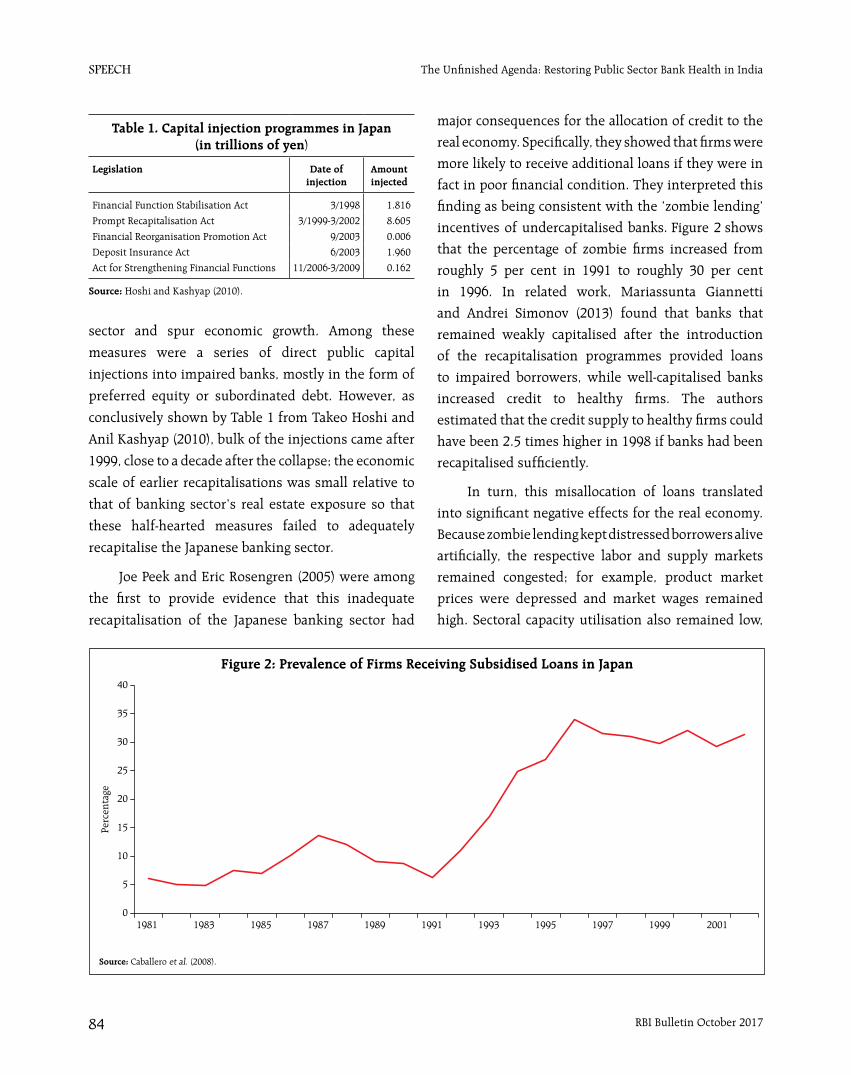
SPEECH
RBI Bulletin October 201784
The Unfinished Agenda: Restoring Public Sector Bank Health in India
sector and spur economic growth. Among these
measures were a series of direct public capital
injections into impaired banks, mostly in the form of
preferred equity or subordinated debt. However, as
conclusively shown by Table 1 from Takeo Hoshi and
Anil Kashyap (2010), bulk of the injections came after
1999, close to a decade after the collapse; the economic
scale of earlier recapitalisations was small relative to
that of banking sector’s real estate exposure so that
these half-hearted measures failed to adequately
recapitalise the Japanese banking sector.
Joe Peek and Eric Rosengren (2005) were among
the first to provide evidence that this inadequate
recapitalisation of the Japanese banking sector had
major consequences for the allocation of credit to the
real economy. Specifically, they showed that firms were
more likely to receive additional loans if they were in
fact in poor financial condition. They interpreted this
finding as being consistent with the ‘zombie lending’
incentives of undercapitalised banks. Figure 2 shows
that the percentage of zombie firms increased from
roughly 5 per cent in 1991 to roughly 30 per cent
in 1996. In related work, Mariassunta Giannetti
and Andrei Simonov (2013) found that banks that
remained weakly capitalised after the introduction
of the recapitalisation programmes provided loans
to impaired borrowers, while well-capitalised banks
increased credit to healthy firms. The authors
estimated that the credit supply to healthy firms could
have been 2.5 times higher in 1998 if banks had been
recapitalised sufficiently.
In turn, this misallocation of loans translated
into significant negative effects for the real economy.
Because zombie lending kept distressed borrowers alive
artificially, the respective labor and supply markets
remained congested; for example, product market
prices were depressed and market wages remained
high. Sectoral capacity utilisation also remained low,
Table 1. Capital injection programmes in Japan (in trillions of yen)
Legislation Date of injection
Amount injected
Financial Function Stabilisation Act 3/1998 1.816
Prompt Recapitalisation Act 3/1999-3/2002 8.605
Financial Reorganisation Promotion Act 9/2003 0.006
Deposit Insurance Act 6/2003 1.960
Act for Strengthening Financial Functions 11/2006-3/2009 0.162
Source: Hoshi and Kashyap (2010).
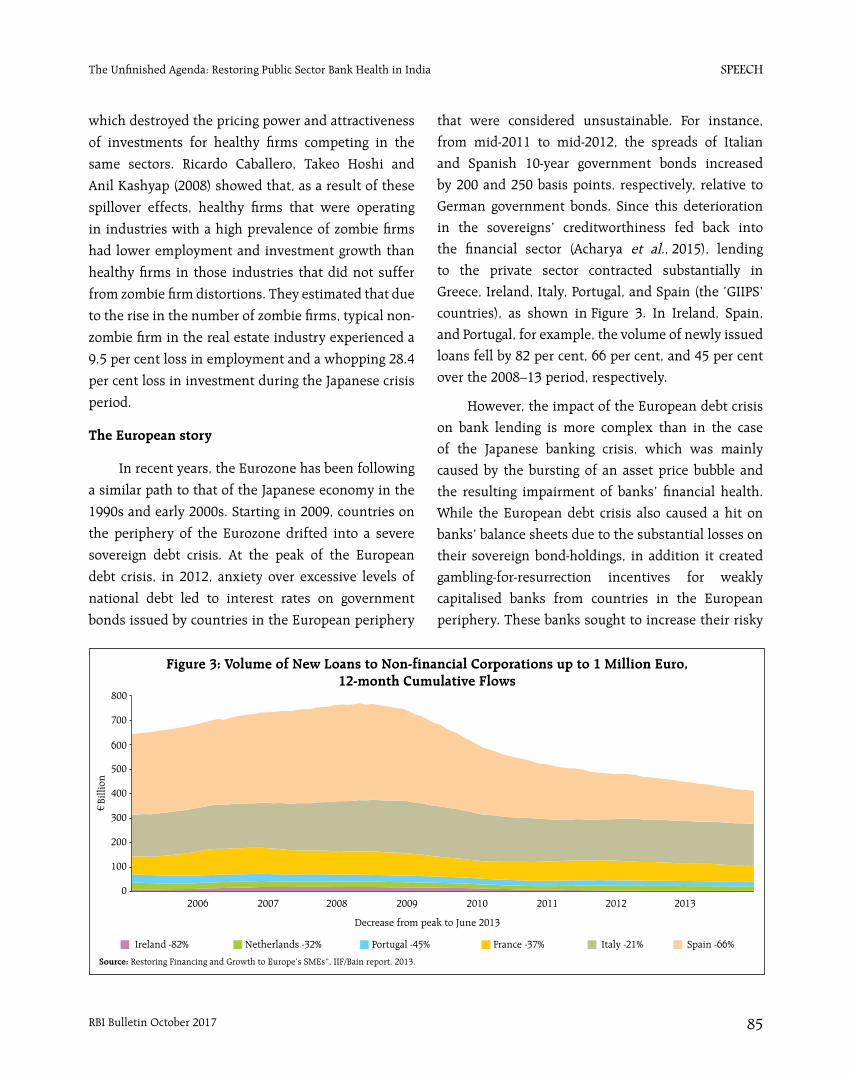
SPEECH
RBI Bulletin October 2017 85
The Unfinished Agenda: Restoring Public Sector Bank Health in India
which destroyed the pricing power and attractiveness
of investments for healthy firms competing in the
same sectors. Ricardo Caballero, Takeo Hoshi and
Anil Kashyap (2008) showed that, as a result of these
spillover effects, healthy firms that were operating
in industries with a high prevalence of zombie firms
had lower employment and investment growth than
healthy firms in those industries that did not suffer
from zombie firm distortions. They estimated that due
to the rise in the number of zombie firms, typical non-
zombie firm in the real estate industry experienced a
9.5 per cent loss in employment and a whopping 28.4
per cent loss in investment during the Japanese crisis
period.
The European story
In recent years, the Eurozone has been following
a similar path to that of the Japanese economy in the
1990s and early 2000s. Starting in 2009, countries on
the periphery of the Eurozone drifted into a severe
sovereign debt crisis. At the peak of the European
debt crisis, in 2012, anxiety over excessive levels of
national debt led to interest rates on government
bonds issued by countries in the European periphery
that were considered unsustainable. For instance,
from mid-2011 to mid-2012, the spreads of Italian
and Spanish 10-year government bonds increased
by 200 and 250 basis points, respectively, relative to
German government bonds. Since this deterioration
in the sovereigns’ creditworthiness fed back into
the financial sector (Acharya et al., 2015), lending
to the private sector contracted substantially in
Greece, Ireland, Italy, Portugal, and Spain (the ‘GIIPS’
countries), as shown in Figure 3. In Ireland, Spain,
and Portugal, for example, the volume of newly issued
loans fell by 82 per cent, 66 per cent, and 45 per cent
over the 2008–13 period, respectively.
However, the impact of the European debt crisis
on bank lending is more complex than in the case
of the Japanese banking crisis, which was mainly
caused by the bursting of an asset price bubble and
the resulting impairment of banks’ financial health.
While the European debt crisis also caused a hit on
banks’ balance sheets due to the substantial losses on
their sovereign bond-holdings, in addition it created
gambling-for-resurrection incentives for weakly
capitalised banks from countries in the European
periphery. These banks sought to increase their risky
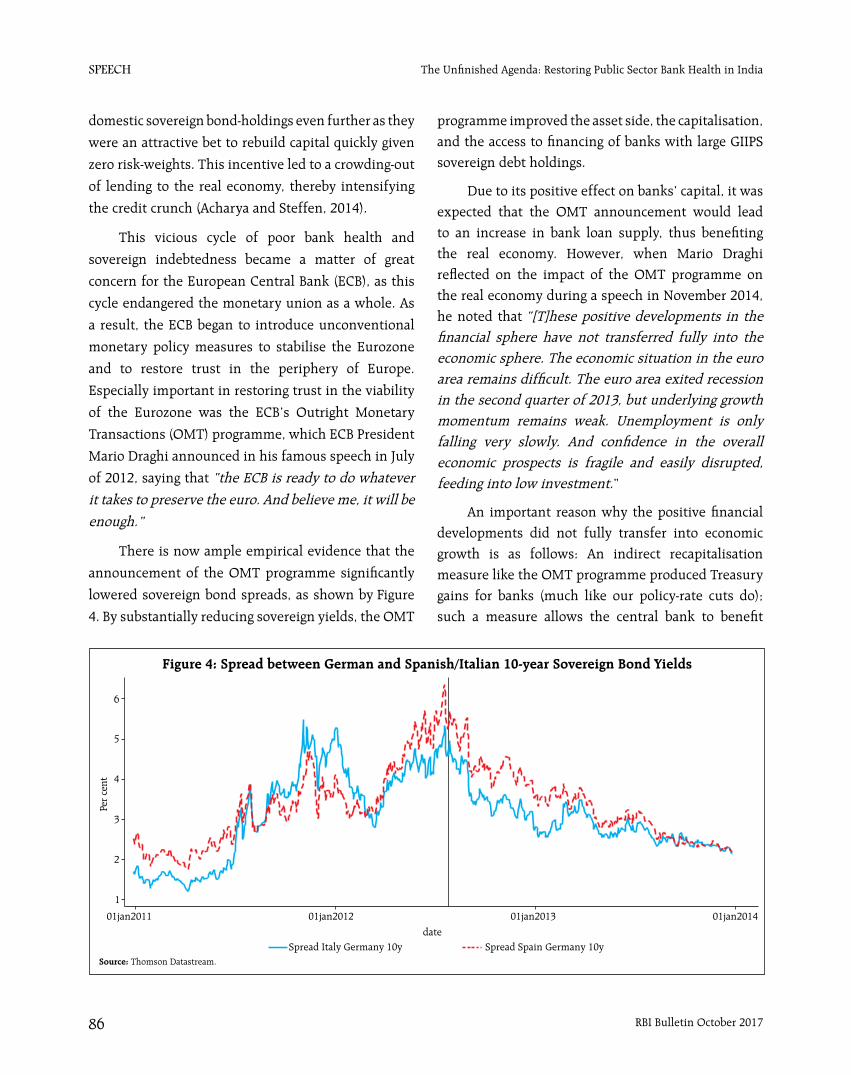
SPEECH
RBI Bulletin October 201786
The Unfinished Agenda: Restoring Public Sector Bank Health in India
domestic sovereign bond-holdings even further as they
were an attractive bet to rebuild capital quickly given
zero risk-weights. This incentive led to a crowding-out
of lending to the real economy, thereby intensifying
the credit crunch (Acharya and Steffen, 2014).
This vicious cycle of poor bank health and
sovereign indebtedness became a matter of great
concern for the European Central Bank (ECB), as this
cycle endangered the monetary union as a whole. As
a result, the ECB began to introduce unconventional
monetary policy measures to stabilise the Eurozone
and to restore trust in the periphery of Europe.
Especially important in restoring trust in the viability
of the Eurozone was the ECB’s Outright Monetary
Transactions (OMT) programme, which ECB President
Mario Draghi announced in his famous speech in July
of 2012, saying that “the ECB is ready to do whatever
it takes to preserve the euro. And believe me, it will be
enough.”
There is now ample empirical evidence that the
announcement of the OMT programme significantly
lowered sovereign bond spreads, as shown by Figure
4. By substantially reducing sovereign yields, the OMT
programme improved the asset side, the capitalisation, and the access to financing of banks with large GIIPS sovereign debt holdings.
Due to its positive effect on banks’ capital, it was expected that the OMT announcement would lead to an increase in bank loan supply, thus benefiting the real economy. However, when Mario Draghi reflected on the impact of the OMT programme on the real economy during a speech in November 2014, he noted that “[T]hese positive developments in the financial sphere have not transferred fully into the economic sphere. The economic situation in the euro area remains difficult. The euro area exited recession in the second quarter of 2013, but underlying growth momentum remains weak. Unemployment is only falling very slowly. And confidence in the overall economic prospects is fragile and easily disrupted, feeding into low investment.”
An important reason why the positive financial developments did not fully transfer into economic growth is as follows: An indirect recapitalisation measure like the OMT programme produced Treasury gains for banks (much like our policy-rate cuts do); such a measure allows the central bank to benefit
SPEECH
RBI Bulletin October 2017 87
The Unfinished Agenda: Restoring Public Sector Bank Health in India
banks that hold troublesome assets, but it does not
tailor the recapitalisation to banks’ specific needs. As
a result, some European banks remained significantly
undercapitalised from an economic standpoint even
post-OMT.
In joint work with Tim Eisert, Christian Eufinger
and Christian Hirsch (Acharya et al., 2016), I have
confirmed that zombie lending is indeed the likely
explanation for why the OMT programme did not
fully translate into economic growth. Our study
shows that banks that benefited more from the
announcement but remained nevertheless weakly
capitalised, extended loans to existing low-quality
borrowers at interest rates that were below the rates
paid by the most creditworthy European borrowers
(high-quality public borrowers in non-GIIPS European
countries, e.g., Germany), a strong indication of the
zombie lending behaviour.
Such lending did not have a positive impact on
real economic activity of the zombie firms: neither
investment, nor employment, nor return on assets
changed significantly for firms that were connected to
the under-capitalised banks. Similar to the spillovers
during the Japanese crisis, the post-OMT rise in zombie
firms had a negative impact on healthy firms operating
in the same industries due to the misallocation of
loans and distorted market competition. In particular,
healthy firms in industries with an average increase in
the proportion of zombie firms invested up to 13 per
cent less capital and experienced employment growth
rates that were about 4 per cent lower compared to a
scenario in which the proportion of zombies stayed
at its pre-OMT level. At extremis, for an industry in
the 95th percentile increase in zombie firms, healthy
firms invested up to 40 per cent less capital and
experienced employment growth rates up to 15 per
cent lower.
The Indian story: Can we end it differently?
In many ways, the problems experienced in
Japan and Europe have been rather similar. Both
regions went through a period of severe banking
sector stress (although triggered by different causes)
and failed to adequately recapitalise their struggling
banking sectors. Bank and other stressed balance-
sheet problems were neither fully recognised nor
addressed expediently.
In Japan, a likely explanation for the cautious
introduction of recapitalisation measures is that the
authorities were afraid of strong public resistance
when announcing large-scale recapitalisation, as
initial smaller support measures had already caused
public outrage. In addition, Japanese officials generally
feared sparking a panic on financial markets when
disclosing more transparent information about the
health of banks.
In Europe, introducing proper recapitalisation
measures has been challenging due to the political
circumstances and constraints of the Eurozone. In
contrast to a single country like Japan, 19 member
states have to come together in the Eurozone and
decide on a particular policy measure. In addition,
even if a particular policy is helping the Eurozone as
a whole, it might not be optimal for each individual
country experiencing divergent economic outcomes.
While our initial conditions look ominously
similar to these episodes and there are many parallels
with how things have played out at our end, we may
be fortunate in not having many of these constraints.
Hence, I believe we can, we should, and in fact, we
must do better. We are at a substantially lower per-
capita GDP than these countries and a sustained
growth slowdown has the potential to really hurt
economic prospects of the common man.
SPEECH
RBI Bulletin October 201788
The Unfinished Agenda: Restoring Public Sector Bank Health in India
With this overall objective, let me first turn to
what I consider the positives of the balance-sheet
resolution agenda that the Reserve Bank and the
Government of India have embarked upon. I will
then highlight the unfinished part of this agenda – its
Achilles’ heel – the lack of a clear and concrete plan
for restoring public sector bank health.
Resolution of Stressed Assets
To address cross-bank information asymmetry
and inconsistencies in asset classification, the Reserve
Bank created the Central Repository of Information on
Large Credits (CRILC) in early 2014. To end the asset
classification forbearance for restructured accounts,
the Reserve Bank announced the Asset Quality
Review (AQR) from April 1, 2015. The objective was to
get the banks to recognise the hitherto masked stress
in their balance sheets. The AQR is now complete.
The Reserve Bank is neither denying the scale of the
NPAs nor trying to forbear on them. Instead, it is fully
focused on resolving the assets recognised as NPAs.
In the absence of an effective, time-bound
statutory resolution framework, various schemes
were introduced by the Reserve Bank to facilitate
viable resolution of stressed assets. While the schemes
were designed, and later modified, to address some
of the specific issues flagged by various stakeholders
in individual deals, the final outcomes have not been
too satisfactory. The schemes were cherry-picked by
banks to keep loan-loss provisions low rather than
to resolve stressed assets. It is in this context that
enactment of the Insolvency and Bankruptcy Code
(IBC) in December 2016 can be considered to have
significantly changed the rules of the game. It is still
early days but the number of bankruptcy cases which
have been filed by operational as well as financial
creditors is encouraging. Many cases have been
admitted and the 180 day clock (extendable by further
90 days) for these cases to resolve has already started.
The promulgation of the Banking Regulation
(Amendment) Ordinance 2017 (since notified as an
Act) and the subsequent actions taken thereunder,
have made the IBC a lynchpin of the new resolution
framework. There were legitimate concerns that if the
Reserve Bank directs banks to file accounts under the
IBC, it would enter the tricky domain of commercial
judgments on specific cases. However, the approach
recommended by the Internal Advisory Committee
(IAC) constituted by the Reserve Bank for this purpose
has been objective and has allayed these misgivings.
The IAC recommended that the Reserve Bank should
initially focus on stressed assets which are large,
material and aged, in that they have eluded a viable
resolution plan despite being classified as NPAs for a
significant amount of time. Accordingly, the Reserve
Bank directed banks to file insolvency applications
against 12 large accounts comprising about 25 per
cent of the total NPAs. The Reserve Bank has now
advised banks to resolve some of the other accounts
by December 2017; if banks fail to put in place a viable
resolution plan within the timelines, these cases also
will be referred for resolution under the IBC.
The Reserve Bank has also advised banks to
make higher provisions for these accounts to be
referred under the IBC. This is intended to improve
bank provision coverage ratios (see Figure C) and to
ensure that banks are fully protected against likely
losses in the resolution process. The higher regulatory
minimum provisions should enable banks to focus on
what the borrowing company requires to turnaround
rather than on narrowly minimising their own balance-
sheet impacts. This should also help transition to
higher, and more countercyclical, provisioning norms
in due course.
Going forward, the Reserve Bank hopes that
banks utilise the IBC extensively and file for insolvency
proceedings on their own without waiting for
regulatory directions. Ideally, in line with international
SPEECH
RBI Bulletin October 2017 89
The Unfinished Agenda: Restoring Public Sector Bank Health in India
best practice, out-of-court restructuring may be the
right medicine at ‘pre-default’ stage, as soon as the
first signs of incipient stress are evident or when
covenants in bank loans are tripped by the borrowers.
Once a default happens, the IBC allows for filing for
insolvency proceedings, time-bound restructuring,
and failing that, liquidation. This would provide the
sanctity that the payment ‘due date’ deserves and
improve credit discipline all around, from bank supply
as well as borrower demand standpoints, as borrowers
might lose control in IBC to competing bidders.
Whither are we headed on restoring public sector bank health?
So far so good. Oft when on my couch I lie in
vacant or in pensive mood, the realisation that we
have put in place a process that not just addresses
the current NPA issues, but is also likely to serve as
a blueprint for future resolutions, becomes the bliss
of my solitude! A whole ecosystem is evolving around
the IBC and the Reserve Bank’s steps have contributed
to this structural reform. I smile and rest peacefully at
night with this thought… But every few days, I wake
up with a sense of restlessness that time is running
out; we have created a due process for stressed assets
to resolve but there is no concrete plan in place for
public sector bank balance-sheets; how will they
withstand the losses during resolution and yet have
enough capital buffers to intermediate well the huge
proportion of economy’s savings that they receive as
deposits; can we end the Indian story differently from
that of Japan and Europe?
The Government of India has been infusing
capital on a regular basis into the public sector
banks, to enable them to meet regulatory capital
requirements and maintain the government stake in
the PSBs at a benchmark level (set at 58 per cent in
December 2010, but subsequently lowered to 52 per
cent in December 2014). In 2015, the Government
announced the “Indradhanush” plan to revamp the
public sector banks. As part of that plan, a program of
capitalisation to ensure the public-sector banks remain
BASEL – III compliant was also announced. However,
given the correctly recognised scale of NPAs in the
books of public sector banks and the lower internal
capital augmentation given their tepid, now almost
moribund, credit growth, substantial additional capital
infusion is almost surely required. This is necessary
even after tapping into other avenues, including the
sale of non-core assets, raising of public equity, and
divestments by the government.
The Cabinet Committee on Economic Affairs
has recently authorised an Alternative Mechanism to
take decision on the divestment in respect of public
sector banks through exchange-traded funds or other
methods subject to the government retaining 52 per
cent stake. Synergistic mergers may also be part of
the broader scheme of things. The Union Cabinet
has also authorised an Alternative Mechanism for
approving amalgamation of public sector banks. The
framework envisages initiation of merger proposal by
the Bank Boards based on commercial considerations,
which will be considered for in-principle approval
by the Alternative Mechanism. This could provide
an opportunity to strengthen the balance sheets,
management and boards of banks and enable capital
raising by the amalgamated entity from the market
at better valuations in case synergies eventually
materialise.
All of this is good in principle. There are several
options on the table and they would have to work
together to address various constraints. What worries
me, however, is the glacial pace at which all this is
happening.
Having embarked on the NPA resolution process,
indeed having catalysed the likely haircuts on banks,
can we delay the bank resolution process any further?
Can we articulate a feasible plan to address the
massive recapitalisation need of banks and publicly
SPEECH
RBI Bulletin October 201790
The Unfinished Agenda: Restoring Public Sector Bank Health in India
announce this plan to provide clarity to investors and restore confidence in the markets about our banking
system?
Why aren’t the bank board approvals of public
capital raising leading to immediate equity issuances
at a time when liquidity chasing stock markets is
plentiful? What are the bank chairmen waiting for, the
elusive improvement in market-to-book which will
happen only with a better capital structure and could
get impaired by further growth shocks to the economy
in the meantime?
Can the government divest its stakes in public
sector banks right away, to 52 per cent? And, for banks
whose losses are so large that divestment to 52 per
cent won’t suffice, how do we tackle the issue?
Can the valuable and sizable deposit franchises
be sold off to private capital providers so that they
can operate as healthy entities rather than be in the
intensive care unit under the Reserve Bank’s Prompt
Corrective Action (PCA)? Can we start with the
relatively smaller banks under PCA as test cases for a
decisive overhaul?
These questions keep me awake at nights. I
fear time is running out. I worry for the small scale
industries that Mr Talwar cared the most about,
which are reliant on relationship-based bank credit.
The Indradhanush was a good plan, but to end the
Indian story differently, we need soon a much more
powerful plan – “Sudarshan Chakra” – aimed at
swiftly, within months if not weeks, for restoring
public sector bank health, in current ownership
structure or otherwise.
References
Acharya, V.V., T. Eisert, C. Eufinger, and C.W Hirsch
(2015), ‘Real effects of the sovereign debt crisis in
Europe: Evidence from syndicated loans’, CEPR
Discussion Paper No 10108.
Acharya, V.V., T. Eisert, C. Eufinger, and C.W. Hirsch
(2016), ‘Whatever it takes: The real effects of
unconventional monetary policy’, Working Paper,
New York University Stern School of Business.
Acharya, V.V. and S. Steffen (2014), ‘The greatest carry
trade ever? Understanding Eurozone bank risks’,
Journal of Financial Economics 115, 215–36.
Bain & Co and Institute of International Finance (IIF)
(2013), Restoring Financing and Growth to Europe’s
SMEs, Washington, DC.
Caballero, R.J, T. Hoshi, and A.K. Kashyap (2008),
‘Zombie lending and depressed restructuring in
Japan’, The American Economic Review 98(5),
1943–77.
Gambacorta, L. and H.S. Shin (2016), ‘Why bank capital
matters for monetary policy’, Working Paper.
Giannetti, M. and A. Simonov (2013), ‘On the real
effects of bank bailouts: Micro evidence from Japan’,
American Economic Journal: Macroeconomics 5,
135–67.
Hoshi, T. and A.K. Kashyap (2010), ‘Will the U.S. bank
recapitalisation succeed? Eight lessons from Japan’,
Journal of Financial Economics 97, 398–417.
Kane, E.J (1989), The S & L insurance mess: how did it
happen? Washington, DC: Urban Institute.
Peek, J. and E.S. Rosengren (2005), ‘Unnatural
selection: Perverse incentives and the misallocation
of credit in Japan’, American Economic Review 95,
1144–1166.
Wilcox, J.A. (2008), ‘Why the US won’t have a “lost
decade”’, Working Paper.
ARTICLES
Non-Banking Finance Companies in India’s Financial Landscape
Consumer Confidence Survey – Q2:2016-17 to Q1:2017-18

article
RBI Bulletin October 2017 91
Non-Banking Finance Companies in India’s Financial Landscape
Non-Banking Finance Companies (NBFCs) have played an important role in the Indian financial system by complementing and competing with banks, and by bringing in efficiency and diversity into financial intermediation. NBFCs have evolved considerably in terms of operations, heterogeneity, asset quality and profitability, and regulatory architecture. Going forward, the growing systemic importance and interconnectedness of this sector calls for regulatory vigil.
Section 1: Introduction
The world over, non-banking financial entities
complement the mainstream banking system in
the process of financial intermediation. Regarded as
shadow banks by the Financial Stability Board (FSB)
–“entities and activities (fully or partially) outside the
regular banking system”1 (FSB, 2017), these specialised
intermediaries leverage on lower transaction costs,
financial innovations and regulatory arbitrage. In
emerging economies, they often play an important role
because of their ability to (a) reach out to inaccessible
areas; and (b) act as not just complements but also
substitutes to banks when the banks are confronted
with stricter regulatory constraints. Customers tend to
* This article is prepared by Smt. K.M. Neelima and Shri Anand Kumar under the guidance of Dr. Pallavi Chavan and Dr. Jai Chander in the Division of Non-Bank Financial Studies of the Department of Economic and Policy Research, Reserve Bank of India. The valuable insights as well as data support from the Department of Non-Banking Supervision are gratefully acknowledged. The views expressed in this article are those of the authors and do not represent the views of the Reserve Bank of India.1 All financial institutions not classified as banks, insurance corporations, pension funds, public financial institutions, central banks or financial auxiliaries; and as a narrow measure, finance companies, leasing companies, factoring companies, money market mutual funds, fixed income funds, real estate funds and securitisation vehicles. Financial auxiliaries consist of financial corporations that are principally engaged in activities associated with transactions or with providing the regulatory context for these transactions but in circumstances that do not involve the auxiliary taking ownership of the financial assets and liabilities being transacted (System of National Accounts, 2008).
Non-Banking Finance Companies in India’s Financial Landscape*
find the non-banking entities convenient due to their
quicker decision-making ability, prompt provision of
services and expertise in niche segments. Apart from
widening the ambit of and access to financial services,
they also enhance the resilience of the financial
system by acting as backup institutions when banks
come under stress.
Given the nature of their operations, NBFCs
also carry inherent risks including, excess leverage,
amplification of procyclicality and over-reliance on
wholesale funding (Ghosh, et al, 2012). Given their
exposure to niche segments, they may also suffer from
concentration of risks. They are often not allowed the
benefit from the central bank as lender of last resort
and from deposits insurance institutions.
The shadow banking sector in India primarily
includes NBFCs and collective investment vehicles
such as money market funds, fixed income funds,
mixed funds, real estate funds, and securitisation-
based credit intermediation like securitisation vehicles
and structured finance vehicles. NBFCs are, however,
distinctly different from shadow banking entities in
other countries. They are regulated by the Reserve
Bank of India (RBI) with priority being assigned to
calibrating regulations to harmonise them with
those of the banking sector regulations to minimise
the scope of regulatory arbitrage. NBFCs are gaining
increasing importance in the Indian financial system,
accounting for about 9 per cent of the total assets of
the financial sector – the third largest segment after
scheduled commercial banks or SCBs (64 per cent)
and insurance companies (14 per cent) (RBI, 2014).2
Mapping of the degree of interconnectedness showed
that NBFCs had the third largest bilateral exposures
after banks and mutual funds. Also, they were the
biggest receivers of funds, on a net basis, surpassing
2 The remaining segments are mutual funds with a share of about 6 per cent, specialised financial institutions (3 per cent), urban cooperative banks and regional rural banks (4 per cent) (RBI, 2014).
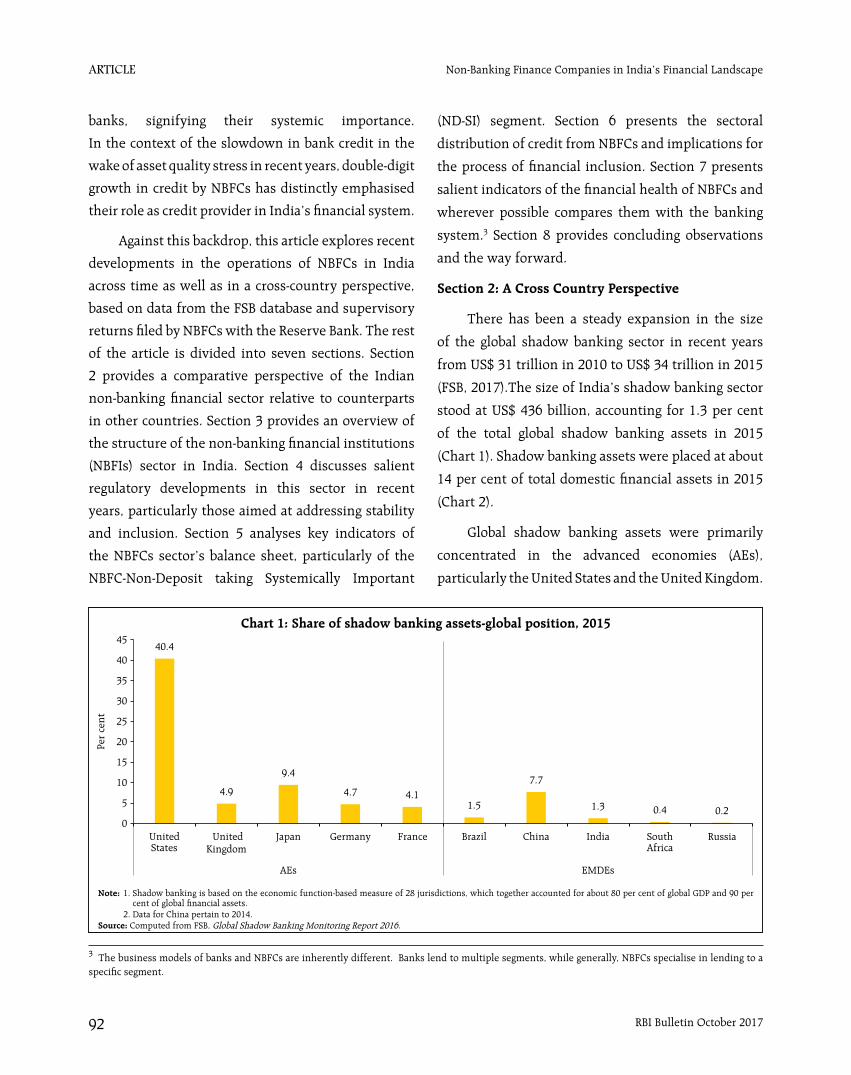
article
RBI Bulletin October 201792
Non-Banking Finance Companies in India’s Financial Landscape
Chart 1: Share of shadow banking assets-global position, 2015
Note: 1. Shadow banking is based on the economic function-based measure of 28 jurisdictions, which together accounted for about 80 per cent of global GDP and 90 per cent of global financial assets.
2. Data for China pertain to 2014.Source: Computed from FSB, Global Shadow Banking Monitoring Report 2016.
banks, signifying their systemic importance.
In the context of the slowdown in bank credit in the
wake of asset quality stress in recent years, double-digit
growth in credit by NBFCs has distinctly emphasised
their role as credit provider in India’s financial system.
Against this backdrop, this article explores recent
developments in the operations of NBFCs in India
across time as well as in a cross-country perspective,
based on data from the FSB database and supervisory
returns filed by NBFCs with the Reserve Bank. The rest
of the article is divided into seven sections. Section
2 provides a comparative perspective of the Indian
non-banking financial sector relative to counterparts
in other countries. Section 3 provides an overview of
the structure of the non-banking financial institutions
(NBFIs) sector in India. Section 4 discusses salient
regulatory developments in this sector in recent
years, particularly those aimed at addressing stability
and inclusion. Section 5 analyses key indicators of
the NBFCs sector’s balance sheet, particularly of the
NBFC-Non-Deposit taking Systemically Important
(ND-SI) segment. Section 6 presents the sectoral
distribution of credit from NBFCs and implications for
the process of financial inclusion. Section 7 presents
salient indicators of the financial health of NBFCs and
wherever possible compares them with the banking
system.3 Section 8 provides concluding observations
and the way forward.
Section 2: A Cross Country Perspective
There has been a steady expansion in the size
of the global shadow banking sector in recent years
from US$ 31 trillion in 2010 to US$ 34 trillion in 2015
(FSB, 2017).The size of India’s shadow banking sector
stood at US$ 436 billion, accounting for 1.3 per cent
of the total global shadow banking assets in 2015
(Chart 1). Shadow banking assets were placed at about
14 per cent of total domestic financial assets in 2015
(Chart 2).
Global shadow banking assets were primarily
concentrated in the advanced economies (AEs),
particularly the United States and the United Kingdom.
3 The business models of banks and NBFCs are inherently different. Banks lend to multiple segments, while generally, NBFCs specialise in lending to a specific segment.
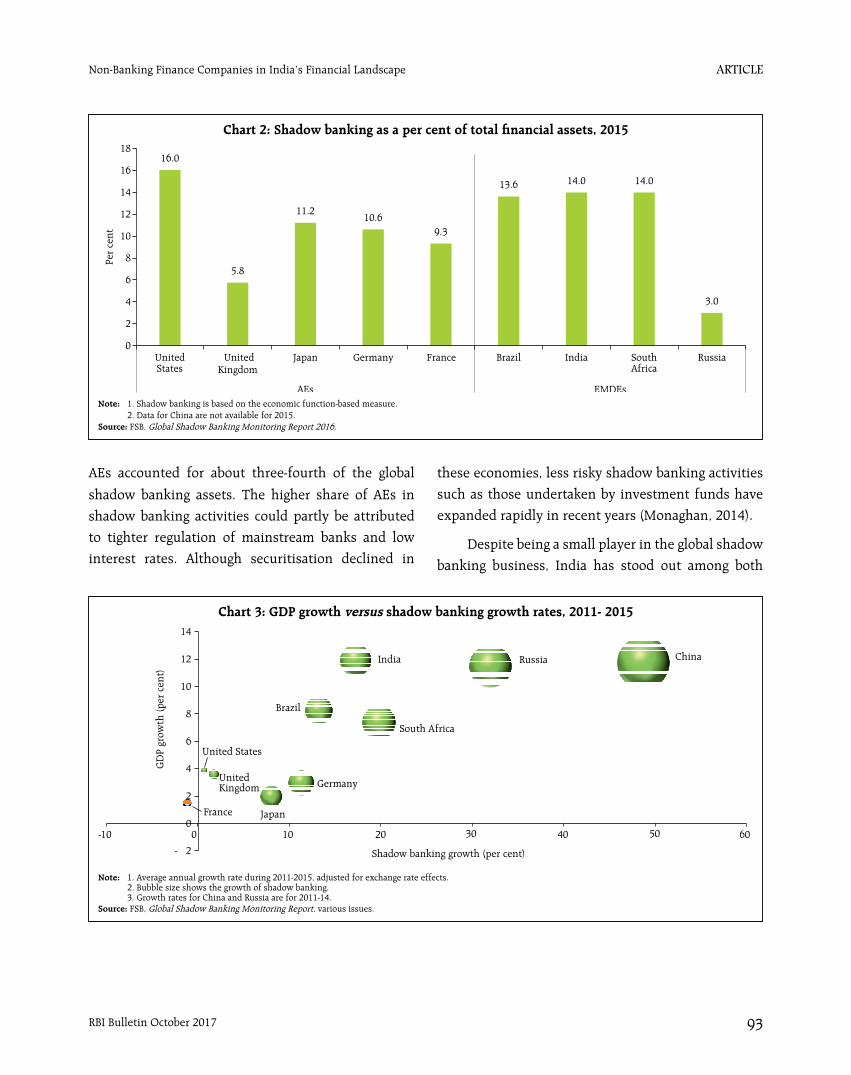
article
RBI Bulletin October 2017 93
Non-Banking Finance Companies in India’s Financial Landscape
AEs accounted for about three-fourth of the global
shadow banking assets. The higher share of AEs in
shadow banking activities could partly be attributed
to tighter regulation of mainstream banks and low
interest rates. Although securitisation declined in
these economies, less risky shadow banking activities
such as those undertaken by investment funds have
expanded rapidly in recent years (Monaghan, 2014).
Despite being a small player in the global shadow
banking business, India has stood out among both
Chart 2: Shadow banking as a per cent of total financial assets, 2015
Note: 1. Shadow banking is based on the economic function-based measure. 2. Data for China are not available for 2015.Source: FSB, Global Shadow Banking Monitoring Report 2016.
Chart 3: GDP growth versus shadow banking growth rates, 2011- 2015
Note: 1. Average annual growth rate during 2011-2015, adjusted for exchange rate effects. 2. Bubble size shows the growth of shadow banking. 3. Growth rates for China and Russia are for 2011-14.Source: FSB, Global Shadow Banking Monitoring Report, various issues.
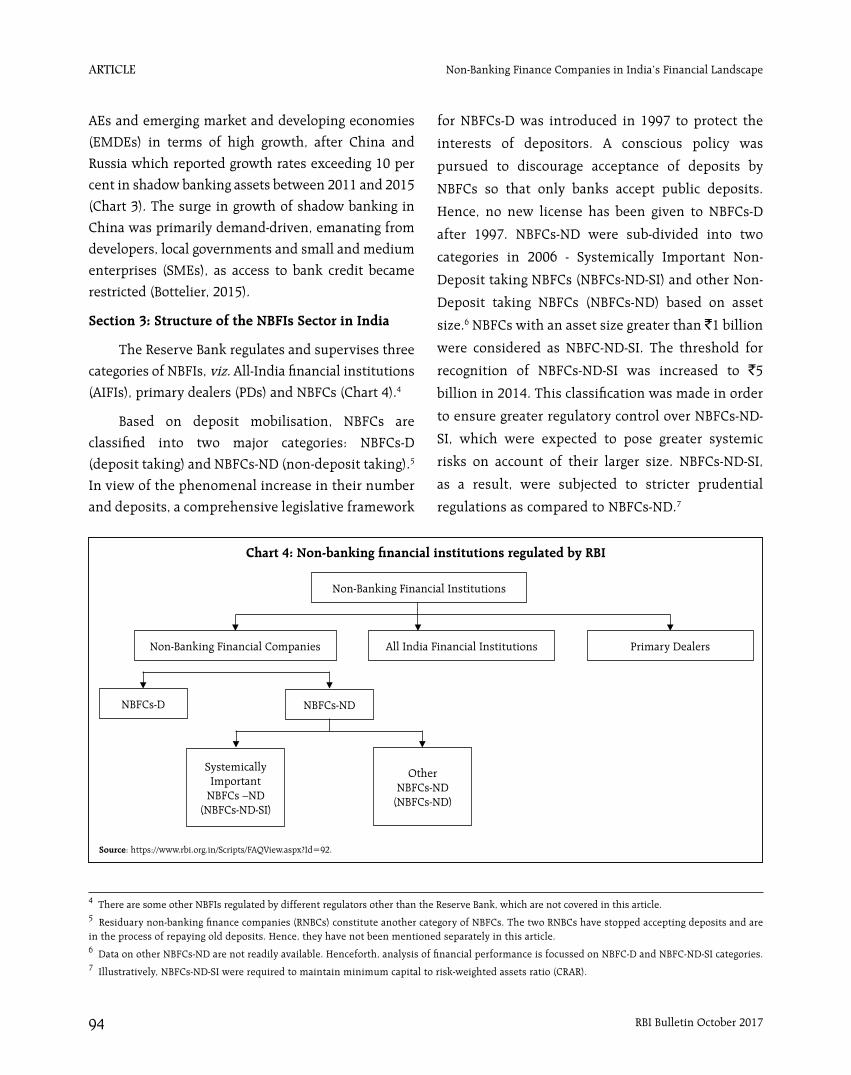
article
RBI Bulletin October 201794
Non-Banking Finance Companies in India’s Financial Landscape
AEs and emerging market and developing economies
(EMDEs) in terms of high growth, after China and
Russia which reported growth rates exceeding 10 per
cent in shadow banking assets between 2011 and 2015
(Chart 3). The surge in growth of shadow banking in
China was primarily demand-driven, emanating from
developers, local governments and small and medium
enterprises (SMEs), as access to bank credit became
restricted (Bottelier, 2015).
Section 3: Structure of the NBFIs Sector in India
The Reserve Bank regulates and supervises three
categories of NBFIs, viz. All-India financial institutions
(AIFIs), primary dealers (PDs) and NBFCs (Chart 4).4
Based on deposit mobilisation, NBFCs are
classified into two major categories: NBFCs-D
(deposit taking) and NBFCs-ND (non-deposit taking).5
In view of the phenomenal increase in their number
and deposits, a comprehensive legislative framework
for NBFCs-D was introduced in 1997 to protect the
interests of depositors. A conscious policy was
pursued to discourage acceptance of deposits by
NBFCs so that only banks accept public deposits.
Hence, no new license has been given to NBFCs-D
after 1997. NBFCs-ND were sub-divided into two
categories in 2006 - Systemically Important Non-
Deposit taking NBFCs (NBFCs-ND-SI) and other Non-
Deposit taking NBFCs (NBFCs-ND) based on asset
size.6 NBFCs with an asset size greater than `1 billion
were considered as NBFC-ND-SI. The threshold for
recognition of NBFCs-ND-SI was increased to `5
billion in 2014. This classification was made in order
to ensure greater regulatory control over NBFCs-ND-
SI, which were expected to pose greater systemic
risks on account of their larger size. NBFCs-ND-SI,
as a result, were subjected to stricter prudential
regulations as compared to NBFCs-ND.7
4 There are some other NBFIs regulated by different regulators other than the Reserve Bank, which are not covered in this article.5 Residuary non-banking finance companies (RNBCs) constitute another category of NBFCs. The two RNBCs have stopped accepting deposits and are in the process of repaying old deposits. Hence, they have not been mentioned separately in this article.6 Data on other NBFCs-ND are not readily available. Henceforth, analysis of financial performance is focussed on NBFC-D and NBFC-ND-SI categories.7 Illustratively, NBFCs-ND-SI were required to maintain minimum capital to risk-weighted assets ratio (CRAR).
NBFCs-D
Systemically Important
NBFCs –ND (NBFCs-ND-SI)
Chart 4: Non-banking financial institutions regulated by RBI
Source: https://www.rbi.org.in/Scripts/FAQView.aspx?Id=92.
Non-Banking Financial Institutions
All India Financial InstitutionsNon-Banking Financial Companies
NBFCs-ND
Other NBFCs-ND
(NBFCs-ND)
Primary Dealers

article
RBI Bulletin October 2017 95
Non-Banking Finance Companies in India’s Financial Landscape
The number of NBFCs-ND-SI increased till 2014
due to increased licences given to these entities
following notification of newer categories. Thereafter,
there was a decline in their number mainly reflecting
the increase in threshold asset size for defining
NBFCs-ND-SI (Table 1). NBFCs-ND-SI have become
significantly larger than NBFCs-D – their share in total
assets of the two categories taken together was about
86 per cent in 2017 (Chart 5).
Based on activities undertaken, NBFCs are
classified into 12 major categories8 (Table 2). While
loan companies and investment companies have
traditionally been the two core categories of the
NBFC sector, newer categories have been added to
this sector over time in recognition of the growing
diversification of financial intermediation and the
need for better regulatory oversight. Illustratively,
in 2006, ‘hire purchase’ and ‘equipment leasing’
categories were merged and categorised as Asset
Finance Companies (AFCs) – the third major category
in the NBFC sector. Infrastructure Finance Companies
(NBFC-IFC) were defined as a separate category in
2010. NBFC-IDFs were set up in 2011 to increase long-
term debt financing of infrastructure projects as well
as to alleviate asset liability mismatches arising out
of financing such projects. They were envisaged to
take over loans provided for infrastructure projects
based on Public Private Partnership (PPP) route which
had completed one year of commercial operation.9
NBFCs-MFI were also set up in 2011 in order to serve
Table 1: Number of different types of NBFCs in India: end-March position
Year NBFC-D NBFC-ND-SI NBFC-ND Total
2012 273 375 12,010 12,3852013 254 418 11,553 12,2252014 241 465 11,323 12,0292015 220 420 11,202 11,8422016 202 209 11,271 11,6822017 (P) 178 218 11,126 11,522
P: Provisional.Sources: 1. Report of Trend and Progress of Banking in India, various
issues. 2. Supervisory returns, RBI.
Chart 5: Distribution of assets across NBFCs-ND-SI and NBFCs-D: end-March position
P: Provisional.Source: 1. Report of Trend and Progress of Banking in India, various issues. 2. Supervisory returns, RBI.
8 Asset Reconstruction Companies (ARCs), set up for resolving Non-Performing Assets (NPAs) of banks and financial institutions, are also given registration by the Reserve Bank under the provisions of the Securitisation and Reconstruction of Financial Assets and Enforcement of Security Interest Act, 2002 (SARFAESI Act). Hence, their business model is inherently different from other NBFCs. They are, therefore, not captured in Table 2.9 Subsequently, in 2015, they were also allowed to undertake investments in non-PPP projects.
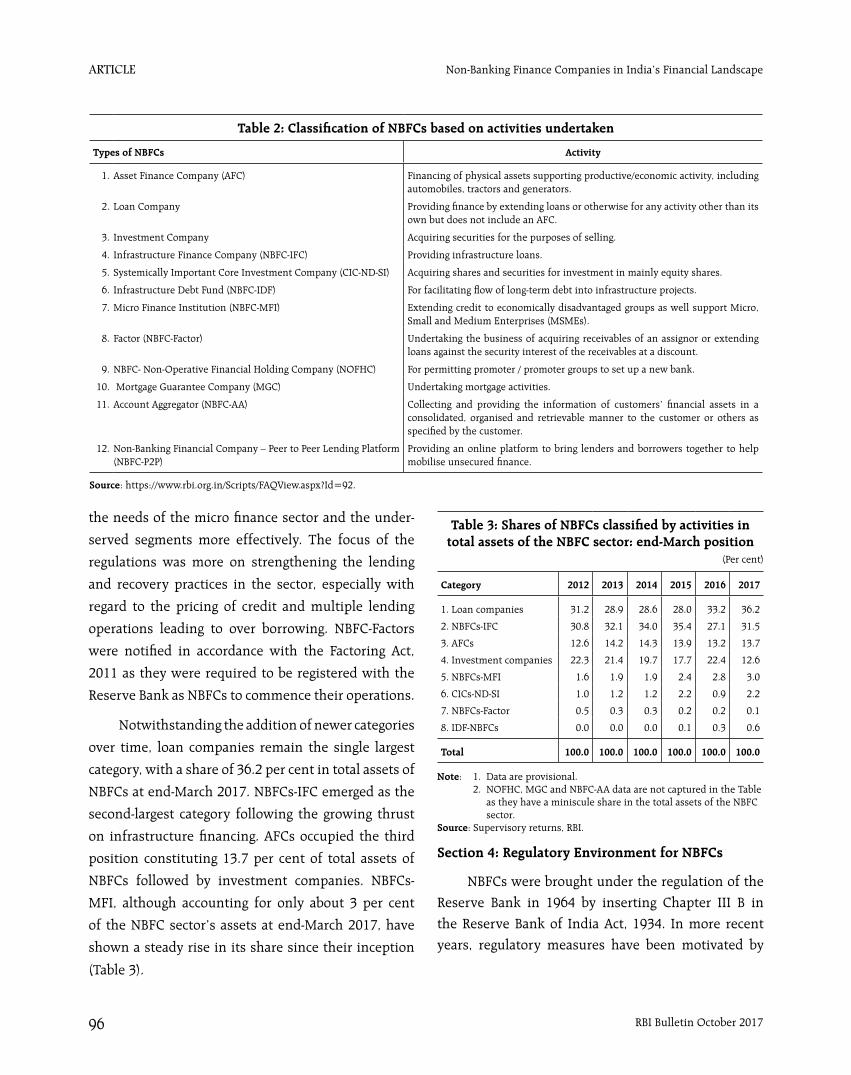
article
RBI Bulletin October 201796
Non-Banking Finance Companies in India’s Financial Landscape
the needs of the micro finance sector and the under-
served segments more effectively. The focus of the
regulations was more on strengthening the lending
and recovery practices in the sector, especially with
regard to the pricing of credit and multiple lending
operations leading to over borrowing. NBFC-Factors
were notified in accordance with the Factoring Act,
2011 as they were required to be registered with the
Reserve Bank as NBFCs to commence their operations.
Notwithstanding the addition of newer categories
over time, loan companies remain the single largest
category, with a share of 36.2 per cent in total assets of
NBFCs at end-March 2017. NBFCs-IFC emerged as the
second-largest category following the growing thrust
on infrastructure financing. AFCs occupied the third
position constituting 13.7 per cent of total assets of
NBFCs followed by investment companies. NBFCs-
MFI, although accounting for only about 3 per cent
of the NBFC sector’s assets at end-March 2017, have
shown a steady rise in its share since their inception
(Table 3).
Section 4: Regulatory Environment for NBFCs
NBFCs were brought under the regulation of the
Reserve Bank in 1964 by inserting Chapter III B in
the Reserve Bank of India Act, 1934. In more recent
years, regulatory measures have been motivated by
Table 3: Shares of NBFCs classified by activities in total assets of the NBFC sector: end-March position
(Per cent)
Category 2012 2013 2014 2015 2016 2017
1. Loan companies 31.2 28.9 28.6 28.0 33.2 36.2
2. NBFCs-IFC 30.8 32.1 34.0 35.4 27.1 31.5
3. AFCs 12.6 14.2 14.3 13.9 13.2 13.7
4. Investment companies 22.3 21.4 19.7 17.7 22.4 12.6
5. NBFCs-MFI 1.6 1.9 1.9 2.4 2.8 3.0
6. CICs-ND-SI 1.0 1.2 1.2 2.2 0.9 2.2
7. NBFCs-Factor 0.5 0.3 0.3 0.2 0.2 0.1
8. IDF-NBFCs 0.0 0.0 0.0 0.1 0.3 0.6
Total 100.0 100.0 100.0 100.0 100.0 100.0
Note: 1. Data are provisional. 2. NOFHC, MGC and NBFC-AA data are not captured in the Table
as they have a miniscule share in the total assets of the NBFC sector.
Source: Supervisory returns, RBI.
Table 2: Classification of NBFCs based on activities undertaken
Types of NBFCs Activity
1. Asset Finance Company (AFC) Financing of physical assets supporting productive/economic activity, including automobiles, tractors and generators.
2. Loan Company Providing finance by extending loans or otherwise for any activity other than its own but does not include an AFC.
3. Investment Company Acquiring securities for the purposes of selling.
4. Infrastructure Finance Company (NBFC-IFC) Providing infrastructure loans.
5. Systemically Important Core Investment Company (CIC-ND-SI) Acquiring shares and securities for investment in mainly equity shares.
6. Infrastructure Debt Fund (NBFC-IDF) For facilitating flow of long-term debt into infrastructure projects.
7. Micro Finance Institution (NBFC-MFI) Extending credit to economically disadvantaged groups as well support Micro, Small and Medium Enterprises (MSMEs).
8. Factor (NBFC-Factor) Undertaking the business of acquiring receivables of an assignor or extending loans against the security interest of the receivables at a discount.
9. NBFC- Non-Operative Financial Holding Company (NOFHC) For permitting promoter / promoter groups to set up a new bank.
10. Mortgage Guarantee Company (MGC) Undertaking mortgage activities.
11. Account Aggregator (NBFC-AA) Collecting and providing the information of customers’ financial assets in a consolidated, organised and retrievable manner to the customer or others as specified by the customer.
12. Non-Banking Financial Company – Peer to Peer Lending Platform (NBFC-P2P)
Providing an online platform to bring lenders and borrowers together to help mobilise unsecured finance.
Source: https://www.rbi.org.in/Scripts/FAQView.aspx?Id=92.
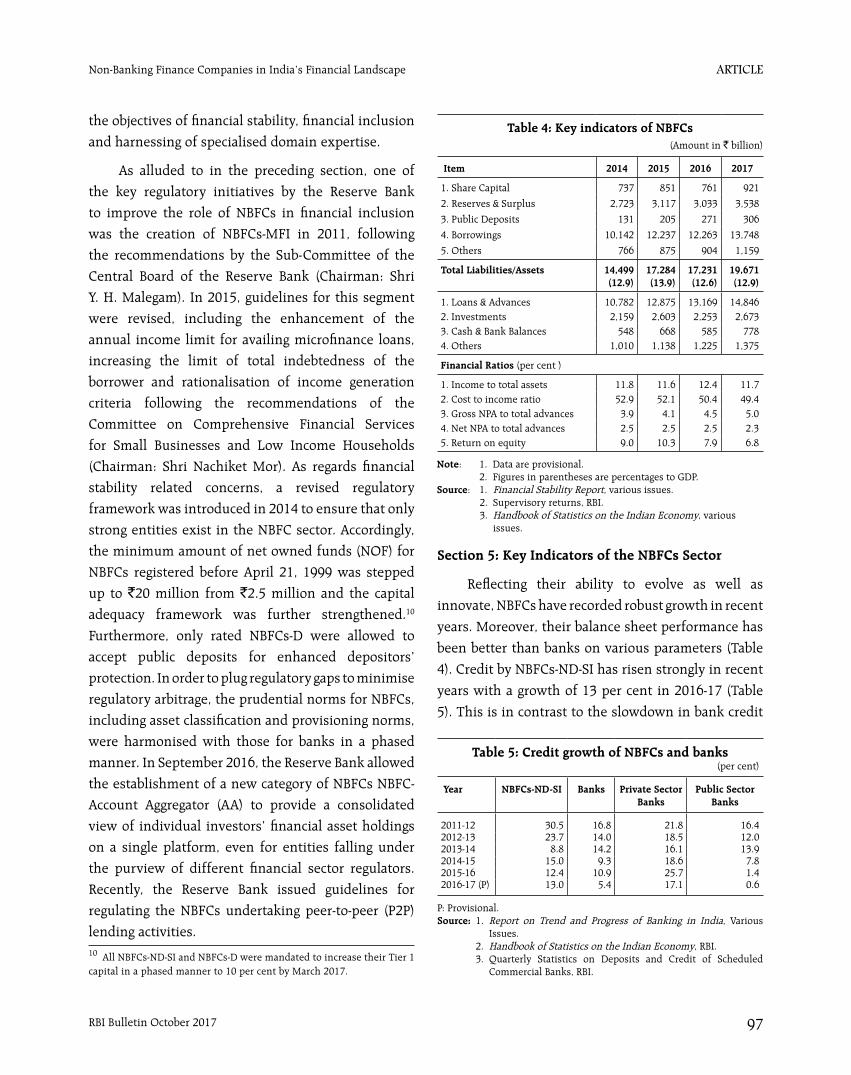
article
RBI Bulletin October 2017 97
Non-Banking Finance Companies in India’s Financial Landscape
the objectives of financial stability, financial inclusion
and harnessing of specialised domain expertise.
As alluded to in the preceding section, one of
the key regulatory initiatives by the Reserve Bank
to improve the role of NBFCs in financial inclusion
was the creation of NBFCs-MFI in 2011, following
the recommendations by the Sub-Committee of the
Central Board of the Reserve Bank (Chairman: Shri
Y. H. Malegam). In 2015, guidelines for this segment
were revised, including the enhancement of the
annual income limit for availing microfinance loans,
increasing the limit of total indebtedness of the
borrower and rationalisation of income generation
criteria following the recommendations of the
Committee on Comprehensive Financial Services
for Small Businesses and Low Income Households
(Chairman: Shri Nachiket Mor). As regards financial
stability related concerns, a revised regulatory
framework was introduced in 2014 to ensure that only
strong entities exist in the NBFC sector. Accordingly,
the minimum amount of net owned funds (NOF) for
NBFCs registered before April 21, 1999 was stepped
up to `20 million from `2.5 million and the capital
adequacy framework was further strengthened.10
Furthermore, only rated NBFCs-D were allowed to
accept public deposits for enhanced depositors’
protection. In order to plug regulatory gaps to minimise
regulatory arbitrage, the prudential norms for NBFCs,
including asset classification and provisioning norms,
were harmonised with those for banks in a phased
manner. In September 2016, the Reserve Bank allowed
the establishment of a new category of NBFCs NBFC-
Account Aggregator (AA) to provide a consolidated
view of individual investors’ financial asset holdings
on a single platform, even for entities falling under
the purview of different financial sector regulators.
Recently, the Reserve Bank issued guidelines for
regulating the NBFCs undertaking peer-to-peer (P2P)
lending activities.
Section 5: Key Indicators of the NBFCs Sector
Reflecting their ability to evolve as well as
innovate, NBFCs have recorded robust growth in recent
years. Moreover, their balance sheet performance has
been better than banks on various parameters (Table
4). Credit by NBFCs-ND-SI has risen strongly in recent
years with a growth of 13 per cent in 2016-17 (Table
5). This is in contrast to the slowdown in bank credit
10 All NBFCs-ND-SI and NBFCs-D were mandated to increase their Tier 1 capital in a phased manner to 10 per cent by March 2017.
Table 4: Key indicators of NBFCs(Amount in ` billion)
Item 2014 2015 2016 2017
1. Share Capital 737 851 761 921
2. Reserves & Surplus 2,723 3,117 3,033 3,538
3. Public Deposits 131 205 271 306
4. Borrowings 10,142 12,237 12,263 13,748
5. Others 766 875 904 1,159
Total Liabilities/Assets 14,499(12.9)
17,284(13.9)
17,231(12.6)
19,671(12.9)
1. Loans & Advances 10,782 12,875 13,169 14,8462. Investments 2,159 2,603 2,253 2,6733. Cash & Bank Balances 548 668 585 7784. Others 1,010 1,138 1,225 1,375
Financial Ratios (per cent )
1. Income to total assets 11.8 11.6 12.4 11.72. Cost to income ratio 52.9 52.1 50.4 49.43. Gross NPA to total advances 3.9 4.1 4.5 5.04. Net NPA to total advances 2.5 2.5 2.5 2.35. Return on equity 9.0 10.3 7.9 6.8
Note: 1. Data are provisional. 2. Figures in parentheses are percentages to GDP.Source: 1. Financial Stability Report, various issues. 2. Supervisory returns, RBI. 3. Handbook of Statistics on the Indian Economy, various
issues.
Table 5: Credit growth of NBFCs and banks(per cent)
Year NBFCs-ND-SI Banks Private Sector Banks
Public Sector Banks
2011-12 30.5 16.8 21.8 16.42012-13 23.7 14.0 18.5 12.02013-14 8.8 14.2 16.1 13.92014-15 15.0 9.3 18.6 7.82015-16 12.4 10.9 25.7 1.42016-17 (P) 13.0 5.4 17.1 0.6
P: Provisional.Source: 1. Report on Trend and Progress of Banking in India, Various
Issues. 2. Handbook of Statistics on the Indian Economy, RBI. 3. Quarterly Statistics on Deposits and Credit of Scheduled
Commercial Banks, RBI.
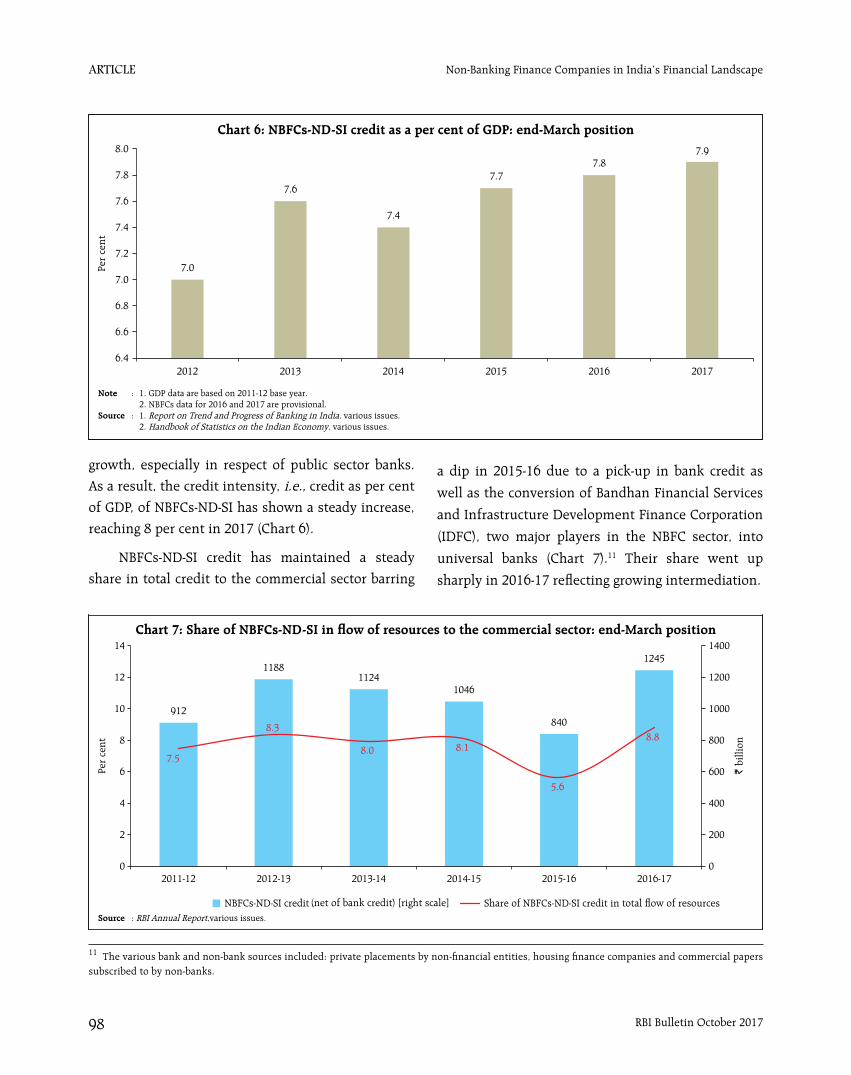
article
RBI Bulletin October 201798
Non-Banking Finance Companies in India’s Financial Landscape
growth, especially in respect of public sector banks.
As a result, the credit intensity, i.e., credit as per cent
of GDP, of NBFCs-ND-SI has shown a steady increase,
reaching 8 per cent in 2017 (Chart 6).
NBFCs-ND-SI credit has maintained a steady
share in total credit to the commercial sector barring
a dip in 2015-16 due to a pick-up in bank credit as
well as the conversion of Bandhan Financial Services
and Infrastructure Development Finance Corporation
(IDFC), two major players in the NBFC sector, into
universal banks (Chart 7).11 Their share went up
sharply in 2016-17 reflecting growing intermediation.
Chart 6: NBFCs-ND-SI credit as a per cent of GDP: end-March position
Note : 1. GDP data are based on 2011-12 base year. 2. NBFCs data for 2016 and 2017 are provisional.Source : 1. Report on Trend and Progress of Banking in India, various issues. 2. Handbook of Statistics on the Indian Economy, various issues.
11 The various bank and non-bank sources included: private placements by non-financial entities, housing finance companies and commercial papers subscribed to by non-banks.
Chart 7: Share of NBFCs-ND-SI in flow of resources to the commercial sector: end-March position
Source : RBI Annual Report,various issues.

article
RBI Bulletin October 2017 99
Non-Banking Finance Companies in India’s Financial Landscape
Among NBFCs-ND-SI, credit extension is the
main business for loan companies, NBFCs-IFC, NBFCs-
MFI, and AFCs. While all these categories of NBFCs
posted double-digit growth till 2015-16, they showed
divergent patterns in 2016-17. Loan companies
and NBFCs-IFC maintained positive credit growth,
whereas NBFCs-MFI and AFCs shrank their asset
portfolios mainly due to conversion of large NBFCs-
MFI into small finance banks during the year (Table 6).
AFCs, which mainly lend to finance vehicles and retail
loans, were affected by the postponement of purchase
decisions by their customers due to uncertainty in the
wake of demonetisation (RBI, 2017).
Protection of depositors’ interests has been a
dominant objective of the Reserve Bank and, therefore,
there has been a conscious move to contain deposit
mobilisation by NBFCs-D. Nevertheless, amount of
public deposits mobilised by NBFCs-D has grown over
time (Chart 8). As a share of total liabilities of NBFCs
sector, it increased from 0.5 per cent in 2012 to 1.6
per cent by end-March 2017. In absolute terms, the
total deposit mobilisation by these institutions stood
at `306 billion at end-March 2017, though less than
one per cent of bank deposits.
Borrowings constitute about 71 per cent of total
liabilities of NBFCs-ND-SI. While banks have been
the main source of borrowings for NBFCs-ND-SI, they
have been increasingly replaced with market-based
instruments in recent years. In 2016-17, NBFCs-
ND-SI largely borrowed through debentures, which
constituted nearly half of their total borrowings.
Borrowing through commercial paper too has
increased over time, reflecting lower cost of raising
funds through these instruments (Chart 9).
Table 6: Growth rate of credit of major categories of NBFCs
Category 2012-13 2013-14 2014-15 2015-16 2016-17
Loan Companies 11.3 7.7 20.5 22.7 22.1
NBFCs-IFC 24.4 17.8 24.6 7.6 5.6
NBFCs-MFI 34.3 21.3 47.6 36.3 -3.4
AFCs 30.0 10.4 13.2 23.1 -17.1
Note: Data are provisional.Source: Supervisory returns, RBI.
P: Provisional.Source: 1. Report on Trend and Progress of Banking in India 2012-13, RBI. 2. Statistical Tables Related to Banks in India, various issues, RBI. 3. Supervisory returns, RBI.
Chart 8: Public deposits of NBFCs-D - amount and share in total liabilities: end-March position
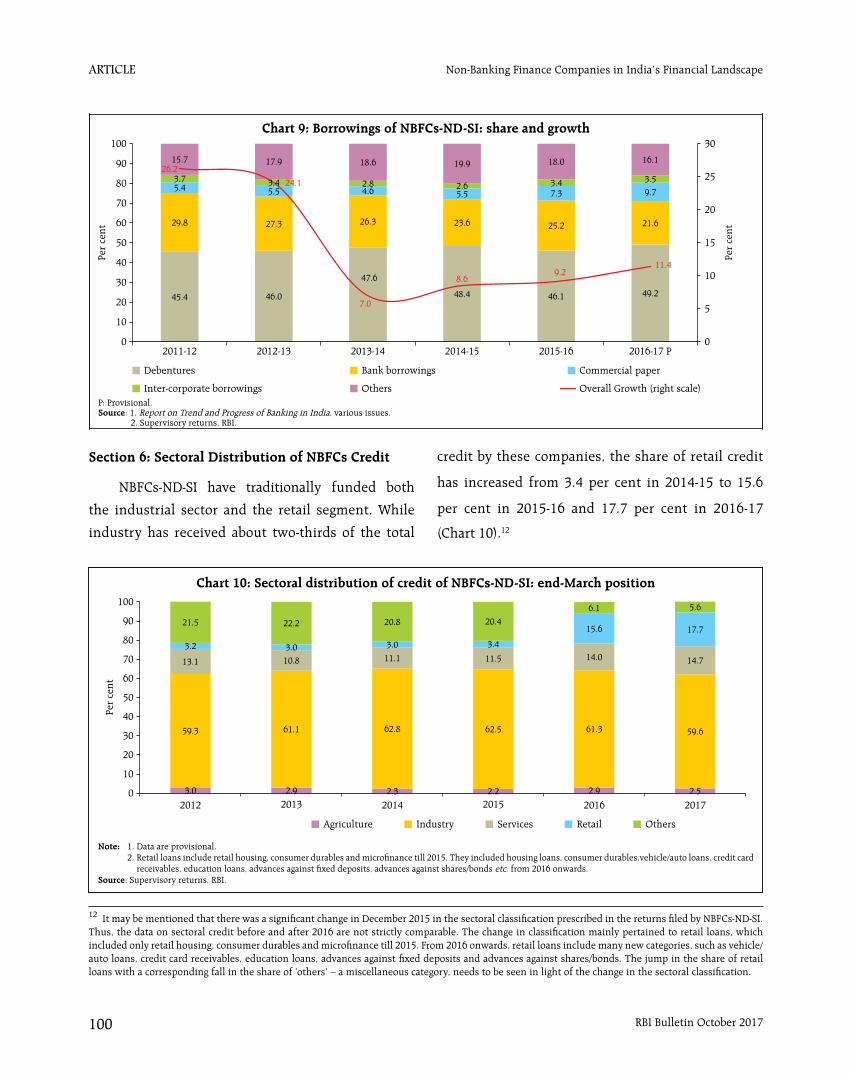
article
RBI Bulletin October 2017100
Non-Banking Finance Companies in India’s Financial Landscape
Section 6: Sectoral Distribution of NBFCs Credit
NBFCs-ND-SI have traditionally funded both
the industrial sector and the retail segment. While
industry has received about two-thirds of the total
credit by these companies, the share of retail credit
has increased from 3.4 per cent in 2014-15 to 15.6
per cent in 2015-16 and 17.7 per cent in 2016-17
(Chart 10).12
Chart 9: Borrowings of NBFCs-ND-SI: share and growth
P: Provisional.Source: 1. Report on Trend and Progress of Banking in India, various issues. 2. Supervisory returns, RBI.
Chart 10: Sectoral distribution of credit of NBFCs-ND-SI: end-March position
Note: 1. Data are provisional. 2. Retail loans include retail housing, consumer durables and microfinance till 2015. They included housing loans, consumer durables,vehicle/auto loans, credit card
receivables, education loans, advances against fixed deposits, advances against shares/bonds etc. from 2016 onwards.Source: Supervisory returns, RBI.
12 It may be mentioned that there was a significant change in December 2015 in the sectoral classification prescribed in the returns filed by NBFCs-ND-SI. Thus, the data on sectoral credit before and after 2016 are not strictly comparable. The change in classification mainly pertained to retail loans, which included only retail housing, consumer durables and microfinance till 2015. From 2016 onwards, retail loans include many new categories, such as vehicle/auto loans, credit card receivables, education loans, advances against fixed deposits and advances against shares/bonds. The jump in the share of retail loans with a corresponding fall in the share of ‘others’ – a miscellaneous category, needs to be seen in light of the change in the sectoral classification.
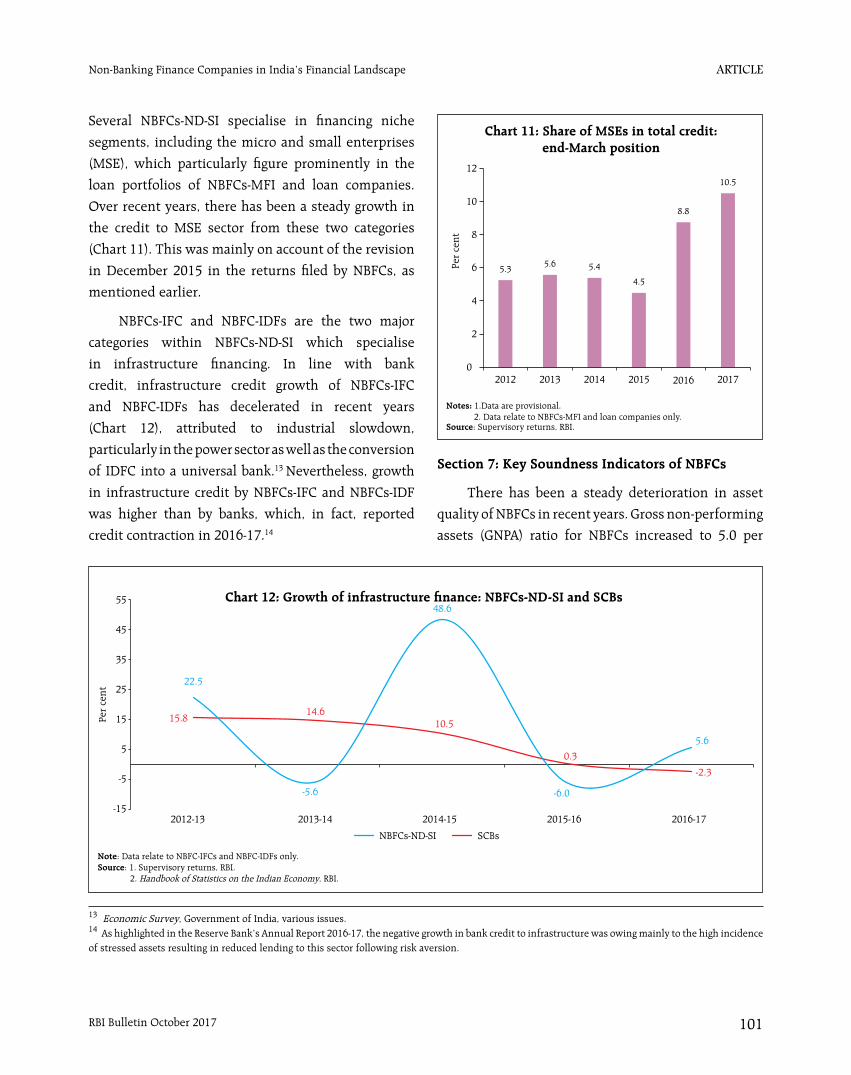
article
RBI Bulletin October 2017 101
Non-Banking Finance Companies in India’s Financial Landscape
Several NBFCs-ND-SI specialise in financing niche
segments, including the micro and small enterprises
(MSE), which particularly figure prominently in the
loan portfolios of NBFCs-MFI and loan companies.
Over recent years, there has been a steady growth in
the credit to MSE sector from these two categories
(Chart 11). This was mainly on account of the revision
in December 2015 in the returns filed by NBFCs, as
mentioned earlier.
NBFCs-IFC and NBFC-IDFs are the two major
categories within NBFCs-ND-SI which specialise
in infrastructure financing. In line with bank
credit, infrastructure credit growth of NBFCs-IFC
and NBFC-IDFs has decelerated in recent years
(Chart 12), attributed to industrial slowdown,
particularly in the power sector as well as the conversion
of IDFC into a universal bank.13 Nevertheless, growth
in infrastructure credit by NBFCs-IFC and NBFCs-IDF
was higher than by banks, which, in fact, reported
credit contraction in 2016-17.14
13 Economic Survey, Government of India, various issues. 14 As highlighted in the Reserve Bank’s Annual Report 2016-17, the negative growth in bank credit to infrastructure was owing mainly to the high incidence of stressed assets resulting in reduced lending to this sector following risk aversion.
Chart 11: Share of MSEs in total credit: end-March position
Notes: 1.Data are provisional. 2. Data relate to NBFCs-MFI and loan companies only.Source: Supervisory returns, RBI.
Chart 12: Growth of infrastructure finance: NBFCs-ND-SI and SCBs
Section 7: Key Soundness Indicators of NBFCs
There has been a steady deterioration in asset
quality of NBFCs in recent years. Gross non-performing
assets (GNPA) ratio for NBFCs increased to 5.0 per
Note: Data relate to NBFC-IFCs and NBFC-IDFs only.Source: 1. Supervisory returns, RBI. 2. Handbook of Statistics on the Indian Economy, RBI.
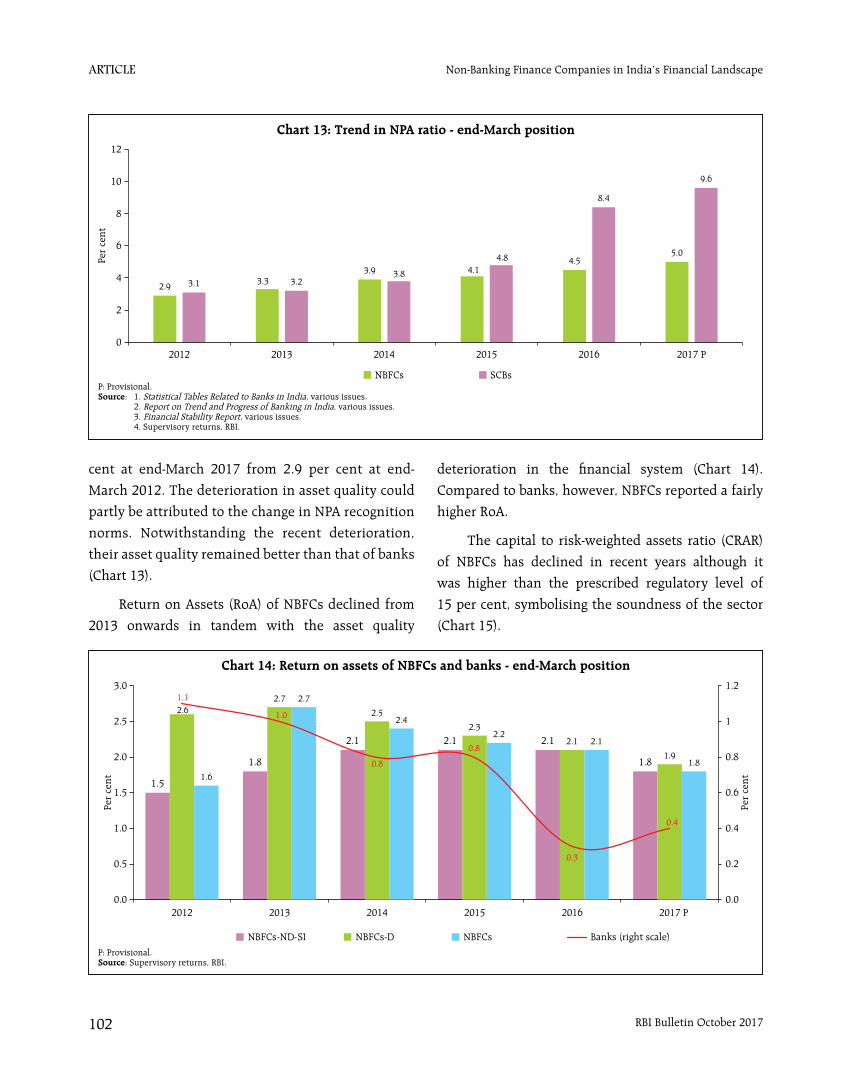
article
RBI Bulletin October 2017102
Non-Banking Finance Companies in India’s Financial Landscape
cent at end-March 2017 from 2.9 per cent at end-
March 2012. The deterioration in asset quality could
partly be attributed to the change in NPA recognition
norms. Notwithstanding the recent deterioration,
their asset quality remained better than that of banks
(Chart 13).
Return on Assets (RoA) of NBFCs declined from
2013 onwards in tandem with the asset quality
deterioration in the financial system (Chart 14).
Compared to banks, however, NBFCs reported a fairly
higher RoA.
The capital to risk-weighted assets ratio (CRAR)
of NBFCs has declined in recent years although it
was higher than the prescribed regulatory level of
15 per cent, symbolising the soundness of the sector
(Chart 15).
Chart 13: Trend in NPA ratio - end-March position
P: Provisional.Source: 1. Statistical Tables Related to Banks in India, various issues. 2. Report on Trend and Progress of Banking in India, various issues. 3. Financial Stability Report, various issues. 4. Supervisory returns, RBI.
P: Provisional.Source: Supervisory returns, RBI.
Chart 14: Return on assets of NBFCs and banks - end-March position
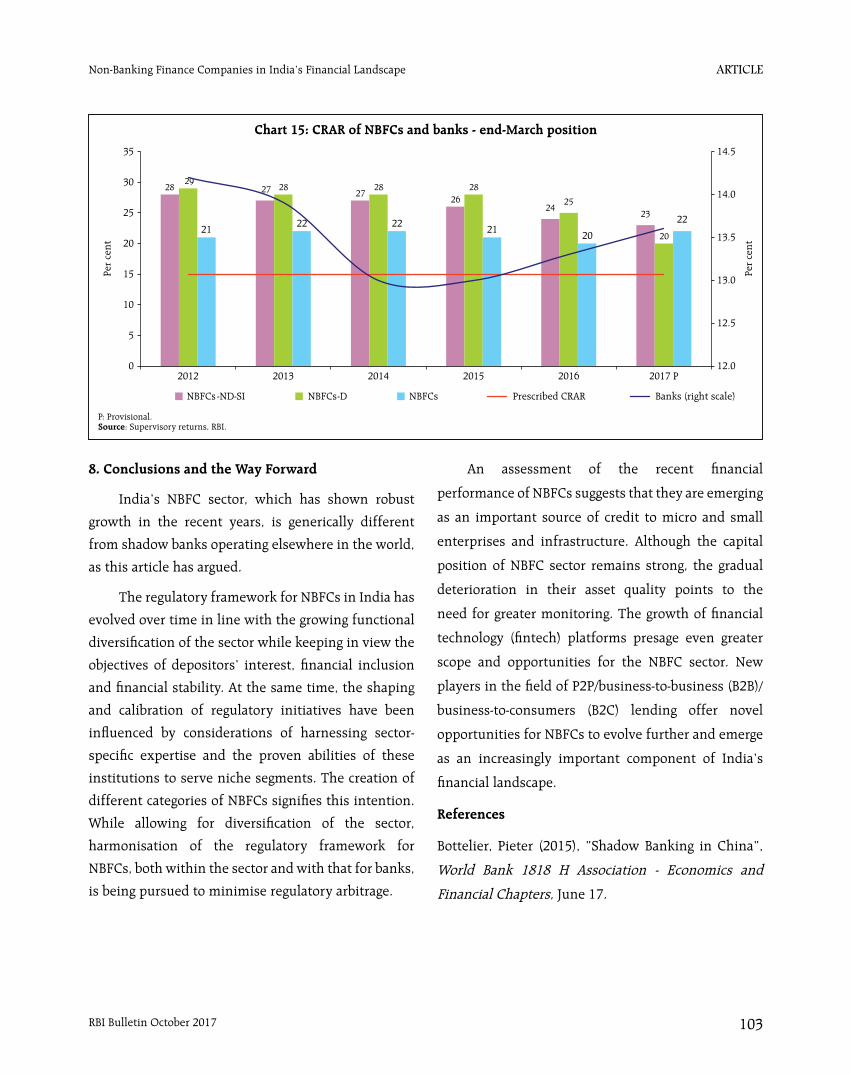
article
RBI Bulletin October 2017 103
Non-Banking Finance Companies in India’s Financial Landscape
8. Conclusions and the Way Forward
India’s NBFC sector, which has shown robust
growth in the recent years, is generically different
from shadow banks operating elsewhere in the world,
as this article has argued.
The regulatory framework for NBFCs in India has
evolved over time in line with the growing functional
diversification of the sector while keeping in view the
objectives of depositors’ interest, financial inclusion
and financial stability. At the same time, the shaping
and calibration of regulatory initiatives have been
influenced by considerations of harnessing sector-
specific expertise and the proven abilities of these
institutions to serve niche segments. The creation of
different categories of NBFCs signifies this intention.
While allowing for diversification of the sector,
harmonisation of the regulatory framework for
NBFCs, both within the sector and with that for banks,
is being pursued to minimise regulatory arbitrage.
An assessment of the recent financial
performance of NBFCs suggests that they are emerging
as an important source of credit to micro and small
enterprises and infrastructure. Although the capital
position of NBFC sector remains strong, the gradual
deterioration in their asset quality points to the
need for greater monitoring. The growth of financial
technology (fintech) platforms presage even greater
scope and opportunities for the NBFC sector. New
players in the field of P2P/business-to-business (B2B)/
business-to-consumers (B2C) lending offer novel
opportunities for NBFCs to evolve further and emerge
as an increasingly important component of India’s
financial landscape.
References
Bottelier, Pieter (2015), “Shadow Banking in China”,
World Bank 1818 H Association - Economics and
Financial Chapters, June 17.
Chart 15: CRAR of NBFCs and banks - end-March position
P: Provisional.Source: Supervisory returns, RBI.
article
RBI Bulletin October 2017104
Non-Banking Finance Companies in India’s Financial Landscape
FSB (2015), Global Shadow Banking Monitoring Report
- 2015, Financial Stability Board.
- (2017), Global Shadow Banking Monitoring Report -
2016, Financial Stability Board.
Ghosh Swati, Mazo Ines Gonzalez del, and Ötker-Robe
İnci. (2012), “Chasing the Shadows: How Significant Is
Shadow Banking in Emerging Markets?” World Bank
Economic Premise, (88).
Monaghan, Angela (2014), “Shadow banking system
a growing risk to financial stability – IMF”, The
Guardian, October 01.
RBI (2014), Financial Stability Report, December,
Reserve Bank of India, Mumbai.
- (2017), Macroeconomic Impact of Demonetisation-
A Preliminary Assessment, Reserve Bank of India,
Mumbai.
article
RBI Bulletin October 2017 105
Consumer Confidence Survey – Q2:2016-17 to Q1:2017-18
and Consumer Sentiment Index of the University of Michigan for the US; Consumer Confidence Index of the Conference Board of Canada).
The Reserve Bank has been a pioneer in propagating the use of consumer confidence surveys in India on a large scale - its own quarterly survey was introduced in June 20102. At present, the survey is conducted in six major cities – Bengaluru; Chennai; Hyderabad; Kolkata; Mumbai; and New Delhi - covering 5,400 respondents in each round (approximately 900 per city). A hybrid two-stage sampling design is adopted. In the first stage, polling booths in a city are selected by systematic random sampling after arranging all polling booths according to their constituencies. About 45 polling booths spread over the entire city are selected in order to ensure the widest geographical coverage. In the second stage, 20 respondents are selected from each polling booth area by following the right hand rule#.
In the survey, responses are canvassed around two reference points in time, viz., the current situation as compared with a year ago and expectations for a year ahead, with reference to five parameters - economic conditions; income; spending; the price level; and employment. Net responses i.e., the difference between positive and negative perceptions on the five parameters are combined to create a current situation index (CSI), which seeks to capture consumer sentiments about the prevailing state of affairs, and the future expectations index (FEI), which gauges the near-term outlook of consumers on these parameters (Annex). The CSI and the FEI can take values between
0 and 200.
1. Introduction
Consumer confidence is a measure of sentiment
about the state of the economy as reflected in the
perceptions of a key economic agent – the consumer.
By polling consumers’ opinions about macroeconomic
conditions – as for example, employment; income;
the price situation; and the outlook- it is possible to
obtain a reasonable gauge of consumption spending,
which is a major component of aggregate demand
in the economy. The literature provides robust
evidence of indicators of consumer confidence
being good predictors of consumer spending with
a lead content of four to five months (Gelper et. al. 2007). Consequently, economic agents that influence
aggregate supply – manufacturers; retailers; investors;
builders; government agencies - rely on measures
of consumer confidence to make an assessment of
consumption expenditure which, in turn, forms their
production decisions. These indicators also provide
useful insights to wielders of monetary and fiscal
policies who have to make decisions on modulating
aggregate demand in the economy around the path
of productive capacity in the economy in order to
ensure macroeconomic stability. Consequently,
several central banks conduct their own consumer
confidence surveys1, while others depend on surveys
carried out by independent organisations (the
Consumer Confidence Index of the Conference Board
* This article is prepared by Smt. Sangeetha Mathews and Shri D P Singh under the guidance of Dr. Goutam Chatterjee in the Division of Household Surveys of the Department of Statistics and Information Management. The valuable inputs and suggestions provided by Dr. Michael D Patra, Executive Director are gratefully acknowledged. The authors would also like to thank Dr. Snehal Herwadkar, Monetary Policy Department for her remarkable contribution to this article. The views expressed in the article are those of the authors and do not represent the views of the Reserve Bank of India.1 An illustrative list of central banks that conduct their own consumer confidence surveys includes Bank of Japan, Bank of Korea, Bank Indonesia and the Central Bank of the Republic of Turkey
2 Two other agencies in India conduct consumer confidence surveys. While Thomson-Reuters initiated a survey in March 2010, it was an online poll restricted to 500 adults. The survey conducted by the Centre for Monitoring the Indian Economy (CMIE) through its consumer pyramids panel was introduced in 2015.
# A method in which the first household from each polling booth area is selected randomly and the subsequent respondent is selected from the 11th household by moving in the right hand direction and skipping 10 houses. The process is continued till the sample size for each polling booth is achieved.
Consumer Confidence Survey – Q2:2016-17 to Q1:2017-18*
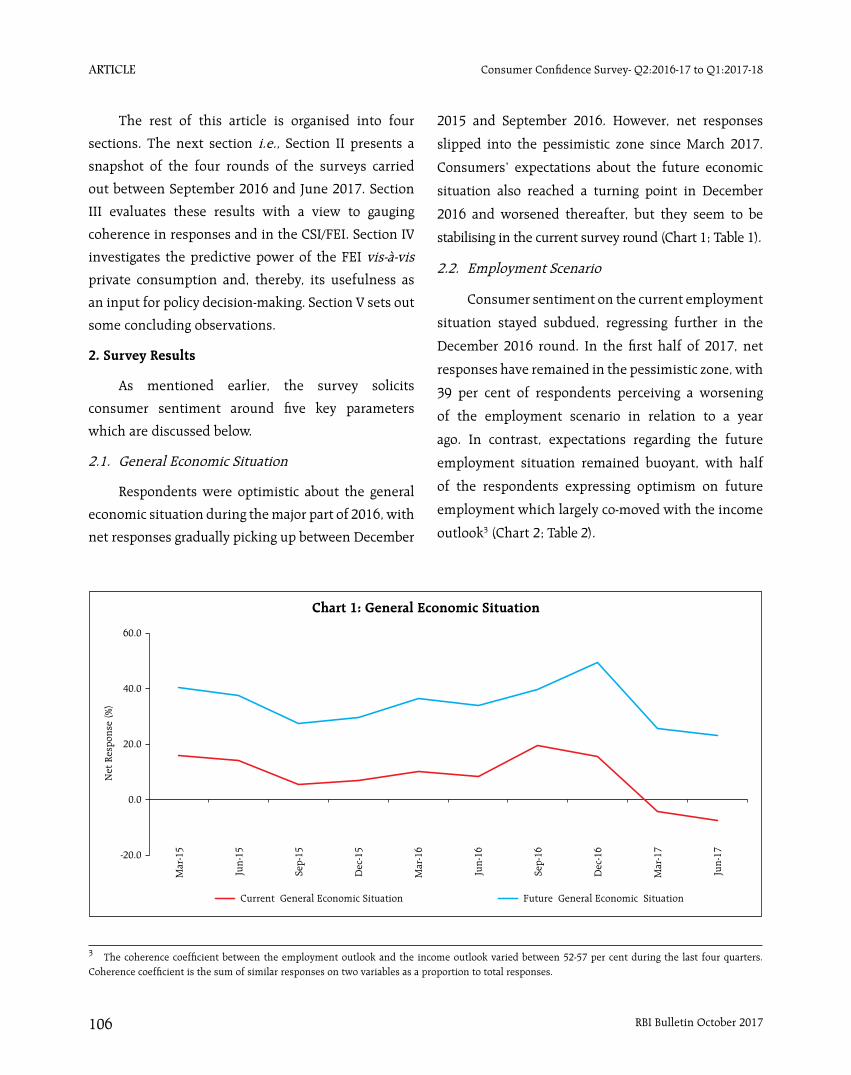
article
RBI Bulletin October 2017106
Consumer Confidence Survey- Q2:2016-17 to Q1:2017-18
The rest of this article is organised into four
sections. The next section i.e., Section II presents a
snapshot of the four rounds of the surveys carried
out between September 2016 and June 2017. Section
III evaluates these results with a view to gauging
coherence in responses and in the CSI/FEI. Section IV
investigates the predictive power of the FEI vis-à-vis
private consumption and, thereby, its usefulness as
an input for policy decision-making. Section V sets out
some concluding observations.
2. Survey Results
As mentioned earlier, the survey solicits
consumer sentiment around five key parameters
which are discussed below.
2.1. General Economic Situation
Respondents were optimistic about the general
economic situation during the major part of 2016, with
net responses gradually picking up between December
2015 and September 2016. However, net responses
slipped into the pessimistic zone since March 2017.
Consumers’ expectations about the future economic
situation also reached a turning point in December
2016 and worsened thereafter, but they seem to be
stabilising in the current survey round (Chart 1; Table 1).
2.2. Employment Scenario
Consumer sentiment on the current employment
situation stayed subdued, regressing further in the
December 2016 round. In the first half of 2017, net
responses have remained in the pessimistic zone, with
39 per cent of respondents perceiving a worsening
of the employment scenario in relation to a year
ago. In contrast, expectations regarding the future
employment situation remained buoyant, with half
of the respondents expressing optimism on future
employment which largely co-moved with the income
outlook3 (Chart 2; Table 2).
3 The coherence coefficient between the employment outlook and the income outlook varied between 52-57 per cent during the last four quarters. Coherence coefficient is the sum of similar responses on two variables as a proportion to total responses.
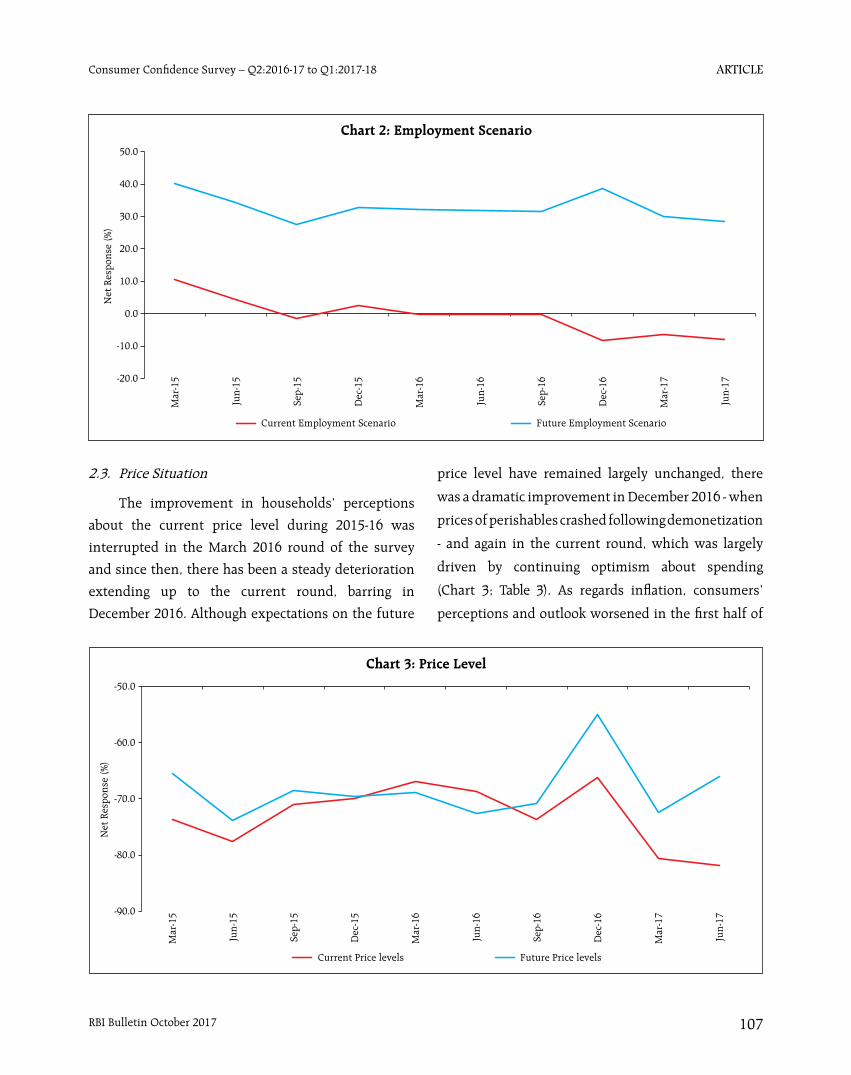
article
RBI Bulletin October 2017 107
Consumer Confidence Survey – Q2:2016-17 to Q1:2017-18
2.3. Price Situation
The improvement in households’ perceptions
about the current price level during 2015-16 was
interrupted in the March 2016 round of the survey
and since then, there has been a steady deterioration
extending up to the current round, barring in
December 2016. Although expectations on the future
price level have remained largely unchanged, there
was a dramatic improvement in December 2016 - when
prices of perishables crashed following demonetization
- and again in the current round, which was largely
driven by continuing optimism about spending
(Chart 3; Table 3). As regards inflation, consumers’
perceptions and outlook worsened in the first half of
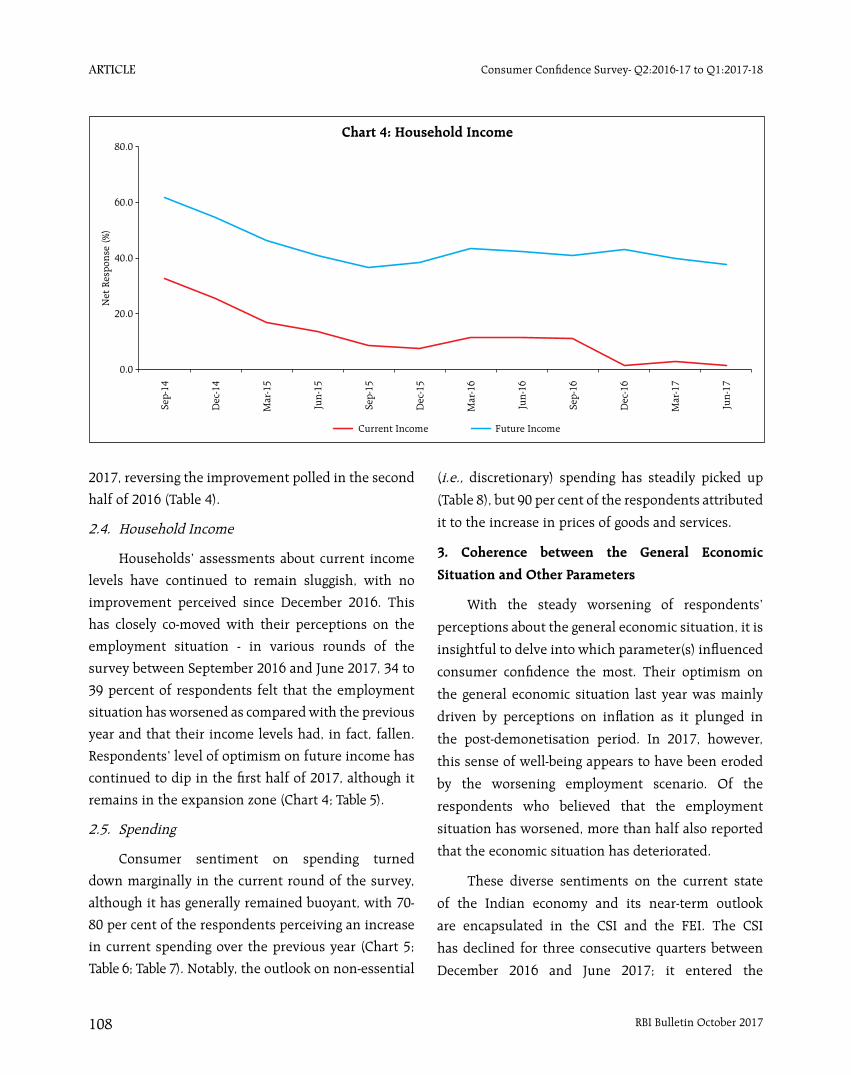
article
RBI Bulletin October 2017108
Consumer Confidence Survey- Q2:2016-17 to Q1:2017-18
2017, reversing the improvement polled in the second
half of 2016 (Table 4).
2.4. Household Income
Households’ assessments about current income
levels have continued to remain sluggish, with no
improvement perceived since December 2016. This
has closely co-moved with their perceptions on the
employment situation - in various rounds of the
survey between September 2016 and June 2017, 34 to
39 percent of respondents felt that the employment
situation has worsened as compared with the previous
year and that their income levels had, in fact, fallen.
Respondents’ level of optimism on future income has
continued to dip in the first half of 2017, although it
remains in the expansion zone (Chart 4; Table 5).
2.5. Spending
Consumer sentiment on spending turned
down marginally in the current round of the survey,
although it has generally remained buoyant, with 70-
80 per cent of the respondents perceiving an increase
in current spending over the previous year (Chart 5;
Table 6; Table 7). Notably, the outlook on non-essential
(i.e., discretionary) spending has steadily picked up
(Table 8), but 90 per cent of the respondents attributed
it to the increase in prices of goods and services.
3. Coherence between the General Economic
Situation and Other Parameters
With the steady worsening of respondents’
perceptions about the general economic situation, it is
insightful to delve into which parameter(s) influenced
consumer confidence the most. Their optimism on
the general economic situation last year was mainly
driven by perceptions on inflation as it plunged in
the post-demonetisation period. In 2017, however,
this sense of well-being appears to have been eroded
by the worsening employment scenario. Of the
respondents who believed that the employment
situation has worsened, more than half also reported
that the economic situation has deteriorated.
These diverse sentiments on the current state
of the Indian economy and its near-term outlook
are encapsulated in the CSI and the FEI. The CSI
has declined for three consecutive quarters between
December 2016 and June 2017; it entered the
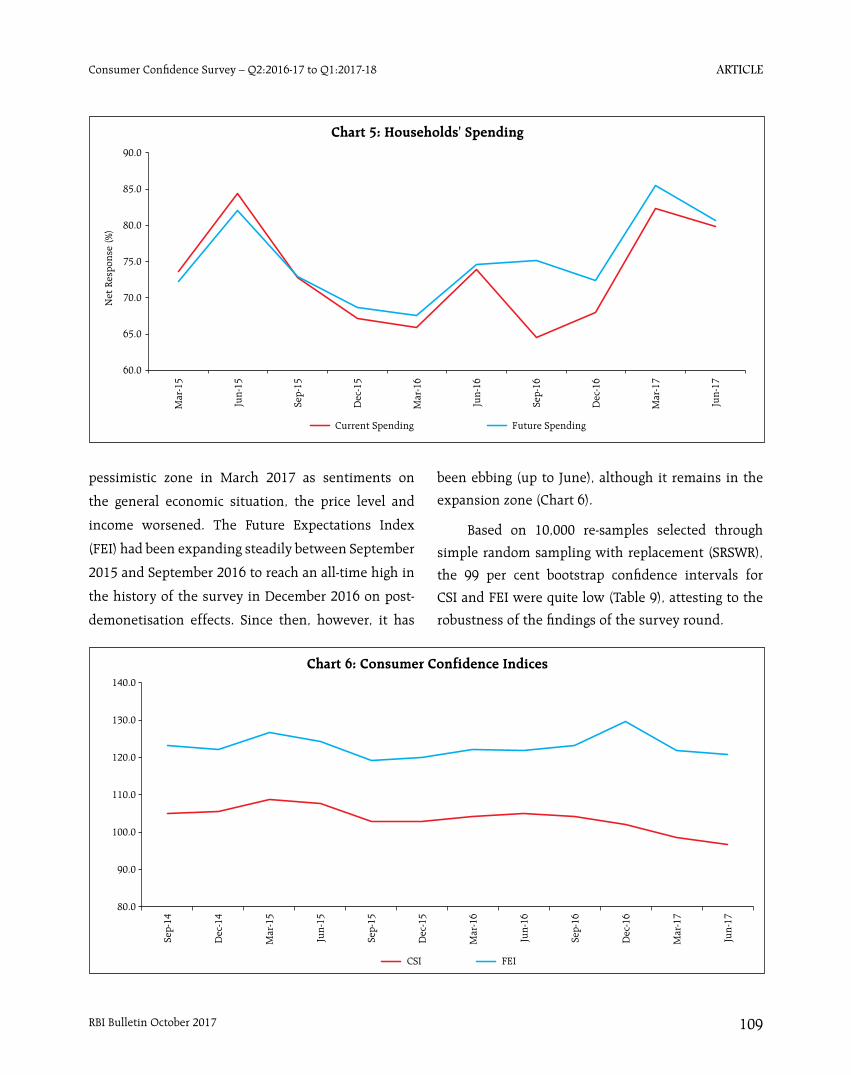
article
RBI Bulletin October 2017 109
Consumer Confidence Survey – Q2:2016-17 to Q1:2017-18
pessimistic zone in March 2017 as sentiments on
the general economic situation, the price level and
income worsened. The Future Expectations Index
(FEI) had been expanding steadily between September
2015 and September 2016 to reach an all-time high in
the history of the survey in December 2016 on post-
demonetisation effects. Since then, however, it has
been ebbing (up to June), although it remains in the
expansion zone (Chart 6).
Based on 10,000 re-samples selected through
simple random sampling with replacement (SRSWR),
the 99 per cent bootstrap confidence intervals for
CSI and FEI were quite low (Table 9), attesting to the
robustness of the findings of the survey round.
article
RBI Bulletin October 2017110
Consumer Confidence Survey- Q2:2016-17 to Q1:2017-18
4. Predictive Power of Future Expectations Index
With a reasonably long time series on consumer
sentiment indices now available, an examination
of their predictive power with respect to the goal
variable – consumer spending – becomes feasible and
worthwhile. In particular, it is of interest to evaluate
whether or not the FEI offers relevant and timely
insights into future consumption levels in India. If
consumers feel confident about the actual and future
economic and financial situation, they would be
willing to increase their consumption. In contrast, if
consumers are pessimistic, they would be inclined to
delay their consumption and engage in precautionary
saving. The empirical literature is inconclusive,
however, with some studies indicating little
information for forecasting consumption (Gosselin
and Desroches, 2002; Roberts and Simon, 2001) and
others detecting leading indicator properties (Gelper,
et. al. 2007; Batchelor and Dua 1998). In the context
of the Reserve Bank’s survey and its FEI, augmented
Dickey-Fuller tests on the FEI and private final
consumption expenditure to test the presence of a
unit root suggest that both the series are I(1) and their
first differences are stationary.
The ability of FEI to provide insights into future
consumption levels has been examined by using
Granger causality test between FEI and nominal private
final consumption expenditure (PFCE) (Table 10). Pair-
wise tests indicate that the FEI Granger causes PFCE
with three to five quarters lag. Thus, the FEI can be
usefully employed to forecast future values of private
final consumption. This highlights the importance of
FEI as an input for policy formulation.
5. Summary
Indicators of consumer confidence provide key
insights into the state of the economy by profiling
the perceptions of the consumer and thereby
consumption spending. This article finds that the
future expectations index predicts private final
consumption expenditure with three to five quarters
lag, offering exploitable potential as an input for
forward looking policy formulation. In this context,
it is useful to note that consumers’ reading of the
general economic situation has turned pessimistic in
2017, mainly reflecting a worsening of perceptions
on employment and inflation. Although consumers
remain somewhat more optimistic on spending, this
may reflect their expectations of higher prices. These
perceptions may be transient, as expectations on all
these parameters captured in the future expectations
index remain in the expansion zone.

article
RBI Bulletin October 2017 111
Consumer Confidence Survey – Q2:2016-17 to Q1:2017-18
Annex A: Data and Results
Table 1: Perceptions and Expectations on General Economic Situation(Percentage responses)
Survey Round Compared with 1-year ago 1-year ahead
Improved Remained Same
Worsened Net Response
Will Improve
Will Remain Same
Will Worsen
Net Response
Mar-15 41.7 32.4 25.9 15.8 56.8 26.8 16.4 40.4
Jun-15 43.1 27.8 29.1 14.0 57.6 22.3 20.2 37.4
Sep-15 36.5 32.7 30.9 5.6 47.7 32.1 20.3 27.4
Dec-15 38.0 30.9 31.1 6.9 51.0 27.6 21.4 29.6
Mar-16 39.9 30.3 29.8 10.1 54.6 27.2 18.2 36.4
Jun-16 40.2 27.9 31.9 8.3 54.2 25.5 20.4 33.8
Sep-16 44.6 30.1 25.3 19.3 57.7 24.3 18.0 39.7
Dec-16 45.7 24.1 30.3 15.4 66.3 16.6 17.1 49.2
Mar-17 35.6 24.4 40.0 -4.5 52.1 21.4 26.5 25.6
Jun-17 32.4 27.7 39.9 -7.5 48.6 25.9 25.5 23.1
Table 2: Perceptions and Expectations on Employment(Percentage responses)
Survey Round Compared with 1-year ago 1-year ahead
Improved Remained Same
Worsened Net Response
Will Improve
Will Remain Same
Will Worsen
Net Response
Mar-15 37.6 35.3 27.2 10.4 55.8 28.7 15.5 40.3
Jun-15 36.0 32.2 31.8 4.2 53.7 26.9 19.4 34.3
Sep-15 31.9 34.8 33.3 -1.4 47.1 33.4 19.5 27.6
Dec-15 34.0 34.7 31.3 2.7 51.6 29.8 18.7 32.9
Mar-16 34.3 31.1 34.6 -0.3 50.4 31.4 18.1 32.3
Jun-16 35.6 28.7 35.7 -0.1 51.1 29.6 19.3 31.8
Sep-16 31.7 36.4 31.9 -0.2 50.5 30.5 19.0 31.5
Dec-16 31.0 29.8 39.2 -8.3 57.3 24.1 18.6 38.7
Mar-17 32.6 28.4 39.0 -6.4 52.8 24.5 22.7 30.1
Jun-17 30.8 30.3 38.9 -8.1 49.6 29.3 21.2 28.4
Table 3: Perceptions and Expectations on Price Level(Percentage responses)
Survey Round Compared with 1-year ago 1-year ahead
Increased Remained Same
Decreased Net Response
Will Increase
Will Remain Same
Will Decrease
Net Response
Mar-15 78.8 16.0 5.2 -73.6 73.9 17.7 8.4 -65.5
Jun-15 84.3 9.1 6.6 -77.7 82.3 9.1 8.5 -73.8
Sep-15 80.9 9.4 9.8 -71.1 78.0 12.4 9.5 -68.5
Dec-15 79.5 10.9 9.6 -69.9 78.9 11.7 9.4 -69.5
Mar-16 77.3 12.4 10.4 -66.9 78.6 11.7 9.7 -68.9
Jun-16 78.1 12.5 9.4 -68.7 80.5 11.5 8.0 -72.5
Sep-16 78.2 17.2 4.6 -73.6 77.8 15.2 6.9 -70.9
Dec-16 73.9 18.3 7.7 -66.2 69.5 16.0 14.5 -55.0
Mar-17 85.8 9.1 5.1 -80.7 81.0 10.4 8.6 -72.4
Jun-17 85.2 11.4 3.4 -81.8 76.1 13.8 10.1 -66.0
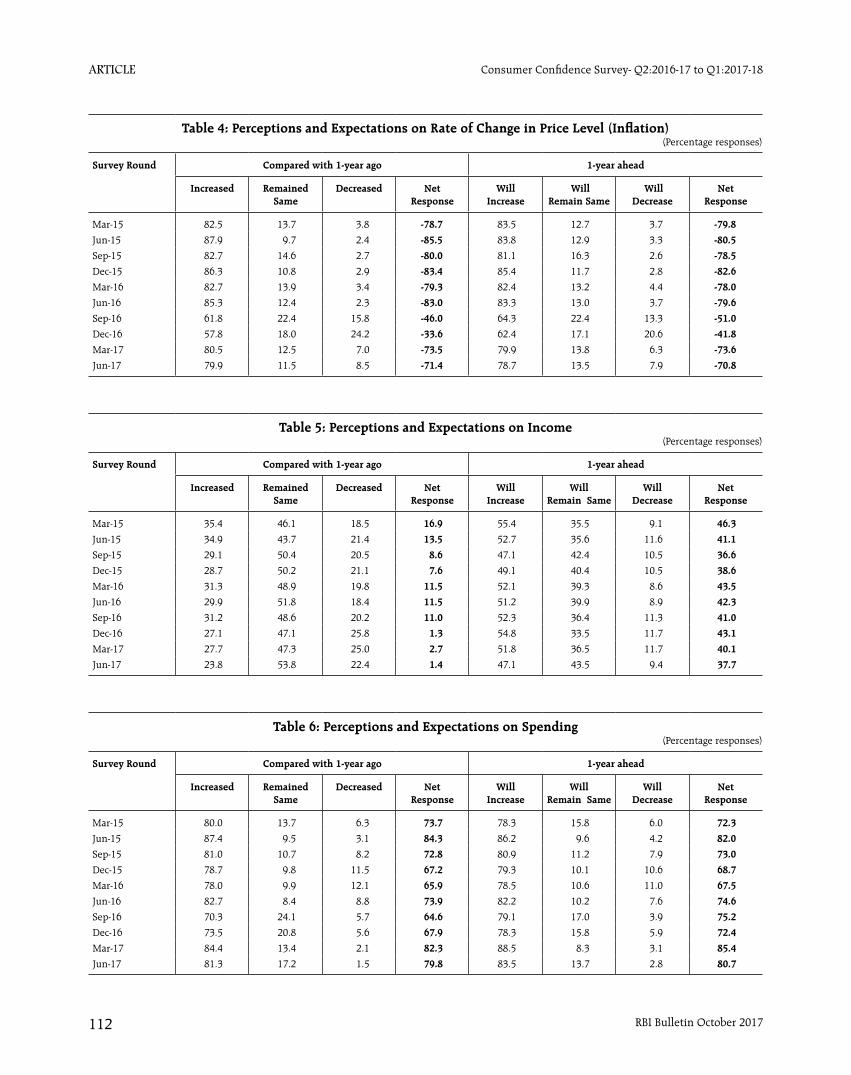
article
RBI Bulletin October 2017112
Consumer Confidence Survey- Q2:2016-17 to Q1:2017-18
Table 4: Perceptions and Expectations on Rate of Change in Price Level (Inflation)(Percentage responses)
Survey Round Compared with 1-year ago 1-year ahead
Increased Remained Same
Decreased Net Response
Will Increase
Will Remain Same
Will Decrease
Net Response
Mar-15 82.5 13.7 3.8 -78.7 83.5 12.7 3.7 -79.8
Jun-15 87.9 9.7 2.4 -85.5 83.8 12.9 3.3 -80.5
Sep-15 82.7 14.6 2.7 -80.0 81.1 16.3 2.6 -78.5
Dec-15 86.3 10.8 2.9 -83.4 85.4 11.7 2.8 -82.6
Mar-16 82.7 13.9 3.4 -79.3 82.4 13.2 4.4 -78.0
Jun-16 85.3 12.4 2.3 -83.0 83.3 13.0 3.7 -79.6
Sep-16 61.8 22.4 15.8 -46.0 64.3 22.4 13.3 -51.0
Dec-16 57.8 18.0 24.2 -33.6 62.4 17.1 20.6 -41.8
Mar-17 80.5 12.5 7.0 -73.5 79.9 13.8 6.3 -73.6
Jun-17 79.9 11.5 8.5 -71.4 78.7 13.5 7.9 -70.8
Table 5: Perceptions and Expectations on Income(Percentage responses)
Survey Round Compared with 1-year ago 1-year ahead
Increased Remained Same
Decreased Net Response
Will Increase
Will Remain Same
Will Decrease
Net Response
Mar-15 35.4 46.1 18.5 16.9 55.4 35.5 9.1 46.3
Jun-15 34.9 43.7 21.4 13.5 52.7 35.6 11.6 41.1
Sep-15 29.1 50.4 20.5 8.6 47.1 42.4 10.5 36.6
Dec-15 28.7 50.2 21.1 7.6 49.1 40.4 10.5 38.6
Mar-16 31.3 48.9 19.8 11.5 52.1 39.3 8.6 43.5
Jun-16 29.9 51.8 18.4 11.5 51.2 39.9 8.9 42.3
Sep-16 31.2 48.6 20.2 11.0 52.3 36.4 11.3 41.0
Dec-16 27.1 47.1 25.8 1.3 54.8 33.5 11.7 43.1
Mar-17 27.7 47.3 25.0 2.7 51.8 36.5 11.7 40.1
Jun-17 23.8 53.8 22.4 1.4 47.1 43.5 9.4 37.7
Table 6: Perceptions and Expectations on Spending(Percentage responses)
Survey Round Compared with 1-year ago 1-year ahead
Increased Remained Same
Decreased Net Response
Will Increase
Will Remain Same
Will Decrease
Net Response
Mar-15 80.0 13.7 6.3 73.7 78.3 15.8 6.0 72.3
Jun-15 87.4 9.5 3.1 84.3 86.2 9.6 4.2 82.0
Sep-15 81.0 10.7 8.2 72.8 80.9 11.2 7.9 73.0
Dec-15 78.7 9.8 11.5 67.2 79.3 10.1 10.6 68.7
Mar-16 78.0 9.9 12.1 65.9 78.5 10.6 11.0 67.5
Jun-16 82.7 8.4 8.8 73.9 82.2 10.2 7.6 74.6
Sep-16 70.3 24.1 5.7 64.6 79.1 17.0 3.9 75.2
Dec-16 73.5 20.8 5.6 67.9 78.3 15.8 5.9 72.4
Mar-17 84.4 13.4 2.1 82.3 88.5 8.3 3.1 85.4
Jun-17 81.3 17.2 1.5 79.8 83.5 13.7 2.8 80.7
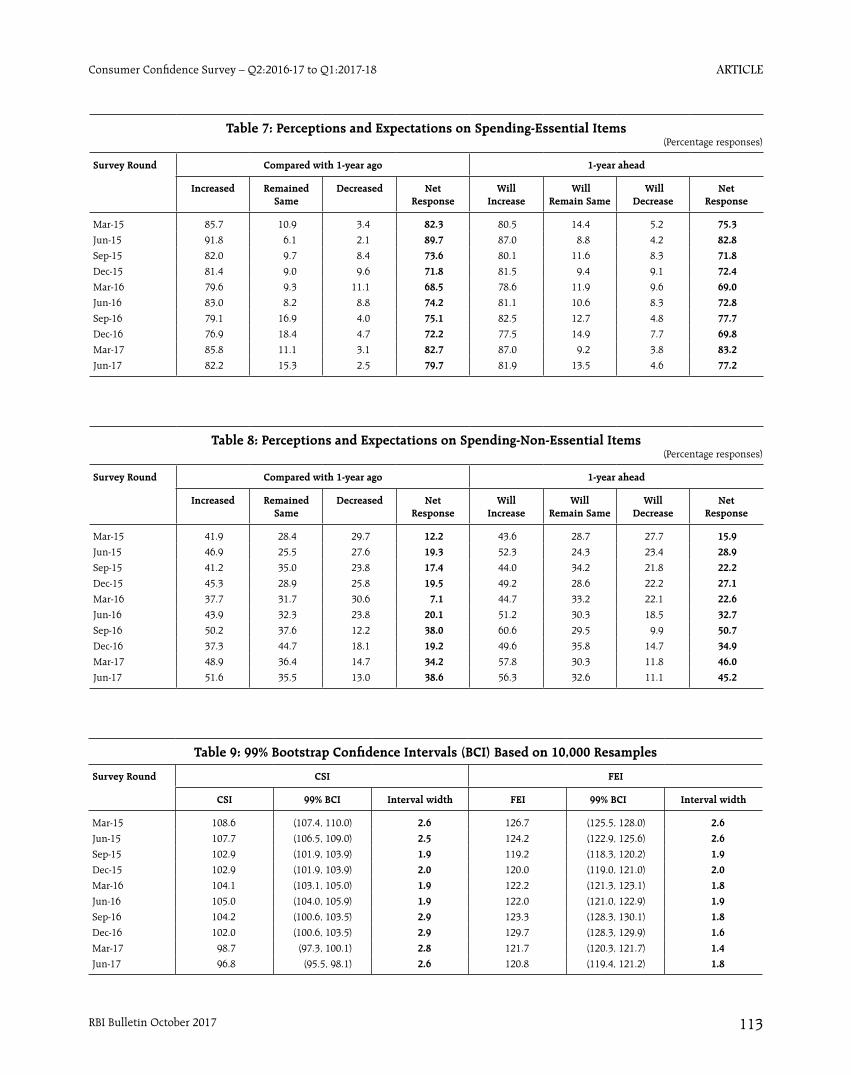
article
RBI Bulletin October 2017 113
Consumer Confidence Survey – Q2:2016-17 to Q1:2017-18
Table 7: Perceptions and Expectations on Spending-Essential Items(Percentage responses)
Survey Round Compared with 1-year ago 1-year ahead
Increased Remained Same
Decreased Net Response
Will Increase
Will Remain Same
Will Decrease
Net Response
Mar-15 85.7 10.9 3.4 82.3 80.5 14.4 5.2 75.3
Jun-15 91.8 6.1 2.1 89.7 87.0 8.8 4.2 82.8
Sep-15 82.0 9.7 8.4 73.6 80.1 11.6 8.3 71.8
Dec-15 81.4 9.0 9.6 71.8 81.5 9.4 9.1 72.4
Mar-16 79.6 9.3 11.1 68.5 78.6 11.9 9.6 69.0
Jun-16 83.0 8.2 8.8 74.2 81.1 10.6 8.3 72.8
Sep-16 79.1 16.9 4.0 75.1 82.5 12.7 4.8 77.7
Dec-16 76.9 18.4 4.7 72.2 77.5 14.9 7.7 69.8
Mar-17 85.8 11.1 3.1 82.7 87.0 9.2 3.8 83.2
Jun-17 82.2 15.3 2.5 79.7 81.9 13.5 4.6 77.2
Table 8: Perceptions and Expectations on Spending-Non-Essential Items(Percentage responses)
Survey Round Compared with 1-year ago 1-year ahead
Increased Remained Same
Decreased Net Response
Will Increase
Will Remain Same
Will Decrease
Net Response
Mar-15 41.9 28.4 29.7 12.2 43.6 28.7 27.7 15.9
Jun-15 46.9 25.5 27.6 19.3 52.3 24.3 23.4 28.9
Sep-15 41.2 35.0 23.8 17.4 44.0 34.2 21.8 22.2
Dec-15 45.3 28.9 25.8 19.5 49.2 28.6 22.2 27.1
Mar-16 37.7 31.7 30.6 7.1 44.7 33.2 22.1 22.6
Jun-16 43.9 32.3 23.8 20.1 51.2 30.3 18.5 32.7
Sep-16 50.2 37.6 12.2 38.0 60.6 29.5 9.9 50.7
Dec-16 37.3 44.7 18.1 19.2 49.6 35.8 14.7 34.9
Mar-17 48.9 36.4 14.7 34.2 57.8 30.3 11.8 46.0
Jun-17 51.6 35.5 13.0 38.6 56.3 32.6 11.1 45.2
Table 9: 99% Bootstrap Confidence Intervals (BCI) Based on 10,000 Resamples
Survey Round CSI FEI
CSI 99% BCI Interval width FEI 99% BCI Interval width
Mar-15 108.6 (107.4, 110.0) 2.6 126.7 (125.5, 128.0) 2.6
Jun-15 107.7 (106.5, 109.0) 2.5 124.2 (122.9, 125.6) 2.6
Sep-15 102.9 (101.9, 103.9) 1.9 119.2 (118.3, 120.2) 1.9
Dec-15 102.9 (101.9, 103.9) 2.0 120.0 (119.0, 121.0) 2.0
Mar-16 104.1 (103.1, 105.0) 1.9 122.2 (121.3, 123.1) 1.8
Jun-16 105.0 (104.0, 105.9) 1.9 122.0 (121.0, 122.9) 1.9
Sep-16 104.2 (100.6, 103.5) 2.9 123.3 (128.3, 130.1) 1.8
Dec-16 102.0 (100.6, 103.5) 2.9 129.7 (128.3, 129.9) 1.6
Mar-17 98.7 (97.3, 100.1) 2.8 121.7 (120.3, 121.7) 1.4
Jun-17 96.8 (95.5, 98.1) 2.6 120.8 (119.4, 121.2) 1.8
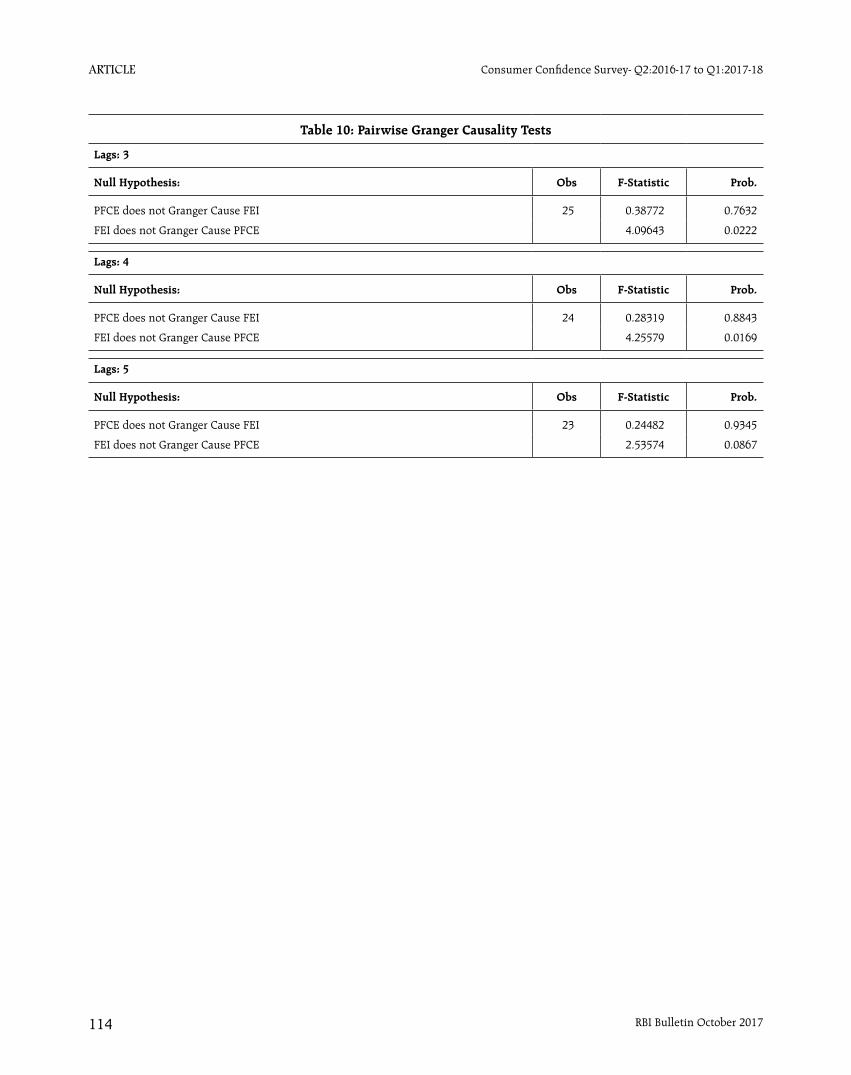
article
RBI Bulletin October 2017114
Consumer Confidence Survey- Q2:2016-17 to Q1:2017-18
Table 10: Pairwise Granger Causality Tests
Lags: 3
Null Hypothesis: Obs F-Statistic Prob.
PFCE does not Granger Cause FEI 25 0.38772 0.7632
FEI does not Granger Cause PFCE 4.09643 0.0222
Lags: 4
Null Hypothesis: Obs F-Statistic Prob.
PFCE does not Granger Cause FEI 24 0.28319 0.8843
FEI does not Granger Cause PFCE 4.25579 0.0169
Lags: 5
Null Hypothesis: Obs F-Statistic Prob.
PFCE does not Granger Cause FEI 23 0.24482 0.9345
FEI does not Granger Cause PFCE 2.53574 0.0867

article
RBI Bulletin October 2017 115
Consumer Confidence Survey – Q2:2016-17 to Q1:2017-18
Annex B
1. Sample Coverage and Survey Questionnaire
The survey is conducted in six metropolitan cities viz. Bengaluru, Chennai, Hyderabad, Kolkata, Mumbai and New Delhi. In each round of the survey, 5,400 respondents are selected (900 respondents from each city), using a hybrid two stage sampling design. At the first stage in a city, the polling booths are selected by systematic random sampling after arranging all polling booths according to their constituencies. In order to ensure wide geographical coverage, 45 polling booths spread over the entire city are selected. In second stage, from each selected polling booth area, 20 respondents are selected following the right hand rule. From Q4:2014-15 onwards, information relating to expenditure on essential and non-essential items, and households’ current financial situation are also being collected.
2. Current Situation Index & Future Expectations Index
In standard opinion surveys, respondents generally have three reply options such as up/same/down; or above-normal/normal/ below-normal; or increase/remain-same/decrease. Because of the difficulty of interpreting all three percentages, the survey results are normally converted into a single quantitative number. One of the most common way of doing
this is to use ‘Net-Responses’ (also called ‘Balances’ or ‘Net Balances’). It is defined as the percentage of the respondents reporting a decrease (negative), subtracted from the percentage reporting an increase (positive). Net Responses can take values from –100 to +100. In this survey, Net Response is used to analyse the Consumer Confidence Survey results. To combine the consumer confidence perceptions on various factors, two indices are worked out. These are Current Situation Index for reflecting current situation as compared to one year ago and Future Expectations Index to reflect the expectations one year ahead. For calculating the index, the following formula has been used.
Overall Index = 100 + Average (Net Response of selected factors)
Where Net Response = Positive perceptions (%) – Negative perception (%)
The average net responses on the current perception on various factors, viz. economic conditions, income, spending, price level and employment are used for the calculation of the Current Situation Index.
The average net responses on the future perceptions on various factors, viz. economic conditions, income, spending, price level and employment are used for the calculation of the Future Expectations Index.

article
RBI Bulletin October 2017116
Consumer Confidence Survey- Q2:2016-17 to Q1:2017-18
References
1. Batchelor, Roy, and Pami Dua. “Improving
macro-economic forecasts: The role of consumer
confidence.” International Journal of Forecasting 14.1
(1998): 71-81.
2. Gelper, Sarah, Aurélie Lemmens, and Christophe
Croux. “Consumer sentiment and consumer spending:
decomposing the Granger causal relationship in the
time domain.” Applied Economics 39.1 (2007): 1-11.
3. Gosselin, Marc-André, and Brigitte Desroches.
“The usefulness of consumer confidence indices in
the US.” (2002).
4. Roberts, Ivan, and John Simon. What Do
Sentiment Surveys Measure? Reserve Bank of
Australia, 2001. Research Discussion Paper 2001–9,
November 2001

Press release
Phillips Curve Relationship in India: Evidence from State-Level Analysis

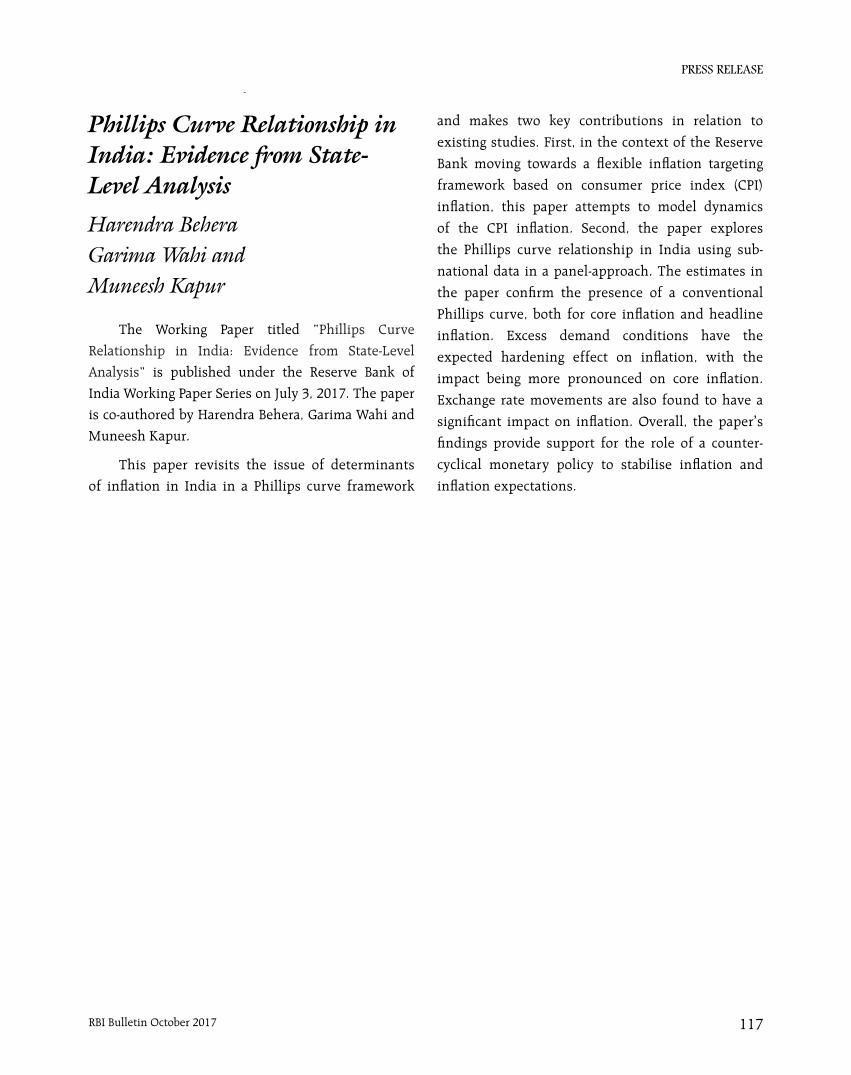
Press release
RBI Bulletin October 2017 117
Phillips Curve Relationship in India: Evidence from State-Level Analysis
and makes two key contributions in relation to
existing studies. First, in the context of the Reserve
Bank moving towards a flexible inflation targeting
framework based on consumer price index (CPI)
inflation, this paper attempts to model dynamics
of the CPI inflation. Second, the paper explores
the Phillips curve relationship in India using sub-
national data in a panel-approach. The estimates in
the paper confirm the presence of a conventional
Phillips curve, both for core inflation and headline
inflation. Excess demand conditions have the
expected hardening effect on inflation, with the
impact being more pronounced on core inflation.
Exchange rate movements are also found to have a
significant impact on inflation. Overall, the paper’s
findings provide support for the role of a counter-
cyclical monetary policy to stabilise inflation and
inflation expectations.
The Working Paper titled “Phillips Curve
Relationship in India: Evidence from State-Level
Analysis” is published under the Reserve Bank of
India Working Paper Series on July 3, 2017. The paper
is co-authored by Harendra Behera, Garima Wahi and
Muneesh Kapur.
This paper revisits the issue of determinants
of inflation in India in a Phillips curve framework
Phillips Curve Relationship in India: Evidence from State-Level AnalysisHarendra Behera Garima Wahi and Muneesh Kapur


CURRENT STATISTICS
Select Economic Indicators
Reserve Bank of India
Money and Banking
Prices and Production
Government Accounts and Treasury Bills
Financial Markets
External Sector
Payment and Settlement Systems
Occasional Series

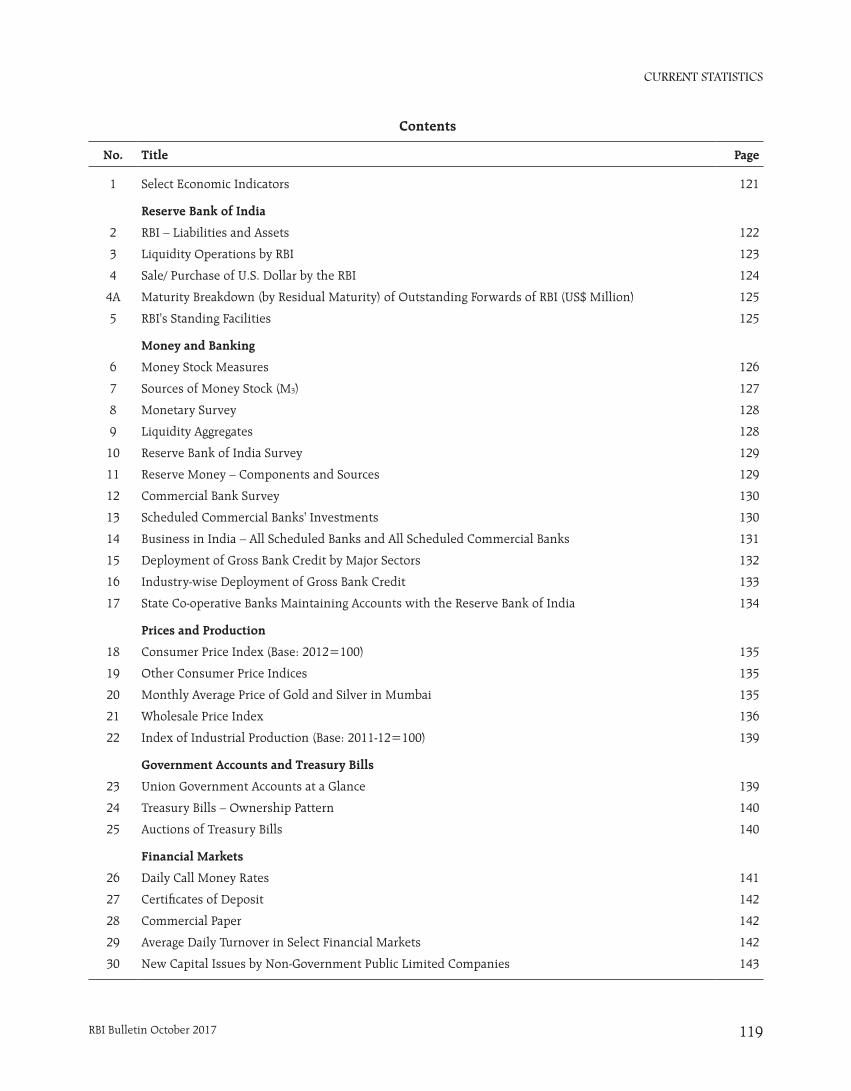
CURRENT STATISTICS
RBI Bulletin October 2017 119
No. Title Page
1 Select Economic Indicators 121
Reserve Bank of India
2 RBI – Liabilities and Assets 122
3 Liquidity Operations by RBI 123
4 Sale/ Purchase of U.S. Dollar by the RBI 124
4A Maturity Breakdown (by Residual Maturity) of Outstanding Forwards of RBI (US$ Million) 125
5 RBI's Standing Facilities 125
Money and Banking
6 Money Stock Measures 126
7 Sources of Money Stock (M3) 127
8 Monetary Survey 128
9 Liquidity Aggregates 128
10 Reserve Bank of India Survey 129
11 Reserve Money – Components and Sources 129
12 Commercial Bank Survey 130
13 Scheduled Commercial Banks' Investments 130
14 Business in India – All Scheduled Banks and All Scheduled Commercial Banks 131
15 Deployment of Gross Bank Credit by Major Sectors 132
16 Industry-wise Deployment of Gross Bank Credit 133
17 State Co-operative Banks Maintaining Accounts with the Reserve Bank of India 134
Prices and Production
18 Consumer Price Index (Base: 2012=100) 135
19 Other Consumer Price Indices 135
20 Monthly Average Price of Gold and Silver in Mumbai 135
21 Wholesale Price Index 136
22 Index of Industrial Production (Base: 2011-12=100) 139
Government Accounts and Treasury Bills
23 Union Government Accounts at a Glance 139
24 Treasury Bills – Ownership Pattern 140
25 Auctions of Treasury Bills 140
Financial Markets
26 Daily Call Money Rates 141
27 Certificates of Deposit 142
28 Commercial Paper 142
29 Average Daily Turnover in Select Financial Markets 142
30 New Capital Issues by Non-Government Public Limited Companies 143
Contents
CURRENT STATISTICS
RBI Bulletin October 2017120
No. Title Page
External Sector
31 Foreign Trade 144
32 Foreign Exchange Reserves 144
33 NRI Deposits 144
34 Foreign Investment Inflows 145
35 Outward Remittances under the Liberalised Remittance Scheme (LRS) for Resident Individuals 145
36 Indices of Real Effective Exchange Rate (REER) and Nominal Effective Exchange Rate (NEER) of the Indian Rupee
146
37 External Commercial Borrowings (ECBs) 146
38 India’s Overall Balance of Payments (US $ Million) 147
39 India's Overall Balance of Payments (` Billion) 148
40 Standard Presentation of BoP in India as per BPM6 (US $ Million) 149
41 Standard Presentation of BoP in India as per BPM6 (` Billion) 150
42 International Investment Position 151
Payment and Settlement Systems
43 Payment System Indicators 152
Occasional Series
44 Small Savings 153
45 Ownership Pattern of Central and State Governments Securities 154
46 Combined Receipts and Disbursements of the Central and State Governments 155
Notes: .. = Not available. – = Nil/Negligible. P = Preliminary/Provisional. PR = Partially Revised.
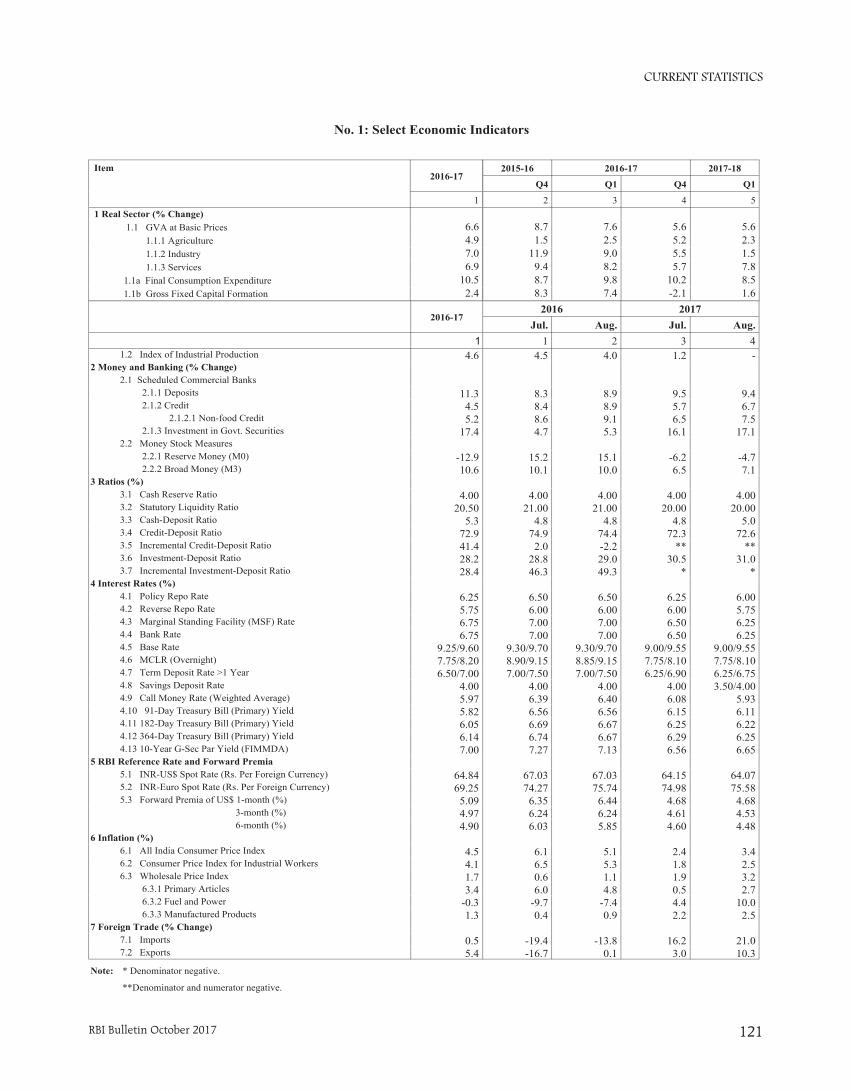
CURRENT STATISTICS
RBI Bulletin October 2017 121
Item2016-17
11 Real Sector (% Change) 1.1 GVA at Basic Prices 6.6 1.1.1 Agriculture 4.9 1.1.2 Industry 7.0 1.1.3 Services 6.9 1.1a Final Consumption Expenditure 10.5 1.1b Gross Fixed Capital Formation 2.4
2016-17
1 1.2 Index of Industrial Production 4.62 Money and Banking (% Change) 2.1 Scheduled Commercial Banks 2.1.1 Deposits 11.3 2.1.2 Credit 4.5 2.1.2.1 Non-food Credit 5.2 2.1.3 Investment in Govt. Securities 17.4 2.2 Money Stock Measures 2.2.1 Reserve Money (M0) -12.9 2.2.2 Broad Money (M3) 10.63 Ratios (%) 3.1 Cash Reserve Ratio 4.00 3.2 Statutory Liquidity Ratio 20.50 3.3 Cash-Deposit Ratio 5.3 3.4 Credit-Deposit Ratio 72.9 3.5 Incremental Credit-Deposit Ratio 41.4 3.6 Investment-Deposit Ratio 28.2 3.7 Incremental Investment-Deposit Ratio 28.44 Interest Rates (%) 4.1 Policy Repo Rate 6.25 4.2 Reverse Repo Rate 5.75 4.3 Marginal Standing Facility (MSF) Rate 6.75 4.4 Bank Rate 6.75 4.5 Base Rate 9.25/9.60 4.6 MCLR (Overnight) 7.75/8.20 4.7 Term Deposit Rate >1 Year 6.50/7.00 4.8 Savings Deposit Rate 4.00 4.9 Call Money Rate (Weighted Average) 5.97 4.10 91-Day Treasury Bill (Primary) Yield 5.82 4.11 182-Day Treasury Bill (Primary) Yield 6.05 4.12 364-Day Treasury Bill (Primary) Yield 6.14 4.13 10-Year G-Sec Par Yield (FIMMDA) 7.005 RBI Reference Rate and Forward Premia 5.1 INR-US$ Spot Rate (Rs. Per Foreign Currency) 64.84 5.2 INR-Euro Spot Rate (Rs. Per Foreign Currency) 69.25 5.3 Forward Premia of US$ 1-month (%) 5.09 3-month (%) 4.97 6-month (%) 4.906 Inflation (%) 6.1 All India Consumer Price Index 4.5 6.2 Consumer Price Index for Industrial Workers 4.1 6.3 Wholesale Price Index 1.7 6.3.1 Primary Articles 3.4 6.3.2 Fuel and Power -0.3 6.3.3 Manufactured Products 1.37 Foreign Trade (% Change) 7.1 Imports 0.5 7.2 Exports 5.4
No. 1: Select Economic Indicators
2015-16 2016-17 2017-18
Q4 Q1 Q4 Q1
2 3 4 5
8.7 7.6 5.6 5.61.5 2.5 5.2 2.3
11.9 9.0 5.5 1.59.4 8.2 5.7 7.88.7 9.8 10.2 8.58.3 7.4 -2.1 1.6
2016 2017Jul. Aug. Jul. Aug.
1 2 3 44.5 4.0 1.2 -
8.3 8.9 9.5 9.48.4 8.9 5.7 6.78.6 9.1 6.5 7.54.7 5.3 16.1 17.1
15.2 15.1 -6.2 -4.710.1 10.0 6.5 7.1
4.00 4.00 4.00 4.00
21.00 21.00 20.00 20.004.8 4.8 4.8 5.0
74.9 74.4 72.3 72.62.0 -2.2 ** **
28.8 29.0 30.5 31.046.3 49.3 * *
6.50 6.50 6.25 6.006.00 6.00 6.00 5.757.00 7.00 6.50 6.257.00 7.00 6.50 6.25
9.30/9.70 9.30/9.70 9.00/9.55 9.00/9.558.90/9.15 8.85/9.15 7.75/8.10 7.75/8.107.00/7.50 7.00/7.50 6.25/6.90 6.25/6.75
4.00 4.00 4.00 3.50/4.006.39 6.40 6.08 5.936.56 6.56 6.15 6.116.69 6.67 6.25 6.226.74 6.67 6.29 6.257.27 7.13 6.56 6.65
67.03 67.03 64.15 64.0774.27 75.74 74.98 75.58
6.35 6.44 4.68 4.686.24 6.24 4.61 4.536.03 5.85 4.60 4.48
6.1 5.1 2.4 3.46.5 5.3 1.8 2.50.6 1.1 1.9 3.26.0 4.8 0.5 2.7
-9.7 -7.4 4.4 10.00.4 0.9 2.2 2.5
-19.4 -13.8 16.2 21.0-16.7 0.1 3.0 10.3
Note: * Denominator negative.
**Denominator and numerator negative.
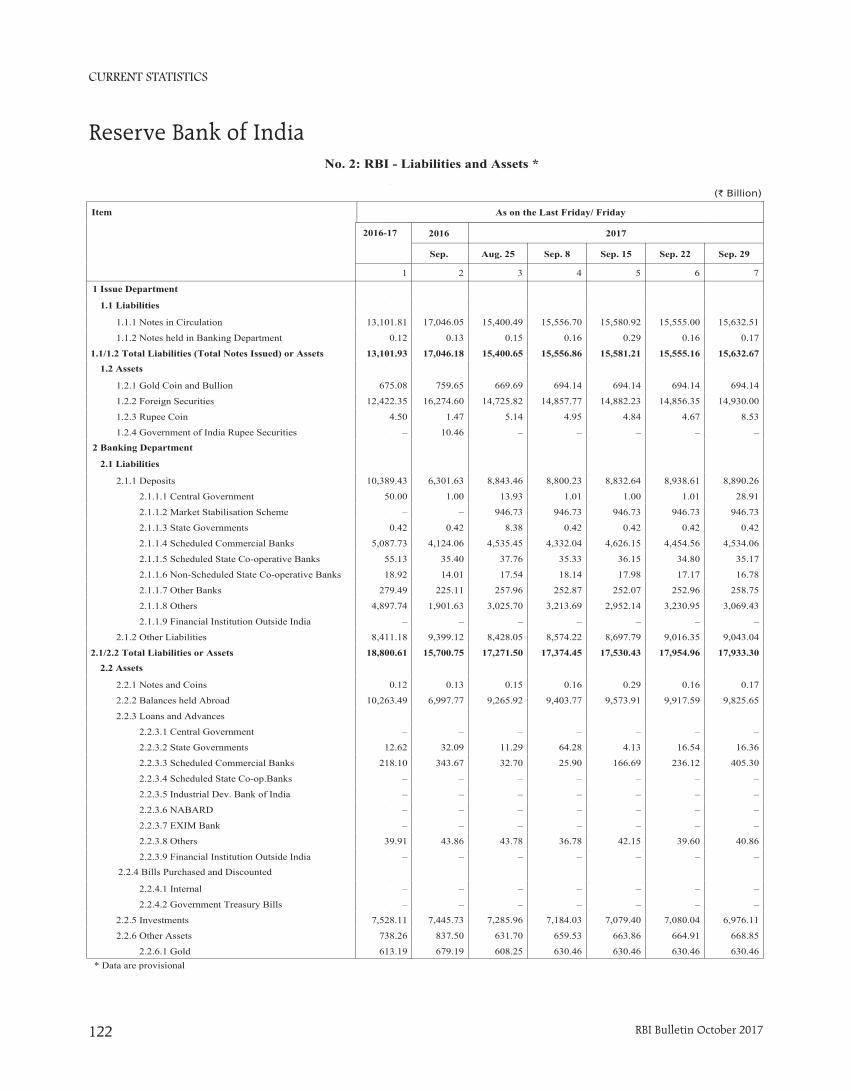
CURRENT STATISTICS
RBI Bulletin October 2017122
No. 2: RBI - Liabilities and Assets *
(` Billion)
L 2016 2017
Sep. Aug. 25 Sep. 8 Sep. 15 Sep. 22 Sep. 29
2 3 4 5 6 7
1
1
1. 17,046.05 15,400.49 15,556.70 15,580.92 15,555.00 15,632.51
1. 0.13 0.15 0.16 0.29 0.16 0.17
1. 17,046.18 15,400.65 15,556.86 15,581.21 15,555.16 15,632.67
2
1. 759.65 669.69 694.14 694.14 694.14 694.14
1. 16,274.60 14,725.82 14,857.77 14,882.23 14,856.35 14,930.00
1. 1.47 5.14 4.95 4.84 4.67 8.53
1. 10.46 – – – – –
2
1
2. 6,301.63 8,843.46 8,800.23 8,832.64 8,938.61 8,890.26
2. 1.00 13.93 1.01 1.00 1.01 28.91
2. – 946.73 946.73 946.73 946.73 946.73
2. 0.42 8.38 0.42 0.42 0.42 0.42
2. 4,124.06 4,535.45 4,332.04 4,626.15 4,454.56 4,534.06
2. 35.40 37.76 35.33 36.15 34.80 35.17
2. 14.01 17.54 18.14 17.98 17.17 16.78
2. 225.11 257.96 252.87 252.07 252.96 258.75
2. 1,901.63 3,025.70 3,213.69 2,952.14 3,230.95 3,069.43
2. – – – – – –
2. 9,399.12 8,428.05 8,574.22 8,697.79 9,016.35 9,043.04
2. 15,700.75 17,271.50 17,374.45 17,530.43 17,954.96 17,933.30
2
2. 0.13 0.15 0.16 0.29 0.16 0.17
2. 6,997.77 9,265.92 9,403.77 9,573.91 9,917.59 9,825.65
2.
2. – – – – – –
2. 32.09 11.29 64.28 4.13 16.54 16.36
2. 343.67 32.70 25.90 166.69 236.12 405.30
2. – – – – – –
2. – – – – – –
2. – – – – – –
2. – – – – – –
2. 43.86 43.78 36.78 42.15 39.60 40.86
2. – – – – – –
2.
2. – – – – – –
2. – – – – – –
2. 7,445.73 7,285.96 7,184.03 7,079.40 7,080.04 6,976.11
2. 837.50 631.70 659.53 663.86 664.91 668.85
2. 679.19 608.25 630.46 630.46 630.46 630.46
Item
2016-17
1
1 Issue Department
1.1 Liabilities
1.1.1 Notes in Circulation 13,101.81
1.1.2 Notes held in Banking Department 0.12
1.1/1.2 Total Liabilities (Total Notes Issued) or Assets 13,101.93
1.2 Assets
1.2.1 Gold Coin and Bullion 675.08
1.2.2 Foreign Securities 12,422.35
1.2.3 Rupee Coin 4.50
1.2.4 Government of India Rupee Securities –
2 Banking Department
2.1 Liabilities
2.1.1 Deposits 10,389.43
2.1.1.1 Central Government 50.00
2.1.1.2 Market Stabilisation Scheme –
2.1.1.3 State Governments 0.42
2.1.1.4 Scheduled Commercial Banks 5,087.73
2.1.1.5 Scheduled State Co-operative Banks 55.13
2.1.1.6 Non-Scheduled State Co-operative Banks 18.92
2.1.1.7 Other Banks 279.49
2.1.1.8 Others 4,897.74
2.1.1.9 Financial Institution Outside India –
2.1.2 Other Liabilities 8,411.18
2.1/2.2 Total Liabilities or Assets 18,800.61
2.2 Assets
2.2.1 Notes and Coins 0.12
2.2.2 Balances held Abroad 10,263.49
2.2.3 Loans and Advances
2.2.3.1 Central Government –
2.2.3.2 State Governments 12.62
2.2.3.3 Scheduled Commercial Banks 218.10
2.2.3.4 Scheduled State Co-op.Banks –
2.2.3.5 Industrial Dev. Bank of India –
2.2.3.6 NABARD –
2.2.3.7 EXIM Bank –
2.2.3.8 Others 39.91
2.2.3.9 Financial Institution Outside India –
2.2.4 Bills Purchased and Discounted
2.2.4.1 Internal –
2.2.4.2 Government Treasury Bills –
2.2.5 Investments 7,528.11
2.2.6 Other Assets 738.26
2.2.6.1 Gold 613.19
As on the Last Friday/ Friday
* Data are provisional
Reserve Bank of India
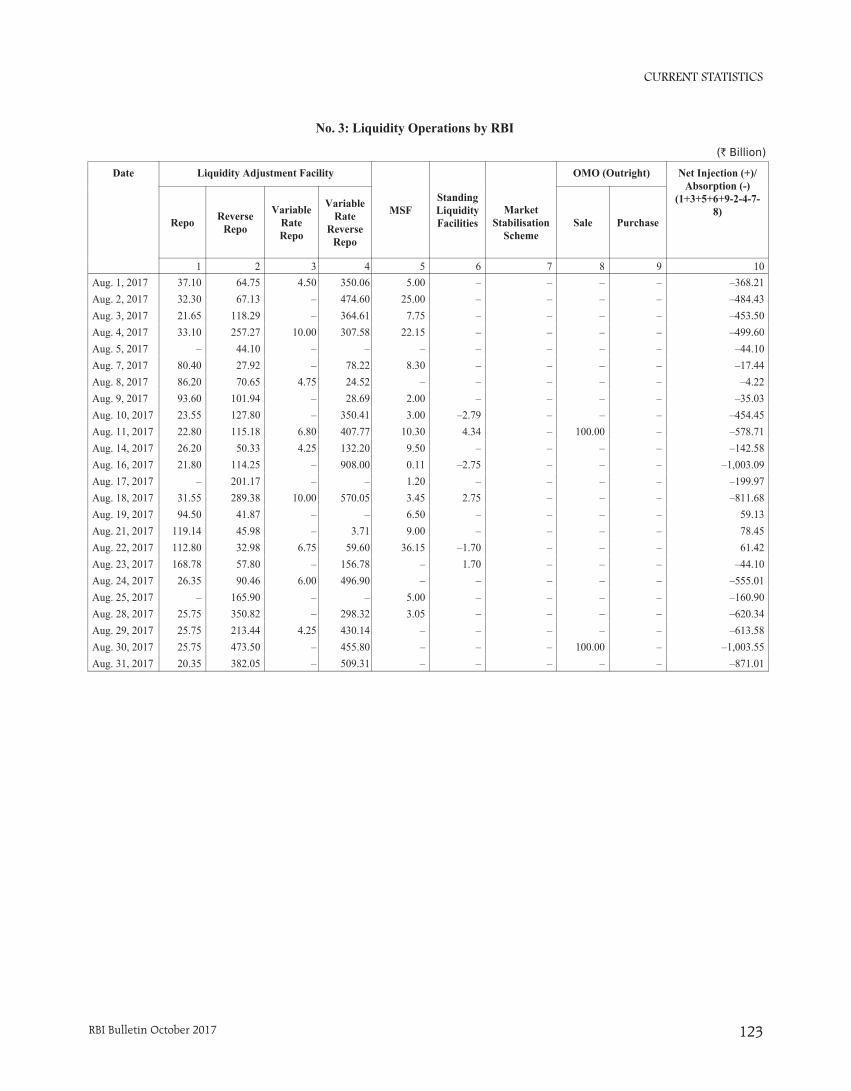
CURRENT STATISTICS
RBI Bulletin October 2017 123
No. 3: Liquidity Operations by RBI
(` Billion)
Date Liquidity Adjustment Facility
MSFStandingLiquidityFacilities
OMO (Outright) Net Injection (+)/Absorption (-)
(1+3+5+6+9-2-4-7-8)
Repo ReverseRepo
VariableRateRepo
VariableRate
ReverseRepo
MarketStabilisation
SchemeSale Purchase
1 2 3 4 5 6 7 8 9 10Aug. 1, 2017 37.10 64.75 4.50 350.06 5.00 – – – – –368.21Aug. 2, 2017 32.30 67.13 – 474.60 25.00 – – – – –484.43Aug. 3, 2017 21.65 118.29 – 364.61 7.75 – – – – –453.50Aug. 4, 2017 33.10 257.27 10.00 307.58 22.15 – – – – –499.60Aug. 5, 2017 – 44.10 – – – – – – – –44.10Aug. 7, 2017 80.40 27.92 – 78.22 8.30 – – – – –17.44Aug. 8, 2017 86.20 70.65 4.75 24.52 – – – – – –4.22Aug. 9, 2017 93.60 101.94 – 28.69 2.00 – – – – –35.03Aug. 10, 2017 23.55 127.80 – 350.41 3.00 –2.79 – – – –454.45Aug. 11, 2017 22.80 115.18 6.80 407.77 10.30 4.34 – 100.00 – –578.71Aug. 14, 2017 26.20 50.33 4.25 132.20 9.50 – – – – –142.58Aug. 16, 2017 21.80 114.25 – 908.00 0.11 –2.75 – – – –1,003.09Aug. 17, 2017 – 201.17 – – 1.20 – – – – –199.97Aug. 18, 2017 31.55 289.38 10.00 570.05 3.45 2.75 – – – –811.68Aug. 19, 2017 94.50 41.87 – – 6.50 – – – – 59.13Aug. 21, 2017 119.14 45.98 – 3.71 9.00 – – – – 78.45Aug. 22, 2017 112.80 32.98 6.75 59.60 36.15 –1.70 – – – 61.42Aug. 23, 2017 168.78 57.80 – 156.78 – 1.70 – – – –44.10Aug. 24, 2017 26.35 90.46 6.00 496.90 – – – – – –555.01Aug. 25, 2017 – 165.90 – – 5.00 – – – – –160.90Aug. 28, 2017 25.75 350.82 – 298.32 3.05 – – – – –620.34Aug. 29, 2017 25.75 213.44 4.25 430.14 – – – – – –613.58Aug. 30, 2017 25.75 473.50 – 455.80 – – – 100.00 – –1,003.55Aug. 31, 2017 20.35 382.05 – 509.31 – – – – – –871.01
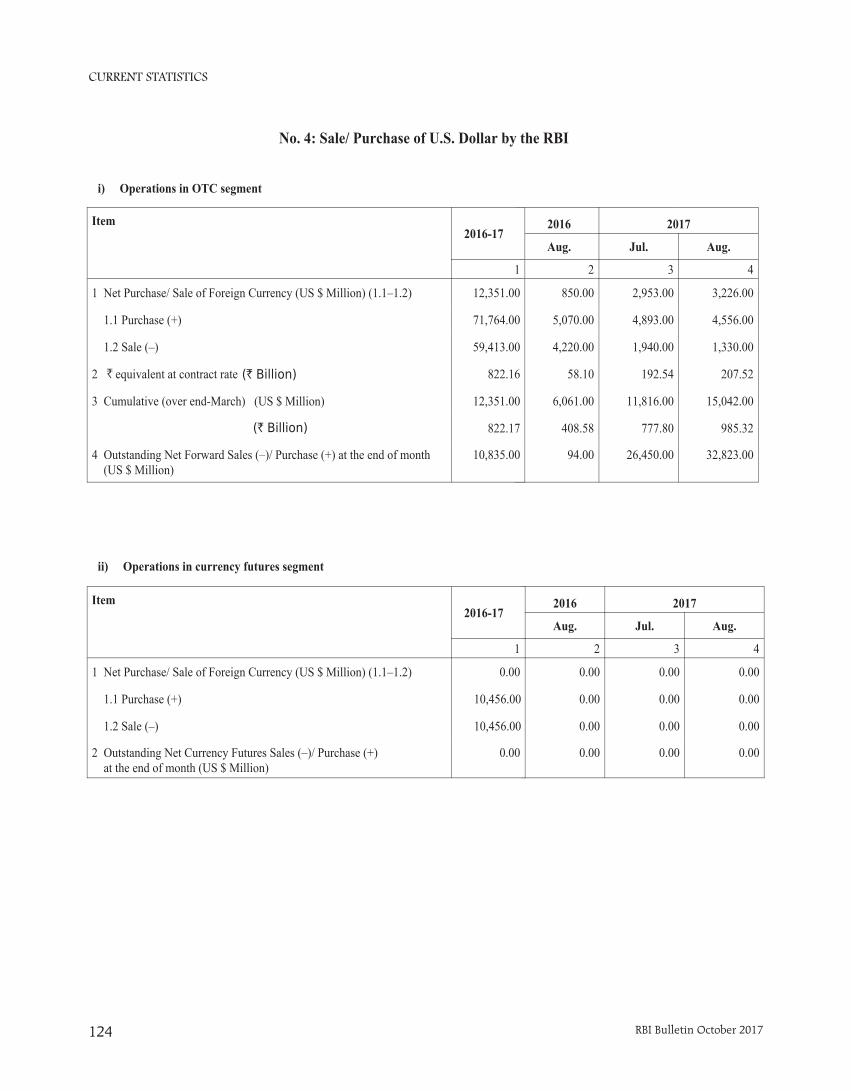
CURRENT STATISTICS
RBI Bulletin October 2017124
2016 2017
Aug. Jul. Aug.
2 3 4
850.00 2,953.00 3,226.00
5,070.00 4,893.00 4,556.00
4,220.00 1,940.00 1,330.00
58.10 192.54 207.52
6,061.00 11,816.00 15,042.00
408.58 777.80 985.32
94.00 26,450.00 32,823.00
No. 4: Sale/ Purchase of U.S. Dollar by the RBI
Item2016-17
1
1 Net Purchase/ Sale of Foreign Currency (US $ Million) (1.1–1.2) 12,351.00
1.1 Purchase (+) 71,764.00
1.2 Sale (–) 59,413.00
2 equivalent at contract rate 822.16
3 Cumulative (over end-March) (US $ Million) 12,351.00
(` Billion) 822.17
4 Outstanding Net Forward Sales (–)/ Purchase (+) at the end of month (US $ Million)
10,835.00
Item2016-17
1
1 Net Purchase/ Sale of Foreign Currency (US $ Million) (1.1–1.2) 0.00
1.1 Purchase (+) 10,456.00
1.2 Sale (–) 10,456.00
2 Outstanding Net Currency Futures Sales (–)/ Purchase (+) at the end of month (US $ Million)
0.00
2016 2017
Aug. Jul. Aug.
2 3 4
0.00 0.00 0.00
0.00 0.00 0.00
0.00 0.00 0.00
0.00 0.00 0.00
i) Operations in OTC segment
ii) Operations in currency futures segment
` (` Billion)
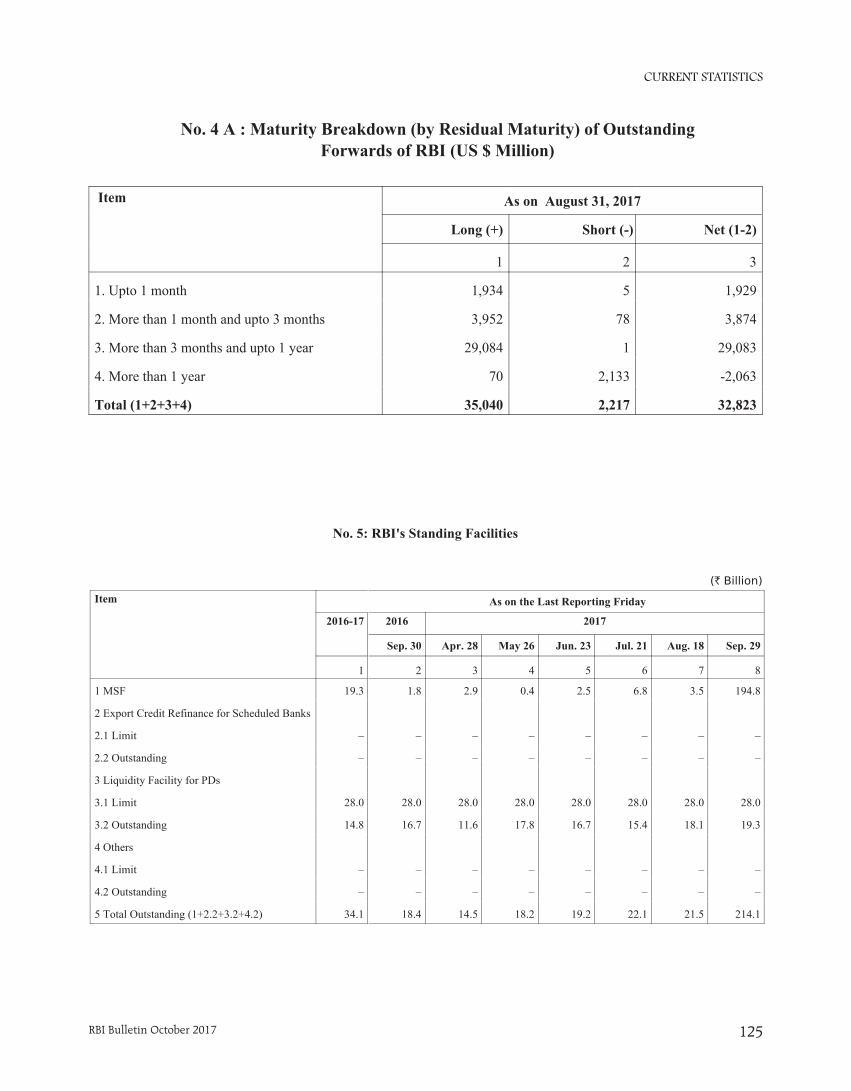
CURRENT STATISTICS
RBI Bulletin October 2017 125
Item As on August 31, 2017
Long (+) Short (-) Net (1-2)
1 2 3
1. Upto 1 month 1,934 5 1,929
2. More than 1 month and upto 3 months 3,952 78 3,874
3. More than 3 months and upto 1 year 29,084 1 29,083
4. More than 1 year 70 2,133 -2,063
Total (1+2+3+4) 35,040 2,217 32,823
No. 4 A : Maturity Breakdown (by Residual Maturity) of OutstandingForwards of RBI (US $ Million)
No. 5: RBI's Standing Facilities
Item
2016-17
1
1 MSF 19.3
2 Export Credit Refinance for Scheduled Banks
2.1 Limit –
2.2 Outstanding –
3 Liquidity Facility for PDs
3.1 Limit 28.0
3.2 Outstanding 14.8
4 Others
4.1 Limit –
4.2 Outstanding –
5 Total Outstanding (1+2.2+3.2+4.2) 34.1
(` Billion)
2016 2017
Sep. 30 Apr. 28 May 26 Jun. 23 Jul. 21 Aug. 18 Sep. 29
2 3 4 5 6 7 8
1.8 2.9 0.4 2.5 6.8 3.5 194.8
– – – – – – –
– – – – – – –
28.0 28.0 28.0 28.0 28.0 28.0 28.0
16.7 11.6 17.8 16.7 15.4 18.1 19.3
– – – – – – –
– – – – – – –
18.4 14.5 18.2 19.2 22.1 21.5 214.1
As on the Last Reporting Friday
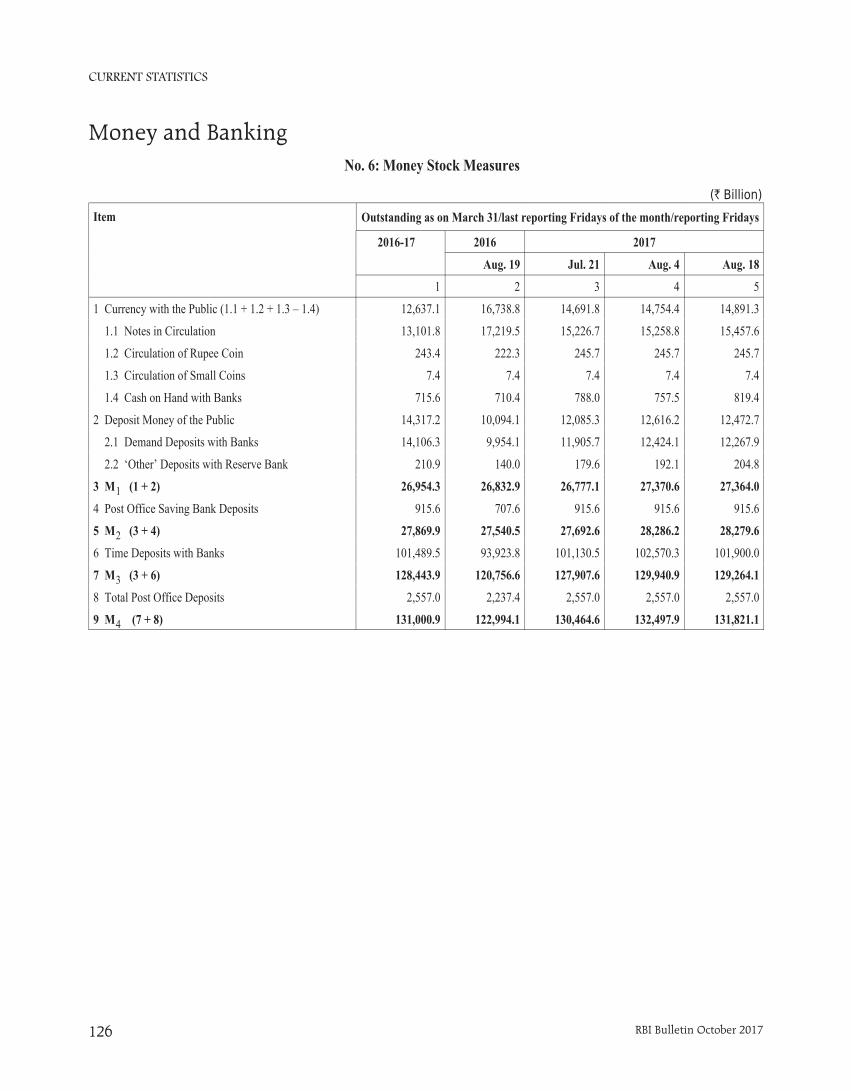
CURRENT STATISTICS
RBI Bulletin October 2017126
Money and Banking
Item
2016-17 2016 2017
Aug. 19 Jul. 21 Aug. 4 Aug. 18
1 2 3 4 5
1 Currency with the Public (1.1 + 1.2 + 1.3 – 1.4) 12,637.1 16,738.8 14,691.8 14,754.4 14,891.3
1.1 Notes in Circulation 13,101.8 17,219.5 15,226.7 15,258.8 15,457.6
1.2 Circulation of Rupee Coin 243.4 222.3 245.7 245.7 245.7
1.3 Circulation of Small Coins 7.4 7.4 7.4 7.4 7.4
1.4 Cash on Hand with Banks 715.6 710.4 788.0 757.5 819.4
2 Deposit Money of the Public 14,317.2 10,094.1 12,085.3 12,616.2 12,472.7
2.1 Demand Deposits with Banks 14,106.3 9,954.1 11,905.7 12,424.1 12,267.9
2.2 ‘Other’ Deposits with Reserve Bank 210.9 140.0 179.6 192.1 204.8
3 M (1 + 2) 26,954.3 26,832.9 26,777.1 27,370.6 27,364.0
4 Post Office Saving Bank Deposits 915.6 707.6 915.6 915.6 915.6
5 M (3 + 4) 27,869.9 27,540.5 27,692.6 28,286.2 28,279.6
6 Time Deposits with Banks 101,489.5 93,923.8 101,130.5 102,570.3 101,900.0
7 M (3 + 6) 128,443.9 120,756.6 127,907.6 129,940.9 129,264.1
8 Total Post Office Deposits 2,557.0 2,237.4 2,557.0 2,557.0 2,557.0
9 M (7 + 8) 131,000.9 122,994.1 130,464.6 132,497.9 131,821.1
No. 6: Money Stock Measures
(` Billion)
Outstanding as on March 31/last reporting Fridays of the month/reporting Fridays
1
2
3
4

CURRENT STATISTICS
RBI Bulletin October 2017 127
No. 7: Sources of Money Stock (M )
Sources
2016-17 2016 2017
Aug. 19 Jul. 21 Aug. 4 Aug. 18
1 2 3 4 5
1 Net Bank Credit to Government 38,690.9 36,973.8 41,002.9 42,074.7 41,674.2
1.1 RBI’s net credit to Government (1.1.1–1.1.2) 6,208.1 6,931.3 6,462.7 7,000.7 6,448.3
1.1.1 Claims on Government 7,512.0 7,274.7 7,410.8 7,948.9 7,396.5
1.1.1.1 Central Government 7,499.4 7,247.5 7,401.9 7,915.6 7,352.8
1.1.1.2 State Governments 12.6 27.2 9.0 33.3 43.7
1.1.2 Government deposits with RBI 1,303.9 343.4 948.2 948.2 948.2
1.1.2.1 Central Government 1,303.5 343.0 947.7 947.7 947.7
1.1.2.2 State Governments 0.4 0.4 0.4 0.4 0.4
1.2 Other Banks’ Credit to Government 32,482.8 30,042.5 34,540.3 35,073.9 35,225.9
2 Bank Credit to Commercial Sector 84,514.3 78,113.3 81,861.4 82,950.1 82,741.0
2.1 RBI’s credit to commercial sector 72.9 70.9 68.7 74.2 75.3
2.2 Other banks’ credit to commercial sector 84,441.4 78,042.3 81,792.7 82,875.9 82,665.7
2.2.1 Bank credit by commercial banks 78,815.3 72,477.2 76,178.6 77,279.5 77,055.5
2.2.2 Bank credit by co-operative banks 5,548.9 5,514.6 5,530.0 5,513.0 5,526.8
2.2.3 Investments by commercial and co-operative banks in other securities 77.2 50.5 84.1 83.4 83.4
3 Net Foreign Exchange Assets of Banking Sector (3.1 + 3.2) 25,582.3 25,973.6 26,766.9 26,674.1 26,818.4
3.1 RBI’s net foreign exchange assets (3.1.1–3.1.2) 23,972.1 24,467.7 25,156.7 25,063.9 25,208.2
3.1.1 Gross foreign assets 23,974.1 24,469.8 25,158.6 25,065.8 25,210.1
3.1.2 Foreign liabilities 2.0 2.1 1.9 1.9 1.9
3.2 Other banks’ net foreign exchange assets 1,610.2 1,505.9 1,610.2 1,610.2 1,610.2
4 Government’s Currency Liabilities to the Public 250.9 229.7 253.1 253.1 253.1
5 Banking Sector’s Net Non-monetary Liabilities 20,594.6 20,533.7 21,976.8 22,011.1 22,222.7
5.1 Net non-monetary liabilities of RBI 8,333.5 9,320.7 8,810.5 8,605.8 8,423.5
5.2 Net non-monetary liabilities of other banks (residual) 12,261.1 11,213.0 13,166.4 13,405.3 13,799.1
M (1+2+3+4–5) 128,443.9 120,756.6 127,907.6 129,940.9 129,264.1
(` Billion)
Outstanding as on March 31/last reporting Fridays ofthe month/reporting Fridays
3
3
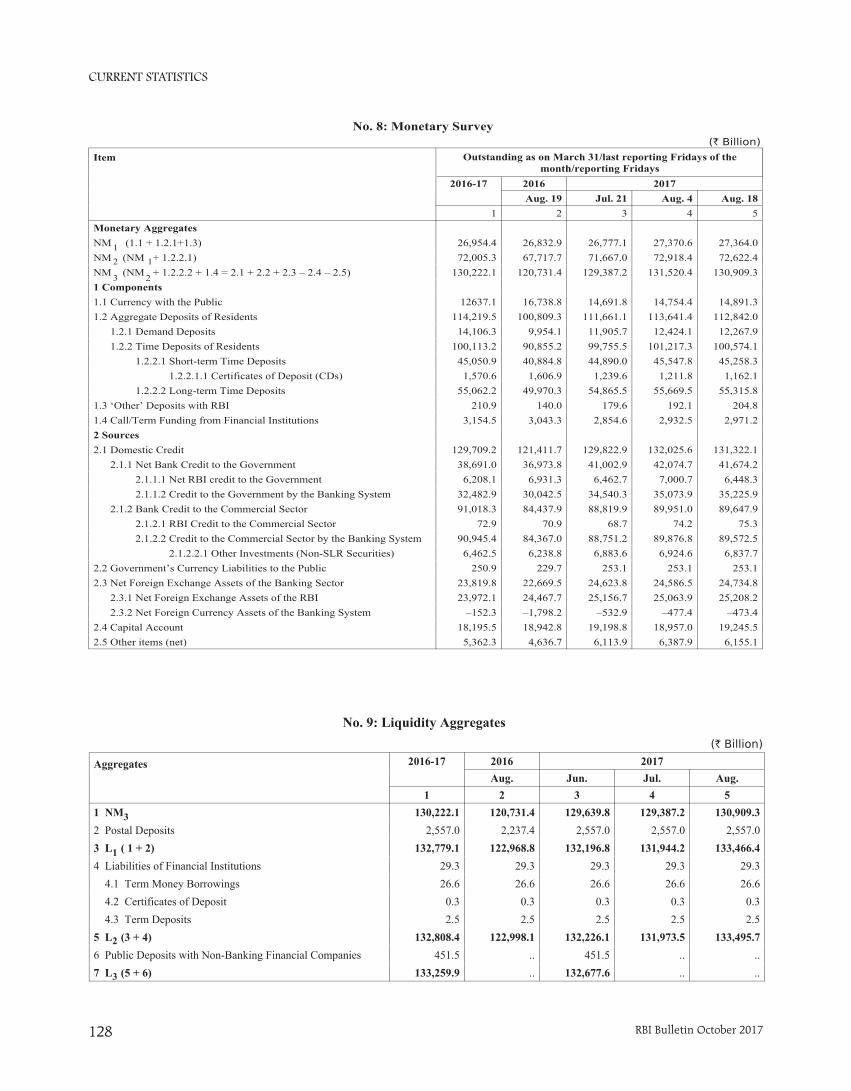
CURRENT STATISTICS
RBI Bulletin October 2017128
No. 8: Monetary Survey
Item
2016-17 2016 2017Aug. 19 Jul. 21 Aug. 4 Aug. 18
1 2 3 4 5Monetary AggregatesNM1 (1.1 + 1.2.1+1.3) 26,954.4 26,832.9 26,777.1 27,370.6 27,364.0NM (NM + 1.2.2.1) 72,005.3 67,717.7 71,667.0 72,918.4 72,622.4NM (NM + 1.2.2.2 + 1.4 = 2.1 + 2.2 + 2.3 – 2.4 – 2.5) 130,222.1 120,731.4 129,387.2 131,520.4 130,909.31 Components1.1 Currency with the Public 12637.1 16,738.8 14,691.8 14,754.4 14,891.31.2 Aggregate Deposits of Residents 114,219.5 100,809.3 111,661.1 113,641.4 112,842.0 1.2.1 Demand Deposits 14,106.3 9,954.1 11,905.7 12,424.1 12,267.9 1.2.2 Time Deposits of Residents 100,113.2 90,855.2 99,755.5 101,217.3 100,574.1 1.2.2.1 Short-term Time Deposits 45,050.9 40,884.8 44,890.0 45,547.8 45,258.3 1.2.2.1.1 Certificates of Deposit (CDs) 1,570.6 1,606.9 1,239.6 1,211.8 1,162.1 1.2.2.2 Long-term Time Deposits 55,062.2 49,970.3 54,865.5 55,669.5 55,315.81.3 ‘Other’ Deposits with RBI 210.9 140.0 179.6 192.1 204.81.4 Call/Term Funding from Financial Institutions 3,154.5 3,043.3 2,854.6 2,932.5 2,971.22 Sources2.1 Domestic Credit 129,709.2 121,411.7 129,822.9 132,025.6 131,322.1 2.1.1 Net Bank Credit to the Government 38,691.0 36,973.8 41,002.9 42,074.7 41,674.2 2.1.1.1 Net RBI credit to the Government 6,208.1 6,931.3 6,462.7 7,000.7 6,448.3 2.1.1.2 Credit to the Government by the Banking System 32,482.9 30,042.5 34,540.3 35,073.9 35,225.9 2.1.2 Bank Credit to the Commercial Sector 91,018.3 84,437.9 88,819.9 89,951.0 89,647.9 2.1.2.1 RBI Credit to the Commercial Sector 72.9 70.9 68.7 74.2 75.3 2.1.2.2 Credit to the Commercial Sector by the Banking System 90,945.4 84,367.0 88,751.2 89,876.8 89,572.5 2.1.2.2.1 Other Investments (Non-SLR Securities) 6,462.5 6,238.8 6,883.6 6,924.6 6,837.72.2 Government’s Currency Liabilities to the Public 250.9 229.7 253.1 253.1 253.12.3 Net Foreign Exchange Assets of the Banking Sector 23,819.8 22,669.5 24,623.8 24,586.5 24,734.8 2.3.1 Net Foreign Exchange Assets of the RBI 23,972.1 24,467.7 25,156.7 25,063.9 25,208.2 2.3.2 Net Foreign Currency Assets of the Banking System –152.3 –1,798.2 –532.9 –477.4 –473.42.4 Capital Account 18,195.5 18,942.8 19,198.8 18,957.0 19,245.52.5 Other items (net) 5,362.3 4,636.7 6,113.9 6,387.9 6,155.1
(` Billion)
Outstanding as on March 31/last reporting Fridays of themonth/reporting Fridays
12
3
1
2
No. 9: Liquidity Aggregates(` Billion)
Aggregates 2016-17 2016 2017Aug. Jun. Jul. Aug.
1 2 3 4 51 NM 130,222.1 120,731.4 129,639.8 129,387.2 130,909.3
2 Postal Deposits 2,557.0 2,237.4 2,557.0 2,557.0 2,557.03 L ( 1 + 2) 132,779.1 122,968.8 132,196.8 131,944.2 133,466.4
4 Liabilities of Financial Institutions 29.3 29.3 29.3 29.3 29.3 4.1 Term Money Borrowings 26.6 26.6 26.6 26.6 26.6 4.2 Certificates of Deposit 0.3 0.3 0.3 0.3 0.3 4.3 Term Deposits 2.5 2.5 2.5 2.5 2.55 L (3 + 4) 132,808.4 122,998.1 132,226.1 131,973.5 133,495.7
6 Public Deposits with Non-Banking Financial Companies 451.5 .. 451.5 .. ..7 L (5 + 6) 133,259.9 .. 132,677.6 .. ..
1
2
3
3
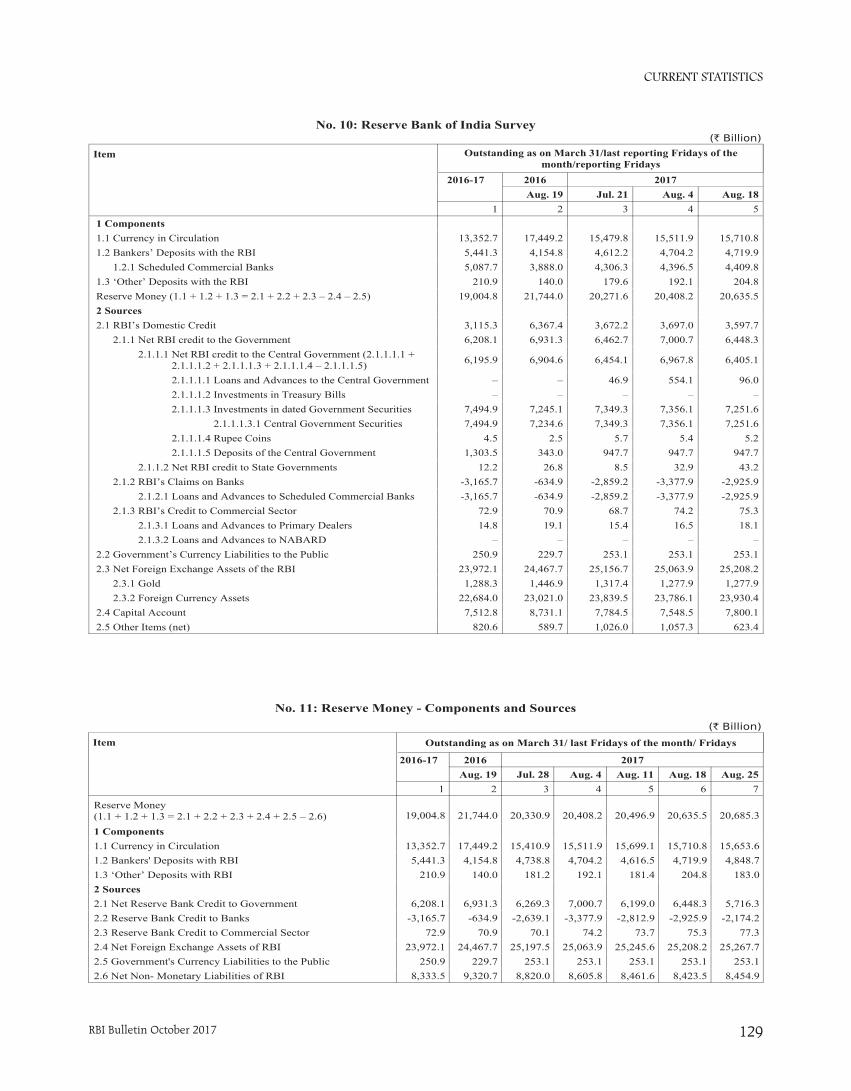
CURRENT STATISTICS
RBI Bulletin October 2017 129
No. 10: Reserve Bank of India Survey
Item
2016-17 2016 2017Aug. 19 Jul. 21 Aug. 4 Aug. 18
1 2 3 4 51 Components1.1 Currency in Circulation 13,352.7 17,449.2 15,479.8 15,511.9 15,710.81.2 Bankers’ Deposits with the RBI 5,441.3 4,154.8 4,612.2 4,704.2 4,719.9 1.2.1 Scheduled Commercial Banks 5,087.7 3,888.0 4,306.3 4,396.5 4,409.81.3 ‘Other’ Deposits with the RBI 210.9 140.0 179.6 192.1 204.8Reserve Money (1.1 + 1.2 + 1.3 = 2.1 + 2.2 + 2.3 – 2.4 – 2.5) 19,004.8 21,744.0 20,271.6 20,408.2 20,635.52 Sources2.1 RBI’s Domestic Credit 3,115.3 6,367.4 3,672.2 3,697.0 3,597.7 2.1.1 Net RBI credit to the Government 6,208.1 6,931.3 6,462.7 7,000.7 6,448.3 2.1.1.1 Net RBI credit to the Central Government (2.1.1.1.1 + 2.1.1.1.2 + 2.1.1.1.3 + 2.1.1.1.4 – 2.1.1.1.5) 6,195.9 6,904.6 6,454.1 6,967.8 6,405.1
2.1.1.1.1 Loans and Advances to the Central Government – – 46.9 554.1 96.0 2.1.1.1.2 Investments in Treasury Bills – – – – – 2.1.1.1.3 Investments in dated Government Securities 7,494.9 7,245.1 7,349.3 7,356.1 7,251.6 2.1.1.1.3.1 Central Government Securities 7,494.9 7,234.6 7,349.3 7,356.1 7,251.6 2.1.1.1.4 Rupee Coins 4.5 2.5 5.7 5.4 5.2 2.1.1.1.5 Deposits of the Central Government 1,303.5 343.0 947.7 947.7 947.7 2.1.1.2 Net RBI credit to State Governments 12.2 26.8 8.5 32.9 43.2 2.1.2 RBI’s Claims on Banks -3,165.7 -634.9 -2,859.2 -3,377.9 -2,925.9 2.1.2.1 Loans and Advances to Scheduled Commercial Banks -3,165.7 -634.9 -2,859.2 -3,377.9 -2,925.9 2.1.3 RBI’s Credit to Commercial Sector 72.9 70.9 68.7 74.2 75.3 2.1.3.1 Loans and Advances to Primary Dealers 14.8 19.1 15.4 16.5 18.1 2.1.3.2 Loans and Advances to NABARD – – – – –2.2 Government’s Currency Liabilities to the Public 250.9 229.7 253.1 253.1 253.12.3 Net Foreign Exchange Assets of the RBI 23,972.1 24,467.7 25,156.7 25,063.9 25,208.2 2.3.1 Gold 1,288.3 1,446.9 1,317.4 1,277.9 1,277.9 2.3.2 Foreign Currency Assets 22,684.0 23,021.0 23,839.5 23,786.1 23,930.42.4 Capital Account 7,512.8 8,731.1 7,784.5 7,548.5 7,800.12.5 Other Items (net) 820.6 589.7 1,026.0 1,057.3 623.4
(` Billion)
Outstanding as on March 31/last reporting Fridays of themonth/reporting Fridays
No. 11: Reserve Money - Components and Sources
Item
2016-17 2016 2017Aug. 19 Jul. 28 Aug. 4 Aug. 11 Aug. 18 Aug. 25
1 2 3 4 5 6 7
Reserve Money(1.1 + 1.2 + 1.3 = 2.1 + 2.2 + 2.3 + 2.4 + 2.5 – 2.6) 19,004.8 21,744.0 20,330.9 20,408.2 20,496.9 20,635.5 20,685.3
1 Components1.1 Currency in Circulation 13,352.7 17,449.2 15,410.9 15,511.9 15,699.1 15,710.8 15,653.61.2 Bankers' Deposits with RBI 5,441.3 4,154.8 4,738.8 4,704.2 4,616.5 4,719.9 4,848.71.3 ‘Other’ Deposits with RBI 210.9 140.0 181.2 192.1 181.4 204.8 183.02 Sources2.1 Net Reserve Bank Credit to Government 6,208.1 6,931.3 6,269.3 7,000.7 6,199.0 6,448.3 5,716.32.2 Reserve Bank Credit to Banks -3,165.7 -634.9 -2,639.1 -3,377.9 -2,812.9 -2,925.9 -2,174.22.3 Reserve Bank Credit to Commercial Sector 72.9 70.9 70.1 74.2 73.7 75.3 77.32.4 Net Foreign Exchange Assets of RBI 23,972.1 24,467.7 25,197.5 25,063.9 25,245.6 25,208.2 25,267.72.5 Government's Currency Liabilities to the Public 250.9 229.7 253.1 253.1 253.1 253.1 253.12.6 Net Non- Monetary Liabilities of RBI 8,333.5 9,320.7 8,820.0 8,605.8 8,461.6 8,423.5 8,454.9
(` Billion)
Outstanding as on March 31/ last Fridays of the month/ Fridays
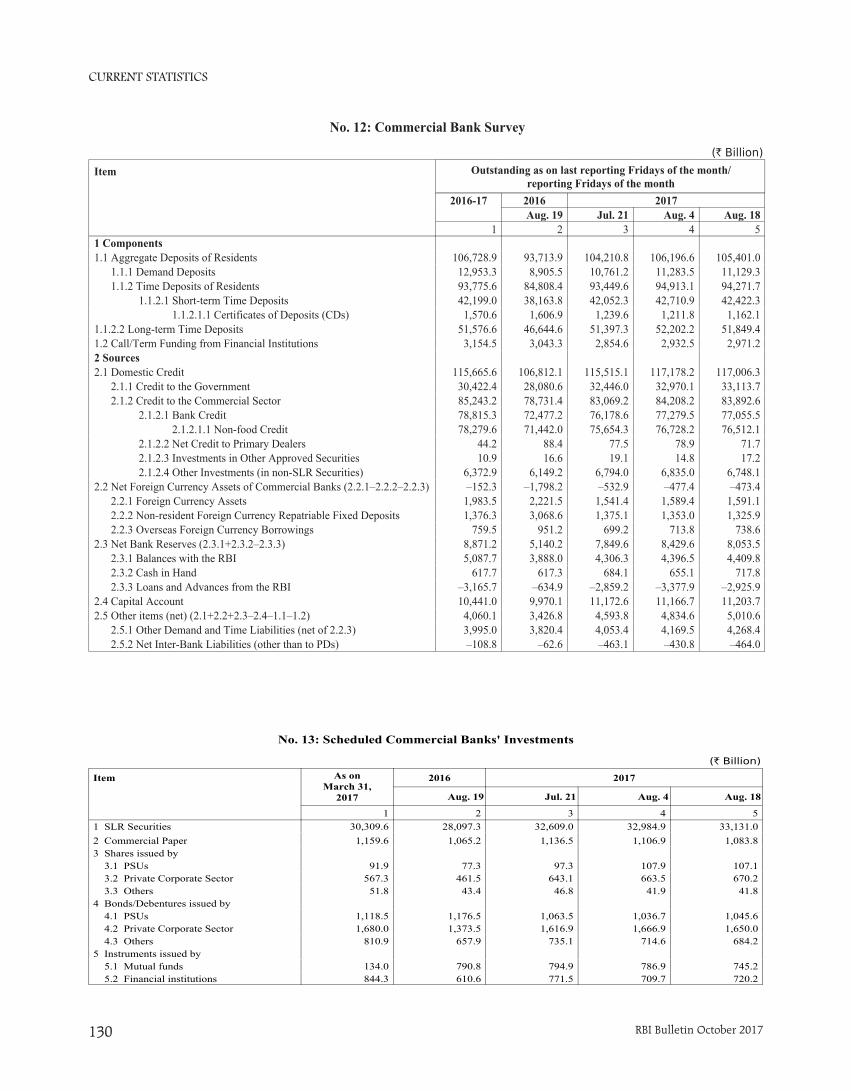
CURRENT STATISTICS
RBI Bulletin October 2017130
No. 13: Scheduled Commercial Banks' Investments
(` Billion)
Item As onMarch 31,
2017
2016 2017
Aug. 19 Jul. 21 Aug. 4 Aug. 18
1 2 3 4 51 SLR Securities 30,309.6 28,097.3 32,609.0 32,984.9 33,131.02 Commercial Paper 1,159.6 1,065.2 1,136.5 1,106.9 1,083.83 Shares issued by 3.1 PSUs 91.9 77.3 97.3 107.9 107.1 3.2 Private Corporate Sector 567.3 461.5 643.1 663.5 670.2 3.3 Others 51.8 43.4 46.8 41.9 41.84 Bonds/Debentures issued by 4.1 PSUs 1,118.5 1,176.5 1,063.5 1,036.7 1,045.6 4.2 Private Corporate Sector 1,680.0 1,373.5 1,616.9 1,666.9 1,650.0 4.3 Others 810.9 657.9 735.1 714.6 684.25 Instruments issued by 5.1 Mutual funds 134.0 790.8 794.9 786.9 745.2 5.2 Financial institutions 844.3 610.6 771.5 709.7 720.2
No. 12: Commercial Bank Survey
Item
2016-17 2016 2017Aug. 19 Jul. 21 Aug. 4 Aug. 18
1 2 3 4 51 Components1.1 Aggregate Deposits of Residents 106,728.9 93,713.9 104,210.8 106,196.6 105,401.0 1.1.1 Demand Deposits 12,953.3 8,905.5 10,761.2 11,283.5 11,129.3 1.1.2 Time Deposits of Residents 93,775.6 84,808.4 93,449.6 94,913.1 94,271.7 1.1.2.1 Short-term Time Deposits 42,199.0 38,163.8 42,052.3 42,710.9 42,422.3 1.1.2.1.1 Certificates of Deposits (CDs) 1,570.6 1,606.9 1,239.6 1,211.8 1,162.11.1.2.2 Long-term Time Deposits 51,576.6 46,644.6 51,397.3 52,202.2 51,849.41.2 Call/Term Funding from Financial Institutions 3,154.5 3,043.3 2,854.6 2,932.5 2,971.22 Sources2.1 Domestic Credit 115,665.6 106,812.1 115,515.1 117,178.2 117,006.3 2.1.1 Credit to the Government 30,422.4 28,080.6 32,446.0 32,970.1 33,113.7 2.1.2 Credit to the Commercial Sector 85,243.2 78,731.4 83,069.2 84,208.2 83,892.6 2.1.2.1 Bank Credit 78,815.3 72,477.2 76,178.6 77,279.5 77,055.5 2.1.2.1.1 Non-food Credit 78,279.6 71,442.0 75,654.3 76,728.2 76,512.1 2.1.2.2 Net Credit to Primary Dealers 44.2 88.4 77.5 78.9 71.7 2.1.2.3 Investments in Other Approved Securities 10.9 16.6 19.1 14.8 17.2 2.1.2.4 Other Investments (in non-SLR Securities) 6,372.9 6,149.2 6,794.0 6,835.0 6,748.12.2 Net Foreign Currency Assets of Commercial Banks (2.2.1–2.2.2–2.2.3) –152.3 –1,798.2 –532.9 –477.4 –473.4 2.2.1 Foreign Currency Assets 1,983.5 2,221.5 1,541.4 1,589.4 1,591.1 2.2.2 Non-resident Foreign Currency Repatriable Fixed Deposits 1,376.3 3,068.6 1,375.1 1,353.0 1,325.9 2.2.3 Overseas Foreign Currency Borrowings 759.5 951.2 699.2 713.8 738.62.3 Net Bank Reserves (2.3.1+2.3.2–2.3.3) 8,871.2 5,140.2 7,849.6 8,429.6 8,053.5 2.3.1 Balances with the RBI 5,087.7 3,888.0 4,306.3 4,396.5 4,409.8 2.3.2 Cash in Hand 617.7 617.3 684.1 655.1 717.8 2.3.3 Loans and Advances from the RBI –3,165.7 –634.9 –2,859.2 –3,377.9 –2,925.92.4 Capital Account 10,441.0 9,970.1 11,172.6 11,166.7 11,203.72.5 Other items (net) (2.1+2.2+2.3–2.4–1.1–1.2) 4,060.1 3,426.8 4,593.8 4,834.6 5,010.6 2.5.1 Other Demand and Time Liabilities (net of 2.2.3) 3,995.0 3,820.4 4,053.4 4,169.5 4,268.4 2.5.2 Net Inter-Bank Liabilities (other than to PDs) –108.8 –62.6 –463.1 –430.8 –464.0
(` Billion)
Outstanding as on last reporting Fridays of the month/reporting Fridays of the month
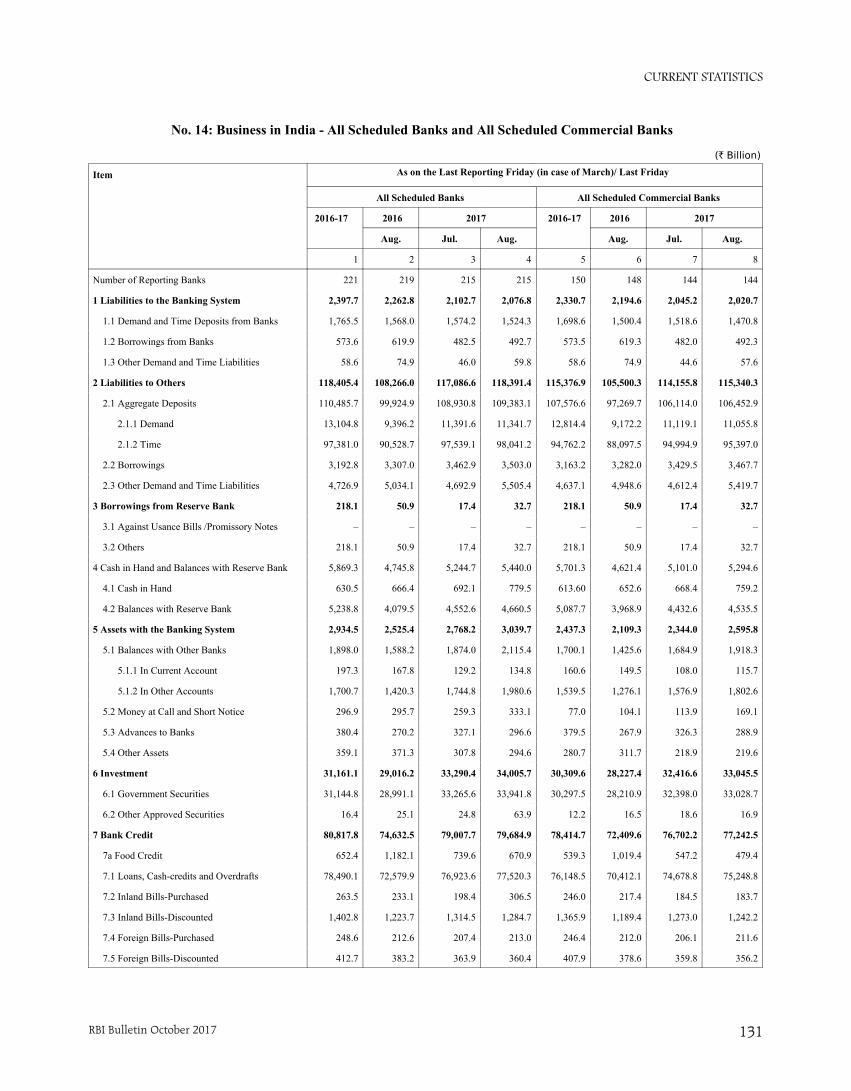
CURRENT STATISTICS
RBI Bulletin October 2017 131
No. 14: Business in India - All Scheduled Banks and All Scheduled Commercial Banks
(` Billion)
All Scheduled Commercial Banks
2016-17 2016 2017
Aug. Jul. Aug.
5 6 7 8
150 148 144 144
2,330.7 2,194.6 2,045.2 2,020.7
1,698.6 1,500.4 1,518.6 1,470.8
573.5 619.3 482.0 492.3
58.6 74.9 44.6 57.6
115,376.9 105,500.3 114,155.8 115,340.3
107,576.6 97,269.7 106,114.0 106,452.9
12,814.4 9,172.2 11,119.1 11,055.8
94,762.2 88,097.5 94,994.9 95,397.0
3,163.2 3,282.0 3,429.5 3,467.7
4,637.1 4,948.6 4,612.4 5,419.7
218.1 50.9 17.4 32.7
– – – –
218.1 50.9 17.4 32.7
5,701.3 4,621.4 5,101.0 5,294.6
613.60 652.6 668.4 759.2
5,087.7 3,968.9 4,432.6 4,535.5
2,437.3 2,109.3 2,344.0 2,595.8
1,700.1 1,425.6 1,684.9 1,918.3
160.6 149.5 108.0 115.7
1,539.5 1,276.1 1,576.9 1,802.6
77.0 104.1 113.9 169.1
379.5 267.9 326.3 288.9
280.7 311.7 218.9 219.6
30,309.6 28,227.4 32,416.6 33,045.5
30,297.5 28,210.9 32,398.0 33,028.7
12.2 16.5 18.6 16.9
78,414.7 72,409.6 76,702.2 77,242.5
539.3 1,019.4 547.2 479.4
76,148.5 70,412.1 74,678.8 75,248.8
246.0 217.4 184.5 183.7
1,365.9 1,189.4 1,273.0 1,242.2
246.4 212.0 206.1 211.6
407.9 378.6 359.8 356.2
Item
All Scheduled Banks
2016-17 2016 2017
Aug. Jul. Aug.
1 2 3 4
Number of Reporting Banks 221 219 215 215
1 Liabilities to the Banking System 2,397.7 2,262.8 2,102.7 2,076.8
1.1 Demand and Time Deposits from Banks 1,765.5 1,568.0 1,574.2 1,524.3
1.2 Borrowings from Banks 573.6 619.9 482.5 492.7
1.3 Other Demand and Time Liabilities 58.6 74.9 46.0 59.8
2 Liabilities to Others 118,405.4 108,266.0 117,086.6 118,391.4
2.1 Aggregate Deposits 110,485.7 99,924.9 108,930.8 109,383.1
2.1.1 Demand 13,104.8 9,396.2 11,391.6 11,341.7
2.1.2 Time 97,381.0 90,528.7 97,539.1 98,041.2
2.2 Borrowings 3,192.8 3,307.0 3,462.9 3,503.0
2.3 Other Demand and Time Liabilities 4,726.9 5,034.1 4,692.9 5,505.4
3 Borrowings from Reserve Bank 218.1 50.9 17.4 32.7
3.1 Against Usance Bills /Promissory Notes – – – –
3.2 Others 218.1 50.9 17.4 32.7
4 Cash in Hand and Balances with Reserve Bank 5,869.3 4,745.8 5,244.7 5,440.0
4.1 Cash in Hand 630.5 666.4 692.1 779.5
4.2 Balances with Reserve Bank 5,238.8 4,079.5 4,552.6 4,660.5
5 Assets with the Banking System 2,934.5 2,525.4 2,768.2 3,039.7
5.1 Balances with Other Banks 1,898.0 1,588.2 1,874.0 2,115.4
5.1.1 In Current Account 197.3 167.8 129.2 134.8
5.1.2 In Other Accounts 1,700.7 1,420.3 1,744.8 1,980.6
5.2 Money at Call and Short Notice 296.9 295.7 259.3 333.1
5.3 Advances to Banks 380.4 270.2 327.1 296.6
5.4 Other Assets 359.1 371.3 307.8 294.6
6 Investment 31,161.1 29,016.2 33,290.4 34,005.7
6.1 Government Securities 31,144.8 28,991.1 33,265.6 33,941.8
6.2 Other Approved Securities 16.4 25.1 24.8 63.9
7 Bank Credit 80,817.8 74,632.5 79,007.7 79,684.9
7a Food Credit 652.4 1,182.1 739.6 670.9
7.1 Loans, Cash-credits and Overdrafts 78,490.1 72,579.9 76,923.6 77,520.3
7.2 Inland Bills-Purchased 263.5 233.1 198.4 306.5
7.3 Inland Bills-Discounted 1,402.8 1,223.7 1,314.5 1,284.7
7.4 Foreign Bills-Purchased 248.6 212.6 207.4 213.0
7.5 Foreign Bills-Discounted 412.7 383.2 363.9 360.4
As on the Last Reporting Friday (in case of March)/ Last Friday
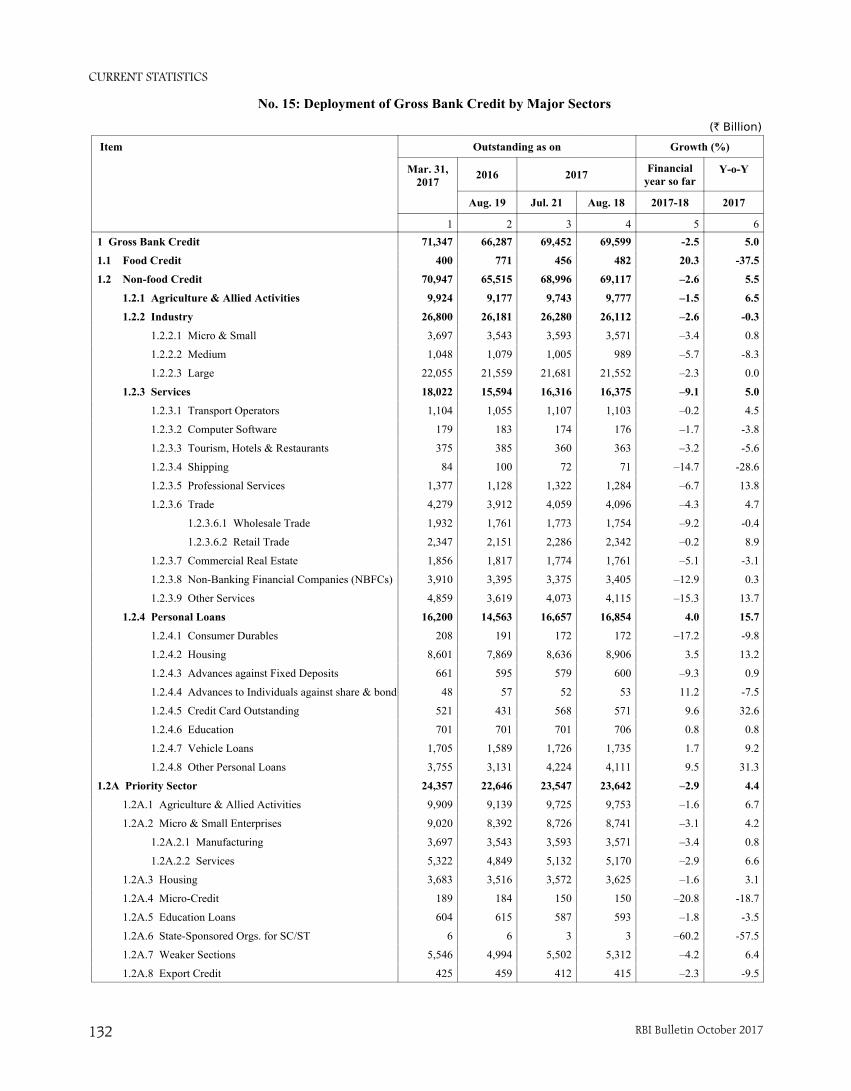
CURRENT STATISTICS
RBI Bulletin October 2017132
No. 15: Deployment of Gross Bank Credit by Major Sectors
(` Billion)
Item Outstanding as on Growth (%)
Mar. 31,2017
2016 2017 Financialyear so far
Y-o-Y
Aug. 19 Jul. 21 Aug. 18 2017-18 2017
1 2 3 4 5 61 Gross Bank Credit 71,347 66,287 69,452 69,599 -2.5 5.0
1.1 Food Credit 400 771 456 482 20.3 -37.5
1.2 Non-food Credit 70,947 65,515 68,996 69,117 –2.6 5.5
1.2.1 Agriculture & Allied Activities 9,924 9,177 9,743 9,777 –1.5 6.5
1.2.2 Industry 26,800 26,181 26,280 26,112 –2.6 -0.3
1.2.2.1 Micro & Small 3,697 3,543 3,593 3,571 –3.4 0.8
1.2.2.2 Medium 1,048 1,079 1,005 989 –5.7 -8.3
1.2.2.3 Large 22,055 21,559 21,681 21,552 –2.3 0.0
1.2.3 Services 18,022 15,594 16,316 16,375 –9.1 5.0
1.2.3.1 Transport Operators 1,104 1,055 1,107 1,103 –0.2 4.5
1.2.3.2 Computer Software 179 183 174 176 –1.7 -3.8
1.2.3.3 Tourism, Hotels & Restaurants 375 385 360 363 –3.2 -5.6
1.2.3.4 Shipping 84 100 72 71 –14.7 -28.6
1.2.3.5 Professional Services 1,377 1,128 1,322 1,284 –6.7 13.8
1.2.3.6 Trade 4,279 3,912 4,059 4,096 –4.3 4.7
1.2.3.6.1 Wholesale Trade 1,932 1,761 1,773 1,754 –9.2 -0.4
1.2.3.6.2 Retail Trade 2,347 2,151 2,286 2,342 –0.2 8.9
1.2.3.7 Commercial Real Estate 1,856 1,817 1,774 1,761 –5.1 -3.1
1.2.3.8 Non-Banking Financial Companies (NBFCs) 3,910 3,395 3,375 3,405 –12.9 0.3
1.2.3.9 Other Services 4,859 3,619 4,073 4,115 –15.3 13.7
1.2.4 Personal Loans 16,200 14,563 16,657 16,854 4.0 15.7
1.2.4.1 Consumer Durables 208 191 172 172 –17.2 -9.8
1.2.4.2 Housing 8,601 7,869 8,636 8,906 3.5 13.2
1.2.4.3 Advances against Fixed Deposits 661 595 579 600 –9.3 0.9
1.2.4.4 Advances to Individuals against share & bond 48 57 52 53 11.2 -7.5
1.2.4.5 Credit Card Outstanding 521 431 568 571 9.6 32.6
1.2.4.6 Education 701 701 701 706 0.8 0.8
1.2.4.7 Vehicle Loans 1,705 1,589 1,726 1,735 1.7 9.2
1.2.4.8 Other Personal Loans 3,755 3,131 4,224 4,111 9.5 31.3
1.2A Priority Sector 24,357 22,646 23,547 23,642 –2.9 4.4
1.2A.1 Agriculture & Allied Activities 9,909 9,139 9,725 9,753 –1.6 6.7
1.2A.2 Micro & Small Enterprises 9,020 8,392 8,726 8,741 –3.1 4.2
1.2A.2.1 Manufacturing 3,697 3,543 3,593 3,571 –3.4 0.8
1.2A.2.2 Services 5,322 4,849 5,132 5,170 –2.9 6.6
1.2A.3 Housing 3,683 3,516 3,572 3,625 –1.6 3.1
1.2A.4 Micro-Credit 189 184 150 150 –20.8 -18.7
1.2A.5 Education Loans 604 615 587 593 –1.8 -3.5
1.2A.6 State-Sponsored Orgs. for SC/ST 6 6 3 3 –60.2 -57.5
1.2A.7 Weaker Sections 5,546 4,994 5,502 5,312 –4.2 6.4
1.2A.8 Export Credit 425 459 412 415 –2.3 -9.5
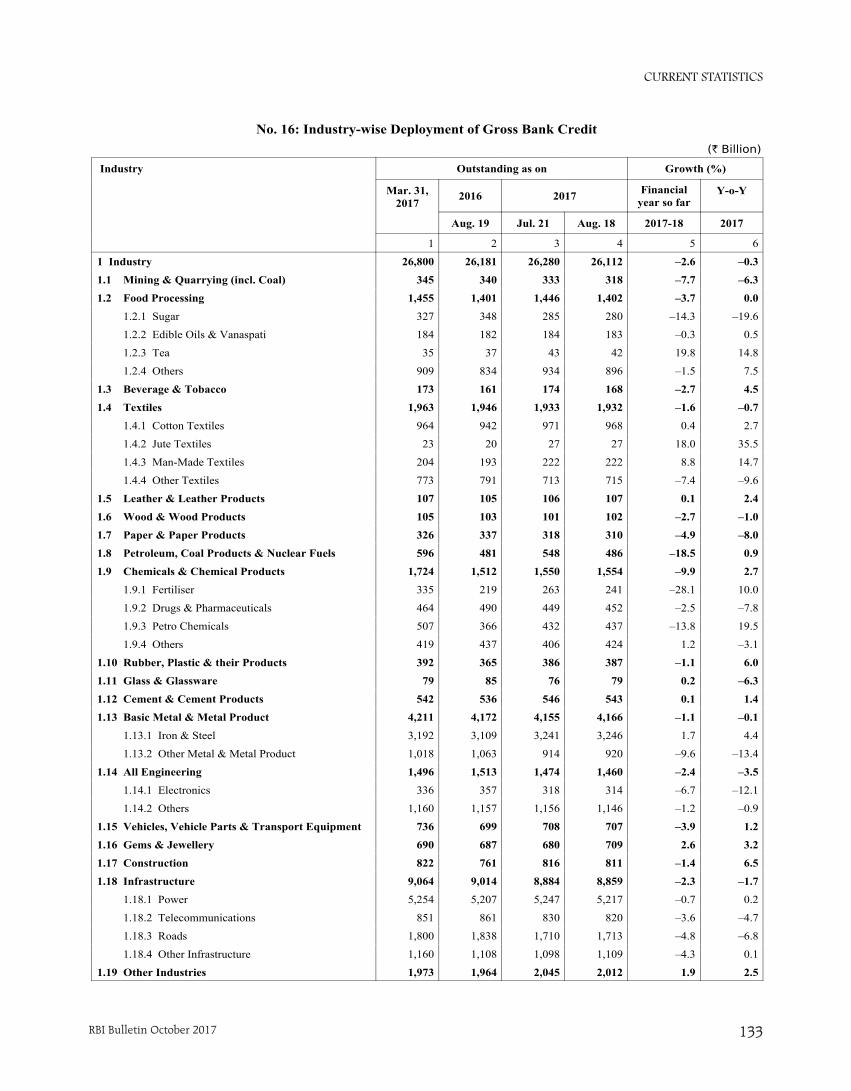
CURRENT STATISTICS
RBI Bulletin October 2017 133
No. 16: Industry-wise Deployment of Gross Bank Credit(` Billion)
Industry Outstanding as on Growth (%)
Mar. 31,2017
2016 2017 Financialyear so far
Y-o-Y
Aug. 19 Jul. 21 Aug. 18 2017-18 2017
1 2 3 4 5 6
1 Industry 26,800 26,181 26,280 26,112 –2.6 –0.3
1.1 Mining & Quarrying (incl. Coal) 345 340 333 318 –7.7 –6.3
1.2 Food Processing 1,455 1,401 1,446 1,402 –3.7 0.0
1.2.1 Sugar 327 348 285 280 –14.3 –19.6
1.2.2 Edible Oils & Vanaspati 184 182 184 183 –0.3 0.5
1.2.3 Tea 35 37 43 42 19.8 14.8
1.2.4 Others 909 834 934 896 –1.5 7.5
1.3 Beverage & Tobacco 173 161 174 168 –2.7 4.5
1.4 Textiles 1,963 1,946 1,933 1,932 –1.6 –0.7
1.4.1 Cotton Textiles 964 942 971 968 0.4 2.7
1.4.2 Jute Textiles 23 20 27 27 18.0 35.5
1.4.3 Man-Made Textiles 204 193 222 222 8.8 14.7
1.4.4 Other Textiles 773 791 713 715 –7.4 –9.6
1.5 Leather & Leather Products 107 105 106 107 0.1 2.4
1.6 Wood & Wood Products 105 103 101 102 –2.7 –1.0
1.7 Paper & Paper Products 326 337 318 310 –4.9 –8.0
1.8 Petroleum, Coal Products & Nuclear Fuels 596 481 548 486 –18.5 0.9
1.9 Chemicals & Chemical Products 1,724 1,512 1,550 1,554 –9.9 2.7
1.9.1 Fertiliser 335 219 263 241 –28.1 10.0
1.9.2 Drugs & Pharmaceuticals 464 490 449 452 –2.5 –7.8
1.9.3 Petro Chemicals 507 366 432 437 –13.8 19.5
1.9.4 Others 419 437 406 424 1.2 –3.1
1.10 Rubber, Plastic & their Products 392 365 386 387 –1.1 6.0
1.11 Glass & Glassware 79 85 76 79 0.2 –6.3
1.12 Cement & Cement Products 542 536 546 543 0.1 1.4
1.13 Basic Metal & Metal Product 4,211 4,172 4,155 4,166 –1.1 –0.1
1.13.1 Iron & Steel 3,192 3,109 3,241 3,246 1.7 4.4
1.13.2 Other Metal & Metal Product 1,018 1,063 914 920 –9.6 –13.4
1.14 All Engineering 1,496 1,513 1,474 1,460 –2.4 –3.5
1.14.1 Electronics 336 357 318 314 –6.7 –12.1
1.14.2 Others 1,160 1,157 1,156 1,146 –1.2 –0.9
1.15 Vehicles, Vehicle Parts & Transport Equipment 736 699 708 707 –3.9 1.2
1.16 Gems & Jewellery 690 687 680 709 2.6 3.2
1.17 Construction 822 761 816 811 –1.4 6.5
1.18 Infrastructure 9,064 9,014 8,884 8,859 –2.3 –1.7
1.18.1 Power 5,254 5,207 5,247 5,217 –0.7 0.2
1.18.2 Telecommunications 851 861 830 820 –3.6 –4.7
1.18.3 Roads 1,800 1,838 1,710 1,713 –4.8 –6.8
1.18.4 Other Infrastructure 1,160 1,108 1,098 1,109 –4.3 0.1
1.19 Other Industries 1,973 1,964 2,045 2,012 1.9 2.5
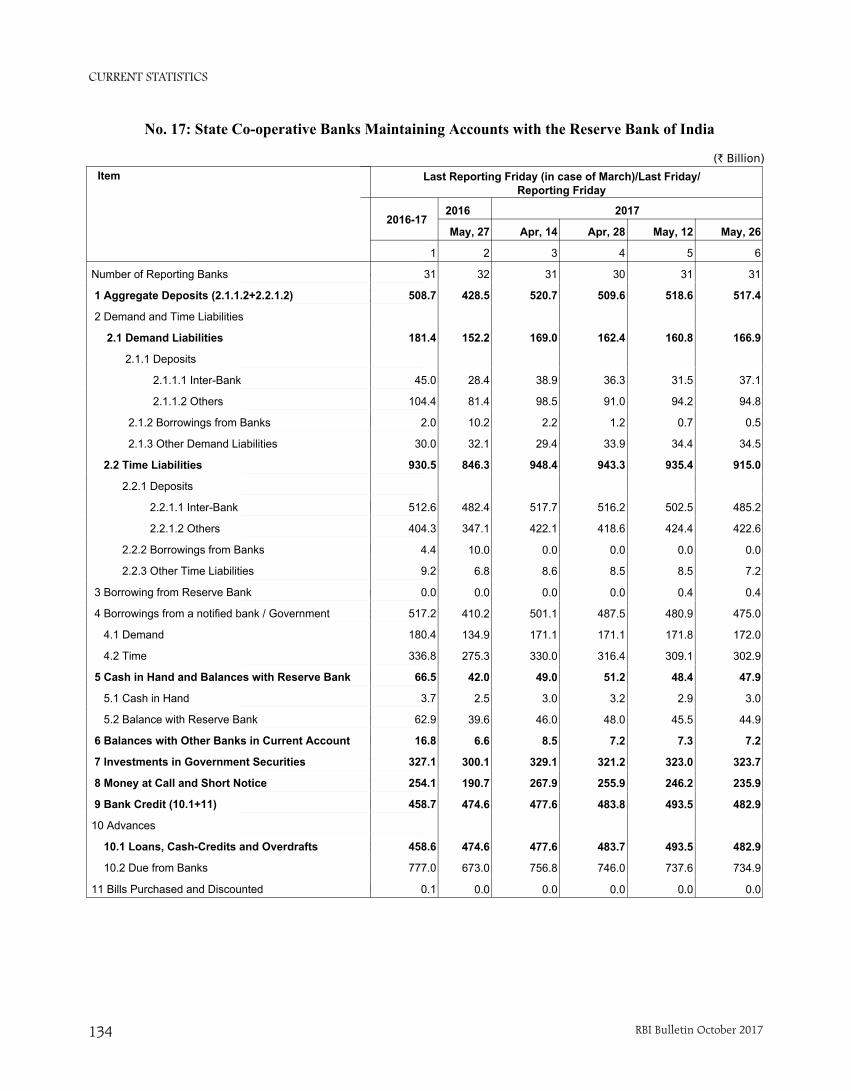
CURRENT STATISTICS
RBI Bulletin October 2017134
2016 2017
May, 27 Apr, 14 Apr, 28 May, 12 May, 26
2 3 4 5 6
Number of Reporting Banks 32 31 30 31 31
1 Aggregate Deposits (2.1.1.2+2 428.5 520.7 509.6 518.6 517.4
2 Demand and Time Liabilities
2.1 Demand Liabilities 152.2 169.0 162.4 160.8 166.9
2.1.1 Deposits
2.1.1.1 Inter-Bank 28.4 38.9 36.3 31.5 37.1
2.1.1.2 Others 81.4 98.5 91.0 94.2 94.8
2.1.2 Borrowings from Banks 10.2 2.2 1.2 0.7 0.5
2.1.3 Other Demand Liabilities 32.1 29.4 33.9 34.4 34.5
2.2 Time Liabilities 846.3 948.4 943.3 935.4 915.0
2.2.1 Deposits
2.2.1.1 Inter-Bank-Bank 482.4 517.7 516.2 502.5 485.2
2.2.1.2 Others 347.1 422.1 418.6 424.4 422.6
2.2.2 Borrowings from Banks 10.0 0.0 0.0 0.0 0.0
2.2.3 Other Time Liabilities 6.8 8.6 8.5 8.5 7.2
3 Borrowing from Reserve Bank 0.0 0.0 0.0 0.4 0.4
4 Borrowings from a notified ban 410.2 501.1 487.5 480.9 475.0
4.1 Demand 134.9 171.1 171.1 171.8 172.0
4.2 Time 275.3 330.0 316.4 309.1 302.9
5 Cash in Hand and Balances wi 42.0 49.0 51.2 48.4 47.9
5.1 Cash in Hand 2.5 3.0 3.2 2.9 3.0
5.2 Balance with Reserve Bank 39.6 46.0 48.0 45.5 44.9
6 Balances with Other Banks in 6.6 8.5 7.2 7.3 7.2
7 Investments in Government Se 300.1 329.1 321.2 323.0 323.7
8 Money at Call and Short Notic 190.7 267.9 255.9 246.2 235.9
9 Bank Credit (10.1+11) 474.6 477.6 483.8 493.5 482.9
10 Advances.
10.1 Loans, Cash-Credits and O 474.6 477.6 483.7 493.5 482.9
10.2 Due from Banks 673.0 756.8 746.0 737.6 734.9
11 Bills Purchased and Discount 0.0 0.0 0.0 0.0 0.0
Item
2016-17
1
Number of Reporting Banks 31
1 Aggregate Deposits (2.1.1.2+2.2.1.2) 508.7
2 Demand and Time Liabilities
2.1 Demand Liabilities 181.4
2.1.1 Deposits
2.1.1.1 Inter-Bank 45.0
2.1.1.2 Others 104.4
2.1.2 Borrowings from Banks 2.0
2.1.3 Other Demand Liabilities 30.0
2.2 Time Liabilities 930.5
2.2.1 Deposits
2.2.1.1 Inter-Bank 512.6
2.2.1.2 Others 404.3
2.2.2 Borrowings from Banks 4.4
2.2.3 Other Time Liabilities 9.2
3 Borrowing from Reserve Bank 0.0
4 Borrowings from a notified bank / Government 517.2
4.1 Demand 180.4
4.2 Time 336.8
5 Cash in Hand and Balances with Reserve Bank 66.5
5.1 Cash in Hand 3.7
5.2 Balance with Reserve Bank 62.9
6 Balances with Other Banks in Current Account 16.8
7 Investments in Government Securities 327.1
8 Money at Call and Short Notice 254.1
9 Bank Credit (10.1+11) 458.7
10 Advances
10.1 Loans, Cash-Credits and Overdrafts 458.6
10.2 Due from Banks 777.0
11 Bills Purchased and Discounted 0.1
Last Reporting Friday (in case of March)/Last Friday/Reporting Friday
(` Billion)
No. 17: State Co-operative Banks Maintaining Accounts with the Reserve Bank of India
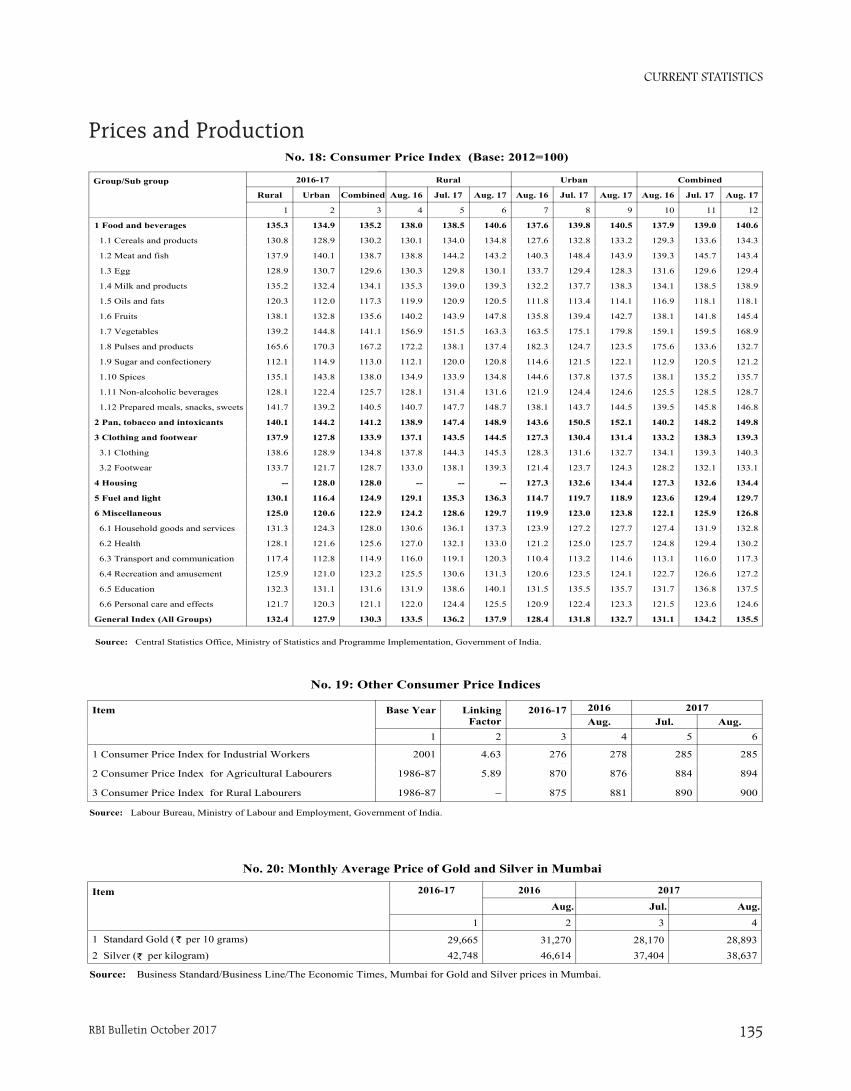
CURRENT STATISTICS
RBI Bulletin October 2017 135
No. 18: Consumer Price Index (Base: 2012=100)
Rural Urban Combined
Aug. 16 Jul. 17 Aug. 17 Aug. 16 Jul. 17 Aug. 17 Aug. 16 Jul. 17 Aug. 17
4 5 6 7 8 9 10 11 12
138.0 138.5 140.6 137.6 139.8 140.5 137.9 139.0 140.6
130.1 134.0 134.8 127.6 132.8 133.2 129.3 133.6 134.3
138.8 144.2 143.2 140.3 148.4 143.9 139.3 145.7 143.4
130.3 129.8 130.1 133.7 129.4 128.3 131.6 129.6 129.4
135.3 139.0 139.3 132.2 137.7 138.3 134.1 138.5 138.9
119.9 120.9 120.5 111.8 113.4 114.1 116.9 118.1 118.1
140.2 143.9 147.8 135.8 139.4 142.7 138.1 141.8 145.4
156.9 151.5 163.3 163.5 175.1 179.8 159.1 159.5 168.9
172.2 138.1 137.4 182.3 124.7 123.5 175.6 133.6 132.7
112.1 120.0 120.8 114.6 121.5 122.1 112.9 120.5 121.2
134.9 133.9 134.8 144.6 137.8 137.5 138.1 135.2 135.7
128.1 131.4 131.6 121.9 124.4 124.6 125.5 128.5 128.7
140.7 147.7 148.7 138.1 143.7 144.5 139.5 145.8 146.8
138.9 147.4 148.9 143.6 150.5 152.1 140.2 148.2 149.8
137.1 143.5 144.5 127.3 130.4 131.4 133.2 138.3 139.3
137.8 144.3 145.3 128.3 131.6 132.7 134.1 139.3 140.3
133.0 138.1 139.3 121.4 123.7 124.3 128.2 132.1 133.1
-- -- -- 127.3 132.6 134.4 127.3 132.6 134.4
129.1 135.3 136.3 114.7 119.7 118.9 123.6 129.4 129.7
124.2 128.6 129.7 119.9 123.0 123.8 122.1 125.9 126.8
130.6 136.1 137.3 123.9 127.2 127.7 127.4 131.9 132.8
127.0 132.1 133.0 121.2 125.0 125.7 124.8 129.4 130.2
116.0 119.1 120.3 110.4 113.2 114.6 113.1 116.0 117.3
125.5 130.6 131.3 120.6 123.5 124.1 122.7 126.6 127.2
131.9 138.6 140.1 131.5 135.5 135.7 131.7 136.8 137.5
122.0 124.4 125.5 120.9 122.4 123.3 121.5 123.6 124.6
133.5 136.2 137.9 128.4 131.8 132.7 131.1 134.2 135.5
Group/Sub group 2016-17
Rural Urban Combined
1 2 3
1 Food and beverages 135.3 134.9 135.2
1.1 Cereals and products 130.8 128.9 130.2
1.2 Meat and fish 137.9 140.1 138.7
1.3 Egg 128.9 130.7 129.6
1.4 Milk and products 135.2 132.4 134.1
1.5 Oils and fats 120.3 112.0 117.3
1.6 Fruits 138.1 132.8 135.6
1.7 Vegetables 139.2 144.8 141.1
1.8 Pulses and products 165.6 170.3 167.2
1.9 Sugar and confectionery 112.1 114.9 113.0
1.10 Spices 135.1 143.8 138.0
1.11 Non-alcoholic beverages 128.1 122.4 125.7
1.12 Prepared meals, snacks, sweets 141.7 139.2 140.5
2 Pan, tobacco and intoxicants 140.1 144.2 141.2
3 Clothing and footwear 137.9 127.8 133.9
3.1 Clothing 138.6 128.9 134.8
3.2 Footwear 133.7 121.7 128.7
4 Housing -- 128.0 128.0
5 Fuel and light 130.1 116.4 124.9
6 Miscellaneous 125.0 120.6 122.9
6.1 Household goods and services 131.3 124.3 128.0
6.2 Health 128.1 121.6 125.6
6.3 Transport and communication 117.4 112.8 114.9
6.4 Recreation and amusement 125.9 121.0 123.2
6.5 Education 132.3 131.1 131.6
6.6 Personal care and effects 121.7 120.3 121.1
General Index (All Groups) 132.4 127.9 130.3
Source: Central Statistics Office, Ministry of Statistics and Programme Implementation, Government of India.
No. 19: Other Consumer Price Indices
2016 2017Aug. Jul. Aug.
4 5 6
278 285 285
876 884 894
881 890 900
Item Base Year LinkingFactor
2016-17
1 2 3
1 Consumer Price Index for Industrial Workers 2001 4.63 276
2 Consumer Price Index for Agricultural Labourers 1986-87 5.89 870
3 Consumer Price Index for Rural Labourers 1986-87 – 875
Source: Labour Bureau, Ministry of Labour and Employment, Government of India.
No. 20: Monthly Average Price of Gold and Silver in Mumbai
Source: Business Standard/Business Line/The Economic Times, Mumbai for Gold and Silver prices in Mumbai.
Item 2016-17 2016 2017
Aug. Jul. Aug.
1 2 3 4
1 Standard Gold ( per 10 grams) 29,665 31,270 28,170 28,8932 Silver ( per kilogram) 42,748 46,614 37,404 38,637
`
`
Prices and Production
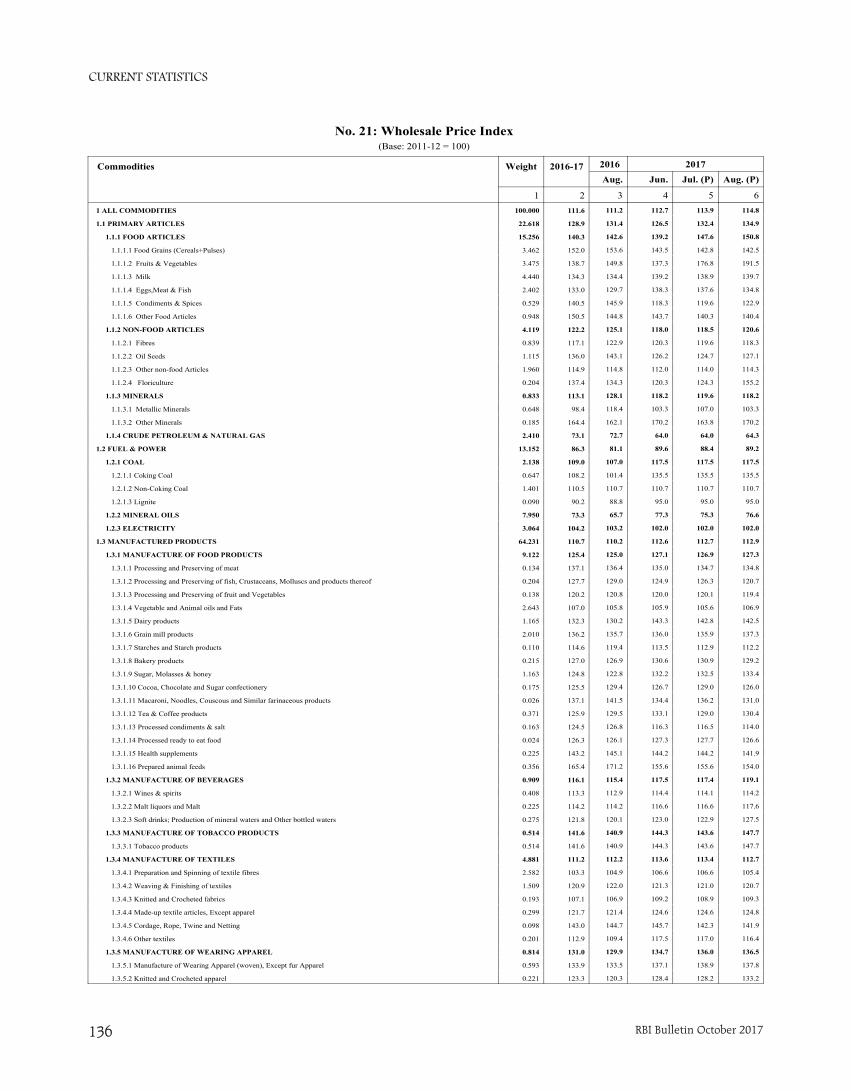
CURRENT STATISTICS
RBI Bulletin October 2017136
No. 21: Wholesale Price Index(Base: 2011-12 = 100)
2016 2017
Aug. Jun. Jul. (P) Aug. (P)
3 4 5 6111.2 112.7 113.9 114.8
131.4 126.5 132.4 134.9
142.6 139.2 147.6 150.8
153.6 143.5 142.8 142.5
149.8 137.3 176.8 191.5
134.4 139.2 138.9 139.7
129.7 138.3 137.6 134.8
145.9 118.3 119.6 122.9
144.8 143.7 140.3 140.4
125.1 118.0 118.5 120.6
122.9 120.3 119.6 118.3
143.1 126.2 124.7 127.1
114.8 112.0 114.0 114.3
134.3 120.3 124.3 155.2
128.1 118.2 119.6 118.2
118.4 103.3 107.0 103.3
162.1 170.2 163.8 170.2
72.7 64.0 64.0 64.3
81.1 89.6 88.4 89.2
107.0 117.5 117.5 117.5
101.4 135.5 135.5 135.5
110.7 110.7 110.7 110.7
88.8 95.0 95.0 95.0
65.7 77.3 75.3 76.6
103.2 102.0 102.0 102.0
110.2 112.6 112.7 112.9
125.0 127.1 126.9 127.3
136.4 135.0 134.7 134.8
129.0 124.9 126.3 120.7
120.8 120.0 120.1 119.4
105.8 105.9 105.6 106.9
130.2 143.3 142.8 142.5
135.7 136.0 135.9 137.3
119.4 113.5 112.9 112.2
126.9 130.6 130.9 129.2
122.8 132.2 132.5 133.4
129.4 126.7 129.0 126.0
141.5 134.4 136.2 131.0
129.5 133.1 129.0 130.4
126.8 116.3 116.5 114.0
126.1 127.3 127.7 126.6
145.1 144.2 144.2 141.9
171.2 155.6 155.6 154.0
115.4 117.5 117.4 119.1
112.9 114.4 114.1 114.2
114.2 116.6 116.6 117.6
120.1 123.0 122.9 127.5
140.9 144.3 143.6 147.7
140.9 144.3 143.6 147.7
112.2 113.6 113.4 112.7
104.9 106.6 106.6 105.4
122.0 121.3 121.0 120.7
106.9 109.2 108.9 109.3
121.4 124.6 124.6 124.8
144.7 145.7 142.3 141.9
109.4 117.5 117.0 116.4
129.9 134.7 136.0 136.5
133.5 137.1 138.9 137.8
120.3 128.4 128.2 133.2
Commodities Weight 2016-17
1 21 ALL COMMODITIES 100.000 111.6
1.1 PRIMARY ARTICLES 22.618 128.9
1.1.1 FOOD ARTICLES 15.256 140.3
1.1.1.1 Food Grains (Cereals+Pulses) 3.462 152.0
1.1.1.2 Fruits & Vegetables 3.475 138.7
1.1.1.3 Milk 4.440 134.3
1.1.1.4 Eggs,Meat & Fish 2.402 133.0
1.1.1.5 Condiments & Spices 0.529 140.5
1.1.1.6 Other Food Articles 0.948 150.5
1.1.2 NON-FOOD ARTICLES 4.119 122.2
1.1.2.1 Fibres 0.839 117.1
1.1.2.2 Oil Seeds 1.115 136.0
1.1.2.3 Other non-food Articles 1.960 114.9
1.1.2.4 Floriculture 0.204 137.4
1.1.3 MINERALS 0.833 113.1
1.1.3.1 Metallic Minerals 0.648 98.4
1.1.3.2 Other Minerals 0.185 164.4
1.1.4 CRUDE PETROLEUM & NATURAL GAS 2.410 73.1
1.2 FUEL & POWER 13.152 86.3
1.2.1 COAL 2.138 109.0
1.2.1.1 Coking Coal 0.647 108.2
1.2.1.2 Non-Coking Coal 1.401 110.5
1.2.1.3 Lignite 0.090 90.2
1.2.2 MINERAL OILS 7.950 73.3
1.2.3 ELECTRICITY 3.064 104.2
1.3 MANUFACTURED PRODUCTS 64.231 110.7
1.3.1 MANUFACTURE OF FOOD PRODUCTS 9.122 125.4
1.3.1.1 Processing and Preserving of meat 0.134 137.1
1.3.1.2 Processing and Preserving of fish, Crustaceans, Molluscs and products thereof 0.204 127.7
1.3.1.3 Processing and Preserving of fruit and Vegetables 0.138 120.2
1.3.1.4 Vegetable and Animal oils and Fats 2.643 107.0
1.3.1.5 Dairy products 1.165 132.3
1.3.1.6 Grain mill products 2.010 136.2
1.3.1.7 Starches and Starch products 0.110 114.6
1.3.1.8 Bakery products 0.215 127.0
1.3.1.9 Sugar, Molasses & honey 1.163 124.8
1.3.1.10 Cocoa, Chocolate and Sugar confectionery 0.175 125.5
1.3.1.11 Macaroni, Noodles, Couscous and Similar farinaceous products 0.026 137.1
1.3.1.12 Tea & Coffee products 0.371 125.9
1.3.1.13 Processed condiments & salt 0.163 124.5
1.3.1.14 Processed ready to eat food 0.024 126.3
1.3.1.15 Health supplements 0.225 143.2
1.3.1.16 Prepared animal feeds 0.356 165.4
1.3.2 MANUFACTURE OF BEVERAGES 0.909 116.1
1.3.2.1 Wines & spirits 0.408 113.3
1.3.2.2 Malt liquors and Malt 0.225 114.2
1.3.2.3 Soft drinks; Production of mineral waters and Other bottled waters 0.275 121.8
1.3.3 MANUFACTURE OF TOBACCO PRODUCTS 0.514 141.6
1.3.3.1 Tobacco products 0.514 141.6
1.3.4 MANUFACTURE OF TEXTILES 4.881 111.2
1.3.4.1 Preparation and Spinning of textile fibres 2.582 103.3
1.3.4.2 Weaving & Finishing of textiles 1.509 120.9
1.3.4.3 Knitted and Crocheted fabrics 0.193 107.1
1.3.4.4 Made-up textile articles, Except apparel 0.299 121.7
1.3.4.5 Cordage, Rope, Twine and Netting 0.098 143.0
1.3.4.6 Other textiles 0.201 112.9
1.3.5 MANUFACTURE OF WEARING APPAREL 0.814 131.0
1.3.5.1 Manufacture of Wearing Apparel (woven), Except fur Apparel 0.593 133.9
1.3.5.2 Knitted and Crocheted apparel 0.221 123.3
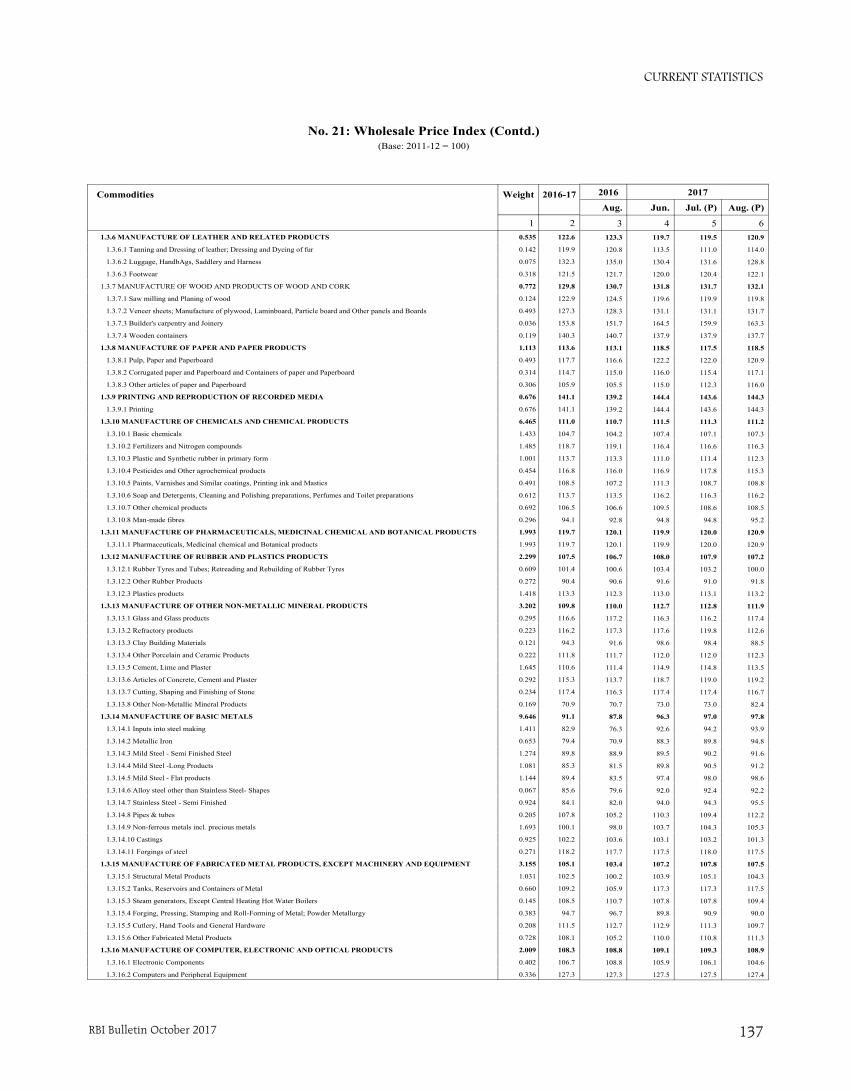
CURRENT STATISTICS
RBI Bulletin October 2017 137
No. 21: Wholesale Price Index (Contd.)(Base: 2011-12 = 100)
Commodities Weight 2016-17
1 2 1.3.6 MANUFACTURE OF LEATHER AND RELATED PRODUCTS 0.535 122.6
1.3.6.1 Tanning and Dressing of leather; Dressing and Dyeing of fur 0.142 119.9
1.3.6.2 Luggage, HandbAgs, Saddlery and Harness 0.075 132.3
1.3.6.3 Footwear 0.318 121.5
1.3.7 MANUFACTURE OF WOOD AND PRODUCTS OF WOOD AND CORK 0.772 129.8
1.3.7.1 Saw milling and Planing of wood 0.124 122.9
1.3.7.2 Veneer sheets; Manufacture of plywood, Laminboard, Particle board and Other panels and Boards 0.493 127.3
1.3.7.3 Builder's carpentry and Joinery 0.036 153.8
1.3.7.4 Wooden containers 0.119 140.3
1.3.8 MANUFACTURE OF PAPER AND PAPER PRODUCTS 1.113 113.6
1.3.8.1 Pulp, Paper and Paperboard 0.493 117.7
1.3.8.2 Corrugated paper and Paperboard and Containers of paper and Paperboard 0.314 114.7
1.3.8.3 Other articles of paper and Paperboard 0.306 105.9
1.3.9 PRINTING AND REPRODUCTION OF RECORDED MEDIA 0.676 141.1
1.3.9.1 Printing 0.676 141.1
1.3.10 MANUFACTURE OF CHEMICALS AND CHEMICAL PRODUCTS 6.465 111.0
1.3.10.1 Basic chemicals 1.433 104.7
1.3.10.2 Fertilizers and Nitrogen compounds 1.485 118.7
1.3.10.3 Plastic and Synthetic rubber in primary form 1.001 113.7
1.3.10.4 Pesticides and Other agrochemical products 0.454 116.8
1.3.10.5 Paints, Varnishes and Similar coatings, Printing ink and Mastics 0.491 108.5
1.3.10.6 Soap and Detergents, Cleaning and Polishing preparations, Perfumes and Toilet preparations 0.612 113.7
1.3.10.7 Other chemical products 0.692 106.5
1.3.10.8 Man-made fibres 0.296 94.1
1.3.11 MANUFACTURE OF PHARMACEUTICALS, MEDICINAL CHEMICAL AND BOTANICAL PRODUCTS 1.993 119.7
1.3.11.1 Pharmaceuticals, Medicinal chemical and Botanical products 1.993 119.7
1.3.12 MANUFACTURE OF RUBBER AND PLASTICS PRODUCTS 2.299 107.5
1.3.12.1 Rubber Tyres and Tubes; Retreading and Rebuilding of Rubber Tyres 0.609 101.4
1.3.12.2 Other Rubber Products 0.272 90.4
1.3.12.3 Plastics products 1.418 113.3
1.3.13 MANUFACTURE OF OTHER NON-METALLIC MINERAL PRODUCTS 3.202 109.8
1.3.13.1 Glass and Glass products 0.295 116.6
1.3.13.2 Refractory products 0.223 116.2
1.3.13.3 Clay Building Materials 0.121 94.3
1.3.13.4 Other Porcelain and Ceramic Products 0.222 111.8
1.3.13.5 Cement, Lime and Plaster 1.645 110.6
1.3.13.6 Articles of Concrete, Cement and Plaster 0.292 115.3
1.3.13.7 Cutting, Shaping and Finishing of Stone 0.234 117.4
1.3.13.8 Other Non-Metallic Mineral Products 0.169 70.9
1.3.14 MANUFACTURE OF BASIC METALS 9.646 91.1
1.3.14.1 Inputs into steel making 1.411 82.9
1.3.14.2 Metallic Iron 0.653 79.4
1.3.14.3 Mild Steel - Semi Finished Steel 1.274 89.8
1.3.14.4 Mild Steel -Long Products 1.081 85.3
1.3.14.5 Mild Steel - Flat products 1.144 89.4
1.3.14.6 Alloy steel other than Stainless Steel- Shapes 0.067 85.6
1.3.14.7 Stainless Steel - Semi Finished 0.924 84.1
1.3.14.8 Pipes & tubes 0.205 107.8
1.3.14.9 Non-ferrous metals incl. precious metals 1.693 100.1
1.3.14.10 Castings 0.925 102.2
1.3.14.11 Forgings of steel 0.271 118.2
1.3.15 MANUFACTURE OF FABRICATED METAL PRODUCTS, EXCEPT MACHINERY AND EQUIPMENT 3.155 105.1
1.3.15.1 Structural Metal Products 1.031 102.5
1.3.15.2 Tanks, Reservoirs and Containers of Metal 0.660 109.2
1.3.15.3 Steam generators, Except Central Heating Hot Water Boilers 0.145 108.5
1.3.15.4 Forging, Pressing, Stamping and Roll-Forming of Metal; Powder Metallurgy 0.383 94.7
1.3.15.5 Cutlery, Hand Tools and General Hardware 0.208 111.5
1.3.15.6 Other Fabricated Metal Products 0.728 108.1
1.3.16 MANUFACTURE OF COMPUTER, ELECTRONIC AND OPTICAL PRODUCTS 2.009 108.3
1.3.16.1 Electronic Components 0.402 106.7
1.3.16.2 Computers and Peripheral Equipment 0.336 127.3
2016 2017
Aug. Jun. Jul. (P) Aug. (P)
3 4 5 6123.3 119.7 119.5 120.9
120.8 113.5 111.0 114.0
135.0 130.4 131.6 128.8
121.7 120.0 120.4 122.1
130.7 131.8 131.7 132.1
124.5 119.6 119.9 119.8
128.3 131.1 131.1 131.7
151.7 164.5 159.9 163.3
140.7 137.9 137.9 137.7
113.1 118.5 117.5 118.5
116.6 122.2 122.0 120.9
115.0 116.0 115.4 117.1
105.5 115.0 112.3 116.0
139.2 144.4 143.6 144.3
139.2 144.4 143.6 144.3
110.7 111.5 111.3 111.2
104.2 107.4 107.1 107.3
119.1 116.4 116.6 116.3
113.3 111.0 111.4 112.3
116.0 116.9 117.8 115.3
107.2 111.3 108.7 108.8
113.5 116.2 116.3 116.2
106.6 109.5 108.6 108.5
92.8 94.8 94.8 95.2
120.1 119.9 120.0 120.9
120.1 119.9 120.0 120.9
106.7 108.0 107.9 107.2
100.6 103.4 103.2 100.0
90.6 91.6 91.0 91.8
112.3 113.0 113.1 113.2
110.0 112.7 112.8 111.9
117.2 116.3 116.2 117.4
117.3 117.6 119.8 112.6
91.6 98.6 98.4 88.5
111.7 112.0 112.0 112.3
111.4 114.9 114.8 113.5
113.7 118.7 119.0 119.2
116.3 117.4 117.4 116.7
70.7 73.0 73.0 82.4
87.8 96.3 97.0 97.8
76.3 92.6 94.2 93.9
70.9 88.3 89.8 94.8
88.9 89.5 90.2 91.6
81.5 89.8 90.5 91.2
83.5 97.4 98.0 98.6
79.6 92.0 92.4 92.2
82.0 94.0 94.3 95.5
105.2 110.3 109.4 112.2
98.0 103.7 104.3 105.3
103.6 103.1 103.2 101.3
117.7 117.5 118.0 117.5
103.4 107.2 107.8 107.5
100.2 103.9 105.1 104.3
105.9 117.3 117.3 117.5
110.7 107.8 107.8 109.4
96.7 89.8 90.9 90.0
112.7 112.9 111.3 109.7
105.2 110.0 110.8 111.3
108.8 109.1 109.3 108.9
108.8 105.9 106.1 104.6
127.3 127.5 127.5 127.4

CURRENT STATISTICS
RBI Bulletin October 2017138
No. 21: Wholesale Price Index (Concld.)(Base: 2011-12 = 100)
Commodities Weight 2016-17
1 2 1.3.16.3 Communication Equipment 0.310 104.1
1.3.16.4 Consumer Electronics 0.641 100.0
1.3.16.5 Measuring, Testing, Navigating and Control equipment 0.181 103.1
1.3.16.6 Watches and Clocks 0.076 137.9
1.3.16.7 Irradiation, Electromedical and Electrotherapeutic equipment 0.055 104.3
1.3.16.8 Optical instruments and Photographic equipment 0.008 96.6
1.3.17 MANUFACTURE OF ELECTRICAL EQUIPMENT 2.930 108.2
1.3.17.1 Electric motors, Generators, Transformers and Electricity distribution and Control apparatus 1.298 105.0
1.3.17.2 Batteries and Accumulators 0.236 120.4
1.3.17.3 Fibre optic cables for data transmission or live transmission of images 0.133 118.8
1.3.17.4 Other electronic and Electric wires and Cables 0.428 99.7
1.3.17.5 Wiring devices, Electric lighting & display equipment 0.263 108.5
1.3.17.6 Domestic appliances 0.366 119.4
1.3.17.7 Other electrical equipment 0.206 104.4
1.3.18 MANUFACTURE OF MACHINERY AND EQUIPMENT 4.789 107.9
1.3.18.1 Engines and Turbines, Except aircraft, Vehicle and Two wheeler engines 0.638 104.1
1.3.18.2 Fluid power equipment 0.162 114.3
1.3.18.3 Other pumps, Compressors, Taps and Valves 0.552 106.6
1.3.18.4 Bearings, Gears, Gearing and Driving elements 0.340 104.5
1.3.18.5 Ovens, Furnaces and Furnace burners 0.008 77.8
1.3.18.6 Lifting and Handling equipment 0.285 103.2
1.3.18.7 Office machinery and Equipment 0.006 130.2
1.3.18.8 Other general-purpose machinery 0.437 124.9
1.3.18.9 Agricultural and Forestry machinery 0.833 112.3
1.3.18.10 Metal-forming machinery and Machine tools 0.224 100.1
1.3.18.11 Machinery for mining, Quarrying and Construction 0.371 79.6
1.3.18.12 Machinery for food, Beverage and Tobacco processing 0.228 116.9
1.3.18.13 Machinery for textile, Apparel and Leather production 0.192 116.2
1.3.18.14 Other special-purpose machinery 0.468 115.8
1.3.18.15 Renewable electricity generating equipment 0.046 73.7
1.3.19 MANUFACTURE OF MOTOR VEHICLES, TRAILERS AND SEMI-TRAILERS 4.969 110.4
1.3.19.1 Motor vehicles 2.600 113.4
1.3.19.2 Parts and Accessories for motor vehicles 2.368 107.2
1.3.20 MANUFACTURE OF OTHER TRANSPORT EQUIPMENT 1.648 107.7
1.3.20.1 Building of ships and Floating structures 0.117 158.7
1.3.20.2 Railway locomotives and Rolling stock 0.110 100.6
1.3.20.3 Motor cycles 1.302 102.8
1.3.20.4 Bicycles and Invalid carriages 0.117 118.0
1.3.20.5 Other transport equipment 0.002 116.5
1.3.21 MANUFACTURE OF FURNITURE 0.727 114.1
1.3.21.1 Furniture 0.727 114.1
1.3.22 OTHER MANUFACTURING 1.064 119.7
1.3.22.1 Jewellery and Related articles 0.996 118.4
1.3.22.2 Musical instruments 0.001 158.0
1.3.22.3 Sports goods 0.012 124.7
1.3.22.4 Games and Toys 0.005 125.2
1.3.22.5 Medical and Dental instruments and Supplies 0.049 143.3
2 FOOD INDEX 24.378 134.7
2016 2017
Aug. Jun. Jul. (P) Aug. (P)
3 4 5 6104.1 104.1 104.1 104.7
100.2 101.6 101.6 101.0
101.5 106.6 109.0 109.0
140.0 139.4 136.5 137.2
105.5 103.5 103.5 102.4
97.7 98.2 103.4 106.8
108.0 109.0 108.4 109.3
104.9 106.4 105.4 106.0
118.7 119.2 120.8 115.0
119.3 114.3 113.2 121.3
98.2 102.5 102.4 103.1
110.4 105.7 104.5 111.4
119.1 120.7 120.6 121.3
105.8 106.4 106.1 105.7
107.5 108.5 108.1 108.4
104.4 102.7 102.8 103.3
114.5 115.5 115.8 115.1
106.4 108.2 108.0 108.4
103.7 105.0 103.6 106.8
75.5 79.2 79.2 79.4
103.2 104.1 103.6 103.6
130.2 130.2 130.2 130.2
124.6 126.8 125.1 126.7
112.0 112.3 111.9 111.5
98.2 102.4 101.5 98.8
80.3 76.1 76.3 75.7
112.3 120.4 119.3 121.8
116.3 117.7 116.9 116.2
115.0 118.4 119.7 118.8
75.4 71.1 69.8 71.1
110.8 111.6 111.1 111.9
113.3 114.3 114.3 115.3
108.0 108.7 107.5 108.2
107.8 109.3 111.0 109.5
158.8 158.8 158.8 158.8
103.4 101.3 102.8 102.1
102.7 104.3 106.7 104.7
117.4 122.5 118.4 119.8
116.2 118.8 120.3 120.7
113.1 117.7 117.8 119.5
113.1 117.7 117.8 119.5
126.0 113.9 115.9 113.7
125.1 111.9 114.1 111.5
162.2 147.2 147.2 148.2
124.5 127.1 127.1 126.0
127.0 126.8 127.9 126.3
144.5 148.0 148.0 153.5
136.0 134.7 139.9 142.0
Source: Office of the Economic Adviser, Ministry of Commerce and Industry, Government of India.
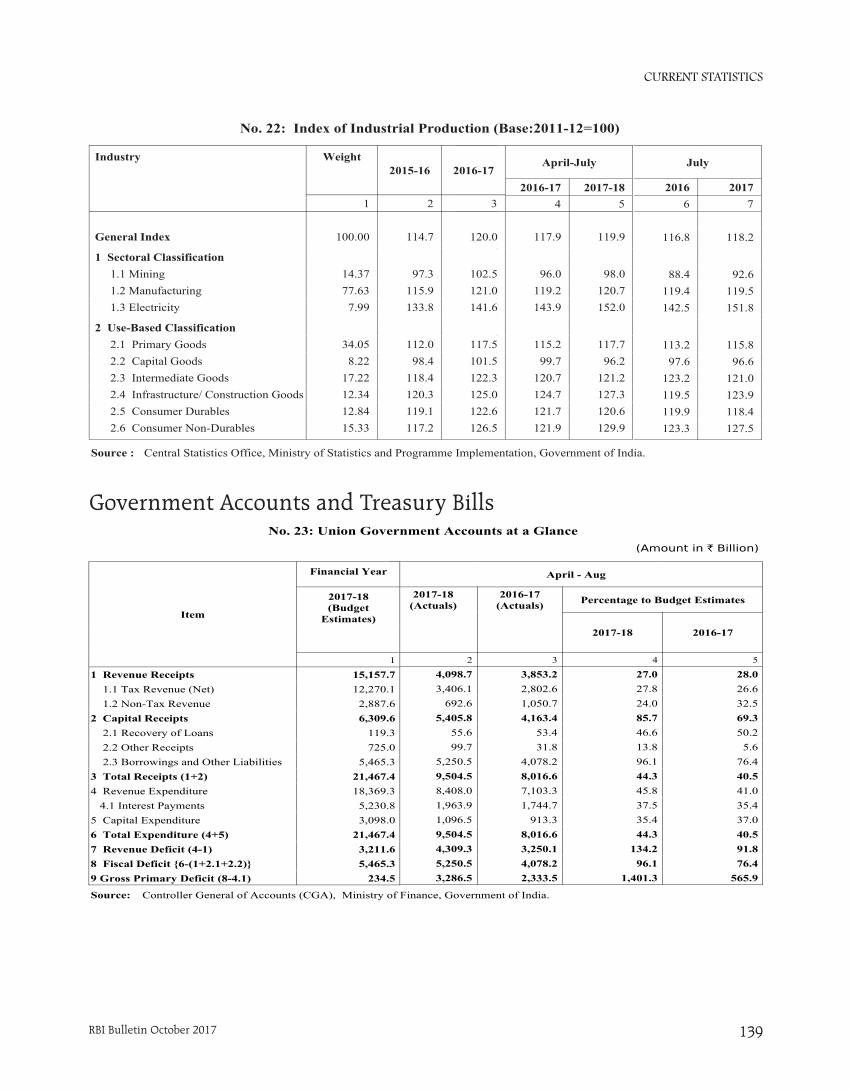
CURRENT STATISTICS
RBI Bulletin October 2017 139
April-July
2016-17 2017-184 5
117.9 119.9
96.0 98.0119.2 120.7143.9 152.0
115.2 117.799.7 96.2
120.7 121.2124.7 127.3121.7 120.6121.9 129.9
Gen Ge
Sect ElMa
Mi
Use-PriCa
Int
Inf
Co
Co
No. 22: Index of Industrial Production (Base:2011-12=100)
Industry Weight2015-16 2016-17
1 2 3General IndexGeneral Index 100.00 114.7 120.0
1 Sectoral Classification 1.1 Mining 14.37 97.3 102.5 1.2 Manufacturing 77.63 115.9 121.0 1.3 Electricity 7.99 133.8 141.6
2 Use-Based Classification 2.1 Primary Goods 34.05 112.0 117.5 2.2 Capital Goods 8.22 98.4 101.5 2.3 Intermediate Goods 17.22 118.4 122.3 2.4 Infrastructure/ Construction Goods 12.34 120.3 125.0 2.5 Consumer Durables 12.84 119.1 122.6 2.6 Consumer Non-Durables 15.33 117.2 126.5
Source : Central Statistics Office, Ministry of Statistics and Programme Implementation, Government of India.
July
2016 20176 7
116.8 118.2
88.4 92.6119.4 119.5142.5 151.8
113.2 115.897.6 96.6
123.2 121.0119.5 123.9119.9 118.4123.3 127.5
Government Accounts and Treasury BillsNo. 23: Union Government Accounts at a Glance
(Amount in ` Billion)
Source: Controller General of Accounts (CGA), Ministry of Finance, Government of India.
April - Aug
2017-18(Actuals)
2016-17(Actuals) Percentage to Budget Estimates
2017-18 2016-17
2 3 4 5
4,098.7 3,853.2 27.0 28.03,406.1 2,802.6 27.8 26.6
692.6 1,050.7 24.0 32.55,405.8 4,163.4 85.7 69.3
55.6 53.4 46.6 50.299.7 31.8 13.8 5.6
5,250.5 4,078.2 96.1 76.49,504.5 8,016.6 44.3 40.58,408.0 7,103.3 45.8 41.01,963.9 1,744.7 37.5 35.41,096.5 913.3 35.4 37.09,504.5 8,016.6 44.3 40.54,309.3 3,250.1 134.2 91.85,250.5 4,078.2 96.1 76.43,286.5 2,333.5 1,401.3 565.9
Item
Financial Year
2017-18(Budget
Estimates)
1
1 Revenue Receipts 15,157.7 1.1 Tax Revenue (Net) 12,270.1 1.2 Non-Tax Revenue 2,887.62 Capital Receipts 6,309.6 2.1 Recovery of Loans 119.3 2.2 Other Receipts 725.0 2.3 Borrowings and Other Liabilities 5,465.33 Total Receipts (1+2) 21,467.44 Revenue Expenditure 18,369.3 4.1 Interest Payments 5,230.85 Capital Expenditure 3,098.06 Total Expenditure (4+5) 21,467.47 Revenue Deficit (4-1) 3,211.68 Fiscal Deficit {6-(1+2.1+2.2)} 5,465.39 Gross Primary Deficit (8-4.1) 234.5

CURRENT STATISTICS
RBI Bulletin October 2017140
(` Billion)
2016 2017Aug. 26 Jul. 21 Jul. 28 Aug. 4 Aug. 11 Aug. 18 Aug. 25
2 3 4 5 6 7 8
211.3 249.0 260.5 287.8 335.3 338.4 392.2162.2 164.5 167.0 154.3 156.7 170.1 191.9645.4 722.7 676.8 727.6 735.1 730.1 664.5895.7 812.2 819.1 823.8 793.2 796.6 742.0
390.6 377.3 372.2 368.2 362.4 354.0 389.8260.1 219.2 242.7 217.2 269.5 273.8 274.4106.0 218.7 218.8 218.8 213.3 213.3 194.0128.7 87.9 99.4 128.9 112.9 117.0 111.3
605.6 596.4 595.5 506.8 542.1 477.3 526.6602.3 456.3 476.8 488.8 496.3 511.6 522.9
25.2 29.7 29.7 29.7 29.7 29.7 29.7322.4 336.7 317.3 392.6 351.0 394.1 333.4
– – – – – – –– – – – – – –
900.0 1,309.9 1,421.0 1,472.3 1,349.1 1,263.1 1,532.76.0 6.5 5.2 6.1 6.2 4.7 4.4
4,355.6 4,270.8 4,275.9 4,344.6 4,397.5 4,406.1 4,372.6
No. 24: Treasury Bills – Ownership Pattern
Item 2016-17
11 91-day
1.1 Banks 323.71.2 Primary Dealers 243.51.3 State Governments 146.21.4 Others 343.4
2 182-day2.1 Banks 216.22.2 Primary Dealers 316.52.3 State Governments 193.62.4 Others 120.9
3 364-day3.1 Banks 512.33.2 Primary Dealers 551.83.3 State Governments 26.33.4 Others 326.4
4 14-day Intermediate4.1 Banks –4.2 Primary Dealers –4.3 State Governments 1,560.64.4 Others 5.1
Total Treasury Bills (Excluding 14 day Intermediate T Bills) #
3,320.8
# 14D intermediate T-Bills are non-marketable unlike 91D, 182D and 364D T-Bills. These bills are ‘intermediate’ by nature as these are liquidated to replenish shortfall in the daily minimum cash balances of State Governments
No. 25: Auctions of Treasury Bills(Amount in ` Billion)
Date ofAuction
NotifiedAmount
Bids Received Bids Accepted TotalIssue(6+7)
Cut-offPrice
Implicit Yieldat Cut-offPrice (per
cent)
Number Total Face Value Number Total Face ValueCompetitive Non-
CompetitiveCompetitive Non-
Competitive
1 2 3 4 5 6 7 8 9 1091-day Treasury Bills
2017-18 Aug. 2 100 60 487.98 221.62 38 100.00 221.62 321.62 98.49 6.1495Aug. 9 100 59 887.93 130.56 51 100.00 130.56 230.56 98.49 6.1495Aug. 16 100 55 1,603.11 30.61 48 100.00 30.61 130.61 98.49 6.1495Aug. 23 100 52 1,559.97 36.62 12 100.00 36.62 136.62 98.50 6.1081Aug. 30 100 57 1,495.51 70.30 20 100.00 70.30 170.30 98.50 6.1081
182-day Treasury Bills2017-18 Jul. 26 70 54 365.30 – 29 70.00 – 70.00 96.98 6.2452Aug. 9 70 60 277.71 5.00 39 70.00 5.00 75.00 96.99 6.2239Aug. 23 70 54 365.27 – 21 70.00 – 70.00 96.99 6.2239
364-day Treasury Bills2017-18 Jul. 19 60 83 428.32 – 11 60.00 – 60.00 94.10 6.2872Aug. 2 60 68 261.09 – 20 60.00 – 60.00 94.14 6.2419Aug. 16 60 50 218.49 – 13 60.00 – 60.00 94.14 6.2419Aug. 30 60 51 223.70 – 25 60.00 – 60.00 94.13 6.2532

CURRENT STATISTICS
RBI Bulletin October 2017 141
No. 26: Daily Call Money Rates
As on Range of Rates Weighted Average Rates
1 Borrowings/ Lendings Borrowings/ Lendings
1 2
August 1, 2017 5.00-6.25 6.10
August 2, 2017 5.00-6.30 6.05
August 3, 2017 4.90-6.00 5.83
August 4, 2017 4.90-6.00 5.88
August 5, 2017 4.60-5.90 5.64
August 7, 2017 4.90-6.05 5.94
August 8, 2017 4.90-6.10 5.91
August 9, 2017 4.90-6.05 5.91
August 10, 2017 4.90-6.00 5.85
August 11, 2017 4.90-6.00 5.84
August 14, 2017 4.90-6.18 5.86
August 16, 2017 4.90-6.10 5.84
August 18, 2017 4.80-6.00 5.85
August 19, 2017 4.60-6.00 5.60
August 21, 2017 5.00-6.12 5.98
August 22, 2017 5.00-6.25 5.94
August 23, 2017 5.00-6.05 5.91
August 24, 2017 5.00-6.10 5.90
August 28, 2017 5.00-6.02 5.85
August 29, 2017 5.00-6.00 5.85
August 30, 2017 5.00-6.10 5.85
August 31, 2017 5.00-6.05 5.83
September 1, 2017 5.00-6.00 5.83
September 4, 2017 5.00-6.00 5.85
September 5, 2017 5.00-6.00 5.83
September 6, 2017 5.00-6.00 5.83
September 7, 2017 5.00-6.00 5.84
September 8, 2017 5.00-6.00 5.86
September 11, 2017 5.00-6.05 5.84
September 12, 2017 5.00-6.05 5.83
September 13, 2017 5.00-6.00 5.84
September 14, 2017 5.00-6.00 5.83
September 15, 2017 4.90-6.35 5.98
(Per cent per annum)
Note: Includes Notice Money.
Financial Markets
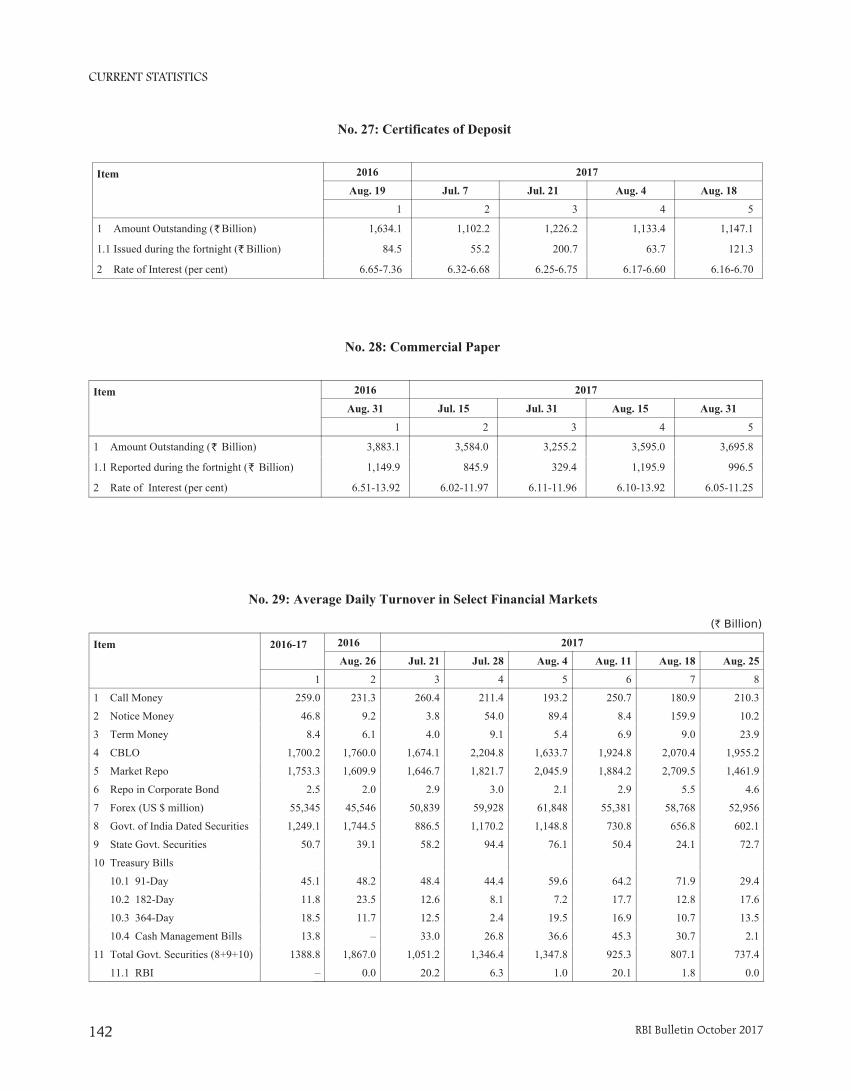
CURRENT STATISTICS
RBI Bulletin October 2017142
(` Billion)
2016 2017
Aug. 26 Jul. 21 Jul. 28 Aug. 4 Aug. 11 Aug. 18 Aug. 25
2 3 4 5 6 7 8
231.3 260.4 211.4 193.2 250.7 180.9 210.3
9.2 3.8 54.0 89.4 8.4 159.9 10.2
6.1 4.0 9.1 5.4 6.9 9.0 23.9
1,760.0 1,674.1 2,204.8 1,633.7 1,924.8 2,070.4 1,955.2
1,609.9 1,646.7 1,821.7 2,045.9 1,884.2 2,709.5 1,461.9
2.0 2.9 3.0 2.1 2.9 5.5 4.6
45,546 50,839 59,928 61,848 55,381 58,768 52,956
1,744.5 886.5 1,170.2 1,148.8 730.8 656.8 602.1
39.1 58.2 94.4 76.1 50.4 24.1 72.7
48.2 48.4 44.4 59.6 64.2 71.9 29.4
23.5 12.6 8.1 7.2 17.7 12.8 17.6
11.7 12.5 2.4 19.5 16.9 10.7 13.5
– 33.0 26.8 36.6 45.3 30.7 2.1
1,867.0 1,051.2 1,346.4 1,347.8 925.3 807.1 737.4
0.0 20.2 6.3 1.0 20.1 1.8 0.0
No. 29: Average Daily Turnover in Select Financial Markets
Item 2016-17
1
1 Call Money 259.0
2 Notice Money 46.8
3 Term Money 8.4
4 CBLO 1,700.2
5 Market Repo 1,753.3
6 Repo in Corporate Bond 2.5
7 Forex (US $ million) 55,345
8 Govt. of India Dated Securities 1,249.1
9 State Govt. Securities 50.7
10 Treasury Bills
10.1 91-Day 45.1
10.2 182-Day 11.8
10.3 364-Day 18.5
10.4 Cash Management Bills 13.8
11 Total Govt. Securities (8+9+10) 1388.8
11.1 RBI –
No. 27: Certificates of Deposit
Item 2016 2017
Aug. 19 Jul. 7 Jul. 21 Aug. 4 Aug. 18
1 2 3 4 5
1 Amount Outstanding ( Billion) 1,634.1 1,102.2 1,226.2 1,133.4 1,147.1
1.1 Issued during the fortnight ( Billion) 84.5 55.2 200.7 63.7 121.3
2 Rate of Interest (per cent) 6.65-7.36 6.32-6.68 6.25-6.75 6.17-6.60 6.16-6.70
`
`
No. 28: Commercial Paper
Item 2016 2017
Aug. 31 Jul. 15 Jul. 31 Aug. 15 Aug. 31
1 2 3 4 5
1 Amount Outstanding ( Billion) 3,883.1 3,584.0 3,255.2 3,595.0 3,695.8
1.1 Reported during the fortnight ( Billion) 1,149.9 845.9 329.4 1,195.9 996.5
2 Rate of Interest (per cent) 6.51-13.92 6.02-11.97 6.11-11.96 6.10-13.92 6.05-11.25
`
`
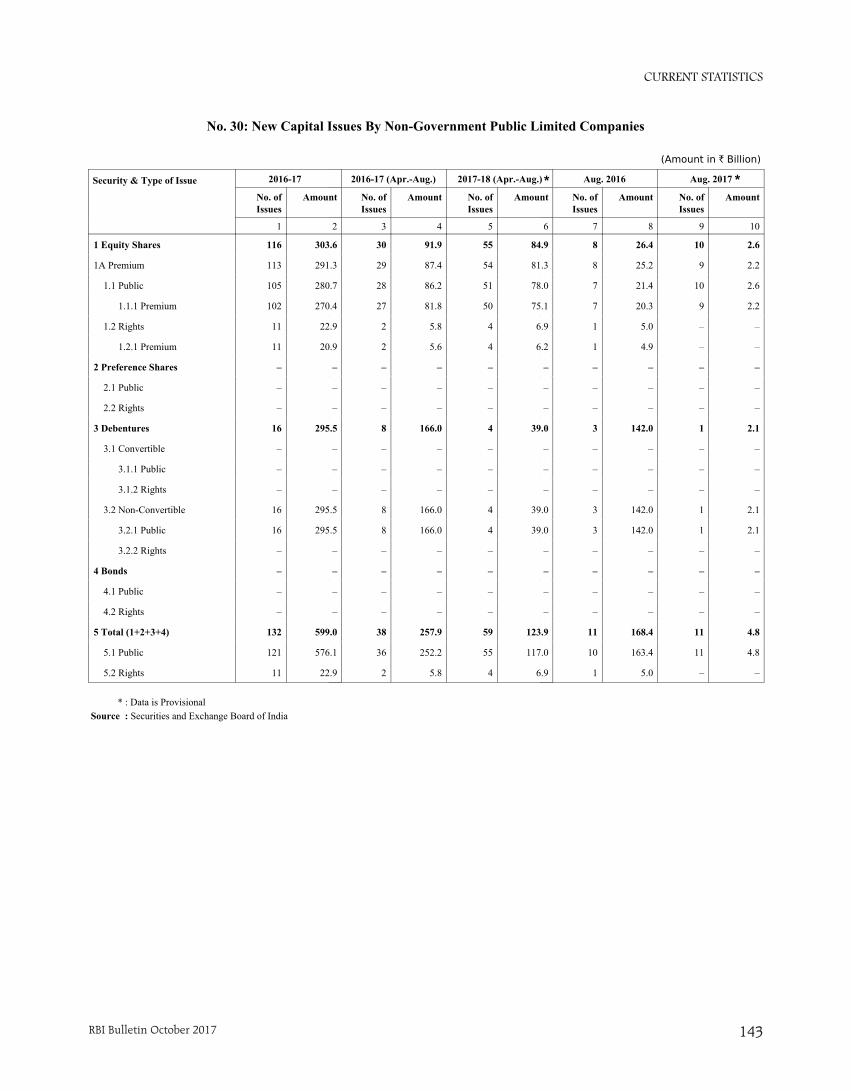
CURRENT STATISTICS
RBI Bulletin October 2017 143
Aug. 2016 Aug. 2017
No. ofIssues
Amount No. ofIssues
Amount
7 8 9 10
1 8 26.4 10 2.6
1 8 25.2 9 2.2
1 7 21.4 10 2.6
1 7 20.3 9 2.2
1 1 5.0 – –
1 1 4.9 – –
2 – – – –
2 – – – –
2 – – – –
3 3 142.0 1 2.1
3 – – – –
3 – – – –
3 – – – –
3 3 142.0 1 2.1
3 3 142.0 1 2.1
3 – – – –
4 – – – –
4 – – – –
4 – – – –
5 11 168.4 11 4.8
5 10 163.4 11 4.8
5 1 5.0 – –
2016-17 (Apr.-Aug.) 2017-18 (Apr.-Aug.)
No. ofIssues
Amount No. ofIssues
Amount
3 4 5 6
1 30 91.9 55 84.9
1 29 87.4 54 81.3
1 28 86.2 51 78.0
1 27 81.8 50 75.1
1 2 5.8 4 6.9
1 2 5.6 4 6.2
2 – – – –
2 – – – –
2 – – – –
3 8 166.0 4 39.0
3 – – – –
3 – – – –
3 – – – –
3 8 166.0 4 39.0
3 8 166.0 4 39.0
3 – – – –
4 – – – –
4 – – – –
4 – – – –
5 38 257.9 59 123.9
5 36 252.2 55 117.0
5 2 5.8 4 6.9
No. 30: New Capital Issues By Non-Government Public Limited Companies
Security & Type of Issue 2016-17
No. ofIssues
Amount
1 2
1 Equity Shares 116 303.6
1A Premium 113 291.3
1.1 Public 105 280.7
1.1.1 Premium 102 270.4
1.2 Rights 11 22.9
1.2.1 Premium 11 20.9
2 Preference Shares – –
2.1 Public – –
2.2 Rights – –
3 Debentures 16 295.5
3.1 Convertible – –
3.1.1 Public – –
3.1.2 Rights – –
3.2 Non-Convertible 16 295.5
3.2.1 Public 16 295.5
3.2.2 Rights – –
4 Bonds – –
4.1 Public – –
4.2 Rights – –
5 Total (1+2+3+4) 132 599.0
5.1 Public 121 576.1
5.2 Rights 11 22.9
(Amount in ` Billion)
Source : Securities and Exchange Board of India
* *
* : Data is Provisional
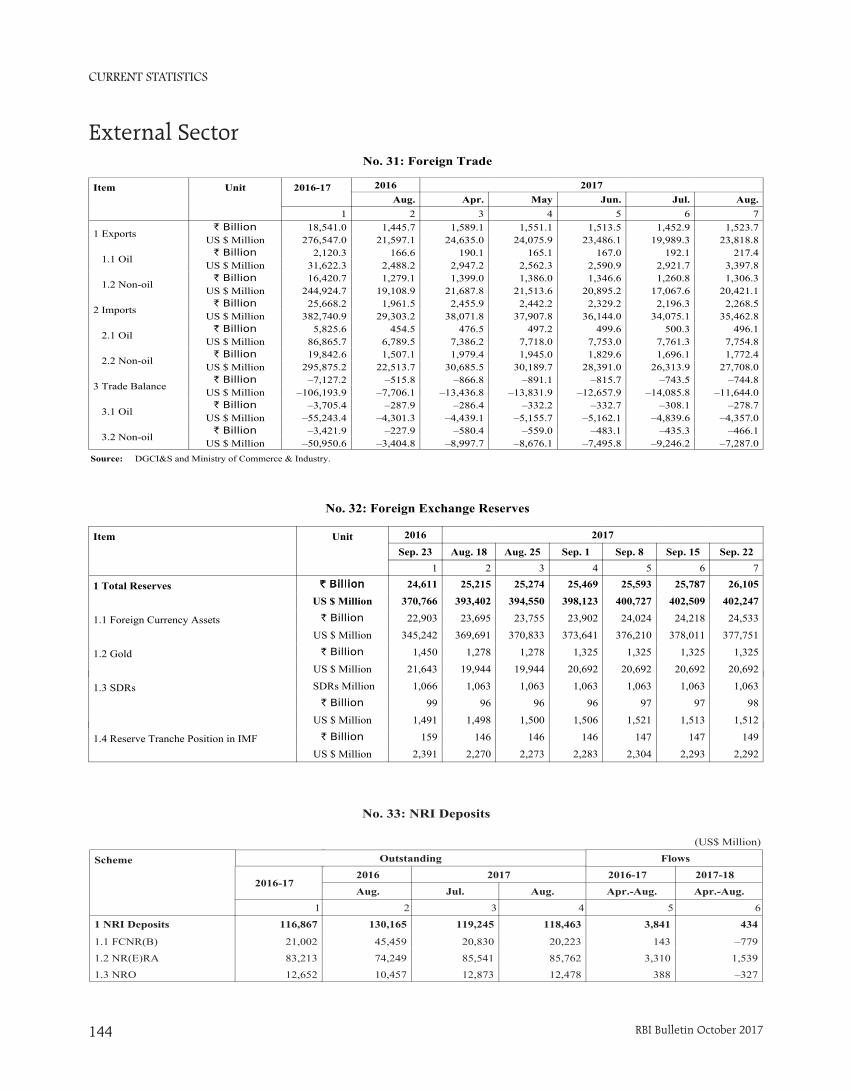
CURRENT STATISTICS
RBI Bulletin October 2017144
No. 31: Foreign Trade
Item Unit 2016-17 2016 2017Aug. Apr. May Jun. Jul. Aug.
1 2 3 4 5 6 7
1 Exports` Billion 18,541.0 1,445.7 1,589.1 1,551.1 1,513.5 1,452.9 1,523.7
US $ Million 276,547.0 21,597.1 24,635.0 24,075.9 23,486.1 19,989.3 23,818.8
1.1 Oil` Billion 2,120.3 166.6 190.1 165.1 167.0 192.1 217.4
US $ Million 31,622.3 2,488.2 2,947.2 2,562.3 2,590.9 2,921.7 3,397.8
1.2 Non-oil` Billion 16,420.7 1,279.1 1,399.0 1,386.0 1,346.6 1,260.8 1,306.3
US $ Million 244,924.7 19,108.9 21,687.8 21,513.6 20,895.2 17,067.6 20,421.1
2 Imports` Billion 25,668.2 1,961.5 2,455.9 2,442.2 2,329.2 2,196.3 2,268.5
US $ Million 382,740.9 29,303.2 38,071.8 37,907.8 36,144.0 34,075.1 35,462.8
2.1 Oil` Billion 5,825.6 454.5 476.5 497.2 499.6 500.3 496.1
US $ Million 86,865.7 6,789.5 7,386.2 7,718.0 7,753.0 7,761.3 7,754.8
2.2 Non-oil` Billion 19,842.6 1,507.1 1,979.4 1,945.0 1,829.6 1,696.1 1,772.4
US $ Million 295,875.2 22,513.7 30,685.5 30,189.7 28,391.0 26,313.9 27,708.0
3 Trade Balance` Billion –7,127.2 –515.8 –866.8 –891.1 –815.7 –743.5 –744.8
US $ Million –106,193.9 –7,706.1 –13,436.8 –13,831.9 –12,657.9 –14,085.8 –11,644.0
3.1 Oil` Billion –3,705.4 –287.9 –286.4 –332.2 –332.7 –308.1 –278.7
US $ Million –55,243.4 –4,301.3 –4,439.1 –5,155.7 –5,162.1 –4,839.6 –4,357.0
3.2 Non-oil` Billion –3,421.9 –227.9 –580.4 –559.0 –483.1 –435.3 –466.1
US $ Million –50,950.6 –3,404.8 –8,997.7 –8,676.1 –7,495.8 –9,246.2 –7,287.0Source: DGCI&S and Ministry of Commerce & Industry.
1.4 Reserve Tranche Position in IMF ` Billion 159 146 146 146 147 147 149
US $ Million 2,391 2,270 2,273 2,283 2,304 2,293 2,292
1.3 SDRs SDRs Million 1,066 1,063 1,063 1,063 1,063 1,063 1,063
` Billion 99 96 96 96 97 97 98
US $ Million 1,491 1,498 1,500 1,506 1,521 1,513 1,512
No. 32: Foreign Exchange Reserves
Item Unit 2016 2017
Sep. 23 Aug. 18 Aug. 25 Sep. 1 Sep. 8 Sep. 15 Sep. 22
1 2 3 4 5 6 7
1 Total Reserves ` Billion 24,611 25,215 25,274 25,469 25,593 25,787 26,105
US $ Million 370,766 393,402 394,550 398,123 400,727 402,509 402,247
1.1 Foreign Currency Assets ` Billion 22,903 23,695 23,755 23,902 24,024 24,218 24,533
US $ Million 345,242 369,691 370,833 373,641 376,210 378,011 377,751
1.2 Gold ` Billion 1,450 1,278 1,278 1,325 1,325 1,325 1,325
US $ Million 21,643 19,944 19,944 20,692 20,692 20,692 20,692
No. 33: NRI Deposits
(US$ Million)
Flows
2016-17 2017-18
Apr.-Aug. Apr.-Aug.
5 6
3,841 434
143 –779
3,310 1,539
388 –327
2016 2017
Aug. Jul. Aug.
2 3 4
130,165 119,245 118,463
45,459 20,830 20,223
74,249 85,541 85,762
10,457 12,873 12,478
Scheme
2016-17
1
1 NRI Deposits 116,867
1.1 FCNR(B) 21,002
1.2 NR(E)RA 83,213
1.3 NRO 12,652
Outstanding
External Sector
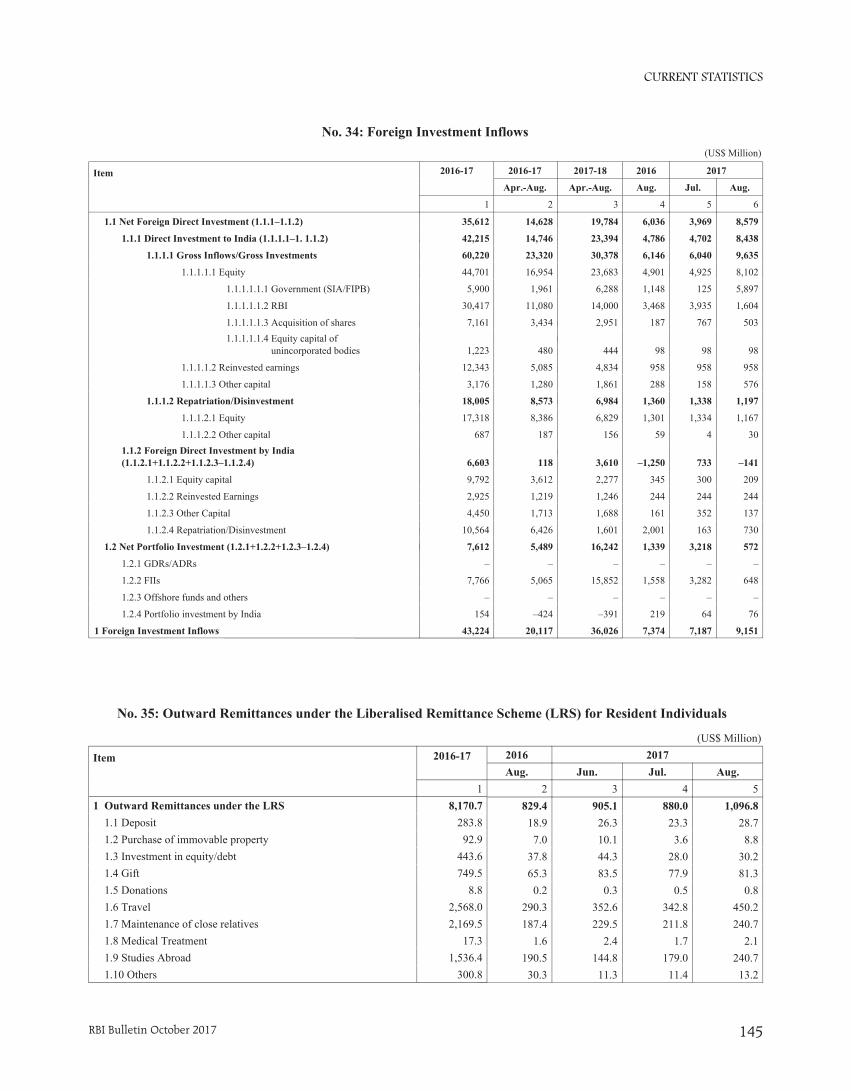
CURRENT STATISTICS
RBI Bulletin October 2017 145
No. 34: Foreign Investment Inflows(US$ Million)
2016 2017
Aug. Jul. Aug.
4 5 6
1.1 Net Foreign Direct Investment (1.1.1–1.1.2) 6,036 3,969 8,579
1.1.1 Direct Investment to India (1.1.1.1–1. 1.1.2) 4,786 4,702 8,438
1.1.1.1 Gross Inflows/Gross Investments 6,146 6,040 9,635
1.1.1.1.1 Equity 4,901 4,925 8,102
1.1.1.1.1.1 Government (SIA/FI 1,148 125 5,897
1.1.1.1.1.2 RBI 3,468 3,935 1,604
1.1.1.1.1.3 Acquisition of shares 187 767 503 1.1.1.1.1.4 Equity capital of unincorporated bodie 98 98 98
1.1.1.1.2 Reinvested earnings 958 958 958
1.1.1.1.3 Other capital 288 158 576
1.1.1.2 Repatriation/Disinvestment 1,360 1,338 1,197
1.1.1.2.1 Equity 1,301 1,334 1,167
1.1.1.2.2 Other capital 59 4 30 1.1.2 Foreign Direct Investment by India (1.1.2.1+1.1.2.2+1.1.2.3–1.1.2.4) –1,250 733 –141
1.1.2.1 Equity capital 345 300 209
1.1.2.2 Reinvested Earnings 244 244 244
1.1.2.3 Other Capital 161 352 137
1.1.2.4 Repatriation/Disinvestment 2,001 163 730
1.2 Net Portfolio Investment (1.2.1+1.2.2+1.2.3–1.2.4) 1,339 3,218 572
1.2.1 GDRs/ADRs – – –
1.2.2 FIIs 1,558 3,282 648
1.2.3 Offshore funds and others – – –
1.2.4 Portfolio investment by India 219 64 76
1 Foreign Investment Inflows 7,374 7,187 9,151
2016-17 2017-18
Apr.-Aug. Apr.-Aug.
2 3
1.1 Net Foreign Direct Investment (1.1.1–1.1.2) 14,628 19,784
1.1.1 Direct Investment to India (1.1.1.1–1. 1.1.2) 14,746 23,394
1.1.1.1 Gross Inflows/Gross Investments 23,320 30,378
1.1.1.1.1 Equity 16,954 23,683
1.1.1.1.1.1 Government (SIA/FI 1,961 6,288
1.1.1.1.1.2 RBI 11,080 14,000
1.1.1.1.1.3 Acquisition of shares 3,434 2,951 1.1.1.1.1.4 Equity capital of unincorporated bodie 480 444
1.1.1.1.2 Reinvested earnings 5,085 4,834
1.1.1.1.3 Other capital 1,280 1,861
1.1.1.2 Repatriation/Disinvestment 8,573 6,984
1.1.1.2.1 Equity 8,386 6,829
1.1.1.2.2 Other capital 187 156 1.1.2 Foreign Direct Investment by India (1.1.2.1+1.1.2.2+1.1.2.3–1.1.2.4) 118 3,610
1.1.2.1 Equity capital 3,612 2,277
1.1.2.2 Reinvested Earnings 1,219 1,246
1.1.2.3 Other Capital 1,713 1,688
1.1.2.4 Repatriation/Disinvestment 6,426 1,601
1.2 Net Portfolio Investment (1.2.1+1.2.2+1.2.3–1.2.4) 5,489 16,242
1.2.1 GDRs/ADRs – –
1.2.2 FIIs 5,065 15,852
1.2.3 Offshore funds and others – –
1.2.4 Portfolio investment by India –424 –391
1 Foreign Investment Inflows 20,117 36,026
Item 2016-17
1
1.1 Net Foreign Direct Investment (1.1.1–1.1.2) 35,612
1.1.1 Direct Investment to India (1.1.1.1–1. 1.1.2) 42,215
1.1.1.1 Gross Inflows/Gross Investments 60,220
1.1.1.1.1 Equity 44,701
1.1.1.1.1.1 Government (SIA/FIPB) 5,900
1.1.1.1.1.2 RBI 30,417
1.1.1.1.1.3 Acquisition of shares 7,161 1.1.1.1.1.4 Equity capital of unincorporated bodies 1,223
1.1.1.1.2 Reinvested earnings 12,343
1.1.1.1.3 Other capital 3,176
1.1.1.2 Repatriation/Disinvestment 18,005
1.1.1.2.1 Equity 17,318
1.1.1.2.2 Other capital 687 1.1.2 Foreign Direct Investment by India (1.1.2.1+1.1.2.2+1.1.2.3–1.1.2.4) 6,603
1.1.2.1 Equity capital 9,792
1.1.2.2 Reinvested Earnings 2,925
1.1.2.3 Other Capital 4,450
1.1.2.4 Repatriation/Disinvestment 10,564
1.2 Net Portfolio Investment (1.2.1+1.2.2+1.2.3–1.2.4) 7,612
1.2.1 GDRs/ADRs –
1.2.2 FIIs 7,766
1.2.3 Offshore funds and others –
1.2.4 Portfolio investment by India 154
1 Foreign Investment Inflows 43,224
No. 35: Outward Remittances under the Liberalised Remittance Scheme (LRS) for Resident Individuals
(US$ Million)2016 2017Aug. Jun. Jul. Aug.
2 3 4 5829.4 905.1 880.0 1,096.8
18.9 26.3 23.3 28.77.0 10.1 3.6 8.8
37.8 44.3 28.0 30.265.3 83.5 77.9 81.30.2 0.3 0.5 0.8
290.3 352.6 342.8 450.2187.4 229.5 211.8 240.7
1.6 2.4 1.7 2.1190.5 144.8 179.0 240.7
30.3 11.3 11.4 13.2
Item 2016-17
11 Outward Remittances under the LRS 8,170.7 1.1 Deposit 283.8 1.2 Purchase of immovable property 92.9 1.3 Investment in equity/debt 443.6 1.4 Gift 749.5 1.5 Donations 8.8 1.6 Travel 2,568.0 1.7 Maintenance of close relatives 2,169.5 1.8 Medical Treatment 17.3 1.9 Studies Abroad 1,536.4 1.10 Others 300.8
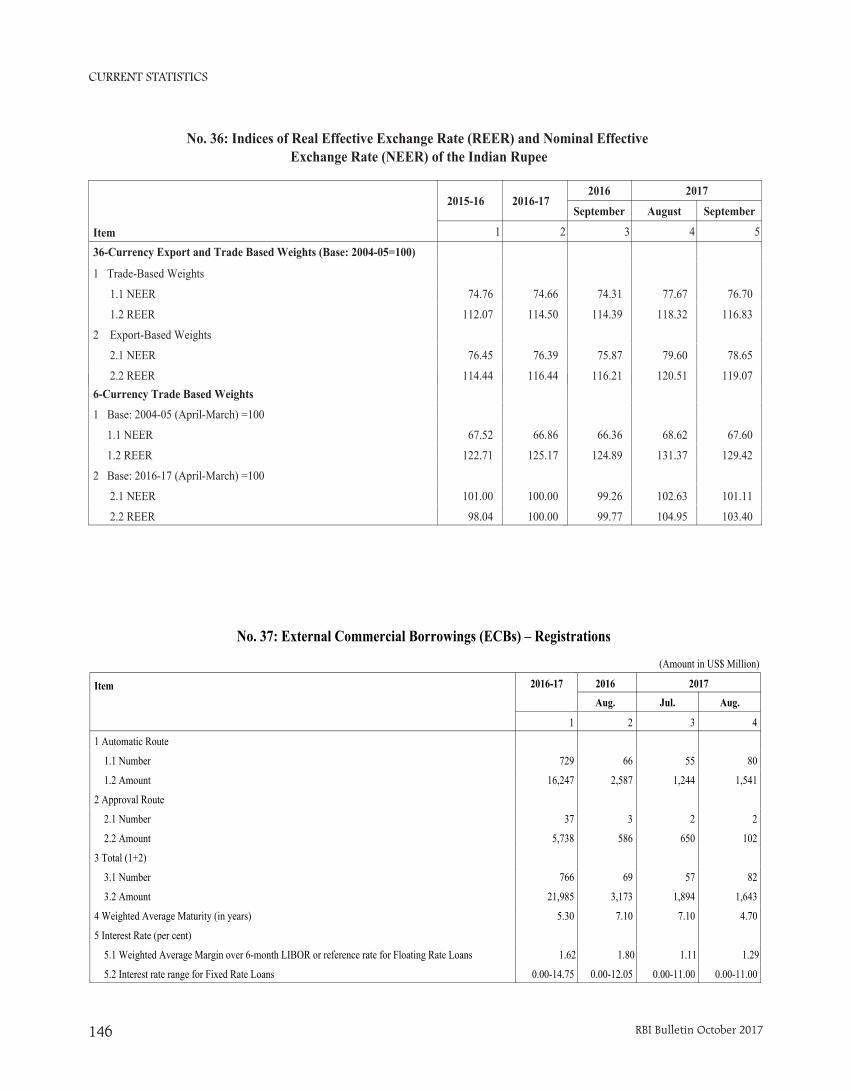
CURRENT STATISTICS
RBI Bulletin October 2017146
No. 36: Indices of Real Effective Exchange Rate (REER) and Nominal Effective Exchange Rate (NEER) of the Indian Rupee
66.36 68.62 67.60
124.89 131.37 129.42
99.26 102.63 101.11
99.77 104.95 103.40
2016 2017
September August September
3 4 5
74.31 77.67 76.70
114.39 118.32 116.83
75.87 79.60 78.65
116.21 120.51 119.072015-16 2016-17 6-Currency Trade Based Weights
1 Base: 2004-05 (April-March) =100
1.1 NEER 67.52 66.86
1.2 REER 122.71 125.17
2 Base: 2016-17 (April-March) =100
2.1 NEER 101.00 100.00
2.2 REER 98.04 100.00
Item
2015-16 2016-17
1 2
36-Currency Export and Trade Based Weights (Base: 2004-05=100)
1 Trade-Based Weights
1.1 NEER 74.76 74.66
1.2 REER 112.07 114.50
2 Export-Based Weights
2.1 NEER 76.45 76.39
2.2 REER 114.44 116.44
(Amount in US$ Million)
2016 2017
Aug. Jul. Aug.
2 3 4
66 55 80
2,587 1,244 1,541
3 2 2
586 650 102
69 57 82
3,173 1,894 1,643
7.10 7.10 4.70
1.80 1.11 1.29
0.00-12.05 0.00-11.00 0.00-11.00
No. 37: External Commercial Borrowings (ECBs) – Registrations
Item 2016-17
1
1 Automatic Route
1.1 Number 729
1.2 Amount 16,247
2 Approval Route
2.1 Number 37
2.2 Amount 5,738
3 Total (1+2)
3.1 Number 766
3.2 Amount 21,985
4 Weighted Average Maturity (in years) 5.30
5 Interest Rate (per cent)
5.1 Weighted Average Margin over 6-month LIBOR or reference rate for Floating Rate Loans 1.62
5.2 Interest rate range for Fixed Rate Loans 0.00-14.75
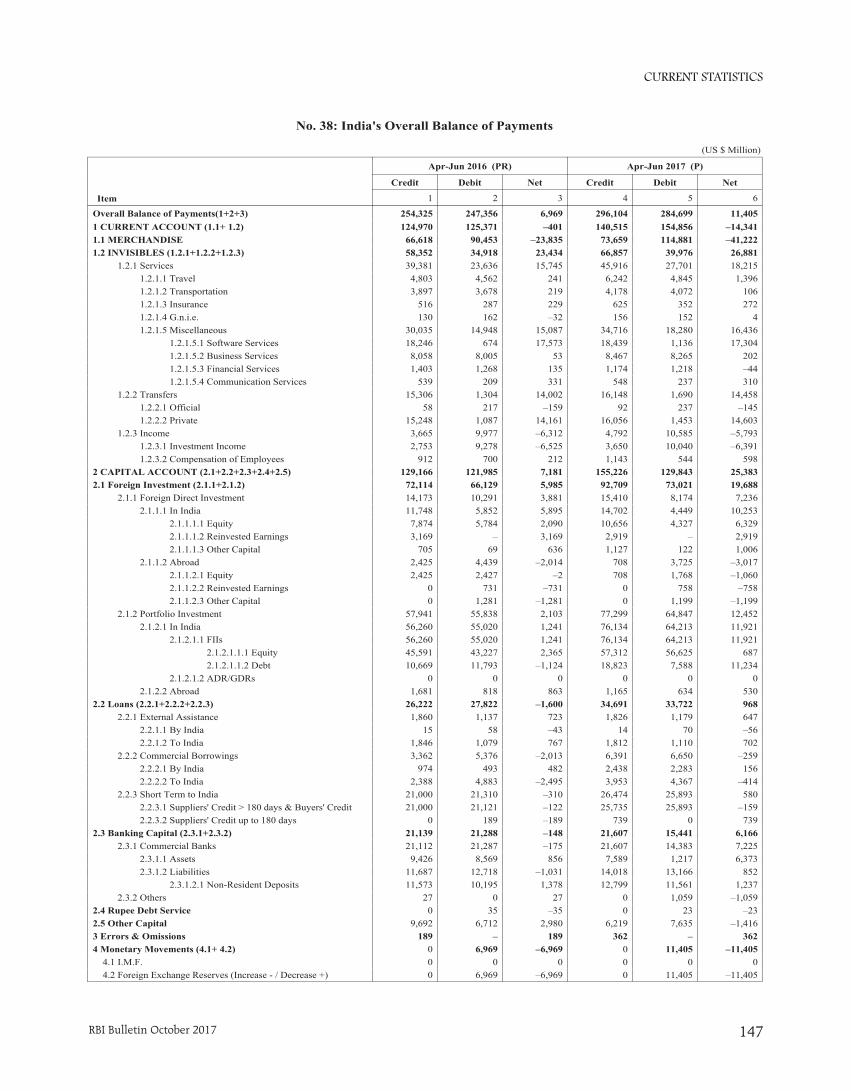
CURRENT STATISTICS
RBI Bulletin October 2017 147
No. 38: India's Overall Balance of Payments
(US $ Million)
Item
Apr-Jun 2016 (PR) Apr-Jun 2017 (P)
Credit Debit Net Credit Debit Net
1 2 3 4 5 6
Overall Balance of Payments(1+2+3) 254,325 247,356 6,969 296,104 284,699 11,4051 CURRENT ACCOUNT (1.1+ 1.2) 124,970 125,371 –401 140,515 154,856 –14,3411.1 MERCHANDISE 66,618 90,453 –23,835 73,659 114,881 –41,2221.2 INVISIBLES (1.2.1+1.2.2+1.2.3) 58,352 34,918 23,434 66,857 39,976 26,881 1.2.1 Services 39,381 23,636 15,745 45,916 27,701 18,215 1.2.1.1 Travel 4,803 4,562 241 6,242 4,845 1,396 1.2.1.2 Transportation 3,897 3,678 219 4,178 4,072 106 1.2.1.3 Insurance 516 287 229 625 352 272 1.2.1.4 G.n.i.e. 130 162 –32 156 152 4 1.2.1.5 Miscellaneous 30,035 14,948 15,087 34,716 18,280 16,436 1.2.1.5.1 Software Services 18,246 674 17,573 18,439 1,136 17,304 1.2.1.5.2 Business Services 8,058 8,005 53 8,467 8,265 202 1.2.1.5.3 Financial Services 1,403 1,268 135 1,174 1,218 –44 1.2.1.5.4 Communication Services 539 209 331 548 237 310 1.2.2 Transfers 15,306 1,304 14,002 16,148 1,690 14,458 1.2.2.1 Official 58 217 –159 92 237 –145 1.2.2.2 Private 15,248 1,087 14,161 16,056 1,453 14,603 1.2.3 Income 3,665 9,977 –6,312 4,792 10,585 –5,793 1.2.3.1 Investment Income 2,753 9,278 –6,525 3,650 10,040 –6,391 1.2.3.2 Compensation of Employees 912 700 212 1,143 544 5982 CAPITAL ACCOUNT (2.1+2.2+2.3+2.4+2.5) 129,166 121,985 7,181 155,226 129,843 25,3832.1 Foreign Investment (2.1.1+2.1.2) 72,114 66,129 5,985 92,709 73,021 19,688 2.1.1 Foreign Direct Investment 14,173 10,291 3,881 15,410 8,174 7,236 2.1.1.1 In India 11,748 5,852 5,895 14,702 4,449 10,253 2.1.1.1.1 Equity 7,874 5,784 2,090 10,656 4,327 6,329 2.1.1.1.2 Reinvested Earnings 3,169 – 3,169 2,919 – 2,919 2.1.1.1.3 Other Capital 705 69 636 1,127 122 1,006 2.1.1.2 Abroad 2,425 4,439 –2,014 708 3,725 –3,017 2.1.1.2.1 Equity 2,425 2,427 –2 708 1,768 –1,060 2.1.1.2.2 Reinvested Earnings 0 731 –731 0 758 –758 2.1.1.2.3 Other Capital 0 1,281 –1,281 0 1,199 –1,199 2.1.2 Portfolio Investment 57,941 55,838 2,103 77,299 64,847 12,452 2.1.2.1 In India 56,260 55,020 1,241 76,134 64,213 11,921 2.1.2.1.1 FIIs 56,260 55,020 1,241 76,134 64,213 11,921 2.1.2.1.1.1 Equity 45,591 43,227 2,365 57,312 56,625 687 2.1.2.1.1.2 Debt 10,669 11,793 –1,124 18,823 7,588 11,234 2.1.2.1.2 ADR/GDRs 0 0 0 0 0 0 2.1.2.2 Abroad 1,681 818 863 1,165 634 5302.2 Loans (2.2.1+2.2.2+2.2.3) 26,222 27,822 –1,600 34,691 33,722 968 2.2.1 External Assistance 1,860 1,137 723 1,826 1,179 647 2.2.1.1 By India 15 58 –43 14 70 –56 2.2.1.2 To India 1,846 1,079 767 1,812 1,110 702 2.2.2 Commercial Borrowings 3,362 5,376 –2,013 6,391 6,650 –259 2.2.2.1 By India 974 493 482 2,438 2,283 156 2.2.2.2 To India 2,388 4,883 –2,495 3,953 4,367 –414 2.2.3 Short Term to India 21,000 21,310 –310 26,474 25,893 580 2.2.3.1 Suppliers' Credit > 180 days & Buyers' Credit 21,000 21,121 –122 25,735 25,893 –159 2.2.3.2 Suppliers' Credit up to 180 days 0 189 –189 739 0 7392.3 Banking Capital (2.3.1+2.3.2) 21,139 21,288 –148 21,607 15,441 6,166 2.3.1 Commercial Banks 21,112 21,287 –175 21,607 14,383 7,225 2.3.1.1 Assets 9,426 8,569 856 7,589 1,217 6,373 2.3.1.2 Liabilities 11,687 12,718 –1,031 14,018 13,166 852 2.3.1.2.1 Non-Resident Deposits 11,573 10,195 1,378 12,799 11,561 1,237 2.3.2 Others 27 0 27 0 1,059 –1,0592.4 Rupee Debt Service 0 35 –35 0 23 –232.5 Other Capital 9,692 6,712 2,980 6,219 7,635 –1,4163 Errors & Omissions 189 – 189 362 – 3624 Monetary Movements (4.1+ 4.2) 0 6,969 –6,969 0 11,405 –11,405 4.1 I.M.F. 0 0 0 0 0 0 4.2 Foreign Exchange Reserves (Increase - / Decrease +) 0 6,969 –6,969 0 11,405 –11,405
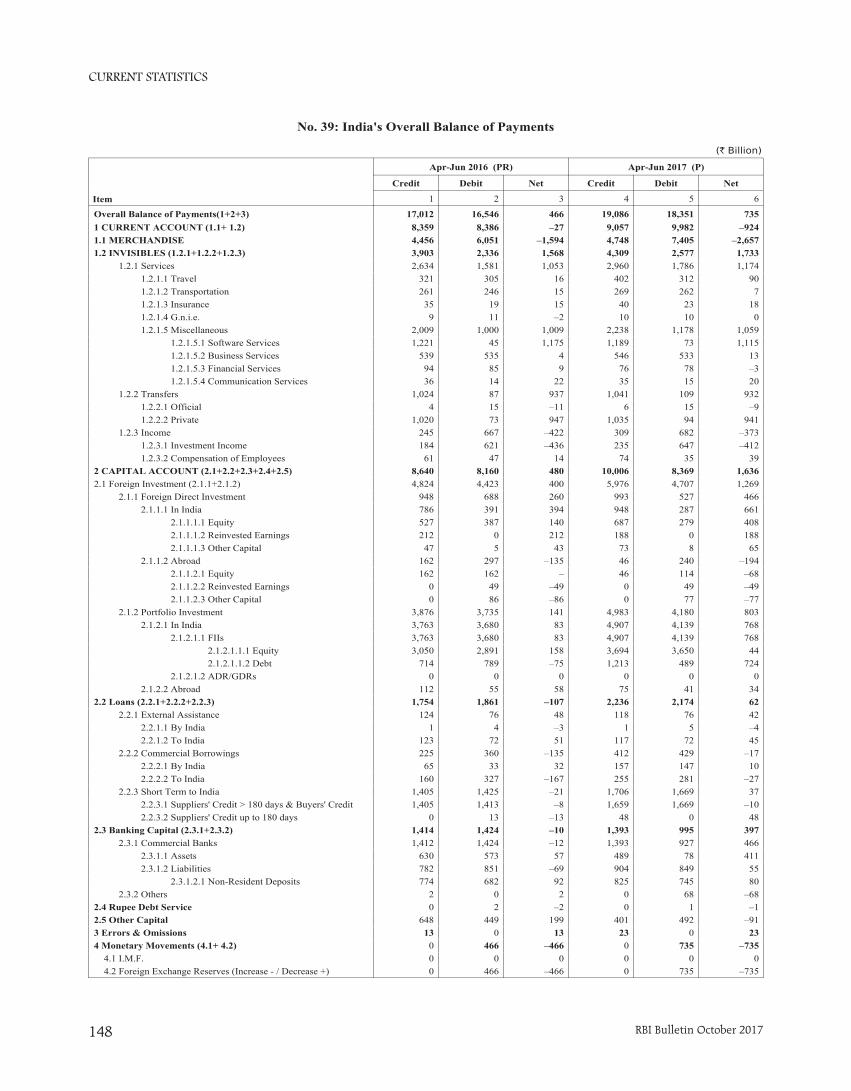
CURRENT STATISTICS
RBI Bulletin October 2017148
No. 39: India's Overall Balance of Payments
(` Billion)
Item
Apr-Jun 2016 (PR) Apr-Jun 2017 (P)
Credit Debit Net Credit Debit Net
1 2 3 4 5 6
Overall Balance of Payments(1+2+3) 17,012 16,546 466 19,086 18,351 7351 CURRENT ACCOUNT (1.1+ 1.2) 8,359 8,386 –27 9,057 9,982 –9241.1 MERCHANDISE 4,456 6,051 –1,594 4,748 7,405 –2,6571.2 INVISIBLES (1.2.1+1.2.2+1.2.3) 3,903 2,336 1,568 4,309 2,577 1,733 1.2.1 Services 2,634 1,581 1,053 2,960 1,786 1,174 1.2.1.1 Travel 321 305 16 402 312 90 1.2.1.2 Transportation 261 246 15 269 262 7 1.2.1.3 Insurance 35 19 15 40 23 18 1.2.1.4 G.n.i.e. 9 11 –2 10 10 0 1.2.1.5 Miscellaneous 2,009 1,000 1,009 2,238 1,178 1,059 1.2.1.5.1 Software Services 1,221 45 1,175 1,189 73 1,115 1.2.1.5.2 Business Services 539 535 4 546 533 13 1.2.1.5.3 Financial Services 94 85 9 76 78 –3 1.2.1.5.4 Communication Services 36 14 22 35 15 20 1.2.2 Transfers 1,024 87 937 1,041 109 932 1.2.2.1 Official 4 15 –11 6 15 –9 1.2.2.2 Private 1,020 73 947 1,035 94 941 1.2.3 Income 245 667 –422 309 682 –373 1.2.3.1 Investment Income 184 621 –436 235 647 –412 1.2.3.2 Compensation of Employees 61 47 14 74 35 392 CAPITAL ACCOUNT (2.1+2.2+2.3+2.4+2.5) 8,640 8,160 480 10,006 8,369 1,6362.1 Foreign Investment (2.1.1+2.1.2) 4,824 4,423 400 5,976 4,707 1,269 2.1.1 Foreign Direct Investment 948 688 260 993 527 466 2.1.1.1 In India 786 391 394 948 287 661 2.1.1.1.1 Equity 527 387 140 687 279 408 2.1.1.1.2 Reinvested Earnings 212 0 212 188 0 188 2.1.1.1.3 Other Capital 47 5 43 73 8 65 2.1.1.2 Abroad 162 297 –135 46 240 –194 2.1.1.2.1 Equity 162 162 – 46 114 –68 2.1.1.2.2 Reinvested Earnings 0 49 –49 0 49 –49 2.1.1.2.3 Other Capital 0 86 –86 0 77 –77 2.1.2 Portfolio Investment 3,876 3,735 141 4,983 4,180 803 2.1.2.1 In India 3,763 3,680 83 4,907 4,139 768 2.1.2.1.1 FIIs 3,763 3,680 83 4,907 4,139 768 2.1.2.1.1.1 Equity 3,050 2,891 158 3,694 3,650 44 2.1.2.1.1.2 Debt 714 789 –75 1,213 489 724 2.1.2.1.2 ADR/GDRs 0 0 0 0 0 0 2.1.2.2 Abroad 112 55 58 75 41 342.2 Loans (2.2.1+2.2.2+2.2.3) 1,754 1,861 –107 2,236 2,174 62 2.2.1 External Assistance 124 76 48 118 76 42 2.2.1.1 By India 1 4 –3 1 5 –4 2.2.1.2 To India 123 72 51 117 72 45 2.2.2 Commercial Borrowings 225 360 –135 412 429 –17 2.2.2.1 By India 65 33 32 157 147 10 2.2.2.2 To India 160 327 –167 255 281 –27 2.2.3 Short Term to India 1,405 1,425 –21 1,706 1,669 37 2.2.3.1 Suppliers' Credit > 180 days & Buyers' Credit 1,405 1,413 –8 1,659 1,669 –10 2.2.3.2 Suppliers' Credit up to 180 days 0 13 –13 48 0 482.3 Banking Capital (2.3.1+2.3.2) 1,414 1,424 –10 1,393 995 397 2.3.1 Commercial Banks 1,412 1,424 –12 1,393 927 466 2.3.1.1 Assets 630 573 57 489 78 411 2.3.1.2 Liabilities 782 851 –69 904 849 55 2.3.1.2.1 Non-Resident Deposits 774 682 92 825 745 80 2.3.2 Others 2 0 2 0 68 –682.4 Rupee Debt Service 0 2 –2 0 1 –12.5 Other Capital 648 449 199 401 492 –913 Errors & Omissions 13 0 13 23 0 234 Monetary Movements (4.1+ 4.2) 0 466 –466 0 735 –735 4.1 I.M.F. 0 0 0 0 0 0 4.2 Foreign Exchange Reserves (Increase - / Decrease +) 0 466 –466 0 735 –735
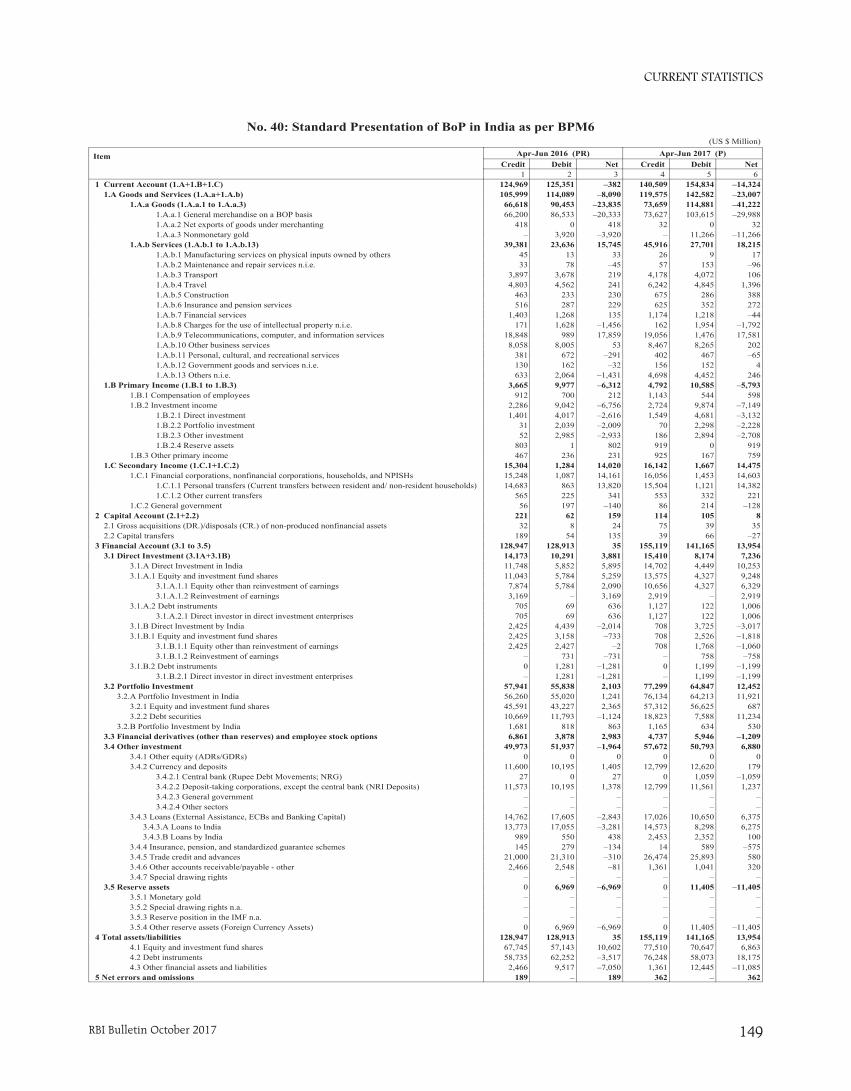
CURRENT STATISTICS
RBI Bulletin October 2017 149
(US $ Million)
Item Apr-Jun 2016 (PR) Apr-Jun 2017 (P)Credit Debit Net Credit Debit Net
1 2 3 4 5 61 Current Account (1.A+1.B+1.C) 124,969 125,351 –382 140,509 154,834 –14,324 1.A Goods and Services (1.A.a+1.A.b) 105,999 114,089 –8,090 119,575 142,582 –23,007 1.A.a Goods (1.A.a.1 to 1.A.a.3) 66,618 90,453 –23,835 73,659 114,881 –41,222 1.A.a.1 General merchandise on a BOP basis 66,200 86,533 –20,333 73,627 103,615 –29,988 1.A.a.2 Net exports of goods under merchanting 418 0 418 32 0 32 1.A.a.3 Nonmonetary gold – 3,920 –3,920 – 11,266 –11,266 1.A.b Services (1.A.b.1 to 1.A.b.13) 39,381 23,636 15,745 45,916 27,701 18,215 1.A.b.1 Manufacturing services on physical inputs owned by others 45 13 33 26 9 17 1.A.b.2 Maintenance and repair services n.i.e. 33 78 –45 57 153 –96 1.A.b.3 Transport 3,897 3,678 219 4,178 4,072 106 1.A.b.4 Travel 4,803 4,562 241 6,242 4,845 1,396 1.A.b.5 Construction 463 233 230 675 286 388 1.A.b.6 Insurance and pension services 516 287 229 625 352 272 1.A.b.7 Financial services 1,403 1,268 135 1,174 1,218 –44 1.A.b.8 Charges for the use of intellectual property n.i.e. 171 1,628 –1,456 162 1,954 –1,792 1.A.b.9 Telecommunications, computer, and information services 18,848 989 17,859 19,056 1,476 17,581 1.A.b.10 Other business services 8,058 8,005 53 8,467 8,265 202 1.A.b.11 Personal, cultural, and recreational services 381 672 –291 402 467 –65 1.A.b.12 Government goods and services n.i.e. 130 162 –32 156 152 4 1.A.b.13 Others n.i.e. 633 2,064 –1,431 4,698 4,452 246 1.B Primary Income (1.B.1 to 1.B.3) 3,665 9,977 –6,312 4,792 10,585 –5,793 1.B.1 Compensation of employees 912 700 212 1,143 544 598 1.B.2 Investment income 2,286 9,042 –6,756 2,724 9,874 –7,149 1.B.2.1 Direct investment 1,401 4,017 –2,616 1,549 4,681 –3,132 1.B.2.2 Portfolio investment 31 2,039 –2,009 70 2,298 –2,228 1.B.2.3 Other investment 52 2,985 –2,933 186 2,894 –2,708 1.B.2.4 Reserve assets 803 1 802 919 0 919 1.B.3 Other primary income 467 236 231 925 167 759 1.C Secondary Income (1.C.1+1.C.2) 15,304 1,284 14,020 16,142 1,667 14,475 1.C.1 Financial corporations, nonfinancial corporations, households, and NPISHs 15,248 1,087 14,161 16,056 1,453 14,603 1.C.1.1 Personal transfers (Current transfers between resident and/ non-resident households) 14,683 863 13,820 15,504 1,121 14,382 1.C.1.2 Other current transfers 565 225 341 553 332 221 1.C.2 General government 56 197 –140 86 214 –1282 Capital Account (2.1+2.2) 221 62 159 114 105 8 2.1 Gross acquisitions (DR.)/disposals (CR.) of non-produced nonfinancial assets 32 8 24 75 39 35 2.2 Capital transfers 189 54 135 39 66 –273 Financial Account (3.1 to 3.5) 128,947 128,913 35 155,119 141,165 13,954 3.1 Direct Investment (3.1A+3.1B) 14,173 10,291 3,881 15,410 8,174 7,236 3.1.A Direct Investment in India 11,748 5,852 5,895 14,702 4,449 10,253 3.1.A.1 Equity and investment fund shares 11,043 5,784 5,259 13,575 4,327 9,248 3.1.A.1.1 Equity other than reinvestment of earnings 7,874 5,784 2,090 10,656 4,327 6,329 3.1.A.1.2 Reinvestment of earnings 3,169 – 3,169 2,919 – 2,919 3.1.A.2 Debt instruments 705 69 636 1,127 122 1,006 3.1.A.2.1 Direct investor in direct investment enterprises 705 69 636 1,127 122 1,006 3.1.B Direct Investment by India 2,425 4,439 –2,014 708 3,725 –3,017 3.1.B.1 Equity and investment fund shares 2,425 3,158 –733 708 2,526 –1,818 3.1.B.1.1 Equity other than reinvestment of earnings 2,425 2,427 –2 708 1,768 –1,060 3.1.B.1.2 Reinvestment of earnings – 731 –731 – 758 –758 3.1.B.2 Debt instruments 0 1,281 –1,281 0 1,199 –1,199 3.1.B.2.1 Direct investor in direct investment enterprises – 1,281 –1,281 – 1,199 –1,199 3.2 Portfolio Investment 57,941 55,838 2,103 77,299 64,847 12,452 3.2.A Portfolio Investment in India 56,260 55,020 1,241 76,134 64,213 11,921 3.2.1 Equity and investment fund shares 45,591 43,227 2,365 57,312 56,625 687 3.2.2 Debt securities 10,669 11,793 –1,124 18,823 7,588 11,234 3.2.B Portfolio Investment by India 1,681 818 863 1,165 634 530 3.3 Financial derivatives (other than reserves) and employee stock options 6,861 3,878 2,983 4,737 5,946 –1,209 3.4 Other investment 49,973 51,937 –1,964 57,672 50,793 6,880 3.4.1 Other equity (ADRs/GDRs) 0 0 0 0 0 0 3.4.2 Currency and deposits 11,600 10,195 1,405 12,799 12,620 179 3.4.2.1 Central bank (Rupee Debt Movements; NRG) 27 0 27 0 1,059 –1,059 3.4.2.2 Deposit-taking corporations, except the central bank (NRI Deposits) 11,573 10,195 1,378 12,799 11,561 1,237 3.4.2.3 General government – – – – – – 3.4.2.4 Other sectors – – – – – – 3.4.3 Loans (External Assistance, ECBs and Banking Capital) 14,762 17,605 –2,843 17,026 10,650 6,375 3.4.3.A Loans to India 13,773 17,055 –3,281 14,573 8,298 6,275 3.4.3.B Loans by India 989 550 438 2,453 2,352 100 3.4.4 Insurance, pension, and standardized guarantee schemes 145 279 –134 14 589 –575 3.4.5 Trade credit and advances 21,000 21,310 –310 26,474 25,893 580 3.4.6 Other accounts receivable/payable - other 2,466 2,548 –81 1,361 1,041 320 3.4.7 Special drawing rights – – – – – – 3.5 Reserve assets 0 6,969 –6,969 0 11,405 –11,405 3.5.1 Monetary gold – – – – – – 3.5.2 Special drawing rights n.a. – – – – – – 3.5.3 Reserve position in the IMF n.a. – – – – – – 3.5.4 Other reserve assets (Foreign Currency Assets) 0 6,969 –6,969 0 11,405 –11,4054 Total assets/liabilities 128,947 128,913 35 155,119 141,165 13,954 4.1 Equity and investment fund shares 67,745 57,143 10,602 77,510 70,647 6,863 4.2 Debt instruments 58,735 62,252 –3,517 76,248 58,073 18,175 4.3 Other financial assets and liabilities 2,466 9,517 –7,050 1,361 12,445 –11,0855 Net errors and omissions 189 – 189 362 – 362
No. 40: Standard Presentation of BoP in India as per BPM6
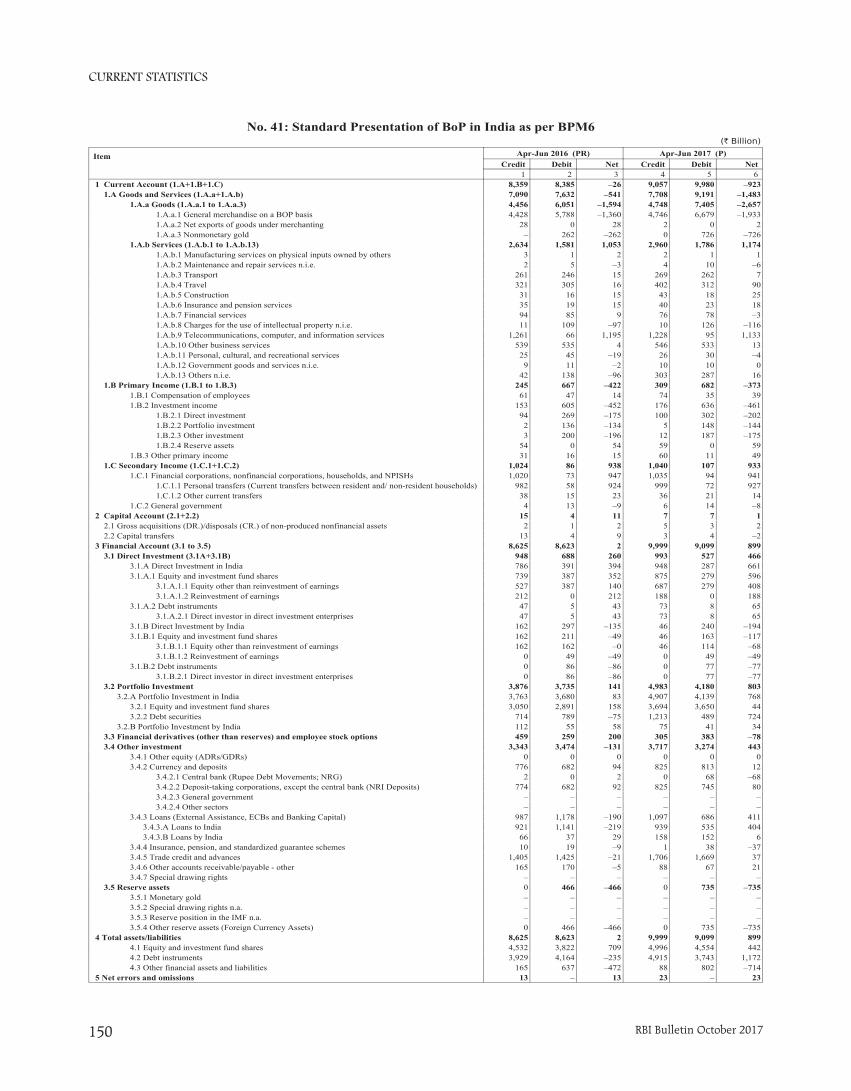
CURRENT STATISTICS
RBI Bulletin October 2017150
(` Billion)
Item Apr-Jun 2016 (PR) Apr-Jun 2017 (P)Credit Debit Net Credit Debit Net
1 2 3 4 5 61 Current Account (1.A+1.B+1.C) 8,359 8,385 –26 9,057 9,980 –923 1.A Goods and Services (1.A.a+1.A.b) 7,090 7,632 –541 7,708 9,191 –1,483 1.A.a Goods (1.A.a.1 to 1.A.a.3) 4,456 6,051 –1,594 4,748 7,405 –2,657 1.A.a.1 General merchandise on a BOP basis 4,428 5,788 –1,360 4,746 6,679 –1,933 1.A.a.2 Net exports of goods under merchanting 28 0 28 2 0 2 1.A.a.3 Nonmonetary gold – 262 –262 0 726 –726 1.A.b Services (1.A.b.1 to 1.A.b.13) 2,634 1,581 1,053 2,960 1,786 1,174 1.A.b.1 Manufacturing services on physical inputs owned by others 3 1 2 2 1 1 1.A.b.2 Maintenance and repair services n.i.e. 2 5 –3 4 10 –6 1.A.b.3 Transport 261 246 15 269 262 7 1.A.b.4 Travel 321 305 16 402 312 90 1.A.b.5 Construction 31 16 15 43 18 25 1.A.b.6 Insurance and pension services 35 19 15 40 23 18 1.A.b.7 Financial services 94 85 9 76 78 –3 1.A.b.8 Charges for the use of intellectual property n.i.e. 11 109 –97 10 126 –116 1.A.b.9 Telecommunications, computer, and information services 1,261 66 1,195 1,228 95 1,133 1.A.b.10 Other business services 539 535 4 546 533 13 1.A.b.11 Personal, cultural, and recreational services 25 45 –19 26 30 –4 1.A.b.12 Government goods and services n.i.e. 9 11 –2 10 10 0 1.A.b.13 Others n.i.e. 42 138 –96 303 287 16 1.B Primary Income (1.B.1 to 1.B.3) 245 667 –422 309 682 –373 1.B.1 Compensation of employees 61 47 14 74 35 39 1.B.2 Investment income 153 605 –452 176 636 –461 1.B.2.1 Direct investment 94 269 –175 100 302 –202 1.B.2.2 Portfolio investment 2 136 –134 5 148 –144 1.B.2.3 Other investment 3 200 –196 12 187 –175 1.B.2.4 Reserve assets 54 0 54 59 0 59 1.B.3 Other primary income 31 16 15 60 11 49 1.C Secondary Income (1.C.1+1.C.2) 1,024 86 938 1,040 107 933 1.C.1 Financial corporations, nonfinancial corporations, households, and NPISHs 1,020 73 947 1,035 94 941 1.C.1.1 Personal transfers (Current transfers between resident and/ non-resident households) 982 58 924 999 72 927 1.C.1.2 Other current transfers 38 15 23 36 21 14 1.C.2 General government 4 13 –9 6 14 –82 Capital Account (2.1+2.2) 15 4 11 7 7 1 2.1 Gross acquisitions (DR.)/disposals (CR.) of non-produced nonfinancial assets 2 1 2 5 3 2 2.2 Capital transfers 13 4 9 3 4 –23 Financial Account (3.1 to 3.5) 8,625 8,623 2 9,999 9,099 899 3.1 Direct Investment (3.1A+3.1B) 948 688 260 993 527 466 3.1.A Direct Investment in India 786 391 394 948 287 661 3.1.A.1 Equity and investment fund shares 739 387 352 875 279 596 3.1.A.1.1 Equity other than reinvestment of earnings 527 387 140 687 279 408 3.1.A.1.2 Reinvestment of earnings 212 0 212 188 0 188 3.1.A.2 Debt instruments 47 5 43 73 8 65 3.1.A.2.1 Direct investor in direct investment enterprises 47 5 43 73 8 65 3.1.B Direct Investment by India 162 297 –135 46 240 –194 3.1.B.1 Equity and investment fund shares 162 211 –49 46 163 –117 3.1.B.1.1 Equity other than reinvestment of earnings 162 162 –0 46 114 –68 3.1.B.1.2 Reinvestment of earnings 0 49 –49 0 49 –49 3.1.B.2 Debt instruments 0 86 –86 0 77 –77 3.1.B.2.1 Direct investor in direct investment enterprises 0 86 –86 0 77 –77 3.2 Portfolio Investment 3,876 3,735 141 4,983 4,180 803 3.2.A Portfolio Investment in India 3,763 3,680 83 4,907 4,139 768 3.2.1 Equity and investment fund shares 3,050 2,891 158 3,694 3,650 44 3.2.2 Debt securities 714 789 –75 1,213 489 724 3.2.B Portfolio Investment by India 112 55 58 75 41 34 3.3 Financial derivatives (other than reserves) and employee stock options 459 259 200 305 383 –78 3.4 Other investment 3,343 3,474 –131 3,717 3,274 443 3.4.1 Other equity (ADRs/GDRs) 0 0 0 0 0 0 3.4.2 Currency and deposits 776 682 94 825 813 12 3.4.2.1 Central bank (Rupee Debt Movements; NRG) 2 0 2 0 68 –68 3.4.2.2 Deposit-taking corporations, except the central bank (NRI Deposits) 774 682 92 825 745 80 3.4.2.3 General government – – – – – – 3.4.2.4 Other sectors – – – – – – 3.4.3 Loans (External Assistance, ECBs and Banking Capital) 987 1,178 –190 1,097 686 411 3.4.3.A Loans to India 921 1,141 –219 939 535 404 3.4.3.B Loans by India 66 37 29 158 152 6 3.4.4 Insurance, pension, and standardized guarantee schemes 10 19 –9 1 38 –37 3.4.5 Trade credit and advances 1,405 1,425 –21 1,706 1,669 37 3.4.6 Other accounts receivable/payable - other 165 170 –5 88 67 21 3.4.7 Special drawing rights – – – – – – 3.5 Reserve assets 0 466 –466 0 735 –735 3.5.1 Monetary gold – – – – – – 3.5.2 Special drawing rights n.a. – – – – – – 3.5.3 Reserve position in the IMF n.a. – – – – – – 3.5.4 Other reserve assets (Foreign Currency Assets) 0 466 –466 0 735 –7354 Total assets/liabilities 8,625 8,623 2 9,999 9,099 899 4.1 Equity and investment fund shares 4,532 3,822 709 4,996 4,554 442 4.2 Debt instruments 3,929 4,164 –235 4,915 3,743 1,172 4.3 Other financial assets and liabilities 165 637 –472 88 802 –7145 Net errors and omissions 13 – 13 23 – 23
No. 41: Standard Presentation of BoP in India as per BPM6
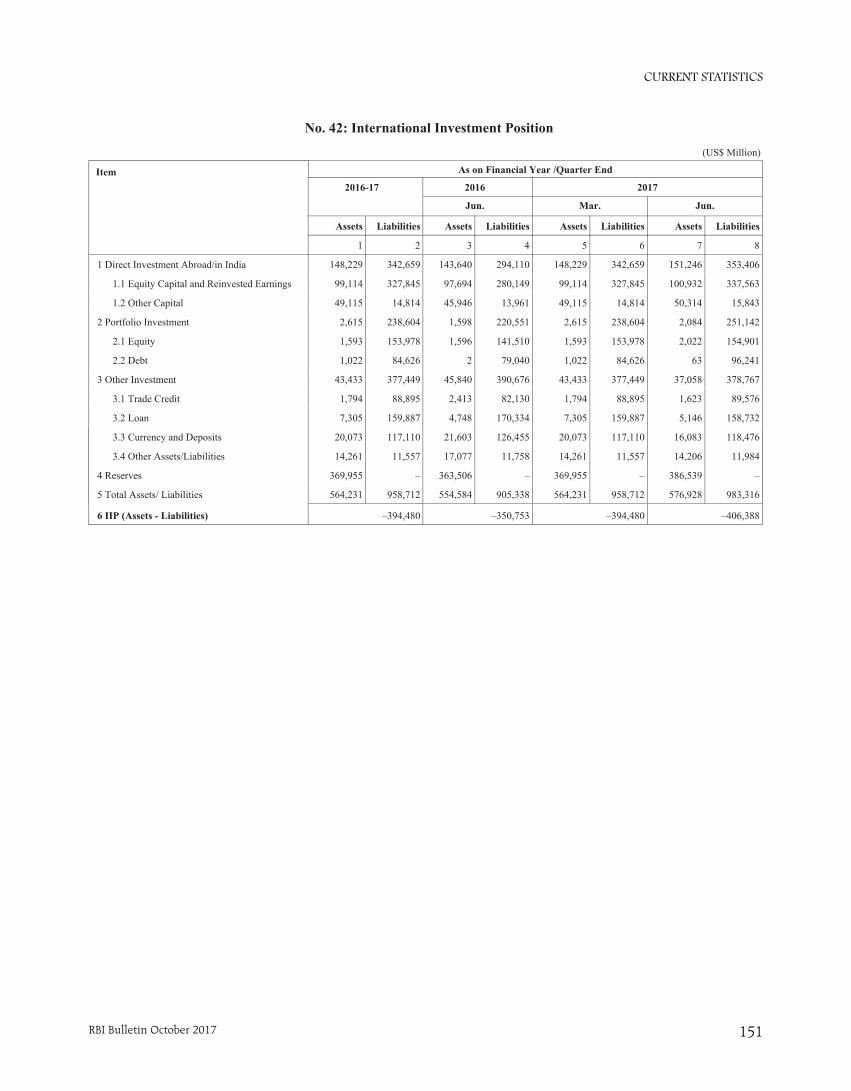
CURRENT STATISTICS
RBI Bulletin October 2017 151
(US$ Million)
2016 2017
Jun. Mar. Jun.
Assets Assets Assets
3 4 5
–350,753 –394,480 –406,388
Item 2016-17
Assets
1
6 IIP (Assets - Liabilities) –394,480
(US$ Million)
2016 2017
Jun. Mar. Jun.
Assets Liabilities Assets Liabilities Assets Liabilities
3 4 5 6 7 8
143,640 294,110 148,229 342,659 151,246 353,406
97,694 280,149 99,114 327,845 100,932 337,563
45,946 13,961 49,115 14,814 50,314 15,843
1,598 220,551 2,615 238,604 2,084 251,142
1,596 141,510 1,593 153,978 2,022 154,901
2 79,040 1,022 84,626 63 96,241
45,840 390,676 43,433 377,449 37,058 378,767
2,413 82,130 1,794 88,895 1,623 89,576
4,748 170,334 7,305 159,887 5,146 158,732
21,603 126,455 20,073 117,110 16,083 118,476
17,077 11,758 14,261 11,557 14,206 11,984
363,506 – 369,955 – 386,539 –
554,584 905,338 564,231 958,712 576,928 983,316
No. 42: International Investment Position
Item2016-17
Assets Liabilities
1 2
1 Direct Investment Abroad/in India 148,229 342,659
1.1 Equity Capital and Reinvested Earnings 99,114 327,845
1.2 Other Capital 49,115 14,814
2 Portfolio Investment 2,615 238,604
2.1 Equity 1,593 153,978
2.2 Debt 1,022 84,626
3 Other Investment 43,433 377,449
3.1 Trade Credit 1,794 88,895
3.2 Loan 7,305 159,887
3.3 Currency and Deposits 20,073 117,110
3.4 Other Assets/Liabilities 14,261 11,557
4 Reserves 369,955 –
5 Total Assets/ Liabilities 564,231 958,712
As on Financial Year /Quarter End
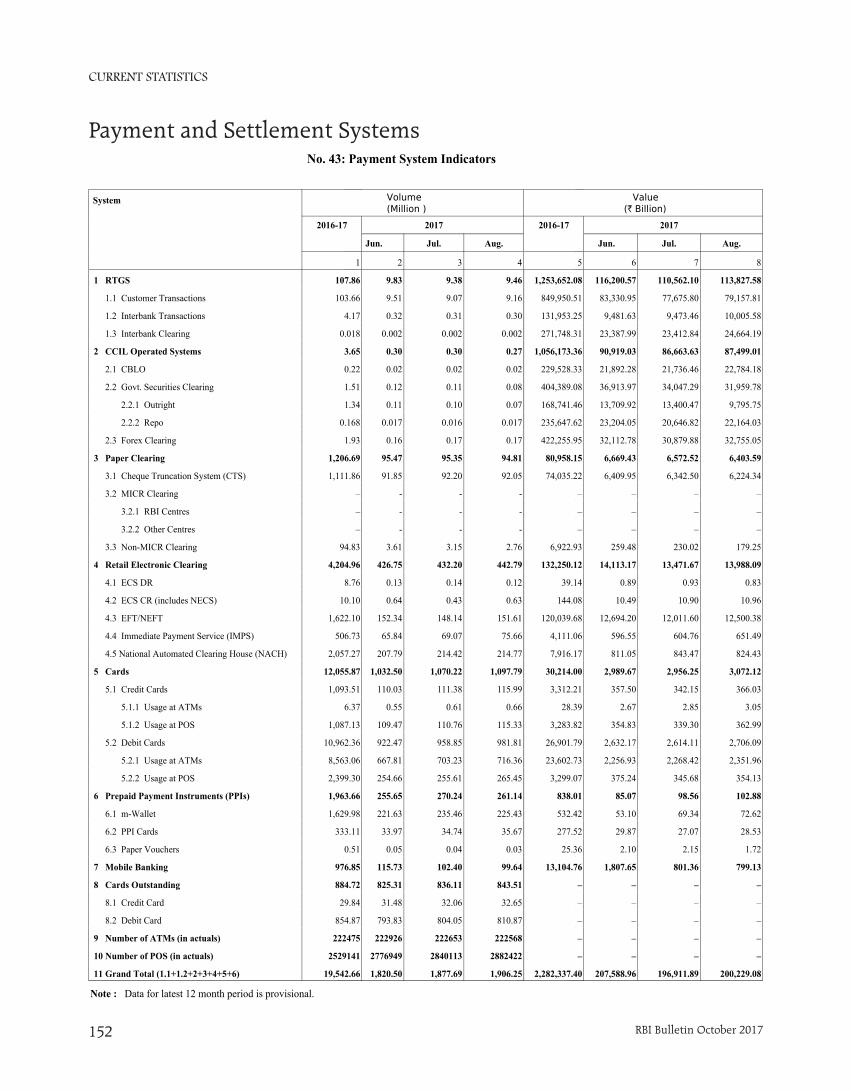
CURRENT STATISTICS
RBI Bulletin October 2017152
No. 43: Payment System Indicators
Value (` Billion)
2017
Jun. Jul. Aug.
6 7 8
116,200.57 110,562.10 113,827.58
83,330.95 77,675.80 79,157.81
9,481.63 9,473.46 10,005.58
23,387.99 23,412.84 24,664.19
90,919.03 86,663.63 87,499.01
21,892.28 21,736.46 22,784.18
36,913.97 34,047.29 31,959.78
13,709.92 13,400.47 9,795.75
23,204.05 20,646.82 22,164.03
32,112.78 30,879.88 32,755.05
6,669.43 6,572.52 6,403.59
6,409.95 6,342.50 6,224.34
– – –
– – –
– – –
259.48 230.02 179.25
14,113.17 13,471.67 13,988.09
0.89 0.93 0.83
10.49 10.90 10.96
12,694.20 12,011.60 12,500.38
596.55 604.76 651.49
811.05 843.47 824.43
2,989.67 2,956.25 3,072.12
357.50 342.15 366.03
2.67 2.85 3.05
354.83 339.30 362.99
2,632.17 2,614.11 2,706.09
2,256.93 2,268.42 2,351.96
375.24 345.68 354.13
85.07 98.56 102.88
53.10 69.34 72.62
29.87 27.07 28.53
2.10 2.15 1.72
1,807.65 801.36 799.13
– – –
– – –
– – –
– – –
– – –
207,588.96 196,911.89 200,229.08
2016-17
5
1,253,652.08
849,950.51
131,953.25
271,748.31
1,056,173.36
229,528.33
404,389.08
168,741.46
235,647.62
422,255.95
80,958.15
74,035.22
–
–
–
6,922.93
132,250.12
39.14
144.08
120,039.68
4,111.06
7,916.17
30,214.00
3,312.21
28.39
3,283.82
26,901.79
23,602.73
3,299.07
838.01
532.42
277.52
25.36
13,104.76
–
–
–
–
–
2,282,337.40
Volume(Million )
2017
Jun. Jul. Aug.
2 3 4
9.83 9.38 9.46
9.51 9.07 9.16
0.32 0.31 0.30
0.002 0.002 0.002
0.30 0.30 0.27
0.02 0.02 0.02
0.12 0.11 0.08
0.11 0.10 0.07
0.017 0.016 0.017
0.16 0.17 0.17
95.47 95.35 94.81
91.85 92.20 92.05
- - -
- - -
- - -
3.61 3.15 2.76
426.75 432.20 442.79
0.13 0.14 0.12
0.64 0.43 0.63
152.34 148.14 151.61
65.84 69.07 75.66
207.79 214.42 214.77
1,032.50 1,070.22 1,097.79
110.03 111.38 115.99
0.55 0.61 0.66
109.47 110.76 115.33
922.47 958.85 981.81
667.81 703.23 716.36
254.66 255.61 265.45
255.65 270.24 261.14
221.63 235.46 225.43
33.97 34.74 35.67
0.05 0.04 0.03
115.73 102.40 99.64
825.31 836.11 843.51
31.48 32.06 32.65
793.83 804.05 810.87
222926 222653 222568
2776949 2840113 2882422
1,820.50 1,877.69 1,906.25
System
2016-17
1
1 RTGS 107.86
1.1 Customer Transactions 103.66
1.2 Interbank Transactions 4.17
1.3 Interbank Clearing 0.018
2 CCIL Operated Systems 3.65
2.1 CBLO 0.22
2.2 Govt. Securities Clearing 1.51
2.2.1 Outright 1.34
2.2.2 Repo 0.168
2.3 Forex Clearing 1.93
3 Paper Clearing 1,206.69
3.1 Cheque Truncation System (CTS) 1,111.86
3.2 MICR Clearing –
3.2.1 RBI Centres –
3.2.2 Other Centres –
3.3 Non-MICR Clearing 94.83
4 Retail Electronic Clearing 4,204.96
4.1 ECS DR 8.76
4.2 ECS CR (includes NECS) 10.10
4.3 EFT/NEFT 1,622.10
4.4 Immediate Payment Service (IMPS) 506.73
4.5 National Automated Clearing House (NACH) 2,057.27
5 Cards 12,055.87
5.1 Credit Cards 1,093.51
5.1.1 Usage at ATMs 6.37
5.1.2 Usage at POS 1,087.13
5.2 Debit Cards 10,962.36
5.2.1 Usage at ATMs 8,563.06
5.2.2 Usage at POS 2,399.30
6 Prepaid Payment Instruments (PPIs) 1,963.66
6.1 m-Wallet 1,629.98
6.2 PPI Cards 333.11
6.3 Paper Vouchers 0.51
7 Mobile Banking 976.85
8 Cards Outstanding 884.72
8.1 Credit Card 29.84
8.2 Debit Card 854.87
9 Number of ATMs (in actuals) 222475
10 Number of POS (in actuals) 2529141
11 Grand Total (1.1+1.2+2+3+4+5+6) 19,542.66
Note : Data for latest 12 month period is provisional.
Payment and Settlement Systems
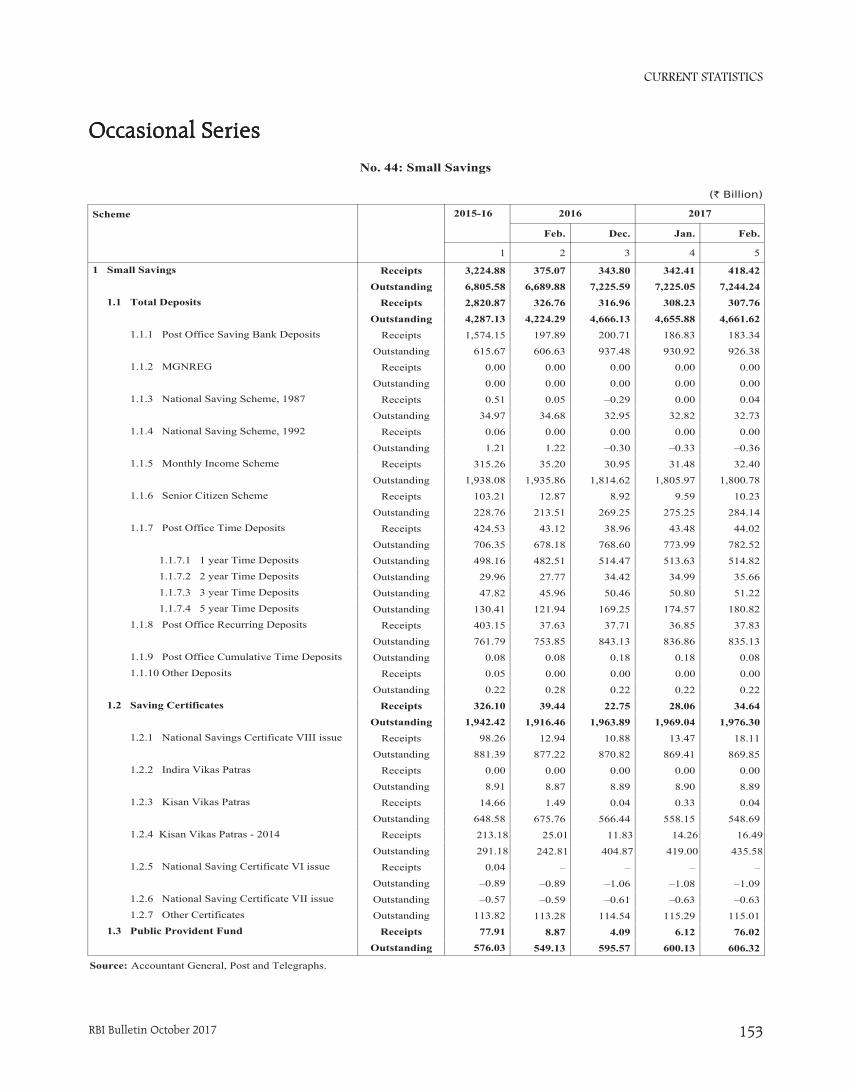
CURRENT STATISTICS
RBI Bulletin October 2017 153
No. 44: Small Savings
(` Billion)
2016 2017
Feb. Dec. Jan. Feb.
2 3 4 5
375.07 343.80 342.41 418.42
6,689.88 7,225.59 7,225.05 7,244.24
326.76 316.96 308.23 307.76
4,224.29 4,666.13 4,655.88 4,661.62
197.89 200.71 186.83 183.34
606.63 937.48 930.92 926.38
0.00 0.00 0.00 0.00
0.00 0.00 0.00 0.00
0.05 –0.29 0.00 0.04
34.68 32.95 32.82 32.73
0.00 0.00 0.00 0.00
1.22 –0.30 –0.33 –0.36
35.20 30.95 31.48 32.40
1,935.86 1,814.62 1,805.97 1,800.78
12.87 8.92 9.59 10.23
213.51 269.25 275.25 284.14
43.12 38.96 43.48 44.02
678.18 768.60 773.99 782.52
482.51 514.47 513.63 514.82
27.77 34.42 34.99 35.66
45.96 50.46 50.80 51.22
121.94 169.25 174.57 180.82
37.63 37.71 36.85 37.83
753.85 843.13 836.86 835.13
0.08 0.18 0.18 0.08
0.00 0.00 0.00 0.00
0.28 0.22 0.22 0.22
39.44 22.75 28.06 34.64
1,916.46 1,963.89 1,969.04 1,976.30
12.94 10.88 13.47 18.11
877.22 870.82 869.41 869.85
0.00 0.00 0.00 0.00
8.87 8.89 8.90 8.89
1.49 0.04 0.33 0.04
675.76 566.44 558.15 548.69
25.01 11.83 14.26 16.49
242.81 404.87 419.00 435.58
– – – –
–0.89 –1.06 –1.08 –1.09
–0.59 –0.61 –0.63 –0.63
113.28 114.54 115.29 115.01
8.87 4.09 6.12 76.02
549.13 595.57 600.13 606.32
Scheme 2015-16
1
1 Small Savings Receipts 3,224.88
Outstanding 6,805.58
1.1 Total Deposits Receipts 2,820.87
Outstanding 4,287.13
1.1.1 Post Office Saving Bank Deposits Receipts 1,574.15
Outstanding 615.67 1.1.2 MGNREG Receipts 0.00
Outstanding 0.00 1.1.3 National Saving Scheme, 1987 Receipts 0.51
Outstanding 34.97 1.1.4 National Saving Scheme, 1992 Receipts 0.06
Outstanding 1.21 1.1.5 Monthly Income Scheme Receipts 315.26
Outstanding 1,938.08 1.1.6 Senior Citizen Scheme Receipts 103.21
Outstanding 228.76 1.1.7 Post Office Time Deposits Receipts 424.53
Outstanding 706.35 1.1.7.1 1 year Time Deposits Outstanding 498.16 1.1.7.2 2 year Time Deposits Outstanding 29.96 1.1.7.3 3 year Time Deposits Outstanding 47.82 1.1.7.4 5 year Time Deposits Outstanding 130.41 1.1.8 Post Office Recurring Deposits Receipts 403.15
Outstanding 761.79 1.1.9 Post Office Cumulative Time Deposits Outstanding 0.08 1.1.10 Other Deposits Receipts 0.05
Outstanding 0.22 1.2 Saving Certificates Receipts 326.10
Outstanding 1,942.42
1.2.1 National Savings Certificate VIII issue Receipts 98.26
Outstanding 881.39 1.2.2 Indira Vikas Patras Receipts 0.00
Outstanding 8.91 1.2.3 Kisan Vikas Patras Receipts 14.66
Outstanding 648.58 1.2.4 Kisan Vikas Patras - 2014 Receipts 213.18
Outstanding 291.18 1.2.5 National Saving Certificate VI issue Receipts 0.04
Outstanding –0.89 1.2.6 National Saving Certificate VII issue Outstanding –0.57 1.2.7 Other Certificates Outstanding 113.82 1.3 Public Provident Fund Receipts 77.91
Outstanding 576.03
Source: Accountant General, Post and Telegraphs.
Occasional SeriesOccasional SeriesOccasional Series
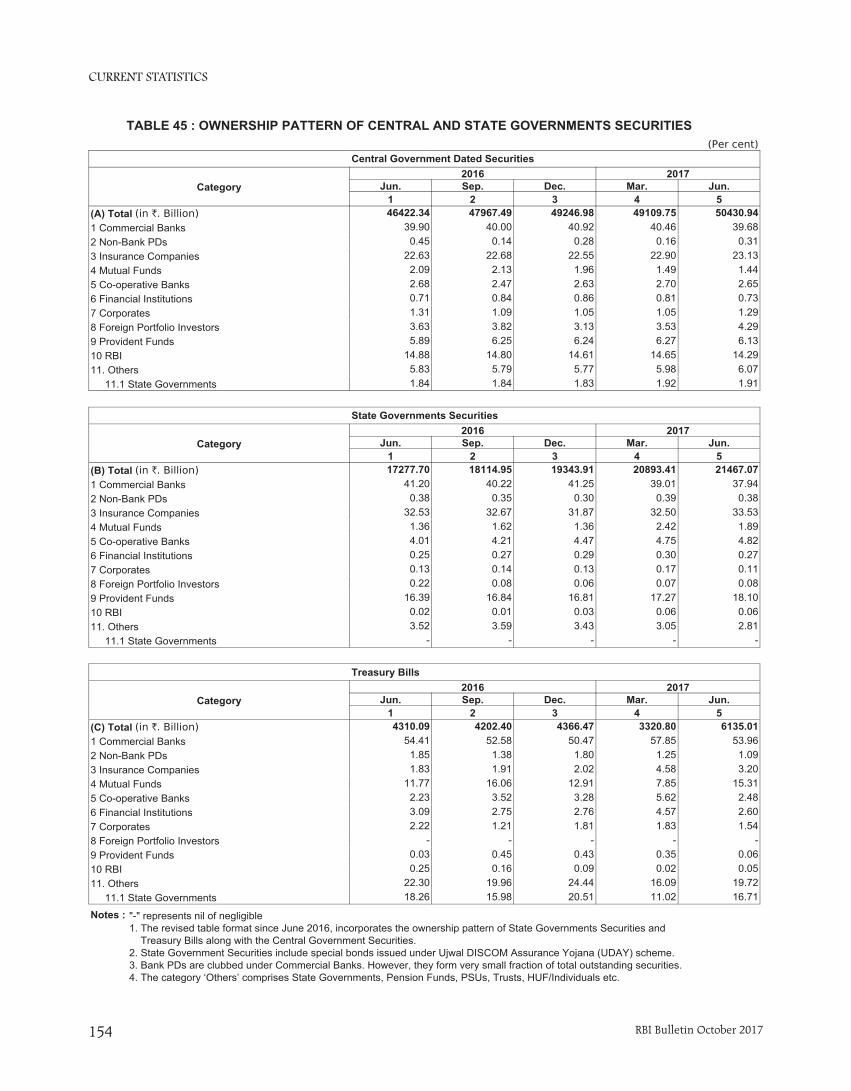
CURRENT STATISTICS
RBI Bulletin October 2017154
TABLE 45 : OWNERSHIP PATTERN OF CENTRAL AND STATE GOVERNMENTS SECURITIES
Central Government Dated Securities
Central Government Dated Securities
Category2016 2017
Jun. Sep. Dec. Mar. Jun.1 2 3 4 5
(A) Total 46422.34 47967.49 49246.98 49109.75 50430.941 Commercial Banks 39.90 40.00 40.92 40.46 39.682 Non-Bank PDs 0.45 0.14 0.28 0.16 0.313 Insurance Companies 22.63 22.68 22.55 22.90 23.134 Mutual Funds 2.09 2.13 1.96 1.49 1.445 Co-operative Banks 2.68 2.47 2.63 2.70 2.656 Financial Institutions 0.71 0.84 0.86 0.81 0.737 Corporates 1.31 1.09 1.05 1.05 1.298 Foreign Portfolio Investors 3.63 3.82 3.13 3.53 4.299 Provident Funds 5.89 6.25 6.24 6.27 6.1310 RBI 14.88 14.80 14.61 14.65 14.2911. Others 5.83 5.79 5.77 5.98 6.07 11.1 State Governments 1.84 1.84 1.83 1.92 1.91
(Per cent)
(in `. Billion)
State Development Loans
State Governments Securities
Category2016 2017
Jun. Sep. Dec. Mar. Jun.1 2 3 4 5
(B) Total 17277.70 18114.95 19343.91 20893.41 21467.071 Commercial Banks 41.20 40.22 41.25 39.01 37.942 Non-Bank PDs 0.38 0.35 0.30 0.39 0.383 Insurance Companies 32.53 32.67 31.87 32.50 33.534 Mutual Funds 1.36 1.62 1.36 2.42 1.895 Co-operative Banks 4.01 4.21 4.47 4.75 4.826 Financial Institutions 0.25 0.27 0.29 0.30 0.277 Corporates 0.13 0.14 0.13 0.17 0.118 Foreign Portfolio Investors 0.22 0.08 0.06 0.07 0.089 Provident Funds 16.39 16.84 16.81 17.27 18.1010 RBI 0.02 0.01 0.03 0.06 0.0611. Others 3.52 3.59 3.43 3.05 2.81 11.1 State Governments - - - - -
(in `. Billion)
Treasury Bills
Treasury Bills
Category2016 2017
Jun. Sep. Dec. Mar. Jun.1 2 3 4 5
(C) Total 4310.09 4202.40 4366.47 3320.80 6135.011 Commercial Banks 54.41 52.58 50.47 57.85 53.962 Non-Bank PDs 1.85 1.38 1.80 1.25 1.093 Insurance Companies 1.83 1.91 2.02 4.58 3.204 Mutual Funds 11.77 16.06 12.91 7.85 15.315 Co-operative Banks 2.23 3.52 3.28 5.62 2.486 Financial Institutions 3.09 2.75 2.76 4.57 2.607 Corporates 2.22 1.21 1.81 1.83 1.548 Foreign Portfolio Investors - - - - -9 Provident Funds 0.03 0.45 0.43 0.35 0.0610 RBI 0.25 0.16 0.09 0.02 0.0511. Others 22.30 19.96 24.44 16.09 19.72 11.1 State Governments 18.26 15.98 20.51 11.02 16.71
(in `. Billion)
Notes : "-" represents nil of negligible1. The revised table format since June 2016, incorporates the ownership pattern of State Governments Securities and Treasury Bills along with the Central Government Securities.2. State Government Securities include special bonds issued under Ujwal DISCOM Assurance Yojana (UDAY) scheme. 3. Bank PDs are clubbed under Commercial Banks. However, they form very small fraction of total outstanding securities.4. The category ‘Others’ comprises State Governments, Pension Funds, PSUs, Trusts, HUF/Individuals etc.
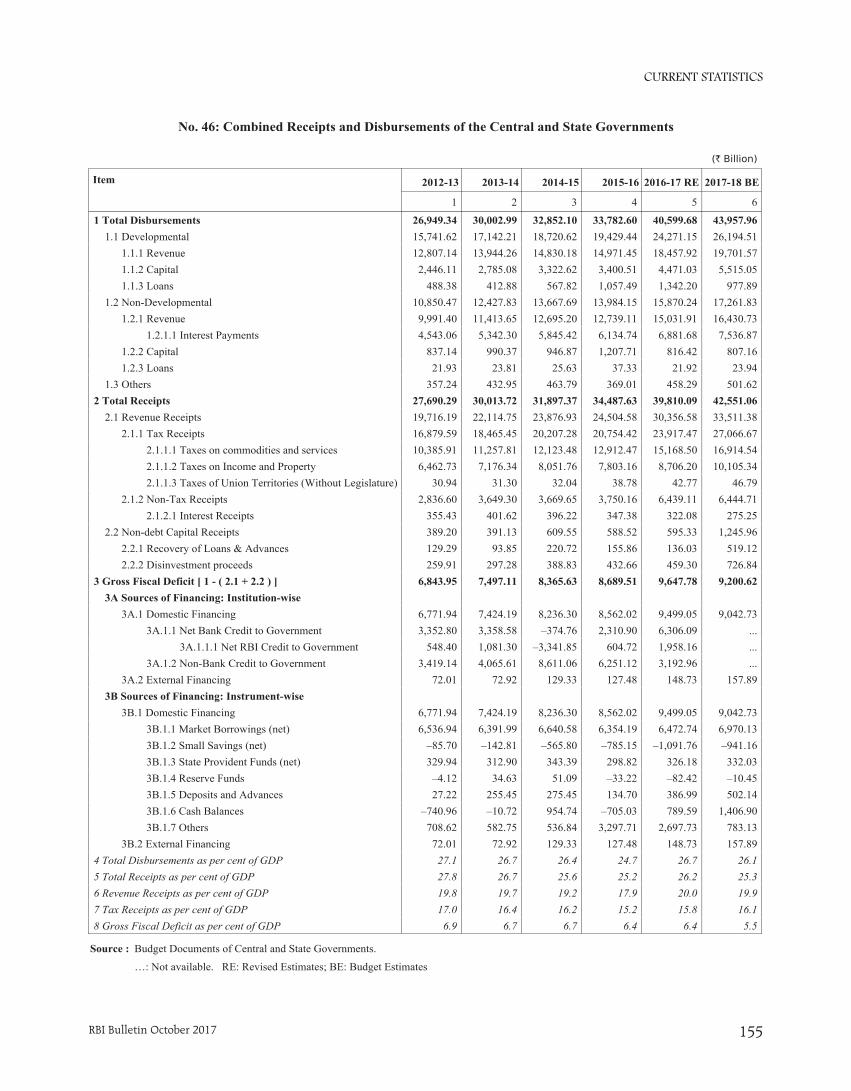
CURRENT STATISTICS
RBI Bulletin October 2017 155
No. 46: Combined Receipts and Disbursements of the Central and State Governments
(` Billion)
Item 2012-13 2013-14 2014-15 2015-16 2016-17 RE 2017-18 BE
1 2 3 4 5 6
1 Total Disbursements 26,949.34 30,002.99 32,852.10 33,782.60 40,599.68 43,957.96 1.1 Developmental 15,741.62 17,142.21 18,720.62 19,429.44 24,271.15 26,194.51 1.1.1 Revenue 12,807.14 13,944.26 14,830.18 14,971.45 18,457.92 19,701.57 1.1.2 Capital 2,446.11 2,785.08 3,322.62 3,400.51 4,471.03 5,515.05 1.1.3 Loans 488.38 412.88 567.82 1,057.49 1,342.20 977.89 1.2 Non-Developmental 10,850.47 12,427.83 13,667.69 13,984.15 15,870.24 17,261.83 1.2.1 Revenue 9,991.40 11,413.65 12,695.20 12,739.11 15,031.91 16,430.73 1.2.1.1 Interest Payments 4,543.06 5,342.30 5,845.42 6,134.74 6,881.68 7,536.87 1.2.2 Capital 837.14 990.37 946.87 1,207.71 816.42 807.16 1.2.3 Loans 21.93 23.81 25.63 37.33 21.92 23.94 1.3 Others 357.24 432.95 463.79 369.01 458.29 501.622 Total Receipts 27,690.29 30,013.72 31,897.37 34,487.63 39,810.09 42,551.06 2.1 Revenue Receipts 19,716.19 22,114.75 23,876.93 24,504.58 30,356.58 33,511.38 2.1.1 Tax Receipts 16,879.59 18,465.45 20,207.28 20,754.42 23,917.47 27,066.67 2.1.1.1 Taxes on commodities and services 10,385.91 11,257.81 12,123.48 12,912.47 15,168.50 16,914.54 2.1.1.2 Taxes on Income and Property 6,462.73 7,176.34 8,051.76 7,803.16 8,706.20 10,105.34 2.1.1.3 Taxes of Union Territories (Without Legislature) 30.94 31.30 32.04 38.78 42.77 46.79 2.1.2 Non-Tax Receipts 2,836.60 3,649.30 3,669.65 3,750.16 6,439.11 6,444.71 2.1.2.1 Interest Receipts 355.43 401.62 396.22 347.38 322.08 275.25 2.2 Non-debt Capital Receipts 389.20 391.13 609.55 588.52 595.33 1,245.96 2.2.1 Recovery of Loans & Advances 129.29 93.85 220.72 155.86 136.03 519.12 2.2.2 Disinvestment proceeds 259.91 297.28 388.83 432.66 459.30 726.843 Gross Fiscal Deficit [ 1 - ( 2.1 + 2.2 ) ] 6,843.95 7,497.11 8,365.63 8,689.51 9,647.78 9,200.62 3A Sources of Financing: Institution-wise 0.00 0.00 0.00 0.00 0.00 0.00 3A.1 Domestic Financing 6,771.94 7,424.19 8,236.30 8,562.02 9,499.05 9,042.73 3A.1.1 Net Bank Credit to Government 3,352.80 3,358.58 –374.76 2,310.90 6,306.09 ... 3A.1.1.1 Net RBI Credit to Government 548.40 1,081.30 –3,341.85 604.72 1,958.16 ... 3A.1.2 Non-Bank Credit to Government 3,419.14 4,065.61 8,611.06 6,251.12 3,192.96 ... 3A.2 External Financing 72.01 72.92 129.33 127.48 148.73 157.89 3B Sources of Financing: Instrument-wise 0.00 0.00 0.00 0.00 0.00 0.00 3B.1 Domestic Financing 6,771.94 7,424.19 8,236.30 8,562.02 9,499.05 9,042.73 3B.1.1 Market Borrowings (net) 6,536.94 6,391.99 6,640.58 6,354.19 6,472.74 6,970.13 3B.1.2 Small Savings (net) –85.70 –142.81 –565.80 –785.15 –1,091.76 –941.16 3B.1.3 State Provident Funds (net) 329.94 312.90 343.39 298.82 326.18 332.03 3B.1.4 Reserve Funds –4.12 34.63 51.09 –33.22 –82.42 –10.45 3B.1.5 Deposits and Advances 27.22 255.45 275.45 134.70 386.99 502.14 3B.1.6 Cash Balances –740.96 –10.72 954.74 –705.03 789.59 1,406.90 3B.1.7 Others 708.62 582.75 536.84 3,297.71 2,697.73 783.13 3B.2 External Financing 72.01 72.92 129.33 127.48 148.73 157.894 Total Disbursements as per cent of GDP 27.1 26.7 26.4 24.7 26.7 26.15 Total Receipts as per cent of GDP 27.8 26.7 25.6 25.2 26.2 25.36 Revenue Receipts as per cent of GDP 19.8 19.7 19.2 17.9 20.0 19.97 Tax Receipts as per cent of GDP 17.0 16.4 16.2 15.2 15.8 16.18 Gross Fiscal Deficit as per cent of GDP 6.9 6.7 6.7 6.4 6.4 5.5
Source : Budget Documents of Central and State Governments.
…: Not available. RE: Revised Estimates; BE: Budget Estimates

CURRENT STATISTICS
RBI Bulletin October 2017156
Explanatory Notes to the Current Statistics
Table No. 11.2 & 6: Annual data are averages of months.3.5 & 3.7: Relate to ratios of increments over financial year so far.4.1 to 4.4, 4.8, 4.12 & 5: Relate to the last day of the month/financial year. 4.5, 4.6 & 4.7: Relate to five major banks on the last Friday of the month/financial year. 4.9 to 4.11: Relate to the last auction day of the month/financial year.
Table No. 22.1.2: Include paid-up capital, reserve fund and Long-Term Operations Funds. 2.2.2: Include cash, fixed deposits and short-term securities/bonds, e.g., issued by IIFC (UK).
Table No. 4 Maturity-wise position of outstanding forward contracts is available at http://nsdp.rbi.org.in under ‘‘Reserves Template’’.
Table No. 5 Special refinance facility to Others, i.e. to the EXIM Bank, is closed since March 31, 2013.
Table No. 6 For scheduled banks, March-end data pertain to the last reporting Friday.2.2: Exclude balances held in IMF Account No.1, RBI employees’ provident fund, pension fund, gratuity and superannuation fund.
Table Nos. 7 & 113.1 in Table 7 and 2.4 in Table 11: Include foreign currency denominated bonds issued by IIFC (UK).
Table No. 8NM2 and NM3 do not include FCNR (B) deposits.2.4: Consist of paid-up capital and reserves.2.5: includes other demand and time liabilities of the banking system.
Table No. 9Financial institutions comprise EXIM Bank, SIDBI, NABARD and NHB. L1 and L2 are compiled monthly and L3 quarterly. Wherever data are not available, the last available data have been repeated.
Table No. 13Data against column Nos. (1), (2) & (3) are Final (including RRBs) and for column Nos. (4) & (5) data are Provisional (excluding RRBs)
Table No. 15 & 16Data are provisional and relate to select 41 scheduled commercial banks, accounting for about 95 per cent of total non-food credit extended by all scheduled commercial banks (excludes ING Vysya which has been merged with Kotak Mahindra since April 2015).
CURRENT STATISTICS
RBI Bulletin October 2017 157
Export credit under priority sector relates to foreign banks only.
Micro & small under item 2.1 includes credit to micro & small industries in manufacturing sector.
Micro & small enterprises under item 5.2 includes credit to micro & small enterprises in manufacturing as well as services sector.
Priority Sector is as per old definition and does not conform to FIDD Circular FIDD.CO.Plan.BC.54/04.09.01/2014-15 dated April 23, 2015.
Table No. 172.1.1: Exclude reserve fund maintained by co-operative societies with State Co-operative Banks2.1.2: Exclude borrowings from RBI, SBI, IDBI, NABARD, notified banks and State Governments.4: Include borrowings from IDBI and NABARD.
Table No. 24Primary Dealers (PDs) include banks undertaking PD business.
Table No. 30 Exclude private placement and offer for sale. 1: Exclude bonus shares.2: Include cumulative convertible preference shares and equi-preference shares.
Table No. 32Exclude investment in foreign currency denominated bonds issued by IIFC (UK), SDRs transferred by Government of India to RBI and foreign currency received under SAARC SWAP arrangement. Foreign currency assets in US dollar take into account appreciation/depreciation of non-US currencies (such as Euro, Sterling, Yen and Australian Dollar) held in reserves. Foreign exchange holdings are converted into rupees at rupee-US dollar RBI holding rates.
Table No. 341.1.1.1.2 & 1.1.1.1.1.4: Estimates.1.1.1.2: Estimates for latest months. ‘Other capital’ pertains to debt transactions between parent and subsidiaries/branches of FDI enterprises.Data may not tally with the BoP data due to lag in reporting.
Table No. 351.10: Include items such as subscription to journals, maintenance of investment abroad, student loan repayments and credit card payments.
Table No. 36 Increase in indices indicates appreciation of rupee and vice versa. For 6-Currency index, base year 2012-13 is a moving one, which gets updated every year. REER figures are based on Consumer Price Index (combined). Methodological details are available in December 2005 and April 2014 issues of the Bulletin.
Table No. 37Based on applications for ECB/Foreign Currency Convertible Bonds (FCCBs) which have been allotted loan registration number during the period.
CURRENT STATISTICS
RBI Bulletin October 2017158
Detailed explanatory notes are available in the relevant press releases issued by RBI and other publications/releases of the Bank such as Handbook of Statistics on the Indian Economy.
Table Nos. 38, 39, 40 & 41 Explanatory notes on these tables are available in December issue of RBI Bulletin, 2012.
Table No. 431.3: Pertain to multiateral net settlement batches.3.1: Pertain to three centres – Mumbai, New Delhi and Chennai.3.3: Pertain to clearing houses managed by 21 banks.6: Available from December 2010.7: Include IMPS transactions.9: Includes ATMs deployed by Scheduled Commercial banks and White Label ATMs (WLA). WLA are included from April 2014 onwards.
Table No. 45(-): represents nil or negligible
The table format incorporates the ownership pattern of State Governments Securities and Treasury Bills along with the Central Government Securities. In addition, State Governments’ holding of securities are shown as a separate category for the first time.
State Government Securities include special bonds issued under Ujwal DISCOM Assurance Yojana (UDAY) scheme.
Bank PDs are clubbed under Commercial Banks. However, they form very small fraction of total outstanding securities.
The category ‘Others’ comprises State Governments, Pension Funds, PSUs, Trusts, HUF/Individuals etc.
Table No. 46GDP data from 2011-12 onwards are based on 2011-12 base. Data from year 2015-16 pertains to 26 states.Total receipts and total expenditure exclude National Calamity Contingency Fund expenditure.1 & 2: Data are net of repayments of the Central Government (including repayments to the NSSF) and State Governments.1.3: Represents compensation and assignments by States to local bodies and Panchayati Raj institutions.2: Data are net of variation in cash balances of the Central and State Governments and includes borrowing receipts of the Central and State Governments.3A.1.1: Data as per RBI records.3B.1.1: Includes borrowings through dated securities and 364-day Treasury Bills.3B.1.2: Represent net investment in Central and State Governments’ special securities by the National Small Savings Fund (NSSF).3B.1.6: Include Ways and Means Advances by the Centre to the State Governments.3B.1.7: Include Treasury Bills (excluding 364-day Treasury Bills), loans from financial institutions, insurance and pension funds, remittances, cash balance investment account.
The concepts and methodologies for Current Statistics are available in Comprehensive Guide for Current Statistics of the RBI Monthly Bulletin (https://rbi.org.in/Scripts/PublicationsView.aspx?id=17618)
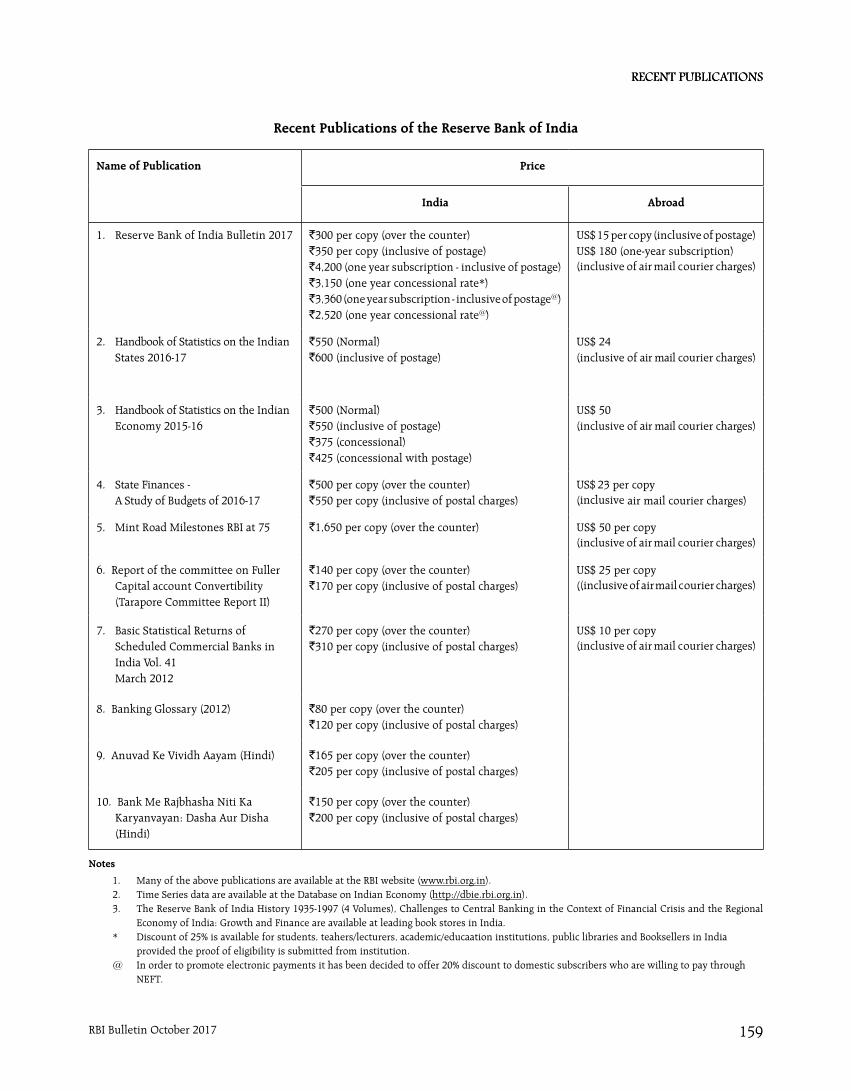
Recent PublicationsRecent Publications
RBI Bulletin October 2017 159
Name of Publication Price
India Abroad
1. Reserve Bank of India Bulletin 2017 `300 per copy (over the counter)`350 per copy (inclusive of postage)`4,200 (one year subscription - inclusive of postage)`3,150 (one year concessional rate*)`3,360 (one year subscription - inclusive of postage@)`2,520 (one year concessional rate@)
US$ 15 per copy (inclusive of postage) US$ 180 (one-year subscription)(inclusive of air mail courier charges)
2. Handbook of Statistics on the Indian States 2016-17
`550 (Normal)`600 (inclusive of postage)
US$ 24(inclusive of air mail courier charges)
3. Handbook of Statistics on the Indian Economy 2015-16
`500 (Normal)`550 (inclusive of postage)`375 (concessional)`425 (concessional with postage)
US$ 50(inclusive of air mail courier charges)
4. State Finances -A Study of Budgets of 2016-17
`500 per copy (over the counter)`550 per copy (inclusive of postal charges)
US$ 23 per copy(inclusive air mail courier charges)
5. Mint Road Milestones RBI at 75 `1,650 per copy (over the counter) US$ 50 per copy (inclusive of air mail courier charges)
6. Report of the committee on Fuller Capital account Convertibility (Tarapore Committee Report II)
`140 per copy (over the counter)`170 per copy (inclusive of postal charges)
US$ 25 per copy((inclusive of air mail courier charges)
7. Basic Statistical Returns of Scheduled Commercial Banks in India Vol. 41 March 2012
`270 per copy (over the counter)`310 per copy (inclusive of postal charges)
US$ 10 per copy(inclusive of air mail courier charges)
8. Banking Glossary (2012) `80 per copy (over the counter)`120 per copy (inclusive of postal charges)
9. Anuvad Ke Vividh Aayam (Hindi) `165 per copy (over the counter)`205 per copy (inclusive of postal charges)
10. Bank Me Rajbhasha Niti Ka Karyanvayan: Dasha Aur Disha (Hindi)
`150 per copy (over the counter)`200 per copy (inclusive of postal charges)
Recent Publications of the Reserve Bank of India
Notes
1. Many of the above publications are available at the RBI website (www.rbi.org.in).2. Time Series data are available at the Database on Indian Economy (http://dbie.rbi.org.in). 3. The Reserve Bank of India History 1935-1997 (4 Volumes), Challenges to Central Banking in the Context of Financial Crisis and the Regional
Economy of India: Growth and Finance are available at leading book stores in India.* Discount of 25% is available for students, teahers/lecturers, academic/educaation institutions, public libraries and Booksellers in India
provided the proof of eligibility is submitted from institution. @ In order to promote electronic payments it has been decided to offer 20% discount to domestic subscribers who are willing to pay through
NEFT.
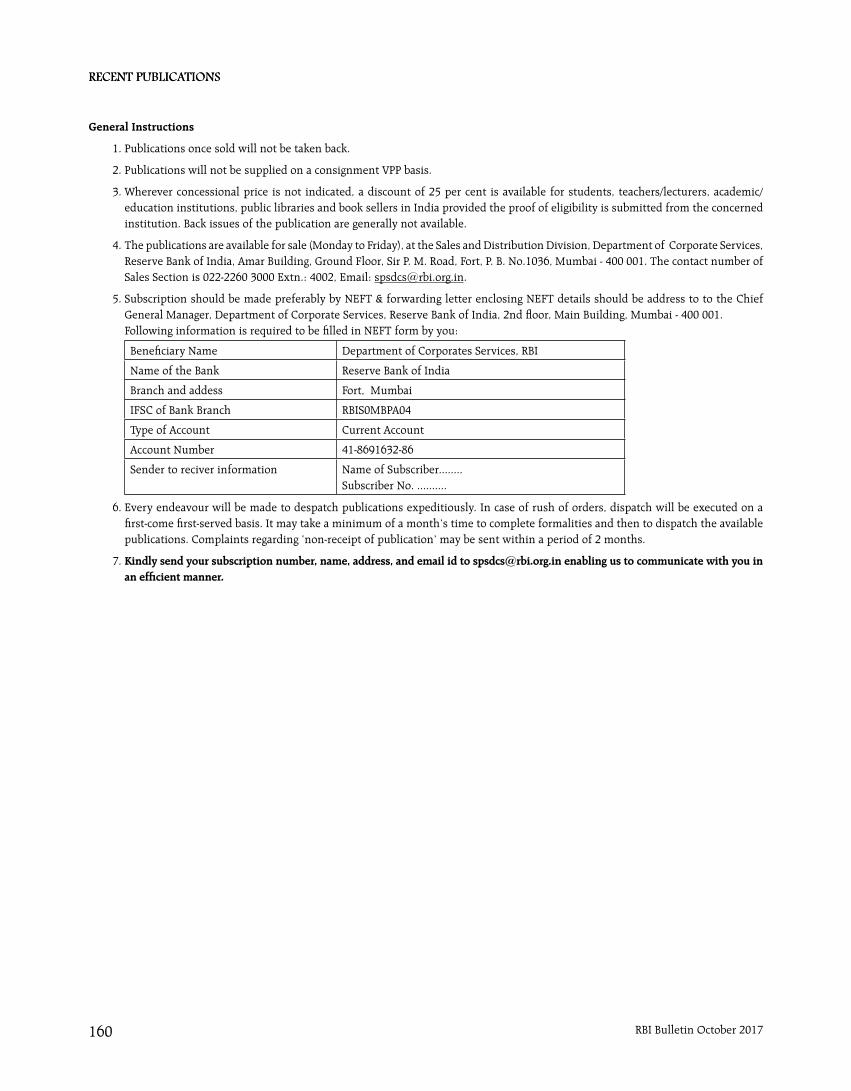
Recent PublicationsRecent Publications
RBI Bulletin October 2017160
General Instructions
1. Publications once sold will not be taken back.
2. Publications will not be supplied on a consignment VPP basis.
3. Wherever concessional price is not indicated, a discount of 25 per cent is available for students, teachers/lecturers, academic/education institutions, public libraries and book sellers in India provided the proof of eligibility is submitted from the concerned institution. Back issues of the publication are generally not available.
4. The publications are available for sale (Monday to Friday), at the Sales and Distribution Division, Department of Corporate Services, Reserve Bank of India, Amar Building, Ground Floor, Sir P. M. Road, Fort, P. B. No.1036, Mumbai - 400 001. The contact number of Sales Section is 022-2260 3000 Extn.: 4002, Email: [email protected].
5. Subscription should be made preferably by NEFT & forwarding letter enclosing NEFT details should be address to to the Chief General Manager, Department of Corporate Services, Reserve Bank of India, 2nd floor, Main Building, Mumbai - 400 001.
Following information is required to be filled in NEFT form by you:
Beneficiary Name Department of Corporates Services, RBI
Name of the Bank Reserve Bank of India
Branch and addess Fort, Mumbai
IFSC of Bank Branch RBIS0MBPA04
Type of Account Current Account
Account Number 41-8691632-86
Sender to reciver information Name of Subscriber........Subscriber No. ..........
6. Every endeavour will be made to despatch publications expeditiously. In case of rush of orders, dispatch will be executed on a first-come first-served basis. It may take a minimum of a month’s time to complete formalities and then to dispatch the available publications. Complaints regarding ‘non-receipt of publication’ may be sent within a period of 2 months.
7. Kindly send your subscription number, name, address, and email id to [email protected] enabling us to communicate with you in an efficient manner.