ocean color retrieval using landsat-8 imagery in … · ocean color retrieval using landsat-8...
TRANSCRIPT
OCEAN COLOR RETRIEVAL USING LANDSAT-8 IMAGERY IN COASTAL CASE 2
WATERS (CASE STUDY PERSIAN AND OMAN GULF)
N .Moradi a, M. Hasanlou a,*, M Saadatseresht a
a School of Surveying and Geospatial Engineering, College of Engineering, University of Tehran, Tehran, Iran
(moradi.n, hasanlou, msaadat)@ut.ac.ir
Commission VIII, WG VIII/9
KEY WORDS: Ocean color, Landsat-8, MODIS, Visible and near infrared bands, Non-Linear Model
ABSTRACT:
Ocean color (OC) monitoring using satellite imageries provides an appropriate tool for a better understanding of marine processes and
changes in the coastal environment. Radiance measurements in the range of visible light of the electromagnetic spectrum provides
information of ocean color that is associated with the water constituents. This measurements are used to monitor the level of biological
activity and the presence of particles in the water. Ocean features such as the concentration of chlorophyll, suspended sediment
concentration and sea surface temperature have a significant impact on the dynamics of the ocean. The concentration of chlorophyll
(chla), active pigments of phytoplankton photosynthesis, as a key indicator applied for assessment of water quality and biochemistry.
Experimental algorithms chla related to internal communication various optical components in the water that may be change in space
and time in the water with different optical characteristics. Therefore, the algorithms have been developed for one area may not work
for other places and each region according to its specific characteristics needs that determined by an algorithm may be appropriate to
local. We have tried treatment several algorithms for determination of chlorophyll, including experimental algorithms with a simple
band ratio of blue-green band (i.e. OCx) and algorithms includes two bands ratio with variable 𝑅𝑟𝑠(λ2)/𝑅𝑟𝑠(λ1), the three bands ratio
with variable [𝑅𝑟𝑠(λ1)−1 − 𝑅𝑟𝑠(λ2)−1] × 𝑅𝑟𝑠(λ3) and four bands ratio with variable [𝑅𝑟𝑠(λ1)−1 − 𝑅𝑟𝑠(λ2)−1]/[𝑅𝑟𝑠(λ4)−1 − 𝑅𝑟𝑠(λ3)−1] that
desired wavelength (i.e. λ1, λ2, λ3 and λ4) in the range of red and near-infrared wavelengths of the electromagnetic spectrum are in the
region of the Persian Gulf and Oman Sea look. Despite the high importance of the Persian Gulf and Oman Sea which can have up
basin countries, to now few studies have been done in this area. The focus of this article on the northern part of Oman Sea and Persian
Gulf, the shores of neighboring Iran (case 2 water). In this paper, by using Landsat 8 satellite imageries, we have discussed chla
concentrations and customizing different OC algorithms for this new dataset (Landsat-8 imagery). This satellite was launched in 2013
and its data using two sensors continuously are provided operating one sensor imager land (OLI: Operational Land Imager) and the
Thermal Infrared Sensor (TIRS: Thermal InfraRed Sensor) and are available. This sensors collect image data, respectively, for the
nine-band short wavelength in the range of 433-2300 nm and dual-band long wavelength thermal. Seven band of the nine band picked
up by the sensor information of OLI to deal with sensors TM (Thematic Mapper) and ETM+ (Enhanced Thematic Mapper Plus) in
previous satellite Landsat compatible and two other band, the band of coastal water (433 to 453 nm) and Cirrus band (1360 to 1390
nm), short wave infrared provides to measure water quality and high thin clouds. Since OLI sensor in Landsat satellite 8 compared
with other sensors to study OC have been allocated a much better spatial resolution can be more accurate to determine changes in OC.
To evaluate the results of the image sensor MODIS (Moderate Resolution Imaging Spectroradiometer) at the same time satellite images
Landsat 8 is used. The statistical parameters used in order to evaluate the performance of different algorithms, including root mean
square error (RMSE) and coefficient of determination (R2), and on the basis of these parameters we choose the most appropriate
algorithm for the area. Extracted results for implementing different OC algorithms clearly shows superiority of utilized method by
R2=0.71 and RMSE=0.07.
1. INTRODUCTION
Oceans and seas almost 70 percent of the Earth's surface and play
an important role in the cycling of elements such as nitrogen,
carbon, oxygen and sulfur [1] . Phytoplankton, microscopic
organisms basis of the marine food chain, are responsible for
most primary production in the ocean and there are everywhere
in the ocean surface. Monitoring changes of phytoplankton in a
very large extent from ocean is possible only through satellite
measurements. Chlorophyll (chla), the photosynthetically active
pigment of phytoplankton, and is soluble in water and produced
yellow-green color. In addition to the light-absorbing, chla
involved in back light with complex interactions [2] .
Chlorophyll concentration as one of the main phytoplankton as
representative for the conditions used chemical water quality and
ecological status. So we know the exact time and place of
chlorophyll can help to understand the water quality and will be
useful for water management [3] .
* Corresponding author
Satellite sensors can be used as a convenient tool to evaluate
some parameters of water quality parameters that affect its
reflectance spectrum, because they produce comprehensive maps
from the area. Bio-optical algorithms have been developed to
recover chla to describe radiance measurements of ocean. Water-
leaving radianceat different wavelengths are converted to
reflection and then are used in various algorithms.
For waters with high concentrations of phytoplankton
populations, algorithm based on the red and near-infrared bands
for retrieval chla concentrations are more effective [4] .
Experimental algorithms that use the band ratio blue-green are
designed for open water ocean (Case 1) and this algorithms is
often designed for coastal waters, as the second type water (Case
2), where other optical components except phytoplankton such as
the suspended sediments and that non-correlation with
phytoplankton, are also present, do not performance[4].
The reflection of the suspended sediments increases in near-
infrared band, so simple band ratio algorithms cannot discern
The International Archives of the Photogrammetry, Remote Sensing and Spatial Information Sciences, Volume XLI-B8, 2016 XXIII ISPRS Congress, 12–19 July 2016, Prague, Czech Republic
This contribution has been peer-reviewed. doi:10.5194/isprsarchives-XLI-B8-1161-2016
1161
high chla concentration and high sediment concentrations. In
these cases, algorithms based on the ratio of red and near-infrared
bands are most successful in predicting the concentration chla[5].
Activity ocean color studies began (1970) with sensor CZCS and
expanded with sensors such as MODIS, SeaWIFS.
Chengfeng Le et al in 2013, the use of algorithms, dual-band, tri-
band and quad-band (described in detail in the second part) in
Florida using field data nine ship during 1998 to 2010 with
MODIS and MERIS satellite data and concluded that the
algorithms used in areas with chlorophyll concentrations greater
than 4 mgm-3 with a relative error of less than 30% is offered
promising results [5] .
Vasily et al in 2014, study the concentration of chlorophyll in the
Gulf of Finland and Using algorithms OC3 and OC4 using
MODIS satellite data and field data for the years 2012 and 2013
and Since the two algorithms overstate the estimate the
concentrations of chla they have developed a new algorithm for
the area that have good compatibility with field data [6] .
Sun et al in 2014, assessment the dual-band and tri-band and
quad-band algorithms in the mouth of two rivers in America
using field data and MODIS data and concluded that the two band
algorithm had better performance than three band and four band
algorithms [3] .
Tebbs et al in 2013, study the using Landsat+ ETM data linear
relationship between chlorophyll concentration and remote
sensing reflectance (Rrs) at a wavelength of 835 nm, and tested
the relationship between chlorophyll concentration and the ratio
of two wavelength band between 835 and 660 and found that the
algorithms based on the ratio of red and near-infrared bands are
most successful in predicting chlorophyll concentration [4].
According to the literature in the field, extracting physical
parameters color of the sea, especially its concentration (chla)
and studies, shows the low number of methods for second type
of water (coastal waters). However, with the launch of a new
satellite optics with high spatial and spectral resolution is
possible that this could be the physical parameters of sea and
ocean in areas close to the coast to be modeled using this data. In this paper, Landsat 8 data with spatial resolution much better
than previous ocean color sensors to determine the amount of
chlorophyll in coastal areas and compare the results with
chlorophyll concentrations provided by the sensors with spatial
resolution medium and low.
2. OCEAN COLOR ALGORITHMS
In this section, different bio-optical OC algorithms for retrieving
chla and explaining ocean radiance measurements have been
discussed. Also, in this section formulation of OC algorithms for
calculating the chlorophyll are introduced.
2.1 Simple band ratio algorithms (OCx algorithms)
Simple band ratio algorithms are based on empirical regression
between blue and green bands and chla. The correlation between
the ratio of blue to green and chla is discussed in this kind of
algorithms. The algorithms provide valuable results for open
ocean waters that they are simple optically. This algorithm is
often in the form of Eq 1.
(1) c=𝟏𝟎∑ 𝐚𝐢𝐱𝐢𝐧
𝐢=𝟎 , x=𝐑𝐫𝐬(𝛌 𝐛𝐥𝐮𝐞)
𝐑𝐫𝐬(𝛌𝐠𝐫𝐞𝐞𝐧)
Here C represents the concentration of chlorophyll and the Rrs is
reflection remote sensing in wavelength λ [4] .
2.2 The algorithm based on the band ratio of RED and NIR
In this algorithm, the ratio of red to near-infrared band used to
extract the correlation chla in three modes (two, three and four
bands) [5].
2.2.1 Two-band approach
This algorithm is based on the principle that it is positioning the
red band (λ1) located in the vicinity of the maximum absorption
chla while the near-infrared band (λ2) in a region that is absorbed
by pigments of phytoplankton. Also, soluble colored organic
matter (CDOM) is lowest, and dual-band index is an indicator of
chla in some areas [5]. This algorithm is often in the form of Eq
2. (2) C=axb, x=Rrs(λ2)×Rrs(λ1)
-1
Where C represents the concentration of chlorophyll, a and b are
constants that must estimate and Rrs is reflection remote sensing.
2.2.2 Three-band approach This algorithm is based on three main assumptions: (1) CDOM
and detrital absorptions at λ2 are close to those at λ1; (2) Rrs(λ3)
is influenced by backscattering only, with minimal influence
from water constituent absorption; and (3) backscattering is
approximately equal at the three wavelengths. This algorithm has
been used successfully in several coastal water [5]. This
algorithm is often in the form of Eq 3. (3) c=aebx, x=[Rrs(λ1)
−1−Rrs(λ2)−1]×Rrs(λ3)
Where C represents the concentration of chlorophyll, a and b are
constants that must estimate and Rrs is reflection remote sensing.
2.2.3 The four-band approach
This algorithm is similar to the three-band but with an additional
band which is applied when absorbed water components λ3
negligible enough not. According to the form algorithm requires
two additional assumptions:
1) CDOM and detrital absorptions at λ2 are close to those at
λ1 and the same is true for λ4 and λ3.
2) backscattering is independent of wavelength[5].
This algorithm is often in the form of Eq 4.
(4) c=ax+b,
x=[Rrs(λ1)−1−Rrs(λ2)−
1]×[Rrs(λ4)−1−Rrs(λ3)−
1]−1 Where C represents the concentration of chlorophyll, a and b are
constants that must estimate and Rrs is reflection remote
sensing [4] .
3. STUDY AREA AND DATA SETS
This section have paid to study area and satellite images data sets
used to estimate the chlorophyll concentration using different OC
algorithms. 3.1 Image data sets
Landsat 8 satellite was launched in 2013 and it continually has
been prepared and made available two sensor data, including
Operational Land Imager (OLI) and the Thermal Infrared Sensor
(TIRS). This two sensors collect image data respectively for the
nine-band and dual-band wavelength in the range of 433-2300
nm long wavelength thermal. OLI has two new bands in addition
to the legacy Landsat bands (1-5, 7, and Pan). Two other band,
the Blue Coast band (433-453 nm) and Cirrus band (1360-1390
nm) short wave infrared can measure water quality and provides
high thin clouds [7] . Since OLI sensor on Landsat 8 compared with other sensors that
have been assigned to study OC is much better spatial resolution,
it can accurately determine the changes of the OC. Landsat 8
satellite images used and downloaded in this article from the site
[8]. The date of incorporated images are October 25, 2014,
November 10, 2014, and December 3, 2014. Also, to evaluate the
The International Archives of the Photogrammetry, Remote Sensing and Spatial Information Sciences, Volume XLI-B8, 2016 XXIII ISPRS Congress, 12–19 July 2016, Prague, Czech Republic
This contribution has been peer-reviewed. doi:10.5194/isprsarchives-XLI-B8-1161-2016
1162

results, the level 2 data set of MODIS sensor on the Aqua satellite
with different spatial resolution is used and download from [9].
3.2 Study area
Study area includes the Persian Gulf and Hormuz Strait, which is
located in the North West Indian Ocean. Persian Gulf is a
shallow, semi-enclosed waters with an average depth of 36 m and
maximum depth of between 90 and 800 meters in the northeast
and is located within Iranian waters, its maximum depth is in the
Hormuz Strait [11] . This paper will focus on the northern part of
the Persian Gulf Iran (Figure 1).
Figure 1. The Persian Gulf region and the study area
4. PROPOSED METHOD
Figure 2 shows the different stages of the proposed algorithm.
Figure 2. Different stages of selecting the best algorithm
Data of Landsat 8 were downloaded and processed using ENVI
5.1 software. Also, atmospheric correction is performed by
FLAASH for each image data set. The output of this stage Rrs
corrected for each pixel in bands 1 to 7, which it values is applied
at each of the algorithms in this paper (i.e. OC2, OC3, OC4, two-
band approach and three-band approach algorithms). The estimated coefficients for each algorithm are performed
using least square method. The output and performance result of
each algorithm evaluated using statistical values of RMSE and
R2. Finally, the most appropriate algorithm will be selected (with
regard to errors). 5. EXPERIMENT AND RESULTS
The statistical parameters and criteria is used to evaluate the
performance of different OC algorithms, including RMSE and R2
is based on the results of these parameters, selection of the most
appropriate algorithm is possible. The brief implemented OC
algorithms that are incorporated in this study is illustrated in
Table 1.
Table 1. Different OC algorithm customized in this study. Ocean Color Algorithm (OCA) By
𝑐ℎ𝑙𝑎 = 𝑎𝑥𝑏 , 𝑥 = 𝑅𝑟𝑠(λ2)/𝑅𝑟𝑠(λ1) [4] 𝑐ℎ𝑙𝑎 = 𝑎𝑥𝑏, 𝑥 = [𝑅𝑟𝑠(λ1)−1 − 𝑅𝑟𝑠(λ2)−1] × 𝑅𝑟𝑠(λ3) [4]
𝑐ℎ𝑙𝑎 = 𝑎𝑥 + 𝑏, 𝑥 = [𝑅𝑟𝑠(λ1)−1 − 𝑅𝑟𝑠(λ2)−1]/[𝑅𝑟𝑠(λ4)−1
− 𝑅𝑟𝑠(λ3)−1] [4]
𝑐ℎ𝑙𝑎 = 10(𝑎0+𝑎1𝑥+𝑎2𝑥2+𝑎3𝑥3+𝑎4𝑥4)
𝑥 = log10{[𝑅𝑟𝑠(λ1) > 𝑅𝑟𝑠(λ2)]/𝑅𝑟𝑠(λ3)}
[8], [9,
p. 4]
Table 2 shows the results and performances provided by these
different OC algorithms. The residuals and remaining charts for
each algorithm is showed in Figure 3. By comparing the
statistical parameters form Table 2, it is clear that two band and
three band algorithms have the lowest performance. Also,
performance of the OC2, OC3 and OC4 algorithms have good
degree of consistency comparing to other algorithms. As it is
clear from Table 2, OC2 and OC3 number of observations and
inputs more than others methods and this is related to the
equation of each algorithm. For avoiding zero values, the
denominator or the fraction of the infinite many two band and
three band observations, is not used in computations. The
residuals and remains graph are showed in Figure 3 for better
understanding of utilized OC algorithms. The remaining graph
two-band and three-band algorithms are sparse while the
remaining graph of OC4 and OC2 and OC3 algorithms are
concentrated around the zero point.
Table 2. Estimated RMSE and R2 values for different
algorithms and related coefficient. three
band two band Oc4 Oc3 Oc2
b1
0.33387
b2
-0.0044
b1
1.5329
b2
-0.03631
b1
-0.54731
b2
-3.8617
b3
-6.4984
b4
-4.1701
b5
-0.90566
b1
0.30354
b2
0.4481
b3
-28.909
b4
-154.47
b5
-207.77
b1
0.29201
b2
1.9985
b3
1.7639
b4
-6.2326 esti
mat
ed c
oef
fici
ents
32923 32952 46665 62353 62997 # inputs
0.398 0.529 0.103 0.0776 0.096 RMSE
0.0109 0.0045 0.533 0.712 0.558 R2
Two band OC2
OC4 OC3
Figure 3. The remaining
graph of different
algorithms.
Three band
Atmospheric
corrections
Radiometric
corrections
Sensor selection and preparation of image data sets
Data preprocessing (using ENVI 5.1)
Incorporating different algorithms for determining the
concentration of chlorophyll
Evaluation of results
Map generation of the Chlorophyll concentration
Calculating
reflection
remote sensing
The International Archives of the Photogrammetry, Remote Sensing and Spatial Information Sciences, Volume XLI-B8, 2016 XXIII ISPRS Congress, 12–19 July 2016, Prague, Czech Republic
This contribution has been peer-reviewed. doi:10.5194/isprsarchives-XLI-B8-1161-2016
1163
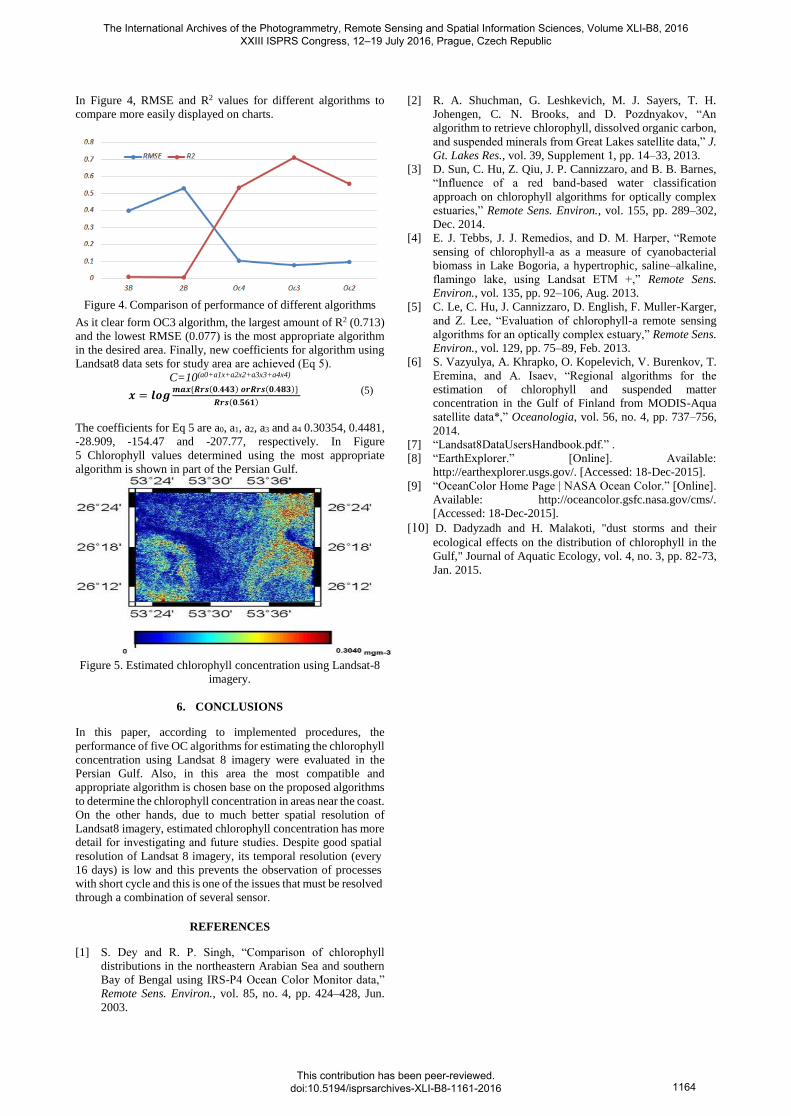
In Figure 4, RMSE and R2 values for different algorithms to
compare more easily displayed on charts.
Figure 4. Comparison of performance of different algorithms
As it clear form OC3 algorithm, the largest amount of R2 (0.713)
and the lowest RMSE (0.077) is the most appropriate algorithm
in the desired area. Finally, new coefficients for algorithm using
Landsat8 data sets for study area are achieved (Eq 5).
C=10(a0+a1x+a2x2+a3x3+a4x4) (5) 𝒙 = 𝒍𝒐𝒈
𝒎𝒂𝒙 {𝑹𝒓𝒔(𝟎.𝟒𝟒𝟑) 𝒐𝒓𝑹𝒓𝒔(𝟎.𝟒𝟖𝟑)}
𝑹𝒓𝒔(𝟎.𝟓𝟔𝟏)
The coefficients for Eq 5 are a0, a1, a2, a3 and a4 0.30354, 0.4481,
-28.909, -154.47 and -207.77, respectively. In Figure
5 Chlorophyll values determined using the most appropriate
algorithm is shown in part of the Persian Gulf.
Figure 5. Estimated chlorophyll concentration using Landsat-8
imagery.
6. CONCLUSIONS
In this paper, according to implemented procedures, the
performance of five OC algorithms for estimating the chlorophyll
concentration using Landsat 8 imagery were evaluated in the
Persian Gulf. Also, in this area the most compatible and
appropriate algorithm is chosen base on the proposed algorithms
to determine the chlorophyll concentration in areas near the coast.
On the other hands, due to much better spatial resolution of
Landsat8 imagery, estimated chlorophyll concentration has more
detail for investigating and future studies spatial good Despite .
every ( temporal resolution sit8 imagery, Landsatof resolution
processes observation of prevents the this and low is16 days)
be resolved must of the issues that and this is one cycle short with
.sensor several through a combination of
REFERENCES
[1] S. Dey and R. P. Singh, “Comparison of chlorophyll
distributions in the northeastern Arabian Sea and southern
Bay of Bengal using IRS-P4 Ocean Color Monitor data,”
Remote Sens. Environ., vol. 85, no. 4, pp. 424–428, Jun.
2003.
[2] R. A. Shuchman, G. Leshkevich, M. J. Sayers, T. H.
Johengen, C. N. Brooks, and D. Pozdnyakov, “An
algorithm to retrieve chlorophyll, dissolved organic carbon,
and suspended minerals from Great Lakes satellite data,” J.
Gt. Lakes Res., vol. 39, Supplement 1, pp. 14–33, 2013.
[3] D. Sun, C. Hu, Z. Qiu, J. P. Cannizzaro, and B. B. Barnes,
“Influence of a red band-based water classification
approach on chlorophyll algorithms for optically complex
estuaries,” Remote Sens. Environ., vol. 155, pp. 289–302,
Dec. 2014.
[4] E. J. Tebbs, J. J. Remedios, and D. M. Harper, “Remote
sensing of chlorophyll-a as a measure of cyanobacterial
biomass in Lake Bogoria, a hypertrophic, saline–alkaline,
flamingo lake, using Landsat ETM +,” Remote Sens.
Environ., vol. 135, pp. 92–106, Aug. 2013.
[5] C. Le, C. Hu, J. Cannizzaro, D. English, F. Muller-Karger,
and Z. Lee, “Evaluation of chlorophyll-a remote sensing
algorithms for an optically complex estuary,” Remote Sens.
Environ., vol. 129, pp. 75–89, Feb. 2013.
[6] S. Vazyulya, A. Khrapko, O. Kopelevich, V. Burenkov, T.
Eremina, and A. Isaev, “Regional algorithms for the
estimation of chlorophyll and suspended matter
concentration in the Gulf of Finland from MODIS-Aqua
satellite data*,” Oceanologia, vol. 56, no. 4, pp. 737–756,
2014.
[7] “Landsat8DataUsersHandbook.pdf.” .
[8] “EarthExplorer.” [Online]. Available:
http://earthexplorer.usgs.gov/. [Accessed: 18-Dec-2015].
[9] “OceanColor Home Page | NASA Ocean Color.” [Online].
Available: http://oceancolor.gsfc.nasa.gov/cms/.
[Accessed: 18-Dec-2015]. [11] D. Dadyzadh and H. Malakoti, "dust storms and their
ecological effects on the distribution of chlorophyll in the
Gulf," Journal of Aquatic Ecology, vol. 4, no. 3, pp. 82-73,
Jan. 2015.
The International Archives of the Photogrammetry, Remote Sensing and Spatial Information Sciences, Volume XLI-B8, 2016 XXIII ISPRS Congress, 12–19 July 2016, Prague, Czech Republic
This contribution has been peer-reviewed. doi:10.5194/isprsarchives-XLI-B8-1161-2016
1164