using landsat 7 imagery to map invasive redd canary...
TRANSCRIPT
USING LANDSAT 7 IMAGERY TO MAP INVASIVE
REED CANARY GRASS (Phalaris arundinacea):
A Landscape Level Wetland Monitoring Methodology
Final Report to the U.S. Environmental Protection Agency
Region V
Thomas W. Bernthaland
Kevin G. WillisMARCH 2004
The Wisconsin Department of Natural Resources developed this documentunder Grant No. CD-975115-01-0 from the U.S. Environmental ProtectionAgency, Region 5.
The Wisconsin Department of Natural Resources provides equal opportunity in its employ-ment, programs, services, and functions under an Affirmative Action Plan. If youhave any questions, please write to Equal Opportunity Office, Department ofInterior, Washington, D.C. 20240.
This publication is available in alternative format (large print, Braille, audio tape. etc.) uponrequest. Please call (608) 266-0531 for more information.
USING LADNSAT 7 IMAGERY TO MAPINVASIVE REED CANARY GRASS
(PHALARIS ARUNDINACEA):A LANDSCAPE LEVEL WETLAND MONITORING
METHODOLOGY
Final Report to U.S. EPA – Region VWetland grant #CD975115-01-0
March 2004
Authors:Thomas W. Bernthal and Kevin G. WillisBureau of Fisheries Management and Habitat ProtectionWisconsin Department of Natural Resources
Editor:Dreux J. WatermolenBureau of Integrated Science ServicesWisconsin Department of Natural Resources
Cover Design:Michelle E. VossBureau of Integrated Science ServicesWisconsin Department of Natural Resources
This remote sensing project was carried out in cooperation with the University ofWisconsin’s Environmental Remote Sensing Center, a Regional Earth ScienceApplications Center (RESAC).
Contact for Further Information
Thomas W. BernthalBureau of Fisheries Management and Habitat ProtectionWisconsin Department of Natural Resources101 S. Webster StreetP.O. Box 7921Madison, WI 53707-7921
(608) 266-3033thom [email protected]
This report was prepared by the Wisconsin Department of Natural Resources under GrantNo. CD975115-01-0 from the U.S. Environmental Protection Agency, Region 5. Pointsof view expressed in this report do not necessarily reflect the views or policies of the U.S.Environmental Protection Agency. Mention of trade names and commercial productsdoes not constitute endorsement of their use.
Reed Canary Grass Monitoring
- 1
Contents
1. Executive Summary 3
2. Introduction 52.1 Concept and Importance of Wetland Biological Integrity2.2 Level 1, 2, 3 Approach to Wetland Assessment and Monitoring2.3 Mapping Invasive Species Dominance as a Landscape Level Indicator of Wetland
Plant Community Integrity
3. Project Goals and Objectives 9
4. Developing the Classification 114.1 Methods
4.1.1 Selecting the Remote Sensing Data Source - Landsat-7 (etm+)4.1.2 Setting Mapping Objectives4.1.3 Fieldwork and Computing Procedures
4.2 Results and Discussion4.2.1 The Classification4.2.2 Accuracy of the Classification4.2.3 Limitations of the Classification Methodology4.2.4 Cost Considerations
4.3 Conclusions4.4 Recommendations for Future Classification Efforts
4.4.1 Expand to Other Areas of the State4.4.2 Explore the Use of Higher Resolution Data Sources4.4.3 Explore the Feasibility of Mapping Additional Invasive Species
5. Analyzing Landscape Factors Associated with Reed Canary Grass 23Dominance
5.1 Methods5.1.1 Data Sources for Sampling the Pilot Area5.1.2 Overlay and Regression Analysis
5.2 Results and Discussion5.2.1 Ecological Significance of Reed Canary Grass at the Landscape Level5.2.2 Wetland Plant Cover Type and Hydrologic Type5.2.3 Spatial Distribution of Reed Canary Grass Dominated Wetlands5.2.4 Relationship of Reed Canary Grass Dominated Wetlands with Land Cover
Types5.3 Conclusions5.4 Some Recommendations for Further Analysis of Landscape Factors Associated with
Reed Canary Grass Dominance5.4.1 Identify Soil Characteristics Associated with Reed Canary Grass
Domination5.4.2 Examine the Relationship of Reed Canary Grass Domination to Drainage
Ditch Density5.4.3 Employ a Stratified Random Sampling Methodology
Contents continue on next page.
Bernthal and Willis
2 -
6. Using Classification Results for Condition Reporting and Wetland 43Management
7. Summary 51
8. Literature Cited 53
AppendixesAppendix A. Remote Sensing Satellites and Their Specifications 57Appendix B. Wetland Richness and Reed Canary Grass Dominance by Basin 59
and Watershed: Tabular FormAppendix C. Wetland Richness and Reed Canary Grass Dominance by Basin 63
and Watershed: Bar GraphsAppendix D. Wetland Richness and Reed Canary Dominance by Land Type 69
Association: Tabular Form
Tables1. Error Matrix 172. Reed Canary Grass Domination of Wetland Types 323. Linear Regression of Reed Canary Grass Domination vs. Land Cover 37
Types by Watershed and by Land Type Association4. Watersheds of the Upper Rock River Basin: Wetland Richness and Reed 47
Canary Grass Dominance5. Wetland Cover Type in Watersheds of the Upper Rock River Basin 48
Figures1. Percent of Wetland Area Heavily Dominated by Reed Canary Grass, 33
Tabulated by Watershed2. Percent of Wetland Area Heavily Dominated by Reed Canary Grass, 35
Tabulated by Land Type Association3. Linear Regressions for Percent of Wetland Heavily Dominated by Reed 38
Canary Grass vs. Percent Agriculture5. Percent Wetlands Dominated by Reed Canary Grass in Each Watershed 45
and Wetland Richness in Each Watershed
Maps1. Extent of Landsat 7 Scene and Study Area with Wisconsin Counties 132. Wetlands of the Study Area and Ground Truth Sites 163. Geographical Management Units (GMUs) and Study Area 244. Watersheds of the Study Area 265. NHFEU Subsections and Land Type Associations (LTAs) within the Study 28
Area6. Percent of Wetlands Heavily Dominated by Reed Canary Grass in Each 34
Watershed7. Percent of Wetlands Heavily Dominated by Reed Canary Grass in Each 36
Land Type Association (LTA)8. Extent of Wetlands in Each Watershed 46
Reed Canary Grass Monitoring
- 3
Executive Summary
The Wisconsin Department of Natural Resources (Wisconsin DNR) is developing awetland monitoring program to assess the biotic condition of wetlands in Wisconsin,using a suite of complementary assessment tools at both the site-specific and landscapescale. This report describes the development of a landscape scale method to assess plantcommunity integrity at a coarse level based on using remote sensing data to map theextent and cover of reed canary grass, Phalaris arundinacea, an invasive species inwetlands.
We chose reed canary grass because it has been documented in previous research as anecologically significant indicator of wetland plant community integrity and is recognizedby professionals as the most widespread and problematic invasive plant in Wisconsinwetlands (Reinartz 2003). Its widespread nature and unique spectral signature in fall dueto its comparatively later senescence make it feasible to map reed canary grass usingspectral classification of satellite imagery. We searched for a remote data source anddeveloped a classification protocol that is relatively inexpensive and feasible to extendover large areas of Wisconsin, while yielding data with acceptable reliability and scale.
We used relatively inexpensive imagery from the National Aeronautic and SpaceAdministration (NASA) Landsat–7 satellite taken with the enhanced thematic plus (etm+)sensor from one date, October 15, 1999, with a 30-meter pixel resolution. Landsat-5imagery is also an acceptable data source for our protocol. We used one 180 km by 180km Landsat scene covering much of southern Wisconsin as our pilot area. Using acombination of unsupervised and supervised classification procedures, we succeeded inidentifying areas of wetland as small as 0.5 acre, that are heavily dominated by reedcanary grass (defined as >80% cover), with accuracy acceptable for further visual,statistical, and geographical analysis. Ground-truthing of 249 plots revealed 86%accuracy for our classification of the "heavily dominated" category. Classification offorested, shrub, and open water wetlands was less than satisfactory, due to the spectralinfluences of woody vegetation and open water. Our protocol, therefore, should beconsidered highly reliable only for assessing reed canary grass dominance in opencanopy, emergent wetlands, a significant cover class in southern Wisconsin wetlands thatmakes up about 500,000 acres (63%) of the wetlands in the pilot area.
The results document the dramatic impact of reed canary grass invasion on wetland plantcommunities in emergent, open canopy wetlands. Of the 737,454 total acres of wetlandsanalyzed, 79,490 acres (11%) are heavily dominated by reed canary grass to the extent ofbecoming almost pure monocultures. We classified another 23,378 acres (3%) of thewetlands as co-dominated by reed canary grass (defined as 50-79% reed canary grasscover), though the accuracy of this class is limited. Taken together, 102,868 acres ofwetland in the study area have been significantly impacted by reed canary grass.
Analyzing our reed canary grass dominance data with other coarse land cover data bywatersheds and by Land Type Associations, an ecological classification unit, we foundagricultural cropland was the land cover type most strongly correlated with reed canary
Bernthal and Willis
4 -
grass dominance of wetlands. The percent of wetlands dominated by reed canary grasswithin sampled watersheds ranged from a high of 40.7% to a low of 0.2%, indicating thata broad range of conditions relative to reed canary grass exists. The protocol isrecommended for further use in Wisconsin for watershed level assessments of wetlandcondition, as well as for restoration planning and management. We present maps of thepilot area and tables demonstrating how classification information can be used forwatershed level wetlands assessment.
We can further analyze this reed canary grass inventory by other ecological, hydrological,land use or political subdivisions of interest. For example, further work should analyzesoil type, drainage intensity, and measures of sediment delivery to wetlands to furtherdefine the relationship between stressors and reed canary grass invasion.
Reed Canary Grass Monitoring
- 5
2. Introduction
2.1 Concept and Importance of Wetland Biological Integrity
Government wetland programs are being asked more and more to document "losses" and"gains" of wetlands. An important component of such questions is the overall biotichealth of the wetland resources of the state, or of a specific geographic area. Merelycounting acres of wetland filled or restored fails to provide an adequate picture as to thebiological condition of wetlands in Wisconsin.
At the national level, the U.S. Environmental Protection Agency (U.S. EPA) hasrecognized the gap in methods for assessing the biological condition of wetlands todetermine whether Clean Water Act goals are being met. The agency has identified thedevelopment of wetland assessment protocols that result in a direct measure of thecondition or biological integrity of wetlands and that quickly screen for signs ofimpairment as a key to assessing wetland condition for Clean Water Act purposes.
A principal goal of the Clean Water Act is to maintain and restore the physical, chemical,and biological integrity of the waters of the United States (33 U.S.C. §1251(a)). Section305(b) of the Clean Water Act requires states to monitor and report on the condition oftheir waters, including the maintenance of biological integrity. Biological integrity hasbeen defined as “… the capability of supporting and maintaining a balanced, integrated,adaptive community of organisms having a species composition, diversity, and functionalorganization comparable to that of natural habitat of the region” (Karr and Dudley 1981).Wetland biological integrity, or condition, can be translated to the layperson as "wetlandhealth." The concept of ecological integrity and ecosystem health has been described inthe following way.
“A biological system is healthy and has ecological integrity when itsinherent potential is realized, its condition is ‘stable,’ its capacity for self-repairis maintained, and external support for maintenance is minimal. Integrity impliesan unimpaired condition or quality or state of being undivided.” (Karr 1993)
The Wisconsin Department of Natural Resources (Wisconsin DNR) Wetland Team hascommitted to developing an assessment and monitoring program to assess the biologicalintegrity, or condition, of wetlands in Wisconsin (Wisconsin DNR Wetland Team 2000,
This study builds upon the recommendations of a study funded under a previous U.S. EPA WetlandGrant (#CD985491-01-0) for developing a wetland monitoring program. That study recommended thedevelopment of a suite of wetland assessment methods that work at a variety of scales (Bernthal 2001).The reed canary grass, Phalaris arundinacea, classification methodology and its application as alandscape level condition metric, described here, is one of three lines of methodology developmentfunded under U.S. EPA Wetland Grant #CD97511501-0. Two other complementary methodsdeveloped under this U.S. EPA grant are summarized in separate publications: Refinement andExpansion of Biological Indices for Wisconsin Wetlands (Lillie, et al. 2002) and Development of aFloristic Quality Assessment Methodology for Wisconsin (Bernthal 2003)
Bernthal and Willis
6 -
Bernthal 2001). Assessing the ecological integrity of a wetland overlaps, but alsocontrasts, with the broader assessment of “functions and values” or “functional values”that is conducted for impact assessment, typically in a regulatory context. The uses forcondition assessment are planning for the preservation, management, and restoration ofwetlands, development and refinement of wetland water quality standards, and periodicreporting on wetland condition to the public as required under Section 305(b) of theClean Water Act.
2.2 Level 1, 2, 3 Approach to Wetland Assessment and Monitoring
U.S. EPA’s National Wetlands Monitoring Workgroup has been developing a frameworkfor wetland monitoring program development that meets the mandate of the Clean WaterAct to report on the biological integrity of the waters of the nation (U.S. EPA 2002, indraft). The workgroup has endorsed the concept of a Level 1, 2, 3 approach to monitoringas outlined by Brooks, et al. (1996). This approach maximizes efficient use of scarceresources for wetland monitoring, while gathering scientifically valid information thataddresses the needs of managers. Level 1, “landscape assessment,” relies on coarse,landscape scale inventory information, typically gathered through remote sensing andpreferably stored in, or convertible to, a geographic information system (GIS) format.Level 2 is “rapid assessment” at the specific wetland site scale, using relatively simple,rapid protocols. Level 2 assessment protocols are to be validated by and calibrated toLevel 3 assessments. Level 3, “intensive site assessment,” uses intensive ecologicalevaluation methodologies, particularly research-derived, multi-metric indices ofbiological integrity. The Wisconsin DNR Wetland Team is pursuing the development ofa wetland assessment and monitoring program following the general Level 1, 2, 3approach endorsed by the U.S. EPA workgroup. The strategy is to developcomplementary wetland condition assessment tools that can be used across the broadspectrum of wetland types at both the site-specific and landscape scales.
One component of the Wisconsin DNR strategy is the development of biotic integrityindices for wetlands. A set of wetland biotic indices for depressional, palustrine wetlandshas been developed as a Level 3 method. The Wisconsin depressional wetland biologicalindices (WDWBI) are intended to provide strongly defensible site-specific assessmentsfor regulatory decision-making, using multiple indices based on plants, macro-invertebrates, amphibians, zooplankton, and diatoms (Lillie 2000, Lillie, et al. 2002). TheWDWBI will also be a tool for the long-term monitoring of ecological integrity onspecific depressional, seasonal and semi-permanent wetlands, and a research tool foridentifying land use conditions that impact the ecological integrity of these wetlands. TheWisconsin DNR has also developed another Level 3 site assessment method for plantcommunity integrity. The Wisconsin Floristic Quality Assessment method is anadaptation of floristic quality assessment methods to Wisconsin, allowing the observer toassess the aggregate conservatism and species richness of vascular plants on a site(Bernthal 2003).
Reed Canary Grass Monitoring
- 7
Significant time and budget constraints limit the feasibility of applying these Level 3,site-specific methods to carry out regional scale wetland assessments. A landscape scalemethod is needed to interpret periodically collected and readily available remotely senseddata for both initial wetland condition assessment and trends monitoring on a watershedscale. This reed canary grass mapping project was conceived to meet that need.
2.3 Mapping Invasive Species Dominance as a Landscape LevelIndicator of Wetland Plant Community Integrity
Two aspects of wetland health are the "naturalness" of the wetland plant communitycompared to undisturbed wetlands of similar type and the level of human disturbancewithin or in proximity to the wetland. In urban and urbanizing areas of Wisconsin,increasingly large areas of impervious surface have led to increased runoff of pollutedstormwater into wetlands and reduced amounts of water that infiltrate to supportgroundwater-fed wetlands. Increasing groundwater withdrawal has also reduced theamount of groundwater available to support wetland hydrology and shifted the waterbalance of wetlands toward surface water influence. In agricultural areas, draining,ditching, and tiling of wetlands for conversion to agricultural uses have eliminatedwetlands or severely altered their hydrology. Remaining wetlands adjacent to intensiveagricultural use are subject to increased sediment and nutrient delivery. One result ofthese stresses is a severe reduction in plant diversity and simplification of structure, asspecies rich assemblages are invaded by highly aggressive species such as reed canarygrass, (Phalaris arundinacea), purple loosestrife (Lythrum salicaria), glossy buckthorn(Rhamnus frangula), hybrid cattail (Typha x glauca), and common reed (Phragmitesaustralis). The result is often monotypic or nearly monotypic stands of these invasivespecies.
Previous research conducted to develop vegetative biological integrity metrics forisolated depressional wetlands in Wisconsin demonstrated a strong positive correlationbetween reed canary grass cover and independent measures of disturbance (Lillie 2000,Lillie, et al. 2002). The importance value of reed canary grass was tested and adopted as ametric in the vegetation index of the Wisconsin Depressional Wetland Biological Indices.
Dominance by invasive species makes a good indicator of wetland condition because itintegrates a variety of disturbance factors such as hydrologic alteration, and sediment andnutrient delivery. The density and extent of invasive species occurrences can provide ameaningful indicator of wetland biological integrity because heavy invasion is known todegrade natural communities by reducing native species richness (Galatowitsch, et al.1999, Werner and Zedler 2002). Although reed canary grass is well recognized by manywetland professionals as the invasive species with the largest extent and impact onwetlands (Reinartz 2003), mapping its effect at a statewide or regional level by use offield surveys would likely be cost-prohibitive. Reliable, quality controlled, satelliteimagery is periodically collected by NASA and is relatively inexpensive. We believe itcould be a feasible data source for periodic monitoring of reed canary grass domination
Bernthal and Willis
8 -
as an indicator of wetland condition, provided an accurate and cost effective means ofclassifying the data into meaningful, mapable categories could be developed.
The Wisconsin DNR Wetland Team chose to include development of the classificationand interpretation methods, in particular, because of their high potential for use in thedepartment's integrated planning process for geographic management units, based onriver basins. Especially for watershed-level planning, it is essential to analyzemultivariate factors and spatial relationships in order to improve the objectivity andefficiency of the planning process and produce a repeatable end product that is easy toexplain to decision-makers and the public.
Reed Canary Grass Monitoring
- 9
3. Project Goals and Objectives
Our goal was to develop a simple, feasible, and repeatable mapping methodology toassess wetland condition at the landscape level that will complement site-specificassessment methodologies. The method should allow us to document levels ofimpairment, in a form that is meaningful to the public, and can be used to establishrestoration, management, and protection goals. Reed canary grass, Phalaris arundinacea,was chosen as the indicator to map for two reasons. It is ecologically meaningful acrossthe state as an indicator of impairment, and we believed it would be feasible to measureand map cost-effectively, due to the characteristics of the plant.
The project goal was divided into three main objectives. The primary project objectivewas to develop a cost-effective methodology to document and map the extent of reedcanary grass dominance in wetlands, in a usable digital format (described in Section 4).The second objective was to analyze the resulting data, together with other landscapelevel data, to identify relationships between reed canary grass dominance and otherdisturbance factors (described in Section 5). The third objective was to lay out a templatefor reporting the results by watershed and basin that would be useful for 305(b) reportingand other planning and management needs (described in Section 6).

Bernthal and Willis
10 -
Reed Canary Grass Monitoring
- 11
4. Developing the Classification
To incorporate remote sensing data into a viable monitoring plan, it is first necessary toconvert the data to the kind of information required by the project goals and objectives.This conversion process, known as classification, narrows the widely varying spectralpatterns of image data into the discrete, usable categories of a map. The digital map canthen be used for analysis and planning.
We developed our classification procedure by first selecting a data source and clearlydefining our target categories, then implementing fieldwork protocols and computingprocedures. The computer work, although often referred to as “classification,” is only onepart of the process and would not be effective without the other supporting stages. Thissection outlines each of these stages in sequential fashion.
4.1 Methods
4.1.1 Selecting the Remote Sensing Data Source - Landsat-7 (etm+)
The first step in developing the classification was to select an appropriate satelliteplatform. With the project objectives and target class definitions properly refined, wewere able, throughout the spring of 2000, to explore the suitability of various satellitedata (see Appendix A). Conversations with staff at the UW-Madison EnvironmentalRemote Sensing Center allowed us to quickly determine an appropriate source. Afterreviewing the specifications, cost, and availability of data from several potentialsatellites, we determined image data from NASA’s Landsat-7 satellite to be mostappropriate for the classification objectives and larger project objectives. Thecharacteristics of Landsat-7 that supported this conclusion can be summarized as:
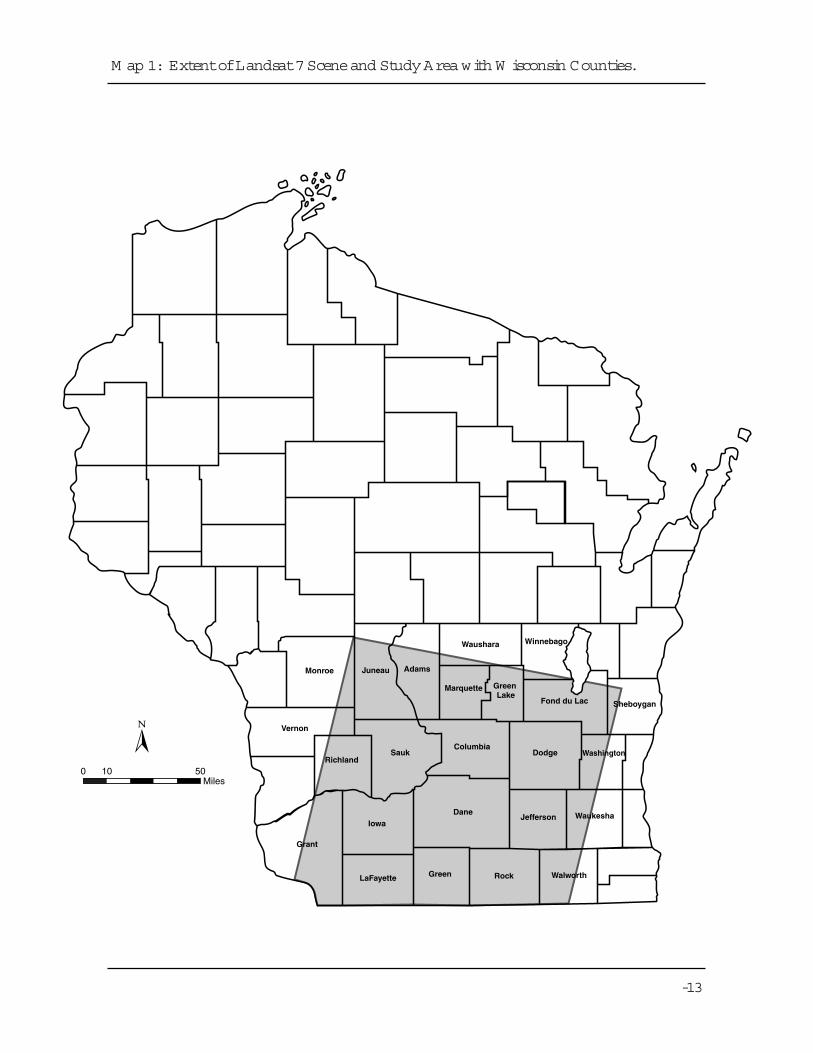
a) Extensive ground coverage by imagery (“scenes” comprise an area approximately180 km x 180 km, or 32,400 km2) would facilitate future statewide classification;full coverage of the state of Wisconsin would require only 11 such scenes.
b) Spatial resolution (30 m x 30 m pixel size) was anticipated to be adequate fordistinguishing the target, i.e. reed canary grass dominated wetlands.
c) Spectral resolution (represented by the number and range of discrete bands in theelectromagnetic spectrum) was sufficient for distinguishing reed canary grass.
d) Temporal resolution (repeat imagery available every 16 days, consistent with thesatellite fly-over schedule) was sufficient for detecting seasonal variations invegetation and would help ensure cloud-free coverage within a given season.
e) Data quality was previously assured by NASA; radiometric errors (artifacts due tosensor error) and geometric errors (displacement of features due to topography)were corrected for, and images were geo-referenced to the appropriate coordinatesystem of UTM zone 16 north.
f) The Landsat-7 platform had been used and proven effective by the WisconsinInitiative for Statewide Cooperation in Landscape Analysis and Data(WISCLAND) (Lillesand, et al. 1998), an earlier land cover project that includedour study area.

Bernthal and Willis
12 -
g) Data are very inexpensive, relative to other remote sensing sources; cost for asingle image for the project is $630 and includes only NASA’s recovery costs.
The Landsat-7 sensor, Enhanced Thematic Mapper Plus (etm+), provided time-seriesimagery for comparative viewing. We bounded our pilot area to coincide with theLandsat scene most convenient for fieldwork, and examined areas known to haveextensive reed canary grass invasion. In spring 2000, we reviewed imagery that would bethe most current for the purpose of classifying vegetation in our pilot area. From manyimages taken throughout the previous growing season, spring through fall of 1999, weselected data captured on October 15. Imagery from this date was cloud-free, anddisplayed the highest potential for our objectives. Our pilot area is shown in Map 1.
4.1.2 Setting Mapping Objectives
The initial phase of the project focused on setting objectives for the mapping of reedcanary grass. In light of the project goals, we created a classification scheme that wouldmost clearly represent reed canary grass, relative to other wetland vegetation. After anexperimental period of fieldwork and observation, we ascertained natural breakpoints inrelative plant cover in the herbaceous stratum that could also be distinguished in thesatellite imagery. Our observations led us to parse herbaceous plant canopy cover intothree discrete categories:
a) Areas of “heavy dominance” by reed canary grass, defined as having groundcoverage of 80% or greater reed canary grass.
b) Areas of “co-dominance” among reed canary grass and other plant species, with areed canary grass proportion of 50% to 79%.
c) Areas of “subdominance” or absence of reed canary grass, having a reed canarygrass proportion of less than 50%.
The primary objective was to be able to map wetland areas that are unquestionablydominated by reed canary grass, where the vegetation is essentially monocultural. Theability to make finer distinctions of the ecological significance of reed canary grass, incategories B and C, is limited. Category B, the co-dominant class, is a transitionalcategory. Category C, the subdominant class, serves as a catch-all that includes a range ofconditions from no reed canary grass influence to significant influence.
Waushara Winnebago
Fond du Lac
Adams
Marquette GreenLake
Juneau
Sheboygan
Dodge
Dane
LaFayette Green Rock
Jefferson
Walworth
Waukesha
WashingtonColumbia
SaukRichland
Grant
Iowa
Vernon
Monroe
Miles0 5010
M ap 1: ExtentofLandsat7Sceneand StudyAreawith W isconsin Counties.
-13
Bernthal and Willis
14 -
4.1.3 Fieldwork and Computing Procedures
An introductory synopsis is provided here to better frame the discussion of our fieldworkand computing techniques. Our efforts are described in more detail in the sections thatfollow.
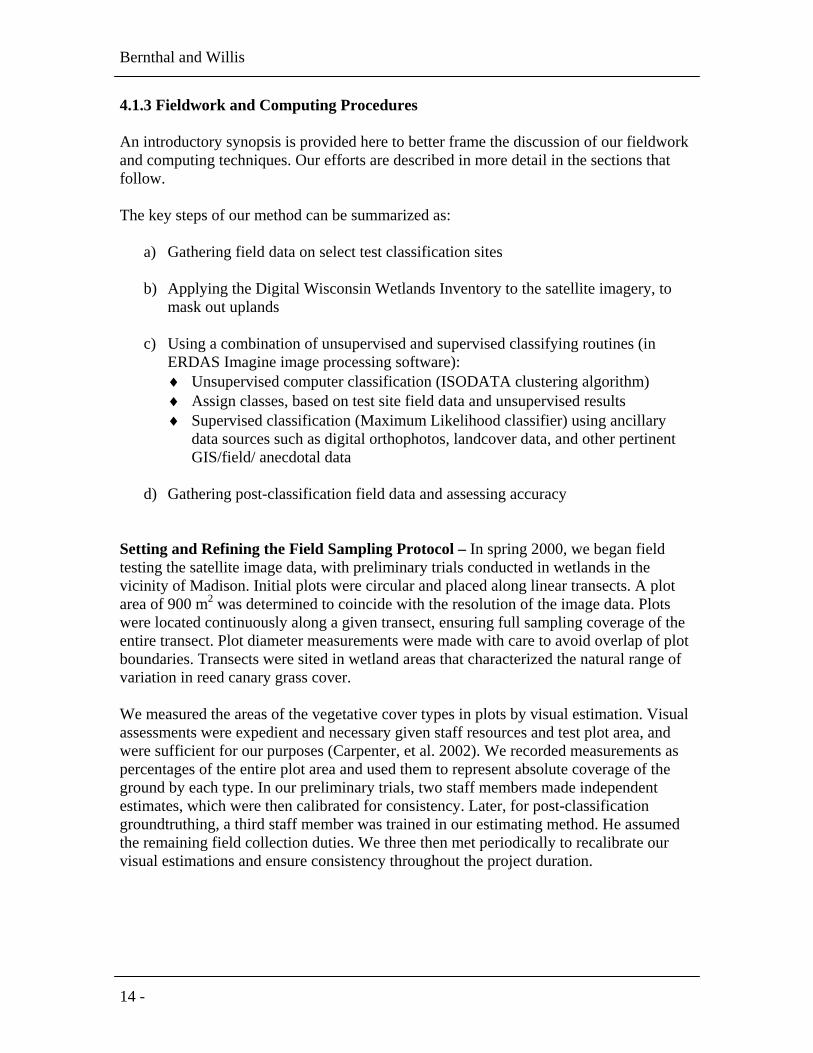
The key steps of our method can be summarized as:
a) Gathering field data on select test classification sites
b) Applying the Digital Wisconsin Wetlands Inventory to the satellite imagery, tomask out uplands
c) Using a combination of unsupervised and supervised classifying routines (inERDAS Imagine image processing software):
Unsupervised computer classification (ISODATA clustering algorithm)Assign classes, based on test site field data and unsupervised resultsSupervised classification (Maximum Likelihood classifier) using ancillarydata sources such as digital orthophotos, landcover data, and other pertinentGIS/field/ anecdotal data
d) Gathering post-classification field data and assessing accuracy
Setting and Refining the Field Sampling Protocol – In spring 2000, we began fieldtesting the satellite image data, with preliminary trials conducted in wetlands in thevicinity of Madison. Initial plots were circular and placed along linear transects. A plotarea of 900 m2 was determined to coincide with the resolution of the image data. Plotswere located continuously along a given transect, ensuring full sampling coverage of theentire transect. Plot diameter measurements were made with care to avoid overlap of plotboundaries. Transects were sited in wetland areas that characterized the natural range ofvariation in reed canary grass cover.
We measured the areas of the vegetative cover types in plots by visual estimation. Visualassessments were expedient and necessary given staff resources and test plot area, andwere sufficient for our purposes (Carpenter, et al. 2002). We recorded measurements aspercentages of the entire plot area and used them to represent absolute coverage of theground by each type. In our preliminary trials, two staff members made independentestimates, which were then calibrated for consistency. Later, for post-classificationgroundtruthing, a third staff member was trained in our estimating method. He assumedthe remaining field collection duties. We three then met periodically to recalibrate ourvisual estimations and ensure consistency throughout the project duration.
Reed Canary Grass Monitoring
- 15
After several initial field excursions and reviewing the satellite image data, wediscovered a difficulty in relating our field observations to the image data. The primaryproblem involved the field sampling design. First, collecting field data throughoutlengthy transects was very time consuming and unnecessarily redundant. A singletransect might require a half day or more to complete and neighboring plots often hadsimilar canopy covers. Although such a natural range of slight variations was helpfulduring the first phases of classification, most of the groundtruthing effort required greaterdistinction of cover types.
Second, although plot area was appropriate, the circular plot shape hindered verificationof the imagery. The discrepancies between our circular field data and the square pixelformat of the image data were significant. To reduce confusion, we changed our plotdesign to mimic the pixel shape of the imagery. Additionally, we abandoned the use oftransects in post-classification groundtruthing. We instead systematically selected sitesthat would rigorously test the image classification’s accuracy.
To organize and plan groundtruthing, we used a combination of ancillary spatial data.Sources included digital aerial orthophotographs and GIS vector layers, such ashydrography, resident at the Wisconsin DNR. We also collected our own location data toensure proper representation within groundtruth plots. Plot locations were set tocorrespond exactly to image pixels via a global positioning system (GPS). This extrameasure served to align closely field and image data and clarified the relationshipbetween actual ground conditions and the image representation. Still, because the rasterformat represents the world as a regular grid, some image pixels did not overlay properlyonto actual ground phenomena. To account for the discrepancy, we increased our plotsize from 900 m2 (a single 30 m square pixel) to 1800 m2 (two conjoined pixels). Thenew design yielded a more generalized area, sufficient to significantly reduce errorsrelated to rasterization. The new plot size of two pixels, then, was declared as ourminimum mapping unit (MMU). This area, equal to approximately one-half acre, is thesmallest object size observable with confidence.
Conducting the Classification – Guided both by project aims and the uniquecharacteristics of the data, we experimented with classification routines. Prior toclassification, applying a mask generated from the Wisconsin DNR’s digital wetlandsdata layer eliminated pixels that did not represent wetlands. Using ERDAS Imagine v8.4software, an unsupervised algorithm known as Iterative Self-Organizing Data AnalysisTechnique (ISODATA) produced the initial classification. From the continuous spectraof all pixels in the scene, clusters manifested and were assigned to preliminary classes.These classes formed the basis for further analysis in a “maximum likelihood” classifyingroutine to refine the analytical output (for discussion of ISODATA and maximumlikelihood algorithms, see Schrader and Pouncey 1997).
Dane
Sauk
Iowa
Rock
Dodge
Grant
Green
Juneau Adams
Lafayette
Jefferson
Richland
Marquette
Walworth
Green Lake
Waukesha
Washington
Monroe
Vernon
Waushara
Winnebago
Columbia
Fond du Lac
8
5 2
91
14
18
17
15
10
18
41
20
24
4
8
12
9
56
7
Ground Truth Sites*
GMU Boundaries
County Boundaries
Wetlands
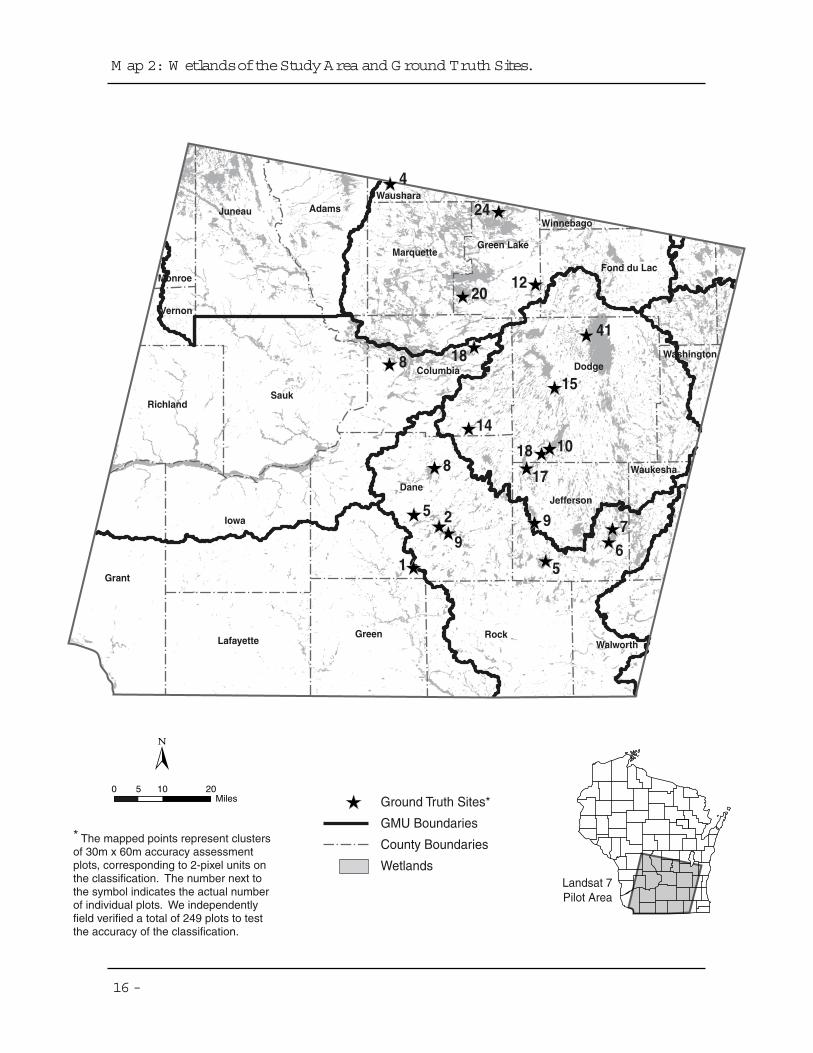
* The mapped points represent clustersof 30m x 60m accuracy assessmentplots, corresponding to 2-pixel units onthe classification. The number next tothe symbol indicates the actual numberof individual plots. We independentlyfield verified a total of 249 plots to testthe accuracy of the classification.
Landsat 7Pilot Area
0 20Miles
105
M ap 2: W etlandsoftheStudyAreaand Ground Truth Sites.
16-
Reed Canary Grass Monitoring
- 17
After many iterations, we assessed the final classification for accuracy. Map 2 illustratesthe location of groundtruth sites across the study area. The final round of groundtruthingfieldwork included 249 plots, systematically selected by the classifying technician. Anindependent field staff member collected groundtruth data and cover estimates for eachsite and submitted these data to the classifying technician for an assessment of statisticalaccuracy.
4.2 Results
4.2.1 The Classification
The classification produced a GIS raster coverage of heavily dominated reed canary grasswetlands mapped to a 0.5 acre minimum mapping unit for the pilot area. Only areasshown as wetlands on the digital Wisconsin Wetland Inventory were mapped. Theclassification maps three categories of wetland vegetation with respect to reed canarygrass: heavily dominated (80-100% cover), co-dominated (50-79% cover) and absent tosubdominant (0-49% cover). A color image of the classification is shown on theWisconsin DNR Wetland Assessment and Monitoring web page: http://dnr.wi.gov/org/water/fhp/wetlands/index.shtml
4.2.2 Accuracy of the Classification
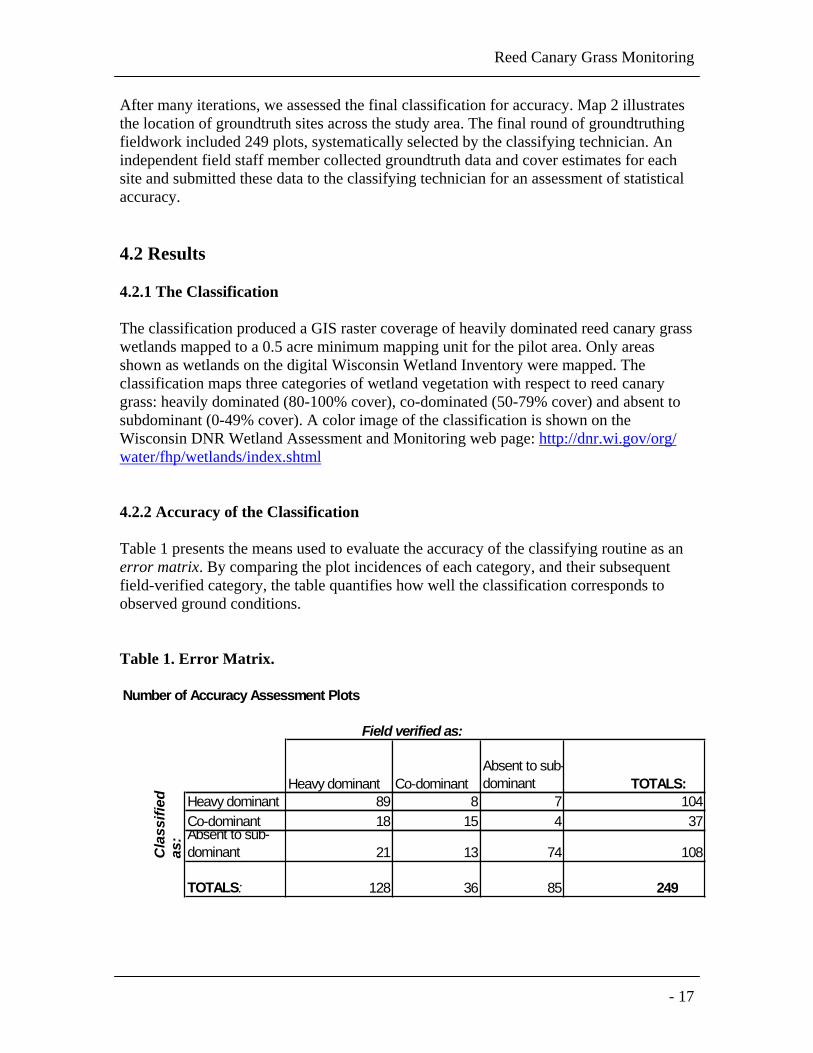
Table 1 presents the means used to evaluate the accuracy of the classifying routine as anerror matrix. By comparing the plot incidences of each category, and their subsequentfield-verified category, the table quantifies how well the classification corresponds toobserved ground conditions.
Table 1. Error Matrix.
Heavy dominant Co-dominantAbsent to sub-dominant TOTALS:
Heavy dominant 89 8 7 104Co-dominant 18 15 4 37Absent to sub-dominant 21 13 74 108
TOTALS: 128 36 85 249
Cla
ssifi
edas
:
Field verified as:
Number of Accuracy Assessment Plots
Bernthal and Willis
18 -
Although there are several ways to represent accuracy, the most concise discussion forthis project focuses on overall accuracy and “user’s” accuracy statistics. Overall accuracymeasures the correspondence of classes to ground data as a single number expressed as apercentage. Summing the number of plots classified correctly in each category(represented along the main diagonal of Table 1), then dividing by the total number ofplots sampled, yields an accuracy considered over all classes. The classification thereforehas an overall accuracy of 71 percent: (89 + 15 + 74) / 249 = 0.71.
More pointedly, user’s accuracy statistics quantify agreement between the classificationand ground data within each class. It is measured as the number of correctly classifiedplots in a category divided by the corresponding row total in Table 1. This measurementsignifies the probability of a map user finding the given class at that point on the ground.For the reed canary grass classes heavily dominant, co-dominant, and subdominant,respectively, the user’s accuracies are 86%, 41%, and 69%:
Heavily dominant: 89 / 104 = 0.86Co-dominant: 15 / 37 = 0.41Absent or subdominant: 74 / 108 = 0.69
When evaluating the accuracies yielded by the error matrix, it is helpful to recall thegoals of the analysis. The higher accuracy of the heavily dominant reed canary grass classreflects the effort to satisfy the primary objective of identifying that species. Compara-tively, the accuracy of the absent to subdominant class is lower; it is acceptable becausethe category here serves only as a contrast to the dominant reed canary grass classes andis not itself a target for the protocol. The classification of co-dominant areas, on the otherhand, is not accurate enough to provide useful information. Our intent regarding the co-dominant class was to define the areas where the invasiveness of reed canary grass ismost dynamic. We were not successful in this respect. These areas are, effectively, zonesof uncertainty for our classification method. Note that most (18) of the co-dominant plotsin error were field verified as heavily dominant, while only four were field verified asabsent or subdominant.
4.2.3 Limitations of the Classification Methodology
Two technical caveats emerge from our work. First, as demonstrated by the effects ofeven sparse woody canopy cover, the protocol should be applied only to nonforestedwetlands. We began with the understanding that, due to the nature and spectralcharacteristics of woody vegetation, the classification would probably not be effective inareas with forest cover. We further discovered that even in open-canopy herbaceouswetlands, woody vegetation such as trees and shrubs had much stronger influence on thevalue of a pixel than anticipated. In many instances, a single shrub present in a 900-m2
pixel area significantly altered the pixel’s classification. Compounding the problem, anyareas of open or standing water produced the same effect. The difficulty with woodyvegetation and water presumably stems from our use of the near-infrared band of thespectrum for classifying. Woody vegetation and water have very imposing responses in
Reed Canary Grass Monitoring
- 19
the near infrared. But because this range of wavelengths is so useful in discerning reedcanary grass, the confounding effects must be accepted as part and parcel of theclassification, at least for now. Future work that relies on our protocol must consider thedramatic effect of relatively small woody plants.
The second caveat is that this method and these data are not sufficient for discerningtransitional gradients between reed canary grass and other vegetation. The uncertainty ofCo-dominant areas is an example of a perennial problem in remote sensing projects:inadequate spatial resolution. The satellite imagery’s 30 x 30-m pixel size is too large todetect the gradient from reed canary grass to other vegetation. In our fieldwork, we foundthe gradient to span only a few feet as a rule. This can be particularly problematic in areaswith a narrow linear vegetation pattern. It may be possible to offset this discrepancy withan increase in spectral resolution, so that the small gradient zone has a more dramaticeffect on averaged pixel response in a given band. Our results, however, and thecharacteristics of the Landsat-7 etm+ sensor suggest that identifying such mixed areasusing this data will continue to be difficult or impossible.
Finally, and perhaps most importantly, we must stipulate a very fundamental conditionfor interpreting the final map product. The procedures here distinguish only a singlespecies, reed canary grass, from all other plants. While reed canary grass is arguably themost aggressive and visible plant invader in Wisconsin wetlands, several other speciesare nuisances and ecological threats. Other examples include purple loosestrife (Lythrumsalicaria), giant reed grass (Phragmites australis) and hybrid cattails (Typha x glauca).With this method, these plants will be considered simply “other vegetation.” We cannot,therefore, interpret an absence of reed canary grass as a sufficient indication of goodbiotic wetland health. We can, however, be certain that areas of the plant’s heavydominance are in poor biotic condition.
4.2.4 Cost Considerations
The exploratory nature of our work to develop the classification makes it difficult to statethe cost of replicating the classification process in other areas of the state. We canestimate the costs for data acquisition and staff time with some confidence, based on thefield time we spent on accuracy assessment and the time spent developing theclassification once we had established a routine protocol.
Our expenditures totaled approximately $20,000 for image analysis and field sampling. Asecond round of classification applying the protocol should be somewhat less expensive,but this provides a reasonable estimate of the costs involved. Given the scarcity ofpersonnel available and the time required for conducting a large field survey of the samearea, our ability to collect the necessary information with a skeleton crew of three peoplebecomes an attractive alternative, and likely represents a dramatic cost savings.
Bernthal and Willis
20 -
4.3 Conclusions
Because the accuracy is high for both the heavily dominant and subdominant classes, wecan rate this classification a success. In addition to sufficiently identifying the location ofreed canary grass, we produced a repeatable method for future work of this kind (outlinedin Methods). Certainly, applying the method in other geographic areas or in futuregrowing seasons will require some customization of procedures, and each project willneed its own groundtruthing corroboration. Our work may provide the blueprint forfuture applications and greatly reduce the workload of both image processing and fielddata collection for groundtruth purposes.
4.4 Recommendations for Future Classification Efforts
4.4.1 Expand to Other Areas of the State
The classification protocol developed in this project shows promise as a cost-effectivetool for identifying reed canary grass dominated wetlands. Future efforts could expandthe mapped area to include the entire state. To test the cost-effectiveness of the protocol,a nearby Landsat image could be purchased and classified by an independent technicianusing the methods developed for this project. The resulting classification could then beassessed for accuracy. The existing spectral classes developed for this classificationwould be used as a starting point. The amount of adjustment and the time to complete aclassification of the second scene would provide the basis to estimate the cost to completea classification of the entire state, as well as the cost to periodically update theclassification of a given Landsat scene. We will conduct this test in a wetland assessmentproject in the Milwaukee River Basin.
4.4.2 Explore the Use of Higher Resolution Data Sources
Several techniques and new data sources could also be pursued to improve theclassification results. A higher resolution data source could be purchased to improve theability to identify smaller areas of reed canary grass domination and reduce the size of theminimum mapping unit. This would be particularly useful in detecting linear distributionof reed canary grass along waterways. A higher resolution data source could also aid inthe ability to classify reed canary grass under shrub or forested canopy and improve theaccuracy of classifying co-dominant areas. The expense of greater resolution data and thelikely reduction in geographic extent, however, will have to be weighed against thebenefits of improved classification.
Reed Canary Grass Monitoring
- 21
There is also room for more investigation into suitable wavelength bands. Bandcombinations other than ours are possible using data from the 8-band Landsat-7 sensor.Other remote sensing data platforms, too, show promise for finer distinctions betweenclass types. Hyperspectral sensors collect data in much narrower, more numerous bandscompared with multispectral platforms such as the Landsat-7 etm+ sensor. Moreresearch is needed to explore the utility of hyperspectral data sources, or other bandcombinations within the constraints of the etm+ sensor.
4.4.3 Explore the Feasibility of Mapping Additional Invasive Species
Mapping of other invasive species in wetlands is another possible future effort. Lopez, etal. (in press) have had success in mapping dense patches of giant reed grass (Phragmitesaustralis) using hyperspectral data at a coastal wetland site in Michigan. The ability tomap this species and purple loosestrife (Lythrum salicaria) would enhance current andplanned volunteer surveys of these invasive species. The level of resolution of the datasource required for these plants will determine the cost-effectiveness and desirability ofpursuing a classification protocol for these species.

Bernthal and Willis
22 -
Reed Canary Grass Monitoring
- 23
5. Analyzing Landscape Factors Associated with Reed CanaryGrass Dominance
5.1 Methods
The second objective of our project is to search for ecological meaning in patterns of reedcanary grass domination at the landscape level revealed in the mapping project and toidentify relationships between reed canary grass domination and land and hydrologicaldisturbance that can be identified from existing GIS data layers. The dynamics of reedcanary grass invasion are becoming better defined from mesocosm and site studies(Maurer, et al. 2003, Green and Galatowitsch 2001). For instance, influxes of sedimentrich stormwater have been identified as a likely cause for current invasions (Maurer, et al.2003.) Coarse landscape scale information could supplement and extend these studies byidentifying land cover and land use variables that predict, at a coarse level, areas that aremore vulnerable to reed canary grass invasion. Due to time constraints, this aspect of theproject was limited to initial explorations to present descriptive statistics and to identifyfurther lines of analysis that could prove fruitful.
5.1.1 Data Sources for Sampling the Pilot Area
The choice of a pilot area for the project was restricted to existing Landsat scenes. Path24, row 30 (shown on Map 1) was chosen as the most appropriate scene available forpurposes of our study, but is not itself a meaningful hydrological or ecological unit. Weconducted an analysis of the pilot area as a whole to break down reed canary grassdominated wetlands by wetland plant community type and wetland hydrologic type inorder to determine which wetland types are most affected by reed canary grassdominance.
The pilot area was large and diverse enough in both geological characteristics and landcover that we were able to conduct several types of analysis by dividing the pilot areainto meaningful sample units in two different ways: by hydrological and by ecologicalsetting. We divided the pilot area into hydrologic units in one analysis and ecologicalunits in a second parallel analysis comparing extent of reed canary grass dominatedwetlands with land cover types. Two different existing GIS data sources were used tocreate the two separate data sets.
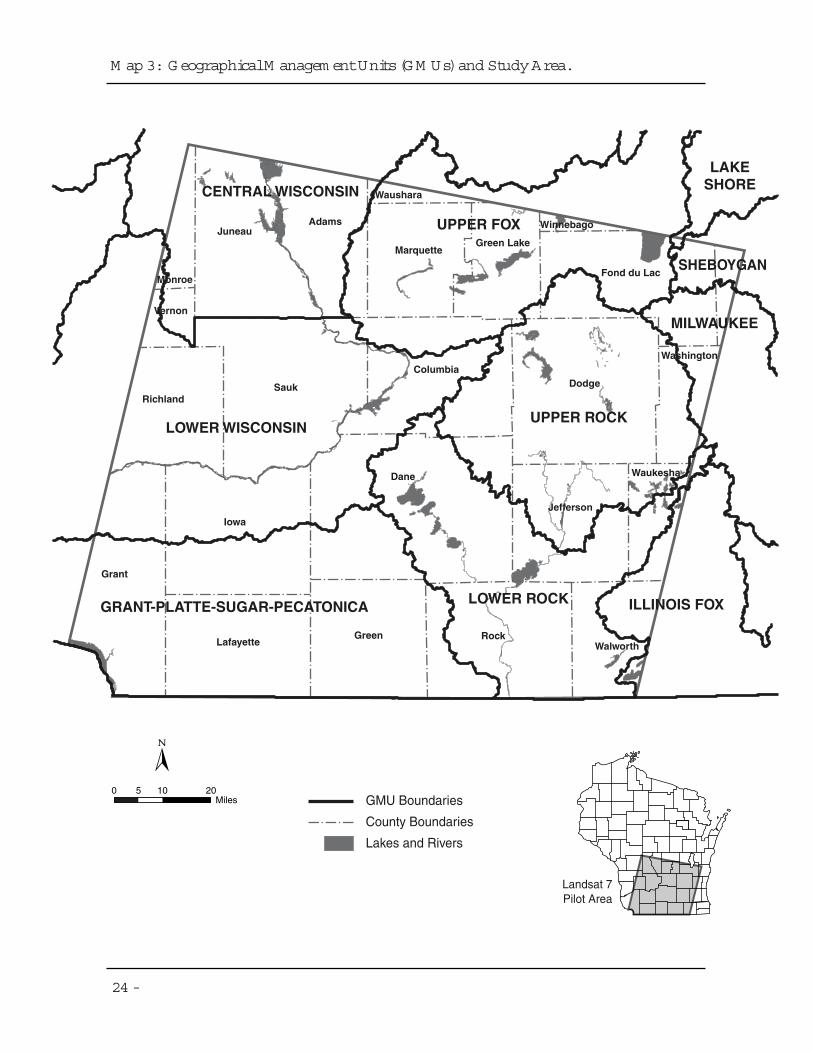
Watersheds – We created a watershed data set by dividing the pilot area into watershedsas sample units. For management purposes, the Wisconsin DNR divides the state intogeographic management units (GMUs), which approximate the larger river basins ofWisconsin, with minor adjustments to political boundaries. Each of these large GMUs isfurther divided into component watersheds. Our study area encompassed portions of 6GMUs and a total of 71 complete watersheds. Map 3 shows the geographic relationshipbetween our study area and the nearest GMUs.
CENTRAL WISCONSIN
UPPER FOX
UPPER ROCKLOWER WISCONSIN
GRANT-PLATTE-SUGAR-PECATONICA LOWER ROCK ILLINOIS FOX
MILWAUKEE
SHEBOYGAN
LAKESHORE
Dane
Sauk
Iowa
Rock
Dodge
Grant
Green
JuneauAdams
Lafayette
Jefferson
Richland
Marquette
Walworth
Green Lake
Waukesha
Washington
Monroe
Vernon
Waushara
Winnebago
Columbia
Fond du Lac
Landsat 7Pilot Area
GMU Boundaries
County Boundaries
Lakes and Rivers
0 20Miles
105
M ap 3: GeographicalM anagem entUnits(GM Us)and StudyArea.
24-
Reed Canary Grass Monitoring
- 25
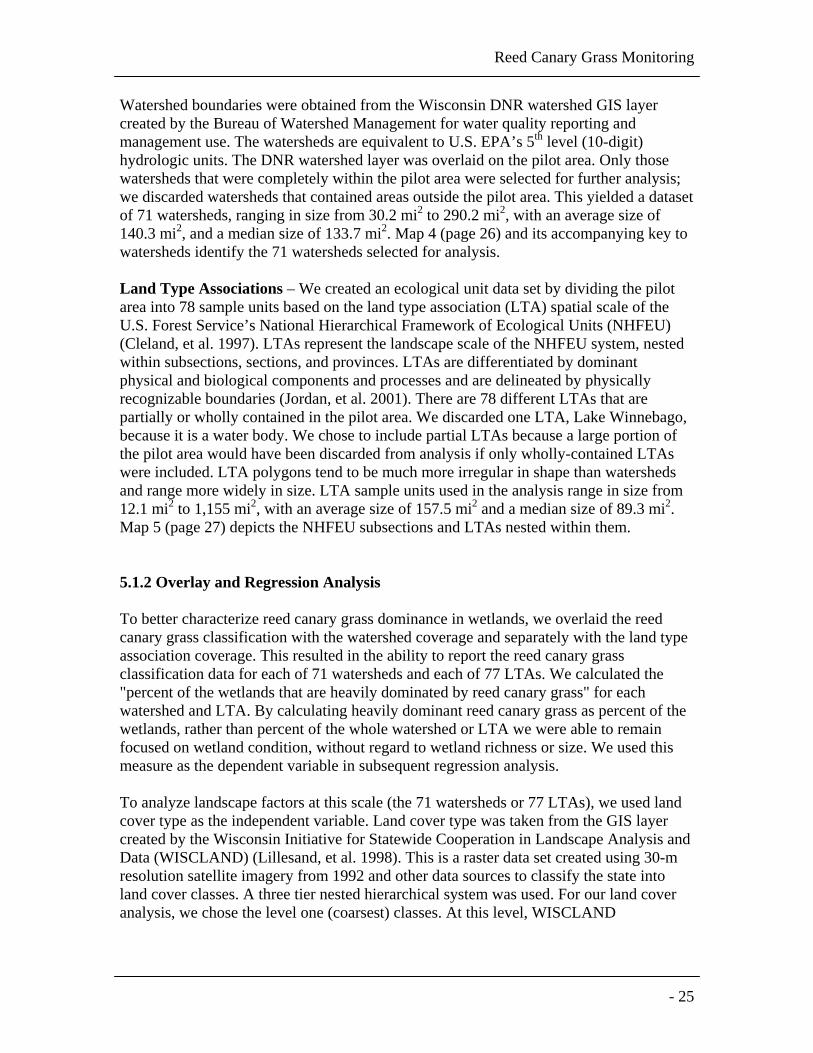
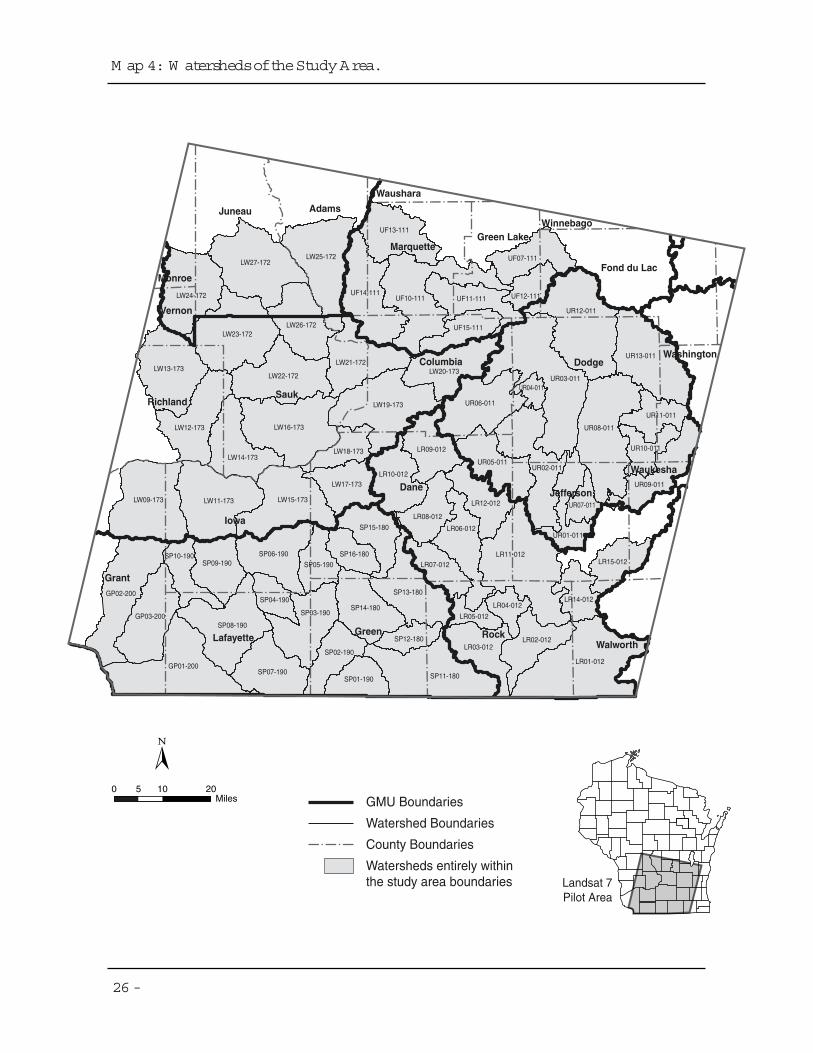
Watershed boundaries were obtained from the Wisconsin DNR watershed GIS layercreated by the Bureau of Watershed Management for water quality reporting andmanagement use. The watersheds are equivalent to U.S. EPA’s 5th level (10-digit)hydrologic units. The DNR watershed layer was overlaid on the pilot area. Only thosewatersheds that were completely within the pilot area were selected for further analysis;we discarded watersheds that contained areas outside the pilot area. This yielded a datasetof 71 watersheds, ranging in size from 30.2 mi2 to 290.2 mi2, with an average size of140.3 mi2, and a median size of 133.7 mi2. Map 4 (page 26) and its accompanying key towatersheds identify the 71 watersheds selected for analysis.
Land Type Associations – We created an ecological unit data set by dividing the pilotarea into 78 sample units based on the land type association (LTA) spatial scale of theU.S. Forest Service’s National Hierarchical Framework of Ecological Units (NHFEU)(Cleland, et al. 1997). LTAs represent the landscape scale of the NHFEU system, nestedwithin subsections, sections, and provinces. LTAs are differentiated by dominantphysical and biological components and processes and are delineated by physicallyrecognizable boundaries (Jordan, et al. 2001). There are 78 different LTAs that arepartially or wholly contained in the pilot area. We discarded one LTA, Lake Winnebago,because it is a water body. We chose to include partial LTAs because a large portion ofthe pilot area would have been discarded from analysis if only wholly-contained LTAswere included. LTA polygons tend to be much more irregular in shape than watershedsand range more widely in size. LTA sample units used in the analysis range in size from12.1 mi2 to 1,155 mi2, with an average size of 157.5 mi2 and a median size of 89.3 mi2.Map 5 (page 27) depicts the NHFEU subsections and LTAs nested within them.
5.1.2 Overlay and Regression Analysis
To better characterize reed canary grass dominance in wetlands, we overlaid the reedcanary grass classification with the watershed coverage and separately with the land typeassociation coverage. This resulted in the ability to report the reed canary grassclassification data for each of 71 watersheds and each of 77 LTAs. We calculated the"percent of the wetlands that are heavily dominated by reed canary grass" for eachwatershed and LTA. By calculating heavily dominant reed canary grass as percent of thewetlands, rather than percent of the whole watershed or LTA we were able to remainfocused on wetland condition, without regard to wetland richness or size. We used thismeasure as the dependent variable in subsequent regression analysis.
To analyze landscape factors at this scale (the 71 watersheds or 77 LTAs), we used landcover type as the independent variable. Land cover type was taken from the GIS layercreated by the Wisconsin Initiative for Statewide Cooperation in Landscape Analysis andData (WISCLAND) (Lillesand, et al. 1998). This is a raster data set created using 30-mresolution satellite imagery from 1992 and other data sources to classify the state intoland cover classes. A three tier nested hierarchical system was used. For our land coveranalysis, we chose the level one (coarsest) classes. At this level, WISCLAND
UF13-111
UF14-111UF10-111 UF11-111
UF15-111
UR03-011UR04-011
UR08-011
UR11-011
UR02-011
UR10-011
UR05-011
LW25-172LW27-172
LW24-172
LW23-172LW26-172
LW21-172LW13-173 LW20-173
LW22-172
LW19-173
LW12-173
UR06-011
LW16-173
LW14-173LR09-012LW18-173
LR10-012LW17-173
LW09-173 LW11-173 LW15-173
UF07-111
UF12-111
UR12-011
UR13-011
UR01-011
LR12-012 UR07-011
LR08-012
LR06-012
LR11-012
UR09-011
SP15-180
SP06-190
SP05-190
SP13-180
SP16-180SP09-190 LR15-012LR07-012
LR14-012SP14-180
SP04-190LR04-012
LR05-012
SP10-190
GP03-200SP08-190
SP03-190
LR02-012
GP01-200LR01-012
SP12-180
SP02-190LR03-012
SP11-180SP07-190SP01-190
GP02-200
Dane
Sauk
Iowa
Rock
Dodge
Grant
Green
Juneau Adams
Lafayette
Jefferson
Richland
Marquette
Walworth
Green Lake
Waukesha
Washington
Monroe
Vernon
Waushara
Winnebago
Columbia
Fond du Lac
GMU Boundaries
Watershed Boundaries
County Boundaries
Watersheds entirely withinthe study area boundaries Landsat 7
Pilot Area
0 20Miles
105
M ap 4: W atershedsoftheStudyArea.
26-
Reed Canary Grass Monitoring
- 27
Key to Watersheds Depicted in Map 4.
IdentificationCode
Watershed Name IdentificatCode
Watershed Name
GP01-200 Galena River UF07-111 Big Green LakeGP03-200 Little Platte River UF12-111 Upper Grand RiverGP02-200 Platte River UF14-111 Neenah CreekLR02-012 Blackhawk Creek UF15-111 Swan LakeLR04-012 Rock River/Milton UF13-111 Montello RiverLR05-012 Marsh Creek UF11-111 Lower Grand RiverLR01-012 Turtle Creek UF10-111 Buffalo and Puckaway LakesLR10-012 Six Mile and Pheasant Branch Creeks UR06-011 Upper Crawfish RiverLR03-012 Bass Creek UR02-011 Lower Crawfish RiverLR07-012 Badfish Creek UR05-011 Maunesha RiverLR09-012 Yahara River and Lake Mendota UR13-011 East Branch Rock RiverLR14-012 Whitewater Creek UR11-011 Rubicon RiverLR06-012 Yahara River and Lake Kegonsa UR09-011 Oconomowoc RiverLR08-012 Yahara River and Lake Monona UR01-011 Middle Rock RiverLR12-012 Upper Koshkonong Creek UR08-011 Sinissippi LakeLR11-012 Lower Koshkonong Creek UR03-011 Beaver Dam RiverLR15-012 Scuppernong River UR10-011 Ashippun RiverLW17-173 Black Earth Creek UR07-011 Johnson CreekLW13-173 Upper Pine River UR04-011 Calamus CreekLW12-173 Willow Creek UR12-011 Upper Rock RiverLW22-172 Narrows Creek and Baraboo RiverLW09-173 Blue RiverLW24-172 Seymour Creek and Upper Baraboo RiverLW11-173 Otter and Morrey CreeksLW23-172 Crossman Creek and Little Baraboo RiverLW19-173 Lake WisconsinLW26-172 Dell CreekLW15-173 Mill and Blue Mounds CreekLW16-173 Honey CreekLW25-172 Duck and Plainville CreeksLW14-173 Bear CreekLW18-173 Roxbury CreekLW27-172 Lower Lemonweir RivLW21-172 Lower Baraboo RiverLW20-173 Duck Creek and Rocky RunSP01-190 Honey and Richland CreeksSP08-190 Middle Pecatonica RiverSP07-190 Lower Pecatonica RiveSP10-190 Upper West Branch Pecatonica RiverSP06-190 Upper East Branch Pecatonica RiverSP05-190 Gordon CreekSP09-190 Mineral Point and Sudan BranchesSP04-190 Yellowstone RiverSP03-190 Lower East Branch Pecatonica RiversSP02-190 Jordan and Skinner CreeksSP16-180 West Branch Sugar River/Mt. Vernon CreekSP15-180 Upper Sugar RiverSP14-180 Little Sugar RiverSP12-180 Lower Middle Sugar RiverSP11-180 Lower Sugar RiverSP13-180 Allen Creek and Middle Sugar River

13
04 1415
11
07
01
0607
0605
1008
0603
081007
08
02
1715
1709
07
04
18
02
01
02
04
0605
04
0317
06
10
18
17
18
01
01
02
1817
03
01
01
01
0205
03
04
02
08
07
01
09
0605 03
11
01
04
0108
07
06
01
0502
03
10
0309
02
12
09
13
14
18
17
16
04
02
01
19 1919
05
20
03
07
0702
04
0205
03
01
15
2205
Rock RiverOld Drift Country Subsection222Kh
Central WisconsinSand Plain Subsection222Ra
Lake WinnebagoClay Plain Subsection222Kc
Central WisconsinMoraines and OutwashSubsection222Kb
South Central WIPrairie and SavannahSubsection222Kd
Mineral PointPrairie/Savannah Subsection222Le
Kickapoo/Wisconsin RiverRavines Subsection222Ld
MelroseOak Forest andSavanna Subsection222Lb
Mississippi/Wisconsin RiverRavines Subsection222Lc
Southern Green BayLobe Subsection222Ke
Geneva/DarienMoraines and TillPlains Subsection222Kf
Subsection Boundaries
LTA Boundaries
County Boundaries
*National Hierarchical Framework of Ecological Units
Landsat 7Pilot Area
0 20Miles
105
M ap 5: NHFEU*Subsectionsand Land TypeAssociations(LTAs)within theStudyArea.
28-
Reed Canary Grass Monitoring
- 29
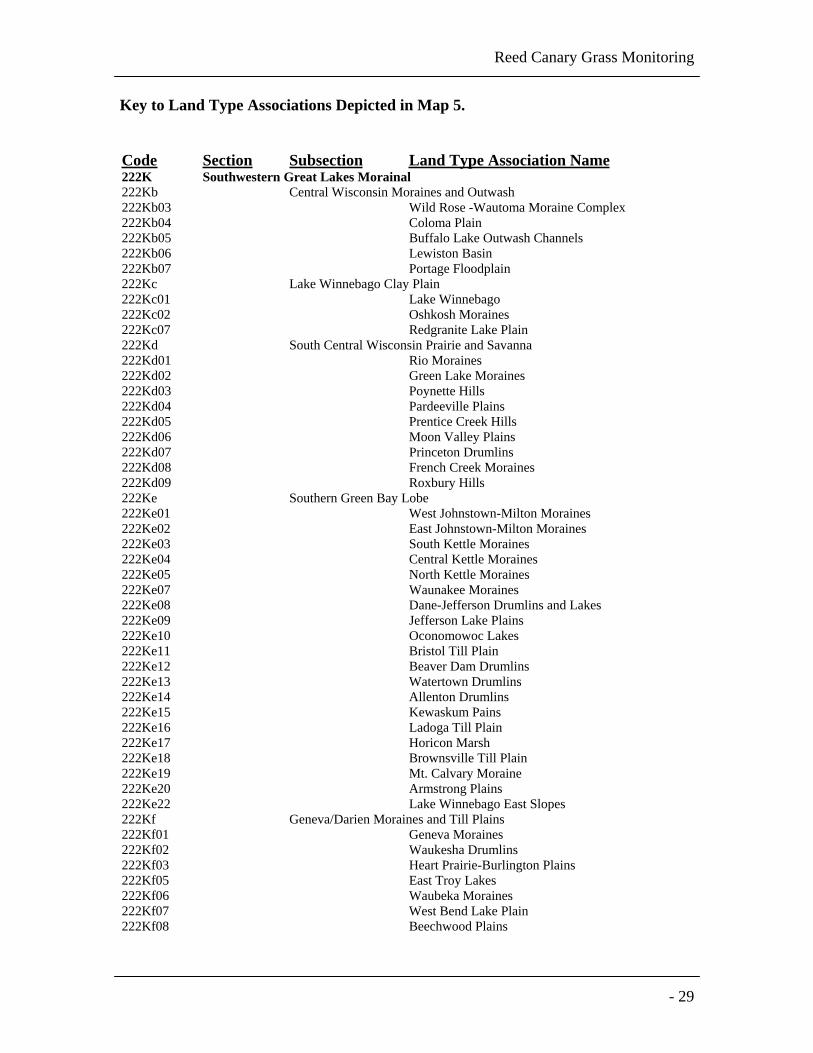
Key to Land Type Associations Depicted in Map 5.
Code Section Subsection Land Type Association Name222K Southwestern Great Lakes Morainal222Kb Central Wisconsin Moraines and Outwash222Kb03 Wild Rose -Wautoma Moraine Complex222Kb04 Coloma Plain222Kb05 Buffalo Lake Outwash Channels222Kb06 Lewiston Basin222Kb07 Portage Floodplain222Kc Lake Winnebago Clay Plain222Kc01 Lake Winnebago222Kc02 Oshkosh Moraines222Kc07 Redgranite Lake Plain222Kd South Central Wisconsin Prairie and Savanna222Kd01 Rio Moraines222Kd02 Green Lake Moraines222Kd03 Poynette Hills222Kd04 Pardeeville Plains222Kd05 Prentice Creek Hills222Kd06 Moon Valley Plains222Kd07 Princeton Drumlins222Kd08 French Creek Moraines222Kd09 Roxbury Hills222Ke Southern Green Bay Lobe222Ke01 West Johnstown-Milton Moraines222Ke02 East Johnstown-Milton Moraines222Ke03 South Kettle Moraines222Ke04 Central Kettle Moraines222Ke05 North Kettle Moraines222Ke07 Waunakee Moraines222Ke08 Dane-Jefferson Drumlins and Lakes222Ke09 Jefferson Lake Plains222Ke10 Oconomowoc Lakes222Ke11 Bristol Till Plain222Ke12 Beaver Dam Drumlins222Ke13 Watertown Drumlins222Ke14 Allenton Drumlins222Ke15 Kewaskum Pains222Ke16 Ladoga Till Plain222Ke17 Horicon Marsh222Ke18 Brownsville Till Plain222Ke19 Mt. Calvary Moraine222Ke20 Armstrong Plains222Ke22 Lake Winnebago East Slopes222Kf Geneva/Darien Moraines and Till Plains222Kf01 Geneva Moraines222Kf02 Waukesha Drumlins222Kf03 Heart Prairie-Burlington Plains222Kf05 East Troy Lakes222Kf06 Waubeka Moraines222Kf07 West Bend Lake Plain222Kf08 Beechwood Plains

Bernthal and Willis
30 -
Code Section Subsection Land Type Association Name222Kh Rock River Old Drift Country222Kh01 Monroe Eroded Moraines222Kh02 Sugar River Valley222Kh03 Rock River Prairies222Kh04 Bergen Moraines222Kh05 Orfordville Eroded Moraines222Kh06 Big Foot Prairies
222L North Central US Driftless and Escarpment222Lb Melrose Oak Forest and Savanna222Lb07 Trempealeau Sandstone Hills222Lc Mississippi/WI River Ravines222Lc16 Rountree Ridges, Tunnel City Hills, and Valleys-
South222Lc17 Mississippi River Valley Train-South222Lc18 Hills and Valleys - Wisconsin River Drainage222Ld Kickapoo/WI River Ravines222Ld01 Richland Ridge222Ld02 LeFarge Hills and Valleys222Ld03 West Baraboo Ridge222Ld04 Baraboo Basin Floodplain and Terraces222Ld05 East Baraboo Ridge222Ld06 Baraboo Basin Moraines
222Le Mineral Point Prairie/Savanna222Le01 Military Ridge Prairie222Le02 Platteville Savanna222Le03 Pecatonica Valley
222R Wisconsin Central Sands222Ra Central Wisconsin Sand Plain222Ra01 Wisconsin River Alluvial Plain and Flowages and
Terraces222Ra02 Wisconsin Dells222Ra03 Glacial Lake Wisconsin Sand Plain222Ra04 Northwest Outlet Cranberry Bogs222Ra05 Glacial Lake Wisconsin Bogs222Ra06 Glacial Lake Wisconsin Sand Dunes222Ra07 Wisconsin River Outwash Terraces222Ra08 Plover-Hancock Outwash Plain222Ra09 Tomah-Mauston Terraces222Ra10 Adams County Bluffs222Ra11 Yellow River Floodplain and Terraces222Ra13 Yellow River Siliceous Terrace222Ra14 Glacial Lake Wisconsin Siliceous Sand Plain222Ra15 Lemonweir Floodplain and Terraces222Ra17 Castle Rock Bluffs and Terraces222Ra18 Baraboo-Dells Terrace and Outwash Plain
Reed Canary Grass Monitoring
- 31
classifies land cover into urban, agriculture, grassland, forest, open water, wetland,barren, shrubland, and cloud cover (areas that could not be classified). The wetlandcategory was developed from the digital Wisconsin Wetland Inventory.
We overlaid the WISCLAND coverage with the watershed and LTA coverages to createa table of level one land cover types for the watershed and LTA data sets. We calculatedthe percent of each land cover class for each watershed and land type association. Wealso calculated the percent wetland of each watershed or land type association and rankedthese to report the "wetland richness" of each unit. We then performed a set of linearregressions using "percent of wetlands that are heavily dominated by reed canary grass"against percent of each watershed in each WISCLAND level one land cover class. Weperformed another set of linear regressions against the percent of each WISCLANDcover type in each LTA.
5.2 Results and Discussion
5.2.1 Ecological Significance of Reed Canary Grass at the Landscape Level
The results of the classification for the pilot area confirm the significance of reed canarygrass in southern Wisconsin wetlands. Of the 737,454 acres of wetlands in the pilot area,79,490 acres (11%) were classified as heavily dominant, operationally defined as 80% to100% reed canary grass cover. These are monocultures or near-monocultures withextremely low plant diversity. Clearly there is a significant acreage of wetlands heavilydegraded by reed canary grass. In comparison to current estimates that approximately40,000 acres across the entire state are affected by purple loosestrife (B. Woods, personalcommunication), this classification confirms our presumption that reed canary grass is themost widespread invasive plant in Wisconsin wetlands.
Studies of reed canary grass dominance and plant diversity have shown that wetlandareas with reed canary grass cover at less than 50% may still have low levels of plantdiversity, and reed canary grass could still be the most dominant plant (Maurer, et al.2003). The reed canary grass metric in the Wisconsin Wetland Plant Biotic Indexdiscriminates greatly among levels of occurrence and cover well below 50% (Lillie2000). Another 23,378 wetland acres (3%), were classified as co-dominant areas, wherereed canary grass comprises more than 50%, but less than 80% of the herbaceous cover.Groundtruthing revealed that most of the error in this category lay in misclassifying areasas co-dominant when they were field verified as properly belonging in the heavilydominant class. This underscores that reporting the heavily dominant class alone resultsin a conservative estimate of this species’ true impact on wetland plant diversity. Takingthese two classes together may give a truer picture of the number of wetland acresimpacted by reed canary grass. Based on this reasoning, reed canary grass significantlyaffects 102,868 wetland acres in the study area.
Bernthal and Willis
32 -
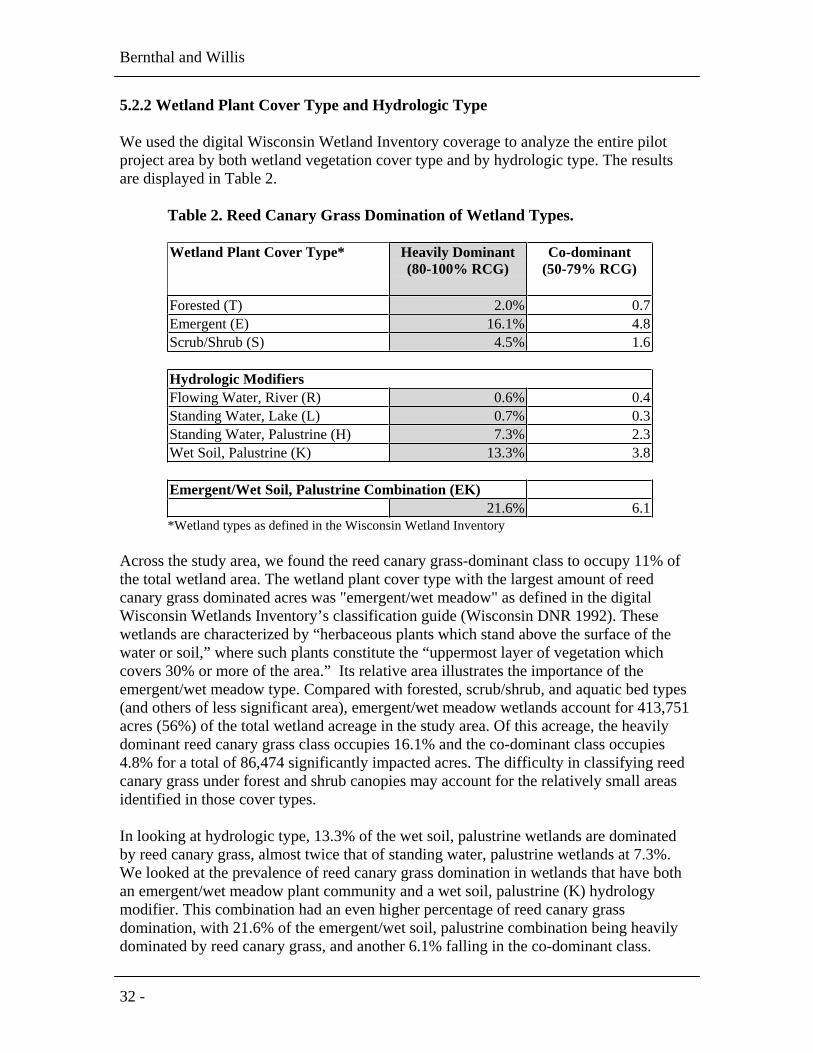
5.2.2 Wetland Plant Cover Type and Hydrologic Type
We used the digital Wisconsin Wetland Inventory coverage to analyze the entire pilotproject area by both wetland vegetation cover type and by hydrologic type. The resultsare displayed in Table 2.
Table 2. Reed Canary Grass Domination of Wetland Types.
Wetland Plant Cover Type* Heavily Dominant(80-100% RCG)
Co-dominant(50-79% RCG)
Forested (T) 2.0% 0.7Emergent (E) 16.1% 4.8Scrub/Shrub (S) 4.5% 1.6
Hydrologic ModifiersFlowing Water, River (R) 0.6% 0.4Standing Water, Lake (L) 0.7% 0.3Standing Water, Palustrine (H) 7.3% 2.3Wet Soil, Palustrine (K) 13.3% 3.8
Emergent/Wet Soil, Palustrine Combination (EK)21.6% 6.1
*Wetland types as defined in the Wisconsin Wetland Inventory
Across the study area, we found the reed canary grass-dominant class to occupy 11% ofthe total wetland area. The wetland plant cover type with the largest amount of reedcanary grass dominated acres was "emergent/wet meadow" as defined in the digitalWisconsin Wetlands Inventory’s classification guide (Wisconsin DNR 1992). Thesewetlands are characterized by “herbaceous plants which stand above the surface of thewater or soil,” where such plants constitute the “uppermost layer of vegetation whichcovers 30% or more of the area.” Its relative area illustrates the importance of theemergent/wet meadow type. Compared with forested, scrub/shrub, and aquatic bed types(and others of less significant area), emergent/wet meadow wetlands account for 413,751acres (56%) of the total wetland acreage in the study area. Of this acreage, the heavilydominant reed canary grass class occupies 16.1% and the co-dominant class occupies4.8% for a total of 86,474 significantly impacted acres. The difficulty in classifying reedcanary grass under forest and shrub canopies may account for the relatively small areasidentified in those cover types.
In looking at hydrologic type, 13.3% of the wet soil, palustrine wetlands are dominatedby reed canary grass, almost twice that of standing water, palustrine wetlands at 7.3%.We looked at the prevalence of reed canary grass domination in wetlands that have bothan emergent/wet meadow plant community and a wet soil, palustrine (K) hydrologymodifier. This combination had an even higher percentage of reed canary grassdomination, with 21.6% of the emergent/wet soil, palustrine combination being heavilydominated by reed canary grass, and another 6.1% falling in the co-dominant class.
Reed Canary Grass Monitoring
- 33
Taken together these two classes comprise more than one-fourth of the acreage ofemergent, palustrine wetland in the study area. A regression analysis of the watersheddata for the entire pilot area showed a significant relationship (R2 = 0.306, p < 0.0001)between percent of the watershed’s wetlands heavily dominated by reed canary grass andpercent that are the emergent-wet soil combination (EK) type. These results corroboratefield observations that reed canary grass does best in fertile hydric soils in full sun.
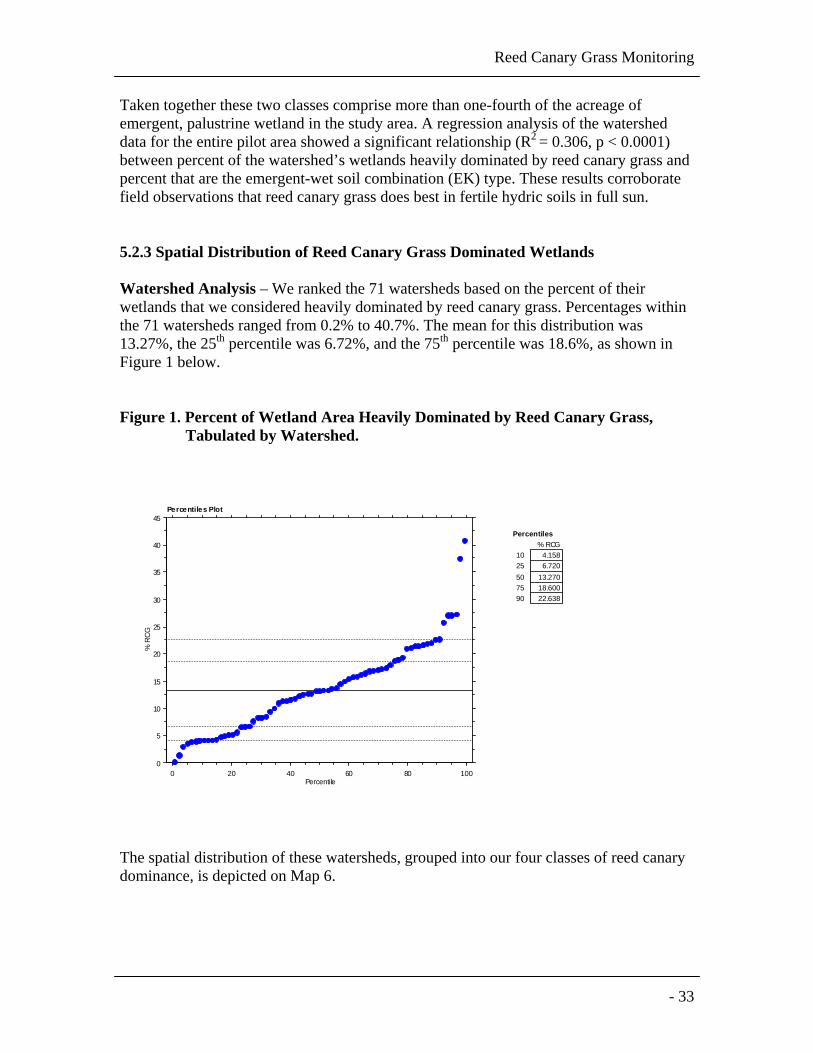
5.2.3 Spatial Distribution of Reed Canary Grass Dominated Wetlands
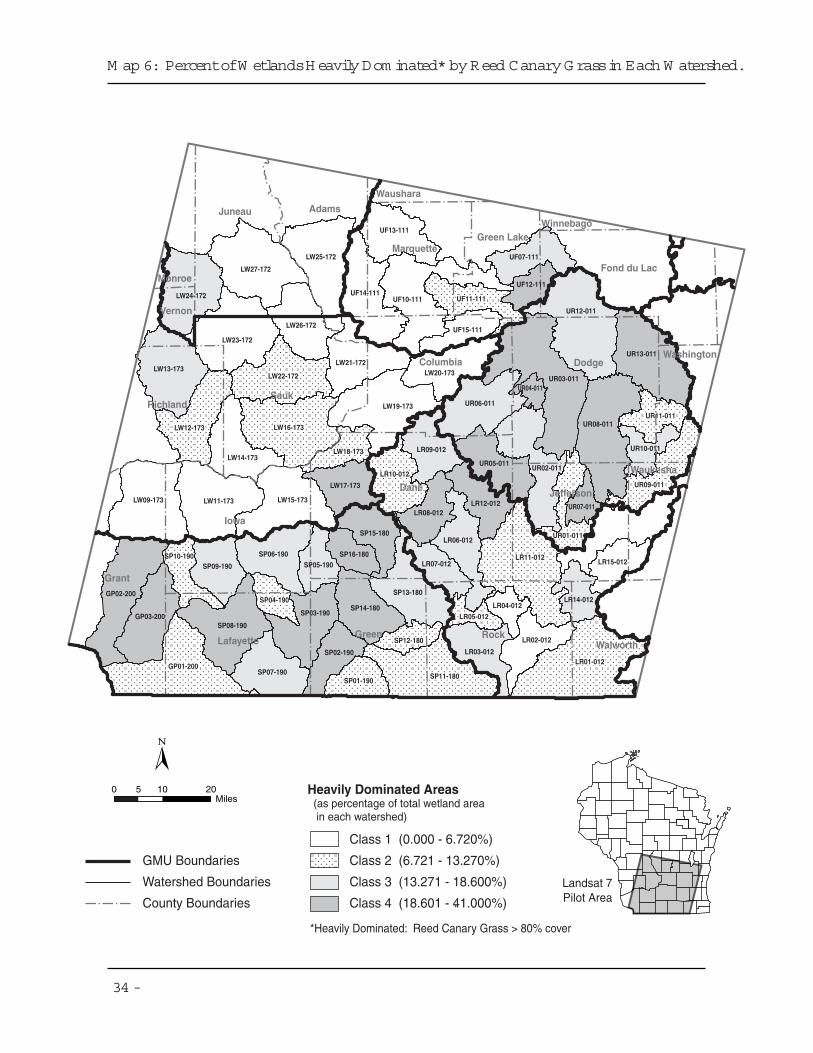
Watershed Analysis – We ranked the 71 watersheds based on the percent of theirwetlands that we considered heavily dominated by reed canary grass. Percentages withinthe 71 watersheds ranged from 0.2% to 40.7%. The mean for this distribution was13.27%, the 25th percentile was 6.72%, and the 75th percentile was 18.6%, as shown inFigure 1 below.
Figure 1. Percent of Wetland Area Heavily Dominated by Reed Canary Grass,Tabulated by Watershed.
The spatial distribution of these watersheds, grouped into our four classes of reed canarydominance, is depicted on Map 6.
% RCG by Watershed
4.1586.720
13.27018.60022.638
% RCG1025507590
Percentiles
0
5
10
15
20
25
30
35
40
45
% R
CG
0 20 40 60 80 100Percentile
Percentiles Plot
UF13-111
UF14-111UF10-111 UF11-111
UF15-111
UR03-011UR04-011
UR08-011UR11-011
UR02-011
UR10-011
UR05-011
LW25-172
LW27-172
LW24-172
LW23-172
LW26-172
LW21-172LW13-173 LW20-173LW22-172
LW19-173
LW12-173
UR06-011
LW16-173
LW14-173LR09-012LW18-173
LR10-012
LW17-173
LW09-173 LW11-173 LW15-173
UF07-111
UF12-111
UR12-011
UR13-011
UR01-011
LR12-012 UR07-011LR08-012
LR06-012
LR11-012
UR09-011
SP15-180
SP06-190SP05-190
SP13-180
SP16-180
SP09-190LR15-012LR07-012
LR14-012SP14-180
SP04-190LR04-012
LR05-012
SP10-190
GP03-200SP08-190
SP03-190
LR02-012
GP01-200LR01-012
SP12-180
SP02-190 LR03-012
SP11-180SP07-190SP01-190
GP02-200
Dane
Sauk
Iowa
Rock
Dodge
Grant
Green
Juneau Adams
Lafayette
Jefferson
Richland
Marquette
Walworth
Green Lake
Waukesha
Washington
Monroe
Vernon
Waushara
Winnebago
Columbia
Fond du Lac
GMU Boundaries
Watershed Boundaries
County Boundaries
Class 1 (0.000 - 6.720%)
Class 2 (6.721 - 13.270%)
Class 3 (13.271 - 18.600%)
Class 4 (18.601 - 41.000%)
Heavily Dominated Areas(as percentage of total wetland areain each watershed)
*Heavily Dominated: Reed Canary Grass > 80% cover
Landsat 7Pilot Area
0 20Miles
105
34-
M ap 6: PercentofW etlandsHeavilyDom inated*byReed CanaryGrassin Each W atershed.
Reed Canary Grass Monitoring
- 35
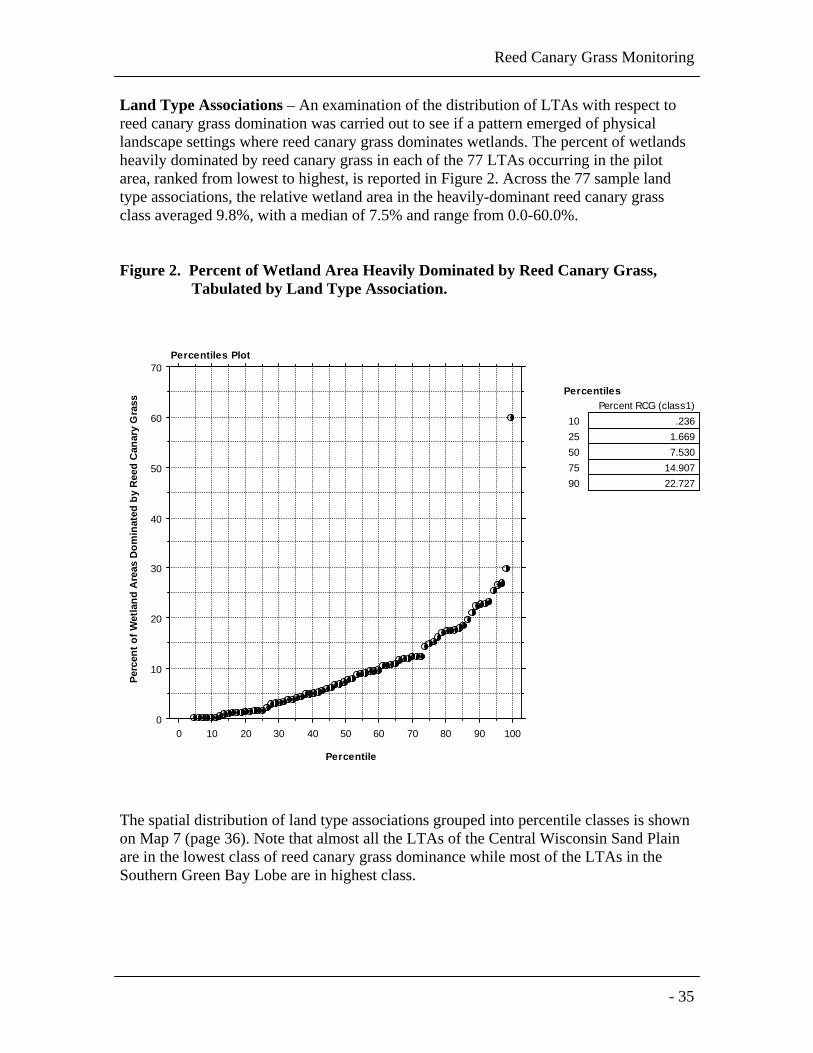
Land Type Associations – An examination of the distribution of LTAs with respect toreed canary grass domination was carried out to see if a pattern emerged of physicallandscape settings where reed canary grass dominates wetlands. The percent of wetlandsheavily dominated by reed canary grass in each of the 77 LTAs occurring in the pilotarea, ranked from lowest to highest, is reported in Figure 2. Across the 77 sample landtype associations, the relative wetland area in the heavily-dominant reed canary grassclass averaged 9.8%, with a median of 7.5% and range from 0.0-60.0%.
Figure 2. Percent of Wetland Area Heavily Dominated by Reed Canary Grass,Tabulated by Land Type Association.
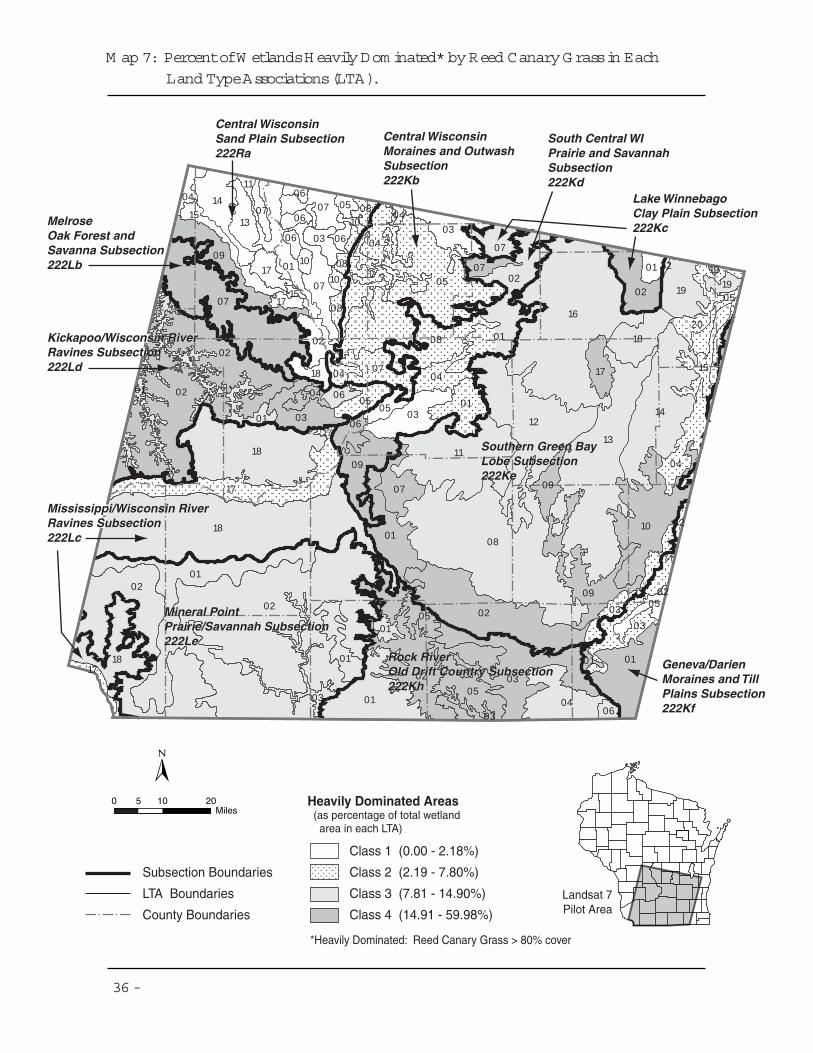
The spatial distribution of land type associations grouped into percentile classes is shownon Map 7 (page 36). Note that almost all the LTAs of the Central Wisconsin Sand Plainare in the lowest class of reed canary grass dominance while most of the LTAs in theSouthern Green Bay Lobe are in highest class.
.2361.6697.530
14.90722.727
Percent RCG (class1)1025507590
Percentiles
0
10
20
30
40
50
60
70
Perc
ent o
f Wet
land
Are
as D
omin
ated
by
Ree
d C
anar
y G
rass
0 10 20 30 40 50 60 70 80 90 100
Percentile
Percentiles Plot
13
04 1415
11
07
01
0607
0605
1008
0603
081007
08
02
1715
1709
07
04
18
02
01
02
04
06 0504
0317
06
10
18
17
18
01
01
02
1817
03
01
01
01
0205
03
04
02
08
07
01
09
0605 03
11
01
04
0108
07
06
01
0502
03
10
0309
02
12
09
13
14
18
17
16
04
02
01
19 1919
05
20
03
07
0702
04
0205
03
01
15
2205
Rock RiverOld Drift Country Subsection222Kh
Central WisconsinSand Plain Subsection222Ra
Lake WinnebagoClay Plain Subsection222Kc
Central WisconsinMoraines and OutwashSubsection222Kb
South Central WIPrairie and SavannahSubsection222Kd
Mineral PointPrairie/Savannah Subsection222Le
Kickapoo/Wisconsin RiverRavines Subsection222Ld
MelroseOak Forest andSavanna Subsection222Lb
Mississippi/Wisconsin RiverRavines Subsection222Lc
Southern Green BayLobe Subsection222Ke
Geneva/DarienMoraines and TillPlains Subsection222Kf
Rock RiverOld Drift Country Subsection222Kh
Central WisconsinSand Plain Subsection222Ra
Lake WinnebagoClay Plain Subsection222Kc
Central WisconsinMoraines and OutwashSubsection222Kb
South Central WIPrairie and SavannahSubsection222Kd
Mineral PointPrairie/Savannah Subsection222Le
Kickapoo/Wisconsin RiverRavines Subsection222Ld
MelroseOak Forest andSavanna Subsection222Lb
Mississippi/Wisconsin RiverRavines Subsection222Lc
Southern Green BayLobe Subsection222Ke
Geneva/DarienMoraines and TillPlains Subsection222Kf
Subsection Boundaries
LTA Boundaries
County Boundaries
Class 1 (0.00 - 2.18%)
Class 2 (2.19 - 7.80%)
Class 3 (7.81 - 14.90%)
Class 4 (14.91 - 59.98%)
Heavily Dominated Areas(as percentage of total wetlandarea in each LTA)
*Heavily Dominated: Reed Canary Grass > 80% cover
Landsat 7Pilot Area
0 20Miles
105
36-
M ap 7: PercentofW etlandsHeavilyDom inated*byReed CanaryGrassin Each
Land TypeAssociations(LTA).
Reed Canary Grass Monitoring
- 37
5.2.4 Relationship of Reed Canary Grass Dominated Wetlands with Land CoverTypes
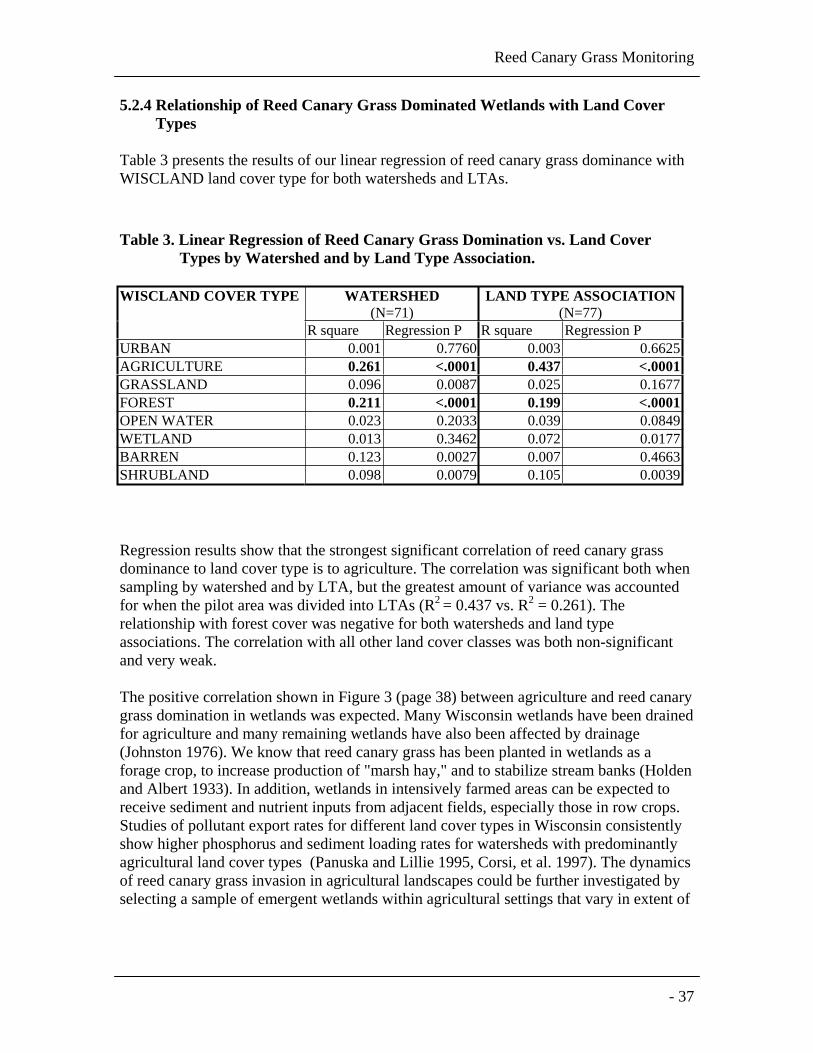
Table 3 presents the results of our linear regression of reed canary grass dominance withWISCLAND land cover type for both watersheds and LTAs.
Table 3. Linear Regression of Reed Canary Grass Domination vs. Land CoverTypes by Watershed and by Land Type Association.
WATERSHED(N=71)
LAND TYPE ASSOCIATION(N=77)
WISCLAND COVER TYPE
R square Regression P R square Regression PURBAN 0.001 0.7760 0.003 0.6625AGRICULTURE 0.261 <.0001 0.437 <.0001GRASSLAND 0.096 0.0087 0.025 0.1677FOREST 0.211 <.0001 0.199 <.0001OPEN WATER 0.023 0.2033 0.039 0.0849WETLAND 0.013 0.3462 0.072 0.0177BARREN 0.123 0.0027 0.007 0.4663SHRUBLAND 0.098 0.0079 0.105 0.0039
Regression results show that the strongest significant correlation of reed canary grassdominance to land cover type is to agriculture. The correlation was significant both whensampling by watershed and by LTA, but the greatest amount of variance was accountedfor when the pilot area was divided into LTAs (R2 = 0.437 vs. R2 = 0.261). Therelationship with forest cover was negative for both watersheds and land typeassociations. The correlation with all other land cover classes was both non-significantand very weak.
The positive correlation shown in Figure 3 (page 38) between agriculture and reed canarygrass domination in wetlands was expected. Many Wisconsin wetlands have been drainedfor agriculture and many remaining wetlands have also been affected by drainage(Johnston 1976). We know that reed canary grass has been planted in wetlands as aforage crop, to increase production of "marsh hay," and to stabilize stream banks (Holdenand Albert 1933). In addition, wetlands in intensively farmed areas can be expected toreceive sediment and nutrient inputs from adjacent fields, especially those in row crops.Studies of pollutant export rates for different land cover types in Wisconsin consistentlyshow higher phosphorus and sediment loading rates for watersheds with predominantlyagricultural land cover types (Panuska and Lillie 1995, Corsi, et al. 1997). The dynamicsof reed canary grass invasion in agricultural landscapes could be further investigated byselecting a sample of emergent wetlands within agricultural settings that vary in extent of

Bernthal and Willis
38 -
reed canary grass dominance, controlling for physical factors, such as soil type andhydrologic regime, and evaluating and the presence of disturbance factors such asditching, presence and extent of buffer between wetland and row crops.
Figure 3. Linear Regressions for Percent of Wetland Heavily Dominated by ReedCanary Grass vs. Percent Agriculture.
A weak negative relationship between forest cover and reed canary grass (R2 = 0.211 forwatersheds, R2 = 0.199) mirrors the positive correlation of agriculture. Forestedwatersheds and land type associations are likely to have less altered hydrology and lowersediment and nutrient additions to wetlands (Brooks, et al. 1996, Reckhow, et al. 1980,Panuska and Lillie 1995, Corsi, et al. 1997). The results were possibly influenced by theinability of our data source to sense reed canary grass under a forested canopy, and hencemiss wetlands where reed canary grass is a dominant in the ground layer. A different datasource is needed to adequately analyze reed canary grass dominance in forested wetlands.
The lack of a correlation with Urban land cover is counter intuitive given the literaturelinking reed canary grass invasion and stormwater inputs (Maurer, et al. 2003). Withinthe pilot area the landscape is generally not heavily urbanized, with the exception of theMadison metropolitan area. Most of the data points in each set had low amounts of urbancover. There were not enough data points with moderate to high levels of urban cover ineither data set to establish a significant correlation with reed canary grass dominance.This indicates these data sets are not useful for analyzing the relationship between urbanland cover and reed canary dominance in wetlands. To understand the dynamics of reedcanary grass invasion in urban areas, sampling the classification by selecting urbanwetlands with a range of stormwater influences could be a more productive approach.
Percent Agriculture Percent Agriculture
Perc
ent W
etla
nd th
atis
Ree
d C
anar
y G
rass
Regression for Watersheds Regression for LTAs
Y = -0.841 + 26.148 * X; R^2 = 0.261 Y = -2.191 + 0.275 * X; R^2 = 0.437
Reed Canary Grass Monitoring
- 39
5.3 Conclusions
Our results showed the dramatic impact of reed canary grass on plant communities inemergent, open-canopy wetlands in the pilot area. Even though our data source was notwell-suited to mapping reed canary grass under shrub or forest canopies, some of thesewetland types also were mapped as reed canary grass dominated, indicating that invasionof these plant community types is also problematic. Our study's finding of 79,490 acresof wetlands heavily dominated by reed canary grass in the study area is a conservativeestimate of the plant's true ecological impact since our heavily dominated class is definedas >80% cover. It is reasonable to add the 23,378 acres in the co-dominant (50-79%cover) class to report a total of 102,868 acres of wetlands in the study area that aresignificantly impacted by reed canary grass.
Few studies that document actual acreage have been completed for other invasive plants,although a 1987 statewide survey did estimate that approximately 30,000 acres ofwetland were dominated by purple loosestrife (Henderson 1987). A more recent estimateof purple loosestrife dominated areas is that approximately 40,000 acres statewide areaffected by purple loosestrife (Woods, Wisconsin DNR, Madison, pers. Comm., 2003). Interms of affected acreage, the impacts of reed canary grass greatly exceed those of purpleloosestrife. In fact, our study lends strong support to the argument that reed canary grassis the single most dominant plant in emergent, open canopy wetlands, and should beconsidered of great concern for wetland managers.
The underlying mechanisms by which wetlands are converted to reed canary grassmonocultures are becoming better understood. Researchers have demonstrated thatsediment delivery and nutrient addition, especially under high light conditions, favorsreed canary grass invasion, while reed canary grass tolerates a variety of hydroperiods(summarized in Maurer, et al. 2003). It is therefore imperative to invest in research intocontrol mechanisms, and develop wetland management practices and policies that limitthe further spread of the plant into wetland areas that are currently not dominated,especially new restoration sites.
Our regression analysis of broad land cover types showed that watersheds and land typeassociations with more agricultural cover tended to have a greater acreage of reed canarygrass dominated wetlands. This lends support to the notion that agricultural impacts suchas periodically farming wetlands, planting reed canary grass in wetlands for "marsh hay,"invasion along agricultural drainage ditches, and sediment deposition and nutrientaddition from upland agricultural fields are significant factors in the conversion of morediverse open wetlands to reed canary grass monocultures. Research aimed at sorting outthe relative role of these mechanisms, especially the role of historical planting of reedcanary grass, even in the absence of other contributing factors is needed.
Our work lends further support to the value of using reed canary grass as a metric inwetland biologic indices. Previous research has already established a strong relationshipbetween reed canary grass cover and level of human disturbance (Lillie 2000, Lillie, et al.
Bernthal and Willis
40 -
2003) and our understanding of the mechanisms of invasion is growing (Maurer, et al.2003). We have demonstrated that it is feasible to use reed canary grass mapping as anaccurate, Level 1, screening tool to assess plant community integrity in open, herbaceouswetlands. The classification allows us to reliably identify areas where the plantcommunity is in poor condition. However it is limited to the "poor" end of the spectrumbecause the classification categories are not fine enough to identify wetland plantcommunities in fair to good to excellent condition. It should also be recognized that thisis a vegetation metric and does not substitute for condition metrics that address otherbiota. Level 2 assessments at the site level are needed to better identify disturbancefactors. Monitoring of other biota will be needed to achieve a more complete assessmentof wetland health and functionality at any given site.
The resolution of the classification was much finer than we originally anticipated. Theability to achieve accurate results at a minimum mapping unit of 1/2 acre, allows theclassification to be sampled at a greater range of scales than we used in our analysis ofland type associations and watersheds. In addition the classification methodology can beused to retrospectively examine trends in the spread of reed canary grass in an area overtime, and to relate these trends to disturbance factors over time by classifying Landsatscenes from past years.
Our analysis of associated land cover was limited in scope and design. However theclassification provides a valuable data source for further work to analyze the mechanismsby which reed canary grass invades wetlands. In particular, controlled mesocosm studiesand site specific studies can now be supplemented by landscape scale analysis that caninclude information on a much larger number of sites. Further work is required todocument the connection to specific disturbance factors and to separate the role ofinherent characteristics of the plant that allow it to be highly invasive, versus the humandisturbance factors that both increase its opportunity to invade and weaken the ability ofnative plant assemblages to withstand invasion.
5.4 Some Recommendations for Further Analysis of Landscape FactorsAssociated with Reed Canary Grass Dominance
A major goal of this project was to provide a data source for further research. Furtherwork to identify the stressors associated with reed canary grass dominance in openwetlands should focus on the emergent/wet meadow cover type (“E” modifier in theWisconsin Wetland Inventory) and the palustrine hydrologic type (“K” modifier). Twopossible directions for further GIS analysis of the classification seem likely to be fruitful.One direction is to use the same sampling strategy we employed, using either watershedsor land type associations as sample units, but examine additional factors for a correlationto reed canary grass dominance in wetlands. A different sampling strategy focused onuniform sample sizes and random sampling should also be considered.
Reed Canary Grass Monitoring
- 41
5.4.1 Identify Soil Characteristics Associated with Reed Canary Grass Domination
An overlay of a digital soil coverage with the reed canary grass classification wouldprovide statistics on the soil characteristics associated with reed canary grass dominationin wetlands. The pattern of reed canary grass dominance shown in the Land TypeAssociation overlay, with very low percentages of reed canary grass in the Central Sandsareas with coarse textured soils and high percentages in glacial moraines, drumlins andtill plains, with finer grained soils suggests that soil texture and permeability is worthy offurther exploration. The Natural Resources Conservation Service is digitizing county soilsurveys with the goal of creating a GIS soils layer for Wisconsin that meets SSURGO(Soil Survey Geographic database) standards. This dataset includes a wealth ofinformation on hydric soils, textural type, soil permeability, and hydrologic classificationthat could be used to investigate correlations between reed canary grass dominatedwetlands and soil texture. Some preparation is required to create a usable single GIS layerfrom the individual county data. During this project we explored this line of investigationbut determined we did not have the resources available to complete a GIS analysis for thepilot area. However we found that usable digital soils surveys for at least 16 of the 23counties in the pilot area have been completed.
5.4.2 Examine the Relationship of Reed Canary Grass Domination to DrainageDitch Density
Another factor that could be linked to reed canary grass domination of wetlands is theconstruction of drainage ditches to convert wetlands for agricultural use. While manywetlands were converted to non-wetland through this process, many areas remainedwetland, but were hydrologically altered by partial drainage, and many of these aredominated by reed canary grass. Unfortunately complete drainage ditch data is notpresently available in any existing GIS waterway coverage. The 1:24,000 hydrographylayer created by the Department contains some waterways designated by drainage ditchbut only the larger drainage ditches, connected to existing streams were captured. It ispossible to create a drainage ditch digital layer by manually digitizing drainage ditchesfrom aerial photography interpretation. A landscape metric based on drainage ditchdensity could be used within a study region and selected sample areas chosen to representa range of drainage densities. These sample areas could be overlayed with the reed canarygrass classification to test for a correlation between drainage density and reed canarygrass domination.
5.4.3 Employ a Stratified Random Sampling Methodology
Another approach to sampling the reed canary grass classification to establishcorrelations with specific disturbance factors would be to randomly sample emergentwetlands within selected watersheds, each occurring within a relatively homogenousecological setting, but stratifying the sample by landscape position and hydrologicconnectivity similar to the stratified random sampling strategy outlined in Brooks, et al.
Bernthal and Willis
42 -
(2002). Though this sampling method was developed to assess condition at a watershedlevel it could also be used to create a data set to test correlations with reed canarydominance. Watersheds could be selected that lie completely within an ecological section(the next level above land type associations in the NHFEU system), or the more familiarecoregions of Wisconsin (Omernick, et al. 2000). Within the selected watersheds asample set of wetlands could be obtained by randomly selecting wetland polygons withemergent, palustrine modifiers from the Wisconsin Wetland Inventory. The "landscapecircle" strategy employed by Brooks, et al. (2002) could be employed by applying a 1 kmradius circle around the center point of the wetland to create uniformly sized sampleunits. Alternatively, sample areas that relate directly to water mediated stressors could bedrawn by delineating the direct watershed of the chosen wetland polygon, though sampleareas would then not be of uniform size.
The amount of the sample wetland in each reed canary grass cover class would bedetermined as the dependent variable. Land cover types, soil characteristics and otherlandscape variables of interest for which GIS data is available or feasible to create, couldthen be investigated within the sample areas. Where on the ground access is possible,sample wetlands could also be assessed using a Level 2 stressor checklist to identifydisturbances and the Wisconsin Floristic Quality Assessment as a Level 3 method toverify the condition of the wetland plant community.
Reed Canary Grass Monitoring
- 43
6. Using Classification Results for Condition Reporting andWetland Management
The classification can be used to characterize wetland conditions at the watershed orsubwatershed level or at the LTA level by identifying the location and extent of wetlandsin poor vegetative condition due to reed canary grass dominance. In conjunction withother land cover data, the extent of reed canary grass dominated wetlands contributes to aprofile of wetland condition in the landscape unit of interest. This is the type ofinformation that can provide an important element for a synoptic map (Leibowitz, et al.1992) for a region of interest. It can provide a "rough cut" picture of wetland condition.
In this section we offer a template for a way the classification in combination withcurrently available digital GIS data can be used for assessment and planning purposes,both across basins and within basins. This section is intended to provide one example ofhow information can be organized and analyzed, with the objective of targetingrestoration efforts for improving the biological condition of wetland plant communities,using the watersheds of the Upper Rock River Basin as examples.
The limits on interpreting classification results must, however, be kept in mind whenincorporating this data source into planning processes. Domination by reed canary grassreveals one aspect of the biotic condition of a wetland, but cannot be used as an overallsurrogate for biotic condition or as an indicator of all functions of a given wetland.Although a degraded biotic state influences other functions, there may be no predictablerelationship to help determine the significance of other wetland functions or the value ofthese functions to society. For instance, a wetland dominated by reed canary grass maystill serve the watershed in a flood storage capacity or as a pollution filter. It may wellretain some aesthetic, human-use, and wildlife value as well. It will fall to continuedresearch, from a range of disciplines, to determine how wetland biotic integrity affectsthe gamut of wetland functions. It is clear, though, that an area classified as dominated byreed canary grass may maintain needed wetland characteristics and should not be writtenoff as worthless. The classification can provide information to guide restoration andmanagement, but is not intended to designate “disposable” wetlands.
The results of the classification can best be integrated into current water quality programsby reporting results by watersheds within the geographic management units (GMUs) thatWisconsin DNR uses as administrative boundaries for carrying out water qualityplanning, monitoring, and management activities. These are based on, though not entirelysynonymous with, the major river basins of state. The term "basin," rather than GMU, ismore often used in communicating with the public and will be followed in thisdiscussion. Reporting by basin and watershed allows planners to compare their basin withthe rest of the state and compare watersheds within their basin.
Bernthal and Willis
44 -
Map 3 (page 24) shows the pilot area divided into basins and watersheds, with countylines and major lakes and rivers for reference. The pilot area contains parts of four basinsand almost all of two other basins, the Upper Rock River and the Lower Rock River.Because the watersheds of the Upper Rock River Basin were all included in theclassification and WISCLAND datasets, we will use that basin as an example.
An examination of Map 6 (page 31) shows that most of the watersheds of the Upper RockRiver Basin are in the top two classes of percent of heavily dominated wetlands,indicating that reed canary grass domination is a significant concern for the entire basin.Taken as a whole, the Upper Rock River Basin appears to be the basin within the projectstudy area whose wetlands are most strongly affected by reed canary grass domination.The Lower Rock River Basin (LR watershed code on Map 6), the Grant-Platte Basin(GP), and the Sugar-Pecatonica Basin (SP) also appear to be strongly affected. Thisinformation will be useful for allocation of resources and understanding the significanceof the issue at a statewide level.
Going to the basin level, we can look at priorities among the watersheds of the UpperRock River Basin. Figure 4 shows the percent of wetlands dominated by reed canarygrass in each watershed of the basin in bar chart form. This allows one to directlycompare watersheds based on this measure.
Figure 4 shows "wetland richness" of the watersheds of the Upper Rock River Basin,generated from the digital Wisconsin Wetlands Inventory. The current percent of eachwatershed that is wetland can be a useful "first cut" watershed metric, to provide anestimate of the importance of wetlands to the hydrologic stability of streams in thewatershed. Research in nine watersheds in southeast Wisconsin showed significantlylower hydrologic stability in streams when current wetland acreage is below 6-10% of thewatershed (Hey and Wickencamp 1998). Note that the watersheds of the Upper RockBasin are all above this threshold. Map 8 (page 46) depicts wetland richness grouped intoclasses for the entire study area.
"Wetland richness" is also useful in understanding the comparative significance of thereed canary grass domination percentage across watersheds. Ideally, current wetlandrichness should be supplemented by an estimate of the extent of wetlands lost in eachwatershed. This can be estimated by comparing mapped hydric soils to the currentwetland inventory. That exercise is beyond the scope of this project, but is beingconducted in a Milwaukee River Basin Wetlands Assessment project.
Taken together these two metrics give an impression of the significance of reed canarygrass domination in a given watershed from a biological diversity perspective. Table 4shows these two metrics in sequence, with watersheds ranked by wetland richness in thefirst column followed by extent of reed canary grass dominance in the second. AppendixB shows these metrics for basins and watersheds of the entire project study area. Forexample, Calamus Creek watershed could be viewed as a priority for restoration toimprove biological diversity because it has the highest level of plant community

Reed Canary Grass Monitoring
- 45
degradation in wetlands, and wetlands are a significant element in that watershed. Thecontiguous watershed to the east, the Beaver Dam River watershed also has high wetlandrichness and reed canary grass invasion.
Figure 4. Percent Wetlands Dominated by Reed Canary Grass in Each Watershedand Wetland Richness in Each Watershed.
Watersheds of the Upper Rock BasinPercent Wetlands In Each Watershed
10.68 10.72
11.9612.61 12.74 13.02
14.3414.76
15.80
17.4518.04
18.77
24.53
0 %
5 %
10 %
15 %
20 %
25 %
Upp
er C
rawf
ish
Rive
r
Lowe
r Cr
awfish
River
Mau
nesh
a Ri
ver
East
Bra
nch
Rock
River
Rubico
n Ri
ver
Oco
nomow
oc R
iver
Middle
Rock
River
Siniss
ippi L
ake
Beav
er D
am R
iver
Ash
ippu
n Ri
ver
John
son
Cree
k
Calamus
Cre
ek
Upp
er R
ock
Rive
r
Perc
ent
Wet
land
s
Watersheds of the Upper Rock Basin Percent of Wetlands In Each Reed Canary Grass (RCG) Class
17.0 15.9
25.819.3
13.27.8 8.5
22.7 22.114.5
19.027.0
17.1
0%
10%
20%
30%
40%
50%
60%
70%
80%
90%
100%
Upp
er C
rawf
ish
Rive
r
Lowe
r Cr
awfish
River
Mau
nesh
a Ri
ver
East
Bra
nch
Rock
Rive
r
Rubi
con
Rive
r
Oco
nomow
oc R
iver
Middle
Rock
River
Siniss
ippi L
ake
Beav
er D
am R
iver
Ash
ippu
n Ri
ver
John
son
Cree
k
Calamus
Cre
ek
Upp
er R
ock
Rive
r
Reed Canary Grass Classes
Perc
ent
of W
etland
sin E
ach
RCG
Clas
s
Heavily Dominant (80-100% RCG) Co-dominant (50-79% RCG) Absent to Sub-dominant (0-49% RCG)

UF13-111
UF14-111UF10-111 UF11-111
UF15-111
UR03-011
UR04-011
UR08-011
UR11-011
UR02-011
UR10-011
UR05-011
LW25-172
LW27-172
LW24-172
LW23-172
LW26-172
LW21-172LW13-173 LW20-173LW22-172
LW19-173
LW12-173
UR06-011
LW16-173
LW14-173LR09-012LW18-173
LR10-012LW17-173
LW09-173 LW11-173 LW15-173
UF07-111
UF12-111
UR12-011
UR13-011
UR01-011
LR12-012 UR07-011
LR08-012
LR06-012
LR11-012
UR09-011
SP15-180
SP06-190SP05-190
SP13-180
SP16-180SP09-190 LR15-012LR07-012
LR14-012SP14-180
SP04-190LR04-012
LR05-012
SP10-190
GP03-200SP08-190
SP03-190
LR02-012
GP01-200 LR01-012
SP12-180
SP02-190 LR03-012
SP11-180SP07-190
SP01-190
GP02-200
Dane
Sauk
Iowa
Rock
Dodge
Grant
Green
Juneau Adams
Lafayette
Jefferson
Richland
Marquette
Walworth
Green Lake
Waukesha
Washington
Monroe
Vernon
Waushara
Winnebago
Columbia
Fond du Lac
Class 1 (0.000 - 2.713%)
Class 2 (2.714 - 6.050%)
Class 3 (6.051 - 12.711%)
Class 4 (12.712 - 25.000%)
M ap 8: ExtentofW etlandsin Each W atershed.
Wetland Areas(as percentage of total land area ineach watershed)
GMU Boundaries
Watershed Boundaries
County Boundaries
Landsat 7Pilot Area
0 20Miles
105
46-
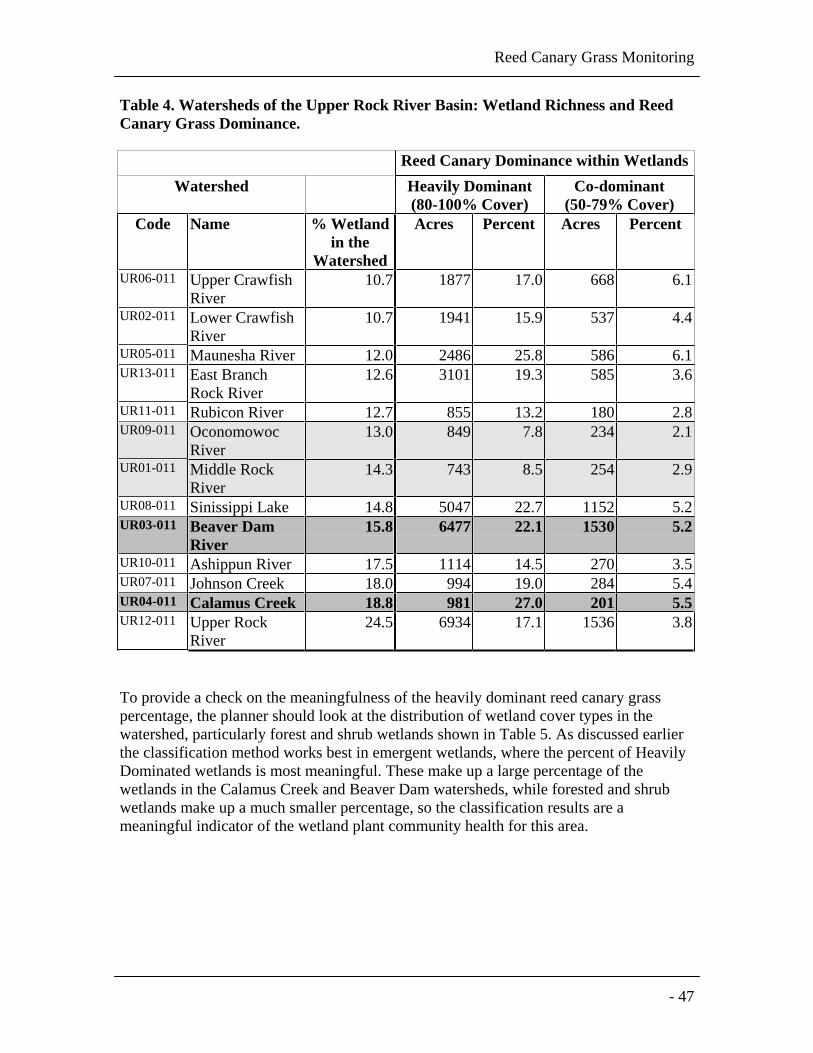
Reed Canary Grass Monitoring
- 47
Table 4. Watersheds of the Upper Rock River Basin: Wetland Richness and ReedCanary Grass Dominance.
Reed Canary Dominance within WetlandsWatershed Heavily Dominant
(80-100% Cover)Co-dominant
(50-79% Cover)Code Name % Wetland
in theWatershed
Acres Percent Acres Percent
UR06-011 Upper CrawfishRiver
10.7 1877 17.0 668 6.1
UR02-011 Lower CrawfishRiver
10.7 1941 15.9 537 4.4
UR05-011 Maunesha River 12.0 2486 25.8 586 6.1UR13-011 East Branch
Rock River12.6 3101 19.3 585 3.6
UR11-011 Rubicon River 12.7 855 13.2 180 2.8UR09-011 Oconomowoc
River13.0 849 7.8 234 2.1
UR01-011 Middle RockRiver
14.3 743 8.5 254 2.9
UR08-011 Sinissippi Lake 14.8 5047 22.7 1152 5.2UR03-011 Beaver Dam
River15.8 6477 22.1 1530 5.2
UR10-011 Ashippun River 17.5 1114 14.5 270 3.5UR07-011 Johnson Creek 18.0 994 19.0 284 5.4UR04-011 Calamus Creek 18.8 981 27.0 201 5.5UR12-011 Upper Rock
River24.5 6934 17.1 1536 3.8
To provide a check on the meaningfulness of the heavily dominant reed canary grasspercentage, the planner should look at the distribution of wetland cover types in thewatershed, particularly forest and shrub wetlands shown in Table 5. As discussed earlierthe classification method works best in emergent wetlands, where the percent of HeavilyDominated wetlands is most meaningful. These make up a large percentage of thewetlands in the Calamus Creek and Beaver Dam watersheds, while forested and shrubwetlands make up a much smaller percentage, so the classification results are ameaningful indicator of the wetland plant community health for this area.
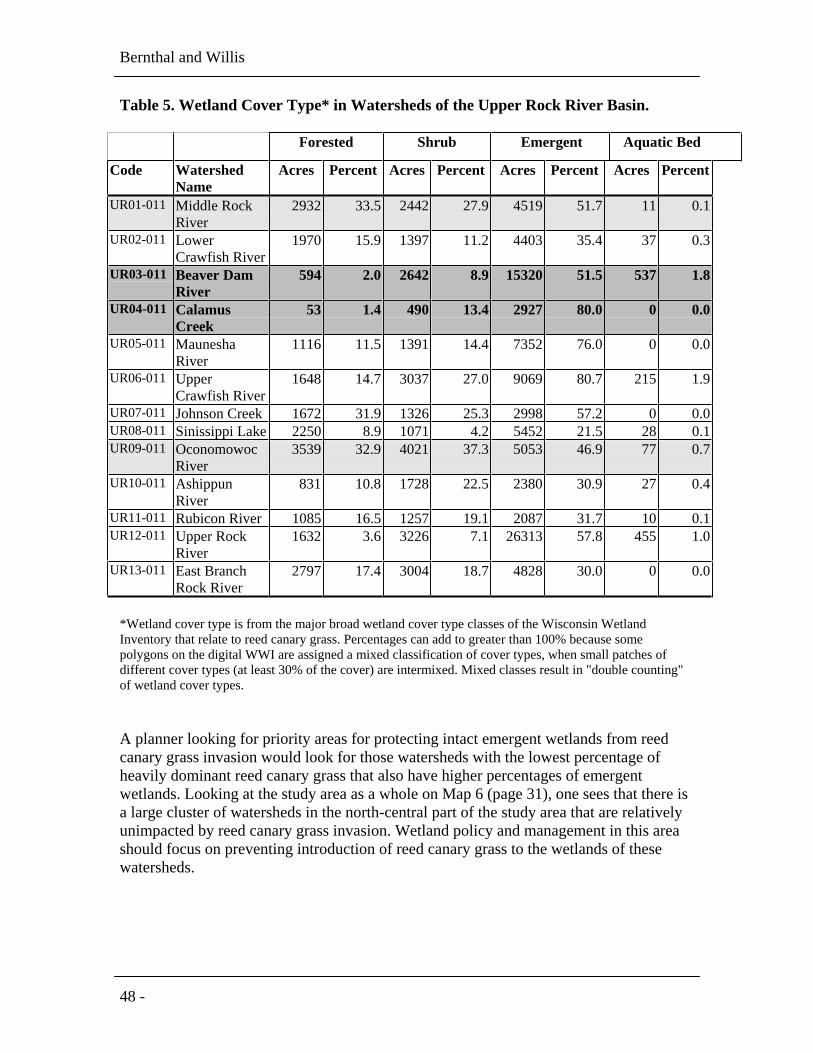
Bernthal and Willis
48 -
Table 5. Wetland Cover Type* in Watersheds of the Upper Rock River Basin.
Forested Shrub Emergent Aquatic Bed
Code WatershedName
Acres Percent Acres Percent Acres Percent Acres Percent
UR01-011 Middle RockRiver
2932 33.5 2442 27.9 4519 51.7 11 0.1
UR02-011 LowerCrawfish River
1970 15.9 1397 11.2 4403 35.4 37 0.3
UR03-011 Beaver DamRiver
594 2.0 2642 8.9 15320 51.5 537 1.8
UR04-011 CalamusCreek
53 1.4 490 13.4 2927 80.0 0 0.0
UR05-011 MauneshaRiver
1116 11.5 1391 14.4 7352 76.0 0 0.0
UR06-011 UpperCrawfish River
1648 14.7 3037 27.0 9069 80.7 215 1.9
UR07-011 Johnson Creek 1672 31.9 1326 25.3 2998 57.2 0 0.0UR08-011 Sinissippi Lake 2250 8.9 1071 4.2 5452 21.5 28 0.1UR09-011 Oconomowoc
River3539 32.9 4021 37.3 5053 46.9 77 0.7
UR10-011 AshippunRiver
831 10.8 1728 22.5 2380 30.9 27 0.4
UR11-011 Rubicon River 1085 16.5 1257 19.1 2087 31.7 10 0.1UR12-011 Upper Rock
River1632 3.6 3226 7.1 26313 57.8 455 1.0
UR13-011 East BranchRock River
2797 17.4 3004 18.7 4828 30.0 0 0.0
*Wetland cover type is from the major broad wetland cover type classes of the Wisconsin WetlandInventory that relate to reed canary grass. Percentages can add to greater than 100% because somepolygons on the digital WWI are assigned a mixed classification of cover types, when small patches ofdifferent cover types (at least 30% of the cover) are intermixed. Mixed classes result in "double counting"of wetland cover types.
A planner looking for priority areas for protecting intact emergent wetlands from reedcanary grass invasion would look for those watersheds with the lowest percentage ofheavily dominant reed canary grass that also have higher percentages of emergentwetlands. Looking at the study area as a whole on Map 6 (page 31), one sees that there isa large cluster of watersheds in the north-central part of the study area that are relativelyunimpacted by reed canary grass invasion. Wetland policy and management in this areashould focus on preventing introduction of reed canary grass to the wetlands of thesewatersheds.
Reed Canary Grass Monitoring
- 49
Within the Upper Rock River Basin, there are few watersheds with low percentages ofheavily dominated wetlands, but relatively speaking, the Oconomowoc and Middle Rockriver watersheds have the lowest extent of reed canary grass domination, yet are in themid-range of "wetland richness." These watersheds have a fairly even distribution ofplant communities, but emergent wetlands make up the largest category (46.9% and52.7%, respectively) of cover types.
In addition to the watershed reports above, an overlay of the LTA (Map 5, page 27) andthe WISCLAND coverages for the basin and its watersheds will be useful to understandthe physical setting within which these wetlands occur. These can be overlaid with thewatershed boundaries to better understand land cover and ecological setting for eachwatershed. Table 5 shows the current wetland richness and percent of wetlands heavilydominated by reed canary grass for each watershed in the Upper Rock River Basin. Aplanner in the Upper Rock River Basin could look at the LTAs within the basin followingthe same process outlined for selecting watersheds and compare the selected areas. Thiscould help in refining boundaries for landscape scale restoration or management projects.
In addition to a watershed focus, the reed canary grass classification can be a useful toolfor land managers at the site level and at other regions of interest. In addition towatersheds, for example, wetland restoration and management efforts might beundertaken at a county level, for a national forest, or for a wildlife refuge. Because theclassification covers a large area yet maps down to 0.5 acre in a GIS format, it can beused as an element for a wide variety of projects and at various scales.
Ecoregional units of analysis rather than watersheds might organize some planningefforts. Map 7 (page 33) shows the results of the classification tabulated for the 78 LTAs,within the pilot area, grouped into classes of reed canary grass dominance. The tabularvalues from which this map is produced are found in Appendix D.

Bernthal and Willis
50 -
Reed Canary Grass Monitoring
- 51
7. Summary
The reed canary grass classification developed in this project provides a useful, cost-effective element for watershed-based monitoring and management of wetlands. Theability to classify to a minimum mapping unit of 0.5 acre with an overall accuracy of71% and a user's accuracy of 86% for the heavily dominant class, should allow theclassification to be used for a wide variety of land management and planning purposes.We can say with a high level of confidence that reed canary grass dominates at least102,868 acres of wetlands in the study area, a strong indication of poor biotic condition.Further research into the control of this species and efforts to prevent its spread areclearly warranted.
In conjunction with other GIS data layers, the classification can be used to create a mapof wetland plant community condition for open, non-forested wetlands at both awatershed scale and at larger sites. This information will improve our ability tocharacterize this aspect of wetland condition at the watershed scale for use in "State ofthe Basin" and “305(b)” reports to U.S. EPA on wetland condition. It will not by itselfallow a comprehensive evaluation of wetland condition, because it cannot be used todistinguish across the entire range of wetland integrity. It does, however, yield usefulinformation on the "poor" end of the vegetative integrity spectrum.
The classification will be carried out in a neighboring Landsat scene covering thesoutheastern portion of the state. This will allow us to gather further information on thecost of implementation. It will be used as a data source in GIS-based decision supporttools being developed to aid wetland planning in the Milwaukee River Basin.
In addition to wetland condition reporting and watershed planning, the classification canbe used by researchers studying the dynamics of reed canary grass invasion by providingaccurate data on the spatial distribution of reed canary grass in 1999. A futureclassification using our protocol could show the trend in reed canary grass distribution fora focus area within the pilot study zone. Similarly, retrospective studies could be doneusing our protocol to look back in time and measure the trend in reed canary grassdomination for a given area by using our protocol to classify data from a series ofLandsat TM images. Extending the classification to remaining unmapped areas of thestate could provide valuable baseline data and perhaps direct an important early warningsignal toward watersheds and localities where reed canary grass is beginning to dominateopen wetlands.

Bernthal and Willis
52 -
Reed Canary Grass Monitoring
- 53
8. Literature Cited
Bernthal, T.W. 2001. Wetland monitoring strategies: one step at a time. WisconsinDepartment of Natural Resources, Madison.
Bernthal, T.W. 2003. Development of a floristic quality assessment methodology forWisconsin. Wisconsin Department of Natural Resources, Madison. [PUB-SS-9862003].
Brooks, R.P., C.A. Cole, D.H. Wardrop, L. Bischel-Machung, D.J. Prosser, D.A.Campbell, and M.T. Gaudette. 1996. Wetlands, wildlife and watershed assessmenttechniques for evaluation and restoration (W3ATER). Vol. 1, 2A, and 2B, Penn StateCooperative Wetlands Center, University Park, Pennsylvania. 782 pp. [Report 96-2].
Brooks, R.P., D.H. Wardrop, and J.A. Bishop. 2002. Watershed-based protection forwetlands in Pennsylvania: Levels 1 & 2 - Synoptic maps and rapid field assessments.Final Report to Pennsylvania Department of Environmental Protection. Report No.2002-2, Penn State Cooperative Wetlands Center, Pennsylvania State University,University Park, Pennsylvania.
Carpenter, A.T., T.A. Murray, and J. Buxbaum. 2002. Inventorying and mappinginvasive plants. Natural Areas Journal 22(2):163-165.
Corsi, S. R., D.J. Graczyk, D.W. Owens, and R. T. Bannerman. 1997. Unit-area loads ofsuspended solids, and total phosphorus from small watersheds in Wisconsin. UnitedStates Geological Survey, Fact Sheet FS-195-97.
Cleland, D.T. P. E. Avers, W. H. McNab, M.E. Jensen, R.G. Bailey, T. King, and W.E.Russell. 1997. National Hierarchical Framework of Ecological Units. Pp. 181-200. InM.S. Boyce and A. Haney (eds). Ecosystem Management: Applications forSustainable Forest and Wildlife Resources. Yale University Press, New Haven &London.
Galatowisch, S.M., N.O. Anderson, and P.D. Ascher. 1999. Invasiveness in wetlandplants in temperate North America. Wetlands 19:733-755.
Green, E.K. and S.M. Galatowisch. 2001. Difference in wetland plant communityestablishment with additions of nitrate-N and invasive species (Phalaris arudinaceaand Typha x glauca). Canadian Journal of Botany 79:170-178.
Henderson, R. 1987. Status and control of purple loosestrife in Wisconsin. Research/Management Findings (4):1-4. Bureau of Research, Wisconsin Department of NaturalResources, Madison.
Hey, D. L. and J. A. Wickencamp. 1998. Effect of wetlands on modulating hydrologicregimes in nine Wisconsin watersheds. Water Resources and the Urban Environment.American Society of Civil Engineers, Weston, Virginia.
Holden, E.D. and A.R. Albert. 1933. Reed canary grass for Wisconsin lowlands.Wisconsin Agricultural Extension Service Circular 264, Madison.
Johnston, C. 1976. Wetland use in Wisconsin: Historical perspectives and presentpicture. Wisconsin Department of Natural Resources, Madison.
Jordan, J.K., E.A. Padley, and D.T. Cleland. 2001. Landtype associations: concepts anddevelopment in Lake States National Forests. In Smith, M.L. (ed). LandtypeAssociations: Development and Use in Natural Resources Management, Planning,and Research. Proceedings of the Conference. 2001 April 24-26. Madison,Wisconsin.
Bernthal and Willis
54 -
Karr, J.R. 1993. Defining and assessing ecological integrity: beyond water quality.Environmental Toxicology and Chemistry 12:1521-1531.
Karr, J.R. and D.R. Dudley. 1981. Ecological perspective on water quality goals.Environmental Management 5(1): 55-68.
Leibowitz, S.G., B. Abbruzzese, P.R. Adamus, L.E. Hughes and J.T. Irish. 1992. Asynoptic approach to cumulative impact assessment: a proposed methodology. U.S.Environmental Protection Agency, Environmental Research Laboratory, Corvallis,OR. [EPA/600/R-92/167].
Lillesand, T., J. Chipman, D. Nagel, H. Reese, M. Bobo, and R. Goldman. 1998. UpperMidwest gap analysis program image processing protocol. Report to theEnvironmental Management Technical Center of the U.S. Geological Survey,Onalaska , Wisconsin. [EMTC 98-G001].
Lillie, R.A. 2000. Development of a biological index and classification system forWisconsin wetlands using macroinvertebrates and plants. Wisconsin Department ofNatural Resources, Madison.
Lillie, R.A., P. Garrison, S.I. Dodson, R. Bautz, and G. LaLiberte. 2002. Refinement andexpansion of biological indices for Wisconsin wetlands. Wisconsin Department ofNatural Resources, Madison. [PUB-SS-968 2002].
Lopez, R.D., C.M. Edmonds, D.T. Heggem, A.C. Neale, K.B. Jones, E.T. Slonecker, E.Jaworski, D. Garofalo, and D. Williams. 2004 (in press). An ecological assessment ofopportunistic plant species in Great Lakes coastal wetlands using airbornehyperspectral data In R.S. Lunetta and J.G. Lyon (eds). Remote Sensing and GISAccuracy Assessment. CRC Press, Boca Raton, FL.
Maurer, D.A., R. Lindig-Cisneros, K.J. Werner, S. Kercher, R. Miller, and J.B. Zedler.2003. The replacement of wetland vegetation by reed canary grass (Phalarisarundinacea). Ecological Restoration 21(2).
Omernick, J.M., S.C. Chapman, R.A. Lillie, and R.T. Dumke. 2000. Ecoregions ofWisconsin. Transactions of the Wisconsin Academy of Sciences, Arts, and Letters88:77-103.
Panuska, J.C. and R.A. Lillie. 1995. Phosphorus loadings from Wisconsin watersheds:recommended phosphorus export coefficients for agricultural and forestedwatersheds. Research/Management Findings 38:1-8. Bureau of Research, WisconsinDepartment of Natural Resources, Madison.
Reckhow, K.H., M.N. Beaulac, and J.T. Simpson. 1980. Modeling phosphorus loadingand lake response under uncertainty: a manual and compilation of export coefficients.U.S. Environmental Protection Agency. [EPA Report 440/5-80-011].
Reinartz, J. 2003. IPAW Working List of the Invasive Plants of Wisconsin – March2003: A call for comments and information. Plants Out of Place, the newsletter of theInvasive Plants Association of Wisconsin. Issue 4.
Schrader, S. and R. Pouncey. 1997. ERDAS Field Guide, Fourth Edition. Documentationfor ERDAS Imagine Version 8.4. ERDAS, Inc., Atlanta, GA.
U.S. Environmental Protection Agency. 2002. Elements of a wetland monitoring andassessment program. U.S. Environmental Protection Agency, Washington, DC. InDraft.
Werner, K.J. and J.B. Zedler. 2002. How sedge meadow soils, microtopography, andvegetation respond to sedimentation. Wetlands 22(3).
Reed Canary Grass Monitoring
- 55
Wisconsin Department of Natural Resources. 1992. Wisconsin Wetland InventoryClassification Guide. Wisconsin Department of Natural Resources, Madison. [Publ-WZ-WZ023].
Wisconsin Department of Natural Resources Wetland Team. 2000. Reversing the Loss: AStrategy for Protecting and Restoring Wetlands in Wisconsin. Wisconsin Departmentof Natural Resources, Madison. [PUB-FH-232 2000].
Woods, B. 2003. Personal communication. Bureau of Integrated Science Services,Wisconsin Department of Natural Resources, Madison.

Bernthal and Willis
56 -
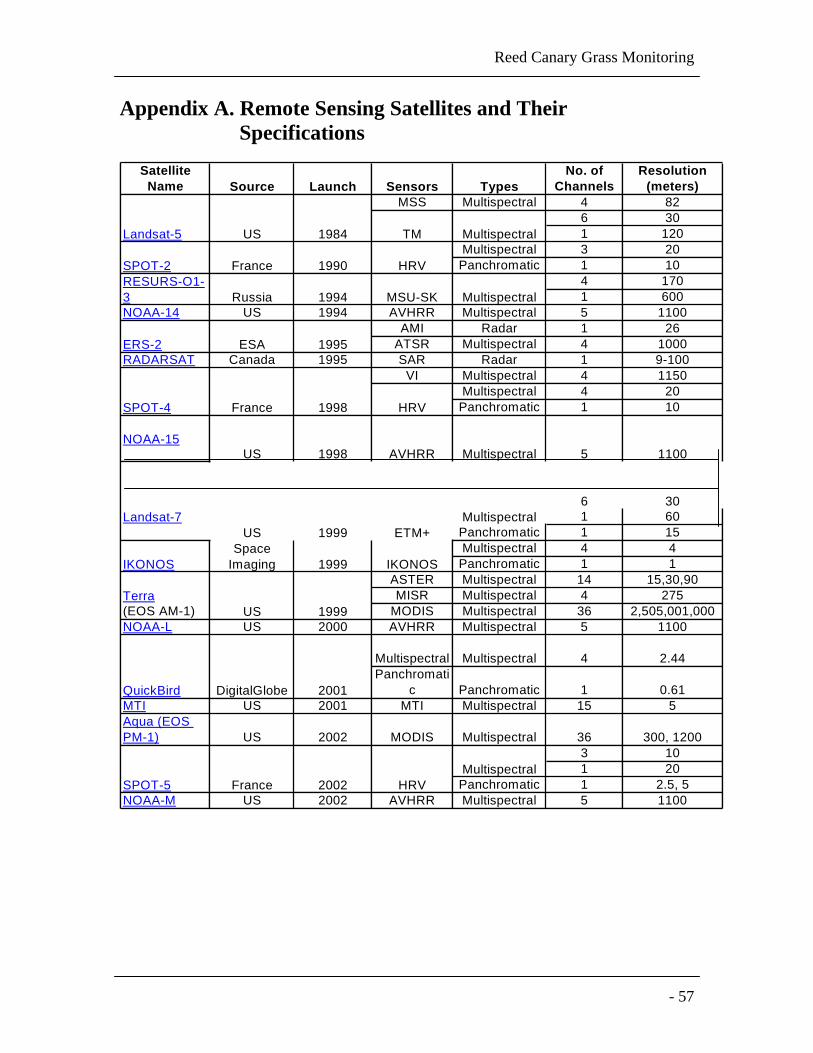
Reed Canary Grass Monitoring
- 57
Appendix A. Remote Sensing Satellites and TheirSpecifications
Satellite No. of ResolutionName Channels (meters)
MSS Multispectral 4 826 301 120
Multispectral 3 20Panchromatic 1 10
4 1701 600
NOAA-14 US 1994 AVHRR Multispectral 5 1100AMI Radar 1 26
ATSR Multispectral 4 1000RADARSAT Canada 1995 SAR Radar 1 9-100
VI Multispectral 4 1150Multispectral 4 20Panchromatic 1 10
1 60Panchromatic 1 15Multispectral 4 4Panchromatic 1 1
ASTER Multispectral 14 15,30,90MISR Multispectral 4 275
(EOS AM-1) MODIS Multispectral 36 2,505,001,000NOAA-L US 2000 AVHRR Multispectral 5 1100
Multispectral Multispectral 4 2.44Panchromati
c Panchromatic 1 0.61MTI US 2001 MTI Multispectral 15 5Aqua (EOS PM-1) US 2002 MODIS Multispectral 36 300, 1200
3 101 20
Panchromatic 1 2.5, 5NOAA-M US 2002 AVHRR Multispectral 5 1100
MultispectralSPOT-5 France 2002 HRV
TerraUS 1999
QuickBird DigitalGlobe 2001
IKONOSSpace
Imaging 1999 IKONOS
5 1100
Multispectral6 30
US 1999 ETM+
MultispectralNOAA-15
US 1998 AVHRR
SPOT-4 France 1998 HRV
Landsat-7
MultispectralRESURS-O1-3 Russia 1994 MSU-SK
ERS-2 ESA 1995
Multispectral
SPOT-2 France 1990 HRV
Landsat-5 US 1984 TM
Source Launch Sensors Types

Bernthal and Willis
58 -
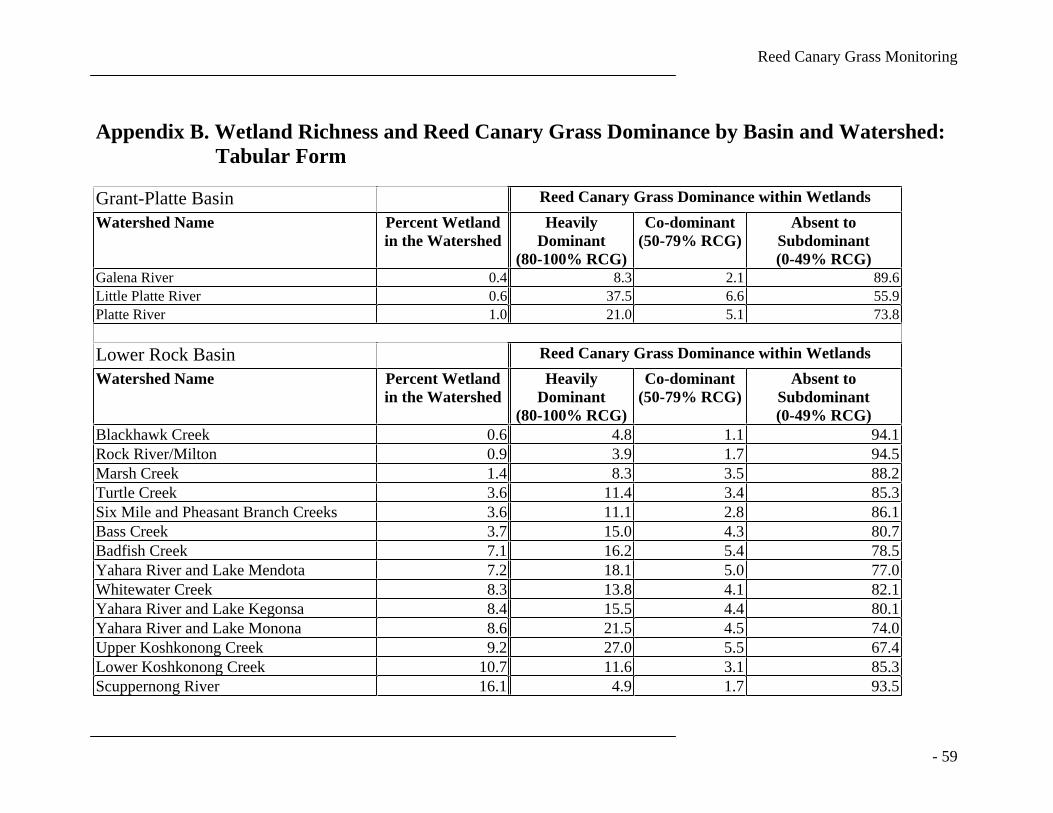
Reed Canary Grass Monitoring
- 59
Appendix B. Wetland Richness and Reed Canary Grass Dominance by Basin and Watershed:Tabular Form
Grant-Platte Basin Reed Canary Grass Dominance within WetlandsWatershed Name Percent Wetland
in the WatershedHeavily
Dominant(80-100% RCG)
Co-dominant(50-79% RCG)
Absent toSubdominant(0-49% RCG)
Galena River 0.4 8.3 2.1 89.6Little Platte River 0.6 37.5 6.6 55.9Platte River 1.0 21.0 5.1 73.8
Lower Rock Basin Reed Canary Grass Dominance within WetlandsWatershed Name Percent Wetland
in the WatershedHeavily
Dominant(80-100% RCG)
Co-dominant(50-79% RCG)
Absent toSubdominant(0-49% RCG)
Blackhawk Creek 0.6 4.8 1.1 94.1Rock River/Milton 0.9 3.9 1.7 94.5Marsh Creek 1.4 8.3 3.5 88.2Turtle Creek 3.6 11.4 3.4 85.3Six Mile and Pheasant Branch Creeks 3.6 11.1 2.8 86.1Bass Creek 3.7 15.0 4.3 80.7Badfish Creek 7.1 16.2 5.4 78.5Yahara River and Lake Mendota 7.2 18.1 5.0 77.0Whitewater Creek 8.3 13.8 4.1 82.1Yahara River and Lake Kegonsa 8.4 15.5 4.4 80.1Yahara River and Lake Monona 8.6 21.5 4.5 74.0Upper Koshkonong Creek 9.2 27.0 5.5 67.4Lower Koshkonong Creek 10.7 11.6 3.1 85.3Scuppernong River 16.1 4.9 1.7 93.5

Bernthal and Willis
60 -
Lower Wisconsin Basin Reed Grass Canary Dominance within WetlandsWatershed Name Percent Wetland
in the WatershedHeavily
Dominant(80-100% RCG)
Co-dominant(50-79% RCG)
Absent toSubdominant(0-49% RCG)
Black Earth Creek 2.3 21.7 8.0 70.3Upper Pine River 2.9 17.2 10.0 72.9Willow Creek 3.7 10.1 5.9 84.0Narrows Creek and Baraboo River 4.1 12.8 5.3 81.9Blue River 4.2 5.6 2.9 91.5Seymour Creek and Upper Baraboo River 4.2 13.3 8.0 78.6Otter and Morrey Creeks 4.6 5.3 3.4 91.3Crossman Creek and Little Baraboo River 4.6 5.2 3.6 91.2Lake Wisconsin 4.8 3.0 1.3 95.6Dell Creek 5.5 4.1 2.8 93.1Mill and Blue Mounds Creek 5.5 4.2 3.2 92.6Honey Creek 6.7 12.5 5.2 82.3Duck and Plainville Creeks 7.7 0.2 0.3 99.5Bear Creek 7.8 4.0 2.4 93.6Roxbury Creek 9.8 11.3 2.1 86.6Lower Lemonweir River 13.2 4.2 2.1 93.7Lower Baraboo River 16.6 3.7 1.3 95.0Duck Creek and Rocky Run 17.8 6.7 2.4 90.9

Reed Canary Grass Monitoring
- 61
Sugar-Pecatonica Basin Reed Grass Canary Dominance within WetlandsWatershed Name Percent Wetland
in the WatershedHeavily
Dominant(80-100% RCG)
Co-dominant(50-79% RCG)
Absent toSubdominant(0-49% RCG)
Honey and Richland Creeks 0.2 13.3 7.5 79.2Middle Pecatonica River 0.3 21.1 7.6 71.3Lower Pecatonica River 0.3 17.5 3.3 79.2Upper West Branch Pecatonica River 0.6 12.8 6.0 81.2Upper East Branch Pecatonica River 0.9 13.6 7.6 78.8Gordon Creek 1.0 16.4 7.0 76.6Mineral Point and Sudan Branches 1.0 16.9 8.4 74.7Yellowstone River 1.7 11.9 7.0 81.2Lower East Branch Pecatonica Rivers 2.2 21.4 6.9 71.7Jordan and Skinner Creeks 2.6 27.3 9.1 63.6West Branch Sugar River/Mt. VernonCreek
2.6 21.9 12.1 66.1
Upper Sugar River 3.3 22.6 8.3 69.1Little Sugar River 3.8 18.8 8.5 72.8Lower Middle Sugar River 4.3 12.3 3.7 84.0Lower Sugar River 5.0 6.8 2.8 90.4Allen Creek and Middle Sugar River 6.1 15.7 6.2 78.0
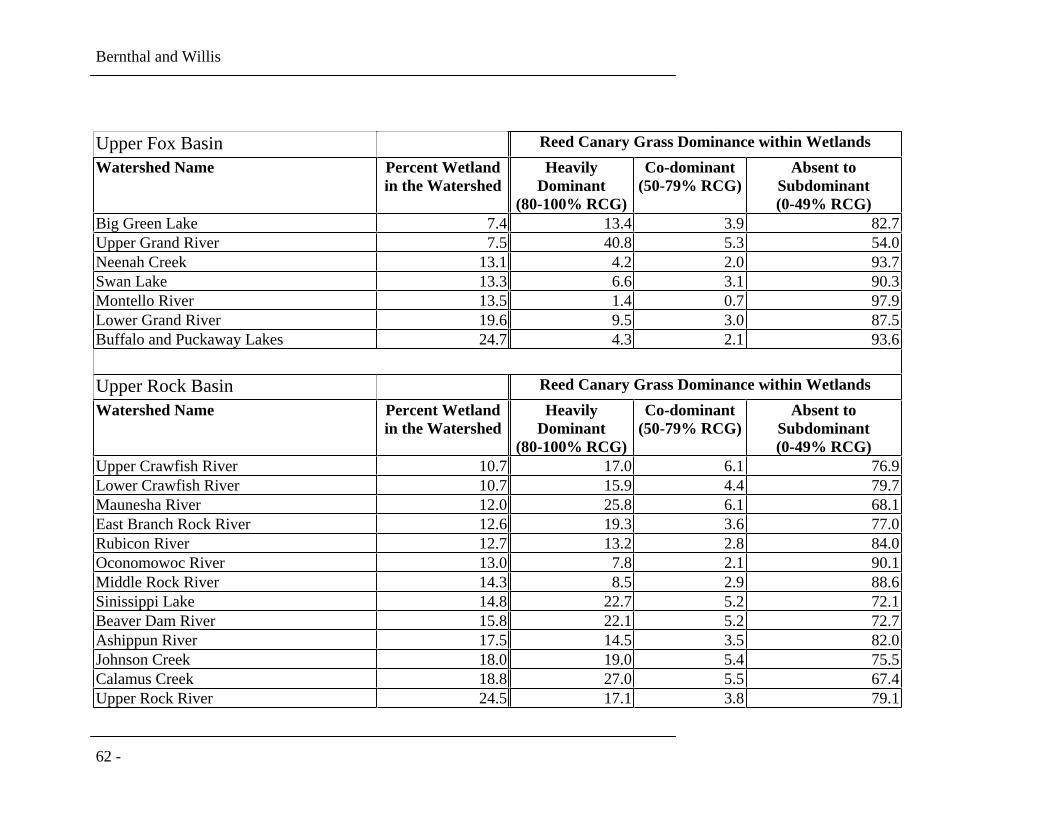
Bernthal and Willis
62 -
Upper Fox Basin Reed Canary Grass Dominance within WetlandsWatershed Name Percent Wetland
in the WatershedHeavily
Dominant(80-100% RCG)
Co-dominant(50-79% RCG)
Absent toSubdominant(0-49% RCG)
Big Green Lake 7.4 13.4 3.9 82.7Upper Grand River 7.5 40.8 5.3 54.0Neenah Creek 13.1 4.2 2.0 93.7Swan Lake 13.3 6.6 3.1 90.3Montello River 13.5 1.4 0.7 97.9Lower Grand River 19.6 9.5 3.0 87.5Buffalo and Puckaway Lakes 24.7 4.3 2.1 93.6
Upper Rock Basin Reed Canary Grass Dominance within WetlandsWatershed Name Percent Wetland
in the WatershedHeavily
Dominant(80-100% RCG)
Co-dominant(50-79% RCG)
Absent toSubdominant(0-49% RCG)
Upper Crawfish River 10.7 17.0 6.1 76.9Lower Crawfish River 10.7 15.9 4.4 79.7Maunesha River 12.0 25.8 6.1 68.1East Branch Rock River 12.6 19.3 3.6 77.0Rubicon River 12.7 13.2 2.8 84.0Oconomowoc River 13.0 7.8 2.1 90.1Middle Rock River 14.3 8.5 2.9 88.6Sinissippi Lake 14.8 22.7 5.2 72.1Beaver Dam River 15.8 22.1 5.2 72.7Ashippun River 17.5 14.5 3.5 82.0Johnson Creek 18.0 19.0 5.4 75.5Calamus Creek 18.8 27.0 5.5 67.4Upper Rock River 24.5 17.1 3.8 79.1
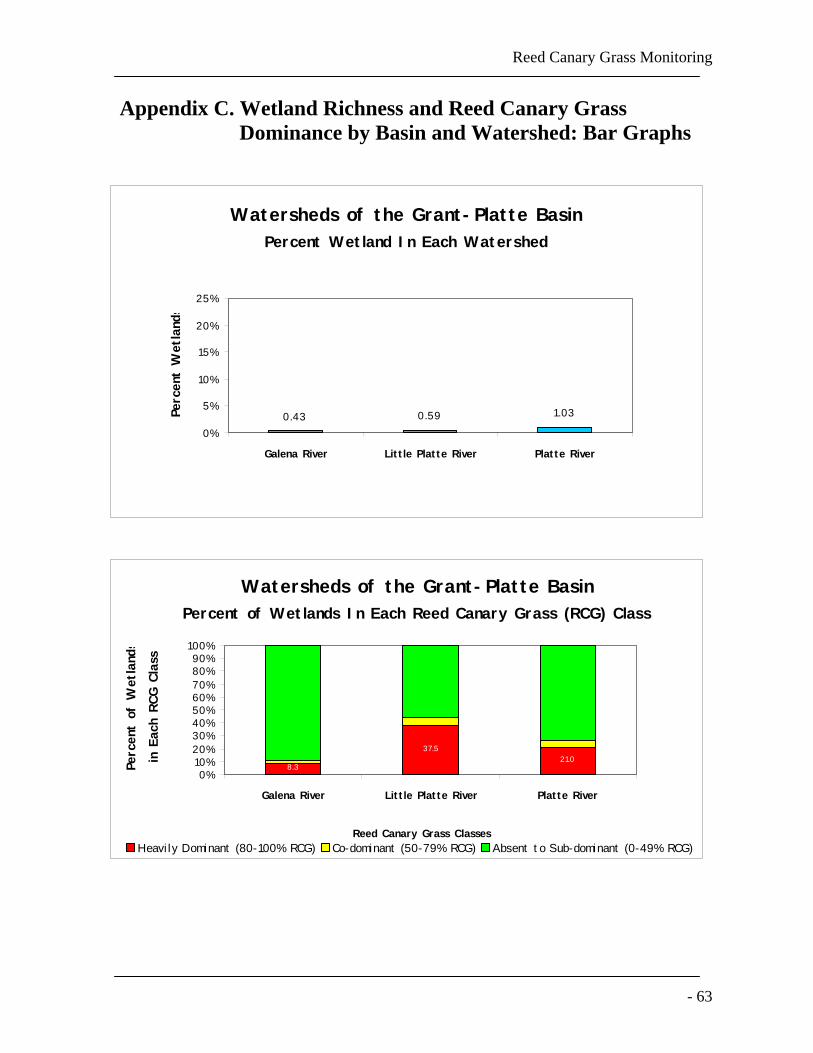
Reed Canary Grass Monitoring
- 63
Appendix C. Wetland Richness and Reed Canary GrassDominance by Basin and Watershed: Bar Graphs
Watersheds of the Grant-Platte BasinPercent Wetland In Each Watershed
1.030.590.430%
5%
10%
15%
20%
25%
Galena River Little Platte River Platte River
Perc
ent
Wet
land
s
Watersheds of the Grant-Platte Basin Percent of Wetlands In Each Reed Canary Grass (RCG) Class
37.521.0
8.30%
10%20%30%40%50%60%70%80%90%
100%
Galena River Little Platte River Platte River
Reed Canary Grass Classes
Perc
ent
of W
etland
s
in E
ach
RCG
Clas
s
Heavily Dominant (80-100% RCG) Co-dominant (50-79% RCG) Absent to Sub-dominant (0-49% RCG)
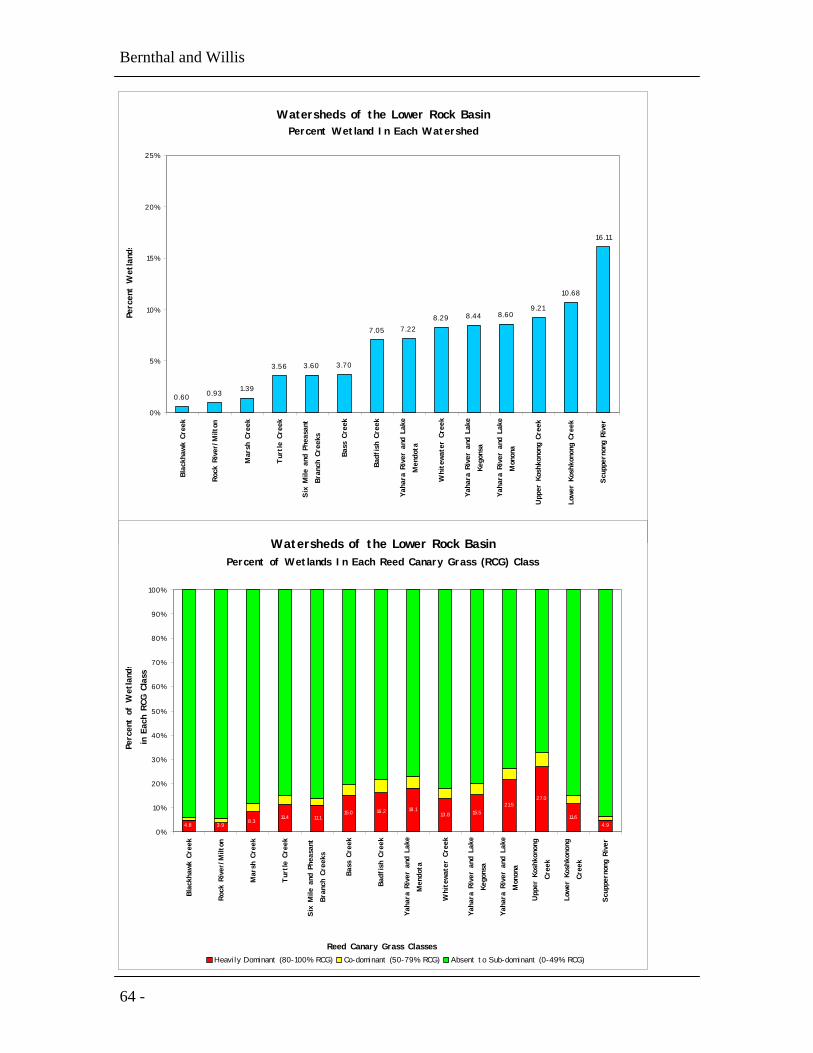
Bernthal and Willis
64 -
Watersheds of the Lower Rock BasinPercent Wetland In Each Watershed
0.60 0.93 1.39
3.56 3.60 3.70
7.05 7.228.29 8.44 8.60
9.21
10.68
16.11
0%
5%
10%
15%
20%
25%
Blac
khaw
k Cr
eek
Rock
River
/Milt
on
Mar
sh C
reek
Tur
tle
Cree
k
Six
Mile
and
Phe
asan
tBr
anch
Cre
eks
Bass
Cre
ek
Badf
ish
Cree
k
Yaha
ra R
iver
and
Lak
eM
endo
ta
White
wate
r Cr
eek
Yaha
ra R
iver
and
Lak
eKe
gons
a
Yaha
ra R
iver
and
Lak
eM
onon
a
Upp
er K
oshk
onon
g Cr
eek
Lowe
r Ko
shko
nong
Cre
ek
Scup
pern
ong
Rive
r
Perc
ent
Wet
land
s
Watersheds of the Lower Rock BasinPercent of Wetlands In Each Reed Canary Grass (RCG) Class
4.8 3.98.3
11.4 11.115.0 16.2 18.1
13.8 15.521.5
27.0
11.64.9
0%
10%
20%
30%
40%
50%
60%
70%
80%
90%
100%
Blac
khaw
k Cr
eek
Rock
River
/Milt
on
Mar
sh C
reek
Tur
tle
Cree
k
Six
Mile
and
Phe
asan
tBr
anch
Cre
eks
Bass
Cre
ek
Badf
ish
Cree
k
Yaha
ra R
iver
and
Lak
eM
endo
ta
White
wate
r Cr
eek
Yaha
ra R
iver
and
Lak
eKe
gons
a
Yaha
ra R
iver
and
Lak
eM
onon
a
Upp
er K
oshk
onon
gCr
eek
Lowe
r Ko
shko
nong
Cree
k
Scup
pern
ong
Rive
r
Reed Canary Grass Classes
Perc
ent
of W
etland
s
in E
ach
RCG
Clas
s
Heavily Dominant (80-100% RCG) Co-dominant (50-79% RCG) Absent to Sub-dominant (0-49% RCG)
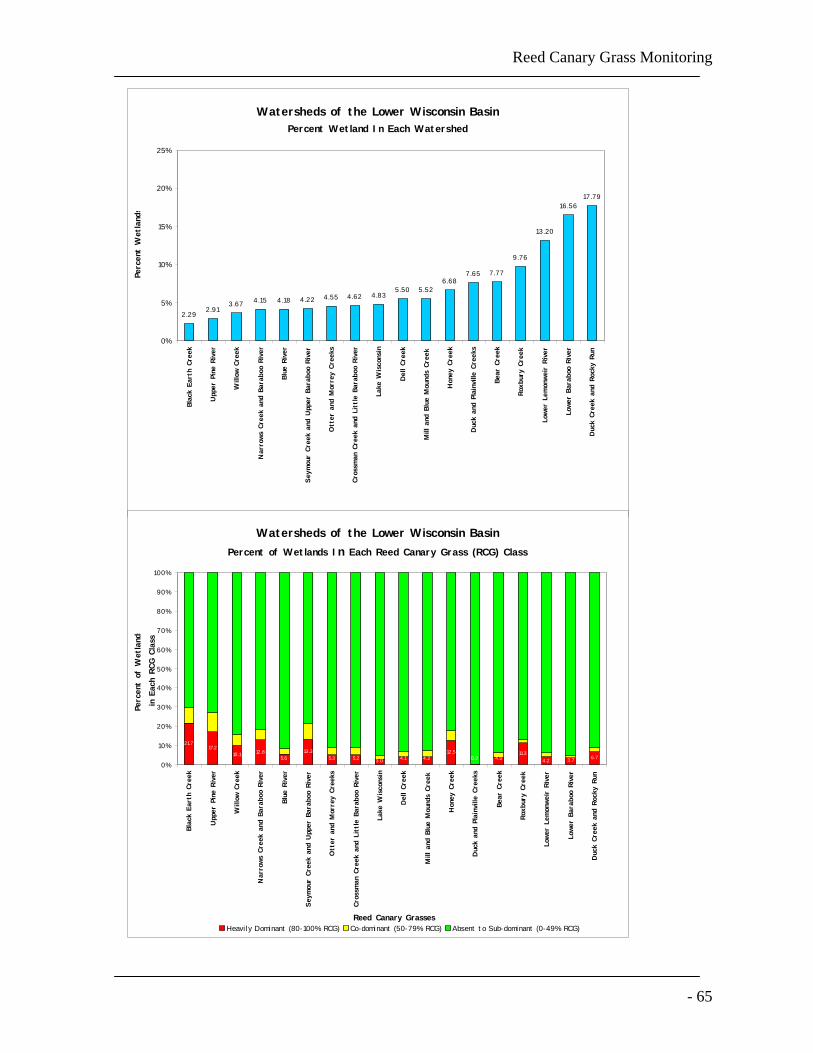
Reed Canary Grass Monitoring
- 65
Watersheds of the Lower Wisconsin BasinPercent Wetland In Each Watershed
2.292.91
3.67 4.15 4.18 4.22 4.55 4.62 4.835.50 5.52
6.687.65 7.77
9.76
13.20
16.5617.79
0%
5%
10%
15%
20%
25%
Blac
k Ea
rth
Cree
k
Upp
er P
ine
Rive
r
Willow
Cre
ek
Nar
rows
Cre
ek a
nd B
arab
oo R
iver
Blue
River
Seym
our
Cree
k an
d Upp
er B
arab
oo R
iver
Ott
er a
nd M
orre
y Cr
eeks
Cros
sman
Cre
ek a
nd L
ittle
Bara
boo
Rive
r
Lake
Wisco
nsin
Dell Cr
eek
Mill a
nd B
lue
Mou
nds
Cree
k
Hon
ey C
reek
Duc
k an
d Plainv
ille
Cree
ks
Bear
Cre
ek
Roxb
ury
Cree
k
Lowe
r Le
mon
weir R
iver
Lowe
r Ba
rabo
o Ri
ver
Duc
k Cr
eek
and
Rock
y Ru
n
Perc
ent
Wet
land
s
Watersheds of the Lower Wisconsin BasinPercent of Wetlands In Each Reed Canary Grass (RCG) Class
21.717.2
10.1 12.85.6
13.35.3 5.2 4.1 4.2
12.54.0
11.36.74.2 3.73.0 0.2
0%
10%
20%
30%
40%
50%
60%
70%
80%
90%
100%
Blac
k Ea
rth
Cree
k
Upp
er P
ine
Rive
r
Willow
Cre
ek
Nar
rows
Cre
ek a
nd B
arab
oo R
iver
Blue
River
Seym
our
Cree
k an
d Upp
er B
arab
oo R
iver
Ott
er a
nd M
orre
y Cr
eeks
Cros
sman
Cre
ek a
nd L
ittle
Bara
boo
Rive
r
Lake
Wisco
nsin
Dell Cr
eek
Mill a
nd B
lue
Mou
nds
Cree
k
Hon
ey C
reek
Duc
k an
d Plainv
ille
Cree
ks
Bear
Cre
ek
Roxb
ury
Cree
k
Lowe
r Le
mon
weir R
iver
Lowe
r Ba
rabo
o Ri
ver
Duc
k Cr
eek
and
Rock
y Ru
n
Reed Canary Grasses
Perc
ent
of W
etland
s
in E
ach
RCG
Clas
s
Heavily Dominant (80-100% RCG) Co-dominant (50-79% RCG) Absent to Sub-dominant (0-49% RCG)
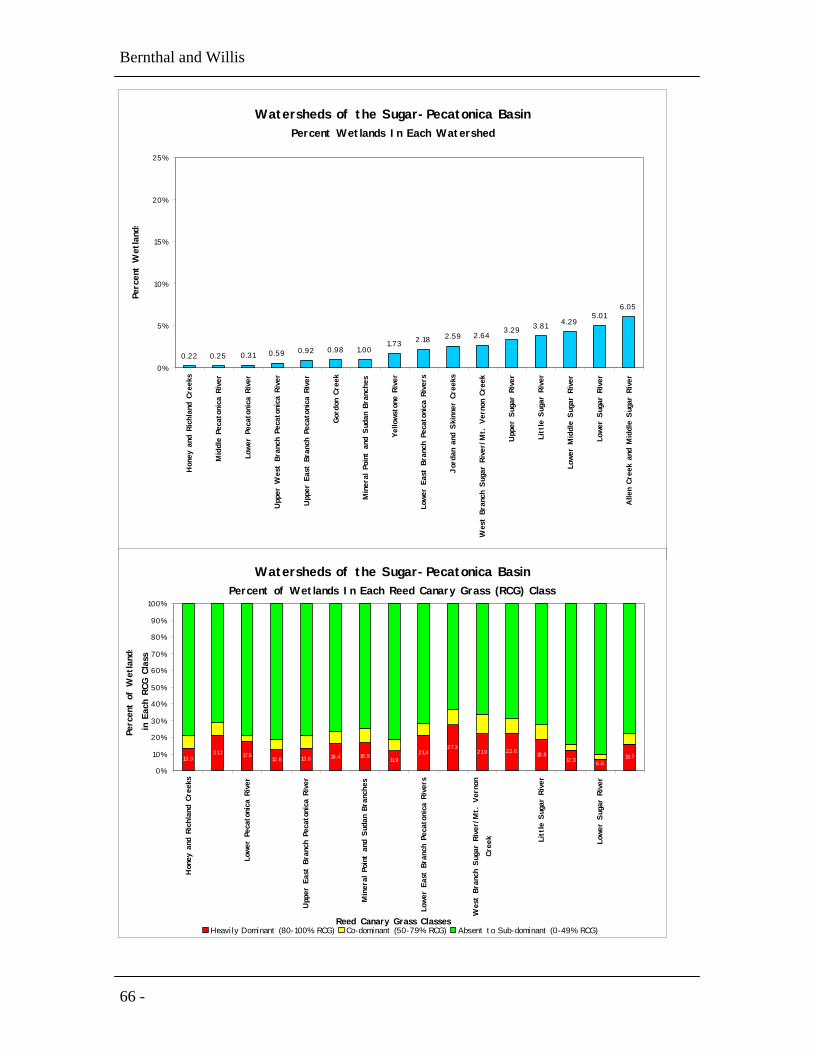
Bernthal and Willis
66 -
Watersheds of the Sugar-Pecatonica BasinPercent Wetlands In Each Watershed
0.22 0.25 0.31 0.59 0.92 0.98 1.001.73 2.18 2.59 2.64
3.29 3.81 4.295.01
6.05
0%
5%
10%
15%
20%
25%
Hon
ey a
nd R
ichlan
d Cr
eeks
Middle
Peca
tonica
River
Lowe
r Pe
cato
nica
River
Upp
er W
est
Bran
ch P
ecat
onica
Rive
r
Upp
er E
ast
Bran
ch P
ecat
onica
Rive
r
Gord
on C
reek
Miner
al P
oint
and
Sud
an B
ranc
hes
Yello
wsto
ne R
iver
Lowe
r Ea
st B
ranc
h Pe
cato
nica
River
s
Jord
an a
nd S
kinn
er C
reek
s
Wes
t Br
anch
Sug
ar R
iver
/Mt.
Ver
non
Cree
k
Upp
er S
ugar
River
Litt
le S
ugar
River
Lowe
r M
iddle
Suga
r Ri
ver
Lowe
r Su
gar
Rive
r
Alle
n Cr
eek
and
Middle
Suga
r Ri
ver
Perc
ent
Wet
land
s
Watersheds of the Sugar-Pecatonica Basin Percent of Wetlands In Each Reed Canary Grass (RCG) Class
13.321.1 17.5
12.8 13.6 16.4 16.911.9
21.427.3
21.9 22.6 18.812.3 6.8
15.7
0%
10%
20%
30%
40%
50%
60%
70%
80%
90%
100%
Hon
ey a
nd R
ichlan
d Cr
eeks
Lowe
r Pe
cato
nica
River
Upp
er E
ast
Bran
ch P
ecat
onica
Rive
r
Miner
al P
oint
and
Sud
an B
ranc
hes
Lowe
r Ea
st B
ranc
h Pe
cato
nica
River
s
Wes
t Br
anch
Sug
ar R
iver
/Mt.
Ver
non
Cree
k Litt
le S
ugar
River
Lowe
r Su
gar
Rive
r
Reed Canary Grass Classes
Perc
ent
of W
etland
s
in E
ach
RCG
Clas
s
Heavily Dominant (80-100% RCG) Co-dominant (50-79% RCG) Absent to Sub-dominant (0-49% RCG)
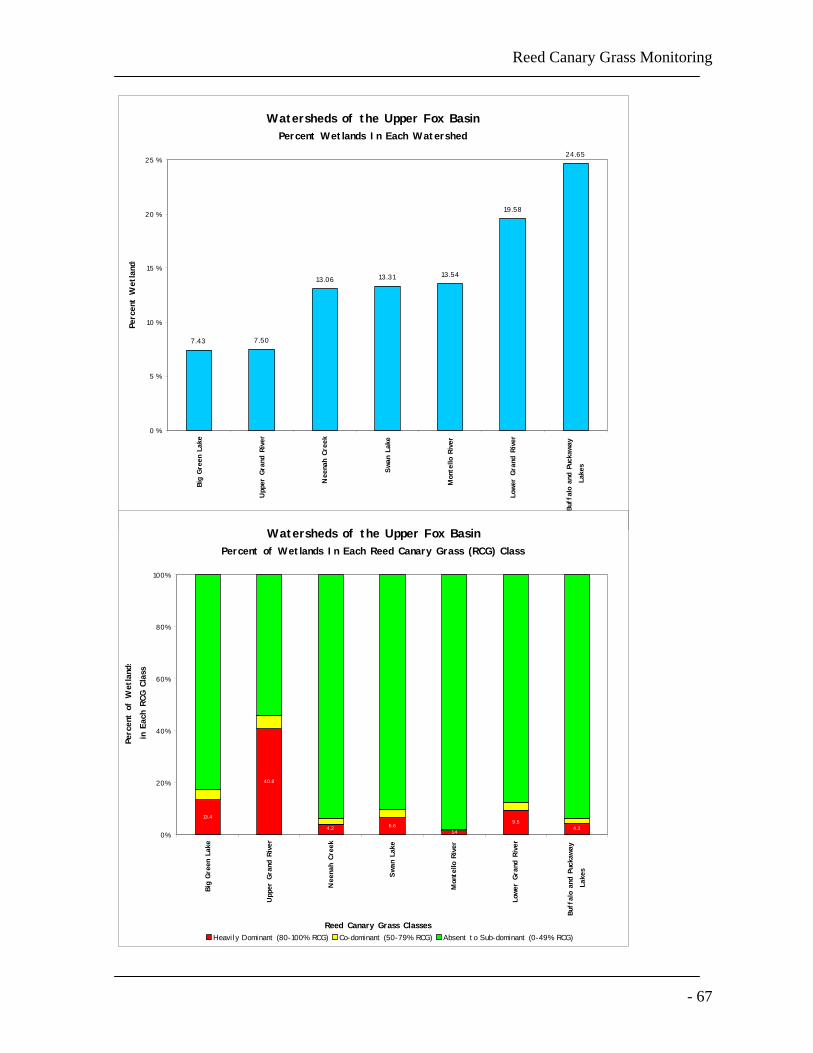
Reed Canary Grass Monitoring
- 67
Watersheds of the Upper Fox BasinPercent Wetlands In Each Watershed
7.43 7.50
13.06 13.31 13.54
19.58
24.65
0 %
5 %
10 %
15 %
20 %
25 %
Big
Gree
n La
ke
Upp
er G
rand
River
Nee
nah
Cree
k
Swan
Lak
e
Mon
tello
River
Lowe
r Gr
and
Rive
r
Buff
alo
and
Puck
away
Lake
s
Perc
ent
Wet
land
s
Watersheds of the Upper Fox Basin Percent of Wetlands In Each Reed Canary Grass (RCG) Class
13.4
40.8
4.2 6.69.5
4.31.40%
20%
40%
60%
80%
100%
Big
Gree
n La
ke
Upp
er G
rand
River
Nee
nah
Cree
k
Swan
Lak
e
Mon
tello
River
Lowe
r Gr
and
Rive
r
Buff
alo
and
Puck
away
Lake
s
Reed Canary Grass Classes
Perc
ent
of W
etland
s
in E
ach
RCG
Clas
s
Heavily Dominant (80-100% RCG) Co-dominant (50-79% RCG) Absent to Sub-dominant (0-49% RCG)
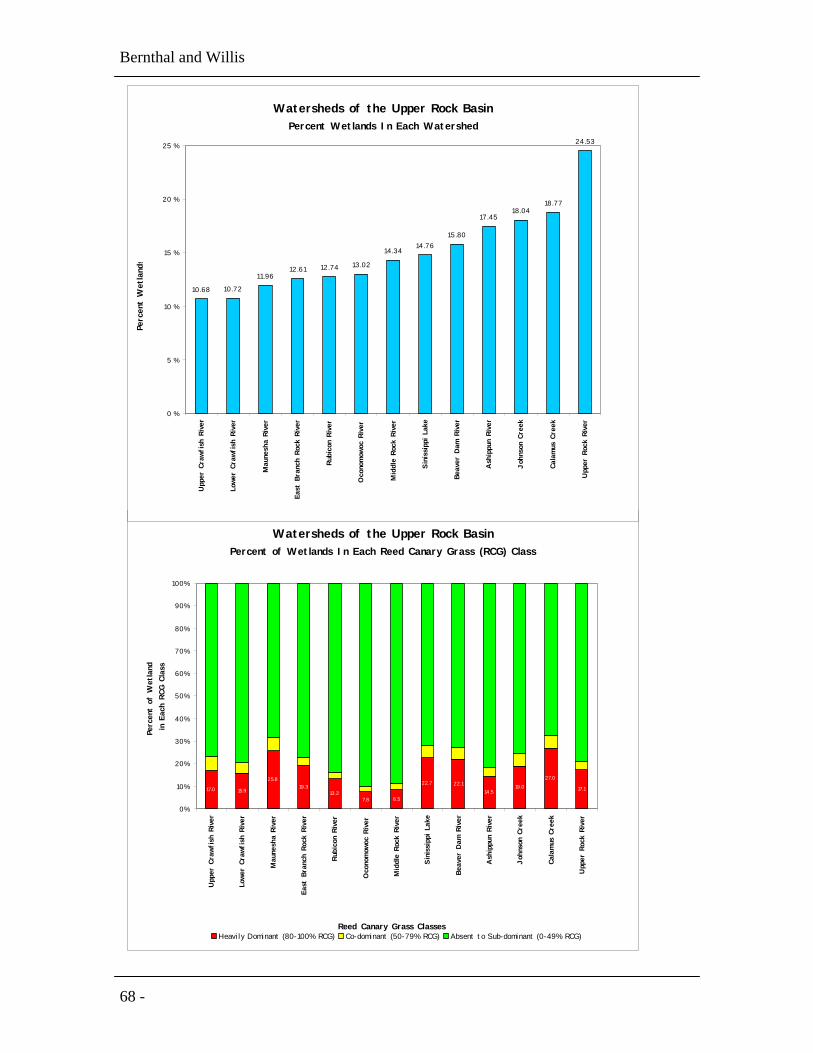
Bernthal and Willis
68 -
Watersheds of the Upper Rock Basin Percent of Wetlands In Each Reed Canary Grass (RCG) Class
17.0 15.9
25.819.3
13.27.8 8.5
22.7 22.114.5
19.0
27.0
17.1
0%
10%
20%
30%
40%
50%
60%
70%
80%
90%
100%
Upp
er C
rawf
ish
Rive
r
Lowe
r Cr
awfish
River
Mau
nesh
a Ri
ver
East
Bra
nch
Rock
River
Rubi
con
Rive
r
Oco
nomow
oc R
iver
Middle
Rock
River
Siniss
ippi L
ake
Beav
er D
am R
iver
Ash
ippu
n Ri
ver
John
son
Cree
k
Calamus
Cre
ek
Upp
er R
ock
Rive
r
Reed Canary Grass Classes
Perc
ent
of W
etland
sin E
ach
RCG
Clas
s
Heavily Dominant (80-100% RCG) Co-dominant (50-79% RCG) Absent to Sub-dominant (0-49% RCG)
Watersheds of the Upper Rock BasinPercent Wetlands In Each Watershed
10.68 10.72
11.9612.61 12.74 13.02
14.3414.76
15.80
17.4518.04
18.77
24.53
0 %
5 %
10 %
15 %
20 %
25 %
Upp
er C
rawf
ish
Rive
r
Lowe
r Cr
awfish
River
Mau
nesh
a Ri
ver
East
Bra
nch
Rock
River
Rubi
con
Rive
r
Oco
nomow
oc R
iver
Mid
dle
Rock
River
Siniss
ippi L
ake
Beav
er D
am R
iver
Ash
ippu
n Ri
ver
John
son
Cree
k
Calamus
Cre
ek
Upp
er R
ock
Rive
r
Perc
ent
Wet
land
s

Reed Canary Grass Monitoring
- 69
Appendix D. Wetland Richness and Reed Canary Dominance byLand Type Association: Tabular Form
NHFEUCode
Name Percent Wetlandin the LTA
Percent of WetlandsHeavily Dominated
by Reed CanaryGrass
222K Section: Southwestern Great Lakes Morainal222Kb Subsection: Central Wisconsin Moraines and Outwash
Land Type Associations:222Kb03 Wild Rose -Wautoma Moraine Complex 22.57 1.0222Kb04 Coloma Plain 2.65 3.9222Kb05 Buffalo Lake Outwash Channels 27.12 3.3222Kb06 Lewiston Basin 24.52 4.3222Kb07 Portage Floodplain 37.80 3.8222Kc Subsection: Lake Winnebago Clay Plain
Land Type Associations:222Kc01 Lake Winnebago 0.14 0.0222Kc02 Oshkosh Moraines 3.41 9.4222Kc07 Redgranite Lake Plain 60.91 16.2222Kd Subsection: South Central Wisconsin Prairie and Savanna
Land Type Associations:222Kd01 Rio Moraines 10.11 6.2222Kd02 Green Lake Moraines 7.71 25.5222Kd03 Poynette Hills 10.05 1.5222Kd04 Pardeeville Plains 33.82 7.3222Kd05 Prentice Creek Hills 4.02 1.2222Kd06 Moon Valley Plains 3.17 8.9222Kd07 Princeton Drumlins 30.12 8.7222Kd08 French Creek Moraines 13.16 3.0222Kd09 Roxbury Hills 2.98 10.7222Ke Subsection: Southern Green Bay Lobe
Land Type Associations:222Ke01 West Johnstown-Milton Moraines 1.14 12.0222Ke02 East Johnstown-Milton Moraines 5.01 12.1222Ke03 South Kettle Moraines 4.03 3.4222Ke04 Central Kettle Moraines 10.13 5.7222Ke05 North Kettle Moraines 15.88 3.1222Ke07 Waunakee Moraines 4.48 14.9222Ke08 Dane-Jefferson Drumlins and Lakes 12.42 17.4222Ke09 Jefferson Lake Plains 22.89 11.7222Ke10 Oconomowoc Lakes 19.03 7.8222Ke11 Bristol Till Plain 5.60 23.3222Ke12 Beaver Dam Drumlins 11.99 26.6222Ke13 Watertown Drumlins 12.83 18.0222Ke14 Allenton Drumlins 15.11 17.7222Ke15 Kewaskum Pains 24.81 5.4222Ke16 Ladoga Till Plain 13.82 22.9222Ke17 Horicon Marsh 70.52 9.1
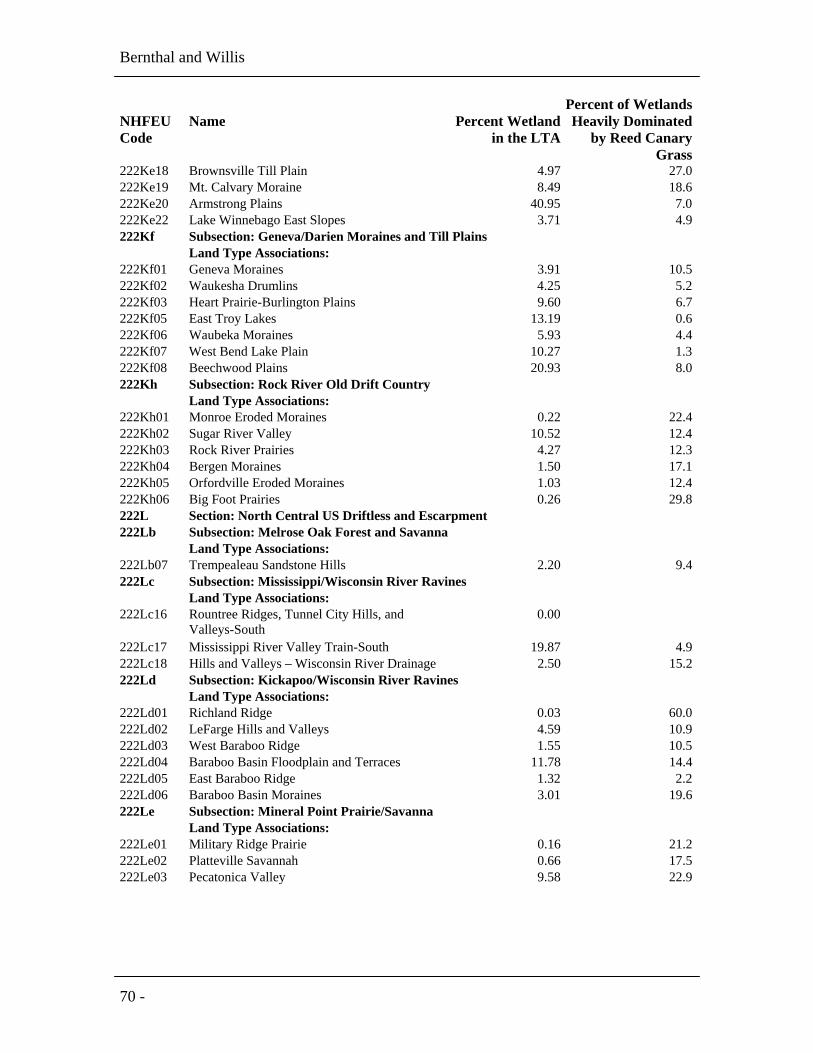
Bernthal and Willis
70 -
NHFEUCode
Name Percent Wetlandin the LTA
Percent of WetlandsHeavily Dominated
by Reed CanaryGrass
222Ke18 Brownsville Till Plain 4.97 27.0222Ke19 Mt. Calvary Moraine 8.49 18.6222Ke20 Armstrong Plains 40.95 7.0222Ke22 Lake Winnebago East Slopes 3.71 4.9222Kf Subsection: Geneva/Darien Moraines and Till Plains
Land Type Associations:222Kf01 Geneva Moraines 3.91 10.5222Kf02 Waukesha Drumlins 4.25 5.2222Kf03 Heart Prairie-Burlington Plains 9.60 6.7222Kf05 East Troy Lakes 13.19 0.6222Kf06 Waubeka Moraines 5.93 4.4222Kf07 West Bend Lake Plain 10.27 1.3222Kf08 Beechwood Plains 20.93 8.0222Kh Subsection: Rock River Old Drift Country
Land Type Associations:222Kh01 Monroe Eroded Moraines 0.22 22.4222Kh02 Sugar River Valley 10.52 12.4222Kh03 Rock River Prairies 4.27 12.3222Kh04 Bergen Moraines 1.50 17.1222Kh05 Orfordville Eroded Moraines 1.03 12.4222Kh06 Big Foot Prairies 0.26 29.8222L Section: North Central US Driftless and Escarpment222Lb Subsection: Melrose Oak Forest and Savanna
Land Type Associations:222Lb07 Trempealeau Sandstone Hills 2.20 9.4222Lc Subsection: Mississippi/Wisconsin River Ravines
Land Type Associations:222Lc16 Rountree Ridges, Tunnel City Hills, and
Valleys-South0.00
222Lc17 Mississippi River Valley Train-South 19.87 4.9222Lc18 Hills and Valleys – Wisconsin River Drainage 2.50 15.2222Ld Subsection: Kickapoo/Wisconsin River Ravines
Land Type Associations:222Ld01 Richland Ridge 0.03 60.0222Ld02 LeFarge Hills and Valleys 4.59 10.9222Ld03 West Baraboo Ridge 1.55 10.5222Ld04 Baraboo Basin Floodplain and Terraces 11.78 14.4222Ld05 East Baraboo Ridge 1.32 2.2222Ld06 Baraboo Basin Moraines 3.01 19.6222Le Subsection: Mineral Point Prairie/Savanna
Land Type Associations:222Le01 Military Ridge Prairie 0.16 21.2222Le02 Platteville Savannah 0.66 17.5222Le03 Pecatonica Valley 9.58 22.9
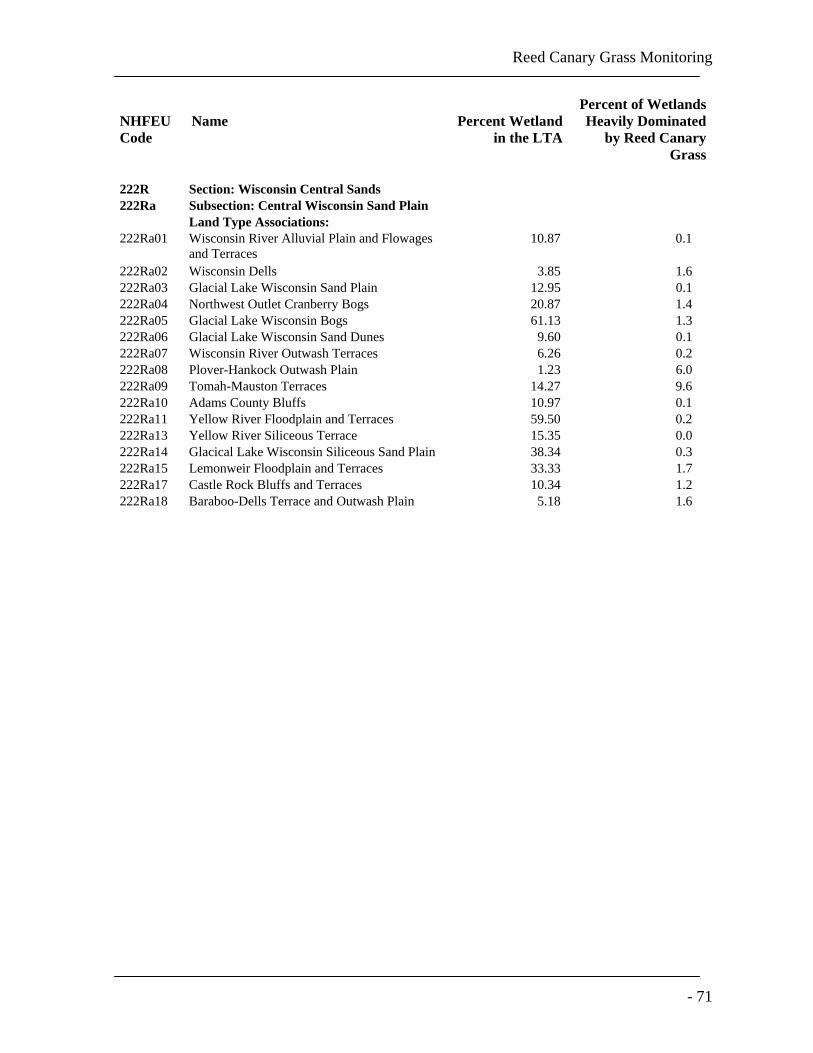
Reed Canary Grass Monitoring
- 71
Percent of WetlandsNHFEU Name Percent Wetland Heavily DominatedCode in the LTA by Reed Canary
Grass
222R Section: Wisconsin Central Sands222Ra Subsection: Central Wisconsin Sand Plain
Land Type Associations:222Ra01 Wisconsin River Alluvial Plain and Flowages
and Terraces10.87 0.1
222Ra02 Wisconsin Dells 3.85 1.6222Ra03 Glacial Lake Wisconsin Sand Plain 12.95 0.1222Ra04 Northwest Outlet Cranberry Bogs 20.87 1.4222Ra05 Glacial Lake Wisconsin Bogs 61.13 1.3222Ra06 Glacial Lake Wisconsin Sand Dunes 9.60 0.1222Ra07 Wisconsin River Outwash Terraces 6.26 0.2222Ra08 Plover-Hankock Outwash Plain 1.23 6.0222Ra09 Tomah-Mauston Terraces 14.27 9.6222Ra10 Adams County Bluffs 10.97 0.1222Ra11 Yellow River Floodplain and Terraces 59.50 0.2222Ra13 Yellow River Siliceous Terrace 15.35 0.0222Ra14 Glacical Lake Wisconsin Siliceous Sand Plain 38.34 0.3222Ra15 Lemonweir Floodplain and Terraces 33.33 1.7222Ra17 Castle Rock Bluffs and Terraces 10.34 1.2222Ra18 Baraboo-Dells Terrace and Outwash Plain 5.18 1.6

Bernthal and Willis
72 -
Reed Canary Grass Monitoring
Acknowledgements
We conducted this project in cooperation with the University of Wisconsin-Madison’sEnvironmental Remote Sensing Center under the auspices of the Upper MidwestRegional Earth Sciences Applications Center, a NASA-supported consortium ofuniversities, state and federal natural resource agencies, and industry partners.
We thank David Siebert for first suggesting the idea of mapping reed canary grass inwetlands at the landscape scale, Richard Lillie whose wetland biological integrityresearch provided strong support for pursuing this line of research, and Patricia Trochlellfor support and direction throughout all phases of the project. Donnalea Dinsmore andCathy Garra provided helpful guidance during the preparation of the Quality AssuranceProject Plan. We thank Jonathan Chipman, Bob Goldman, and Thomas Lillesand fortechnical guidance and logistical support in the development of the classificationprotocol. We thank Marc Cottingham for conducting field surveys used to assess theaccuracy of the classification, Sally Willis for conducting the GIS analyses for theproject, and Janel Pike, Katherine Barrett, Eunice Padley, and Steven Westenbroek forassistance with this phase of the project. Finally, we thank Joy Zedler, Evelyn Howell,Marcia Caton Campbell, Paul Zedler, Nancy Mathews, Thomas Lillesand, Richard Lillie,Patricia Trochlell, David Siebert, Kelly Kearns, Joanne Kline, Richard Sumner, andSusan Elston for their review of parts or all of the manuscript.
Wisconsin Department of Natural ResourcesBureau of Integrated Science Services
PO Box 7921, Madison WI 53707
PUB-SS-992 2004
Printed on recycled paper.
WISCONSINDEPT. OF NATURAL RESOURCES