observations of emic waves in the earth’s magnetosphere ... · emic waves, averaged normal angles...
TRANSCRIPT
URSI AP-RASC 2019, New Delhi, India, 09 - 15 March 2019
Observations of EMIC waves in the Earth’s magnetosphere observed by Magnetospheric Multiscale
(MMS) mission S. Y. Huang* (1), X. Y. Wang(1), R. C. Allen(2,3), H. S. Fu(4), X. H. Deng(5), M. Zhou(5), J. L. Burch(3) and R. B. Torbert(6)
(1) School of Electronic Information, Wuhan University, Wuhan, China, 430072, http://www.whu.edu.cn (2) Department of Physics and Astronomy, University of Texas at San Antonio, San Antonio, Texas, USA
(3) Southwest Research Institute, San Antonio TX, USA (4) School of Space and Environment, Beihang University, Beijing, China
(5) Institute of Space Science and Technology, Nanchang University, Nanchang, China (6) University of New Hampshire, Durham, New Hampshire, USA
Abstract Electromagnetic ion cyclotron (EMIC) waves can precipitate the ring current ions and relativistic electrons, and heat the cold electrons in the magnetosphere. This requires comprehensive knowledge of the occurrence and wave properties of EMIC waves. In present paper, we used the data from one new mission, Magnetospheric Multiscale (MMS) mission launched in March 2015, to investigate the occurrence and wave properties of H+-band and [He+-band EMIC waves in the magnetosphere. Our statistical results show that: 1) H+-band EMIC waves mostly occur in the higher L-shells (L > 5) while He+-band EMIC waves are mostly observed in the lower L-shells (L < 6). 2) The occurrence rate of H+-band EMIC waves in the dayside is higher than that in the night-side. The highest peak of occurrence rate of H+-band EMIC waves is in the post-noon sector (5-8 L-shells) and the secondary peak lies in the small area of dawn sector. 3) The wave power spectral density peaks in the post-noon and pre-dusk sectors, while the wave normal angles are largest in the dawn sector. 4) Linear and right-hand polarized H+-band EMIC waves are mainly in the regions of peak occurrence, while linear polarized waves are seen to also dominate outside of the regions of peak occurrence. Highest occurrence rate of linear polarized He+-band EMIC waves is observed in the dawn sector. We discussed the results and compared with previous findings. 1. Introduction Electromagnetic ion cyclotron (EMIC) waves are usually generated near the geomagnetic equator with the frequency below the ion gyrofrequency and a left-handed polarization at the source region by the ion temperature anisotropy [1] or hot ions with ring velocity distributions [2, 3] etc. EMIC waves can be divided into three bands according to the ion gyrofrequency distinctions: hydrogen band (H+-band) EMIC waves with frequency between the hydrogen gyrofrequency and the helium gyrofrequency; helium band (He+-band) EMIC waves with the frequency between helium gyrofrequency and the oxygen
gyrofrequency; oxygen band (O+-band) EMIC waves with frequency below the oxygen gyrofrequency. EMIC waves play an important role in the particle dynamic and evolution in the Earth’s magnetosphere. EMIC waves can interact with the particles, leading to precipitations of ring current ions [4, 5], scattering of relativistic electrons into the loss cone in the radiation belt [6, 7], and heating of cold electrons in the plasmaspheric plume [8]. To better understand the interaction mechanism between EMIC waves and the particles, including ions and electrons, it requires global distributions and occurrence rates of EMIC waves, and their properties in the magnetosphere. 2. MMS data and Analysis Procedure The MMS spacecraft were launched on 12 March 2015, and consists of four identical spacecraft [9]. MMS can provide very high resolution measurements, including fields, particles and waves [9]. In the present study, only magnetic field data measured by the FIELDS instruments with the sampling rate of 8 Hz (few time periods in 16 Hz) in the survey mode from 1 September 2015 to 31 October 2016 were analyzed. Due to the small separation among the MMS spacecraft, we only statistically analyzed the data from one spacecraft, i.e., MMS2. We performed the short time fast Fourier transform (FFT) technique on the fluctuating magnetic field, and obtained the wave power spectral densities. The FFT was parameterized by a sliding window size of 800 data points (100 s), with an overlap of 400 points for the magnetic field with the sampling rate of 8 Hz; a sliding window size of 1600 data points (100 s), with an overlap of 800 points for the magnetic field with the sampling rate of 16 Hz. The wave properties, including polarization, normal angle, and ellipticity, are derived by the singular value decomposition (SVD) method [10] which is widely applied in the identifications of different wave modes [11, 12, 13, 14]. EMIC wave events were identified visually, and must last at least 5 min. All EMIC wave events were
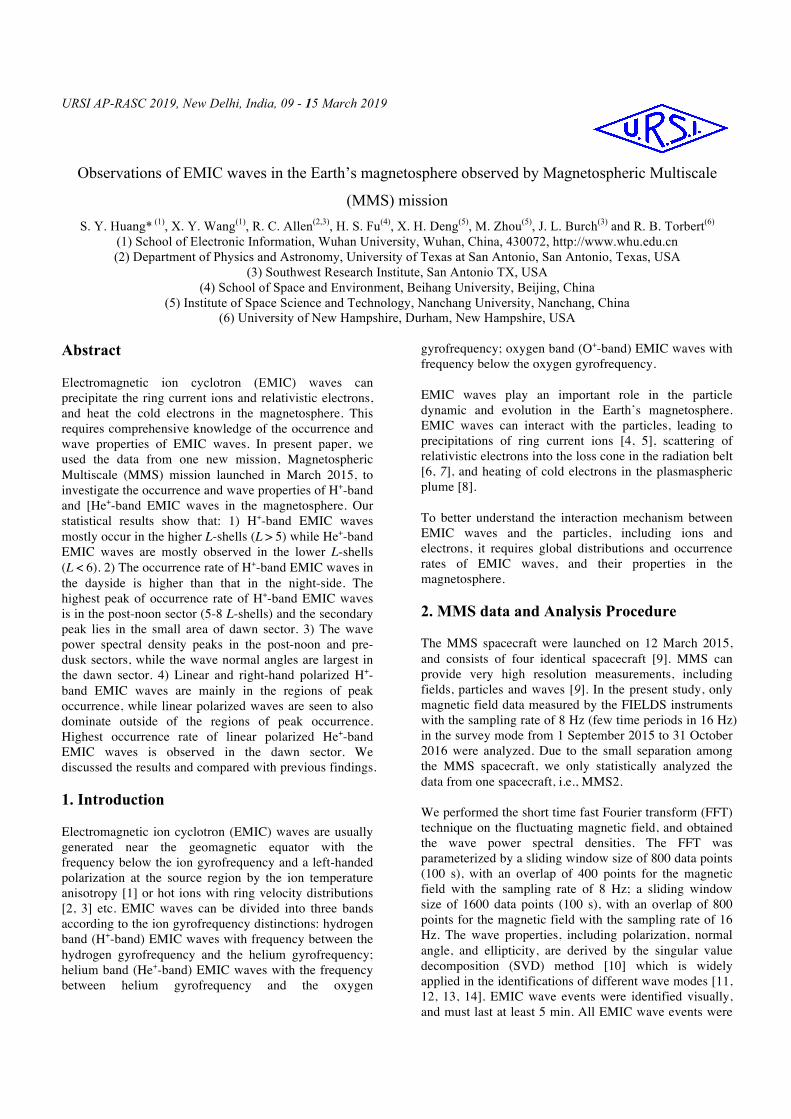
catalogued by ion gyro-frequency band. The examples of H+-band and He+-band EMIC wave events are shown in Figure 1.
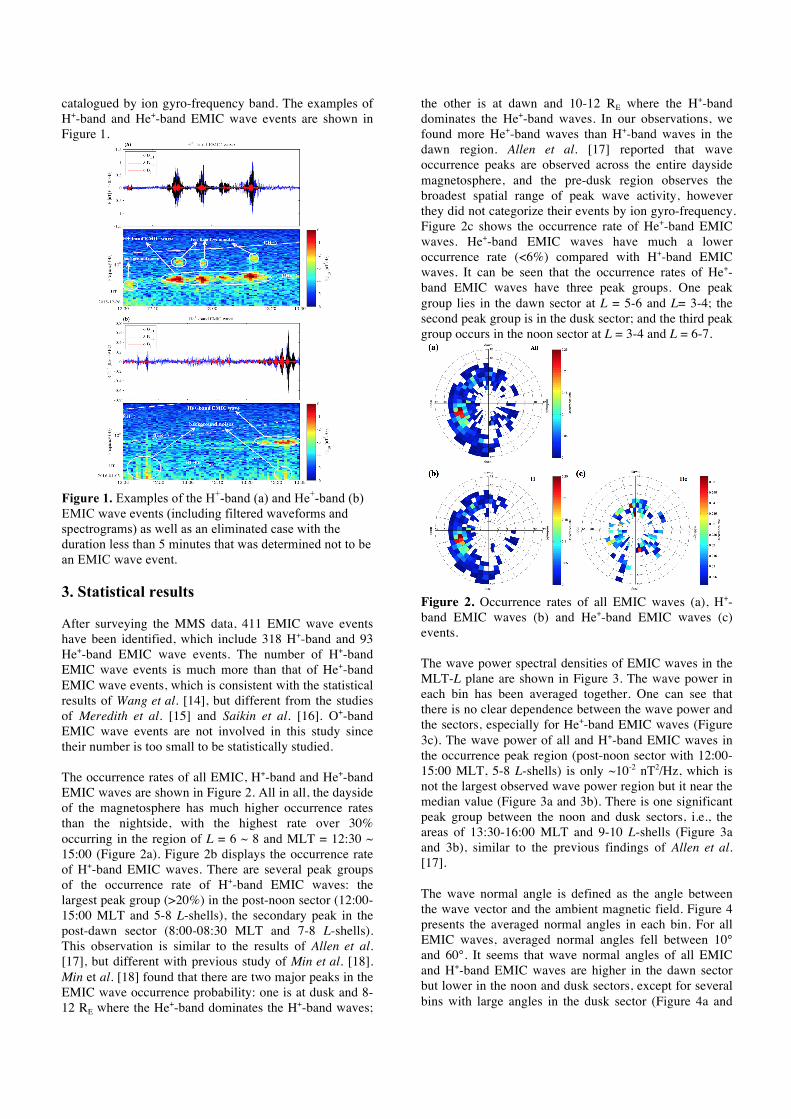
Figure 1. Examples of the H+-band (a) and He+-band (b) EMIC wave events (including filtered waveforms and spectrograms) as well as an eliminated case with the duration less than 5 minutes that was determined not to be an EMIC wave event. 3. Statistical results After surveying the MMS data, 411 EMIC wave events have been identified, which include 318 H+-band and 93 He+-band EMIC wave events. The number of H+-band EMIC wave events is much more than that of He+-band EMIC wave events, which is consistent with the statistical results of Wang et al. [14], but different from the studies of Meredith et al. [15] and Saikin et al. [16]. O+-band EMIC wave events are not involved in this study since their number is too small to be statistically studied. The occurrence rates of all EMIC, H+-band and He+-band EMIC waves are shown in Figure 2. All in all, the dayside of the magnetosphere has much higher occurrence rates than the nightside, with the highest rate over 30% occurring in the region of L = 6 ~ 8 and MLT = 12:30 ~ 15:00 (Figure 2a). Figure 2b displays the occurrence rate of H+-band EMIC waves. There are several peak groups of the occurrence rate of H+-band EMIC waves: the largest peak group (>20%) in the post-noon sector (12:00-15:00 MLT and 5-8 L-shells), the secondary peak in the post-dawn sector (8:00-08:30 MLT and 7-8 L-shells). This observation is similar to the results of Allen et al. [17], but different with previous study of Min et al. [18]. Min et al. [18] found that there are two major peaks in the EMIC wave occurrence probability: one is at dusk and 8-12 RE where the He+-band dominates the H+-band waves;
the other is at dawn and 10-12 RE where the H+-band dominates the He+-band waves. In our observations, we found more He+-band waves than H+-band waves in the dawn region. Allen et al. [17] reported that wave occurrence peaks are observed across the entire dayside magnetosphere, and the pre-dusk region observes the broadest spatial range of peak wave activity, however they did not categorize their events by ion gyro-frequency. Figure 2c shows the occurrence rate of He+-band EMIC waves. He+-band EMIC waves have much a lower occurrence rate (<6%) compared with H+-band EMIC waves. It can be seen that the occurrence rates of He+-band EMIC waves have three peak groups. One peak group lies in the dawn sector at L = 5-6 and L= 3-4; the second peak group is in the dusk sector; and the third peak group occurs in the noon sector at L = 3-4 and L = 6-7.
Figure 2. Occurrence rates of all EMIC waves (a), H+-band EMIC waves (b) and He+-band EMIC waves (c) events. The wave power spectral densities of EMIC waves in the MLT-L plane are shown in Figure 3. The wave power in each bin has been averaged together. One can see that there is no clear dependence between the wave power and the sectors, especially for He+-band EMIC waves (Figure 3c). The wave power of all and H+-band EMIC waves in the occurrence peak region (post-noon sector with 12:00-15:00 MLT, 5-8 L-shells) is only ~10-2 nT2/Hz, which is not the largest observed wave power region but it near the median value (Figure 3a and 3b). There is one significant peak group between the noon and dusk sectors, i.e., the areas of 13:30-16:00 MLT and 9-10 L-shells (Figure 3a and 3b), similar to the previous findings of Allen et al. [17]. The wave normal angle is defined as the angle between the wave vector and the ambient magnetic field. Figure 4 presents the averaged normal angles in each bin. For all EMIC waves, averaged normal angles fell between 10° and 60°. It seems that wave normal angles of all EMIC and H+-band EMIC waves are higher in the dawn sector but lower in the noon and dusk sectors, except for several bins with large angles in the dusk sector (Figure 4a and
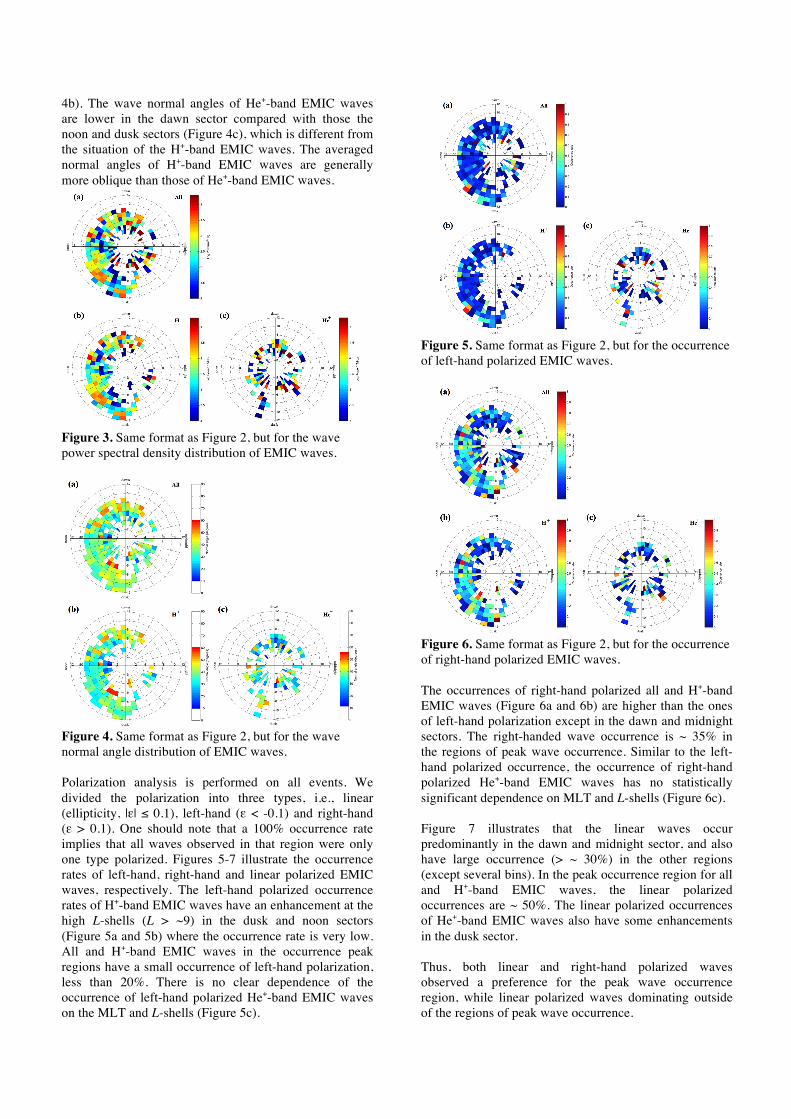
4b). The wave normal angles of He+-band EMIC waves are lower in the dawn sector compared with those the noon and dusk sectors (Figure 4c), which is different from the situation of the H+-band EMIC waves. The averaged normal angles of H+-band EMIC waves are generally more oblique than those of He+-band EMIC waves.
Figure 3. Same format as Figure 2, but for the wave power spectral density distribution of EMIC waves.
Figure 4. Same format as Figure 2, but for the wave normal angle distribution of EMIC waves. Polarization analysis is performed on all events. We divided the polarization into three types, i.e., linear (ellipticity, |ε| ≤ 0.1), left-hand (ε < -0.1) and right-hand (ε > 0.1). One should note that a 100% occurrence rate implies that all waves observed in that region were only one type polarized. Figures 5-7 illustrate the occurrence rates of left-hand, right-hand and linear polarized EMIC waves, respectively. The left-hand polarized occurrence rates of H+-band EMIC waves have an enhancement at the high L-shells (L > ~9) in the dusk and noon sectors (Figure 5a and 5b) where the occurrence rate is very low. All and H+-band EMIC waves in the occurrence peak regions have a small occurrence of left-hand polarization, less than 20%. There is no clear dependence of the occurrence of left-hand polarized He+-band EMIC waves on the MLT and L-shells (Figure 5c).
Figure 5. Same format as Figure 2, but for the occurrence of left-hand polarized EMIC waves.
Figure 6. Same format as Figure 2, but for the occurrence of right-hand polarized EMIC waves. The occurrences of right-hand polarized all and H+-band EMIC waves (Figure 6a and 6b) are higher than the ones of left-hand polarization except in the dawn and midnight sectors. The right-handed wave occurrence is ~ 35% in the regions of peak wave occurrence. Similar to the left-hand polarized occurrence, the occurrence of right-hand polarized He+-band EMIC waves has no statistically significant dependence on MLT and L-shells (Figure 6c). Figure 7 illustrates that the linear waves occur predominantly in the dawn and midnight sector, and also have large occurrence (> ~ 30%) in the other regions (except several bins). In the peak occurrence region for all and H+-band EMIC waves, the linear polarized occurrences are ~ 50%. The linear polarized occurrences of He+-band EMIC waves also have some enhancements in the dusk sector. Thus, both linear and right-hand polarized waves observed a preference for the peak wave occurrence region, while linear polarized waves dominating outside of the regions of peak wave occurrence.
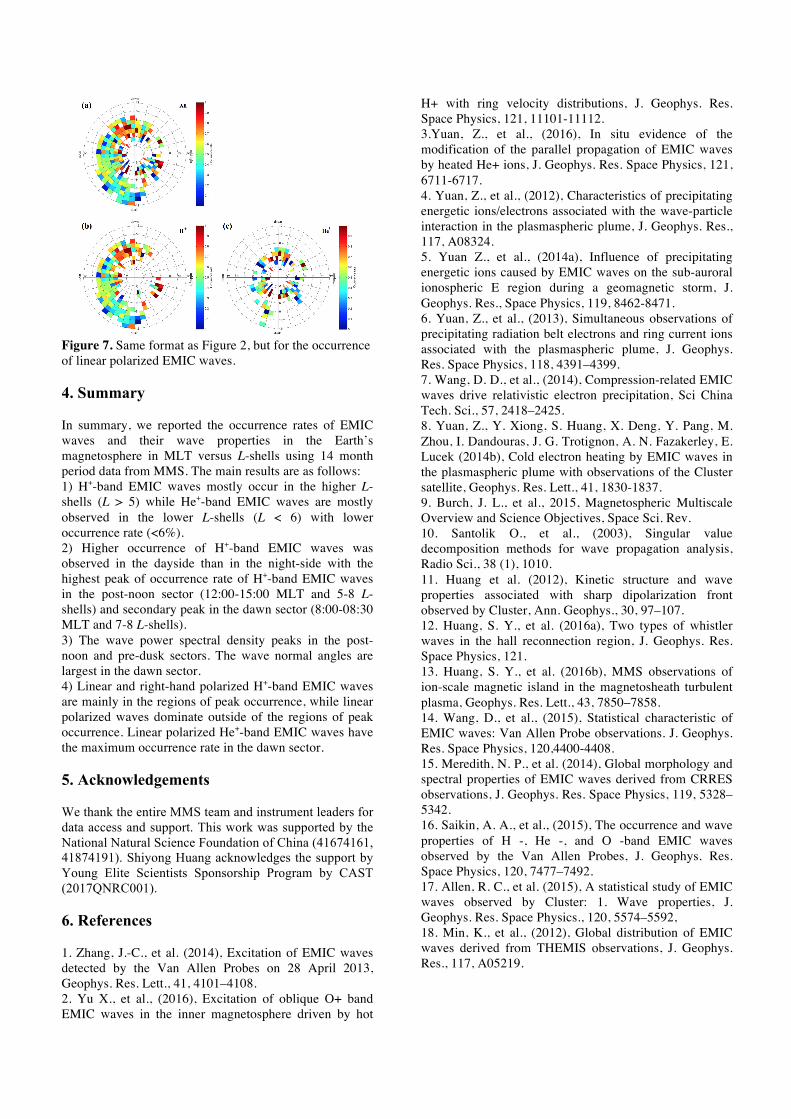
Figure 7. Same format as Figure 2, but for the occurrence of linear polarized EMIC waves. 4. Summary In summary, we reported the occurrence rates of EMIC waves and their wave properties in the Earth’s magnetosphere in MLT versus L-shells using 14 month period data from MMS. The main results are as follows: 1) H+-band EMIC waves mostly occur in the higher L-shells (L > 5) while He+-band EMIC waves are mostly observed in the lower L-shells (L < 6) with lower occurrence rate (<6%). 2) Higher occurrence of H+-band EMIC waves was observed in the dayside than in the night-side with the highest peak of occurrence rate of H+-band EMIC waves in the post-noon sector (12:00-15:00 MLT and 5-8 L-shells) and secondary peak in the dawn sector (8:00-08:30 MLT and 7-8 L-shells). 3) The wave power spectral density peaks in the post-noon and pre-dusk sectors. The wave normal angles are largest in the dawn sector. 4) Linear and right-hand polarized H+-band EMIC waves are mainly in the regions of peak occurrence, while linear polarized waves dominate outside of the regions of peak occurrence. Linear polarized He+-band EMIC waves have the maximum occurrence rate in the dawn sector. 5. Acknowledgements We thank the entire MMS team and instrument leaders for data access and support. This work was supported by the National Natural Science Foundation of China (41674161, 41874191). Shiyong Huang acknowledges the support by Young Elite Scientists Sponsorship Program by CAST (2017QNRC001). 6. References 1. Zhang, J.-C., et al. (2014), Excitation of EMIC waves detected by the Van Allen Probes on 28 April 2013, Geophys. Res. Lett., 41, 4101–4108. 2. Yu X., et al., (2016), Excitation of oblique O+ band EMIC waves in the inner magnetosphere driven by hot
H+ with ring velocity distributions, J. Geophys. Res. Space Physics, 121, 11101-11112. 3.Yuan, Z., et al., (2016), In situ evidence of the modification of the parallel propagation of EMIC waves by heated He+ ions, J. Geophys. Res. Space Physics, 121, 6711-6717. 4. Yuan, Z., et al., (2012), Characteristics of precipitating energetic ions/electrons associated with the wave-particle interaction in the plasmaspheric plume, J. Geophys. Res., 117, A08324. 5. Yuan Z., et al., (2014a), Influence of precipitating energetic ions caused by EMIC waves on the sub-auroral ionospheric E region during a geomagnetic storm, J. Geophys. Res., Space Physics, 119, 8462-8471. 6. Yuan, Z., et al., (2013), Simultaneous observations of precipitating radiation belt electrons and ring current ions associated with the plasmaspheric plume, J. Geophys. Res. Space Physics, 118, 4391–4399. 7. Wang, D. D., et al., (2014), Compression-related EMIC waves drive relativistic electron precipitation, Sci China Tech. Sci., 57, 2418–2425. 8. Yuan, Z., Y. Xiong, S. Huang, X. Deng, Y. Pang, M. Zhou, I. Dandouras, J. G. Trotignon, A. N. Fazakerley, E. Lucek (2014b), Cold electron heating by EMIC waves in the plasmaspheric plume with observations of the Cluster satellite, Geophys. Res. Lett., 41, 1830-1837. 9. Burch, J. L., et al., 2015, Magnetospheric Multiscale Overview and Science Objectives, Space Sci. Rev. 10. Santolik O., et al., (2003), Singular value decomposition methods for wave propagation analysis, Radio Sci., 38 (1), 1010. 11. Huang et al. (2012), Kinetic structure and wave properties associated with sharp dipolarization front observed by Cluster, Ann. Geophys., 30, 97–107. 12. Huang, S. Y., et al. (2016a), Two types of whistler waves in the hall reconnection region, J. Geophys. Res. Space Physics, 121. 13. Huang, S. Y., et al. (2016b), MMS observations of ion-scale magnetic island in the magnetosheath turbulent plasma, Geophys. Res. Lett., 43, 7850–7858. 14. Wang, D., et al., (2015), Statistical characteristic of EMIC waves: Van Allen Probe observations. J. Geophys. Res. Space Physics, 120,4400-4408. 15. Meredith, N. P., et al. (2014), Global morphology and spectral properties of EMIC waves derived from CRRES observations, J. Geophys. Res. Space Physics, 119, 5328–5342. 16. Saikin, A. A., et al., (2015), The occurrence and wave properties of H -, He -, and O -band EMIC waves observed by the Van Allen Probes, J. Geophys. Res. Space Physics, 120, 7477–7492. 17. Allen, R. C., et al. (2015), A statistical study of EMIC waves observed by Cluster: 1. Wave properties, J. Geophys. Res. Space Physics., 120, 5574–5592, 18. Min, K., et al., (2012), Global distribution of EMIC waves derived from THEMIS observations, J. Geophys. Res., 117, A05219.