nwp(b) annual report 2014-15
TRANSCRIPT

i
NETWORK PROJECT ON BUFFALO IMPROVEMENT
ANNUAL REPORT 2014 - 2015
AND PROJECT CO-ORDINATOR’S OBSERVATIONS
ICAR- CENTRAL INSTITUTE FOR RESEARCH ON BUFFALOES SIRSA ROAD, HISAR – 125 001 (HARYANA)

ii
NETWORK PROJECT ON BUFFALO IMPROVEMENT
ANNUAL REPORT 2014- 2015 AND
PROJECT CO-ORDINATOR’S OBSERVATIONS
Published by
Director & PC(B) CIRB Hisar-125 001 Edited by Dr. Inderjeet Singh, PC(B) Dr. A K Pandey, I/c NWP(B) Compiled by: Sri. Ramchander, Tech. Officer Phone: +91-1662-281635/281602 Fax: +91- 01662-275004 E mail: [email protected]
[email protected] Website: www.cirb.res.in
COORDINATING UNIT
ICAR- CENTRAL INSTITUTE FOR RESEARCH ON BUFFALOES HISAR – 125 001 (HARYANA)

iii
CONTENTS
S. N. TITLE PAGE NO. 1.
INTRODUCTION AND ACTION TAKEN REPORT
Introduction, head wise and year wise breakup of XIIth Plan (2012-17)
Participating Centres Objectives, Technical program, Growth, Production & Reproduction Targets
1-2 3 4
2. CENTREWISE PERFORMANCE, RESEARCH ACHIEVEMENTS AND PROJECT COORDINATOR’S OBSERVATIONS
NAME OF CENTRE BREED CIRB, Hisar Murrah 5-15 GADVASU, Ludhiana Murrah 16-29 NDRI, Karnal Murrah 30-42 IVRI, Izatnagar Murrah 43-54 LUVAS, Hisar Murrah 55-67 LRS, Mamnoor Murrah 68-77 ICAR Res. Complex E R Patna Murrah 78-84 CIRB Sub Campus, Nabha Nili Ravi 85-96 JAU, Junagarh Jaffarabadi 97-114 MPKV, Kolhapur Pandharpuri 115-135 AAU, Khanapara Swamp 136-146 RAJUVAS, LRS Vallabhnagar Surti 147-178 IGFRI, Jhansi Bhadawari 179-192 4. FIELD UNITS CIRB, Hisar Murrah 193-205 GADVASU, Ludhiana -do- 206-221 NDRI, Karnal -do-
222-232
5. Bull Certification Laboratory, CIRB HISAR 233-234 6.
SUMMARY OF RESEARCH ACHIEVEMENTS AND PROGRESS OF THE PROJECT
Selection and use of Breeding Bulls for Murrah Breed
Health Evaluation and Semen Quality Testing Progeny Test Evaluation of Bulls (10th Set) Frozen semen doses of progeny Tested Bulls (Murrah breed) Semen freezing and balance stock for bulls under test Germplasm dissemination for breeding purpose Performance characteristics of different centres since inception Performance characteristics of different Field Units
235-236 236
236-237 237-238
238 239
239-247 248-249

1
NETWORK PROJECT ON BUFFALO IMPROVEMENT
Annual Report 2014 – 2015 All India Coordinated Research Project on buffaloes was initiated in the year 1970-71 for genetic
evaluation of large and medium size buffaloes which was later on made specific on two important breeds viz. Murrah and Surti in the coordinated program. The main thrust was to test the sires with a view to produce proven bulls for enhancing milk production. The efforts made by scientific manpower through this venture are able to standardize testing methodology and germplasm evaluation for superior bull production of important breeds of buffaloes. The infrastructure has been created which is capable to generate germplasm in the form of bulls and frozen semen at some of the testing centers.
During the VIII Five Year Plan, efforts were made by coordinating various Institutions engaged in
buffalo research and institutional buffalo herds to meet the objectivity of producing large number of genetically superior breeding bulls on the basis of their pedigree and progeny performance. It has been initiated as Network Project on Buffalo Improvement and running at ICAR-Central Institute for Research on Buffalo, Hisar since 1993. This has ensured sustained maintenance and production of improved germplasm on large scale for use in buffalo improvement program and for establishing linkages with institutions. This is the only centre in India where semen from progeny tested proven bulls are available. Progeny testing in Murrah Breed is carried out at eight participating institutional /SVU centres viz. CIRB Hisar, NDRI Karnal and IVRI Izatnagar (non funded ICAR centers), GADVASU Ludhiana, LUVAS Hisar and LRS Mamnoor (funded SVU centres), KVASU Pookode and ICAR RC Patna (non funded centres). Three field centers of Murrah were also initiated in 2001 at CIRB Hisar, NDRI Karnal and GADVASU Ludhiana to produce more number of daughters per bull for accurately evaluating the breeding bulls. About 15000 artificial inseminations were carried out in 2014-15 at farmer’s door in the village to produce daughters. The milk yields of daughters are being recorded for use in sire evaluation. Apart from Murrah six other important buffalo breeds: Jaffarabadi, Pandharpuri, Surti, Nili Ravi, Bhadawari, and Swamp are covered under the project.
About 900 breedable buffaloes are being maintained at institutional Murrah centres for production
of high genetic merit male and female calves to be used for production of future sires. 188 bulls in fourteen set were test mated at various Murrah centre till August 2015. Test mating from 15 bulls of 15th set is going on since July 2014 and continues upto December 2015. 142 Bulls of ten sets has been evaluated. Top ranked 26 proven bulls with percent superiority ranging from 3.53 (Bull no. 829 IInd set) to 24.89 (Bull no. 1875 VIIIth set) over their contemporary daughters has been used for nominated mating for production of males calves for future breeding purposes. From 10th set onward BLUP method of sire evaluation is being used to evaluate the test bulls, the genetic superiority of 10th set proven bulls was 1.23 percent over the least square means of their contemporary daughters. 73291 doses of semen from these proven bulls are available at semen labs of CIRB, GADVASU and NDRI centre. In addition to semen doses from proven bulls more than 2.50 Lakh doses of semen of test bulls are also available at CIRB, GADVASU and NDRI centre. Germplasm dissemination is essential activity of the project in which breeding bulls and semen from test bulls and progeny tested (PT) bulls are being disseminated to the farmers, state animal husbandry departments, state livestock development boards and other developmental agencies for breed improvement. 9,06,015 frozen semen doses were disseminated/ sold to farmers and various agencies for improvement in milk production of buffaloes of the country from 1998-99 till 2014-15.
Elite herds of Jaffarabadi, Surti, Bhadawari, Pandharpuri, Nili Ravi, and Swamp breeds of
buffaloes have been established in their respective breeding tracts. Semen freezing laboratories have been established at all the centres. Nili-Ravi, Bhadawari and swamp breed centres are functioning as conservation and improvement units and Jaffarabadi, Pandharpuri and Surti breed centre are concentrating on field progeny testing along with maintaining the herd for bull production and testing. A breedable herd of 501 (Nili-Ravi-178, Jaffarabadi-151, Pandharpuri-34, Swamp-41, Surti-44 and Bhadawari-53) is being maintained of the six breeds.

2
XII Plan Outlay: NWP (BI) Year-wise and head-wise) (Rs. in Lakhs)
Head 2012-13 2013-14 2014-15 2015-16 2016-17 Total
ICAR Share State
Share ICAR Share State
Share ICAR Share State
Share ICAR Share State
Share ICAR Share State
Share ICAR Share State
Share A) Grant-in-aid Salary i) Pay & allowances 142.67 47.55 235.13 78.38 144.90 48.30 153.75 51.25 163.87 54.63 840.32 280.11 Total A 142.67 47.55 235.13 78.38 144.90 48.30 153.75 51.25 163.87 54.63 840.32 280.11 B) Grant-in-aid General ii) TA (Domestic) 6.41 1.25 8.65 1.55 10.75 1.85 11.27 1.93 11.48 1.92 48.56 8.50 iii) Cont. (Research) 200.92 44.01 236.22 58.40 436.93 91.46 476.55 101.85 500.75 106.25 1851.37 401.97 iv) HRD (Trg.)
International Domestic
0.00 0.00 0.00 0.00 0.00 0.00 0.00 0.00 0.00 0.00 0.00 0.00 Total B 207.33 45.26 244.87 59.95 447.68 93.31 487.82 103.78 512.23 108.17 1899.93 410.47 C) Grant-in-aid Capital a) Works 0.00 0.00 0.00 0.00 153.25 39.25 0.00 0.00 0.00 0.00 153.25 39.25 b) Equipment 0.00 0.00 0.00 0.00 144.75 25.25 96.75 17.25 0.00 0.00 241.50 42.50 c) Inf. Technology 0.00 0.00 0.00 0.00 0.00 0.00 0.00 0.00 0.00 0.00 0.00 0.00 d) Library Books & journals 0.00 0.00 0.00 0.00 0.00 0.00 0.00 0.00 0.00 0.00 0.00 0.00 e) Vehicles & Vessels 0.00 0.00 0.00 0.00 0.00 0.00 0.00 0.00 0.00 0.00 0.00 0.00 f) Livestock 0.00 0.00 0.00 0.00 65.00 17.00 0.00 0.00 0.00 0.00 65.00 17.00 g) Furniture & fixtures 0.00 0.00 0.00 0.00 0.00 0.00 0.00 0.00 0.00 0.00 0.00 0.00 h) Land & renovation 0.00 0.00 0.00 0.00 0.00 0.00 0.00 0.00 0.00 0.00 0.00 0.00 i) Others 0.00 0.00 0.00 0.00 0.00 0.00 0.00 0.00 0.00 0.00 0.00 0.00 Total C 0.00 0.00 0.00 0.00 363.00 81.50 96.75 17.25 0.00 0.00 459.75 98.75 Total (A+B+C) 350.00 92.81 480.00 138.33 955.58 223.11 738.32 172.28 676.10 162.80 3200.00 789.33 Total allocation 442.81 618.33 1178.69 910.60 838.90 3989.33
Centrewise and headwise fund (ICAR Share) released in respect of Network Project on Buffalo Improvement for year 2014-15 (R E) (Rs. In lakhs)
Name of Centre Capital Salary General
Works Equip. Vehi-cle
Libr-ary
Live stock
Furni-ture
Others
Estt. Char.
TA HRD Conti-ngency
Other Total Released
SAU’s GADVASU, Ludhiana 0.00 9.0000 0.00 0.00 0.0000 0.0000 0.00 18.0000 0.7500 0.00 37.5000 0.0000 65.2500 LUVAS, Hisar 0.00 3.0000 0.00 0.00 0.0000 0.0000 0.00 0.0000 0.4500 0.00 24.0000 0.0000 27.4500 JAU, Junagarh 0.00 2.2500 0.00 0.00 0.0000 0.0000 0.00 7.5000 0.7500 0.00 31.5000 0.0000 42.0000 RAJUVAS, Vallabhnagar 0.00 4.5000 0.00 0.00 0.0000 0.0000 0.00 10.5000 0.7500 0.00 26.2500 0.0000 42.0000 MPKV, Kolhapur 0.00 0.5250 0.00 0.00 3.9750 0.0000 0.00 23.2500 0.7500 0.00 30.0000 0.0000 58.5000 SVVU, Mamnoor (AP) 0.00 1.5000 0.00 0.00 0.0000 0.0000 0.00 10.5000 0.7500 0.00 16.5000 0.0000 29.2500 GADVASU (Field Unit) 0.00 1.5000 0.00 0.00 0.0000 0.0000 0.00 10.5000 0.3000 0.00 7.5000 0.0000 19.8000 AAU Khanapara 0.00 0.7500 0.00 0.00 1.5000 0.0000 0.00 18.0000 0.7500 0.00 15.0000 0.0000 36.0000 ICAR Institutes IGFRI, Jhansi 0.00 4.0000 0.00 0.00 0.0000 0.0000 0.00 0.0000 1.0000 0.00 24.0000 0.0000 29.0000 NDRI (Field Unit) 0.00 2.0000 0.00 0.00 0.0000 0.0000 0.00 0.0000 0.4000 0.00 12.0000 0.0000 14.4000 CIRB, Sub Campus Nabha 0.00 1.9394 0.00 0.00 0.0000 0.0000 0.00 0.0000 0.5394 0.00 12.0000 0.0000 14.4787 CIRB (Field Unit) 0.00 1.1258 0.00 0.00 0.0000 0.0000 0.00 0.0000 0.4000 0.00 10.0000 0.0000 11.5258 Bull Cert. Lab., CIRB, Hisar 0.00 0.0000 0.00 0.00 0.0000 0.0000 0.00 0.0000 0.3570 0.00 1.7500 0.0000 2.1070 Coordinating Unit 0.00 0.0000 0.00 0.00 0.0000 0.0000 0.00 0.0000 1.9520 0.00 1.0000 0.0000 2.9520 Total 0.00 32.0902 0.00 0.00 5.475 0.0000 0.00 98.2500 9.8984 0.00 249.0000 0.0000 394.7135
3
PARTICIPATING CENTRES (As on 31.03.2015)
Coordinating Unit, CIRB, Hisar Sr No Name of centre Breed Year of start
Agricultural University based centers I GADVASU, Ludhiana Murrah 1993
II LUVAS, Hisar Murrah 1993 III JAU, Junagarh Jaffarabadi 2001 IV RAJVASU, Vallabhnagar Surti 2001 V MPKV, Kolhapur Pandharpuri 2001 VI AAU, Khanapara Swamp 2001 VII Field Unit GADVASU, Ludhiana Murrah 2001 VIII LRS, Mamnoor Murrah 2012-13
ICAR Institute based Centres I IGFRI, Jhansi Bhadawari 2001
II CIRB, Sub - Campus Nabha Nili-Ravi 2001 III Field Unit NDRI, Karnal Murrah 2001 IV Field Unit CIRB, Hisar Murrah 2001 V Bull Cert. Lab., CIRB, Hisar All breed 2001
Non funded participating centers I IVRI, Izatnagar Murrah 1993
II NDRI, Karnal Murrah 1993 III CIRB, Hisar Murrah 1993 IV ICAR Res. Comp. ER Patna Murrah 2014 V KVASU, Pookode (Kerala) Murrah 2014
Scientists Meets: Place Duration 1st Scientist meet GAU, Junagarh, February 10-11, 1993 2nd Scientist meet PAU Ludhiana April 28 – 29, 1994 3rd Scientist meet RAU, Udaipur November 2 - 3 , 1995 4th Scientist meet PAU, Ludhiana July 28 – 29, 2000 5th Scientist meet AAU, Khanapara January 3- 4, 2002 6th Scientist meet MPKV, Kolhapur April 5 - 6, 2005 7th Scientist meet CIRB, Hisar April 4 - 5, 2007 8th Scientist meet JAU, Junagadh March 5 - 6, 2009. Midterm Review meet CIRB, Hisar December 5, 2009 9th Scientist meet CIRB, Hisar November 27-28, 2010 10th Annual Review Meet Bhuj, Gujarat September 2 - 3, 2011 11th Annual Review Meet NDRI, Karnal August 24, 2012 12th Annual Review Meet LRS Vallabhnagar September 9-10, 2014

4
CENTRE WISE PERFORMANCE, RESEARCH ACHIEVEMENTS AND
PROJECT COORDINATOR OBSERVATIONS
MURRAH BREED CENTRES CIRB Hisar GADVASU Ludhiana LUVAS, Hisar NDRI Karnal IVRI Izatnagar LRS Mamnoor ICAR Res. Complex for ER Patna KVASU Pookode Objective: The objective of the project is to envisage and undertake progeny testing for improvement of various breeds of buffaloes through variouscentres in different parts of the country. Priority and emphasis to be on performance recording and improvement of Murrah, Nili Ravi, Jaffarabadi, Surti, Bhadawari, Pandharpuri and Swamp breeds and on semen quality testing laboratory.
Technical Programme: The technical programme involves testing of 12-15 bulls on about 1000 breedable buffaloes at organised farms at GADVASU, Ludhiana; CIRB, Hissar; NDRI, Karnal; IVRI, Izatnagar; LRS, Mamnoor and KVASU, Pookode in every 18-month’s cycle. From each bull 75-80 pregnancies are to be obtained so that 20-25 recorded daughters per bull are available at all the centres for the evaluation of bulls. The bulls will be ranked on the basis of performance of their daughters and 20% of them will be selected as proven bulls from each set. The semen of the proven bulls will be used on elite buffaloes at different centres for the production of future sires and herd replacements.
A. Growth rate targets :- Age group Target growth rate (g) per day Expected body weight at terminal age (kg) Female Male Female Male Birth-6 mths 450 450 112 112
6-18 mths 500 550 294 312 18-24 mths 400 530 367 410 24-30 mths 400 450 440 520 30-36 mths 300 350 495 584
N.B. Average birth weight, 30kg
B. Reproduction and production targets:- i. Av. age at first service = 24 months (300kg B. wt.) ii. Av. age at first calving = 40 months
iii. AV. age for initiating training of bulls = 18 months (350 kg B. wt.) iv. Av. age at first collection = 30 months (400 kg B .wt.) v. Av. service period = 130 days
vi. Calf mortality (0-3 mths) = ≤ 5 % vii. Wet average = ≥ 8.5 kg
viii. Herd average = ≥ 5.5 kg
5
ICAR-CENTRAL INSTITUTE FOR RESEARCH ON BUFFALOES, HISAR (MAIN UNIT)
1. Name of Center CIRB, Hisar 2. Project Code Specified 3. Project Title Net work Programme on Buffaloes Improvement 4. Date of Start 1993-1994 5. Objectives Specified 6. Technical Programme Specified 7. Financial Statement - 8. Staff Position: - 9. Herd Performance Enclosed Tables 9.1 to 9.21 9.1 Herd Strength during the Period April 2014 to March, 2015 Category Addition Disposal Sr. No. OB B T D T S Exptl CB
Female 1. Female Calves below 3 months 15 80 - 9 72 - - 14 2. Female Calves 3-6 months 14 - 72 2 67 - - 17 3. Female Calves 6-12 months 37 - 67 - 64 - - 40 4. Heifers above
1-2 years 2-2.5 years Above 2.5 years
45 29 66
- - -
64 47 58
- - -
47 58 61
1 - 5
- - 4
61 18 52
5. Total Buffaloes 151 4* 61 6 - 25 3 185 6. Sub Total 357 84 369 17 369 31 7 387
Males 1. Male Calves below 3 months 14 76 - 8 68 - - 14 2. Male Calves 3-6 months 15 - 68 1 58 - - 24 3. Male Calves 6-12 months 32 58 1 50 7 - 32 4. Male above
1-2 years > 2 years
14 5
50 3
- 1
3 7
31 5
- -
21 2
5. Breeding bulls 8 3* 7 - - 7 - 11 6. Bullocks - - - - - - - - 7. Teasers / others 2 - - - - 1 4 5 Sub Total 90 79 186 11 186 51 4 109 Grand Total 447 163 555 28 555 82 11 496
OB = Opening Balance D = Deaths S = Sale A= Auction *Purchase B = Births T = Transfer CB = Closing Balance

6
9.2 Calving Statistics during the period April 2014 to March, 2015 Month Male
No. % Female No. %
Still Birth No. %
Overall No. %
April, 14 1 0.63 1 0.63 1 0.63 3 1.88 May 4 2.50 4 2.50 -- 8 5.00 June 3 1.88 7 4.41 1 0.63 11 6.93 July 8 5.00 9 5.63 -- -- 17 10.71 August 8 5.00 11 6.93 1 0.63 20 12.60 September 9 5.63 12 7.56 -- -- 21 13.13 October 10 6.26 11 6.93 -- -- 21 13.13 November 6 3.78 4 2.50 1 0.63 11 6.93 December 5+4* 5.63 5 3.15 -- -- 10 6.30 January,15 11 6.93 13 8.19 -- -- 24 15.00 February 4 2.50 1 0.63 -- -- 5 3.15 March 3 1.88 2 1.26 -- -- 5 3.15
Overall 72+4* 47.50 80 50.00 4 2.50 160 100.00 * Purchase with buffaloes 9.3. Disposal of Animals during the Period April 2014 to March, 2015
Female Category Surplus Repd.
Problem Weak & Old
Off breed
Death Sale Total 1.Female Calves
< 6 months 6-12 months
-- --
-- --
-- --
-- --
9 --
-- --
9 --
2. Heifers 1-2.5 years > 2.5 years
-- --
-- 4
-- 1
1 --
2 --
-- --
3 5
3. Buffaloes 8 12 4 1 6 -- 31 Sub Total 8 16 5 2 17 -- 48
Male 1.Male Calves
< 6 months 6-12 months
-- --
-- 1
-- --
-- --
8 1
-- 6
8 8
2. Above 1 – 2 yrs 11 -- -- - 1 20 32 3. Young Bulls 2 -2.5 yrs - -- -- - 1 5 6 4. Breeding bulls >2.5yrs - -- -- - - 7 7 5. Teaser 1 -- -- - - - 1 Sub Total 12 1 - - 11 38 62 Grand Total 20 17 5 2 28 38 109
9.4. Month-wise Mortality during the Period April 2014 to March, 2015
Month Female Male Over
all Herd 0-3m 3-6m 6-12m 1-2
Yrs. Above 2 Yrs.
Overall Female 0-3m 3-
6m 6-12m
Above 1 Yrs.
Overall Male
mortality 9 2 -- -- 6 17 8 1 1 1 11 28 Overall calves mortality = 9.19 % (17/185)

7
9.5. Causes of Mortality (quarter wise) during the period April, 2014 to March, 2015 Particulars 1st quarter 2nd quarter 3rd quarter 4th quarter Total A. Respiratory System : 1. Pheumo-Enteritis -- -- 4 3 7 2. Broncho-Pheumonia 3 2 1 2 9 B. Digestive System : 1. Enteritis -- -- -- 1 1 2. Septicamia & Toxaemia -- -- -- -- -- 3. Gastroenteritis -- 1 -- 1 2 4. Haem. Enteritis -- -- -- 3 3 C. Circulatory 1 1 -- 1 3 D. Others 1. Accidents -- -- 1 -- 1 2. Miscellaneous -- 2 1 -- 3 Total 4 6 7 11 28
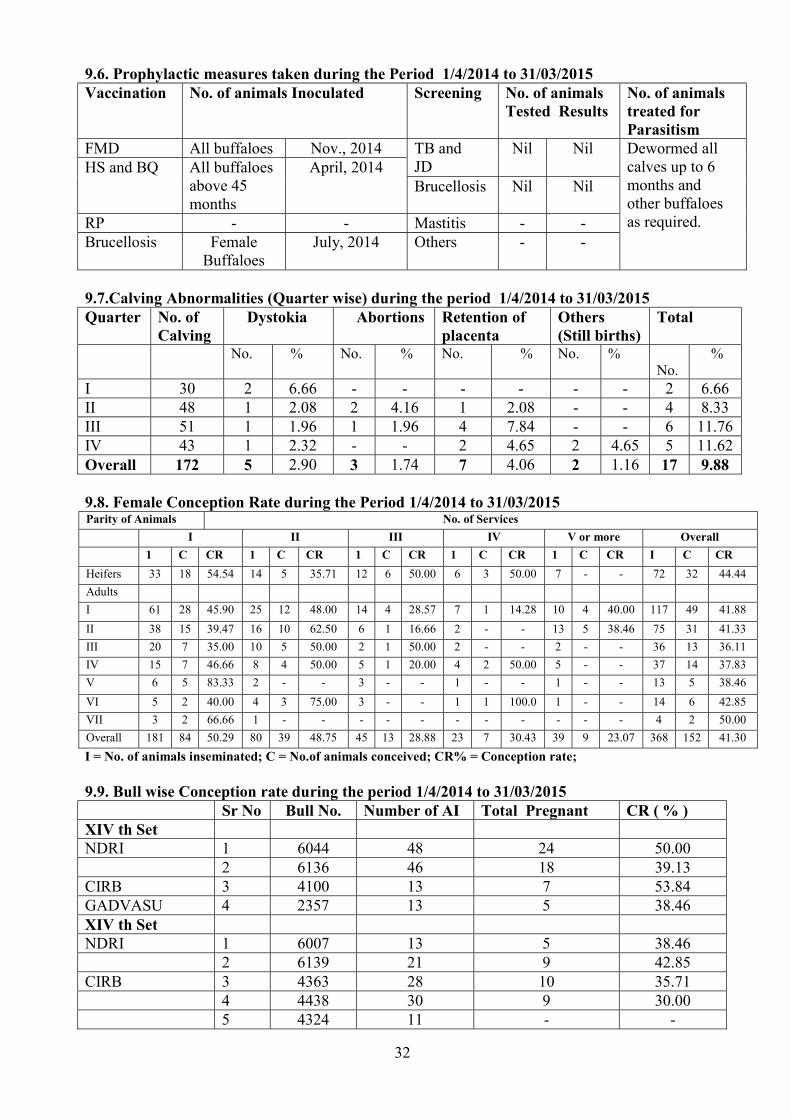
9.6 Prophylactic Measures Taken During the Period April 2014 to March, 2015 During the period under report all calves up to the age of one year were treated for parasitism at regular
interval. Deworming also done in adult animals as per their symptoms and health conditions. Animals were vaccinated against FMD and HS.
9.7 Calving Abnormalities (Quarter wise) during the period April 2014 to March, 2015 Quarter
No. of
Calv. Dystocia Retention of
Placenta Prolepses Others (Still births) Abortions Total
No % No % No % No % No % No. % I 22 2 1.26 3 1.89 - - 2 1.26 2 1.26 9 5.67 II 58 1 0.63 - - - - 1 0.63 2 1.26 4 2.52 III 46 1 0.63 - - - - 1 0.63- - - 2 1.26 IV 34 - - 3 1.89 - - - - 2 1.26 5 3.15
Overall 160 4 2.52 6 3.78 - - 4 2.52 6 3.78 20 12.60
9.8. Female Conception Rate During the Period January to December 2014 Parity I II III IV Overall A I C CR % AI C CR % AI C CR% AI C CR % AI C CR % Heifers 51 19 32.20 32 21 65.60 22 9 40.90 18 7 38.80 123 56 45.53 Adults 128 68 53.10 72 38 52.80 29 22 75.80 11 6 54.50 240 134 55.83 Overall 179 87 48.60 104 59 56.70 51 31 60.80 29 13 44.80 363 190 52.34
AI = Animals inseminated C = Animals conceived CR % = Conception rate in percent
9.9. Bull-wise Conception Rate (January to December, 2014) Sr. No. Bull No. Total Number of AI Total Conceived CR%
1. 2429 9 6 66.7 2. 4438 9 4 44.4 3. 4363 13 7 53.8 4. 4328 10 5 50.0 5. 1693 6 2 33.3 6. 6290 33 21 63.6 7. OBAMA 2 2 100.0 8 6136 13 8 61.5 9 6066 12 6 50.0 10 1994 8 5 62.5 11 4196 27 15. 55.5 12 4093 14 9 64.2 13 4100 15 8 53.3 14 YUVRAJ 21 15 71.4

8
15 VIRAAT 24 10 41.6 16 6044 16 6 37.5 17 2459 12 4 33.3 18 R-10 2 1 50.0 19 4354 15 7 46.6 20 SHERU 5 2 40.0 21 4324 17 5 29.4 22 6139 12 6 50.0 23 2371 12 5 41.6 24 2412 3 1 33.3 25 2417 21 11 52.3 26 2045 9 6 66.6 27 6067 23 13 56.5
Over all 363 190 52.3 9.9.1 Month-wise Conception Rate (January to December 2014)
Sr. No. Months No. of A I Preg. Animals CR % 1 January 27 16 59.26 2 February 31 16 51.61 3 March 43 27 62.79 4 April 19 8 42.11 5 May 13 7 53.85 6 June 14 6 42.86 7 July 17 7 41.18 8 August 30 12 40.00 9 September 25 10 40.00 10 October 54 30 55.56 11 November 56 31 55.36 12 December 36 20 55.56 13 Overall 363 190 52.34
9.10 Semen Stock for the year 2014-15 : Brief report of semen freezing and dissemination given below: Opening balance on 1.4.2015 : 252681 Semen Freezing : 127429 Semen doses received : 31765 Semen doses supplied /shared : 45721 Semen doses discarded : 6133 Semen doses sold : 57761 Semen doses used for Experiment : 123 Balance Grand Total at the end March 2015 : 302137
9.12 Production Performance of Buffaloes Completing Their Lactation During the period
April 2014 to March, 2015. Lact. No. No. of
obs. Av. Lact. Yield (kg)
Av. Lact. Length (days)
305-day Milk Yield (kg)
Av. Peak yield
1st 37 2296 315 2128 9.99 2nd 28 2652 322 2375 11.49 3rd 14 2784 319 2576 12.74 4th 12 2412 282 2383 12.47 5th 10 2743 288 2586 12.11
6th& above 9 2261 289 2229 10.90 Overall 110 2502 313 2355 11.26

9
9.12.1 Production Performance of Buffaloes since Inception of Network Year Av. Lact. Yield (kg) Av. Lact. Length
(days) 305-day Milk Yield
(kg) Av. Peak yield
1991-92 1761±77(154) 374±9(154) 1552±60(154) - 1992-93 1804±48(137) 395±8(137) 1508±34(137) 7.46 1993-94 1980±58(148) 419±7(148) 1686±46(148) 8.20 1994-95 1930±37(206) 334±5(206) 1787±0(206) 8.89 1995-96 1936±47(147) 313±7(147) 1855±42(147) 9.40 1996-97 1879±51(173) 313±7(173) 1775±45(173) - 1997-98 1784±44(123) 304±6(123) 1688±37(123) - 1998-99 1762±36(153) 284±16(153) 1702±33(153) - 1999-00 2138±38(141) 313±4(141) 2042±31(141) - 2000-01 1997±41(173) 306±9(173) 1914±36(173) 9.68 2001-02 1954±40(152) 290±4(152) 1898±35 (152) 9.71 2002-03 1987±39(148) 303±5(148) 1902±32(148) 9.20 2003-04 1910±37(148) 299±5(148) 1837±31(148) 9.18 2004-05 2017±40(167) 319±5(167) 1886±33(167) 9.33±0.16 2005-06 2047±45(149) 321±5(149) 1921±38(149) 8.76±0.19 2006-07 1994.9± 37(170) 322±4 (170) 1882±32(170) 9.23±0.15 2007-08 1954±38.02 299±4.66 1891±34.12 9.72±0.19 2008-09 2076(138) 325 (138) 1926 (138) 9.50 (138) 2009-10 2285(102) 361(102) 1995(102) 9.54(102) 2010-11 2471 (113) 337 (113) 2247 (113) 10.48 (113) 2011-12 2598 (116) 338 (116) 2374 (116) 12.29 (116) 2012-13 2478±54.36 (110) 318±6.14 (110) 2335±45.71 (110) 11.23 ± 0.23 (110) 2013-14 2494 ± 44.16 (98) 333 ± 6.92 (98) 2291± 58.25 (98) 11.03 ± 0.19 (98) 2014-15 2501.72±60.17 (110) 313.05 ± 5.57 (110) 2354.65±47.55 (110) 11.26 ± 0.17 (110)
9.13 Average Milk Components (Month-Wise) April, 2014 to March, 2015 Month N Fat SNF Protein Lactose April, 2014 101 9.11 ± 0.10 9.34 ± 0.04 4.18 ± 0.02 5.20 ± 0.03 May 96 9.09 ± 0.09 9.46 ± 0.04 4.18 ± 0.02 5.21 ± 0.03 June 90 9.19± 0.11 9.52 ± 0.05 4.10 ± 0.02 5.10 ± 0.03 July 93 9.18 ± 0.16 9.54 ± 0.05 4.04 ± 0.03 5.04 ± 0.03 August 93 8.23 ± 0.15 8.98 ± 0.05 3.94 ± 0.04 4.88 ± 0.04 November 125 7.73 ± 0.10 8.82 ± 0.05 3.81 ± 0.03 4.80 ± 0.03 December 130 7.72 ± 0.10 8.64 ± 0.04 3.69 ± 0.03 4.73 ± 0.02 January, 2015 134 8.24 ± 0.10 9.11± 0.04 3.93 ± 0.02 4.86 ± 0.02 February 153 8.23 ± 0.09 8.98 ± 0.03 3.90 ± 0.02 4.85 ± 0.02 March 153 8.53 ± 0.08 9.21± 0.03 4.01 ± 0.02 5.00 ± 0.02 Overall 1168 8.46 ± 0.04 9.13 ± 0.02 3.96 ± 0.01 4.95 ± 0.01
9.14: Reproduction Performance of Buffaloes during the Period April 2014 to March, 2015 Traits 1 2 3 4 5 6 7 & above Overall Average Age at Calving (Months)
N ẋ
SE -- -- -- -- -- -- -- 61
42.84 0.79
Average Service Period (Days)
N ẋ
SE 35
186
23 171
11 141
7
111
3 110
9
191
88 168.43
8.31 Average Dry Period (Days)
N ẋ
SE 35
151
23 148
11 128
7 127
3 106
9 182
88 149.33
6.46 Average Calving Interval (Days)
N ẋ
SE 35
500
23 477
11 445
7 424
3 415
9 499
88 472.92 8.45
10
9.14.1 Reproduction Performance of Buffaloes Since inception of Network.
Years AFC (Months) Service Period (days) Dry Period (days) Calving Interval (days) 1991-92 51.0±0.8 (26) 236±11(108) 138±6 (74) 502±12(74) 1992-93 50.7±1.5 (27) 304±15(96) 132±7 (42) 489±16 (42) 1993-94 59.1±1.6 (48) 312±12(158) 230±14(161) 625±1 (161) 1994-95 55.3±1.3 (48) 202±15(105) 180±12(113) 527±10(116) 1995-96 51.51.5 (22) 193±10(149) 186±7 (149) 501±9 (152) 1996-97 47.6±1.0 (23) 182±10(149) 204±7 (173) 473±9 (152) 1997-98 45.5±0.5 (49) 175±14(106) 203±11(118) 491±10(118) 1998-99 50.0±0.1 (57) 137±9(121) 159±14(126) 455±10(126) 1999-00 46.2±1.0 (54) 138±9(104) 142±7 (120) 451±8 (120) 2000-01 46.2±1.2 (45) 146±9(151) 153±7 (154) 454±9 (154) 2001-02 49.8±0.8 (51) 146±11(125) 158±8 (135) 456±11(135) 2002-03 47.83±0.51(61) 133±9(126) 143±6 (128) 440±9 (130) 2003-04 50.52±0.84(77) 151±10(142) 147±7 (149) 458±10(151) 2004-05 48.18±0.82(76) 111±7(100) 134±6 (100) 426±7 (101) 2005-06 47.89±0.73(76) 184±12(112) 168±8 (117) 499±12(117) 2006-07 46.90±1.06(43) 183±10.11(113) 178±8 (116) 495±10 (116) 2007-08 48.27±0.64 159±11.55 177±9.26 482±12.06 2008-09 47.66±0.97 (44) 171±12.31 (80) 160±10.50 (85) 469±12.20 (85) 2009-10 49.22±0.75 (51) 212±16.64 (77) 170±12.99 (77) 520±16.21 (77) 2010-11 49.92±1.04 (35) 186±13.74 (80) 157±10.47 (83) 492±13.96 (83) 2011-12 51.91±0.98 (37) 181±13.24 (80) 155± 8.63 (81) 485±12.65 (81) 2012-13 44.48 ±1.42 (37) 174±11.53 (72) 153±8.19 (72) 481±11.87 (73) 2013-14 45.62±10.78(37) 190±11.27 (86) 170±9.77 (85) 495±11.64 (87) 2014-15 42.84±0.79 (61) 168.43 ± 8.31 (88) 149.33±6.46 (88) 472.92 ± 8.45 (88)
9.15 Month wise Milk Production and Disposal during the Period 4/1/ 2014 to 31/03/15 Month Total milk
produced (kg) Disposal(Kg) Liquid Milk Calf feeding Expt.
April, 2014 25128 21894 3234 -- May 20844 18416 2428 -- June 21665 19222 2443 -- July 23465 20695 2770 -- August 25780 23308 2472 -- September 26355 24037.5 2317 -- October 29498 29123 2375 -- November 31143 26230 4913 -- December 34590 29783 4807 -- January, 2015 36172 31710.5 4461.5 -- February 34805 30582 4323 -- March 37569 33442.5 4126.5 -- Total 348828 308443.5 40384.5 --
11
9.16 Feed and fodder (Quintals) purchased and offered to animals during the 4/1/ 14 to 31/03/15 Quarter Type of
Fodder Old
Balance Qty. produced
at Farm Qty.
Purchased Actually
fed Balance
1 Green
Dry Silage
concentrate
--- 675 2050
--
7279 552 657 --
-- 298 -- --
6622 985 2120 1419
-- 540 587 --
1I Green Dry
Silage concentrate
-- 540 587 --
15856 ---
3917 ---
-- 3550
-- --
11939 827 587 1426
-- 3263 3917
-- III Green
Dry Silage
concentrate
-- 3263 3917
--
7416 --- --- ---
-- -- -- --
7416 1235 2490 1539
-- 2028 1427
-- 1V Green
Dry Silage
concentrate
-- 2028 1427
--
8734 --- --- ---
-- -- -- --
8734 1076 1427 1413
-- 952 660 --
Total Green Dry
Silage concentrate
-- 675 2050 ---
39944 552 5234 ---
-- 3848 --- --
34710 4123 6624 5797
-- 952 660 --
+ * Indicate previous year balance
Table 9.17: Milk performance during April 14 to March 15 Month Buffaloes in
Milk Dry buffaloes Total % in Milk Wet Av.
(kg) Herd Av.
(kg) April 2014 106 44 150 70.47 7.91 5.57 May 98 51 149 66.00 6.86 4.53 June 95 55 150 63.70 7.58 4.83 July 97 57 154 63.24 7.77 4.92 August 103 56 159 64.77 8.08 5.23 September 105 51 156 67.00 8.45 5.65 October 117 47 164 71.00 8.63 5.80 November 121 52 173 69.90 8.55 6.02 December 124 56 180 68.70 9.00 6.18 January 2015 134 53 187 71.30 8.68 6.19 February 145 38 183 79.18 8.57 6.76 March 146 35 181 80.57 8.80 6.67 overall 116 50 166 69.97 8.25 5.77
9.17.1 Milking performance since inception Year No. of Animal
in Milk No. of Animal dry
Total Animal
% in Milk Wet Av. (kg)
Herd Av. (kg)
1991-92 182 147 329 55.3 4.70 2.61 1992-93 165 111 276 60.60 4.80 2.83 1993-94 153 125 178 55.00 5.65 3.10 1994-95 181 85 266 68.10 6.09 4.15 1995-96 153 82 235 65.19 6.43 4.19 1996-97 122 83 205 59.56 5.62 3.35 1997-98 121 76 197 61.38 6.12 3.75 1998-99 133 73 206 64.52 6.77 4.37 1999-00 137 72 209 65.48 6.85 4.49
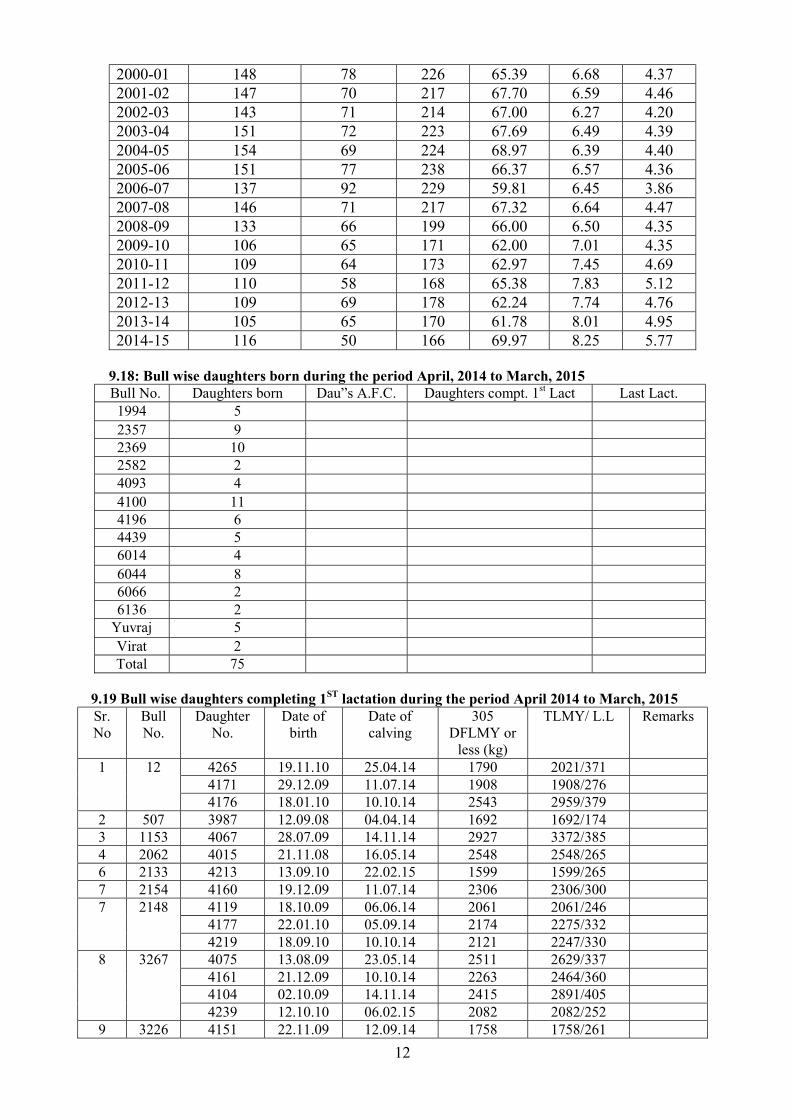
12
2000-01 148 78 226 65.39 6.68 4.37 2001-02 147 70 217 67.70 6.59 4.46 2002-03 143 71 214 67.00 6.27 4.20 2003-04 151 72 223 67.69 6.49 4.39 2004-05 154 69 224 68.97 6.39 4.40 2005-06 151 77 238 66.37 6.57 4.36 2006-07 137 92 229 59.81 6.45 3.86 2007-08 146 71 217 67.32 6.64 4.47 2008-09 133 66 199 66.00 6.50 4.35 2009-10 106 65 171 62.00 7.01 4.35 2010-11 109 64 173 62.97 7.45 4.69 2011-12 110 58 168 65.38 7.83 5.12 2012-13 109 69 178 62.24 7.74 4.76 2013-14 105 65 170 61.78 8.01 4.95 2014-15 116 50 166 69.97 8.25 5.77
9.18: Bull wise daughters born during the period April, 2014 to March, 2015
Bull No. Daughters born Dau”s A.F.C. Daughters compt. 1st Lact Last Lact. 1994 5 2357 9 2369 10 2582 2 4093 4 4100 11 4196 6 4439 5 6014 4 6044 8 6066 2 6136 2
Yuvraj 5 Virat 2 Total 75
9.19 Bull wise daughters completing 1ST lactation during the period April 2014 to March, 2015 Sr. No
Bull No.
Daughter No.
Date of birth
Date of calving
305 DFLMY or
less (kg) TLMY/ L.L Remarks
1 12 4265 19.11.10 25.04.14 1790 2021/371 4171 29.12.09 11.07.14 1908 1908/276 4176 18.01.10 10.10.14 2543 2959/379
2 507 3987 12.09.08 04.04.14 1692 1692/174 3 1153 4067 28.07.09 14.11.14 2927 3372/385 4 2062 4015 21.11.08 16.05.14 2548 2548/265 6 2133 4213 13.09.10 22.02.15 1599 1599/265 7 2154 4160 19.12.09 11.07.14 2306 2306/300 7 2148 4119 18.10.09 06.06.14 2061 2061/246
4177 22.01.10 05.09.14 2174 2275/332 4219 18.09.10 10.10.14 2121 2247/330
8 3267 4075 13.08.09 23.05.14 2511 2629/337 4161 21.12.09 10.10.14 2263 2464/360 4104 02.10.09 14.11.14 2415 2891/405 4239 12.10.10 06.02.15 2082 2082/252
9 3226 4151 22.11.09 12.09.14 1758 1758/261

13
4088 04.09.09 14.11.14 2570 2608/317 10 3255 4131 30.10.09 12.09.14 1709 1709/285 11 3598 4337 19.07.11 06.03.15 1748 1748/218 12 3631 3926 27.03.08 09.05.14 2851 3510/427 13 5371 3922 23.03.08 04.04.14 1538 1538/228
4144 17.11.09 02.05.14 1263 1612/370 14 4915 4226 27.09.10 14.11.14 2094 2094/257 15 5396 4001 22.10.08 13.06.14 2854 4131/497 16 5496 4129 24.10.09 15.08.14 2356 2375/344
4153 26.11.09 29.08.14 1632 1632/273 17 5514 4142 15.11.09 25.07.14 1925 2034/326 18 5414 4156 02.12.09 22.08.14 2281 2281/296 19 5516 4159 18.12.09 15.08.14 2335 2386/315
4130 27.10.09 05.12.14 2269 2726/403 4201 17.07.10 30.01.15 2330 2566/336
20 ND-2 3983 02.09.08 23.05.14 2142 2295/341 21 4170-P 26.02.09 09.05.14 1180 1180/247 22 4115-P 16.10.09 18.04.14 2528 2864/351 23 4113-P 16.10.09 09.01.15 1975 2001/313 24 4074 08.08.09 30.05.15 2274 2274/264 25 4202 21.07.10 28.11.14 2186 2377/340
9.20 List of Future breeding bulls Sr. No.
Bull No.
Date of Birth
Dam No. Sire No.
Dams best lact.305days or less yield (kg)
Semen doses
available Remarks (Parity)
1 4480 07.08.12 3133 1796 vii 3040 3 2 4512 29.09.12 3417 1875 viii 3076 2 3 4531 03.12.12 4041 2422 viii 2905 1 4 4590 14.06.13 4075 4059 2629 1 5 4592 28.06.13 4353 Khali 3528 2 6 4623 01.09.13 4261-P 1875 3506 2 7 4630 13.09.13 2273 851 3000 5 8 4654 19.1013 3633 2269 3241 3 9 4705-P 22.07.12
03.03.14-P 83-P B902 3913 --
10 4646 04.10.13 4067 ET 2927 1 11 4669 06.12.13 3546 851 2732 1 12 4677 21.12.13 3225 1994 2977 3 13 4678 22.12.13 4088 838 2608 1 14 4687 20.01.14 3156 1994 3309 2 15 4715 27.03.14 3351 4093 2982 2 16 4742 06.07.14 3586-P 1994 3276 4 17 4697 15.02.14 4091 4439 2678 1 18 4708 12.03.14 4707-P UK 2821 - 19 4733 14.06.14 4216 6044 2840 1
9.21 Target achieved during the year 2014-15 Sr.No Trait Target Achieved
1 Av. age at first calving 40.0 months 42.84 ± 0.79 (61) months 2 Av. service period 130 days 168.43±8.31 (88) days 3 Calf mortality (0-3 months) ≤ 5 % 9.19 % 4 Wet average ≥ 8.50 kg 8.25 kg 5 Herd average ≥ 5.50 kg 5.77 kg

14
10. Salient Research Achievements: The overall wet average and herd average were 8.25 and 5.77 kg, respectively, reported highest since inception of the project and revealed an improvement of 3.0 and 16.15 percent, respectively as compared to the performance in 2013-14.
The overall 305 days lactation milk yield and total lactation milk yield during April 2014 to March 2015 was reported 2355 and 2502 kg, respectively, revealed improvement of 2.79 and 4.51 percent as compared to last year performance.
The AFC during the period under report was observed 42.84 months which is lowest since inception of the project and revealed 11.58 percent improvement over the last year performance.
During the period April 2014 to March 2015 the total buffalo herd and calf mortality (0-3 month) was reported 5.65 and 9.19 percent, respectively.
The overall conception rate during the period under report was 52.34 percent, which was reported higher than the previous year (51.22 %).
A total 1,27,429 semen doses were frozen at the semen freezing Lab during 1st April 2014 to 31st March, 2015. A total of 57,761 semen doses were sold and 42,721 semen doses supply in network project.
Publications: Book Chapters / Research Articles : 2 Invited / Lead Papers : 2 Papers presented in seminar / symposium and published : 9 PG Research : 1 (M V Sc.) Expected Socio-economic Impact: There is significant increased for demands of buffalo bulls and frozen semen. During the year under report 38 Murrah breeding bulls were sold to Madhya Pradesh, Orissa, Haryana and developmental agencies for improvement of buffalo germplasm. During the year 2014-15 frozen semen doses 1,00,482 were supplied / sold to farmers and other buffalo / dairy development agencies. Two Murrah buffalo mela at CIRB, buffalo milk competition and four calf rallies in adopted villages were organized to demonstrate outstanding buffalo germplasm to farmers. These events have created awareness in rearing superior buffaloes.

15
Herd Performance The overall herd strength at the centre was 496 head, 152 calves were added due to birth. The breedable buffaloes were 237. During the period of report calf mortality (0-3 months) was 9.19 % (17/185). The female conception rate of 52.34 % at the farm is showing improvement over previous year. Total 1,27,429 semen doses were frozen and 57,761 doses were sold to different agencies and farmers. Semen were also collected from elite bulls of farmers at their doorstep on sharing basis, doses are available from these elite bulls.
Average lactation yield, lactation length, 305 or less day milk yield were 2501.72±60.17 (n=110), 313±5.57 (n=110) and 2354.65±47.55 (n=110) kg. The production performance was comparable to the last year performance. The reproduction parameters viz Age at first calving, Service Period, Dry Period and Calving Interval were 42.84±0.79 (n=61) months, 168±8.31 (n=88) days, 149±6.46 (n=88) days and 473±8.45 (n=88) days respectively. Wet and herd averages were 8.25 kg and 5.77 kg, respectively. This year first time the wet average crosses the 8.25 kg mark.
Targets achieved during 2014-15 S. N Trait Target Achieved 1. Av. Age at first service (months) 24 (300 kg. B. wt.) … 2. Av. Age at first calving (months) 40 42.84±0.79 3. Av. Age for initiating training of bulls (months) 18 (350 kg. B. wt.) …. 4. Av. Age at first collection (months) 30 (400 kg. B. wt.) -- 5. Av. Service period (days) 130 168 days 6. Calf mortality (0-3 months) < 5 % 9.19 % 7. Wet average > 8.5 kg 8.25 kg. 8. Herd average > 5.5 kg 5.77 kg.
Recommendations:
1. The reproductive parameters are still below the target. 2. AFC reduced this year and these efforts be continued to reduced it further and service
period is still higher.
Project Co-ordinator’s observations on centre performance

16
GURU ANGAD DEV VETERINARY AND ANIMAL SCIENCES UNIVERSITY, LUDHIANA, MAIN UNIT
1. Name of Centre : Guru Angad Dev Veterinary & Animal Sciences University, Ludhiana 2. Project Code : F. No. 18(I) 2002- ASR- II 3. Project Title : Network Project on Buffalo Improvement 4. Date of Start : 01/04/1992 5. Objectives : As per NWP(B) 6. Technical Programme : The GADVASU Centre of the all India Co-ordinated Research Project on Buffalo Breeding is one of the participating units of the Network Project on Buffalo Improvement from 1.4.1992. Broadly, the technical programme involves testing of 12-15 bulls on about 1000 breedable buffaloes at organized farms at GADVASU, Ludhiana; CIRB, Hisar; NDRI, Karnal; IVRI Izatnagar, HAU, Hisar and KVASU, Pookot in every 18-month’s cycle. From each bull 75-80 pregnancies are to be obtained so that 20-25 recorded daughters per bull are available at all the centres for the evaluation of bulls. The bulls will be ranked on the basis of performance of their daughters and 20% of them will be selected as proven bulls from each set. The semen of the proven bulls will be used on elite buffaloes at different centres for the production of future sires and herd replacements. 7. Financial Statement: Statement showing budget sanctioned, amount spent and receipt
realized for the period 1st April 2013 to 31st March 2014. Budget Sanctioned (Rs.) Amount Spent (Rs.) Pay & Allowances 24,00,000 39,60,143 Arrears T. A. 1,00,000 44,679 Contingencies i) Recurring Cont. 50,00,000 50,93,372 ii) Non-Recurring Cont. Total 12,00.000 9,07,296 87,00,000 100,05,490 * The exact amount will reflect in the AUC. Receipts: The project transferred 142372 kg of milk to the College of Dairy Sciences, GADVASU for sale after processing. The department sold 53 surplus/breeding animals and 50445 doses liquid & frozen semen to the progressive dairy farmers and dairy developed agencies. 8. Staff and Infrastructure Buildup during the year: Staff in position : Name & Designation of the person employed on the sanctioned post with pay scale
Date of joining
Date of leaving
Other project (assignment) in the institution besides the project
Total time spent for the project
Transfer or upgrading of the post if any, give details of sanction from the ICAR
Remarks
1. Dr. Simarjeet Kaur Asstt. Animal Geneticist In Rs. 15600-39100
- - - Full time - -
2. Dr. Sikh Tejinder Singh Asstt Animal Health Specialist In Rs. 15600-39100
02/06/04 - - -do- - -
3. Sh. Kashmir Singh Statistical Assistant in Rs. 10300-34800
24/11/88 - - -do- - -

17
Herd performance : 9.1. Herd strength during the period 4/2014 to 3/2015 Sr. No
Category Addition Disposal OB B/P T D T S CB
Female 1. Calves below 3 months 7 20 0 2 16 0 9 2. Calves 3-6 months 12 0 16 1 26 0 1 3. Calves 6-12 months 10 0 26 0 29 0 7 4. Heifers 1) 1-2 Years 37 0 29 1 36 0 29 2) 2-2.5 Years 21 0 36 2 44 0 11 3) Above 2.5 Years 27 0 44 3 23 2 43 5. Buffaloes in Milk 73 0 23 0 0 8 62 6. Buffaloes Dry 22 0 0 2 0 18 28 1) Pregnant 11 0 0 0 0 0 9 2) Non- Pregnant 11 0 0 0 0 0 19 Sub Total 209 20 174 11 174 28 190
Male 1. Male below 3 months 12 38 0 8 25 3 14 2. Males 3-6 months 14 0 25 0 29 5 5 3. Males 6-12 months 15 0 29 0 17 7 10 4. Males 1)1-2 Years 12 0 17 0 8 8 13 2) > 2 Years 2 0 8 0 2 2 6 5. Breeding bulls 11 0 2 1 0 0 12 6. Bullocks 0 0 0 0 0 0 0 7. Teasers 1 0 0 0 0 0 1 Sub Total 57 38 81 9 81 25 61 Grand Total 266 58 255 20 255 53 251 OB = Opening Balance D = Deaths S = Sale B/P = Births/Purchase T = Transfer CB = Closing Balance
9.2. Calving statistics during the period 4/2014 to 3/2015 Month Male Female Still birth Overall
No. % No. % No. % No. % April, 13 2 2.74 1 1.37 0 0.00 3 4.11 May 0 0.00 2 2.74 0 0.00 2 2.74 June 1 1.37 1 1.37 0 0.00 2 2.74 July 1 1.37 2 2.74 1 1.36 4 5.47 August 5 6.85 2 2.74 0 0.00 7 9.59 September 0 0.00 2 2.74 0 0.00 2 2.74 October 4 5.48 3 4.11 0 0.00 7 9.59 November 1 1.37 1 1.37 0 0.00 2 2.74 December 11 15.07 11 15.07 0 0.00 22 30.14 January, 14 6 8.22 5 6.85 0 0.00 11 15.07 February 3 4.11 3 4.11 0 0.00 6 8.22 March 4 5.48 1 1.37 0 0.00 5 6.85 Overall 38 52.06 34 46.58 1 1.36 73 100.00
Sex ratio Male: Female = 1:0.53

18
9. 3. Disposal of animals during the period 4/2014 to 3/2015 Female
Sr. No.
Category Surplus Reprod. Problem
Weak & Old Death Experimental purposes
Total 1. Female Calves < 6 months 0 0 0 3 0 3 6-12 months 0 0 0 0 0 0 2. Heifers 1-2.5 Years 0 0 0 3 0 3 .> 2.5 Years 0 0 2 3 0 5 3. Buffaloes Dry 0 1 17 2 0 20 Milch 0 2 6 0 0 8 Sub Total 0 3 25 11 0 39 Male 1. Male Calves < 6 months 5 0 0 8 3 16 6-12 months 6 0 0 0 1 7 2. Above 1 year 8 0 0 0 0 8 3. Young Bulls 2 0 0 0 0 2 4. Breeding Bulls 0 0 0 1 0 1 5. Bullock + Teasers 0 0 0 0 0 0 Sub Total 21 0 0 9 4 34 Grand Total 21 3 25 20 4 73
21 Bulls/bull calves sold for breeding purposes
9.4. Month-wise mortality during the period 4/2014 to 3/2015 Female Male
Month
0-3 (mo)
3-6 (mo)
6-12 (mo)
1-2 yrs
Abo. 2 yrs.
Over all female
0-3 (mo)
3-6 (mo)
6-12 (mo)
Abo. 1 yr.
Over All male
Over All Herd
Over all
No. 27 28 36 66 190 240 50 39 24 43 95 335 Died 2 1 - 1 7 11 8 - - 1 9 20 % 7.41 3.57 - 1.52 3.68 4.58 16.0 - - 2.33 9.47 5.97
Calf mortality (0-3m) was 12.98 percent.
9.5. Causes of Mortality (quarter-wise) during the period 4/2014 to 3/2015 Particulars 1st quarter 2nd quarter 3rd quarter 4th quarter A. Respiratory System : 1. Pheumo-Enteritis - 1 - - B. Digestive System : - 1. Enteritis 1 - 1 2 2. Septicamia & Toxaemia - 1 - - 3. Peritonitis 1 1 - - 4. Gastroenteritis - - 1 1 C. Circulatory - 1 - - D. Others 1. Chronic debility - - - 1 3. Umblical Hernia - - 1 - 13. Miscellaneous 2 3 2 Total 4 4 6 6

19
9.6. Prophylactic measures taken during the period 4/2014 to 3/2015 Vaccination No. of
animals Available
Inoculation done
Screening No. of Animals Tested
Results (No. of positive animals)
No. of animals treated for parasitism
FMD 509 (Twice in a year)
TB The disease testing (TB,
JD, Brucellosis) of animals in the herd is done and the report is
pending
All the new born were dewormed at the age of 15 day, 4 months and 6 months.
HS 808 (Thrice in a year)
JD BQ 257
(Annual) Brucellosis
Brucellosis 18 (once at the age of 4-8 months, only
in females)
9.7. Calving abnormalities (quarter-wise) during the period 4/2014 to 3/2015 Quarter No. of
Calv. Dystokia Abortions Retention of
Placenta Prolapse Others
(Still births) No. % No. % No. % No. % No. % I 9 0 0 0 0 0 0 0 0 2 22.2 II 17 0 0 2 11.8 3 17.6 0 0 0 0 III 9 1 11.1 0 0 1 11.1 0 0 0 0 IV 29 3 10.3 1 3.4 1 3.4 0 0 1 3.4 Overall 64 4 6.2 3 4.7 5 7.8 0 0 3 4.7
9.8. Female conception rate during the period 4/2014 to 3/2015
No. of services I II III IV V & Above Overall Parity I C CR% I C CR% I C CR% I C CR% I C CR% I C CR% Heifer 24 148 58.33 14 5 35.71 7 1 14.29 4 1 25.00 5 1 20.00 54 22 40.74 Adult 1st 15 5 33.33 6 2 33.33 3 0 0.00 2 0 .00 4 0 0.00 30 7 23.33 2nd 13 4 30.77 8 3 37.50 5 1 20.00 2 0 .00 7 3 42.86 35 11 31.43 3rd 7 2 28.57 7 2 28.57 4 2 50.00 2 0 .00 2 1 50.00 22 7 31.82 4tth 7 4 57.14 5 0 0.00 2 0 0.00 0 0 0.00 2 0 0.00 16 4 25.00 5th 5 3 60.00 5 3 60.00 1 0 0.00 1 0 .00 0 0 0.00 12 6 50.00 6th 1 0 0.00 1 0 .00 1 1 100.0 0 0 .00 3 1 33.33 6 2 33.33 7th & Above
4 2 50.00 2 1 50.00 1 0 0 1 0 .00 0 0 0.00 8 3 37.50
Overall 76 34 44.74 48 16 33.33 24 5 20.83 12 1 8.33 23 6 26.09 183 62 33.88 I. = No. of animals inseminated C. = No. of animals conceived CR% = Conception rate % 9.9. Bull-wise conception rate during the period 4/2014 to 3/2015
Sr. No. Bull No. Total No. of AI Total Conceived CR % 1 M1994 38 14 36.84 2 M2045 9 2 22.22 3 M2357 1 0 0.00 4 M2369 91 40 43.96 5 M2412 25 5 20.00 6 M2459 19 2 10.53 Total 183 62 33.88

20
9.10. Bull-wise semen stock 4/2014 to 3/2015 Sr. No
Bull No. Set No
Opening Balance Semen
Prod./ Received
Consumption for AI/Supplied Dairy Field Other Sold Total Farm Unit Agencies Supply
Balance
1 M1713 6 765 0 0 0 0 764 764 1 2 M1717 6 381 0 0 0 0 381 381 0 3 M1727 7 140 0 0 0 0 140 140 0 4 M1749 7 1964 0 0 0 0 0 0 1964 5 M1867 8 56 120 0 0 0 136 136 40 6 M1868 8 727 0 0 0 0 665 665 62 7 M1913 9 539 0 0 0 0 539 539 0 8 M1940 9 672 0 0 0 0 672 672 0 9 M1964 9 799 0 0 0 0 799 799 0 10 M2062 10 2382 0 0 0 0 2372 2372 10 11 M2073 10 2661 0 0 0 0 1240 1240 1421 12 M2074 10 2154 0 0 0 0 50 50 2104 13 M2083 10 1543 0 0 0 0 0 0 1543 14 M2133 11 1659 0 0 0 0 0 0 1659 15 M2148 11 2039 0 0 0 0 0 0 2039 16 M2154 11 3486 0 0 0 0 0 0 3486 17 M2176 12 3046 0 0 0 0 0 0 3046 18 M2177 12 2015 1830 0 0 0 430 430 3415 19 M2185 12 1741 0 0 0 0 0 0 1741 20 M2234 13 1865 0 0 0 0 580 580 1285 21 M2269 13 1133 0 0 0 0 0 0 1133 22 M2304 13 2909 5230 0 0 0 4124 4124 4015 23 M2357 14 357 3600 0 655 0 0 655 3302 24 M2369 14 2373 3590 265 1460 0 135 1860 4103 25 M2371 15 2835 6240 55 630 5000 0 5685 3390 26 M2412 15 1225 7805 155 490 4200 5 4850 4180 27 M2417 15 670 9865 0 290 3650 90 4030 6505 28 M2429 15 905 9230 40 800 3900 0 4740 5395 29 M2459 15 0 9705 175 1250 3200 95 4720 4985
Sub total 43041 57215 690 5575 19950 13217 39432 60824 Proven bulls 30 156 1 718 0 0 0 0 0 0 718 31 888 2 1599 0 0 0 0 0 0 1599 32 458 3 442 0 0 0 0 0 0 442 33 293 4 1685 0 0 0 0 0 0 1685 34 558 5 2165 0 0 0 0 0 0 2165 35 610 6 330 0 0 0 0 0 0 330 36 M82 7 289 0 0 0 0 0 0 289 37 M432 8 34 0 0 0 0 0 0 34 38 M584 9 544 0 0 0 0 0 0 544 39 M675 10 94 0 0 0 0 0 0 94 40 M1354 Nw3 2072 0 0 0 0 0 0 2072 41 M1437 Nw4 3956 0 0 0 0 0 0 3956 42 M1451 Nw4 3307 0 0 0 0 0 0 3307 43 M1506 Nw4 4998 0 0 0 0 0 0 4998 44 M1796 Nw7 4564 0 0 0 15 10 25 4539 45 M1875 Nw8 3388 0 0 0 0 233 233 3155 46 M1994 NW9 1576 0 55 0 0 50 105 1471 47 M2045 NW10 1177 0 60 0 800 0 860 317 Sub total 32938 0 115 0 815 293 1223 31715 Grand Total 75979 57215 805 5575 20765 13510 40655 92539
21
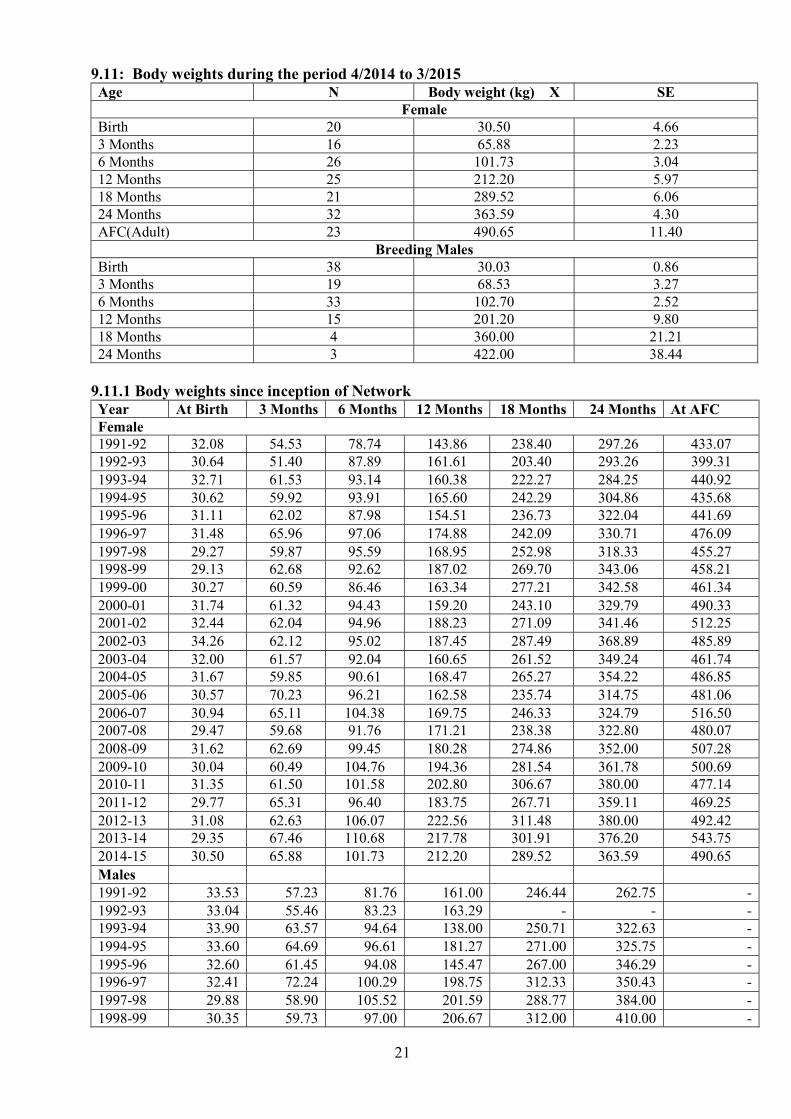
9.11: Body weights during the period 4/2014 to 3/2015 Age N Body weight (kg) X SE
Female Birth 20 30.50 4.66 3 Months 16 65.88 2.23 6 Months 26 101.73 3.04 12 Months 25 212.20 5.97 18 Months 21 289.52 6.06 24 Months 32 363.59 4.30 AFC(Adult) 23 490.65 11.40
Breeding Males Birth 38 30.03 0.86 3 Months 19 68.53 3.27 6 Months 33 102.70 2.52 12 Months 15 201.20 9.80 18 Months 4 360.00 21.21 24 Months 3 422.00 38.44
9.11.1 Body weights since inception of Network Year At Birth 3 Months 6 Months 12 Months 18 Months 24 Months At AFC Female 1991-92 32.08 54.53 78.74 143.86 238.40 297.26 433.07 1992-93 30.64 51.40 87.89 161.61 203.40 293.26 399.31 1993-94 32.71 61.53 93.14 160.38 222.27 284.25 440.92 1994-95 30.62 59.92 93.91 165.60 242.29 304.86 435.68 1995-96 31.11 62.02 87.98 154.51 236.73 322.04 441.69 1996-97 31.48 65.96 97.06 174.88 242.09 330.71 476.09 1997-98 29.27 59.87 95.59 168.95 252.98 318.33 455.27 1998-99 29.13 62.68 92.62 187.02 269.70 343.06 458.21 1999-00 30.27 60.59 86.46 163.34 277.21 342.58 461.34 2000-01 31.74 61.32 94.43 159.20 243.10 329.79 490.33 2001-02 32.44 62.04 94.96 188.23 271.09 341.46 512.25 2002-03 34.26 62.12 95.02 187.45 287.49 368.89 485.89 2003-04 32.00 61.57 92.04 160.65 261.52 349.24 461.74 2004-05 31.67 59.85 90.61 168.47 265.27 354.22 486.85 2005-06 30.57 70.23 96.21 162.58 235.74 314.75 481.06 2006-07 30.94 65.11 104.38 169.75 246.33 324.79 516.50 2007-08 29.47 59.68 91.76 171.21 238.38 322.80 480.07 2008-09 31.62 62.69 99.45 180.28 274.86 352.00 507.28 2009-10 30.04 60.49 104.76 194.36 281.54 361.78 500.69 2010-11 31.35 61.50 101.58 202.80 306.67 380.00 477.14 2011-12 29.77 65.31 96.40 183.75 267.71 359.11 469.25 2012-13 31.08 62.63 106.07 222.56 311.48 380.00 492.42 2013-14 29.35 67.46 110.68 217.78 301.91 376.20 543.75 2014-15 30.50 65.88 101.73 212.20 289.52 363.59 490.65 Males 1991-92 33.53 57.23 81.76 161.00 246.44 262.75 - 1992-93 33.04 55.46 83.23 163.29 - - - 1993-94 33.90 63.57 94.64 138.00 250.71 322.63 - 1994-95 33.60 64.69 96.61 181.27 271.00 325.75 - 1995-96 32.60 61.45 94.08 145.47 267.00 346.29 - 1996-97 32.41 72.24 100.29 198.75 312.33 350.43 - 1997-98 29.88 58.90 105.52 201.59 288.77 384.00 - 1998-99 30.35 59.73 97.00 206.67 312.00 410.00 -

22
1999-00 33.40 65.13 91.69 148.30 318.75 415.00 - 2000-01 33.40 64.05 97.00 159.25 213.63 340.56 - 2001-02 33.17 62.53 103.11 187.27 340.00 - - 2002-03 34.79 65.00 99.38 205.56 346.88 460.00 - 2003-04 33.03 64.32 106.94 193.75 284.84 405.62 - 2004-05 34.36 60.53 105.88 195.25 288.44 408.56 - 2005-06 31.36 69.37 112.58 204.30 313.18 386.10 - 2006-07 33.44 70.86 111.81 215.08 335.63 403.75 - 2007-08 31.25 61.27 101.90 202.81 295.42 402.45 - 2008-09 32.37 67.50 108.53 211.43 286.11 387.27 - 2009-10 32.35 60.94 108.89 198.75 308.75 371.67 - 2010-11 32.73 66.60 98.70 200.00 287.00 398.00 - 2011-12 32.62 68.70 107.79 209.44 320.00 402.50 - 2012-13 31.96 63.36 110.88 262.00 370.71 397.50 - 2013-14 32.32 69.72 120.71 230.42 372.56 430.00 2014-15 30.03 68.53 102.70 201.20 360.00 422.00
9.12. Production performance of buffaloes completing their lactation during 4/2014 to 3/2015
Lactation No.
No. of Observations
Av. Lact. Yield (kgs)
Av. Lact. Length (days)
305-day Milk Yield (kgs)
Av. Peak yield (kg)
1st 11 2842.7±221.3 366.6±28.2 2465.7±119.8 12.8±0.5 2nd 18 3232.2±272.5 367.9±22.2 2884.9±162.2 15.3±0.7 3rd 6 2782.4±188.0 324.0±23.1 2673.1±203.3 16.2±1.3 4th 3 2521.7±259.7 342.3±42.9 2362.0±160.3 15.7±1.7 5th 3 2863.0±409.7 314.7±20.8 2748.0±370.4 15.7±2.5 6th 5 2661.6±252.9 329.8±24.0 2514.2±167.2 15.0±0.9
Over All 46 2947.7±129.3 352.6±12.0 2673.8±82.6 14.8±0.4 9.12.1 Production performance of buffaloes (general herd) since inception of network Years No. of
Observations Av. Lact.
Yield (kgs) Av. Lact. Length
(days) 305-day Milk
Yield (kgs) Av. Peak yield( kg)
1991-92 157 1858 321 1738 10.80 1992-93 138 1894 340 1730 10.81 1993-94 144 2238 370 1948 11.01 1994-95 121 2003 320 1877 12.06 1995-96 126 2248 350 2008 11.86 1996-97 125 2115 334 1948 11.40 1997-98 098 2255 354 1995 11.03 1998-99 125 2411 372 2101 11.50 1999-00 114 2238 375 2041 11.41 2000-01 103 2257 347 2032 11.82 2001-02 112 2419 344 2175 12.95 2002-03 105 2245 304 2144 13.16 2003-04 111 2464 342 2233 12.90 2004-05 106 2501 346 2270 12.74 2005-06 78 2480 322 2327 13.17 2006-07 91 2389 326 2235 12.39 2007-08 67 2362 323 2176 12.62 2008-09 88 2346 329 2141 11.96 2009-10 67 2478 336 2271 12.73 2010-11 81 2836 376 2470 13.28 2011-12 87 2454 322 2306 13.38 2012-13 75 2741 349 2528 13.84 2013-14 55 2789 366 2509 13.63 2014-15 46 2948 353 2674 14.84
23
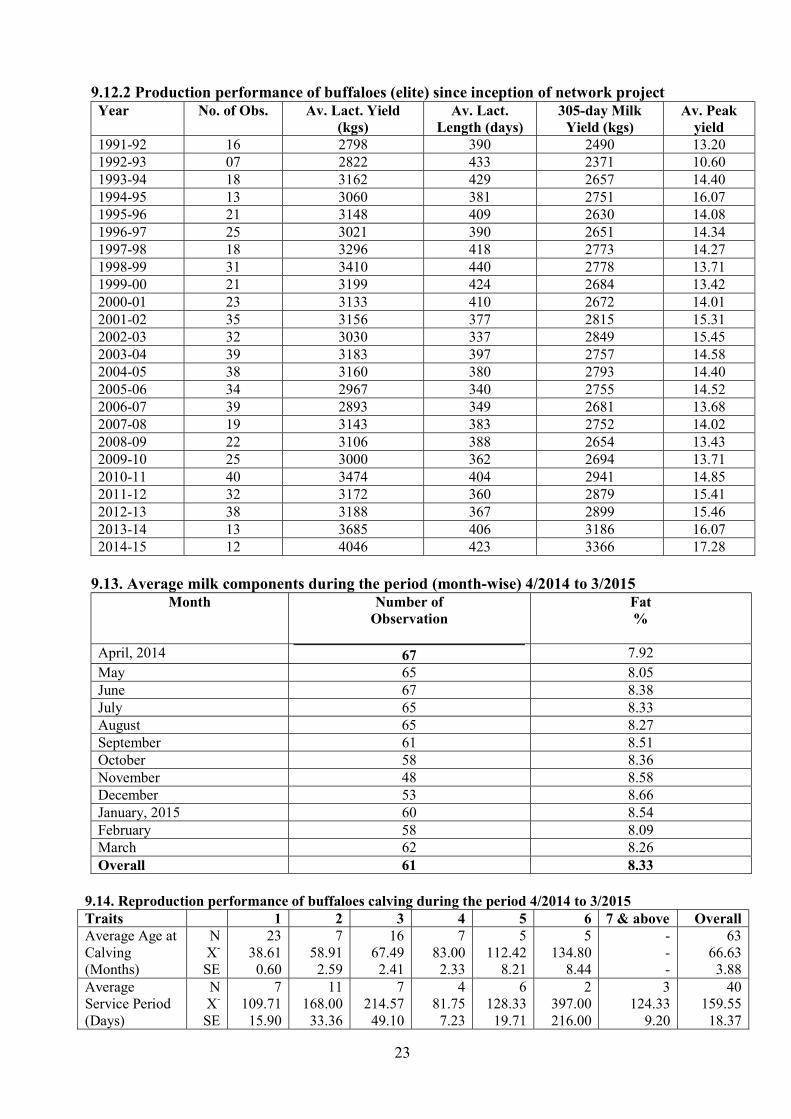
9.12.2 Production performance of buffaloes (elite) since inception of network project Year No. of Obs. Av. Lact. Yield
(kgs) Av. Lact.
Length (days) 305-day Milk
Yield (kgs) Av. Peak
yield 1991-92 16 2798 390 2490 13.20 1992-93 07 2822 433 2371 10.60 1993-94 18 3162 429 2657 14.40 1994-95 13 3060 381 2751 16.07 1995-96 21 3148 409 2630 14.08 1996-97 25 3021 390 2651 14.34 1997-98 18 3296 418 2773 14.27 1998-99 31 3410 440 2778 13.71 1999-00 21 3199 424 2684 13.42 2000-01 23 3133 410 2672 14.01 2001-02 35 3156 377 2815 15.31 2002-03 32 3030 337 2849 15.45 2003-04 39 3183 397 2757 14.58 2004-05 38 3160 380 2793 14.40 2005-06 34 2967 340 2755 14.52 2006-07 39 2893 349 2681 13.68 2007-08 19 3143 383 2752 14.02 2008-09 22 3106 388 2654 13.43 2009-10 25 3000 362 2694 13.71 2010-11 40 3474 404 2941 14.85 2011-12 32 3172 360 2879 15.41 2012-13 38 3188 367 2899 15.46 2013-14 13 3685 406 3186 16.07 2014-15 12 4046 423 3366 17.28
9.13. Average milk components during the period (month-wise) 4/2014 to 3/2015
Month Number of Observation
Fat %
April, 2014 67 7.92 May 65 8.05 June 67 8.38 July 65 8.33 August 65 8.27 September 61 8.51 October 58 8.36 November 48 8.58 December 53 8.66 January, 2015 60 8.54 February 58 8.09 March 62 8.26 Overall 61 8.33
9.14. Reproduction performance of buffaloes calving during the period 4/2014 to 3/2015 Traits 1 2 3 4 5 6 7 & above Overall Average Age at Calving (Months)
N X- SE
23 38.61
0.60 7
58.91 2.59
16 67.49 2.41
7 83.00 2.33
5 112.42
8.21 5
134.80 8.44
- - -
63 66.63 3.88
Average Service Period (Days)
N X- SE
7 109.71 15.90
11 168.00 33.36
7 214.57
49.10 4
81.75 7.23
6 128.33
19.71 2
397.00 216.00
3 124.33
9.20 40
159.55 18.37

24
Average Dry Period (days
N X- SE
- - -
7 193.86 34.08
16 120.25
9.00 7
188.71 38.20
4 371.75 135.87
6 219.67 111.28
- - -
40 185.18
24.51 Average Calving Interval (Days)
N X- SE
- - -
7 537.0 59.75
16 463.19
25.44 7
527.71 42.44
5 620.0
114.08 6
508.83 83.36
- - -
41 512.63
24.10 9.14.1. Reproduction performance of buffaloes calving since inception of network. Years AFC (Months) Service Period
(days) Dry Period (days) Calving Interval
(days) 1991-92 49.2 (73) 169 (93) 187 (101) 493 (101) 1992-93 44.4 (48) 207 (100) 190 (98) 510 (100) 1993-94 46.7 (24) 228 (105) 184 (106) 532 (106) 1994-95 47.5 (37) 206 (96) 182 (96) 512 (96) 1995-96 45.6 (43) 218 (105) 196 (104) 526 (105) 1996-97 49.4 (34) 196 (76) 167 (76) 510 (76) 1997-98 45.0 (45) 248 (94) 203 (94) 553 (94) 1998-99 47.0 (34) 232 (81) 204 (84) 553 (87) 1999-00 42.0 (54) 213 (59) 175 (63) 518 (63) 2000-01 44.4 (27) 197 (81) 170 (82) 511 (82) 2001-02 44.7 (32) 164 (95) 149 (84) 496 (84) 2002-03 40.2 (39) 133 (95) 147 (95) 463 (95) 2003-04 36.8 (23) 160 (107) 153 (93) 455 (93) 2004-05 41.7 (27) 140 (80) 155 (80) 478 (80) 2005-06 43.7 (35) 143 (65) 119 (60) 433 (60) 2006-07 43.3 (20) 166 (69) 115 (61) 438 (61) 2007-08 42.8 (30) 147 (53) 126 (58) 419 (58) 2008-09 42.6 (43) 142 (90) 134 (52) 438 (52) 2009-10 39.3 (29) 151 (76) 174 (72) 492 (72) 2010-11 39.1 (21) 154 (94) 150 (76) 457 (76) 2011-12 37.4 (22) 136 (65) 154 (85) 473 (85) 2012-13 38.9 (34) 151 (53) 136 (59) 435 (59) 2013-14 42.3 (12) 159 (67) 190 (64) 471 (64) 2014-15 38.6 (23) 160 (40) 185 (40) 513 (41) Figures in parenthesis indicate number of observations 9.15. Month-wise milk production and disposal during the period 4/2014 to 3/2015 Production Disposal Month Total milk
produced (kg) Liquid milk
(kg) Calf feeding
(kg) Experimental purposes (kg)
Milk lost in handling (kg)
April, 2014 16695.4 14980.0 1693.2 0 22.2 May 15635.1 14523.0 1084.0 0 28.1 June 13771.2 13092.0 651.7 0 27.5 July 12723.0 12146.0 546.5 4.0 26.5 August 12563.6 11716.0 817.2 2.0 28.4 September 11864.1 10981.0 850.6 4.0 28.5 October 11171.6 9940.0 1201.3 7.0 23.3 November 10309.1 9314.0 970.2 0 24.9 December 11187.5 10189.0 966.0 4.0 28.5 January, 2015 12357.5 11009.0 1321.3 0 27.2 February 12621.9 10856.0 1740.8 0 25.1 March 15974.9 13605.0 2338.4 0 31.5 Total 156874.9 142351.0 14181.2 21 321.7

25
9.16. Feed and fodder purchased and offered (qtls) to animals during the period 4/2014 to 3/2015 Quarter Feed/fodder Quantity
produced at farm Quantity
purchased Actually fed to
animals Balance
I Green 3772.30 0 3772.30 - Dry 356.00 160.00 516.00 - Silage 3811.00 0 3811.00 - Concentrate 0 1113.23 1113.23 - II Green 4484.00 0 4484.00 - Dry 454.00 0 454.00 - Silage 3580.00 0 3580.00 - Concentrate 0 1119.93 1119.93 - III Green 2968.00 0 2968.00 - Dry 307.50 438.50 746.00 - Silage 2780.00 0 2780.00 - Concentrate 0 1070.96 1070.96 - IV Green 4869.00 0 4869.00 - Dry 0 880.15 880.15 - Silage 2517.00 0 2517.00 - Concentrate 0 951.69 951.69 - Overall Green 10089.30 0 10089.00 - Dry 1117.50 1478.65 2596.15 - Silage 12688.00 0 12688.00 - Concentrate 0 4255.81 4255.81 - 9.17. Milking performance during the period 4/2014 to 3/2015 Month No. of Animal
in milk No. of
Animal dry Total
Animal % in Milk
Wet average (kg)
Herd average (kg)
April, 2014 67 23 90 74.44 8.31 6.18 May 65 24 89 73.03 7.76 5.67 June 58 31 89 65.17 7.91 5.16 July 55 35 90 61.11 7.46 4.56 August 55 39 94 58.51 7.37 4.31 September 51 42 93 54.84 7.75 4.25 October 48 35 83 57.83 7.51 4.34 November 43 36 79 54.43 7.99 4.35 December 45 32 77 58.44 8.02 4.69 January, 2015 51 31 82 62.20 7.82 4.86 February 50 33 83 60.24 9.02 5.43 March 59 28 87 67.82 8.73 5.92 Overall 54 32 86 62.34 7.97 4.98 9.17.1. Milking performance since inception Years No. of Animal
in milk No. of
Animal dry Total
Animal % in Milk
Wet average (kg)
Herd average (kg)
1991-92 148 74 222 66.67 5.65 3.79 1992-93 149 77 226 65.93 5.54 3.68 1993-94 115 76 191 60.21 6.20 3.71 1994-95 116 67 183 63.39 6.09 3.86 1995-96 123 66 189 65.08 6.43 4.21 1996-97 112 72 194 60.87 6.17 3.73 1997-98 116 61 177 65.54 6.53 4.30 1998-99 119 65 184 64.67 6.26 4.06 1999-00 109 55 164 66.46 6.26 4.17 2000-01 105 58 163 64.42 6.70 4.36 2001-02 94 48 142 66.20 7.09 4.70

26
2002-03 109 48 157 69.43 7.22 5.00 2003-04 108 52 160 67.50 7.01 4.80 2004-05 91 45 136 66.91 7.33 5.00 2005-06 74 31 105 70.48 7.36 5.21 2006-07 81 27 108 75.00 7.03 5.27 2007-08 70 29 99 70.35 6.90 4.90 2008-09 78 38 116 67.00 7.07 4.73 2009-10 83 40 123 69.17 7.62 5.15 2010-11 88 47 135 64.93 7.21 4.72 2011-12 88 51 139 63.06 7.56 4.79 2012-13 78 45 123 63.49 7.74 4.90 2013-14 61 43 104 58.29 7.98 4.67 2014-15 54 32 86 62.34 7.97 4.98 9.18. Bull-wise daughters born/daughters reaching A.F.C. and completing 1st lactation records
during the period 4/2014 to 3/2015 Bull No. Total No. of
daughters born No. of daughters reaching A. F. C.
No. of daughters completing 1st Lactation
Last Lactation M1994 2 - - - M2234 3 - - - M2357 1 - - - M2369 13 - - - NK 1 M2177 - 7 - - M2176 - 6 - - M2185 - 1 - - M1796 - 2 - - MU333 - 1 - - MU220 - 1 - - MU5710 - 3 - - Khurana - 1 - - NK - 1 - - ND2 - - 1 - MU220 - - 1 - M2074 - - 1 - M2176 - - 1 - M2177 - - 1 - MU3591 - - 3 - MU5489 - - 1 - MU5516 - - 2 - Total 20 23 11 - 9.19. Bull-wise daughters completing 1st lactation during the Period 4/2014 to 3/2015
Sr. No
Bull No. Daughter No.
Date of birth
Date of calving
1st lact. 305 day milk yield (kg)
Total lact. yield (kg)
Lact. length (day)
1-1 ND2 P2511 09.12.08 25.02.13 2452.6 3180.6 430 2-1 MU220 P2657 06.06.11 20.03.14 2110.3 2110.3 302 3-1 M2074 P2492 25.05.08 06.12.12 2927.4 4260.1 536 4-1 M2176 P2650 05.02.11 07.12.13 1924.8 1924.8 224 5-1 M2177 P2669 16.08.11 10.06.14 2591.3 2591.3 279 6-1 MU3591 P2605 26.02.10 11.07.13 3011.0 3395.9 373 7-2 MU3591 P2598 08.02.10 29.12.13 2214.0 2214.0 276 8-3 MU3591 P2602 12.02.10 02.01.14 3005.2 3435.1 395 9-1 MU5489 P2611 14.07.10 25.05.13 2649.0 3394.0 428
10-1 MU5516 P2608 06.03.10 29.06.13 2061.2 2525.8 458 11-2 MU5516 P2564 17.11.09 03.07.13 2176.6 2237.9 332

27
9.20 List of breeding/young bulls as on 3/2015
Sr. No.
Bull No. Date of Birth
Dam No. Sire No. Dam’s 305 days or less yield (kg)
Semen doses available
Remarks
1. M1867 13.08.01 P1901 MU1485 2708 40 2. M2177 06.10.06 P1884 M1354 3024 3415 3. M2304 01.08.09 P2138 MU3226 3435 4015 4. M2357 24.07.10 P2488 MU1933 3559 3302 5. M2369 24.08.10 P2138 MU5496 3435 4103 6. M2371 30.08.10 P1794 M1796 3053 3390 7. M2383 13.10.10 P2489 MU3267 4636 8. M2412 24.04.11 P2467 MU220 2998 4180 9. M2417 10.07.11 P2487 M2177 3565 6505 10. M2429 15.08.11 P2138 MU5710 3435 5395 11. M2459 22.12.11 P2489 M1796 4636 4985 12. M2467 01.04.12 P2279 R10 3574 13. M2468 02.04.12 P2530 R11 3125 14. M2475 28.05.12 P2286 M1796 3114 15. M2489 25.08.12 P2314 M1875 3207 16. M2494 02.09.12 P2431 M1875 2787 17. M2501 10.10.12 P1794 M1875 3053 18. M2519 19.01.13 P2515 MU5943 4284 19. M2550 07.12.13 P2293 M1875 2622 20. M2551 09.12.13 P2286 M1875 3170 21. M2552 10.12.13 P2314 M1875 3207 22. M2554 18.12.13 P2480 M2234 2704 23. M2555 18.12.13 P2269 M1875 2713 24. M2558 20.12.13 P2279 M1875 3574 25. M2561 02.01.14 P2602 M2269 2672 26. M2565 24.01.14 P2522 M2269 2777 27. M2566 30.01.14 P2304 M2269 3002 28. M2568 31.01.14 P2547 M2269 2855 29. M2583 02.04.14 P2395 M2269 2702 30. M2584 03.04.14 P2530 M1875 3395 31. M2588 02.05.14 P2436 MU2583 2702 32 M2594 30.07.14 P2221 M1994 3334 33. M2602 01.10.14 P2539 M2357 2830 34. M2607 17.12.14 P2605 M2369 3011 35. M2608 24.12.14 P2293 M1994 2622 36. M2610 26.01.15 P2548 M2369 2844 37. M2612 10.01.15. P2279 M1994 3094 38. M2614 23.01.15 P2438 M1994 4243 39. M2624 02.03.15 P2141 M1994 3305 40. M2625 04.03.15 P2547 M2369 2985
9.21 Target achieved during the year 4/2014 to 3/2015 Sr. N Trait Target Achieved 1. Av. Age at first service (months) 24 months (300 kg. B. wt.) 2. Av. Age at first calving 40 months 38.6 months (23) 3. Av. Age for initiating of bulls (months) 18 months (350 kg. B.wt.) 18 months (360 kg. B.wt.) 4. Av. Age at first collection 30 months (400 kg. B.wt.) 29.3 months 408 kg. B.wt.) 5. Av. Service period 130 days 160 (40) 6. Calf mortality (0-3 months) ≤ 5% 12.98 % 7. Wet average ≥ 8.5 kg. 7.97 kg 8. Herd average ≥ 5.5 kg. 4.98 kg

28
10. Salient Research Achievements including survey reports/farmers animals covered in the project: Five bulls presented to Bull Selection Committee have been included in the 15th set of the project. One bull No. M2045 of 10th set ranked second among all the progeny tested bulls. The average age at 1st calving is achieved to 38.6 months. The average age at first collection of the bulls at the institute was 29.3 months. The average 305-day yield of the herd was 2674 kg and wet average of 7.97 kg and herd average of
4.98 kg during the period 4/2014 to 3/2015.
11. Publications: - 12. Expected Socio-economic impact in the tract : There is great demand of Murrah breeding
bull/bull calves as well as liquid and frozen semen of Murrah bulls from the centre. 13. Constraints if any : Regular staff like beldars, supervisors and milk recorders has been reduced in the
strength in the project which is causing working problems at the Dairy farm. 14. Focus of work in the coming year: Efforts will be made - To improve the reproductive efficiency of the buffalo herd. - To get the uniform calvings throughout the year. - To reduce the calf mortality. - To minimize the inbreeding effects permission and funds may be granted to introduce elite buffaloes
from outsources.

29
Financial Statement for the year 2014-15 (Rs in Lakhs) Sanctioned as per R E 2014-15 Total ICAR Share
Released ICAR Share as per R E
Expenditure as per AUC Receipts (ICAR Share)
Balance ICAR Share
State Share
87.00 65.25 65.25 74.83867 24.94623 5.38990 -4.19877 Herd Performance Herd strength at the centre was 251 animals with 133 breedable buffaloes. During the period 61 calving were reported with 38 male and 20 females and three still births. The calf mortality (0-3 months) during the period was 12.98 % (10/77). The female conception rate at the farm was low at 33.88 % (62/183) and lower than the previous year 36.61%.
During the period 57215 semen doses were produced from 10 bulls and 13510 semen doses were sold and 26330 doses were supplied to field unit/ other Murrah centres and other agencies. The 305 day or less day milk yield was 2674 kg (n=46) with average peak yield of 14.8 kg. The reproductive performance viz. AFC, SP, DP and calving interval were 38.6 months (n=23), 159.55±18.37 days (n=40), 185.18±24.51 days (n=40) and 512.63±24.10 days (n=41) respectively. The wet and herd averages were 7.97 kg and 4.98 kg respectively.
Targets achieved during 2014-15
S. No Trait Target Achieved 1. Av. Age at first service (months) 24 months (300 kg. B. wt.) 25.8 (39) 2. Av. Age at first calving 40 months 38.6 (23) 3. Av. Age for initiating training of
bulls (months) 18 months (350 kg. B. wt.) 18 months
(360 kg B wt) 4. Av. Age at first collection 30 months (400 kg. B. wt.) 29.3 months 5. Av. Service period 130 days 160 (40) 6. Calf mortality (0-3 months) < 5% 12.98 % 7. Wet average > 8.5 kg 7.97 kg. 8. Herd average > 5.5 kg 4.98 kg.
Recommendations: All the 15th set bulls were not used in equal proportion at the farm. Care should be
taken to use all set bulls simultaneously and in equal numbers for AI at the farm.
Project Co-ordinator’s observations on centre performance

30
ICAR-NATIONAL DAIRY RESEARCH INSTITUTE, KARNAL 1. Name of Center NDRI, Karnal 2. Project Code Specified 3. Project Title Net work Programme on Buffaloes 4. Date of Start 1993-1994 5. Objectives Specified 6. Technical Programme Specified 7. Financial Statement Non Funded centre; 8. Staff Position - Redeployment 9. Herd Performance Enclosed Tables 9.1 to 9.22 9.1 Herd Strength during the Period 1/4/2014 to 31/ 03 /2015 Category Addition Disposal Sr.No. OB B T/P D T S CB Female 1. Female Calves below 3 months 13 86 - 12 66 - 21 2. Female Calves 3-6 months 11 - 23 1 21 - 12 3. Female Calves 6-12 months 16 - 9 1 - - 24 4. Heifers 1-2 years
2-2.5 years Above 2.5 years
- 23 15 53
- - - -
23 9 -
- 2 - -
- - - 11
- - - 3
44 24 39
5. Buffaloes in Milk and Dry 170 - 89 10 - 18 231 Sub Total 301 86 153 26 98 21 395 Male 1. Male Calves below 3 months 11 84 - 11 49 16 19 2. Male Calves 3-6 months 3 - 17 3 - 4 13 3. Male Calves 6-12 months 5 - 20 1 - 8 16 4. Male 1-2 years
> 2 years - 7 3
- - -
- 6 4
- - -
- - -
- -
- 13 7
5. Breeding bulls 44 - 6 - - 9 41 Sub Total 73 84 53 15 49 37 109 Grand Total 374 170 206 41 147 58 504
OB = Opening Balance D = Deaths S = Sale P= Purchase B = Births T = Transfer CB = Closing Balance
9.2. Calving Statistics during the period 1/4/2014 to 31/03/2015 Month Male
No.
% Female
No.
% Still Birth
No. % Overall
No. % April, 14 5 5.95 5 5.84 - - 10 5.81 May 3 3.57 7 8.13 - - 10 5.81 June 3 3.57 7 8.13 - - 10 5.81 July 6 7.14 8 9.30 - - 14 8.14 August 12 14.28 9 10.46 - - 21 12.21 September 8 9.56 5 5.84 - - 13 7.56 October 10 11.90 9 10.46 - - 19 11.05 November 8 9.52 6 6.98 14 8.14 December 11 13.09 7 8.13 - - 18 10.47 January,15 7 8.33 8 9.30 1 50.00 16 9.30 February 6 7.14 7 8.13 1 50.00 14 8.14 March 5 5.95 8 9.30 - 13 7.56 Overall 84 100 86 100 2 100 172 100 Sex ratio: Male : Female – 1: 1.024

31
9.3. Disposal of Animals during the Period 1/4/2014 to 31/03/2015 Female Category Surplus Repd. Problem
/udder problem/ teat defects / Weak & Old
Death Experimental purposes
1.Female Calves < 6 months 6-12 months
- 13 1
- - -
2. Heifers 1-2.5 years > 2.5 years
- 3
2
- - -
3. Buffaloes Dry & Milch
2 16 10 42 Sub Total 5 16 26 42 Male 1.Male Calves < 6 months 6-12 months
- 20 8
- 14 1
- -
12 2. Above 1 year - - - 3. Young Bulls - - - 4. Breeding bulls 9 - 6 5. Teaser - - - Sub Total 37 - 15 18 Grand Total 42 16 41 60 9.4. Month wise Mortality during the Period 1/4/2014 to 31/03/2015
Female Male Month 0-3 3-6 6-12 1-2
Yrs. Above 2 Yrs.
Over all
0-3 3-6 6-12 Above 1 Yrs.
Over all
Over all
No. Died %
12
11.42 1 1 2 10 26
6.71
11
11.57 3 1 - 15
9.55
Overall calf mortality (0-3m) was 11.86 percent. 9.5. Causes of Mortality (quarter wise) during the period 1/ 4/2014 to 31 / 3/2015 Particulars 1st quarter 2nd quarter 3rd quarter 4th quarter A. Respiratory System : 1. Pneumo-Enteritis 6 4 2 5 2. Broncho-Pneumonia 2 3 1 1 B. Digestive System : 1. Enteritis - 1 - 1 2. Septicamia & Toxaemia 1 2 - 1 3. Acute Bloat 1 1 2 - C. Others 1. Chronic debility 1 3 1 2 Total 11 14 6 10
32
9.6. Prophylactic measures taken during the Period 1/4/2014 to 31/03/2015 Vaccination No. of animals Inoculated Screening No. of animals
Tested Results No. of animals treated for Parasitism
FMD All buffaloes Nov., 2014 TB and JD
Nil Nil Dewormed all calves up to 6 months and other buffaloes as required.
HS and BQ All buffaloes above 45 months
April, 2014 Brucellosis Nil Nil RP - - Mastitis - - Brucellosis Female
Buffaloes July, 2014 Others - -
9.7.Calving Abnormalities (Quarter wise) during the period 1/4/2014 to 31/03/2015 Quarter No. of
Calving Dystokia Abortions Retention of
placenta Others (Still births)
Total No. % No. % No. % No. %
No. %
I 30 2 6.66 - - - - - - 2 6.66 II 48 1 2.08 2 4.16 1 2.08 - - 4 8.33 III 51 1 1.96 1 1.96 4 7.84 - - 6 11.76 IV 43 1 2.32 - - 2 4.65 2 4.65 5 11.62 Overall 172 5 2.90 3 1.74 7 4.06 2 1.16 17 9.88 9.8. Female Conception Rate during the Period 1/4/2014 to 31/03/2015 Parity of Animals No. of Services I II III IV V or more Overall 1 C CR 1 C CR 1 C CR 1 C CR 1 C CR I C CR Heifers 33 18 54.54 14 5 35.71 12 6 50.00 6 3 50.00 7 - - 72 32 44.44 Adults I 61 28 45.90 25 12 48.00 14 4 28.57 7 1 14.28 10 4 40.00 117 49 41.88 II 38 15 39.47 16 10 62.50 6 1 16.66 2 - - 13 5 38.46 75 31 41.33 III 20 7 35.00 10 5 50.00 2 1 50.00 2 - - 2 - - 36 13 36.11 IV 15 7 46.66 8 4 50.00 5 1 20.00 4 2 50.00 5 - - 37 14 37.83 V 6 5 83.33 2 - - 3 - - 1 - - 1 - - 13 5 38.46 VI 5 2 40.00 4 3 75.00 3 - - 1 1 100.0 1 - - 14 6 42.85 VII 3 2 66.66 1 - - - - - - - - - - - 4 2 50.00 Overall 181 84 50.29 80 39 48.75 45 13 28.88 23 7 30.43 39 9 23.07 368 152 41.30 I = No. of animals inseminated; C = No.of animals conceived; CR% = Conception rate; 9.9. Bull wise Conception rate during the period 1/4/2014 to 31/03/2015 Sr No Bull No. Number of AI Total Pregnant CR ( % ) XIV th Set NDRI 1 6044 48 24 50.00 2 6136 46 18 39.13 CIRB 3 4100 13 7 53.84 GADVASU 4 2357 13 5 38.46 XIV th Set NDRI 1 6007 13 5 38.46 2 6139 21 9 42.85 CIRB 3 4363 28 10 35.71 4 4438 30 9 30.00 5 4324 11 - -

33
6 4354 9 4 44.44 GADVASU 7 2371 43 15 34.88 8 2412 51 27 52.94 Total 326 133 41.18 Proven Bull 1 1994 19 9 47.36 2 5258 23 10 43.47 Total 42 19 45.23 G.Total 368 152 41.30 9.10 Bull Wise Semen Stock during the period 1/04/2014 to 31/03/2015 Centre Bull
No. Open. Balance
Semen Produced
Semen Received
Consumption Balance XIVth Set AI To NOB
CIRB NOB NDRI
NDRI 6014 2670 1850 - - - 200 3878 6044 5366 3280 - 110 - 400 4448 6136 8641 2900 - 100 - 550 5596 Total 16,677 8030 - 210 - 1150 13,922 XVth Set NDRI 6007 7050 2700 - 100 2250 450 2753 6139 6705 3860 - 100 2250 564 3977 6290 - 3228 - 1250 400 2224 6405 - 2060 - 1250 400 601 CIRB 4324 - - 1500 100 - 450 950 4328 - - 1000 - - 200 800 4354 - - 1500 100 - 420 980 4363 - - 1000 200 - 400 400 4403 - - 250 - - - 250 4438 - - 1000 100 - 450 450 GADVASU 2371 - - 1000 100 - 540 360 2412 - - 700 100 - 200 400 2417 - - 250 - - 200 50 2429 - - 500 - - - 500 2459 - - 250 - - - 250 Total 13,755 11,848 7150 900 7000 4674 14,945 G.Total 30,432 19,878 7150 1110 7000 5824 28,867 9.11.1 Body Weights of buffaloes during the period 1/4/2014 to 31/03/2015 Age
N Body weight (kg)
Mean S.E Female Birth 92 30.66 0.48 3 Months 44 57.59 2.16 6 Months 16 87.44 5.69 Males Birth 84 31.44 0.55 3 Months 38 60.08 1.39 6 Months 9 93.00 4.31

34
9.11.2 Body Weights of buffaloes since 1999 Age N Body weight (kg)
Mean S.E Female Birth 978 31.82 0.16 3 Months 696 64.77 0.45 6 Months 594 105.75 0.84 12 Months 492 172.14 1.67 18 Months 440 252.74 2.06 24 Months 434 333.88 2.56 WT AFC 336 562.15 3.75
9.12 Production Performance of Buffaloes completing their lactation during 1/4/2014 to 31/03/15 Lact. No. Av. Lact. Yield
(kgs) Av. Lact.
Length (days) 305-day Milk Yield
(kgs) Av. Peak yield
(Kg ) 1st 2251.02 (35) 309.60 (35) 2114.60 (35) 12.23 (35) 2nd 2344.30 (37) 311.19 (37) 2190.87 (40) 12.73 (40) 3rd 2619.55 (19) 291.00 (19) 2345.38 (21) 13.33(21) 4th 2994.11 (18) 313.44 (18) 2653.06 (18) 14.18(18) 5th 2925.4 (05) 310.80 (05) 2743.10 (05) 13.40(05) 6th& Above 2411.30 (05) 227.60 (05) 2390.70 (05) 11.25(05) Overall 2486.33 (119) 305.15 (119) 2223.57 (124) 12.86 (124) Figures in parenthesis indicate number of observations 9.12.1 Production Performance of Buffaloes since inception of Network Year Av. Lact. Yield
(Kgs) Av. Lact. Length
(Days) 305-day Milk Yield
(Kgs) Av. Peak Yield
(Kgs) 1993-94 2513.70 (117) 311.00 (117) 2351.80 (137) - 1994-95 2382.30 (128) 325.90 (128) 2270.10 (128) 11.70 (128) 1995-96 2750.90 (106) 323.10 (106) 2576.10 (106) 14.20 (106) 1996-97 2636.50 (105) 330.00 (105) 2423.10 (105) 13.20 (105) 1997-98 2336.10 (128) 301.00 (128) 2191.20 (128) 11.80 (128) 1998-99 2190.00 (112) 328.30 (112) 2032.60 (112) 11.10 (112) 1999-00 1951.00 (095) 316.80 (095) 1822.40 (102) 11.10 (102) 2000-01 2075.30 (116) 292.30 (116) 2019.10 (126) 12.00 (126) 2001-02 2070.80 (085) 315.90 (085) 1963.20 (091) 11.80 (091) 2002-03 2209.44 (072) 330.07 (072) 2000.67 (081) 12.01 (081) 2003-04 2009.08 (077) 315.23 (077) 1897.08 (089) 10.93 (092) 2004-05 2091.94 (080) 317.00 (080) 2025.00 (098) 10.86 (098) 2005-06 2226.97 (126) 301.25 (126) 2159.06 (142) 12.41 (142) 2006-07 2143.65 (099) 307.39 (099) 2053.77 (111) 11.80 (111) 2007-08 2254.75 (112) 322.15 (112) 2094.16(127) 12.50(127) 2008-09 2419.13 (081) 341.61 (081) 2256.01 (086) 12.43 (086) 2009-10 2272.54 (077) 313.04 (077) 2221.61 (084) 12.08 (084) 2010-11 2146.04 (125 ) 310.69 ( 125 ) 2014.70 (130) 11.24 (130) 2011-12 2344.16 ( 67 ) 331.83 ( 67 ) 2191.83 ( 67 ) 10.67 ( 67 ) 2012-13 2381.05 ( 78 ) 304.87 ( 78 ) 2255.81 ( 83 ) 11.56 ( 83 ) 2013-14 2631.90 ( 82 ) 332.68 ( 82 ) 2430.91 ( 82 ) 11.98 ( 98 ) 2014-15 2486.33 (119) 305.15 (119) 2223.57 (124) 12.86 (124) Figures in Parenthesis indicate number of observation

35
9.13 Average Milk Components during the period (Month-Wise) 1/4/2014 to 31/03/2015 Month
Number of observation
Fat ( % )
Solids not Fat ( % )
Total Solids ( % )
April, 2014 103 7.98 9.87 17.85 May 103 8.19 9.57 17.76 June 102 8.80 9.73 18.53 July 106 8.12 9.63 17.75 August 122 8.24 9.64 17.88 September 114 8.79 9.67 18.46 October 110 8.63 9.65 18.28 November 116 8.61 9.65 18.26 December,2014 110 8.39 9.61 18.00 January, 2015 134 8.25 9.67 17.92 February 141 7.95 9.59 17.54 March 132 7.70 9.56 17.26 Overall 116 8.30 9.65 17.95 9.14 Reproduction Performance of Buffaloes calving during the period 1/4/14 to 31/03/15 Traits 1 2 3 4 5 6 &
Above Overall
Average Age at Calving (Months)
N X- SE
35 40.39 ± 1.15
- - - - - 35 40.39 ± 1.15
Average Service Period (Days)
N X- SE
16 139.63 ±10.59
24 124.58 ±11.83
14 145.07 ±18.84
12 141.25 ±23.39
03 121.0
± 23.82 02
126.0 ± 26.31
71 134.71 ±18.97
Average Dry Period (Days)
N X- SE
9 93.89 ±9.92
16 122.75 ±9.94
7 107.43 ±14.36
4 100.25 ±15.94
02 125.5 ± 4.50
02 122.50 ± 21.50
40 111.45 ±11.52
Average calving Interval (Days)
N X- SE
9 445.0
± 15.89 16
423.0 ±12.81
7 395.86 ± 18.52
4 419.75 ± 15.66
02 446.50 ± 25.50
02 361.50 ± 17.50
40 420.97 ± 18.01
9.15 Reproduction Performance of Buffaloes calving since inception of Network. Years AFS
( months ) AFC (Months) Service Period
(days) Dry Period
(days) Calving
Interval (days) 1993-94 - 45.50 (44) 148.63 (97) 123.26 (98) 428.02 (98) 1994-95 - 46.00 (37) 119.70 (70) 103.18 (71) 428.20 (70) 1995-96 - 43.84 (27) 114.79 (72) 113.03 (72) 422.64 (72) 1996-97 - 46.81 (27) 114.33 (66) 96.06 (66) 423.27 (66) 1997-98 - 44.84 (34) 96.80 (59) 93.49 (59) 394.68 (60) 1998-99 - 46.24 (54) 118.24 (63) 108.50 (62) 424.40 (62) 1999-00 - 42.60 (29) 159.18 (82) 113.94 (52) 435.19 (52) 2000-01 - 42.40 (42) 107.10 (53) 111.50 (56) 407.70 (56) 2001-02 31.23 44.03 (34) 123.56(77) 118.65 (43) 428.12 (43) 2002-03 30.94 44.02 (20) 140.87 (59) 82.98 (31) 405.90 (31) 2003-04 30.63 (63) 43.87 (62) 131.65 (117) 103.59 (37) 438.58 (37) 2004-05 29.35 (76) 43.37 (47) 126.45 (93) 106.03 (35) 427.99 (35) 2005-06 26.80 (35) 39.90 (36) 149.06 (68) 109.61 (54) 413.31 (54) 2006-07 28.02 (48) 41.42 (50) 131.40 (80) 113.86 (50) 419.02 (50) 2007-08 28.25 (39) 41.82 (42) 119.61 (84) 121.95 (55) 441.01 (55)

36
2008-09 27.97 (35) 40.75 (31) 130.58 (61) 102.04(21) 423.71(21) 2009-10 29.61(23) 41.08 (25) 145.96 (62) 107.08(30) 412.54(30) 2010-11 32.86 (37) 41.26 (50) 145.06 (76) 119.36 (44) 442.40 (44) 2011-12 31.06 (27) 42.13 (24) 120.66 (87) 110.83 (56) 428.33 (56) 2012-13 30.01 (36) 41.58 (29) 123.93 (69) 96.94 (55) 401.96 (55) 2013-14 31.95 (34) 41.87 (36) 128.37 (73) 100.73 (48) 423.74 (48 ) 2014-15 27.91 (31) 40.39 (35) 134.71 (71) 111.45 (40) 420.97 (40 ) 9.16 Month wise Milk Production and Disposal during the period 1/4/2014 to 31/03/2015
Month Total milk produced (kg) Disposal Liquid Milk
Calf feeding Expt. April , 2014 23773.5 Total milk supplied to the milk plant May 25651.5 June 25671.0 July 25221.0 August 25030.0 September 23947.0 October 23580.0 November 24647.5 December, 2014 28437.0 January, 2015 31954.5 February 32188.0 March 38272.0 Total 3,28,373.5 9.17. Milking performance during the period 1/4/2014 to 31/03/2015 Month No. of
Animals in Milk
No. of Animals in dry
Total Animals
% in Milk Wet Av. ( Kg )
Herd Av. ( Kg )
April, 2014 100 70 170 58.8 8.9 5.7 May 103 72 175 58.8 8.2 5.3 June 104 73 177 58.8 8.5 5.3 July 105 75 180 58.3 8.3 5.0 August 112 73 185 60.5 7.7 4.9 September 113 78 191 59.2 7.3 4.9 October 110 89 199 55.3 7.4 4.8 November 107 97 204 52.5 7.4 4.8 December 111 100 211 52.6 8.1 5.1 January, 2015 124 91 215 57.7 8.1 5.1 February 139 83 222 62.6 8.3 5.2 March 146 91 237 61.6 8.5 5.2 Average 115 82 197 58.05 8.05 5.10

37
9.17.1 Milking Performance since inception of Network Year No. of
Animals in Milk
No. of Animals in
Dry Total No. of
Animals % in Milk Wet
Av. ( Kg )
Herd Av. ( Kg )
1993-94 115 45 160 72.15 7.80 5.60 1994-95 114 54 168 68.02 8.39 5.72 1995-96 109 51 160 68.12 8.03 5.50 1996-97 103 43 146 70.55 7.90 5.60 1997-98 119 47 166 71.98 7.40 5.30 1998-99 100 68 168 59.40 5.93 3.52 1999-00 094 71 165 75.53 6.60 3.90 2000-01 104 59 163 63.56 6.65 4.23 2001-02 090 53 143 62.69 6.26 3.93 2002-03 073 34 106 68.48 6.23 4.27 2003-04 080 37 117 68.38 6.36 4.31 2004-05 111 46 157 70.50 7.39 5.23 2005-06 107 65 172 62.14 7.05 4.38 2006-07 100 78 178 56.18 6.70 3.75 2007-08 104 69 173 60.00 6.80 4.00 2008-09 064 65 130 50.25 7.09 3.49 2009-10 091 65 156 58.33 7.32 4.25 2010-11 096 109 205 46.82 5.83 2.75 2011-12 066 81 147 44.89 6.79 3.03 2012-13 090 51 141 63.69 7.35 4.63 2013-14 101 65 166 60.84 7.80 4.70 2014-15 115 82 197 58.05 8.05 5.10 9.19 Bull wise Daughters Performance (XI Set ) Sr. No
Bull No.
Daughter Number
Date of Birth
Date of Calving
First lact. 305 Days M.Y.(Kg )
Total yield /L.L.( Kg)
Fat %
1 ND12 6252 26.08.10 24.11.14 2221.5 2221.5 6255 04.09.10 - - 6291 30.10.10 18.08.13 1762.0 1762.0 2 2133 6175 04.01.10 - - 6197 10.04.10 27.08.14 CONT 3 2148 6162 26.11.10 08.11.14 CONT 4 2154 6142 07.10.09 13.08.13 CONT 6143 11.10.10 05.01.14 1228.5 1228.5 6160 24.11.09 31.05.13 1743.5 1743.5 5 3226 6091 14.08.09 06.05.13 2051.5 2205.5/359 6093 15.08.09 30.05.13 2172.0 2221.5/335 6094 17.08.10 Abort 6239 19.07.10 21.09.13 1924.0 1924.0 6 3255 6095 20.08.10 - - 6114 18.08.10 07.07.14 CONT 6267 17.09.10 - - 6270 18.09.10 20.10.13 2261.0 2758.5/396 6281 09.10.10 05.10.14 CONT 6286 20.10.10 08.05.14 2345.0 CONT 6292 01.11.10 29.08.14 1822.0 1822.0

38
6296 03.11.10 - - 6310 19.12.10 09.05.14 1752.0 1752.0 7 3267 6105 07.09.09 15.04.13 1652.0 1652.0 6116 20.09.09 03.10.13 2314.0 2363.5/388 6212 17.04.10 20.03.04 2477.5 2477.5/295 8 5489 6185 13.03.10 - - 6186 14.03.10 14.03.14 2478.0 2652.0/365 6236 12.07.10 03.12.13 2420.0 2435.0/328 6321 01.03.11 - - 9 5496 6109 11.09.10 - - 6111 14.09.09 Died 6135 25.09.10 31.05.13 2400.5 2400.5/294 6199 15.04.10 23.01.14 3423.0 4034.5/412 6231 09.07.10 08.05.14 3541.8 CONT 10 5516 6155 16.10.10 - - 6166 03.12.10 - - 6220 15.06.10 - - 6222 20.06.10 13.05.14 700 Dried 11 3591 6289 25.10.10 22.11.14 CONT 9.20 Bull wise daughters born during the period 1/4/2014 to 31/03/2015 Set No. Centre Bull No. Total No. of daughters born XIV NDRI 6014 11 6044 7 6066 8 6136 15 GADVASU 2357 10 2369 6 CIRB 4093 5 4100 5 4439 8 Total 75 Proven Bull 2422 2 5258 9 Total 11 Grand Total 86 9.21 List of bulls as on 31/03/2015 Sr.No Bull No. Date of
Birth Sire No. Dam No. Dams B 305 D
or less MY ( Kg ) Age as on
31.03.2015 (yrs ) 1 5720 20.06.2006 3930 3543 3011 8.8 2 5926 16.10.2007 2720 5237 2596 7.5 3 6007 15.09.2008 5396 5231 3260 6.5 4 6014 02.10.2008 1693 5234 3072 6.5 5 6044 15.01.2009 4371 430 3567 6.2 6 6125 14.09.2009 2148 460 2727 5.5 7 6136 25.09.2009 2148 5517 4341 5.5 8 6139 03.10.2009 4506 5850 2828 5.5 9 6253 26.08.2010 NK 418 2601 4.6

39
10 6290 26.10.2010 4915 5517 4341 4.4 11 6294 02.11.2010 4915 4231 2768 4.4 12 6303 09.12.2010 2177 473 2737 4.3 13 6304 29.11.2010 4915 465 2733 4.3 14 6409 09.02.2011 NK 490 1628 4.1 15 6333 17.05.2011 4915 4933 3324 3.9 16 6340 19.07.2011 220 5620 2557 3.7 17 6355 27.08.2011 5604 5763 2556 3.6 18 6376 10.08.2011 5710 458 2506 3.6 19 6379 17.10.2011 4915 402 3505 3.5 20 6386 13.11.2011 220 452 2740 3.4 21 6405 26.01.2012 NK 486 2743 3.2 22 6417 31.01.2012 4059 6416 1995 3.2 23 6407 01.05.2012 NK 488 3137 2.9 24 6521 09.05.2012 2279 5736 2588 2.9 25 6485 13.07.2012 2177 463 2671 2.7 26 6482 07.08.2012 4915 428 2847 2.6 27 6509 17.08.2012 3551 5132 2763 2.6 28 6510 21.08.2012 2269 472 2657 2.6 29 6449 03.11.2012 NK 6439 2687 2.4 30 6547 14.11.2012 4915 463 2747 2.4 31 6540 25.10.2012 5943 467 3164 2.4 32 6644 03.10.2013 NK 6625 3349 2.2 33 6597 10.01.2013 NK 455 2833 2.2 34 6708 18.03.2013 NK 5573 2139 2.0 35 6723 11.04.2013 4851 6105 3224 2.0 36 6728 30.04.2013 1875 6441 2390 1.9 37 6646 02.07.2013 NK 6627 3533 1.7 38 6753 13.07.2013 858 470 3389 1.7 39 6603 02.09.2013 3964 492 3179 1.6 40 6770 15.08.2013 405 6218 4088 1.6 41 6822 13.12.2013 2412 490 4090 1.3
Target achieved during the year 2014 – 2015 Sr. No. Trait Target Achieved 1. Av. Age at first service 24 months 27.91 (31) 2. Av. Age at first calving 40 months 40.39 (35) 3. Av. Age for initiating training of bulls 18 months 17.60 4. Av. Age at first collection 30 months 22.75 5. Av. Service period 130 days 134.71 (71) 6. Calf mortality (0-3 months) ≤ 5 % 11.86 % 7. Wet average ≥8.5 kg. 8.05 kg 8. Herd average ≥5.5 kg. 5.10 kg 4. Activity carried out during the period The NDRI center is involved for genetic improvement of Murrah Buffalo breed along with other
centers under Network Project on Buffalo Improvement. i) Technical Programme : During the reporting period, the breeding programme in the
Murrah herd was followed for test mating of XIV th and XV th set of bulls. Fifteen set had 15 bulls of which eight bulls test mating continued up to March, 2015. The dams’ best

40
lactation 305 day or less milk yield of eight test bulls had ranged from 2828 in first lactation to 3605 Kg. Two proven bulls were used for elite mating at the centre.
ii) Targets and Achievements : The herd strength was increased during the reporting period. Average age at first service and age at first calving of buffaloes were 27.91 and 40.39 month. Average age for initiating training and age at first collection of the young Murrah bulls has significantly reduced to 17.60 and 22.75 months. The average service period of buffaloes has been estimated as 134.71 days. The overall female conception rate in the herd was 41.30 %. The female calf ( 0-3 month ) mortality was marginally higher ( 11.42 % ) than the target. The wet and herd average were increased to 8.05 Kg and 5.10 Kg, respectively. The average milk Fat, SNF and Total solid were estimated as 8.30 %, 9.65 %, and 17.95 %, respectively.
5. Selection of Young Murrah bull A total of twelve elite Murrah male calves were reserved during the period (2014-15) on the basis of Expected Predicted Difference and dam’s best 305d or less lactation milk yield, breed characteristics and physical conformity for selection of young male calves for future breeding. The dam’s best 305 days lactation milk yield of reserved males ranged from 2740 Kg in first lactation to 4088 kg. The EPD and superiority of reserved Murrah male calves ranged from 58 to 243 Kg and 2.71 to 11.36 %, respectively. The center proposed seven Murrah bulls out of which four breeding bulls were selected for test mating under XV th Set. The dam’s best 305 days milk yield of selected bulls ranged from 2828 in first lactation to 4341 kg.
6. Progeny Test Evaluation – Set-wise The information on 305 days milk yield of daughters were collected, compiled and supplied
to Nodal institute for genetic evaluation of XI th set of Murrah bulls using Contemporary Comparison Method.
7. Technologies developed / Success story(s) 1. The average age for initiating training and age at first collection of the young Murrah bulls has
significantly reduced to 17.60 and 21.75 months. 2. The age at first use (AAFU) of semen of Murrah breeding bulls has been optimized, which will help in early selection of bulls under progeny testing program for improving the reproductive performance in the herd. The average predicted CR based on first A.I was found highest (39.95%) at <3.5 years and lowest (34.87%) at >4.5 years of age at first A.I/use. Similarly, average predicted overall CR was found highest (41.05%) at <3.5 years and lowest (39.42%) at >4.5 years of age at first A.I/use of Murrah bulls. Under progeny testing program, Murrah bulls should be used at young age, i.e. prior to 3.5 years, which is expected to result in 5.08% better CR based on first AI and 1.63% better overall CR in comparison to Murrah bulls used after 4.5 years of age.
3. Genetic evaluation of murrah buffaloes using multi-trait animal model including fertiltiy and production performances has been developed.
4. The comparison of estimated breeding values (EBVs) of Murrah bulls through different sire evaluation methods, viz. contemporary comparison (CC), least-squares (LS), simple regressed least-squares (SRLS) and best linear unbiased prediction (BLUP) for FLMTDMY revealed that . BLUP method is more efficient, accurate and stable with lowest genetic variation.
5. Identified the best temperature humidity index model (THI model) among seven different THI models for analyzing the effect of heat stress on pregnancy rate of 581 Murrah buffaloes in a subtropical climate. A negative association was found between THI and pregnancy rate. THI model [THI = [0.4 × (Tdb + Twb)] × 1.8 + 32 + 15] indicates the maximum decline (-0.761 %) in pregnancy rate with per unit increase in THI value and
41
therefore, identified as the best THI model for studying the effect of heat stress on pregnancy rate of Murrah buffaloes in a subtropical climate.
6. The NDRI centre has produced 19,878 doses of frozen semen during the period. The centre has supplied 7000 doses of frozen semen to other centers. In addition 5824 doses of semen were supplied to NDRI Field Unit, 4060 doses of semen were supplied for different research purpose and 11,966 doses of frozen semen to farmers and other dairy development organizations during the period.
7. The germplasm of genetically superior progeny tested proven bulls are being used on elite cows in organized herds for production of high-pedigreed bulls for further multiplication and production of superior germplasm and establishment of elite herds. Superior semen of proven and high-pedigreed bulls of NDRI center is being used by various dairy development agencies and dairy farmers for bringing genetic improvement of Murrah buffaloes.
8. Bulls for elite mating at the institute herd The breeding programme in the herd was followed for nominated mating using semen of
three Proven Murrah Bulls. About 40 Murrah buffaloes were identified as elite animals. The average lactation milk yield of elite Murrah buffaloes increased to 3173.22 Kg which was 48.89 per cent higher than the herd average. The best lactational milk yield of elite Murrah buffaloes ranged between 2737 Kg in first lactation to 4341 kg. Eighty six daughters and eighty four male calves were born in the herd of which 11 and 9 were elite female and male calves, respectively.
9. Feeding / Reproduction/ Management studies, if any The effects of feeding different energy levels on age at puberty and semen quality in
Murrah buffalo bulls were studied. Three groups ( six animals in each group) were designed with control group ( G-I) fed as per NRC(2001)/ICAR recommendations of feeding of buffalo males, second ( G-II) and third ( G-III) groups were fed as per the control plus 10% and 20 % extra energy, respectively. The average age at first ejaculation in Murrah bulls of G-I, G-II and G-III was found 20.4, 18.4 and 19.3 months, respectively. The scrotal circumference size of Murrah bulls with the corresponding groups was obtained as 23.9, 24.0 and 25.0 cm, respectively. The result revealed that increase of 10 % feed energy level would decrease the semen donation age and increase the semen quality of Murrah bulls. The findings will help to select the Murrah bulls at the early age for progeny testing programme.
10. Gaps/ Constraints, if any The center has not faced any constraints during the period. 11. Future programme 1. The efforts will continue to further reduce the calf mortality, improving the reproduction
and production performance of buffaloes for achieving the targets specified in the project. 2. Research has been initiated for genomic selection of Murrah bulls for reproduction and
production performance. 12. Reasons of continuation in the 12th Plan NDRI contributed significantly for the genetic improvement of Murrah buffaloes in the country.

42
Herd Performance Herd strength increased from 374 in previous year to 504 in 2014-15, out of which 270 were breedable buffaloes. Number of breeding bull > 2 years are 48 and the bull having dams 305 days or less day milk yield < 2500 kg may be culled off from the herd. During the period 170 calving took place consisting of 84 males, 86 females and 2 still births. The calf mortality (0-3 months) was 11.86 percent (23/194) which is higher than the target. Female conception rate reported as 41.30 percent (152/368). During the report period 19878 semen doses were produced from the 14th & 15th set bulls and 13934 frozen semen doses were consumed /distributed at farm and field. Yearly body weight at different age was not presented in the table 9.11.
Milk production performance viz. Average lactation yield, Lactation length, 305 day or less
day milk yield were 2486.33 kg (n=119), 305 days (n=119) and 2224 kg (n=124), respectively. Age at first calving, Average service period, Average dry period and average calving Interval were 40.39±1.15 months (n=35), 134.71±18.97 days (n=71), 111.45±11.52 days (n=40) and 420.97±18.01 days (n=40). The centre has maintained its reproduction performance over the years. The wet and Herd averages were8.05 kg & 5.10 kg. During the report period 58.05 percent animals were in milk. The centre showed improvement in wet & herd average. 1st time crossed 8 kg and 5 kg barrier in wet and herd average since 1996. Targets achieved during 2014-15 Sr. No. Trait Target Achieved 1. Av. Age at first service 24 months 27.91 (31) 2. Av. Age at first calving 40 months 40.39 (35) 3. Av. Age for initiating training of bulls 18 months 17.60 4. Av. Age at first collection 30 months 22.75 5. Av. Service period 130 days 134.71 (71) 6. Calf mortality (0-3 months) ≤ 5% 11.86 % 7. Wet average ≥ 8.5 kg. 8.05 kg 8. Herd average ≥ 5.5 kg. 5.10 kg
Recommendations: The improved production performance need to be sustained and nominated mating strictly be followed for superior bull production.
Project Co-ordinator’s observations on centre performance
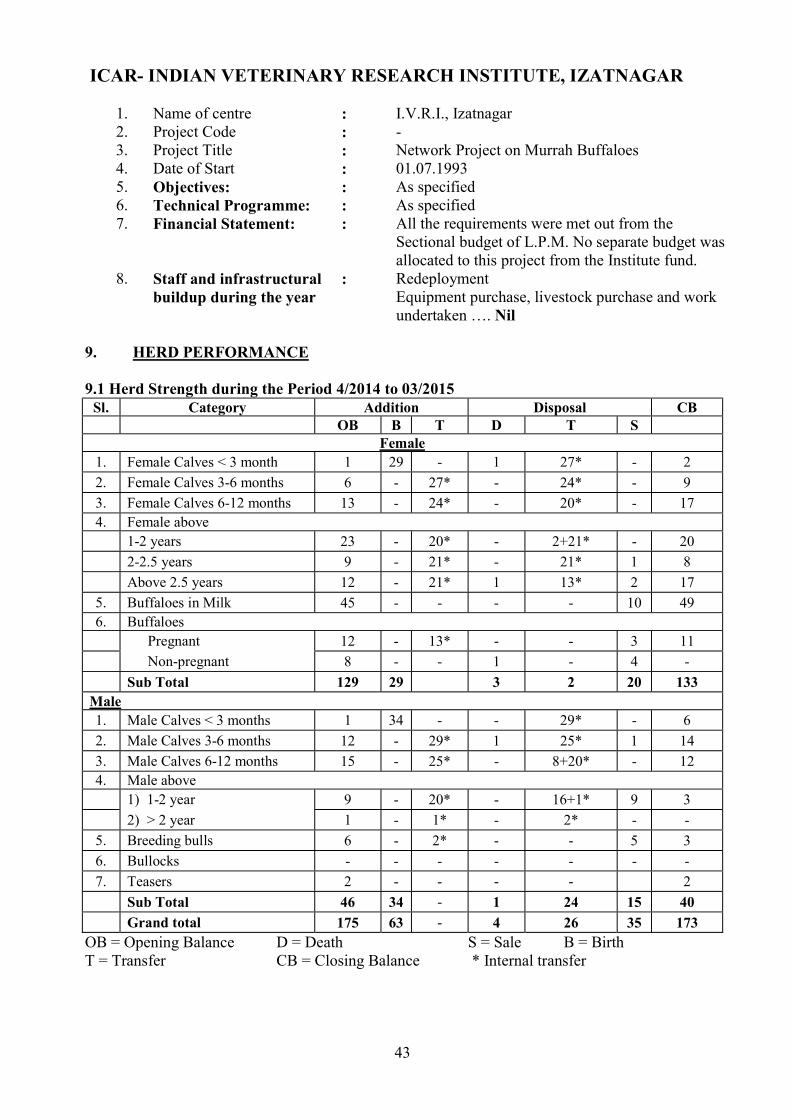
43
ICAR- INDIAN VETERINARY RESEARCH INSTITUTE, IZATNAGAR 1. Name of centre : I.V.R.I., Izatnagar
2. Project Code : - 3. Project Title : Network Project on Murrah Buffaloes 4. Date of Start : 01.07.1993 5. Objectives: : As specified 6. Technical Programme: : As specified 7. Financial Statement: : All the requirements were met out from the
Sectional budget of L.P.M. No separate budget was allocated to this project from the Institute fund.
8. Staff and infrastructural buildup during the year
: Redeployment Equipment purchase, livestock purchase and work undertaken …. Nil
9. HERD PERFORMANCE 9.1 Herd Strength during the Period 4/2014 to 03/2015
Sl. Category Addition Disposal CB OB B T D T S
Female 1. Female Calves < 3 month 1 29 - 1 27* - 2 2. Female Calves 3-6 months 6 - 27* - 24* - 9 3. Female Calves 6-12 months 13 - 24* - 20* - 17 4. Female above 1-2 years 23 - 20* - 2+21* - 20 2-2.5 years 9 - 21* - 21* 1 8 Above 2.5 years 12 - 21* 1 13* 2 17
5. Buffaloes in Milk 45 - - - - 10 49 6. Buffaloes Pregnant 12 - 13* - - 3 11 Non-pregnant 8 - - 1 - 4 - Sub Total 129 29 3 2 20 133
Male 1. Male Calves < 3 months 1 34 - - 29* - 6 2. Male Calves 3-6 months 12 - 29* 1 25* 1 14 3. Male Calves 6-12 months 15 - 25* - 8+20* - 12 4. Male above 1) 1-2 year 9 - 20* - 16+1* 9 3 2) > 2 year 1 - 1* - 2* - -
5. Breeding bulls 6 - 2* - - 5 3 6. Bullocks - - - - - - - 7. Teasers 2 - - - - 2 Sub Total 46 34 - 1 24 15 40 Grand total 175 63 - 4 26 35 173
OB = Opening Balance D = Death S = Sale B = Birth T = Transfer CB = Closing Balance * Internal transfer

44
9.2 Calving Statistics during the period 4/2014 to 3/2015 Month Male Female Still Birth Overall No. No. % No. % No. % No. % April, 2014 - - - - - - May, 2014 - - - - 1 1.75 June, 2014 2 5.88 5 17.24 7 11.11 4 7.02 July, 2014 5 14.71 4 13.79 9 14.29 5 8.77 August, 2014 4 11.76 5 17.24 9 14.29 10 17.54 September, 2014 3 8.82 3 10.34 6 9.52 11 19.30 October, 2014 6 17.65 2 6.90 8 12.70 11 19.30 November, 2014 3 8.82 4 13.79 7 11.11 6 10.52 December, 2014 5 14.71 3 10.34 8 12.70 4 7.02 January, 2015 2 5.88 2 6.90 4 6.35 3 5.27 February, 2015 4 11.76 1 3.45 5 7.94 2 3.51 March, 2015 - - - - - - - - Overall 34 100.00 29 100.00 63 100.00 57 100.0 Sex Ratio Male: Female = 1.17:1.00 9.3 Disposal of Animals during the Period 4/2013 to 3/2014 Sl. No.
Female Category Surplus /Off type
/ Low Prod. Reproductive
Problem Weak & Old
Death Exptl. purposes
Total Female
1. < 6 months - - - 1 - 1 6 – 12 months - - - - - -
2. Heifers 1-2.5 years 1 - - - 2 3 2.5 years - 2 - 1 - 3
3. Buffaloes Dry 6 4 - 1 - 11 Milch 2 4 1 - - 7 Sub Total 9 10 1 3 2 25
Male 1. < 6 months 1 - - 1 - 2 2. 6 – 12 months - - - - 8 8 3. Above 1 year 9 - - - 16 25 4. Young Bull - - - - - - 5. Breeding bulls 5 - - - - 5 6. Bullocks/Teaser - - - - - - Sub Total 15 - - 1 24 40 Grand Total 24 10 1 4 26 65 9.4 Month wise Mortality during the Period 4/2014 to 03/2015 Month Female Male 0-3 m 3-6
m 6-12
m 1-2 Yrs
Above 2 Yrs
Overall Female
0-3 m 3-6 m
6-12 m
Above 1 Yrs
Overall Male
Overall Group
Overall No. 30 33 37 43 141 158 35 41 40 41 80 238 Died 1 - - - 2 3 - 1 - - 1 4
% 3.33 - - - 1.42 1.89 - 2.44 - - 1.25 1.68 Overall calf mortality (0-3m) was 1.54 percent.

45
9.5 Causes of Mortality (quarter wise) during the period 04/14 to 03/15 Particulars 1st qrt. 2nd qrt. 3rd qrt. 4th qrt. Total A. Respiratory System:
Granulomatous Pneumonia/ Pneumonia enteritis / Septicaemia
01 - 01 01 03 B. Digestive System:
Septicaemia & Toxemia/ Enteritis leading to Septicaemia, Acute abomasamitis & Septicaemia
01 - - - 01
C. Others Abortion/+ve for Brucellosis (on RBPT) 01 01 - - 02 Total 3 1 1 1 06 9.6 Prophylactic Measures Taken During the Period 4/2014 to 03/2015 Vaccination No. of animals Screening
No. of animals No of animals treated
for Parasitism etc. Available Inoculated Tested Result Endoparsites 386
FMD - - - - - Ectoparasites 292 HS - - - - - Liquid Vit. Supplement Brucellosis - - - - - Feed supplement 106
- - - Coccidisotat 138 - - - Antibiotics coverage 8
Post natal coverage 73 9.7 Calving Abnormalities (Quarter wise) during the period 4/2014 to 03/2015 Quarter
No. of
Calving
Abortions Unseen Abortions
Dystokia Retention of
Placenta Premature Birth/ Still
birth Prolapse Overall
abnormalities
N % N % N % N % N % N % N % I 7 - - 2 2.8 - - 1 1.4 - - - - 3 4.2 II 24 3 4.2 1 1.4 1 1.4 - - - - 1 1.4 6 8.5 III 23 - - - - - - - - - - - - - - IV 9 1 1.4 1 1.4 - - - - - - - - 2 2.8
Overall 63* 4 5.6 4 5.6 1 1.4 1 1.4 - - 1 1.4 11 15.5 * abortions and unseen abortions were added in total calvings to calculate %ages
9.8 Female conception rate during the period April 2014 to January 2015 (2014-15) NUMBER OF INSEMINATIONS
Parity 1st AI 2nd AI 3rd AI 4th AI 5th & above Overall Particulars I C CR% I C CR% I C CR% I C CR% I C CR% I C CR% Heifers 18 10 55.55 7 4 57.14 5 2 40 2 1 50 - - - 32 17 53.12 Adult 46 23 50 17 11 64.70 3 1 33.33 3 1 33.33 1 - - 70 36 51.42 Overall 64 33 51.56 24 15 62.5 8 3 37.5 5 2 40 1 - - 102 53 51.96
I=Inseminated, C= Conceived, C%=Conception rate

46
9.9 Bull wise Conception Rate Inseminated during April 14 to January 2015 Sl. Bull No. Total No of AI Diagnosed Total Conceived CR % 1. 2429 16 10 62.50 2. 4196 1 - - 3. 4354 21 10 47.61 4. 4324 20 9 45.00 5. 6066 1 1 100.00 6. 4439 2 1 50.00 7. 6136 1 1 100.00 8. 2417 10 4 40.00 9. 2412 13 7 53.84 10 4100 1 1 100.00 11. 4093 1 - - 12. 6007 2 - - 13. 6290 1 1 100.00 14. 6405 1 1 100.00 15. 4328 1 1 100.00 16. 2371 9 5 55.55 17. 2459 1 1 100.00
Total 9.10 Bull wise semen stock/ set-wise of buffaloes (1st April, 2014 to 31st Jan, 2015) S.No. Bull No
Opening balance
1ST April 2013 Semen
Produced/ Received
Consumption / supplied Balance
XI th SET 1. 2429 - 50 dose 20 dose 30 dose 2. 4196 55 dose Transferred to P&C Div 3. 4354 - 100 dose 100 dose nil 4. 4324 - 100 dose 75 dose 25 dose 5. 6066 18 - Issued to AR DIV nil 6. 4439 29 dose - Issued to AR DIV nil 7. 6136 7 dose - Issued to AR DIV nil 8. 2417 - 50 dose 50 dose nil 9. 2412 - - 8 dose 42 dose 10. 4100 48 - Transferred to P&C Div 11. 4093 29 - Issued to AR DIV 12. 6007 - 50 dose 8 dose 42 dose 13. 6290 - 50 dose 4 dose 46 dose 14. 6405 - 50 dose 8 dose 42 dose 15. 4328 - 100 dose 8 dose 92 dose 16. 2371 - 50+50 dose 50 dose 50 dose 17. 2459 - 50 dose 4 dose 46 dose
* Dose tested, **Auctioned / transferred *** Used in second AI 9.11 Body Weight during the period 04/14 to 03/15 Age N Body weight (kg) (±) SE Female Birth 29 34.75 0.72 3 Month 27 76.44 3.96 6 Month 15 108.33 4.27 12 Months 21 227.38 7.63 18 Months 21 342.86 5.52 24 Months 25 412.80 6.67 Weight at first calving 18 530.56 20.14

47
Breeding Males Birth 34 38.12 0.74 3 Months 23 78.39 1.89 6 Months 23 111.52 4.08 12 Months 11 219.55 12.60 18 Months - - - 24 Months 2 340.00 65.00 Overall Birth 63 36.57 0.56 3 Month 50 77.34 2.29 6 Month 38 110.26 2.96 12 Months 32 224.69 6.53 18 Months 21 342.86 5.52 24 Months 27 407.41 8.00 9.11.1 Body weight since inception of Network
Body Weight (in kg) at Year At Birth 3 Months 6 Months 12 Months 18 Months 24 Months At AFC
1992-93 26.30 (30) 60.78 (11) 120.30 (11) 201.43 (11) 265.31 (08) 350.41 (10) - 1993-94 25.81 (16) 63.95 (19) 102.67 (15) 170.59 (17) 263.82 (17) 319.47 (09) - 1994-95 25.97 (31) 51.52 (04) 77.12 (26) 148.82 (34) 217.00 (15) 284.05 (16) - 1995-96 24.25 (08) 56.67 (03) 105.00 (01) 165.00 (05) 220.33 (15) 286.25 (24) - 1996-97 24.38 (16) 86.67 (03) 117.50 (04) 217.50 (02) 248.15 (04) 368.00 (04) - 1997-98 24.84 (19) 92.50 (18) 123.75 (12) 224.29 (14) 254.50 (10) 366.25 (08) - 1998-99 26.98 (20) 89.50 (21) 125.41 (13) 220.00 (06) 240.30 (07) 350.81 (08) - 1999-00 23.60 (20) 63.60 (10) 120.46 (11) 183.33 (09) 245.00 (07) 310.67 (15) - 2000-01 24.36 (33) 50.55 (11) 99.28 (14) 195.00 (10) 261.50 (10) 342.50 (08) - 2001-02 26.73 (11) 59.37 (08) 95.00 (09) 183.63 (11) 284.23 (13) 359.44 (09) - 2002-03 29.07 (14) 81.11 (09) 107.08 (12) 195.62 (16) 277.14 (07) 347.27 (11) - 2003-04 31.66 (40) 58.50 (18) 98.75 (32) 196.66 (14) 326.34 (16) 366.40 (17) - 2004-05 32.52 (62) 60.60 (40) 97.66 (25) 187.91 (12) 271.66 (12) 368.00 (11) 501.50 (10) 2005-06 31.77 (63) 57.96 (32) 96.66 (42) 186.51 (32) 300.19 (20) 369.22 (16) 600.50 (10) 2006-07 31.98 (50) 63.78 (34) 98.30 (26) 195.74 (20) 279.34 (21) 357.87 (21) 588.37 (52) 2007-08 30.53 (63) 67.74 (69) 112.19 (67) 196.85 (41) 279.83 (20) 351.82 (16) 475.38 (13) 2008-09 31.07 (73) 62.51 (56) 101.57 (50) 182.02 (39) 235.56 (33) 355.89 (23) 477.81 (16) 2009-10 30.64 (67) 73.55 (46) 112.64 (38) 187.74 (43) 269.50 (39) 331.37 (25) 509.00 (15) 2010-11 30.34 (67) 78.71 (39) 123.34 (46) 225.55 (38) 292.16 (56) 352.22 (23) 483.75 (20) 2011-12 32.75 (54) 63.40 (43) 123.73 (34) 226.53 (26) 308.13 (18) 377.90 (24) 498.44 (16) 2012-13 35.58(53) 69.43(47) 126.63(42) 234.26(25) 334.62(13) 391.25(16) 527.71(07) 2013-14 33.37 (57) 70.98 (53) 125.15 (47) 247.27 (33) 330.45 (25) 409.69 (16) 539.58 (12) 2014-15 36.57 (63) 77.34 (50) 110.26 (38) 224.69 (32) 342.86 (21) 407.41 (27) 530.56 (18)
9.12 Production Performance of Buffaloes Completing Their Lactation during 14-15 Lact No. No of
obs. Av. total lact.
yield (kg) Av. lact. length
(day) Av. 305 days MY (kg) Av. peak yield
(kg) 1st 13 2241.27±118.24 332.15±17.25 2104.58±91.66 9.65±0.46 2nd 12 2334.58±107.35 277.08±9.74 2318.21±98.12 11.18±0.52 3rd 6 2222.25±119.04 270.17±19.94 2209.00±114.22 11.75±1.11 4th 3 2272.83±152.55 270.33±6.96 2272.83±152.55 13.00±0.76 5th 3 1992.67±100.85 258.67±30.69 1988.00±98.52 11.67±1.45 6th 7 2195.57±245.80 301.00±36.23 2089.79±247.46 11.21±1.08
≥7th 9 1928.56±96.85 261.00±8.63 1928.56±96.85 10.50±0.81 Overall 53 2188.82±55.81 288.81±8.02 2135.85±51.77 10.89±0.31

48
9.12.1 Production performance of buffaloes since inception of network Year Av. Lact. Yield (Kg.)* Av. Lact. Length (d) Milk in 305 days (kg)* Ave. peak yield (kg)
1992-93 1502.60±57.03 (34) 297.91±9.24 (34) 1457.72±48.65 (34) 07.88±0.35 (26) 1993-94 1557.30±57.07 (28) 276.32±8.46 (28) 1537.17±49.53 (28) 09.05±0.33 (30) 1994-95 1546.66±51.03 (32) 259.25±6.62 (32) 1535.94±40.61 (32) 09.58±0.30 (35) 1995-96 1522.72±55.66 (27) 323.15±7.65 (27) 1456.50±51.77 (27) 07.40±0.39 (21) 1996-97 1738.33±94.52 (20) 341.10±13.41 (20) 1629.27±76.30 (20) 07.91±0.38 (23) 1997-98 1830.99±119.31 (23) 320.35±19.41 (23) 1714.57±95.93 (23) 08.34±0.39 (22) 1998-99 1980.32±97.68 (22) 320.05±12.09 (22) 1980.32±97.68 (22) 08.45±0.39 (21) 1999-00 2106.83±107.58 (18) 309.94±11.65 (18) 2025.83±98.47 (18) 09.78±0.35 (26) 2000-01 2011.15±169.51 (20) 277.15±27.11 (20) 1897.80±147.16 (20) 10.56±0.39 (22) 2001-02 2090.67±78.93 (28) 317.42±9.75 (28) 2101.89±75.21 (19) 10.12±0.36 (28) 2002-03 1999.43±88.39 (55) 298.55±9.95 (05) 2043.49±66.45 (55) 10.73±0.45 (55) 2003-04 2070.94±98.94 (26) 306.51±14.68 (26) 2103.31±118.1 (26) 10.99±0.68 (26) 2004-05 2182.47±92.90 (31) 299.05±8.98 (31) 2216.03±86.06 (31) 11.25±0.47 (31) 2005-06 2166.92±92.42 (45) 307.66±9.70 (45) 2217.55±89.44 (32) 09.96±0.62 (45) 2006-07 2338.20±89.28 (43) 319.85±6.96 (43) 2412.86±88.60 (27) 11.00±0.43 (43) 2007-08 2379.09±66.65 (56) 296.51±3.93 (56) 2525.47±109.09 (28) 11.89±0.33 (56) 2008-09 2257.76±49.49 (43) 291.89±4.87 (43) 2208.95±106.07 (16) 11.00±0.28 (43) 2009-10 2418.2577.48 (51) 298.506.77 (51) 2570.4891.81 (26) 11.820.35 (51) 2010-11 2157.7864.94 (56) 286.404.89 (56) 2136.4863.14 (56) 11.160.38(56) 2011-12 2208.41±70.08 (49) 308.75±7.72 (49) 2276.82±82.85 (27) 11.54±0.37(49) 2012-13 2249.40±8.46 (38) 316.43±8.41(38) 2242.31±108.05(20) 11.01±0.34(38) 2013-14 2113.36±56.07 (47) 304.27±7.95 (47) 2037.79±62.44 (47) 11.52±0.25 (47) 2014-15 2188.82±55.81 (53) 288.81±8.02 (53) 2135.85±51.77 (53) 10.89±0.31 (53)
* 319 kg milk is added in pail yields on account of milk suckled by calf
1.13 Average Milk Components during the Period (Month-wise) 4/2014 to 3/2015 Month No. of Samples % Fat SNF (%) Total Solids (%) April, 2014 82 7.85 9.89 17.74 May, 2014 68 7.81 9.97 17.78 June, 2014 60 7.93 9.82 17.75 July, 2014 64 7.91 9.8 17.71 August, 2014 58 7.84 9.85 17.69 September, 2014 66 7.84 9.89 17.73 October, 2014 78 7.77 9.91 17.68 November, 2014 72 7.91 10.07 17.98 December, 2014 88 7.93 10.04 17.97 January, 2015 - - - - February, 2015 - - - - March, 2015 - - - - Overall 636 7.87 9.92 17.78 9.14 Reproduction Performance of buffaloes calving during the Period 4/2014 to 03/2015
Traits 1 2 3 4 5 6 ≥7 Overall Average Age at Calving (Months)
N 18 - - - - - - 18 X 37.64 - - - - - - 37.64
SE 1.33 - - - - - - 1.33 Average Service Period (days)
N 11 14 8 3 3 7 9 55 X 116.00 117.43 129.38 110.67 123.00 210.43 75.78 123.84
SE 12.84 16.82 33.86 48.21 49.22 47.66 10.91 10.72 Average Dry Period (Days)
N - 14 8 3 3 7 9 44 X - 132.86 248.38 131.33 200.00 190.71 107.11 162.27
SE - 18.95 61.85 26.82 45.62 45.82 9.74 16.31 Average Calving Interval (Days)
N - 14 8 3 3 7 9 44 X - 424.29 481.25 437.00 454.67 498.29 376.00 439.48
SE - 23.25 39.75 43.66 85.86 61.59 5.55 15.97

49
9.14.1 Reproduction Performance of Buffaloes calving since inception of Network
Years AFC (Months) Service Period (d) Dry Period (d) Calving Interval (d) 1992-93 33.61±1.72 (10) 119.67±33.72 (08) 129.86±10.63 (07) 403.63±21.77 (08) 1993-94 39.38±2.99 (07) 100.90±16.01 (10) 133.15±12.72 (13) 406.08±16.77 (12) 1994-95 38.27±1.70 (10) 77.33±05.56 (09) 129.10±09.72 (20) 377.00±08.00 (20) 1995-96 37.90±1.08 (14) 100.00±11.78 (06) 118.71±11.77 (07) 401.14±16.55 (07) 1996-97 42.08±3.38 (04) 125.14±11.23 (07) 146.00±38.31 (08) 424.00±23.55 (07) 1997-98 40.14±3.38 (06) 82.55±06.54 (11) 101.73±25.10 (11) 391.55±13.11 (11) 1998-99 43.42±2.28 (08) 152.50±25.80 (11) 12.58±08.87 (10) 437.83±15.33 (10) 1999-00 48.80±7.03 (06) 189.82±28.65 (16) 110.36±13.67 (11) 422.46±21.47 (11) 2000-01 42.37±2.81 (04) 164.94±22.66 (17) 126.66±10.74 (09) 410.78±13.05 (09) 2001-02 44.35±2.58 (11) 134.25±24.63 (12) 134.00±15.33 (12) 440.52±23.81 (12) 2002-03 41.20±2.90 (04) 404.60±96.25 (05) 310.77±54.92 (09) 585.50±69.01 (04) 2003-04 41.82±3.19 (08) 108.36±15.51 (19) 256.81±35.81 (29) 553.20±36.24 (29) 2004-05 42.55±1.75 (08) 149.71±15.59 (30) 212.75±29.94 (37) 480.71±28.12 (37) 2005-06 42.25±2.43 (10) 179.91±28.47 (54) 204.41±41.40 (38) 477.45±42.50 (37) 2006-07 41.87±2.26 (10) 139.01±15.40 (40) 171.09±21.44 (28) 452.42±21.30 (30) 2007-08 45.84±0.96 (28) 114.97±07.56 (62) 150.33±19.04 (43) 443.24±21.39 (43) 2008-09 39.73±1.79 (48) 152.44±11.71 (48) 167.02±10.70 (48) 451.51±10.57 (48) 2009-10 41.324.73 (15) 121.7711.25 (59) 154.6914.01 (63) 444.6413.01 (63) 2010-11 39.591.16 (25) 175.2716.26 (26) 183.2421.07 (60) 449.0815.74 (60) 2011-12 45.613.21 (20) 152.9120.66 (29) 207.3822.22 (39) 460.8917.90 (39) 2012-13 39.692.79 (7) 213.4926.37 (30) 232.9321.36 (31) 479.2922.88 (31) 2013-14 38.202.15 (18) 140.0712.79 (39) 170.6311.86 (39) 470.8714.03 (39) 2014-15 37.641.33 (18) 123.8410.72 (55) 162.2716.31 (44) 439.4815.97 (44)
9.15 Month wise Milk Production and disposal during the Period 4/2014 to 03/2015 Month Total Milk Production
(kg) Disposal
Liquid Milk Calf Feeding Exptl. April, 2014 8226 The whole milk was given to DT Section (LPT) for
disposal May 6110 June 5385 July 6337 August 6502 September 8143 October 9686 November 9725 December 11805 January 2015 12815 February 11410 March 11453 Total 107597 9.16 Feed and fodder purchased and offered to animals during the period 4/14 to 3/15 Quarter Type of fodder Qty. produced at
Farm Qty.* Purchased Actually fed
(Qtls.)* Balance I Green /Semi Dry - - 5015.9 - Dry - - 43.0 - Silage - - - - Concentrate - - 380.2 - II Green /Semi Dry - - 4591.2 - Dry - - 59.5 -

50
Silage - - - - Concentrate - - 467.3 - III Green /Semi Dry - - 4869.4 - Dry - - 75.1 - Silage - - 212.3 - Concentrate - - 486.4 - IV Green /Semi Dry - - 5460.9 - Dry - - 124.8 - Silage - - 39.4 - Concentrate - - 400.7 - Total Green /Semi Dry - - 19937.4 - Dry - - 302.4 - Silage - - 251.6 - Concentrate - - 1734.7 - *Concentrate mixture supplied/purchased by F.T. Unit of Institute 9.17 Milking performance during the period 4/2014 to 03/2015
Month/Year No. of Animal in Milk
No. of Animal Dry
Total Animal
% in Milk
Wet Av. (kg)*
Herd Av. (kg)*
April, 2014 44.80 20.27 65.07 68.85 6.12 4.21 May 38.48 27.52 66.00 58.30 5.12 2.99 June 36.87 29.70 66.57 55.39 4.87 2.70 July 34.10 34.45 68.55 49.74 6.00 2.98 August 33.00 32.71 65.71 50.22 6.37 3.19 September 34.73 35.57 67.30 49.40 7.81 4.03 October 39.61 28.39 68.00 58.25 7.89 4.59 November 42.20 26.03 68.23 61.85 7.68 4.75 December 49.65 19.00 68.65 72.32 7.67 5.55 January, 2015 53.03 9.97 63.00 84.17 7.80 6.56 February 55.43 7.57 63.00 87.98 7.35 6.47 March 53.29 9.13 62.52 85.40 6.92 5.91 Overall 42.93 23.36 66.05 65.15 6.80 4.49 * Based on pail yields (319 kg milk has not been added in the pail yields on account of milk suckled by calf. 9.17.1 Milking performance since inception Year No. of Animal
in Milk No. of Animal
Dry Total
Animal % in Milk
Wet Ave. * (kg)
Herd Ave. * (kg)
1992-93 22.44 13.56 36 62.33 4.31 2.68 1993-94 38.15 25.85 64 59.60 4.62 2.75 1994-95 38.62 44.38 83 46.53 3.90 1.81 1995-96 29.17 41.83 71 41.08 3.63 1.49 1996-97 28.20 31.80 60 47.00 4.19 1.96 1997-98 26.67 23.33 50 53.34 4.84 2.58 1998-99 20.30 22.70 43 47.20 5.79 2.73 1999-00 22.64 11.36 31.70 71.41 4.77 4.17 2000-01 26.97 10.03 38.73 69.63 5.42 3.80 2001-02 32.61 19.17 51.78 59.80 5.82 3.64 2002-03 33.64 29.98 63.62 51.75 4.94 2.47 2003-04 36.82 54.79 91.61 39.67 5.94 2.46 2004-05 37.68 53.90 91.58 40.95 5.99 2.53 2005-06 45.64 53.22 98.87 46.16 6.14 3.07

51
2006-07 41.42 35.33 76.75 53.96 6.15 3.42 2007-08 62.03 33.16 93.23 66.53 5.98 4.05 2008-09 53.45 31.23 84.69 63.12 6.69 4.27 2009-10 45.28 41.66 86.94 52.08 6.68 3.34 2010-11 46.67 43.33 90.00 51.85 5.88 3.14 2011-12 40.68 31.56 72.27 57.44 5.82 3.39 2012-13 39.16 23.08 62.25 62.92 5.66 3.59 2013-14 44.94 22.84 67.78 65.97 5.85 3.91 2014-15 42.93 23.36 66.05 65.15 6.80 4.49 *based on pail yields. 9.18 Bull Wise Daughters Performance (first lact. 305 days yield) during 4/14-03/15 Sl. No.
Bull No.
Daughter number
Date of Birth
Date of Calving
First lact. 305 days
MY Total
Yield /LL Remarks
1. 5604 1055 26/8/2011 26/12/2013 2103.0 2412.5/400 2. 3267 944 6/12/2009 3/9/2013 2041.0 2043.0/306 3. 2177 1067 5/10/2011 11/12/2014 - 153/46 4. 3591 924 5/12/2009 24/7/2013 - 2644.5/277 5. 5496 959 12/3/2010 23/6/2013 1968.5 2075.5/337 6. 5604 1046 30/7/2011 29/4/2014 0 0 7. 3255 931 5/11/2009 25/6/2013 2294.5 2499.5/365 8. 1153 933 8/11/2009 30/6/2013 1940.5 2083/360 9. 3591 982 2/9/2010 15/9/2013 - 2041/302 10. 3591 989 12/9/2010 4/9/2013 2306.5 2392.5/327 11. 2133 1000 16/10/2010 26/8/2013 1824.0 1852/314 12. - 1035* 15/3/2011 11/7/2014 - 73.5/8 13. 3255 1012 6/11/2010 3/10/2013 2664.0 2694/317 14. 2185 1051 11/8/2011 21/1/2014 - 1476/214 15. 5516 964* 25/4/2010 11/6/2014 - 340/88 16. 3267 1007 30/10/2010 17/10/2013 1815.5 1858/323 17. 5604 1064* 25/9/2011 19/8/2014 - 55/29 18. 3267 994* 27/9/2010 22/7/2013 2240.0 3065/476
* Auctioned/Died 9.19 Bull wise daughters born during the period 4/2014 to 03/2015
Bull No.
Total No. of daughters born (daughter numbers)
No. of daughters reaching
AFC
No. of daughters
completing 1St Lact.
Last Lactation
6044 111/14,112/14,128/14,129/14,131/14,134/14 - - - 6136 116/14,117/14,122/14,157/14 - - - 1994 119/14,132/14,155/14 - - - 4439 120/14,160/14,168/15 - - - 6014 125/14,140/14,141/14,161/14 - - - 6066 137/14,154/14 - - - 2357 147/14,151/14,152/14,167/15 - - - 4093 149/14 - - - 4100 173/15* - - - * Died

52
9.20 List of breeding/young bulls as on 31/03/2015 Sr. No.
Bull No. Date of birth
Dam No.
Sire No. Dam’s best lact. 305-days or less
yield (kg) Semen doses
available Remarks
1. 1084 05.01.12 709 3598 3025.5/V - - 2. 7/2012 04.08.12 660 5710 2745/II - - 3. 16/2012 23.08.12 736 2234 2518/I - - 4. 33/2012 22.10.12 712 1875 2726.5/IV - - 5. 41/2012 11.12.12 900 2234 1877.0/I - - 6. 42/2012 18.12.12 764 2304 2299.0/II - - 7. 45/2013 01.01.13 708 4059 2041.0/II - - 8. 47/2013 16.01.13 709 2422 3025.5/V - - 9. 50/2013 01.02.13 518 2422 2533.0/II - - 10. 52/2013 03.03.13 726 2304 2515.0/II - - 9.21 Target achieved during the year 2014-15 Sr. No.
Trait Target Achieved 1. Av. Age at first service (months) 24 m (300 kg. LBW) 28.21 (465.67) 2. Av. age at first calving 40 month 37.64 3. Av. age for initiating training of bulls (months) 18 month (350 kg) NA 4. Av. age at first collection 30 month (400 kg) NA 5. Av. service period 130 day 123.84 6. Calf mortality (0-3 months) ≤ 5% 1.54 7. Wet average ≥ 8.5 kg 6.80 8. Herd average ≥ 5.5 kg 4.49 10. SALIENT RESEARCH ACHIEVEMENTS: (a) Herd Strength: The opening balance (herd strength) of Murrah buffaloes as on 01/04/2014
was 175 heads (46 males and 129 females). Additions in the herd were due to birth of 29 female and 34 male calves (63 heads). Deletions from the herd were due to death of 4 animals (1 males and 3 females), external transfer of 26 animals (2 females and 24 males) and auction/sale of 35 buffaloes (15 males and 20 females). The male: female ratio of new calvings was 1.17:1.00. The closing balance of the buffalo herd as on 31/03/2015 was 173 buffalo heads (133 females and 40 males, Table 9.1). Out of total 35 animals (10 males and 25 females) culled/sold during the current year due to surplus/off-type/low production, reproductive ground along with weak and old buffaloes.
(b) Mortality (Detailed): The overall mortality per cent was 1.68%. The overall female and
male group mortality percents were 1.89 and 1.25%, respectively. A total of 4 deaths were recorded in IVRI buffalo herd during the current year (1 males and 3 females).
(c) Prophylaxis: The prophylaxis measures taken in the Murrah Buffaloes.
(d) Reproductive Performance: The overall conception rate was 51.96%. The respective figures in heifer and adult groups were 53.12 and 51.42%, respectively. The means for

53
age at first calving, service period, dry period and calving interval were 37.641.33 months, 123.8410.72 days, 162.2716.31 days and 439.4815.97 days, respectively.
(e) Growth performance: The means for overall live body weights at birth, 3, 6, 12, 18 and 24 months of age were 36.57±0.56, 77.34±2.29, 110.26±2.96, 224.69±6.53, 342.86±5.52 and 407.41±8.00 kg, respectively. The respective values for females and males were 34.75±0.72, 76.44±3.96, 108.33±4.27, 227.38±7.63, 342.86±5.52 and 412.80±6.67 kg, respectively and 38.12±0.74, 78.39±1.89, 111.52±4.08, 219.55±12.60 and 340.00±65.00 kg, respectively. Weight at first calving during the current year was 530.56±20.14 kg.
(f) Milk Production Performance: Buffaloes produced 107597 kg milk during the period
under report. Means for overall wet and herd averages were 6.80 and 4.49 kg, respectively. On an average, 65.15% of the total adult females were in the milk during this period. The means for total lactation milk yield, average lactation length, average 305 days’ yield and peak yield were 2188.82±55.81 kg, 288.81±8.02 days, 2135.85±51.77 kg and 10.89±0.31 kg, respectively. The means for fat, SNF and total solid % were 7.87, 9.92 and 17.78%, respectively (based on 636 samples during April-December, 2014).
11. Publications/Presentations: a. Research Papers : 7 b. Technical/popular articles : 2 c. Book Chapters : 1 d. Presentations In Conferences/Symposia/Seminars/Other Form: -Nil- e. Invited Lectures : 6
12. Expected Socio-economic impact in the tract: Surplus Murrah buffaloes along with breeding males have been sold in the public auction to the local dairy farmers. It will not only improve the milk and meat production in the field in the form of Murrah/graded Murrah progenies but will also uplift the socioeconomic status of the dairy farmers of northern India.
13. Constraints (if any): -None- 14. Focus of the work in the coming year:
a. To increase the number of elite buffaloes in the herd. b. To carry out the envisaged technical programme for fulfillment of laid down objectives. c. To distribute superior germ-plasm to the buffalo farmers in field. d. To establish a high yielding nucleus herd of Murrah buffaloes at IVRI Izatnagar.

54
Herd Performance Herd strength at the centre was 173 including 77 breedable buffaloes. During the report
period 63 calving were reported and calf mortality (0-3 months) was 1.54 % (1/65). Female conception rate was 51.96 % and 14th & 15th set bulls were used for test mating in the herd. Body weights at 24 months 412.80±6.67 (n=25) in female indicate good growth of the animals. Production performance in terms of 305 days or less day milk yield was 2136±51.77 (n=53) kg which was higher than the previous year record of 2038± 62.44 (n=47). Reproductive performance of the centre improved over the years. AFC at the centre was 37.64 ±1.33 (n=18) showing the better heifer management at the centre. Service period, Dry period and Calving Interval were 124±10.72 (n=55), 162.27±16.31 (n=44) and 439.48±15.97 (n=44) respectively. Wet & herd averages improved from the last year and these are reported as 6.80 kg and 4.49 kg, respectively. This improvement is > 1 kg in wet average and 0.90 kg in herd average over 2012-13. Out of 66 animals, 65% animals were in milk during the period.
Targets achieved during 2014-15
Sr. No.
Trait Target Achieved 1. Av. Age at first service (months) 24 m (300 kg. LBW) 28.21 (465.67) 2. Av. age at first calving 40 m 37.64 3. Av. age for initiating training of bulls (months) 18 m (350 kg) NA 4. Av. age at first collection 30 m (400 kg) NA 5. Av. service period 130 d 123.84 6. Calf mortality (0-3 months) ≤ 5% 1.54 7. Wet average ≥ 8.5 kg 6.80 8. Herd average ≥ 5.5 kg 4.49
Recommendations: Need to sustain the improvement shown during last two year in the performance traits.
Project Co-ordinator’s observations on centre performance

55
LLR UNIVERSITY OF VETY. & ANIMAL SCIENCES, HISAR (LUVAS)
1. Name of Centre: Buffalo Research Centre Department of Livestock Production Management
LUVAS, Hisar 2. Date of start: 1993 3. Objectives: To envisage and undertake progeny testing for improvement of Murrah breed of
buffaloes. Priority and emphasis will be on performance recording and improvement of breed and on semen quality testing laboratory.
4 Technical Program:The technical programme involves testing of 12-15 bulls on about 1000
breedable buffaloes at organized farms participating in this project in every 18-month’s cycle. From each bull 75-80 pregnancies are to be obtained so that 20-25 recorded daughters per bull are available at all the centers for the evaluation of bulls. The bulls will be ranked on the basis of performance of their daughters and 20% of them will be selected as proven bulls from each set. The semen of the proven bulls will be used on elite buffaloes at different centers for the production of future sires and herd replacements.
5. Financial statement:Statement of allotment and expenditure for the year 2014-15 as under:
Code 5508 C(b) LPM-3 ICAR SOE Allotment Expenditure Balance M&S 2665000 2662694 2306 OC 200000 199219 781 M&E 400000 399206 794 TA 60000 50376 9624 POL 10000 9805 195 OE (O) 5000 Nil 5000 Electrical 320000 320000 Nil Total 36,60,000 36,41,300 18,700 6. Staff position 1 Dr. Harish Kr. Gulati, Professor & Head LPM and PI NWP on Buffalo Improvement
2 Dr. Dipankar Kar, Sr. Scientist, CO-PI NWP on Buffalo Improvement 3. Dr. S.K. Chhikara, Scientist, Department of LPM 4. Dr. Vishal Sharma, Assistant Professor, I/c Animal Health Department of LPM 5 Dr.R.K.Malik, Scientist, Department of VPB and Dr. S.S. Sahu, Assistant Professor, Department of LPM is looking after Animal Reproduction.
7. Herd performance As stated below in table 9.1 to 9.21.

56
9.1 Herd Strength During the Period 4/2014 to 3/2015
OB = Opening Balance D = Death S = Sale B = Birth T = Transfer CB = Closing Balance P = Purchase
9.2 Calving Statistics During the Period 4/2014 to 3/2015
Month Male Female Still birth/ abortion
Overall No. % No. % No. % No. %
April 2014 5 6.66 3 4.00 8 10.66 May 2014 4 5.33 3 4.00 1 1.33 7 9.33 June 2014 1 1.33 0 0 1 1.33 July 2014 4 5.33 1 1.33 5 6.66 Aug. 2014 3 4.00 4 5.33 7 9.33 Sept. 2014 6 8.00 6 8.00 12 16.00 Oct. 2014 2 2.66 7 9.33 9 12.00 Nov. 2014 7 9.33 3 4.00 10 13.33 Dec. 2014 2 2.66 5 6.66 7 9.33 Jan. 2015 2 2.66 3 4.00 1 1.33 5 6.66 Feb. 2015 0 0 2 2.66 2 2.66 Mar. 2015 0 0 2 2.66 2 2.66 Overall 36 48.00 39 52.00 75 100.00
Sex ratio (Male : Female ) = 36: 39
Category OB Addition Disposal CB S.No B P T D T S
Female 1 Female Calves < 3 months 4 39 1 -35 - 7 2 Female Calves 3-6 months 11 +35 - -32 - 14 3 Female Calves 6-12 months 18 +32 - -33 - 17 4 Heifers above 1-2 years
2-2.5 years >2.5 years
41 9 27
+33 +41 +35
- - -
-41 -35 -19
- - 4
33 15 39
5 Buffaloes 96 +19 1 - 14 100 Sub Total 206 2 - 18 225
Male 1 Male Calves < 3 months 6 36 5 -32 3 2 2 Male Calves 3-6 months 11 +32 -31 4 8 3 Male Calves 6-12 months 14 +31 1 -19 13 12 4 Growing Bulls 1-2 years
>2 years 9 2
+19 +3
1 -
-3 -2
9 -
15 3
5 Breeding Bulls Nil - - - - - 6 Teasers 2 +2 - - - 4 7 Bullocks - - - - - - Sub Total 44 - 7 - 29 44 Grand Total 250 9 9 - 47 269

57
9.3 Disposal of Animals During the Period 4/2014 to 3/2015 Female
Category Surplus Repd. Problem
Weak & Old
Death Research purpose
Off Breed /Others
Total Female Calves <6 months 6-12 months
- -
- -
- -
1 -
- -
- -
1 -
Heifers 1-2.5 years > 2.5 years
- -
- -
- -
- -
- -
- 4
- 4
Buffaloes 1 2 - 1 2 9 15 Sub Total 1 2 - 2 2 13 20
Males 1 Male Calves < 6 months 6-12 months
- 6
- -
- -
5 1
5 5
- -
10 12
2 Above 1 year 13 - - 1 - - 14 3 Young Bulls - - - - - - - 4 Breeding bulls - - - - - - - 5 Teaser bulls - - - - - - - Sub Total 19 - - 7 10 - 36 Grand .Total 20 2 - 9 12 13 56
9.4 Month-wise Mortality During the Period 4/2014 to 3/2015 Month Female Male Over
All Group 0-3
month 3-6
month 6-12
month 1-2
years Above 2 year
Total 0-3 month
3-6 month
6-12 month
Above 1 year
Total Over all
No Died
% 1 - -
- - -
- - -
- - -
1 - -
2 - -
6 - -
1 - -
- - -
- - -
7 - -
9 - -
Calf mortality (0-3 months) was 8.23 percent (7/85). 9.5 Causes of Mortality (quarter-wise) During the Period 4/2014 to 3/2015 S.
No. Particulars 1st
Quarter. 2nd.
Quarter. 3rd.
Quarter. 4th.
Quarter. Total
A Respiratory System 1 Pneumo-Enteritis - - 2 1 3 2 Broncho-Pneumonia - - - 1 1 B Digestive System - - - - - 1 Enteritis - - - - - 2 Septicemia & Toxemia - 1 - - 1 3 Peritonitis - - - - - 4 Gastro-enteritis - - - 1 1 5 Hepatitis 1 - - - 1 6 Haemo-enteritis - - - 1 1 C Circulatory System - - - - - D Others - - - - - 1 Miscellaneous. 1 - - - 1
Total 2 1 2 4 9

58
9.6 Prophylactic Measures Taken During the Period 4/2014 to 3/2015 Vaccination No. of animals Screening No. of animals No. of animals
treated for parasitism Available Inoculated Tested Result
FMD Whole herd (Once a year)
Whole herd (Once a year)
TB - - All calves up to the age of 1 year at regular interval.
HS Whole herd (Once a year)
Whole herd (Once a year)
JD - - BQ - - - - - RP - - Mastitis - - Brucellosis - - Others - -
9.7 Calving Abnormalities (quarter wise) During the Period 4/2014 to 3/2015
Qtr No. of Calves
Dystokia Retention of placenta
Prolapse Others (Still birth )
Abortion
Total No % No % No % No % No % No % I 16 - - - - - - - - 1 1.33 16 1.33 II 24 - - - - - - - - - - 24 - III 26 - - - - - - - - - - 26 - IV 9 - - - - - - 1 1.33 - - 9 1.33 Overall 75 - - - - - - 1 1.33 1 1.33 75 2.66
9.8 Female Conception Rate during 4/2014 to 3/2015
No. of Services Parity I II III IV & Above Overall
I C CR I C CR I C CR I C CR I C CR Heifer 41 16 39 20 6 30 15 6 40 11 3 27.3 87 31 36% Buffs. 117 48 41 47 18 38.3 21 7 33.3 22 10 45.5 207 83 40% Overall 158 64 40.5 67 24 35.8 36 13 36.1 33 13 39.4 294 114 38.8% I = No. of animals inseminated, C= No. of animals conceived, CR= % Conception rate. No. of Services / Conception =2.5:1 9.9 Bull-wise Conception Rate During the Period 4/2014 to 3/2015
S.No. Bull No. Total No. of AIs. Total Conceived CR% 1 E1994 (14 set) 5 1 20.0 2 6136(14 set) 15 8 53.3 3 6066(14 set) 11 4 36.4 4 2417(15 set) 18 3 16.7 5 2371(15 set) 20 8 40.0 6 2412(15 set) 29 14 48.3 7 2429(15 set) 12 3 25.0 8 E2045 (15 set) 42 16 38.0 9 E1693 (15 set) 21 11 52.4 10 6290 (15 set) 11 2 18.2 11 6007(15 set) 15 3 20.0 12 6139(15 set) 11 6 54.5 13 2459(15 set) 4 2 50.0 14 6405(15 set) 22 10 45.5 15 4328(15 set) 23 11 47.8 16 4354(15 set) 7 4 57.2 17 4438(15 set) 13 3 23.0 18 4363(15 set) 8 4 50.0 19 6014(14 set) 7 1 14.3 Total 294 114 38.8

59
9.10 Bull-wise Semen Stock During the Period 4/2014 to 3/2015 S.No. Bull No. Set No. Opening
balance Semen produced/
Received Consumption AI/Supplied
Balance 1 E1693 15th - 100 75 25 2 1994 14th 26 10 36 - 3 E 2045 15th - 150 125 25 4 2369 14th 4 - 4 - 5 2371 15th - 50 50 - 6 2412 15th - 100 100 - 7 2417 15th - 150 65 85 8 2429 15th - 75 75 - 9 2459 15th - 50 30 20 10 4324 15th - 100 80 20 11 4354 15th - 100 84 16 12 4363 15th - 100 35 65 13 4438 15th - 100 50 50 14 6007 15th - 50 50 - 15 6014 14th 34 - 34 - 16 6044 14th 6 - 6 - 17 6066 14th 30 - 30 - 18 6136 14th 40 - 40 - 19 6139 15th - 50 50 - 20 6290 15th - 50 50 - 21 6405 15th - 50 50 - Total 140 1285 1119 306 9.11 Body Weights of Animal During the Period 4/2014 to 3/2015
Age No of animals N Body weights (kg.) X SE Females
Birth 39 36.2 0.34 3 months 32 63.2 0.37 6 months 29 84.2 0.18 12 months 17 155.1 8.3 18 months 18 219.0 0.23 24 months 10 316.6 6.9 Adult(At 1st Calving) 17 511 12.1
Males Birth 36 38.3 0.53 3 months 28 64.4 0.49 6 months 28 85.6 0.08 12 months 8 194.0 1.73 18 months 8 276.3 28.3 24 months 15 335.2 7.4 Adult Bulls - - -

60
9.11.1 Body Weights since Inception of Network Project.
Year At Birth 3 months 6 months 12 months 18 months 24 months At FC 1994-95 34.0 62.8 97.1 150.7 203.2 262.5 470.03 1995-96 36.48 51.20 77.89 106.75 138.79 191.28 448.08 1996-97 35.26 53.7 90.5 118.65 146.59 206.49 423.18 1997-98 36.65 55.7 94.25 123.75 148.42 217.1 439.53 1998-99 36.87 55.94 94.4 112.31 149.94 217.1 439.53 1999-00 35.43 57.11 102.1 139.27 163.66 241.97 417.74 2000-01 39.49±3.25 59.52±4.93 104.76±7.13 134.02±10.39 164.69±13.32 237.38±25.27 494.59±11.58 2001-02 37.6±0.06 5085±0.06 84.69±0.10 167.9±0.42 238.6±2.08 300.97±3.84 470.1±13.57 2002-03 37.3±0.53 74.8±4.02 105.9±7.56 177.0±7.9 259.5±9.3 -- 457.4±5.8 2003-04 37.2±0.61 74.8±4.03 105.9±6.96 177.0±8.04 259.6±9.07 345.1±19.02 457.4±5.81 2004-05 36.7±0.58 74.8±3.89 105.4±6.63 183.7±7.95 260.6±8.67 341.0±19.04 459.2±5.75 2005-06 35.8±0.61 64.3±1.20 89.9±3.59 140.1±6.93 190.6±9.94 295.6±9.29 463.8±17.39 2006-07 36.8±0.91 71.2±1.25 103.2±1.88 141.5±3.97 181.9±6.33 262.5±5.32 467.4±9.87 2007-8 36.6±0.06 66.2±0.25 105.8±0.45 201.6±3.78 249.0±10.54 302.7±4.89 463.2±9.18 2008-09 36.3±0.6 66.4±1.78 94.5±3.02 146.7±6.19 184.2±2.96 246.6±5.89 459.4±5.69 2009-10 36.6±0.5 70.8±0.97 105.0±5.59 154.4±4.73 199.8±7.63 244.2±3.71 502.5±11.6 2010-11 35.8±0.4 72.3±5.0 108.0±6.6 166.4±7.3 209.3±8.61 287.9±7.5 522.9±5.61 2011-12 35.0±0.6 68.5±4.2 101.6±6.4 175.6±4.7 269.6±6.3 311.6±11.1 512.6±7.4 2012-13 36.4±0.55 68.2±0.45 105.1±4.89 189.2±5.25 278.4±7.1 302.8±4.1 528.7±7.1 2013-14 36.1±0.38 76.2±2.92 122.7±5.48 185.5±6.0 280.5±8.4 326±7.8 521.4±6.16 2014-15 37.2±0.43 63.8±0.43 84.9±0.13 174.5±5.0 247.6±14.26 325.9±7.15 511±12.1
9.12 Production Performance During the Period 4/2014 to 3/2015
Lact. No. Avg. Lact. Yield (kg.)
Avg. Lact. Length (days)
305 days Yield ( kg.)
Avg Peak Yield ( kg.)
Ist. No. Mean
SE 29
2617.3 78.64
29 310.4 9.15
29 2547.8 68.6
29 12.24 0.19
II nd. No. Mean
SE 18
2595.1 85.22
18 287.6 9.09
18 2562.4 97.7
18 13.2 0.24
III rd. No. Mean
SE 5
2615.6 253.48
5 286.2 23.64
5 2560.0 234.2
5 13.5 0.44
IVth. No. Mean
SE 7
2963.1 187.96
7 323.28 20.72
7 2838.75 177.90
7 14.8 0.25
Vth No. Mean
SE 3
2573.1 14.74
3 247.3 9.67
3 2573.23
14.69 3
13.06 0.43
VI th. & above
No. Mean
SE - - -
- - -
- - -
- - -
Overall No. Mean
SE 62
2653.4 55.34
62 300.2 6.29
62 2584.4 49.45
62 12.9 0.16
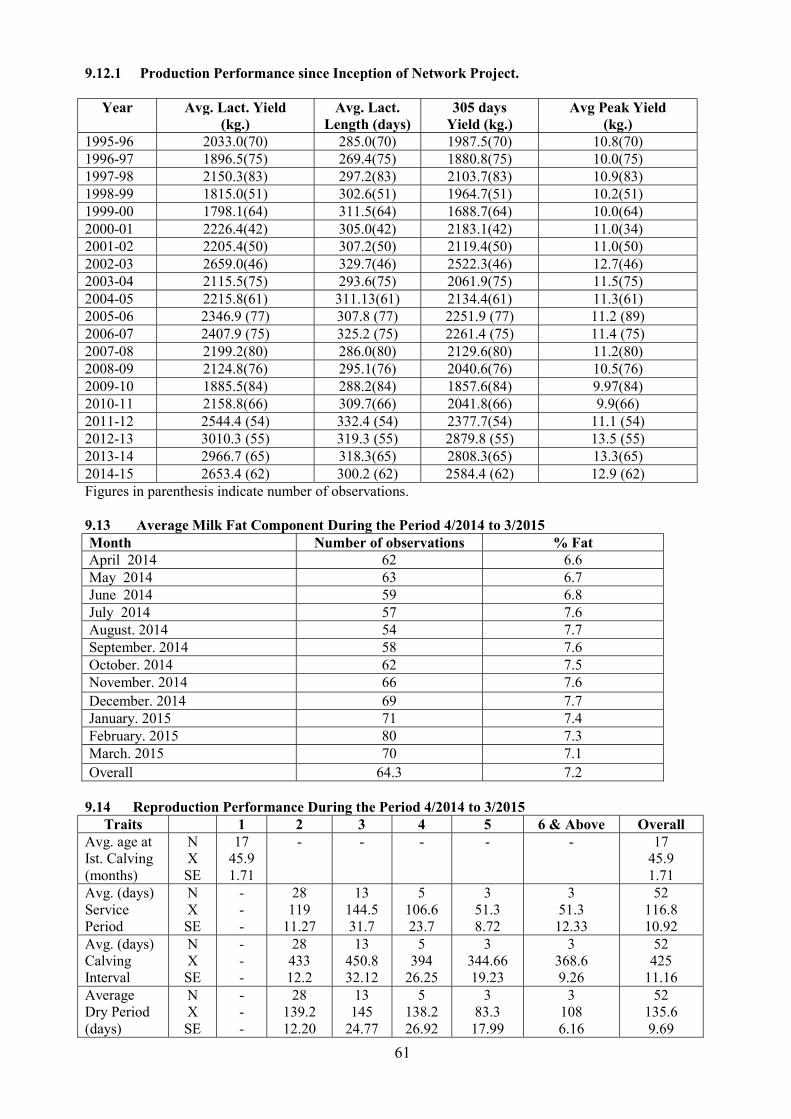
61
9.12.1 Production Performance since Inception of Network Project.
Year Avg. Lact. Yield (kg.)
Avg. Lact. Length (days)
305 days Yield (kg.)
Avg Peak Yield (kg.)
1995-96 2033.0(70) 285.0(70) 1987.5(70) 10.8(70) 1996-97 1896.5(75) 269.4(75) 1880.8(75) 10.0(75) 1997-98 2150.3(83) 297.2(83) 2103.7(83) 10.9(83) 1998-99 1815.0(51) 302.6(51) 1964.7(51) 10.2(51) 1999-00 1798.1(64) 311.5(64) 1688.7(64) 10.0(64) 2000-01 2226.4(42) 305.0(42) 2183.1(42) 11.0(34) 2001-02 2205.4(50) 307.2(50) 2119.4(50) 11.0(50) 2002-03 2659.0(46) 329.7(46) 2522.3(46) 12.7(46) 2003-04 2115.5(75) 293.6(75) 2061.9(75) 11.5(75) 2004-05 2215.8(61) 311.13(61) 2134.4(61) 11.3(61) 2005-06 2346.9 (77) 307.8 (77) 2251.9 (77) 11.2 (89) 2006-07 2407.9 (75) 325.2 (75) 2261.4 (75) 11.4 (75) 2007-08 2199.2(80) 286.0(80) 2129.6(80) 11.2(80) 2008-09 2124.8(76) 295.1(76) 2040.6(76) 10.5(76) 2009-10 1885.5(84) 288.2(84) 1857.6(84) 9.97(84) 2010-11 2158.8(66) 309.7(66) 2041.8(66) 9.9(66) 2011-12 2544.4 (54) 332.4 (54) 2377.7(54) 11.1 (54) 2012-13 3010.3 (55) 319.3 (55) 2879.8 (55) 13.5 (55) 2013-14 2966.7 (65) 318.3(65) 2808.3(65) 13.3(65) 2014-15 2653.4 (62) 300.2 (62) 2584.4 (62) 12.9 (62) Figures in parenthesis indicate number of observations. 9.13 Average Milk Fat Component During the Period 4/2014 to 3/2015 Month Number of observations % Fat April 2014 62 6.6 May 2014 63 6.7 June 2014 59 6.8 July 2014 57 7.6 August. 2014 54 7.7 September. 2014 58 7.6 October. 2014 62 7.5 November. 2014 66 7.6 December. 2014 69 7.7 January. 2015 71 7.4 February. 2015 80 7.3 March. 2015 70 7.1 Overall 64.3 7.2
9.14 Reproduction Performance During the Period 4/2014 to 3/2015
Traits 1 2 3 4 5 6 & Above Overall Avg. age at Ist. Calving (months)
N X SE
17 45.9 1.71
- - - - - 17 45.9 1.71
Avg. (days) Service Period
N X SE
- - -
28 119
11.27 13
144.5 31.7
5 106.6 23.7
3 51.3 8.72
3 51.3 12.33
52 116.8 10.92
Avg. (days) Calving Interval
N X SE
- - -
28 433 12.2
13 450.8 32.12
5 394
26.25 3
344.66 19.23
3 368.6 9.26
52 425
11.16 Average Dry Period (days)
N X SE
- - -
28 139.2 12.20
13 145
24.77 5
138.2 26.92
3 83.3 17.99
3 108 6.16
52 135.6 9.69

62
9.14.1 Reproduction Performance since Inception of Network Project.
Year AFC ( DAYS\ months) Average
Service Period (days)
Average Dry Period
(days) Average
Calving Interval (days)
1993-94 1570.2 107.5 - - 1994-95 1560.6 163.1 132.7 459.5 1995-96 1575.8(26) 135.0(54) 161.0(36) 456.0(40) 1996-97 1438.2(44) 107.0(63) 109.7(31) 408.5(76) 1997-98 1480.4(28) 107.7(55) 143.1(55) 389.2(55) 1998-99 1439.5(22) 108.7(47) 156.0(38) 417.2(46) 1999-00 1502.0(15) 148.3(49) 148.6(49) 459.0(49) 2000-01 1540.0(17) 146.0(25) 137.0(25) 479.6(25) 2001-02 1400.1(14) 147.0(31) 128.0(31) 457.0(31) 2002-03 47.01 months (27) 165.3(47) 156.4(47) 472.1(47) 2003-04 40.4(40) 87.6(42) 115.9(42) 396.4(42) 2004-05 40.0(26) 95.8(52) 128.0(52) 402.2(52) 2005-06 41.0 (31) 147.8 (128) 156.2(26) 454.8(128) 2006-07 41.8 (15) 165.2 ( 60 ) 162.6 (64) 472.5(60) 2007-08 44.4 (30) 164.9(57) 147.1(57) 467.2(57) 2008-09 48.4 (54) 139.1(54) 146.0(54) 444.0(54) 2009-10 45.7 (27) 156.86(68) 163.6(68) 459.3(68) 2010-11 45.8(33) 155.38(38) 160.3(38) 461.8(38) 2011-12 46.0 (23) 154.0 (47) 147.8 (47) 462.8 (47) 2012-13 46 (39) 112.1 (36) 100.8 (36) 411 (36) 2013-14 43.6 (33) 118.0(39) 119.8 (39) 423 (39) 2014-15 45.9 (17) 116.8 (52) 135.6 (52) 425 (52) Figures in parenthesis indicate number of observations 9.15 Milk Production and Disposal During the Period 4/2014 to 3/2015
Month
Total milk produced (kg.)
Disposal Liquid Milk (kg.) Calf Feeding (kg) Expt
April 2014 15773 13373 2400 - May 2014 15869 13539 2330 - June 2014 14734 12514 2220 - July 2014 13794 11502 2292 - Aug. 2014 12726 10536 2190 - Sept. 2014 13326 11380 1946 - Oct. 2014 15701 13957 1744 - Nov. 2014 17521 15529 1992 - Dec. 2014 18289 16365 1924 - Jan. 2015 18965 17105 1860 - Feb. 2015 18057 16377 1680 - Mar. 2015 19962 17492 2470 - Overall (Av.) 16226 14139 2087 -

63
9.16 Feed & Fodder (Qtls.) During the Period 4/2014 to 3/2015 Quarter Item Quantity
Produced Quantity
Purchased Actually
Fed Balance
I Green
Dry Silage Concentrate
3886.0 700.0
- 656.40
- - - -
3886.0 700.0
- 656.40
- - - -
II Green Dry Silage Concentrate
2847.0 584.0
- 839.81
- - - -
2847.0 584.0
- 839.81
- - - -
III Green Dry Silage Concentrate
4221.0 584.0
- 682.20
- - - -
4221.0 584.0
- 682.20
- - - -
IV Green Dry Silage Concentrate
5110.0 590.0
- 990.60
- - - -
5110.0 590.0
- 990.60
- - - -
Total Green Dry Silage Concentrate
16064.0 2458.0
- 3169.0
- - - -
16064.0 2458.0
- 3169.0
- - - -
9.17 Milking Performance During the Period 4/2014 to 3/2015 Month
No. of animals (in milk)
No. of animals (Dry)
Total animals
Animals in milk
(%) Wet
Average (kg)
Herd Average
(kg) April 2014 62 39 101 61.4 9.3 5.7 May 2014 63 34 97 64.9 9.2 6.0 June 2014 59 36 95 62.1 9.1 5.7 July 2014 57 39 96 59.4 8.4 5.0 Aug. 2014 54 43 97 55.6 8.0 4.5 Sept. 2014 58 42 100 58.0 7.5 4.4 Oct. 2014 62 38 100 62.0 8.2 5.2 Nov. 2014 66 37 103 64.0 8.9 5.8 Dec. 2014 69 35 104 66.3 8.6 5.7 Jan. 2015 71 33 104 68.3 8.8 6.0 Feb. 2015 80 21 101 79.2 8.4 6.7 Mar. 2015 70 30 100 70.0 9.5 6.7 Overall (Av.) 64.25 35.58 99.83 64.26 8.7 5.6
9.17.1 Milking Performance since Inception of Network Project. Month
No. of animals (in milk)
No. of animals (Dry)
Total animals
Animals in milk
(%) Wet
Average (kg)
Herd Average
(kg) 1993-94 42 43 85 49.0 6.3 3.8 1994-95 49 39 88 55.7 7.2 3.4 1995-96 53 39 92 57.1 7.3 4.0 1996-97 76 46 122 62.4 7.0 4.3 1997-98 68 36 104 65.4 6.5 3.7 1998-99 71 27 98 70.0 6.2 4.2
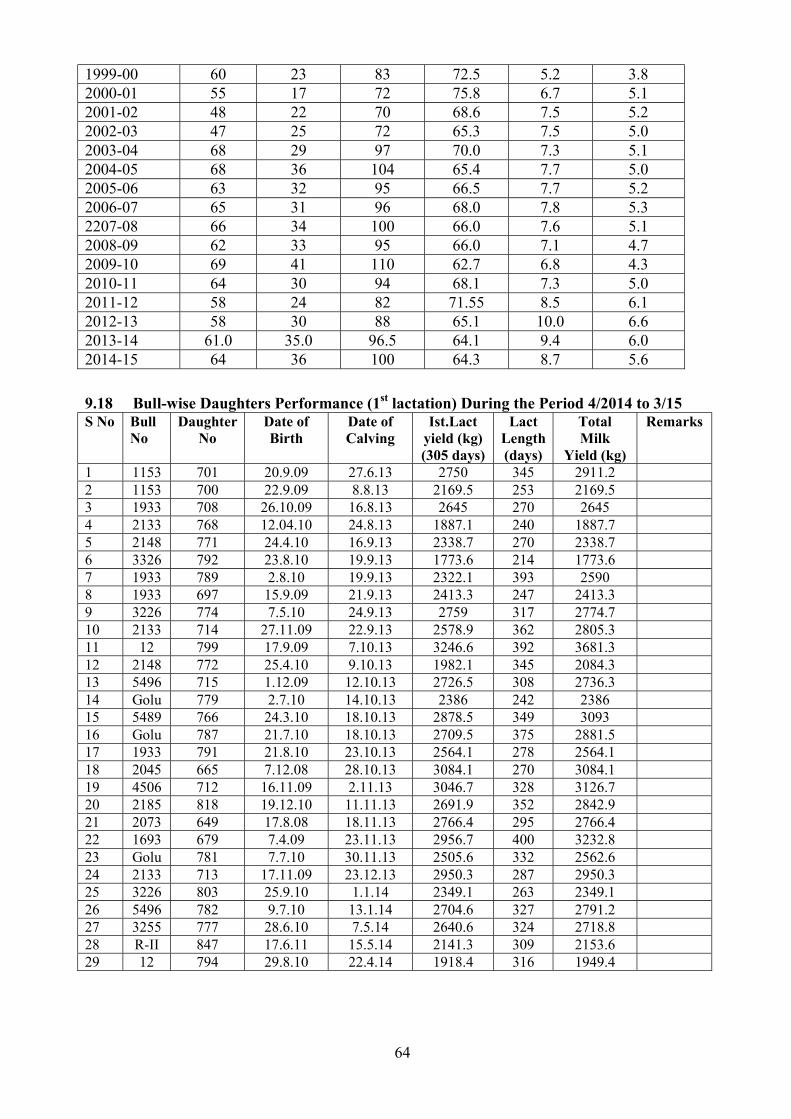
64
1999-00 60 23 83 72.5 5.2 3.8 2000-01 55 17 72 75.8 6.7 5.1 2001-02 48 22 70 68.6 7.5 5.2 2002-03 47 25 72 65.3 7.5 5.0 2003-04 68 29 97 70.0 7.3 5.1 2004-05 68 36 104 65.4 7.7 5.0 2005-06 63 32 95 66.5 7.7 5.2 2006-07 65 31 96 68.0 7.8 5.3 2207-08 66 34 100 66.0 7.6 5.1 2008-09 62 33 95 66.0 7.1 4.7 2009-10 69 41 110 62.7 6.8 4.3 2010-11 64 30 94 68.1 7.3 5.0 2011-12 58 24 82 71.55 8.5 6.1 2012-13 58 30 88 65.1 10.0 6.6 2013-14 61.0 35.0 96.5 64.1 9.4 6.0 2014-15 64 36 100 64.3 8.7 5.6 9.18 Bull-wise Daughters Performance (1st lactation) During the Period 4/2014 to 3/15 S No Bull
No Daughter
No Date of Birth
Date of Calving
Ist.Lact yield (kg) (305 days)
Lact Length (days)
Total Milk
Yield (kg) Remarks
1 1153 701 20.9.09 27.6.13 2750 345 2911.2 2 1153 700 22.9.09 8.8.13 2169.5 253 2169.5 3 1933 708 26.10.09 16.8.13 2645 270 2645 4 2133 768 12.04.10 24.8.13 1887.1 240 1887.7 5 2148 771 24.4.10 16.9.13 2338.7 270 2338.7 6 3326 792 23.8.10 19.9.13 1773.6 214 1773.6 7 1933 789 2.8.10 19.9.13 2322.1 393 2590 8 1933 697 15.9.09 21.9.13 2413.3 247 2413.3 9 3226 774 7.5.10 24.9.13 2759 317 2774.7 10 2133 714 27.11.09 22.9.13 2578.9 362 2805.3 11 12 799 17.9.09 7.10.13 3246.6 392 3681.3 12 2148 772 25.4.10 9.10.13 1982.1 345 2084.3 13 5496 715 1.12.09 12.10.13 2726.5 308 2736.3 14 Golu 779 2.7.10 14.10.13 2386 242 2386 15 5489 766 24.3.10 18.10.13 2878.5 349 3093 16 Golu 787 21.7.10 18.10.13 2709.5 375 2881.5 17 1933 791 21.8.10 23.10.13 2564.1 278 2564.1 18 2045 665 7.12.08 28.10.13 3084.1 270 3084.1 19 4506 712 16.11.09 2.11.13 3046.7 328 3126.7 20 2185 818 19.12.10 11.11.13 2691.9 352 2842.9 21 2073 649 17.8.08 18.11.13 2766.4 295 2766.4 22 1693 679 7.4.09 23.11.13 2956.7 400 3232.8 23 Golu 781 7.7.10 30.11.13 2505.6 332 2562.6 24 2133 713 17.11.09 23.12.13 2950.3 287 2950.3 25 3226 803 25.9.10 1.1.14 2349.1 263 2349.1 26 5496 782 9.7.10 13.1.14 2704.6 327 2791.2 27 3255 777 28.6.10 7.5.14 2640.6 324 2718.8 28 R-II 847 17.6.11 15.5.14 2141.3 309 2153.6 29 12 794 29.8.10 22.4.14 1918.4 316 1949.4

65
9.19 Bull-wise Daughters Completing 1st Lactation During the Period 4/2014 to 3/15 S. No
Bull No
Daughter born
Daughters Reaching
AFC Daughters
Completing Ist. Lactation
Last Lactation
1 2177 - 2 - - 2 1153 - 1 2 1st 3 12 - 4 2 1st 4 3255 - 2 1 1st 5 2045 - 1 1 1st 6 R-11 - 2 1 1st 7 3591 - 1 1 1st 8 4506 - 1 - - 9 Khurana - 1 - - 10 3898 - 1 - - 11 220 - 1 - - 12 29M45 1 - - - 13 B-1 330 5 - - - 14 70577 14 - - - 15 2369 3 - - - 16 2557 2 - - - 17 6014 3 - - - 18 6044 4 - - - 19 1944 1 - - - 20 6136 2 - - - 21 PC461 4 - - - 22 1933 - - 4 1st 23 2133 - - 3 1st 24 2148 - - 2 1st 25 3326 - - 1 1st 26 3226 - - 2 1st 27 5496 - - 2 1st 28 Golu - - 3 1st 29 5489 - - 1 1st 30 2185 - 7 1 1st 31 2073 - - 1 1st 32 1693 - - 1 1st Total 39 17 29 - 9.20 List of Pre-Selected Breeding/Young Bulls as on 31.03.2015 Sr. No.
Bull No.
Date of Birth
Dam No.
Sire No.
Dam’s best lact. 305/ less days
Milk Yield ( kg) Total Yield/ lact. length
Remarks
1 1011 26.8.13 548 70577 3343/III 3343.9/308 2 1027 28.9.13 603 PC461 3763/IV 3776.2/309 3 1052 11.12.13 663 29M45 3226/I 3707/408 4 1053 17.12.13 683 29M45 3559/I 3559.0/300 5 1059 13.1.14 782 B-1-330 2705/I 2791.0/327 6 1062 18.2.14 648 29M45 3126/I 3560.5/388

66
9.21 Targets Achieved During the Year 2014-15 Sr. No.
Trait Target Fixed
Achieved ( 2014-15)
1 Av. Age at first Ist. Service ( months ) 24.0 months 27.8 months 2 Av. Age at first Ist. Calving ( months ) 40.0 months 45.9 months 3 Av. Age for initiating training of bulls ( months ) - - 4 Av. Age at first Ist. Collection - - 5 Av. Service Period. 130 days 116.8 days 6 Calf Mortality ( 0-3 months ) ≤ 5% 8.23 % 7 Wet Average (kg) ≥ 8.5 kg 8.7 Kg 8 Herd Average (kg) ≥ 5.5 kg 5.6 Kg 10. Salient Research Achievements: The Buffalo Research Centre envisages quantification of
management practices for livestock since 1983, which also envision evaluation of Murrah breed buffaloes and proven sires started from the year 1993. The center has been making steady progress in meeting out the objectives of the Network Project which are reflected in the Animal Progress Report.
11. Expected socio-economic impact in the tract: Breeding bulls will be sold to Panchayats in the field/villages for improvement of Murrah Buffaloes.
12 Focus of work in the coming year: To increase the elite number of buffaloes in the herd To carryout the envisaged technical programme of the project for fulfillment of the laid
down objectives. To establish a high yielding herd of murrah buffaloes. 13 Constraints: Since, the cost of feed ingredients has increased many fold, more budgetary provision
for this centre should be provided. Budget should be provided to hire contractual literate manpower as well as labour to carryout farm work effectively and efficiently. More budget should be provided in Non recurring contingency to Purchase/ installation of a Weigh bridge which is must on the farm. Budget for renovation of old existing animal sheds & for the purchase of a new tractor (as the existing one is pretty old and needs to be disposed off.) should be provided. Some budget should be provided for the installation of showers in animal sheds etc.
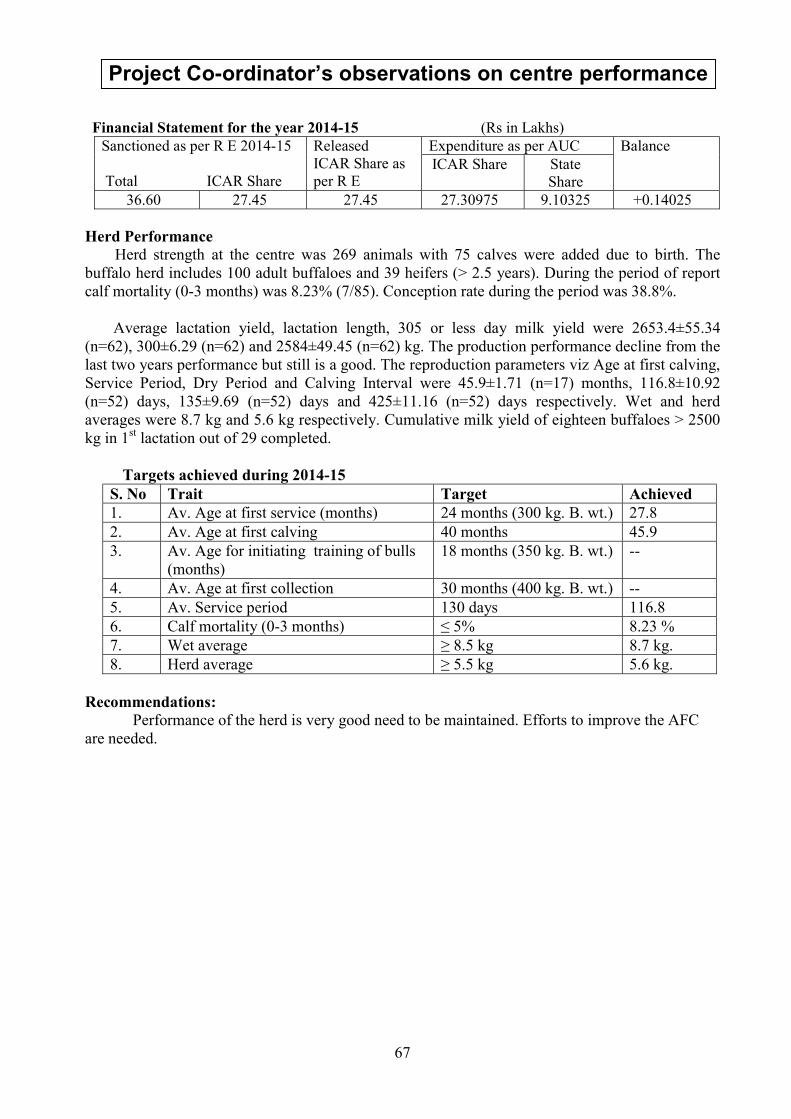
67
Financial Statement for the year 2014-15 (Rs in Lakhs) Sanctioned as per R E 2014-15 Total ICAR Share
Released ICAR Share as per R E
Expenditure as per AUC Balance ICAR Share State
Share 36.60 27.45 27.45 27.30975 9.10325 +0.14025
Herd Performance Herd strength at the centre was 269 animals with 75 calves were added due to birth. The buffalo herd includes 100 adult buffaloes and 39 heifers (> 2.5 years). During the period of report calf mortality (0-3 months) was 8.23% (7/85). Conception rate during the period was 38.8%.
Average lactation yield, lactation length, 305 or less day milk yield were 2653.4±55.34
(n=62), 300±6.29 (n=62) and 2584±49.45 (n=62) kg. The production performance decline from the last two years performance but still is a good. The reproduction parameters viz Age at first calving, Service Period, Dry Period and Calving Interval were 45.9±1.71 (n=17) months, 116.8±10.92 (n=52) days, 135±9.69 (n=52) days and 425±11.16 (n=52) days respectively. Wet and herd averages were 8.7 kg and 5.6 kg respectively. Cumulative milk yield of eighteen buffaloes > 2500 kg in 1st lactation out of 29 completed.
Targets achieved during 2014-15
S. No Trait Target Achieved 1. Av. Age at first service (months) 24 months (300 kg. B. wt.) 27.8 2. Av. Age at first calving 40 months 45.9 3. Av. Age for initiating training of bulls
(months) 18 months (350 kg. B. wt.) --
4. Av. Age at first collection 30 months (400 kg. B. wt.) -- 5. Av. Service period 130 days 116.8 6. Calf mortality (0-3 months) ≤ 5% 8.23 % 7. Wet average ≥ 8.5 kg 8.7 kg. 8. Herd average ≥ 5.5 kg 5.6 kg.
Recommendations: Performance of the herd is very good need to be maintained. Efforts to improve the AFC are needed.
Project Co-ordinator’s observations on centre performance

68
LIVESTOCK RESEARCH STATION, MAMNOOR
1. Name of center : Sri P.V. Narsimha Rao Telangana State University For Veterinary, Animal & Fishery Sciences
Livestock Research Station, Mamnoor – 506 166 2. Project Code : 18-3/97, ASR – II Dated 29.3.2001 3. Project Title : Network Project on Buffalo Improvement 4. Date of Start : 1.4.2012 5. Objectives : 6. Technical Programme: Performance recording farm & field PT 7. Financial Statement : Receipts : Rs. 11,97,504/-
Item of Expenditure
Budget Provision for 2014-15
Actual Expenditure from 01-04-14 to 31-03-15
Anticipated Expenditure for 1st half from 01-04-15 to 30-09-15
Progressive total (3+4)
1 2 3 4 5 1. Pay of Estt. 14,00,000 13,90,201 10,00,000 23,90,201 2. T.A. 1,00,000 78,166 75,000 1,53,166 3. Recurring Contingencies 22,00,000 30,39,154 20,00,000 50,39,154 4. Non- Recurring Contingencies 2,00,000 1,99,932 5,00,000 6,99,932 Total : 39,00,000 47,07,453 35,75,000 82,82,453
8. Staff and Infrastructure Buildup during the year : SNo
Category / Designation No. of Posts
Sanctioned No. of Posts
Filled No. of Posts
Vacant SCIENTIFIC 1 Associate Professor 1 1 - 2 Assistant Research Scientist 1 - 1 TECHNICAL 3 Technical Assistant (Lab) 1 1 0

69
9. Herd Performance: 9.1. Herd strength during the period 4/2013 to 3/2014 SN Category Addition Disposal
OB B/P T D T S CB Female 1. Calves < 3 months - 20 - - 20 - 0 2. Calves 3-6 months - - 20 1 11 - 8 3. Calves 6-12 months 4 - 11 - 4 - 11 4 Heifers 1-2 Years 4 - 4 - 4 - 4 Heifers 2-2.5 Years 3 - 4 - 7 - 0 Heifers > 2.5 Years 3 - 7 - - - 10
5. Buffaloes in Milk 11 2 34 1 10 - 36 6. Buffaloes Dry 20 18 10 - 34 - 14 Pregnant 13 - - - 5 - 8 Non- Pregnant 7 - - 1 - 6 Sub Total 45 40 - 2 - - 83
Male 1. Male below 3 months - 15 - - 11 - 4 2. Males 3-6 months 3 - 11 - 10 - 4 3. Males 6-12 months 4 - 10 - 7 - 7 4 1-2 Years 3 - 7 - 3 - 7 > 2 Years - - 3 - - - 3
5. Breeding bulls - - - - - - - 6. Bullocks - - - - - - - 7. Teasers 2 - - - - - 2 Sub Total 12 15 - - 31 - 27 Grand Total 57 55 - 2 - - 110
OB = Opening Balance D = Deaths S = Sale B/P = Births/Purchase T = Transfer CB = Closing Balance
9.2. Calving statistics during the period 4/2014 to 3/2015 Month Male Female Still birth Overall
No. % No. % No. % No. % April, 2014 - - 1 5.0 - 1 2.94 May - - - - - - - June - - 1 5.0 - 1 2.94 July 2 15.38 6 30.0 - 8 23.52 August 1 7.69 3 15.0 1 100.0 5 14.70 September 2 15.38 0 - - 2 5.88 October - - 2 10.0 - 2 5.88 November 4 30.77 6 30.0 - 10 29.41 December - - 1 5.0 - 1 2.94 January, 15 4 30.77 - - - 4 11.76 February - - - - - - - March - - - - - - - Overall 13 38.23 20 58.82 1 2.94 34 100.0 Sex ratio= Male: Female = 1:2

70
9. 3. Disposal of animals during the period 4/2014 to 3/2015 Females Sr. No.
Category Surplus Reprod. Problem
Weak & Old Death Experi-mental
purposes Total
Female 1. Calves 3 - 6 months - - - - - - < 6 months - - - 1 - 1 6-12 months - - - - - 2. Heifers 1-2.5 Years - - - - - - > 2.5 Years - - - - - - 3. Buffaloes Dry - - - 1 - 1 Milch - - - - - - Sub Total - - - 2 - 2 Males 1. Male Calves - - - - - - < 6 months - - - - - - 6-12 months - - - - - - 2. Above 1 year - - - - - - 3. Young Bulls - - - - - - 4. Breeding Bulls - - - - - - 5. Bullock + Teasers - - - - - - Sub Total - - - - - - Grand Total - - - 2 - 1 9.4. Month-wise mortality during the period 4/2014 to 3/2015
Female Male Month 0-3
(m) 3-6 (m)
6-12 (m)
1-2 yrs
> 2 yrs
Over all Female
0-3 (m)
3-6 (m)
6-12 (m)
> 1 yr
Over All Male
Over All Herd
Overall No. 20 20 24 8 61 85 15 18 22 12 27 112 Died - 1 - - 1 2 - - - - - 2 % - 5.00 - - 1.63 2.35 - - - - - 1.78 There was no calf mortality (0-3 m) 9.5. Causes of mortality (quarter-wise) during the period 4/2014 to 3/2015 Particulars 1st quarter 2nd quarter 3rd quarter 4th quarter A. Respiratory System: - - - - B. Digestive System: - 1. Enteritis (Calf scours) - - 01 - 2 Gastritis - 01 - - C. Circulatory System: - - - - D. Others:- Total - 01 01 - 9.6. Prophylactic measures taken during the period 4/2014 to 3/2015 Vaccination No. of animals Screening No. of animals No. of animals
treated for Parasitism Available Inoculated Tested Result FMD 93 93 Brucellosis 50 -Ve All the animals were
protected from parasitic infestations by periodical deworming
HS 93 93

71
9.7. Calving abnormalities (quarter-wise) during the period 4/2014 to 3/2015 Quarter No. of
Calvings Dystocia Abortions Retention
of Placenta Prolapse Others
(Still births) No. % No. % No. % No. % No. %
I 2 - - - - - - - - - - II 15 - - - - - - - - 1 6.66 III 13 - - - - - - - - - - IV 04 - - - - - - - - - - Overall 34 - - - - - - - - 1 2.94 9.8. Female conception rate during the period 4/2014 to 3/2015 No. of animals
No. of services Overall Parity I II III IV& Above
I C CR% I C CR% I C CR% I C CR% I C CR% Heifers 6 4 66.6 - - - - - - - - - 6 4 66.6 Adults
1st - - - - - - - - - - - - - - - 2nd 6 - - - - - - - - - - - 6 - - 3rd 11 5 45.45 2 - - - - - - - 13 5 38.46 4tth 16 10 62.5 - - - - - - - - - 16 10 62.5 5th 6 3 50.0 - - - - - - - - - 6 3 50.0
6th & above 1 1 100.0 - - - - - - - - - 1 1 100.0
Overall 46 23 50.0 2 - - - - - - - - 48 23 47.92 I = No. of animals inseminated C = No. of animals conceived CR% = Conception Rate % 9.9. Bull-wise conception rate during the period 4/2014 to 3/2015 S.No. Bull No. Total No. of AI Total Conceived CR % 1 6136 10 2 20.0 2 4100 8 3 37.5 3 MB851 30 18 60.0 Total 48 23 47.92 9.10. Bull-wise semen stock 4/2014 to 3/2015 S. No.
Bull No.
Set No
Opening Balance Semen Produced/ Received
Consumption for AI/Supplied Bal-ance
Dairy farm
supply Field Unit
Other agencies
Sold Disc. Total Balan
ce 1 4439 - 37 - - - 37 2 4100 - 22 - 8 - 14 3 6040 - 33 - - - 33 4 6014 - 40 - - 20 20 5 6136 - 40 - 10 - 30 6 MB 858 - 165 - - 45 120 7 MB 851 - 167 - 30 27 110
Total 504 - 48 92 - -- - - 364

72
Table 9.11: Body weights during the period 4/2014 to 3/2015 Age N Body weight (kg) X SE Females Birth 20 30.00 0.39 3 Months 20 47.85 1.92 6 Months 11 69.36 2.29 12 Months 4 142.75 4.25 18 Months 8 230.25 19.72 24 Months 4 310.75 20.20 Adults 60 482.28 10.99 Breeding Males Birth 13 30.85 0.46 3 Months 15 45.00 1.62 6 Months 10 65.10 2.17 12 Months 7 137.14 4.26 18 Months 4 198.75 5.19 24 Months 3 320.00 27.30 Adult Bulls 5 343.00 23.77 9.11.1 Body weights since inception of Network: Weighing balance purchased during this year in September 2014 9.12. Production performance of buffaloes completing their lactation during the
period 4/2014 to 3/2015 Lactation
No. No. of
Observations Av. Lact.
Yield (kgs) Av. Lact.
Length (days) 305-day Milk
Yield (kgs) Av. Peak yield (kg)
1st - - - - - 2nd - - - - - 3rd 4 1681.18 302.64 1626.45 7.38 4th 6 1757.83
± 141.06 307.00 ± 15.51
1719.50 ± 120.10
7.23 ± 0.28
5th 1 1675.00 321.00 1659.00 8.04 7th & Above - - - - -
Over All 11 1681.18 ± 106.37
302.64 ± 12.46
1626.45 ± 91.42
7.38 ± 0.17
9.12.1. Production performance of buffaloes (General herd) since inception of Network: Years No. of
Observations Av. Lact. Yield (kgs)
Av. Lact. Length (days)
305-day Milk Yield (kgs)
Av. Peak yield (kg)
2011-12 6 1564 273 1564 11.50 2012-13 5 1560 285 1560 9.50 2013-14 13 1753 272 1963 7.41 2014-15 11 1681 302 1626 7.38 9.12.2 Production performance of buffaloes (Elite) since inception of Network: Year No. of
Obs. Av. Lact. Yield (kgs)
Av. Lact. Length (days)
305-day Milk Yield (kgs)
Av. Peak yield
2011-12 - - - - - 2012-13 - - - - - 2013-14 - - - - - 2014-15 - - - - -

73
9.13. Average milk components during the period (month-wise) 4/2014 to 3/2015
Month Number of Observations Fat (%) April, 2014 12 8.4 May 10 8.8 June 8 8.4 July 13 8.2 August 16 8.4 September 17 7.8 October 21 7.6 November 31 7.6 December 32 7.8 January, 2015 36 8.0 February 36 8.2 March 36 8.6 Overall 268 8.15 ± 0.11 9.14. Reproduction performance of Buffaloes calving during the period 4/2014 to 3/2015 Traits 1 2 3 4 5 6 7 &
Above Overall
Average Age at First Calving (m)
N X- SE
- - - - - - - - Average Service Period (d)
N X-SE
- 7 91.86 7.60
4 89.75 21.18
19 184.37 25.98
3 79.00
- 1
62.00 -
- 34 141.29 16.91
Average Dry Period (d)
N X-SE
- 7 151.29 10.29
4 123.00 21.75
19 250.47 29.78
3 101.33
- 1
120.00 -
- 34 198.06 20.01
Average Calving Interval (d)
N X-SE
- 7 400.71 6.85
4 390.50 27.11
19 517.68 32.58
3 380.00
- 1
365.00 -
- 34 462.00 21.36
9.14.1. Reproduction performance of buffaloes calving since inception of Network: Years AFC (m) Service Period (d) Dry Period (d) Calving Interval (d) 2011-12 - 153 - - 2012-13 - 172 188 464 2013-14 - 143 147 397 2014-15 - 141 198 462 9.15. Month-wise milk production and disposal during the period 4/2014 to 3/2015 Month Production Disposal
Total milk produced (kg)
Liquid milk (kg)
Calf feeding(kg)
Experimental purposes (kg)
Milk lost in handling (kg)
April, 2014 1373.00 1352.50 20.50 May 1483.00 1385.00 98.00 June 1248.00 1140.75 107.25 July 1773.00 1366.25 406.75 August 3531.00 2513.00 1018.00 September 3761.00 2540.25 1220.75 October 3849.00 2676.25 1172.75 November 5536.00 4213.75 1322.25

74
December 7407.00 5929.75 1477.25 January, 2015 7491.00 5830.75 1660.25 February 5914.00 4913.50 1000.50 March 6873.00 4940.75 1932.25 Total 50239.00 38802.50 11436.50 0 0 9.16. Feed and fodder purchased and offered (qtls) for animals during 4/2014 to 3/2015 Quarter Feed/fodder Quantity produced at farm Quantity purchased Actually fed Balance I Green 1220 0 1220 0 Dry 100 290 327 67 Silage 300 0 300 0 Concentrate 0 200 273 75 II Green 2320 0 2320 0 Dry 0 0 130 130 Silage 0 0 0 0 Concentrate 0 275 275 2 III Green 2100 0 2100 0 Dry 50 0 50 0 Silage 220 0 220 0 Concentrate 0 400 337 2 IV Green 1450 0 1450 0 Dry 80 275 167.5 0 Silage 0 0 0 0 Concentrate 0 230 260 65 Overall Green 7090 0 7090 0 Dry 230 565 674.5 187.5 Silage 520 0 520 0 Concentrate 0 1105 1145 35 (Difference B/w produced and fed is handling loss) 9.17. Milking performance during the period 4/2014 to 3/2015 Month No. of
Animals in milk
No. of Animals
dry Total
Animals % in Milk
Wet average
(kg) Herd
average (kg)
April, 2014 12 19 31 39 3.81 1.48 May 10 21 31 32 4.78 1.54 June 8 23 31 26 5.20 1.34 July 13 18 31 42 4.40 1.84 August 16 14 30 53 7.12 3.80 September 17 13 30 57 7.37 4.18 October 21 9 30 70 5.91 4.14 November 31 19 50 62 5.95 3.69 December 32 18 50 64 7.47 4.78 January, 2015 36 14 50 72 6.71 4.83 February 36 14 50 72 5.87 4.22 March 36 14 50 72 6.16 4.43 Overall 22.0 16.0 50.0 57.89 5.90 3.36

75
9.17.1. Milking performance since inception: Years No. of Animals
in milk No. of Animals dry
Total Animals
% in Milk
Wet average(kg)
Herd average (kg)
2011-12 6 - 6 100 5.19 5.19 2012-13 17 14 31 55 4.70 2.80 2013-14 11 20 31 40 5.25 2.13 2014-15 22 16 50 55 5.90 3.36 9.18. Bull-wise Daughters Born/Daughters reaching A. F. C. and completing 1st Lactation records During the Period 4/2014 to 3/2015
-NIL- 9.19. Bull-wise daughters completing 1st lactation during the Period 4/2014 to 3/2015
-NIL- 9.20 List of breeding/young bulls as on 3/2014:
Sr. No.
Bull No. Date of Birth Dam No.
Sire No. Dam’s 305 days or
lessyield (kg) Semen
doses available
Remarks
1 485 03-03-2011 444 3472 2050 - 2 489 04-03-2011 450 3472 2060 - 3 569 24-10-2012 559 3098 1224 - 4 573 08-11-2012 567 3294 1144 - 5 581 02-01-2013 565 3206 1200 - 6 15 25-07-2013 547 3294 1655 - 7 17 14-08-2013 442 3462 2020 - 8 19 14-09-2013 9772 3206 1600 - 9 21 29-09-2013 454 3098 2170 -
10 23 16-10-2013 539 3462 1324 - 11 25 17-10-2013 458 3294 1910 - 12 27 01-11-2013 9775 3206 1559 -
9.21 Target achieved during the year 4/2014 to 3/2015: S. No. Trait Target Achieved 1. Av. Age at first service (months) 24 months (300 kg. B. wt.) - 2. Av. Age at first calving 40 months - 3. Av. Age for initiating training of bulls (months) 18 months (350 kg. B. wt.) - 4. Av. Age at first collection 30 months (400 kg. B. wt.) - 5. Av. Service period 130 days 141 days 6. Calf mortality (0-3 months) ≤ 5% Nil 7. Wet average ≥ 8.5 kg 5.90 kg 8. Herd average ≥ 5.5 kg 3.36 kg 10. Salient Research Achievements including survey reports/farmers animals covered in the project. : Survey of farmer’s animals is in progress in all the selected
villages.

76
11. a. Publications: Name of the Scientist Popular articles/Pamphlets published Dr. Ch. Harikrishna
1. Summer management in Buffaloes 2. Reproductive management in Buffaloes
b. All India Radio Programme: Farmer School on Reproductive management and Scientific management of buffaloes.
c. Kisan Mela: -- d. TV Live Phone –in Programmes: Delivered Topics on Buffalo management and
other livestock management in DD, ETV & T News etc. for betterment of Farmers.
12. Expected Socio-economic impact in the tract : 1. In the Progeny-Testing Programme, inseminations of local buffaloes with semen
procured from Hisar, improving the genetic makeup of the calf crop for milk production in the field units, resulting in improvement in economic status of farmers.
2. Improved perennial fodder varieties like Hybrid napier, APBN-1, Co-4 are being distributed to the farmers since inception of this Research Station, which helps in increase in the area of fodder production, milk yield and reducing the cost of milk production at farmer level in Warangal district.
13. Constraints if any :
1. Budget allotment under head RC has to be increased to meet all day to day contingencies, feeding and maintenance of (110) buffaloes and salaries of contractual personnel.
2. Due to less budget under head RC during the year, on request, the University allotted additional budget from state plan funds and accordingly, the excess expenditure incurred for NPBI project (Rs.5,74,128/-) during 2014-15 may be sanctioned in order to remit back to the state plan.
3. Additional posts of (1 No.) Veterinary Assistant and (1 No.) Junior Assistant are to be sanctioned for smooth and effective implementation of the PT programme.
14. Focus of work in the coming year: 1. Performance recording of animals of NPBI. 2. Purchase of elite animals to maintain wet and herd averages of the centre. 3. Selection and training of breeding bulls for field PT programme. 4. Conducting farmer trainings, Animal health camps and Calf rallies to encourage the
farmers under PT programme.

77
Financial Statement for the year 2014-15 (Rs in Lakhs)
Sanctioned as per R E Total ICAR Share
Released ICAR Share as per R E
Expenditure as per AUC Receipts (ICAR Share)
Balance ICAR Share
State Share
39.00 29.25 29.25 35.30590 11.76863 2.99376 -3.06214 Herd Performance : Herd strength at the centre was 110 animals out of which 60 were
breedable animals. 34 calves born at the centre and no mortality were reported in 0 – 3 months calves but one still birth was reported. A total 48 AI’s were performed and 23 conceived with a conception rate of 47.92%. 305 days or less day milk yield was 1626 kg (n=11), Av. Lactation length was 303 days (n=11), the milk production is low at the centre. Wet & herd average were reported to be 5.90 & 3.36 kg. 57.89% of the animals (22/38) were in milk during the period. Reproductive performance viz. average service period, average dry period and average calving interval for 34 animals were 141 days, 198 days and 462 days respectively. Animals from Venketramanagudem have been shifted. However production needs to be improved.
Target achieved during the year 4/2014 to 3/2015: S. No. Trait Target Achieved 1. Av. Age at first service (months) 24 months (300 kg. B. wt.) - 2. Av. Age at first calving 40 months - 3. Av. Age for initiating training of bulls (months) 18 months (350 kg. B. wt.) - 4. Av. Age at first collection 30 months (400 kg. B. wt.) - 5. Av. Service period 130 days 141 days 6. Calf mortality (0-3 months) ≤ 5% Nil 7. Wet average ≥ 8.5 kg 5.90 kg 8. Herd average ≥ 5.5 kg 3.36 kg Recommendations: Breeding bull need to be disposed off to the developmental
agencies/farmers/village panchayat. The centre should concentrate at the farm activity so that elite buffaloes may be reared for bull production. The performance at the farm needs to be improved. Semen from 15th set bulls was collected on 13.08.15 from the semen freezing lab CIRB, Hisar.
Project Co-ordinator’s observations on centre performance

78
ICAR RESEARCH COMPLEX FOR EASTERN REGION, PATNA (BIHAR) 1. Name of centre : ICAR Research Complex Eastern Region Patna 2. Project Code 3. Project Title : Network Project on Murrah Buffaloes 4. Date of Start : July 2014 (Re-inducted) 5. Objective : Specified NWP(BI) 6. Technical Programm : As per the Technical programme of Murrah breed of NWPBI. 7. Financial Statement : Self-financed. 8. Staff Position : PI of the project - Dr PC Chandran, Scientist, 9. Herd Performance : Tables 9.1 to 9.21
9.1 Herd Strength during the Period 4/2014 to 3/2015 Category Addition Disposal Sr. No. OB B T D T S CB Female 1. Female Calves below 3 months 0 4 0 0 4 0 0 2. Female Calves 3-6 months 2 0 2 0 0 0 4 3. Female Calves 6-12 months 7 0 2 0 0 0 9 4. Heifers above 1-2 years
2-2.5 years Above 2.5 years
1 0 2
0
0 0 0 0 1 0 2
5. Buffaloes in Milk 13 0 0 0 0 0 13 6. Buffaloes Dry P /NP 5 0 0 0 0 0 5 Sub Total 30 4 4 0 4 0 34 Male 1. Male Calves below 3 months 1 2 0 1 0 0 2 2. Male Calves 3-6 months 0 0 0 0 0 0 0 3. Male Calves 6-12 months 1 0 0 0 0 0 1 4. Male above 1-2 years
> 2 years 2 0
0 0 0 0 2 0
0 0
5. Breeding bulls 0 0 0 0 0 0 0 6. Bullocks 0 0 0 0 0 0 0 7. Teasers 0 0 0 0 0 0 0 Sub Total 4 2 0 1 0 2 3 Grand Total 34 6 4 1 4 2 37
OB = Opening Balance D = Deaths S = Sale B = Births T = Transfer CB = Closing Balance 9.2. Calving Statistics during the period 4/2014 to 3/2015 Month Male
No. % Female No. %
Still Birth No. %
Overall No. %
April, 14 0 0 0 0 0 0 0 0 May 0 0 0 0 0 0 0 0 June 0 0 0 0 0 0 0 0 July 0 0 0 0 0 0 0 0 August 0 0 1 16.67 0 0 1 16.67 September 0 0 2 33.33 0 0 2 33.33 October 0 0 0 0 0 0 0 0 November 0 0 0 0 0 0 0 0 December 0 0 0 0 0 0 0 0 January,15 1 16.67 0 0 0 0 1 16.67 February 0 0 0 0 0 0 0 0 March 1 16.67 1 16.67 0 0 2 33.33 Overall 2 33.34 4 66.66 0 0 6 100 Sex ratio Male : Female 1:2

79
9.3. Disposal of Animals during the Period 4/2014 to 3/2015 Female
Category Surplus Repd. roblem Weak Death Exp. purposes Total Nil
Male Above 1 year 2 2 Total 2 2
9.4. Monthwise Mortality During the Period 4/2014 to 3/2015
Month Female Male Overall Herd 0-3 3-6 6-12 1-2
Yrs. Above 2
Yrs. Overall Female
0-3 3-6 6-12
Above 1 Yrs.
Overall Male
April 14 No. Died %
0
0
0
0
0
0
1
0
0
0
1
1
Overall No. Died %
0
0
0
0
0
0
0
0
0
0
0
0
Calf mortality (0-3 months) was 33.3 percent 9.5. Causes of Mortality (quarterwise) during the period 4/2014 to 3/2015 Particulars 1st quarter 2nd quarter 3rd quarter 4th quarter A. Respiratory System : 13. Miscellaneous Congenital blindness and prematurity Total
9.8 Prophylactic Measures Taken During the Period 4/2014 to 3/2015 Vaccination No. of animals
Available Inoculated Screening No. of animals
Tested Results No. of animals treated for Parasitism
FMD 37 33 Nil Nil Nil All animals dewormed
HS 37 33 Nil Nil Nil BQ 37 33 Nil Nil Nil Brucellosis 37 5 c-ELISA 37 Negative 9.9 Calving Abnormalities (Quarterwise) during the period 4/2014 to 3/2015 – Nil
9.10. Female Conception Rate during the Period 4/2014 to 3/2015 No. of animals No. of services Overall Parity I II III IV V 1 C CR 1 C CR 1 C CR 1 C CR 1 C CR I C CR Heifers 2 1 50% 2 1 50 Adults 1 0 0 4 2 50% 9 5 55.55% 4 2 50% 18 9 50 Overall 3 1 33.3 4 2 50 9 5 55.55 4 2 50 20 10 50
I = No. of animals inseminated C = No. of animals conceived CR% = Conception rate%
9.9. Bullwise Conception Rate During the period 4/2014 to 3/2015 Sr. No. Bull No. Total Number of AI Total Conceived CR% 1. B-851 27 10 37.04%
Total 27 10 37.04% 9.10 Bull Wise Semen Stock Bull No. Set no. Opening
balance Semen produced
/Received Consumption for
AI/ Supplied Balance
B-851 XIII 122 0 55 67

80
9.11 Body Weights During the period 4/2014 to 3/2015 Age
N Body weight (kg)
X
SE Female Birth 5 30.15 2.86 3 Months 5 43.81 4.56 6 Months 5 75.46 5.27 12 Months 3 123.11 7.80 18 Months 1 155.37 24 Months 0 0 Adult 20 457.23 0.97 Breeding Males Birth 2 31.05 1.58 3 Months 0 6 Months 0 12 Months 0 18 Months 3 24 Months 0 Adult Bulls 1 386.87 9.11.1 Body Weights (Kg.) since inception of Network Year Birth 3 Months 6 Months 12
Months 18 Months
24 Months
Heifer Adult Female 2014-15 30.15 43.81 75.46 123.11 155.37 457.23 Breeding Males 2014-15 31.05 386.87
9.12 Production Performance of Buffaloes Completing Lactation during 4/2014 to 3/2015 Lact. No. No. of
obs. Av. Lact. Yield (kg)
Av. Lact. Length (days)
305-day Milk Yield (kg)
Av. Peak yield 1st 1 1894.80 345 1829.00 7.9 2nd 10 2013.94 424.20 1667.10 9.99 3rd 3 2088.83 436.66 1751.30 9.43 14 2021.48 421.21 1696.71 9.72 Figures in parenthesis indicate number of observations
9.12.1 Production Performance of Buffaloes since Inception of Network Year Av. Lact. Yield
(kg) Av. Lact. Length (days)
305-day Milk Yield (kg)
Av. Peak yield 2014-15 2021.48 191.12 1696.70 9.72
9.13 Average Milk Components during the Period (Month-Wise) 4/2014 to 3/2015
Month Number of Observation Fat ( % ) April, 2014 0 May 115 7.15 June 122 7.18 July 81 7.26 August 48 7.74 September 47 7.87

81
October 35 7.92 November 52 7.53 December 15 7.80 January, 15 0 February 0 March 0 Overall 515 7.40
9.14 Reproduction Performance of Buffaloes During the Period 4/2014 to 3/2015 Traits 1 2 3 4 5 6 7 &
above Overall
Average Age at Calving (Months)
N X- SE
Average Service Period (Days)
N X- SE
1 69
5
175.8 9.20
1 76
7 146.3 8.98
Average Dry Period (Days)
N X- SE
1 65
5 146.2 4.70
1 78
7 124.9 5.91
Average Calving Interval (Days)
N X- SE
1 438
5 620.2 13.1
1 447
7 569.4 14.54
9.14.1 Reproduction Performance of Buffaloes Since inception of Network.
Years AFC (Months) Service Period (days) Dry Period (days)
Calving Interval (days)
2014-15 146.3±8.98 124.9±5.91 569.4±14.54 9.15 Month-wise Milk Production and Disposal during the Period 4/2014 to 3/2015 Month Total milk
produced (kg) Disposal Liquid Milk Calf feeding Expt.
April, 14 1809 1346 463 0 May 1510.5 1095.5 414 1 June 1153.5 784.5 368 1 July 900 618 281 1 August 794 528.5 265 0.5 September 806 570.5 235 0.5 October 789 572.5 216 0.5 November 719 535.5 183 0.5 December 700 514.5 185 0.5 January, 15 728.5 508.5 220 0 February 849.5 613.5 236 0 March 954 705 249 0 Total 11713 8392.5 3315 5.5

82
9.16 Feed and fodder purchased and offered to animals during the period 4/2014 to 3/2015 Quarter Qty. produced at
Farm Qty. Purchased
Actually fed Balance 1 Green
Dry Silage Concentrate
56,320 kg Nil Nil Nil
3000 kg 12,012 kg
Nil 11,830 kg
59,320 kg 12,012 kg
Nil 11,830 kg
Nil Nil Nil Nil
1I Green Dry Silage Concentrate
44,580 kg Nil Nil Nil
14,000 kg 10,580 kg
Nil 11,830 kg
58,580 kg 10,580 kg
Nil 11,830 kg
Nil Nil Nil Nil
1II Green Dry Silage Concentrate
10,501 kg Nil Nil Nil
13,500 kg 13,455 kg
Nil 11,830 kg
24,001 kg 13,455 kg
Nil 11,830 kg
Nil Nil Nil Nil
1V Green Dry Silage Concentrate
58,713 kg Nil Nil Nil
Nil 9840 kg
Nil 11,830 kg
58,713 kg 9840 kg
Nil 11,830 kg
Nil Nil Nil Nil
Total Green Dry Silage Concentrate
170,114 kg Nil Nil Nil
30,500 kg 45,887 kg
Nil 47,320 kg
200,614 kg 45,887 kg
Nil 47,320 kg
Nil Nil Nil Nil
9.17. Milking performance during the period 4/2014 to 3/2015 Month No. of
Animal in Milk
No. of Animal dry
Total Animal
% in Milk Wet Av. (kg)
Herd Av. (kg)
April, 14 13 06 19 68.42 4.64 3.17 May 13 06 19 68.42 3.87 2.65 June 11 08 19 57.89 3.50 2.02 July 08 11 19 42.11 3.75 1.58 August 07 12 19 36.84 3.78 1.39 September 09 10 19 47.37 2.99 1.41 October 08 11 19 42.11 3.29 1.38 November 06 13 19 31.58 3.99 1.26 December 06 13 19 31.58 3.89 1.23 January, 15 05 14 19 26.32 4.86 1.28 February 05 14 19 26.32 5.66 1.49 March 07 12 19 36.84 4.54 1.67 Overall 8.17 10.83 19 42.98 3.98 1.71 9.17.1 Milking performance since inception
Year No. of Animal in Milk
No. of Animal dry
Total Animal
% in Milk
Wet Av. (kg)
Herd Av. (kg)
2014-15 8.17 10.83 19 42.98 3.98 1.71 9.18 Bull wise daughters born during the period 4/2014 to 3/2015 Bull No. Total No. of
daughters born No. of daughters reaching A.F.C.
No. of daughters completing 1st Lact
Last Lact. B-851 7 Nil Nil Nil

83
9.19 Bull wise daughters completing 1ST lactation during 4/2014 to 3/2015 : Nil 9.20 List of breeding /young bulls as on 31-03-2015 : Nil 9.21 Target achieved during the year 2014-15 S. No. Trait Target Achieved 1. Av. Age at first service (months) 24 months (300 kg. B. wt.) - 2. Av. Age at first calving 40 months - 3. Av. Age for initiating training of bulls (months) 18 months (350 kg. B. wt.) - 4. Av. Age at first collection 30 months (400 kg. B. wt.) - 5. Av. Service period 130 days 146.3±8.98 6. Calf mortality (0-3 months) ≤ 5 % 14.29 7. Wet average ≥ 8.5 kg. 3.98 8. Herd average ≥ 4.5 kg. 1.71 10. Research Achievements: Mortality in buffalo farm has reduced to 2.63 per cent in 2014-15 from 8.11 per cent in the year 2013-
14. (Only one calf was died due to congenital blindness and prematurity, out of entire stock in the year 2014-15).
A teaser bull has been developed and trained to detect estrum in female buffaloes which are in heat. Conception rate in buffalo farm has increased to 55.55 per cent in the year 2014-15 as a remarkable
increment from 31.4 per cent in 2013-14. Continuous interventions in reproduction have now brought more animals into normal reproductive status. Buffaloes have been continuously monitored for heat symptoms. Anestrous buffaloes have been given supplementation therapy, chemotherapy and hormonal therapy. Preparation and feeding of own mineral mixture to the buffaloes might have impacted some effect on the reproductive fitness of the buffaloes.
Thermoregulation of their body temperature has been maintained by allowing buffaloes in the newly built wallowing tank.
Efforts are continued to produce green fodder round the yearFeeding of these buffaloes is being managed through own resources and by purchasing the materials from outside. This has been achieved by creating bunds in low lying area and opting for cultivation of Napier Hybrid crosses. A total of 11 plots of approx. 4 ha. are under cultivation of different fodder crops. The fodder crops cultivated are: Berseem and Oat in winter, Jowar and MP Chari during summer and rainy season. Besides, 200 kg to 500 kg of green fodder is being purchased whenever unexpected scarcity arises due to severe water logging and other reasons.
Continuous evaluation of concentrate feed for its proximate principles to ensure the quality of feed being offered to the buffaloes. Concentrate feed required feeding the buffaloes are being continuously purchased from the feed plant of Patna Dairy Project, a cooperative Dairy Milk Union Ltd., under Govt. of Bihar.
Periodic vaccination against FMD, HS&BQ, and regular deworming have been carried out to the project buffaloes.
In order to ensure the cleanliness in the shed even during the period of electricity shut down, the solar operated pump has been installed in the farm to ensure the water availability 24 × 7 hours.
Fat from milking buffaloes are estimated and recorded every fortnight. Recently, ICAR-RCER has also erected two new cattle sheds which can hold around 45 animals.

84
Herd Performance The herd strength of farm was 37 heads out of which 20 were breedable buffaloes. 6 calves were reported during the year and calf mortality (0-3 months) was 14.29 percent (1/7). Twenty seven AI’s were carried out resulting in ten conceptions with conception rate of 37.04 percent at the centre. Semen doses of 15th set bulls are now being used at the centre.
Av. Lactation yield, Av. Lactation length and 305 or less day milk yield were 2021.48 (n=14),
421.21 (n=14) and 1696.71 (n=14) respectively during the year. The service period dry period and calving interval were 146.3±8.98 days (n=7), 124.9±5.91 days (n=7) and 569.4±14.54 days (n=7) respectively. The wet and herd averages at the centre were very low at 3.98 kg and 1.71 kg respectively. Only 42.98 % buffaloes were in milk.
9.21 Target achieved during the year 2014-15 S. No. Trait Target Achieved 1. Av. Age at first service (months) 24 months (300 kg. B. wt.) - 2. Av. Age at first calving 40 months - 3. Av. Age for initiating training of bulls
(months) 18 months (350 kg. B. wt.) -
4. Av. Age at first collection 30 months (400 kg. B. wt.) - 5. Av. Service period 130 days 146.3±8.98 6. Calf mortality (0-3 months) ≤ 5% 14.29 % 7. Wet average ≥ 8.5 kg 3.98 8. Herd average ≥ 5.5 kg 1.71
Recommendations: Heard strength to be increased to 50 breedable buffaloes at the centre. Production and reproduction performance need to be improved.
Project Co-ordinator’s observations on centre performance

85
ICAR-CIRB SUB CAMPUS, NABHA
1. Name of the center : Central Institute for Research on Buffaloes, Sub campus, Nabha 2. Project Code : 18-3/97 ASR-II Dated 29/03/2001 3. Project title : Network project on improvement of Nili Ravi buffaloes 4. Date of Start : 11/10/ 2001 5. Objectives: The objective of the project is to envisage and undertake progeny testing for
improvement of Nili Ravi breed of buffaloes. Priority and emphasis will be on performance recording and improvement of the breed and on semen quality testing laboratory.
6. Technical Programme: As approved for the Network programme. 7. Staff position at CIRB sub-campus Nabha as on 31/03/2015 : Redemployment 8. Herd Performance: Presented in table 9.1 to 9.21 9.1: Herd strength during the period 2014-15 Category Addition Disposal Female OB B T R D T S CB Female Calves below 3 months 06 68 01 60 13 Female Calves 3-6 months 18 60 53 25 Female Calves 6-12 months 19 53 43 29 Heifers a) 1-2 years b) 2-2.5 years c) Above 2.5 years
58 56 12
43 58 56
01 -
58 56 36
04
43 57 28
Buffaloes in Milk 116 124 04 117 09 110 Buffaloes Dry 28 117 02 88 15 40 Sub Total 313 68 511 08 511 28 345 Male Male Calves below 3 months 18 56 65 09 Male Calves 3-6 months 30 65 65 02 28 Male Calves 6-12 months 34 65 01 49 31 18 Male 1) 1-2 years 2) > 2 years
35 14
49 24
24 03
14 09
46 26
Breeding bulls 20 03 02 05 16 Bullocks 01 - - - 01 Teasers - 02 - - 02 Exp. Animals 02* - - - 02 Sub Total 154 56 208 01 208 61 148 Grand Total 467 124 719 09 719 89 493
* Two experimental animals OB = Opening Balance D = Death S = Sale R = Received CB = Closing Balance B = Birth T = Transfer

86
9.2: Calving statistics during the period 2014-15 Month Male Female Abortions &
Still Birth Overall
No % No % No % No % April 14 04 3.08 03 2.31 - 07 5.38 May - - 01 0.77 - 01 0.77 June 03 2.31 02 1.54 - 05 3.85 July 04 3.08 04 3.08 - 08 7.69 August 04 3.08 10 7.69 - 14 10.77 September 10 7.69 13 10.0 - 23 17.69 October 09 6.92 08 6.15 - 17 13.08 November 05 3.85 10 7.69 01SB 16 12.31 December 08 6.15 04 3.08 01SB 13 11.54 January 15 04 3.08 05 3.85 - 09 6.92 February 02 1.54 01 0.77 - 03 2.31 March 03 2.31 07 5.38 - 10 7.69 Overall 56 68 02 126
9.3: Disposal of animals during the period 2014-15 Category Surplus Repd.
problem Weak & old
Death Expt. purpose
Total Female < 6 months 6-12 months
- -
01 -
01 -
Heifers 1-2.5 yrs > 2.5 yrs
-
04
- 01
-
05 Buffaloes Dry/ Milch
09 15
04 02
13 17
Sub Total 28 08 36 Male < 6 months 6-12 months
02 31
-
01
- 32
>1 yr 14 - - Young Bulls 09 - - Breeding bulls 05 - - Bullock +Teaser - - - Sub total 61 01 62 G. Total 89 09 98
9.4: Month wise mortality during the period 2014-15
Females Males Month 0-3 3-6 6-12 >1yr >2yrs All 0-3 3-6 6-12 >1yr >2yrs All Total Overall
No Died %
68 01
1.47 78 - -
72 - -
101 - -
214 07
3.27 381 08
2.09 56 - -
95 - -
99 01
1.01 84 - -
- -
210 - -
617 09
1.46 Overall calf mortality (0-3m) was 0.68 percent

87
9.5: Causes of mortality (quarter wise) during the period 2014-15 Particulars 1st quarter 2nd quarter 3rd quarter 4th quarter A. Respiratory System: 1. Bronchopneumonia 01 2. Pheumo-Enteritis B. Digestive System: 1. Enteritis 01 2. Impaction 01 3. Peritonitis 4.Hepatitis 01 01 C. Cardivascular System 01 D. Urogenital System 1. Others 01 E. Others. 1. Euthanasia 2. Miscellaneous & Others 01 01 Total 03 03 Nil 03
9.6: Prophylactic measures taken during the period 2014-15 Vaccination No. of animals Screening No of animals No of animals
treated for Parasitism Available Inoculated Tested Results
FMD 499 499 TB 205 Negative* HS 499 499 JD 205 Negative* 545 BQ Brucellosis 205 Negative** RP Mastitis 135 12 Positive
*** Brucellosis 52 52 IBR
Leptospirosis * Based on Intradermal Tuberculin PPD/Johnin PPD ** Based on RBPT /SAT; ***Based on CMT
9.7 Calving abnormalities (quarter wise) during the period 2014-15 Quarter
No. of calving
Dystokia Abortion ROP Prolapse Still birth Total No % No % No % No % No % No %
1 13 - - - - - - - - - - - - II 44 - - 2 4.55 - - - - - - 02 4.55 III 45 - - 2 4.44 - - - - 02 4.44 04 8.88 IV 22 - - - - - - - - - -- - - All 124 - - 4 3.23 - - - - 02 1.61 06 4.84 9.8 Female-wise conception rate during the Period 2014-15 No. of Services Overall Parity I II III IV I C CR I C CR I C CR I C CR I C CR Heifers 64 24 37.5 33 20 60.1 20 10 50.0 16 8 50.0 133 63 47.36 Adult 166 70 42.17 70 20 28.57 38 10 26.32 22 6 27.27 296 106 35.81 Overall 230 94 40.87 103 40 38.83 58 20 34.48 38 14 36.84 429 169 39.39
I = No. of animals inseminated; C= No. of animals conceived; CR% = Conception rate%

88
9.9 Bull-wise conception rate during the period 2014-15 Sr. No. Bull No. Set No. Total No. of AI Total Conceived CR% 1 113 5th 67 19 28.36 2 991 -do- 56 23 41.07 3 03 -do- 53 15 28.30 4 63 -do- 65 32 49.23 5 25 -do- 47 23 48.94 6 27 -do- 82 35 42.68 7 R-2 4th 05 2 40.00 8 181 6th 07 2 28.57 9 251 -do- 07 5 71.43 10 168 -do- 04 0 nil 11 245 -do- 05 3 60.00 12 252 -do- 05 2 40.00 13 226 -do- 02 0 nil 14 254 -do- 03 1 33.33 15 R-1 4th 05 1 20.00 16 R-3 4th 16 6 37.50
Total 429 169 39.39
9.10 Bull Wise Semen Stock Bull No.
Set No.
Opening balance
as on 01.04.2014
Semen Pro. / Received
Consumption for AI / Testing
Sold Balance on
31.03.15 411 693 - - - 693 439 698 - - - 698 453 670 - - - 670 455 670 - - - 670 464 770 - - - 770 473 760 - - - 760 479 770 - - - 770 523 2nd 800 - - - 800 524 1382 - - - 1382 525 573 - - - 573 528 - - - - - 535 897 - - - 897 562 898 - - - 898 576 340 - - - 340 577 1380 - - - 1380 579 710 - - - 710 596 3rd 1330 - - - 1330 674 1390 - - - 1390 702 1240 - - - 1240 716 1350 - - - 1350 719 1200 - - - 1200 771 570 - - - 570 791 1070 - - - 1070 802 1200 - - - 1200 806 4th 1500 - - - 1500 878 1200 1240 30 410 2000

89
881 1520 - - - 1520 891 1500 - - - 1500 900 1500 - - - 1500 902 1500 - - - 1500 905 1500 - - - 1500 916 1530 - - - 1530 930 1500 - - - 1500 941 1530 - - - 1530 R-1 65 - 55 - 10 R-2 185 - 140 - 45 R-3 120 - 105 - 15 991 5th 1000 2229 84 910 2235 003 420 845 80 665 520 025 2500 6320 70 7210 1540 027 1300 3696 71 3970 955 063 1000 2647 77 1070 2500 113 1076 1470 76 400 2070 168 6th 200 2415 85 1945 585 181 200 3994 116 3170 908 226 80 40 40 0 251 --- 639 30 524 85 252 - 609 45 564 0 254 - 60 20 0 40 245 - 2905 118 2287 500 214 - 1280 10 70 1200 231 - 915 20 0 895 232 - 110 20 90 0 285 - 20 20 0 0
Total Total 44207 31474 1312 23325 51044
9.11: Body weights during the period 2014-15 Female
Age N Body Weight (kg) SE Birth 68 35 0.59 3 Months 61 72 1.15 6 Months 49 122 2.68 12 Months 40 189 4.75 18 Months 49 279 4.39 24 Months 58 340 5.39 Adult 149 548 5.12
Males Birth 57 36 0.57 3 Months 58 72 1.12 6 Months 46 112 2.92 12 Months 48 197 5.46 18 Months 19 249 5.93 24 Months 20 360 7.59 Adult Bulls 21 675 19.40

90
9.11.1: Body weights (in kg) since inception of Network Year Birth 3 Months 6 Months 12 months 18 Months 24 Months Adult animal Female 2001-02 35.9 74.1 106 - - - - 2002-03 - - - - - - 2003-04 30.7 58.4 88.3 - - 255.0 - 2004-05 33.8 63.4 90.0 - - 225.0 - 2005-06 34.5 61. 8 94.8 153.4 172.6 202.0 505.7 2006-07 32.8 65.3 109.5 166.6 245.9 280.0 507.0 2007-08 32.8 55.0 99.5 207.5 273.6 322.3 547.2 2008-09 34.7 69.5 108.4 166.7 272.5 356.7 527.2 2009-10 32.9 50.2 75.1 124.8 243.7 273.9 539.2 2010-11 32.1 59.1 89.0 121.8 227.1 317.6 536.8 2011-12 32.8 - 76.3 162.4 - 325.7 526.4 2012-13 32.28 74.87 121.3 203.55 276.62 351.74 555.3 2013-14 33.36 71.71 112.53 210.94 291.72 365.10 539.43 2014-15 35.0 72.0 122.0 189.0 279.0 340.0 548.0 Male 2001-02 37.8 70.1 100.8 - - - - 2002-03 - - - - - - 2003-04 33.8 60.5 87.8 - - 252.0 - 2004-05 37.1 66.6 98.3 - - 270.0 603.0 2005-06 36.1 68.3 104.0 158.6 182.1 243.0 566.3 2006-07 33.0 66.3 97.8 199.3 255.0 277.4 577.4 2007-08 33.1 64.5 103.4 146.5 219.9 324.3 610.9 2008-09 34.8 72.2 104.4 168.3 270.9 354.3 604.4 2009-10 34.3 47.8 76.7 112.7 223.8 357.5 575.0 2010-11 32.9 74.0 94.6 163.7 243.8 320.3 560.0 2011-12 32.6 72.4 114.0 168.1 248.7 326.7 535.2 2012-13 34.24 81.69 125.8 203.2 283.0 382.0 651.6 2013-14 36.01 77.80 124.38 230.91 319.81 391.0 674.14 2014-15 36.0 72.0 112.0 197.0 249.0 360. 675.0
9.12: Production of buffaloes completing lactation during the period 2014 – 15
Lact. No N Av. Lact Yield (kg)
Av. Lact length (days)
305-days yield (kg)
Av. Peak Yield (kg)
1st 31 2319±98.91 319±9.31 2190±76.17 10.78±0.34 2nd 42 2491±78.09 297±6.35 2437±70.22 12.47±0.28 3rd 13 2496±150.46 286±13.77 2439±134.03 12.90±0.45 4th 11 2275±118.27 290±25.14 2254±112.64 12.87±0.69 5th 14 2666±177.26 311±14.33 2569±158.79 14.02±0.59 6th 04 3014±486.99 311±37.81 2855±348.23 15.0±1.39 Overall 115 2464±52.47(115) 303±4.94(115) 2384±45.39(115) 12.38±0.21(115)
9.12.1: Production performance of buffaloes (General herd) since inception of Network project.
Year No. of Observations
Av. Lact. Yield (kg)
Av. Lact. Length (days)
305 days or less Milk yield (kg)
Av. Peak yield 2001-02 86 1926 296 1885 10.00 2002-03 105 2007 293 1941 10.49 2003-04 93 1968 307 1895 10.49 2004-05 116 1974 315 1848 08.00 2005-06 102 2190 306 2090 10.00 2006-07 118 1921 304 1795 09.00 2007-08 122 1787 302 1629 09.10 2008-09 108 2036 289 1929 09.94

91
2009-10 146 1927 302 1822 09.40 2010-11 115 2042 292 1972 10.54 2011-12 88 2045.3 278.5 1997.9 10.60 2012-13 123 2048.2 264 2017.4 11.14 2013-14 109 2297 285 2241 12.20 2014-15 115 2464 303 2384 12.38 9.13: Average Milk Components during the period (month wise) 4/2014 to 3/2015
Month % Fat Solid not fat Total solids Apr 14 8.2 10.5 18.7 May 8.3 10.1 18.4 Jun 8.6 10.3 18.9 Jul 8.5 10.3 18.8 Aug. 8.1 10.1 18.2 Sep 8.1 09.9 18.0 Oct 7.6 09.6 17.2 Nov - - - Dec 7.1 10.5 17.6 Jan 15 7.3 10.6 17.9 Feb 7.3 10.3 17.6 Mar 7.4 10.2 17.6 Overall 7.86 10.22 18.08
9.14: Reproduction performance of buffaloes calving during period 2014-15 Traits 1 2 3 4 5 6 & above Overall Av. Age at Calving (Months)
N X SE
36 39.9 19.89
36 39.9 19.89
Av. Service Period (Days)
N X SE
31 139
16.77 29 97
9.94 11 108
25.75 8 80
9.28 9
100 16.24
88 112 7.89
Av. Dry Period (Days)
N X SE
31 150
17.85 29 129
11.79 11 137
19.64 8
134 8.94
9 121
12.29 88 138 6.37
Av. Calving Interval (Days)
N X SE
31 448
16.98 29 405
10.45 11 416
26.18 8
387 9.61
9 406
17.38 88 420 8.09
9.14.1: Reproduction performance of buffaloes since inception of Network project.
Year AFC (Months) S P (days) D P (days) C I (days) 2001-02 41.6 (31) 137±09.0 (83) 133 (83) 445±09.0 (83) 2002-03 42.0 (58) 132±08.0 (90) 132 (90) 440±08.0 (90) 2003-04 41.6 (59) 138±09.0 (78) 136 (78) 443±09.0 (78) 2004-05 43.0 (39) 155±10.1(89) 146 (89) 463±10.3 (89) 2005-06 42.6 (58) 167±10.9 (72) 157 (72) 474±10.7 (72) 2006-07 39.9 (57) 165±14.7 (58) 160 (58) 478±14.3 (58) 2007-08 40.8(43) 165±11.2 (74) 150 (74) 458±11.1 (74) 2008-09 39.7 (69) 172±11.8 (70) 172 (70) 489±16.3 (70) 2009-10 41.1 (52) 170±14.0 (76) 163 (76) 478±14.1 (76)

92
2010-11 41.1 (47) 191±13.7 (71) 170 (71) 500±13.7 (71) 2011-12 39.7 (43) 136±20.24 (48) 150 (48) 464±23.1 (48) 2012-13 39.6 (52) 126±10.80 (75) 151(75) 436±10.9 (75) 2013-14 39.8(42) 127±10.6(67) 159(67) 446±8.53(67) 2014-15 39.9 (36) 112±7.89(88) 138(88) 420±8.09(88)
9.15: Month wise milk production and disposal during the period 2014-15 Month
Total Milk Produced (kg) Disposal (lts.)
Liquid Milk Calf feeding Expt. Apr 14 28190.1 24870.0 2488.0 11.0 May 26433.6 23068.0 2587.2 8.5 Jun 21477.7 18750.0 2094.1 8.0 Jul 19.098.9 16309.0 2227.1 6.5 Aug 17809.6 15074.0 2210.9 6.0 Sep 20761.7 16907.9 3245.1 4.0 Oct 26650.7 21320.7 4549.8 4.0 Nov 27216.1 22446.9 3976.5 - Dec 30062.7 25097.1 4086.5 3.5 Jan 15 32561.5 26831.9 4775.7 5.5 Feb 27305.8 23141.4 3365.5 3.5 Mar 28033.8 24635.8 2578.4 3.0 Overall 305602.2 258452.7 38184.8 63.5
9.16 Feed and fodder purchased / sold and offered to animals during the period 2014-15 Quarter Fodder Balance
(Q) Produced
(Q) Total (Q)
Sale (Q)
Fed (Q)
Closing Balance
I Green - 8200 8200 - 8200 - DRY(Turi/karbi) 34 3487 3521 1000 198 2323 Silage 1746 - 1746 - 1540 206 Concentrate - - - - 1245.91 -
II Green 12111 12111 12111 - DRY(Turi/karbi) 2323 - 2323 - 124 2199 Silage 206 1414 1620 - 99 1521 Concentrate - - - - 1168.58 -
III Green - 7261 7261 - 7261 - DRY(Turi/karbi) 2199 - 2199 - 1099 1100 Silage 1521 - 1521 - 433 1088 Concentrate - - - - 1237.05 -
1v Green - 11985 11985 - 11985 - DRY(Turi/karbi) 1100 - 1100 - 1100 - Silage 1088 2189 3277 - 1822 1455 Concentrate - - - - 1262.08
Total Green - 39557 39557 - 39557 - DRY(Turi/karbi) 34 3487 3521 1000 2521 - Silage 1746 3603 5349 3894 1455 Concentrate 4913.62

93
9.17: Milking performance of herd during the period 2014-15 Month # Animal in milk # Animal dry Total
Animal % in Milk
Wet Av. (kg)
Herd Av. (kg)
Apr 14 115 29 144 80 8.19 6.55 May 107 37 144 74 7.97 5.94 Jun 95 42 137 69 7.53 5.24 July 84 50 134 63 7.33 4.60 Aug 78 56 134 58 7.34 4.28 Sept 84 54 138 61 8.27 5.03 Oct 96 48 144 67 8.95 5.98 Nov 98 39 137 72 9.27 6.40 Dec 105 33 138 76 9.52 7.27 Jan 15 113 27 140 81 9.33 7.52 Feb 107 37 144 74 9.10 6.76 Mar 106 42 148 72 8.54 6.13 Overall 99 41 140 71 8.48 5.98
9.17.1: Milking performance since inception of Network project Year Iin milch No. dry Total % in Milk Wet Av (kg) Herd Av (kg) 2001-02 86 38 124 69 6.85 4.82 2002-03 106 38 144 73 6.56 4.83 2003-04 106 37 143 74 6.35 4.70 2004-05 100 47 147 67 6.86 4.65 2005-06 114 46 160 71 6.85 4.84 2006-07 119 48 167 71 6.20 4.40 2007-08 102 54 156 65 6.73 4.46 2008-09 122 44 166 73 6.91 5.03 2009-10 110 58 168 65 7.00 4.66 2010-11 98 43 141 70 7.11 4.93 2011-12 84 40 124 68 7.74 5.30 2012-13 90 49 139 65 8.26 5.34 2013-14 94 52 146 64 8.25 5.32 2014-15 99 41 140 71 8.48 5.98
9.18: Bull wise daughters born during the period 2014-15 Bull No. Total no. of
daughters born No. of daughters reaching A. F. C.
No. of daughters completing 1st Lactation
Last Lactation
902 - - 2 881 - - 1 806 - - 1 63 12 5 6 25 9 6 4 27 10 8 7 991 12 5 4 113 15 5 4 03 10 7 4
Total 68 36 33
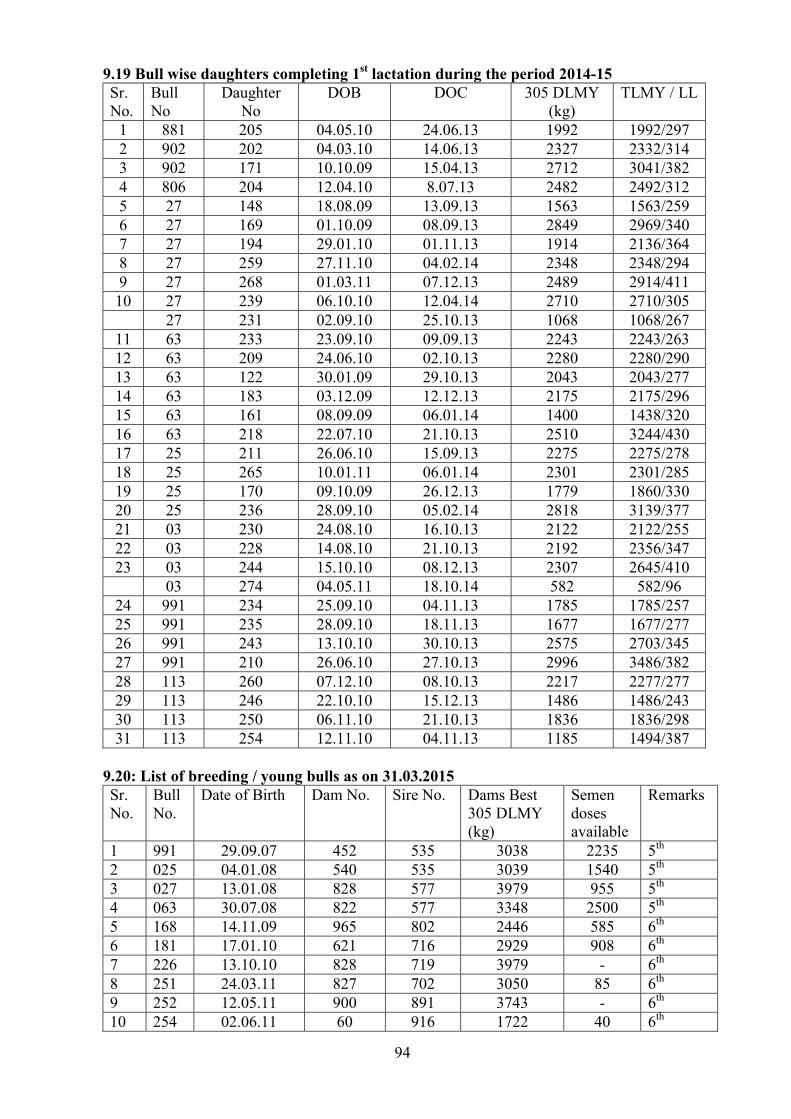
94
9.19 Bull wise daughters completing 1st lactation during the period 2014-15 Sr. No.
Bull No
Daughter No
DOB DOC 305 DLMY (kg)
TLMY / LL 1 881 205 04.05.10 24.06.13 1992 1992/297 2 902 202 04.03.10 14.06.13 2327 2332/314 3 902 171 10.10.09 15.04.13 2712 3041/382 4 806 204 12.04.10 8.07.13 2482 2492/312 5 27 148 18.08.09 13.09.13 1563 1563/259 6 27 169 01.10.09 08.09.13 2849 2969/340 7 27 194 29.01.10 01.11.13 1914 2136/364 8 27 259 27.11.10 04.02.14 2348 2348/294 9 27 268 01.03.11 07.12.13 2489 2914/411 10 27 239 06.10.10 12.04.14 2710 2710/305 27 231 02.09.10 25.10.13 1068 1068/267
11 63 233 23.09.10 09.09.13 2243 2243/263 12 63 209 24.06.10 02.10.13 2280 2280/290 13 63 122 30.01.09 29.10.13 2043 2043/277 14 63 183 03.12.09 12.12.13 2175 2175/296 15 63 161 08.09.09 06.01.14 1400 1438/320 16 63 218 22.07.10 21.10.13 2510 3244/430 17 25 211 26.06.10 15.09.13 2275 2275/278 18 25 265 10.01.11 06.01.14 2301 2301/285 19 25 170 09.10.09 26.12.13 1779 1860/330 20 25 236 28.09.10 05.02.14 2818 3139/377 21 03 230 24.08.10 16.10.13 2122 2122/255 22 03 228 14.08.10 21.10.13 2192 2356/347 23 03 244 15.10.10 08.12.13 2307 2645/410 03 274 04.05.11 18.10.14 582 582/96
24 991 234 25.09.10 04.11.13 1785 1785/257 25 991 235 28.09.10 18.11.13 1677 1677/277 26 991 243 13.10.10 30.10.13 2575 2703/345 27 991 210 26.06.10 27.10.13 2996 3486/382 28 113 260 07.12.10 08.10.13 2217 2277/277 29 113 246 22.10.10 15.12.13 1486 1486/243 30 113 250 06.11.10 21.10.13 1836 1836/298 31 113 254 12.11.10 04.11.13 1185 1494/387
9.20: List of breeding / young bulls as on 31.03.2015 Sr. No.
Bull No.
Date of Birth Dam No. Sire No. Dams Best 305 DLMY (kg)
Semen doses available
Remarks
1 991 29.09.07 452 535 3038 2235 5th 2 025 04.01.08 540 535 3039 1540 5th 3 027 13.01.08 828 577 3979 955 5th 4 063 30.07.08 822 577 3348 2500 5th 5 168 14.11.09 965 802 2446 585 6th 6 181 17.01.10 621 716 2929 908 6th 7 226 13.10.10 828 719 3979 - 6th 8 251 24.03.11 827 702 3050 85 6th 9 252 12.05.11 900 891 3743 - 6th 10 254 02.06.11 60 916 1722 40 6th

95
11 245 07.02.11 841 Suraj 3527 500 12 214 18.09.10 540 719 3039 1200 13 231 22.10.10 32 719 2771 895 14 232 26.10.10 487 719 3421 - 15 285 05.11.11 74 891 2478 -
9.21: Target Achieved during the year 2014-15 No Trait Target Achieved (2014-15) 1 Av. age at first service (months) or 300 kg
body weight 24 Less than 24(months)
2 Av. age at first calving (months) 40 39.9 3 Av. age for initiating training of bulls
(months) or 350 kg body weight 18 20
4 Av. age at first collection (months) 30 --- 5 Av. service period (days) 130 112 6 Calf mortality (0-3 months) ≤ 5% 0.68 7 Wet average (kg) ≥ 8.5 kg 8.48 8 Herd average (kg) ≥ 5.5 kg 5.98

96
Financial Statement for the year 2014-15 (Rs in Lakhs)
Sanctioned as per R E Total ICAR Share
Released ICAR Share as per R E
Expenditure as per AUC Receipts (ICAR Share)
Balance ICAR Share
State Share
14.47872 14.47872 14.47872 14.47872 - - - Herd Performance Herd strength at the centre was 493 including 178 breedable buffaloes. Number of young
males was 148 out of which 16 were breedable bulls. Male calves are being used for meat experiment. Total 126 calvings were reported during the year out of which 56 were male and 68 were female. Calf mortality (0-3 months) was 0.68 % (1/148) indicating good calf management at the centre. Conception rate was 39.39 % and it need to be improved. 31474 doses of semen produced during 2014-15, 1312 doses used for AI/testing purpose and the centre has sold 23325 frozen semen doses to developmental agencies and farmers. It indicates increased demand of Nili Ravi semen. 305 or less day lactation milk yield was 2384±45.39 kg (n=115) which is 113 kg more than the previous year (2241 kg). This was the highest 305 or less day milk yield since inception. Average lactation length also improved to 303 days from last year (285 days). Reproductive performance at the centre was good. This year Age at first calving, Service Period, Dry Period and Calving Interval were 39.9 (n=36) months, 112±7.89 (n=88) days, 138 (n=88) days and 420 (n=88) days respectively. The wet and herd averages were 8.48 (n=99) and 5.98 (n=140) with 71 % animals in milk. Overall the performance of the centre is good.
Targets achieved during 2014-15 S. No Trait Target Achieved 1. Av. Age at first service (months) 24 months (300 kg. B. wt.) < 24months 2. Av. Age at first calving 40 months 39.90 3. Av. Age for initiating training of bulls
(months) 18 months (350 kg. B. wt.) 20
4. Av. Age at first collection 30 months (400 kg. B. wt.) -- 5. Av. Service period 130 days 112 6. Calf mortality (0-3 months) ≤ 5% 0.68 % 7. Wet average ≥ 8.5 kg 8.48 kg. 8. Herd average ≥ 5.5 kg 5.98 kg.
Recommendations: The semen and bulls to be distributed in the breeding tract of Nili Ravi with the help of AH
Department of Punjab. Semen freezing activity outsourced to ‘A grade’ accredited Nabha Sperm Station of AHD, Punjab through MoU for collaboration in quality semen production.
Project Co-ordinator’s observations on centre performance

97
JUNAGADH AGRICULTURAL UNIVERSITY, JUNAGADH (GUJARAT) 1. Name of center : Cattle Breeding Farm, Junagadh Agricultural University, Junagadh. 2. Project Code : 18-3 / 97-ASR - II dt. 29 / 03 / 2001 3. Project Title : Network Project on Buffalo Improvement ( Jaffarabadi )
4. Date of Start : 01/ 04 / 2001 5. Objectives : As per NWP(BI) 6. Technical Program: The technical programme of the project for the year 2014-15 was carried
out as per the approved mandate both at the station as well as in field. Frozen semen doses of seven bulls (6 bulls of set 2) were used at the station as well as in the field in varying numbers. The semen doses of 2nd set of bulls had to be used to meet the demand of the field centres The progress of the station and the field has been presented in the report. Besides Forteen ongoing centres, Dolasa and Ghumali Center had to be closed as the Operter Shifted to Other place. All the breedable females of the station were allotted to new set of Six bulls. They are being breed as per the allotment. Collection and freezing of semen from bulls of set 1 has been discontinued from 2011-12 and frozen semen doses of the new (2nd set) is being used for breeding females., both in field as well as at station. The performance of the station herd has been given in tables 9.1 to 9.21. The overall reproductive performance was satisfactory with respect to fertility, AFC, Service period, Dry period and Calving interval. Targets were fulfilled in terms of Service Period, Wet average and Calf mortality (Table 9.14,9.17.1 & 9.4). Figure for and Herd average is closer to the given target However, the target given for Age at first calving appears to be very high for Jaffrabadi breed
7. Financial Statement: Budget Head: 2305/03 Year: 2014-15 Item / Head Grant ( Rs. )
Allotted Expenditure Balance A. Recurring Pay & Allowances 1500000 843550
8820 656450
TA 50000 41180 Pay & Allow. + TA 1550000 852370 697630 Contingency 3750000 3749765 235 Anim. Purch. -- - Total 3750000 3749765 235 B. Non-recurring 300000 297221 2779 Total 300000 297221 2779 Total 5600000 4899356 700644 8. Staff Position (Present and revised) (2014-15) ( i ) Staff position:- No Desig. & No. of posts
Sanctioned Name of the
person employed Dt. of joining Total time
spent Remarks
1. Asso Res Sci. (AGB) 01 Vacant -- -- -- 2 Asst Res Sci. 01
(Anim. Reproduction) Vacant -- -- --
3 Tech. Asstt. (LAB) 01 A.P.Patel 03-01-2009 Full -

98
Herd performance : 9.1 Herd Strength During the Period 4 / 2014 to 3 / 2015
Category Addition Disposal Sr. No. OB B T D T S CB Female 1. Female Calves below 3 months 5 16 1 14 6 2. Female Calves 3-6 months 7 14 14 2 5 3. Female Calves 6-12 months 17 14 28 3 4. Heifers above
1-2 years 19 28 19 28 2-2.5 years 19 19 27 11 Above 2.5 years 49 27 1 05 70 5. Buffaloes in Milk 40 35 37 38 6. Buffaloes Dry P/NP 49 37 30 13 43 Sub Total 205 16 174 2 174 15 204 Male 1. Male Calves below 3 months 2 19 0 15 0 6 2. Male Calves 3-6 months 9 15 0 13 0 11 3. Male Calves 6-12 months 19 13 0 29 01 02 4. Male 1-2 years 22 29 0 15 07 29 Above 2 years 15 15 0 9 04 17 5. Breeding bulls 9 9 0 0 0 18 6. Bullocks 0 0 0 0 0 00 7. Teasers 1 0 0 0 0 01 Sub Total 77 19 81 0 81 12 84 Grand Total 282 35 255 2 255 27 288 OB = Opening Balance D = Deaths S = Sale B = Births T = Transfer CB = Closing Balance 9.2. Calving Statistics During the Period 4/2014 to 3/2015 Month
Male No. %
Female NO. %
Still Birth No. %
Overall No. %
April, 14 0 0.00 0 0.00 0 0.00 May 1 5.26 0 0.00 1 2.78 June 0 0.00 0 0.00 0 0.00 July 0 0.00 1 6.25 1 2.78 August 1 5.26 2 12.50 3 8.33 September 0 0.00 0 0.00 0 0.00 October 1 5.26 2 12.50 3 8.33 November 2 10.53 2 12.50 4 11.11 December 8 42.11 3 18.75 1 12 33.33 January, 15 4 21.05 1 6.25 5 13.89 February 2 10.53 2 12.50 4 11.11 March 0 0.00 3 18.75 3 8.33 Overall 19 100.00 16 100.00 1 36 100.00 Sex ratio Male : Female

99
9.3. Disposal of Animals During the Period 4/2014 to 3/2015 Female
Category Surplus Repd. Problem
Weak & Old
Death
Experimental purposes
Total 1.Female Calves < 6 Months 02 01 03 6-12 Months 00 00 2. Heifers 1-2.5 years 00 00 >2.5 years 01 01 3. Buffaloes Dry 13 00 13 Milch Sub Total 15 02 17 Male 1.Male Calves 00 00 < 6 Months 6-12 Months 01 01 2. Above 1 year 11 11 3. Young Bulls 4. Breeding Bulls 5. Bullock+Teaser Sub Total 12 00 00 00 00 12 Grand Total 27 00 00 02 00 29 9.4. Monthwise Mortality During the Period 4/2014 to 3/2015 Month
Female Male Overall
Herd 0-3 3-6 6-
12 1-2 Yrs.
Above 2 Yrs.
Overall Female 0-3 3-6 6-
12 Abov
e Overall Male
Overall No. 21 7 17 19 157 221 21 9 19 47 96 317 Died 1 1 1 2 0 0 2
% 4.76 14.29 0.0 0.00 0.64 0.90 0.00 0.0 0.0 0.00 0.00 0.63 Calf mortality (0-3 months) was 2.38 percent 9.5. Causes of Mortality (quarterwise) During the Period 4/2014 to 3/2015 Particulars 1st quarter 2nd quarter 3rd quarter 4th quarter A.Respiratory System : 1.Broncho-Pheumonia 1 B. Digestive System : 1.Septicamia&Toxaemia C. Others 1.Accidents 1 2.Coliboeillosis 1 Total 0 0 0 2 9.6 Prophylactic Measures Taken During the Period 4/2014 to 3/2015 Vaccination No. of Animals
Available Inoculated No. of Animalas Screening Tested Results
No. of Animalas Treated for Parasitism
FMD 222 222 -- -- Deworming of General Herd
HS 222 222 -- -- BQ 222 222 -- -- RP -- -- -- -- Brucellosis 18 18 89 03

100
9.7 Calving Abnormalities (Quarterwise) During the Period 4/2014 to 3/2015 Quarter No.of
Calv. Dystokia Retention of
Plancenta Prolapse Others (Stil
births) Total Abortions
No. % No. % No. % No. % No. % No. I 1 II 4 III 18 01 01 IV 12 02 01 03 Overall 35 03 01 04 9.10 Female Conception Rate During the Period 4/2014 to 3/2015 No. of Animalas No. of Services Overall Parity I II III IV V&Above I C CR I C CR I C CR I C CR I C CR I C CR Heifers 8 5 62.5 3 2 66.0 0 0 0 0 0 0 0 0 0 11 7 63.6 Adults I 14 7 50.0 7 4 57.0 3 1 33.3 0 0 0 0 0 0 24 12 50.0 II 18 11 61.0 7 3 42.8 2 0 0 0 0 0 0 0 0 27 14 51.9 III 11 6 54.0 5 2 40.0 3 1 33.0 0 0 0 0 0 0 19 09 47.4 IV 11 5 45.0 6 2 33.0 3 1 33.3 0 0 0 0 0 0 20 08 40.0 V 4 2 50.0 2 1 50.0 0 0 0 0 0 0 0 0 0 6 3 50.0 VI 4 2 50.0 2 1 50.0 1 1 100.0 0 0 0 0 0 0 7 4 57.1 VII 1 1 100.0 0 0 0 0 0 0 0 0 0 0 0 0 1 1 100.0 Overall 71 39 54.91 32 15 46.86 12 4 33.33 0 0 0.0 0 0 0.0 115 58 50.43 I = No. of Animalas Inseminated C = No. of Animalas Conceived CR% = Conception Rate% 9.9 Bullwise Conception Rate During the Period 4/2014 to 3/2015 Sr. No. Bull No. Total Number of AI Total Conceived CR%
1. Moti 13 8 61.54 2. Sundar 19 8 42.11 3. Bholenath 14 7 50.00 4. Haresh 14 8 57.14 5. Dhingalo 16 7 43.75 6. Nayan 21 10 47.61 7. Laxman 18 10 55.56
Total 115 58 50.44 9.10 Bull Wise Semen Stock Bull No. Set No. Opening
Balance Semen Prouduced /Received
Consumption for AI/ Supplied
Balance
Bhagro I 6683 162 0 6845 Laxman I 3423 0 6 3417 Nagraj I 2580 759 0 3339 Sub Total 12686 921 6 13601 Moti II 7321 4961 385 11897 Haresh II 2550 0 760 1790 Sunder II 3021 0 7 3014 Raja II 3777 1117 2055 2839 Dhinglo II 5324 2854 1513 6665 Bholenath II 2238 0 399 1839
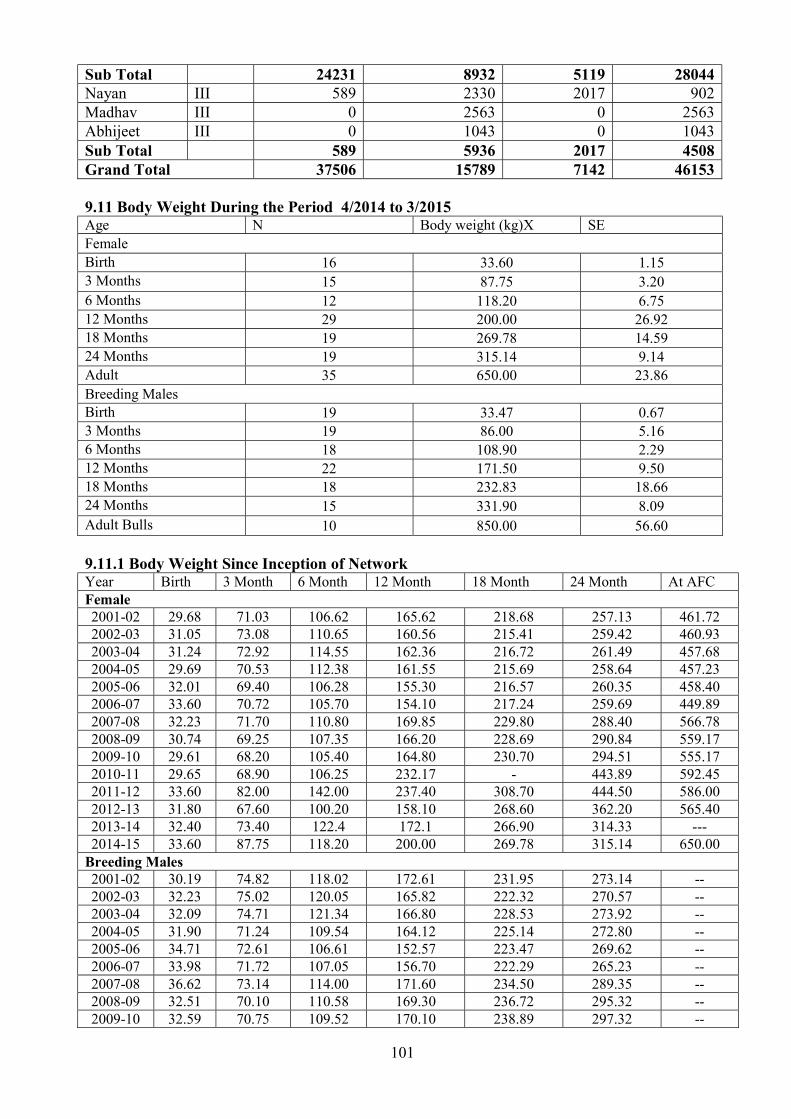
101
Sub Total 24231 8932 5119 28044 Nayan III 589 2330 2017 902 Madhav III 0 2563 0 2563 Abhijeet III 0 1043 0 1043 Sub Total 589 5936 2017 4508 Grand Total 37506 15789 7142 46153 9.11 Body Weight During the Period 4/2014 to 3/2015 Age N Body weight (kg)X SE Female Birth 16 33.60 1.15 3 Months 15 87.75 3.20 6 Months 12 118.20 6.75 12 Months 29 200.00 26.92 18 Months 19 269.78 14.59 24 Months 19 315.14 9.14 Adult 35 650.00 23.86 Breeding Males Birth 19 33.47 0.67 3 Months 19 86.00 5.16 6 Months 18 108.90 2.29 12 Months 22 171.50 9.50 18 Months 18 232.83 18.66 24 Months 15 331.90 8.09 Adult Bulls 10 850.00 56.60 9.11.1 Body Weight Since Inception of Network Year Birth 3 Month 6 Month 12 Month 18 Month 24 Month At AFC Female 2001-02 29.68 71.03 106.62 165.62 218.68 257.13 461.72 2002-03 31.05 73.08 110.65 160.56 215.41 259.42 460.93 2003-04 31.24 72.92 114.55 162.36 216.72 261.49 457.68 2004-05 29.69 70.53 112.38 161.55 215.69 258.64 457.23 2005-06 32.01 69.40 106.28 155.30 216.57 260.35 458.40 2006-07 33.60 70.72 105.70 154.10 217.24 259.69 449.89 2007-08 32.23 71.70 110.80 169.85 229.80 288.40 566.78 2008-09 30.74 69.25 107.35 166.20 228.69 290.84 559.17 2009-10 29.61 68.20 105.40 164.80 230.70 294.51 555.17 2010-11 29.65 68.90 106.25 232.17 - 443.89 592.45 2011-12 33.60 82.00 142.00 237.40 308.70 444.50 586.00 2012-13 31.80 67.60 100.20 158.10 268.60 362.20 565.40 2013-14 32.40 73.40 122.4 172.1 266.90 314.33 --- 2014-15 33.60 87.75 118.20 200.00 269.78 315.14 650.00
Breeding Males 2001-02 30.19 74.82 118.02 172.61 231.95 273.14 -- 2002-03 32.23 75.02 120.05 165.82 222.32 270.57 -- 2003-04 32.09 74.71 121.34 166.80 228.53 273.92 -- 2004-05 31.90 71.24 109.54 164.12 225.14 272.80 -- 2005-06 34.71 72.61 106.61 152.57 223.47 269.62 -- 2006-07 33.98 71.72 107.05 156.70 222.29 265.23 -- 2007-08 36.62 73.14 114.00 171.60 234.50 289.35 -- 2008-09 32.51 70.10 110.58 169.30 236.72 295.32 -- 2009-10 32.59 70.75 109.52 170.10 238.89 297.32 --
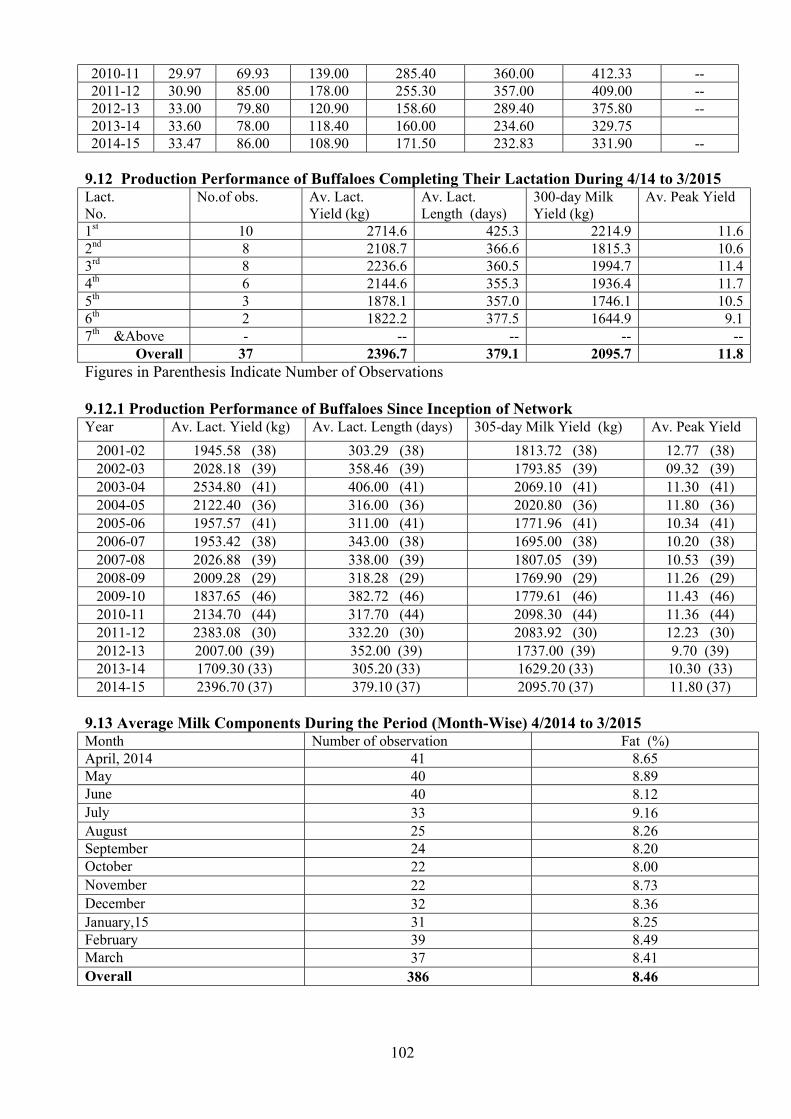
102
2010-11 29.97 69.93 139.00 285.40 360.00 412.33 -- 2011-12 30.90 85.00 178.00 255.30 357.00 409.00 -- 2012-13 33.00 79.80 120.90 158.60 289.40 375.80 -- 2013-14 33.60 78.00 118.40 160.00 234.60 329.75 2014-15 33.47 86.00 108.90 171.50 232.83 331.90 --
9.12 Production Performance of Buffaloes Completing Their Lactation During 4/14 to 3/2015 Lact. No.
No.of obs. Av. Lact. Yield (kg)
Av. Lact. Length (days)
300-day Milk Yield (kg)
Av. Peak Yield 1st 10 2714.6 425.3 2214.9 11.6 2nd 8 2108.7 366.6 1815.3 10.6 3rd 8 2236.6 360.5 1994.7 11.4 4th 6 2144.6 355.3 1936.4 11.7 5th 3 1878.1 357.0 1746.1 10.5 6th 2 1822.2 377.5 1644.9 9.1 7th &Above - -- -- -- --
Overall 37 2396.7 379.1 2095.7 11.8 Figures in Parenthesis Indicate Number of Observations 9.12.1 Production Performance of Buffaloes Since Inception of Network Year Av. Lact. Yield (kg) Av. Lact. Length (days) 305-day Milk Yield (kg) Av. Peak Yield
2001-02 1945.58 (38) 303.29 (38) 1813.72 (38) 12.77 (38) 2002-03 2028.18 (39) 358.46 (39) 1793.85 (39) 09.32 (39) 2003-04 2534.80 (41) 406.00 (41) 2069.10 (41) 11.30 (41) 2004-05 2122.40 (36) 316.00 (36) 2020.80 (36) 11.80 (36) 2005-06 1957.57 (41) 311.00 (41) 1771.96 (41) 10.34 (41) 2006-07 1953.42 (38) 343.00 (38) 1695.00 (38) 10.20 (38) 2007-08 2026.88 (39) 338.00 (39) 1807.05 (39) 10.53 (39) 2008-09 2009.28 (29) 318.28 (29) 1769.90 (29) 11.26 (29) 2009-10 1837.65 (46) 382.72 (46) 1779.61 (46) 11.43 (46) 2010-11 2134.70 (44) 317.70 (44) 2098.30 (44) 11.36 (44) 2011-12 2383.08 (30) 332.20 (30) 2083.92 (30) 12.23 (30) 2012-13 2007.00 (39) 352.00 (39) 1737.00 (39) 9.70 (39) 2013-14 1709.30 (33) 305.20 (33) 1629.20 (33) 10.30 (33) 2014-15 2396.70 (37) 379.10 (37) 2095.70 (37) 11.80 (37)
9.13 Average Milk Components During the Period (Month-Wise) 4/2014 to 3/2015 Month Number of observation Fat (%) April, 2014 41 8.65 May 40 8.89 June 40 8.12 July 33 9.16 August 25 8.26 September 24 8.20 October 22 8.00 November 22 8.73 December 32 8.36 January,15 31 8.25 February 39 8.49 March 37 8.41 Overall 386 8.46

103
9.14 Reproduction Performance of Buffaloes During the Period 4/2014 to 3/2015 Traits 1 2 3 4 5 6 7&
Above Overall
Average Age at calving(Months)
N 05 05 X 1416.60
(46.60 mth)
1416.60 (46.60 mth)
SE 65.45 (2.15 mth)
65.45 (2.15 mth)
Average Service Period (Day)
N 6 7 8 4 3 2 30 X 139.17 149.14 122.50 126.25 201.33 122.50 140.43 SE 25.72 31.05 19.42 19.76 45.04 22.50 11.50
Average Dry period(Day)
N 6 7 8 4 3 2 30 X 139.50 202.57 178.50 197.00 165.67 164.00 176.53 SE 6.94 39.90 31.91 22.67 54.72 80.00 14.29
Average Calving Interval (Day)
N 6 7 8 4 3 2 30 X 449.17 459.14 432.50 436.25 511.33 432.50 450.43 SE 25.72 31.05 19.42 19.76 45.04 22.50 11.50
9.14.1 Reproduction Performance of Buffaloes Since Inception of Netwoerk Year AFC (Months) Service Period (days) Dry Period (days) Calving Interval (days)
2001-02 46.84 (13) 159.41 (33) 166.50 (33) 496.36 (33) 2002-03 47.02 (15) 155.12 (33) 179.66 (33) 465.79 (33) 2003-04 57.71 (3) 205.00 (23) 213.00 (23) 513.00 (23) 2004-05 59.44 (12) 225.00 (34) 195.00 (33) 539.00 (34) 2005-06 59.97 (16) 194.00 (45) 218.00 (45) 459.00 (45) 2006-07 55.57 (11) 188.00 (32) 267.00 (35) 499.00 (32) 2007-08 59.53 (07) 263.08 (24) 238.83 (24) 568.33 (24) 2008-09 59.52 (11) 302.69 (41) 249.62 (41) 543.67 (41) 2009-10 54.28 (20) 149.52 (45) 194.20 (45) 463.35 (45) 2010-11 52.66 (11) 127.40 (35) 168.70 (35) 436.80 (35) 2011-12 49.28 (06) 186.09 (23) 161.83 (23) 484.48 (23) 2012-13 49.31 (10) 174.00 (42) 464.58 (42) 217.16 (42) 2013-14 48.00 (24) 144.67 (33) 206.51 (43) 523.16 (43) 2014-15 46.60 (5) 140.43 (30) 176.53 (30) 450.43 (30)
9.15 Monthwise Milk Production and Disposal During the Period 4/2014 to 3/2015 Month Total Milk
Produced (kg) Disposal Liquid Milk Calf Feeding Expt.
April, 2014 9686.6 8802.0 884.6 May 8495.85 7707.5 788.35 June 7070.25 6421.5 648.75 July 6105.55 5515.5 590.05 August 5311.9 4789.0 522.9 September 4934.05 4467.5 466.55 October 4957.15 4440.5 516.65 November 5149.65 4642.5 507.15 December 6665.45 5910.5 754.95 January,15 9413.8 8486.0 927.8 February 10329.55 9319.5 1010.05 March 11842.6 10724.0 1118.6
Total 89962.4 81226 8736.4

104
9.16 Feed and Fodder purchased and Offered to Animals During the Period 4/2014 to 3/2015 Quarter Qty. prod. at farm (kg) Qty. Purchased(kg) Actually fed kg Balance (kg)
I Green 651400 - 651400 - Dry 175000 - 79000 96000 Silage - - - - Concentrate - 87160 82700 4460
II Green 518300 - 518300 - Dry 96000 - 53000 43000 Silage - - - - Concentrate - 99480 78250 21230
III Green 636580 - 636580 - Dry 75000 - 101500 16500 Silage - - - - Concentrate - 91530 74800 16730
IV Green 1285000 - 1285000 - Dry 628200 - 15000 613200 Silage - - - - Concentrate - 115490 88300 27190
Total Green 3091280 - 3091280 - Dry 974200 - 248500 768700 Silage - - - - Concentrate - 393660 324050 69610
9.17 Milking Performance during the period 4/2014 to 3/2015
Month Animal in Milk Animal Dry Total Animal % in Milk Wet Av.(kg) Herd Av.(kg) April, 2014 40 49 89 44.94 8.07 3.63 May 40 49 89 44.94 6.85 3.08 June 37 51 88 42.05 6.37 2.68 July 31 46 77 40.26 6.35 2.56 August 29 50 79 36.71 5.91 2.17 September 28 51 79 35.44 5.87 2.08 October 23 56 79 29.11 6.95 2.02 November 24 55 79 30.38 7.15 2.17 December 33 47 80 41.25 6.52 2.69 January,15 36 44 80 45.00 8.44 3.80 February 37 44 81 45.68 9.97 4.55 March 38 43 81 46.91 10.05 4.72 Overall 33.00 48.75 81.75 40.22 7.38 3.01 9.17.1 Milking performance since inception Month Animal in Milk Animal Dry Total Animal % in Milk Wet Av.(kg) Herd Av.(kg) 2001-02 40.00 31.00 71.00 56.19 5.44 3.01 2002-03 32.00 34.00 66.00 48.89 7.19 3.55 2003-04 26.00 35.00 61.00 41.26 8.03 3.30 2004-05 32.00 34.83 66.89 44.65 7.91 3.96 2005-06 33.00 46.58 79.58 41.80 7.45 3.08 2006-07 34.00 44.92 78.92 42.27 7.31 3.11 2007-08 30.75 40.58 71.42 42.87 7.52 3.21 2008-09 25.25 43.12 69.41 39.05 6.81 2.44 2009-10 37.63 47.93 85.56 43.85 6.46 2.85 2010-11 35.14 33.92 69.06 50.32 7.27 3.62 2011-12 27.67 20.08 47.75 58.03 6.91 4.06 2012-13 34.00 51.33 85.33 39.78 6.73 2.67 2013-14 34.00 47.42 81.42 40.64 6.90 2.83 2014-15 33.00 48.75 81.75 40.22 7.38 3.01

105
9.18 Bull wise daughters born during the period 4/2014 to 3/2015 Bull No. Total No. of
daughters born No. of daughters reaching A.F.C.
No. of daughters completing 1st Lact
Last Lact. GAJANAN 00 01 01 KHEMLO 00 02 01 NAGRAJ 00 02 04 MOTI 03 00 00 SUNDAR 04 00 00 ASHOK 00 00 02 LAXMAN 04 00 01 BHOLENATH 03 00 00 HARESH 02 00 00 NA 00 00 01
TOTAL 16 05 10 9.19 Bull wise daughters completing 1st lactation during the period 4/2014 to 3/2015 Sr. No.
Bull No. Daughter No.
Date of birth
Date of calving
First lact. 305 day or less milk yield (kg)
Total yield
L.L Remarks
1 ASHOK 24/07 04-09-2007 02-05-2013 2436.4 2752.1 420 2 GAJANAN 55/08 15-12-2008 25-08-2013 2078.9 2231.0 339 3 ASHOK 19/08 08-09-2008 27-08-2013 2453.0 2588.4 328 4 NA AM16/11 PURCHASED 15-09-2013 2448.4 2527.0 332 5 NAGRAJ 40/10 26-09-2010 30-09-2013 1948.3 2155.6 384 6 NAGRAJ 21/10 16-08-2010 07-10-2013 1491.8 1873.1 397 7 LAKSHMAN 03/09 15-01-2009 18-08-2013 2643.4 3352.6 480 8 KHEMALO 27/09 26-08-2009 31-08-2013 2325.1 3235.4 512 9 NAGRAJ 53/09 10-10-2009 31-08-2013 2269.6 3360.3 494 10 NAGRAJ 49/09 03-10-2009 05-09-2013 2054.3 3070.7 567
AV. 2214.9 2714.6 425.3 SE 105.3 167.6 26.6
9.20 List of breeding / young bulls as on 31-3-2015 Sr. No.
Bull No.
Date of Birth
Dam No.
Sire No.
Dams best lact.305 or less days yield (kg)
Semen doses available
Remarks
I set 1 Ranjeet 21.11.00 Rasmita Ajay 4776 AI centre Rajkot 2 Rupesh 5.11.99 Rupa Rustam 5000 AI centre Rajkot 3 Ashok 16.11.98 Ambika Rustam 6020 AI centre Rajkot 4 Manek 16.11.06 Mayuri Lakheno 4700 AI centre Rajkot 5 Bhagro Purchased ---- ---- 20 lit/d CBF 6 Gajanan 4/02 29.1.02 Gauri Jugnu 2846 CBF 7 Nagraj 18-12-02 Nagari Rupnath 2957 CBF 8 Laxman 16-10-03 Laxmi Subiraj 3738.0 CBF
II set 1 Haresh 08-02-04 Hitad Hemalo 2884.0 2009-10 2 Moti Purchased -- -- >3000 litter 2010-11 3 Sunder 13-07-05 Sundari Lailano 2732.0 2012-13 4 Raja 08-05-04 Ranjita Subiraj 2948.0 2012-13 5 Dhinglo Purchased -- -- >3000 litter 2013-14 6 Bholenath Purchased -- -- >3000 litter 2013-14
III set

106
1 Nayan (07/10) 12-06-10 Mira Nagraj 4120.9 litter Sept -2014 2 Abhijit (A1/10) Purchased Hedi 3184.2 3 Madhav(37/10) 19-09-10 Manisha Nagraj 3895.8 4 Alok Purchased >3500 5 Bhairav(17/12) 27-07-12 Bhuri Gajanan 2481.7 6 Ronak(09/11) 10-07-11 Rita Gajanan 2491.5
9.20 List of breeding / young bulls as on 31-3-2015 Sr.No. Bull No. Set Date of
Birth Dam No.
Sire No. Dams best lact.300days or less yield (kg)
Semen doses available
Remarks
1 Bhagro I Purchased ---- ---- 20 lit/d 6845 2 Laxman I 16-10-03 Laxmi Subiraj 3738.0 3417 3 Nagraj I 18-12-02 Nagari Rupnath 2957.0 3339 4 Moti II Purchased -- -- >3000 litter 11897 5 Haresh II 08-02-04 Hitad Hemalo 2884.0 1790 6 Sunder II 13-07-05 Sundari Lailano 2732.0 3014 7 Raja II 08-05-04 Ranjita Subiraj 2948.0 2839 8 Dhinglo II Purchased -- -- >3000 litter 6665 9 Bholenath II Purchased -- -- >3000 litter 1839 10 Nayan III 12-06-10 Mira Nagraj 4120.9 litter 902 11 Madhav III 19-09-10 Manisha Nagraj 3895.8 2563 12 Abhijeet III Purchased Hedi 3184.2 1043 9.21 Target Achieved During the year 2014-2015 Sr No.
Trait Target Achieved 1. Av. Age at first service (months) 22mth. -- 2. Av. Age at first calving 42mth. 46.60 months 3. Av. Age for initiating training of bulls (months) - 32 months 4. Av. Age at first collection - 40 months 5. Av. service period 140days 140.43 days 6. Calf mortality (0-3 months) ≤ 5% 2.38 7. Wet Average ≥ 7.5 kg 7.38 8. Herd Average ≥ 4.0 kg 3.01

107
Performance of JAU, Junagadh (Field Units)
F 1. Herd Strength of Registered Females at Different Field Centres during 2014-2015 Centres/ Village OB Addition Deduction
New Reg. Birth Purchase Sold Death CB SHEDHAYA 1588 154 39 1781 PIPALI 1871 237 49 2157 LOEJ 9916 922 223 11061 MOVANA 4269 336 59 4664 SURVA 2418 346 63 2827 MAND LIKPUR 2529 480 126 3135 SHERADI 1477 356 64 1897 HADMDIYA 530 146 15 691 GUNDALA 569 274 33 876 PORBANDAR 0 478 0 478 KHORASA 245 216 30 491 ODADAR 0 686 30 716 CHANCHAKVAD 0 150 0 150 Total 28179 4781 731 33691 F 2. Status of Breedable Females at Different Field Unit Centres during 2014-2015 Centres/ Village
Heifers > 3 years Buffalo (NP) Buffalo Pregnant Total Pregnant In Milk Dry In Milk Dry
SHEDHAYA 283 PIPALI 219 LOEJ 1416 MOVANA 421 SURVA 235 MAND LIKPUR 156
SHERADI 31 HADMDIYA 20 GUNDALA 12 PORBANDAR 0 KHORASA 0 ODADAR 0 CHANCHAKVAD 0 Total 2793

108
F 3. Monthly AI at Different Field Unit Centers During Period 4/2014 to 3/2015
Month
Centre / Village
Total SH
EDHA
YA
PIPAL
I
LOEJ
MOVA
NA
SURV
A
MAND
LIKPU
R
SHER
ADI
HADM
DIYA
GUND
ALA
PORB
ANDA
R
KHOR
ASA
ODAD
AR
CHAC
HAKV
AD
April, 14 11 16 55 27 20 31 38 7 31 34 10 0 0 280 May 12 17 62 8 14 35 36 5 35 23 12 0 0 259 June 12 13 62 0 25 34 27 4 20 18 13 0 0 228 July 12 17 66 32 21 43 28 7 21 48 10 53 0 358 August 12 14 57 17 31 45 28 6 22 31 9 45 0 317 September 13 16 94 49 31 59 34 7 30 23 14 46 14 430 October 14 15 92 43 40 55 26 9 28 44 20 91 23 500 November 14 30 84 52 41 65 27 28 20 72 0 104 30 567 December 14 30 127 38 36 45 34 14 11 64 28 107 30 578 January,15 14 28 95 41 33 25 26 26 20 56 42 88 29 523 February 14 27 67 9 27 15 24 14 16 24 32 77 15 361 March 12 14 61 20 27 28 28 19 20 41 26 75 9 380 Total 154 237 922 336 346 480 356 146 274 478 216 686 150 4781
F 4. Bull-wise AI at Different Field Unit Centers During the Period 4/2014 to 3/2015 Months Bull No.
Total Bhagro Bholenath Nagraj Laxman Haresh Moti Raja Sundar April, 14 0 280 0 0 0 0 0 0 280 May 65 194 0 0 0 0 0 0 259 June 86 142 0 0 0 0 0 0 228 July 201 125 0 0 0 32 0 0 358 August 260 0 0 0 0 57 0 0 317 September 345 0 14 0 71 0 0 0 430 October 82 0 0 0 266 0 152 0 500 November 50 0 0 0 57 0 460 0 567 December 0 0 0 0 11 0 567 0 578 January,15 0 0 0 0 31 0 197 295 523 February 0 0 0 0 0 0 27 334 361 March 0 0 0 3 0 0 27 350 380 Total 1089 741 14 03 436 89 1430 979 4781
F 5. Monthwise Conception at Different Field Unit Centers During the Period 4/2014 to 3/2015
Month Village / Centre SHEDHAYA PIPALI LOEJ MOVANA SURVA MAND LIKPUR SHERADI P E P E P E P E P E P E P E April, 14 6 6 8 6 71 41 6 9 18 10 34 34 14 22 May 6 6 8 7 54 35 20 16 0 0 26 24 8 16 June 8 6 6 8 33 32 17 11 23 17 30 33 13 14 July 7 4 6 8 33 22 9 18 11 9 14 17 19 19 August 6 6 8 9 28 12 3 5 8 6 15 19 17 19 September 6 5 7 6 31 32 0 0 15 10 14 20 12 15 October 5 7 11 6 21 16 14 18 13 9 16 27 11 17 November 8 4 9 5 16 12 10 7 17 14 20 25 11 17 December 7 6 10 6 42 23 23 26 18 13 26 33 14 20 January,15 8 6 8 7 53 39 24 20 22 18 26 29 12 14 February 7 7 17 12 49 35 29 23 24 17 32 33 10 17 March 8 6 16 14 71 56 20 18 23 13 22 23 14 20 Total 82 69 114 94 502 355 175 171 192 136 275 317 155 210
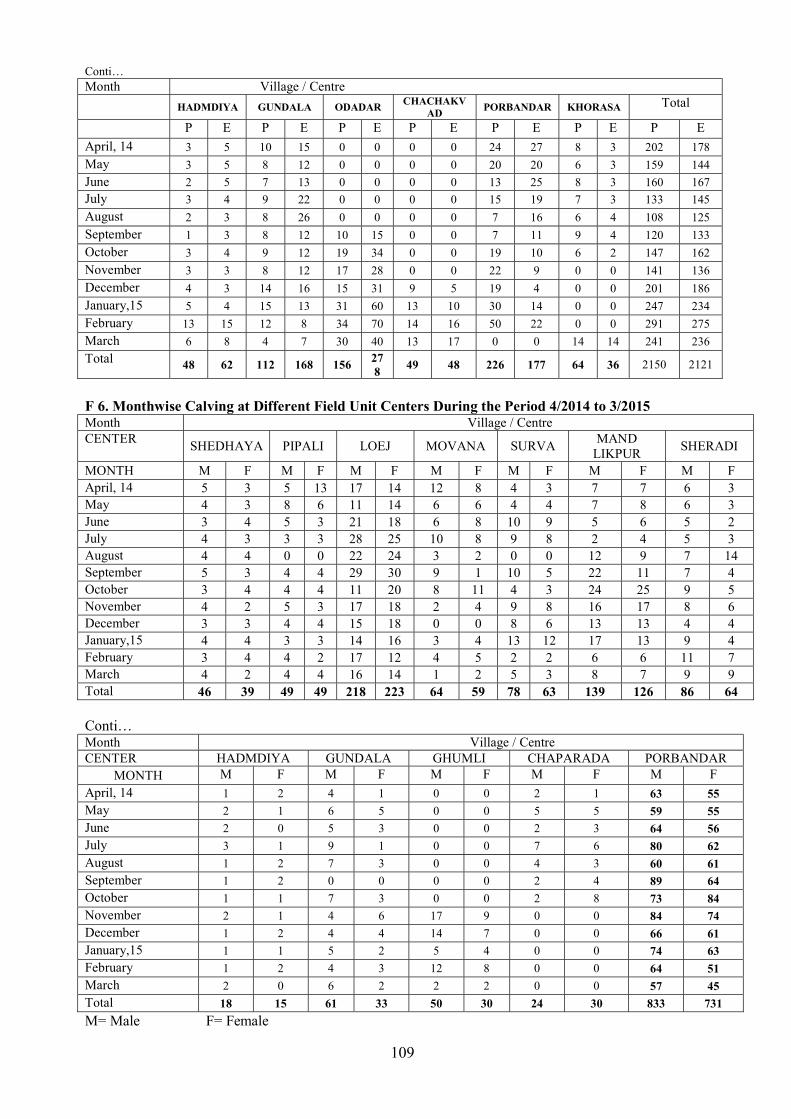
109
Conti… Month Village / Centre HADMDIYA GUNDALA ODADAR CHACHAKV
AD PORBANDAR KHORASA Total P E P E P E P E P E P E P E April, 14 3 5 10 15 0 0 0 0 24 27 8 3 202 178 May 3 5 8 12 0 0 0 0 20 20 6 3 159 144 June 2 5 7 13 0 0 0 0 13 25 8 3 160 167 July 3 4 9 22 0 0 0 0 15 19 7 3 133 145 August 2 3 8 26 0 0 0 0 7 16 6 4 108 125 September 1 3 8 12 10 15 0 0 7 11 9 4 120 133 October 3 4 9 12 19 34 0 0 19 10 6 2 147 162 November 3 3 8 12 17 28 0 0 22 9 0 0 141 136 December 4 3 14 16 15 31 9 5 19 4 0 0 201 186 January,15 5 4 15 13 31 60 13 10 30 14 0 0 247 234 February 13 15 12 8 34 70 14 16 50 22 0 0 291 275 March 6 8 4 7 30 40 13 17 0 0 14 14 241 236 Total 48 62 112 168 156 27
8 49 48 226 177 64 36 2150 2121 F 6. Monthwise Calving at Different Field Unit Centers During the Period 4/2014 to 3/2015 Month Village / Centre CENTER SHEDHAYA PIPALI LOEJ MOVANA SURVA MAND
LIKPUR SHERADI MONTH M F M F M F M F M F M F M F April, 14 5 3 5 13 17 14 12 8 4 3 7 7 6 3 May 4 3 8 6 11 14 6 6 4 4 7 8 6 3 June 3 4 5 3 21 18 6 8 10 9 5 6 5 2 July 4 3 3 3 28 25 10 8 9 8 2 4 5 3 August 4 4 0 0 22 24 3 2 0 0 12 9 7 14 September 5 3 4 4 29 30 9 1 10 5 22 11 7 4 October 3 4 4 4 11 20 8 11 4 3 24 25 9 5 November 4 2 5 3 17 18 2 4 9 8 16 17 8 6 December 3 3 4 4 15 18 0 0 8 6 13 13 4 4 January,15 4 4 3 3 14 16 3 4 13 12 17 13 9 4 February 3 4 4 2 17 12 4 5 2 2 6 6 11 7 March 4 2 4 4 16 14 1 2 5 3 8 7 9 9 Total 46 39 49 49 218 223 64 59 78 63 139 126 86 64 Conti… Month Village / Centre CENTER HADMDIYA GUNDALA GHUMLI CHAPARADA PORBANDAR
MONTH M F M F M F M F M F April, 14 1 2 4 1 0 0 2 1 63 55 May 2 1 6 5 0 0 5 5 59 55 June 2 0 5 3 0 0 2 3 64 56 July 3 1 9 1 0 0 7 6 80 62 August 1 2 7 3 0 0 4 3 60 61 September 1 2 0 0 0 0 2 4 89 64 October 1 1 7 3 0 0 2 8 73 84 November 2 1 4 6 17 9 0 0 84 74 December 1 2 4 4 14 7 0 0 66 61 January,15 1 1 5 2 5 4 0 0 74 63 February 1 2 4 3 12 8 0 0 64 51 March 2 0 6 2 2 2 0 0 57 45 Total 18 15 61 33 50 30 24 30 833 731 M= Male F= Female

110
F 7. Bull-wise Conception at Different Field Unit Centers During the Period 4/2014 to 3/2015
Month Bull Name Total Bhagro Bholenath Nagraj Dhingalo Haresh Raja
P E P E P E P E P E P E P E April, 14 0 0 188 156 14 22 0 0 0 0 0 0 202 178 May 0 0 159 144 0 0 0 0 0 0 0 0 159 144 June 0 0 160 167 0 0 0 0 0 0 0 0 160 167 July 0 0 133 145 0 0 0 0 0 0 0 0 133 145 August 17 19 77 91 0 0 14 15 0 0 0 0 108 125 September 0 0 64 61 0 0 56 72 0 0 0 0 120 133 October 0 0 52 43 0 0 95 119 0 0 0 0 147 162 November 17 14 0 0 0 0 124 122 0 0 0 0 141 136 December 0 0 0 0 0 0 164 152 37 34 0 0 201 186 January,15 0 0 0 0 0 0 23 20 119 137 105 77 247 234 February 0 0 0 0 0 0 17 12 38 39 236 224 291 275 March 0 0 0 0 0 0 0 0 4 7 237 229 241 236 Total 34 33 833 807 14 22 493 512 198 217 578 530 2150 2121
F 8. Bull-wise Calving at Different Field Unit Centers During the Period 4/2014 to 3/2015
Month
Bull Name TOTAL BHOLENATH GAJANAN NAGRAJ DHINAGLO HARESH MOTI SUNDAR M F M F M F M F M F M F M F M F April, 14 0 0 0 0 46 38 0 0 2 1 4 1 11 15 63 55 May 0 0 3 3 33 36 0 0 4 3 0 0 19 13 59 55 June 0 0 0 0 51 46 0 0 0 0 0 0 13 10 64 56 July 3 3 0 0 64 55 0 0 0 0 0 0 13 4 80 62 August 7 3 0 0 46 52 0 0 0 0 3 2 4 4 60 61 September 19 14 0 0 70 50 0 0 0 0 0 0 0 0 89 64 October 54 72 0 0 19 12 0 0 0 0 0 0 0 0 73 84 November 84 74 0 0 0 0 0 0 0 0 0 0 0 0 84 74 December 66 61 0 0 0 0 0 0 0 0 0 0 0 0 66 61 January,15 74 63 0 0 0 0 0 0 0 0 0 0 0 0 74 63 February 64 51 0 0 0 0 0 0 0 0 0 0 0 0 64 51 March 40 30 0 0 0 0 17 15 0 0 0 0 0 0 57 45 Total 411 371 3 3 329 289 17 15 6 4 7 3 60 46 833 731
F 9. Bull-wise Live Female Progeny at Different Field Unit Centers (0-6 month) as on 3/2015 Centres BHOLENATH NAGRAJ DHINGALO Total SHEDHAYA 17 2 19 PIPALI 16 4 20 LOEJ 98 98 MOVANA 26 26 SURVA 34 34 MAND LIKPUR 74 7 81 SHERADI 21 5 9 35 HADMDIYA 7 7 GUNDALA 20 20 GHUMLI 0 CHAPARADA 0 PORBANDAR 0 KHORASA 8 8 ODADAR 30 30
Total 351 12 15 378

111
F 10. Bull-wise Live Female Progeny at Different Field Unit Centers (6-12 month) as on 3/2015
Centres BHOLENATH GAJANAN NAGRAJ HARESH MOTI SUNDAR Total SHEDHAYA 3 17 20 PIPALI 7 3 4 15 29 LOEJ 125 125 MOVANA 1 30 2 33 SURVA 29 29 MAND LIKPUR 45 45 SHERADI 4 21 4 29 HADMDIYA 2 5 1 8 GUNDALA 3 1 9 13 PORBANDAR 0 KHORASA 18 4 22 ODADAR 0 CHANCHAKVAD 0
Total 20 3 277 4 3 46 353 F 11. Bull-wise Live Female Progeny at Different Field Unit Centers (1-3 years) as on 3/2015
Centres BHAGARO GAJANAN NAGRAJ LAXMAN HARESH SUNDAR MOTI TOTAL SHEDHAYA 00 00 19 75 00 00 09 103 PIPALI 00 00 28 34 00 00 25 87 LOEJ 00 00 120 204 00 98 47 469 MOVANA 00 04 88 91 00 00 57 240 SURVA 00 00 38 93 00 00 42 173 MAND LIKPUR 19 00 28 28 00 07 85 167 SHERADI 12 00 14 16 00 00 23 65 HADMDIYA 00 00 13 06 00 00 07 26 GUNDALA 06 00 07 07 00 00 20 40 PORABANDAR 00 00 11 23 00 00 42 76 KHORASA 00 00 06 02 03 00 14 25 ODADAR 00 00 00 00 00 00 00 0 CHANCHAKVAD 00 00 00 00 00 00 00 0
Total 37 4 372 579 3 105 371 1471 F 12. Bull-wise Live Female Progeny at Different Field Unit Centers (> 3years) as on 3/2015
Centres RUPESH ASHOK MANEK BHAGARO GAJANAN NAGRAJ LAXMAN HARESH MOTI TOTAL SHEDHAYA 0 3 44 59 7 48 56 17 0 234 PIPALI 6 9 10 63 40 13 18 29 12 200 LOEJ 69 101 76 250 147 8 520 56 37 1264 MOVANA 32 40 27 140 13 0 106 22 7 387 SURVA 7 6 0 135 26 0 31 0 13 218 MAND LIKPUR 0 0 14 136 0 0 0 0 0 150 SHERADI 0 0 0 26 5 0 0 0 0 31 HARAMADIYA 0 0 0 12 0 0 5 3 0 20 GUNDALA 0 0 0 12 0 0 0 0 0 12
Total 114 159 171 833 238 69 736 127 69 2516 F 13. Bull-wise Daughters Calved at Different Field Units During 2014-2015 Nil

112
F 14. Bull-wise Daughters Recorded at Different Field Units During 2014-2015 Nil F 15. Bull-wise AI, Conception, Calving and Daughters Retained Till Completion of Milk Recording During the Year
Bull Name
Set No.
Total AI
Conception Calving Daughters Retained Upto Total Female 1
year 2
year 3
year Cal ving
Complete Recording Pro. Cur.year
(14-15) Pro. Cur.year
(14-15) Pro. Cur.year
(14-15) Pro. Cur.year
(14-15) Ranjeet I 243 00 108(179) 00 72 00 34 00 00 00 00 Rupesh I 777 00 429(661) 00 251 00 116 00 00 00 00 Ashok I 2120 00 732(1217) 00 715 00 346 00 00 00 00 Manek I 741 00 300(482) 00 376 00 182 00 00 00 06 Bhagro I 4658 89 1868(3763) 34(67) 1840 00 877 00 00 40 316 Gajanan 4/02 I 929 00 502(781) 00 480 06 242 03 04 00 00 Nagraj I 4002 14 1808(2416) 14(36) 181 618 479 289 388 15 122 Laxman I 5343 00 2682(4503) 00 2735 00 1349 00 67 546 207
A 18813 103 8429(14002) 48(103) 6650 624 3625 292 459 601 651
Haresh II 809 436 449(638) 198(415) 262 10 130 04 03 00 15 Moti II 2459 00 1041(2129) 00 997 10 469 03 265 181 10 Sunder II 719 00 371(539) 00 223 106 105 46 77 28 00 Raja II 13 1430 8(12) 578(1108) 00 00 00 00 00 00 00 Dhinglo II 00 1089 00 493(1005) 00 32 00 15 00 00 00 Bholenath II 1816 741 402(348) 833(1640) 00 782 00 371 00 00 00
B 5816 3696 2271(3666) 2102(4168) 1482 940 704 439 345 209 25
Nayan (07/10) III 00 979 00 00 00 00 00 00 00 00 00 Abhijit (A1/10) III 00 00 00 00 00 00 00 00 00 00 00 Madhav(37/10) III 00 03 00 00 00 00 00 00 00 00 00 Alok III 00 00 00 00 00 00 00 00 00 00 00 Bhairav(17/12) III 00 00 00 00 00 00 00 00 00 00 00 Ronak(09/11) III 00 00 00 00 00 00 00 00 00 00 00
C 00 982 00 00 00 00 00 00 00 00 00 Gr.Total (A+B+C)
24629 4781 10700(17668) 2150(4271) 8132 1564 4329 731 804 810 676 Performance of FPT Programme Since Inception Duration AI Pregnancies CR% Calv-
ings Females Born
Daughters Recorded
Av. AFC (mnt)
Av. Milk Yield (kg/day)
Daughters Available
for Recording
2005-06 15 - - - - 2006-07 966 - - - - 2007-08 2169 1196(1907) 62.72 468 223 - - - - 2008-09 2961 1141(2065) 55.25 944 455 - - - - 2009-10 3070 1563(2676) 58.41 1429 694 - - - - 2010-11 3457 1613(2651) 60.84 1333 666 - - - - 2011-12 3738 1603(2918) 54.93 1538 729 - - - - 2012-13 4067 1776(3627) 48.97 1684 810 - - - - 2013-14 4121 1957(2064) 40.91 1688 801 - - - - 2014-15 4781 2150(2121) 50.34 1564 731 Overall 29345 12999(22179) 58.61 10648 5109

113
AI, Conception, Calving and Daughters Retained (Set wise) Set - I Bull No.
Ranjit Rupesh Ashok Manek Bhagro Gajanan Nagraj Laxman Total AI 243 777 2120 741 4747 929 4016 5343 18916 Pregnancies 108 429 732 300 1902 502 1822 2682 8477 Daughters Born 34 116 346 182 877 245 768 1349 3917 Daughters Calved - - - - - - - - - Set - II Bull No.
Hresh Moti Sundar Raja Dhingalo Bholenath Total AI 1245 2459 719 1443 1089 2557 9512 Pregnancies 647 1041 371 586 493 1235 4373 Daughters Born 134 472 151 00 15 371 1143 Daughters Calved - - - - - Set - III Bull No.
Nayan Abhijit Madhav Alok Bhairav Ronak Total AI 979 00 03 00 00 00 982 Pregnancies 00 00 00 00 00 00 00 Daughters Born 00 00 00 00 00 00 00 Daughters Calved
Bottlenecks 1. Sanctioned staff for the project has not been filled since inception.
2. Field AI workers needs to be paid for the data on AI/PD/Milk being collected and supplied to CBF. 3. Field villages are scattered at far distance for which separate staff for monitoring is needed. 4. Allocated funds are insufficient for the project implementation satisfactorily.
114
Financial Statement for the year 2014-15 (Rs in Lakhs)
Allocation as per R E 2014 – 15 Total ICAR Share
Receipt ICAR Share
Released ICAR Share
Expenditure as per AUC Cosing Balance ICAR Share State Share
56.00 42.00 0.021 42.00 36.74517 12.24839 5.27583
Herd Performance Herd strength was 288 heads comprising of 151 breedable buffaloes and 18 breeding bulls. 46 males of 1-2 years age are standing in the herd. Surplus bulls should be immediately disposed off after preliminary selection for next set. 36 calving reported during the report period out of which 16 were females, 19 were males and three one births. Calf mortality (0-3 months) was 2.38 percent (1/42) at the centre. Buffaloes were inseminated with seven bulls and conception rate was 50.43 % (58/115). 46153 semen doses of semen from 12 bulls are available at the centre. During the year 15789 doses of semen were produced and 7142 doses were used in AI in farm and field. Production performance indicated by 305 day or less day milk yield showed improvement in performance i.e. 2095.7 kg (n=37) from 1629.2 kg (n=33) of the year 2013-14. There was improvement in all the reproductive traits viz. AFC 46.60 m (n=5), Service period 140.43 days (n=30), dry period 176.53 days (n=3) and calving interval was 450.43 days (n=30). Only 40.22 percent animals were in milk with 7.38 % wet average and 3.01 % herd average.
Field Unit: 4781 AI’s were performed utilization the semen of 8 bulls in 13 centers/villages. Total 2150 conceptions took place with rate of 50.34 %.
Targets achieved during 2014-15 S. No Trait Target Achieved 1. Av. Age at first service (months) 28 months - 2. Av. Age at first calving 42 months 46.60 months 3. Av. Age for initiating training of bulls (months) 20 months 32 months 4. Av. Age at first collection 32 months 40 months 5. Av. Service period 130 days 140.43 days 6. Calf mortality (0-3 months) ≤ 5% 2.38 7. Wet average ≥ 7.5 kg 7.38 kg. 8. Herd average ≥ 4.0 kg 3.01 kg.
Recommendations: 1. Early selection of male calves for breeding bull to be followed.
2. There are only 40% animals in production during last two years. The production performance needs to be improved.
3. One set should be used for a fixed duration only i.e 24 month cycle. 4. Old bull, born upto 2004 may be disposed off/distributed/ sold. 5. Only one bull from III set used in 2014-15 All the bulls of III set should be used randomly
and in equal proportion. 6. Field recording is very poor. It should be strengthened by engaging contract workers &
provide incentives to the farmers. All the bulls should be used in equal proportion in the field. No of AI per bull to be increased to record 25-30 daughters per bull for progeny testing.
Project Co-ordinator’s observations on centre performance

115
ZONAL AGRICULTURAL RESEARCH STATION, KOLHAPUR
1. Name of Center : Zonal Agricultural Research Station, Sub-Montane
Zone, NARP, Shenda Park, Kolhapur-416 012 2. Project Code : 18-3/97-ASR-II, dated 29/3/2001,
ADG (AP & B), ICAR, New Delhi 3. Project Title : “Network Project on Pandharpuri Buffalo” 4. Date of Start / Sanction : 29 / 03 / 2001. 5. Objectives: The objective of the project is to envisage and undertake progeny testing for
improvement of Pandharpuri breed of buffaloes. Priority and emphasis will be on performance recording and improvement of the breed and on semen quality testing laboratory.
6. Technical Programme : “Network Project on Buffalo Improvement (Pandharpuri)” is being implemented at Zonal Agricultural Research Station (Z. A. R. S.) Shenda Park Kolhapur. Pandharpuri buffaloes of superior genetic potential are maintained on farm for production of test breeding bulls. These breeding bulls are used for production of frozen semen straws in the semen freezing laboratory of the project. From each bull 8-10 thousand production of semen straws is the target. These semen straws are used for inseminations in field for Pandharpuri and non-descript buffaloes. Daughters are expected to be recorded from each bull for evaluation of Sire. About 3.69 lakhs semen straws from 48 bulls have been freezed and about 2.51 lakhs semen straws are utilized in field for insemination.
7. Financial Statement: 75: 25 (ICAR: State Govt.)
Sr. no.
Head of Account
Sanctioned grants (Rs.)
Expenditure (Rs.)
1. Pay and allowances 31,00,000/- 35,52,483/- 2. TA 1,00,000/- 75,684/- 3. Contingencies
Recurring 32,00,000/- 30,06,356/- Non- recurring 6,00,000/- 4,73,488/-
Total 70,00,000/- 71,08,011/- 8. Staff Position during the year: 2014-15 Sr. no. Name of Sanctioned Posts No. of posts Filled/Vacant
1 Associate Professor (Animal Breeding) 01 Filled 2 Assistant Professor (Veterinary Science) 01 Filled 3 Technical Assistant (Lab.) 01 Filled
9.1 Herd Strength during the period 1/04/2014 to 31-03-2015
Category Addition Disposal Sr. No. FEMALES OB B/P T D T S CB
1. Female calves below 3 months 1 4 - - 4 - 1 2. Female calves 3 – 6 months 1 - 4 - 3 - 2 3. Female calves 6 - 12 months 2 - 3 - 3 - 2
4. Heifers above 1-2 years 1 - 3 - 3 - 1 2-2.5 years 2 - 3 - 3 - 2
Above 2.5 years 2 4 3 - 4 2 3

116
5. Buffaloes in milk 10 - 4 - 4 - 10 6. Buffaloes dry /Pregnant 13 5 4 - - 1 21
Subtotal (A) 32 13 24 - 24 3 42 MALES
1. Male calves below 3 months 5 7 - 1 9 - 2 2. Male calves below 3 – 6 months 2 - 9 - 7 - 4 3. Male calves below 6 - 12 months - - 7 2 5 - -
4.
Male above 1-2 years 8 - 5 - 9 - 4 Above 2 years 4 - 9 - - - 13
5. Breeding bulls 15 - - - - 3 12 Subtotal (B) 34 7 30 3 30 3 35 Total (A + B ) 66 20 54 3 54 6 77
OB = Opening Balance D = Deaths S = Sales B = Births P= Purchase T = Transfers CB = Closing Balance 9.2 Calving statistics during the period 1/04/2014 to 31-03-2015 Month Male Female Still Birth Overall
No. % No. % No % No. % April 2014 - - - - - - - - May - - - - - - - - June - - - - - - - - July - - - - - - - - August - - - - - - - - September - - - - - - - - October 04 30.76 - - 01 Abo 7.69 05 38.46 November - - 01 7.69 - - 01 7.69 December - - 02 15.38 - - 02 15.38 January 15 03 23.07 - - 01 SB 7.69 04 30.76 February - - 01 7.69 - - 01 7.69 March - - - - - - - - Overall 07 53.84 04 30.76 02 15.38 13 100 Sex ratio (Male: Female) : 63:37 9.3 Disposal of animals during the period 04/2014 to 03/2015
Category Surplus Repd. Problem
Weak & old
Death Experimental Purposes
Total FEMALES
Calves < 6 months - - - - - -
6 – 12 months - - - - - - Heifers
1 – 2.5 years - - - - - - > 2.5 years - 02 - - - 02
Buffaloes Dry - - - - - -
Milch 01 - - - - 01 Subtotal (A) 01 02 - - - 03

117
MALES Calves
< 6 months - - - 01 - 01 6 – 12 months - - - 02 - 02
Above 1 years - - - - - - Young bulls - - - - - - Breeding bulls 03 - - - - 03 Subtotal (B) 03 - - - - 03 Total (A+B) 04 02 - 03 - 09
9.4 Month wise mortality during the period 04/2014 to 03/2015
Month
Partic-ulars
Females Males Over
all Herd
0-3 3-6 6-12 1-2 Yrs.
Above 2 Yrs.
Over all
Female 0-3 3-6 6-12 Above
1 Yrs. Over
all Male
Over all
No. 5 5 5 4 50 69 12 11 7 41 71 140 Died - - - - - - 1 2 - - 3 3 % 0 0 0 0 0 0 8.33 18.18 0 0 4.23 2.14 Calf mortality (0-3 month) was 5.88 percent (1/17)
9.5 Causes of mortality (Quarter wise) during the period 04/2014 to 03/2015
Particulars 1st Quarter
2nd Quarter
3rd Quarter
4th Quarter
Total
Respiratory System: ( Broncho-Pheumonia )
- 01 - - 01 B. Digestive system - - - 01 01 C. Circulatory system - 01 - - 01
Total - 02 - 01 03 9.6 Prophylactic measures taken during the period 04/2014 to 03/2015
Vaccination No. of Animals Screening No. of animals No. of animals treated for parasitism Available Inoculated Tested Results Date No.
FMD (Twice) 126 126 TB 60 -ve 19/6/14 66 HS 66 66 JD 60 -ve 22/1/15 69 BQ 66 66 Brucellosis 60 -ve - - RP - - Mastitis - - - - Brucellosis 04 04 IBR 60 -ve - - - - - Campylo-
bacterilosis
10 -ve - -
Trichomoniasis
10 -ve - - Total 262 262 Total 260 - - 135

118
9.7 Calving abnormalities (Quarter wise) during the period 04/2014 to 03/2015 Quarter
No. of
Calvings Dystokia Abortions Retention
of placenta Prolapse Still births Total
No % No % No % No % No % No % I - - - - - - - - - - - - - II - - - - - - - - - - - - - III 08 - - 01 12.5 - - - - - - 01 12.50 IV 05 - - - - - - - - 01 20.0 01 20.00
Over all 13 00 00 01 7.69 00 00 00 00 01 7.69 02 15.38 9.8 Conception rate during the period 04/2014 to 03/2015
Number of animals :- 22 Number of Services :- 26 Service No. I II III IV & above Overall Parity I C CR I C CR I C CR I C CR I C CR Heifers 8 4 50.00 - - - - - - 8 4 50.00 Adults I 1 1 100 - - - - - - - - - 1 1 100.00 II 2 2 100 2 1 50.00 6 2 33.33 - - - 10 5 50.00 III - - - - - - - - - - - - - - - IV 2 2 100 - - - - - - - - - 02 02 100.00 V & above 2 2 100 2 1 50.00 - - - 5 1 20.00 09 04 44.44 Total 7 7 100 12 6 50.00 6 2 33.33 5 1 20.00 30 16 53.33 I = No. of animals inseminated C = No. of animals conceived CR = Conception rate % 9.9 Bull wise conception rate during the period 04/2014 to 03/2015
Sr. No. Bull no. Total number of AI Total conceived CR % 1 PB-54 4 2 50.00 2 PB-72 2 1 50.00 3 PB-101 6 4 66.66 4 PB-110 2 1 50.00 5 PB-204 1 1 100.00 6 PB-205 3 1 33.33 7 PB-208 2 1 50.00 8 PB-210 10 5 50.00
Total 30 16 53.33 9.10: Semen straws produced and used for Artificial Insemination: Up to 03/2015
Set No.
No. of bulls in each Set
Semen straws Semen straws used for AI in field Doses at balance as
on 31/03/15
Opening balance
1-4-2014 Production
1-4-14 to 31-3-15
Total Produc-tion Up to
31-03-14 1-4-14 to 31-3-15
Total I 12 bulls 52863 - 52863 39545 30 39575 13288 II 9 bulls 71604 - 71604 58193 - 58193 13411 III 6 bulls 79220 - 79220 63244 - 63244 15976 IV 9 bulls 88370 - 88370 63030 4790 67820 20550 V 9 bulls 39700 34760 74460 4300 13560 22860 51600 VI 3 bulls - 3100 - - - - 3100 Total 48 bulls 331757 37860 369617 233312 18380 251692 1,17,925

119
9.11 Body weights during the period 04/2014 to 03-2015
Age N Average body weight (kg) SE + Females
Birth 3 28.11 0.38 3 months 3 56.73 1.42 6 months 3 89.46 1.31 12 months 4 134.21 2.19 18 months 7 160.14 4.02 24 months 7 188.20 4.45 Adults (Av. of all ages) 26 426.34 8.15
Males Birth 9 29.63 0.68 3 months 7 58.97 1.61 6 months 7 95.59 1.52 12 months 7 137.13 2.21 18 months 5 161.74 3.68 24 months 6 191.28 5.17 Adults (Av. of all ages) 22 460.12 9.39
9.11.1 Body weights (kg) of Pandharpuri buffalo
Year
At birth
3 months
6 months
12 months
18 months
24 months
1st conception Females 2005-06 28.80 55.80 91.57 118.60 164.60 192.00 - 2006-07 29.33 57.90 91.57 119.00 153.48 204.32 - 2007-08 28.57 59.44 92.36 119.48 159.05 207.06 358.00 2008-09 29.43 59.78 94.82 119.14 165.10 212.50 342.00 2009-10 27.67 60.25 97.80 134.00 160.40 195.75 354.60 2010-11 27.17 59.20 92.32 117.60 156.00 184.60 349.32 2011-12 27.25 59.47 93.91 123.21 159.32 190.18 369.20 2012-13 28.50 57.75 91.50 130.00 160.22 188.20 338.20 2013-14 27.30 56.42 90.85 134.57 159.88 188.71 345.16 2014-15 28.11 56.73 89.46 134.21 160.72 189.16 340.12
Males 1st collection 2005-06 28.20 63.67 93.62 120.78 169.00 234.00 - 2006-07 28.70 61.43 87.31 113.39 169.00 216.10 - 2007-08 34.75 61.89 88.29 117.24 170.09 218.29 424.00 2008-09 32.14 60.72 87.24 121.08 170.62 220.13 417.00 2009-10 29.64 60.21 94.92 136.29 161.30 190.80 370.50 2010-11 29.54 61.40 98.56 138.20 160.08 192.42 366.41 2011-12 28.53 60.10 93.33 136.22 160.16 191.60 380.52 2012-13 28.66 59.25 92.86 135.44 162.13 191.15 348.12 2013-14 29.60 58.90 95.10 137.35 161.74 190.26 351.25 2014-15 29.63 58.97 95.59 137.13 160.92 191.20 372.36

120
9.12.1 Production performance of buffaloes during the period 04/2014 to 03-2015
Lactation No.
No. of obs.
Av. Lact. yield (kg.)
Av.Lact. length (days)
305 days or less milk yield
( kg. ) Av. Peak yield
(kg.) 1st 2 1281.00 280 - 6.0 2nd 3 1316.00 275 - 7.5 3rd 3 1490.00 282 - 7.0 4th 2 1630.00 285 - 7.5 5th 2 1405.00 266 7.0 6th - - - - - 7th & Above - - - - Overall 12 1421.34± 22.78 277.75±2.36 7.04±0.22
9.12.2 Production performance of Pandharpuri buffaloes since inception
Year Av. Lact. yield (kg)
Av.Lact. length (days)
305 days or less milk yield (kg)
Av. Peak yield (kg)
2005 – 06 (12) 1810.71±244.65 320.23±17.28 1724.59±184.97 8.02±1.39 2006 – 07 (11) 1625.09±171.50 324.49±10.06 1527.48±188.14 8.17±1.42 2007 – 08 (13) 2084.03±116.32 346.66±14.28 1833.58±123.12 9.41±1.28 2008 – 09 (12) 2077.22±163.26 345.54±13.72 1833.51±142.13 8.69±1.36 2009 – 10 (10) 1452.00±71.02 303.40±11.90 1461.90±76.28 8.30±1.27 2010 – 11 (12) 1336.93±24.16 279.60±3.35 1336.93±24.16 7.82±1.18 2011 – 12 (12) 1622.57±82.58 284.00±4.14 1622.57± 82.58 7.20±0.27 2012 – 13 (12) 1442.25±58.37 266.00± 3.93 1442.25±58.37 6.82±0.13 2013– 14 (11) 1491.36± 87.35 284.00±13.36 1491.36±87.35 6.41± 0.43 2014– 15 (12) 1421.34± 22.78 277.75± 2.36 1421.34±22.78 7.04±0.22
9.13 Month wise milk components during the period 04/2014 to 03-2015
Month No. of observations
Fat (%)
Protein (%)
Lactose (%)
Ash (%)
SNF (%)
TS (%)
April 2014 15 8.11 0.84 9.80 17.91 9.09 16.58 May 18 8.14 0.81 9.78 17.92 9.08 17.15 June 20 8.10 0.82 9.86 17.96 9.03 16.14 July 16 8.04 0.80 9.82 17.86 9.05 16.89 August 18 7.72 0.79 9.88 17.60 9.20 16.73 September 20 7.83 0.78 9.92 17.75 8.92 16.11 October 24 8.00 0.80 9.79 17.79 8.45 15.76 November 28 7.98 0.82 9.81 17.79 9.02 16.15 December 32 8.12 0.84 9.80 17.92 9.90 17.75 January 15 37 8.10 0.80 9.86 17.96 9.42 17.26 February 30 8.02 0.83 9.84 17.86 9.74 18.68 March 31 8.04 0.82 9.85 17.89 9.85 18.48 Overall 24 8.02 0.81 9.83 17.85 9.23 16.97

121
9.14 Reproduction performance of Pandharpuri buffalos (4/2014 to 03-2015)
Lactation No. Traits 1 2 3 4 5 6 & above Overall Average age at calving (months)
N X 44.32 - - - - - 44.32
SE + - - - - - - Average service period (days)
N - 3 3 2 2 - 10 X 110 108 102 115 - 109
SE+ - - - - - - Average dry period (days)
N - 3 3 2 2 - 10 X - 98 112 108 116 - 108
SE+ - - - - - - - Average calving interval (days)
N - 3 3 2 2 - 10 X - 428 436 430 418 - 429
SE+ - - - - - - -
9.14.1 Reproduction performance of Pandharpuri buffaloes since inception Year AFC (months Service Period
(days) Dry Period (days)
Calving Interval (days)
2005 – 06 12 46.23±0.69 118.00± 9.26 115.00± 6.33 425.75± 8.33 2006 – 07 11 46.83± 0.72 128.49±7.23 118.26± 8.43 452.36±10.44 2007 – 08 13 44.08± 0.58 84.27± 11.32 93.35±10.35 409.10±12.26 2008 – 09 12 43.28±0.49 85.18±5.78 100.60±7.54 425.51± 11.23 2009 – 10 10 40.00±0.72 74.10±8.47 206.00±7.92 444.44±9.67 2010 – 11 12 43.11±0.63 91.38±6.35 157.94± 8.04 400.00±8.98 2011 – 12 12 43.28±0.70 98.60±7.06 108.60±4.28 425.50±9.04 2012 – 13 12 42.16±0.46 105.60±4.16 111.00± 5.02 435.00±6.32 2013– 14 11 43.26±0.57 106.00±5.04 110.00±5.28 429.00±7.02 2014 – 15 44.32 (2) 109.00 (10) 108.00 (10) 429.00 (10) 9.15 Month wise milk production and disposal during the period 04/2014 to 03-2015
Months Total Milk Produced (Kg)
Disposal (kg) Liquid Milk Sold Calf Feeding Expt.
April 2014 1102.0 890 212 - May 974.0 944 30 - June 824.0 824 0 - July 765.0 765 0 - August 622.0 622 0 - September 499.0 499 0 - October 663.0 506 157 - November 1031.0 706 325 - December 1228.0 814 414 - January 2015 1428.0 980 448 - February 1422.0 1119 303 - March 1599 1445 154 -
Overall 12157 10114 2043 -

122
9.16 Feed and fodder during the Period 04/2014 to 03-2015 Quarter
Items Balance as on
04/14 (kg) Produced at
farm (kg) Purchased
(kg) Actually fed(kg)
Balance (kg)03/15
I Green 1000 16800 10200 28000 - Dry 17400 4900 7500 15800 14000 Concentrate 2300 - 10000 11550 750
II Green - 31000 - 31000 - Dry 14000 - - 14000 - Concentrate 750 - 14600 12022 3328
III Green - 13500 25000 38100 1100 Dry - 18900 - 15900 3000 Concentrate 3328 - 9200 10475 2053
IV Green 400 5000 16000 16400 5000 Dry 3000 19000 10000 12400 14600 Concentrate 2053 - 25310 16103 11260
Total
Green 1000 66300 51200 113500 5000 Dry 17400 37800 17500 58100 14600 Concentrate 2300 - 59110 50150 11260
9.17 Milking performance during the period 04/2014 to 03-2015
Month animals in milk animals dry Total animals
% in milk
Wet. Av. (kg)
Herd Av. (kg)
April 2014 08 13 21 38 4.31 2.15 May 07 14 21 34 4.38 2.10 June 07 14 21 34 4.22 2.10 July 06 15 21 29 4.52 2.04 August 05 16 21 24 4.45 2.00 September 04 17 21 20 4.52 2.00 October 05 16 21 24 4.12 2.00 November 07 16 23 30 4.82 2.16 December 09 14 23 40 4.44 2.21 January 2015 10 13 23 44 4.68 2.34 February 10 13 23 44 5.24 2.28 March 10 20 30 34 5.15 2.10
Mean 7.33 15.08 22.42 33.00 4.57 2.12 9.17.1 Milking performance since inception
Years No. of Animal in Milk
No. of Animals Dry
Total Animal
% in Milk
Wet. Av. ( Kg)
Herd Av. (Kg)
2005-06 15.17 10.25 25.42 59.68 5.78 3.45 2006-07 15.50 10.00 25.50 60.85 6.25 3.16 2007-08 12.80 10.92 23.72 48.88 5.47 2.63 2008-09 11.83 08.17 20.00 59.17 5.13 3.02 2009-10 11.75 10.10 21.85 54.19 4.80 2.56 2010-11 08.83 12.10 20.93 47.28 4.30 2.13 2011-12 10.50 6.08 16.58 63.38 5.12 3.25 2012-13 10.00 6.50 16.50 60.00 5.00 3.00

123
2013-14 11.00 7.58 18.58 59.19 5.10 3.07 2014-15 7.33 15.08 22.42 33.00 4.57 2.12
9.18 Bull wise daughters performance (first lact. 305 days milk yield)
Bull No. Total No. of daughters born
No. of daughters reaching A.F.C.
No. of daughters completing 1st Lact.
I lactation yield (kg)
PB- 48 2 2 2 1405 PB- 54 6 3 2 1374
PB-101 2 1 1 1669 PB-107 2 2 2 1378 PB-114 1 1 - - PB-120 1 - - - PB-122 1 1 1 1244 PB-204 1 2 1+1=2 1360 PB-205 2 2 1+1=2 1201 PB-207 1 1 1 1163 PB-208 5 3 1 1251 PB-232 4 - - - PB-233 2 - - - PB-210 3 -
Total 33 18 13 1246.31 9.19 Bull wise daughters completing 1st lactation during the period 04/2014 to 03-2015
Sr. No.
Bull No.
Daughter No.
Date of birth
Date of calving
Total milk yield (kg)
Lactation Length (days)
305 days or less milk yield(kg)
1 PB-204
PB-211 8-4-09 26-9-13 1360 305 1360 2 PB-
208 PB-445 14-2-09 8-10-13 1201 280 1201
9.20 List of breeding bulls / young bulls available as on 31/03/2015
Set No.
Bull No.
Date of birth
Dam No.
Sire No.
Dams best lact. 305 or Less days
yield (kg.) Semen doses
available V
PB- 69 25-09-2008 193 120 1800 6660 PB-241 25-07-2009 406 114 1950 6200 PB- 72 15-09-2009 183 114 1950 6840 PB- 74 01-10-2009 200 208 1800 5840 PB-244 08-12-2009 purchased 210 2200 5500
VI
PB-246 30-9-2010 417 52 1730 1380 PB-248 16-11-2010 424 54 1878 520
PB- 80 23-2-2011 205 54 1680 1200 PB-261 22-3-2012 406 228 1950 Under training PB-264 29-4-2012 431 229 2000 Under training PB-265 22-8-2012 437 232 1850 Under training PB-267 2-9-2012 411 233 2530 Under training
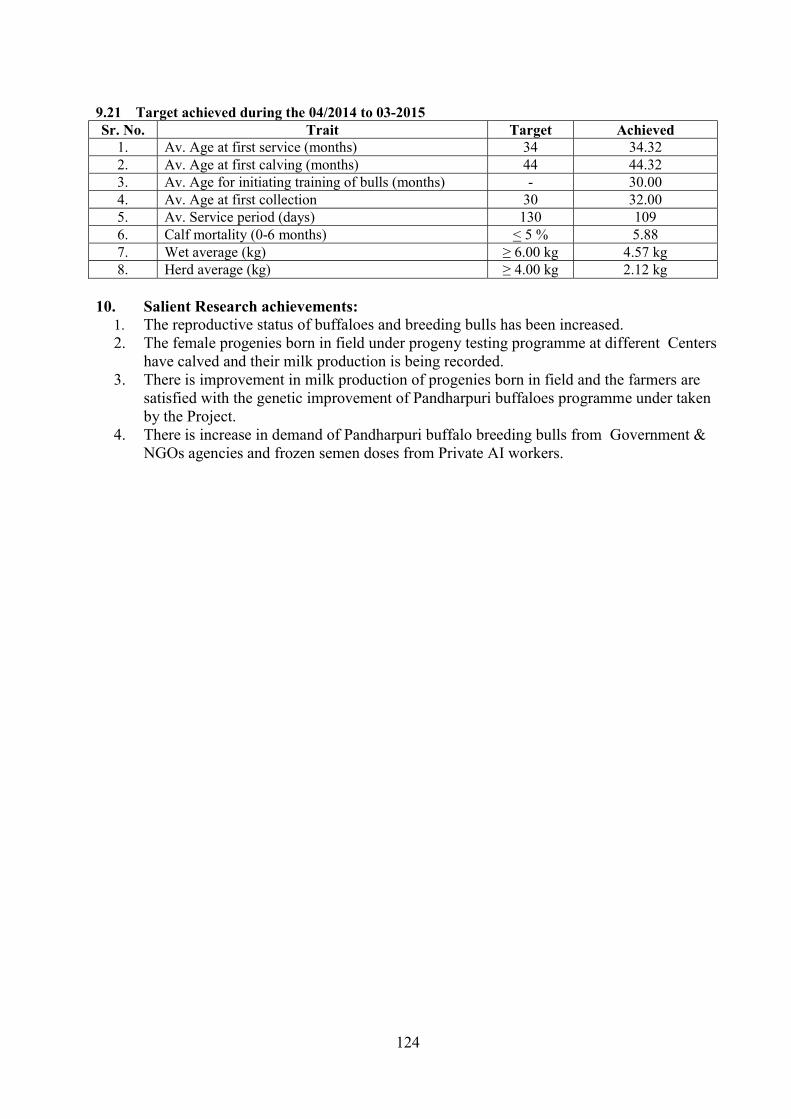
124
9.21 Target achieved during the 04/2014 to 03-2015 Sr. No. Trait Target Achieved
1. Av. Age at first service (months) 34 34.32 2. Av. Age at first calving (months) 44 44.32 3. Av. Age for initiating training of bulls (months) - 30.00 4. Av. Age at first collection 30 32.00 5. Av. Service period (days) 130 109 6. Calf mortality (0-6 months) < 5 % 5.88 7. Wet average (kg) ≥ 6.00 kg 4.57 kg 8. Herd average (kg) ≥ 4.00 kg 2.12 kg
10. Salient Research achievements:
1. The reproductive status of buffaloes and breeding bulls has been increased. 2. The female progenies born in field under progeny testing programme at different Centers
have calved and their milk production is being recorded. 3. There is improvement in milk production of progenies born in field and the farmers are
satisfied with the genetic improvement of Pandharpuri buffaloes programme under taken by the Project.
4. There is increase in demand of Pandharpuri buffalo breeding bulls from Government & NGOs agencies and frozen semen doses from Private AI workers.

125
FIELD REPORT
F. 1: Herd Strength of females at different field Unit Centers during 2014 -15
District Cent
er No.
Name of Center
OB Additions Deduction CB New Reg. (Birth /
Purchase) Sold/ Death
Kolhapur 1 Ajara & Chandgad 1391 086 105 1372 2 Gadhinglaj & Bhudargad 309 075 066 318 3 Karveer & Kagal 5164 642 215 5591 4 Hatkanangale & Shirol 967 054 062 959 5 Panhala & Shahuwadi 547 033 127 453 6 Radhanagari & Gaganbavda 205 042 088 159
Solapur 7 Akluj & Malsiras 1995 155 120 2030 Sangli 8 Islampur & Miraj 094 026 047 073 Belgaum 9 Chikodi & Khanapur 393 045 093 345
Total 11415 1190 923 11682 i) OB - Opening balance ii) CB - Closing balance F. 2: Status of breedable females under field unit during 2014-15
District Name of Center
Heifers > 3 years Buffalo (NP) Buffalo Pregnant
Total Total Pregnant In Milk Dry In Milk Dry
Kolhapur
Ajara & Chandgad
155 057 108 090 108 140 601 Gadhinglaj & Bhudargad
058 015 022 026 020 016 142 Karveer & Kagal
2945 604 1385 492 1435 735 6992 Hatkanangale & Shirol
110 028 102 045 110 072 439 Panhala & Shahuwadi
279 078 066 040 192 096 673 Radhanagari & Gaganbavda
073 016 031 019 026 024 173 Solapur Akluj &
Malsiras 912 344 274 218 197 072 1673
Sangli Islampur & Miraj
032 012 023 015 024 045 139 Belgaum Chikodi &
Khanapur 424 072 105 079 172 070 850
Total 4988 1226 2116 1024 2284 1270 11682

126
F.3: Month wise AI by using frozen semen under field unit during 2013-14 District Kolhapur Solapur Belgaum
Total Center Ajara &
Chandgad Gadhinglaj &
Bhudargad Karveer &
Kagal Hatkanangale &
Shirol Panhala & Shahuwadi
Radhanagari & Gaganbavada
Akluj & Malsiras
Islampur & Miraj
Chikodi & Khanapur Month
April 2014 12 14 37 13 14 07 32 08 31 168 May 04 18 42 08 10 02 50 04 17 155 June 14 12 74 10 16 08 88 37 36 295 July 22 26 104 16 19 16 163 33 90 489 August 24 30 123 12 27 20 167 24 113 540 September 20 19 117 06 32 10 140 54 89 537 October 36 22 108 15 28 08 162 15 74 568 November 30 18 92 11 18 06 100 67 58 400 December 22 10 103 14 29 04 88 86 63 419 January 15 31 25 109 07 26 02 90 64 49 403 February 18 12 75 10 25 10 88 19 52 309 March 27 08 49 12 27 08 84 33 38 286
Total 260 214 933 134 281 101 1252 444 710 4329 F.4: Bull wise AI at different field unit centers during the period 2014-15
Center Set – IV Bulls Set – V Bulls Total District: Kolhapur PB-101 PB-110 PB-210 PB-201 PB-67 PB-68 PB-72 PB-238 PB-239 PB-244 PB-69 Ajara & Chandgad 10 20 18 20 32 44 29 - 12 53 20 - Gadhinglaj & Bhudargad - 15 - 20 33 22 36 18 16 30 09 15 Karveer & Kagal 105 20 25 30 18 180 60 142 10 252 32 33 Hatkanangale & Shirol 17 - - - - 32 - 16 24 28 17 - Panhala & Shahuwadi - 44 23 34 16 10 18 12 20 46 24 26 Radhanagari & Gaganbavada - 10 06 17 12 15 - 10 15 10 - 06 District: Solapur Akluj & Malsiras 136 - - - 135 284 - 70 85 335 164 - Sangli Islampur & Miraj 25 - - - 65 44 52 62 40 60 66 - District: Belgaum Chikodi & Khanapur 85 - - - 27 152 60 130 40 162 34 -
Total 378 109 72 121 338 783 255 460 262 976 366 80

127
F.5: Month wise Conception by using frozen semen under field unit as on 2014-15 District Kolhapur Solapur Sangali Belgaum
Total Center Ajara &
Chandgad Gadhinglaj & Bhudargad
Karveer & Kagal
Hatkanangale & Shirol
Panhala & Shahuwadi
Radhanagari & Gaganbavada
Akluj & Malsiras
Islampur & Miraj
Chikodi & Khanapur Month
April, 2014 06 05 18 05 07 03 14 04 16 78 May 02 08 26 03 06 01 23 02 08 79 June 06 05 38 04 08 03 42 19 15 140 July 10 12 52 07 10 07 82 17 42 239 August 12 14 59 04 14 10 87 13 48 261 September 10 08 48 02 16 04 68 28 40 224 October 16 10 46 06 15 03 78 08 35 217 November 13 07 44 05 10 02 47 34 25 187 December 10 04 55 06 13 02 42 42 32 206 January, 15 14 11 58 02 13 01 44 31 24 198 February 08 05 38 04 12 04 40 10 22 143 March 11 03 25 05 15 04 37 12 20 132 Total 118 92 507 53 139 44 604 220 327 2104
F.6: Bull wise Conceptions at different field unit centers during the period 2014-15
Center Set – IV Bulls Set – V Bulls Total District: Kolhapur PB-101 PB-110 PB-210 PB-201 PB-67 PB-68 PB-72 PB-238 PB-239 PB-244 PB-69 PB-241 PB-74 Ajara & Chandgad - 9 8 9 14 20 14 - 6 24 10 4 - 118 Gadhinglaj & Bhudargad 6 6 - 8 15 9 16 8 8 13 3 - - 92 Karveer & Kagal 18 9 14 15 8 92 32 72 6 136 16 54 16 488 Hatkanangale & Shirol - - - - - 14 - 7 11 13 7 8 - 60 Panhala & Shahuwadi 11 23 10 17 8 15 9 6 10 23 10 13 4 149 Radhanagari & Gaganbavada
3 5 4 9 5 6 - 4 8 5 - - - 49 District: Solapur Akluj & Malsiras - - - - 70 140 - 33 40 16 75 65 21 604 Pandharpur - - - - 34 22 28 32 20 30 32 12 15 225 District: Belgaum Chikodi & Khanapur - - - - 13 72 23 59 17 76 26 28 7 321
Total 38 52 34 58 67 380 122 221 26 480 179 184 63 2104

128
F.7: Month wise calving at different field unit centers during the period 2014-15 District Kolhapur Solapur Belgaum Total M F
Center Ajara &
Chandgad Gadhinglaj &
Bhudargad Karveer &
Kagal Hatkanangale
& Shirol Panhala
& Shahuwadi Radhanagari & Gaganbavada
Akluj & Malsiras
Pandhar-pur
Chikodi & Khanapur Month
2014-15 April 2014 3 4 8 - 7 - 03 8 8 41 23 18 May 2 6 7 01 8 - 02 11 3 40 23 18 June 3 3 15 - 3 - 07 15 15 61 34 27 July 6 9 32 04 6 03 16 13 32 121 67 54 August 5 7 37 - 8 - 21 10 28 116 64 52 September 8 5 38 - 7 - 31 23 35 147 81 66 October 18 5 33 03 15 - 18 16 18 116 66 50 November 8 5 26 - 12 - 20 25 16 112 63 49 December 6 3 22 03 8 - 27 35 14 118 65 53 January 2015 7 8 39 05 7 - 29 23 15 113 63 50 February 6 4 30 - 6 01 16 12 14 89 57 36 March 6 2 15 - 4 - 21 8 15 71 39 32
Total 68 61 302 16 91 04 211 199 213 1165 641 524 M 37 34 166 09 50 02 116 109 117 641 F 31 27 136 07 41 02 95 90 96 524
F.8: Bull wise calving at different field unit centers during the period 2014-15 Set No. Set – IV bulls Set-V bulls
Total
M
F Bull No. PB-232
PB-233
PB-234
PB-237
PB-67
PB-68
PB-72
PB-238
PB-239
PB-241
PB-244 Center
District: Kolhapur Ajara & Chandgad 37 - - - 08 16 07 - - - - 68 37 31 Gadhinglaj & Bhudargad 16 - - 23 - 08 06 - 08 - - 61 34 27 Karveer & Kagal 150 - 20 - 30 40 20 16 - 26 - 302 166 136 Hatkanangale & Shirol 03 - 13 - - - - - - - - 16 09 07 Panhala & Shahuwadi 04 - - - 10 13 32 - - 32 - 91 50 41 Radhanagari & Gaganbavada 02 - - - - - - - - 2 - 04 02 02 District: Solapur Akluj & Malsiras - - - - 45 68 - - 60 - 38 211 116 95 Pandharpur 40 59 55 45 - - - - - - - 199 109 90 District: Belgaum Chikodi & Khanapur 28 30 - 59 - - - 96 - - - 213 117 96
Total 280 89 88 127 93 145 65 112 68 60 38 1165 641 524 M 154 49 48 70 51 80 36 62 37 35 22 641 F 126 40 40 57 42 65 29 50 31 25 16 524

129
F.9: Bull wise live female progeny at different field unit centers (0-6 month) during the period 2014-15 Center Set – IV bulls Set-V bulls Total
PB-232 PB-233 PB-234 PB-237 PB-67 PB-68 PB-72 PB-238 PB-239 PB-241 PB-244 District: Kolhapur Ajara & Chandgad 09 - - - 02 03 02 - - - - 16 Gadhinglaj & Bhudargad 03 - - 06 - 01 01 - 02 - - 13 Karveer & Kagal 28 - 04 - 04 10 04 03 - 08 - 61 Hatkanangale & Shirol 01 - 03 - - - - - - - - 04 Panhala & Shahuwadi 01 - - - 03 03 06 - - 07 - 20 Radhanagari & Gaganbavada 01 - - - - - - - - - - 01 District: Solapur Akluj & Malsiras - - - - 08 14 - - 16 - 08 46 Pandharpur 10 16 12 06 - - - - - - - 44 District: Belgaum Chikodi & Khanapur 05 06 - 12 - - - 16 - - - 39
Total 58 22 19 24 17 31 13 19 18 15 08 244 F.10: Bull wise live female progeny at different field unit centers (6-12 month) during the period 2014-15
Set No. Set - III Set - IV Total Bull No./ Center PB-232 PB-233 PB-234 PB-237 PB-67 PB-68 PB-72 PB-238 PB-239 PB-241 PB-244
District: Kolhapur Ajara & Chandgad 03 - - - 02 04 02 - - - - 11 Gadhinglaj & Bhudargad 02 - - 04 - 01 01 - 02 - - 10 Karveer & Kagal 31 - 03 - 10 08 04 02 - 08 - 66 Hatkanangale & Shirol 01 - 02 - - - - - - - - 03 Panhala & Shahuwadi 01 - - - 02 02 03 - - 06 - 14 Radhanagari & Gaganbavada - - - - - - - - - 01 - 01 District: Solapur Akluj & Malsiras - - - 12 13 - - 12 - 04 41 Pandharpur 05 15 10 11 - - - - - - - 36 District: Belgaum Chikodi & Khanapur 04 07 - 14 - - - 12 - - - 37
Total 47 07 15 29 26 28 10 14 14 15 04 219

130
F.11: Bull-wise live female progeny at different field unit centers (1-3 years) during 2014-15 Center Set – IV bulls Set – III bulls Total
PB-228 PB-229 PB-230 PB-232 PB-233 PB-234 PB-236 PB-237 PB-52 PB-54 PB-208 District: Kolhapur Ajara & Chandgad 02 01 04 05 - 02 01 - 01 14 - 30 Gadhinglaj & Bhudargad - 01 - 01 - - 02 04 - 08 - 16 Karveer & Kagal 12 21 26 29 10 16 08 12 - 34 - 168 Hatkanangale & Shirol - - - 04 - - - - 01 - - 05 Panhala & Shahuwadi 04 03 02 02 02 04 02 02 - 09 - 30 Radhanagari & Gaganbavada - 01 02 01 - 1 - 01 01 01 - 08 District: Sangali Akluj & Malsiras 12 07 08 06 18 19 08 06 06 04 02 96 District: Belgaum Chikodi & Khanapur 01 03 04 06 02 09 02 02 - 18 - 47 Total 32 40 50 59 39 56 25 29 09 92 02 433
F.12: Bull-wise live female progeny at different field unit centers (> 3 years) during 2014-15
District Center Set – I bulls Set – II bulls Set – III bulls Total 101 108 110 118 201 203 209 210 48 49 106 107 114 120 121 123 204 205 207 208 52 54
Kolha-pur
Ajara & Chandgad 01 01 01 - 02 06 02 01 08 05 01 04 04 02 05 04 06 08 07 14 06 13 101 Gadhinglaj & Bhudargad - - - - 01 01 - 01 02 01 01 01 05 - - 01 01 02 01 02 04 01 25 Karveer & Kagal 04 06 05 10 14 13 06 10 18 22 18 23 27 18 07 16 18 27 19 30 14 42 367 Hatkanangale & Shirol - - - - - 01 - 01 01 - - - 01 04 - - - 01 - 01 01 02 13 Panhala & Shahuwadi 03 01 01 01 01 01 05 01 04 01 - 02 03 01 01 02 03 06 04 04 02 07 56 Radhanagari & Gaganbavada - 01 - - - - - 01 - - - 01 01 - - - - 04 01 04 - 04 17
Sola- pur
Akluj & Malsiras - - - - - - - - 02 10 06 14 - - - - - - - - 32 28 92 Pandharpur - - - - - - - - - - - - - - - 02 12 14 10 08 04 02 52
Sangli Islampur & Miraj - - - - - - - - - - - - - 03 - - - - - - 02 01 06 Belgaum Chikodi & Khanapur - - - - - - - - 01 01 - - - 02 - - - - - - - 04 08
Total 08 09 07 11 18 22 13 15 36 39 26 45 41 30 13 25 40 62 42 63 65 95 737

131
F.13: Bull-wise daughters calved at different field unit centers during 2014-15 District Center Set – I bulls Set – II bulls Set – III bulls Tot
al 101 108 110 118 201 203 209 210 48 49 106 107 114 120 121 123 204 205 207 208 52 54 Kolha-pur
Ajara & Chandgad - 01 - - - 01 01 01 02 02 01 02 03 02 03 02 04 05 02 04 02 04 42 Gadhinglaj & Bhudargad - - - - - - - - - - - - 02 - - 01 01 01 01 01 01 01 09 Karveer & Kagal 03 05 05 06 07 07 04 07 08 12 08 07 12 07 04 10 08 04 08 08 12 16 168 Hatkanangale & Shirol - - - - - - - - - - - - - - - - - - - - - 02 02 Panhala & Shahuwadi 01 - - - 01 - - 01 01 01 - - 01 01 01 01 01 02 02 02 01 04 21 Radhanagari & Gaganbavada - - - - - - - - - - - - - - - - - 01 - 02 - 02 05
Solapur Akluj & Malsiras - - - - - - - - 02 04 03 04 - - - - - - - - 06 10 29 Pandharpur - - - - - - - - - - - - - - - 01 04 06 05 04 02 01 23
Sangli Islampur & Miraj - - - - - - - - - - - - - 02 - - - - - - 02 01 05 Belgaum Chikodi & Khanapur - - - - - - - - - 01 01 - - 01 - - - - - - - 04 07
Total 04 06 05 06 08 08 05 09 13 20 13 13 18 13 08 15 18 19 18 21 26 45 310 F.14: Bull-wise daughters recorded at different field unit centers during 2014-15
District Center Set – I bulls Set – II bulls Set – III bulls Total 101 108 110 118 201 203 209 210 48 49 106 107 114 120 121 123 204 205 207 208 52 54
Kolha-pur
Ajara & Chandgad - - - - - - - - - - - - - - - - - - - - - - - Gadhinglaj & Bhudargad
- - - - - - - - - - - - - - - - - - - - - - - Karveer & Kagal
02 02 02 03 02 02 01 02 03 03 02 02 03 02 01 02 02 01 02 02 04 08 53 Hatkanangale & Shirol
- - - - - - - - - - - - - - - - - - - - - - - Panhala & Shahuwadi
- - - - - - - - - - - - - - - - - - - - - - - Radhanagari & Gaganbavada
- - - - - - - - - - - - - - - - - - - - - - - Sola- pur
Akluj & Malsiras - - - - - - - - - - - - - - - - - - - - - - - Pandharpur - - - - - - - - - - - - - - - - - - - - - - -
Sangli Islampur & Miraj - - - - - - - - - - - - - - - - - - - - - - - Belgaum Chikodi & Khanapur - - - - - - - - - - - - - - - - - - - - - - -
Total 02 02 02 03 02 02 01 02 03 03 02 02 03 02 01 02 02 01 02 02 04 08 53

F.15: Bull wise AI, conceptions, calving and daughters retained till completion of milk recording till 31-03-2015
Set No.
Bull No.
Total AI
Concep-
tions Calvings Daughters retained upto
Total Female Below 3 years
Above 3 years
Calving Complete recording
I
PB-101 1935 780 498 231 - 08 62 32 PB-108 1743 730 472 227 - 09 63 41 PB-110 1844 781 463 230 - 07 55 23 PB-118 1686 758 492 241 - 11 61 29 PB-201 1979 877 503 239 - 18 44 43 PB-203 1866 840 532 261 - 22 64 26 PB-209 1687 759 488 239 - 13 58 23 PB-210 1800 794 490 275 - 15 78 32
Sub total A 14540 6319 3938 1943 - 103 488 249
II
PB-48 2726 1460 1119 450 - 36 49 10 PB-49 5567 2319 1656 605 - 39 71 12 PB-106 2866 1239 789 384 - 26 38 07 PB-107 3637 1635 1235 398 - 45 40 08 PB-114 3091 1331 1094 330 - 41 51 12 PB-120 2432 1216 1116 524 - 30 37 05 PB-121 2080 1035 892 415 - 13 37 02 PB-123 2007 1095 848 390 - 25 37 03
Sub total B 24406 11330 8749 3496 - 255 360 59
III PB-204 3037 1021 859 412 - 40 27 06 PB-205 4262 2104 1023 443 - 62 44 09 PB-207 3127 1315 885 428 - 42 35 08 PB-208 7380 2314 1279 588 02 63 55 06 PB-52 6069 2303 1570 738 09 65 26 04 PB-54 11775 5351 3495 1468 92 95 45 08
Sub total C 35650 14408 9115 4077 103 367 232 34
IV
PB-228 2325 1046 335 148 32 - - - PB-229 3563 1603 639 261 40 - - - PB-230 3261 1402 569 233 50 - - - PB-232 2860 1323 908 376 164 - - - PB-233 1950 877 286 111 68 - - - PB-234 1771 848 467 190 90 - - - PB-236 1058 402 265 092 25 - - - PB-237 2382 1092 353 148 82 - - -
Sub total D 19170 8593 3822 1559 551 - - -
V
PB-67 0646 295 093 042 40 - - - PB-68 1197 574 145 065 59 - - - PB-72 0473 213 065 029 23 - - - PB-238 0772 380 112 050 38 - - - PB-239 0471 224 068 031 32 - - - PB-241 0574 276 060 025 40 - - - PB-244 1109 532 038 016 22 - - -
Sub total E 5376 2557 581 358 254 - - - Grand total
(A+B+C+D+E)
99142
43207
26203
11433
908
725
1127
342

F.16: AI, Conception, Calvings and Daughters Retained (Set wise) Bull No AI Pregnancies Daughter
Born Daughters Calved
Complete Recording
Daughters Available
Set I 101 1935 780 231 58 31 - 108 1743 730 227 57 39 - 110 1844 78 230 50 21 - 118 1686 758 241 55 27 - 201 1979 877 239 86 41 - 203 1866 840 261 57 24 - 209 1687 759 239 53 22 - 210 1800 760 235 69 30 -
Set II 48 2726 1460 450 36 07 - 49 5567 2319 605 51 09 - 106 2866 1239 384 25 05 - 107 3637 1635 398 27 06 - 114 3091 1331 330 33 09 - 120 2432 1216 524 24 03 - 121 20280 1035 415 29 01 - 123 2007 1095 390 22 01 -
Set III 204 3037 1021 412 09 04 - 205 4262 2104 443 25 08 - 207 3127 1315 428 17 06 - 208 7380 2314 588 34 04 - 52 6069 2303 738 - - - 54 11775 5351 1468 - - -
Set IV 228 2325 1046 148 - - - 229 3563 1603 261 - - - 230 3261 1402 233 - - - 232 2860 1323 250 - - - 233 1950 877 71 - - - 234 1771 848 150 - - - 236 1058 402 92 - - - 237 2382 1092 91 - - -
Set V 67 646 128 - - - - 68 1197 194 - - - - 72 473 91 - - - - 74 134 - - - - - 238 722 159 - - - - 239 471 98 - - - - 241 574 92 - - - - 244 1109 52 - - - -
Total 99142 43187 11393 1127 342 -

F.17: Set-wise AI, Conception and daughters retained Set No.
No. of
Bulls AI Preg-
nancies Calving Daughters Retained
Total F Up to 1
Year Up to 2
Year Above
2 Years
Daughters Recorded
Av. AFC
(Month) Av. Milk
Yield (kg/day)
Daughters to be
recorded I 08 14540 6299 3936 1903 - - 103 249 46.58 4.72 - II 08 24406 11330 8749 3496 - - 255 59 45.94 4.54 - III 06 35650 14408 9115 4077 219 215 379 34 46.40 4.20 - IV 08 19170 8593 3822 1559 244 218 - - - - - V 07 5376 2557 581 358 - - - - - - -
Total 37 99142 43187 26203 11393 463 433 737 342 46.67 4.63 -
F.18: Performance of FPT Programme since Inception
Duration
AI
Pregnancies
CR %
Calvings
Females
born
Daughter recorded
AV. AFC
(months) Av. milk yield
(kg/day)
Daughters available
for recording
2004-05 - - - - - - - - - 2005-06 - - - - - - - - - 2006-07 3969 1530 51.53 770 382 45 46.58 4.742 - 2007-08 5299 2001 37.76 1254 554 47 46.32 4.320 - 2008-09 9349 4402 47.08 1246 666 61 46.46 4.660 - 2009-10 25106 9712 38.68 4273 1902 52 47.32 4.820 - 2010-11 22398 10379 46.34 6230 2186 63 - - - 2011-12 21181 9353 47.75 6110 2819 59 - - - 2012-13 4081 2183 53.49 3520 1623 15 - - - 2013-14 3766 2702 45.19 2800 1261 - - - - 2014-15* 4329 1104 48.60 - - - - - - Over all 99142 43207 46.27 26203 11481 342 46.67 4.635 - * Pregnancies confirmed up to March 2015 against AI done till December 2014

135
Financial Statement 2014-15 (Rs in Lakhs) Sanctioned as per R E
Total ICAR Share
Released ICAR
Share as per R E
Opening balance (ICAR Share)
Anti. Receipt (ICAR Share)
Expenditure as per AUC 2013-14
Closing Balance ICAR
Share State Share
78.00 58.50 51.57330 6.92670 1.21210 53.31008 17.77003 6.40202
Herd strength increased to 77 head from 66 in 2013-14. The breedable herd size 34. Thirteen calving (7 male, 4 females and 2 still births) were reported during the period. The calf mortality (0-3 months) was 5.88 percent (1/17). At the farm AI was performed utilizing semen of 8 bulls with the conception rate of 53.33 (16/30) percent, which is quite good. During the period 37860 semen doses were produced and 18380 doses from IVth set and Vth set of bulls were used in the field. 1,17,925 semen doses available at the centre. Production Performance: The 305 day or less day milk yield 141.34 kg (n=12). The reproductive parameters viz AFC, Service period, Dry period and Calving interval were 44.32 months (n=2), 109 days (n=10), 108 days (n=10) and 429 days (n=10) respectively. The centre is sustaining the reproductive performance over the years. The wet and herd averages were 4.57 kg and 2.12 kg, respectively and only 33.00 percent buffaloes were in milk this year compare to about 60% in milk during previous year. Field Unit: 4329 AI’s were performed at 9 centers of Kolhapur, Solapur and Belgaum districts. For these AI’s semen from Vth set of bulls were used. A total of 2104 conceptions took place with the conception rate of 48.60 % (2104/4329) and 641 male 524 female progenies born. 244 live female progenies of 0-6 m, 219 of 6-12 months and 433 progenies of 1-3 years and 737 progenies of >3years are standing in the field in three districts for future recording. 425 daughters of 8 bulls of 1st set, 141 daughters of 8 bulls of 2nd set and 32 daughters of 4 bulls of (out of six bulls of the set) 3rd set completely recorded. 9.22 Target achieved during the 04/2014 to 03-2015 Sr. No. Trait Target Achieved
1. Av. Age at first service (months) 34 34.32 2. Av. Age at first calving (months) 44 44.32 3. Av. Age for initiating training of bulls (months) - 30.00 4. Av. Age at first collection 30 32.00 5. Av. Service period (days) 130 109 6. Calf mortality (0-6 months) < 5 % 5.88 7. Wet average (kg) ≥ 6.00 kg 4.57 kg 8. Herd average (kg) ≥ 4.00 kg 2.12 kg
Recommendations: A breedable herd of 50 animals to be maintained so that superior male calves may be
produced from the breeding purpose. Emphasis is to be given on daughter recording in the field budgetary provision of FPT has been made. 25 bulls are standing in herd. The surplus bulls should be disposed off immediately by auction/ sale to progressive farmers/panchayat/developmental agency as per SAU’s norm’s etc.
Project Co-ordinator’s observations on centre performance
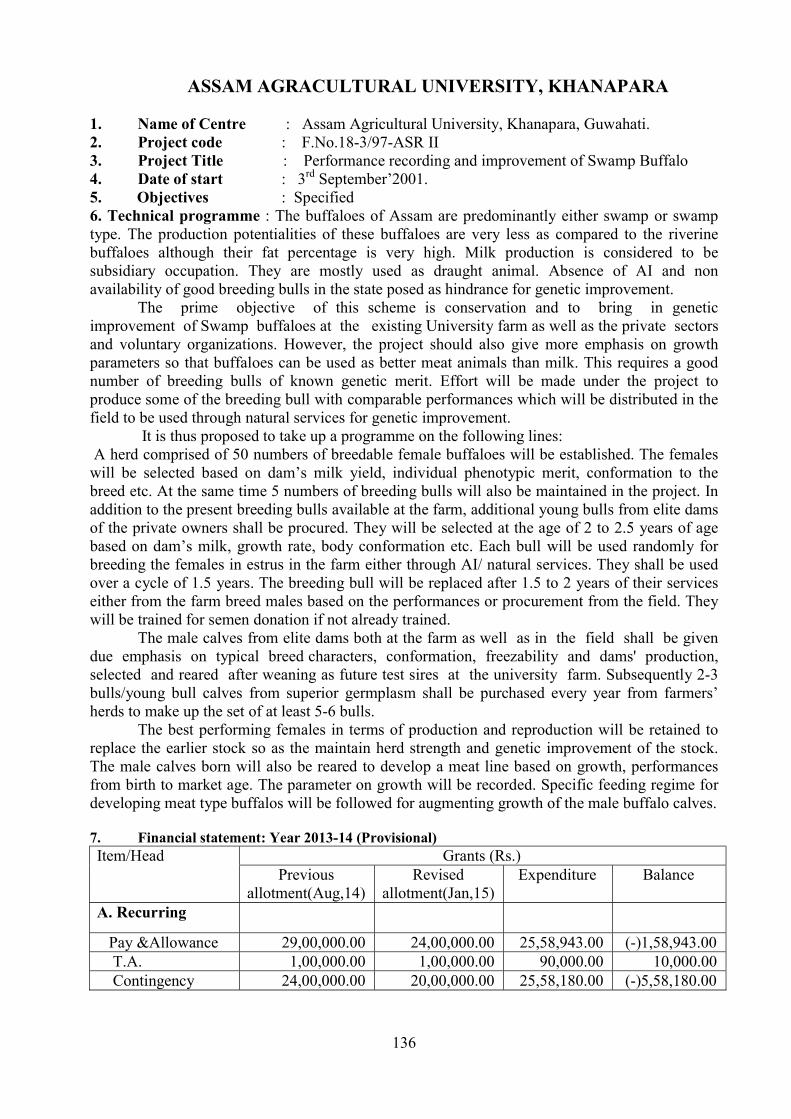
136
ASSAM AGRACULTURAL UNIVERSITY, KHANAPARA 1. Name of Centre : Assam Agricultural University, Khanapara, Guwahati. 2. Project code : F.No.18-3/97-ASR II 3. Project Title : Performance recording and improvement of Swamp Buffalo 4. Date of start : 3rd September’2001. 5. Objectives : Specified 6. Technical programme : The buffaloes of Assam are predominantly either swamp or swamp type. The production potentialities of these buffaloes are very less as compared to the riverine buffaloes although their fat percentage is very high. Milk production is considered to be subsidiary occupation. They are mostly used as draught animal. Absence of AI and non availability of good breeding bulls in the state posed as hindrance for genetic improvement.
The prime objective of this scheme is conservation and to bring in genetic improvement of Swamp buffaloes at the existing University farm as well as the private sectors and voluntary organizations. However, the project should also give more emphasis on growth parameters so that buffaloes can be used as better meat animals than milk. This requires a good number of breeding bulls of known genetic merit. Effort will be made under the project to produce some of the breeding bull with comparable performances which will be distributed in the field to be used through natural services for genetic improvement.
It is thus proposed to take up a programme on the following lines: A herd comprised of 50 numbers of breedable female buffaloes will be established. The females will be selected based on dam’s milk yield, individual phenotypic merit, conformation to the breed etc. At the same time 5 numbers of breeding bulls will also be maintained in the project. In addition to the present breeding bulls available at the farm, additional young bulls from elite dams of the private owners shall be procured. They will be selected at the age of 2 to 2.5 years of age based on dam’s milk, growth rate, body conformation etc. Each bull will be used randomly for breeding the females in estrus in the farm either through AI/ natural services. They shall be used over a cycle of 1.5 years. The breeding bull will be replaced after 1.5 to 2 years of their services either from the farm breed males based on the performances or procurement from the field. They will be trained for semen donation if not already trained. The male calves from elite dams both at the farm as well as in the field shall be given due emphasis on typical breed characters, conformation, freezability and dams' production, selected and reared after weaning as future test sires at the university farm. Subsequently 2-3 bulls/young bull calves from superior germplasm shall be purchased every year from farmers’ herds to make up the set of at least 5-6 bulls.
The best performing females in terms of production and reproduction will be retained to replace the earlier stock so as the maintain herd strength and genetic improvement of the stock. The male calves born will also be reared to develop a meat line based on growth, performances from birth to market age. The parameter on growth will be recorded. Specific feeding regime for developing meat type buffalos will be followed for augmenting growth of the male buffalo calves. 7. Financial statement: Year 2013-14 (Provisional) Item/Head Grants (Rs.)
Previous allotment(Aug,14)
Revised allotment(Jan,15)
Expenditure Balance A. Recurring Pay &Allowance 29,00,000.00 24,00,000.00 25,58,943.00 (-)1,58,943.00 T.A. 1,00,000.00 1,00,000.00 90,000.00 10,000.00 Contingency 24,00,000.00 20,00,000.00 25,58,180.00 (-)5,58,180.00

137
Total A 54,00,000.00 45,00,000.00 52,07,123.00 7,07,123.00 B.Non-recurring Equipments 6,00,000.00
- -
1,00,000.00 97,000.00
2,00,000.00 3,000.00
- Works -
Livestock 2,00,000.00 Total B 6,00,000.00 3,00,000.00 3,000.00 Total A + B 60,00,000.00 48,00,000.00 55,04,123.00 (-)7,04,123.00
NB.:The negative balance was due to reduction of fund under RC as well as inclusion of pay of the RA in the RC which was earlier paid from pay and allowance head. 8. i) Staff Position : Designation No. of posts
sanctioned Scale No. of posts
filled Posts vacant
Assoc. Professor (Animal Breeding) 1 12000-16000 1 Nil Asst.Res.Sci. (Rep./Health) 1 23,000 +HRA (Fixed) 1(As RA) Nil
Tech.Asst(Lab) 1 4500-7000 1 Nil 9. Herd Performance 9.1 Herd Strength of buffalo under the project during the Period 4/2014 to 3/2015 Category Addition Disposal Sl.No. OB B T D T S CB Female 1. Female Calves below 3 months 00 08 - - 06 - 02 2. Female Calves 3-6 months 02 - 06 - 03 - 05 3. Female Calves 6-12 months 01 - 03 - 03 - 01 4. Heifers above
1-2 years 2-2.5 years Above 2.5 years
02 01 24
- - -
03 02 03
- -
01
02 03 08
- - -
03 00 18
5. Buffaloes in Milk 03 - 08 - 00 - 11 6. Buffaloes Dry 13 - 00 01 00 - 12 Sub Total 46 08 25 02 25 - 52 Male 1. Male Calves below 3 months 00 06 - 02 04 - 00 2. Male Calves 3-6 months 00 - 04 01 01 - 02 3. Male Calves 6-12 months 01 - 01 - 01 - 01 4. Male above
1) 1-2 years 2) > 2 years
03 04
- -
01 03
- -
03 00
- -
01 07
5. Breeding bulls 09 - 00 01 00 - 08 Bullocks - - - - - - 00 7. Teasers - - - - - - 00 Sub Total 17 06 09 04 09 - 19 Grand Total 63 14 34 06 34 - 71

138
9.2 Calving Statistics during the period 4/2014 to 3/2015 Month Male Female Still Birth Overall No. % No. % Nos. % No % April 14 - - - - - - - - May - - - - - - - - June - - - - - - - - July 01 10.00 - - - - 01 10.00 August - - 01 10.00 - - 01 10.00 September 01 10.00- - - - - 01 10.00 October 02 20.00 02 20.00 - - 04 40.00 November 02 20.00 01 10.00 - - 03 30.00 December - - 03 30.00 - - 03 30.00 January 15 - - - - - - - - February - - 01 10.00 - - 01 10.00 March - - - - - - - - Overall 06 60.00 08 80.00 - - 14 100.00
Sex ratio Male : Female 42.86 : 57.14
9.3. Disposal of Animals during the Period 4/2014 to 3/2015 Female
Category Surplus Reprod. Problem
Weak & Old Death Experimental Purposes
1. Female calves <6 months 6-12 month
- - -
- - -
- - -
- - -
- - -
2. Heifers 1-2.5 years > 2.5 years
- -
- -
- -
- -
01 - - -
3. Buffaloes Dry Milch
- -
- -
- -
01 -
- -
Sub Total - - - 02 - Male
1. Male calves < 6 months 6-12 months
- -
- -
- -
03 -
- - -
2. Above 1 years - - - - - 3. Young bulls - - - - - 4. Breeding Bulls - - - 01 - Grand Total - - - 06 -

139
9.4. Month wise Mortality during the Period 4/2014 to 3/2015 Female Male
Overa
ll He
rd
Month
0-3
3-6
6-12 1-2
Yrs.
Above
2 Y
rs. Ov
erall
female
0-3
3-6
6-12
Above
1 Y
rs. Ov
erall
male
Over all
No. Died
% 08 - -
08 - -
04 - -
05 - -
54 02
3.70 79 02
2.53 06 02
33.33 04 01
25 02 - -
20 01 5.0
32 4
12.5 111 06
5.41 Calf mortality (0-3 months) was 14.28 percent 9.5. Causes of Mortality (quarter wise) during the period 4/2014 to 3/2015
Particulars 1st quarter 2nd quarter 3rd quarter 4th quarter A. Respiratory System : B. Digestive System : - - - - 1. Enteritis - - 01 - C. Circulatory System: - - - - D. Others - - - - 1. Chronic debility - - 01 - 13. Miscellaneous 01 - 02 01
Total 01 - 04 01 9.6. Prophylactic Measures Taken During the Period 4/2014 to 3/2015
Vaccination No. of animals Available Inoculated
Screening No. of animals Tested Results
No. of animals treated for Parasitism
FMD 71 71 TB - - All the animals were routinely
treated with anthelmintics
HS 71 71 JD - - BQ 71 71 Brucellosis - - RP - - Mastitis - -
Brucellosis - - Others - -- *FMD, HS, BQ vaccines were inoculated in other animals in the field. 9.7 Calving Abnormalities (Quarter wise) during the period 4/2014 to 3/2015 Quarter Nos. of
calving Dystocia Abortions Retention of
placenta Others Total
No. % No. % No. % No. % No. % I - - - - - - - - - - - II 03 - - - - - - - - - - III 10 - - - - - - - - - - IV 01 - - - - - - - - - -
Overall 14 - - - - - - - - - -
9.8. Female Conception Rate During the Period 4/2014 to 3/2015 Parity I II III IV Overall I C CR I C CR I C CR I C CR I C CR Heifers - - - - - - 3 1 33.33 4 1 25 7 2 28.57 Adults - - - - - - 4 3 75 9 7 77.78 13 10 76.92 Overall - - - - - - 7 4 57.14 13 8 61.53 20 12 60.00 I = Nos. of animals inseminated C = No. of animal conceived CR% = Conception rate %

140
9.9. Bull wise Conception Rate During the period 4/2014 to 3/2015
S.No Bull No. Total No. of AI Total Conceived CR% 1. C9C 2 2 100 2. C28A 6 4 66.67 3. 34 3 1 33.33 4. C29 5 4 80.00 5. C13A 2 1 50.00 6. SB-1 2 - -
Total 20 12 60.00 9.10 Bull Wise Semen Stock:
S. No. Bull No.
Opening Balance
Semen Produced/Received Consumption for AI/Supplied
Balance
1 34 160 102 10 252 2 C5 180 250 04 426 3 C13A 185 376 06 555 4 C9C 790 - 15 775 5 C28A 257 1085 15 1327 6 C29 124 476 15 585 7 SB-1 90 326 06 410
Total 1786 2615 71 4330 *1771 doses of straw were discarded due to poor post thaw sperm motility. 9.11.1 Body measurement of buffaloes at 0-6months, 6-1year and at 1-2 years of ages measured in field and farm during the period 4/2014 to 3/2015
Sex 0 – 6 months Mean.
6 – 1 year Mean.
1 – 2 years Mean.
Male Female Overall
41.95 42.76 42.36
134.87 90.01 112.44
169.97 156.50 163.24
(Figure in parenthesis indicate nos. of observation) 9.11.2 Body measurement of buffaloes at 2-3 years, 3-4 years and at 4 years and above measured in field and farm during the period 4/2014 to 3/2015
Sex 2 – 3 years Mean
3 – 4 years Mean
4 years and above Mean
Male Female Overall
250.89 243.35 247.12
378.09 361.59 369.84
425.35 405.49 415.27
(From next financial year onwards weight of the animals will be recorded as the weighing balance has been procured during the month of March’2015 only) 9.12 Production Performance during 4/2014 to 3/2015
Lact. No Av. Lact. Yield (lits)
Av. Lact. Length (days)
305-day Milk Yield (lit)
Av. Peak yield (lits)
1st 511.250 (1) 638 (1) 301.00 (1) 2.50 (1) 2nd - - - -

141
3rd - - - - 4th - - - - 5th 937.00 (1) 207 (1) - 3.50 (1) 6th - - - - 7th - - - - 8th - - - -
Overall 724.13 422.5 301 3.00 (Figure in parenthesis indicates No. of observations) 9.12.1 Production Performance of Buffaloes Since Inception of Network
Years Av. Lact. Yield (lit)
Av. Lact. Length (days)
305-day Milk Yield (lit)
Av. Peak yield 2004-05 689.22 281.12 - 4.06 2005-06 530.00 198.00 - 4.75 2006-07 343.01 144.87 - 3.53 2007-08 602.80 276 - 4.16 2008-09 417.73 282 412.57 3.13 2009-10 772.10 389 589.79 3.73 2010-11 578.05 426 417.23 3.35 2011-12 671.32 405 480.18 3.39 2012-13 624.83 360 529.37 3.21 2013-14 682.00 411 501.00 3.75 2014-15 724.13 422.50 301.00 3.00
9.13 Average Milk Components (Month wise) 4/2014 to 3/2015
Month Number of Observations
Fat (%)
SnF% T.S.% Protein% Density (Kg/m3)
April 14 6 10.65 9.64 20.29 3.48 1027.93 May 5 9.63 9.48 19.11 3.12 1027.71 June 2 9.41 9.39 18.80 3.42 1028.83 July 2 9.43 9.35 18.78 3.42 1029.01 August 4 8.23 9.65 17.93 3.44 1030.25 September 3 8.39 9.72 18.11 3.45 1030.02 October 3 8.83 9.41 18.24 3.36 1027.90 November 6 7.21 9.09 16.30 3.26 1028.82 December 6 7.61 9.13 16.74 3.21 1028.96 January 15 8 6.94 9.09 15.97 3.14 1029.59 February 8 7.38 9.23 16.61 3.24 1029.21 March 9 7.29 9.20 16.49 3.21 1027.62
Overall 62 8.45 9.37 17.78 3.31 1028.82 9.14. Reproduction Performance of Buffaloes during the period 2014-15
Traits 1st lact 2nd lact 3rd lact 4th lact 5th lact 6th 7th Overall Average Age at
Calving (Months)
N X¯ SE
10 63.33 ± 6.57
- - -
- - -
- - -
- - -
- - -
- - -
10 63.33 ± 6.57

142
Average Service
Period (Days) N X¯ SE
- - -
2 454 ±
- - -
- - -
1 334.00 ± 0.00
- - -
1 587
± 0.00 4
458.33±
Average Dry Period (Days)
N X¯ SE
- - -
2 353 ±
- - -
- - -
1 160.00 ± 0.00
- - -
1 254
± 0.00 4
255.67 ±
Average Calving Interval (Days)
N X¯ SE
- - -
2 770.50
± - - -
- - -
1 651 ±
- - -
1 901.00
± 4
774.17 ±
9.14.1. Reproduction Performance of Buffaloes Since inception of Network
Years AFC (Months) Service Period (days)
Dry Period (days)
Calving Interval (days)
2004-05 47.94±0.31 63.60±9.58 - - 2005-06 49.31±1.21 99.11±20.92 120.60±6.64 367.60±5.24 2006-07 47.97±0.87 99.81±35.51 152.09±35.42 445.30±80.30 2007-08 47.98±0.94 155.58±47.55 236.00±53.55 472.17±48.37 2008-09 49.33±0.00 134.73±9.02 177.55±17.51 440.18±8.80 2009-10 59.77±4.05 364.55±67.17 343.11±67.33 660.64±65.89 2010-11 - 366.58+ 69.89 270.75+ 60.82 652.25+72.23 2011-12 66.63±5.07 380.00±102.77 233.60±70.66 611.40±108.94 2012-13 65.13±14.80 210.75±97.92 210.00 506.50±106.21 2013-14 47.18± 251.50± 156.50± 563.50± 2014-15 63.331± 6.57 458.33± 255.671± 774.171±
9.15 Month wise Milk Production and Disposal During the Period 4/2014 to 3/2015
Month Total Milk Produced (Lts.)
Disposal Liquid Milk Calf feeding Expt.
April’ 2014 133.60 88.00 45.00 0.60 May’ 2014 76.15 48.75 27.00 0.40 June’ 2014 42.20 27.00 15.00 0.20 July’ 2014 39.95 24.25 15.50 0.20 August’ 2014 89.40 37.50 51.50 0.40 September’ 2014 175.55 59.75 115.50 0.30 October’ 2014 269.30 87.50 181.50 0.30 November’ 2014 512.85 191.25 321.00 0.60 December’ 2014 622.10 211.00 410.50 0.60 January’ 2015 664.55 290.25 373.50 0.80 February’ 2015 537.15 264.75 271.50 0.90 March’ 2015 554.9 288.00 266.00 0.90
Total 3717.70 1618.00 2093.50 6.20

143
9.16. Feed and fodder purchased and offered to animals during the period 4/014 o 3/2015 Quarter Qty. produced
at Farm (qntl) Qty. Purchased (qntl) Actually fed
(qntl) Balance (qntl)
I
Green Dry
Silage Concentrate
920 - - -
50.00
- * 68.36 + 7.00=145.36
5 trucks
77.50
-
67.86
II Green Dry
Silage Concentrate
890 - - -
50.00
- 225.86
50.00
137.00
-
88.86
III Green Dry
Silage Concentrate
730 - - -
50.00
- 170.86
50.00
- 148.50
- -
22.36
IV Green Dry
Silage Concentrate
740 - - -
200.00 50.00
- 174.36
200.00 50.00
137.33
- - -
37.03
Total Green Dry
Silage Concentrate
3280 - - -
- 200.00
- 716.44
200.00
- 500.33
- - -
37.03 * Previous year’s balance which has been brought forwarded to 14-15
9.17. Milking performance during the period 4/2014 to 3/2015
Month Nos. of Animal in Milk
Nos. of Animal dry
Total Animal
% in milk
Wet Av. (lits.)
Herd Av.
(lits.) April’ 2014 3 13 16 18.75 0.97 0.18 May’ 2014 3 13 16 18.75 0.52 0.10 June’ 2014 1 15 16 6.25 0.90 0.06 July’ 2014 1 15 16 6.25 0.78 0.05 August’ 2014 2 15 17 11.76 0.60 0.07 Sept’ 2014 4 15 19 21.05 0.49 0.10 October’ 2014 8 12 20 40.00 0.35 0.14 Nov’ 2014 9 12 21 42.85 0.70 0.30 Dec’ 2014 11 12 23 47.82 0.62 0.30 January’ 2015 11 11 22 50.00 0.85 0.43 February’ 2015 12 11 23 52.17 0.79 0.41 March’ 2015 12 11 23 52.17 0.77 0.40
Overall 6.41 13 19.33 30.65 0.70 0.21

144
9.17.1 Milking Performance since Inception Year No. of Animal
in Milk Nos. of
Animal Dry Total
Animal % in Milk
Wet Av. (lit)
Herd Av. (lit)
2001-02 - - - - - - 2002-03 - - - - - - 2003-04 - - - - - - 2004-05 5 10 15 36.86 2.44 0.91 2005-06 7 3 10 67.28 2.39 1.61 2006-07 6 6 12 50.92 1.95 1.15 2007-08 13 7 20 65.00 1.56 1.02 2008-09 13 12 25 50.49 2.13 1.07 2009-10 13 13 26 49.31 2.15 1.06 2010-11 10 11 21 54.48 2.11 1.19 2011-12 8 8 16 54.50 2.19 1.16 2012-13 7 6 13 56.36 1.95 1.07 2013-14 8 7 14 53.51 2.19 1.17 2014-15 6 13 19 30.65 0.70 0.21
NB.Most of the animals in lactation are first calvers which either do not allow to milk or produce meager amount of milk 9.19 Bull Wise Daughters completing first lactation during 2014-2015
Bull No.
Daughter No.
Date of Birth
Date of Calving
First lact. 305 day M.L.
Total yield/L.L.
Remarks 8 C9A 28.10.05 14.12.11 - - - 8 C3 03.07.05 11.1.12 - - - 8 C27 05.09.05 1.7.12 - - - 10 C9B 01.10.06 - - - - 35 C14D 27.09.10 - - - - 37 C26 13.05.07 28.8.12 - - - 37 C13C 06.10.08 - - - - 37 C18A 20.12.08 - - - - 36 C21A 25.08.08 4.1.12 - - - C5 C27C 03.11.09 - - - - C5 C42A 26.10.10 - - - - C5 CC14A 19.01.12 34 C9E 04.11.09 - - - - 34 C7C 21.11.09 - - - - 34 C28C 30.12.10 - - - -
C13A C9G 19.4.12 - - - - C6 CC27 01.07.12 - - - -
C28A CC27A 07.12.13 - - - - C29 CC9E 31.8.14 - - - - C9C CC18A 10.12.14 - - - - C5 CC7C 15.10.14 - - - -
9.18: Bull wise daughters born during the period 4/2014to 3/2015
Bull No. Total Nos. of daughter born
Nos. of daughter reaching A.F.C.
No. of daughter completing 1st Lact.
Last Lact.
C9C 5 - - - C28A 5 - - -
C5 3 - - - C29 1 - - -

145
9.20 List of breeding /young bulls as on 31.3.2015 Sr.No. Bull
No. Date of
birth Dam No.
Sire No.
Dam’s best lact. Yield
Semen doses available
Remarks 1 34 - - - - 325 - 2 C5 21.01.05 5 8 1089.15 235 - 3 C13A 09.08.06 13 10 722.00 230 - 4 C9C 02.09.07 9 10 532.75 1110 - 5 C28A 30.09.07 28 12 1344.25 598 - 6 C29 31.08.07 29 10 690.75 361 - 7 SB-1 10.09.09 - - - 90 - 8 SB-2 05.10.09 - - - - - 9 SB-3 20.11.09 - - - - - 10 CC21A 04.11.12 C21A C9C - - -
9.21 Target achieved during the year 2014-15 Sr. No Traits Target Achievement
I Av. Age of first service (months) 36 42.91 II Av. Age of first calving (months) 45 63.33 III Av. Age for initiating training of bulls (months) 24 - IV Av. Age at first collection 36 - V Av. Service period (days) 150 458.33 VI Calf mortality (0-3 months) % < 5 % 14.28 VII Wet average (kg) ≥ 3.0 kg 0.70 kg VIII Herd average (kg) ≥ 2.0 kg 0.21 kg
12. Expected socio-economic impact in the tract: The swamp buffaloes of Assam play a very important role in the socio-economic as
well as socio-cultural life of the people of Assam. It has got its important social values other than its long time use as draft animals in various agricultural operations as well as producer of quality milk with high fat percentage.
Because of the service rendered to the farmers from the project in the way of providing free vaccination cum treatments to their buffaloes, organization of welfare camp, distribution of breeding bulls they have now shown great interest about buffalo rearing and more and more people are coming forward for advise as well as training.
Therefore, it is expected that the present project will certainly help in genetic improvement of the swamp buffaloes of Assam by way of supplying breeding bulls of high genetic merit, providing other health care and thereby increasing the milk production. This would simultaneously help in economic upliftment of the farming community.
13. Constraints if any: (i) Fund allotted under recurring contingency during 2014-15 was less which needs to be enhanced.
(ii) Additional fund for pay of the RA should be given in the Contingency. (iii) Provision of fund under Non-recurring should be made for civil works and purchase of
animals as fund allotted under these heads during 2014-15 was not released. 14. Brief work plan for the year 2015-16: To increase the herd strength by purchasing new animals that is true to the breed type. To develop meat type swamp buffaloes. To replace the swamp type buffaloes gradually from the farm. To produce quality breeding bulls in the farm. Distribution of surplus breeding bulls in the field will be made. To increase the production and reproductive performances.

146
Financial Statement for the year 2014-15 (Rs in Lakhs) Sanctioned as per R E Total ICAR Share
Released ICAR
Share as per R E
Opening balance (ICAR Share)
Expenditure as per AUC Closing Balance ICAR
Share State Share
48.00* 36.00* 36.00* -19.38156 * Includes Rs. 31.00 lakhs (ICAR Share) from non NEH centers.
Herd Performance Herd strength at the centre was 71 heads, having 41 breedable females. Fourteen calving were reported during the year (6 male and 8 female), calf mortality (0-3 months) was 14.28% (2/14). Six breeding bulls were used for 20 inseminations at the farm. 12 buffaloes conceived with a conception rate of 60.00%. No of breeding bulls at the centre were eight. 2615 doses of semen produced from the seven bulls during the period. Only 71 doses were used / supplied and 4330 doses are available at the centre. 305 or less day milk yield was 301.0 kg (n= 1) and age at first calving, service period, dry period and calving interval were 63.33 month, 458.33 days, 255.67 days and 774.17 days respectively. The reproductive performance declined at the centre. Wet & herd averages were 0.70 and 0.21 lt, respectively. This is lowest since inception.
Targets achieved during 2014-15 S. No Trait Target Achieved 1. Av. Age at first service (months) 36 months 42.91 2. Av. Age at first calving 45 months 63.33 3. Av. Age for initiating training of bulls (months) 24 months -- 4. Av. Age at first collection 36 months -- 5. Av. Service period 150 days 458.33 6. Calf mortality (0-3 months) < 5 % 14.28 % 7. Wet average ≥ 3.0 kg 0.70 8. Herd average ≥ 2.0 kg 0.21
Recommendations: The centre should concentration on conservation & improvement of Swamp buffaloes.
The breeding bulls be selected on the basis of growth traits along with other production parameters.
Project Co-ordinator’s observations on centre performance
147
LIVESTOCK RESEARCH STATION, VALLABHNAGAR 1. Name of center : Livestock Research Station ,Vallabhnagar RAJVASU, Bikaner. 2. Project Code : 3. Project Title : Network Project on Buffalo Improvement 4. Date of start : 01-04-2001 5. Objectives : The objective of the project is to envisage and undertake progeny
testing for improvement of Surti breed of buffaloes. Priority and emphasis will be on performance recording and improvement of the breed and on semen quality testing laboratory.
6. Technical Programme The prime objective of this scheme is to bring in genetic improvement in Surti buffaloes
at the existing University farm as well as at the private sector and voluntary organizations. This requires a good number of bulls of known merit, which are produced in the farm and are identified in the field for rearing at the farm and to be included into the Progeny Testing program. 6.1 Breeding herd at University Farm: An elite herd of 30 buffaloes was initially
proposed in the project. The male calves from elite dams both at the farm as well as in the field are given due emphasis on typical breed characters, conformation, freezability and dams production. Selected bull calves are reared after weaning as future test bulls at the university farm. Subsequently 2-3 bulls/young bull calves from superior germplasm can be purchased every year from farmers’ animals to make up the set at least 8-10 bull of 18-24 months duration.
6.2 Breeding : On persuasions for AI to the farmers, the frozen semen will be used on at least 3000 breedable females, covered under the programme.
(a) Information recorded: On the farmer (for quantification of management system) Occupation and education of the farmer, Land holding and area devoted to fodder production, Number of animals, age and species wise, Housing system and Management stall feeding or grazing Identification of animals.
(b) On animals: Data on mates Lactation number, Date of A.I., Date of conception, Date of calving, Sex of calf, Test days milk yield at monthly intervals and Fat percentage in milk in 2nd, 5th and 8th month of lactation. Data of Progeny: Date of birth, Pedigree of the animal, Date of insemination, Date of conception, Date of calving, Milk production at monthly intervals, Fat percentage in milk in 2nd, 5th and 8th month of lactation, Quantity and type of fodder at monthly interval, Quantity and type of concentrate at monthly interval.
6.3 System of milk recording: Milk recording is done by milk recorders at monthly interval in test progenies and in dams of the progenies and bull mothers etc., both in morning and evening. At least one milk recording on each test progeny is supervised by a senior staff. Milk records are compiled by the milk recorders and sent to the executing centre.
6.4 Insemination, pregnancy diagnosis and identification: All the breedable females are bred through AI from semen obtained from the identified bull in the project by the trained technician of the university, state department and/ or lay inseminators in the field trained for the purpose. Proper record of AI, PD and calves born are maintained at the centers. Each animal entering this project is registered.

148
7. Financial Statement : (Rs. In Lacs) Head Budget sanctioned Amount spent Pay & Allowances 14.00 10.95 T.A. 1.00 0.22 Contingencies : Recurring 35.00 34.77 Non-recurring 6.00 6.00
8. Staff Infrastructure Name of Employee Designation Pay Scale (Rs.) Date of Joining Scientific Dr. K S Nehra
Associate Professor (Animal Breeding)
37400-67000
23-04-2015
Dr. Mitesh Gaur Assistant Professor (Rep/Health)
15600-39100 28-09-2005 Technical Sh. Gireesh Kumar
SRF against Technical Assistant
18000/-Fixed
01-02-2002
9. Herd Performance : 9.1 to 9.21 9.1 Herd Strength During the Period 4/2014 to 3/2015 Category Addition Disposal Sr. No. OB B T D T S CB Female 1. Female Calves below 3 months 5 15 0 2 18 0 0 2. Female Calves 3-6 months 6 0 18 1 17 0 6 3. Female Calves 6-12 months 2 0 17 2 11 0 6 4. Heifers above
1-2 years 2-2.5 years Above 2.5 years
9 1
11
0 0 0
11 9
14
1 0 0
9 4
10
0 0 0
10 6 5
5. Buffaloes in Milk 26 0 10 5 11 20 6. Buffaloes Dry P /NP 10 0 11 2 0 0 19 Sub Total 70 15 80 13 80 0 72 Male 1. Male Calves below 3 months 7 18 0 5 19 0 1 2. Male Calves 3-6 months 5 0 19 0 18 0 6 3. Male Calves 6-12 months 5 0 18 6 12 0 5 4. Male above
1-2 years > 2 years
6
20
0 0
12 6
0 2
6 1
0 1
12 22
5. Breeding bulls 12 0 0 0 0 0 12 6. Bullocks 1 0 0 0 0 0 1 7. Teasers 1 0 1 0 0 0 2 Sub Total 57 18 56 13 56 1 61 Grand Total 127 33 136 26 136 1 133
OB = Opening Balance D = Deaths S = Sale B = Births T = Transfer CB = Closing Balance
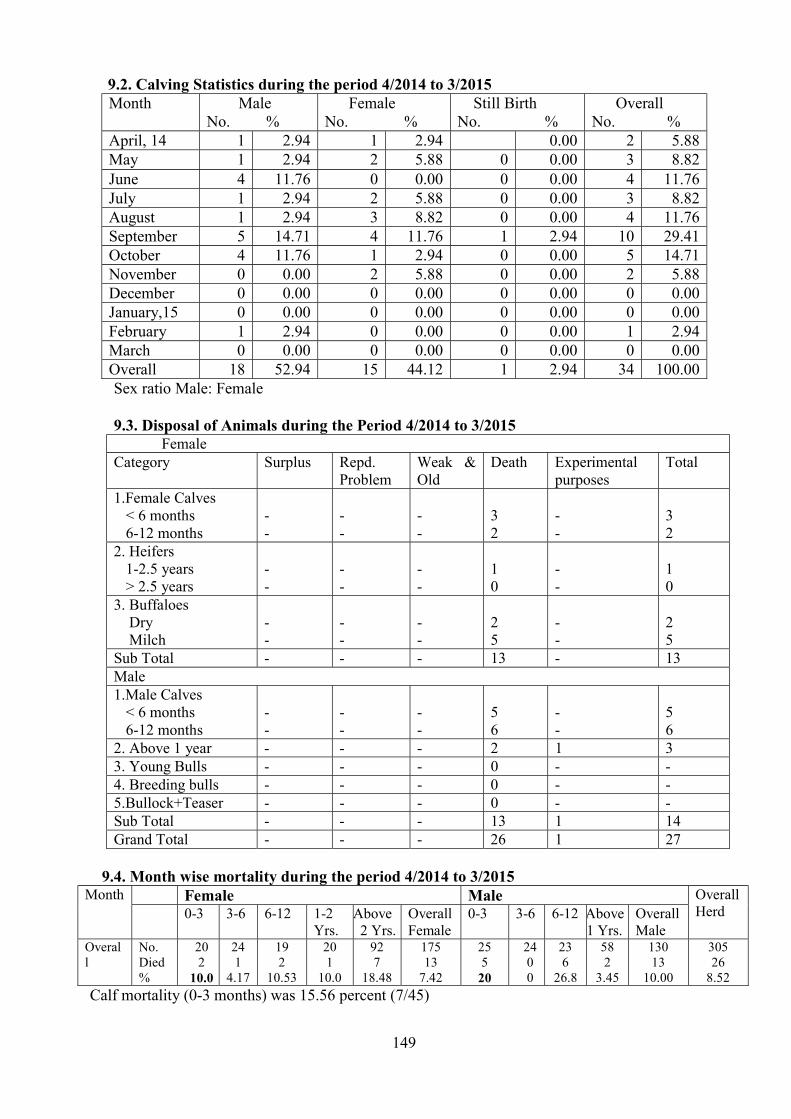
149
9.2. Calving Statistics during the period 4/2014 to 3/2015 Month Male
No. % Female No. %
Still Birth No. %
Overall No. %
April, 14 1 2.94 1 2.94 0.00 2 5.88 May 1 2.94 2 5.88 0 0.00 3 8.82 June 4 11.76 0 0.00 0 0.00 4 11.76 July 1 2.94 2 5.88 0 0.00 3 8.82 August 1 2.94 3 8.82 0 0.00 4 11.76 September 5 14.71 4 11.76 1 2.94 10 29.41 October 4 11.76 1 2.94 0 0.00 5 14.71 November 0 0.00 2 5.88 0 0.00 2 5.88 December 0 0.00 0 0.00 0 0.00 0 0.00 January,15 0 0.00 0 0.00 0 0.00 0 0.00 February 1 2.94 0 0.00 0 0.00 1 2.94 March 0 0.00 0 0.00 0 0.00 0 0.00 Overall 18 52.94 15 44.12 1 2.94 34 100.00 Sex ratio Male: Female 9.3. Disposal of Animals during the Period 4/2014 to 3/2015 Female Category Surplus Repd.
Problem Weak & Old
Death Experimental purposes
Total 1.Female Calves
< 6 months 6-12 months
- -
- -
- -
3 2
- -
3 2
2. Heifers 1-2.5 years > 2.5 years
- -
- -
- -
1 0
- -
1 0
3. Buffaloes Dry Milch
- -
- -
- -
2 5
- -
2 5
Sub Total - - - 13 - 13 Male 1.Male Calves
< 6 months 6-12 months
- -
- -
- -
5 6
- -
5 6
2. Above 1 year - - - 2 1 3 3. Young Bulls - - - 0 - - 4. Breeding bulls - - - 0 - - 5.Bullock+Teaser - - - 0 - - Sub Total - - - 13 1 14 Grand Total - - - 26 1 27
9.4. Month wise mortality during the period 4/2014 to 3/2015
Month Female Male Overall Herd 0-3 3-6 6-12 1-2
Yrs. Above 2 Yrs.
Overall Female
0-3 3-6 6-12 Above 1 Yrs.
Overall Male
Overall
No. Died %
20 2
10.0 24 1
4.17 19 2
10.53 20 1
10.0 92 7
18.48 175 13
7.42 25 5
20 24 0 0
23 6
26.8 58 2
3.45 130 13
10.00 305 26
8.52 Calf mortality (0-3 months) was 15.56 percent (7/45)

150
9.5. Causes of Mortality (quarter wise) during the period 4/2014 to 3/2015 Particulars 1st quarter 2nd quarter 3rd quarter 4th quarter A. Respiratory System : 1. Pneumo Enteritis - 2 1 - 2. Broncho Pneumonia 1 - 3 1 B. Digestive System : 1. Septicemia & Toxaemia 1 - 1 3 2. Haem. Enteritis - - 1 - C. Circulatory D. Others 1. Miscellaneous 2 6 2 2 Total 4 8 8 6 9.6 Prophylactic Measures Taken During the Period 4/2014 to 3/2015
Vaccination No. of animals Available Inoculated
Screening No. of animals Tested Results
No. of animals treated for Parasitism Endo Ecto
FMD 130 130 MRT 40 Negative HS 130 130 Brucellosis
(RBPT) 20 Negative 183 125
BQ 130 130 - - - RP - - - - - Brucellosis - - - - -
9.7 Calving Abnormalities (Quarter wise) during the period 4/2014 to 3/2015 Quarter No. of
Calvings Dystokia Retention of
Placenta Prolapse Others (Still
births) Total Abortions
No. % No. % No. % No. % No. % No. I 9 - 0 1 11.11 - 0.00 - 0.00 1 11.11 - II 17 - 0 - 0 1 5.88 1 5.88 2 11.76 - III 7 - 0 - 0 - 0.00 - 0.00 0 0.00 - IV 1 - 0 - 0 - 0.00 - 0.00 0 0.00 - Overall 34 0 0 1 2.94 1 2.94 1 2.94 3 8.82 0
9.8. Female Conception Rate during the Period 4/2014 to 3/2015 No. of animals No. of services Overall Parity I II III IV V I C CR I C CR I C CR I C CR I C CR I C CR Heifers 2 1 50 1 0 0 - - - - - - - - - 3 1 33.33 I 12 1 8.33 10 6 60.00 3 3 100 - - - - - - 25 10 40.00 II 5 1 20 3 0 0 2 2 100 - - - - - - 10 3 30 III 5 1 20 2 2 100 - - - - - - - - - 7 3 42.86 IV 1 0 0 - - - - - - - - - - - - 1 0 0 V - - - - - - - - - - - - - - - 0 0 - VI & above
6 3 50 3 1 33.33 - - - - - - - - - 9 4 44.44 Overall 31 7 22.58 19 9 47.37 5 5 100 0 0 - 0 0 - 55 21 38.18
I = No. of animals inseminated C = No. of animals conceived CR% = Conception rate%

151
9.9. Bull wise Conception Rate during the period 4/2014 to 3/2015 Sr. No. Bull No. Total Number of AI Total Conceived CR% 1. 1948 6 1 16.67 2. 1950 14 5 35.71 3. 1952 6 4 66.67 4. 1956 13 5 38.46 5. 1961 9 4 44.44 6. 4264 1 0 0.00 7. 4392 1 1 100.00 8 4403 3 1 33.33 9. 4413 2 0 0.00 Total 55 21 38.18 9.11 Bull Wise Semen Stock
Sr. No Bull No.
Set No
Opening Balance
Semen Prod./ Received
Consumption for AI/Supplied Balance Dairy
Farm Field Unit
other Agencies
Total consumed
1 1948 I 302 0 12 0 0 12 290 2 1949 I 2 0 - 0 0 0 2 3 1950 II 428 0 28 0 - 28 400 4 1951 II 25 0 - 0 - 0 25 5 1952 II 266 0 12 0 - 12 254 6 1953 II 95 0 - 0 - 0 95 7 1955 III 680 0 - 0 - 0 680 8 1956 III 616 0 26 0 - 26 590 9 1957 III 920 0 - 0 20 20 900 10 1958 III 195 0 - 0 - 0 195 11 1959 III 195 0 - 0 170 170 25 12 1961 III 559 0 18 0 - 18 541 13 1962 IV 85 0 - 0 - 0 85 14 1963 IV 1020 0 - 0 - 0 1020 15 1964 IV 510 0 0 0 - 0 510 16 1965 IV 350 0 0 0 - 0 350 17 1966 IV 1195 0 0 0 - 0 1195 18 1967 IV 2435 0 0 0 - 0 2435 19 1968 IV 1690 0 0 0 0 0 1690 20 1969 IV 1640 0 0 0 0 0 1640 21 1970 IV 5 0 0 0 0 0 5 22 1971 V 1111 0 0 0 0 0 1111 23 1972 V 573 0 0 0 0 0 573 24 1973 V 1451 0 0 0 0 0 1451 25 1974 V 1137 0 0 0 0 0 1137 26 1975 V 741 0 0 0 0 0 741 27 1976 V 1346 0 0 0 0 0 1346 28 1977 V 1877 0 0 0 0 0 1877 29 1978 V 70 0 0 0 0 0 70 30 4203 VI 268 0 - - - 0 268 31 4229 VI 2874 1434 - - - 445 3863 32 4264 VI 1117 1131 2 - - 2 2246 33 4299 VI 3532 2061 - - - 0 5593 34 4302 VI 174 0 - - - 0 174 35 4321 VI 124 0 - - - 0 124 36 4323 VI 114 0 - 15 - 15 99 37 25 VI 248 0 - - - 0 248 38 8 VI 565 0 - - - 0 565 39 4373 VII 11 578 - 389 - 389 200

152
40 4392 VII 75 808 2 235 - 237 646 41 4403 VII 559 896 6 352 - 358 1097 42 4413 VII 167 1133 4 478 - 482 818 43 4429 VII 139 1267 - 445 - 445 961 44 4458 VII - 592 - 255 - 255 - 45 4464 VII 17 0 - - - 0 17 46 4497 VII 22 470 - - - 0 492
Total 31525 10370 110 2169 190 2914 38644 9.11 Body Weights during the period 4/2014 to 3/2015 Age N Body weight (kg) X SE Female Birth 16 21.66 0.64 3 Months 11 49.41 2.33 6 Months 8 64.13 3.44 12 Months 4 106.5 13.92 18 Months 2 214 4.71 24 Months 5 239.25 7.27 Adult 12 440.75 15.24 Breeding Males Birth 19 22.38 0.65 3 Months 10 52.3 2.28 6 Months 8 67.81 4.70 12 Months 5 153.5 14.24 18 Months 2 184 2.83 24 Months 5 224.5 10.76 Adult Bulls 10 452.60 28.64 9.11.1 Body Weights since inception of Network
Year Birth 3 Months 6 Months 12 Months 18 Months 24 Months At AFC Female 2001-02 26.86±1.04 62.44±3.88 - - - - - 2002-03 27.78±0.77 60.23±2.84 99.54±2.99 183.33±7.69 244.00±NE - - 2003-04 27.73±1.39 58.62±2.03 89.88±3.22 160.08±5.26 232.50±8.88 277.29±8.34 - 2004-05 27.82±0.75 60.85±1.90 89.07±3.60 165.37±3.06 237.75±5.93 299.12±9.43 405.33±8.08 2005-06 27.88±0.64 54.80±1.33 85.43±2.15 129.40±4.08 191.45±3.33 224.25±4.62 415.71±14.98 2006-07 28.52+0.54 55.00+0.77 76.10+1.50 119.55+ 1.61 166.14+ 1.93 217.13+ 3.21 426.57 + 7.68 2007-08 28.89+0.72 58.71+2.41 83.68+2.74 116.43+ 4.77 159.77+ 2.57 208.40+ 4.35 430.47+10.81 2008-09 28.56+0.37 59.80 + 1.85 84.77 + 3.62 120.64+ 6.25 162.58+ 4.15 210.21 4.17 435.83 + 6.41 2009-10 27.71+0.58 60.09+3.11 85.25+4.54 131.50+5.32 181.91+4.82 209.43+3.83 434.23+8.12 2010-11 27.54±0.76 59.84 ± 3.45 72.91 ± 3.96 109.09 ± 4.58 163.19 ± 5.09 205.43 ± 4.16 427.67 ± 9.15 2011-12 26.84±0.86 58.46±2.45 74.45±4.23 108.37±5.37 162.82±7.34 208.64±4.64 426.54±14.21 2012-13 26.80±0.82 59.45±2.47 75.95±4.25 110.40±5.32 165.50±7.30 212.65±4.75 429.50±14.40 2013-14 24.13±0.30 60.34±2.46 77.13±6.26 100.67±1.70 161.72±12.81 209.63±16.76 462.50±23.58 2014-15 21.66±0.64 49.41±2.33 64.13±3.44 106.5±13.92 214.00±4.71 239.25±7.27 440.75±15.24 Male 2001-02 28.71±1.15 65.17±3.14 99.80±1.74 - - - - 2002-03 30.18±3.57 63.43±5.66 100.38±2.34 164.60±3.04 239.75±14.92 - - 2003-04 28.21±0.91 59.46±3.61 88.80±5.16 168.00±7.80 241.00±7.65 338.91±16.86 417.62±8.23 2004-05 27.76±0.76 58.39±1.70 90.96±1.87 165.33±9.56 239.50±7.50 335.31±14.21 479.25±75.65 2005-06 29.45±0.85 60.21±2.27 86.62±3.49 121.71±10.04 179.67±21.26 260.5±16.5 440.0±29.67 2006-07 29.85+0.80 55.54+1.20 83.73+2.10 116.40+ 0.82 169.13+10.09 214.40+15.86 440.0+ 29.67 2007-08 29.58+0.62 60.23+2.30 86.00+5.79 112.75+ 6.25 171.20+ 8.86 221.20+18.04 444.75+ 6.58 2008-09 29.33+0.45 61.47 + 1.80 89.42 + 2.64 118.50 +5.27 176.36+ 3.90 225.71+ 6.57 441.38+11.54 2009-10 27.85+0.57 65.86+3.39 91.50+4.07 132.50+16.6 183.88+8.01 226.74+9.34 439.41+16.48

153
2010-11 28.03 ±0.54 76.71 ± 3.17 69.92 ± 3.36 109.70±14.86 166.28± 6.54 214.49 ±10.91 436.37±17.69 2011-12 28.37±1.02 61.87±4.72 79.43±3.66 124.97±5.72 164.64±445 224.54±14.75 438.64±31.42 2012-13 28.55±1.05 62.80±4.75 80.35±3.65 125.45±5.25 170.5±4.50 225.75±14.80 445.74±31.38 2013-14 24.31±0.49 60.74±3.36 76.00±12.96 107.33±10.35 166.54±10.35 215.59±14.21 455.80±65.67 2014-15 22.38±0.65 52.3±2.28 67.81±4.70 153.5±14.24 184.00±2.83 224.5±10.76 452.60±28.64
9.12 Production Performance of Buffaloes Completing Their Lactation during 4/2014 to 3/2015 Lact. No. No. of
obs. Av. Lact. Yield (kg)
Av. Lact. Length (days)
305-day Milk Yield (kg) Av. Peak yield
1st 13 1313.34±69.36 296.8±11.29 1294.31±70.65 9.03±0.29 2nd 8 1573.10±86.88 292.00±17.45 1532.99±77.18 9.94±0.45 3rd 6 1485.55±118.82 277.00±10.65 1485.55±118.82 10.35±0.39 4th 3 1485.40±402.70 277.50±9.55 1159.45±633.18 9.75±2.30 5th 3 1445.95±110.27 291.50±22.27 1428.70±122.47 10.00±1.06 6th 3 1876.27±74.49 353.67±19.74 1757.60±56.27 9.83±0.59 7th & Above 5 1545.67±150.78 265.67±25.12 1536.43±145.41 10.17±0.72 Overall 41 1493.40±53.85 294.00±7.69 1443.99±60.65 9.71±0.25
9.12.1 Production Performance of Buffaloes since Inception of Network Year Av. Lact. Yield
(kg) Av. Lact. Length (days)
305-day Milk Yield (kg)
Av. Peak yield 2001-02 1687.42±110.73 315.00±20.88 1606.00±95.38 9.08±0.40 2002-03 1859.21±70.84 304.68±11.87 1792.70±62.60 10.23±0.17 2003-04 1653.11±42.43 278.10±5.80 1645.78±41.11 10.59±0.18 2004-05 1661.63±49.10 299.1±7.87 1633.26±39.73 11.13±0.23 2005-06 1721.07±72.95 292.32±9.97 1667.20±62.32 11.32±0.27 2006-07 1684.73 + 52.55 293.03 + 5.24 1661.06 + 50.04 10.89 + 0.31 2007-08 1726.25 + 72.56 303.53 + 8.26 1649.06 + 45.70 11.17 + 0.21 2008-09 1598.69 + 51.34 337.62 + 7.81 1491.37 + 44.77 9.75 + 0.24 2009-10 1600.89 ± 64.93 328.28 ± 16.09 1551.11 ± 49.56 9.69 ± 0.38 2010-11 1433.91 ± 72.22 319.0 ± 17.74 1348.87 ± 72.00 9.0 ± 0.28 2011-12 1428.65±45.49 318.76±9.91 1386.12±47.16 8.82±0.22 2012-13 1432.7±50.59 296.48±9.01 1390.57±41.29 9.70±0.21 2013-14 1526.74±49.26 294.30±9.79 1480.64±38.21 9.58±0.18 2014-15 1493.40±53.85 294.00±7.69 1443.99±60.65 9.71±0.25
9.13 Average Milk Components during the Period (Month-Wise) 4/2014 to 3/2015
Months Number of observations Fat (%) April, 2014 24 7.86 May 27 6.74 June 28 6.74 July 49 7.15 August 26 7.2 September 31 7.68 October 31 7.5 November 30 7.63 December 21 8.17 January, 2015 27 7.65 February 48 8.18 March 22 8.49 Overall 364 7.58

154
9.15 Reproduction Performance of Buffaloes during the Period 4/2014 to 3/2015 Traits 1 2 3 4 5 6 7 &
above Overall
Average Age at Calving (Months)
N X SE
10 47.01 2.49
- - - - - - 10 47.01 2.49
Average Service Period (Days)
N X SE
9 181.56 23.56
2 163.00 70.00
3 170.33 51.48
0 0 2 144.50 55.51
2 80.50 17.32
18 162.28 18.74
Average Dry Period (Days)
N X SE
- 2 249.50 61.16
3 107.67 10.96
1 339
1 74
1 344
2 96.50 32.88
10 177.2 35.07
Average Calving Interval (Days)
N X SE
- 2 490.5 49.14
3 344.33 4.91
1 614
1 341
1 584
2 453 50.91
10 445.9 33.71
9.15.1 Reproduction Performance of Buffaloes Since inception of Network. Years AFC (Months) Service Period (days) Dry Period (days) Calving Interval
(days) 2001-02 - 243.92 ±42.12 250.08 ±23.75 556.17 ±24.96 2002-03 - 195.00 ±22.93 204.45 ±25.71 489.95 ±24.01 2003-04 1517.34 ±50.82 146.13 ±14.32 177.35 ±12.01 454.71 ±14.45 2004-05 1370.64 ±86.23 153.55 ±11.10 179.37 ±9.84 462.79 ±11.33 2005-06 1366.23 ±31.93 145.87 ±18.50 171.83 ±16.20 451.63 ±18.03 2006-07 1367.69 ±29.27 148.68 ±13.13 163.32 ±11.69 450.27 ±14.29 2007-08 1431.62 + 22.36 150.57 + 13.02 162.03 + 23.45 456.11 + 11.48 2008-09 1565.62 + 41.18 118.27 + 16.96 172.88 + 15.90 480.25 + 16.10 2009-10 1489.18 ± 29.65 203.10 ± 22.39 169.57 ± 11.58 453.30 ± 16.06 2010-11 1391.67 ± 88.97 108.68 ± 19.01 193.57 ± 19.64 503.24 ± 22.75 2011-12 1461.00 ± 98.49 97.11 ± 5.15 141.19 ± 31.18 425.90 ± 33.77 2012-13 1448.00 ± 69.58 108.6 ± 14.82 164.08 ± 21.72 441.73 ± 22.99 2013-14 45.47 ± 2.62 119.63 ± 11.84 135.60 ± 7.83 401.06 ± 11.50 2014-15 47.01 ± 2.49 162.28 ± 18.74 177.2 ± 35.07 445.9 ± 33.71
9.15 Month wise Milk Production and disposal during the period 4/2014 to 3/2015 Month Total milk
produced (kg) Disposal Liquid Milk Calf feeding Expt.
April, 14 4424.5 3623 801.5 0 May 4083.5 3578 505.5 0 June 3754.1 3054.6 699.5 0 July 3739 2861 878 0 August 4292.5 3263 1029.5 0 September 4380.7 3147 1232.2 1.5 October 4463 3212 1250 1 November 4541.5 3278.5 1259.5 3.5 December 4287.5 3452 834 1.5 January, 15 4079 3612.5 465 1.5 February 3030.5 2822 207 1.5 March 2835.5 2741 93.00 1.5 Total 47,911.30 38,644.60 9,254.70 12.00
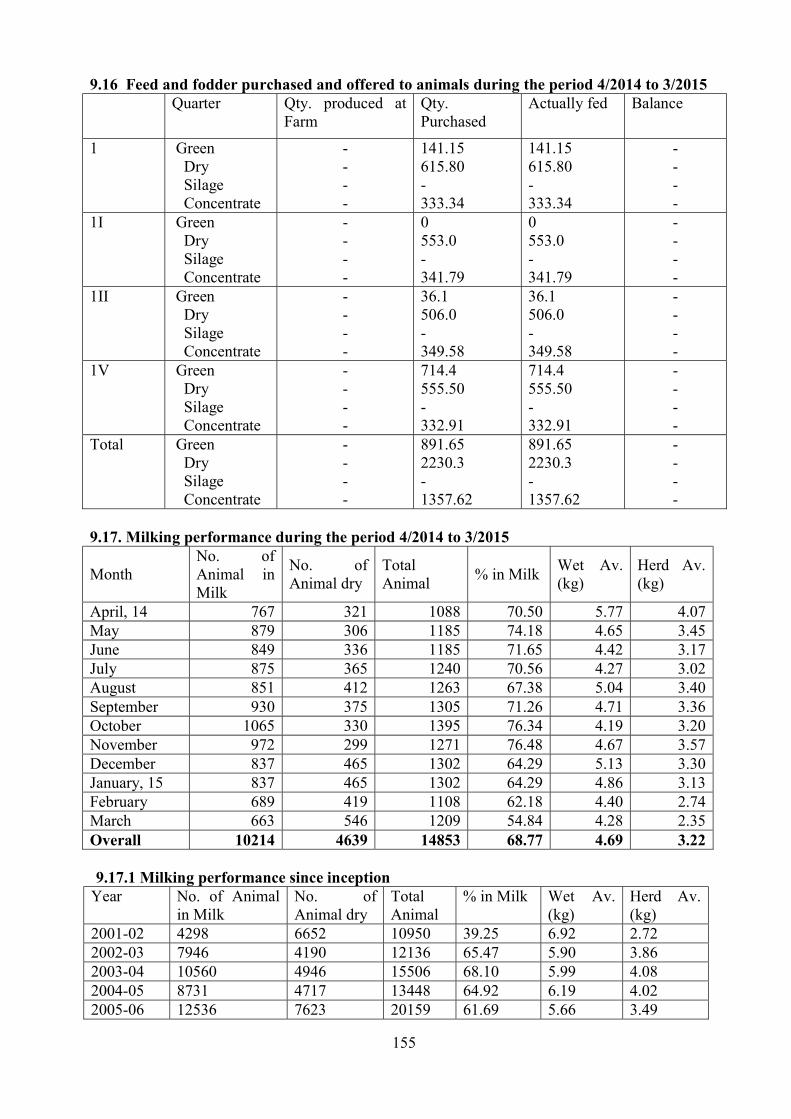
155
9.16 Feed and fodder purchased and offered to animals during the period 4/2014 to 3/2015 Quarter Qty. produced at
Farm Qty. Purchased
Actually fed Balance 1 Green
Dry Silage Concentrate
- - - -
141.15 615.80 - 333.34
141.15 615.80 - 333.34
- - - -
1I Green Dry Silage Concentrate
- - - -
0 553.0 - 341.79
0 553.0 - 341.79
- - - -
1II Green Dry Silage Concentrate
- - - -
36.1 506.0 - 349.58
36.1 506.0 - 349.58
- - - -
1V Green Dry Silage Concentrate
- - - -
714.4 555.50 - 332.91
714.4 555.50 - 332.91
- - - -
Total Green Dry Silage Concentrate
- - - -
891.65 2230.3 - 1357.62
891.65 2230.3 - 1357.62
- - - -
9.17. Milking performance during the period 4/2014 to 3/2015 Month
No. of Animal in Milk
No. of Animal dry
Total Animal % in Milk Wet Av.
(kg) Herd Av. (kg)
April, 14 767 321 1088 70.50 5.77 4.07 May 879 306 1185 74.18 4.65 3.45 June 849 336 1185 71.65 4.42 3.17 July 875 365 1240 70.56 4.27 3.02 August 851 412 1263 67.38 5.04 3.40 September 930 375 1305 71.26 4.71 3.36 October 1065 330 1395 76.34 4.19 3.20 November 972 299 1271 76.48 4.67 3.57 December 837 465 1302 64.29 5.13 3.30 January, 15 837 465 1302 64.29 4.86 3.13 February 689 419 1108 62.18 4.40 2.74 March 663 546 1209 54.84 4.28 2.35 Overall 10214 4639 14853 68.77 4.69 3.22 9.17.1 Milking performance since inception
Year No. of Animal in Milk
No. of Animal dry
Total Animal
% in Milk Wet Av. (kg)
Herd Av. (kg)
2001-02 4298 6652 10950 39.25 6.92 2.72 2002-03 7946 4190 12136 65.47 5.90 3.86 2003-04 10560 4946 15506 68.10 5.99 4.08 2004-05 8731 4717 13448 64.92 6.19 4.02 2005-06 12536 7623 20159 61.69 5.66 3.49

156
2006-07 12299 8306 20605 59.69 5.64 3.37 2007-08 10057 7717 17774 56.58 5.70 3.23 2008-09 8975 7124 16099 55.75 5.48 3.06 2009-10 10119 7668 17787 56.55 4.27 2.42. 2010-11 9072 6836 15908 58.39 4.48 2.73 2011-12 8501 5212 13713 63.29 4.66 3.02 2012-13 8281 4412 12693 65.24 5.15 3.36 2013-14 8181 4701 12882 63.51 5.11 3.25 2014-15 10214 4639 14853 68.77 4.69 3.22 9.18 Bull wise daughters born during the period 04/2014 to 3/2015 Bull No. Total No. of daughters born No. of daughters
reaching A.F.C. No. of daughters
completing 1st Lact. Last Lact. Farm Field Farm Field Farm Field
Ist Set 1948 - - 1 - 1 - - 1949 - - - - 1 - -
IInd Set 1950 2 - - - - - - 1951 - - - - - - - 1952 2 - - - - - - 1953 - - - - - - - 1954 - - - - - - -
IIIrd Set 1955 - - - - - - - 1956 - - - - - - - 1957 1 - - - - - - 1958 - - - - - - - 1959 - - - - - - - 1961 - - - - - - -
IVth Set 1963 - - - - - - - 1964 - - - - - - - 1965 - - - - - - 1966 - - - - - - 1967 - - - - - - 1968 - - - - - 1 - 1969 - - - - - - - 1970 - - - - - - -
Vth Set 1971 - - 1 - 3 - - 1972 - - - 1 1 2 - 1973 - - 2 2 1 - 1974 - - 4 2 4 2 - 1975 - - 2 4 1 3 - 1976 - - - 4 - 3 - 1977 - - - 6 - 5 - 1978 - - - 12 - 5 -
VI th Set 4203 1 5 - 1 - - - 4224 - - - - - - - 4229 1 7 - 2 - - - 4264 1 2 - - - - - 4299 - 18 - 1 - - - 4302 - - - - - - - 4321 1 - - - - - - 4323 - - - - - - -

157
VIIth Set 4392 1 23 - - - - - 4403 5 70 - - - - - 4413 - 24 - - - - - 4429 - 7 - - - - -
9.19 Bull wise daughter completing 1st lactation (since inception) till 3/2015 S. No. Bull
No. Daughters number
Date of birth
Date of calving I lactation milk yield Lactation
length day Total 305 days
1. 1948 4330 8-05-2005 28-07-2010 1229.5 1229.5 268 2. 1949 4454 02-02-2008 26082013 1636.4 1626.1 320
3. 1950
3948 25-11-98 16-06-03 1277 1277 281 3902 03-06-98 30-06-03 1350 1350 274 4025 12-04-00 13-07-03 1300 1300 230 4035 29-06-00 13-07-03 769 769 158 3956 25-12-98 13-08-03 1150 1150 263 4019 27-03-00 13-10-03 869 869 169 4018 24-03-00 01-01-04 1405 1405 305 4078 13-08-01 18-12-04 1805 1707 349 4021 02-04-01 09-08-05 740 740 188 4046 26-08-00 10-09-05 1367 1367 294 4127 05-04-02 29-10-05 1760 1610 355 4128 24-04-02 06-08-06 1480 1480 297 C109 20-07-98 05-08-03 1337 305 C80 19-05-98 09-10-03 1393 305 C112 24-07-98 29-08-04 1210 305
4. 1951
3950 26-11-98 26-11-02 731 731 206 3929 26-09-98 01-12-02 1131 1131 249 3925 10-09-98 21-12-02 955 955 229 3920 06-09-98 13-02-03 1179 1179 255 4014 12-03-00 03-06-03 1361 1361 228 3959 10-01-99 20-06-03 1321 1321 258 3954 12-12-93 23-07-02 1181 1181 254 3908 05-08-98 01-10-03 1659 1659 283 3980 26-08-99 06-10-03 1157 1157 223 C90 17-06-98 30-10-02 1465 305 B192 18-07-98 16-10-03 966 305 B188 15-07-98 29-08-04 1433 305 E510/199 14-08-01 04-10-06 1317.6 305 B374/129 10-09-00 23-08-06 1096.5 243 A171/391 08-09-02 28-08-06 1369.5 305
5. 1952
3945 17-11-98 18-02-03 607 607 122 4003 13-01-00 27-06-03 1565 1544 314 3988 19-11-99 14-07-03 1103 1103 235 4005 31-01-00 27-07-03 1116 1116 234 4008 13-02-00 01-08-03 1235 1235 297 3946 19-11-98 26-10-03 1070 1070 231 3911 16-08-98 02-11-03 1438 1438 305 3931 27-09-98 13-05-04 1157 1157 220

158
B196 03-08-98 17-01-03 1666 305 A009 20-09-98 18-10-04 1702 305 D02 10-07-01 15-08-05 1351 305
6. 1953
3969 08-03-99 25-08-03 809 809 183 3970 13-03-99 29-08-03 1237 1237 291 4009 15-12-00 11-09-03 958 958 189 4011 24-02-00 07-12-03 1593 1593 274 4082 31-08-01 27-08-05 1203 1199 308 4061 03-10-00 28-06-06 1429 1380 331 A054 30-08-99 23-11-04 1549 305 B250 23-11-99 23-09-05 1211 305 B403 14-10-00 22-10-05 1397 305 A43 06-09-00 18-09-05 1366 305 A105/230 15-09-01 07-01-07 1384.7 305 E581 23-02-02 23/04/2008 1311.5 305
7. 1954 C413/559 10-05-02 15-10-08 823.5 305
8. 1955
C469 21-10-02 13-07-10 838.75 305 C491 26-01-03 14-08-10 1201.07 305 C470 23-10-02 06-10-10 1424.35 305 A179 14-10-02 04-08-07 1534.15 305 A187 21-01-02 15-10-07 860.1 305 C484 15-12-02 22-10-07 1128.5 305 4107 02-11-01 20-09-05 1248 1248 273 4182 11-12-02 21-03-06 1413 1359 330 4194 30-01-03 24-10-07 1055 1055 222 D34 18-08-01 15-09-05 1809 305 D43 23-08-01 22-02-06 1967 305 B400/419 15-10-00 310806 1223.1 305 A129/166 02-12-01 03-11-06 1708.0 305 4198 21-02-03 16-07-07 1360.5 1360.5 277 E599/141 19-08-02 01-09-08 1119.35 305 B708/64 17-01-03 05-11-08 1204.75 305 D198/521 29-07-03 02-02-09 1281 305 D180/510 23-01-03 07-03-09 924 275 B595 05-06-02 08-04-10 1159 305 D183 05-06-03 11-09-09 1266 305 D193 10-07-03 06-01-10 1022 305 D201 05-08-03 18-01-10 1254 305
9. 1956
4129 07-05-02 19-08-05 1152 1152 298 4164 30-10-02 18-10-05 1063 1063 255 B701 03-12-02 13-07-10 588.65 305 C472 30-10-02 13-04-11 1714.1 305 C473 31-10-02 02-05-11 1451.8 305 D115 01-07-02 08-06-07 866.2 305 A142 24-07-02 27-07-07 1040.05 305 A193 02-01-03 06-09-07 1607.35 305 4122 20-01-02 19-12-05 1391 139 302 4180 09-12-02 30-09-06 1126 1126 264 B328 10-08-00 03-10-05 1281 305

159
A022/441 191001 061106 1329.8 305 4272 29-12-03 05-07-07 1261.5 1160.5 351 4184 16-12-02 08-12-07 1305.0 1300.0 309 B684/476 20-10-02 01-12-08 966.85 305 D174 22-11-02 04-08-08 1805.6 305 B692 06-11-02 14-0809 1083 305 A172 15-09-02 01-01-10 1346 305
10. 1957
4121 31-12-01 22-10-05 871 871 220 4135 31-07-02 26-10-06 1377 1377 269 A154/414 110802 281106 1668.4 305 C584 17-05-04 09-05-11 1772.05 305 D135 17-08-02 02-04-08 1149.85 305 A164 10-09-02 26-07-08 1375.55 305 4186 21-12-02 15-06-07 1408.0 1297.0 369 4233 26-08-03 28-09-07 800.5 800.5 275 E590/471 03-08-02 01-10-08 1293.2 305 E593/62 10-08-02 25-08-08 1189.5 305 E601/463 15-09-02 01-01-09 1189.5 305 B603/191 21-06-02 01-11-08 957.7 305 B635/68 30-07-02 01-11-08 960.75 305 B653/184 23-08-02 07-11-08 930.25 305 A164/399 10-09-02 26-07-08 1375.55 305 B615 13-07-02 05-04-10 1205 305 D195 12-07-03 26-12-09 1110 305
11. 1958
4098 17-10-08 22-09-05 915 915 211 4145 05-09-02 28-08-06 1108 1108 281 B717 21-04-03 25-10-07 588.65 305 B676 08-10-02 05-12-07 1079.7 305 4123 23-01-02 14-09-06 1340 1340 284 4166 01-11-02 15-11-06 1058 1058 223 C400 12-11-01 06-07-05 1308 305 4165 30-10-02 02-11-07 914.0 914.0 240 4227 18-07-03 24-07-07 1958.0 1337.0 476 B698 30-11-02 14-03-09 1784.25 305 B706/76 09-01-03 05-11-08 1018.7 305 4228 23-07-03 19-10-08 650 248 E638 06-09-03 15-08-09 860 305 A216 25-08-03 25-11-03 1116 305 D191 16-07-03 18-07-09 714 305 D219 24-09-03 16-02-10 964 305
12. 1959
C507 07-06-03 05-01-11 725.9 305 C562 02-11-03 19-04-11 1833.05 305 A201 14-07-03 26-11-07 1232.20 305 4244 29-08-03 05-09-07 487 487 147 C571/896 300303 050507 1247.5 305 4245 01-09-03 24-07-07 1608.0 1505.0 345 4189 04-01-03 20-08-07 1450.5 1306.0 372 4240 22-08-03 17-01-08 1470.0 1459.0 312 4259 04-11-03 21-11-07 761.5 761.5 262

160
C583/821 15-05-04 05-10-08 875.35 305 4267 17-12-03 19-08-08 1122 1119.5 307 4256 26-10-03 10-10-08 976.5 312 C503 07-06-03 02-07-09 1226 305 C544 30-09-03 24-09-09 1229 305 B802 09-05-04 11-08-09 1464 305 B758 27-09-03 22-09-09 1174 305 D228 17-11-03 1802-10 848 305
13. 1961
4242 25-08-03 18-08-07 697 697 165 4232 02-08-03 21-09-07 1163.5 1115.0 334 4224 14-07-03 13-09-07 745.0 745.0 218 E636/578 05-09-03 01-12-08 1302.35 305 A252/742 07-10-03 10-09-08 1302.35 305 C577 02-01-04 24-10-09 1214 305 C655 12-10-03 28-08-09 1720 305 E672 30-12-03 18-12-09 1513 305 A250 02-10-03 10-0809 891 305 A275 27-01-04 13-04-11 1181.25 305 C555 27-10-03 19-04-11 1451.8 305 A272 17-01-04 30-04-11 1848.03 305 C578 02-09-04 17-05-11 1427.4 305 B777 19-10-03 15-09-07 1143.75
6 305 A256 10-10-03 30-09-07 1387.75 305 C526 25-08-03 26-10-09 1052.25 305 A265 03-12-03 26-11-09 1089 305 A261 26-11-03 13-12-09 1138 305 D206 12-08-03 10-02-10 942 305 E674 05-10-04 20-07-11 1848.3 305
14. 1962 E630 12-08-03 08-06-09 793 305 E617 02-08-03 23-08-09 1943 305
15. 1963
4314 02-12-04 05-11-08 1267 1266 307 4286 22-08-04 11-08-10 841 841 207 4310 25-11-04 08-08-09 1257 1257 269 E692 27-08-04 10-07-10 1433.5 305 A417 17-11-05 30-11-10 1826.95 305 A409 04-11-05 12-12-10 1939.08 305 C587 01-07-04 10-04-11 1891 305 C585 04-06-04 07-05-11 1357.25 305 A286 06-08-04 30-04-11 2360.70 305 B822 20-08-04 21-07-09 1525 305 D250 15-07-04 28-02-10 692 305 C760 26-10-05 31-07-11 1168.2 305 A412 09-11-05 30-07-12 710.65 305
16. 1964 B877 13-11-04 13-09-08 869.25 305 4320 18-12-04 01-12-08 1295.5 1292.5 307 4308 12-11-04 11-09-09 1161 1029 372 4317 09-12-04 22-07-09 1364 1055 420 A371 03-09-05 07-06-10 1656.15 305

161
B877 13-11-04 19-09-08 869.5 305 B961 08-09-05 25-08-09 1083 305 D304 16-03-05 03-03-10 458 305 E790 16-07-06 02-04-12 1732.4 305 B989 15-10-05 25-08-11 1095.0 305 C633 23-10-04 05-07-11 1540.3 305 C635 26-10-04 15-08-11 1546.5 305 C720 30-08-05 01-01-12 2186.9 305 C716 22-08-05 14-07-12 1506.7 305
17. 1965
C593/833 05-08-04 01-12-08 1021.75 305 B938 18-08-05 04-08-10 1329.8 305 C684 04-07-05 04-11-10 762.5 305 C733 16-09-05 05-02-11 777.75 305 C734 17-09-05 17-12-10 814.35 305 A389 30-09-05 13-11-10 2397.30 305 B944 23-08-05 21-09-09 1113 305 E687 10-08-04 20-01-10 805 305 C696 20-07- 05 30-08-12 1546.35 305
18. 1966
C607/911 29-08-04 01-03-09 1128.5 305 4291 17-09-04 14-12-08 1274 278 4359 25-11-05 16-09-10 472.0 472.0 118 B844 13-09-04 23-06-09 1296 305 D283 14-09-04 15-07-10 1488.4 305 D312 17-07-05 03-04-11 1220 305 C607 29-08-04 05-03-09 1128.5 305 D295 24-10-04 03-03-10 586 305 E696 07-09-04 28-01-10 842 305 A295 29-08-04 29-08-09 1101 305 4381 30-07-06 25-12-11 1196.0 1196.0 267 A297 31-08-04 27-08-11 1342.0 305
19. 1967
4295 09-10-04 11-10-08 1286.0 1192.5 338 4343 3-09-05 11-08- 10 934.5 934.5 291 4426 24-07-07 8-07-10 1264 1198.5 335 E722 04-11-04 10-02-10 1016 305 A285 28-07-04 02-08-09 918 305 D244 26-05-04 10-12-09 1055 305 A288 09-08-04 06-10-11 427.0 305 C862 21-10- 06 07-02-13 1101.05 305 C863 21-10- 06 30-11-13 1686.65 305
20. 1968
C661/861 12-12-04 20-12-08 1058.35 305 A344/690 02-08-05 03-11-08 1656.15 305 B901 18-05-05 09-08-10 997.35 305 B907 23-06-05 16-09-10 1198.65 305 C671 28-01-05 10-12-10 1198.65 305 D363 22-02-06 09-04-11 1311.5 305 A398 13-10-05 25-05-11 1924.55 305 4292 24-09-04 02-10-08 1531 1311.5 362 C658 06-12-04 27-08-09 1299 305 A395 0910-05 02-10-09 909 305S

162
D333 02-09-05 04-07-11 973.0 305 D356 30-11-05 12-08-11 1445.7 305 C668 27-12-04 11-08-11 1515.9 305 E781 100106 17-12-13 1399.95 305
21. 1969
C624/853 08-10-04 20-12-08 994.3 305 B833/818 29-08-04 05-11-08 1006.5 305 4271 25-09-04 16-07-08 1380 342 D383 08-08-06 16-07-10 1711.05 305 D388 15-08-06 18-07-10 1619.55 305 A445 15-07-06 10-08-10 1268.8 305 D389 16-08-06 07-06-11 1085.8 305 4306 12-11-04 20/02/09 865.5 865.5 213 4289 02-0904 20/11/04 1414.5 1398.5 311 C796 08-02-06 25-07-09 1168 305 B1053 31-08-06 02-01-12 1247.5 305 C835 08-09-06 05-09-11 1583.0 305 C814 25-07-06 04-06-12 1232.5 305 A450 25-07-06 31-10-12 1119.35 305
22. 1970 C643 20-11-04 12-11-09 1268 305 A317 30-10-04 12-10-10 1274.9 305 A319 11-11-04 12-04-11 1143.75 305
23. 1971
4427 09-08-07 19-09-11 1209.0 1078.0 357 A533 15-01-07 28-11-11 912.0 305 C825 26-08-06 17-09-11 1523.2 305 B1069 24-09-06 29-09-12 1159.0 305 4511 22092009 29122013 1443.4 1443.4 290 4528 05082010 12012014 1221.9 1185.6 323 4533 12082010 11072014 875.8 875.8 240
24. 1972
4399 21-11- 06 19-10-10 1386 1386 351 4405 03-12-06 12-07-11 1297 1255 329 4455 09-08-06 06-08- 11 870.5 870.5 257 A652 08-07-06 03-09-12 1052.25 305 D511 06-08-06 05052013 1277.95 305 D501 050708 10102013 1598.2 305 D515 080808 02112013 1817.5 305 4494 10042009 20012014 1399.6 1377.3 315
25. 1973
E816 03-10-06 31-07-11 1015.7 305 C876 28-10-06 10-10-11 1491.5 305 C871 17-10-06 14-10-11 1482.3 305 B1191 01-07-08 17-11-12 1534.15 305 A664 30-07-08 30-09-12 741.15 305 A748 02-07-09 03-10-12 741.15 305 C869 10072007 14092013 1521.95 305 4523 28072010 25032014 1195.3 1126.8 342 4537 22082010 25052014 602.2 602.2 157
26. 1974 4426 24-07-07 8-07-10 1264 1198.5 335 D414 25-10-06 13-08-10 2080.1 305 A513 05-11-06 28-09-10 2016.05 305 A591 30-09-07 10-10-11 1125.5 305
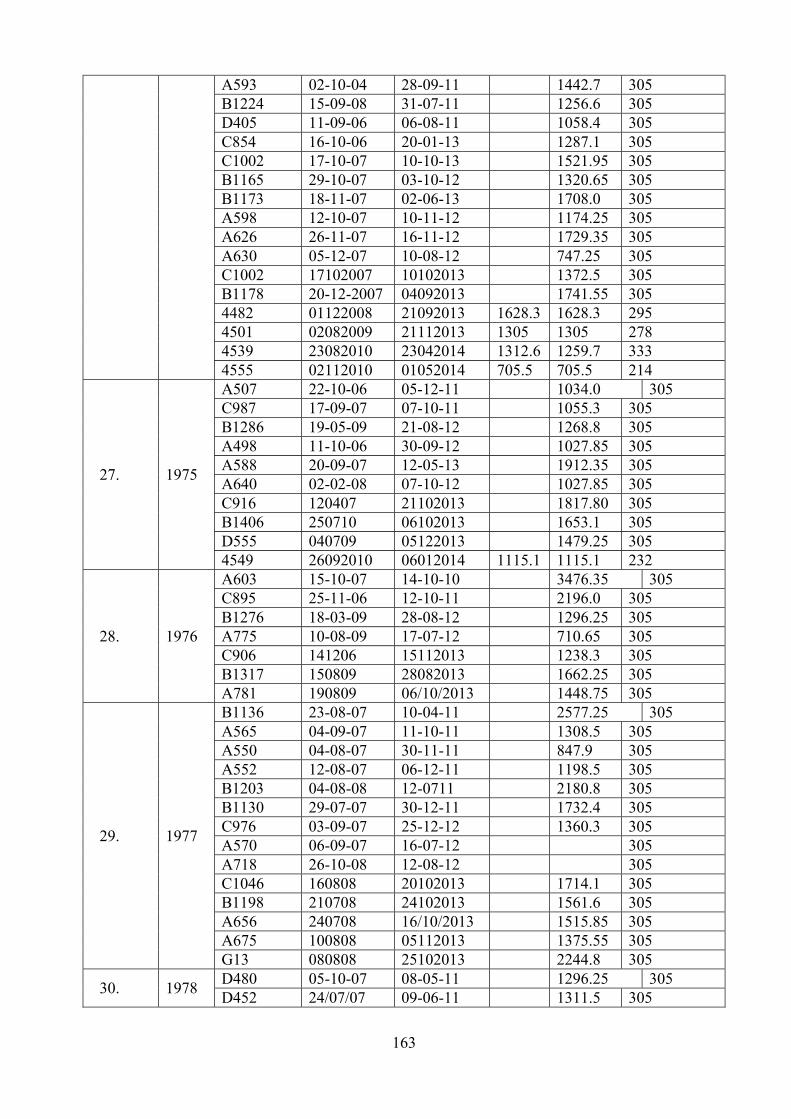
163
A593 02-10-04 28-09-11 1442.7 305 B1224 15-09-08 31-07-11 1256.6 305 D405 11-09-06 06-08-11 1058.4 305 C854 16-10-06 20-01-13 1287.1 305 C1002 17-10-07 10-10-13 1521.95 305 B1165 29-10-07 03-10-12 1320.65 305 B1173 18-11-07 02-06-13 1708.0 305 A598 12-10-07 10-11-12 1174.25 305 A626 26-11-07 16-11-12 1729.35 305 A630 05-12-07 10-08-12 747.25 305 C1002 17102007 10102013 1372.5 305 B1178 20-12-2007 04092013 1741.55 305 4482 01122008 21092013 1628.3 1628.3 295 4501 02082009 21112013 1305 1305 278 4539 23082010 23042014 1312.6 1259.7 333 4555 02112010 01052014 705.5 705.5 214
27. 1975
A507 22-10-06 05-12-11 1034.0 305 C987 17-09-07 07-10-11 1055.3 305 B1286 19-05-09 21-08-12 1268.8 305 A498 11-10-06 30-09-12 1027.85 305 A588 20-09-07 12-05-13 1912.35 305 A640 02-02-08 07-10-12 1027.85 305 C916 120407 21102013 1817.80 305 B1406 250710 06102013 1653.1 305 D555 040709 05122013 1479.25 305 4549 26092010 06012014 1115.1 1115.1 232
28. 1976
A603 15-10-07 14-10-10 3476.35 305 C895 25-11-06 12-10-11 2196.0 305 B1276 18-03-09 28-08-12 1296.25 305 A775 10-08-09 17-07-12 710.65 305 C906 141206 15112013 1238.3 305 B1317 150809 28082013 1662.25 305 A781 190809 06/10/2013 1448.75 305
29. 1977
B1136 23-08-07 10-04-11 2577.25 305 A565 04-09-07 11-10-11 1308.5 305 A550 04-08-07 30-11-11 847.9 305 A552 12-08-07 06-12-11 1198.5 305 B1203 04-08-08 12-0711 2180.8 305 B1130 29-07-07 30-12-11 1732.4 305 C976 03-09-07 25-12-12 1360.3 305 A570 06-09-07 16-07-12 305 A718 26-10-08 12-08-12 305 C1046 160808 20102013 1714.1 305 B1198 210708 24102013 1561.6 305 A656 240708 16/10/2013 1515.85 305 A675 100808 05112013 1375.55 305 G13 080808 25102013 2244.8 305
30. 1978 D480 05-10-07 08-05-11 1296.25 305 D452 24/07/07 09-06-11 1311.5 305
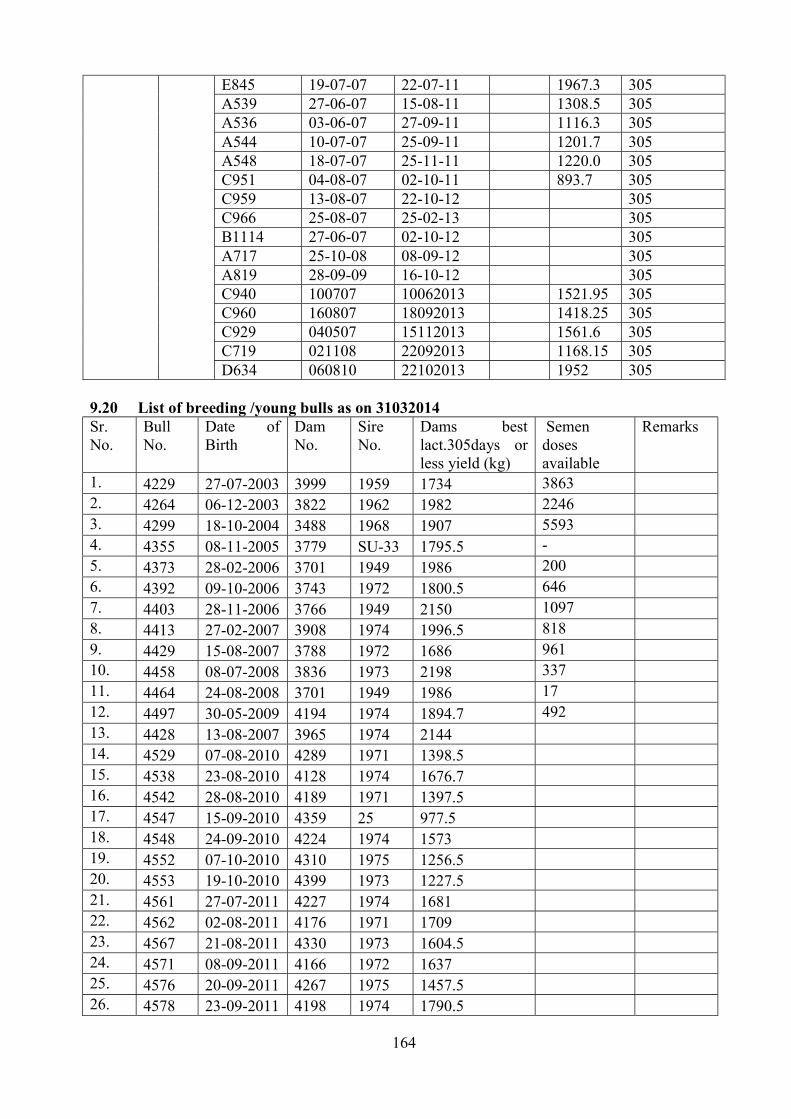
164
E845 19-07-07 22-07-11 1967.3 305 A539 27-06-07 15-08-11 1308.5 305 A536 03-06-07 27-09-11 1116.3 305 A544 10-07-07 25-09-11 1201.7 305 A548 18-07-07 25-11-11 1220.0 305 C951 04-08-07 02-10-11 893.7 305 C959 13-08-07 22-10-12 305 C966 25-08-07 25-02-13 305 B1114 27-06-07 02-10-12 305 A717 25-10-08 08-09-12 305 A819 28-09-09 16-10-12 305 C940 100707 10062013 1521.95 305 C960 160807 18092013 1418.25 305 C929 040507 15112013 1561.6 305 C719 021108 22092013 1168.15 305 D634 060810 22102013 1952 305
9.20 List of breeding /young bulls as on 31032014 Sr. No.
Bull No.
Date of Birth
Dam No.
Sire No.
Dams best lact.305days or less yield (kg)
Semen doses available
Remarks
1. 4229 27-07-2003 3999 1959 1734 3863 2. 4264 06-12-2003 3822 1962 1982 2246 3. 4299 18-10-2004 3488 1968 1907 5593 4. 4355 08-11-2005 3779 SU-33 1795.5 - 5. 4373 28-02-2006 3701 1949 1986 200 6. 4392 09-10-2006 3743 1972 1800.5 646 7. 4403 28-11-2006 3766 1949 2150 1097 8. 4413 27-02-2007 3908 1974 1996.5 818 9. 4429 15-08-2007 3788 1972 1686 961 10. 4458 08-07-2008 3836 1973 2198 337 11. 4464 24-08-2008 3701 1949 1986 17 12. 4497 30-05-2009 4194 1974 1894.7 492 13. 4428 13-08-2007 3965 1974 2144 14. 4529 07-08-2010 4289 1971 1398.5 15. 4538 23-08-2010 4128 1974 1676.7 16. 4542 28-08-2010 4189 1971 1397.5 17. 4547 15-09-2010 4359 25 977.5 18. 4548 24-09-2010 4224 1974 1573 19. 4552 07-10-2010 4310 1975 1256.5 20. 4553 19-10-2010 4399 1973 1227.5 21. 4561 27-07-2011 4227 1974 1681 22. 4562 02-08-2011 4176 1971 1709 23. 4567 21-08-2011 4330 1973 1604.5 24. 4571 08-09-2011 4166 1972 1637 25. 4576 20-09-2011 4267 1975 1457.5 26. 4578 23-09-2011 4198 1974 1790.5

165
27. 4579 26-09-2011 4184 1971 1318 28. 4587 25-10-2011 4128 1974 1676.7 29. 4588 13-11-2011 3908 1948 1996.5 30. 4611 28-09-2012 3908 1948 1996.5 31. 4612 05-10-2012 4176 1957 1709 32. 4614 21-10-2012 4267 1950 1457.5 33. 4617 26-10-2012 4330 1957 1604.5 34. 4620 09-11-2012 4166 1950 1637 35. 4626 14-03-2013 4427 4321 1684.6 36. 4629 (18/3/13)P 4628P UK - 37. 4631 27-03-2013 4630P UK - 38. 4633 08-04-2013 4194 1952 1894.7 39. 4635 30-08-2013 4466 4229 1050.9 40. 4641 21-09-2013 4469 4229 1344 41. 4646 11-11-2013 4330 1957 2054.9 42. 4647 17-11-2013 4446 4264 1790.8 43. 4648 20-11-2013 4434 4264 1580.3 44. 4656 28-01-2014 4186 1952 1721 45. 4657 03-02-2014 4455 1957 1668.5 46. 4658 05-02-2014 4377 4299 1576.2 47. 4661 25-03-2014 4523 4403 1126.8 48. 4663 30-04-2014 4184 1955 1318 49. 4668 10-06-2014 4405 4323 1738.5 50. 4669 16-06-2014 4569 4392 In prog. 51. 4677 20-08-2014 4127 1948 1610 52. 4680 09-09-2014 4520 4403 In prog. 53. 4682 16-09-2014 4514 4403 In prog. 54. 4685 22-09-2014 4166 1950 1637 55. 4686 25-09-2014 4469 4229 1344 56. 4689 13-10-2014 4176 1952 1709 57. 4690 22-10-2014 4330 1957 2054.9 58. 4695 10-02-2015 4549 4403 1115.1 P= Purchased 9.21 Target achieved during the year 2014-15 Sr. No.
Trait Target Achieved
1. Av. Age at first service (months) 28 32.05 2. Av. age at first calving 40 47.01 3. Av. age for initiating training of bulls (months) 20 35.6 4. Av. age at first collection 32 - 5. Av. service period 130 162.28 6. Calf mortality (03 months) < 5% 15.56 7. Wet average ≥ 6.5 kg 4.69 8. Herd average ≥ 4.0 kg 3.22

166
Field Unit
F 1. Herd Strength of Registered Females at Different Field Unit Centers during 2014-15 Center
Opening balance
Addition Deduction Closing balance Birth Purchased New
Regtd. Sold Death Reg.
Cancelled Vallabhnagar 552 35 30 0 40 33 0 544 Rundera 1240 78 58 0 69 51 0 1256 Menar 1126 57 52 0 57 44 0 1134 Navania 990 55 62 0 59 51 0 997 Tarawat 543 38 30 0 35 31 0 545 Total 4451 263 232 0 260 210 0 4476 F 2. Status of Breedable Females at Different Field Unit Centers during 2014-15 Center Heifers >3 years Buffalo Non Pregnant Buffalo Pregnant
Total Pregnant In milk Dry In milk Dry Vallabhnagar 86 27 92 65 39 71 Rundera 186 82 195 102 100 118 Menar 261 82 197 98 107 130 Navania 221 64 201 99 94 132 Tarawat 123 47 137 87 58 77 Total 877 302 822 451 398 528 F 3. Monthly AI (Centerwise) at Different Field Unit Centers during 4/2014 to 3/2015 Month
Center Total Menar Rundera Navania Tarawat Vallabhnagar Dhamania
April 14 7 13 5 6 1 4 36 May 8 8 8 7 2 7 40 June 3 4 4 3 3 4 21 July 15 23 10 12 4 10 74 Aug 32 45 26 15 8 19 145 Sept 24 68 50 26 21 52 241 Oct 24 58 51 24 20 46 223 Nov 35 81 38 25 25 43 247 Dec 14 43 54 38 31 11 35 212 Jan 15 26 36 16 18 6 24 126 Feb 16 29 14 11 11 22 103 March 10 17 10 14 5 10 66 Total 243 436 270 192 117 276 1534

167
F 4. Bullwise AI at Different Field Unit Centers during the Period 4/2014 to 3/2015 Month Bull No. Total
4323 4373 4392 4403 4413 4429 4458 April,14 0 0 0 9 2 25 0 36 May 0 0 0 17 0 23 0 40 June 0 0 0 3 0 18 0 21 July 14 0 4 4 3 49 0 74 August 0 0 8 7 64 66 0 145 September 0 0 58 33 70 80 0 241 October 0 0 29 87 32 75 0 223 November 0 0 56 81 102 8 0 247 Dec. 14 0 39 21 11 76 53 12 212 January 15 0 90 0 6 7 0 23 126 February 0 64 0 6 0 0 33 103 March 0 29 0 0 0 0 37 66 Total 14 222 176 264 356 397 105 1534 F 5. Monthwise Conception at Different Field Unit Centers during the Period 4/2014 to 3/15 Month
Center Menar Rundera Navania Tarawat Vallabhnagar Dhamania Total
Jan. 14 6 16 8 5 3 5 43 Feb, 5 8 7 5 2 7 34 March, 5 14 3 2 0 4 28 April, 3 3 2 2 0 2 12 May 3 1 3 2 0 2 11 June 1 0 2 0 0 1 4 July 3 3 4 4 1 5 20 Aug 7 15 8 5 1 3 39 Sept 6 19 12 11 2 22 72 Oct 9 19 14 7 3 21 73 Nov 7 17 10 7 5 15 61 Dec, 14 10 16 9 7 2 14 58 Total 65 131 82 57 19 101 455
F 6. Monthwise Calving at Different Field Unit Centres during the Period 4/2014 to 3/2015 Month Centre Total
Menar Rundera Navania Tarawat Vallabhnagar Dhamania M F M F M F M F M F M F M F
April,14 1 1 0 1 3 0 0 0 0 0 1 0 5 2 May 1 1 1 1 1 3 2 1 0 0 1 1 6 7 June 0 2 5 3 3 3 6 4 1 2 5 1 20 15 July 4 3 16 5 4 7 8 4 4 0 8 4 44 23 August 4 0 8 5 8 9 8 3 2 2 13 4 43 23 Sept. 2 4 13 9 7 5 5 5 3 2 6 0 36 25 Oct. 7 5 15 6 2 2 4 3 3 1 2 6 33 23 Nov. 1 3 12 3 6 2 3 2 1 1 2 2 25 13 Dec. 14 3 1 6 2 2 3 2 1 0 2 1 2 14 11 Jan., 15 3 2 8 4 2 0 0 2 0 0 1 2 14 10

168
Feb. 2 0 1 0 1 1 1 1 0 0 2 0 7 2 March 2 1 1 0 2 0 1 1 0 0 0 0 6 2 Total 30 23 86 39 41 35 40 27 14 10 42 22 253 156 F 7. Bullwise Conception at Different Field Unit Centres during the Period 4/2014 to 3/2015
Month Bull No. Total 4299 4323 4373 4392 4403 4413 4429 4458 Jan. 14 2 0 0 30 9 2 0 0 43 Feb, 4 0 0 25 2 2 1 0 34 March, 0 0 0 2 2 14 10 0 28 April, 0 0 0 0 4 0 8 0 12 May 0 0 0 0 5 0 6 0 11 June 0 0 0 0 0 0 4 0 4 July 0 1 0 2 1 1 15 0 20 Aug 0 0 0 5 1 17 16 0 39 Sept 0 0 0 21 11 17 23 0 72 Oct 0 0 0 10 24 9 30 0 73 Nov 0 0 0 7 27 25 2 0 61 Dec. 14 0 0 7 3 2 25 19 2 58 Total 6 1 7 105 88 112 134 2 455
F 8. Bullwise Calving at Different Field Unit Centers during the Period 4/2014 to 3/2015
Month Bull No. Total 4203 4229 4264 4299 4392 4403 4413 4429 M F M F M F M F M F M F M F M F M F
April,14 0 0 0 0 2 1 2 1 0 0 1 0 0 0 0 0 5 2 May 2 1 0 0 1 1 1 1 0 0 2 4 0 0 0 0 6 7 June 6 4 0 0 1 0 1 2 0 0 12 9 0 0 0 0 20 15 July 0 0 1 0 1 0 1 6 0 0 41 17 0 0 0 0 44 23 August 0 0 10 6 0 0 3 5 0 0 30 12 0 0 0 0 43 23 September 0 0 2 1 0 0 0 0 0 0 23 16 11 8 0 0 36 25 October 0 0 0 0 0 0 0 0 4 7 11 7 18 9 0 0 33 23 November 0 0 0 0 0 0 1 1 17 9 6 2 1 1 0 0 25 13 December,14 0 0 0 0 0 0 2 2 11 7 0 0 1 1 0 1 14 11 January,15 0 0 0 0 0 0 0 0 1 0 0 2 7 5 6 3 14 10 February 0 0 0 0 0 0 0 0 0 0 3 1 0 0 4 1 7 2 March 0 0 0 0 0 0 0 0 0 0 3 0 0 0 3 2 6 2 Total 8 5 13 7 5 2 11 18 33 23 132 70 38 24 13 7 253 156
F 9. Bullwise Live Female Progeny at Different Field Unit Centres (0-6 M) as on 3/2015 Centre Bull No Total 4299 4392 4403 4413 4429 Menar 0 3 0 3 3 9 Rundera 0 3 0 7 1 11 Navania 0 5 1 0 1 7 Tarawat 2 0 10 0 1 13 Vallabhnagar 0 0 4 1 0 5 Dhamania 0 8 1 2 0 11 Total 2 19 16 13 6 56

169
F 10. Bullwise Live Female Progeny at Different Field Unit Centres (6-12 M) as on 3/2015
Center
Bull No. Total 4203 4229 4264 4299 4403 4413 Menar 0 0 0 0 7 0 7 Rundera 0 5 2 0 7 7 21 Navania 0 0 0 5 13 0 18 Tarawat 5 0 0 0 6 0 11 Vallabhnagar 0 0 0 2 2 0 4 Dhamania 0 0 0 1 6 0 7 Total 5 5 2 8 41 7 68
F 11. Bullwise Live Female Progeny at Different Field Unit Centers (1 - 3 years) as on 3/2015
Center
Bull No. Total 4203 4229 4264 4299 4302 4321 4323 Menar 7 6 7 9 0 0 2 31 Rundera 7 7 18 6 2 1 3 44 Navania 8 9 9 5 6 4 6 47 Tarawat 2 0 6 0 1 1 0 10 Vallabhnagar 0 9 2 2 1 1 0 15 Dhamania 4 13 11 7 0 0 3 38 Total 28 44 53 29 10 7 14 185
F 12. Bullwise Live Female Progeny at Different Field Unit Centers (>3 years) as on 3/2015 Bull No.
Center Total Menar Rundera Navania Tarawat Vallabhnagar Dhamania 1969 0 0 1 0 0 0 1 1972 0 0 0 0 2 0 2 1973 0 0 1 0 1 0 2 1974 0 1 1 1 0 0 3 1975 2 0 2 1 2 0 7 1976 3 0 0 0 4 0 7 1977 1 0 7 1 5 0 14 1978 2 4 5 0 4 0 15 4203 0 2 3 0 4 0 9 4229 10 6 5 2 0 0 23 4264 2 8 10 1 1 0 22 4299 4 3 12 1 2 0 22 4302 2 2 3 0 1 0 8 4321 1 0 0 1 0 0 2 4323 0 0 0 0 1 0 1 Total 27 26 50 8 27 0 138

170
F 12.1. Center and Agewise Live female Progeny as on 3/2015
F 13. Bullwise Daughters Calved at Different Field Unit Centres during 2014-15
Bull No. Center Total Menar Rundera Navania Tarawat Vallabhnagar
1972 - - - 1 - 1 1974 1 - - 1 - 2 1975 - 2 - 1 1 4 1976 2 - 1 - 1 4 1977 1 2 3 6 1978 2 4 3 - 3 12 4203 - 1 1 4229 - 1 1 - - 2 4299 - - 1 - - 1 Total 6 7 8 3 9 33
Center
Age Total 0 – 6 M 6 – 12 M 1 – 3 yr >3 yr Menar 9 7 31 27 74 Rundera 11 21 44 26 102 Navania 7 18 47 50 122 Tarawat 13 11 10 8 42 Vallabhnagar 5 4 15 27 51 Dhamania 11 7 38 56 Total 56 68 185 138 447

171
F 14. Bullwise Daughters Recorded at Different Field Unit Centres during 2014-15 Name of village
Bull no.
Daughter no.
Date of birth Monthly milk recorded
Menar
1973 C-869 10/07/07 DOR 22/06/13 20/07/13 20/08/13 19/09/13 19/10/13 18/11/13 18/12/13 18/01/14 13/02/14 15/03/14 M 3.0 3.7 3.8 4.0 3.8 3.7 3.4 3.1 1.7 2.5 E 1.8 2.0 2.1 2.5 2.3 2.0 1.9 1.5 1.3 0 Total 4.8 5.7 5.9 6.5 6.1 5.7 5.1 4.6 3.0 2.5
1974 C-1002 17/10/07 DOR 19/10/13 18/11/13 18/12/13 18/01/14 13/02/14 15/03/14 17/04/14 16/05/14 16/06/14 14/07/14 M 2.2 2.6 3.0 3.1 2.8 2.7 2.4 2.2 2.2 2.2 E 1.8 2.1 2.5 2.4 2.2 2.0 1.7 1.6 1.7 1.6 Total 4.0 4.7 5.5 5.5 5 4.7 4.1 3.8 3.9 3.8
1975 C-916 12/04/07 DOR 31/10/13 18/11/13 18/12/13 18/01/14 13/02/14 15/03/14 17/04/14 16/05/14 16/06/14 14/07/14 M 3.1 3.8 4.0 4.3 3.7 3.3 2.7 2.5 2.6 2.4 E 3 3.5 3.7 3.9 3.2 2.9 1.9 1.7 1.7 1.8 Total 6.1 7.3 7.7 8.2 6.9 6.1 4.6 4.2 4.3 4.2
1976 C-906 14/12/06 DOR 18/11/13 18/12/13 18/01/14 13/02/14 15/03/14 17/04/14 16/05/14 16/06/14 14/07/14 17/08/14 M 1.8 2.1 2.4 2.7 2.4 2.3 2.1 2.4 2.3 2.0 E 1.6 1.8 2.2 2.2 2.0 1.6 1.7 1.6 1.9 1.7 Total 3.4 3.9 4.4 4.9 4.4 3.9 3.8 4.0 4.2 3.7
1977 C-1046 16/08/08 DOR 31/10/13 18/11/13 18/12/13 18/01/14 13/02/14 15/03/14 17/04/14 16/05/14 16/06/14 14/07/14 M 3.0 3.7 4.0 4.4 3.7 3.4 2.9 2.3 2.6 2.5 E 2.7 2.3 2.6 3.1 2.6 2.3 2.2 1.9 1.9 2.2 Total 5.7 6 6.6 7.4 6.3 5.7 5.1 4.2 4.5 4.7
1978 C-940 10/07/07 DOR 22/06/13 20/07/13 20/08/13 19/09/13 19/10/13 18/11/13 18/12/13 18/01/14 13/02/14 15/03/14 M 3 3.7 3.8 4.0 3.8 3.7 3.4 3.1 1.7 2.5 E 1.8 2.0 2.1 2.5 2.3 2.0 1.9 1.5 1.3 0 Total 4.8 5.7 5.9 6.5 6.1 5.7 5.1 4.6 3.0 2.5
C-960 16/08/07 DOR 30/09/13 19/10/13 18/11/13 18/12/13 18/01/14 13/02/14 15/03/14 17/04/14 16/05/14 16/06/14 M 3.0 3.2 3.6 3.8 3.5 3.2 3.0 0 0 0 E 2.3 2.5 2.8 3.4 2.9 2.4 2.3 1.7 1.4 1.5 Total 5.3 5.7 6.4 7.2 6.4 5.6 5.3 1.7 1.4 1.5
C-929 04/0507 DOR 18/11/13 18/12/13 18/01/14 13/02/14 15/03/14 17/04/14 16/05/14 16/06/14 14/07/14 17/08/14 M 2.5 2.8 3.1 3.5 3.1 3.2 2.7 2.8 2.7 2.8 E 1.8 2.1 2.3 2.5 2.2 2.8 1.7 2.3 2.3 2.2 Total 4.3 4.9 5.4 5.8 5.3 6.0 4.4 5.1 5.0 5.0
Rundera 1974 B-1178 20/12/07 DOR 14/9/13 14/10/13 14/11/13 15/12/13 14/01/14 15/02/15 13/03/14 15/04/14 14/05/14 15/06/14 M 2.9 3.1 3.8 4.2 3.9 3.6 2.6 2.8 2.5 2.3 E 2.1 2.6 3.0 3.5 3.0 2.7 2.3 2.3 2.1 1.8
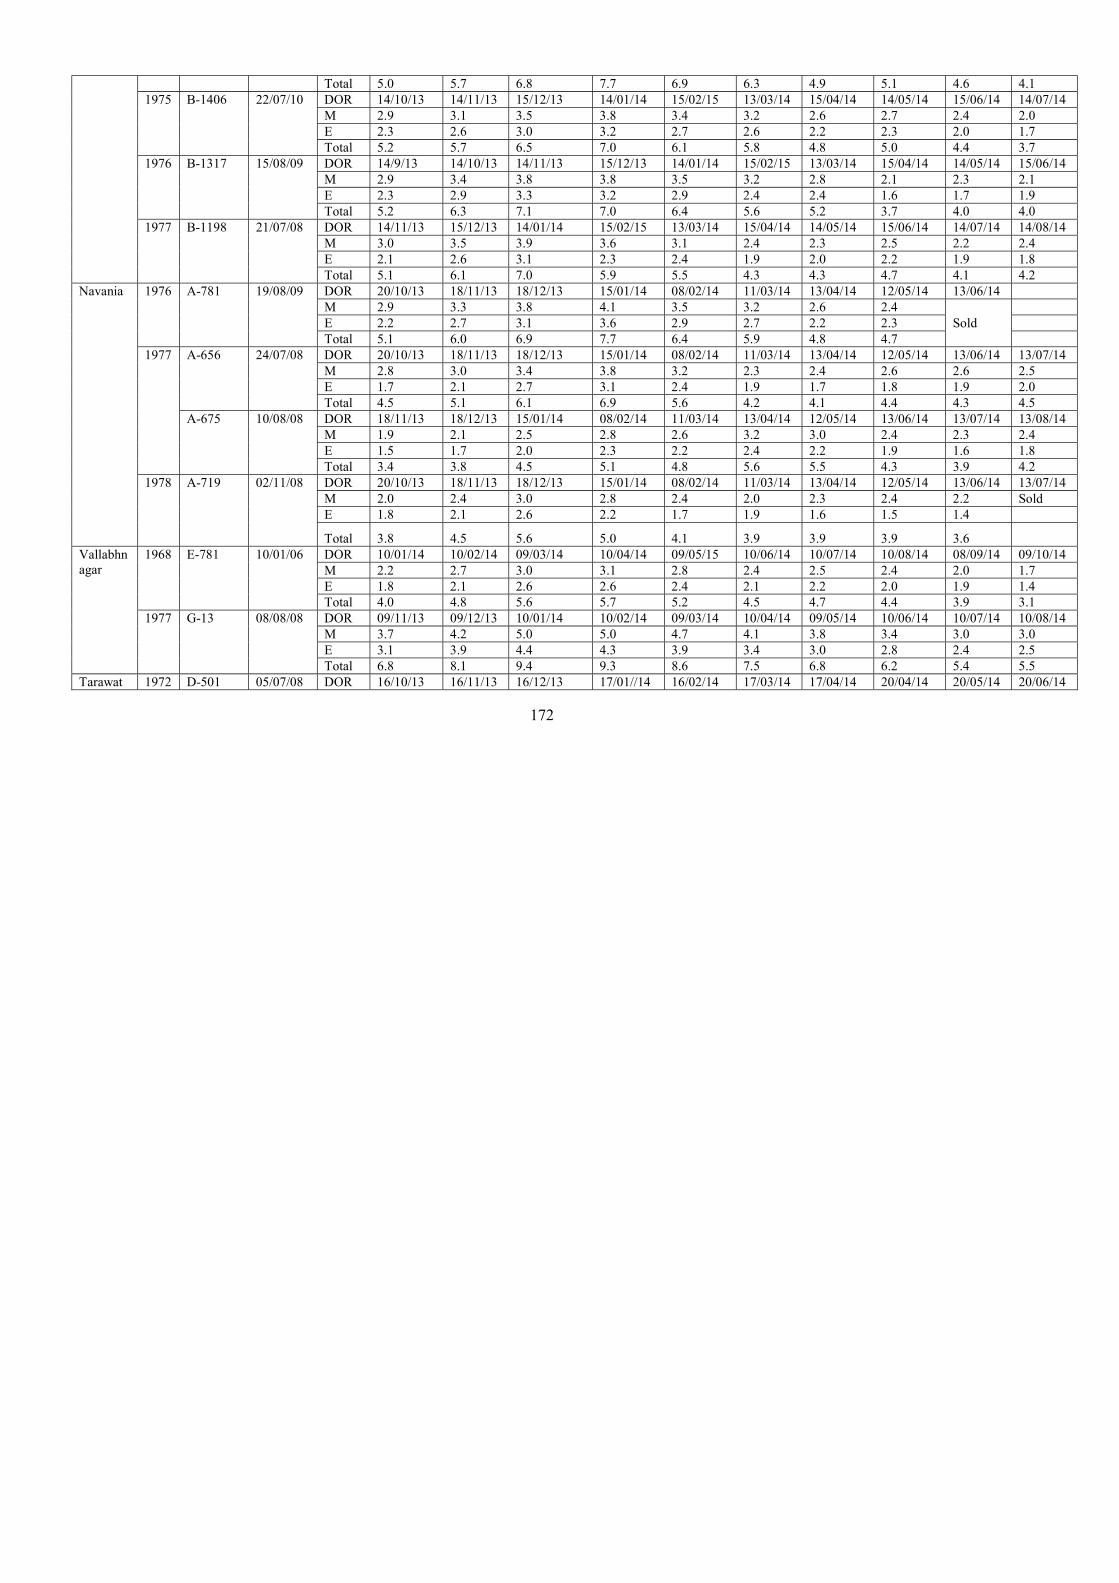
172
Total 5.0 5.7 6.8 7.7 6.9 6.3 4.9 5.1 4.6 4.1 1975 B-1406 22/07/10 DOR 14/10/13 14/11/13 15/12/13 14/01/14 15/02/15 13/03/14 15/04/14 14/05/14 15/06/14 14/07/14
M 2.9 3.1 3.5 3.8 3.4 3.2 2.6 2.7 2.4 2.0 E 2.3 2.6 3.0 3.2 2.7 2.6 2.2 2.3 2.0 1.7 Total 5.2 5.7 6.5 7.0 6.1 5.8 4.8 5.0 4.4 3.7
1976 B-1317 15/08/09 DOR 14/9/13 14/10/13 14/11/13 15/12/13 14/01/14 15/02/15 13/03/14 15/04/14 14/05/14 15/06/14 M 2.9 3.4 3.8 3.8 3.5 3.2 2.8 2.1 2.3 2.1 E 2.3 2.9 3.3 3.2 2.9 2.4 2.4 1.6 1.7 1.9 Total 5.2 6.3 7.1 7.0 6.4 5.6 5.2 3.7 4.0 4.0
1977 B-1198 21/07/08 DOR 14/11/13 15/12/13 14/01/14 15/02/15 13/03/14 15/04/14 14/05/14 15/06/14 14/07/14 14/08/14 M 3.0 3.5 3.9 3.6 3.1 2.4 2.3 2.5 2.2 2.4 E 2.1 2.6 3.1 2.3 2.4 1.9 2.0 2.2 1.9 1.8 Total 5.1 6.1 7.0 5.9 5.5 4.3 4.3 4.7 4.1 4.2
Navania
1976 A-781 19/08/09 DOR 20/10/13 18/11/13 18/12/13 15/01/14 08/02/14 11/03/14 13/04/14 12/05/14 13/06/14 M 2.9 3.3 3.8 4.1 3.5 3.2 2.6 2.4
Sold
E 2.2 2.7 3.1 3.6 2.9 2.7 2.2 2.3 Total 5.1 6.0 6.9 7.7 6.4 5.9 4.8 4.7
1977 A-656 24/07/08 DOR 20/10/13 18/11/13 18/12/13 15/01/14 08/02/14 11/03/14 13/04/14 12/05/14 13/06/14 13/07/14 M 2.8 3.0 3.4 3.8 3.2 2.3 2.4 2.6 2.6 2.5 E 1.7 2.1 2.7 3.1 2.4 1.9 1.7 1.8 1.9 2.0 Total 4.5 5.1 6.1 6.9 5.6 4.2 4.1 4.4 4.3 4.5
A-675 10/08/08 DOR 18/11/13 18/12/13 15/01/14 08/02/14 11/03/14 13/04/14 12/05/14 13/06/14 13/07/14 13/08/14 M 1.9 2.1 2.5 2.8 2.6 3.2 3.0 2.4 2.3 2.4 E 1.5 1.7 2.0 2.3 2.2 2.4 2.2 1.9 1.6 1.8 Total 3.4 3.8 4.5 5.1 4.8 5.6 5.5 4.3 3.9 4.2
1978 A-719 02/11/08 DOR 20/10/13 18/11/13 18/12/13 15/01/14 08/02/14 11/03/14 13/04/14 12/05/14 13/06/14 13/07/14 M 2.0 2.4 3.0 2.8 2.4 2.0 2.3 2.4 2.2 Sold E 1.8 2.1 2.6 2.2 1.7 1.9 1.6 1.5 1.4 Total 3.8 4.5 5.6 5.0 4.1 3.9 3.9 3.9 3.6
Vallabhnagar
1968 E-781 10/01/06 DOR 10/01/14 10/02/14 09/03/14 10/04/14 09/05/15 10/06/14 10/07/14 10/08/14 08/09/14 09/10/14 M 2.2 2.7 3.0 3.1 2.8 2.4 2.5 2.4 2.0 1.7 E 1.8 2.1 2.6 2.6 2.4 2.1 2.2 2.0 1.9 1.4 Total 4.0 4.8 5.6 5.7 5.2 4.5 4.7 4.4 3.9 3.1
1977 G-13 08/08/08 DOR 09/11/13 09/12/13 10/01/14 10/02/14 09/03/14 10/04/14 09/05/14 10/06/14 10/07/14 10/08/14 M 3.7 4.2 5.0 5.0 4.7 4.1 3.8 3.4 3.0 3.0 E 3.1 3.9 4.4 4.3 3.9 3.4 3.0 2.8 2.4 2.5 Total 6.8 8.1 9.4 9.3 8.6 7.5 6.8 6.2 5.4 5.5
Tarawat 1972 D-501 05/07/08 DOR 16/10/13 16/11/13 16/12/13 17/01//14 16/02/14 17/03/14 17/04/14 20/04/14 20/05/14 20/06/14

173
M 2.1 3.0 3.3 3.5 3.5 3.2 2.9 2.5 2.1 - E 1.9 2.5 2.8 3.0 3.1 2.9 2.4 2.0 1.8 3.9 Total 4.0 5.5 6.1 6.5 6.6 6.1 5.3 4.5 3.9 3.9
D-515 08/08/08 DOR 16/11/13 16/12/13 17/01//14 16/02/14 17/03/14 17/04/14 20/04/14 20/05/14 20/06/14 20/07/14 M 2.8 3.1 3.4 3.8 3.8 3.5 3.1 2.8 2.5 2.1 E 2.6 2.0 3.3 3.5 3.4 3.1 2.9 2.6 2.3 2.0 Total 5.4 6.1 6.7 7.3 7.2 6.6 6.0 5.4 4.8 4.1
1975 D-555 04/07/09 DOR 16/12/13 17/01//14 16/02/14 17/03/14 17/04/14 20/04/14 20/05/14 20/06/14 20/07/14 20/08/14 M 2.0 2.6 2.6 3.2 3.1 2.9 2.6 2.2 2.1 2.0 E 1.8 2.1 2.2 2.9 2.8 2.6 2.2 2.0 2.5 2.1 Total 3.8 4.7 4.8 6.1 5.9 5.5 4.8 4.2 4.6 4.1
1978 D-634 06/08/10 DOR 16/11/13 16/12/13 17/01//14 16/02/14 17/03/14 17/04/14 20/04/14 20/05/14 20/06/14 20/07/14 M 2.9 3.7 4.0 4.1 3.8 3.7 3.4 3.2 3.0 3.1 E 2.7 3.2 3.5 3.5 3.1 2.9 2.7 2.5 2.4 2.6 Total 5.6 6.9 7.5 7.6 6.9 6.6 6.1 5.7 5.4 5.7

174
F 15. Bull wise AI, Conception, Calving and Daughters Retained till completion of milk recording till now
Bull No. / Set No.
Total AI Conception
Calving Daughters retained up to Total Female 1
year 2 year
3 years Calving Complete
recording 1948/I 43 20 18 6 0 0 0 0 0 1949/I 0 0 0 0 0 0 0 0 0 1950/II 2 0 0 0 0 0 0 0 0 1951/II 87 20 17 10 0 0 0 1 1 1952/II 58 18 18 8 0 0 0 0 0 1953/II 50 12 8 1 0 0 0 1 1 1954/II 65 13 11 4 0 0 0 1 1 1955/III 499 105 84 38 0 0 0 16 13 1956/III 523 128 86 35 0 0 0 10 10 1957/III 952 183 157 60 0 0 0 14 12 1958/III 572 135 108 46 0 0 0 9 8 1959/III 573 141 112 58 0 0 0 10 10 1960/III 15 4 1 0 0 0 0 0 0 1961/III 705 187 143 60 0 0 0 17 17 1962/III 88 13 9 5 0 0 0 2 2 1963/IV 842 222 168 70 0 0 0 10 10 1964/IV 489 144 118 54 0 0 0 11 10 1965/IV 578 152 120 49 0 0 0 9 9 1966/IV 373 80 72 36 0 0 0 10 9 1967/IV 423 112 77 33 0 0 0 6 6 1968/IV 752 222 178 79 0 0 0 13 13 1969/IV 950 270 221 86 0 0 0 11 11 1970/IV 130 34 24 12 0 0 0 3 3 1971/V 336 93 77 31 16 13 9 3 3 1972/V 363 117 90 37 35 28 18 5 4 1973/V 388 122 108 43 37 33 28 7 7 1974/V 877 296 230 94 68 60 53 16 14 1975/V 954 298 236 106 66 59 75 14 9 1976/V 1322 401 329 135 104 92 75 14 7 1977/V 1490 469 379 157 121 103 109 20 14 1978/V 1821 634 507 222 167 160 127 32 18 4203/VI 935 322 247 101 65 50 43 1 0 4229/VI 1776 571 418 180 114 55 63 2 0 4264/VI 1579 514 396 174 119 79 52 0 0 4299/VI 1477 466 343 153 84 73 56 1 0 4302/VI 543 176 129 57 39 46 25 0 0 4321/VI 226 67 49 22 20 20 1 0 0 4323/VI 359 95 89 38 37 35 1 0 0 4373/VII 222 7 0 0 0 0 0 0 0 4392/VII 393 119 56 23 0 0 0 0 0 4403/VII 1051 340 202 70 0 0 0 0 0 4413/VII 546 166 62 24 0 0 0 0 0 4429/VII 442 134 20 7 0 0 0 0 0 4458/VII 105 2 0 0 0 0 0 0 0 TOTAL 25974 7624 5717 2424 1092 906 735 269 222

175
Performance of FPT Programme since Inception Duration AI Pregna
ncies CR% Calvings Females
Born Daughters Recorded
Av. AFC (months)
Av. Milk Yield (kg/day)
Daughters Due for Recording
2001-02 2256 477 21.14 393 165 50 67.15 4.10 - 2002-03 1850 472 25.51 362 159 49 65.44 3.87 - 2003-04 1980 471 23.79 352 167 50 63.68 4.08 - 2004-05 1861 551 29.61 445 186 29 64.46 4.27 - 2005-06 1717 536 31.22 446 170 33 62.12 4.45 1 2006-07 1637 506 30.91 411 162 36 57.06 4.64 0 2007-08 1811 542 29.93 420 184 17 55.35 4.75 2(1) 2008-09 1804 604 33.48 502 218 11 45.60 4.15 12(4) 2009-10 1975 671 33.97 529 224 9 42.07 4.42 15(7) 2010-11 2038 681 33.42 458 203 - - - 37(18) 2011-12 2023 520 25.70 475 226 - - - 71(2) 2012-13 1897 583 30.73 497 198 - - - 91 2013-14 1591 555 34.88 410 158 - - - 94 2014-15 1534 455 29.66 17 4 - - - 124 Overall 25,974 7,624 29.57 5,717 2,424 284 61.77 4.31 447(32)
AI, Conception, Calvings and Daughters Retained (Set wise) 1stset
Bull of set I 1948/ I 1949/ I Total AI 43 - 43 Pregnancies 11 - 11 Daughters Born 2 - 2 Daughters Calved - - - Complete Recording - - - Daughters Available - - -
AI, Conception, Calvings and Daughters Retained (Set wise) 2ndset Bull No. of II set Total
1950 II 1951 II 1952 II 1953 II 1954 II AI 2 87 58 50 65 262 Pregnancies - 26 12 12 13 63 Daughters Born - 10 8 1 4 23 Daughters Calved - 1 - 1 1 3 Complete Recording - 1 - 1 1 3 Daughter available - - - - - -

176
AI, Conception, Calvings and Daughters Retained (Set wise) 1stset Bull no Total 1948 1949 AI 43 - 43 Pregnancies 20 - 20 Daughters Born 6 - 6 Daughters Calved - - - Complete Recording - - - Daughters Available - - -
AI, Conception, Calvings and Daughters Retained (Set wise) 2ndset
Bull no Total 1950 1951 1952 1953 1954 AI 2 87 58 50 65 262 Pregnancies - 20 18 12 13 63 Daughters Born - 10 8 1 4 23 Daughters Calved - 1 - 1 1 3 Complete Recording - 1 - 1 1 3 Daughters Available - - - - - -
AI, Conception, Calvings and Daughters Retained – 3nd Set Bull No. of III set
1955 1956 1957 1958 1959 1960 1961 1962 Total AI 499 523 952 572 573 15 705 88 3927 Pregnancies 105 128 183 135 141 4 187 13 896 Daughters Born 38 35 60 46 58 0 60 5 302 Daughters Calved 16 10 14 9 10 - 17 2 78 Complete Recording 13 10 12 8 10 - 17 2 72 Daughters Available - - - - - - - - -
AI, Conception, Calvings and Daughters Retained – 4th Set Bull No. of IV set
1963 1964 1965 1966 1967 1968 1969 1970 Total AI 842 489 578 373 423 752 950 130 4537 Pregnancies 222 144 152 80 112 222 270 34 1236 Daughters Born 70 54 49 36 33 79 86 12 419 Daughters Calved 10 11 9 10 6 13 11 3 73 Complete Recording 10 10 9 9 6 13 11 3 71 Daughters Available 0 0 0 0 0 0 1 0 1
AI, Conception, Calvings and Daughters Retained –5th Set Bull No. of V set
1971 1972 1973 1974 1975 1976 1977 1978 Total AI 336 363 388 877 954 1322 1490 1821 7551 Pregnancies 93 117 122 296 298 401 469 634 2430 Daughters Born 31 37 43 94 106 135 157 222 825 Daughters Calved 3 5 7 16 14 14 20 32 111 Complete Recording 3 4 7 14 9 7 14 18 76 Daughters Available 0 2 (1) 2 3 (2) 7 (4) 7 (4) 14(6) 15(12) 50(29)

177
AI, Conception, Calvings and Daughters Retained – 6th Set Bull No. of VI set Total
4203 4224 4229 4264 4299 4302 4321 4323 AI 935 - 1776 1579 1477 543 226 359 6895 Pregnancies 322 - 571 514 466 176 67 95 2211 Daughters Born 101 - 180 174 153 57 22 38 725 Daughters Calved 1 - 2 - 1 - - - 4 Complete Recording - - - - - - - - - Daughters Available 42(1) - 72(1) 77 61(1) 18 9 15 294(3)
AI, Conception, Calvings and Daughters Retained –7th Set Bull No. of V set Total 4373 4392 4403 4413 4429 4458 AI 222 393 1051 546 442 105 2759 Pregnancies 7 119 340 166 134 2 768 Daughters Born - 23 70 24 7 - 124 Daughters Calved - - - - - - - Complete Recording - - - - - - - Daughters Available - 19 57 20 6 - 102
Setwise AI, Conception and daughters retained
Set No.
No. of Bulls AI Preg
Calving Daughters Retained Total F Up to
1Year Up to 2 Year
Up to 3
Year Daughters Recorded
Av. AFC (month)
Av. Milk Yield
(kg/day) Daughters
to be Recorded
1 2 43 20 18 6 - - - - - - - 2 5 262 63 54 23 1 1 1 3 67.28/3 3.8 - 3 8 3927 896 700 302 0 0 0 72 74.13/76 3.97 - 4 8 4537 1236 978 419 0 0 0 71 65.77/72 4.17 1 5 8 7551 2430 1956 825 614 548 494 76 57.05/111 4.71 50(29) 6 7 6895 2211 1671 725 478 358 241 0 40.06/4 - 294(3) 7 8 2759 768 340 124 0 0 0 0 - - 102

178
Financial Statement for the year 2014-15 (Rs in Lakhs) Sanctioned as per R E 14-15 Total ICAR Share
Released ICAR Share as per R E
Opening Balance
Expenditure as per AUC Balance ICAR Share State Share
56.0000 42.000 42.0000 -15.69516 39.51940 13.17312 -13.21456 Herd Performance Herd strength was 133 heads against 127 in 2013-14 comprising 44 breedable buffaloes (> 2.5 years) 34
calves were born during the period and 0 – 3 months calf mortality was 15.56 %. Male calves of > 2years were 22 at the farm.The female conception rate was 38.8 percent at the farm. During the report period 10370 semen doses were produced from VI & VII set of bulls and 2169 doses of semen from these set bulls were used in field. 38644 frozen semen doses is available in stock.
Production performance Average lactation yield and 305 or less day lactation yield were 1493±54 kg and 1444±61 kg, respectively. Age at first calving, Service Period, Dry Period and calving Interval were 47.01±2.49 months, 162.28±18.74 days, 177.2±35.07 days and 445.9±33.71 days respectively. All the reproductive parameter showed –ve growth during 2014-15 from previous year. 68.77 % animals were in milk with the wet & herd averages of 4.69 kg and 3.22 kg during the 2014-15 the corresponding values for previous years were 5.11 kg and 3.25 kg, respectively.
Field Unit Total 1534 AI’s from 7 bulls were performed at 6 field centers having 4476 registered females. Total 455
buffaloes conceived and 409 calving took place. 56 live female progenies of 0-6 month, 68 of 6-12 months 185 of 1-3 years and 138 progenies of > 3 years was available at field unit centers. Milk recording of the first lactation daughter yield is going on at the different centers and 22 daughter completed recording during the year.
Targets achieved during 2014-15
S. No Trait Target Achieved 1. Av. Age at first service (months) 28 months 32.05 2. Av. Age at first calving 40 months 47.01 3. Av. Age for initiating training of bulls (months) 20 months 35.6 4. Av. Age at first collection 32 months NA 5. Av. Service period 130 days 162.28 days 6. Calf mortality (03 months) < 5% 15.56 % 7. Wet average ≥ 6.5 kg 4.69 kg. 8. Herd average ≥ 4.0 kg 3.22 kg.
Recommendations: 58 males more than 1 year age are at the farm, after early selection surplus males should be distributed/
disposed off at earliest. Young breeding male from dam’s having < 1700 kg in 305 or less day best lactation yield not to be reared for breeding purpose. Field recording should be strengthened by engaging contract workers & provide incentives to the farmers. All the bulls should be used in equal proportion in the field. No of AI per bull to be increased to record 25-30 daughters per bull for progeny testing.
Project Co-ordinator’s observations on centre performance

179
ICAR-INDIAN GRASSLAND AND FODDER RESEARCH INSTITUTE, JHANSI 1. Name of Centre : IGFRI, Jhansi 2. Project Code : 2000000001 3. Project Title : Performance recording and improvement of Bhadawari Buffaloes 4. Date of Start : 1.04.2001 5. Objectives : To undertake genetic improvement and conservation of
Bhadawari buffaloes. 6. Technical Program: As per the envisaged technical program of Network project on Buffaloes. A herd of 60-75 breedable females of Bhadawari buffaloes are to be maintained under the project. Selection criteria for elite buffaloes will be at least 1500 kg best lactation yield. The herd will be used for production of superior males. Males selected (68 numbers) as bull will be used for breeding in the herd as well as in the field through AI. Semen from each of these bulls is to be frozen. To increase the population of Bhadawari buffaloes in the field, frozen semen will be used for breeding in the field. Help of the state Govt. of UP and MP and some other organizations will be sought for distribution and use of Bhadawari semen in the field. Daughter’s performance is expected to be recorded from each bull for evaluation of the sires. It is also envisaged to record behavioral aspects for developing optimum management practices as well as information on nutritional aspects for utilizing locally available feed resources available in the semiarid region. Breeding bulls: Initially elite bulls will be provided from the field for elite mating till the first set of bulls is evaluated. Each set of 8 bulls be selected from the males born out of elite mating /procured from field. Bulls will be selected on the basis of Dam’s milk production/reproduction traits and breed characteristics. 7. Financial statement: Statement showing budget received and amount spent during the period 1.04.2014 to 31.03.2015.
(Rs. In Lakhs) Expenditure Head Expenditure incurred during financial year
2014-15 A)Recurring expenditure i) TA ii) Others Sub total
0.55328 23.97731 24.53059
B) Non recurring expenditure i) Animal purchase ii) Equipment
iii) works/modification Sub total
Nil 0.98175 Nil 0.98175
Total 25.51234 Summary: a) Opening balance : 1.71345
b) Remittance (i) Recurring : 25.00000 (ii) Non recurring : 4.00000
c) Refund to PC/CIRB : 1.71345 d) Closing balance at IGFRI : 3.48766
8. Staff and Infrastructure Build up during the year:

180
i) Staff in position S. No.
Designation No. of post sanctioned
Scale No. of post filled
No. of post vacant
Scientific 1. Sr. Scientist, (Animal
Breeding) 1 12000-16000 1
2. Scientist (Rep./Health)
1 8000-12000 1 Technical 3. TII3 (Lab. Tech) 1 4500-7000 1 4. TII3 (field farm) 2 4500-7000 2 5. TI ) comp. Operator) 1 3200-4500 1 Administrative 6. Jr. Clerk 1 3050-4500 1 9.1 Herd Strength during the period 4/2014 to 3/2015 Category Addition Disposal Sr. No. OB B T D T S CB Female 1. Female Calves below 3 months 3 12 1 12 2 2. Female Calves 36 months 3 12 11 4 3. Female Calves 612 months 5 11 11 5 4. Heifers above
12 years 22.5 years Above 2.5 years
2 4 9
11 2 2
2 2 5
11 2 6
5. Buffaloes in Milk 24 5 1 28 6. Buffaloes Dry P /NP 20 3 19 Sub Total 70 12 43 1 43 4 77 Male 1. Male Calves below 3 months 1 18 4 11 1 3 2. Male Calves 36 months 7 11 1 13 4 3. Male Calves 612 months 5 13 9 4 5 4. Male above
12 years > 2 years
4 2
9 2
2 2
4
7 2
5. Breeding bulls 2 2 4 6. Bullocks 7. Teasers Sub Total 21 18 37 5 37 9 25 Grand Total 91 30 80 6 80 13 102 OB = Opening Balance D = Deaths S = Sale B = Births T = Transfer CB = Closing Balance

181
9.2 . Calving Statistics During the period 4/2014 to 3/2015 Month Male
No. % Female No. %
Still Birth No. %
Overall No. %
April, 14 3 10 3 10.0 May 1 3.33 1 3.33 June July 2 6.66 2 6.66 August 3 10 2 6.66 5 16.66 September 2 6.66 2 6.66 October 2 6.66 2 6.66 November 5 16.66 1 3.33 6 20.0 December 1 3.33 2 6.66 3 10.0 January,15 2 6.66 2 6.66 February 1 3.33 1 3.33 2 6.66 March 1 3.33 1 3.33 2 6.66 Overall 18 60 12 40.0 30 100 9.3. Disposal of Animals During the Period 4/2014 to 3/2015
Female Category Surplus Repd.
Problem Weak & Old
Death Experimental purposes
Total 1.Female Calves
< 6 months 612 months
1
1
2. Heifers 12.5 years > 2.5 years
3. Buffaloes Dry Milch
3 1
3 1
Sub Total 4 1 5 1.Male Calves
< 6 months 612 months
1 4
5
6 4
2. Above 1 year 4 4 3. Young Bulls 4. Breeding bulls 5.Bullock+Teaser Sub Total 9 5 14 Grand Total 9 4 6 19

182
9.4. Monthwise Mortality During the Period 4/2014 to 3/2015 Month Female Male Overall
Herd 0-3 3-6 6-12 1-2 Yrs.
Above 2 Yrs.
Overall Female
0-3 3-6 6-12 Above 1 Yrs.
Overall Male
Overall No. Died %
15 1 6.6
82 1 1.2
19 4 21.0
18 1 5.5
39 5 12.8
121 6 4.9
Calf mortality (0-3m) was 14.71 percent 9.5. Causes of Mortality (quarterwise) during the period 4/2014 to 3/2015 Particulars 1st quarter 2nd quarter 3rd quarter 4th quarter A. Respiratory System : 1. BronchoPheumonia 1 B. Digestive System : 1. Gastroenteritis 1 C. Circulatory D. Others 1. Miscellaneous 1 3 Total 1 1 4 9.6 Prophylactic Measures Taken During the Period 4/2014 to 3/2015 Vaccination No. of animals Screening No. of animals
Tested Results No. of animals treated for Parasitism
Available Inoculated FMD 131 131 Deworming 85 HS 131 131 Dipping 66 BQ 131 131 RP Brucellosis
9.7 Calving Abnormalities (Quarterwise) during the period 4/2014 to 3/2015 Quarter No.
of Calv.
Dystokia Retention of Plancenta
Prolapse Others (Still births)
Total Abortions
No. % No. % No. % No. % No. % No. I II Nil III IV Overall

183
9.8. Female Conception Rate During the Period 4/2014 to 3/2015 Parity I II III IV Overall I C CR% I C CR% I C CR% I C CR% I C CR% Heifers 8 3 37.5 3 2 66.6 2 1 50 13 6 46.15 Buffaloes 24 10 41.6 8 4 50 3 2 66.6 35 16 45.71 Overall 32 13 40.62 11 6 54.54 5 3 60.0 48 22 45.83
I = No. of animals inseminated C = No. of animals conceived CR% = Conception rate%
9.9. Bull-wise Conception Rate During the period 4/2014 to 3/2015 Sr. No. Bull No. Total Number of AI Total Conceived CR% 1. B240 23 10 43.47 2. B244 25 12 48.00
Total 48 22 45.83 9.10 Bull Wise Semen Stock
Bull No. Opening balance Semen produced /Received
Consumption for AI/ Supplied/sold
Balance
B46 264 264 B76 215 215 B78 179 179 B79 337 337 B84 191 50 141 B87 368 368 B89 163 163 -
B138 364 364 B122 292 292 B143 400 400 B147 30 30 B150 169 169 B167 275 275 B170 254 254 B182 339 339 B184 291 291 B228 1697 100 1597 B240 586 2585 1730 1441 B244 1649 2163 3145 667 B331 3122 1950 1172 Total 8063 7870 7138 8795

184
9.11 Body Weights During the period 4/2014 to 3/2015 Age N Body weight (kg) X SE Female Birth 12 24.59 1.34 3 Months 12 48.75 2.57 6 Months 11 66.87 2.84 12 Months 11 105.6 6.62 18 Months 11 155.86 13.56 24 Months 6 211.43 18.82 Adult 53 400.27 10.42 Breeding Males Birth 18 26.31 0.83 3 Months 14 50.56 2.07 6 Months 13 63.67 2.81 12 months 6 105.14 8.06 18 Months 4 158.75 10.6 24 Months 2 261.28 20.2 Adult Bulls 4 436.21 9.10 Table: 9.11.1 Body weights since inception of Network Year At Birth 3 Months 6 Months 12 Months 18 Months 24 Months AFC
Females 2002-03 24.06±0.92 43.20±1.59 66.33±2.76 2003-04 24.85±0.96 46.41±1.82 67.55±3.36 118.8±4.45 163.87±10.87 2004-05 24.15±1.09 46.16±1.40 64.80±3.08 106.7±7.42 173.40±7.55 2005-06 27.30±0.82 44.30±2.02 63.25±2.53 110.83±5.11 183.36±12.18 225.16±12.09 2006-07 26.33±1.33 44.44±2.70 65.00±1.93 107.27±3.40 166.54±8.51 210.41±12.42 326.7±26.50 2007-08 24.73±1.10 40.54±1.02 62.07±3.34 104.12±5.13 167.25±12.55 230.85±7.02 344.85±14.94 2008-09 26.50±1.17 40.90±1.44 62.75±3.30 108.75±3.42 168.20±5.95 232.14±8.33 326.71±10.83 2009-10 26.89±0.85 41.5±3.50 64.80±5.50 115.15±12.15 169.31±23.92 228.0±16.24 361.8±15.74 2010-11 24.58±0.58 40.89±1.14 60.41±1.28 104.87±4.47 154.84±14.2 206.22±12.40 340.8±20.4 2011-12 26.00±1.00 42.66±2.35 57.91±2.62 108.37±5.87 156.90±10.69 196.07±9.22 290.00±25.10 2012-13 24.87±1.12 43.50±2.05 58.0±2.32 112.40±5.63 160.0±15.3 201.45±10.12 296.16±13.20 2013-14 25.45±0.72 43.71±3.55 67.42±3.38 106.8±7.04 161.25±11.74 192.5±2.50 359.8±18.72 2014-15 24.59±1.34 48.75±2.57 66.87±2.84 105.60±6.62 155.86±13.56 211.43±18.82 376.7±24.23 Males 2002-03 26.80±1.30 48.8±2.81 68.0±6.82 2003-04 26.90±0.62 49.29±1.85 74.80±4.83 133.20±11.6 2004-05 24.66±1.03 47.09±1.53 68.42±2.78 115.72±6.66 2005-06 27.96±0.87 46.90±1.14 68.68±2.80 123.50±3.42 203.60±6.38 258.0±6.08 2006-07 27.35±0.73 45.08±1.32 70.44±2.50 115.51±6.27 179.75±6.60 234.32±8.92 2007-08 27.72±0.98 42.56±1.04 67.95±2.67 114.18±1.40 178.28±6.91 234.5±9.50 2008-09 27.30±1.25 43.0±0.99 67.80±2.58 114.35±4.63 180.0±4.48 242.5±9.93 2009-10 27.30±0.85 44.20±5.6 68.30±5.32 116.00±6.0 175.0±7.20 236.0±10.5 2010-11 26.22±0.70 41.93±0.84 65.04±2.80 112.72±5.10 160.40±8.02 224.50±10.34 2011-12 27.4±1.25 42.72±2.68 60.66±2.74 112.00±6.23 165.00 2012-13 25.92±0.97 43.60±2.50 60.50±2.70 116.0±7.30 175.0±11.0 235±11.5 2013-14 25.87±1.07 45.22±2.58 70.8±2.34 108.3±4.33 157.3±5.54 195.0±7.64 2014-15 26.31±0.83 50.56±2.07 63.67±2.81 105.14±8.06 158.75±10.6 261.0±20.2

185
9.12 Production Performance of Buffaloes Completing Their Lactation During the period 4/2014 to 3/2015
Lact. No. No. of obs.
Av. Lact. Yield (kg)
Av. Lact. Length (days)
305day Milk Yield (kg)
Av. Peak yield 1st 6 1503.6 388 1248.5 6.3 2nd 6 1590.9 346 1500.8 7.6 3rd 2 1704.4 368 1516.4 7.5 4th 3 1574 340 1502.4 7.3 5th 3 2056.4 413 1821.8 8.5 6th 1 1551 314 1545.0 8.3 7th & Above Overall 21 1638.8 367 1478.3 7.33 Table 9.12.1. Production performance of buffaloes since inception of project Year Av. Lact. Yield
(kgs) Av. Lact. Length (days)
305 day milk yield (kgs)
Av. Peak Yield (kgs)
2003-04 1067.95 (24) 296 (24) 1029.41 (24) 6.6 (24) 2004-05 997.96 (29) 245 (29) 958.96 (29) 6.7 (29) 2005-06 891.81 (17) 236.53 (17) 891.81 (17) 6.30 (17) 2006-07 1294.65 (35) 304.49 (35) 1159.22 (35) 6.83 (35) 2007-08 1201.33 (24) 279.29 (24) 1188.92 (24) 6.61 (24) 2008-09 1561.11 (31) 344 (31) 1433.48 (31) 7.41 (31) 2009-10 1331.47 (26) 294.7 (26) 1286.50 (26) 7.5 (26) 2010-11 1381.44 (34) 311.0 (34) 1310.00 (34) 7.22 (34) 2011-12 1276.65 (13) 293.76 (13) 1214.78 (13) 6.19 (13) 2012-13 1587.76 (8) 334 (8) 1494.9 (8) 8.19 (8) 2013-14 1416.3 (21) 294.5 (21) 1385.9 (21) 7.50 (21) 2014-15 1638.8 (21) 367 (21) 1478.3 (21) 7.33 (21)
9.13 Average Milk Components (MonthWise) during 4/2014 to 3/2015
Month
Number of observation
Fat ( % )
SNF (%)
Protein (%)
Lactose (%)
April, 2014 15 8.5 11.02 4.2 6.4 May 30 8.7 10.2 4.0 5.6 June 28 8.4 10.1 3.9 5.6 July 34 8.3 10.2 4.0 5.6 August 30 7.9 10.1 3.9 5.6 September 30 8.0 10.4 4.1 5.8 October 26 8.0 10.7 4.1 5.9 November 30 8.1 10.1 4.0 5.6 December 30 7.6 10.1 3.9 5.6 January, 15 30 7.8 10.6 4.1 5.7 February 24 8.7 10.0 4.0 5.7 March 33 7.4 9.3 4.2 5.3 Overall 340 8.12 10.23 4.03 5.7

186
9.16 Reproduction Performance of Buffaloes During the Period 4/2014 to 3/2015 Traits Overall N X SE Average Age at Calving (Months) 15 53.97 2.98 Average Service Period (Days) 15 182.3 27.19 Average Dry Period (Days) 15 216.46 25.19 Average Calving Interval (Days) 15 534 29.55
Table 9.14.1 Reproductive performance of buffaloes since inception Year AFC (months) Service Period
(days) Dry period (days)
Calving interval (days)
2003-04 137.90 220.25 444.5 2004-05 230.33 269.29 535.8 2005-06 156.25 218.46 463.57 2006-07 44.60 166.33 203.29 467.33 2007-08 43.20 226.73 216.13 530.80 2008-09 51.20 148.60 206.8 499.6 2009-10 53.22 167.84 202.75 525.79 2010-11 49.11 160.00 222.75 516.95 2011-12 49.00 179.28 187.92 497.20 2012-13 51.32 153.75 202.62 513.25 2013-14 50.13 174.90 214.2 520.10 2014-15 53.97 182.3 216.4 534.0
9.15 .Month wise Milk Production and Disposal During the Period 4/2014 to 3/2015 Month Total milk
produced (kg) Disposal Liquid Milk Calf feeding Expt.
April, 14 3166.2 2949.7 216.5 May 3389.2 3036.5 352.7 June 2755.7 2561.3 194.4 July 2878.4 2568.1 310.3 August 3051.7 2576.2 475.5 September 2974.4 2539.8 434.6 October 3149.6 2656.3 493.3 November 3220.0 2639.2 580.8 December 3865.5 3172.4 693.1 January, 15 4188.6 3506.0 682.6 February 3713.0 3206.7 506.3 March 3634.4 3168.4 466.0 Total 39986.7 34580.6 5406.1

187
9.16 Feed and fodder purchased and offered to animals during the period 4/2014 to 3/2015 Quarter Qty. produced at
Farm (Quintal) Qty. Purchased (Quintal)
Actually fed (Quintal)
Balance (Quintal)
1 Green Dry Silage Concentrate
455 179 253
94.0** 60.90**
455 273 253 107.6
1I Green Dry Silage Concentrate
460 105
519.40 707.0
460 289 134
1II Green Dry Silage Concentrate
1188 74.85
1188 105 74.85 185.3
1V Green Dry Silage Concentrate
1285 100 75
1285 130 75 185
Total Green Dry Silage Concentrate
3388 384 402.85
613.4 767.9
3388 797.4 402.85 611.9
200 156.0
** Balance from previous year 9.17. Milking performance during the period 4/2014 to 3/2015 Month No. of
Animal in Milk
No. of Animal dry
Total Animal
% in Milk Wet Av. (kg)
Herd Av. (kg)
April, 14 25 19 44 56.8 4.46 2.39 May 26 18 44 59.0 4.33 2.48 June 24 20 44 54.5 3.92 2.09 July 25 19 44 56.8 4.13 2.11 August 26 18 44 59.0 4.20 2.23 September 26 18 44 59.0 4.11 2.25 October 27 14 41 65.8 3.89 2.48 November 33 9 42 78.57 3.58 2.56 December 36 7 43 83.70 3.68 2.89 January, 15 35 8 43 81.4 4.44 3.14 February 27 20 47 58.6 5.28 2.82 March 28 19 47 59.5 4.56 2.50 Overall 28 16 44 63.6 4.22 2.50

188
Table: 9.17.1 Milking performance since inception Year No. Of
Animal in Milk
No. Of Animal dry
Total Animal
% in Milk Wet Av. (kg)
Herd Av. (kg)
2002-03 19 23 42 46.03 3.30 1.35 2003-04 18 22 40 44.74 3.44 1.35 2004-05 23 16 38 59.44 3.75 1.97 2005-06 22 20 42 51.43 3.74 1.80 2006-07 27 20 47 57.67 3.56 1.86 2007-08 27 19 46 58.69 4.67 2.57 2008-09 29 18 47 62.9 4.35 2.49 2009-10 27 23 50 54.5 4.64 2.37 2010-11 27 21 48 56.90 3.95 2.02 2011-12 12.5 20.92 33.41 37.41 4.65 1.58 2012-13 14 19.75 34 41.17 4.57 1.75 2013-14 21 19 40 52.50 4.72 2.24 2014-15 28 16 44 63.6 4.22 2.50 9.18 Bull wise daughters born during the period 4/2014 to 3/2015 Bull No. Total No. of
daughters born No. of daughters reaching A.F.C.
No. of daughters completing 1st Lact
Last Lact. * 22 15 1 7 7 44 13 1 7 45 4 4 46 10 8 76 4 3 78 5 1 1 2 79 7 1 3 84 12 3 5 87 7 3 1 89 5 138 16 2 4 143 2 1 147 2 170 7 1 2 182 3 184 8 1 228 5 240 10 244 5

189
9.20 List of breeding/young bulls as on 31.03.2015 Sr. No.
Bull No.
Date of Birth
Dam No.
Sire No.
Dams best lact.305days or less yield (kg)
Semen doses available
Remarks
1 B240 04.01.2008 164 79 1780 1441 2 B244 04.04.2008 94 84 1840 667 3 B331 03.09.2011 88 182 2000 1172 4 B333 12.10.2011 55 170 1866 5 B349 14.11.2012 224 184 815 6 B354 02.02.2013 107 170 1932 7 B358 25.04.2013 265 244 1504 8 B359 18.05.2013 114 228 1625 9 B366 25.09.2013 193 244 2235 10 B370 19.10.2013 296 244 940 11 B375 20.11.2013 262 244 1082 12 B376 23.11.2013 295 240 1641 13 B378 15.01.2014 164 228 1780 14 B383 15.04.2014 242 240 1000 15 B384 01.05.2014 238 228 1254 16 B388 04.08.2014 323 240 17 B392 31.08.2014 204 244 1058 18 B393 18.09.2014 88 244 2000 19 B397 06.11.2014 248 240 20 B398 07.11.2014 270 240 21 B399 15.11.2014 308 240 22 B401 24.11.2014 231 240 1087 23 B405 31.12.2014 320 184 24 B409 25.02.2015 285 240 25 B410 13.03.2015 314 240 9.21 Target achieved during the year 2014-15 Sr. No.
Trait Target Achieved (2014-15)
1. Av. Age at first service (months) 32 months 40.2 2. Av. age at first calving (months) 44 months 54 3. Av. age for initiating training of bulls (months) 24 months -- 4. Av. age at first collection (months) 34 months -- 5. Av. service period (days) 140 days 182 6. Calf mortality (03 months) ≤ 5 % 14.7 7. Wet average (kg) ≥ 3.0 kg 4.22 8. Herd average (kg) ≥ 5.0 kg 2.50
Conservation in the breeding tract a) Germplasm Dissemination: 2800 doses of frozen semen sold to lay inseminators for AI in Agra district. 9 males and 4 females were sold through auction
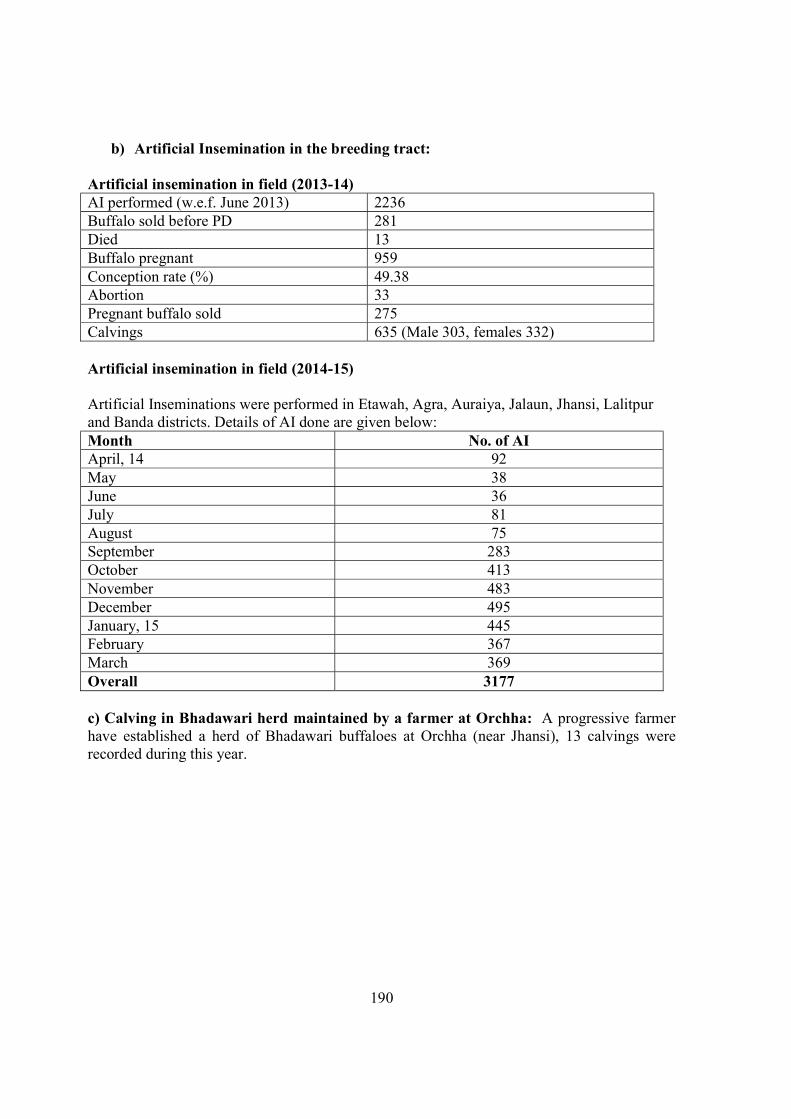
190
b) Artificial Insemination in the breeding tract:
Artificial insemination in field (2013-14) AI performed (w.e.f. June 2013) 2236 Buffalo sold before PD 281 Died 13 Buffalo pregnant 959 Conception rate (%) 49.38 Abortion 33 Pregnant buffalo sold 275 Calvings 635 (Male 303, females 332) Artificial insemination in field (2014-15) Artificial Inseminations were performed in Etawah, Agra, Auraiya, Jalaun, Jhansi, Lalitpur and Banda districts. Details of AI done are given below: Month No. of AI April, 14 92 May 38 June 36 July 81 August 75 September 283 October 413 November 483 December 495 January, 15 445 February 367 March 369 Overall 3177 c) Calving in Bhadawari herd maintained by a farmer at Orchha: A progressive farmer have established a herd of Bhadawari buffaloes at Orchha (near Jhansi), 13 calvings were recorded during this year.

191
Assistant Director General (Animal Nutrition and Physiology) visited the Orchha unit. 10. Research Achievements: Average lactation milk yield, 305 days or less milk yield and wet average were recorded as
1438.8 kg, 1478.3 kg and 4.22 kg, respectively. Average age at first service, age at first calving and average service period and conception rate were 40.2 months, 54 months, 182 days and 50 percent, respectively.
9 male calves and 4 females were sold to farmers through auction. Cryopreservation of semen form selected bulls was done for it use in field and farm herd for artificial insemination. 2800 semen doses were sold to lay inseminators for AI in Agra district. 635 calvings were recorded in the field from the AI done during the year 201314. Conception rate in the field was recorded as 49.38 percent. Artificial insemination in the Bhadawarti breeding tract was continued during the year 2014-15. A total of 3177 artificial inseminations were performed in Etawah, Agra, Jalaun, Jhansi, Auraiya, Lalitpur and Banda districts.
11. Publications: Research papers published in journals : 2 Presentations in conference/symposia/seminars/other form : 3
12. Expected Socioeconomic impact in the tract: Activities of the project is creating awareness among the farmers about the Bhadawari buffaloes and farmers are coming forward to purchase the Bhadawari animals for rearing purpose during auction.
13. Constraints if any : Erratic supply of electricity as well as liquid nitrogen (LN2) availability is one the constraints in semen freezing.
14. Focus of work in the coming year: Semen freezing will be continued. Artificial insemination in the breeding tract will be continued. Efforts will be made to disseminate Bhadawari germplasm through sale of frozen semen/ breeding bulls to various agencies for their use in the field.

192
1. Financial Statement for the year 2014-15 (Rs in Lakhs) Sanctioned as per R E Total ICAR Share
Released ICAR Share as per R E
Expenditure as per AUC Closing balance ICAR Share State Share
29.00 29.00 29.00 25.51234 0.00 3.48766 Herd Performance The Herd strength was 102 head as against 91 in 2013-14, which consists of 53 breeding
buffaloes, 30 calving took place during the period out of which 18 were male and 12 were female. 0-3 months calf mortality was reported as 14.71% (5/34). 44 AI were performed and 22 conceived with a conception rate of 50.00 percent. Semen of two bulls were used for AI purpose at the farm. 7870 doses of semen were produced from three bulls and 7138 doses were used/ supplied for AI purpose in the field. Average lactation yield, lactation length and 305 or less day milk yield were 1638.8 (n=21) kg, 367 (n=21) days and 1478.3 (n=21) kg, respectively during the report period. Average service period was 182.3 days and Age at first calving was 54 months. These two values are higher than the target fixed. 63.6 % animals were in the milk with wet average 4.22 kg and herd average of 2.50 kg. 9 male calves and 2800 frozen semen doses were disseminated to farmers. A total of 2236 AIs in 2013-14 and 3177 AI’s in 14-15 were performed in Etawh, Agra, Jalaun, Jhansi, Auriya, Lalitpur & Banda districts. 635 calving took place in the field. Targets achieved during 2014-15
S. No Trait Target Achieved 1. Av. Age at first service (months) 32 months 40.2 months 2. Av. Age at first calving 44 months 54 months 3. Av. Age for initiating training of bulls
(months) 24 months NA
4. Av. Age at first collection 34 months NA 5. Av. Service period 140 days 182 days 6. Calf mortality (03 months) ≤ 5 % 14.7 % 7. Wet average ≥ 5.0 kg 4.22 kg 8. Herd average ≥ 3.0 kg 2.50 kg
Recommendations: Surplus bulls/male calves may be disposed off/auction. The young bulls whose dam’s 305 day or less day best lactation yield less than 1600 kg not to be use as breeding bull. Field AI program to be continued.
Project Co-ordinator’s observations on centre performance

193
NETWORK PROJECT ON BUFFALO IMPROVEMENT (FIELD UNITS)
Participating Units : 1. CIRB, Hisar 2. GADVASU, Ludhiana 3. NDRI, Karnal Date of start : 2001 INTRODUCTION: Murrah is most important breed among milch buffaloes which draws maximum
demand of its germplasm in the country. But the problem of non-availability of genetically superior and progeny tested bulls is acute to meet ever increasing demand for improvement of the country buffaloes. It is, therefore, essential to develop superior germplasm and test them efficiently on large organized herds as well as the ones available with the farmers. Progeny testing under institutional and field conditions besides providing superior bulls for use in developmental programme, helps in developing elite breeding herds. Buffalo herds available with various research institutions and those managed by the state/central government developmental agencies are too small in size to independently implement a worthwhile progeny testing programme for even a moderately accurate evaluation of bulls. It is more desirable to evaluate the bulls on the basis of their progeny performance raised in different environments at various associated organized as well as at the farmers herds.
OBJECTIVES: To strengthen the on going sire evaluation programme of associated herd progeny testing
by including field performance recording of the daughters of test bulls.
FIELD UNIT: CIRB HISAR The use of semen of test bulls under Network Project on Buffalo Improvement on
approximately 4100 buffaloes in ten adopted villages of CIRB Hisar is to be undertaken. This has to be followed by pregnancy diagnosis, calving of buffaloes and follow up of progenies till the completion of first lactation milk records on the basis of monthly test day records. Data on different aspects shall be recorded as per specified format. A total of 4129 artificial inseminations were done in ten adopted villages with the semen of 6 test bulls of 14th set and 15 bulls of 15th set during April 2014 to March 2015. The use of 15th set was initiated from July 2014. The conception rate in the field was worked out to be 52.75%. In this period 1993 pregnancies were confirmed and 1093 calving (565 males, 528 females) were recorded. Ninety three progenies, 1 of 10th, 39 of 11th, 52 of 12th and 1 of 13th set were also calved and the monthly test day milk recordings are in progress. The average age at first calving for these 93 daughters calved was 42.20 months. During the year, the monthly test day milk yield was recorded for 138 daughters, out of which 52 daughters completed the lactation, 20 daughters sold before the lactation was completed and recording of 66 daughters
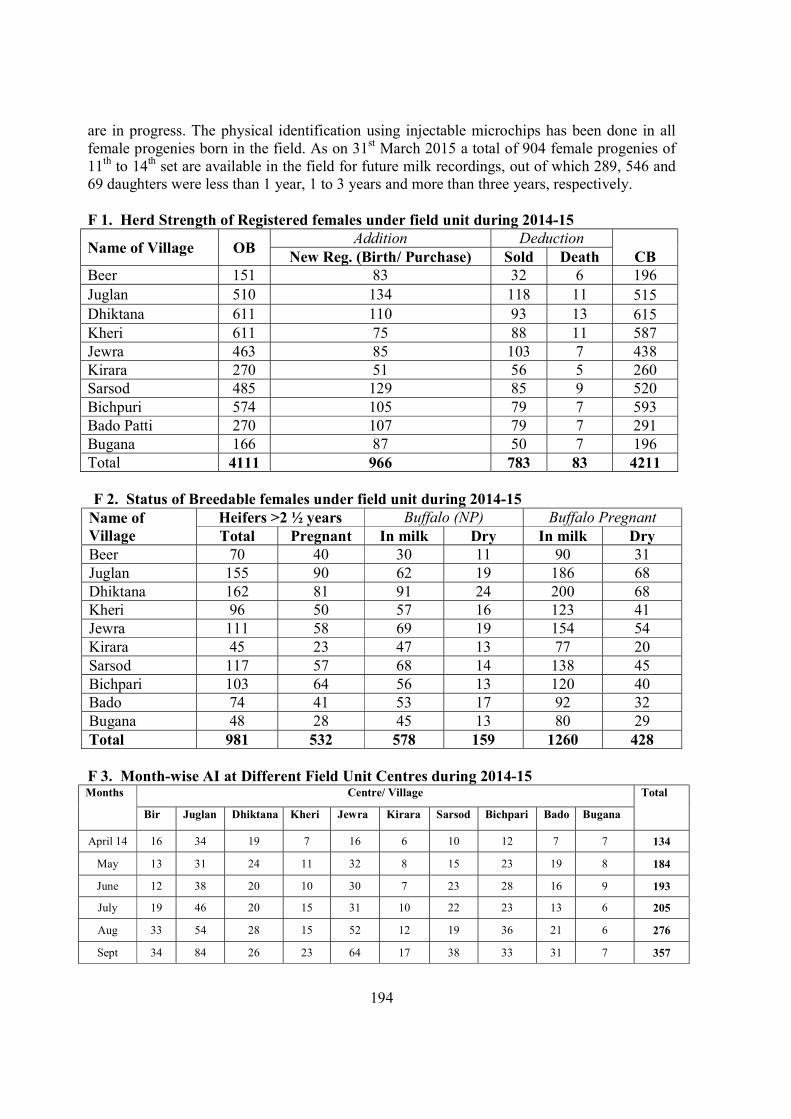
194
are in progress. The physical identification using injectable microchips has been done in all female progenies born in the field. As on 31st March 2015 a total of 904 female progenies of 11th to 14th set are available in the field for future milk recordings, out of which 289, 546 and 69 daughters were less than 1 year, 1 to 3 years and more than three years, respectively. F 1. Herd Strength of Registered females under field unit during 2014-15 Name of Village OB Addition Deduction
CB New Reg. (Birth/ Purchase) Sold Death Beer 151 83 32 6 196 Juglan 510 134 118 11 515 Dhiktana 611 110 93 13 615 Kheri 611 75 88 11 587 Jewra 463 85 103 7 438 Kirara 270 51 56 5 260 Sarsod 485 129 85 9 520 Bichpuri 574 105 79 7 593 Bado Patti 270 107 79 7 291 Bugana 166 87 50 7 196 Total 4111 966 783 83 4211 F 2. Status of Breedable females under field unit during 2014-15
Name of Village
Heifers >2 ½ years Buffalo (NP) Buffalo Pregnant Total Pregnant In milk Dry In milk Dry
Beer 70 40 30 11 90 31 Juglan 155 90 62 19 186 68 Dhiktana 162 81 91 24 200 68 Kheri 96 50 57 16 123 41 Jewra 111 58 69 19 154 54 Kirara 45 23 47 13 77 20 Sarsod 117 57 68 14 138 45 Bichpari 103 64 56 13 120 40 Bado 74 41 53 17 92 32 Bugana 48 28 45 13 80 29 Total 981 532 578 159 1260 428 F 3. Month-wise AI at Different Field Unit Centres during 2014-15 Months Centre/ Village Total
Bir Juglan Dhiktana Kheri Jewra Kirara Sarsod Bichpari Bado Bugana April 14 16 34 19 7 16 6 10 12 7 7 134
May 13 31 24 11 32 8 15 23 19 8 184 June 12 38 20 10 30 7 23 28 16 9 193 July 19 46 20 15 31 10 22 23 13 6 205 Aug 33 54 28 15 52 12 19 36 21 6 276 Sept 34 84 26 23 64 17 38 33 31 7 357

195
Oct 58 104 50 40 60 12 43 61 69 10 507 Nov 52 98 55 31 82 21 43 61 43 18 504 Dec 33 90 46 32 55 17 59 63 32 28 455
Jan 15 42 93 46 36 52 23 50 50 40 32 464 Feb 41 91 37 25 72 22 70 67 43 27 495
March 30 60 36 27 38 16 45 48 32 23 355 Total 383 823 407 272 584 171 437 505 366 181 4129
F4. Bull-wise AI at Different Field Unit Centres during the Period 2014-15
Months Bull No.
Total 2357 XIV
4093 XIV
4100 XIV
4196 XIV
4439 XIV
6136 XIV
2371 XV
2412 XV
2417 XV
2429 XV
2459 XV
4324 XV
4328 XV
4354 XV
4363 XV
4403 XV
4438 XV
6007 XV
6139 XV
6290 XV
6405 XV
April 14 15 37 1 77 - 4 - - - - - - - - - - - - - - - 134 May 85 - - 99 - - - - - - - - - - - - - - - - - 184 June 91 22 - 55 25 - - - - - - - - - - - - - - - - 193 July - 5 - 15 17 - 53 52 14 - - 15 - 34 - - - - - - - 205 Aug - - - - - - 26 38 2 45 - - - 25 - - - 71 69 - - 276 Sept 1 - - - - - 37 - - 73 - 26 - 71 - - - 6 143 - - 357 Oct - - - - - - - 40 80 32 36 118 38 1 62 - 54 - 34 - 12 507 Nov - - - - - - 8 75 32 1 - 67 66 89 11 - 3 110 - - 42 504 Dec - - - - - - 86 46 - - - 7 23 59 110 - - 115 - 9 - 455 Jan 15 - - - - - - 124 - 53 - - 104 - 2 - - - 117 64 - - 464 Feb - - - - - - 21 - 53 - 121 10 - 1 17 82 - 10 63 115 2 495 March - - - - - - - - 3 83 39 - - - - 42 95 - - 19 74 355 Total 192 64 1 246 42 4 355 251 237 234 196 347 127 282 200 124 152 429 373 143 130 4129
F 5. Month-wise Conception at Different Field Unit Centres during 2014-15
Months Centre/ Village Total Bir Juglan Dhiktana Kheri Jewra Kirara Sarsod Bichpari Baado Bugana
April 14 26 40 39 19 14 11 19 21 16 5 210 May 10 29 14 6 13 6 16 17 9 6 126 June 8 24 11 11 6 5 9 9 9 3 95 July 9 19 8 4 7 3 5 6 4 3 68 Aug 8 18 10 5 16 5 7 10 9 4 92 Sept 8 19 10 7 17 4 11 15 9 3 103 Oct 12 27 8 8 18 7 13 13 8 2 116 Nov 19 31 14 7 30 8 12 19 12 2 154 Dec 23 40 12 14 39 11 23 19 13 3 197
Jan 15 39 57 26 19 33 8 27 36 35 4 284 Feb 33 64 24 16 49 12 25 35 21 7 286
March 20 55 21 17 35 9 35 37 20 13 262 Total 215 423 197 133 277 89 202 237 165 55 1993
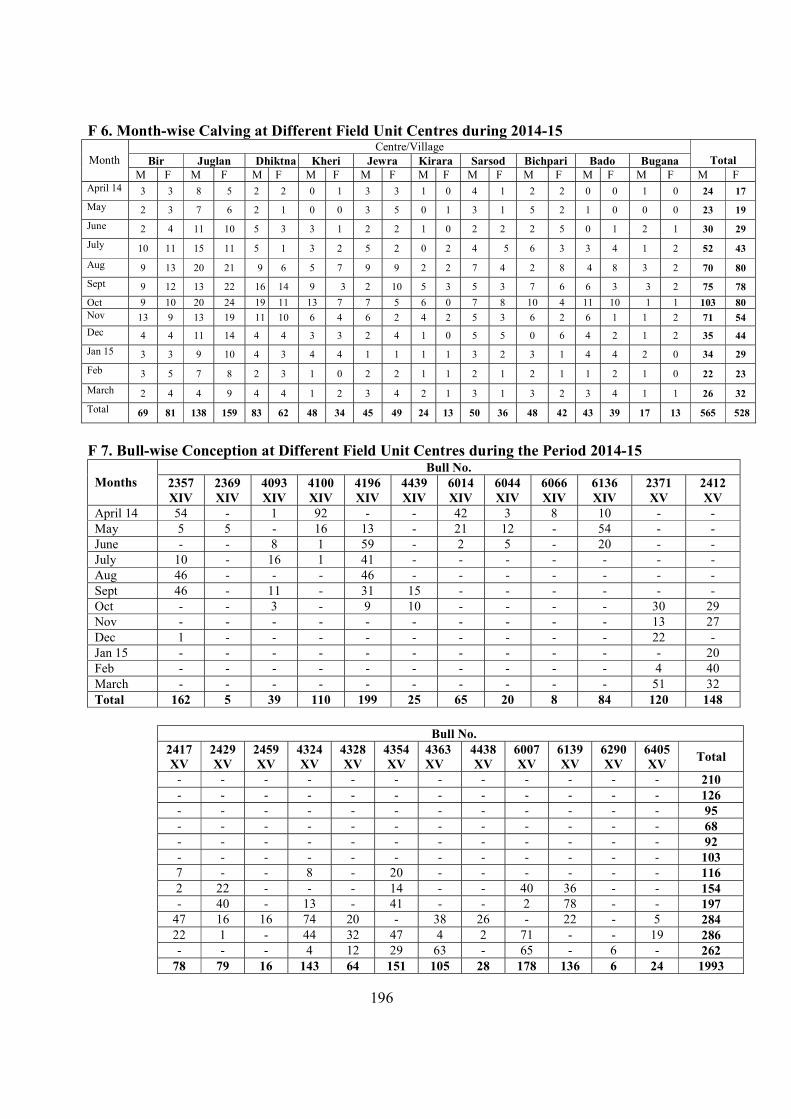
196
F 6. Month-wise Calving at Different Field Unit Centres during 2014-15 Month
Centre/Village Total Bir Juglan Dhiktna Kheri Jewra Kirara Sarsod Bichpari Bado Bugana
M F M F M F M F M F M F M F M F M F M F M F April 14 3 3 8 5 2 2 0 1 3 3 1 0 4 1 2 2 0 0 1 0 24 17 May 2 3 7 6 2 1 0 0 3 5 0 1 3 1 5 2 1 0 0 0 23 19 June 2 4 11 10 5 3 3 1 2 2 1 0 2 2 2 5 0 1 2 1 30 29 July 10 11 15 11 5 1 3 2 5 2 0 2 4 5 6 3 3 4 1 2 52 43 Aug 9 13 20 21 9 6 5 7 9 9 2 2 7 4 2 8 4 8 3 2 70 80 Sept 9 12 13 22 16 14 9 3 2 10 5 3 5 3 7 6 6 3 3 2 75 78 Oct 9 10 20 24 19 11 13 7 7 5 6 0 7 8 10 4 11 10 1 1 103 80 Nov 13 9 13 19 11 10 6 4 6 2 4 2 5 3 6 2 6 1 1 2 71 54 Dec 4 4 11 14 4 4 3 3 2 4 1 0 5 5 0 6 4 2 1 2 35 44 Jan 15 3 3 9 10 4 3 4 4 1 1 1 1 3 2 3 1 4 4 2 0 34 29 Feb 3 5 7 8 2 3 1 0 2 2 1 1 2 1 2 1 1 2 1 0 22 23 March 2 4 4 9 4 4 1 2 3 4 2 1 3 1 3 2 3 4 1 1 26 32 Total 69 81 138 159 83 62 48 34 45 49 24 13 50 36 48 42 43 39 17 13 565 528 F 7. Bull-wise Conception at Different Field Unit Centres during the Period 2014-15
Months
Bull No. 2357 XIV
2369 XIV
4093 XIV
4100 XIV
4196 XIV
4439 XIV
6014 XIV
6044 XIV
6066 XIV
6136 XIV
2371 XV
2412 XV
April 14 54 - 1 92 - - 42 3 8 10 - - May 5 5 - 16 13 - 21 12 - 54 - - June - - 8 1 59 - 2 5 - 20 - - July 10 - 16 1 41 - - - - - - - Aug 46 - - - 46 - - - - - - - Sept 46 - 11 - 31 15 - - - - - - Oct - - 3 - 9 10 - - - - 30 29 Nov - - - - - - - - - - 13 27 Dec 1 - - - - - - - - - 22 - Jan 15 - - - - - - - - - - - 20 Feb - - - - - - - - - - 4 40 March - - - - - - - - - - 51 32 Total 162 5 39 110 199 25 65 20 8 84 120 148
Bull No.
2417 XV
2429 XV
2459 XV
4324 XV
4328 XV
4354 XV
4363 XV
4438 XV
6007 XV
6139 XV
6290 XV
6405 XV Total
- - - - - - - - - - - - 210 - - - - - - - - - - - - 126 - - - - - - - - - - - - 95 - - - - - - - - - - - - 68 - - - - - - - - - - - - 92 - - - - - - - - - - - - 103 7 - - 8 - 20 - - - - - - 116 2 22 - - - 14 - - 40 36 - - 154 - 40 - 13 - 41 - - 2 78 - - 197
47 16 16 74 20 - 38 26 - 22 - 5 284 22 1 - 44 32 47 4 2 71 - - 19 286 - - - 4 12 29 63 - 65 - 6 - 262
78 79 16 143 64 151 105 28 178 136 6 24 1993

197
F 8. Bull-wise Calving at Different Field Unit Centres during the Period 2014-15 Bull No
Month 2357 XIV
2369 XIV
4093 XIV
4100 XIV
4196 XIV
4439 XIV
6014 XIV
6044 XIV
6066 XIV
6136 XIV Total
M F M F M F M F M F M F M F M F M F M F M F April 14 - - - - - - - - - - - - 14 11 2 4 - - 8 2 24 17 May - - - - - - - - - - - - 8 11 11 6 - - 4 2 23 19 June - - - - - - - - - - - - 13 6 4 3 - - 13 20 30 29 July - - 14 11 - - - - - - 15 13 5 3 14 8 - - 4 8 52 43 Aug - - 25 29 9 7 - - - - 12 13 - - 12 18 - - 12 13 70 80 Sept - - 3 1 40 40 4 4 - - 7 4 - - 21 29 - - - - 75 78 Oct 30 30 - - 7 5 56 38 - - - - 3 3 4 1 3 3 - - 103 80 Nov 20 16 - - 0 1 29 24 - - - - 16 6 0 1 2 1 4 5 71 54 Dec 1 2 1 2 - - 6 7 8 4 - - 5 9 1 1 - - 13 19 35 44 Jan 15 - - - - 4 1 1 0 23 22 - - - - 2 1 - - 4 5 34 29 Feb 2 4 - - 7 3 - - 13 16 - - - - - - - - - - 22 23 March 11 15 - - - - - - 15 17 - - - - - - - - - - 26 32 Total 64 67 43 43 67 57 96 73 59 59 34 30 64 49 71 72 5 4 62 74 565 528
F 9. Bull-wise Live Female Progeny at Different Field Unit Centers (0 – 6 month) as on 3/2015
Bull No. Centres/Set No.
2357 XIV
2369 XIV
4093 XIV
4100 XIV
4196 XIV
6014 XIV
6044 XIV
6066 XIV
6136 XIV Total
Bir 9 - - 5 3 1 - 2 20 Juglan 16 - - 4 16 1 1 - 3 41 Dhiktana 1 - 2 11 2 2 3 - 3 24 Kheri 3 - 1 3 1 - - 3 11 Jewra 1 - 3 3 1 1 - - - 9 Kirara - - - 1 1 - - - - 2 Sarsod - - 1 5 - 2 1 1 - 10 Bichpari - - - 1 - 2 1 - 1 5 Bado Patti 3 - - - 3 - - - - 6 Bugana 1 1 1 1 - - - - - 4 Total 34 1 8 34 27 8 7 1 12 132
F 10. Bull-wise Live Female Progeny at Different Field Unit Centers (6 – 12 month) as on 3/2015 Bull No. Centres
2369 XIV
4093 XIV
4100 XIV
4439 XIV
6014 XIV
6044 XIV
6136 XIV Total
Bir 2 3 - 4 3 7 3 22 Juglan 6 13 1 2 9 13 3 47 Dhiktana 1 4 - 2 2 4 4 17 Kheri 2 - - 2 - - 2 6 Jewra 5 3 - - 2 6 6 22 Kirara 1 2 - - - - 1 4 Sarsod 1 2 - 2 1 3 2 11 Bichpari 2 1 - 1 1 3 5 13 Bado Patti 5 2 - - - 1 2 10 Bugana 1 1 - 1 1 - 1 5 Total 26 31 1 14 19 37 29 157

198
F 11. Bullwise Live Female Progeny at Different Field Unit Centers (1 – 3 years) as on 3/2015
Bull No. Centres
183 XII
220 XII
2176 X11
2177XII
2185 XII
3598 XII
5604 XII
5710 XII
5720XII
R11 XII
838 XIII
851 XIII
Bir - - 2 1 - 1 - - - - 4 1 Juglan 3 - 1 1 - 2 - 1 1 1 6 11 Dhiktana 4 - 4 - - - 1 - - - 6 10 Kheri 1 - - - - - - - - - 5 3 Jewra - - 2 1 - - 1 - 1 2 11 5 Kirara - - - - - - - - - 1 2 3 Sarsod 1 - 3 - 2 - - - 1 2 5 2 Bichpari - 1 2 1 - - - - 2 2 4 6 Bado Patti - - - - - - - - - - 9 2 Bugana 3 - - - - - - - - - 5 6 Total 12 1 14 4 2 3 2 1 5 8 57 49
Cont…11 858 XIII
2234 XIII
2269 XIII
2304 XIII
3964 XIII
4059 XIII
5943 XIII
2369 XIV
4093 XIV
4439 XIV
6014 XIV Total
5 1 7 4 10 2 10 1 1 - 1 51 10 2 9 13 18 2 9 7 1 2 1 101 5 5 3 12 5 9 8 1 - - - 73 3 8 - 7 5 9 8 - - 2 - 51 4 5 2 4 8 4 - 2 - 2 - 54 1 3 3 4 1 3 - 1 - 1 - 23 5 2 3 4 8 4 9 - - 1 - 52 4 4 6 6 5 7 4 - - - - 54 1 2 3 9 1 4 5 - - 1 - 37 2 2 4 9 3 7 9 - - - - 50
40 34 40 72 64 51 62 12 2 9 2 546 F 12. Bull-wise Live Female Progeny at Field Unit Centers (> 3 years) as on 3/2015
Bull No.
12 XI
2148 XI
2154 XI
3267 XI
5496 XI
183 XII
220 XII
2176 X11
2177XII
2185 XII
Bir - - - - - - 4 - 5 2 Juglan - - - - - - - - 1 - Dhiktana - - - - - 1 1 1 2 - Kheri 1 - - - - - - - 1 1 Jewra - 1 1 1 - 1 - - - - Kirara - - - - - - - - - - Sarsod - - - 1 - 1 - - - - Bichpari 1 - - - 1 - - - - - Bado - - - - - 3 - 1 - 1 Total 2 1 1 2 1 6 5 2 9 4
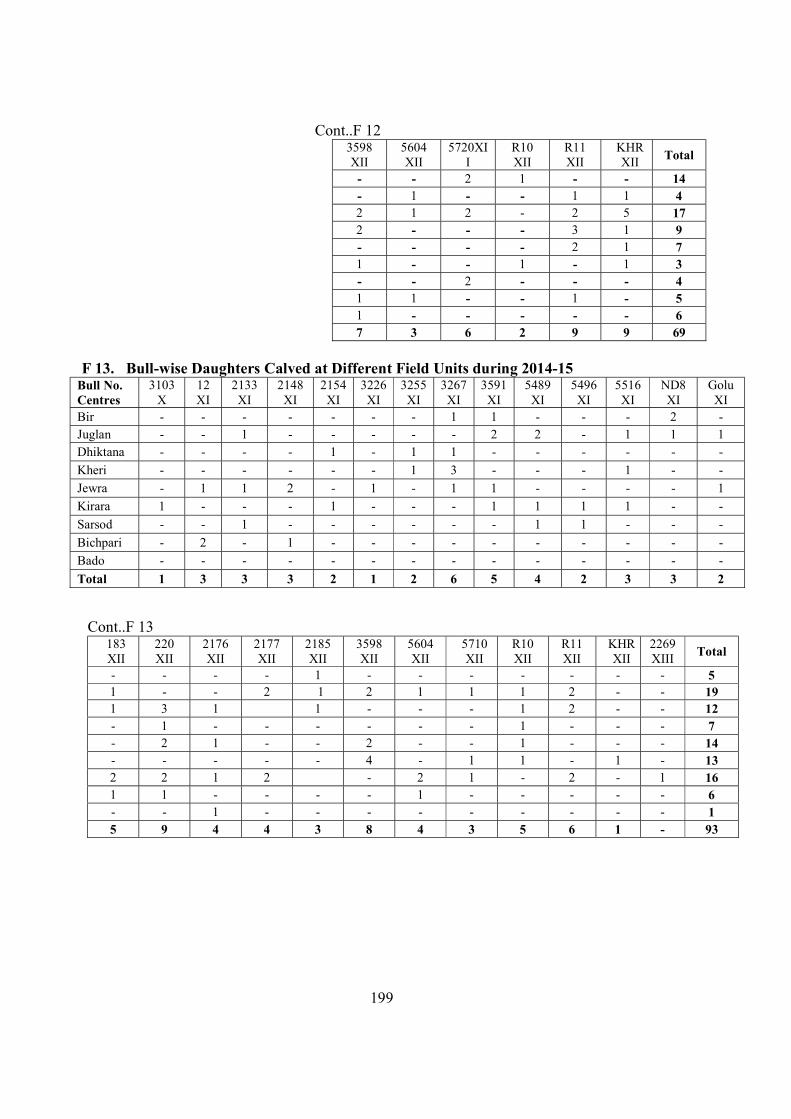
199
Cont..F 12 3598 XII
5604 XII
5720XII
R10 XII
R11 XII
KHR XII Total
- - 2 1 - - 14 - 1 - - 1 1 4 2 1 2 - 2 5 17 2 - - - 3 1 9 - - - - 2 1 7 1 - - 1 - 1 3 - - 2 - - - 4 1 1 - - 1 - 5 1 - - - - - 6 7 3 6 2 9 9 69
F 13. Bull-wise Daughters Calved at Different Field Units during 2014-15
Bull No. Centres
3103 X
12 XI
2133 XI
2148 XI
2154 XI
3226 XI
3255 XI
3267 XI
3591 XI
5489 XI
5496 XI
5516 XI
ND8 XI
Golu XI
Bir - - - - - - - 1 1 - - - 2 - Juglan - - 1 - - - - - 2 2 - 1 1 1 Dhiktana - - - - 1 - 1 1 - - - - - - Kheri - - - - - - 1 3 - - - 1 - - Jewra - 1 1 2 - 1 - 1 1 - - - - 1 Kirara 1 - - - 1 - - - 1 1 1 1 - - Sarsod - - 1 - - - - - - 1 1 - - - Bichpari - 2 - 1 - - - - - - - - - - Bado - - - - - - - - - - - - - - Total 1 3 3 3 2 1 2 6 5 4 2 3 3 2
Cont..F 13
183 XII
220 XII
2176 XII
2177 XII
2185 XII
3598 XII
5604 XII
5710 XII
R10 XII
R11 XII
KHR XII
2269 XIII Total
- - - - 1 - - - - - - - 5 1 - - 2 1 2 1 1 1 2 - - 19 1 3 1 1 - - - 1 2 - - 12 - 1 - - - - - - 1 - - - 7 - 2 1 - - 2 - - 1 - - - 14 - - - - - 4 - 1 1 - 1 - 13 2 2 1 2 - 2 1 - 2 - 1 16 1 1 - - - - 1 - - - - - 6 - - 1 - - - - - - - - - 1 5 9 4 4 3 8 4 3 5 6 1 - 93

200
F 14. Bull-wise Daughters Recorded at Different Field Units Centres during the Period 2013-14
Name of village
Bull No. Dgtr No.
Date of Birth
Date of Calving
Monthly Milk Records I II III IV V VI VII VIII IX X
M E M E M E M E M E M E M E M E M E M E Bir
5489 XI 146 18/08/10 03/08/13 3.5 3.2 4.3 4.2 4.3 4.2 4.4 4.3 3.4 3.8 4.3 4.2 3.3 3.2 2.7 2.5 2.8 2.6 4.5 0.0 3591 XI 137 26/04/10 07/08/13 3.6 3.5 4.1 3.9 4.2 4.0 4.6 4.4 3.8 3.6 4.4 4.2 3.4 3.3 3.0 2.8 2.9 2.7 2.3 2.1 2083 X 82 31/07/08 16/08/13 3.9 3.2 4.9 4.6 4.2 4.1 4.3 4.2 3.9 3.7 4.2 4.0 3.4 3.2 3.1 2.9 3.0 2.8 2.4 2.3 3631 X 108 10/05/09 01/09/13 3.7 3.6 3.8 3.7 3.8 3.7 3.3 3.2 3.6 3.5 3.2 3.0 2.8 2.7 3.1 2.9 2.5 2.3 3.2 0.0 3591 XI 155 30/09/10 08/09/13 3.9 3.7 4.2 3.9 4.4 4.3 3.8 3.7 4.3 4.2 3.2 3.1 3.0 2.9 3.3 3.2 2.4 2.3 3.5 0.0 2045 X 117 10/07/09 26/10/13 3.8 3.7 4.0 3.8 4.6 4.5 3.3 3.2 3.2 3.1 3.5 3.4 2.3 2.1 2.5 2.3 3.0 0.0 3.4 0.0 2185 XII 180 10/07/11 05/08/14 4.5 4.4 4.4 4.3 4.3 4.2 4.8 4.7 3.8 3.6 4.0 3.9 4.3 4.2 4.3 4.2 3267 XI 161 29/10/10 02/09/14 3.6 3.5 3.7 3.6 4.3 4.2 4.5 4.4 4.9 4.8 5.2 5.0 4.6 4.5 ND8 XI 163 31/10/10 29/09/14 3.3 3.2 4.7 4.6 5.2 5.1 5.3 5.2 4.5 4.4 3.5 3.4 3591 XI 159 25/10/10 21/10/14 2.8 2.7 4.2 4.1 4.3 4.2 4.3 4.1 3.8 3.6 ND8 XI 162 29/10/10 10/12/14 3.8 3.6 4.0 3.8 4.2 4.0 4.2 4.0
Juglan 5489 XI 362 25/08/09 10/09/13 3.8 3.7 4.4 4.3 4.5 4.3 3.9 3.8 4.8 4.6 3.3 3.2 3.3 3.2 3.1 3.0 Sold x x x 5414 XI 402 12/05/10 04/11/13 3.8 3.6 3.8 3.7 4.3 4.2 3.8 3.7 3.5 3.4 3.2 3.1 2.6 2.5 2.9 2.8 2.4 2.3 3.5 0.0 5489 XI 432 18/08/10 27/02/14 4.4 4.3 4.0 3.8 4.8 4.6 4.8 4.7 4.3 4.2 4.8 4.6 3.4 3.3 3.7 3.6 3.0 2.8 3.8 3.7 2177 XII 503 27/04/11 28/01/14 5.4 5.1 5.9 5.5 5.9 5.6 5.1 4.7 4.1 4.0 3.4 3.3 2.4 2.3 3.2 3.1 3.2 3.3 4.0 0.0 5489 XI 420 29/07/10 18/06/14 4.3 4.2 4.7 4.6 Sold x x x x x x x x x x x x x x x 3591 XI 449 19/09/10 05/07/14 4.3 4.2 4.3 4.2 4.5 4.4 3.9 3.8 3.8 3.7 4.2 4.1 3.7 3.6 3.4 3.2 3.0 3.0 3598 XII 508 20/06/11 05/07/14 4.4 4.3 4.2 4.1 4.3 4.2 4.0 3.9 4.0 3.8 4.6 4.5 4.2 4.0 4.0 3.8 3.8 3.7 R10 XII 516 25/07/11 19/07/14 3.3 3.2 3.7 3.6 4.2 4.1 4.3 4.2 4.2 4.1 4.6 4.6 4.3 4.1 4.2 4.0 4.0 3.9 5516 XI 424 08/08/10 22/07/14 3.6 3.5 Sold x x x x x x x x x x x x x x x x x 3591 XI 446 14/09/10 24/07/14 4.3 4.2 3.8 3.7 4.2 4.1 3.8 3.7 4.0 3.8 4.0 3.5 3.8 3.6 3.5 3.4 2177 XII 510 27/06/11 01/08/14 3.2 3.1 3.3 3.1 3.2 3.1 3.8 3.6 4.2 4.1 4.0 3.9 3.6 3.4 3.8 3.7 5489 XI 431 18/08/10 18/08/14 Sold x x x x x x x x x x x x x x x x x x x Golu XI 482 05/12/10 15/08/14 Sold x x x x x x x x x x x x x x x x x x x 5710 XII 526 26/09/11 23/08/14 3.2 3.1 3.4 3.3 3.6 3.5 Sold x x x x x x x x x x x x x R11 XII 501 26/04/11 02/09/14 Sold x x x x x x x x x x x x x x x x x x x 3598 XII 520 08/09/11 15/09/14 2.8 2.7 3.3 3.2 3.4 3.3 4.6 4.5 4.8 4.7 4.5 4.4 4.3 4.2 183 XII 543 12/11/11 22/09/14 3.2 3.1 3.6 3.5 4.8 4.7 5.0 4.8 5.2 5.0 5.1 5.0 R11 XII 537 29/10/11 18/10/14 Sold x x x x x x x x x x x x x x x x x x x ND8 XI 462 22/10/10 25/10/14 4.5 4.4 6.3 6.2 6.4 6.3 6.2 6.0 6.1 6.0 2185 XII 519 28/08/11 22/10/14 3.5 3.4 4.5 4.3 4.8 4.7 5.2 4.9 5.5 5.4 5604 XII 547 14/11/11 03/11/14 3.7 3.6 3.8 3.7 4.0 3.8 4.4 4.2 4.8 4.6 2177 XII 555 24/12/11 15/12/14 Sold x x x x x x x x x x x x x x x x x x x 2133 XI 440 28/08/10 14/01/15 4.1 4.0 Sold x x x x x x x x x x x x x x x x x

201
Dhiktana 2133 XI 309 30/09/10 01/08/13 3.5 3.2 4.1 3.9 4.2 4.0 3.0 3.2 3.7 3.5 3.8 3.5 3.5 3.0 2.2 2.0 3.1 3.0 1.9 1.8 2148 XI 302 06/09/10 04/08/13 4.5 4.0 4.8 4.6 4.8 4.6 5.0 5.3 4.4 4.2 4.7 4.5 4.7 4.5 4.8 4.6 2.8 2.5 2.5 2.4 2148 XI 248 10/10/09 07/08/13 3.5 3.1 4.5 4.3 5.0 4.8 5.0 5.2 4.3 4.1 3.9 3.6 3.5 3.2 3.9 3.7 3.0 2.9 3.1 2.9 3591 XI 326 20/11/10 10/08/13 3.5 3.2 5.2 5.0 5.2 5.0 4.6 4.5 5.6 5.5 3.6 3.4 4.3 4.1 4.2 4.0 4.5 0.0 2.0 2.0 2154 XI 283 29/04/10 12/08/13 3.4 3.2 5.3 5.2 5.7 5.4 5.6 5.4 4.8 4.6 5.0 4.8 3.8 3.6 4.3 4.0 4.5 4.5 2.5 2.5 2148 XI 250a 15/10/09 02/09/13 5.2 4.8 5.2 5.0 4.0 4.2 4.5 4.3 4.6 4.4 3.7 3.5 3.7 3.5 3.2 3.0 Dry x x x 2133 XI 308 26/09/10 15/10/13 3.7 3.5 4.8 4.6 4.2 4.0 4.6 4.4 3.2 3.0 5.2 5.1 2.8 2.5 2.6 2.5 2.3 2.2 1.9 1.6 3267 XI 329 25/11/10 06/10/13 3.9 3.6 4.6 4.5 4.6 4.4 3.8 3.6 5.2 5.0 4.4 4.2 3.2 3.0 3.2 3.1 3.1 3.0 2.8 2.7 3255 XI 260 01/11/09 02/11/13 3.0 3.2 3.8 3.6 4.2 3.9 2.9 2.7 3.5 3.2 3.0 2.9 2.5 2.5 1.4 1.1 1.4 1.1 Dry x 12 XI 304 08/09/10 3/11/13 4.6 4.5 3.8 3.6 3.1 3.0 3.5 3.2 4.2 4.0 3.5 3.0 1.5 1.5 Dry x x x x x Golu XI 325 09/11/10 01/11/13 5.6 5.4 5.9 5.6 5.2 5.0 6.2 6.0 5.8 5.6 3.5 3.5 3.6 3.4 3.7 3.3 3.5 3.3 3.2 3.0 R10 XII 366 20/07/11 20/05/14 5.1 4.9 4.8 4.7 5.0 4.9 3.9 3.6 2.6 2.4 3.3 3.2 3.0 3.0 2.9 2.7 2.1 2.0 1.5 1.2 183 XII 353 10/04/11 29/05/14 5.2 4.8 4.9 4.7 5.2 4.8 3.6 3.5 2.8 2.5 4.4 4.2 4.1 3.9 3.9 3.7 3.2 3.0 2.6 2.4 3267 XI 330 30/11/10 17/06/14 3.6 3.4 3.2 3.1 3.3 3.2 2.5 0.0 Dry x x x x x x x x x x x 220 XII 367 05/08/11 18/09/14 4.9 4.8 4.6 4.4 4.1 4.0 4.0 3.8 4.0 3.7 3.6 3.4 3.2 3.1 220 XII 374 18/08/11 22/09/14 4.7 4.5 3.9 3.8 3.6 3.4 3.6 3.4 3.4 3.3 2.8 2.5 2185 XII 384 15/09/11 02/10/14 5.1 4.9 4.1 3.9 3.9 3.7 3.8 3.6 3.5 3.4 3.2 3.1 2154 XI 319 15/10/10 24/10/14 3.7 3.5 3.9 3.8 3.8 3.7 3.6 3.4 3.4 3.2 220 XII 403 16/11/11 29/10/14 3.5 3.5 3.5 3.4 3.5 3.4 3.5 3.5 3.2 3.0 R11 XII 361 03/07/11 25/10/14 5.0 5.4 5.1 5.0 4.4 4.2 4.1 3.9 3.2 3.0 3255 XI 336 18/12/10 03/12/14 4.4 4.1 4.7 4.5 4.5 4.4 4.2 4.0 2176 XII 358 28/05/11 25/12/14 4.9 4.6 4.5 4.2 4.1 3.9 R11 XII 363 30/06/11 14/01/15 5.2 4.9 4.8 4.5 4.5 4.0
Kheri 3226 XI 240 26/09/09 12/09/13 4.3 4.0 5.0 4.5 5.8 5.5 4.7 4.3 4.7 4.3 4.7 4.2 4.7 4.2 4.0 3.7 3.0 3.0 2.5 2.0 3226 XI 242 26/09/09 12/09/13 2.5 2.1 4.2 3.7 4.8 4.2 3.7 3.3 3.7 3.3 3.7 3.0 3.6 3.0 3.0 3.0 2.8 2.7 3.0 2.5 5496 XI 275 05/02/10 03/11/13 4.2 4.0 4.7 4.5 3.9 3.3 3.7 3.4 3.5 3.1 3.2 3.0 3.0 2.7 2.5 2.5 2.0 2.0 2.0 2.0 2154 XI 343 13/10/10 06/12/13 4.5 4.5 5.2 5.0 5.1 5.0 5.0 4.8 4.1 4.3 3.7 3.5 3.5 3.0 3.0 2.5 2.0 2.0 2.0 2.5 12 XI 336 10/09/10 29/03/14 5.0 5.0 4.5 4.0 4.5 5.0 4.0 4.5 4.5 3.5 3.5 3.5 3.5 4.0 3.0 3.0 2.0 2.0 2.5 2.0 3267 XI 345 14/10/10 21/05/14 3.0 3.0 5.0 4.0 4.5 3.5 3.0 3.5 4.0 3.5 3.5 3.2 3.0 2.8 2.5 2.0 2.0 0.0 1.0 1.0 R10 XII 374 28/04/11 12/07/14 5.0 4.0 4.5 5.5 5.0 4.5 4.5 5.0 4.0 4.2 4.5 4.0 3.5 3.0 2.5 2.7 3.2 2.0 3267 XI 356 08/12/10 17/07/14 4.0 4.0 5.0 5.5 5.0 4.5 5.5 5.0 4.5 4.5 4.5 4.0 4.0 4.0 1.5 1.0 2.2 1.0 220 XII 385 10/07/11 13/07/14 3.0 3.5 4.5 4.5 5.0 5.5 5.5 5.0 5.0 4.5 4.5 5.0 4.0 3.5 3.5 3.0 4.0 3.5 3255 XI 312 08/07/10 03/08/14 4.0 4.5 4.5 4.5 4.0 4.5 4.0 3.5 4.0 3.8 4.0 4.0 3.5 2.7 2.5 3.0 5516 XI 322 31/07/10 15/11/14 4.0 3.9 4.7 4.1 5.3 5.0 5.6 5.4 5.9 5.2 3267 XI 359 20/12/10 27/11/14 4.5 4.5 5.0 4.6 5.3 5.1 5.3 4.7
Jewra 2045 X 271a 13/07/09 30/06/13 4.2 3.9 4.9 3.6 4.7 4.3 5.1 4.8 4.6 4.3 4.1 3.8 3.7 3.4 3.2 2.9 2.7 2.4 Dry x 5489 XI 293 06/09/09 14/08/13 3.3 3.0 3.6 3.3 3.5 3.2 3.4 3.1 2.8 2.5 2.8 2.5 2.6 2.3 2.5 2.2 4.0 0.0 3.7 0.0 2133 XI 408 06/04/10 12/08/13 3.5 3.2 3.4 3.1 4.9 4.6 4.1 3.8 4.1 3.8 4.1 3.8 4.0 3.5 3.7 3.3 4.0 0.0 3.3 0.0

202
5496 XI 431 27/06/10 22/08/13 4.2 3.9 4.2 3.8 3.9 3.5 3.3 3.0 2.9 2.5 3.2 2.8 3.0 2.7 2.8 2.5 Dry x x x 5516 XI 318 17/10/09 18/09/13 2.3 2.0 4.3 4.0 4.1 3.8 4.0 3.6 4.2 3.8 4.0 3.7 3.8 3.5 Sol
d x x x x x 3267 XI 531 24/12/10 09/11/13 4.1 3.8 4.8 4.5 4.3 3.9 4.1 3.7 3.9 3.5 4.6 4.4 4.5 4.1 3.6 3.5 3.1 2.6 2.0 1.5 2148 XI 491 25/09/10 22/09/13 3.0 2.6 3.5 3.2 4.0 4.0 5.0 4.6 4.8 4.4 4.3 4.0 4.1 3.6 4.0 3.1 Sold x x X 5489 XI 446 29/07/10 02/01/14 3.8 3.4 4.0 3.7 3.7 3.3 4.5 4.5 4.4 4.3 4.0 3.6 3.5 3.1 3.0 2.5 1.5 0.0 1.0 0.0 2148 XI 493 26/09/10 21/04/14 3.0 2.9 4.5 4.4 4.6 4.4 4.4 4.0 4.0 4.0 3.4 3.4 3.6 3.0 3.0 3.0 2.8 2.5 2.3 2.1 2133 XI 498 05/10/10 21/05/14 2.5 2.5 3.7 3.6 4.1 4.0 4.0 3.6 4.0 3.5 4.1 3.0 3.1 3.0 2.5 2.4 2.3 2.2 2.9 0.0 2148 XI 462 15/08/10 12/06/14 2.7 2.6 4.1 4.0 4.2 4.1 4.2 4.0 4.1 4.0 3.6 3.2 3.3 3.0 5.5 0.0 5.1 0.0 2.0 0.0 Golu XI 529 15/12/10 15/07/14 3.6 3.4 4.8 4.5 3.7 3.5 3.6 3.4 3.2 3.1 3.0 2.8 3.1 2.4 2.3 2.1 1.5 0.0 3591 XI 325 26/10/09 20/07/14 3.7 3.6 5.0 4.5 5.0 4.6 4.1 4.3 3.7 3.4 3.4 3.0 3.2 3.1 3.1 3.0 3.1 2.5 3267 XI 525 13/11/10 22/07/14 4.3 3.6 4.4 3.7 4.0 3.1 3.4 3.0 3.1 3.0 3.1 2.8 2.8 2.5 2.6 2.3 R10 XII 548 27/06/11 10/08/14 2.5 2.4 2.4 2.4 2.5 2.4 2.5 2.1 2.5 2.2 2.1 1.8 2.0 1.5 2.1 1.3 2176 XII 533 16/01/11 20/08/14 3.5 3.1 Sold x x x x x x x x x x x x x x x x x 12 XI 434 05/07/10 22/08/14 3.6 3.4 3.5 3.5 3.4 3.4 3.3 3.2 3.6 2.8 3.1 2.5 3.1 0.0 3226 XI 423 03/06/10 27/08/14 3.5 3.5 Sold x x x x x x x x x x x x x x x x x 220 XII 555 25/08/11 15/10/14 4.1 4.0 4.4 4.3 4.1 4.0 4.0 3.6 3.8 3.5 3.6 3.1 3598 XII 535 10/02/11 20/08/14 4.1 4.0 4.5 4.2 3.7 3.6 3.5 3.5 3.1 2.8 2.8 2.5 2.5 2.3 3598 XII 559 03/09/11 22/10/14 4.5 4.3 4.6 4.5 4.6 4.4 4.5 4.0 4.4 4.1 220 XII 552 23/07/11 23/10/14 3.7 3.2 3.5 3.3 3.3 3.0 3.3 3.0 3.1 3.0
Kirara 2148 XI 281 22/08/10 28/06/13 4.8 4.5 4.4 3.1 4.5 4.2 4.1 3.8 3.8 3.4 4.5 0.0 3.5 0.0 2.0 0.0 4.0 0.0 Dry x 3267 XI 238 10/11/09 21/07/13 3.3 3.0 5.3 5.0 5.1 4.8 4.8 4.5 4.9 4.6 4.9 4.5 4.8 4.5 3.9 3.5 3.6 3.3 3.3 3.0 2990 X 206 27/06/09 25/07/13 3.8 3.5 4.4 4.1 5.0 4.7 4.6 4.3 3.7 3.4 3.8 3.5 3.8 3.2 3.6 3.2 0.0 2.8 0.0 2.5 3226 XI 266 10/06/10 20/09/13 5.4 5.0 4.7 4.3 4.5 4.2 4.7 4.3 4.5 4.2 4.0 3.7 5.1 4.6 5.0 4.6 4.5 4.1 3.7 3.5 2154 XI 251 26/01/10 04/11/13 4.6 4.3 5.2 4.8 4.0 3.6 3.7 3.4 3.4 3.1 4.4 4.1 4.1 4.0 3.8 3.5 3.0 2.7 3.0 2.0 2133 XI 254 28/02/10 12/12/13 3.8 3.5 3.9 3.5 3.8 3.4 3.5 3.2 4.8 4.5 4.3 4.0 3.6 3.4 1.4 1.1 1.0 1.0 0.5 0.0 3103 X 192 20/02/09 20/04/14 1.0 1.0 1.5 1.5 1.5 1.5 1.5 1.5 0.5 0.5 1.4 1.4 1.0 1.0 1.0 0.0 Dry x x x 5516 XI 269 28/06/10 30/04/14 Sold x x x x x x x x x x x x x x x x x x x 5496 XI 289 22/09/10 30/06/14 3.5 3.6 3.5 3.5 3.5 3.6 3.6 3.4 3.0 3.0 3.2 3.0 3.1 2.5 3.0 2.1 2.1 1.5 5489 XI 275 30/07/10 30/07/14 3.6 3.6 3.4 3.4 3.3 3.3 3.2 3.1 3.0 3.0 2.4 2.2 2.1 2.0 1.5 1.3 2154 XI 260 01/05/10 23/08/14 4.0 4.1 Sold x x x x x x x x x x x x x x x x x KHR XII 324 27/08/11 05/11/14 4.6 4.5 6.0 6.3 6.1 6.0 6.0 5.4 5.6 5.0 3598 XII 318 09/06/11 27/11/14 4.6 4.3 Sold x x x x x x x x x x x x x x x x x 3591 XI 262 10/05/10 11/12/14 4.4 4.0 4.1 3.7 4.1 3.7 3.5 3.2 3598 XII 323 03/08/11 17/12/14 3.7 3.3 4.8 4.3 4.6 4.1 4.4 4.0 3598 XII 321 25/07/11 26/12/14 4.1 4.0 4.0 3.9 3.9 3.9 3598 XII 306 28/02/11 05/01/15 3.5 3.1 3.5 3.2 3.5 3.3 5710 XII 322 27/07/11 05/01/15 3.4 3.2 3.7 3.5 3.8 3.5 R10 XII 315 26/05/11 06/01/15 3.7 3.2 Sold x x x x x x x x x x x x x x x x x

203
Sarsod
2148 XI 25 12/08/10 09/09/13 3.5 3.5 4.2 4.0 4.2 4.0 4.0 3.9 4.2 4.0 4.0 3.9 3.7 3.4 Sold x x x x x 12 XI 36 04/09/10 05/09/13 4.0 4.0 4.6 4.4 5.0 4.5 5.0 4.5 5.0 4.5 4.5 4.0 4.4 4.0 3.6 3.5 3.2 3.1 3.3 3.2 5496 XI 72 31/10/10 20/10/13 3.4 3.1 3.2 3.0 3.2 3.0 3.2 3.0 3.2 3.0 3.2 3.0 3.2 3.0 3.6 3.5 3.5 3.4 3.2 3.0 12 XI 44 14/09/10 19/10/13 4.7 4.5 5.2 5.0 5.2 4.8 5.2 5.0 5.2 4.8 5.3 4.8 3.7 3.5 2.6 2.7 2.0 2.2 2.0 1.5 2133 XI 54 28/09/10 14/11/13 5.2 4.8 5.2 5.0 5.2 4.8 5.2 5.0 5.1 5.0 Sol
d x x x x x x x x x 183 XII 95 20/04/11 15/05/14 6.0 5.8 5.7 5.5 5.1 5.0 5.0 5.1 5.0 5.2 2.2 2.0 2.5 2.2 2.6 2.4 2.2 2.0 1.0 1.2 2133 XI 57 05/10/10 08/06/14 6.2 6.0 6.4 6.2 6.0 6.0 3.7 3.6 5.8 5.6 3.3 3.1 2.1 2.0 2.2 2.0 2.0 1.8 1.5 1.0 5489 XI 60 07/10/10 10/06/14 Sold x x x x x x x x x x x x x x x x x x x 2177 XII 87 10/02/11 18/06/14 4.4 4.0 5.2 5.3 5.4 5.6 5.6 5.4 5.6 5.7 4.0 4.1 3.0 3.1 3.7 3.5 3.5 3.2 2.0 0.0 5710 XII 107 25/07/11 28/07/14 4.6 4.5 4.7 4.5 3.8 3.7 4.2 4.0 3.3 3.4 4.6 4.4 4.2 4.0 1.7 1.5 5496 XI 67 29/10/10 09/08/14 3.2 3.1 4.0 4.2 4.1 4.2 5.1 5.2 3.8 3.7 2.5 2.4 2.4 2.3 2.2 2.0 R11 XII 105 10/07/11 17/08/14 Sold x x x x x x x x x x x x x x x x x x x 5604 XII 114 07/09/11 12/09/14 Sold x x x x x x x x x x x x x x x x x x x R10 XII 112 18/08/11 16/10/14 2.6 2.5 4.6 4.4 3.3 3.1 4.7 4.5 4.3 4.5 4.8 4.7 5604 XII 115 24/09/11 18/10/14 Sold x x x x x x x x x x x x x x x x x x x 220 XII 128 25/11/11 23/10/14 5.3 5.4 4.5 4.3 5.1 5.0 5.0 4.8 5.6 5.4 2176 XII 100 23/05/11 02/11/14 4.5 4.2 4.1 4.2 4.4 4.7 4.6 4.3 4.5 4.7 183 XII 101 12/06/11 07/11/14 3.7 3.5 4.5 4.5 4.7 4.5 4.6 4.4 5.2 5.3 2269 III 156 28/07/12 12/11/14 4.0 3.7 4.6 4.3 4.5 4.6 4.4 4.6 3.9 3.7 220 XII 106 13/07/11 23/02/15 4.8 4.6 2176 XII 104 28/06/11 21/03/15 Sold x x x x x x x x x x x x x x x x x x x
Bichpari 2133 XI 19 29/09/10 11/09/13 3.0 3.0 3.9 3.6 3.6 3.4 3.6 3.4 3.6 3.4 3.5 3.4 3.4 3.3 3.2 3.0 3.4 3.5 2.4 2.3 3267 XI 35 03/12/10 19/10/13 4.0 3.9 4.0 3.9 4.0 3.9 4.0 3.8 4.0 3.8 4.0 3.8 4.4 4.0 3.3 3.2 Sold x x x 2133 XI 03 26/08/10 28/12/13 4.8 4.6 5.3 5.1 5.6 5.4 5.2 5.0 4.2 4.1 4.2 4.1 4.0 4.1 4.3 4.1 3.0 3.1 2.1 2.2 12 XI 10 13/09/10 08/04/14 4.2 4.1 4.7 4.5 5.2 5.0 5.6 5.5 4.7 4.5 4.6 4.5 3.0 3.2 3.0 3.3 3.0 3.0 2.3 2.1 12 XI 12 14/09/10 26/04/14 4.6 4.5 5.0 5.1 4.8 4.7 5.2 5.0 3.1 3.2 3.5 3.6 4.2 4.0 3.2 3.0 2.7 2.9 2.7 2.9 220 XII 54 02/09/11 04/09/14 4.0 4.2 4.1 4.3 3.7 3.5 4.3 4.1 4.1 4.0 3.4 3.2 2.7 2.5 5604 XII 65 11/12/11 08/09/14 5.0 5.1 4.0 4.2 4.5 4.2 3.7 3.6 3.6 3.8 3.8 3.5 3.5 3.2 2148 XI 06 04/09/10 03/10/14 Sold x x x x x x x x x x x x x x x x x x x 183 XII 55 05/10/11 19/11/14 3.7 3.5 5.2 5.1 5.2 5.0 5.7 5.6 4.0 4.2
Baddo Patti 2176 XII 8 25/09/11 01/08/14 3.0 3.0 3.5 3.5 3.5 4.5 4.0 3.5 4.0 4.0 3.5 3.4 2.2 2.0 2.5 1.5

204
F 15. Set-wise AI, Conception and daughters retained Set No. Duration Bulls
(n) AI Preg Calving Progenies
Total F Calved (n)
Av. AFC (month)
Av. Milk Yield (kg/day)
Avail-able (n)
VIII Jan 2004 to July 2005 17 1679 737 440 199 23 40.56 6.86 -
IX Aug 2005 to Jan 2007 14 3418 1744 1222 558 89 44.28 7.88 -
X Jan 2007 to Oct 2008 13 3400 1795 1252 600 100 42.21 7.52 -
XI # Oct 2008 to March 2010 14 4058 2066 1825 892 121 41.52 7.24 7
XII # March 2010 to Sept 2011 12 4569 2356 1119 538 54 38.16 7.85 114
XIII Sept 2011 to March 2013 9 6251 3197 1989 937 1 28.43 8.46 469
XIV March 2013 to July 2014 10 4144 2261 1238* 593* - - - 314
# Calving and milk recording of progenies of 11th and 12th set is in progress * Calving reported till March 2015 904 F 16. Performance of FPT Programme on Farmer’s Buffaloes
Duration AI Pregn ancies
CR% Calvings Females Born
Daughters Recorded
Av. AFC (months)
Av. Milk Yield
(kg/day) Daughters
Available for Future
Recording 2001-02 139 25 17.98 15 7 - - - - 2002-03 540 236 43.70 147 73 12 42.02 7.28 - 2003-04 1001 356 35.56 237 129 15 46.82 6.43 - 2004-05 1298 566 43.61 361 173 21 39.63 6.51 - 2005-06 1999 1009 50.48 744 345 55 43.77 7.75 - 2006-07 2102 1139 54.19 650 305 48 44.38 8.09 - 2007-08 2132 1104 51.78 694 341 58 42.75 7.61 - 2008-09 2176 1086 49.91 955 477 71 41.09 7.09 - 2009-10 2803 1450 51.73 1276 627 81 41.75 7.40 7 2010-11 3433 1743 50.77 787 377 56 38.63 7.85 58 2011-12 3308 1756 53.08 1103 557 1 28.43 8.46 245 2012-13 4204 2104 50.05 1247 553 - - - 288 2013-14 3962 1903 48.03 1079 517 - - - 281 Overall 4129 1562* 103# 55# - - - 25
33226 14477 49.75 9398 4536 418 41.98 7. 44 904 * Pregnancies confirmed up to March 2015 against AI done till December 2014 # Calvings reported up to March 2015 against AI done till May 2014

205
Financial Statement for the year 2014-15 (Rs in Lakhs) Sanctioned as per R E Total ICAR Share
Released ICAR Share as per R E
Expenditure as per AUC ICAR Share State Share
11.52580 11.52580 11.52580 11.52580 -- A total of 4129 artificial inseminations were performed in ten adopted villages with the semen of 6 test bulls of 14th set and 15 bulls of 15th set with conception rate 52.75 % (1993/4129). In this period 1993 pregnancies were confirmed and 1093 calving (565 males, 528 females) were recorded. Ninety three progenies, 1 of 10th, 39 of 11th, 52 of 12th and 1 of 13th set were also calved and the monthly test day milk recordings are in progress. The average age at first calving for these 93 daughters calved was 42.20 months. Milk recording of 52 daughters completed, 20 daughters sold before the lactation was completed and recording of 66 daughters are in progress. The physical identification using injectable microchips has been done in all female progenies born in the field. As on 31st March 2015 a total of 904 female progenies of 11th to 14th set are available in the field for future milk recordings, out of which 289, 546 and 69 daughters were less than 1 year, 1 to 3 years and more than three years, respectively. Recommendations: Follow up action be taken to record maximum no daughters’ first lactation milk yield for PT. Incentives to the livestock owner may be provided for getting the more daughters recorded on
test day milk of 1st lactation.
Project Co-ordinator’s observations on field unit performance

206
FIELD UNIT: GADVASU, LUDHIANA Financial Statement : Statement showing budget sanctioned, amount spent for the period 1st April, 2014 to March, 2015. Budget Sanctioned (Rs.) Amount Spent (Rs.) Balance
(Rs.) Salary 12,71,500 22,56,034 9,84,534 T.A. 40,000 0 40,000 Contingencies Recurring 14,00,000 13,03,426 96574 Equipments 2,00000 1,94,483 5517 Total 29,11,500 37,53,943 842443 Staff and Infrastructure Buildup during the year : i) Staff in position: Principal Investigator: Dr. P.P. Dubey (Asstt. Scientist)
Co Principal Investigator: Dr. Simarjeet Kaur (Asstt. Animal Geneticist)
Sr. No. Name & Designation of the person employed on the sanctioned post with pay scale
Pay scale Total time spent for the project
Remarks
1. Dr. Ajit Kumar, Asstt. Prof. Rs. 15600-39100 +8000
Full Time 2. Sh. Narinder Kumar
Milk Recorder Supervisor Rs. 10300-34800 +3800
Full Time 2. Sh. Hans Raj
Stock Assistant Rs. 10300-34800 +3200
Full Time F 1. Herd Strength of Registered females at Different Field Centers during 20152015
Centers/ Village OB Addition Deduction CB New Reg. Birth Purchase Sold Death
AITIANA 67 33 2 0 21 0 79 BARSAL 122 16 11 0 0 2 136 BATHA DHUA 197 50 22 0 3 2 242 BHAROWAL KALAN 1 & 2 40 10 2 0 1 0 49 BHUNDRI 1 & 2 309 26 21 0 25 2 308 BOPARAI KALAN 34 9 1 0 2 0 41 CHIMNA 124 78 7 0 14 0 188 CHOWKIMAN 79 34 14 0 14 0 99 DHAT 19 4 0 0 1 0 22 GURUSAR KAUNKE 102 15 5 0 4 0 113 JANDI 31 4 2 0 9 0 26 JASOWAL 138 99 2 0 11 0 226 KAILPUR 439 107 27 0 32 5 509 KEHRA BET 18 13 1 0 0 0 31 KHUDAI CHAK 217 28 16 0 23 1 221
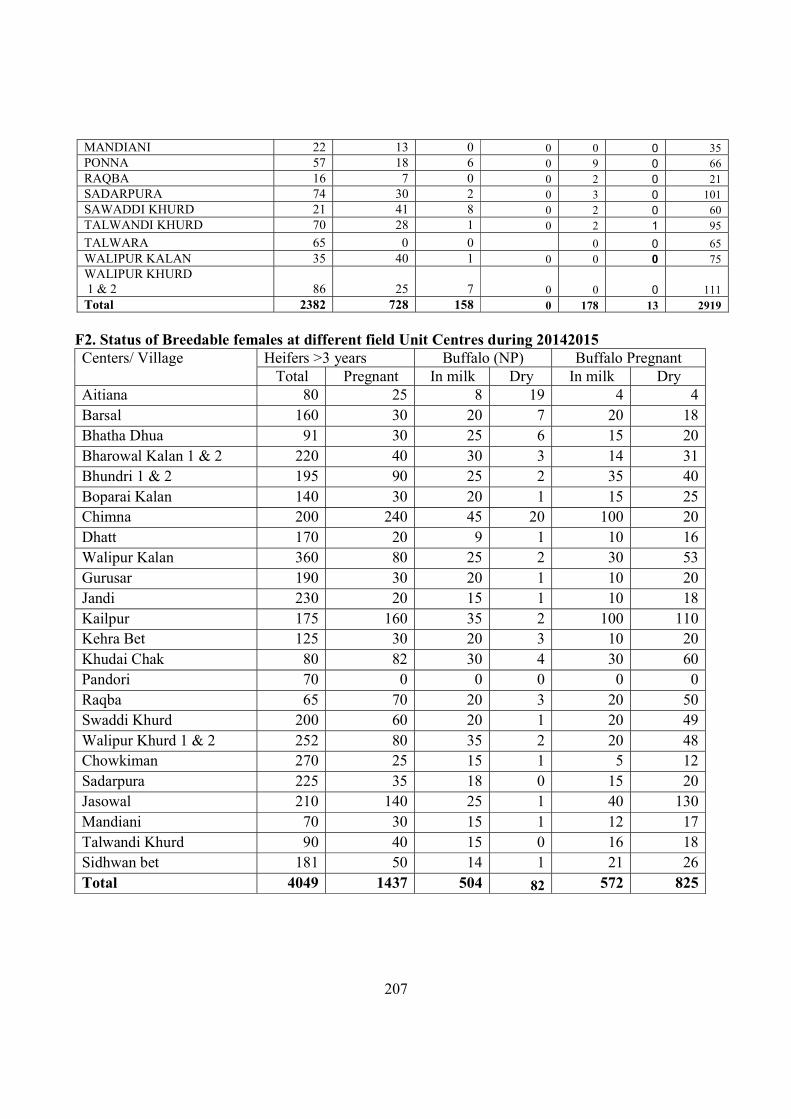
207
MANDIANI 22 13 0 0 0 0 35 PONNA 57 18 6 0 9 0 66 RAQBA 16 7 0 0 2 0 21 SADARPURA 74 30 2 0 3 0 101 SAWADDI KHURD 21 41 8 0 2 0 60 TALWANDI KHURD 70 28 1 0 2 1 95 TALWARA 65 0 0 0 0 65 WALIPUR KALAN 35 40 1 0 0 0 75 WALIPUR KHURD 1 & 2 86 25 7 0 0 0 111 Total 2382 728 158 0 178 13 2919
F2. Status of Breedable females at different field Unit Centres during 20142015 Centers/ Village Heifers >3 years Buffalo (NP) Buffalo Pregnant
Total Pregnant In milk Dry In milk Dry Aitiana 80 25 8 19 4 4 Barsal 160 30 20 7 20 18 Bhatha Dhua 91 30 25 6 15 20 Bharowal Kalan 1 & 2 220 40 30 3 14 31 Bhundri 1 & 2 195 90 25 2 35 40 Boparai Kalan 140 30 20 1 15 25 Chimna 200 240 45 20 100 20 Dhatt 170 20 9 1 10 16 Walipur Kalan 360 80 25 2 30 53 Gurusar 190 30 20 1 10 20 Jandi 230 20 15 1 10 18 Kailpur 175 160 35 2 100 110 Kehra Bet 125 30 20 3 10 20 Khudai Chak 80 82 30 4 30 60 Pandori 70 0 0 0 0 0 Raqba 65 70 20 3 20 50 Swaddi Khurd 200 60 20 1 20 49 Walipur Khurd 1 & 2 252 80 35 2 20 48 Chowkiman 270 25 15 1 5 12 Sadarpura 225 35 18 0 15 20 Jasowal 210 140 25 1 40 130 Mandiani 70 30 15 1 12 17 Talwandi Khurd 90 40 15 0 16 18 Sidhwan bet 181 50 14 1 21 26 Total 4049 1437 504 82 572 825

208
F3. Monthly A.I.’s at different field unit centers during the period from 4/2014 to 3/2015 CENTRE/ MONTH 4/14 5/14 6/14 7/14 8/14 9/14 10/14 11/14 12/14 1/15 2/15 3/15
Grand Total
AITIANA 11 16 24 27 22 38 30 14 24 22 22 8 258 BARSAL 14 13 0 13 12 16 17 15 23 16 27 20 186 BATHA DHUA 11 15 13 14 11 15 16 19 23 16 38 20 211 BHAROWAL KALAN 1 8 14 4 8 14 10 31 27 26 16 19 8 185 BHAROWAL KALAN 2 10 19 13 17 21 62 50 55 30 37 28 15 357 BHUNDRI 1 1 3 1 0 3 3 10 4 3 44 2 31 105 BHUNDRI 2 30 18 30 20 20 30 23 25 34 0 40 2 272 BOPARAI KALAN 15 23 9 13 10 20 14 24 25 26 11 5 195 CHIMNA 77 81 60 72 102 132 161 165 131 126 84 69 1260 CHOWKIMAN 7 10 3 7 12 15 14 12 6 13 16 8 123 DHAT 7 13 4 10 8 5 15 15 6 5 5 8 101 GURUSAR 11 15 13 16 14 10 16 16 16 13 18 5 163 JANDI 0 0 6 15 0 15 24 24 14 10 5 10 123 JASOWAL 53 11 26 41 50 96 123 91 113 67 74 44 789 KAILPUR 50 80 50 59 77 147 140 140 87 49 54 53 986 KEHRA BET 11 11 13 13 10 14 13 16 14 8 8 3 134 KHUDAI CHAK 21 28 20 25 33 49 36 53 59 32 32 25 413 MANDIANI 9 5 10 0 0 0 26 12 6 0 0 0 68 PONNA 7 23 12 14 26 27 26 25 24 15 38 10 247 RAQBA 17 27 24 26 36 33 34 28 12 24 22 24 307 SADARPURA 10 14 8 12 13 19 14 20 15 15 15 9 164 SAWADDI KALAN 0 16 8 11 26 33 34 46 34 23 20 25 276 SAWADDI KHURD 11 15 18 23 27 27 31 41 33 47 23 0 296 SIDHWAN BET 14 14 14 10 25 20 12 11 22 17 10 11 180 TALWANDI KHURD 14 12 12 12 13 15 20 16 20 16 15 22 187 WALIPUR KALAN 30 42 17 34 27 30 31 25 48 26 35 22 367 WALIPUR KHURD 17 13 13 20 21 48 46 51 29 42 37 26 363 Grand Total 466 551 425 532 633 929 1007 990 877 725 698 483 8316
F4. Bull-wise A.I’s. at different field unit centers during the period from 4/2014 to 3/2015 BULL NO
Set No. 4/14 5/14 6/14 7/14 8/14 9/14 10/14 11/14 12/14 1/15 2/15 3/15
Grand Total
2234 13 0 0 0 4 0 0 0 0 0 0 0 0 4 2357 14 54 0 113 196 5 30 0 0 0 0 0 0 398 2369 14 446 179 294 181 112 0 0 0 0 0 0 0 1212 2371 15 0 0 0 0 17 47 8 18 0 0 0 64 154 2412 15 0 0 0 0 0 0 209 69 0 0 0 0 278 2417 15 0 0 0 0 0 0 98 48 21 0 0 0 167 2429 15 0 0 0 0 0 77 67 30 0 0 0 0 174 2459 15 0 0 0 0 0 357 134 154 96 0 0 0 741
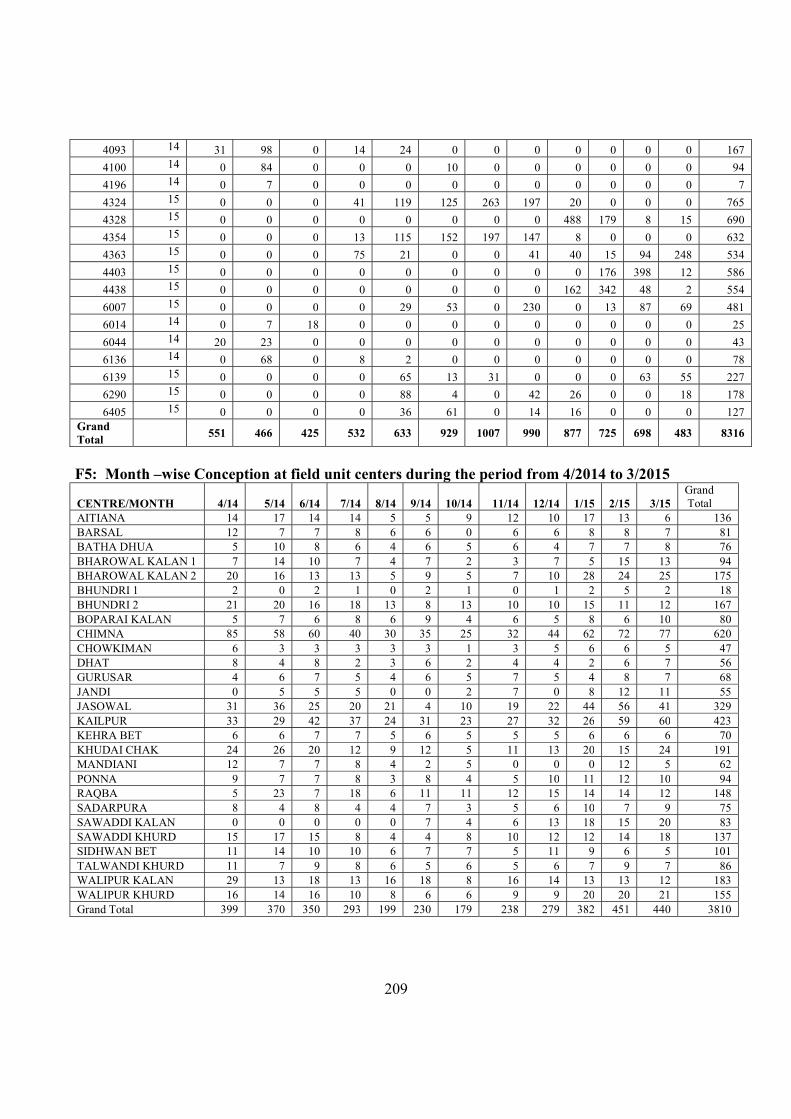
209
4093 14 31 98 0 14 24 0 0 0 0 0 0 0 167 4100 14 0 84 0 0 0 10 0 0 0 0 0 0 94 4196 14 0 7 0 0 0 0 0 0 0 0 0 0 7 4324 15 0 0 0 41 119 125 263 197 20 0 0 0 765 4328 15 0 0 0 0 0 0 0 0 488 179 8 15 690 4354 15 0 0 0 13 115 152 197 147 8 0 0 0 632 4363 15 0 0 0 75 21 0 0 41 40 15 94 248 534 4403 15 0 0 0 0 0 0 0 0 0 176 398 12 586 4438 15 0 0 0 0 0 0 0 0 162 342 48 2 554 6007 15 0 0 0 0 29 53 0 230 0 13 87 69 481 6014 14 0 7 18 0 0 0 0 0 0 0 0 0 25 6044 14 20 23 0 0 0 0 0 0 0 0 0 0 43 6136 14 0 68 0 8 2 0 0 0 0 0 0 0 78 6139 15 0 0 0 0 65 13 31 0 0 0 63 55 227 6290 15 0 0 0 0 88 4 0 42 26 0 0 18 178 6405 15 0 0 0 0 36 61 0 14 16 0 0 0 127
Grand Total
551 466 425 532 633 929 1007 990 877 725 698 483 8316
F5: Month –wise Conception at field unit centers during the period from 4/2014 to 3/2015 CENTRE/MONTH 4/14 5/14 6/14 7/14 8/14 9/14 10/14 11/14 12/14 1/15 2/15 3/15
Grand Total
AITIANA 14 17 14 14 5 5 9 12 10 17 13 6 136 BARSAL 12 7 7 8 6 6 0 6 6 8 8 7 81 BATHA DHUA 5 10 8 6 4 6 5 6 4 7 7 8 76 BHAROWAL KALAN 1 7 14 10 7 4 7 2 3 7 5 15 13 94 BHAROWAL KALAN 2 20 16 13 13 5 9 5 7 10 28 24 25 175 BHUNDRI 1 2 0 2 1 0 2 1 0 1 2 5 2 18 BHUNDRI 2 21 20 16 18 13 8 13 10 10 15 11 12 167 BOPARAI KALAN 5 7 6 8 6 9 4 6 5 8 6 10 80 CHIMNA 85 58 60 40 30 35 25 32 44 62 72 77 620 CHOWKIMAN 6 3 3 3 3 3 1 3 5 6 6 5 47 DHAT 8 4 8 2 3 6 2 4 4 2 6 7 56 GURUSAR 4 6 7 5 4 6 5 7 5 4 8 7 68 JANDI 0 5 5 5 0 0 2 7 0 8 12 11 55 JASOWAL 31 36 25 20 21 4 10 19 22 44 56 41 329 KAILPUR 33 29 42 37 24 31 23 27 32 26 59 60 423 KEHRA BET 6 6 7 7 5 6 5 5 5 6 6 6 70 KHUDAI CHAK 24 26 20 12 9 12 5 11 13 20 15 24 191 MANDIANI 12 7 7 8 4 2 5 0 0 0 12 5 62 PONNA 9 7 7 8 3 8 4 5 10 11 12 10 94 RAQBA 5 23 7 18 6 11 11 12 15 14 14 12 148 SADARPURA 8 4 8 4 4 7 3 5 6 10 7 9 75 SAWADDI KALAN 0 0 0 0 0 7 4 6 13 18 15 20 83 SAWADDI KHURD 15 17 15 8 4 4 8 10 12 12 14 18 137 SIDHWAN BET 11 14 10 10 6 7 7 5 11 9 6 5 101 TALWANDI KHURD 11 7 9 8 6 5 6 5 6 7 9 7 86 WALIPUR KALAN 29 13 18 13 16 18 8 16 14 13 13 12 183 WALIPUR KHURD 16 14 16 10 8 6 6 9 9 20 20 21 155 Grand Total 399 370 350 293 199 230 179 238 279 382 451 440 3810

210
F6: Month –wise Calving at different field unit centers during the period from 4/2013 to 3/2014 CENTRE
4/14 5/14 6/14 7/14 8/14 9/14 10/14 F M F M F M F M F M F M F M
AITIANA 1 1 4 4 2 2 2 3 5 7 0 0 6 5 BARSAL 3 4 3 3 2 1 4 2 3 5 3 6 4 5 BATHA DHUA 3 5 2 3 1 3 1 1 2 4 5 5 3 3 BHAROWAL KALAN 1 1 2 1 1 2 2 3 3 4 3 6 5 5 4 BHAROWAL KALAN 2 3 4 3 2 1 1 2 2 6 6 4 6 7 9 BHUNDRI 1 2 2 1 1 1 1 0 0 0 0 8 9 2 1 BHUNDRI 2 5 5 3 1 5 5 4 4 5 7 0 0 2 4 BOPARAI KALAN 2 2 3 3 2 3 2 3 2 2 4 5 1 1 CHIMNA 14 13 14 16 10 12 16 17 30 35 0 0 26 32 CHOWKIMAN 2 2 2 1 1 1 1 1 2 2 0 0 4 5 DHAT 3 5 3 2 2 2 1 1 3 3 4 5 3 4 GURUSAR 2 2 2 2 3 4 2 2 2 2 0 0 2 2 JANDI 1 2 1 1 2 1 4 3 2 3 5 5 7 9 JASOWAL 5 5 6 6 3 4 8 10 13 14 0 0 17 20 KAILPUR 7 12 4 5 6 9 13 15 14 22 5 7 12 16 KEHRA BET 1 2 2 1 2 2 1 1 3 5 2 3 4 5 KHUDAI CHAK 3 2 2 3 4 4 4 4 8 9 0 0 10 11 MANDIANI 2 3 3 3 2 3 4 4 2 2 0 0 3 3 PONNA 1 1 1 1 1 1 3 3 1 1 0 0 2 2 RAQBA 5 6 4 4 5 7 4 5 5 9 7 11 9 12 SADARPURA 2 1 2 1 1 2 2 2 2 3 2 3 2 2 SAWADDI KHURD 2 2 1 0 2 2 4 5 5 8 0 0 0 0 SIDHWAN BET 1 3 4 1 3 1 5 3 2 3 4 3 5 4 TALWANDI KHURD 3 3 3 2 3 2 3 2 3 3 3 3 2 4 WALIPUR KALAN 3 4 4 5 2 2 3 3 6 6 7 9 7 9 WALIPUR KHURD 3 3 5 3 5 3 4 5 5 8 7 8 6 8 Grand Total 80 96 83 75 73 80 100 104 135 172 76 93 151 180
Cont… F6
CENTRE
11/14 12/14 1/15 2/15 3/15 Total F M F M F M F M F M F M
AITIANA 5 6 5 6 5 6 11 6 2 2 48 48 BARSAL 5 5 3 3 4 3 7 4 2 3 43 44 BATHA DHUA 2 2 4 4 3 3 6 3 2 2 34 38 BHAROWAL KALAN 1 4 3 5 7 5 4 6 3 2 2 44 39 BHAROWAL KALAN 2 8 11 7 8 5 6 11 5 3 2 60 62 BHUNDRI 1 1 2 0 0 1 1 1 1 0 0 17 18 BHUNDRI 2 8 11 8 9 6 7 14 7 6 7 66 67 BOPARAI KALAN 2 3 2 4 2 3 7 3 2 3 31 35 CHIMNA 36 39 24 26 24 28 35 17 13 14 242 249 CHOWKIMAN 2 2 1 1 2 1 3 2 1 1 21 19 DHAT 3 4 2 2 3 4 2 1 1 2 30 35 GURUSAR 2 1 2 2 2 2 4 2 1 1 24 22 JANDI 0 0 2 3 3 2 4 2 0 0 31 31 JASOWAL 13 15 12 14 9 10 15 7 6 7 107 112 KAILPUR 12 18 10 14 17 19 34 14 11 12 145 163 KEHRA BET 2 3 2 3 3 3 6 3 2 3 30 34 KHUDAI CHAK 8 10 2 2 7 8 8 4 3 3 59 60 MANDIANI 5 5 3 3 3 3 7 4 2 2 36 35

211
PONNA 3 3 2 2 2 2 5 3 1 1 22 20 RAQBA 2 3 7 14 3 3 13 6 3 3 67 83 SADARPURA 3 3 2 1 4 4 4 2 2 2 28 26 SAWADDI KHURD 6 7 5 6 4 6 5 3 1 1 35 40 SIDHWAN BET 5 5 5 7 4 4 9 4 2 2 49 40 TALWANDI KHURD 4 5 3 3 4 4 8 4 2 3 41 38 WALIPUR KALAN 11 15 4 8 6 7 12 6 6 9 71 83 WALIPUR KHURD 6 9 5 8 6 7 10 4 4 4 66 70 Grand Total 158 190 127 160 137 150 247 120 80 91 1447 1511
F= Female M= Male F7: Bull–wise Conception at field unit centers during the period from 4/2014 to 3/2015
BULL NO Set
No. 4/14 5/14 6/14 7/14 8/14 9/14 10/14 11/14 12/14 1/15 2/15 3/15 Grand Total
2234 13 0 5 21 3 0 0 0 2 0 0 0 0 31 2269 13 0 40 0 0 0 0 0 0 0 0 0 0 40 2357 14 80 163 29 0 0 21 50 87 2 14 0 0 446 2369 14 269 162 300 187 72 189 121 80 46 0 0 0 1426 2371 15 0 0 0 0 0 0 0 0 8 21 4 8 41 2412 15 0 0 0 0 0 0 0 0 0 0 97 31 128 2417 15 0 0 0 0 0 0 0 0 0 0 44 22 66 2429 15 0 0 0 0 0 0 0 0 0 34 30 14 78 2459 15 0 0 0 0 0 0 0 0 0 130 60 69 259 4093 14 0 0 0 0 44 11 0 7 12 0 0 0 74 4100 14 0 0 0 7 37 0 0 0 0 4 0 0 48 4196 14 0 0 0 57 3 0 0 0 0 0 0 0 60 4324 15 0 0 0 0 0 0 0 18 58 57 116 88 337 4354 15 0 0 0 0 0 0 0 6 49 64 86 65 270 4363 15 0 0 0 0 0 0 0 34 9 0 0 18 61 6007 15 0 0 0 0 0 0 0 0 13 22 0 101 136 6014 14 15 0 0 8 3 0 8 0 0 0 0 0 34 6044 14 0 0 0 13 11 9 0 0 0 0 0 0 33 6136 14 35 0 0 18 29 0 0 4 1 0 0 0 87 6139 15 0 0 0 0 0 0 0 0 28 6 14 0 48 6290 15 0 0 0 0 0 0 0 0 36 2 0 18 56 6405 15 0 0 0 0 0 0 0 0 17 28 0 6 51
Grand Total
399 370 350 293 199 230 179 238 279 382 451 440 3810
F8 Bull–wise calving at different field unit centers during the period from 4/2014 to 3/2015 MONTH/
BULL NO. 4/2013 5/2013 6/2013 7/2013 8/2013 9/2013 10/2013
F M F M F M F M F M F M F M 2234 17 21 6 4 8 8 10 9 6 6 0 0 0 0 2269 0 1 0 0 0 0 1 0 4 6 2 2 3 4 2304 38 40 23 23 13 15 3 3 43 49 1 1 0 0 2357 0 0 0 0 1 1 40 41 30 42 10 14 17 19 2369 25 34 54 48 51 56 43 47 50 67 35 42 85 102 4059 0 0 0 0 0 0 3 4 2 2 0 0 0 0 4093 0 0 0 0 0 0 0 0 0 0 2 3 11 13 4100 0 0 0 0 0 0 0 0 0 0 0 0 0 0

212
4196 0 0 0 0 0 0 0 0 0 0 0 0 0 0 4439 0 0 0 0 0 0 0 0 0 0 24 28 11 13 6014 0 0 0 0 0 0 0 0 0 0 2 3 10 10 6044 0 0 0 0 0 0 0 0 0 0 0 0 13 18 6136 0 0 0 0 0 0 0 0 0 0 0 0 1 1
Grand Total 80 96 83 75 73 80 100 104 135 172 76 93 151 180 Cont… F8
MONTH/ BULL NO.
11/2013 12/2013 1/2014 2/2014 3/2014 Total F M F M F M F M F M F M
2234 0 0 2 3 7 8 2 1 0 0 58 60 2269 0 0 13 14 0 0 0 0 0 0 23 27 2304 0 1 0 0 0 0 0 0 0 0 121 132 2357 31 35 54 69 12 13 0 0 0 0 195 234 2369 107 130 58 74 118 129 154 76 27 31 807 836 4059 0 0 0 0 0 0 0 0 0 0 5 6 4093 0 0 0 0 0 0 0 0 18 20 31 36 4100 0 0 0 0 0 0 7 3 16 17 23 20 4196 0 0 0 0 0 0 49 22 1 1 50 23 4439 0 0 0 0 0 0 0 0 0 0 35 41 6014 6 7 0 0 0 0 8 4 1 1 27 25 6044 0 0 0 0 0 0 12 6 5 6 30 30 6136 14 17 0 0 0 0 15 8 12 15 42 41
Grand Total 158 190 127 160 137 150 247 120 80 91 1447 1511 F = Female M = Male
F9. Live female progeny at field unit centers from (0 to ≤ 6mo.) as on 3/2015. 89 live female progeny (0 to ≤ 6mo.) available in the field unit centres.
F10. Live female progeny at different field unit centers from (>6 to ≤ 12mo.) as on 3/2015. 231 live female progeny (>6 to ≤ 12mo.) available in the field unit centres. F11 : Live female progeny at different field unit centers (>1 to ≤3 years) as on 3/2015 1313 live female progeny (>1 to ≤3 years) available in the field unit centres. F12 : Live female progeny at different field unit centers ( >3 years) as on 3/2015 1286 live female progeny ( >3 years) available in the field unit centres. F13 : Daughters calved at different field unit centers during 2014-2015 120 daughters calved during the report period at different field unit centres. F 14 Daughters recorded at different field units during 2014-2015 Test day milk recording of 90 daughters completed at different field unit during the period.

213
F15. Bull-wise A.I., Conception, Calving and Daughter’s retained till completion of milk recording
Bull No Set No. A.I. Conception Calving Daughters retained up to Total Female 1 year 2 years 3 years Calving Complete
1667 6 159 56 18 7 0 0 2 2 2 1706 6 421 141 130 61 0 0 4 4 4 1713 6 423 208 121 54 0 0 0 0 0 1717 6 497 168 145 65 0 0 4 4 4 1933 6 27 11 5 3 0 0 0 0 0 1944 6 25 11 5 2 0 0 0 0 0 4506 6 210 76 49 21 0 0 1 1 1 4523 6 117 82 65 30 0 0 4 4 4 4619 6 99 52 26 11 0 0 0 0 4637 6 124 48 30 12 0 0 3 3 3 4640 6 221 90 75 34 0 0 6 6 6 1727 7 301 109 88 42 0 0 5 5 5 1746 7 594 219 132 67 0 0 9 9 9 1749 7 314 110 84 39 0 0 0 0 1796 7 200 80 45 17 0 0 1 1 1 2121 7 85 34 13 6 0 0 0 0 2133 7 103 32 26 12 0 0 3 3 3 2184 7 36 28 27 13 0 0 0 0 0 2331 7 61 19 13 7 0 0 2 2 2 2363 7 61 20 8 3 0 0 0 0 1492 8 134 43 40 18 0 0 1 1 1 1509 8 101 30 26 13 0 0 1 1 1 1867 8 604 202 173 78 0 0 9 10 9 1868 8 520 199 169 85 0 0 8 8 8 1875 8 980 366 236 105 0 0 7 7 7 1893 8 342 110 88 41 0 0 1 1 1 2250 8 84 33 27 14 0 0 0 0 0

214
Cont.. Bull No Set No. A.I. Conception Calving Daughters retained up to
Total Female 1 year 2 years 3 years Calving Complete 2308 8 136 48 27 12 0 0 3 3 3 2396 8 60 22 16 6 0 0 0 0 0 2422 8 63 30 22 10 0 0 0 0 0 2479 8 81 38 27 13 0 0 1 1 1 2522 8 77 35 28 14 0 0 2 2 2 4813 8 21 12 5 2 0 0 1 1 1 4865 8 103 51 37 20 0 0 0 0 0 5049 8 88 34 23 10 0 0 0 0 0 5054 8 73 25 10 6 0 0 0 0 0 5083 8 75 40 28 14 0 0 0 0 0 1575 9 76 29 19 9 0 0 1 1 1 1903 9 785 299 219 97 0 0 14 14 14 1913 9 571 224 146 66 0 0 7 7 7 1940 9 1107 427 272 121 0 0 18 18 18 1964 9 1014 378 267 118 0 0 14 14 14 1994 9 856 301 209 92 0 0 15 15 15 2582 9 165 72 48 26 0 0 6 6 6 2592 9 146 58 35 13 0 0 2 2 2 2720 9 105 39 17 6 0 0 0 0 0 2910 9 54 22 12 6 0 0 0 0 0 5112 9 95 54 40 18 0 0 5 5 5 5197 9 33 13 10 4 0 0 1 1 1 5218 9 76 27 19 9 0 0 0 0 5258 9 36 13 6 3 0 0 0 0 0 5312 9 37 14 12 6 0 0 0 0 0 1693 10 52 19 15 6 0 0 0 0 0 2045 10 1431 555 425 187 0 1 48 45 41 2062 10 1190 481 354 162 0 1 39 39 33
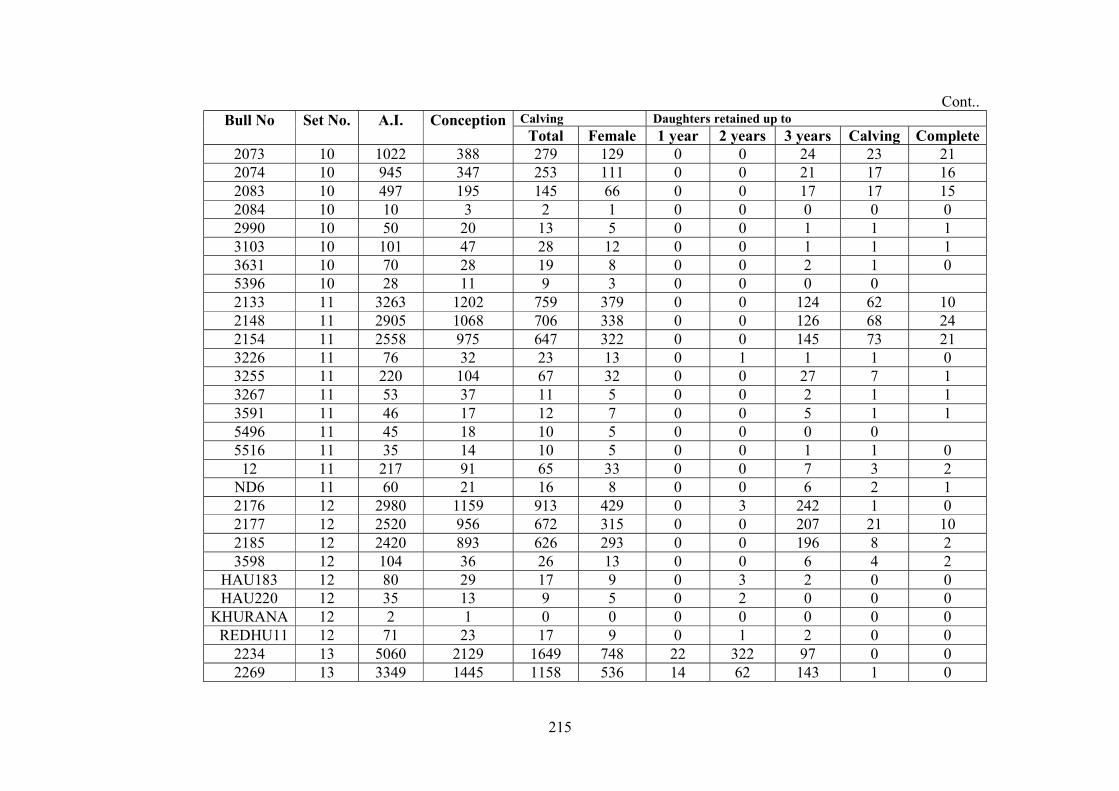
215
Cont.. Bull No Set No. A.I. Conception Calving Daughters retained up to
Total Female 1 year 2 years 3 years Calving Complete 2073 10 1022 388 279 129 0 0 24 23 21 2074 10 945 347 253 111 0 0 21 17 16 2083 10 497 195 145 66 0 0 17 17 15 2084 10 10 3 2 1 0 0 0 0 0 2990 10 50 20 13 5 0 0 1 1 1 3103 10 101 47 28 12 0 0 1 1 1 3631 10 70 28 19 8 0 0 2 1 0 5396 10 28 11 9 3 0 0 0 0 2133 11 3263 1202 759 379 0 0 124 62 10 2148 11 2905 1068 706 338 0 0 126 68 24 2154 11 2558 975 647 322 0 0 145 73 21 3226 11 76 32 23 13 0 1 1 1 0 3255 11 220 104 67 32 0 0 27 7 1 3267 11 53 37 11 5 0 0 2 1 1 3591 11 46 17 12 7 0 0 5 1 1 5496 11 45 18 10 5 0 0 0 0 5516 11 35 14 10 5 0 0 1 1 0
12 11 217 91 65 33 0 0 7 3 2 ND6 11 60 21 16 8 0 0 6 2 1 2176 12 2980 1159 913 429 0 3 242 1 0 2177 12 2520 956 672 315 0 0 207 21 10 2185 12 2420 893 626 293 0 0 196 8 2 3598 12 104 36 26 13 0 0 6 4 2
HAU183 12 80 29 17 9 0 3 2 0 0 HAU220 12 35 13 9 5 0 2 0 0 0
KHURANA 12 2 1 0 0 0 0 0 0 0 REDHU11 12 71 23 17 9 0 1 2 0 0
2234 13 5060 2129 1649 748 22 322 97 0 0 2269 13 3349 1445 1158 536 14 62 143 1 0

216
Cont.. Bull No Set No. A.I. Conception Calving Daughters retained up to
Total Female 1 year 2 years 3 years Calving Complete 2304 13 6134 2631 2115 985 32 383 101 0 0 3964 13 131 52 45 25 0 15 0 0 0 4059 13 214 85 69 32 3 14 0 0 0 5943 13 31 13 10 5 0 0 5 0 0 2357 14 1640 701 429 195 44 0 0 0 0 2369 14 5454 2323 1645 808 169 31 1 0 0 4093 14 253 109 67 31 5 0 0 0 0 4100 14 110 48 43 23 1 0 0 0 0 4196 14 143 60 73 50 0 0 0 0 0 4439 14 214 87 76 35 13 0 0 0 0 6014 14 146 63 52 27 9 0 0 0 0 6044 14 166 70 60 30 1 0 0 0 0 6136 14 202 89 83 42 7 0 0 0 0 2371 15 154 41 0 0 0 0 0 0 0 2412 15 278 128 0 0 0 0 0 0 0 2417 15 167 66 0 0 0 0 0 0 0 2429 15 174 78 0 0 0 0 0 0 0 2459 15 741 259 0 0 0 0 0 0 0 4324 15 765 337 0 0 0 0 0 0 0 4328 15 690 0 0 0 0 0 0 0 0 4354 15 632 270 0 0 0 0 0 0 0 4363 15 534 61 0 0 0 0 0 0 0 4403 15 586 0 0 0 0 0 0 0 0 4438 15 554 0 0 0 0 0 0 0 0 6007 15 481 136 0 0 0 0 0 0 0 6139 15 227 48 0 0 0 0 0 0 0 6290 15 178 56 0 0 0 0 0 0 0 6405 15 127 51 0 0 0 0 0 0 0 Total 65397 25101 17140 8043 320 838 1761 560 364

217
Performance of FPT Programme since Inception
Duration A.I. Pregnancies CR% Calvings Females born
Daughters recorded
Av. AFC (Mo.)
Av. Milk Yield (kg./days)
Daughters available for recording
2001-02 493 184 37.3 2002-03 1908 723 37.9 229 135 3 56.1 8.1 2003-04 1858 629 33.9 472 245 22 50.3 8.0 2004-05 2435 726 29.8 466 215 26 50.3 8.1 2005-06 2822 967 34.3 699 333 14 46.5 7.9 2006-07 3313 1178 35.6 755 357 59 49.7 8.1 2007-08 4015 1438 35.8 870 368 53 47.1 8.3 2 2008-09 4147 1622 39.1 1149 491 85 45.3 8.3 9 2009-10 5415 1878 34.7 1140 538 58 43.3 8.1 91 2010-11 6846 2289 33.4 1274 603 40 8.1 285 2011-12 7298 2814 38.6 1800 853 4 8.1 536 2012-13 8517 3463 40.7 2497 1155 476 2013-14 8014 3380 42.2 2831 1303 837 2014-15 8316 3810 45.8 2958 1447 319 Overall 65397 25101 38.4 17140 8043 364 47.4 8.1 2555
A. I. Conceptions, Calvings and Daughters Retained –9th Set
Bull No. 1575 1903 1913 1940 1964 1994 2582 2592 2720 2910 5112 5197 5218 5258 5312 Total
AI 76 785 571 1107 1014 856 165 146 105 54 95 33 76 36 37 5156 Pregnancies 29 299 224 427 378 301 72 58 39 22 54 13 27 13 14 1970 Daughter Born 9 97 66 121 118 92 26 13 6 6 18 4 9 3 6 594 Daughter Calved 1 14 7 18 14 15 6 2 0 0 5 1 0 0 0 83 Complete Record 1 14 7 18 14 15 6 2 0 0 5 1 0 0 0 83 Daughter Available 0 0 0 0 0 0 0 0 0 0 0 0 0 0 0 0

218
A.I., Conceptions, Calvings and Daughters Retained –10th Set
A.I., Conception, Calvings and Daughters Retained –11th Set
Bull No. 2133 2148 2154 3226 3255 3267 3591 5496 5516 12 ND6 Total Total
AI 3263 2905 2558 76 220 53 46 45 35 217 60 9478 9478 Pregnancies 1202 1068 975 32 104 37 17 18 14 91 21 3579 3579 Daughter Born 379 338 322 13 32 5 7 5 5 33 8 1147 1147 Daughter Calved 62 68 73 1 7 1 1 0 1 3 2 219 92 Complete Recording 10 24 21 0 1 1 1 0 0 2 1 61 10 Daughter Available 114 102 124 2 26 1 4 0 1 5 5 384 586
A.I., Conception, Calvings and Daughters Retained –12th Set
Bull No. 2176 2177 2185 3598 HAU183 HAU220 KHURANA REDHU11 Total
AI 2980 2520 2420 104 80 35 2 71 8212 Pregnancies 1159 956 893 36 29 13 1 23 3110 Daughter Born 429 315 293 13 9 5 0 9 1073 Daughter Calved 1 21 8 4 0 0 0 0 34 Complete Recording 0 10 2 2 0 0 0 0 14 Daughter Available 245 197 194 4 5 2 0 3 650
Bull No. 1693 2045 2062 2073 2074 2083 2084 2990 3103 3631 5396 Total
AI 52 1431 1190 1022 945 497 10 50 101 70 28 5396 Pregnancies 19 555 481 388 347 195 3 20 47 28 11 2094 Daughter Born 6 187 162 129 111 66 1 5 12 8 3 690 Daughter Calved 0 45 39 23 17 17 0 1 1 1 0 144 Complete Recording 0 41 33 21 16 15 0 1 1 0 0 128 Daughter Available 0 8 7 3 5 2 0 0 0 2 0 27

219
A.I., Conception, Calvings and Daughters Retained –13th Set Bull No.
2234 2269 2304 3964 4059 5943 Total AI 5060 3349 6134 131 214 31 14919 Pregnancies 2129 1445 2631 52 85 13 6355 Daughter Born 748 536 985 25 32 5 2331 Daughter Calved 0 1 0 0 0 0 1 Complete Recording 0 0 0 0 0 0 0 Daughter Available 441 219 516 15 17 5 1213
A.I., Conception, Calvings and Daughters Retained –14th Set
2357 2369 4093 4100 4196 4439 6014 6044 6136 Total AI 1640 5454 253 110 143 214 146 166 202 8328 Pregnancies 701 2323 109 48 60 87 63 70 89 3550 Daughter Born 195 808 31 23 50 35 27 30 42 1241 Daughter Calved 0 0 0 0 0 0 0 0 0 0 Complete Recording 0 0 0 0 0 0 0 0 0 0 Daughter Available
A.I., Conception, Calvings and Daughters Retained –15th Set 2371 2412 2417 2429 2459 4324 4328 4354 4363 4403 4438 6007 6139 6290 6405 Total AI 154 278 167 174 741 765 690 632 534 586 554 481 227 178 127 6288 Pregnancies 41 128 66 78 259 337 0 270 61 0 0 136 48 56 51 1531 Daughter Born 0 0 0 0 0 0 0 0 0 0 0 0 0 0 0 0 Daughter Calved 0 0 0 0 0 0 0 0 0 0 0 0 0 0 0 0 Complete Recording 0 0 0 0 0 0 0 0 0 0 0 0 0 0 0 0 Daughter Available 0 0 0 0 0 0 0 0 0 0 0 0 0 0 0 0

220
Set-wise AI, Conception and daughters retained Set no.
No. of Bulls used
AI Preg Daughters retained, Recorded and to be recorded Total Female
Up to 1Year
Up to 2 Year
Up to 3 Year
Daughter Recorded
Av. AFC (Mo.)
Av. Milk Yield (kg)
Daughters to be recorded
6th 11 2323 923 669 300 0 0 24 24 52.0 7.9 0 7th 9 1755 651 436 206 0 0 20 20 49.4 8.0 0 8th 17 3542 1318 982 461 0 0 34 34 50.3 8.1 0 9th 15 5156 1970 1331 594 0 0 83 83 47.6 8.2 0 10th 11 5396 2094 1542 690 0 2 153 128 47.6 8.3 27 11th 12 9478 3579 2326 1147 0 1 444 61 44.8 8.0 384 12th 8 8212 3110 2280 1073 0 8 656 14 42.1 8.0 650 13th 6 14919 6355 5046 2331 71 796 346 0 47.6 1213 14th 9 8328 3550 2528 1241 249 31 1 0 52.0 281 15th 15 6288 1531 0 0 0 0 0 0 0
97 65397 25101 17140 8043 320 838 1761 364 49.4 8.1 2555

221
Financial Statement for the year 2014-15 (Rs in Lakhs) Sanctioned as per R E Total ICAR Share
Released ICAR Share as per R E
Expenditure as per AUC Balance ICAR Share State Share
26.40 19.80 19.80 32.11901 10.70633 -12.31901
Overall 2919 females were registered in the field. Total 8316 AI’s were performed in the field using one bull of 13th set (only for AI), 8 bulls of 14th set and all 15 bulls of 15th set. 3810 buffalos conceived and 2958 calving took place during the period out of which 1447 were female. At various centres live female progenies of different age groups viz. 0 to < 6 months, > 6 to < 12 months, > 1 to < 3 year and > 3 years were 89, 231, 1313 and 1286 heads, respectively. Overall 65397 AI’s were performed resulting in 25101 progenies with the conception rate of 38.4 percent. 17140 calving were recorded out of which 8043 were female. 156 daughters calved during the year and 90 daughter recorded in 2014-15. AFC in the field reduced from 56.1 month (2002-03) to 43.3 months. 2533 daughters are still available for recording. Recommendations: Care should be taken to use all set bulls simultaneously and in equal numbers for AI
at the field. Three bulls of NDRI (6139, 6290, 6405) and all the bulls of GADVASU of 15th set should be used for more upto December to produced approximately equal number of daughters from each bull of the set. Follow up for the AI should be done to record more no of daughter per bull.
Project Co-ordinator’s observations on Field Unit performance

222
FIELD UNIT: NDRI, KARNAL
Research Achievements : A total of 3941 AI were performed in Murrah Buffaloes under field conditions during 2014-15 and as a result 51.58 % conception rate was obtained. The highest conception rate was observed in the month of Jan (56.48 %) and the lowest was in the month of Feb (49.69%). Across the villages, the highest conception rate was observed in Rindal (55.41%) and lowest was observed in the village Manglora (46.48%). A total of 1860 (955 male and 905 female) Murrah buffalo calves were born in the farmers’ herds and performance data on 183 daughters have been recorded for evaluation of bulls under field conditions. The total herd strength of registered females and the breedable females at different centers was 5988 and 4495 respectively. As many as 15 breeding bulls belonging to the 14th & 15th set were used for AI during the year. F 1. Herd Strength of Registered females under field unit as on 31 3 2015 Name of Centre OB Addition Deduction
New Reg. (Birth/ Purchase)
Sold Death CB Darar 1576 219 108 35 1672 Kheriman Singh 1501 209 103 28 1579 Rindal 1273 115 207 28 1153 Sheikhpura * 1579 210 165 20 1604 Total 5929 753 583 111 5988 F2. Status of Breedable females under field unit as on 313 2015 Name of Village Heifers >3 years Buffalo (NP) Buffalo Pregnant
Total Pregnant In milk Dry In milk Dry Darar 285 105 385 130 202 110 Kheriman Singh 377 180 370 140 130 89 Rindal 247 124 225 55 237 95 Sheikhpura * 440 205 218 106 417 237 Total 1349 614 1198 431 986 531 *Includes Manglora
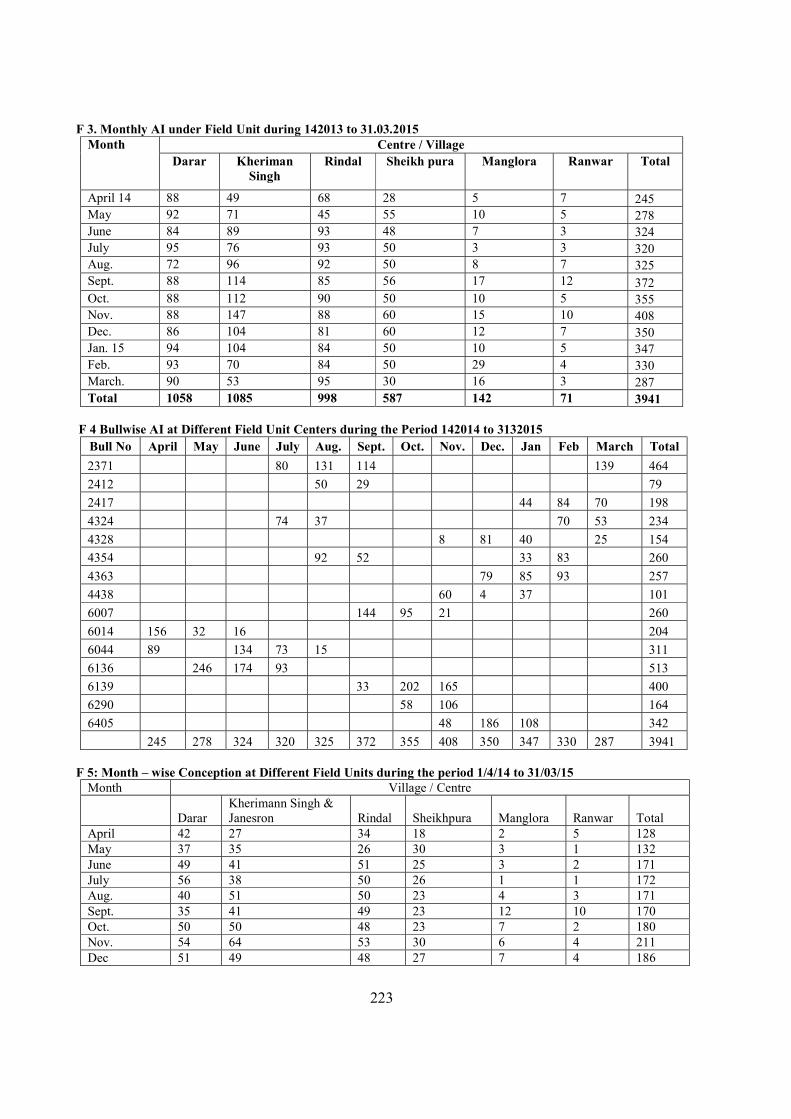
223
F 3. Monthly AI under Field Unit during 142013 to 31.03.2015 Month Centre / Village
Darar Kheriman Singh
Rindal Sheikh pura Manglora Ranwar Total April 14 88 49 68 28 5 7 245 May 92 71 45 55 10 5 278 June 84 89 93 48 7 3 324 July 95 76 93 50 3 3 320 Aug. 72 96 92 50 8 7 325 Sept. 88 114 85 56 17 12 372 Oct. 88 112 90 50 10 5 355 Nov. 88 147 88 60 15 10 408 Dec. 86 104 81 60 12 7 350 Jan. 15 94 104 84 50 10 5 347 Feb. 93 70 84 50 29 4 330 March. 90 53 95 30 16 3 287 Total 1058 1085 998 587 142 71 3941
F 4 Bullwise AI at Different Field Unit Centers during the Period 142014 to 3132015 Bull No April May June July Aug. Sept. Oct. Nov. Dec. Jan Feb March Total 2371 80 131 114 139 464 2412 50 29 79 2417 44 84 70 198 4324 74 37 70 53 234 4328 8 81 40 25 154 4354 92 52 33 83 260 4363 79 85 93 257 4438 60 4 37 101 6007 144 95 21 260 6014 156 32 16 204 6044 89 134 73 15 311 6136 246 174 93 513 6139 33 202 165 400 6290 58 106 164 6405 48 186 108 342 245 278 324 320 325 372 355 408 350 347 330 287 3941
F 5: Month – wise Conception at Different Field Units during the period 1/4/14 to 31/03/15
Month Village / Centre Darar
Kherimann Singh & Janesron Rindal Sheikhpura Manglora Ranwar Total
April 42 27 34 18 2 5 128 May 37 35 26 30 3 1 132 June 49 41 51 25 3 2 171 July 56 38 50 26 1 1 172 Aug. 40 51 50 23 4 3 171 Sept. 35 41 49 23 12 10 170 Oct. 50 50 48 23 7 2 180 Nov. 54 64 53 30 6 4 211 Dec 51 49 48 27 7 4 186

224
Jan 55 61 49 21 8 2 196 Feb 52 34 47 22 7 2 164 March 48 28 48 20 6 2 152 Total 569 519 553 288 66 38 2033 AI Till Dec 1058 1085 998 587 142 71 3941 CR% 53.78 47.83 55.41 49.06 46.48 53.52 51.58 F 6: Monthwise Calvings at Different Field Unit Centers During the Period 142014 to 3132015 Month Darar Rindal &
Nagla Kherimann
Singh & Janesaron
Sheikhpura Manglora Rawar Total M F M F M F M F M F M F M F
Apr 14 24 15 8 5 4 4 5 6 4 4 3 2 48 36 May 24 15 6 9 6 4 7 6 6 5 3 2 52 41 June 28 18 5 9 19 21 16 12 7 8 4 2 79 70 July 26 19 5 9 32 33 20 15 10 8 6 6 99 90 Aug. 25 23 9 14 32 38 20 14 5 5 5 5 96 99 Sept. 23 23 18 16 27 23 19 20 5 6 5 5 97 93 Oct. 35 24 30 26 30 32 14 12 6 3 2 3 117 100 Nov. 26 22 21 26 25 34 5 10 5 4 2 4 84 100 Dec. 21 15 16 16 25 31 7 5 6 3 4 5 79 75
Jan 15 21 14 27 34 25 26 10 9 4 4 3 3 90 90 Feb 26 16 10 13 12 12 5 6 4 3 2 3 59 53 Mar 21 16 7 10 15 19 6 6 4 4 2 3 55 58
Total 300 220 162 187 252 277 134 121 66 57 41 43 955 905 M = Male: 955 F = Female: 905 Total = 1860 F 7. Bull wise Conception at different Field Unit Centers during 1414 to 31-03-15
Bull No April May June July Aug. Sept. Oct. Nov. Dec. Jan Feb March Total conc.
Total AI
CR% 2371 48 75 51 76 250 464 53.88 2412 28 15 43 79 54.43 4324 37 16 34 28 115 234 49.15 4328 3 48 23 13 87 154 56.49 4354 50 31 14 31 126 260 48.46 4363 26 38 50 52 140 257 54.47 4438 9 2 78 106 200 53.00 6007 23 55 49 136 260 52.30 6014 76 17 8 101 204 49.51 6044 52 73 9 7 141 311 45.34 6136 115 90 50 255 513 49.71 6139 18 98 90 206 400 51.50 6290 33 56 89 164 54.27 6405 27 98 5 130 243 53.50 2417 26 47 35 108 198 54.55 Total 128 132 171 172 171 170 180 211 186 196 164 152 2033 3941 51.58

225
F 8. Bullwise Calving at Different Field Unit Centers during 1-4-2014 to 31-3-2015 Month April May June July Aug. Sept. Oct. Nov. Dec. Jan Feb March Total 4093 M 8 5 13 24 17 18 85
F 5 3 14 22 22 15 81 4100 M 52 32 84
F
57 30
87
4439 M 16 44 28 6 14 25 6 139 F 10 32 20 3 14 18 5 102
6014 M 1 29 23 40 24 54 9 9 62 36 2 289 F 3 26 26 44 19 52 13 6 56 29 3 277
6044 M 8 6 9 11 9 25 18 4 90
F 6
5 7 10 10
29 19 5 91 6066 M 1 1 2
F 3 3 6 6136 M 15 3 2 36 28 6 12 17 38 3 5 49 214
F 14 6 2 29 23 6 14 23 39 5 5 50 216 2357 M 5 17 22
F
5 11
16
2369 M 21 9 30 F 24 5 29 Total 1860
M = Male: 905 F = Female: 955 Total= 1860 F. 9. Bull wise female progeny at different Field Unit Centers (0-12 months) as on 31/3/15
Centers Darar Kheriman Singh & Janeseron
Rindal & Nagla
Sheikhpura Manglora Ranwar Total Bull No
2357
16 16 2369 10 12 8 4 34 4093 24 20 30 74 4100 52 24 18 7 4 4 109 4439 75 14 9 6 5 2 111 6014 95 95 33 43 20 9 295 6044 24 29 14 4 3 74 6066 4 4 6136 45 53 32 36 21 20 207
Total 325 251 140 108 61 39 924

226
F. 10. Bull wise Live Female Progeny at different Field Unit s (1-3 yrs) as on 31/3/ 2015
Centers Darar Kheriman Singh & Janeseron Rindal & Nagla Sheikhpura Manglora Ranwar Total
851 15 5 12 15 8 5 60 858 20 6 26 2234 3 3 2234 6 6 2269 10 11 21 2304 22 5 27 3226 8 9 1 11 29 3252 8 8 3255 20 20 3267 2 24 6 5 37 3591 10 4
11
25
3631
0 3964 3 11 24
38
4059 10 9 13
6 38 4093
5
5
4439
21
21 5414 1 1 5489 10 10 5489 8 8 5496 12 6 6 7 6 37 5516 8 6 7 21 5604 2 2 5710 6 8 10 4 5 33 5720 6 63 69 5943 7 10 19 16 9 61
6014 105 105 6044 6 6 6059 9 9 6066 4 4 6136 12 51 15 78 H12 10 13 23
ND 8 8 8 ND6 6 6 R10 5 5 R11 4 4
Total 181 356 183 68 46 36 870 F. 11. Bull wise Live Female Progeny at different Field Unit Centers (>3 Years) as on 31/3/2015
Centers Darar Kheriman Singh & Janesron
Rindal & Nagla
Sheikhpura Manglora Ranwar Total ND1 1 1 ND6 4 1 5 ND8 6 2 8 H12 8 9 6 23
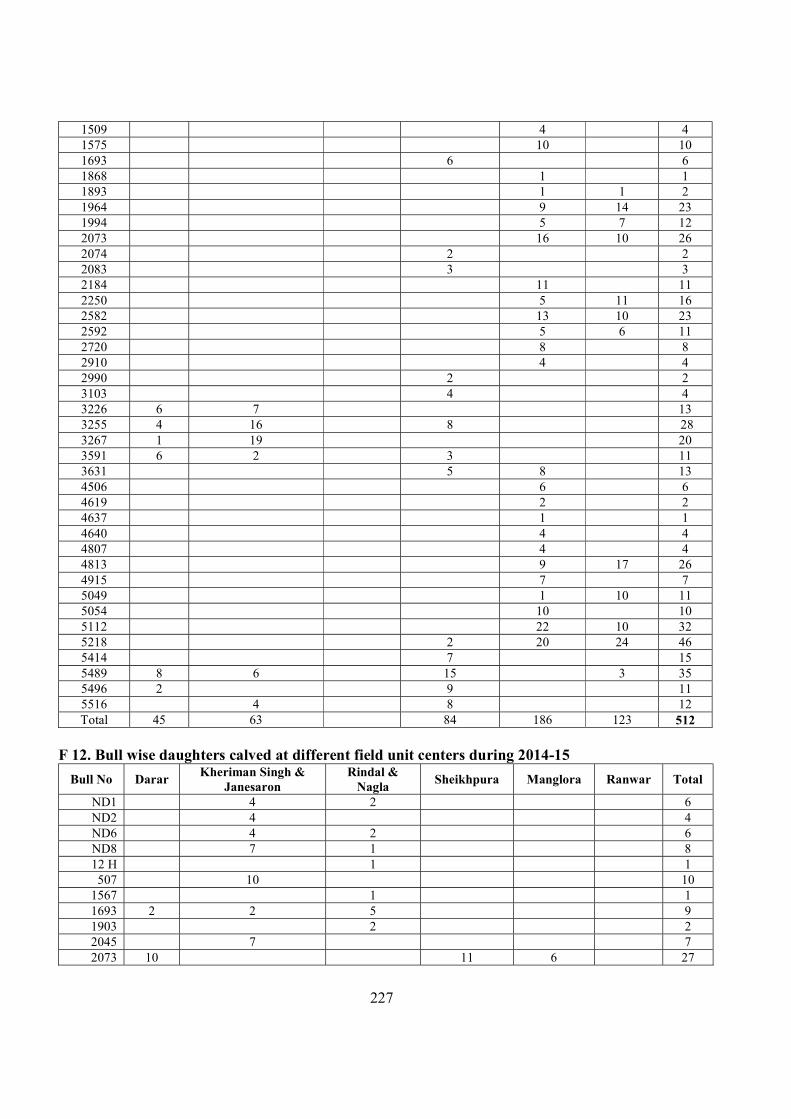
227
1509 4 4 1575 10 10 1693 6 6 1868 1 1 1893 1 1 2 1964 9 14 23 1994 5 7 12 2073 16 10 26 2074 2 2 2083 3 3 2184 11 11 2250 5 11 16 2582 13 10 23 2592 5 6 11 2720 8 8 2910 4 4 2990 2 2 3103 4 4 3226 6 7 13 3255 4 16 8 28 3267 1 19 20 3591 6 2 3 11 3631 5 8 13 4506 6 6 4619 2 2 4637 1 1 4640 4 4 4807 4 4 4813 9 17 26 4915 7 7 5049 1 10 11 5054 10 10 5112 22 10 32 5218 2 20 24 46 5414 7 15 5489 8 6 15 3 35 5496 2 9 11 5516 4 8 12 Total 45 63 84 186 123 512
F 12. Bull wise daughters calved at different field unit centers during 2014-15 Bull No Darar Kheriman Singh &
Janesaron Rindal &
Nagla Sheikhpura Manglora Ranwar Total ND1 4 2 6 ND2 4 4 ND6 4 2 6 ND8 7 1 8 12 H 1 1 507 10 10
1567 1 1 1693 2 2 5 9 1903 2 2 2045 7 7 2073 10 11 6 27

228
2074 4 5 1 10 2083 2 2 4
2133 3 3 2308 1 1 2582 3 4 12 5 24 2592 7 2 4 4 17 2720 4 1 5 2754 6 6 2910 3 3 2990 2 1 1 4 3103 5 1 6 3255 3 3 3226 1 1 3267 2 2 3507 2 2 3591 1 1 3631 8 1 5 14 4396 1 1 4865 2 2 5049 1 1 5112 18 7 25 5197 4 5 9 5218 18 4 22 5312 1 1 5396 3 3 5414 2 2 5 9 5489 5 6 2 1 14 5496 3 3 5516 4 4 Total 31 110 60 57 23 281
F. 13. Bull wise daughters recorded at different field units during 2014-15
Bull No
Darar Kheriman Singh & Janesaron
Rindal & Nagla
Sheikhpura Manglora Ranwar Total 507 1 1 2 1693 2 2 4 1893 1 2 3 1940 2 2 1964 1 1 2073 10 10 2074 4 1 1 6 2085 5 5 10 2133 1 1 2184 8 4 2 14 2250 4 4 2308 3 3 6 2422 1 1 2 2582 1 1 2 2 6 2720 4 1 1 6 2990 2 1 1 4 3226 2 2 4 3255 2 2 4 3591 2 2 4 3636 3 3 6

229
4506 1 1 4619 1 1 4637 1 1 4807 1 1 4813 12 4 16 4865 2 2 4 5049 6 6 5112 4 2 1 7 5197 4 1 1 6 5218 2 2 2 6 5396 3 3 5414 2 1 1 4 5489 4 4 8 5496 2 2 4 5516 6 6 12 ND1 2 2 4 Total 41 45 45 21 25 6 183
F 14.Bull-wise AI, conception, calving and daughters retained till completion of milk recording as on 31/03/2015
S.No. Bull No.
A.I. Conception Calving Daughters Retained upto Complete Recording Total Females 1 Year 2 Year 3 Year Calving
1 ND1 207 100 24 2 ND2 105 50 36 15 3 4 7 7 3 ND6 305 116 104 43 10 24 9 4 ND8 217 94 92 48 30 17 6 5 H10 190 100 88 41 17 6 6 6 R10 34 19 11 7 6 5 7 R11 36 8 6 10 4 8 H12 482 230 192 95 11 39 15 6 9 507 187 86 45 23 11 4 10
10 405 3 2 11 851 301 134 139 69 33 12 858 223 122 90 37 13 1419 241 86 40 25 10 10 14 1492 146 46 17 8 4 4 15 1509 37 20 12 6 3 5 3 16 1524 39 16 7 6 17 1575 252 89 51 23 14 20 18 18 1693 215 98 59 29 12 17 13 19 1727 103 40 29 5 6 6 20 1746 112 57 48 19 6 9 9 21 1749 63 39 28 12 2 5 5 22 1796 95 53 24 10 4 4 23 1836 28 15 6 3 24 1867 27 15 5 2 1 1 25 1868 46 13 8 4 6 4 4

230
Cont.. S.No. Bull
No. A.I. Conception Calving Daughters Retained upto Complete
Recording Total Females 1 Year 2 Year 3 Year Calving 26 1875 101 38 27 16 5 4 7 27 1893 224 127 55 25 2 8 8 6 28 1903 82 34 17 9 7 3 4 29 1913 127 35 25 11 8 3 6 30 1940 101 50 37 23 17 12 11 31 1964 127 66 65 39 14 14 14 32 1994 57 24 19 11 3 3 3 33 2045 221 81 52 19 2 21 2 4 34 2062 82 34 24 9 4 2 2 35 2073 310 132 128 57 68 35 24 36 2074 185 68 40 21 5 17 8 7 37 2083 184 74 36 13 7 4 38 2121 62 29 18 10 39 2133 282 171 94 49 3 26 13 13 40 2154 90 49 38 21 7 2 41 2184 384 178 109 46 42 19 26 42 2234 74 40 28 12 43 2250 217 99 79 34 17 10 6 44 2269 139 83 142 62 11 45 2304 183 85 62 29 22 46 2308 118 58 38 23 2 5 7 47 2331 270 92 70 32 12 10 48 2357 72 38 16 49 2363 216 85 52 26 1 8 6 50 2369 108 46 59 29 51 2371 464 168 52 2412 79 38 53 2417 162 54 2422 163 63 38 19 8 5 55 2479 150 42 28 10 5 7 7 56 2522 71 25 8 7 1 1 57 2582 394 147 88 47 4 20 16 58 2592 301 124 86 38 6 19 25 59 2717 34 11 6 4 60 2720 308 143 108 59 8 39 10 61 2910 202 79 46 25 22 8 62 2990 188 102 80 33 6 14 12 15 63 3103 309 135 94 44 15 12 10 64 3226 553 211 140 60 8 47 18 17 11 65 3255 540 270 188 108 29 17 12 2 66 3267 497 243 164 93 51 29 22 16 1 67 3591 540 261 242 103 28 14 28 22 9 68 3631 218 101 56 27 5 5 8 12 8 69 3964 512 289 208 103 41 11 70 4059 266 108 87 42 6 9

231
Cont.. S.No. Bull
No. A.I. Conception Calving Daughters Retained upto Complete
Recording Total Females 1 Year 2 Year 3 Year Calving 71 4093 648 300 217 107 25 72 4100 417 171 87 73 4324 234 49 74 4328 154 51 75 4439 670 355 300 109 7 76 4354 260 81 77 4363 257 38 78 4438 101 30 79 4506 282 117 57 30 6 18 9 80 4523 317 117 187 32 12 10 81 4619 183 74 37 20 2 14 14 82 4637 156 60 50 15 1 6 6 83 4640 190 76 48 14 4 12 8 84 4807 82 42 17 14 4 8 7 85 4813 255 107 61 29 9 43 14 86 4865 325 109 55 25 12 9 87 4915 389 152 63 33 6 14 14 88 5049 120 49 41 17 2 20 8 89 5054 435 200 107 45 13 21 20 90 5112 706 292 181 82 12 56 30 91 5197 176 89 72 42 11 30 11 92 5218 765 370 246 137 8 41 28 93 5312 64 23 16 6 3 1 94 5396 200 93 73 33 10 10 14 24 14 95 5414 515 176 173 96 21 18 28 15 96 5475 62 36 35 16 97 5489 1271 562 448 199 29 74 50 12 10 98 5496 736 248 301 140 51 42 40 7 3 99 5516 966 429 314 162 20 53 36 7 4
100 5604 61 18 32 13 101 5710 746 224 338 170 118 18 18 102 5720 1057 267 417 212 161 82 18 103 5943 563 244 193 84 46 11 1 104 6007 260 143 105 6014 1598 505 576 283 10 106 6044 791 344 302 139 107 6066 67 25 16 10 4 108 6136 1474 545 608 308 34 8 109 6139 400 215 110 6290 164 93 111 6405 342 125
Total 32117 13052 9974 4743 762 608 805 882 652

232
ACTION PLAN FOR 2015 - 16 In order to bring more number of animals under the AI coverage and to retain most of the female progeny up to the completion of their first lactation, more farms in the vicinity of project area having relatively large herd size (5-15 breedable buffaloes) will be identified and included in the project. Efforts shall be made to improve the conception rate by balanced feeding through supplementation of mineral mixture offered to farmers as an incentive and by timely heat detection and proper time AI. The work of identification of progeny born in the field by ear tagging will continue and the progenies born will be properly identified. The farmers whose herds have been included in the project will be motivated through the provision of various incentives like offering of various technical inputs, treatment of infertile buffaloes, veterinary first aid, calf rallies for active participation in the performance recording and progeny testing programme. Necessary provision of funds for above activities should be made. The performance recording in terms of monthly recording of milk yield of the daughters and their dams shall continue. Finally the data generated on AI’s, conception rate, milk production and performance traits will be supplied to coordinating unit for analysis by employing suitable statistical tools. The elite buffaloes will be identified and mated with proven bulls for production of young bulls. There is need to develop modalities for procuring such superior young male calves for future breeding and providing necessary funds for procuring males.
Financial Statement for the year 2014-15 (Rs in Lakhs) Sanctioned as per R E Total ICAR Share
Released ICAR Share as per R E
Expenditure as per AUC Balance ICAR Share State Share
14.40 14.40 14.40 9.07399 -- 5.32601 A total of 3941 AI were performed in Murrah Buffaloes under field conditions during
2014-15 and as a result 51.58 % conception rate was obtained. The highest conception rate was observed in the month of Jan (56.48 %) and the lowest was in the month of Feb (49.69%). Across the villages, the highest conception rate was observed in Rindal (55.41%) and lowest was observed in the village Manglora (46.48%). A total of 1860 (955 male and 905 female) Murrah buffalo calves were born in the farmers’ herds and performance data on 183 daughters have been recorded for evaluation of bulls under field conditions. The total herd strength of registered females and the breedable females at different centers was 5988 and 4495 respectively. As many as 15 breeding bulls belonging to the 14th & 15th set were used for AI during the year.
Recommendations: Effort should be made to use all bulls simultaneously and in equal numbers for AI from each bull of the set for obtaining equal progenies. For retrieval of records from the farmers incentives should be given to the farmers & AI workers.
Project Co-ordinator’s observations on field performance

233
BULL CERTIFICATION LABORATORY, CIRB HISAR
Name of Project : Network project on Buffalo Improvement Name of the centre : Bull Certification laboratory, CIRB, Hisar Scheme code : 183/97, ASR dated 29.3.2001 PI : Dr S Khanna
Technical Programme : Screening of buffalo breeding bulls for the following infectious diseases: Tuberculosis Johnin Disease Brucellosis IBRT Leptospirosis Campylobacteriosis Trichomoniasis
The bulls are tested for the above mentioned diseases prior to entry into breeding programme. Targets : Bull certification Laboratory was established Network Project on Buffaloes with the
objective of health evaluation of male germ plasm and prevent the transmission of pathogenic transmission of microorganism through frozen semen and artificial insemination. Screening of XIIIth set of breeding bulls and future breeding bulls from XIVth set for the infectious Diseases viz. Tuberculosis, Johnin Disease, Brucellosis, IBRT, Leptospirosis, Campylobacteriosis and Trichomoniasis as per protocols as under:
Bulls to be tested for Test applied Tuberculosis Intradermal tuberculin, delayed hypersensitivity Johnin Disease Intradermal johnin, delayed hypersensitivity Brucellosis RBPT, Dot ELISA IBRT Dot ELISA Leptospirosis Dot ELISA Campylobacteriosis Microscopy, Agent identification Trichomoniasis Microscopy, Agent identification
During the period under report buffalo breeding bulls and future breeding bulls (Murrah), Nili Ravi bulls(Sub Campus Nabha), experimental males reared at CIRB Hisar, Farmer’s bulls and bulls spotted for purchase for CIRB Hisar were screened for various diseases as per MSP protocol. Out of 25 animals screened for Tuberculosis and Johnin diseases none was found reactive. Two out of 127 males (1.57 %) were found positive for brucellosis as tested by RBPT and ELISA .Out of 37 animals tested for detection and estimation of BHVI (causative agent of IBR) antibodies, 7 animal (18.97%) were found +ve using commercially available ELISA kit. Semen from these bulls was also got tested for presence of virus by RTPCR and all the samples were found –ve. Prepucial washings and smegma from 15 bulls were found negative for Campylobacteriosis fetus vuneralis and Trichomonas.

234
In addition to above, samples from the institute’s herd and other centers under Network are also received for testing against above mentioned diseases.
During the period, bulls of Murrah, NiliRavi breed and bulls of farmers were tested for
various diseases i.e. Tuberculosis, Johnin Disease, Brucellosis, IBRT, Leptospirosis, Campylobacteriosis and Trichomoniasis. In addition, experimental animals from CIRB, bulls spotted for purchase were also tested.
Recommendation:
1. All the animals of different participating herds be tested and evaluated periodically to Ensure disease free semen production and availability.
2. The laboratory should also ensure that all the centres are producing disease free frozen semen as per MSP
Project Co-ordinator’s observations on Bull Certification Laboratory

235
SUMMARY OF RESEARCH ACHIEVEMENTS AND
PROGRESS OF THE PROJECT Selection and use of Breeding Bulls for Murrah breed
From July 93 till date test mating from 14 sets of bulls have been completed and 15th set be operational from July 2014. Brief summary of the duration, the number of bulls, average of the dam’s best yield and highest dam’s yield in each set is shown below. Fifteen sets of bulls used under Network Project on Buffalo since July 1993. Set No.
Duration
Centrewise No. of bulls Total Bull
Av. of 305 day or less dams best yield (kg)
Highest dam 305 day yield (kg)
305 day or less herd average ( kg )
CIRB
NDRI
GADV
ASU
HAU
NDUA
T
IVRI
V Gudm
1. July, 1993 to
Dec., 1994 2 9 0
11 3050 4114 1820/501
2. Jan., 1995 to June, 1996
4 5 6 15 3002 3898 1920/487 3. July, 1996 to
Dec., 1997 8 5 2 15 2876 3275 2053/476
4. Jan., 1998 to June, 1999
5 4 5 14 2999 3401 1973/457 5. July, 1999 to
Dec., 2000 6 5 4 15 3120 3898 1943/551
6. Jan., 2001 to June 2002
5 5 4 2 16 3055 3898 1972/562 7 July 2002 to
Dec., 2003 5 2 4 1 12 2928 3544 2017/505
8. Jan., 2004 to June 2005
5 5 4 2 16 2928 3690 2056/511 9. July 2005 to
Dec. 2006 4 5 5 1 15 2923 3336 2008/458
10. Jan., 2007 to June 2008
3 1 5 1 3 1 14 2829 3369 2130/509 11. July 2008 to
Dec., 2009 4 4 3 1 1 1* 14 2792 3051 2046/483
12. Jan., 2010 to June 2011
1 3 3 1 3** 11 3362 5192 2115/384 13. July 2011 to
Dec., 2012 2 1 3 2 8 3205 3805 2199/380
14. Jan., 2013 to June 2014
4 4 3 1 12 3451 4636 2356/288 15. July, 2014 to
Dec., 2015 6 5 4 15 3350 4636 2361/335
* bulls from Deedwadi ** Two from Redhu Farm

236
List of bulls selected for 15th set (Murrah Breed) These bulls shall be used from Ist July 2014 for test mating at Murrah centres and field units
Sr. No.
Bull No.
Location Date of Birth
Dam No.
Sire No./ Set
No Dam’s
best lact. 305 day or less
yield (kg)
Dam’s 305 day or less
Av. yield (kg)
Bull’s expected BV
Health status (TB/JD/B/ IBR/Trich/ Lept) /Test
date 1. 4324 CIRB 19-04-11 4323
(Pur) UK 3605 3600/2 2632 ve /120614
2. 4354 CIRB 05-09-11 4353 (Pur)
UK 3528 3179/2 2556 ve /100414 3. 4363 CIRB 24-09-11 3428 4915 PT 3068 2397/4 2416 ve /120614 4. 4403 CIRB 04-01-12 3351 R10 XII 2981 2620/3 2462 ve /120614 5. 4438 CIRB 20-03-12 4437
(Pur) UK 3222 3222/2* 2521 ve /120614
6. 4328 CIRB 14-05-11 3147 220 2989 (4) 2477/6 - ve /120614 7. M2371 GADVASU 30-08-10 1794 1796 3053 2616/12 2475 ve /050514 8. M2412 GADVASU 24-04-11 2467 220 2998 2998/1 2493 ve /050514 9. M2417 GADVASU 10-07-11 2487 2177 3565 3287/3 2601 ve /050514 10 M2429 GADVASU 15-08-11 2138 5710 3435 2779/4 2502 ve /050514 11 M2459 GADVASU 22-12-11 2489 1796 4636 3267/4 2613 ve /050514 12 6007 NDRI 15-09-08 5231 5396 X 3260 3260/1 2526 ve /190214 13 6139 NDRI 03-10-09 5650 4506 PT 2828 2828/1 2472 ve /190214 14 6290 NDRI 26-10-10 5517 4915 PT 4341 4135/3 2778 ve /190214 15. 6405 NDRI 26-01-12 486 NK 2743 2743/1 2461 ve /190214
Note : From each bull 10,000 semen doses are to be frozen. * Purchased in 2nd lactation
Health Evaluation and Semen Quality Testing During the period under report, apparently healthy buffalo breeding bulls of different
centres (CIRB Hisar, NDRI Karnal, GADVASU Ludhiana, IVRI Iztnagar) all of Murrah breed and proposed for XVth set for semen collection under Network Project on Buffalo were screened for TB,JD and Brucellasis.
Progeny Test Evaluation of Bulls
Data of daughters born from the 10th set of bulls which completed 1st lactation was compiled and progeny test evaluated. Bull no. 1693 from LUVAS, Hisar top ranked with sire index 2320.39 kg followed by bull no 2045 from GADVASU. Ludhiana having sire index 2320.29 kg with % superiority over least square mean (LSM) of 1.23 and 1.23. The pedigree detail and sire index of the 10th set are presented below.

237
Progeny Test evaluation of 10th set bulls (Murrah breed – January 2007 to June 2008) SN Bull
no. Location Date of
birth Dam No.
Sire No.
Dams best lactation
305 day or less yield
(kg)
Sire Index
No of daughter recorded per bull
% superiority
over LSM.
Rank
1. 1693 LUVAS 27-10-03 1050 392 3194 2320.39 13 1.23 1 2. 2045 GADVASU 24-02-04 1835 3567 3369 2320.29 48 1.23 II 3. 3103 CIRB 13-10-03 1144 392 2942 2319.10 15 1.18 III 4. 2990 CIRB 24-06-03 587/4.9 392 2655 2316.41 16 1.06 IV 5. 507 IVRI 14-12-03 341 1923 2572 2296.51 13 0.19 V 6. ND2 NDUAT 07-09-02 119 2583 2271.8 12 0.89 VI 7. 2074 GADVASU 02-09-04 1794 3567 3050 2270.51 27 0.94 VII 8. ND1 NDUAT 03-09-02 106 2644 2266.88 10 1.10 VIII 9. 2062 GADVASU 04-08-04 1819 1419 2672 2266.29 39 1.13 IX
10. 3631 CIRB Purchase 26-09-06 18.0 kg * 2265.54 24 1.16 X
11. 5396 NDRI 21-11-03 4635 4807 2617 2256.41 19 1.56 XI 12. 2083 GADVASU 20-09-04 1888 2363 3063 2250.03 29 1.84 XII 13 2073 GADVASU 01-09-04 1909 2184 2717 2239.06 43 2.32 XIII All herds first lactation 305 day or less day Least square mean of milk yield was 2292.12 kg based on 308 daughters. All centers are requested to use the semen of bull no. 1693 and 2045for elite mating from July 2014 onwards. * Peak yield
Progeny Tested bulls used under Network Project The top ranking 25 % progeny tested bulls (2 to 3 bulls from each set) used for elite/
nominated matings from set I to set X as selected from the centres are listed below. The pedigree details, sire index and availability of frozen semen doses from each bull are under. Centrewise frozen semen doses of progeny tested bulls (Murrah breed) Bull no. Set
No Name of
centre Date of Birth
Dam no.
Sire No.
Dam best lact.
Yield
Sire index % superiorty over
cotemporary daughter
Semen doses
available as on
31.3.2015 392 I CIRB 06-04-86 238 PQ1 2594 2118 22.80 121 761 II CIRB 20-11-90 474 366 2878 1967 09.37 5195 93 II CIRB 03-11-90 PQ1 22.0* 1890 03.96 90 829 II CIRB 04-07-91 597 766 2626 1876 03.53 6818
1153 III CIRB 13-08-93 701 896 2540 1957 12.27 2799 1061 III CIRB 24-09-92 769 896 2846 1913 09.50 5103 1933 VI CIRB 01-10-97 208 988 2650 1953 06.92 4119 1153 VI CCS HAU 29-09-96 618 759 2675 2121 13.31 2140 2422 VIII CIRB 19-08-00 1194 4337 3369 2057 9.40 3835 1693 X CCS HAU 27-10-03 1050 392 3194 2320.39 1.23** 1808
Total 32028 1354 III GADVASU 12-12-92 762 989 3088 1975 13.11 2072 1506 IV GADVASU 25-04-95 988 3018 2089 18.81 5347 1451 IV GADVASU 10-08-94 3567 3401 1945 10.44 3755 1437 IV GADVASU 04-04-94 797 636 3127 1904 08.11 4381

238
1796 VII GADVASU 10-02-00 1386 1506 3170 2092 15.81 4550 1875 VIII GADVASU 20-08-01 1669 558 2714 2300 24.89 3199 1994 IX GADVASU 16-06-03 1884 392 2938 2487 11.73 2931 2045 X GADVASU 24-02-04 1835 3567 3369 2320.29 1.23** 317
Total 26552 3108 I NDRI 29-04-86 2221 368 4114 1953 07.10 1066 3567 I NDRI 07-09-89 2408 2304 2877 1923 06.20 2183 4393 V NDRI 10-12-95 2762 1908 2143 22.29 2624 4371 V NDRI 23-10-95 2984 988 3258 1971 14.90 1225 4506 VI NDRI 31-10-96 3527 3551 3512 1972 09.29 2217 4915 VII NDRI 28-10-99 3521 2921 3437 2116 17.26 2306 4813 VIII NDRI 17-01-99 3818 3966 3016 2101 12.59 989 5258 IX NDRI 01-08-02 4066 1706 3305 2466 10.52 2101
Total 14711 Grand Total 73291
* Peak yield ** analyzed by Harvey model VIII Semen freezing and balance stock for bulls under test Centre wise test bulls of Murrah breed as on 31-03-2015 at various centres
CIRB NDRI GADVASU Bull No. Set
No No of semen
doses Bull No.
Set No
No of semen doses
Bull No.
Set No
No of semen doses
3226 XI 4108 5414 XI 3604 2133 XI 1689 3255 XI 2870 5489 XI 3459 2148 XI 2159 3267 XI 4135 5496 XI 2184 2154 XI 3586
12 (HAU) XI 5084 5516 XI 3557 2176 XII 3256 3591 XI 4435 5720 XII 4042 2177 XII 3708 3598 XII 5214 5710 XII 4075 2185 XII 2084
183 (HAU) XII 5850 5604 XII 2951 2234 XIII 1360 R-10 XII 1851 5943 XIII 4197 2269 XIII 1226 R-11 XII 1078 6014 XIV 4868 2304 XIII 4113 4059 XIII 6136 6044 XIV 4828 2357 XIV 6861 3964 XIII 4627 6136 XIV 6756 2369 XIV 8503 4439 XIV 8650 6007 XV 3003 2371 XV 6443 4093 XIV 8852 6139 XV 4227 2412 XV 6680 4100 XIV 9218 6290 XV 2324 2417 XV 8955 4196 XIV 8520 6405 XV 625 2429 XV 7795 4324 XV 13040 54700 2459 XV 7335 4354 XV 6594 75753 4438 XV 7878 54700 4363 XV 5944 75753 4403 XV 3584 125909 4328 XV 8241
125909 Grand Total 256362
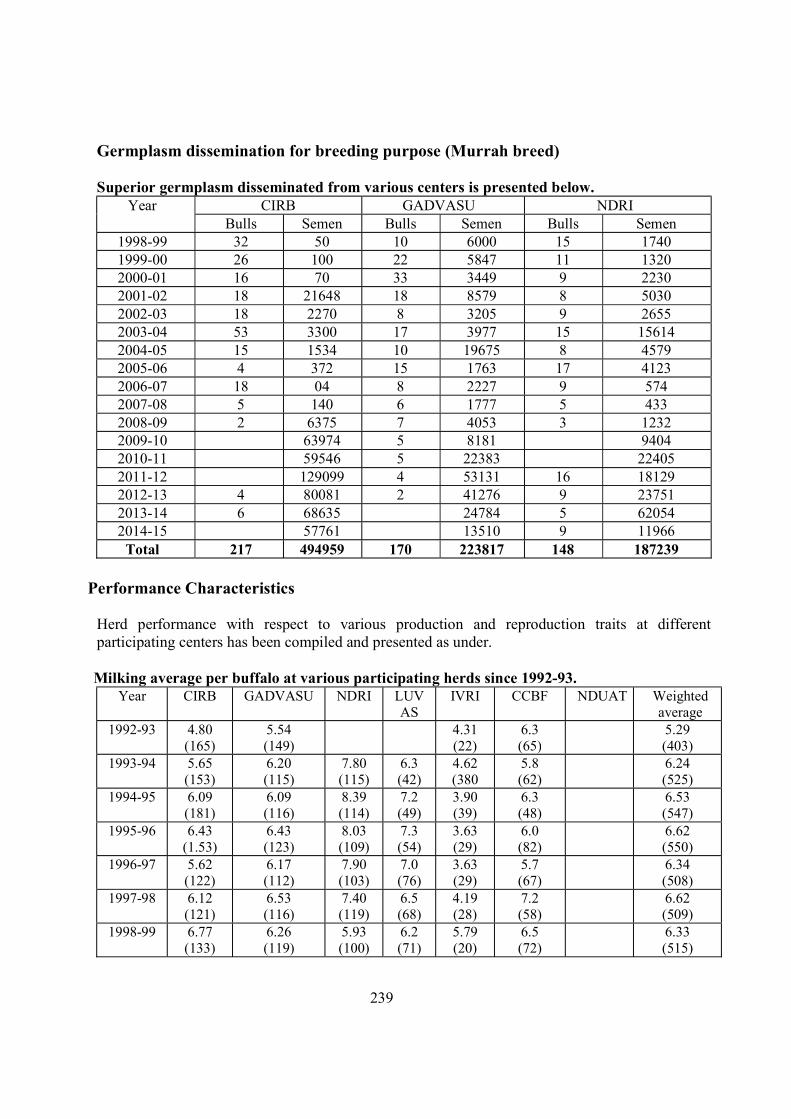
239
Germplasm dissemination for breeding purpose (Murrah breed)
Superior germplasm disseminated from various centers is presented below.
Year CIRB GADVASU NDRI Bulls Semen Bulls Semen Bulls Semen
1998-99 32 50 10 6000 15 1740 1999-00 26 100 22 5847 11 1320 2000-01 16 70 33 3449 9 2230 2001-02 18 21648 18 8579 8 5030 2002-03 18 2270 8 3205 9 2655 2003-04 53 3300 17 3977 15 15614 2004-05 15 1534 10 19675 8 4579 2005-06 4 372 15 1763 17 4123 2006-07 18 04 8 2227 9 574 2007-08 5 140 6 1777 5 433 2008-09 2 6375 7 4053 3 1232 2009-10 63974 5 8181 9404 2010-11 59546 5 22383 22405 2011-12 129099 4 53131 16 18129 2012-13 4 80081 2 41276 9 23751 2013-14 6 68635 24784 5 62054 2014-15 57761 13510 9 11966
Total 217 494959 170 223817 148 187239 Performance Characteristics
Herd performance with respect to various production and reproduction traits at different participating centers has been compiled and presented as under.
Milking average per buffalo at various participating herds since 1992-93.
Year CIRB GADVASU NDRI LUVAS
IVRI CCBF NDUAT Weighted average
1992-93 4.80 (165)
5.54 (149)
4.31 (22)
6.3 (65)
5.29 (403)
1993-94 5.65 (153)
6.20 (115)
7.80 (115)
6.3 (42)
4.62 (380
5.8 (62)
6.24 (525)
1994-95 6.09 (181)
6.09 (116)
8.39 (114)
7.2 (49)
3.90 (39)
6.3 (48)
6.53 (547)
1995-96 6.43 (1.53)
6.43 (123)
8.03 (109)
7.3 (54)
3.63 (29)
6.0 (82)
6.62 (550)
1996-97 5.62 (122)
6.17 (112)
7.90 (103)
7.0 (76)
3.63 (29)
5.7 (67)
6.34 (508)
1997-98 6.12 (121)
6.53 (116)
7.40 (119)
6.5 (68)
4.19 (28)
7.2 (58)
6.62 (509)
1998-99 6.77 (133)
6.26 (119)
5.93 (100)
6.2 (71)
5.79 (20)
6.5 (72)
6.33 (515)

240
1999-00 6.85 (137)
6.26 (109)
6.60 (90)
5.2 (60)
5.77 (23)
7.4 (98)
6.55 (521)
2000-01 6.68 (148)
6.70 (105)
6.65 (104)
6.7 (55)
5.42 (30)
6.5 (84)
6.58 (523)
2001-02 6.59 (147)
7.09 (94)
6.26 (90)
7.47 (48)
5.82 (32)
6.3 (81)
6.61 (492)
2002-03 6.27 (143)
7.22 (109)
6.23 (73)
7.5 (47)
4.94 (30)
5.9 (68)
6.47 (470)
2003-04 6.49 (151)
7.01 (108)
6.36 (80)
7.30 (68)
5.94 (37)
6.2 (57)
6.62 (501)
2004-05 6.39 (154)
7.33 (91)
7.39 (111)
7.70 (66)
5.99 (38)
6.70 (47)
6.95 (509)
2005-06 6.57 (151)
7.36 (74)
7.05 (107)
7.70 (63)
6.14 (46)
6.7 (39)
6.92 (479)
2006-07 6.45 (137)
7.03 (81)
6.70 (100)
7.8 (65)
6.15 (41)
6.8 (48)
6.52 (29)
6.78 (501)
2007-08 6.64 (146)
6.90 (70)
6.80 (104)
7.60 (66)
5.98 (62)
6.92 (22)
6.75 (470)
2008-09 6.50 (133)
7.07 (78)
7.09 (64)
7.10 (62)
6.69 (53)
6.4 (59)
6.66 (22)
6.82 (412)
2009-10 7.01 (106)
7.62 (83)
7.32 (91)
6.8 (69)
6.68 (45)
5.39 (27)
7.05 (421)
2010-11 7.45 (109)
7.21 (88)
5.83 (96)
7.3 (64)
5.88 (47)
5.60 (21)
6.75 (425)
2011-12 7.83 (110)
7.56 (88)
6.79 (66)
5.82 (41)
KVASU Mamnoor 7.26 (305)
2012-13 7.74 (109)
7.74 (78)
7.35 (90)
5.66 (39)
4.82 (13)
4.70 (17)
7.15 (346)
2013-14 8.01 (105)
7.98 (61)
7.80 (101)
9.40 (62)
5.85 (45)
5.54 (19)
5.25 (11)
7.73 (404)
2014-15 8.25 ( 110)
7.97 (54)
8.05 (115)
8.70 (64)
6.80 (43)
-- 5.90 (22)
7.95 (408)

241
Average 305 day or less milk yield at various participating herds since 1992 – 93. Year CIRB GADV
ASU NDRI LUVAS IVRI CCBF/
KVASU NDUAT/ Mamnoor
Weighted average
1992-93 1508±34 (137)
1730 (138)
1458±48 (34)
1899.1 1602 (309)
1993-94 1686±46 (148)
1948 (144)
2351.8 (137)
1818.8 1537±49 (28)
1746.0 1959 (457)
1994-95 1787±0 (206)
1877 (121)
2270.1 (128)
1912.7 1536±40 (32)
1896.7 1920 (487)
1995-96 1855±42 (147)
2008 (126)
2576.1 (106)
1987.5 1457±51 (27)
1950.4 2053 (476)
1996-97 1775±45 (173)
1948 (125)
2423.1 (105)
1880.8 1629±76 (20)
1714.1 1965 (498)
1997-98 1688±37 (123)
1995 (98)
2191.2 (128)
2103.7 1715±95 (23)
2006.8 1973 (455)
1998-99 1702±33 (153)
2101 (125)
2032.7 (112)
1964.7 1980±97 (22)
2179.7 1943 (551)
1999-00 2042±31 (141)
2041 (114)
1822.4 (102)
1688.7 2026±98 (18)
2134.9 1939 (439)
2000-01 1914±36 (173)
2032 (103)
2019 (126)
2183.1 1898±147 (20)
1875.0 1972 (562)
2001-02 1898±35 (152)
2175 (112)
1963±61 (91)
2119±46 (50)
2102±75 (19)
2000.0 (81)
2017 (505)
2002-03 1902±32 (148)
2144 (105)
2000.6 (81)
2522±13 (46)
2362.5 (55)
1789.1 (76)
2056 (511)
2003-04 1837±31 (148)
2233 (111)
1897 (29)
2162±42 (75)
2103±118 (26)
1881.9 (6)
2033 (395)
2004-05 1886±33 (167)
2270 (106)
2025 (98)
2134±44 (61)
2369±128 (10)
2114 (26)
2062 (494)
2005-06 1921±38 (149)
2327 (78)
2159 (142)
2252±47 (77)
2218±89 (32)
2085 (32)
2130 (509)
2006-07 1882±32 (170)
2235 (91)
2054 (111)
2261±44 (75)
2412±89 (27)
2139 (54)
1941±77 (27)
2079 (555)
2007-08 1891±34 (127)
2176±60 (67)
2094 (127)
2130±44 (80)
2525±109 (28)
1988±83 (24)
2097 (453)
2008-09 1926 (138)
2141±48 (88)
2256 (86)
2041±48 (76)
2209±106 (16)
1822 (57)
2078±89 (22)
2076 (426)
2009-10 1995 (102)
2271±53 (67)
2222 (84)
1858±33 (84)
2570±92 (26)
2153±107 (20)
2110 (383)
2010-11 2247 (113)
2470±68 (81)
2015 (130)
2042±48 (66)
2136±63 (56)
2092±54 (22)
2172 (468)
2011-12 2374 (116)
2306±72 (87)
2192 (67)
2277±83 (49)
KVASU Mamnoor 2302 (319)
2012-13 2335±46 (110)
2528±55 (75)
2256 (83) 2242±108 (20)
1698±219 (11)
1560 (5)
2319 (304)
2013-14 2291±58 (98)
2509±67 (55)
2431 (82) 2808±43 (65)
2038±62 (47)
1728±158 (17)
1753 (13)
2367 (377)
2014-15 2355±48 (110)
2674±82 (46)
2224 (124)
2584±49 (62)
2136±52 (53)
1626 (11)
2338 (406)

242
Average Age at first calving at various participating herds
Year CIRB GADVASU
NDRI LUVAS IVRI CCBF NDUAT Weighted average
1993-94 59.1±1.6 (48)
46.7 (24)
45.5 (44)
51.6 39.4±3.0 (7)
43.0 50.7 (123)
1994-95 55.3±1.3 (48)
47.5 (37)
46.0 (37)
51.3 38.3±1.7 (10)
48.0 49.2 (132)
1995-96 55.3±1.5 (22)
49.4 (43)
46.8 (27)
51.9 (26)
42.1±3.4 (14)
51.0 49.6 (132)
1996-97 47.6±1.6 (23)
49.4 (34)
46.8 (27)
47.3 (44)
42.1±3.4 (4)
51.0 47.6 (132)
1997-98 45.5±0.5 (49)
45.0 (45)
44.8 (34)
48.7 (28)
40.1±3.4 (6)
51.0 45.6 (162)
1998-99 50.0±0.01 (57)
47.0 (34)
46.2 (54)
47.3 (22)
43.4±2.3 (8)
54.0 47.6 (178)
1999-00 46.2±1.0 (54)
42.0 (54)
42.6 (29)
49.4 (15)
48.8±7.0 (6)
55.0 (10)
45.1 (168)
2000-01 46.2±1.2 (45)
44.4 (27)
42.4±0.7 (42)
50.6±2.0 (17)
42.4±2.8 (4)
60.5 (11)
46.2 (146)
2001-02 49.8±0.8 (51)
44.7±1.4 (32)
44.0±1.0 (34)
46.7±4.9 (14)
44.4±2.6 (11)
45.0 (12)
46.4 (154)
2002-03 47.83±0.5 (61)
40.2±1.1 (39)
44.0±1.5 (20)
47.0±41.2 (27)
41.2±2.9 (4)
50 (15)
45.47 (166)
2003-04 50.52±0.8 (77)
36.8±1.0 (23)
43.87 (62)
40.37±12.4 (40)
41.82±3.2 (8)
48 (11)
44.94 ( 221 )
2004-05 48.18±0.8 (76)
41.7±1.7 (27)
43.4±0.9 (47)
40.0±3.6 (26)
42.5±1.7 (8)
46 (16)
44.83 (200)
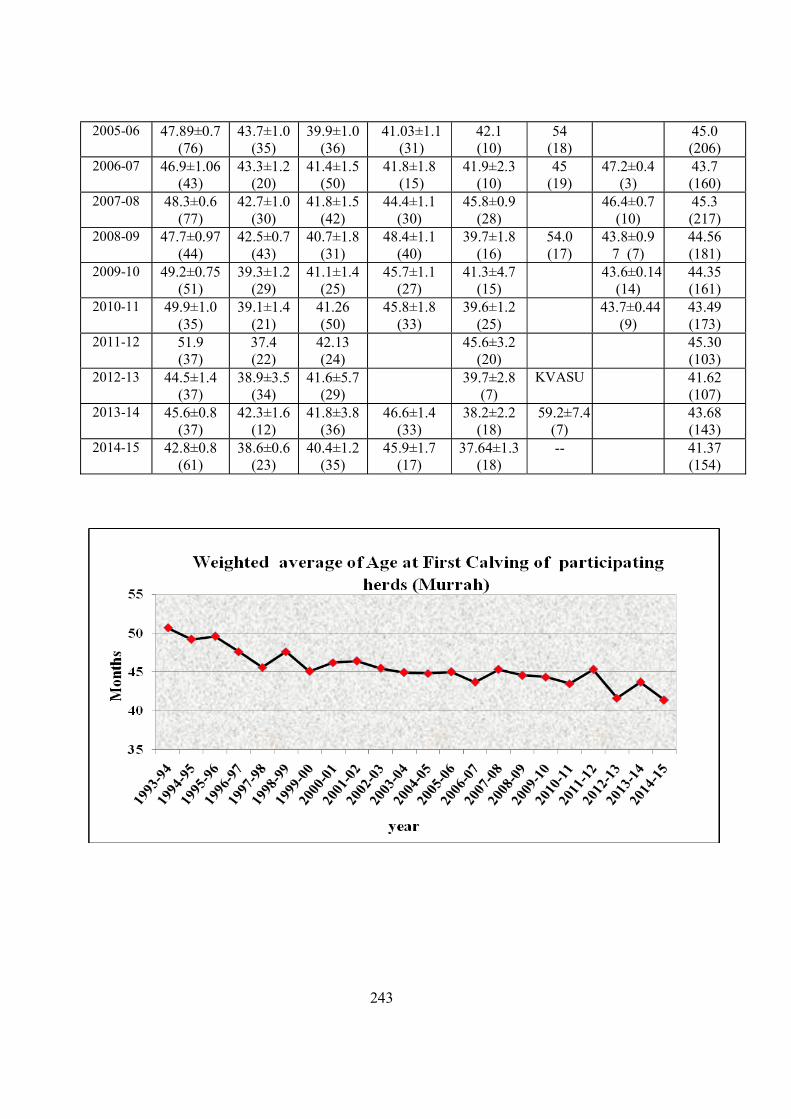
243
2005-06 47.89±0.7 (76)
43.7±1.0 (35)
39.9±1.0 (36)
41.03±1.1 (31)
42.1 (10)
54 (18)
45.0 (206)
2006-07 46.9±1.06 (43)
43.3±1.2 (20)
41.4±1.5 (50)
41.8±1.8 (15)
41.9±2.3 (10)
45 (19)
47.2±0.4 (3)
43.7 (160)
2007-08 48.3±0.6 (77)
42.7±1.0 (30)
41.8±1.5 (42)
44.4±1.1 (30)
45.8±0.9 (28)
46.4±0.7 (10)
45.3 (217)
2008-09 47.7±0.97 (44)
42.5±0.7 (43)
40.7±1.8 (31)
48.4±1.1 (40)
39.7±1.8 (16)
54.0 (17)
43.8±0.97 (7)
44.56 (181)
2009-10 49.2±0.75 (51)
39.3±1.2 (29)
41.1±1.4 (25)
45.7±1.1 (27)
41.3±4.7 (15)
43.6±0.14 (14)
44.35 (161)
2010-11 49.9±1.0 (35)
39.1±1.4 (21)
41.26 (50)
45.8±1.8 (33)
39.6±1.2 (25)
43.7±0.44 (9)
43.49 (173)
2011-12 51.9 (37)
37.4 (22)
42.13 (24)
45.6±3.2 (20)
45.30 (103)
2012-13 44.5±1.4 (37)
38.9±3.5 (34)
41.6±5.7 (29)
39.7±2.8 (7)
KVASU 41.62 (107)
2013-14 45.6±0.8 (37)
42.3±1.6 (12)
41.8±3.8 (36)
46.6±1.4 (33)
38.2±2.2 (18)
59.2±7.4 (7)
43.68 (143)
2014-15 42.8±0.8 (61)
38.6±0.6 (23)
40.4±1.2 (35)
45.9±1.7 (17)
37.64±1.3 (18)
-- 41.37 (154)

244
Average Service period at various participating herds Year CIRB GADVA
SU NDRI LUVAS IVRI CCBF NDUAT Weighted
average 1992-93 304±15
(96) 207
(100) 120±33
(8) 115 249
(204) 1993-94 312±158
(158) 228
(105) 148 (97)
107.5 101±16 (10)
165 239 (370)
1994-95 202±15 (105)
206 (96)
119 (70)
163.1 77±5 (9)
159 179 (280)
1995-96 193±10 (149)
218 (105)
115 (72)
135.0 100±12 (12)
132 175 (391)
1996-97 182±10 (149)
196 (76)
114 (66)
107.0 125±11 (7)
204 158 (361)
1997-98 175±14 (106)
248 (94)
97 (59)
107.7 83±06 (11)
175 167 (325)
1998-99 137±09 (121)
232 (81)
118 (63)
108.7 153±25 (11)
186 159 (323)
1999-00 138±09 (104)
213 (59)
159 (82)
148.3 190±28 (16)
187 162 (310)
2000-01 146±09 (151)
197 (81)
107±14 (53)
146.0 165±22 (17)
163 153 (370)
2001-02 146±11 (125)
202±14 (83)
123±9 (77)
147±14 (31)
134±25 (12)
126 (69)
150 (397)
2002-03 133±9 (126)
133±9 (95)
141±12 (59)
165±11 (47)
405±96 (5)
102 (76)
135.4 (408)
2003-04 151±10 (142)
160 (107)
131.65 (117)
87.6±8.4 (42)
108±15.5 (19)
48 (11)
134.7 ( 432 )
2004-05 111±7 (100)
140 (80)
126±10 (93)
96±6.0 (52)
150±16 (30)
160 (87)
130 (442)
2005-06 184±12 (112)
143 (65)
149±12 (68)
148±8.5 (128)
180±28 (54)
253 (32)
167 (459)
2006-07 183±11 (113)
166±15 (69)
131±10 (80)
165±12 (60)
139±15 (40)
151 (37)
99±12.7 (22)
156 (421)
2007-08 159±11 (113)
147±12 (53)
119±11 (84)
165±16 (57)
115±7.5 (62)
109±15.6 (22)
140 (391)
2008-09 171±12 (80)
142±9 (90)
131±22 (61)
139±13 (54)
152±12 (48)
191 (63)
91±17.5 (22)
144 (355)
2009-10 212±17 (77)
151±10 (76)
146±22 (62)
157±12 (68)
122±11 (59)
130±14.6 (17)
159 (359)
2010-11 186±14 (80)
154±12 (94)
145 (76)
155±12 (38)
175±16 (35)
140±3.9 (15)
161 (338)
2011-12 181 (80)
136 (65)
121 (87)
153±216 (29)
KVASU 153
Mamnoor 147 (261)
2012-13 174±12 (72)
151±13 (53)
124±27 (69)
213±26 (30)
298±42 (11)
172 (9)
165 (244)
2013-14 190±11 (86)
159±11 (67)
128±11 (73)
118±9 (39)
140±13 (39)
322±115 (6)
143±11 (14)
155 (324)
2014-15 168±8 (88)
160±18 (40)
135±19 (71)
117±11 (52)
124±12 (55)
-- 141±17 (34)
143 (340)

245
Average calving interval at various participating herds
Year CIRB GADVASU NDRI LUVAS IVRI CCBF NDUAT Weighted average
1992-93 489±16 (42)
510 (100) 404±22 (8)
498 495 (250)
1993-94 625±10 (161)
532 (106) 428 (98)
406±17 (3)
480 544 (368)
1994-95 527±10 (116)
512 (96)
428 (70)
459 377±08 (20)
523 489 (302)
1995-96 501±09 (152)
526 (105) 423 (72)
456 (40)
401±16 (7)
539 486 (376)
1996-97 473±09 (152)
510 (76)
423 (66)
408 (76)
424±23 (7)
510 458 (377)
1997-98 491±10 (118)
553 (94)
395 (60)
389 (55)
392±13 (11)
574 431 (338)
1998-99 455±10 (126)
553 (87)
424 (62)
417 (46)
438±15 (10)
522 469 (331)
1999-00 451±08 (120)
518 (63)
435 (52)
459±34 (49)
422±21 (11)
513 463 (295)
2000-01 454±09 (154)
511 (82)
408±21 (56)
479±33 (25)
411±13 (9)
491 468 (427)
2001-02 456±11 (135)
496±15 (84)
428±13 (43)
457±14 (31)
440±24 (12)
445 (69)
460 (374)
2002-03 440±9 (130)
463±13 (95)
406±16 (31)
472±11 (47)
585±69 (4)
501 (76)
461 (383)
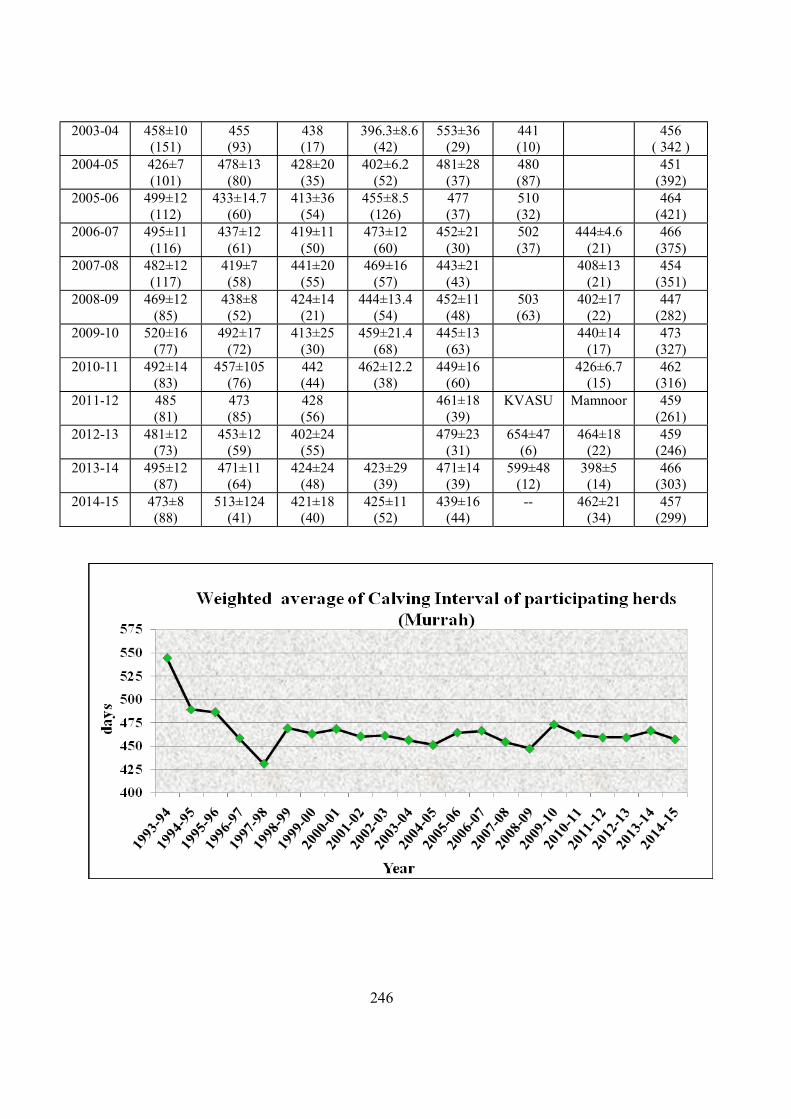
246
2003-04 458±10 (151)
455 (93)
438 (17)
396.3±8.6 (42)
553±36 (29)
441 (10)
456 ( 342 )
2004-05 426±7 (101)
478±13 (80)
428±20 (35)
402±6.2 (52)
481±28 (37)
480 (87)
451 (392)
2005-06 499±12 (112)
433±14.7 (60)
413±36 (54)
455±8.5 (126)
477 (37)
510 (32)
464 (421)
2006-07 495±11 (116)
437±12 (61)
419±11 (50)
473±12 (60)
452±21 (30)
502 (37)
444±4.6 (21)
466 (375)
2007-08 482±12 (117)
419±7 (58)
441±20 (55)
469±16 (57)
443±21 (43)
408±13 (21)
454 (351)
2008-09 469±12 (85)
438±8 (52)
424±14 (21)
444±13.4 (54)
452±11 (48)
503 (63)
402±17 (22)
447 (282)
2009-10 520±16 (77)
492±17 (72)
413±25 (30)
459±21.4 (68)
445±13 (63)
440±14 (17)
473 (327)
2010-11 492±14 (83)
457±105 (76)
442 (44)
462±12.2 (38)
449±16 (60)
426±6.7 (15)
462 (316)
2011-12 485 (81)
473 (85)
428 (56)
461±18 (39)
KVASU Mamnoor 459 (261)
2012-13 481±12 (73)
453±12 (59)
402±24 (55)
479±23 (31)
654±47 (6)
464±18 (22)
459 (246)
2013-14 495±12 (87)
471±11 (64)
424±24 (48)
423±29 (39)
471±14 (39)
599±48 (12)
398±5 (14)
466 (303)
2014-15 473±8 (88)
513±124 (41)
421±18 (40)
425±11 (52)
439±16 (44)
-- 462±21 (34)
457 (299)

247
Average Fat % during the years
Murrah GADVASU NDRI CIRB LUVAS IVRI NDUAT SVVU KVASU Overall 2006-07 7.57
(82) 8.07 (99)
7.01 (130)
7.6 (37)
7.55 (71)
8.17 (27)
7.55 (446)
2007-08 7.31 (71)
7.92 (101)
7.03 (136)
7.70 (30)
7.99 (111)
8.02 (24)
7.58 (473)
2008-09 7.80 (78)
7.98 (787)
7.82 (1436)
7.3 (652)
8.19 (1244)
7.96 7.88 (4197)
2009-10 7.54 (79)
8.11 (1083)
7.70 (85)
6.8 (65)
7.97 (1008)
7.92 (20)
7.98 (2340)
2010-11 8.17 (87)
8.03 (1107)
7.81 (1257)
6.9 (783)
8.01 (1080)
7.99
7.18 (546)
7.69 (4860)
2011-12 7.99 (88)
8.19 (750)
7.66 (1257)
8.08 (924)
7.93 (3019)
2012-13 8.27 (83)
8.15 (1010)
7.66 (1240)
7.88 (872)
7.56 (196)
8.95 (12)
7.88 (3413)
2013-14 8.59 (61)
7.90 (101)
8.44 (1194)
6.80 (61)
7.89 (82)
8.20 (133)
7.80 (2423)
8.00 (4055)
2014-15 8.33 (61)
8.30 (116)
8.46 (1168)
7.20 (64)
7.87 (363)
8.15 (268)
-- 8.26 (2040)
Between breeds
Murrah Nili Ravi
Bhadawari Jaffara badi
Pandhar puri
Surti Godavari Swamp 2006-07 7.55
(446) 6.8
(118) 7.65 (34)
8.21 (34)
8.01 (25)
7.12 (34)
7.38 (47)
8.38 (12)
2007-08 7.58
(473) 6.70 (122)
8.09 (106)
8.25 (29)
8.03 (15)
7.25 (34)
7.00 (47)
7.67 (21)
2008-09 7.88 (4197)
6.9 (108)
8.09 (604)
8.61 (260)
8.04 (180)
7.33 (446)
7.73 (16)
2009-10 7.98 (2340)
6.9 (146)
8.02 (375)
8.02 (446)
8.04 (257)
7.5 (301)
7.64 (44)
8.52 (20)
2010-11 7.69 (4860)
6.8 (98)
8.20 (309)
8.01 (364)
8.03 (203)
8.06 (267)
8.91 (159)
2011-12 7.93 (3019)
7.3 (81)
8.03 (195)
8.03 (27)
8.03 (630)
7.93 (229)
9.23 (115)
2012-13 7.88 (3413)
7.62 (123)
8.16 (242)
8.24 (1632)
8.01 (545)
7.96 (240)
8.04 (155)
2013-14 8.00 (4055)
8.20 (109)
8.65 (309)
8.06 (34)
7.85 (187)
7.89 (226)
10.16 (184)
2014-15 8.265 (2040)
7.86 (115)
8.12 (340)
8.46 (386)
8.02 (289)
7.58 (364)
8.45 (62)

248
Total AI, Calving, PD, Conception and daughter’s milk recording in Field Units MURRAH BREED AI Pregnancy Total
calving Daughters born Daughters
Recorded GADVASU, Ludhiana 2006-07 3313 1178 755 357 59 2007-08 4015 1438 870 368 53 2008-09 4147 1622 1149 491 85 2009-10 5415 1878 1140 538 58 2010-11 6846 2289 1274 603 40 2011-12 7298 2814 1800 853 4 2012-13 8517 3463 2497 1155 - 2013-14 8014 3380 2831 1303 - 2014-15 8316 3810 2958 1447 - Total 55881 21872 15274 7115 299 CIRB, Hisar 2006-07 2102 1139 650 305 48 2007-08 2132 1104 694 341 58 2008-09 2176 1086 955 477 71 2009-10 2803 1450 1276 627 81 2010-11 3433 1743 787 377 56 2011-12 3308 1756 1103 557 1 2012-13 4204 2104 1247 553 - 2013-14 3962 1903 1079 517 - 2014-15 4129 1562* 103# 55# - Total 28249 13847 7894 3809 315 NDRI, Karnal 2006-07 2913 976 643 325 2007-08 2594 1212 710 333 20 2008-09 2529 1190 875 400 20 2009-10 2739 1377 918 440 66 2010-11 2747 1399 1140 517 149 2011-12 2995 1600 1086 503 37 2012-13 2905 1422 1159 569 138 2013-14 4419 2242 1225 560 221 2014-15 3941 2033 1860 905 183 Total 27782 13451 9616 4552 834 NDUAT Faizabad 2006-07 482 57 222 103 2007-08 372 122 143 61 2008-09 2009-10 1178 416 275 122 2010-11 3695 427 328 164 2011-12 Centre closed Total 5727 1022 968 450 SVVU Venkataramangudam 2010-11 282 67 21 8 Grand Total 117921 50259 33773 15934 1448
* Pregnancies confirmed upto March 15 against AI done till Dec 14; * Calving confirmed upto March 15 against AI done till Dec 14;

249
OTHER BREEDS Jaffarabadi (JAU, Junagadh) 2006-07 1600 647 188 88 2007-08 3651 1615 873 431 2008-09 3773 1297 1143 556 2009-10 3167 1443 1439 704 2010-11 3542 1602 1333 666 2011-12 3738 1603 1538 729 2012-13 4067 1776 1684 810 2013-14 2173 679 848 409 2014-15 4781 2150 1564 731 Total 30492 12812 10610 5124 Surti (LRS, Vallabhnagar) 2006-07 1637 506 411 162 36 2007-08 1811 542 420 184 17 2008-09 1804 604 502 218 11 2009-10 1975 671 529 224 9 2010-11 2038 681 458 203 - 2011-12 2023 520 475 226 - 2012-13 1897 583 497 198 - 2013-14 1591 555 410 158 - 2014-15 1534 455 17 4 - Total 16310 5117 3719 1577 73 Pandharpuri (MPKV, Kolhapur) 2006-07 3969 1530 770 382 45 2007-08 5299 2001 1254 554 47 2008-09 9349 4402 1246 666 61 2009-10 25106 9712 4273 1902 52 2010-11 22398 10379 6230 2186 63 2011-12 21181 9353 6110 2819 59 2012-13 4081 2183 3520 1623 15 2013-14 3766 2702 2800 1261 - 2014-15* 4329 1104 - - - Over all 99478 43366 26203 11393 342 Godavari, SVVU, Venkataramanngudem 2006-07 2167 530 271 124 2007-08 1436 619 428 202 2008-09 2009-10 196 32 86 40 Centre closed Total 3799 1181 785 366 Grand Total 150079 62476 41317 18460 415
* upto December of the year 14