nutrition policy in finland - thl
TRANSCRIPT
20/03/2012 20/03/2012 Nutrition policy in Finland / SM Virtanen 1
Nutrition policy in Finland
Suvi M. Virtanen, Professor
13.3.2012
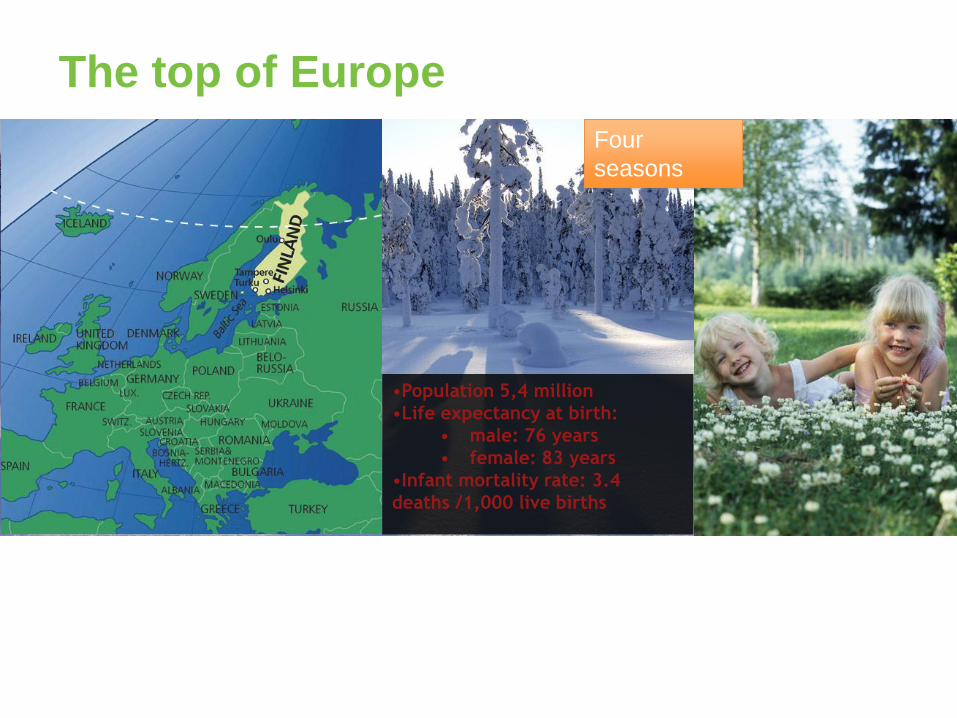
The top of Europe
•Population 5,4 million
•Life expectancy at birth:
• male: 76 years
• female: 83 years
•Infant mortality rate: 3.4
deaths /1,000 live births
Four
seasons
20/03/2012 20/03/2012 Nutrition policy in Finland / SM Virtanen 3
Main Emphasis in Nutrition Policy in Finland
• Historically (since 1940’s): preventing various deficiencies - e.g., free school lunches, fortification programmes
• Chronic disease prevention since 1970’s: reduction of blood cholesterol, blood pressure and cardiovascular diseases
• More recently: weight control and prevention of type 2 diabetes
5
20/03/2012 20/03/2012 Nutrition policy in Finland / SM Virtanen 4
How to influence?
• Research and monitoring
• Nutrition policy – collaboration between various actors
• Legislation
• Education (nutritionists, dietitians, nurses, doctors, teachers, food scientists)
• Nutrition recommendations and dietary guidelines
• Implementation programs of the recommendations and guidelines
• Fortification of foods
• Food production
• Catering services
20/03/2012 20/03/2012 Nutrition policy in Finland / SM Virtanen 5
National Nutrition Council • Public Nutrition Committee in 1936
• National Nutrition Council established in1954
• Appointed by the Ministry of Agriculture and Forestry
• Members are representatives of authorities handling nutrition, food safety, consumer, health promotion, catering, food industry, trade and agricultural issues
• Observes and improves nutritional situation in Finland - by making recommendations - by action programmes
• Promotes comprehensive nutritional risk monitoring
• Coordinates the action plan concerning nutrition in the Government resolution for promoting healthy diet and physical activity
• Observes the development of nutrition policy in Europe
20/03/2012 20/03/2012 Nutrition policy in Finland / SM Virtanen 6
Nutrition recommendations and guidelines
• Finnish nutritional recommendations are based on the Nordic recommendations, published 4 times since 1981
• Additional recommendations for special purposes:
– catering services, schools
– hospitals and nursing homes
– prisons, armed forces
– athletes
– infants and young children
– pregnant and lactating mothers
– beverage use recommendations
– vitamin D supplementation recommendations

20/03/2012
Long history of school lunches
• 1948: free lunch for all pupils at elementary schools
• 1970: guidelines for the quality of school lunches
• 2007: special recommendations for school lunches
• Today: law guarantees free, adequate, balanced lunch for all pupils at primary and secondary schools and upper secondary and vocational schools on every school day

20/03/2012
Why to provide free school lunches?
• The aim is to promote pupil’s well-being, growth and development
• Good lunch helps to concentrate during the school day
• School meals are important for nutrition and also for education
• Not only food, also a social event
• Meals served at schools are model of nutritionally balanced diet which helps to develope healthy eating habits
20/03/2012 8
20/03/2012
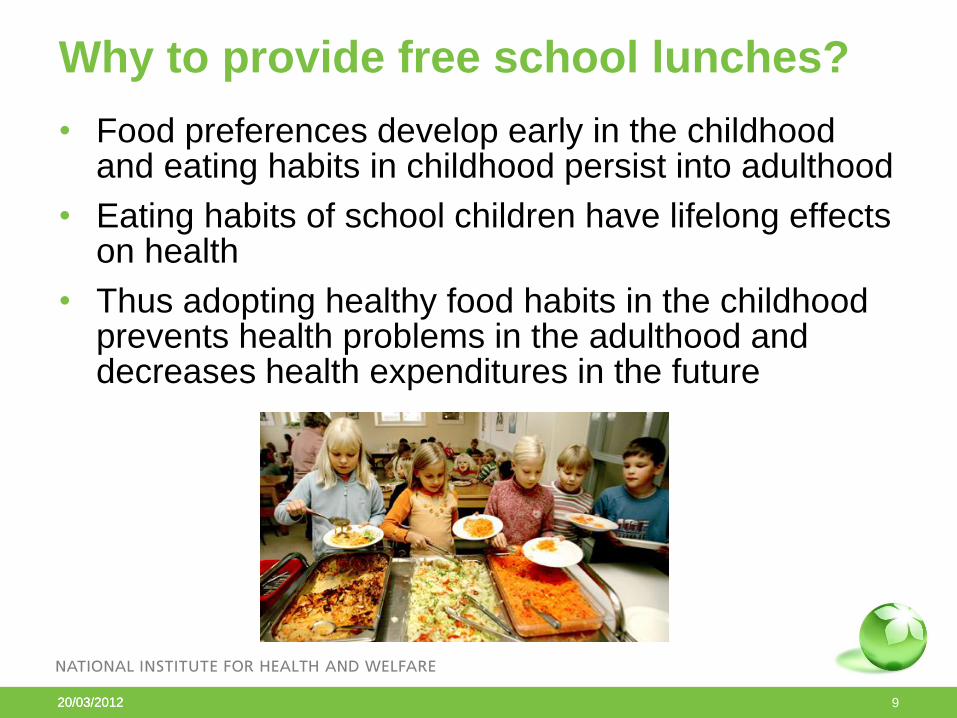
Why to provide free school lunches?
• Food preferences develop early in the childhood and eating habits in childhood persist into adulthood
• Eating habits of school children have lifelong effects on health
• Thus adopting healthy food habits in the childhood prevents health problems in the adulthood and decreases health expenditures in the future
20/03/2012 9
20/03/2012
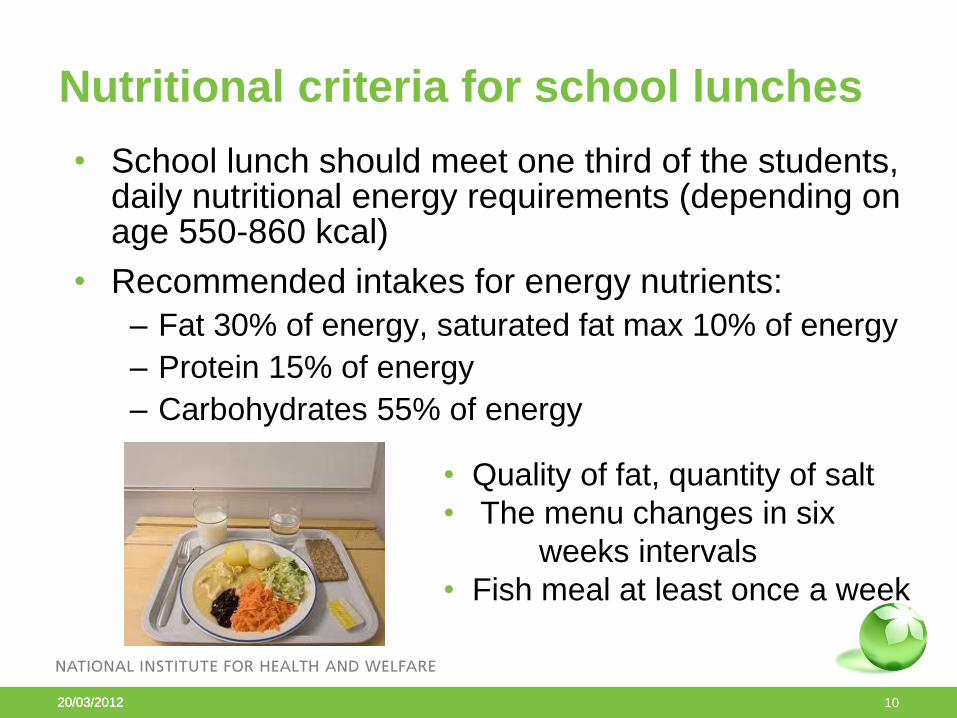
Nutritional criteria for school lunches • School lunch should meet one third of the students,
daily nutritional energy requirements (depending on age 550-860 kcal)
• Recommended intakes for energy nutrients:
– Fat 30% of energy, saturated fat max 10% of energy
– Protein 15% of energy
– Carbohydrates 55% of energy
20/03/2012 10
• Quality of fat, quantity of salt
• The menu changes in six
weeks intervals
• Fish meal at least once a week
20/03/2012 20/03/2012 Nutrition policy in Finland / SM Virtanen 11
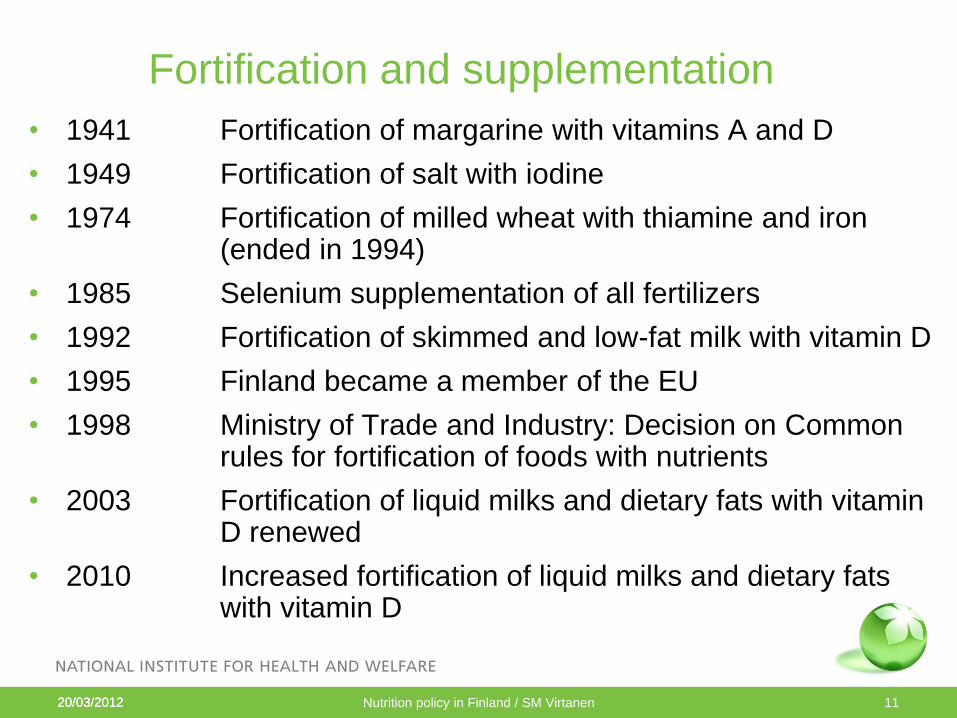
Fortification and supplementation
• 1941 Fortification of margarine with vitamins A and D
• 1949 Fortification of salt with iodine
• 1974 Fortification of milled wheat with thiamine and iron (ended in 1994)
• 1985 Selenium supplementation of all fertilizers
• 1992 Fortification of skimmed and low-fat milk with vitamin D
• 1995 Finland became a member of the EU
• 1998 Ministry of Trade and Industry: Decision on Common rules for fortification of foods with nutrients
• 2003 Fortification of liquid milks and dietary fats with vitamin D renewed
• 2010 Increased fortification of liquid milks and dietary fats with vitamin D
20/03/2012
Monitoring the Finnish Diet
• Food Balance Sheets since 1950s (Ministry of Agriculture and Forestry) – per capita data
• National Health Behaviour Questionnaires (AVTK) – annual data since 1978 (questionnaire data)
• FINRISK/Findiet Surveys every 5 years: large population surveys (2007: 6000/2000 persons)
20/03/2012
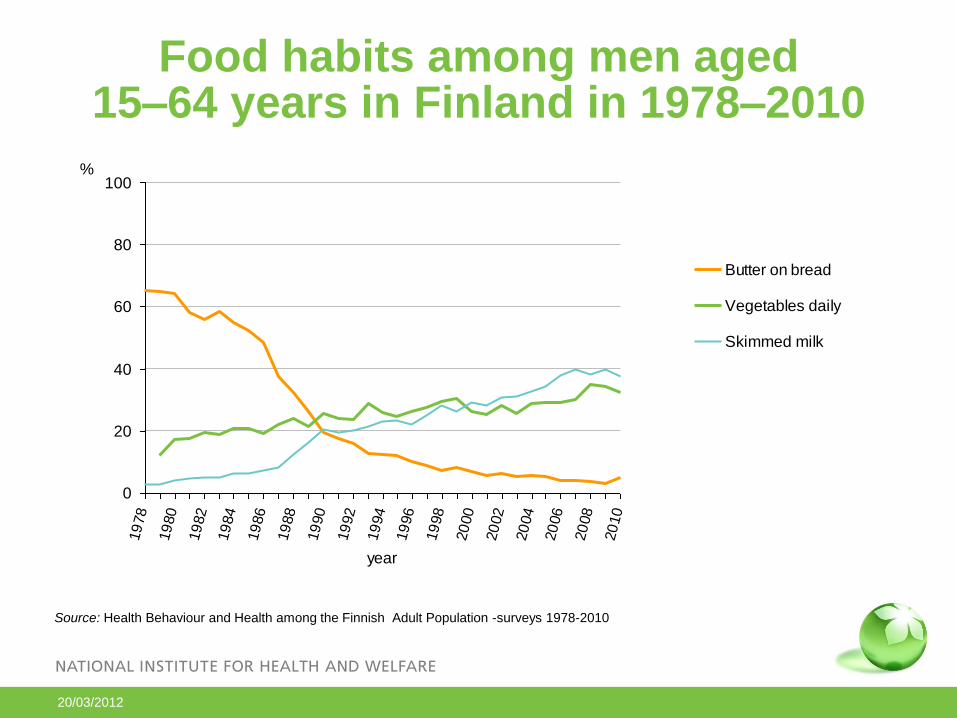
Food habits among men aged 15–64 years in Finland in 1978–2010
Source: Health Behaviour and Health among the Finnish Adult Population -surveys 1978-2010
0
20
40
60
80
100
19
78
19
80
19
82
19
84
19
86
19
88
19
90
19
92
19
94
19
96
19
98
20
00
20
02
20
04
20
06
20
08
20
10
year
%
Butter on bread
Vegetables daily
Skimmed milk
20/03/2012
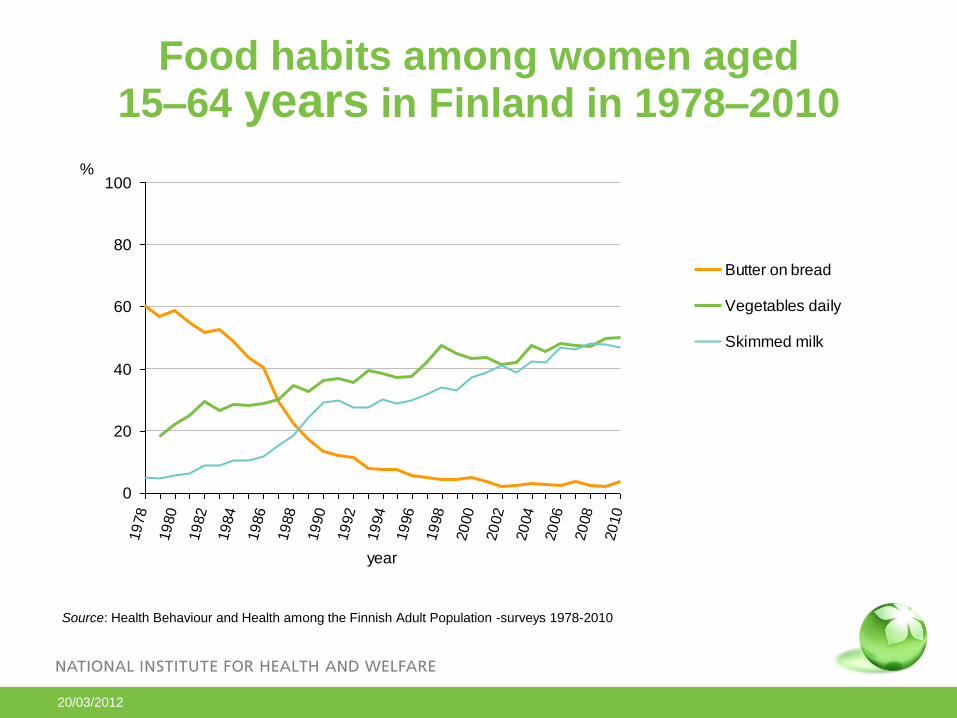
Food habits among women aged 15–64 years in Finland in 1978–2010
Source: Health Behaviour and Health among the Finnish Adult Population -surveys 1978-2010
0
20
40
60
80
100
19
78
19
80
19
82
19
84
19
86
19
88
19
90
19
92
19
94
19
96
19
98
20
00
20
02
20
04
20
06
20
08
20
10
year
%
Butter on bread
Vegetables daily
Skimmed milk
20/03/2012
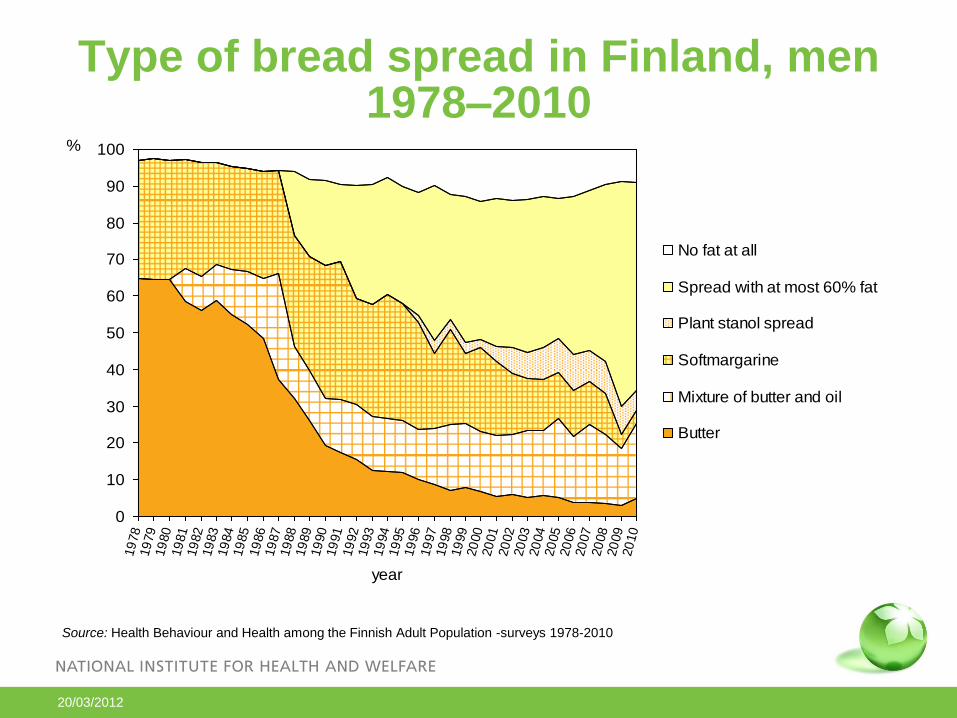
Type of bread spread in Finland, men 1978–2010
0
10
20
30
40
50
60
70
80
90
100
19
78
19
79
19
80
19
81
19
82
19
83
19
84
19
85
19
86
19
87
19
88
19
89
19
90
19
91
19
92
19
93
19
94
19
95
19
96
19
97
19
98
19
99
20
00
20
01
20
02
20
03
20
04
20
05
20
06
20
07
20
08
20
09
20
10
year
%
No fat at all
Spread with at most 60% fat
Plant stanol spread
Softmargarine
Mixture of butter and oil
Butter
Source: Health Behaviour and Health among the Finnish Adult Population -surveys 1978-2010
20/03/2012
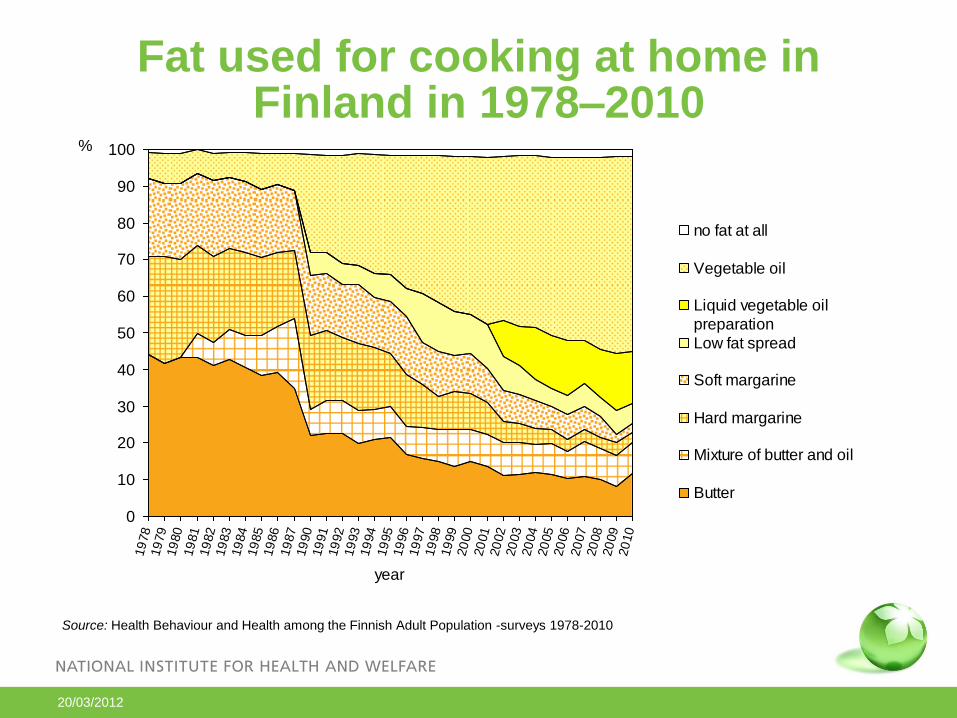
Fat used for cooking at home in Finland in 1978–2010
0
10
20
30
40
50
60
70
80
90
10019
78
19
79
19
80
19
81
19
82
19
83
19
84
19
85
19
86
19
87
19
90
19
91
19
92
19
93
19
94
19
95
19
96
19
97
19
98
19
99
20
00
20
01
20
02
20
03
20
04
20
05
20
06
20
07
20
08
20
09
20
10
year
%
no fat at all
Vegetable oil
Liquid vegetable oil
preparation
Low fat spread
Soft margarine
Hard margarine
Mixture of butter and oil
Butter
Source: Health Behaviour and Health among the Finnish Adult Population -surveys 1978-2010
20/03/2012
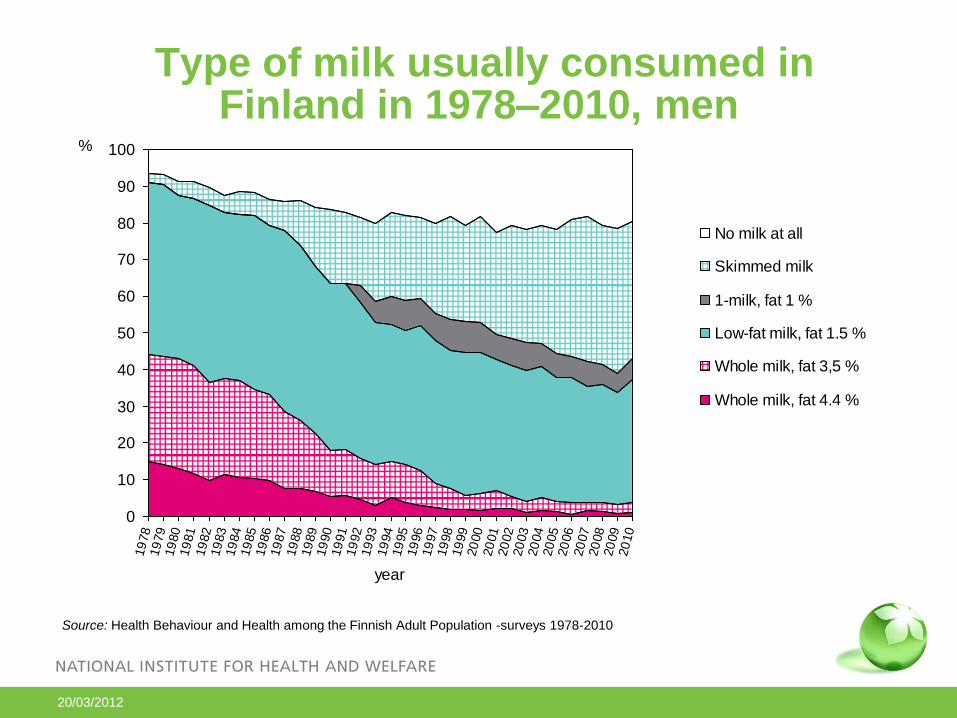
Type of milk usually consumed in
Finland in 1978–2010, men
0
10
20
30
40
50
60
70
80
90
10019
78
19
79
19
80
19
81
19
82
19
83
19
84
19
85
19
86
19
87
19
88
19
89
19
90
19
91
19
92
19
93
19
94
19
95
19
96
19
97
19
98
19
99
20
00
20
01
20
02
20
03
20
04
20
05
20
06
20
07
20
08
20
09
20
10
year
%
No milk at all
Skimmed milk
1-milk, fat 1 %
Low-fat milk, fat 1.5 %
Whole milk, fat 3,5 %
Whole milk, fat 4.4 %
Source: Health Behaviour and Health among the Finnish Adult Population -surveys 1978-2010
20/03/2012
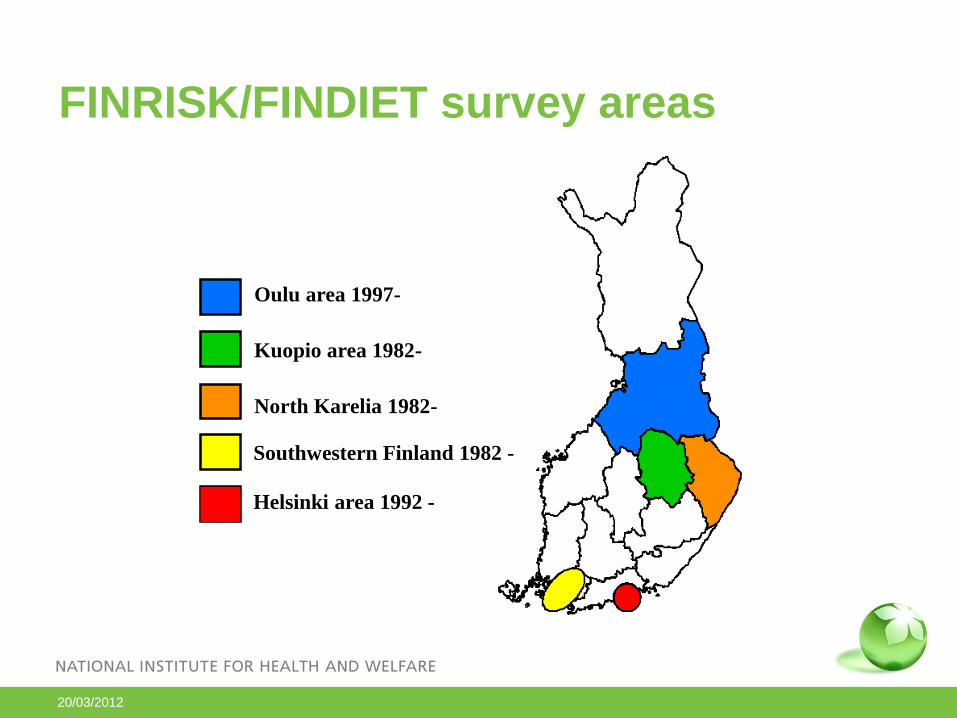
FINRISK/FINDIET survey areas
Southwestern Finland 1982 -
Helsinki area 1992 -
North Karelia 1982-
Kuopio area 1982-
Oulu area 1997-
20/03/2012 19 20/03/2012 Nutrition policy in Finland / SM Virtanen 19
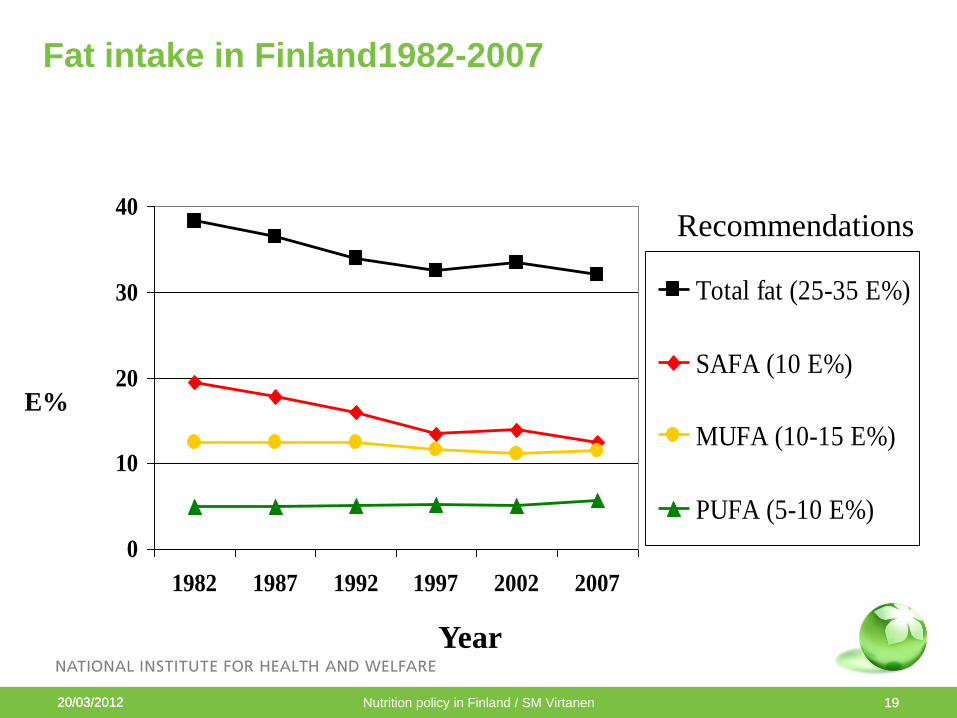
Fat intake in Finland1982-2007
0
10
20
30
40
1982 1987 1992 1997 2002 2007
Total fat (25-35 E%)
SAFA (10 E%)
MUFA (10-15 E%)
PUFA (5-10 E%)
E%
Year
Recommendations
20/03/2012 20
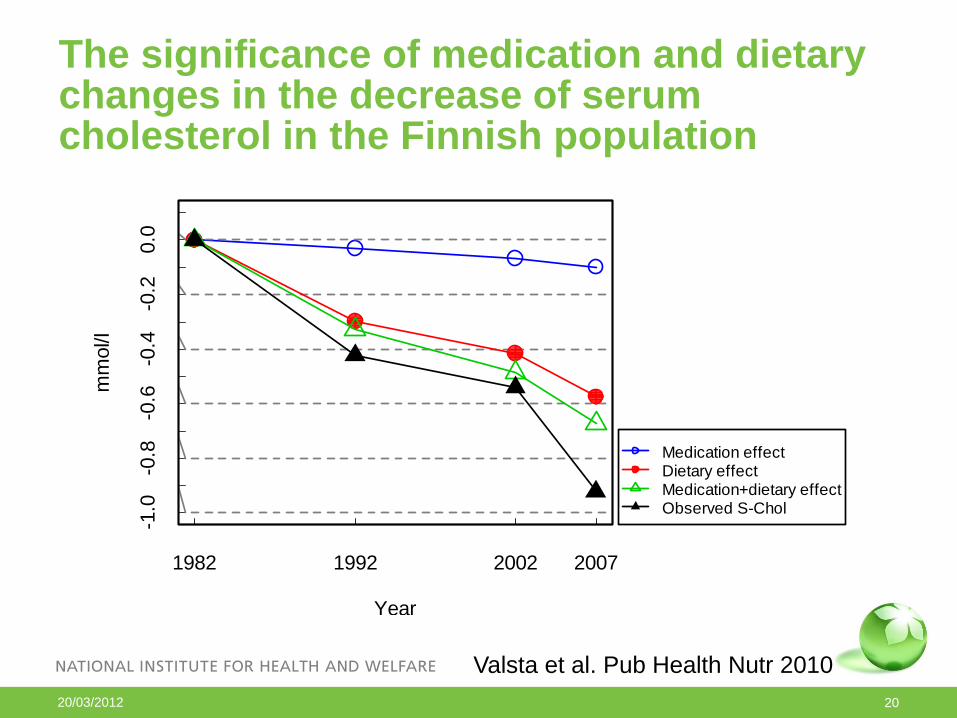
The significance of medication and dietary changes in the decrease of serum cholesterol in the Finnish population
Year
mm
ol/l
1982 1992 2002 2007
-1.0
-0.8
-0.6
-0.4
-0.2
0.0
Medication effectDietary effectMedication+dietary effectObserved S-Chol
Valsta et al. Pub Health Nutr 2010
20/03/2012 20/03/2012 Nutrition policy in Finland / SM Virtanen 21
Conclusions concerning fats
• Changing the type of fat in the population requires long-lasting, systematic work
• Co-operation with food industry is very important – the availability of soft, healthy fats is crucial as well as the availability of low-fat and fat-free milk products and cheeses
• Consumer education is very important
• Changes in the type of fat are reflected in lower serum cholesterol levels and further in lower coronary heart disease mortality
20/03/2012 20/03/2012 Nutrition policy in Finland / SM Virtanen 22
Salt reduction: 30 yrs of systematic work
• Recommendation to reduce salt intake by the National Nutrition Council in 1978
• 1979-1982 The North Karelia Salt project with population surveys in 1979 and 1982
• Mass media campaigns, co-operation with food industry to reduce salt voluntarily, education of health care personnel
• Expanded after the 3-year project to the whole country
• The public became aware of salt and blood pressure, regular monitoring was established, and the first national labelling decrees were launched in the 1980s
20/03/2012 20/03/2012 Nutrition policy in Finland / SM Virtanen 23
Salt reduction – an integrated approach
• Research: salt reduction interventions (North Karelia Salt Project, local projects, e.g. Turku area etc.)
• Monitoring (The National Public Health Institute, KTL, since 1.1.2009 The National Institute for Health and Welfare):
• Sodium in the food composition database since early 1980s (regular updates).
20/03/2012 20/03/2012 Nutrition policy in Finland / SM Virtanen 24
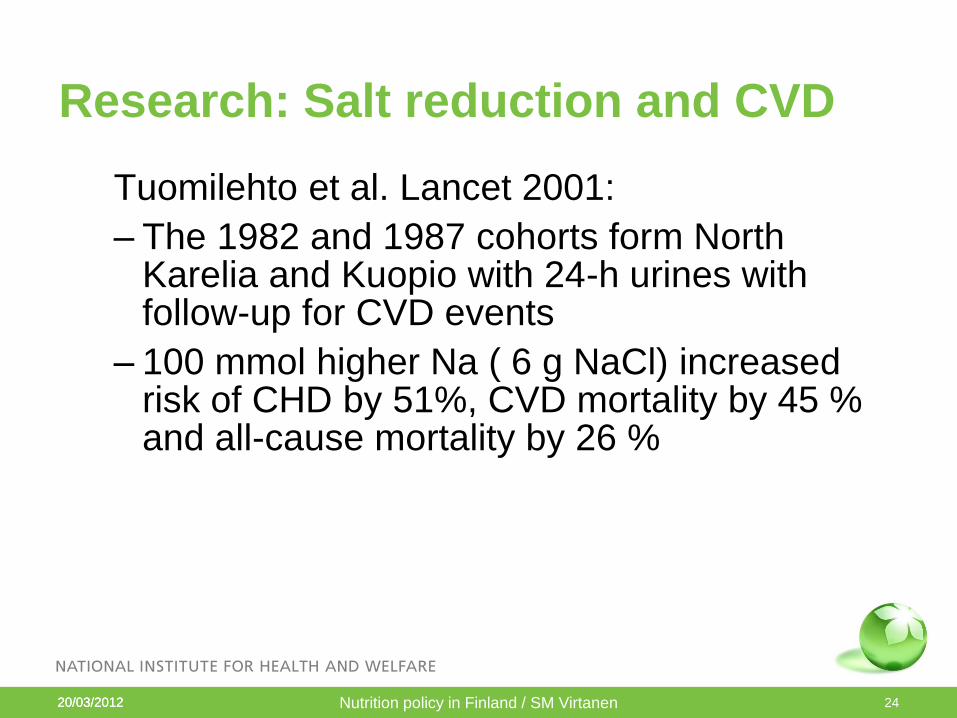
Research: Salt reduction and CVD
Tuomilehto et al. Lancet 2001:
– The 1982 and 1987 cohorts form North Karelia and Kuopio with 24-h urines with follow-up for CVD events
– 100 mmol higher Na ( 6 g NaCl) increased risk of CHD by 51%, CVD mortality by 45 % and all-cause mortality by 26 %
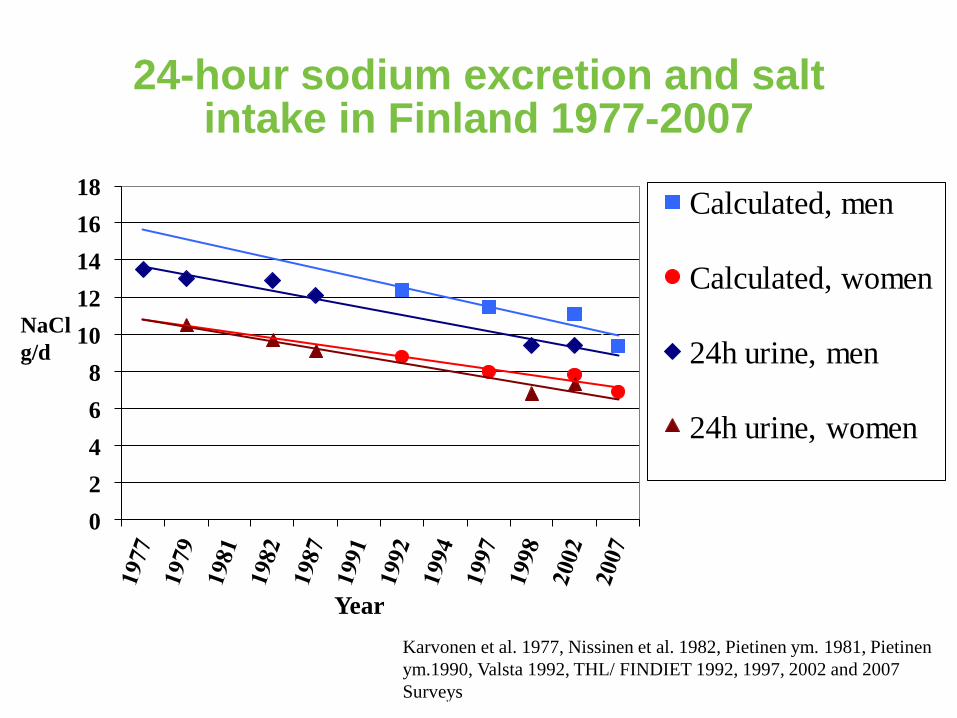
24-hour sodium excretion and salt intake in Finland 1977-2007
0
2
4
6
8
10
12
14
16
18Calculated, men
Calculated, women
24h urine, men
24h urine, women
NaCl
g/d
Year
Karvonen et al. 1977, Nissinen et al. 1982, Pietinen ym. 1981, Pietinen
ym.1990, Valsta 1992, THL/ FINDIET 1992, 1997, 2002 and 2007
Surveys 20/03/2012 25 Nutrition policy in Finland / SM Virtanen

20/03/2012 20/03/2012 Nutrition policy in Finland / SM Virtanen 26
Sources of salt. Food Balance Sheets 1980-1999.
0.00
2.00
4.00
6.00
8.00
10.00
12.00
14.00
1980 1991 1997-1999
YEAR
Na
Cl
g/d
ay
Milk products
Fat spreads
Bread
Sweet bakery
Meat products
Fish products
Prepared, canned or frozen
food, condiment sauces
Catering
Salt used in households
Other sodium sources
Reinivuo et al. Eur J Clin Nutr 2006

20/03/2012 20/03/2012 Nutrition policy in Finland / SM Virtanen 27
Salt reduction – an integrated approach
• Legislation, consumer information: Compulsory labelling of salt
• The Heart Symbol, better choice in a certain food groups concerning salt content and type of fat (additionally fiber and sugar in some product groups)
• Product development: e.g. mineral salt, meat products, bread
• Salt seminars (publications) for the nutrition experts and medical community
• Information on salt reduction: non-governmental organizations, e.g., The Finnish Heart Association, consumer organisations
20/03/2012 20/03/2012
Nutrition policy in Finland / SM Virtanen
28
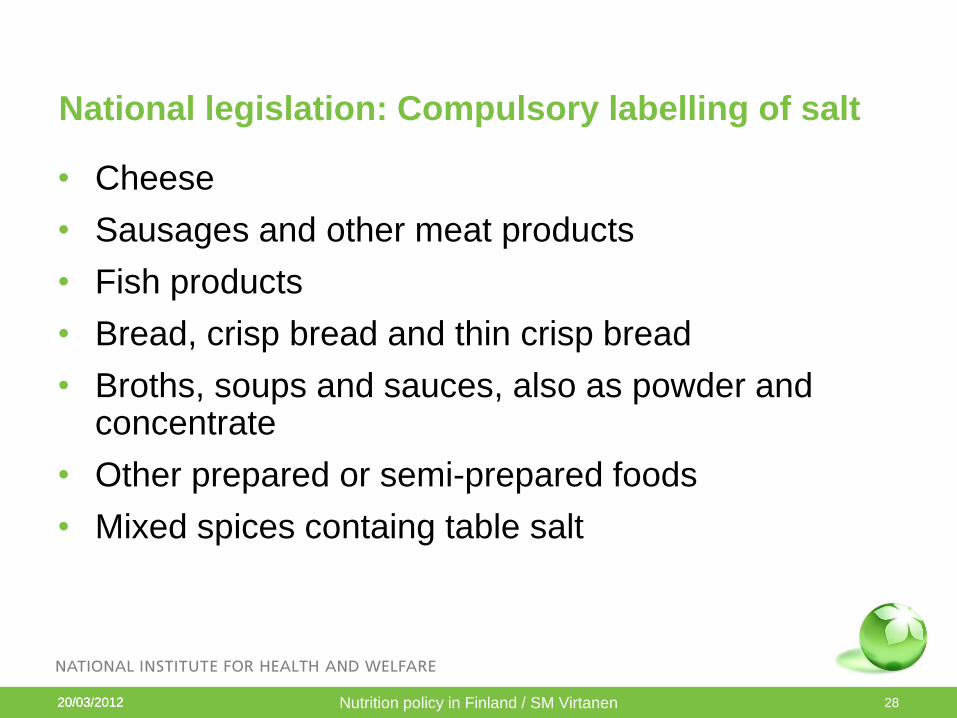
National legislation: Compulsory labelling of salt
• Cheese
• Sausages and other meat products
• Fish products
• Bread, crisp bread and thin crisp bread
• Broths, soups and sauces, also as powder and concentrate
• Other prepared or semi-prepared foods
• Mixed spices containg table salt
20/03/2012 20/03/2012 Nutrition policy in Finland / SM Virtanen 29
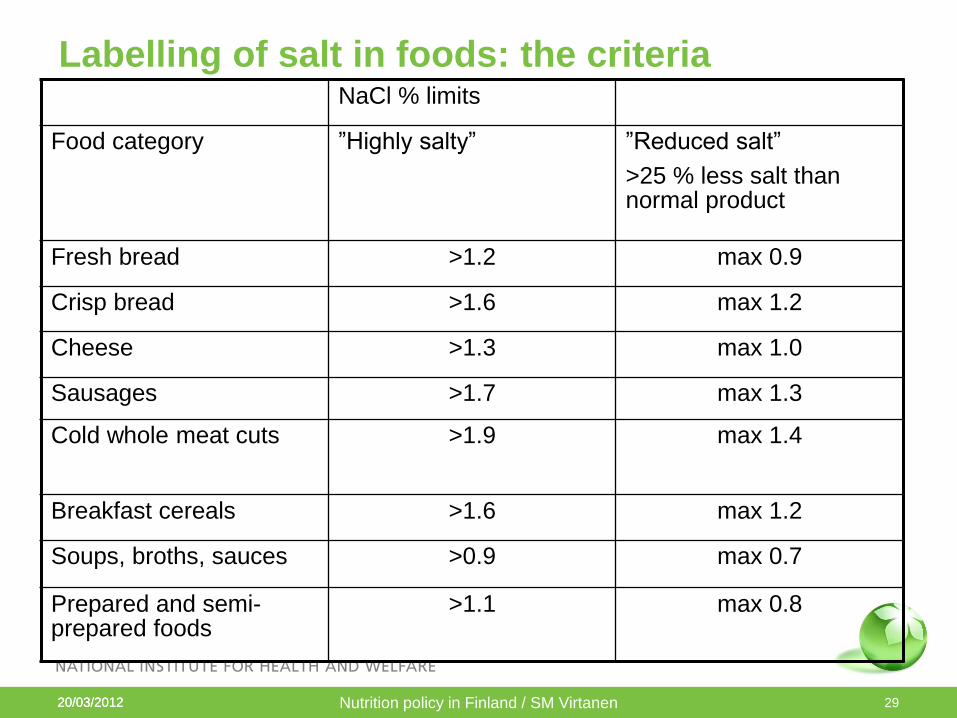
Labelling of salt in foods: the criteria NaCl % limits
Food category ”Highly salty”
”Reduced salt”
>25 % less salt than normal product
Fresh bread >1.2 max 0.9
Crisp bread >1.6 max 1.2
Cheese >1.3 max 1.0
Sausages >1.7 max 1.3
Cold whole meat cuts >1.9 max 1.4
Breakfast cereals >1.6 max 1.2
Soups, broths, sauces >0.9 max 0.7
Prepared and semi-prepared foods
>1.1 max 0.8
20/03/2012 20/03/2012 Nutrition policy in Finland / SM Virtanen 30
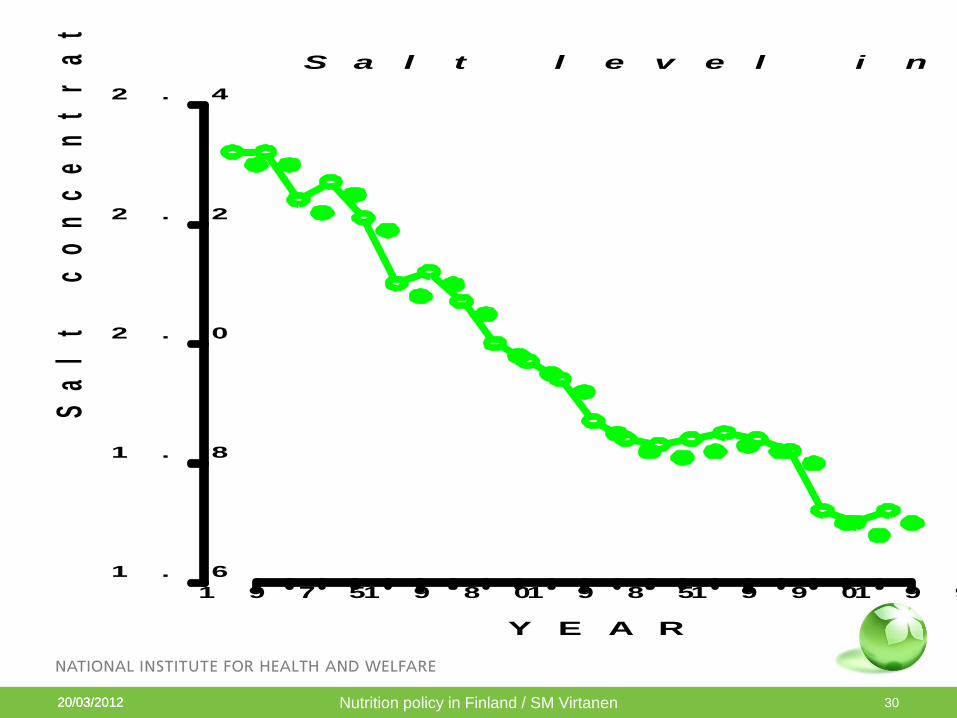
1 9 7 51 9 8 01 9 8 51 9 9 01 9 9 5
Y E A R
1 . 6
1 . 8
2 . 0
2 . 2
2 . 4S
al
t
co
nc
en
tr
at
io
n
(%
)S a l t l e v e l i n F i n n i s h s a u s a g e s
20/03/2012 20/03/2012
Nutrition policy in Finland / SM Virtanen
31
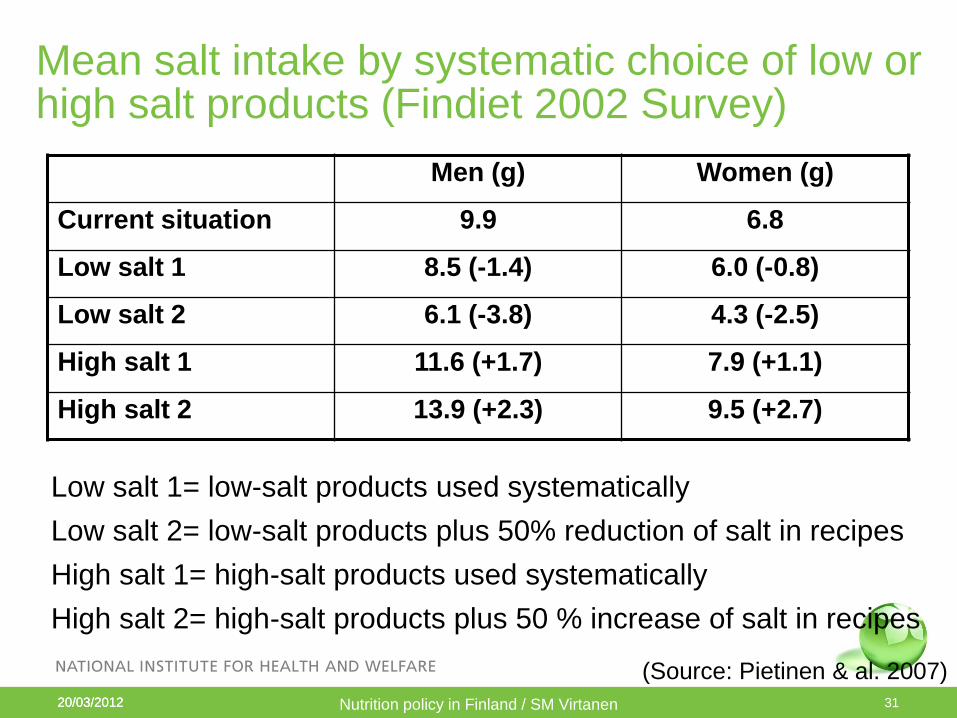
Mean salt intake by systematic choice of low or high salt products (Findiet 2002 Survey)
Men (g) Women (g)
Current situation 9.9 6.8
Low salt 1 8.5 (-1.4) 6.0 (-0.8)
Low salt 2 6.1 (-3.8) 4.3 (-2.5)
High salt 1 11.6 (+1.7) 7.9 (+1.1)
High salt 2 13.9 (+2.3) 9.5 (+2.7)
Low salt 1= low-salt products used systematically
Low salt 2= low-salt products plus 50% reduction of salt in recipes
High salt 1= high-salt products used systematically
High salt 2= high-salt products plus 50 % increase of salt in recipes
(Source: Pietinen & al. 2007)
20/03/2012 20/03/2012 Nutrition policy in Finland / SM Virtanen 32
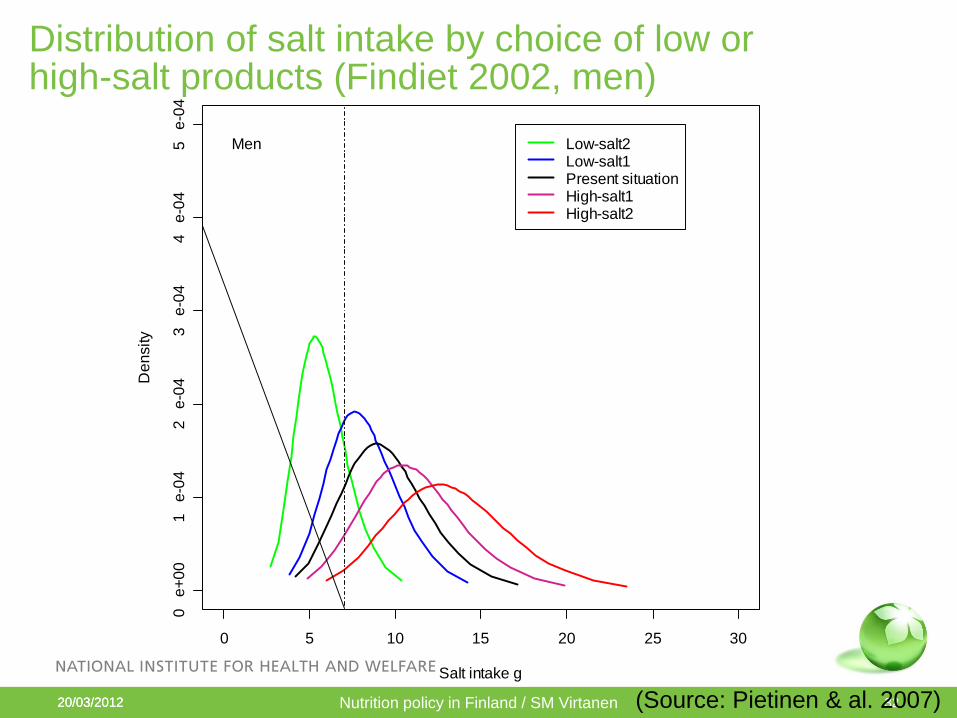
Distribution of salt intake by choice of low or high-salt products (Findiet 2002, men)
0 5 10 15 20 25 30
0 e
+0
01
e
-04
2 e
-04
3 e
-04
4 e
-04
5 e
-04
Salt intake g
De
nsity
Low-salt2Low-salt1Present situationHigh-salt1High-salt2
Men
(Source: Pietinen & al. 2007)

20/03/2012 20/03/2012 Presentation name / Author 33
Salt reduction – an integrated approach
• Dietary recommendations and dietary guidelines for different population groups (National Nutrition Council, Ministry of Social Affairs and Health)
• The Heart Symbol, better choice in a certain food group concerning salt content and fat quality (additionally fiber and sugar in some product groups)
20/03/2012 20/03/2012 Presentation name / Author 34
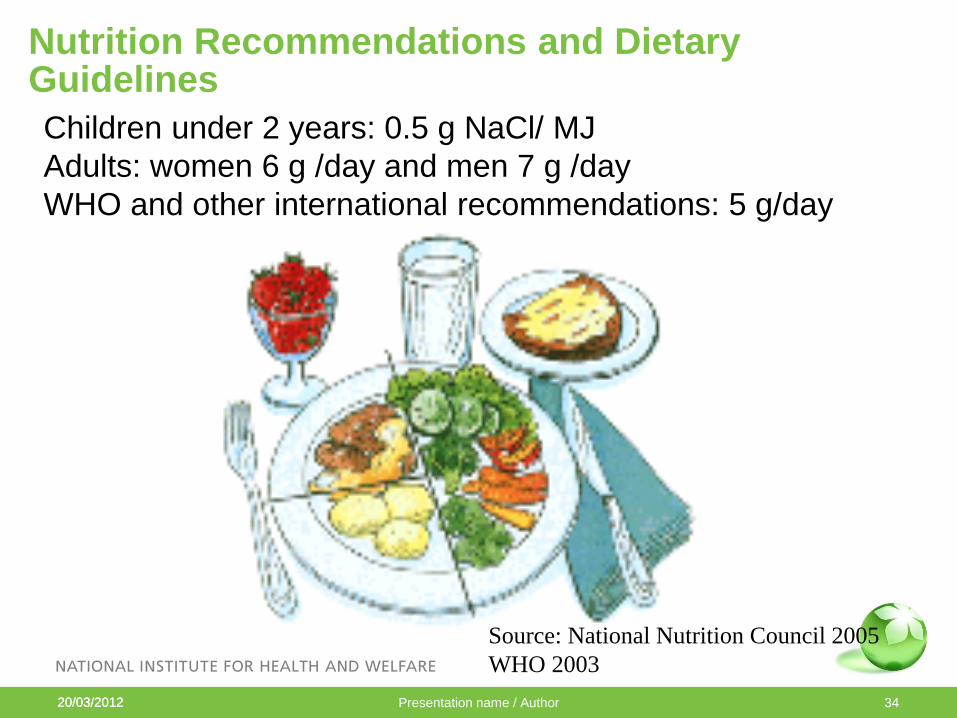
Nutrition Recommendations and Dietary Guidelines
Source: National Nutrition Council 2005
WHO 2003
Children under 2 years: 0.5 g NaCl/ MJ
Adults: women 6 g /day and men 7 g /day
WHO and other international recommendations: 5 g/day
20/03/2012 20/03/2012 Presentation name / Author 35
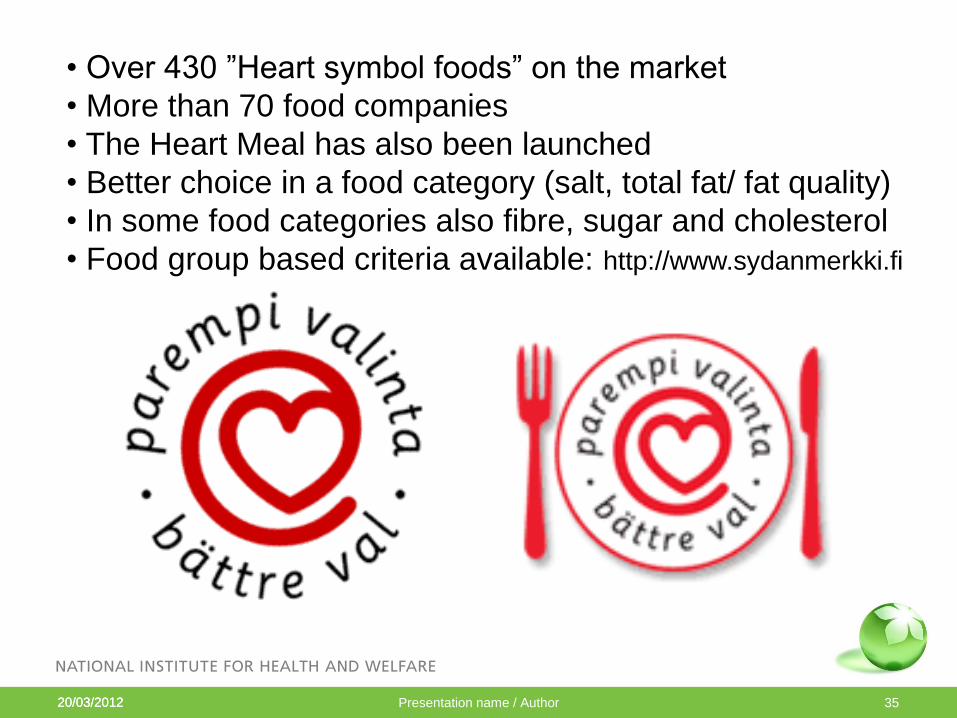
• Over 430 ”Heart symbol foods” on the market
• More than 70 food companies
• The Heart Meal has also been launched
• Better choice in a food category (salt, total fat/ fat quality)
• In some food categories also fibre, sugar and cholesterol
• Food group based criteria available: http://www.sydanmerkki.fi
20/03/2012 20/03/2012 Presentation name / Author 36
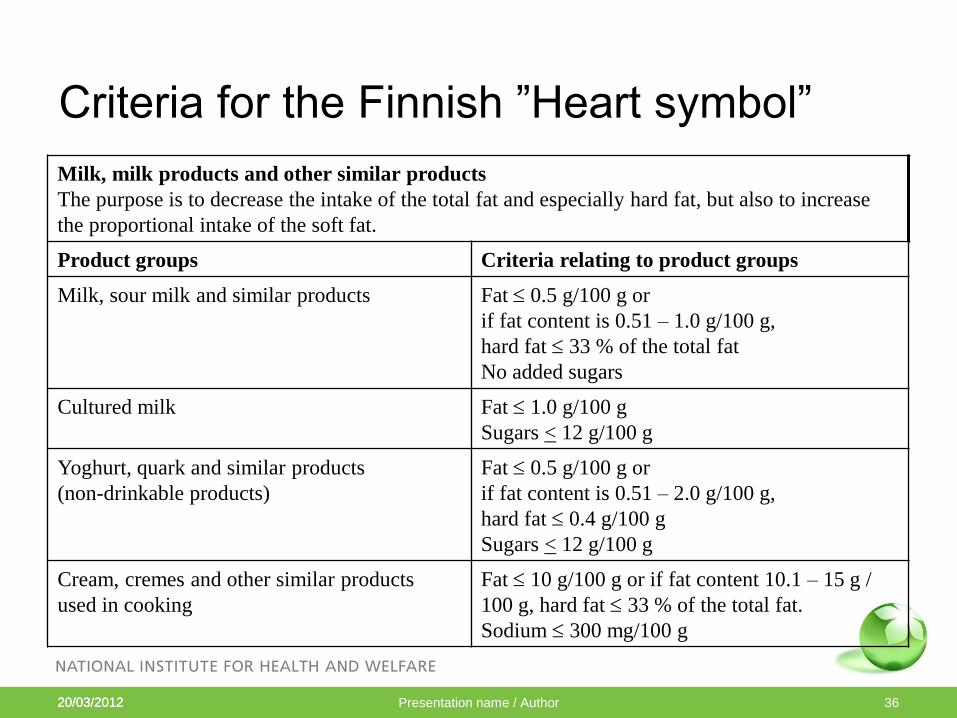
Criteria for the Finnish ”Heart symbol”
Milk, milk products and other similar products
The purpose is to decrease the intake of the total fat and especially hard fat, but also to increase
the proportional intake of the soft fat.
Product groups Criteria relating to product groups
Milk, sour milk and similar products Fat 0.5 g/100 g or
if fat content is 0.51 – 1.0 g/100 g,
hard fat 33 % of the total fat
No added sugars
Cultured milk Fat 1.0 g/100 g
Sugars < 12 g/100 g
Yoghurt, quark and similar products
(non-drinkable products)
Fat 0.5 g/100 g or
if fat content is 0.51 – 2.0 g/100 g,
hard fat 0.4 g/100 g
Sugars < 12 g/100 g
Cream, cremes and other similar products
used in cooking
Fat 10 g/100 g or if fat content 10.1 – 15 g /
100 g, hard fat 33 % of the total fat.
Sodium 300 mg/100 g
20/03/2012
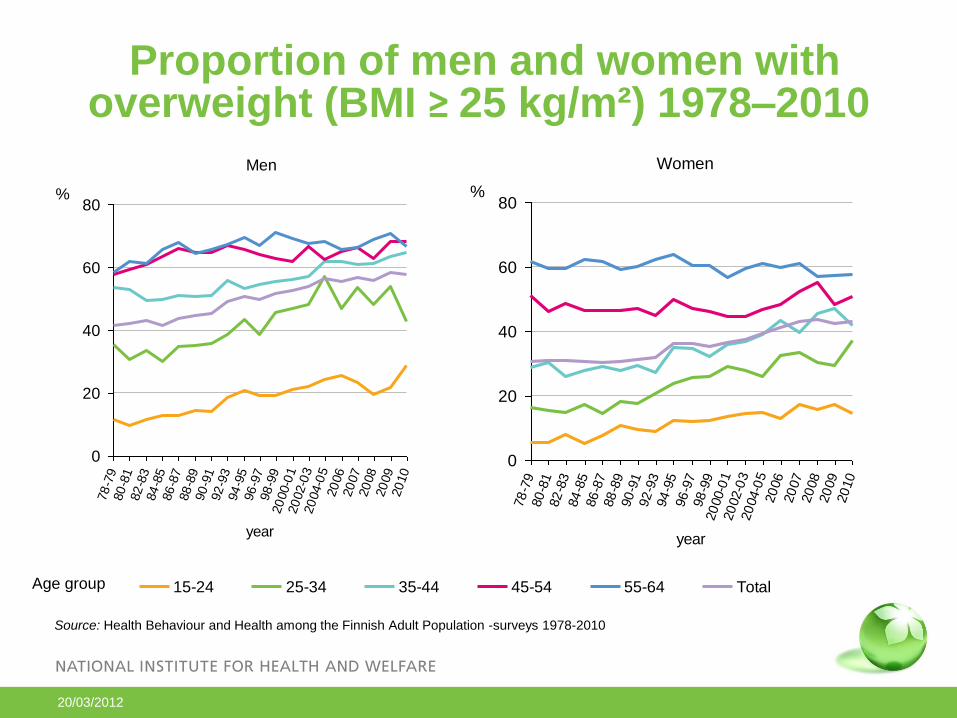
Proportion of men and women with
overweight (BMI ≥ 25 kg/m²) 1978–2010
Source: Health Behaviour and Health among the Finnish Adult Population -surveys 1978-2010
Men
0
20
40
60
80
78
-79
80
-81
82
-83
84
-85
86
-87
88
-89
90
-91
92
-93
94
-95
96
-97
98
-99
20
00-0
120
02-0
320
04-0
520
06
20
07
20
08
20
09
20
10
year
%
15-24 25-34 35-44 45-54 55-64 Total
Women
0
20
40
60
80
78
-79
80
-81
82
-83
84
-85
86
-87
88
-89
90
-91
92
-93
94
-95
96
-97
98
-99
20
00-0
120
02-0
320
04-0
520
06
20
07
20
08
20
09
20
10
year
%
Age group
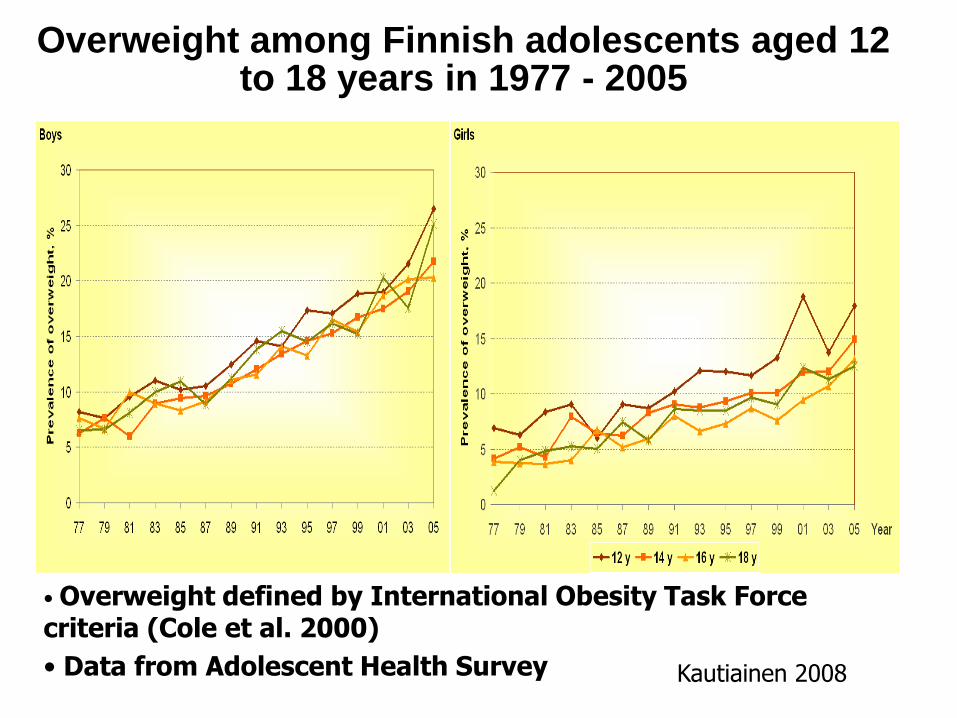
• Overweight defined by International Obesity Task Force criteria (Cole et al. 2000)
• Data from Adolescent Health Survey
Overweight among Finnish adolescents aged 12 to 18 years in 1977 - 2005
Kautiainen 2008
20/03/2012
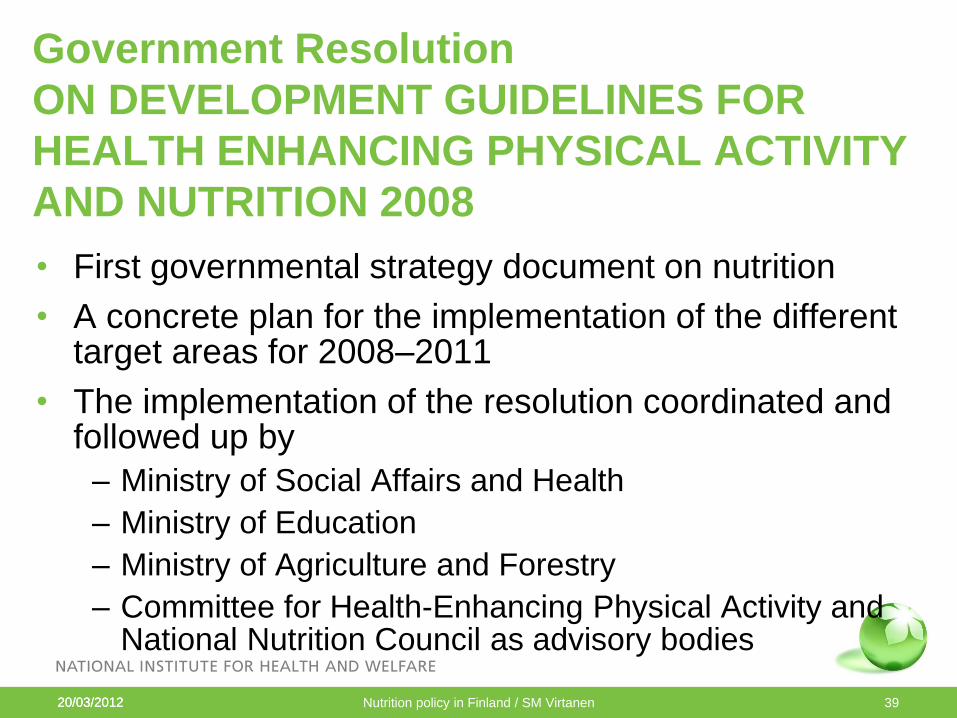
Government Resolution
ON DEVELOPMENT GUIDELINES FOR
HEALTH ENHANCING PHYSICAL ACTIVITY
AND NUTRITION 2008
• First governmental strategy document on nutrition
• A concrete plan for the implementation of the different target areas for 2008–2011
• The implementation of the resolution coordinated and followed up by
– Ministry of Social Affairs and Health
– Ministry of Education
– Ministry of Agriculture and Forestry
– Committee for Health-Enhancing Physical Activity and National Nutrition Council as advisory bodies
20/03/2012 Nutrition policy in Finland / SM Virtanen 39
20/03/2012
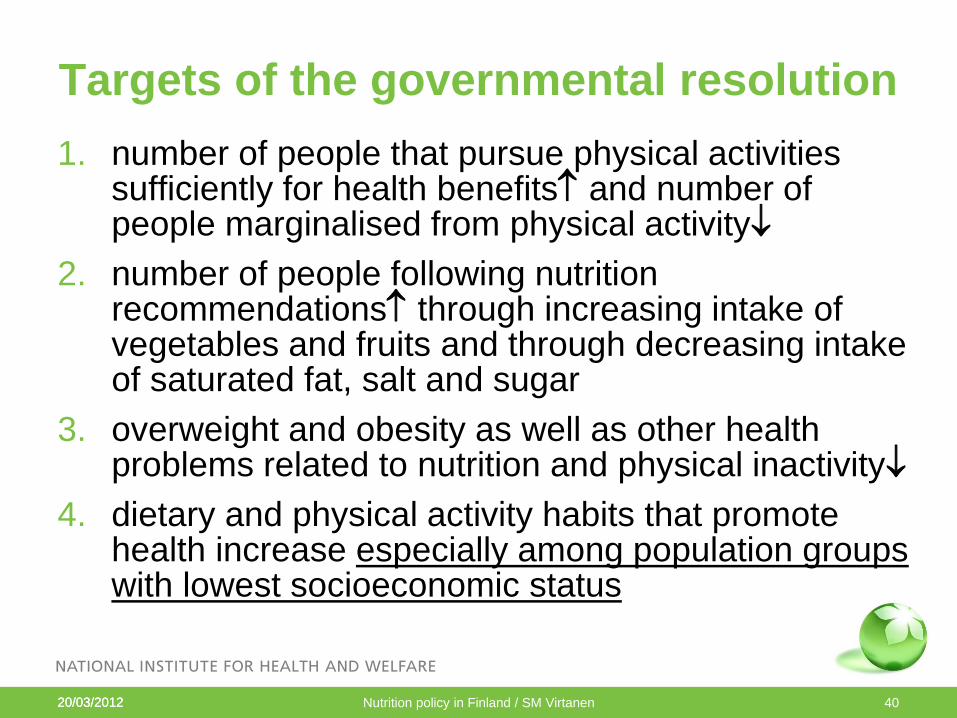
Targets of the governmental resolution
1. number of people that pursue physical activities sufficiently for health benefits and number of people marginalised from physical activity
2. number of people following nutrition recommendations through increasing intake of vegetables and fruits and through decreasing intake of saturated fat, salt and sugar
3. overweight and obesity as well as other health problems related to nutrition and physical inactivity
4. dietary and physical activity habits that promote health increase especially among population groups with lowest socioeconomic status
20/03/2012 Nutrition policy in Finland / SM Virtanen 40
20/03/2012
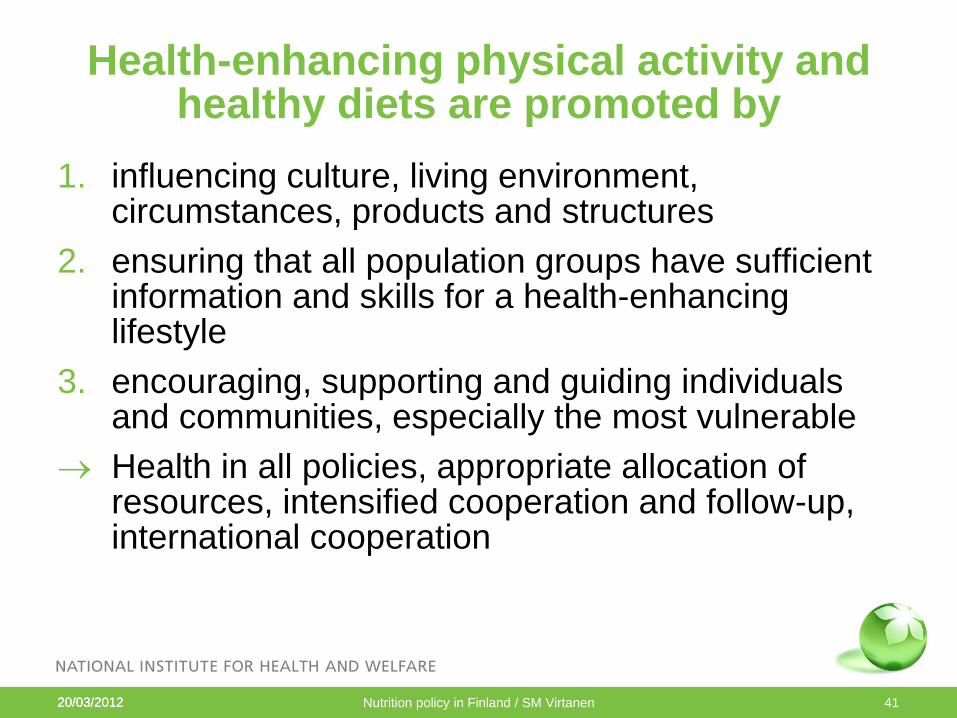
Health-enhancing physical activity and healthy diets are promoted by
1. influencing culture, living environment, circumstances, products and structures
2. ensuring that all population groups have sufficient information and skills for a health-enhancing lifestyle
3. encouraging, supporting and guiding individuals and communities, especially the most vulnerable
Health in all policies, appropriate allocation of resources, intensified cooperation and follow-up, international cooperation
20/03/2012 Nutrition policy in Finland / SM Virtanen 41
20/03/2012 20/03/2012 Nutrition policy in Finland / SM Virtanen 42
Nutrition policy in Finland: conclusions
• Broad spectrum of bodies working together
• Long history of activities
• Dietary changes in Finland during the last decades have been mainly beneficial: less saturated fat and salt, more fruits and vegetables
• Dietary challenges: energy intake vs. expenditure, saturated fat, vitamin D, folate, sugars, alcohol
• Nutritional monitoring of children is urgently needed
• Obesity is increasing, especially among men and in children
• Diabetes is increasing

20/03/2012
THANK YOU!
20/03/2012