northcoast!opportunities! community!action!plan! …
TRANSCRIPT

NORTH COAST OPPORTUNITIES
COMMUNITY ACTION PLAN
2014-‐2015

NORTH COAST OPPORTUNITIES COMMUNITY ACTION PLAN 2014-2015 PAGE 1
Table of Contents
I. Community Information Profile 4
II. Community Resources and Services 32
III. Data Sources for CAP Review and Revision 37
IV. Needs Assessment 41
V. Program Plan for 2014-‐2015 46

NORTH COAST OPPORTUNITIES COMMUNITY ACTION PLAN 2014-2015 PAGE 2
Acronyms used in this document
ABC California Department of Alcoholic Beverage Control ACA Affordable Care Act AOD Alcohol and other drugs AODS Department of Mental Health, Alcohol and Other Drug Services Division BEANS Better Education And Nutrition for Students Project
CAA Community Action Agency CAHSEE California High School Exit Exam
CERT Community Emergency Response Team CHIS California Health Interview Survey CHKS California Healthy Kids Survey CoC Homelessness Continuum of Care
CREW Community Re-‐Entry Work Program CSBG Community Service Block Grant EITC Earned Income Tax Credit ELA English Language Arts FMR Fair Market Rent FPL Federal Poverty Level
FQHC Federally-‐Qualified Health Center FRC Family Resource Center
FRPM Free and Reduced Price Meal Program FSP Ford Street Project
GAAP Generally Accepted Accounting Principles HFZ High Fitness Zone
HHSA Mendocino County Health and Human Services Agency HPSA Health Professional Shortage Area HSPG Mendocino County Homeless Services Planning Group
HSRFEI Home and School Retail Food Environment Index LTA Lake Transit Authority
MAGSU Multi-‐Agency Gang Suppression Unit MCFARM Mendocino County Farmers Market Association
MPIC Mendocino Private Industry Council MSSA Medical Service Study Area MSSP Multipurpose Senior Service Program MTA Mendocino Transit Authority MUA Medically Underserved Area MUP Medically Underserved Population NCO North Coast Opportunities, Inc. R&R Resource and Referral Program RCCC Rural Communities Child Care RCRC Redwood Caregiver Resource Center REDI Renewable Energy Development Institute RFEI Retail Food Environment Index RHC Rural Health Clinic
ROMA Results-‐Oriented Management and Accountability System RSVP Retired Senior Volunteer Program RWJF Robert Wood Johnson Foundation SNAP Supplemental Assistance Nutrition Program (food stamps) SOUP Skills and Options Using Produce Project USDA US Department of Agriculture WIC Women, Infant, and Children Supplemental Nutrition Program

NORTH COAST OPPORTUNITIES COMMUNITY ACTION PLAN 2014-2015 PAGE 3
Tables
Table 1 Population change, 2000-‐2010 Table 2 2013 population estimates for Lake County Table 3 2013 population estimates for Mendocino County Table 4 Population by race and ethnicity, 2010 Census data Table 5 Population composition by age Table 6 Age and gender demographics of veterans, 2007-‐2011 Table 7 Poverty data from the American Community Survey, 2009-‐2011 Table 8 Unemployment, April 2013 Table 9 Percent adults attaining educational levels, 2007-‐2011 American Community Survey average
Table 10 Demographics in county schools, 2012-‐2013 school year Table 11 2011-‐2012 education indicators Table 12 Lake County Children Now 2012-‐2013 Scorecard Table 13 Mendocino County Children Now 2012-‐2013 Scorecard Table 14 RWJF Health Rankings Table 15 Deaths by cause, 2009-‐2011 average Table 16 Health insurance coverage Table 17 Medicare enrollment by county, April 2013 Table 18 Physician supply Table 19 Institutional Medicare and Medicaid providers, 2nd quarter, 2011 Table 20 Availability of licensed child care by area, income, and age, January 2012 Table 21 USDA food deserts in project area Table 22 Physical fitness testing: body composition, 2011-‐2012 Table 23 US Postal Service address vacancies, 3rd quarter, 2010 Table 24 Fair market rents and wages, 2013 Table 25 Crime data from Lake County Sheriff’s Office, 2012 Table 26 2009-‐2011 CHKS safety and gang data Table 27 2009-‐2011 CHKS data on past 30-‐day substance use and perception of harm Table 28 Method of transportation to work, 2007-‐2011 Table 29 Community partners Table 30 Family Resource Centers Table 31 Community Information Profile data sources Table 32 Suggestions from community surveys
Figures
Figure 1 State of California Map showing Lake and Mendocino Counties Figure 2 Lake and Mendocino County participation in free and reduced price meal program Figure 3 Unemployment rates, 2002-‐2012 Figure 4 School enrollment, 2000-‐2012 Figure 5 Lake County 2007-‐2012 crime cases Figure 6 2010 Sheriff service calls, Mendocino County Figure 7 2010 jail bookings, Mendocino County Figure 8 Gang-‐affiliated bookings, Mendocino County Figure 9 CAP Logic Model

NORTH COAST OPPORTUNITIES COMMUNITY ACTION PLAN 2014-2015 PAGE 4
I. Community Information Profile
INTRODUCTION
This report presents an overview of the current community conditions for Lake and Mendocino Counties in rural Northern California, the area highlighted on the California map in Figure 1 below.
Lake County is a two-‐hour drive from San Francisco to the south, Sacramento to the east, and the Mendocino County to the west. The county is about 100 miles long by about 50 miles wide, with Clear Lake, the largest natural lake lying entirely within California borders, at its center. Lake County’s 64,5311 residents occupy an area of 1,258 square miles, resulting in a population density of 51.4 persons per square mile. The county is surrounded by 4,000-‐6,000 foot mountain ranges and bordered by Mendocino, Sonoma, Napa, and Colusa counties. Less than 10% of the county’s 1,258 square miles of largely mountainous terrain are developed, and approximately half are publicly owned. Lake County’s rugged rural geography, winding two-‐lane roads, and widely-‐separated towns limit access to services, including health care, recreation, social support, employment, and even food.
Mendocino County lies on the Pacific coast about 100 miles north of San Francisco. Humboldt, Trinity, Tehama, Glenn, Lake, and Sonoma Counties encircle the county to the north, east, and south. Mendocino County’s vineyard-‐covered hillsides, towering redwoods, deep fertile valleys, and rugged mountains comprise 3,510 square miles, only 3% of which is flat. Although Mendocino County is the 15th largest of California’s 58 counties, its 88,291 residents represent less than one-‐quarter of one percent (0.24%) of the state’s population. Mendocino County is larger in size than the states of Delaware and Rhode Island combined but has a population density of only 25 persons/square mile, compared with 234 persons per square mile statewide.
POPULATION PROFILE
Population and Population Change
Population changes from 2000-‐2010 are shown in Table 1 below. During the ten-‐year period, the population of the report area grew by 5.49% (compared with a statewide growth of 14.6%), increasing from 144,572 persons in 2000 to 152,506 persons in 2010. The greatest growth occurred in Lake County, which experienced a 10.9% increase in population, while Mendocino County experienced only a 1.83% increase. The California Department of Finance Demographic Research Unit predicts a
1 California Department of Finance, Demographic Research Unit. (www.dof.ca.gov/research/demographic/reports/estimates/e-1/view.php).
Figure 1 State of California

NORTH COAST OPPORTUNITIES COMMUNITY ACTION PLAN 2014-2015 PAGE 5
population of 84,394 in Lake County and a population of 94,812 in Mendocino County by 2030, for a total population of 179,206.2
Table 1. Population change, 2000 -‐ 20103
Geographic Area Census 2000 Population
Census 2010 Population
Population Change % Change
Lake County 58,309 64,665 6,356 10.90% Mendocino County 86,263 87,841 1,578 1.83% Report Area 144,572 152,506 7,934 5.49%
Approximately 30% of all Lake County residents live in the county’s two incorporated cities—Lakeport, the county seat of government, and Clearlake, the county’s largest community—which are situated 28 miles apart on opposite sides of Clear Lake. Scattered around the lake’s 100-‐mile shoreline and in the surrounding foothills, there are 16 small communities4 as well as 7 Native American Indian settlements5 and 5 federally-‐designated rural communities.
Table 2. 2013 population estimates for Lake County6
Area Population Lake County 64,531 City of Clearlake 15,192 City of Lakeport 4,713 Unincorporated areas 44,626
There are four incorporated cities in Mendocino County—Ukiah, Fort Bragg, Point Arena, and Willits—none larger than 16,000 people. In addition to recognized unincorporated communities (e.g., Boonville, Hopland, Gualala, Mendocino, Laytonville, Covelo), there are as many as 30 unincorporated “pocket” and “unofficial” communities in isolated parts of the county. Pocket communities are defined as recognized but unincorporated towns and villages with populations of less than 1,000.7 Unofficial communities are communal settlements that are not found on any map and are isolated not only geographically, but also by tradition and choice. Mendocino County also has 11 Native American Indian settlements lying within its borders, the fourth most of any county in the United States (after San Diego and Riverside Counties in California and Sandoval County, New Mexico.8 In addition, there are four federally designated frontier communities and eight federally designated rural communities.9
2 Ibid. 3 US Census Bureau, Census 2010. 4 Blue Lakes, Clearlake Oaks, Cobb, Finley, Glenhaven, Hidden Valley Lake, Kelseyville, Loch Lomond, Lower Lake, Lucerne, Nice, Middletown, Spring Valley, Anderson Springs, Upper Lake, and Witter Springs. 5 Big Valley Rancheria Pomo, Elem Indian Colony of Pomo Indians of the Sulphur Bank Rancheria, Habematolel Pomo of Upper Lake, Middletown Rancheria of Pomo and Lake Miwok Indians, Scotts Valley Band of Pomo Indians, and Robinson Rancheria Pomo Indians. From Lake County Tribal Health Consortium, 2011 Needs Assessment (www.lcthc.com/human_services.shtml). 6 California Department of Finance, Demographic Research Unit. 7 Pocket communities include Albion, Anchor Bay, Bell Springs, Branscomb, Caspar, Cleone, Comptche, Dos Rios, Elk, Hales Grove, Inglenook, Leggett, Little River, Longvale, Manchester, Navarro, Noyo, Old Hopland, Philo, Piercy, Pine Grove, Rockport, Westport, Whale Gulch, and Yorkville. 8 Tribes and Tribal Communities of the North Coast (http://fiesta.bren.ucsb.edu/~mlpa3/tribes.html). Native American Indian settlements in Mendocino County include Coyote Valley and Round Valley Reservations and Guidiville, Hopland, Laytonville, Manchester/Point Arena, Pinoleville, Potter Valley, Redwood Valley, Sherwood Valley Rancherias, and Stewarts Point Rancherias. 9 The definition of “Rural” is a Medical Service Study Area (MSSA) with a population 2,500 persons or less per square mile with no incorporated area greater than 50,000 persons. The definition of “Frontier” is a MSSA with a population

NORTH COAST OPPORTUNITIES COMMUNITY ACTION PLAN 2014-2015 PAGE 6
Table 3. 2013 population estimates for Mendocino County10
Area Population Mendocino County 88,291 City of Fort Bragg 7,311 City of Point Arena 449 City of Ukiah 16,065 City of Willits 4,893 Unincorporated areas 59,573
Demographics: Race and Ethnicity
The population in both counties remains socially diverse and continues to grow in ethnic diversity. According to the California Department of Finance, 74% of Lake County and 69% of Mendocino County residents are White/non-‐Hispanic, while Hispanics represent 17% of the Lake County population and 22% of Mendocino County residents. Lake County’s Hispanic population is projected to reach 14,621 (21%) by 2020, and in Mendocino County the Hispanic population is projected to rise to 23,781 (26%). The area’s increasing diversity is reflected in local kindergarten classes, where 33% of 2012-‐2013 Lake County students are Hispanic and 43% of students in Mendocino County are Hispanic.
Table 4. Population by race and ethnicity, 2010 Census data
Geographic Area White Black American Indian
Asian Native Hawaiian / Pacific Islander
Some Other Race
M F M F M F M F M F M F Lake County 25,909 26,124 704 528 1,003 1,046 309 415 56 52 1,543 1,521 Mendocino County 33,312 33,906 432 190 2,098 2,179 538 912 60 59 2,013 1,957 Report Area 59,221 60,030 1,136 718 3,101 3,225 847 1,327 116 111 3,556 3,478
Both counties have significant numbers of Native American Indian residents—the 2007-‐2011 American Community Survey reports 5.7% in Lake County and 7.2% in Mendocino County, including both those who identified as a single race and those that identified as a mixture that included Native American Indian. Lake County’s 7 Native American Indian settlements are home to tribal people self-‐identifying from at least 111 different tribes, including 20 of the state’s 22 Pomo tribes.
Mendocino County’s significant Native American Indian population is drawn primarily from indigenous Pomo tribes, although Round Valley Indian Tribes in Covelo, the county’s northeastern most community, includes 1,200 tribal members representing Concow, Nomlacki, Wailacki, Yuki, and Pit River, as well as Pomo Indian tribes. The Round Valley reservation is the second largest reservation in the state.
Demographics: Age
Although Californians as a whole continue to be younger than the national average, 17.6% of Lake County residents are age 65 or older and 15.4% of Mendocino County residents are in that age group, compared with a statewide rate of 11.4%. The California Department of Finance has projected that this age group will increase markedly over the next two decades—by 2030, the number of seniors will reach 46,580, a full quarter of the population (26.8% of Lake County residents and 25.3% of
density equal or less than 11 persons per square mile. California Rural Health Policy Council (www.oshpd.ca.gov/RHPC/Resources/northern.html). 10 California Department of Finance, Demographic Research Unit, City Population Estimates.

NORTH COAST OPPORTUNITIES COMMUNITY ACTION PLAN 2014-2015 PAGE 7
Mendocino County residents).11 Among the senior population over the age of 75, over 54% have a disability. The incidence of disabilities doubles between the ages of 65 and 75+, and those 75+ are more likely to suffer from multiple disabilities, indicating an increased need for in-‐home systems of care and caregiver support services.12
Table 5 below details local residents by age. As the table shows, 21.6% of the population in the two-‐county area is under the age of 25 (compared with the statewide rate of 24.9%), while 24,910 (16.3%) members of the community are age 65 or older (compared with 11.4% statewide).
Table 5. Population composition by age13
Geographic Area Preschool (0-‐4 years)
School Age (5-‐17)
College Age (18-‐24 years)
Working Age
(25-‐64 years)
Young Retirees (65-‐74 years)
Mature Retirees (75-‐84 years)
Seniors (85+ year)
Lake County 3,621 5.6%
9,947 15.4%
4,955 7.7%
34,710 53.7%
6,607 10.2%
3,395 5.3%
1,364 2.1%
Mendocino County 5,367 6.1%
14,048 16.0%
6,974 7.9%
47,991 54.6%
7,621 8.7%
3,962 4.5%
1,961 2.2%
Report Area 8,988 5.9%
23,995 15.7%
11,930 7.8%
82,700 54.2%
14,229 9.3%
7,356 4.8%
3,325 2.2%
Demographics: Veteran Status
Table 6 below shows the numbers of veterans living in the two-‐county report area, with the greatest percentage (14.3%) living in Lake County, California. In the combined two-‐county report area, 12.1% of the adult population are veterans, which is higher than the national average of 9.6%.
Table 6. Age and gender demographics of veterans, 2007 -‐ 201114
Geographic Area Veterans Percent of Population over 18 by Gender Total Males Females Total Males Females
Lake County 7,212 6,733 479 14.3 26.8 1.9 Mendocino County 7,134 6,644 490 10.5 19.7 1.4 Report Area 14,346 13,377 969 12.1 22.7 1.6 California 1,997,566 1,868,098 129,468 7.3 13.8 0.9 United States 22,215,300 20,679,890 1,535,409 9.6 18.5 1.3
POVERTY AND FAMILY ECONOMICS
The scenic beauty of rural Northern California belies the reality of life faced by many Lake and Mendocino County residents. According to the US Census, the poverty rate for the two-‐county area increased by 5% between the 2000 and 2010 censuses. The US Census American Community Survey’s 5-‐year estimates for 2007-‐2011 poverty levels show 21.4% of Lake County residents living below the federal poverty level (FPL) and 17.8% of Mendocino County residents (compared with 14.4% statewide). During the same period of time, Lake County’s median household income was $39,525 (64% of the statewide median of $61,632) and Mendocino County’s median was $44,527 (72%). Family income data from the same source show that almost one-‐quarter (23.7%) of Lake County 11 California Department of Finance, Demographic Research Unit. 12 Area Agency on Aging of Lake and Mendocino Counties, 2012-2016 Area Plan Needs Assessment (http://www.co.lake.ca.us/government/directory/social_services/aaa.htm). 13 US Census Bureau, Population Division, Census 2010. 14 US Census Bureau, American Community Survey, 2007-2011 5-year average.

NORTH COAST OPPORTUNITIES COMMUNITY ACTION PLAN 2014-2015 PAGE 8
families and one in five Mendocino County families (19.6%) were living on incomes of $25,000 or less, compared with 15.2% statewide.
In April 2013, Realty Trac reported that 28.7% of Lake County homes were vacant, and 578 homes were listed for sale. At 2.96%, foreclosures in Lake County have tripled since 2007, when there were fewer than 1%, and bankruptcies have also tripled, from 0.48% to 1.55%.15 Not surprisingly, Lake County’s Economic Stress Index, as of May 2011, stood at 20.51, up from 9.34 in October 2007.16 By contrast, in Mendocino County, where the Economic Stress Index is 12.06, the bankruptcy rate was 0.81% (up from .28% in 2007) and the foreclosure rate was 1.43% (compared with 0.38% in 2007). For comparison, the statewide Economic Stress Index was 15.07 in 2011, and the foreclosure and bankruptcy rates were 2.3% and 1.88% respectively.
Table 7 below provides the poverty rates overall and by age group, gender, and ethnic group for each county and the state.
Table 7. Poverty data from the American Community Survey, 2009-‐201117
Living in Poverty Lake County Mendocino County
California
General population 24.6% 18.9% 15.5% GENDER • Female 25.4% 20.0% 16.5%
• Male 23.7% 17.9% 14.5% AGE • Children under age 18 years 37.9% 27.4% 21.6% • Children under 5 years 42.7% 32.4% 23.5% • Families with female head of household with children < 18 57.2% 39.9% 35.5% • Families with female head of household with children < 5 73.9% 58.7% 38.5% • People age 18-‐64 24.4% 18.6% 14.2%
• People age 65 and older 9.3% 8.4% 9.5% RACE/ETHNICITY • Hispanic 37.5% 29.4% 22.3% • Native American Indian 40.0% 44.3% 24.5% • White/non-‐Hispanic 20.1% 13.7% 9.5%
Countywide, 65% of Mendocino County students participated in Free and Reduced Price Meal (FRPM) Programs during the 2011-‐2012 school year, with participation ranging from a low of 37% in Mendocino Township to 100% in Round Valley, as detailed in Figure 2 below.
In Lake County schools, 73% of students participated in FRPM Programs during the 2011-‐2012 school year (up from 68% during the 2010-‐2011 school year), ranging from a low of 45% in Middletown to 93% at the Lake County Office of Education.18 However, it is the worth noting that California Food Policy Advocates estimates that 31% of local students eligible for Free and Reduced Price Meal programs are not enrolled in the program.19
15 Realty Trac, Foreclosure Rate Heat Map (http://www.realtytrac.com/trendcenter/ca-trend.html). 16 Associated Press Economic Stress Index measures the combined impact of unemployment, foreclosures, and bankruptcies (http://hosted.ap.org/specials/interactives/_national/stress_index/). 17 US Census Bureau: American FactFinder (http://factfinder2.census.gov/faces/nav/jsf/pages/index.xhtml) Tables DP03 and S1701, 2009-20111 American Community Survey 3-Year Estimates. 18 California Department of Education, DataQuest (http://data1.cde.ca.gov/dataquest/). 19 California Food Policy Advocates (www.cfpa.net).

NORTH COAST OPPORTUNITIES COMMUNITY ACTION PLAN 2014-2015 PAGE 9
Figure 2
EMPLOYMENT AND UNEMPLOYMENT
Lake County’s economy is based largely on tourism and recreation, largely due to the accessibility and popularity of its numerous lakes and recreational areas and its superior air quality. However, unemployment is high. From a 2000 average of 7%, unemployment rates had more than doubled by 2012. In April 2013, unemployment stood at 15% and ranged from a low of 6.4% in Upper Lake to 19.3% in Clearlake Oaks.20
20 California Employment Development Department, Labor Market Information (http://www.labormarketinfo.edd.ca.gov/).
0% 10% 20% 30% 40% 50% 60% 70% 80% 90% 100%
Middletown Lakeport
LAKE COUNTY Upper Lake High
Kelseyville Upper Lake Elementary
Konocti Lucerne LCOE
Lake County 2011-‐2012 FRPM participation, by district
0% 20% 40% 60% 80% 100% 120%
Mendocino Leggett Ukiah
Laytonville Manchester
Point Arena Joint Union High MENDOCINO COUNTY
Arena Union Elementary Willits
Fort Bragg Potter Valley
Anderson Valley MCOE
Round Valley
Mendocino County 2011-‐2012 FRPM participation, by district
8.3% 9.2% 9.1% 8.0% 7.7% 8.4%
10.5%
15.4%
18.1% 16.8%
15.0%
6.70% 6.90% 6.40% 5.80% 5.20%
5.50% 6.80%
10.30%
11.40%
10.90% 9.70%
0%
2%
4%
6%
8%
10%
12%
14%
16%
18%
20%
2002 2003 2004 2005 2006 2007 2008 2009 2010 2011 2012
Figure 3. Unemployment rates (2002-2012)
Lake County Mendocino County

NORTH COAST OPPORTUNITIES COMMUNITY ACTION PLAN 2014-2015 PAGE 10
Businesses with one to four employees account for 77% of all Lake County establishments. An additional 10% consist of only five to nine employees. The largest employers in the county are in the sectors of services, including health care and social services, educational services, business management, information, and professional services (45%); retail trade (12%); and construction (12%).21
Although Mendocino County once boasted a prime commercial fishery and was a major timber producer, employing many residents with well-‐paid jobs, over the past 15 years low-‐wage tourism and service jobs have replaced these industries. Compared with a 2000 average of 5.6%, the countywide unemployment rate stood at 9.7% in April 2013, ranging from a low of 4.3% in Point Arena to 17.8% in Laytonville. The largest employers in the county are in the sectors of government (15%); retail trade (12%); health care and social assistance (10%); accommodation and food services (9%); construction (7%); and manufacturing (7%).22
A local study released in 2007 pinpointed six areas of economic and workforce development as targets of opportunity for Northern California’s coastal counties. In the report, specialty agriculture was identified as the third fastest growing opportunity, and as having the greatest potential for future growth. Along with the five other targeted opportunities, over the past ten years these sectors have grown in employment and real wages, and each includes elements that are export-‐oriented, population-‐driven, and offer career potential for local residents.23
Table 8. Unemployment, April 2013
Geographic Area Labor Force Employment Unemployment Unemployment Rate Lake County 24,670 21,520 3,150 12.8% Mendocino County 42,070 38,700 3,370 8.0% Report Area 66,740 60,220 6,520 9.8% California 18,624,000 16,951,000 1,673,000 9.0%
EDUCATION
US Census updates from the American Community Survey (2007-‐2011) show that 87.2% of the Lake County population age 25 years and older hold at least a high school diploma (compared to 80.8% statewide), and 16.2% hold a four-‐year college level or higher degree (compared to 30.2% statewide).24 Lake County is served by two community colleges: Mendocino College operates a campus in Lakeport, and Yuba College operates a campus in Clearlake. The nearest four-‐year university is Sonoma State University in Rohnert Park.
For Mendocino County, US Census updates show that 83.6% of the adult population hold a high school diploma, while 22.1% hold a four-‐year college level or higher degree. Mendocino College, a two-‐year community college, is located in Ukiah and also operates a campus in Willits. Humboldt County’s College of the Redwoods has an extension campus in Fort Bragg. Both of these colleges offer two-‐year associate degrees. Sonoma State University, the nearest four-‐year university, also offers some programs in Ukiah.
21 Center for Economic Development, California State University, Chico in Lake County 2009-2010 Economic and Demographic Profile (http://www.cedcal.com/). 22 Ibid. 23 WIA Rapid Response Special Project (2007). Targets of Opportunity: The North Coast Counties of Del Norte, Humboldt, Mendocino, Siskiyou, and Trinity (www.mendowib.org/pdf/RCTO_7-07.pdf ). 24 US Census Bureau: State and County Quick Facts.

NORTH COAST OPPORTUNITIES COMMUNITY ACTION PLAN 2014-2015 PAGE 11
The National Center for Education Statistics produces estimates for adult literacy based on educational attainment, poverty, and other factors in each county. The estimated literacy rate in both counties was 13% in 2003 (compared with 23% statewide).25
Table 9. Percent adults attaining educational levels, 2007-‐2011 American Community Survey (Table S1501)
Geographic Area % No High School Diploma
% High School Graduates Only
% Some College Only
% Associate’s Degree Only
% Bachelors Bachelor’s Degree
% Graduate or Professional Degree Only
Lake County 12.8% 31.4% 31.0% 8.6% 12.0% 4.2% Mendocino 16.4% 25.2% 26.1% 10.2% 13.7% 8.4% Report Area 14.8% 27.9% 28.2% 9.5% 13.0% 6.6% California 19.2% 21.1% 21.8% 7.7% 19.3% 11.0%
There are seven school districts in Lake County and 13 in Mendocino County. In each county, all districts are linked to individual communities, with the exception of County of Education Alternative Education Programs, which serve students who have been expelled, are on probation, are habitual truants, have substance abuse issues, or are pregnant or parenting. Although school enrollment has fallen markedly over the past 10 years, dropping by 12% in both counties, it has now begun to increase, as shown in Figure 4 below.
Figure 4
English learners comprise 10.8% of Lake County students and 19.5% of Mendocino County students. Table 10 below provides enrollment and demographic details for the two counties.
Table 10. Demographics in county schools, 2012-‐2013 school year26
Kindergarten Elementary (grades 1-‐5)
Middle (grades 6-‐8)
High (grades 9-‐12)
TOTAL
LAKE COUNTY Total Enrollment 733 3,453 2,049 2,910 9,145 • African American 2% 2% 2% 2% 2% • Native American Indian 5% 6% 5% 5% 5% • Asian/Pacific Islander 2% 1% 2% 2% 2%
25 US Department of Education, Institute of Education Sciences, National Center for Education Statistics, State and County Estimates of Low Literacy, 2003. This report has not been updated. 26 California Department of Education DataQuest (http://data1.cde.ca.gov/dataquest/).
10,163 10,443 10,325 10,091 9,683 8,734 9,145
15,358 14,908 14,407 13,688 13,305 12,992
13,101
0
5,000
10,000
15,000
20,000
2000 2002 2004 2006 2008 2010 2012
School enrollment (2000-2012)
Lake County Mendocino County

NORTH COAST OPPORTUNITIES COMMUNITY ACTION PLAN 2014-2015 PAGE 12
Kindergarten Elementary (grades 1-‐5)
Middle (grades 6-‐8)
High (grades 9-‐12)
TOTAL
• Hispanic 33% 32% 28% 26% 29% • White/not Hispanic 51% 53% 59% 60% 56% • Other or Multiple 4% 4% 4% 6% 4% • Not Reported 3% 2% 1% <1% 1%
MENDOCINO COUNTY Total Enrollment 1,054 4,885 2,908 4,254 13,101 • African American <1% 1% <1% <1% <1% • Native American Indian 8% 9% 8% 9% 8% • Asian/Pacific Islander <1% 1% 1% 2% 1% • Hispanic 43% 42% 39% 35% 39% • White/not Hispanic 45% 45% 48% 51% 47% • Other or Multiple 3% 2% 2% 2% 2% • Not Reported <1% <1% 1% <1% <1%
At the end of the 2011-‐2012 school year, 25% of Lake County’s 646 graduates and 26% of Mendocino County’s 914 high school graduates met University of California entrance requirements (compared with 38% statewide). Table 11 below provides data for other academic indicators. As the table shows, in each county fewer than half of the students achieved proficiency in English Language Arts (ELA) and Math, compared with 57% at the state level. Among subgroups, testing results are lowest among Native American Indian students, with Hispanic students falling about midway between the results of the total student population and the scores of Native American Indian students.
Table 11. 2011-‐2012 education indicators
Indicator Lake County Mendocino County California Truancy Rate27 26.6% 18.8% 28.5% Adjusted Grade 9-‐12 Dropout Rate 2.8% 2.5% 4.0% STAR Testing: Percent Proficient ELA MATH ELA MATH ELA MATH ALL STUDENTS 47% 44% 47% 44% 57% 57% HISPANIC STUDENTS 37% 39% 35% 37% 46% 48% NATIVE AMERICAN INDIAN STUDENTS 26% 25% 30% 32% 49% 45% California High School Exit Exam (CAHSEE) percent passing (November 2012 testing)
37% 36% 44% 41% 37% 38%
HEALTH AND SOCIAL FUNCTIONING
Health: Children and youth
Economic stresses provide a partial explanation for many of the risk factors that affect the area’s 36,000 children and youth age 0-‐18. The 2012-‐2013 Children Now California County Scorecard reports that Lake County children, compared with children in California’s other 57 counties, are in the bottom third of performance on 11 of 28 indicators of child well being, the middle third on 9 indicators, and the top third on 7 indicators (with data not reported for the remaining 2 indicators). By comparison, Mendocino County children are in the bottom third of performance on 8 of 28 indicators of child well being, the middle third on 14 indicators, and the top third on 5 indicators (with data not reported for the remaining 2 indicators). These findings are detailed in Tables 12 and 13 below.
27 Truancy Rate = number of students with 3 or more unexcused absences ÷ total enrollment.

NORTH COAST OPPORTUNITIES COMMUNITY ACTION PLAN 2014-2015 PAGE 13
Table 12. Lake County Children Now 2012-‐2013 Scorecard28
Indicator Ranking and Percent
Trend Bottom Mid Top
1. Women who receive early prenatal care 64% ⇘ -‐12% 2. Newborns who are exclusively breastfed while in the hospital 69% NA 3. Young children who are read to every day. NA 4. Children age 0-‐3 who do not experience recurring abuse or neglect 100% ⇗ +18% 5. 3-‐ and 4-‐year-‐olds who attend preschool NA 6. 3rd-‐graders who read at grade level 39% ⇗ +30% 7. 7th-‐graders who meet or exceed state standards in math 42% ⇗ +42% 8. Elementary/middle students supervised by an adult after school 59% ⇗ +15% 9. Students “ready” or “conditionally ready” for college-‐level math 46% ⇗ +24% 10. 12th-‐graders who graduate on time 80% ⇘ -‐1% 11. Classrooms with high-‐speed internet access 100% NA 12. High school science classes taught by “highly qualified teacher” 95% ⇗ +6% 13. Children who feel connected to their school 43% ⇗ +44% 14. Suspensions that are limited to serious offenses, not willful defiance 56% ⇗ +9% 15. Expulsions that are limited to serious offenses, not willful defiance 95% ⇗ +12% 16. Children who are in a healthy weight zone 68% ⇗ +7% 17. Eligible students who eat free/reduced price breakfasts at school 43% ⇗ +4% 18. Children who live near groceries, produce stands, farmers markets 67% ⇗ +25% 19. Eligible students who eat free/reduced price breakfasts in summer 1% ⇘ -‐89% 20. Schools that have a health center 0% No change
21. Children who have health insurance for the entire year 91% ⇗ +16% 22. Children who have a usual source of health care 91% NA 23. Asthmatic children with an asthma management plan 31% NA 24. Adolescents who are not at risk for depression 68% ⇗ +8% 25. Children who have visited a dentist in the last year 90% NA 26. Children in the welfare system who visited a dentist in the last year 81% ⇗ +8% 27. Children in the welfare system who have placement stability 73% ⇘ -‐11% 28. Children in the welfare system who exit to permanency in 3 years 85% ⇗ +20%
Table 13. Mendocino County Children Now 2012-‐2013 Scorecard
Indicator Ranking and Percent
Trend Bottom Mid Top
1. Women who receive early prenatal care 67% ⇗ +16% 2. Newborns who are exclusively breastfed while in the hospital 70% NA 3. Young children who are read to every day. NA 4. Children age 0-‐3 who do not experience recurring abuse or neglect 85% ⇗ +1% 5. 3-‐ and 4-‐year-‐olds who attend preschool NA 6. 3rd-‐graders who read at grade level 27% No change
7. 7th-‐graders who meet or exceed state standards in math 39% ⇗ +105% 8. Elementary/middle students supervised by an adult after school 57% ⇗ +9% 9. Students “ready” or “conditionally ready” for college-‐level math 60% ⇗ +2% 10. 12th-‐graders who graduate on time 78% ⇗ +6% 11. Classrooms with high-‐speed internet access 93% NA 12. High school science classes taught by “highly qualified teacher” 97% ⇗ +7% 13. Children who feel connected to their school 44% ⇗ +38%
28 Children Now 2012-2013 County Scorecard (http://scorecard.childrennow.org/2012/).

NORTH COAST OPPORTUNITIES COMMUNITY ACTION PLAN 2014-2015 PAGE 14
Indicator Ranking and Percent
Trend Bottom Mid Top
14. Suspensions that are limited to serious offenses, not willful defiance 32% ⇘ -‐40% 15. Expulsions that are limited to serious offenses, not willful defiance 92% ⇗ +7% 16. Children who are in a healthy weight zone 64% ⇘ -‐5% 17. Eligible students who eat free/reduced price breakfasts at school 41% ⇗ +10% 18. Children who live near groceries, produce stands, farmers markets 73% ⇗ +46% 19. Eligible students who eat free/reduced price breakfasts in summer 12% ⇘ -‐45% 20. Schools that have a health center 0% No change
21. Children who have health insurance for the entire year 91% ⇗ +5% 22. Children who have a usual source of health care 92% NA 23. Asthmatic children with an asthma management plan 42% NA 24. Adolescents who are not at risk for depression 69% ⇗ +5% 25. Children who have visited a dentist in the last year 89% NA 26. Children in the welfare system who visited a dentist in the last year 88% ⇗ +32% 27. Children in the welfare system who have placement stability 69% ⇗ +4% 28. Children in the welfare system who exit to permanency in 3 years 89% ⇗ +11%
At 6.0/1,000, the rate of substantiated reports of child abuse in Lake County in 2012 was well below the statewide rate of 8.9/1,000. However, Mendocino County’s 2012 rate of 19.4/1,000 was more than double the state rate. Lake County’s 2012 foster care entry rate of 9.2/1,000 is higher than the statewide rate of 5.6/1,000, placing the county in the high-‐to-‐mid range (50th-‐-‐74th percentile) in comparison with other California counties. Mendocino County’s foster care entry rate of 10.1/1,000 places is in the high range (75th-‐99th percentile) in comparison with other counties.29
Health: Mortality and morbidity
The Robert Wood Johnson Foundation (RWJF) County Health Rankings for 2013 place Lake County at 57 for overall health outcomes, worse than all but one other California county; Mendocino County is ranked at 43. Published by the University of Wisconsin Population Health Institute and the Robert Wood Johnson Foundation, the Health Rankings look at a variety of measures (e.g., the rate of people dying before age 75, high school graduation rates, access to healthier foods, air pollution levels, income, and rates of smoking, obesity and teen births) to help counties understand the factors that influence resident health.
Table 14. RWJF Health Rankings30 (higher numbers indicate worse outcomes, in comparison with California’s 58 counties)
Geographic Area Health Outcomes Health Factors Overall Mortality
(premature death)
Morbidity (health
condition)
Overall Health Behaviors (smoking, activity, diet)
Clinical Care (insurance coverage, physician
ratio, health screening)
Social & Economic Factors
(education, employment,
social support)
Physical Environment
(air and water
quality, fast foods)
Lake County 57 57 38 50 57 45 49 20 Mendocino County 43 50 27 31 36 27 43 3
Cancers and coronary heart disease are the most frequent causes of death in Lake and Mendocino County. Lake County’s 2009-‐2011 age-‐adjusted death rate of 989.2 per 100,000 population is higher
29 UC Berkeley Center for Social Services Research (http://cssr.berkeley.edu/ucb_childwelfare/RefRates.aspx). 30 RWJF Health Rankings (http://www.countyhealthrankings.org).
NORTH COAST OPPORTUNITIES COMMUNITY ACTION PLAN 2014-2015 PAGE 15
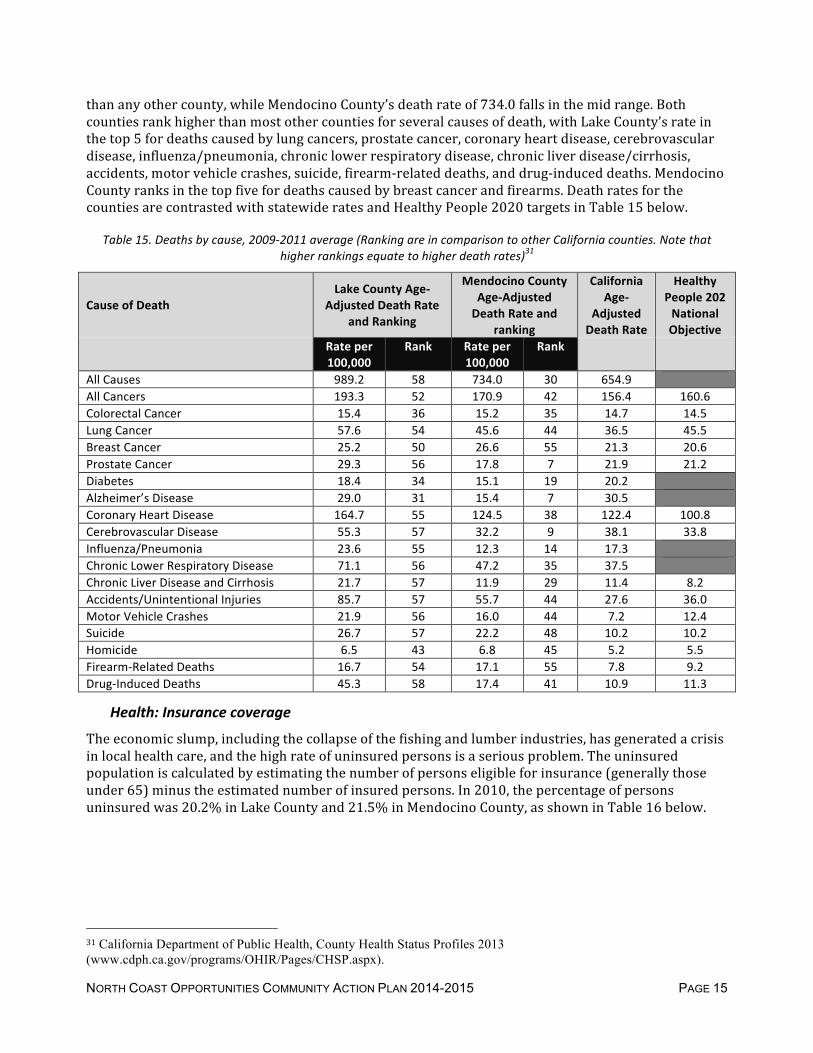
than any other county, while Mendocino County’s death rate of 734.0 falls in the mid range. Both counties rank higher than most other counties for several causes of death, with Lake County’s rate in the top 5 for deaths caused by lung cancers, prostate cancer, coronary heart disease, cerebrovascular disease, influenza/pneumonia, chronic lower respiratory disease, chronic liver disease/cirrhosis, accidents, motor vehicle crashes, suicide, firearm-‐related deaths, and drug-‐induced deaths. Mendocino County ranks in the top five for deaths caused by breast cancer and firearms. Death rates for the counties are contrasted with statewide rates and Healthy People 2020 targets in Table 15 below.
Table 15. Deaths by cause, 2009-‐2011 average (Ranking are in comparison to other California counties. Note that higher rankings equate to higher death rates)31
Cause of Death Lake County Age-‐
Adjusted Death Rate and Ranking
Mendocino County Age-‐Adjusted Death Rate and
ranking
California Age-‐
Adjusted Death Rate
Healthy People 202 National Objective
Rate per 100,000
Rank Rate per 100,000
Rank
All Causes 989.2 58 734.0 30 654.9 All Cancers 193.3 52 170.9 42 156.4 160.6 Colorectal Cancer 15.4 36 15.2 35 14.7 14.5 Lung Cancer 57.6 54 45.6 44 36.5 45.5 Breast Cancer 25.2 50 26.6 55 21.3 20.6 Prostate Cancer 29.3 56 17.8 7 21.9 21.2 Diabetes 18.4 34 15.1 19 20.2 Alzheimer’s Disease 29.0 31 15.4 7 30.5 Coronary Heart Disease 164.7 55 124.5 38 122.4 100.8 Cerebrovascular Disease 55.3 57 32.2 9 38.1 33.8 Influenza/Pneumonia 23.6 55 12.3 14 17.3 Chronic Lower Respiratory Disease 71.1 56 47.2 35 37.5 Chronic Liver Disease and Cirrhosis 21.7 57 11.9 29 11.4 8.2 Accidents/Unintentional Injuries 85.7 57 55.7 44 27.6 36.0 Motor Vehicle Crashes 21.9 56 16.0 44 7.2 12.4 Suicide 26.7 57 22.2 48 10.2 10.2 Homicide 6.5 43 6.8 45 5.2 5.5 Firearm-‐Related Deaths 16.7 54 17.1 55 7.8 9.2 Drug-‐Induced Deaths 45.3 58 17.4 41 10.9 11.3
Health: Insurance coverage
The economic slump, including the collapse of the fishing and lumber industries, has generated a crisis in local health care, and the high rate of uninsured persons is a serious problem. The uninsured population is calculated by estimating the number of persons eligible for insurance (generally those under 65) minus the estimated number of insured persons. In 2010, the percentage of persons uninsured was 20.2% in Lake County and 21.5% in Mendocino County, as shown in Table 16 below.
31 California Department of Public Health, County Health Status Profiles 2013 (www.cdph.ca.gov/programs/OHIR/Pages/CHSP.aspx).

NORTH COAST OPPORTUNITIES COMMUNITY ACTION PLAN 2014-2015 PAGE 16
Table 16. Health insurance coverage32
Geographic Area Insurance Population (2010 Estimate)
Number Insured Number Uninsured Percent Uninsured
Lake County 52,972 42,246 10,726 20.2 Mendocino County 73,668 57,810 15,858 21.5 Report Area 126,640 100,056 26,584 21.0 California 32,504,288 25,784,009 6,720,279 20.7 United States 262,403,379 215,846,576 46,556,803 17.7
As of April 2013, Medi-‐Cal enrollment in the two-‐county area stood at 38,796: 16,794 in Lake County (26% of the population) and 22,002 in Mendocino County (25% of the population).33 At the same point in time, 3,104 children were enrolled in the Healthy Families insurance program in the two-‐county area (1,231 in Lake County and 1,873 in Mendocino County).34 As shown in Tables 12 and 13 above, both counties are in the mid range for children’s health insurance coverage, with 91% reporting full-‐year coverage.
In the two-‐county area, a total of 31,315 persons were receiving Medicare (including both disabled persons and those over 65) in 2010, accounting for 20.4% of the total population.
Table 17. Medicare enrollment by county, April 201335
Geographic Area Persons Over 65 Receiving Medicare
Disabled Persons Receiving Medicare
Total Persons Receiving Medicare
Lake County 10,655 3,539 14,194 Mendocino County 13,430 3,691 17,121 Report Area 24,085 7,230 31,315 California 4,053,654 667,111 4,720,765 United States 38,802,763 7,865,374 46,668,299
Health: Access to care
Like many rural areas, Mendocino and Lake County suffer from a lack of access to health care providers and infrastructure. As a result of geographic isolation and limited access to health care, the US Health Resources and Services Administration has designated 5 Lake County census tracts as Medically Underserved Areas (MUA). There are also 8 designated Health Professional Shortage Areas (HPSA) for primary health care in the county, 2 dental HPSAs, and 3 mental health care HPSAs. Mendocino County’s Medicaid-‐Eligible Population has been designated as a Medically Underserved Population (MUP) and there are also 21 designated HPSAs for primary health care, 10 for dental care, and 9 for mental health care.36
A 2011 survey conducted by the California Health Care Foundation found that Mendocino County physicians are, as a group, among the oldest in the state, with half of the county’s physicians over the age of 56. In Lake County, 45% are over the age of 56.37 According to the Council on Graduate Medical
32 US Census Bureau, Small Area Health Insurance Estimates, 2010 (October 2012 release). 33 California Department of Health Care Services, Research and Analytical Studies Section (www.dhcs.ca.gov/dataandstats/statistics/). 34 California Managed Risk Medical Board (www.mrmib.ca.gov/MRMIB/CountyList.html). 35 US Department of Health and Human Services, Centers for Medicare and Medicaid Services, Medicare County Enrollment Report, as of July 1 2010. (http://www.cms.hhs.gov/MedicareEnrpts/). 36 US Dept. of Health and Human Services, Health Resources and Services Administration, (http://hpsafind.hrsa.gov/HPSASearch.aspx). 37 California Health Care Foundation, Center for Health Reporting (http://www.chcf.org/publications/2009/06/fewer-and-more-specialized--a-new-assessment-of-physician-supply-in-california).
NORTH COAST OPPORTUNITIES COMMUNITY ACTION PLAN 2014-2015 PAGE 17
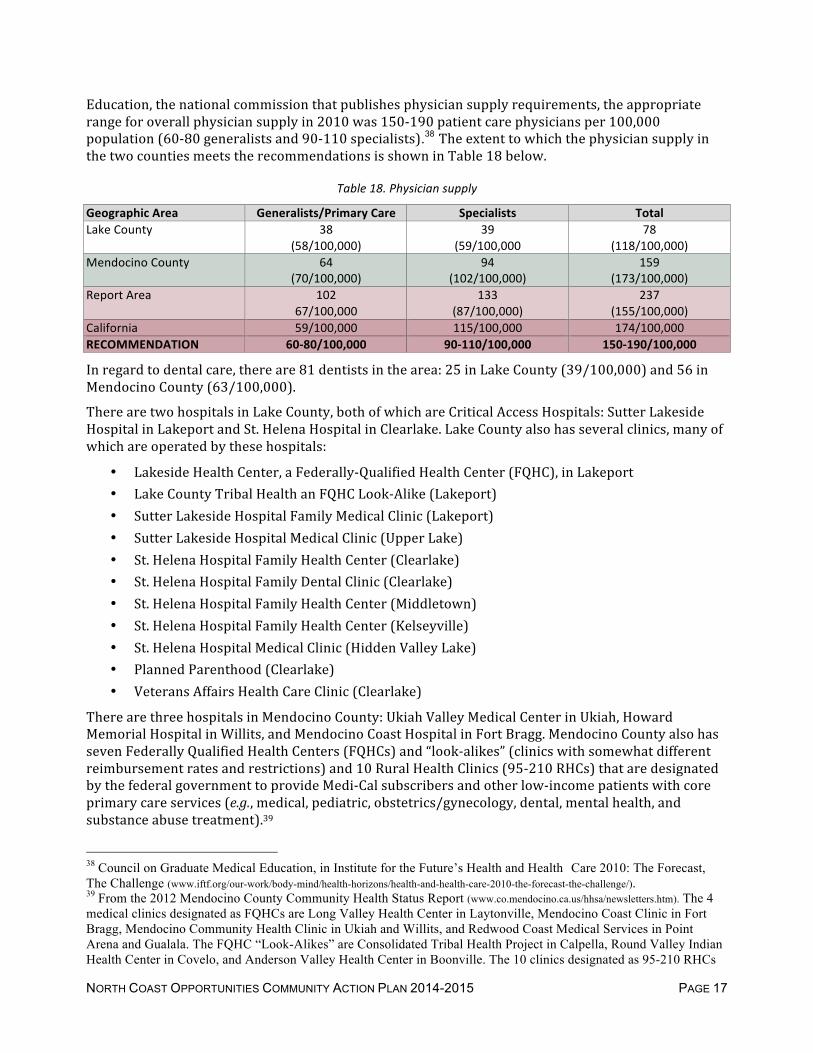
Education, the national commission that publishes physician supply requirements, the appropriate range for overall physician supply in 2010 was 150-‐190 patient care physicians per 100,000 population (60-‐80 generalists and 90-‐110 specialists).38 The extent to which the physician supply in the two counties meets the recommendations is shown in Table 18 below.
Table 18. Physician supply
Geographic Area Generalists/Primary Care Specialists Total Lake County 38
(58/100,000) 39
(59/100,000 78
(118/100,000) Mendocino County 64
(70/100,000) 94
(102/100,000) 159
(173/100,000) Report Area 102
67/100,000 133
(87/100,000) 237
(155/100,000) California 59/100,000 115/100,000 174/100,000 RECOMMENDATION 60-‐80/100,000 90-‐110/100,000 150-‐190/100,000
In regard to dental care, there are 81 dentists in the area: 25 in Lake County (39/100,000) and 56 in Mendocino County (63/100,000).
There are two hospitals in Lake County, both of which are Critical Access Hospitals: Sutter Lakeside Hospital in Lakeport and St. Helena Hospital in Clearlake. Lake County also has several clinics, many of which are operated by these hospitals:
• Lakeside Health Center, a Federally-‐Qualified Health Center (FQHC), in Lakeport • Lake County Tribal Health an FQHC Look-‐Alike (Lakeport) • Sutter Lakeside Hospital Family Medical Clinic (Lakeport) • Sutter Lakeside Hospital Medical Clinic (Upper Lake) • St. Helena Hospital Family Health Center (Clearlake) • St. Helena Hospital Family Dental Clinic (Clearlake) • St. Helena Hospital Family Health Center (Middletown) • St. Helena Hospital Family Health Center (Kelseyville) • St. Helena Hospital Medical Clinic (Hidden Valley Lake) • Planned Parenthood (Clearlake) • Veterans Affairs Health Care Clinic (Clearlake)
There are three hospitals in Mendocino County: Ukiah Valley Medical Center in Ukiah, Howard Memorial Hospital in Willits, and Mendocino Coast Hospital in Fort Bragg. Mendocino County also has seven Federally Qualified Health Centers (FQHCs) and “look-‐alikes” (clinics with somewhat different reimbursement rates and restrictions) and 10 Rural Health Clinics (95-‐210 RHCs) that are designated by the federal government to provide Medi-‐Cal subscribers and other low-‐income patients with core primary care services (e.g., medical, pediatric, obstetrics/gynecology, dental, mental health, and substance abuse treatment).39
38 Council on Graduate Medical Education, in Institute for the Future’s Health and Health Care 2010: The Forecast, The Challenge (www.iftf.org/our-work/body-mind/health-horizons/health-and-health-care-2010-the-forecast-the-challenge/). 39 From the 2012 Mendocino County Community Health Status Report (www.co.mendocino.ca.us/hhsa/newsletters.htm). The 4 medical clinics designated as FQHCs are Long Valley Health Center in Laytonville, Mendocino Coast Clinic in Fort Bragg, Mendocino Community Health Clinic in Ukiah and Willits, and Redwood Coast Medical Services in Point Arena and Gualala. The FQHC “Look-Alikes” are Consolidated Tribal Health Project in Calpella, Round Valley Indian Health Center in Covelo, and Anderson Valley Health Center in Boonville. The 10 clinics designated as 95-210 RHCs

NORTH COAST OPPORTUNITIES COMMUNITY ACTION PLAN 2014-2015 PAGE 18
In Lake County, mental health services are provided by the county mental health department, the County Office of Education, non-‐profit providers, and five of the clinics listed above.40 Mendocino County has recently awarded contracts for the provision of mental health services that have historically been provided by the county.
With a population that is older and poorer, and with less employer-‐based health insurance coverage, a larger segment of a rural county’s population is dependent upon public programs such as Medi-‐Cal, Medicare, and Healthy Families. The cost of health care, including dental and mental health services, creates a barrier for people who are not covered by some form of health insurance, which includes many residents who are in small businesses or self-‐employed. Institutional Medicare and Medicaid providers, including hospitals, nursing facilities, Federally qualified health centers, rural health clinics and community mental health centers for the two-‐county report area are shown in Table 19 below. According to the US Department of Health and Human Services, there were 61 active Medicare and Medicaid institutional service providers in the report area in 2011.
Table 19. Institutional Medicare and Medicaid providers, second quarter, 201141
Geographic Area Total Institutional Providers
Hospitals Nursing Facilities
Federally Qualified
Health Centers
Rural Health Clinics
Community Mental Health
Centers Lake County 24 2 3 2 8 0 Mendocino County 37 3 4 8 9 1 Report Area 61 5 7 10 17 1
CHILD CARE42
According to US Census data, about 13% of Lake County residents are under the age of 13 and about 3,500 (5.5%) are age 0-‐5. In Mendocino County, 16% are under the age of 13 and 6.1% are age 0-‐5. In Lake County, 56% of the parents of children age 0-‐12 are in the workforce, compared with 69% in Mendocino County and 64% statewide. Many families with children rely on publicly funded or supplemented licensed child care; current data for child care in the service area is drawn from NCO’s Rural Communities Child Care and the California Child Care Resource and Referral Network.
Table 20. Availability of licensed child care by area, income, and age, January 2012.43
# Child Care
Homes # Child Care Centers
Centers for Low
Income
Children Served
0-‐2 yrs old
Children Served
3-‐5 yrs old Mendocino County 87 48 23 121 247 Ukiah 40 20 9 75 148 Willits 7 8 3 5 14 Fort Bragg 25 6 3 28 50
include 5 clinics under Ukiah Valley Primary Care Medical Group (UVPC) and Dr. Rushton Clinic in Ukiah; Baechtel Creek Medical Clinic in Willits; and Women’s Health Medical Center, Mendocino Coast Pediatric Medical Group, and Mendocino Medical Associates in Fort Bragg. 40 Lakeside Health Center, Lake Country Tribal Health, St. Helena Family Health Center in Clearlake, St. Helena Family Health Center in Kelseyville, and the Veterans Affairs Health Care Clinic in Clearlake. 41 US Department of Health and Human Services, Centers for Medicare and Medicaid Services, Provider of Services File, Second Quarter, 2011 (http://www.cms.gov/Research-Statistics-Data-and-Systems/Files-for-Order/NonIdentifiableDataFiles/ProviderofServicesFile.html). 42 Information in this section is extracted from the 2012-2015 NCO Head Start Community Assessment. 43 California Child Care Resource and Referral Network (www.rrnetwork.org/rr-research-in-action/2011-california-child-care.html).

NORTH COAST OPPORTUNITIES COMMUNITY ACTION PLAN 2014-2015 PAGE 19
# Child Care
Homes # Child Care Centers
Centers for Low
Income
Children Served
0-‐2 yrs old
Children Served
3-‐5 yrs old Other Areas (Redwood Valley, Hopland, Potter Valley, Booneville, Gualala, Caspar, Point Arena, Mendocino, Talmage, Westport, Leggett, Laytonville, Covelo)
15 14 8 13 35
Lake County 72 27 22 97 163 Lakeport 20 6 4 9 25 Clearlake 15 8 8 42 55 Upper Lake 5 3 2 1 2 Other Areas (Middletown, Lower Lake, Hidden Valley Lake, Cobb, Clearlake Oaks, Finely, Kelseyville, Lucerne, Nice)
32 10 8 45 81
• In 2011, the supply of licensed child care in Mendocino County was 2,477 slots, or 46% of the estimated total 5,347 slots needed to accommodate all children age 0-‐5 requiring child care.
• In 2011, the supply of licensed child care in Lake County was 1,683 slots, or 77% of the estimated total 2,165 slots needed to accommodate all children age 0-‐5 requiring child care.
• Many child care centers do not meet the needs of families working full days, evenings, weekends, or non-‐traditional shifts and there is a shortage of odd-‐hour care.44 Of the centers listed above, 32 child care homes provide non-‐traditional hours in Lake County and 1 center and 40 child care homes provide non-‐traditional hours in Mendocino County. All providers are required to take disabled children. However, some providers are better equipped to do so and have more experience than others. Rural Communities Child Care retains files and information on the nature of providers’ experience so that parents can make informed decisions.
• In 2011, there were 96 license-‐exempt child care providers in Mendocino County and 129 license-‐exempt child care providers in Lake County.45 These providers are often temporary and are not available to the general public. Consequently, at least 71% of children age 0-‐13 in Mendocino County and 72% in Lake County are not receiving child care because slots are not available, according to the Lake County Child Care Needs Assessment 2007.
• Many geographic areas in the two counties are so isolated that no centers or licensed child care homes are available. Many other families are unable to access available quality care because of lack of transportation, non-‐traditional work hours, lack of linguistic or cultural compatibility, special needs, and prohibitive cost.
Child care, especially for younger children, consumes significant amounts of family income, and without subsidies, many families could not afford child care. To be affordable, child care should cost no more than 10-‐13% of family income.46 Working families who have two children in child care can easily spend up to $1,000 per month on child care for two children. With only one wage earner working full time at California’s minimum wage of $8 per hour ($16,640/year), full-‐time licensed care for one
44 NCO/Rural Communities Child Care, Resource and Referral Program. 45 License-exempt childcare providers must be at least 18 years old and have a California identification card or driver's license as well as a social security card, but are not required to have any training in early childhood development or the care of very young children. They are limited to caring for children from only one family (often their own). 46 Getting Help with Child Care Expenses, L. Giannarelli, S. Adelman, and S. Schmidt, The Urban Institute, 2003.

NORTH COAST OPPORTUNITIES COMMUNITY ACTION PLAN 2014-2015 PAGE 20
preschool child could easily account for 43% of annual income, and unsubsidized child care plus housing could consume the entire income.47
NUTRITION AND FOOD SECURITY
The US Department of Agriculture’s (USDA) interactive food desert locator map for 201048 provides data on the number and percent of people who live within specified distances of a supermarket. These data are provided in Table 21 below. Note that 6 of Lake County’s 15 census tracts and 9 of Mendocino County’s 20 tracts are considered low-‐access tracts, areas where there are no nearby supermarkets or large grocery stores for some residents. In these areas, there are a total of 18,841 residents with limited access to markets, about 28% of the population living in these census tracts.
Table 21. USDA food deserts in project area
Community
Census Tract Pop. Rural/ Urban
Low Access Tract
Low-‐ Income Tract
Number with Low Access at
1 mile
Number Low-‐Income, Low-‐
Access at ½ mile LAKE COUNTY
Nice 06033000502 2,703 Urban YES YES 427 (16%) 593 (22%) Clearlake Oaks 06033000701 4,343 Rural No YES 2,500 (58%) 2,427 (56%) Clearlake 06033000702 4,029 Urban YES YES 217 (5%) 1,895 (47%) Clearlake 06033000801 2,894 Urban YES YES 450 (16%) 940 (33%) Clearlake 06033000802 4,234 Urban YES YES 9 (<1%) 735 (17%) Lakeport 06033001000 6,045 Rural No YES 6,011 (99%) 2,498 (41%)
MENDOCINO COUNTY Fort Bragg 06045010400 3,467 Urban YES YES 234 (7%) 412 (12%) Fort Bragg 06045010500 4,439 Urban YES YES 53 (1%) 632 (14%) Willits 06045010700 6,203 Urban YES YES 707 (11%) 647 (10%) Comptche 06045011200 3,293 Rural YES YES 2,914 (88%) 1,735 (53%) Ukiah 06045011300 5,972 Urban YES YES 2,258 (38%) 2,299 (39%) Ukiah 06045011500 6,739 Urban YES YES 1 (<1%) 595 (9%) Ukiah 06045011600 5,802 Urban YES YES 0 663 (11%) Ukiah 06045011700 4,181 Rural No YES 3,856 (92%) 1738 (42%) Anderson Valley 06045011800 2,082 Rural YES YES 2,081 (99%) 1,040 (50%) TOTAL 66,426 21,718 (33%) 18,849 (28%)
In 2009, the California Health Interview Survey (CHIS) found that one-‐third of Lake and Mendocino County families with incomes below 200% of the federal poverty level had difficulty reliably putting food on the table in the previous year.49
In Lake County food stamp enrollment has risen by 82% over the past five years, increasing from 2,825 households in July 2008 to 5,137 of the county’s 26,548 households (19%, representing 10,200 individuals) in March 2013. Food Stamp enrollment in Mendocino County rose by 126% from 2008 to March 2013, increasing from 3,100 to 6,991 households (20% of the county’s 34,945 households, representing 13,163 individuals). By comparison, the current state average is just over 15%.50 Note, however, that California Food Policy Advocates estimates that 33% of eligible California households
47 California Child Care Portfolio 2009 (www.rrnetwork.org). 48 USDA Food Desert Locator (http://www.ers.usda.gov/data/fooddesert/fooddesert.html). 49 California Health Interview Survey (http://www.chis.ucla.edu/). Although the CHIS was repeated in 2011, data for Lake and Mendocino Counties are grouped with 25 other Northern California counties and are not reported separately. 50 California Department of Social Services, Food Stamp Participation and Benefit Issuance Report DFA-256 for March 2013 (http://www.dss.cahwnet.gov/research/PG352.htm).

NORTH COAST OPPORTUNITIES COMMUNITY ACTION PLAN 2014-2015 PAGE 21
are not enrolled in the food stamp program.51 Although the reasons eligible people do not apply for food stamps are not well understood, several factors are likely: the stigma associated with utilizing food stamps, misunderstandings about eligibility requirements, and concerns about immigration and other legal issues. At mild and moderate levels, food insecurity contributes to anxiety and worry, and often results in adjusting the household budget to forego other basic needs in order to make sure that family members are fed. Very low food security results in the disruption of eating patterns and reduced food intake.
Ironically, poverty and food insecurity are associated with increased obesity, due in part to the fact that cheaper and more readily available food is often of lower quality, more processed, and less nutritious.
• 65% of Lake County adults and 63% of Mendocino County adults are obese or overweight (compared with 57% statewide).52
• 4,000 Lake County residents, and 4,000 Mendocino County residents, have been diagnosed with Type II diabetes.53 These numbers represent 2008 rates of 9.2% and 7.1%, respectively, compared with 8.1 statewide for that year.54 According to the California Diabetes Program, the prevalence of type 2 diabetes continues to increase at epidemic proportions, both nationally and within the state of California. A complex mix of socioeconomic factors and lifestyle choices have contributed to the increased rates of diabetes.
• According to Children Now, 18% of Lake county children, and 16% of Mendocino County children are overweight for their age, compared with 11% statewide,55 and only 68% of Lake County children and 64% of Mendocino County children are in the healthy weight zone, compared with 69% statewide.56
• Lake and Mendocino County residents consume 49 gallons of soft drinks per capita every year, compared with 56 gallons per capita statewide.57
• In 2006, overweight, obesity, and physical inactivity cost Lake County an estimated $78 million and Mendocino County an estimated $47 million due to direct health care costs, worker’s compensation, absenteeism and presentee-‐ism (not being productive at work).58
• The physical inactivity rate is 17.5% in Lake County and 16.8% in Mendocino County.59
According to Children Now, only 68% of Lake County children and 64% of Mendocino County children are in the healthy weight zone. To assess student fitness, school-‐based physical fitness testing is used to identify students that are in the high fitness zone (HFZ), and those that are in need of improvement and at high risk, in six specific physical fitness areas. The results for body composition, detailed in Table 22 below, show the imperative of working to improve the fitness of local children and youth.
51 California Food Policy Advocates (2010). Improving Access to Food for Low-Income Families: The Food Stamp Program. A nutrition policy profile prepared by Prevention Institute for the Center for Health Improvement (CHI): www.preventioninstitute.org. 52 California Food Policy Advocates, 2010 County Profiles (http://cfpa.net/county-profiles-2010). 53 Ibid. 54 National Diabetes Surveillance System. Atlanta (GA): Centers for Disease Control and Prevention; 2010. http://apps.nccd.cdc.gov/ddtstrs/. 55 California Food Policy Advocates, 2010 County Profiles (http://cfpa.net/county-profiles-2010). 56 Children Now 2012-2013 County Scorecard (http://scorecard.childrennow.org/2012/). 57 Centers for Disease Control and Prevention (http://diabetes-obesity.findthedata.org/q/2633/4300/What-was-the-obesity-rate-in-Lake-County-CA-in-2008). 58 California Center for Public Health Advocacy (2006). The Economic Costs of Overweight, Obesity, and Physical Inactivity Among California Adults. Chenoweth & Associates, Inc. New Bern, North Carolina, July 2009. 59 Centers for Disease Control and Prevention (http://diabetes-obesity.findthedata.org/q/2633/4300/What-was-the-obesity-rate-in-Lake-County-CA-in-2008).

NORTH COAST OPPORTUNITIES COMMUNITY ACTION PLAN 2014-2015 PAGE 22
Table 22. Physical fitness testing: body composition, 2011-‐201260
Geographic Area 5th graders 7th graders 9th graders HFZ High-‐Risk HFZ High-‐Risk HFZ High-‐Risk Lake County 53% 33% 54% 29% 63% 20% Mendocino County 49% 35% 50% 35% 52% 31% California 53% 34% 55% 30% 59% 25%
Research has shown fast food and energy-‐dense foods (those containing more calories per volume) are more available in in lower-‐income and minority neighborhoods, and that residents in these neighborhoods are more likely to be overweight or obese and have higher rates of diabetes. In Mendocino County, there are an average of two fast food restaurants and convenience stores for every one place to buy fresh fruits and vegetables. In the county’s largest cities—Fort Bragg, Ukiah, and Willits—the ratio ranges from more than 2:1 in Fort Bragg to more than 5:1 in Willits. Analysis of Mendocino County’s food environment, using the Retail Food Environment Index (RFEI) process, revealed a moderate positive correlation between the percentage of the population living below the poverty level and the ratio of fast food and convenience stores to healthy food outlets. There is also a moderate positive correlation between the percentage of Hispanic residents in a census tract and the ratio of fast food and convenience stores to healthy food outlets. These data mean that there is a tendency for there to be more fast food and convenience stores in Hispanic and lower-‐income neighborhoods, and fewer grocery stores and farmers markets. This situation often results in unhealthy diets that are higher in fats and sugars, and lower in fresh fruits and vegetables.
The UCLA Center for Health Policy Research Home and School Retail Food Environment Index (HSRFEI) is constructed by dividing the number of fast food restaurants, convenience stores (including gas stations with attached convenience stores), liquor stores, dollar stores, and pharmacies by the number of grocery stores (including supermarkets), warehouse stores, and produce vendors (including produce stores and farmer’s markets) within 0.5 miles of the adolescent’s school and within a given radius around their home (one mile in urban areas, two miles in smaller cities and suburban areas, and five miles in rural areas). The HSRFEI is an indicator of the density of food outlets that are less likely to carry healthy foods, such as fresh produce, relative to those that are more likely to have such healthy options available. Cutoffs ratings of 5.0 and 8.0 were selected to provide sufficient sample size to support descriptive analyses using the HSRFEI. Although an HSRFEI of less than 5.0 represents a healthier food environment relative to an HSRFEI of 8.0 and above, it does not necessarily represent the optimal mix of food outlets for a community.
The average HSRFEI for California adolescents is 7.9, meaning the average California teen has more than seven times as many fast food restaurants, convenience stores, liquor stores, dollar stores, and pharmacies near home and school as they do grocery stores, warehouse stores, and produce vendors. Nearly 75% of California teens live and go to school in less healthy food environments (HSRFEI of at least 5.0), while only 21% do so in healthier food environments (HSRFEI of less than 5.0).
The rural nature of Lake and Mendocino Counties helps to keep the HSRFEI numbers lower than they might otherwise be—Mendocino County’s HSRFEI is 3.5, less than half of the statewide figure. Although Lake County’s HSRFEI is quite a bit higher, at 6.2, it is still below the statewide figure.61
Residents in both counties are demonstrating an increasing interest in developing strong localized economies that produce healthy food for local use. However, localization efforts are hampered by insufficient local production, which is the greatest gap in local food systems. According to the
60 California Department of Education, DataQuest (http://data1.cde.ca.gov/dataquest). 61 UCLA Center for Health Policy Research (http://healthpolicy.ucla.edu/publications/Pages/default.aspx). The data on which the HSRFEI are based are drawn from the 2007 CHIS, and may have changed although a new report has not been generated.

NORTH COAST OPPORTUNITIES COMMUNITY ACTION PLAN 2014-2015 PAGE 23
Mendocino County Agriculture Commissioner, 320 acres were under vegetable cultivation in 2011, producing 0.05% of the year’s agricultural value. For the same year, Lake County reported only 20 acres under vegetable cultivation, down from 23 acres in 2010. The total gross agricultural value for commodities produced in 2011 in both counties represented slight increases from 2010.62 Other gaps in local food security systems include:
• Individual food security—limited understanding of nutrition, minimal cooking skills, and limited access to fresh local produce.
• Market coordination—local production designed for other areas, while local markets import food grown in other areas, resulting in undeveloped relationships between producers, buyers, and consumers. Market analysts say that a single bite of food has traveled, on average, 1,500 miles before it is eaten.
• Community food security—school and business policies that inhibit purchasing from local producers, and a workforce that therefore does not consider production for local use a viable economic option. Surveys of local markets to determine the extent to which markets are selling local produce, as well as their capacity to feed their communities in the event of blocked delivery routes, found that most of the food sold locally is trucked in from other areas, and that in smaller communities, food supplies would last for less than a week if deliveries were disrupted.
HOUSING
Housing prices in both counties have risen significantly over the past two years. As of April 2013, the median purchase price of a house in Lake County was $156,670, up 32% from the July 2011 median of $118,890. In Mendocino County, the median price was $350,000, up 82% from the April 2011 median of $192,500.63 In the two-‐county area, the number of homeowners increased by 3% between the 2000 and 2010 censuses, from 37,297 to 38,503.
Residential and business vacancy rates reported by the US Postal Service for the third quarter of 2010 show that Lake County’s vacancy rate continues to be well above the state and national rates for both business and residential vacancies.
Table 23. US Postal Service address vacancies, 3rd quarter, 201064
Geographic Area Residential Addresses
Vacant Residential Addresses
Residential Vacancy Rate
Business Addresses
Vacant Business Addresses
Business Vacancy Rate
Lake County 23,907 1,971 8.24% 1,634 198 12.12% Mendocino County 32,664 958 2.93% 3,939 286 7.26% Report Area 56,571 2,929 5.18% 5,573 484 8.68% California 13,366,648 306,073 2.29% 1,346,759 121,223 9.00% United States 132,389,902 4,850,831 3.66% 11,015,221 1,209,932 10.98%
Each year, maximum affordable housing costs falls far below actual local Fair Market Rent (FMR) in both counties. This is important, because more than one-‐third of area households are renters. For 2013, the FMR for a two-‐bedroom apartment is $895 in Lake County and $971 in Mendocino County.
62 Mendocino County Agriculture Commissioner. 2011 Mendocino County Crop Report (http://www.co.mendocino.ca.us/agriculture/cropStats.htm) and Lake County Agriculture Commissioner, 2011 Lake County Crop Report (www.co.lake.ca.us/Assets/Agriculture/docs/2011cropreport.pdf ). 63 California Association of Realtors, Current Sales and Price Statistics (http://www.car.org/marketdata/data/countysalesactivity/). 64 US Department of Housing and Urban Development, Aggregated USPS Administrative Data on Address Vacancies, Third Quarter, 2010 (http://www.huduser.org/portal/datasets/usps.html).

NORTH COAST OPPORTUNITIES COMMUNITY ACTION PLAN 2014-2015 PAGE 24
The annual income required to afford FMR plus utilities, without paying more than 30% of income on housing, is shown in Table 24 below, along with required hourly wages to generate this income.
Table 24. Fair market rents and wages, 201365
Geographic Area 2-‐bedroom FMR
Minimum income to afford 2-‐bedroom FMR
Minimum hourly wage to afford 2-‐bedroom FMR
Full-‐time jobs at
minimum wage
needed to afford 2-‐bedroom FMR
Rent affordable at
30% of median
household income
Mean renter hourly wage
Rent affordable at mean renter
wage
Full-‐time jobs at mean renter wage needed to afford 2-‐
bedroom FMR
Lake County $879 $35,160 $16.90 2.1 $369 $10.17 $529 1.7 Mendocino County $989 $39,560 $19.02 2.4 $374 $10.94 $569 1.7 California $1,341 $53,627 $25.78 3.2 $537 $17.99 $935 1.4
By contrast, in 2011 the Insight Center for Community Economic Development calculated the Lake County self-‐sufficiency wage for a single adult at $10.14/hour ($1,784/month) and for a family of four (2 adults, one preschooler, and 1 school age child) at $14.09 for each adult, for an annual income of $59,530. For Mendocino County, the self-‐sufficiency wage for a single adult is calculated to be $11.18/hour ($1,967/month) and for a family of four (2 adults, one preschooler, and 1 school age child) $14.64 for each adult, for an annual income of $61,843.66
As a result of these discrepancies, many residents live in substandard housing in remote areas far from service. For example, the 2010 census reports 797 housing units (1.3%) in the two-‐county area that lack basic plumbing.67 Although some people are living an alternative life style by choice and have adapted systems for their needs, others are living without utilities or running water because they cannot afford a home with these amenities.
HOMELESSLESS
Lake County. In January 2013, Lake County conducted its first point-‐in-‐time Homeless Census, identifying 188 homeless individuals (abut 0.3% of the county population). Census takers surveyed 179 homeless people, collecting the following information:68
• LOCATION: Over half (52%) of homeless people interviewed were living in Clearlake, followed by 20% in Lakeport, 13% in Lucerne, and 6% in Kelseyville.
• HOUSING: Almost half (44%) of those interviewed reported that they were living in tents or trailers, while 21% were living outdoors without a roof, 17% were living in cars or on the street, 7% were living in motels, 5% were living in emergency shelters, and 5% were living in abandoned buildings.
• DURATION: Over half (53%) of respondents had been homeless for more than a year, while 30% reported being homeless for less than 6 months and 15% had been homeless for a period of 6-‐12 months.
• FREQUENCY: One third (31%) of respondents reported 4 or more episodes of homelessness in the past three years, while 47% reported fewer than 4 episodes.
65 National Low Income Housing Coalition (http://nlihc.org/oor/2013). 66 Insight Center for Community Economic Development (http://www.insightcced.org/communities/besa/besa-ca/calculator.html). 67 US Census Bureau, American Community Survey. 68 Lake County Point In Time Homeless Count, 2013.

NORTH COAST OPPORTUNITIES COMMUNITY ACTION PLAN 2014-2015 PAGE 25
• FAMILY SIZE: On average, survey respondents reported family sizes of 1.38 adults with 1.86 children.
• GENDER: Two-‐thirds (65%) of those surveyed were male and one-‐third (35%) were female. • VETERAN STATUS: 15% of respondents reported that they had served in the military. • DISABILITIES: One-‐third (33%) of respondents reported having a physical disability, while
28% reported a chronic health condition, 22% reported mental health issues, and 9% reported chronic substance abuse.
• CAUSE OF HOMELESSNESS: More than one-‐third (37%) of respondents reported that their homelessness was caused by the loss of a job, while 27% pointed to a family crisis or breakup. Other frequent responses: economic reasons (25%), loss of temporary living situation (21%), eviction (20%), illness (18%), and alcohol and drug use (16%).
• STUDENT HOMELESSNESS: During the 2011-‐2012 school year, Lake County Office of Education identified 774 homeless students, about 8.5% of the total county enrollment.69
Mendocino County. In January 2013, the county’s Homeless Services Planning Group (HSPG) conducted its fifth point-‐in-‐time Homeless Census. Although final data from this count are not yet available, the previous census, conducted in 2011, counted 1,456 homeless people, up 21% from the 1,206 homeless persons counted in 2009. By region, the count identified 258 (18%) homeless persons in and around Ukiah, 442 (30%) in North County communities, 614 (42%) in coastal communities, and 142 (10%) in other areas. Using a combination of point-‐in-‐time census data and homeless survey data provides an annual estimate of 3,989 persons experiencing homelessness during the year, or 4.5% of the county population. Of those counted in 2011, 142 (10%) were living in emergency or transitional shelters while 1,314 (90%) were unsheltered. Of the total number, 117 represented families that included at least one child.70
During the 2012-‐2013 school year, county school districts reported serving 234 homeless students, representing about 2% of the county’s total student enrollment for that year.71
CRIME AND DELINQUENCY
The 2012 Annual Statistical Report from the Lake County Sheriff’s Office shows an overall 10% decrease in reported incidents compared with numbers reported for 2011, although cases of property crime increased by 20%. Trend data for criminal cases by type is detailed in Figure 5 below.
Figure 5. 72
69 Lake County Office of Education. 70 Mendocino County Health and Human Services Agency, 2013 Homeless Count Summary for Mendocino County. 71 Mendocino County Office of Education. 72 Lake County Sheriff’s Office Crime Statistics, 2012 (www.lakesheriff.com/Assets/Sheriff/Crime+Stats/2012.pdf ).
0 1000 2000 3000
2007 2008 2009 2010 2011 2012
Lake County 2007-‐2012 Crime Cases
Property Crimes
Violent Crimes
Sex Crimes
AOD Crimes

NORTH COAST OPPORTUNITIES COMMUNITY ACTION PLAN 2014-2015 PAGE 26
Table 25. Crime data from Lake County Sheriff Office, 2012
Geographic Area Property crimes
Violent crimes
Sex crimes Drug and alcohol crimes
Total incidents Change since 2011
Lake County 1,252 611 52 727 54,501 +10%
The 2010 Annual Statistical Report from the Mendocino County Sheriff’s Office73 cites 37,439 service calls received and responded to, up 3.7% from the 36,119 calls received in 2000. Of the total number of calls received, 3,546 (9.5%) were criminal/incident reports, 302 were coroner’s cases, 217 were traffic and misdemeanor citations, and 33,374 were miscellaneous service calls. Half (49.7%) of the calls were received from Central Inland communities, 22.7% from Northern Inland communities, and 27.6% from Coastal communities.74
Figure 6. 2010 Sheriff service calls, Mendocino County
In 2010, the Sheriff reported 6,246 jail bookings (including court-‐ordered commitments and remands) for all county law enforcement agencies, up 16% since 2000.
Figure 7. 2010 jail bookings, Mendocino County
73 The Mendocino County Sheriff’ Office has not yet released an Annual Report for 2012. 74 Mendocino County Sheriff’s Office 2010 Annual Report.

NORTH COAST OPPORTUNITIES COMMUNITY ACTION PLAN 2014-2015 PAGE 27
Figure 8. Gang-‐affiliated jail bookings, Mendocino County
According to the Lake County Sheriff’s Office, there are an estimated 200 gang members in Lake County. In February 2012, an enforcement sweep coordinated by the Lake County Gang Task Force resulted in seven arrests. The Lake County Gang Task Force is comprised of personnel from the Lake County Sheriff’s Office, Lakeport Police Department, Clearlake Police Department, California Highway Patrol and the Lake County Probation Department. The Gang Task Force’s mission is to gather intelligence on criminal street gangs, street gang members, and their associates and to conduct anti-‐gang law enforcement.
Data collected by the Mendocino County’s Multi-‐Agency Gang Suppression Unit (MAGSU) show that gang activity in Mendocino County has escalated as recruitment from urban areas has spread up the US Highway 101 corridor from Southern California and the Bay Area. Gang activity in the county includes criminal street gangs (Sureños and Norteños, White supremecists, and Native American Indian gangs) and prison gangs. Many gang members have ties to Mexican crime elements involved in supplying chemicals to rural marijuana growers and methamphetamine producers. Gang members are visible on some high school campuses, and gang-‐related incidents at local high schools have increased. For example, among students attending Fort Bragg’s non-‐traditional schools, 38% of the students self-‐report as gang members, and students in Fort Bragg’s alternative middle school are disproportionately more likely than the general school population to “hang out with” or date gang members or to be “jumped in” to a gang.75 Data from the Mendocino County Sheriff’s Office show that gang-‐affiliated bookings represent a steadily increasing percentage of all jail bookings. The increase is shown graphically in Figure 8 above.76
The juvenile arrest rates in the two counties (5,602/100,000 in Lake County and 5,518 in Mendocino County in 2010) are well above the statewide rate of 4,384/100,000. However, in both counties rates dropped over the past five years. In Lake County, the rate has fallen by 26% when compared with the 2006 rate of 7,559/100,000 and in Mendocino County the rate has fallen by 24% when compared with the 2006 rate of 7,293.77 Statewide, the juvenile arrest rate fell by 15% over the same time period.
75 Fort Bragg Comprehensive Gang Assessment (2012). 76 Mendocino County Sheriff’s Office 2010 Annual Report. 77 US Office of Juvenile Justice and Delinquency Prevention, FBI Arrest Statistics (http://ojjdp.gov/ojstatbb/ezaucr/).

NORTH COAST OPPORTUNITIES COMMUNITY ACTION PLAN 2014-2015 PAGE 28
In 2012, the Lake County Probation Department reported 195 first-‐time bookings in the county’s Juvenile Hall, which maintained an average daily census of 16.56 youth (14.62 boys and 2.15 girls).78
The Mendocino County Probation Department reports that 504 youth were booked into Mendocino County’s Juvenile Hall in 2012, of whom 383 (76%) were boys and 121 (24%) were girls. Ethnically, 38% of admitted youth were White/non-‐Hispanic, 38% were Hispanic, 20% were Native American Indian, and 4% were of mixed or other ethnicities. Length of stay averaged 18 days, and the hall’s average daily census was 23.75 residents. Reasons for admission included violations of probation and court orders (61%), crimes against people (11%), gang and weapon activity (11%), alcohol and drugs (7%), and property crimes (11%).79
The California Healthy Kids Survey (CHKS) measures both youth assets as well as crime and safety data and is administered to students in grades 7, 9, and 11 in alternate years. Compiled district data from 2009-‐2011 indicate higher risk factors for Lake County students, while Mendocino County results are aligned with statewide values.
Table 26. 2009-‐2011 CHKS safety and gang data80
Geographic Area Self-‐identify as a gang member
Felt “very safe” at school
Have been in a fight in school in
past year
Have been bullied or harassed at
school
School connectedness: % scoring “high”
Lake County 11% 20% 24% 40% 44% Mendocino County 8% 21% 23% 36% 45% California 8% 21% 21% 35% 46%
SUBSTANCE ABUSE
Substance abuse is one of the most far-‐reaching problems in the area, which lies in the heart of the rugged Emerald Triangle that has for decades provided a convenient cover for the clandestine growth of marijuana and the production and sale of methamphetamines. Outside elements exploit remote wilderness areas to establish commercial operations. Many residents have themselves turned to these illegal activities to supplement low incomes, creating patterns of multigenerational substance abuse and leaving children caught in conflict between home and school values.
The Mendocino County Sheriff’s Statistical Report for 2010 shown an increase of 664% in marijuana plant seizures since 2000. During the same period, the number of arrests increased by 420% (from 27 arrests to 140 arrests), although the number of sites involved fell from 287 sites to 222 sites.81 However, the amount of marijuana being grown is estimated by some to be 10 times higher than the amount seized, representing an underground cash crop valued at $5 billion per year.82
According to the Mendocino County Sheriff's Office, arrests for drug offenses increased from 807 in 2000 to a peak of 1,178 in 2005 and dropped to 957 in 2010. This includes a category called “dangerous drugs,” most of which are meth-‐related. In addition, there were 133 Driving Under the Influence (DUI) violations in 2010 and 86 other violations of liquor laws.83
It times of economic difficulty, alcohol and drug use increases, while people at risk for substance use disorders have even greater need for life-‐saving prevention, treatment, and recovery support services.
78 Lake County Probation Department, 2012 Juvenile Hall Report. 79 Mendocino County Probation Department, 2012 Juvenile Hall Report. 80 California Healthy Kids Survey, 2009-2011 (http://chks.wested.org/reports/search). 81 Mendocino County Sheriff’s Office Statistical Report 2010. 82 California Department of Justice, Office of the Attorney General. (http://ag.ca.gov/crime.php). 83 Mendocino County Sheriff’s Office Statistical Report 2010.

NORTH COAST OPPORTUNITIES COMMUNITY ACTION PLAN 2014-2015 PAGE 29
Alcohol and drug treatment services are a cost-‐effective approach to this debilitating social problem. Taxpayers save $7 for every $1 spent on treatment, both through increased productivity and through reduced health care, criminal justice, and social services costs.84 In the report area, treatment for alcohol and drug abuse is provided by County Public Health Departments, clinics, and nonprofit organizations.
Overall, admission rates to treatment facilities in Lake County decreased slightly since 2000. In 2000 there were about 1,122 admissions per 100,000 compared to 1,078 admissions per 100,000 in 2008. Nevertheless, Lake County’s admission rate was higher than the state overall each year. Admissions due to methamphetamine use accounted for 29% of all admissions in 2008. Admissions due to alcohol use accounted for roughly 25% of admissions, marijuana for 39% of admissions, heroin for 1% of admissions, and crack/cocaine for 2%. Admission rates were highest among Native American Indians and African Americans, 2,587 and 2,425 per 100,000 in 2008, respectively. These rates were more than double the rates of every other race/ethnicity group. By age, the highest rate of admissions was for 25 to 34 year olds, with a rate of 2,949 per 100,000 in 2008. The next highest rate was for 18 to 24 year olds with a rate of 1,722 per 100,000, followed by those 17 years and younger at a rate of 1,579 per 100,000.85
In Mendocino County, admission rates to treatment facilities also increased slightly since 2000. In 2000 there were about 906 admissions per 100,000 compared to 1,040 admissions per 100,000 in 2008. Mendocino County’s AOD admission rate was much higher than the state overall each year. Admissions due to methamphetamine use accounted for 38% of all admissions, admissions due to alcohol use accounted for roughly 29%, marijuana for 18%, heroin for 5% percent, and crack/cocaine for 5%. Admission rates were highest among Blacks and American Indians, 9,126 and 1,414 per 100,000 in 2008, respectively. These rates were significantly higher than each other race/ethnicity group. The highest rate of admissions was for 35 to 44 year olds with a rate of 2,647 per 100,000 in 2008. The next highest rate was for 25 to 34 year olds with a rate of 2,288 per 100,000. 18 to 24 year olds and 45 to 54 year olds also had high rates of admission, 1,506 and 1,440, respectively.
The number of alcohol outlets per community (outlet density) is an indicator of readily available alcohol to the public and an indicator of overall alcohol consumption. While local governments may be inclined to grant approval to alcohol license applicants in attempts to bolster local business and the economy, a high density of outlets corresponds with a proportional increase in alcohol related violence, underage drinking, unprotected sex and driving after drinking.
In terms of alcohol availability, the California Department of Alcoholic Beverage Control (ABC) reports that there were 81 wholesale and off-‐sale and 230 retail/on-‐sale alcohol licenses in Lake County as of June 2012, equal to 1 off-‐sale outlet for every 797 residents and 1 on-‐sale outlet for every 280 residents. In Mendocino County, there were 270 wholesale and off-‐sale and 424 retail/on-‐sale alcohol licenses as of June 2012, equal to 1 off-‐sale outlet for every 327 residents and 1 on-‐sale outlet for every 208 residents.86 These levels are well above the density allowed by ABC policy, which allows 1 on-‐sale general license for each 2,000 persons in a county and 1 off-‐sale general license for each 2,500 persons.87 If Lake County conformed to ABC policy, there would be only 26 off-‐sale and 32 on-‐sale
84 National Institute on Drug Abuse (NIDA): http://archives.drugabuse.gov/NIDA_Notes/NNVol10N2/CAStudy.html. 85 Center for Applied Research Solutions, Indicators of Alcohol and Other Drug Risk and Consequences for California Counties: Lake and Mendocino Counties, 2010 (http://www.ca-cpi.org/resources/community_indicators_2010.php). An update to this report has not been released. 86 California Department of Alcoholic Beverage Control, Alcoholic Beverage Licenses as of June 30, 2012 (http://www.abc.ca.gov/datport/SubscrMenu.asp). Off-sale licenses are for outlets where alcohol is sold to be consumed off site, such as liquor and grocery stores, while on-sale licenses are for locations such as bars and restaurants where alcohol is consumed on the premises. 87 ABC Act, California Business and Professions Code (www.abc.ca.gov/cbnpc.html).

NORTH COAST OPPORTUNITIES COMMUNITY ACTION PLAN 2014-2015 PAGE 30
alcohol licenses in the county. In Mendocino County, licenses would be limited to 35 off-‐sale and 44 on-‐sale outlets.
The area’s culture of acceptance of alcohol and drug (AOD) use has a powerful impact on local youth. CHKS data show that rates for most AOD indicators are dismal when compared with statewide rates, as the examples shown in Table 27 below demonstrate.
Table 27. 2009-‐2011 CHKS data on past 30-‐day substance use and perception of harm by 7th, 9th, and 11th graders88
Geographic Area Had at least one drink of alcohol
Perceived frequent alcohol use as of great or moderate harm
Had 5 or more drinks in a
couple of hours (binge drinking)
Smoked marijuana
Perceived frequent marijuana use as of great or moderate
harm
Smoked cigarettes
Lake County 32% 64% 21% 25% 53% 12% Mendocino County 32% 66% 21% 20% 59% 12% California 23% 62% 14% 14% 67% 9%
TRANSPORTATION AND TRAFFIC SAFETY
Mendocino and Lake County both feature many barriers to physical mobility, including rugged mountain ranges and, in Lake County, Clear Lake itself, which lies in the center of the county and occupies 5% of the total area. Many isolated communities are reached by winding two-‐lane mountain highways, some more than two hours drive from commercial centers. Many local roads are in poor condition and not fully maintained during winter months. Even in cities such as Clearlake and Lakeport, streets revert to unpaved, unlit, and unmarked roads just blocks from town centers, Although Lake Transit Authority (LTA) and Mendocino Transit Authority (MTA) provide regular service in and between larger communities, public transportation outside incorporated areas is minimal, magnifying the barrier to accessing services and employment.
LTA provides valuable linkages with its fixed route, deviated-‐fixed route, and paratransit services. These include routes connecting to Ukiah in Mendocino County and seven regional routes connecting the larger Lake County communities. LTA also provides Flex-‐Stop and other help for the disabled and elderly. However, services are limited with respect to frequency, service coverage, and service span. Geographically, service is focused primarily in Lakeport and Clearlake, and LTA services are not provided in several smaller communities. Furthermore, most public transportation services end at 6 pm and weekend services are limited.
Many Lake County households (37%) have access to two vehicles, 7% have no vehicle and 30% share a single vehicle. In Mendocino County, 38% of households have access to two vehicles, although 6.5% have no vehicle and 31% share a vehicle.89
On average, local workers experience a commute time of about 23 minutes. Table 28 below shows the mode of transportation local workers use to travel to work. Of the 57,487 workers in the report area, 85%, or 48,039 workers, use private automobiles to travel to work. Of these, 72% drive to work alone while 11% carpool. Fewer than 1% of all workers use some form of public transportation, while 7% (or 3,763 workers) use some other means, including walking, bicycles, and taxicabs.
88 California Healthy Kids Survey (2009-2011). 89 US Census, 2011 American Community Survey 1-Year Estimates.

NORTH COAST OPPORTUNITIES COMMUNITY ACTION PLAN 2014-2015 PAGE 31
Table 28. Method of transportation to work, 2007 -‐ 201190
Geographic Area Workers 16 and Up
Method of Transportation to Work (Percent) Drive Alone
Carpool Public Transportation
Bicycle Walk Other Work at Home
Lake County 23,533 74.0% 10.0% 0.5% 3.9% 2.1% 9.5% Mendocino County 37,509 71.0% 12.6% 0.8% 4.9% 1.7% 9.0% California 16,251,032 73.0% 11.7% 5.1% 2.8% 2.3% 5.1%
In 2010, 430 Lake County residents were killed or injured in traffic collisions. Of these, 74 (17%) were alcohol-‐related. According to the California Office of Traffic Safety, these figures represent an alcohol-‐related accident rate that is higher than all but 8 of California’s 58 counties in terms of population size. When considering drivers who were under 21 and who had been drinking, Lake County’s rate is worse than all but one other county. Mendocino County reported 587 residents killed or injured, 103 (18%) in alcohol-‐involved collisions. This placed Mendocino County higher than all but 7 other counties.91
90 US Census Bureau, American Community Survey, 2007 through 2011 averages. 91 California Office of Traffic Safety, 2010 OTS Rankings (http://www.ots.ca.gov/media_and_research/Rankings/default.asp).

NORTH COAST OPPORTUNITIES COMMUNITY ACTION PLAN 2014-2015 PAGE 32
II. Community Resources and Services
Safety Net Programs
Both Mendocino County and Lake County are fortunate to have a number of organizations that work to alleviate suffering and ameliorate the causes of poverty. NCO Community Action has established and maintains strong connections with these community resources; descriptions follow.
Local Governments and Agencies • Employment and Vocational Rehabilitation Services • Social Services, Public Health, and Mental Health Services Agencies • FIRST 5 Commissions • County Offices of Education • City and County Governments • Tribal Governments
Nonprofit Organizations and Community-‐Based Groups
Table 29. Community partners
LAKE COUNTY MENDOCINO COUNTY California Human Development Corporation California Conservation Corps Churches and faith-‐based groups Churches and faith-‐based groups Community Care, serving individuals with HIV/AIDS Community Care, serving individuals with HIV/AIDS Hospice of Lake County Community Foundation of Mendocino County Kelseyville Food Pantry Easter Seals of Northern California Lake County Co-‐op Economic Development and Finance Corporation Lake County Co-‐op Ford Street Project Lake County Health Leadership Network Grateful Gleaners Lake County Hunger Task Force Hospice of Ukiah Lake County Office of Education and local districts Legal Services of Northern California, Inc. Lakeport Gleaners Mayacama Industries Legal Services of Northern California, Inc. Mendocino College Northlake Adult Day Center Mendocino Office of Education and local school districts Northlake Community Services Phoenix Hospice Parents and Community for Kids Redwood Coast Regional Center Redwood Coast Regional Center Redwood Empire Food Bank Redwood Empire Food Bank Service clubs (Soroptomists, Lions Club, Rotary, Kiwanis) Service clubs (Soroptomists, Lions Club, Rotary, Kiwanis) Ukiah Valley Medical Center Redwood Children’s Services Ukiah Community Center Sutter Wellness Foundation Ukiah Natural Foods Co-‐op Thrive! Lake County United Way United Way West Company Salvation Army, Goodwill Industries, and Society of Vincent de Paul
Salvation Army, Goodwill Industries, and Society of Vincent de Paul
Senior centers (Highlands Senior Center, Lakeport Senior Center, Live Oaks Senior Center, Lucerne Alpine Senior Center, Middletown Senior Center)
Senior centers (Anderson Valley Senior Center, Harrah Senior Center in Willits, Indian Senior Center in Ukiah, Redwood Coast Senior Center, Round Valley Indian Senior Center, South Coast Senior Center, Ukiah Senior Center)

NORTH COAST OPPORTUNITIES COMMUNITY ACTION PLAN 2014-2015 PAGE 33
Family Resource Centers (FRCs) • Communities throughout the county have established FRCs that provide a range of services
designed to address needs of low-‐income families in each community. Services provided by FRCs range from parenting classes and after school tutoring to referrals, children’s health insurance outreach and enrollment, family literacy classes, translation assistance, citizenship classes, and more. Mendocino County’s FRCs have established a network to better coordinate and standardize services. Currently there are 10 FRCs in the network, as listed below.
Table 30. Family Resource Centers92
FRC Name Location Target Population LAKE COUNTY
Lake Family Resource Center Clearlake, Lakeport, Kelseyville
Low-‐income and Hispanic
Lake County Office of Education, Healthy Start Resource Centers
Sites at 11 schools throughout the county
Low-‐income students and families
MENDOCINO COUNTY Anderson Valley Resource Center Boonville Low-‐income and Hispanic Safe Passage Fort Bragg Low-‐income and Hispanic Action Network Gualala and Point Arena Low-‐income Laytonville Healthy Start Laytonville Low-‐income Potter Valley Youth and Community Center Potter Valley Low-‐income Arbor on Main Youth Community Center Ukiah At-‐risk youth Nuestra Casa Ukiah Low-‐income and Hispanic Mendocino County Health and Human Services Agency (HHSA) Family Resource Center
Ukiah Low-‐income and mandated
Nuestra Alianza Willits Low-‐income and Hispanic HHSA Family Resource Center Willits Low-‐income and mandated
Community Centers, Food Banks, and Community Kitchens • Community Centers located in Ukiah, Fort Bragg, and Willits provide referrals to housing and
other services for homeless individuals as well as coordinating food commodity distribution. Community kitchens in the same three communities provide regular free meals for the hungry. In Lake County, food distribution is coordinated through the Clearlake Community Food Pantry and the Kelseyville Food Pantry.
Senior Centers • Senior centers throughout the county support low-‐income elders by providing low-‐cost meals
and no-‐cost socialization opportunities, as well as serving as a resource for information on available services.
Mendocino Private Industry Council (MPIC) • In both counties, MPIC provides employment development services that include job search,
soft job skills training, job placement, and, for eligible individuals, subsidized salaries for set periods of time.
92 FIRST 5 Mendocino (http://mendochildren.org/projects/frc.htm).

NORTH COAST OPPORTUNITIES COMMUNITY ACTION PLAN 2014-2015 PAGE 34
Volunteer Programs
Volunteer Network and Retired and Senior Volunteer Program (RSVP) • RSVP works with more than 1,200 volunteers in Mendocino County and 500 in Lake County
who volunteer in more than 139 agencies, including 45 Lake County organizations. • RSVP’s 1,107 volunteers contributed 119,000 hours in Lake and Mendocino Counties last year. • Working with senior centers and other community partners, volunteers have been providing
support, assistance, companionship, and respite for homebound seniors and/or their care providers since 1980. Currently, approximately 900 volunteers are providing these services.
• NCO began its focus on disaster preparedness in 2002, with the initiation of Community Emergency Response Team (CERT) trainings in collaboration with local law enforcement and emergency response agencies. During the past year, the program offered 5 trainings and currently has 58 active CERT members. CERT training has been offered 58 times in Lake and Mendocino County communities since the beginning of the program; 12 CERT trainings were conducted in 2012.
• Collaborative community events such as the Human Race bring together more than 45 nonprofits and 500 participants every year. Promotion of the Human Race raises community awareness of volunteer opportunities, while local nonprofits benefit from the more than $50,000 that is generated. A recent survey of callers to the Volunteer Network found that 35% had learned about the Volunteer Network through the Human Race.
• RSVP and Volunteer Network volunteers enrich communities by serving as tutors, senior center workers, drivers, disaster preparedness workers, botanical garden staff, museum and library aides, peer counselors, sheriff sub-‐station staffers, and many other interesting and challenging positions. Volunteers 55 and older (for RSVP) and all ages (for the Volunteer Network) serve without compensation in non-‐profit and public community organizations.
Foster Grandparent Program • The Foster Grandparent Program recruits low-‐income seniors and partners with local schools
to give supportive individual attention to children with special needs. In return, low-‐income seniors receive a small stipend and travel allowance.
• Approximately 85 Foster Grandparents serve 20 hours a week, working with nearly 340 children in pre-‐schools, elementary schools, juvenile detention centers, and residential facilities in Del Norte, Humboldt, Lake, Mendocino, and Sonoma Counties. The Foster Grandparent Program collaborates with public school districts, pre-‐school programs, Head Start, Juvenile Hall, and others. Community support is received from a variety of professionals who provide monthly in-‐service training for volunteers.
Child Development Programs
Head Start, Early Head Start, and State Preschools • NCO operates 13 Head Start centers, as well as State Preschools and Early Head Start
programs, serving more than 500 children and their families in sites located throughout Lake and Mendocino Counties.
• Head Start provides comprehensive early education and support services for poor children ages 3 to 5 and their families. Services are focused on the “whole child,” including early education addressing cognitive, developmental, and socio-‐emotional needs; medical and dental screenings and referrals; nutrition services; parental involvement; and referrals to social service providers for the entire family. NCO has also helped to establish on-‐site gardens and nutrition education for children and parents at many Head Start centers.

NORTH COAST OPPORTUNITIES COMMUNITY ACTION PLAN 2014-2015 PAGE 35
• Early Head Start provides comprehensive early education and support services for poor children ages 3 months to 3 years.
• NCO has received Head Start funding since 1968 and currently administers $6.1 million in Head Start funds each year. In 2008, NCO received the Head Start Gold Certificate of Excellence for its compliance with federal regulations, an honor awarded to fewer than 10% of Head Start programs nationwide.
• State Preschool programs are braided with Head Start and general child care funds to create full-‐day/full-‐year services for low-‐income families.
Rural Communities Child Care (RCCC)
Subsidized Child Care • RCRC pays childcare costs for low-‐income parents who are working or going to school. • Provides subsidized payments for 865 children in day care and 1,659 children with family day
care providers in Lake and Mendocino Counties. • Serves children from birth to 13 years. • Administers the Centralized Eligibility List that connects eligible families with all subsidized
child care options in their county. • Manages the Child Care Food Program by providing reimbursements for meals that comply
with USDA regulations.
Resource and Referral (R&R) • Provides free childcare referrals for parents and guardians. • Improves the quality of child care through training and technical assistance, providing 93
workshops over the past year (24 in Lake County and 69 in Mendocino County). • Delivers support and technical assistance to providers and parents, assisting parents and
providers annually and publishing a quarterly newsletter and community resource directory. • Maintains data on licensed child care facilities and unlicensed family child care providers and
provides data for child care needs assessments. • Administers Trustline, an application and background check service for unlicensed exempt
care providers and provides training for applicants. • Provides training and on-‐site monitoring of 150 family child care providers, making 236 site
visits during the past year (109 site visits to 66 providers in Lake County and 127 site visits to 84 Mendocino County providers).
Community Action Programs
The focus of Community Action is to provide innovative solutions to community issues with an emphasis on prevention while working toward family and community self-‐sufficiency. Programs and projects are designed to address needs specific to local communities while maximizing partnerships and leveraging resources.
Better Education and Nutrition for Student (BEANS) Project • The Better Education, Activity, and Nutrition for Students (BEANS) Project trains teen
educators to deliver interactive nutrition education to younger students in after school programs. BEANS has provided interactive cooking demonstrations using local foods for more than 1,500 students.

NORTH COAST OPPORTUNITIES COMMUNITY ACTION PLAN 2014-2015 PAGE 36
Brookside Demonstration Farm • In 2005, NCO partnered with the Willits Unified School District to establish and develop the
Brookside Demonstration Farm, which is located adjacent to Brookside Elementary School. • NCO is currently working with the school district to contract a farmer to operate and manage
the farm as a business that will continue to provide fresh produce for school cafeterias.
Clearlake Community Food Pantry • In 2011, NCO’s Clearlake Community Food Pantry began distributing food purchased from
local farmers and through the Redwood Empire Food Bank; more than 300 families are now benefitting from this program.
Farm2Fork Project • Funded through a Specialty Crop Block Grant Program grant, Farm2Fork works directly with
four Mendocino County school districts to develop schools as new markets for local crops. Benefits to schools have included training, food processing equipment, and access to new local vendors. Farm2Fork has also provided training and technical assistance (TA) to local farmers, to build their capacity to sell to local schools. The project has trained 65 school food service staff, and districts are buying fresh produce from 12 local growers, representing a sustainable 100-‐250% increase in local farm to school purchasing.
Farmers Convergence • In March 2013, NCO hosted the Farmer Convergence, a meet-‐and-‐greet event attended by 140
growers, distributors, and institutional buyers who made new connections and shared skills to celebrate the vital profession of farming.
Farmers Market Partnerships • NCO has worked with farmers markets to adopt electronic Supplemental Assistance Nutrition
Program (SNAP/food stamp) payments and matching programs that double the value of food stamps used at farmers markets.
Feeding Our Future • In September 2012, NCO sponsored the “Feeding Our Future” conference, which provided
culinary training to 100 school cooks, kitchen managers, and food service directors and celebrated these unsung heroes who plan, cook, and serve meals in local schools.
Food Policy Council • In 2010, NCO funded an economic analysis of the local farm and food economy and partnered
with county government and others to create a Food Policy Council that has completed a food action plan and an assessment of food production, economic indicators, processing facilities, etc.
Gardens Project • The Gardens Project creates access to local organic produce by organizing and/or supporting
school and community gardens throughout Mendocino County. NCO partners with more than 70 low-‐income neighborhoods, schools, and senior housing developments with existing public gardens or the desire to create new gardens, working with them to increase food production, develop new community gardens, and strengthen leadership skills that will lead to lower cost of living and increase health. Community and school gardens contribute to community food security while tackling issues of nutrition and obesity.
• A three-‐year USDA grant that began in September 2011 is developing new gardens and provide leadership training for garden coordinators.

NORTH COAST OPPORTUNITIES COMMUNITY ACTION PLAN 2014-2015 PAGE 37
Lake County Food Distribution Hub • NCO is coordinating with the Redwood Empire Food Bank in Santa Rosa and other Lake County
food pantries and food banks to arrange delivery of surplus commodities and other foods from Santa Rosa to Lakeport and Clearlake.
Lake County Grown • Through a Specialty Crop Block Grant Program, NCO is managing the Lake County Grown on-‐
line ordering system for the use of local farmers, institutions, and consumers (www.localfoodmarketplace.com/lakecounty/Default.aspx).
North Coast Regional Food System Network • Through a USDA Rural Business Enterprise Grant, NCO is the fiscal sponsor for the North Coast
Regional Food System Network to strengthen production, distribution, and marketing of local foods throughout a five-‐county region (Lake, Marin, Mendocino, Napa, and Sonoma Counties).
ReThink Your Drink • NCO is partnering with the County Health and Human Services Agency and family resource
centers to offer nutrition education and cooking classes to low-‐income families, and NCO’s “ReThink Your Drink” campaign is spreading the word about the health benefits of drinking water rather than sugar-‐sweetened beverages.
Skills and Options Using Produce (SOUP) Project • Through CSD Targeted Initiatives and Innovative Projects funding, NCO is working with the
Ford Street Project (FSP) and other partners to strengthen both individual-‐ and community-‐level food self-‐reliance while addressing the needs of high-‐risk, low-‐income people. This will be accomplished through partnership development and a range of trainings for FSP’s homeless clients covering nutrition; personal and institutional cooking skills; development of a social enterprise through which participants will further develop their skills and generate income while market testing a food product in the community; and development of market gardens on the FSP campus.
Willits Granary • NCO established an organic granary that is now operated by the Little Lake Grange in Willits.
Case Management Programs
Redwood Caregiver Resource Center (RCRC) • RCRC helps people cope when a loved one is suffering serious memory or other functional
losses resulting from Alzheimer’s disease or other chronic brain-‐impairing conditions or injury. RCRC supports the caregiver’s efforts to keep the impaired individual at home and maintain their quality of their life as long as possible.
• RCRC assists with care planning, individual and group support, education and training, legal and financial consultations, and respite care.
• RCRC actively serves 150 caregivers who 150 clients in Lake and Mendocino Counties.

NORTH COAST OPPORTUNITIES COMMUNITY ACTION PLAN 2014-2015 PAGE 38
III. Data Sources for CAP Review and Revision Every two years, NCO gathers data to develop the Community Information Profile from a variety of primary and secondary data sources and assessments. NCO’s close relationships with agencies throughout its service area ensure that the organization has access to the most recent needs and resource assessments that are conducted on a regular schedule by these agencies. Reviewing each assessment as it is released provides NCO with access to the information that is necessary to revise the Community Information Profile on a biannual basis, and analysis of these data informs the design of the Community Action Plan. The most relevant local and archival sources that NCO uses for updating the Community Information Profile are listed below.
Table 31. Community Information Profile data sources
DATA SOURCE CONTENT Area Agency on Aging of Lake and Mendocino Counties, 2012-‐2016 Area Plan Needs Assessment (http://www.co.lake.ca.us/government/directory/social_services/aaa.htm)
Senor demographics and disability rates
Associated Press Economic Stress Index (http://hosted.ap.org/specials/interactives/_national/stress_index/)
Bankruptcy and foreclosure rates
California Association of Realtors (http://www.car.org/marketdata/data/countysalesactivity/)
Current Home Sales and Price Statistics
California Child Care Portfolio (www.rrnetwork.org). Child care costs California Child Care Resource and Referral Network (www.rrnetwork.org/rr-‐research-‐in-‐action/2011-‐california-‐child-‐care.html)
Child care availability and utilization
California Department of Alcoholic Beverage Control, Alcoholic Beverage Licenses as of June 30, 2012 (http://www.abc.ca.gov/datport/SubscrMenu.asp) and Frequently Asked Questions (http://www.abc.ca.gov/questions/licenses_faq.html)
Off-‐sale alcohol licenses and licensing policies
California Department of Corrections and Rehabilitation http://www.cdcr.ca.gov/Juvenile_Justice/Research_and_Statistics/index.html
Arrest and incarceration data
California Department of Education/DataQuest (http://data1.cde.ca.gov/dataquest/)
Academic performance, demographics, physical fitness, enrollment, participation in free and reduced price meal programs
California Department of Finance, Demographic Research Unit (http://www.dof.ca.gov/research/demographic/reports/estimates/e-‐1/view.php)
Population demographics and projects
California Department of Health Care Services, Research and Analytical Studies Section (http://www.dhcs.ca.gov/dataandstats/statistics/Pages/RASS_Default.aspx)
Medi-‐Cal enrollment
California Department of Justice, Office of the Attorney General (http://ag.ca.gov/crime.php)
Crime data
California Department of Public Health: http://www.cdph.ca.gov/data/statistics/Pages/DeathStatisticalDataTables.aspx
2010 Death Records
California Department of Public Health (www.cdph.ca.gov/pubsforms/Pubs/OHIRProfiles2010.pdf)
2013 County Health Status Profiles
California Department of Social Services (http://www.dss.cahwnet.gov/research/PG352.htm)
California Food Stamp Participation and Benefit Issuance Report DFA-‐256 (March 2013)
California Dept. of Finance, Demographic Research Unit: www.cedcal.com/assets/Profile-‐PDF/MendocinoWebProfile02-‐11.pdf
Population demographics and projections
California Employment Development Department, Labor Market Information (http://www.labormarketinfo.edd.ca.gov/)
Employment and unemployment updates, median housing prices
California Food Policy Advocates (http://www.cfpa.net/2010CountyProfiles/Main.html)
Mendocino County 2010 Nutritional Profile, including obesity and diabetes rates
California Health Care Foundation, Center for Health Reporting: (http://www.centerforhealthreporting.org/project/aging-‐doctors-‐looming-‐retirements-‐worry-‐rural-‐areas)
Number and age of physicians
California Health Interview Survey (CHIS) (http://www.chis.ucla.edu/)
2009 California Health Interview: health status, behaviors, and conditions; healthcare access and utilization; insurance; demographics; elder health

NORTH COAST OPPORTUNITIES COMMUNITY ACTION PLAN 2014-2015 PAGE 39
DATA SOURCE CONTENT California Healthy Kids Survey, 2009-‐2011 (http://chks.wested.org/reports/) Countywide compilation of district data: resiliency,
substance abuse, physical fitness, violence California Managed Risk Medical Insurance Board (MRMIB) (http://www.mrmib.ca.gov/MRMIB/HFPReports1.shtml)
Medi-‐Cal and Healthy Families enrollment
California Office of Traffic Safety (http://www.ots.ca.gov/media_and_research/Rankings/default.asp)
Alcohol-‐related traffic accident data for 2010
California Rural Health Policy Council: (http://www.oshpd.ca.gov/RHPC/Resources/northern.html)
California Frontier and Rural Demographics
Center for Applied Research Solutions, Indicators of Alcohol and Other Drug Risk and Consequences for California Counties, 2010 (http://www.ca-‐cpi.org/resources/community_indicators_2010.php)
Substance abuse rates and related crime
Center for Economic Development, California State University, Chico (http://www.co.mendocino.ca.us/econdev/)
Mendocino County 2010-‐2011 Economic and Demographic Profile
Center for Economic Development, California State University, Chico (http://www.cedcal.com)
Economic data
Centers for Disease Control and Prevention (http://diabetes-‐obesity.findthedata.org/q/2633/4300/What-‐was-‐the-‐obesity-‐rate-‐in-‐Lake-‐County-‐CA-‐in-‐2008)
Obesity and diabetes data
National Diabetes Surveillance System. Atlanta (GA): Centers for Disease Control and Prevention; 2010 (http://apps.nccd.cdc.gov/ddtstrs/)
Diabetes statistics
Children Now (http://www.childrennow.org) 2012-‐2013 California County Scorecard Of Children's Well-‐Being
Council on Graduate Medical Education, in Institute for the Future’s Health and Health Care 2010: The Forecast, The Challenge (www.iftf.org/our-‐work/body-‐mind/health-‐horizons/health-‐and-‐health-‐care-‐2010-‐the-‐forecast-‐the-‐challenge/)
Physician census
Donald Bren School of Environmental Science and Management (http://fiesta.bren.ucsb.edu/~mlpa3/contactus.html)
Tribes and Tribal Communities of the North Coast
Fort Bragg Coalition for Gang Awareness and Prevention, Comprehensive Gang Assessment Draft (2012)
Gang statistics
Humboldt State University, California Center for Rural Policy (http://www.humboldt.edu/ccrp)
Poverty maps, population demographics, and health insurance disparities
Insight Center for Community Economic Development (http://www.insightcced.org/communities/cfess/ca-‐sss.html)
California Family Economic Self-‐Sufficiency Standard by County
Lake County Agriculture Commissioner (www.co.lake.ca.us/Assets/Agriculture/docs/2011cropreport.pdf )
Lake County 2011 Crop Report
Lake County Continuum of Care, 2013 Point-‐in-‐Time Homeless Count Homelessness Lake County Department of Transportation, Coordinated Public Transit: Human Services Transportation Plan, 2008 (www.dot.ca.gov/hq/MassTrans/Docs-‐Pdfs/CoordinatedPlng/LAKE.pdf)
LTA routes
Lake County Probation Department, 2012 Juvenile Hall Report Juvenile delinquency Lake County Sheriff’s Office (http://www.lakesheriff.com/resources/crimestats.htm) Community safety indicators Lake County Tribal Health Consortium, Needs Assessment (http://www.lcthc.com/human_services.shtml)
Tribal listing and tribal data
Mendocino County Agriculture Commissioner (http://www.co.mendocino.ca.us/agriculture/cropStats.htm)
Mendocino County 2011 Crop Report
Mendocino County Health and Human Services Agency, 2013 Point-‐in-‐Time Homeless Count (http://www.co.mendocino.ca.us/hhsa/adult/coc.htm)
Homelessness
Mendocino County Health and Human Services Agency, 2012 Health Status Report (http://www.co.mendocino.ca.us/hhsa/newsletters.htm)
Community health indicators (crime, disease, mortality, poverty)
Mendocino County Probation Department, 2012 Juvenile Hall Report Juvenile delinquency Mendocino County Sheriff’s Office Statistical Report 2010 Community safety indicators National Institute on Drug Abuse (NIDA) (http://archives.drugabuse.gov/NIDA_Notes/NNVol10N2/CAStudy.html)
Economic benefit of AOD treatment
National Low Income Housing Coalition, Out of Reach 2013 (www.nlihc.org) Homelessness indicators NCO Head Start, 2013 Community Assessment Child care and other indicators Realty Trac, Foreclosure Rate Heat Map (http://www.realtytrac.com/trendcenter/ca-‐trend.html)
Bankruptcies and foreclosures

NORTH COAST OPPORTUNITIES COMMUNITY ACTION PLAN 2014-2015 PAGE 40
DATA SOURCE CONTENT Robert Wood Johnson Foundation and University of Wisconsin Population Health Institute (http://www.countyhealthrankings.org)
2013 County Health Rankings
UC Berkeley Center for Social Services Research (http://cssr.berkeley.edu/CWSCMSreports)
Child abuse and foster care data
UCLA Center for Health Policy Research (July 2011). Food Environments Near Home and School Related to Consumption of Soda and Fast Food. UCLA Center for Health Policy Research (www.healthpolicy.ucla.edu/pubs/files/foodenvpbjuly2011.pdf)
Home and School Retail Food Environment Index
California Center for Public Health Advocacy, UCLA Center for Health Policy Research (www.cdph.ca.gov/healthinfo/.../CostofObesityToplineReport.pdf)
The Economic Costs of Overweight, Obesity, and Physical Inactivity Among California Adults
US Census Bureau (http://factfinder2.census.gov) and American Community Survey (http://www.census.gov/acs/www/)
Demographics, population estimates, poverty data, vehicle ownership and commute times
US Department of Education, Institute of Education Sciences, National Center for Education Statistics (nces.ed.gov/naal/estimates)
State and County Estimates of Low Literacy, 2003
US Department of Health and Human Services, Centers for Medicare and Medicaid Services (http://www.cms.hhs.gov/MedicareEnrpts/)
Medicare County Enrollment Report
US Department of Health and Human Services, Health Resources and Services Administration (http://hpsafind.hrsa.gov/HPSASearch.aspx)
MUA/P and HPSA by State and County
US Department of Housing and Urban Development, Aggregated USPS Administrative Data on Address Vacancies, Third Quarter, 2010 (http://www.huduser.org/portal/datasets/usps.html)
Housing vacancies
US Department of Justice, Office of Juvenile Justice and Delinquency Prevention (http://www.ojjdp.gov/ojstatbb/ezaucr/asp/ucr_display.asp)
FBI Arrest Statistics
US Department of Agriculture Food Desert Locator (http://www.ers.usda.gov/data/fooddesert/fooddesert.html)
Food desert data
WIA Rapid Response Special Project, 2007 (http://oecbd.org/node/3279) Targets of Opportunity: The North Coast Counties of Del Norte, Humboldt, Mendocino, Siskiyou, and Trinity

NORTH COAST OPPORTUNITIES COMMUNITY ACTION PLAN 2014-2015 PAGE 41
IV. Needs Assessment Prior to preparing this Community Action Plan, NCO conducted a needs assessment survey, receiving responses from a total of 293 residents. The survey first asked respondents about the type of organization or entity they represent. Of the total, 42% were nonprofit organization employees; the largest other sectors represented were city and county government (21%), private businesses (13%), schools (9%), community-‐based organizations (6%), and tribal governments (2%).
The most frequent response to the target population served or type of work conducted was children and youth (36%), followed by health care (23%), community development (18%), mental health care (14%), environment (12%), disabled (11%), senior citizens (10%), business (10%), arts and culture (9%), economic development (8%), recreation (8%), food and agriculture (6%), education (5%), and housing and homelessness (3%). (Note that respondents were allowed to provide more than one answer to this question.)
Thirteen percent (13%) of respondents provide services throughout Lake County or in defined communities within Lake County, 64% provide services throughout Mendocino County or in specific communities or regions of the county, and 20% provide services in multiple counties.
In response to a question asking respondents to select the top five most pressing concerns confronting local residents, there were a total of 1,417 votes cast, with the following issues receiving the largest numbers of votes:
• Unemployment, underemployment, and economic development (21% of votes cast and 100% of participants)
• Housing and homelessness (17% of votes cast and 81% of participants) • Alcohol and drug use (14% of votes cast and 66% of participants) • Nutrition, food security, and hunger (10% of votes cast and 49% of participants) • Education (8% of votes cast and 37% of participants) • Availability of services (7% of votes cast and 34% of participants) • Access to and availability of health care services (7% of votes cast and 33% of participants)
Finally, the survey asked respondents to provide suggestions for addressing the concerns they selected. Responses from the 204 individuals who answered this question ranged from the general to the very specific, from countywide strategies to programs for individual communities, and from solutions to further descriptions of needs. Selected responses are shown in Table 32 below and complete summaries are provided in Appendices A and B.
NCO also convened Community Action Forums in each county. Participants included community leaders as well as NCO Board and staff representatives, with 21 people attending the Lake County forum and 24 attending in Mendocino County. The meetings focused on homelessness issues, with the goals of bringing diverse groups together, presenting the results of the Community Needs Assessment and other information on homelessness in the community, hearing about an innovative way others have used to address the needs of the AB109 population, and beginning to explore whether or not this model, the Community Re-‐Entry Work Program (CREW) could be used locally to address homelessness in Lake and Mendocino County. Summaries of the discussions held in each county are included in Appendices C and D.
Table 32. Suggestions from community survey
Area of Concern Lake County Mendocino County
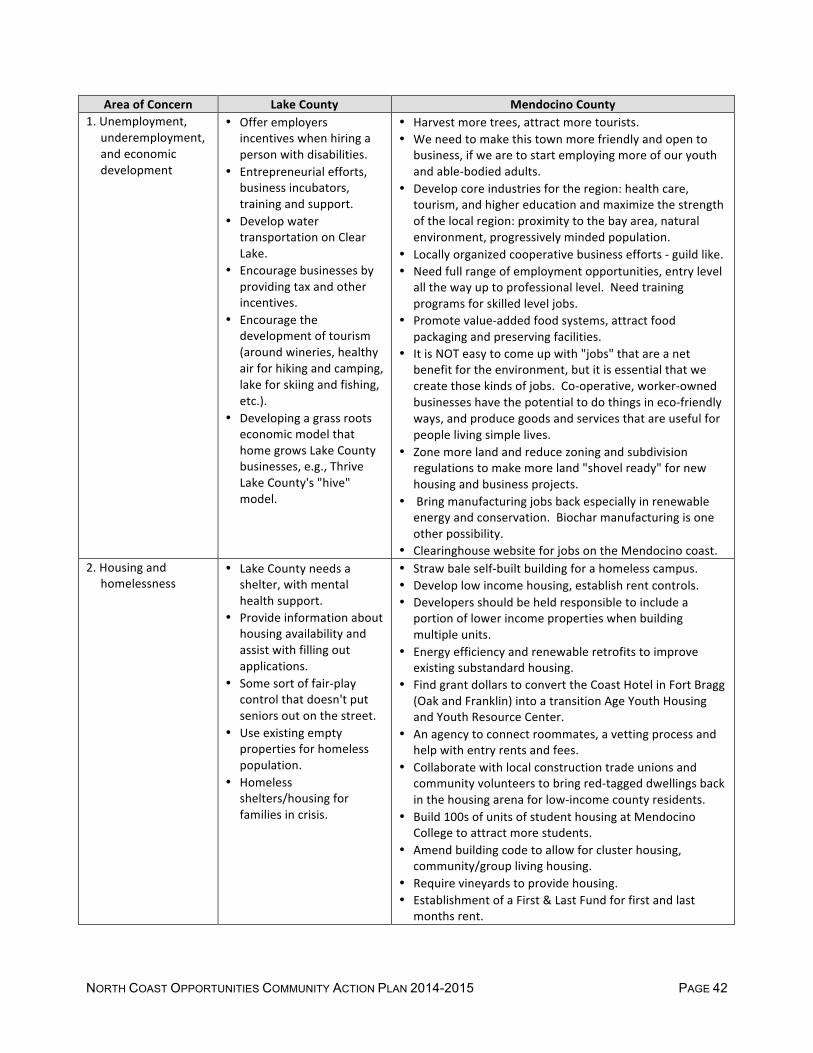
NORTH COAST OPPORTUNITIES COMMUNITY ACTION PLAN 2014-2015 PAGE 42
Area of Concern Lake County Mendocino County 1. Unemployment,
underemployment, and economic development
• Offer employers incentives when hiring a person with disabilities.
• Entrepreneurial efforts, business incubators, training and support.
• Develop water transportation on Clear Lake.
• Encourage businesses by providing tax and other incentives.
• Encourage the development of tourism (around wineries, healthy air for hiking and camping, lake for skiing and fishing, etc.).
• Developing a grass roots economic model that home grows Lake County businesses, e.g., Thrive Lake County's "hive" model.
• Harvest more trees, attract more tourists. • We need to make this town more friendly and open to
business, if we are to start employing more of our youth and able-‐bodied adults.
• Develop core industries for the region: health care, tourism, and higher education and maximize the strength of the local region: proximity to the bay area, natural environment, progressively minded population.
• Locally organized cooperative business efforts -‐ guild like. • Need full range of employment opportunities, entry level
all the way up to professional level. Need training programs for skilled level jobs.
• Promote value-‐added food systems, attract food packaging and preserving facilities.
• It is NOT easy to come up with "jobs" that are a net benefit for the environment, but it is essential that we create those kinds of jobs. Co-‐operative, worker-‐owned businesses have the potential to do things in eco-‐friendly ways, and produce goods and services that are useful for people living simple lives.
• Zone more land and reduce zoning and subdivision regulations to make more land "shovel ready" for new housing and business projects.
• Bring manufacturing jobs back especially in renewable energy and conservation. Biochar manufacturing is one other possibility.
• Clearinghouse website for jobs on the Mendocino coast. 2. Housing and
homelessness
• Lake County needs a shelter, with mental health support.
• Provide information about housing availability and assist with filling out applications.
• Some sort of fair-‐play control that doesn't put seniors out on the street.
• Use existing empty properties for homeless population.
• Homeless shelters/housing for families in crisis.
• Straw bale self-‐built building for a homeless campus. • Develop low income housing, establish rent controls. • Developers should be held responsible to include a
portion of lower income properties when building multiple units.
• Energy efficiency and renewable retrofits to improve existing substandard housing.
• Find grant dollars to convert the Coast Hotel in Fort Bragg (Oak and Franklin) into a transition Age Youth Housing and Youth Resource Center.
• An agency to connect roommates, a vetting process and help with entry rents and fees.
• Collaborate with local construction trade unions and community volunteers to bring red-‐tagged dwellings back in the housing arena for low-‐income county residents.
• Build 100s of units of student housing at Mendocino College to attract more students.
• Amend building code to allow for cluster housing, community/group living housing.
• Require vineyards to provide housing. • Establishment of a First & Last Fund for first and last
months rent.

NORTH COAST OPPORTUNITIES COMMUNITY ACTION PLAN 2014-2015 PAGE 43
Area of Concern Lake County Mendocino County 3. Alcohol and drug
use
• Tell kids they don't have to emulate their parents.
• Introduce mindfulness and other appropriate education into schools.
• Involve youth in building community.
• More, more, more school-‐based prevention programs for drugs/ alcohol and STD/pregnancy prevention.
• More incentives for people to access drug and alcohol programs.
• For drugs/alcohol, accept that people use them, provide more services to encourage healthy lifestyles.
• Mendocino Co. should put forth a ballot measure that would take 5-‐10% of property confiscated in drug raids and move it towards youth treatment.
• Our County has a meth epidemic. More attention needs to be paid to manufacturing and distribution of this insidious substance. Perhaps the reformation of the MCSO "white drug unit" disbanded several years ago?
• Legalize marijuana, regulate it and tax it. • Create/change policy to reduce harm in communities. • Develop an inpatient treatment center that can handle
both adults and youth separately, and integrate community healthcare with specialized drug treatment.
• Self medication is the only self-‐esteem available for many people. With few esteem-‐building employment opportunities, and the economic and physical world seeming to be deteriorating, and drugs/alcohol being cool, education, little by little.
• Continue with education about the effects of drugs and alcohol. Maybe begin as early as elementary school age children.
• I would like to see Howard Hospital converted to a drug/alcohol rehab and homeless shelter.
4. Nutrition, food security, and hunger
• Provide food so people don't have to burglarize.
• Home gardening projects. • Continue growing
community gardens, education, and relations with local producers.
• Food Security can be enhanced with the addition of a freeze drying facility in each region of the county.
• Support of food banks, soup kitchens, food programs in the schools, and increased employment opportunities.
• Supporting local food production is the best way address hunger / food security.
• Protect farm land from development or other land use conversion.
• Greater access to healthy food for low income individuals. Food Stamp match. Increased enrollment in Cal Fresh.
• Public education program on proper nutrition. • Put community gardens everywhere. • A Culinary School with a Nutrition thread. • We need much more healthy, non-‐processed food
provided by schools and other public facilities and we need to get soft drinks and ultra packaged foods out of schools.

NORTH COAST OPPORTUNITIES COMMUNITY ACTION PLAN 2014-2015 PAGE 44
Area of Concern Lake County Mendocino County 5. Education
• Increase Ed Tech classes in the school, i.e., bring back auto repair, and expand technology classes.
• Classes in food and money management.
• Have a SRO at each school.
• Mandate parenting classes.
• Incorporate citizenship and community service into every class and every grade level.
• Funding for pre-‐school, resources for non-‐English speaking students, reduction of class size.
• Revitalize College of the Redwoods, possibly make it Mendocino College campus.
• An overhaul of the curriculum being used. • Teach mindfulness practices to children. • Alternative education plans that enhance Native
American traditions and values. • Getting music back into our public school system is of the
utmost importance. • Establish work experience and trade programs, and
apprentice programs for all high school age students. • Work within schools to promote better nutrition tied to
local gardens and get children and teachers involved with the environment through stewardship activities.
• More time spent in school on math and environmental science.
• Partner to build certificate programs to meet the needs of the youth.
• It all comes down to guiding our youth to make healthy life choices.
6. Availability of services
• More county services located in largest city – Clearlake.
• Train front-‐end people to talk about services and get update on available services.
• Increase services by using regional (around the lake) offices and mobile access.
• Home visiting models that provide services in homes, for families without transportation.
• Fund coordination positions that could creatively bundle people going to court, agencies, grocery shopping, the doctor.
• Consolidate the many not-‐for-‐profits to save on administrative costs.
• Overhaul of HHSA, with particular attention to allocation of money -‐-‐ what % of budget goes to direct client services?
• Educating the public on the reality of limited services and whatever alternatives may be available would be a first step.
• Cross discipline training. Increase interagency collaboration and education.
• More collaborative relationships with the County. • Need broadband and improved cell phone coverage. • Private and public investment in better schools,
transportation, community infrastructure, and value-‐added and sustainable use of natural resources.
7. Access to health care and availability of health care services
• Somehow attract more medical/dental specialists to the area and retain them!
• We need to attract more medical staff to the area. • We need more insurance that is affordable for people in
the 55 to 65 age bracket. • Promote providers to accept plans that may pay less but
more than managed care, i.e., Blue Shield, HMO, etc. • Set up a low-‐cost county-‐run single-‐payer health care. • Mendocino County needs to have school-‐based health
care in low income schools. • Promote knowledge of herbs and natural healing,
exercise and self-‐help care. • Integrated Health Homes. • Need care after hours.

NORTH COAST OPPORTUNITIES COMMUNITY ACTION PLAN 2014-2015 PAGE 45
Area of Concern Lake County Mendocino County Other comments • All of these are complex
issues and will take focused, formal cross-‐agency and community strategies implemented over time to begin seeing positive outcomes.
• Workshops that can inspire children and parents to learn how to improve their lives starting with themselves!
• Community service projects that encourage student involvement.
• Attract and hire several good grant-‐writers.
• Choosing five was difficult. • Taking personal responsibility and not relying on
organizations for salvation, dropping out of this greed and fear culture.
• Capitalism is the number one problem for our planet. • Cultural Workshops for County Employee's would be
helpful for the County Staff to understand the legal rights Tribes have to go about their own business.
• Knowledge is power. People without hope are powerless. Let's give them hope!
• We have a great deal of talent and expertise right here in Mendocino County.
• For all areas, a community approach is necessary. We need to start thinking about the health of our communities when making community decisions, including planning and development. We need to somehow include our vulnerable populations in our discussions about community issues and how to address them.

NORTH COAST OPPORTUNITIES COMMUNITY ACTION PLAN 2014-2015 PAGE 46
V. Program Plan for 2014-‐2015 The following plan for 2014-‐2015 Community Action activities has been developed with community input through surveys, community forums, and needs identified throughout the previous year of program implementation and evaluation. The proposed activities have been selected based on a number of criteria, including the potential impact on participants, the existence of strong partnerships, organizational strengths and capacity, potential for leveraging additional funding, and the extent to which the activity will complement existing NCO programming. Because the areas of concern cannot be clearly demarcated, the proposed strategies may in fact address multiple needs although each is listed under only one area of concern. Project objectives and activities are outlined below.
NCO will continue working with local partners, including internal NCO programs, to develop and support programs that help low-‐income people to build the capacity to provide for themselves. Strategies in support of the proposed goals are outlined below.
Goal 1. Support the development of job training and work opportunities that make the most of local strengths.
• Work with community partners to promote and create opportunities for participation in job training programs that result in an increase in marketable job skills. These may include green jobs training programs (e.g., solar energy, water conservation), organic gardening, or similar topics. Partners may include city and county governments, the Workforce Investment Board, Mendocino Private Industry Council, Thrive Lake County, the Economic Development Finance Corporation, the California Indian Manpower Consortium, community colleges, County Offices of Education, family resource centers, and community groups interested in job development and retention.
• Work with local governments, the Workforce Investment Board, the Mendocino Private Industry Council, each County Office of Education’s Career Technical Education Program, and community groups and/or businesses to promote and create new jobs, such as green manufacturing programs (e.g., non-‐toxic baby bottles and solar panels), business incubators, food processing facilities, etc.
• Work with local partners (e.g., Thrive! Lake County, Lake County Farmers Finest, Lake County Food Round Table, MCFARM, Mendocino County Food Policy Council, Workforce Investment Board, local governments, Chambers of Commerce, and others) to advocate for institutional policies that support local economies.
• Work with Chambers of Commerce, local farmers, and farmers market associations to promote local food production and “buy local” campaigns.
• Explore innovative models for reducing homelessness, such as the Community Re-‐Entry Work Program (CREW) Model, which is a best-‐practice, cost-‐effective response to reduce homelessness among returning offenders by addressing their varied needs, including housing, employment, behavioral health services, and benefits assistance.
Goal 2. Develop housing resources, including resources for homeless people.
• Establish a Homelessness Continuum of Care (CoC) for Lake County. • Explore the feasibility of merging the Lake and Mendocino County CoCs. • Participate in each county’s biannual point-‐in-‐time homeless counts. • Raise community awareness of the extent and causes of homelessness in the area. • Seek funding for expanded housing resources for the homeless.

NORTH COAST OPPORTUNITIES COMMUNITY ACTION PLAN 2014-2015 PAGE 47
• Work with the Lake County Continuum of Care and the Mendocino County Homeless Services Planning Group to advocate for development of low-‐income and transitional housing units.
Goal 3. Increase community food security and access to healthy food and nutrition information.
• Continue to support and participate on the Lake County Food Round Table and the Mendocino County Food Policy Council.
• To attract youth and other nontraditional farmers, work with Mendocino College and other partners to explore a small farm management certificate program.
• Continue to strengthen networking and advocacy with local businesses to increase purchase and promotion of locally-‐produced foods.
• Support development of community and school gardens. • Extend GetFRESH outreach into family day care homes. • Work with community partners to strategize and support development of local food industries
such as a culinary institute, business incubators, meat processing facility, etc. • Through the BEANS Project, partner with family resource centers and local school districts to
plan and deliver nutrition education and cooking classes to low-‐income children and parents. • Coordinate training for school food service staff to increase their capacity to utilize fresh local
produce. • Convene a Farmers Convergence for networking and training. • Develop and support local food pantries.
Goal 4. Strengthen collaboration with partners and with existing NCO programs to increase access to services.
• Share information among NCO programs to identify opportunities for joint program development, implementation, and collaboration.
• Coordinate with family resource centers, senior centers, banks and credit unions, and community volunteers to offer tax preparation assistance to low-‐income families.
• Coordinate with local utility providers and North Coast Energy Services to enroll eligible families in such programs as LifeLine Telephone Program, Low Income Home Energy Assistance Program, etc.
• Continue to recruit, train, support, and recognize community volunteers for NCO programs (e.g., Foster Grandparents, Retired and Senior Volunteers, etc.) and other community programs.
• Encourage the participation of low-‐income residents on such boards and leadership groups as: the NCO Board, Leadership Mendocino, Lake County Continuum of Care, Mendocino County Food Policy Council, Head Start Policy Council, food banks, and others.
• Continue to partner and collaborate with a wide range of agencies, faith-‐based organizations, and community groups to develop and strengthen programs that help families and communities to build their capacity for self-‐sufficiency.
• Work to create and strengthen the social networks that empower people to have healthy, secure, and fulfilling lives.
• Continue to offer fiscal sponsorship in support of local projects, as appropriate.
Goal 5. Increase access to health care services by increasing levels of insurance coverage.
• Partner to coordinate outreach and community education to raise awareness of the Affordable Care Act (ACA).

NORTH COAST OPPORTUNITIES COMMUNITY ACTION PLAN 2014-2015 PAGE 48
• Coordinate with local partners to maximize insurance enrollment.
Connections between identified needs, the proposed activities, and anticipated outcomes are depicted in the Logic Model that is shown in Figure 9 below.
Figure 9. CAP Logic Model
Challenges and Opportunities
Goals Activities Anticipated Outcomes
High levels of unemployment, under-‐employment, and a struggling economic environment
1. Support the development of job training and work opportunities that make the most of local strengths.
• Support job training programs • Explore innovative models such as CREW • Promote and create new job opportunities • Promote local food production and “buy
local” campaigns. • Advocate for institutional policies that
support local economies
• Lower unemployment
• High skill base • Improved local
economy
High levels of homelessness and limited availability of low-‐income housing
2. Develop housing resources, including resources for homeless people.
• Establish a Lake CoC • Explore feasibility of merging the Lake and
Mendocino CoCs • Support homeless counts • Raise community awareness of problem • Seek funding for expanded housing
resources • Advocate for low-‐income and transitional
housing units.
• Better coordination among agencies serving the homeless
• Increase in emergency and long-‐term housing resources
High poverty rates resulting in low levels of food security, hunger, and poor nutrition demonstrated by high levels of diabetes and obesity
3. Increase community food security and access to healthy food and nutrition information.
• Support Lake County Food Round Table and Mendocino County Food Policy Council
• Support community and school gardens • Explore a small farm certificate program • Promote locally-‐produced foods • Extend GetFRESH outreach into family day
care homes • Support development of local food
industries. • Through BEANS, deliver nutrition education
and cooking classes to low-‐income children and parents
• Training for school food service staff • Convene Farmers Convergence • Develop and support local food pantries
• Increase in local food production, utilization, and consumption
• Increase in nutritional knowledge
• Improvement in healthy eating habits
In adequate levels of service and barriers to accessing services
4. Strengthen collaboration with partners and with existing NCO programs to increase access to services.
• Internal collaboration. • Tax preparation assistance to low-‐income
families • Coordination to enroll eligible families in
utility company programs • Utilize volunteers • Encourage participation of low-‐income
residents on boards and leadership groups • Support family and community self-‐
sufficiency • Strengthen social networks • Offer fiscal sponsorship to nonprofits
• Improved internal coordination of programs and services
• Increased access to services for low-‐income people
• Voice of low-‐income people heard on decision-‐making bodies and leadership groups

NORTH COAST OPPORTUNITIES COMMUNITY ACTION PLAN 2014-2015 PAGE 49
Challenges and Opportunities
Goals Activities Anticipated Outcomes
Limited access to health care and availability of health care services
5. Increase access to health care services by increasing levels of insurance coverage.
• Community outreach and education on ACA • Coordination to maximize insurance
enrollment
• Increase community knowledge and awareness related to ACA
• Increased level of insurance coverage