nordic sustainable development indicators 2014
DESCRIPTION
This brochure briefly describes these Nordic Sustainable Development Indicators, which show long term trends in the following focus areas: theNordic welfare model; viable ecosystems; changing climate; sustainable use of the earth’s resources; and education, research and innovation. A complete set of key indicators, including separate national graphics, can be found on the website www.norden.org/sdindicators. The website also offers free access to the Nordic Statistics database, which allows you to download data and create graphics for your own analysis.TRANSCRIPT

Nordic Sustainable Development Indicators
2014

Nordic Sustainable Development Indicators 2014
ISBN 978-92-893-3810-3 (PRINT)ISBN 978-92-893-3811-0 (PDF)http://dx.doi.org/10.6027/ANP2014-755ANP 2014:755© Nordic Council of Ministers 2014Cover design: Jette Koefoed/SignElementsPhotos: ImageSelect and SignElementsPrint: Rosendahls-Schultz Grafisk, AlbertslundCopies: 1 500
Printed in Denmark
Main suppliers of data: The Nordic national statistical institutes and EurostatEd: Klaus Munch Haagensen, Statistics Denmark.
Nordic Council of Ministers Ved Stranden 18DK-1061 Copenhagen K www.norden.org/en/publications
Nordic co-operation
Nordic co-operation is one of the world’s most extensive forms of regional collaboration, involving Denmark, Finland, Iceland, Norway, Sweden, and the Faroe Islands, Greenland, and Åland.
Nordic co-operation has firm traditions in politics, the economy, and culture. It plays an important role in European and international collabora-tion, and aims at creating a strong Nordic community in a strong Europe.
Nordic co-operation seeks to safeguard Nordic and regional interests and principles in the global community. Common Nordic values help the region solidify its position as one of the world’s most innovative and competitive.

Nordic Sustainable Development Indicators 2014
ANP 2014:755

1. The Nordic welfare model 41.1 Demographic trends 4
1.2 Gross Domestic Product (GDP) 6
1.3 Public debt 7
1.4 Urbanisation 8
1.5 Employment and unemployment rate 9
1.6 Life expectancy at birth 11
1.7 Gini-coefficient 13
1.8 Risk of poverty amongst families
with children 14
1.9 Gender pay gap 15
2. Viable ecosystems 162.1 Sustainability of fish stocks 16
2.2 Discharge of nitrogen and phosphorus
into the Baltic Sea 18
2.3 Change in the common bird index 20
2.4 Developments in annual fellings and
increments in forests 21
2.5 Urban population exposure to air
pollution by ozone and particulates 22
Symbols Nil - Less than half 0 Not applicable . Data not available ..
3. Changing climate 243.1 Share of renewable energy in gross
energy supply 24
3.2 Developments in greenhouse gas
emissions by sector 25
3.3 Emissions and land use, land use
change and forestry 28
4. Sustainable use of earth’s resources 294.1 Decoupling of environmental
pressures and economic growth 29
4.2 Nordic Ecolabel and the EU Ecolabel 31
4.3 Proportion of environmental taxes in
total tax revenues 32
4.4 Development in municipal waste
management by treatment method 33
5. Education, research and innovation 345.1 Educational attainment 34
5.2 Research and development expenditure
as a percentage of GDP 36
The symbol : and the reference that appears below a diagram identifies the table in the database that has served as its source. A click in the PDF version takes you directly to the table in question. On the web page www.norden.org/sdindicators, you can find the Nordic Statistics database and all the data behind the indicators, in more detail.
Content
Denmark (DK) Faroe Islands (FO) Euro Area (EA)
Greenland (GL) Finland (FI) EU (EU27 or
EU28)
Norway (NO) Sweden (SE)
Åland (AX) Iceland (IS)

Foreword
Achieving sustainable development is an ambitious but necessary goal. There is no alternative: we have to improve welfare and quality of life globally and safeguard the earth’s ability to support life in all its diversity.
The Nordic countries have established joint objectives for sustainable development in the Nordic region. In addition, the countries have agreed on a set of sustainability indicators that give an overall picture of our progress.
This brochure briefly describes these Nordic Sustainable Development Indicators, which show long-term trends in the following focus areas: the Nordic welfare model; viable ecosystems; changing climate; sustainable use of the earth’s resources; and education, research and innovation.
A complete set of key indicators, including separate national graphics, can be found on our website . The website also offers free access to the Nordic Statistics database, which allows you to download data and create graphics for your own analysis.
I believe that our indicators are useful not just for decision makers and civil servants but for all who need reliable information and comparable data on development in the Nordic region.
Secretary GeneralNordic Council of Ministers

4 Nordic Sustainable Development Indicators 2014. www.norden.org/sdindicators
1
Population Development. Index 1990=100
INDIC01 Opdateret 18.06.2014 kmh
90
95
100
105
110
115
120
125
130
NO
AX
FO
EU27
DK
FI
SE
GL
IS
FO
DK
1. The Nordic welfare model
1.1 Demographic trends
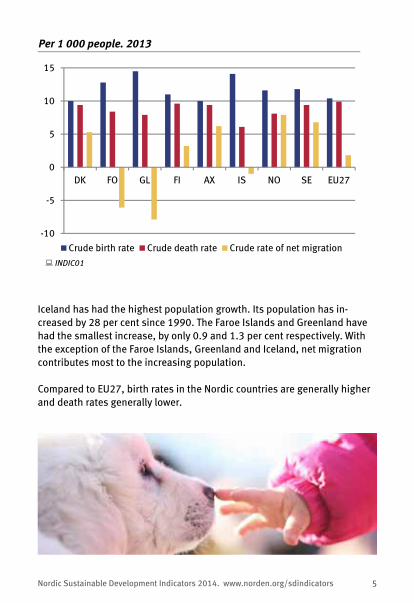
The indicator shows the population development and the contributing factors: births, deaths and net migration. The population development is shown as an index based on 1990, i.e. you can directly read how much the population has grown compared to the other countries. The contributing factors are here shown as the crude rate, i.e. the number of births, deaths and net migration per 1 000 inhabitants.
Nordic Sustainable Development Indicators 2014. www.norden.org/sdindicators 5
Iceland has had the highest population growth. Its population has in-creased by 28 per cent since 1990. The Faroe Islands and Greenland have had the smallest increase, by only 0.9 and 1.3 per cent respectively. With the exception of the Faroe Islands, Greenland and Iceland, net migration contributes most to the increasing population.
Compared to EU27, birth rates in the Nordic countries are generally higher and death rates generally lower.
2
Crude birth rate, death rate and crude rate of net migration. Per 1 000 people. 2013
INDIC01
Opdateret 18.06.2014 kmh
-10
-5
0
5
10
15
DK FO GL FI AX IS NO SE EU27
Crude birth rate Crude death rate Crude rate of net migration

6 Nordic Sustainable Development Indicators 2014. www.norden.org/sdindicators
1.2 Gross Domestic Product (GDP)
The indicator Gross Domestic Product per person shows trends in the nation’s general economic situation. Purchasing Power Standards (PPS) have been recalculated, thereby eliminating differences in price levels between countries.
All of the Nordic countries have a higher GDP per person than the EU. In Norway, the GDP per person is almost twice that of the EU27. Norway is at the top, Sweden and Denmark numbers two and three.
GDP per person has increased in all countries since 1995 but, due to the global financial crisis, GDP declined in all countries in 2009.
3
Gross Domestic Product in PPS. Euro per person
INDIC02
Opdateret 05.08.2014 kmh
15 000
20 000
25 000
30 000
35 000
40 000
45 000
50 000
1995
1996
1997
1998
1999
2000
2001
2002
2003
2004
2005
2006
2007
2008
2009
2010
2011
2012
2013
IS
NO
AX
EU27
DK
FI
SE

Nordic Sustainable Development Indicators 2014. www.norden.org/sdindicators 7
1.3 Public debt
The indicator shows the consolidated general government gross debt as a percentage of GDP, as defined in the Maastricht Treaty.
4
Consolidated general government gross debt. Per cent of GDP
INDIC03
Opdateret 05.08.2014 kmh
0102030405060708090
100110
1990
1991
1992
1993
1994
1995
1996
1997
1998
1999
2000
2001
2002
2003
2004
2005
2006
2007
2008
2009
2010
2011
2012
2013
IS
NO
EA17DK
FI
SE
EU threshold
Except for Iceland, the share of debt is lower in all the Nordic countries than in the EU, and all are below the EU threshold of 60 per cent of GDP. However, both Denmark and Finland (and the EU) have experienced a rise in their debt share since the beginning of the financial crisis.

8 Nordic Sustainable Development Indicators 2014. www.norden.org/sdindicators
1.4 Urbanisation
The indicator shows the share of the population living in densely, intermediate and thinly populated areas. The populations are placed in the different areas of urbanisation based on the EU definition of Rural grid cells, Urban clusters and High-density clusters.
Since 2000, densely populated areas have increased in all the Nordic countries (in Norway since 2005).
In Iceland and in the EU, the largest proportion of the population lives in densely populated areas. Please note that almost 25 per cent of the population in Sweden has been placed in the category “unknown”.
5
Degree of urbanisation. Per cent of total population
INDIC104
Opdateret 18.06.2014 kmh
0%
20%
40%
60%
80%
100%
2000
2013
2000
2013
2000
2013
2005
2013
2000
2013
2000
2013
Denmark Finland Iceland Norway Sweden EU27
Densely populated area Intermediate urbanised areaThinly populated area Unknown

Nordic Sustainable Development Indicators 2014. www.norden.org/sdindicators 9
1.5 Employment and unemployment rate
The employment rate is defined as the proportion of persons aged 15 to 64 in employment. The EU 2020 target is an employment rate of 75 per cent for the group of 20 to 64-year-olds.
6
Employment rate. 15–64 years of age
INDIC05
Opdateret 05.08.2014 kmh
55
60
65
70
75
80
85
90
95
1990
1991
1992
1993
1994
1995
1996
1997
1998
1999
2000
2001
2002
2003
2004
2005
2006
2007
2008
2009
2010
2011
2012
2013
IS
NOAX
FO
EU27
DK
FI
SE
GL
All the Nordic countries with the exception of Finland are close to – or even exceed – the target of an employment rate of 75 per cent for people aged 20 to 64, even when the 15–20-year-olds are included. The employment rate is usually much lower for this latter group.

10 Nordic Sustainable Development Indicators 2014. www.norden.org/sdindicators
The overall unemployment rate has fluctuated since the early 1990s. The current rate has varied from 1.8 per cent in the Faroe Islands in 2007 to almost 17 per cent in Finland in 1994, and was at a maximum in most countries in the early 1990s and late 2000s.
All Nordic countries have experienced a rise in their unemployment since the financial crisis began in 2008. In 2013, Denmark, Finland and Sweden had the highest rates between 7 and 8 per cent.
The unemployment rate is much higher for young people aged 15 to 24 than for the population between 15 and 64. In the EU, Finland and Sweden, more than 20 per cent of the people in that group are unemployed. This is more than twice the overall rate.
7
Unemployment rate. 15–64 years of age
INDIC05
Opdateret 05.08.2014 kmh
0
2
4
6
8
10
12
14
16
18
1990
1991
1992
1993
1994
1995
1996
1997
1998
1999
2000
2001
2002
2003
2004
2005
2006
2007
2008
2009
2010
2011
2012
2013
IS
NO
AX
FO EU27DK
FI
SE
GL
The unemployment rate is defined as the number of unemployed persons as a percentage of the labour force. The labour force consists of all employed and unemployed persons in the age group 15 to 64.
Nordic Sustainable Development Indicators 2014. www.norden.org/sdindicators 11
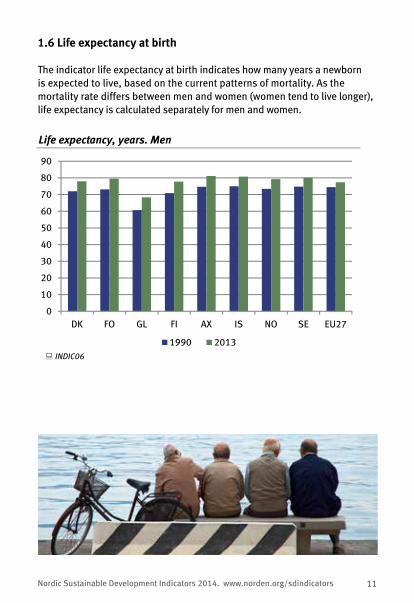
1.6 Life expectancy at birth
The indicator life expectancy at birth indicates how many years a newborn is expected to live, based on the current patterns of mortality. As the mortality rate differs between men and women (women tend to live longer), life expectancy is calculated separately for men and women.
8
Life expectancy, years. Men
INDIC06
Opdateret 20.06.2014 kmh
0
10
20
30
40
50
60
70
80
90
DK FO GL FI AX IS NO SE EU27
1990 2013
12 Nordic Sustainable Development Indicators 2014. www.norden.org/sdindicators
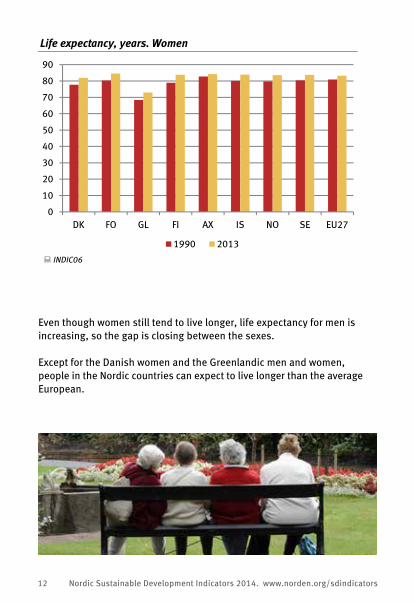
9
Life expectancy, years. Women
INDIC06
Opdateret 20.06.2014 kmh
0
10
20
30
40
50
60
70
80
90
DK FO GL FI AX IS NO SE EU27
1990 2013
Even though women still tend to live longer, life expectancy for men is increasing, so the gap is closing between the sexes.
Except for the Danish women and the Greenlandic men and women, people in the Nordic countries can expect to live longer than the average European.

Nordic Sustainable Development Indicators 2014. www.norden.org/sdindicators 13
All the Nordic countries are considered to be very equal societies. In recent years (20005 to 2012), inequality has risen in Denmark and Sweden. This trend is also seen in the rest of Europe and among other OECD countries.
10
Gini-coefficient
INDIC07
Opdateret 20.06.2014 kmh
0.00
0.05
0.10
0.15
0.20
0.25
0.30
0.35
Denmark Finland Iceland Norway Sweden EU27
2005 2006 2007 2008 2009 2010 2011 2012
1.7 Gini-coefficient
The Gini-coefficient is the most commonly used measure of inequality. The coefficient varies between 0, which reflects complete equality (when everybody has identical incomes) and 1, which indicates complete inequality (i.e. one person has all the income or consumption, all others have none).

14 Nordic Sustainable Development Indicators 2014. www.norden.org/sdindicators
1.8 Risk of poverty amongst families with children
The indicator measures the proportion of persons at risk of monetary poverty. Monetary poverty is a key dimension of social inclusion. Persons are at risk of poverty if their equivalised disposable income is below the risk-of-poverty threshold, which in the EU is set at 60 per cent of the national median income after social transfers.
In all the Nordic countries, single parents are at a greater risk of poverty than two adults with children.
In 2012, single parents in Sweden were at the greatest risk of poverty compared with the other Nordic countries and the 27 EU countries.
Since 2004, most countries have experienced an increase in the risk of poverty for both types of households.
11
Risk of poverty
INDIC09
Opdateret 20.06.2014 kmh
0
5
10
15
20
25
30
35
40
Denmark Finland Iceland Norway Sweden EU27
Single parent with children 2004 Single parent with children 2008Single parent with children 2012 Two adults with children 2004Two adults with children 2008 Two adults with children 2012
Nordic Sustainable Development Indicators 2014. www.norden.org/sdindicators 15
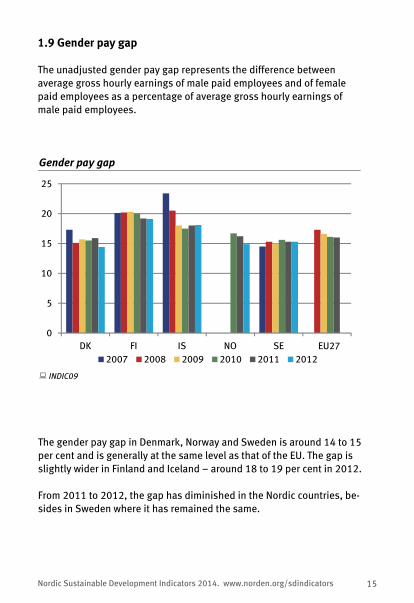
1.9 Gender pay gap
The unadjusted gender pay gap represents the difference between average gross hourly earnings of male paid employees and of female paid employees as a percentage of average gross hourly earnings of male paid employees.
12
Gender pay gap
INDIC09
Opdateret 20.06.2014 kmh
0
5
10
15
20
25
DK FI IS NO SE EU272007 2008 2009 2010 2011 2012
The gender pay gap in Denmark, Norway and Sweden is around 14 to 15 per cent and is generally at the same level as that of the EU. The gap is slightly wider in Finland and Iceland – around 18 to 19 per cent in 2012.
From 2011 to 2012, the gap has diminished in the Nordic countries, be-sides in Sweden where it has remained the same.
16 Nordic Sustainable Development Indicators 2014. www.norden.org/sdindicators
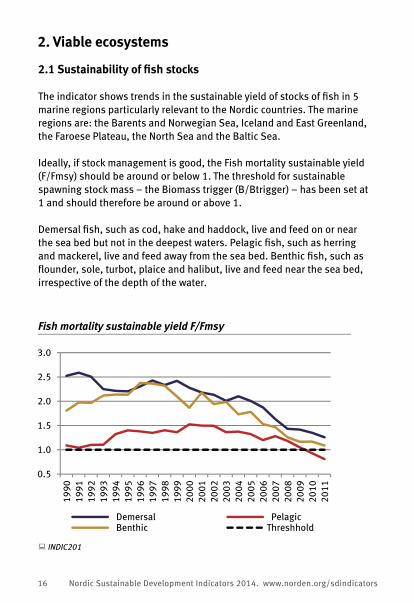
2.1 Sustainability of fish stocks
The indicator shows trends in the sustainable yield of stocks of fish in 5 marine regions particularly relevant to the Nordic countries. The marine regions are: the Barents and Norwegian Sea, Iceland and East Greenland, the Faroese Plateau, the North Sea and the Baltic Sea.
Ideally, if stock management is good, the Fish mortality sustainable yield (F/Fmsy) should be around or below 1. The threshold for sustainable spawning stock mass – the Biomass trigger (B/Btrigger) – has been set at 1 and should therefore be around or above 1.
Demersal fish, such as cod, hake and haddock, live and feed on or near the sea bed but not in the deepest waters. Pelagic fish, such as herring and mackerel, live and feed away from the sea bed. Benthic fish, such as flounder, sole, turbot, plaice and halibut, live and feed near the sea bed, irrespective of the depth of the water.
13
Fish mortality sustainable yield F/Fmsy
INDIC201
0.5
1.0
1.5
2.0
2.5
3.0
1990
1991
1992
1993
1994
1995
1996
1997
1998
1999
2000
2001
2002
2003
2004
2005
2006
2007
2008
2009
2010
2011
Demersal Pelagic Benthic Threshhold
2. Viable ecosystems

Nordic Sustainable Development Indicators 2014. www.norden.org/sdindicators 17
The overall picture regarding trends in fish mortality from 1990 onwards is positive for all types of fish stocks. The indicator for pelagic stocks is below 1, and below 1.5 for demersal and benthic stocks. The trend is downwards, and therefore positive.
The Biomass trigger has been on the positive side of the threshold since 1990 with some fluctuations below the threshold over the period. In 2011, pelagic and benthic stocks were approximately 1.3 and demersal stocks approximately 1.8.
14
Biomass trigger/Btrigger
INDIC201
0.5
1.0
1.5
2.0
1990
1991
1992
1993
1994
1995
1996
1997
1998
1999
2000
2001
2002
2003
2004
2005
2006
2007
2008
2009
2010
2011
Demersal Pelagic Benthic Threshhold

18 Nordic Sustainable Development Indicators 2014. www.norden.org/sdindicators
2.2 Discharge of nitrogen and phosphorus into the Baltic Sea
The indicator shows the annual discharges of nitrogen and phosphorus into the Baltic Sea from all the countries bordering the Baltic Sea.
Data covers both monitored and unmonitored loads (i.e. loads from unmonitored areas). From parts of the countries surrounding the Baltic Sea (especially Russia), some loads have not been reported. Data concerning loads from the Kaliningrad region (Russia), are missing completely. The load from the Tornionjoki/Torneälv river forming the boundary between Sweden and Finland has been allocated exclusively to Sweden, and the load of the river Narva between Estonia and Russia has been allocated exclusively to Estonia.
15
Discharge of nitrogen into the Baltic Sea. 1 000 tonnes
INDIC202
Opdateret 22.08.2014 kmh
0
200
400
600
800
1,000
1994
1995
1996
1997
1998
1999
2000
2001
2002
2003
2004
2005
2006
2007
2008
2009
2010
Poland Sweden Finland Russia LithuaniaDenmark Estonia Germany Latvia

Nordic Sustainable Development Indicators 2014. www.norden.org/sdindicators 19
The amount of precipitation, and thus the amount of riverine flow, are closely related to the riverine input of nutrients to the Baltic Sea. This can be seen clearly, for example, in the diagrams for 2003. Runoff was very low, so the discharges of both nitrogen and phosphorus were also low.
The largest nitrogen and phosphorus discharges are from Poland. Discharge of nitrogen from Poland is nearly 2 ½ times that of the second country, Sweden, and discharge of phosphorus from Poland is three times that of the second country, Sweden. Russia and Finland are in third and fourth place for both types of discharge. The same four countries also have the largest riverine water runoff in the region.
Total discharge of nitrogen into the Baltic Sea declined from approximately 890 000 tonnes in 1994 to approximately 730 000 tonnes in 2010.
Phosphorus discharge decreased slightly between 1994 and 2010 from 36 000 tonnes to approximately 34 500 tonnes
16
Discharge of phosphorus into the Baltic Sea. 1 000 tonnes
INDIC202
Opdateret 22.08.2014 kmh
0
10
20
30
40
5019
94
1995
1996
1997
1998
1999
2000
2001
2002
2003
2004
2005
2006
2007
2008
2009
2010
Poland Sweden Finland Russia LithuaniaDenmark Estonia Germany Latvia
20 Nordic Sustainable Development Indicators 2014. www.norden.org/sdindicators
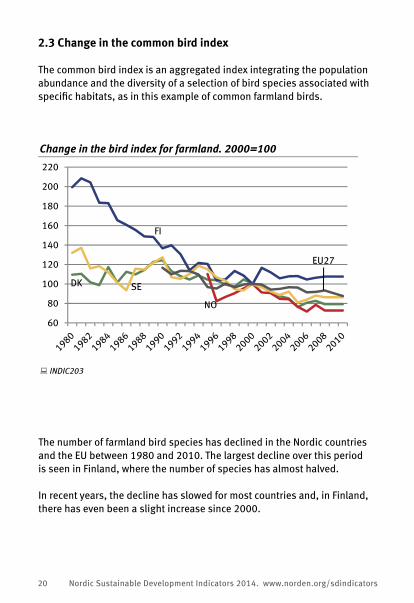
2.3 Change in the common bird index
The common bird index is an aggregated index integrating the population abundance and the diversity of a selection of bird species associated with specific habitats, as in this example of common farmland birds.
The number of farmland bird species has declined in the Nordic countries and the EU between 1980 and 2010. The largest decline over this period is seen in Finland, where the number of species has almost halved.
In recent years, the decline has slowed for most countries and, in Finland, there has even been a slight increase since 2000.
17
Change in the bird index for farmland. 2000=100
INDIC203
Ingen nye tal til opdatering 20.06.2014 kmh
60
80
100
120
140
160
180
200
220
NO
SE
EU27
DK
FI

Nordic Sustainable Development Indicators 2014. www.norden.org/sdindicators 21
2.4 Developments in annual fellings and increments in forests
The indicator shows three trends in forests: the annual amount of forest fellings, the net increment and the annual fellings as a percentage of net annual increment. The latter is shown here.
18
Forests. Annual fellings as share of net annual increment
INDIC204
Ingen nye tal til opdatering 20.06.2014 kmh
0
20
40
60
80
100
Denmark Finland Norway Sweden EU27
1990 2000 2005 2010
The net annual increment of forests is now greater than in 1990 for all the Nordic countries. Annual fellings are also greater than in 1990, with the exception of Norway.
In all Nordic countries except Norway, there were fewer fellings in relation to the net increment in 2010 than in 2005. In the EU and Norway, the rate of fellings has increased in the same period.

22 Nordic Sustainable Development Indicators 2014. www.norden.org/sdindicators
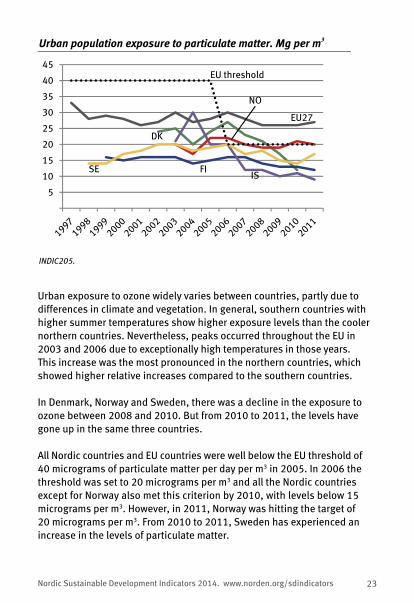
2.5 Urban population exposure to air pollution by ozone and particulates
The first part of the indicator shows the population-weighted annual total of maximum daily eight-hour mean ozone concentrations above a threshold of 70 micrograms of ozone per m3 at background stations in urban areas. The second part of the indicator shows the population-weighted annual mean concentration of particulate matter (PM10) at urban background. Particulate matter (PM10) comprises particles of smaller than 10 micrometers.
19
Urban population exposure to ozone. Number of hours1
INDIC205 1 Number of eight-hours mean concentration (annual sum).
Opdateret 20.06.2014 kmh
1 000
2 000
3 000
4 000
5 000
6 000
1997
1998
1999
2000
2001
2002
2003
2004
2005
2006
2007
2008
2009
2010
2011
IS NOSE
EU27
DK
FI
Nordic Sustainable Development Indicators 2014. www.norden.org/sdindicators 23
Urban exposure to ozone widely varies between countries, partly due to differences in climate and vegetation. In general, southern countries with higher summer temperatures show higher exposure levels than the cooler northern countries. Nevertheless, peaks occurred throughout the EU in 2003 and 2006 due to exceptionally high temperatures in those years. This increase was the most pronounced in the northern countries, which showed higher relative increases compared to the southern countries.
In Denmark, Norway and Sweden, there was a decline in the exposure to ozone between 2008 and 2010. But from 2010 to 2011, the levels have gone up in the same three countries.
All Nordic countries and EU countries were well below the EU threshold of 40 micrograms of particulate matter per day per m3 in 2005. In 2006 the threshold was set to 20 micrograms per m3 and all the Nordic countries except for Norway also met this criterion by 2010, with levels below 15 micrograms per m3. However, in 2011, Norway was hitting the target of 20 micrograms per m3. From 2010 to 2011, Sweden has experienced an increase in the levels of particulate matter.
20
Urban population exposure to particulate matter. Mg per m3
INDIC205.
Opdateret 20.06.2014 kmh
5
10
15
20
25
30
35
40
45
IS
NO
SE
EU27
DK
FI
EU threshold

24 Nordic Sustainable Development Indicators 2014. www.norden.org/sdindicators
3.1 Share of renewable energy in gross energy supply
The indicator shows the share of renewable energy in the total energy supply for consumption. Renewable energy sources are hydro-electric, wind, geothermal, wave and solar energy.
Due to the availability of natural resources, hydro energy is a major source of renewable energy in some of the Nordic countries, e.g. Norway and Sweden. In Iceland, geothermal power plays the largest role.
Since 1990, there has been a rise in the proportion of renewable energy in the overall energy supply in the Nordic region – by between 7 and 21 per cent. Iceland and Norway have the highest proportions of renewable energy supply at 86 and 42 per cent respectively.
The biggest change has occurred in Denmark, where the proportion has in-creased to almost 23 per cent – nearly fourfold in 2012 compared with 1990.
21
Share of renewable energy in gross energy supply. Per cent
INDIC301
Opdateret 20.06.2014 kmh
0
10
20
30
40
50
60
70
80
90
1990
1991
1992
1993
1994
1995
1996
1997
1998
1999
2000
2001
2002
2003
2004
2005
2006
2007
2008
2009
2010
2011
2012
IS
NO
SE
EU27
DKFI GL
3. Changing climate

Nordic Sustainable Development Indicators 2014. www.norden.org/sdindicators 25
3.2 Developments in greenhouse gas emissions by sector
This indicator shows the contribution of key source categories to total greenhouse gas emissions, and how they change over time. A key source category is defined as an emission source category that has a significant influence on a country’s greenhouse gas inventory in terms of the absolute level of emissions, the trend in emissions, or both.
The different greenhouse gases are weighted by their global warming potential, and the results are expressed in CO2-equivalents.
22
Total greenhouse gas emissions. 1990=100
INDIC302
Opdateret 20.06.2014 kmh
70
80
90
100
110
120
130
140
1990 1992 1994 1996 1998 2000 2002 2004 2006 2008 2010 2012
IS
NO
SEEU28
DK
FI
GL
In Denmark and Sweden, greenhouse gas emissions decreased by between 20 and 25 per cent between 1990 and 2012, but emissions have increased in Norway and Iceland. Iceland has had the highest increase in greenhouse gas emissions, an incease of 26 per cent.

26 Nordic Sustainable Development Indicators 2014. www.norden.org/sdindicators
23
Greenhouse gas emissions by sectors. Nordic countries total. Million tonnes of CO2-equivalents
INDIC302
Opdateret 20.06.2014 kmh
0
50
100
150
200
250
300
1990 1992 1994 1996 1998 2000 2002 2004 2006 2008 2010 2012
Waste Agriculture Solvent and Other product use Industrial processes Other energy sectors Transport Manufacturing and Construction Energy industries
In both the Nordic countries and the EU, the energy industries and the transport sector account for the highest emissions of green-house gases. Except for the transport sector, all other sectors have had a decline in their emissions since 1990.

Nordic Sustainable Development Indicators 2014. www.norden.org/sdindicators 27
24
Greenhouse gas emissions by sectors. EU27 total. Million tonnes of CO2-equivalents
INDIC302
Opdateret 20.06.2014 kmh
1 000
2 000
3 000
4 000
5 000
6 000
1990 1992 1994 1996 1998 2000 2002 2004 2006 2008 2010 2012
Waste Agriculture Solvent and other product use Industrial processes Other energy sectors Transport Manufacturing and construction Energy industries
28 Nordic Sustainable Development Indicators 2014. www.norden.org/sdindicators
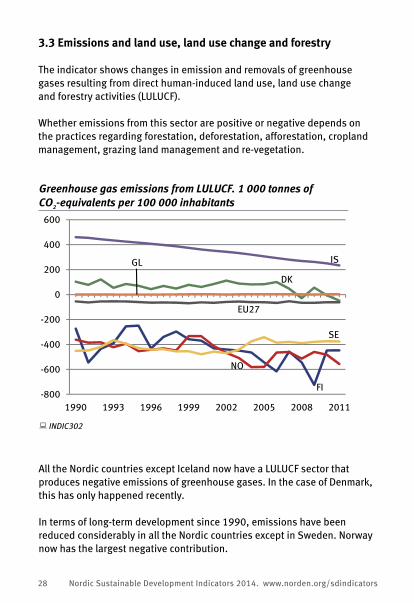
3.3 Emissions and land use, land use change and forestry
The indicator shows changes in emission and removals of greenhouse gases resulting from direct human-induced land use, land use change and forestry activities (LULUCF).
Whether emissions from this sector are positive or negative depends on the practices regarding forestation, deforestation, afforestation, cropland management, grazing land management and re-vegetation.
25
Greenhouse gas emissions from LULUCF. 1 000 tonnes of CO2-equivalents per 100 000 inhabitants
INDIC302
Opdateret 20.06.2014 kmh
-800
-600
-400
-200
0
200
400
600
1990 1993 1996 1999 2002 2005 2008 2011
IS
NO
DK
FI
SE
EU27
GL
All the Nordic countries except Iceland now have a LULUCF sector that produces negative emissions of greenhouse gases. In the case of Denmark, this has only happened recently.
In terms of long-term development since 1990, emissions have been reduced considerably in all the Nordic countries except in Sweden. Norway now has the largest negative contribution.

Nordic Sustainable Development Indicators 2014. www.norden.org/sdindicators 29
4.1 Decoupling of environmental pressures and economic growth
This indicator shows the developments in greenhouse gas emissions, total energy consumption and the GDP since 1990, and gives an indication of a possible correlation between economic growth and environmental pressures and gross energy consumption.
26
GDP, energy consumption and greenhouse gas emissions. Nordic countries total
INDIC401
Opdateret 05.08.2014 kmh
70
80
90
100
110
120
130
140
150
1995
1996
1997
1998
1999
2000
2001
2002
2003
2004
2005
2006
2007
2008
2009
2010
2011
2012
GDP Energy consumption GHG emissions
4. Sustainable use of earth’s resources

30 Nordic Sustainable Development Indicators 2014. www.norden.org/sdindicators
Between 1995 and 2012, energy consumption has decreased in the Nordic countries – a decrease of 20 per cent.
Considering the total greenhouse gas emissions in the same period, the overall tendency varies more between the Nordic countries. For the Nordic countries in total, there has been a decrease of 17 per cent in emissions from 1995 to 2012. In the same period, the GDP of the Nordic countries has increased by 45 per cent.
In the EU27, GDP has increased by nearly 34 per cent. At the same time, greenhouse gas emissions in the EU have fallen by 13.5 per cent, but total energy consumption has increased by 3 per cent.
27
GDP, energy consumption and greenhouse gas emissions. EU27 total
INDIC401
Opdateret 05.08.2014 kmh
70
80
90
100
110
120
130
140
150
1995
1996
1997
1998
1999
2000
2001
2002
2003
2004
2005
2006
2007
2008
2009
2010
2011
2012
GDP Energy consumption GHG emissions

Nordic Sustainable Development Indicators 2014. www.norden.org/sdindicators 31
Since the Nordic Ecolabel was set up in 1989, there has been a steady increase in the number of licences issued.
The number of EU Ecolabel licences has also increased but much more gradually, and there have been greater fluctuations and even a decline recently.
4.2 Nordic Ecolabel and the EU Ecolabel
The indicator shows the number of Nordic Ecolabel licences issued in the Nordic countries and the number of EU Ecolabel licences issued to Nordic producers.
28
Number of ecolicences issued in the Nordic countries
INDIC402
500
1 000
1 500
2 000
2 500
1993
1994
1995
1996
1997
1998
1999
2000
2001
2002
2003
2004
2005
2006
2007
2008
2009
2010
2011
2012
The Nordic Ecolabel – the Swan The EU Ecolabel – the Flower

32 Nordic Sustainable Development Indicators 2014. www.norden.org/sdindicators
Environmental taxes have shown a downward trend since 2000 in Denmark, Iceland, Norway and the EU27. In Sweden and Finland, there has been a modest rise. Environmental taxes range from 5.6 per cent of the tax revenue in Norway and Sweden to 8.1 in Denmark.
In all the countries, taxes on energy comprise the largest proportion of environmental taxes followed by taxes on transport, while taxes on pollution and resources only account for a minimal proportion of total taxes. However, taxes on transport are still substantial in Denmark and Norway.
4.3 Proportion of environmental taxes in total tax revenues
The indicator shows the proportion of taxes with a primary environmental goal as a proportion of total tax revenues. Environmental taxes are divided into taxes on transport, energy taxes and taxes on pollution and resources.
29
Environmental taxes. Per cent of total tax revenues
INDIC403
Opdateret 20.06.2014 kmh
0.0
2.5
5.0
7.5
10.0
2000
2006
2012
2000
2006
2012
2000
2006
2012
2000
2006
2012
2000
2006
2012
2000
2006
2012
Denmark Finland Iceland Norway Sweden EU27
Taxes on pollution and resources Transport taxes Energy taxes

Nordic Sustainable Development Indicators 2014. www.norden.org/sdindicators 33
Since 1995, the amount of waste being treated has gone up in all countries.
Finland and Iceland still deposit a large propotion of their waste onto or into the land. This is a treatment method that has almost completely disap-peared in the three other Nordic countries. In all countries except Iceland, most waste is incinerated and often used for energy recovery.
Generally, material recycling has become a more important treatment type over the last 15 years.
4.4 Development in municipal waste management by treatment method
This indicator presents the quantities of municipal waste recovered through recycling and composting, as well as the amount disposed through landfilling and incineration.
30
Treatment of municipal waste
INDIC404
Opdateret 20.06.2014 kmh
0
20
40
60
80
100
1995
2012
1995
2011
1995
2012
1995
2012
1995
2012
1995
2012
1995
2012
DenmarkGreenland Finland Iceland Norway Sweden EU27
Deposit onto or into land Total incinerationMaterial recycling Composting and digestion
Per cent of total treatment

34 Nordic Sustainable Development Indicators 2014. www.norden.org/sdindicators
5.1 Educational attainment
The indicator defines the percentage of the population aged 15–74 having reached UNESCO’s International Standard Classification of Education (ISCED) level 3 and 4 (upper- and post-secondary education) and level 5 and 6 (tertiary education).
31
Educational attainment at upper- and post-secondary level. Per cent of total population aged 15–74
INDIC501
Opdateret 04.07.2014 kmh
15
20
25
30
35
40
45
50
55
1998
1999
2000
2001
2002
2003
2004
2005
2006
2007
2008
2009
2010
2011
2012
2013
IS
NO
AX
SE
EU27
DK
FI
GL
5. Education, research and innovation

Nordic Sustainable Development Indicators 2014. www.norden.org/sdindicators 35
Between 35 and 50 per cent of the Nordic population aged 15–74 have a secondary education and 24 to 30 per cent a tertiary education.
32
Educational attainment at tertiary level. Per cent of total population aged 15–74
INDIC501
Opdateret 04.07.2014 kmh
5
10
15
20
25
30
35
1998
1999
2000
2001
2002
2003
2004
2005
2006
2007
2008
2009
2010
2011
2012
2013
IS
NO AX
SEEU27
DKFI
GL
Finland and Norway have the highest proportion of people aged 15–74 with tertiary education, and Denmark has the lowest. When both secondary and tertiary levels are considered, Sweden has the highest propotion with 78 per cent, while, of the five Nordic countries, Iceland has the lowest with 64 per cent. Generally the educational attainment level is higher in the Nordic countries than in the EU countries as a whole.
The proportion of people having a tertiary education has been rising in all the Nordic countries – and in the EU – since the late 1990s.

36 Nordic Sustainable Development Indicators 2014. www.norden.org/sdindicators
All the Nordic countries except Norway spend more on R&D than the EU average of 2.0 per cent. Norway spends 1.7 per cent. However, if the Norwegian R&D expenses were calculated in euro per person, spending would be higher due to Norway’s extraordinarily high GDP.
While R&D expenses in EU27 have constituted an unchanged proportion of GDP since the mid-1990s, the R&D expenses of the Nordic countries – again with the exception of Norway – have typically increased.
5.2 Research and development expenditure. Percentage of GDP
The indicator is defined as gross domestic expenditure on research and experimental development (GERD) as a percentage of GDP. The expenses are shown by performing sector.
33
Total R&D expenditure by performing sector. Per cent of GDP
INDIC502
Opdateret 20.06.2014 kmh
0.00.51.01.52.02.53.03.54.0
199520121995201219952011199520121995201219952012
Denmark Finland Iceland Norway Sweden EU-27
Business and enterprise sector GovernmentHigher education Private non-profit sector

www.norden.org/sdindicators

Ved Stranden 18DK-1061 Copenhagen K
www.norden.org
This brochure briefly describes the Nordic Sustainable Development Indicators, which show long-term trends in the following focus areas: the Nordic welfare model; viable ecosystems; changing climate; sustainable use of the earth’s resources; and education, research and innovation.
A complete set of key indicators, including separate national graphics, can be found on the website www.norden.org/sdindicators. The website also offers free access to the Nordic Statistics database, which allows you to download data and create graphics for your own analysis.
www.norden.org/sdindicators
ANP 2014:755ISBN 978-92-893-3810-3 (PRINT)ISBN 978-92-893-3811-0 (PDF)