a study of variation in soil gas concentration associated ... associated with earthquakes near ......
TRANSCRIPT

Geoenvironmental DisastersSingh et al. Geoenvironmental Disasters (2016) 3:22 DOI 10.1186/s40677-016-0055-8
RESEARCH Open Access
A study of variation in soil gasconcentration associated with earthquakesnear Indo-Burma Subduction zone
Sanjay Singh1, Hari Prasad Jaishi1, Raghavendra Prasad Tiwari2 and Ramesh Chandra Tiwari1*Abstract
Background: In the recent past, several efforts have been made by a number of researchers to measure anomalousemanations of geo-gases in seismic prone regions of the world and radon has been the most preferred geo-gas aspossible earthquake precursor since it is easily detectable.
Results: In the present investigation, continuous measurements of radon concentration at 80 cm inside the soil hasbeen carried out at Chite Fault (23.73°N, 92.73°E), Aizawl, Mizoram situated in the seismic zone V in North Eastern partof India near Indo-Burma subduction zone, using LR-115 Type-II nuclear track detectors manufactured by Kodak Pathe,France. During the investigation period, the radon concentration varied from 163.27 Bq/m3 to 2557.82 Bq/m3 with anaverage and standard deviation of 1116.15 Bq/m3 and 591.76 Bq/m3 respectively.
Conclusion: Certain anomalies observed in radon concentration have been correlated to the earthquakes withinthe range of magnitudes 4.7 ≤M ≤ 5.5, while some other anomalies are due to the influence of meteorologicalparameters.
Keywords: Soil-gas, Radon, LR-115 films, Correlations, Meteorological parameters, Earthquake
BackgroundMigration of carrier gas by bubbles is considered to bean important transport mechanism governing distribu-tion of carrier (CO2 and CH4) and trace (Rn, He) gasesover wide areas on the earth surface. Soil-gas anomaliesand chemical changes in groundwater, observed duringseismic events may be attributed to gas carrier dynamics(Etiope and Martinelli, 2002). During the last several de-cades, analysis of earthquake precursory phenomena re-veals that significant changes in geophysical andgeochemical process may occur prior to intermediate andlarge earthquake. The behavior of the gas concentrationanomalies has been quite variable. Several investigatorshave reported increase in gas concentrations before theoccurrence of seismic events (Cai et al., 1984; Nersesov,1984; Kawabe, 1985). Besides these, declines in radon con-centration or concentration ratio immediately and prior toseismic events have also been reported (King et al., 1981;
* Correspondence: [email protected] of Physics, Mizoram University, Aizawl 796004, IndiaFull list of author information is available at the end of the article
© The Author(s). 2016 Open Access This articleInternational License (http://creativecommons.oreproduction in any medium, provided you givthe Creative Commons license, and indicate if
Barsukov et al., 1985; Sugisaki and Sugiura, 1986). In somecases, anomalies have also occurred contemporaneouslywith or after the events (Birchard and Libby, 1980; King,1985; Thomas et al., 1986). Soil-gas concentrations arenot sensitive to hydrologic changes as they are extremelysusceptible to a number of other environmental effects.However, many authors in the past suggest that spatialand temporal variations in soil-gas concentrations aremost intensively influenced by meteorological interfer-ences (Kraner et al., 1964; Klusman, 1981; Fleischer, 1983;Robinson and Whitehead, 1986; Guedalia et al., 1970).
Radon emanation and earthquakeRadon concentration in the soil-gas increases with depth(Jonsson, 1995; Kristiansson and Malmqvist, 1984) untila certain depth is reached which depend on the soil’sproperties and moisture content. Radon act as an indica-tor for changes in the gas streams. The most sensitivedepth to detect such changes is between 0.5 to 1 m(Friedmann, 2012). Since 1971 much effort has been de-voted to explain earthquake on the basis of Dilatancyand fluid flow (Scholz et al., 1973). Dilatancy means an
is distributed under the terms of the Creative Commons Attribution 4.0rg/licenses/by/4.0/), which permits unrestricted use, distribution, ande appropriate credit to the original author(s) and the source, provide a link tochanges were made.
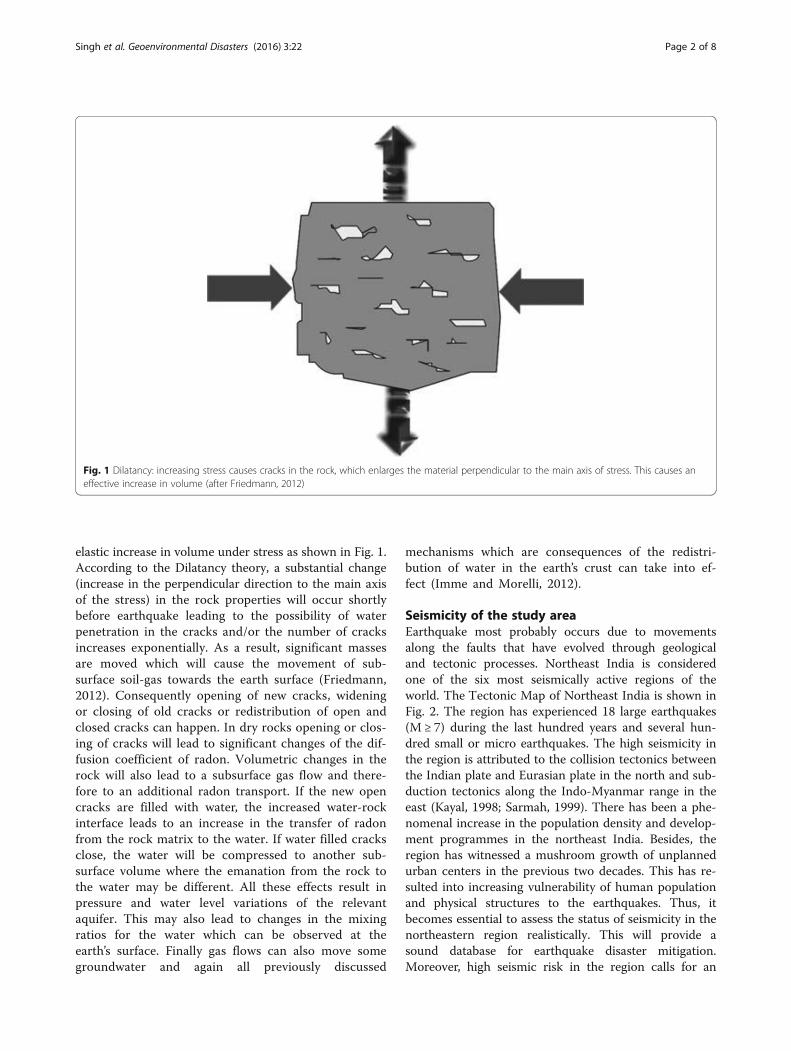
Fig. 1 Dilatancy: increasing stress causes cracks in the rock, which enlarges the material perpendicular to the main axis of stress. This causes aneffective increase in volume (after Friedmann, 2012)
Singh et al. Geoenvironmental Disasters (2016) 3:22 Page 2 of 8
elastic increase in volume under stress as shown in Fig. 1.According to the Dilatancy theory, a substantial change(increase in the perpendicular direction to the main axisof the stress) in the rock properties will occur shortlybefore earthquake leading to the possibility of waterpenetration in the cracks and/or the number of cracksincreases exponentially. As a result, significant massesare moved which will cause the movement of sub-surface soil-gas towards the earth surface (Friedmann,2012). Consequently opening of new cracks, wideningor closing of old cracks or redistribution of open andclosed cracks can happen. In dry rocks opening or clos-ing of cracks will lead to significant changes of the dif-fusion coefficient of radon. Volumetric changes in therock will also lead to a subsurface gas flow and there-fore to an additional radon transport. If the new opencracks are filled with water, the increased water-rockinterface leads to an increase in the transfer of radonfrom the rock matrix to the water. If water filled cracksclose, the water will be compressed to another sub-surface volume where the emanation from the rock tothe water may be different. All these effects result inpressure and water level variations of the relevantaquifer. This may also lead to changes in the mixingratios for the water which can be observed at theearth’s surface. Finally gas flows can also move somegroundwater and again all previously discussed
mechanisms which are consequences of the redistri-bution of water in the earth’s crust can take into ef-fect (Imme and Morelli, 2012).
Seismicity of the study areaEarthquake most probably occurs due to movementsalong the faults that have evolved through geologicaland tectonic processes. Northeast India is consideredone of the six most seismically active regions of theworld. The Tectonic Map of Northeast India is shown inFig. 2. The region has experienced 18 large earthquakes(M ≥ 7) during the last hundred years and several hun-dred small or micro earthquakes. The high seismicity inthe region is attributed to the collision tectonics betweenthe Indian plate and Eurasian plate in the north and sub-duction tectonics along the Indo-Myanmar range in theeast (Kayal, 1998; Sarmah, 1999). There has been a phe-nomenal increase in the population density and develop-ment programmes in the northeast India. Besides, theregion has witnessed a mushroom growth of unplannedurban centers in the previous two decades. This has re-sulted into increasing vulnerability of human populationand physical structures to the earthquakes. Thus, itbecomes essential to assess the status of seismicity in thenortheastern region realistically. This will provide asound database for earthquake disaster mitigation.Moreover, high seismic risk in the region calls for an

Fig. 2 Seismo-tectonic map of North East India showing epi-centres of damaging earthquakes (after Jaishi et al., 2014c). Tectonic zones (zones A,B, C, D and E) and major thrusts (MBT-Main Boundary Thrust; MCT-Main Central Thrust; NT-Naga Thrust; DT-Disang Thrust) are also shown. Thickblue line represents the International boundary of North Eastern part of India bordering Myanmar and Bangladesh (not to scale) and red linesrepresents faults and thrusts
Singh et al. Geoenvironmental Disasters (2016) 3:22 Page 3 of 8
urgent and sustained mitigation effort. Accordingly,there seems to be a real need for employing all availableefforts including radon variations and seismicity recordsthat may assist in reducing seismic risk in the area.Radon variations might seem to be a good precursor ofcrustal motion resulting in earthquakes. This fact encour-ages researchers to find a way of using this phenomenonfor earthquakes prediction. However earthquakes are notalways preceded by a radon anomaly and not every radonincrease is followed by an earthquake. But the radon tech-nique has been successfully used in several seismic areasof the world for the purpose of earthquake precursory re-search. Based on the status of seismicity in the northeast-ern India, it seems very necessary to apply whateveravailable techniques which may help to understand thebehavior of soil-gas radon concentration and correlatewith nearby seismic events. Keeping the above in view,present authors began studies of radon variation as a pos-sible seismic precursor in 2011 at Mat Fault in Mizoramfor the first time and the results of this work have been re-ported (Jaishi et al., 2013; 2014a; 2014b;). Encouraged withthe outcome and for future research, authors extended
radon measurement at weekly interval at Chite Fault(Singh et al., 2014). The location of the study area isshown in Fig. 3. The main objective of this study is con-tinuous monitoring of soil radon and their possible correl-ation with seismic events. The present paper reportscontinuous soil radon measurements carried out at ChiteFault from August 2013 to January 2014.
Experimental techniques and methodsSolid State Nuclear Track Detector (SSNTD) is one of themost widely used devices for the last few decades formeasuring radon concentration in earthquake precursorystudies. In the present investigation, weekly measurementswere carried out using LR-115 Type-II SSNTD films man-ufactured by M/S Kodak Pathe, France. The detectors(LR-115 Films) were cut into a size of 3 cm × 3 cm andloaded in a twin cup radon/thoron discriminating dosime-ters, designed and fabricated by Mayya and group (Mayyaet al., 1998) at BARC, Mumbai (India). The experimentaldetail is discussed in Singh et al. (2014). The meteoro-logical parameters for the study area were obtained fromthe IMD-Regional Meteorological Centre, Guwahati,
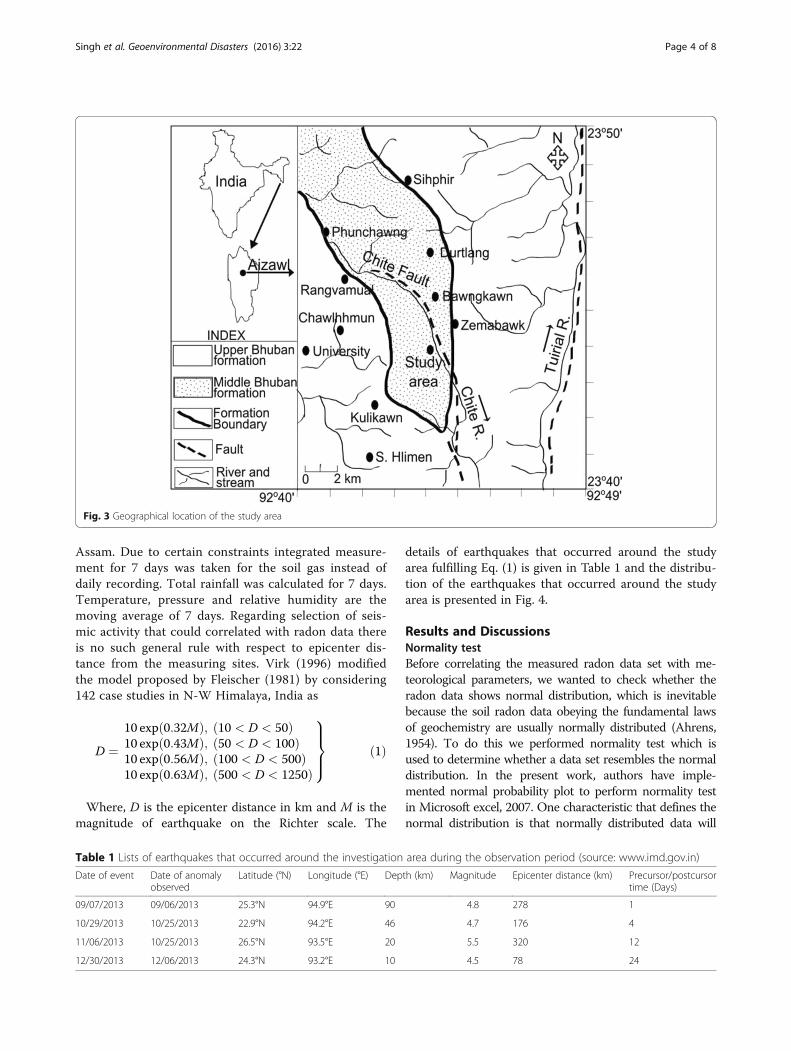
Fig. 3 Geographical location of the study area
Singh et al. Geoenvironmental Disasters (2016) 3:22 Page 4 of 8
Assam. Due to certain constraints integrated measure-ment for 7 days was taken for the soil gas instead ofdaily recording. Total rainfall was calculated for 7 days.Temperature, pressure and relative humidity are themoving average of 7 days. Regarding selection of seis-mic activity that could correlated with radon data thereis no such general rule with respect to epicenter dis-tance from the measuring sites. Virk (1996) modifiedthe model proposed by Fleischer (1981) by considering142 case studies in N-W Himalaya, India as
D ¼10 exp 0:32Mð Þ; 10 < D < 50ð Þ10 exp 0:43Mð Þ; 50 < D < 100ð Þ10 exp 0:56Mð Þ; 100 < D < 500ð Þ10 exp 0:63Mð Þ; 500 < D < 1250ð Þ
9>>=
>>;
ð1Þ
Where, D is the epicenter distance in km and M is themagnitude of earthquake on the Richter scale. The
Table 1 Lists of earthquakes that occurred around the investigation
Date of event Date of anomalyobserved
Latitude (°N) Longitude (°E) Dep
09/07/2013 09/06/2013 25.3°N 94.9°E 90
10/29/2013 10/25/2013 22.9°N 94.2°E 46
11/06/2013 10/25/2013 26.5°N 93.5°E 20
12/30/2013 12/06/2013 24.3°N 93.2°E 10
details of earthquakes that occurred around the studyarea fulfilling Eq. (1) is given in Table 1 and the distribu-tion of the earthquakes that occurred around the studyarea is presented in Fig. 4.
Results and DiscussionsNormality testBefore correlating the measured radon data set with me-teorological parameters, we wanted to check whether theradon data shows normal distribution, which is inevitablebecause the soil radon data obeying the fundamental lawsof geochemistry are usually normally distributed (Ahrens,1954). To do this we performed normality test which isused to determine whether a data set resembles the normaldistribution. In the present work, authors have imple-mented normal probability plot to perform normality testin Microsoft excel, 2007. One characteristic that defines thenormal distribution is that normally distributed data will
area during the observation period (source: www.imd.gov.in)
th (km) Magnitude Epicenter distance (km) Precursor/postcursortime (Days)
4.8 278 1
4.7 176 4
5.5 320 12
4.5 78 24

Fig. 4 Spatial distribution of earthquakes (open star) around the study area during the investigation period
Singh et al. Geoenvironmental Disasters (2016) 3:22 Page 5 of 8
have the same amount of area of normal curve betweeneach point. The area under the normal curve between eachpoint can be determined by cumulative distribution func-tion (CDF) using the following Excel formula.
CDF ¼ NORMDIST Radon value; mean; standard deviation; TRUEð Þ
Now the CDF value of each Radon value is used forcalculating the expected radon values and Z- score ateach radon value by the following formulae.
Fig. 5 Normal probability plot comparing actual radon value with expecte
NORMSINV (CDF at each radon value) for Z-score,and NORMINV (CDF at each radon value, mean, stand-ard deviation) for expected values.A plot of expected radon values versus Z-score will be a
straight line. We now observed the actual radon datacompared to the expected radon data for normally distrib-uted data having the same mean and standard deviationand observed that the actual radon data maps closely tothe expected radon values (Fig. 5). So it may be concludedthat the data is derived from a normally distributed
d radon value

Singh et al. Geoenvironmental Disasters (2016) 3:22 Page 6 of 8
population. Also, the skew factor of the radon data wascalculated and it was found to be 0.49 indicating that theradon value is slightly skewed towards the right. In orderto check the significance of skew factor we have used theExcel formula viz. if skew > 2*sqrt(6/count) then the skewfactor is significant (i.e. the distribution is not normal) andif skew < 2*sqrt(6/count) then it is non-significant (i.e. thedistribution is normal). In our case the skew factor wasfound to be non- significant (i.e., 0.49 < 0.94).
Effects of meteorological parameters on radonconcentrationAnalysis of radon concentration in soil gas along withmeteorological parameters viz. temperature, rainfall,relative humidity and pressure provide useful informa-tion about the dependence of these parameters on radonemanation. The average concentration of radon in soilgas at Chite fault for this time window is reported to be1116.15 Bq/m3 with a standard deviation of 591.76 Bq/m3.The percentage variation co-efficient (σ/Avg.) of radon is53.02% (Table 2). From Table 2 it is clear that the mea-sured radon shows a very low positive correlation withtemperature and rainfall i.e. the value of radon concentra-tion increases with increase in these parameters and viceversa. The reason may be due to the capping effect of wetsoil layers at the surface which prevents radon from escap-ing in to the atmosphere (Virk et al., 2000). As a result theradon values initially falls and then start rising over aperiod of time. A moderate positive correlation coefficientof 0.31 was found between radon and relative humidity.The percentage variation coefficient was found to be6.96%. This demonstrates that the variation in radon emis-sion was much more influenced by relative humidity ra-ther than temperature and rainfall. Therefore, increase insoil moisture may increase the fraction of radon producedin rocks to migrate into pore fluids, thus increasing theradon content of soil gas (Tanner, 1964; Fleischer, 1983).A very low negative correlation coefficient (−0.005) wasfound between radon and pressure suggesting that pres-sure have a non-significant influence on the measuredradon concentration during the investigation period.
Correlation of radon concentration with seismic eventsVarious statistical methods have been used by differentauthors in the past (Guerra and Lombardi, 2001; Fu
Table 2 Descriptive statistics of radon and the meteorological param
Parameter Average (Avg.) Standard deviation (σ)
Radon (Bq/m3) 1116.15 591.76
Temperature (°C) 22.24 3.83
Rainfall(mm) 40.03 51.92
Humidity (%) 81.80 5.63
Pressure (mbar) 960.81 5.59
et al., 2005; Yang et al., 2005; Walia et al., 2005) for iden-tifying possible threshold values of the anomalous radonconcentrations. A very common approach could be toexamine the difference between radon peak and themean value of the radon concentration for a few monthsor a year. In our case, the average value of radon con-centration (X) is taken as the background level and thevalue crossing X ± 2σ (mean ± 2 standard deviation) isconsidered as anomalous. In cases when the radon max-imum increases or decreases by ±1σ from its mean, apossible influence of the meteorological parameters iscarefully examined and accordingly a radon anomaly isassumed. The variation of radon concentration togetherwith the meteorological parameters for the given timeperiod is presented in Fig. 6.According to the characteristics trends of radon con-
centration as illustrated in Fig. 6, there are three positivepeaks and three negative peaks recorded during thegiven time period. The first radon peak (negative anom-aly) was observed on 9/6/2013 followed by an event of4.8 M which occurred on 9/7/2013. Since the observedpeak do not crosses the X-2σ limit, therefore it seemsnecessary to investigate the behavior of meteorologicalparameters carefully. During this period the relative hu-midity and rainnfall, which shows positive correlationwith radon was quite low. Therefore, this decline inradon concentration is attributed and/or have caused byvariation in meteorological parameters and not by seis-mic events. The second radon peak (negative) was re-corded on 4/10/2013. During this time period a fairamount of rainfall was received and the temperature andhumidity which shows positive correlation with radonwere quite high indicating that this decline in radonconcentration is caused by some other geophysicalprocess which was not mature enough to produce anearthquake (Walia et al., 2009). Three consecutive posi-tive radon peaks were recorded on 10/11/2013 and 10/25/2013 crossing the X + 2σ limit while the third peakon 11/8/2013 just exceeding X + 1σ level followed bytwo seismic events of 4.7 M and 5.5 M recorded on 10/29/2013 and 11/6/2013 with an epicenter distances of176 km and 320 km from the measuring site. Thesepositive anomalies may be due to the combining effectsof these two earthquakes. The positive radon anomaliescan be explained by the Dilatancy-diffusion model
eters
% Variation coefficient (σ/Avg.) Correlation coefficient
53.02 -
17.2 0.16
129.7 0.16
6.88 0.31
0.58 −0.01

Fig. 6 Plot showing the variation of a Radon concentration Rn, b Temperature T, c Relative humidity RH, d Rainfall RF, e Pressure P during theobservation period. The vertical lines represent earthquakes along with their magnitude. The solid horizontal line represents the average value ofradon concentration (X) and the dotted lines represent the deviation (σ) from the average value
Singh et al. Geoenvironmental Disasters (2016) 3:22 Page 7 of 8
(Mjachkin et al., 1975) where the increase in radon con-tent prior to earthquakes is connected with the amountof cracking of rocks and therefore is sharply increasedand then flattens out due to relaxation of stress. Anothersharp fall in radon concentration was observed on 11/22/2013 but no seismic events occurred during thisperiod. Besides, it is quite difficult to explain such alarge radon decrease by environmental parameters. Thisabrupt decrease in radon concentration may be eitherdue to additional compression closing cracks and pores(Singh et al., 1991; Ramola et al., 2008) or from expan-sion causing under saturation of the pore volume(Whitcomb, 1983).
ConclusionIn the present study, the radon data generated duringthe mentioned time period have been analyzed with seis-mic events and meteorological parameters. Some consid-erable positive radon anomalies have been observedcrossing the limits of X + 2σ before and after the
earthquake of 4.7 and 5.5 magnitude. Such variation inradon concentration could be due to crustal deformationalong Indo-Myanmar subduction zone during these twoseismic events. Besides these, few abnormal declines inradon data having negative correlation with seismicitywere also recorded. It can be concluded that thesechanges may be either because of meteorological param-eters influencing radon concentration or due to thecomplexity of its transport mechanism from deeper soil.However, for better correlation and to pinpoint theseismic event with anomaly, longer periods of data col-lection along with measurements of other carrier andtrace gases (like thoron).
AcknowledgementsThis work was funded by the Ministry of Earth Sciences (MoES), Govt. ofIndia, New Delhi; in the form of Major project vide Sanction Order No. MoES/P.O.(Seismo)/1(167)/2013 Dated 10.12.2013.
Author’s contributionsSS collected the data and drafted the manuscript. HPJ helped to collect thedata and performed the statistical analysis. RPT helped to draft the manuscript

Singh et al. Geoenvironmental Disasters (2016) 3:22 Page 8 of 8
and site selection. RCT helped in the experimental design, participated in theextensive revision and overall supervision. All authors read and approved thefinal manuscript.
Competing interestsThe authors declare that they have no competing interests.
Author details1Department of Physics, Mizoram University, Aizawl 796004, India.2Department of Geology, Mizoram University, Aizawl 796004, India.
Received: 25 May 2016 Accepted: 11 November 2016
ReferencesAhrens, L.H. 1954. The lognormal distribution of the elements (a fundamental law
of geochemistry and its subsidiary). Geochimica et Cosmochimica Acta 5: 49–73.Barsukov, V.L., G.M. Varshal, and N.S. Zamokina. 1985. Recent results of
hydrogeochemical studies for earthquake prediction in the USSR.Pure and Applied Geophysics 122: 143–156.
Birchard, G.F., and W.F. Libby. 1980. Soil radon concentration changes precedingand following four magnitude 4.2–4.7 earthquakes on the San Jacinto Faultin southern California. Journal of Geophysical Research 85: 3100–3106.
Cai Z, Shi H, Zhang W, Luo GEX, Shi X, Yang H. 1984. Some applications of fluid-geochemical methods to earthquake prediction in China: Internationalsymposium on continental seismology and earthquake prediction, 384–395.Beijing (China): Seismological Press.
Etiope, G., and G. Martinelli. 2002. Migration of carrier and trace gases in thegeosphere: an overview. Physics of the Earth and Planetary Interiors 129(3):185–204.
Fleischer, R.L. 1981. Dislocation Model for radon response to distant earthquakes.Geophysical Research Letters 8(5): 477–480.
Fleischer, R.L. 1983. Theory of alpha recoil effects on radon release and isotopicdisequilibrium. Geochimica et Cosmochimica Acta 47(4): 779–784.
Friedmann, H. 2012. Radon in earthquake prediction research. RadiationProtection Dosimetry 149: 177–184.
Fu, C.C., T.F. Yang, V. Walia, and C.H. Cheng. 2005. Reconnaissance of soil gascomposition over the buried fault and fracture zone in southern Taiwan.Geochemical Journal 39(5): 427–439.
Guedalia, D., J.L. Laurent, J. Fontan, D. Blanc, and A. Druilhet. 1970. A study ofradon 220 emanation from soils. Journal of Geophysical Research 75(2): 357–369.
Guerra, M., and S. Lombardi. 2001. Soil-gas method for tracing neotectonic faultsin clay basin: the Pisticci field (southern Italy). Tectonophysics 339(3): 511–522.
Imme G, Morelli D. 2012. Radon as earthquake precursor. In: Earthquake Researchand Analysis-Statistical Studies, Observation and Planning (Dr. Amico S.D., Ed.),ISBN: 978-953-51-0134-5, In Tech, Available from: http://www.intechopen.com/books/earthquake-research-and-analysis-statistical-studies-observations-and-planning/radon-as-earthquake-precursor.
Jaishi, H.P., S. Singh, R.P. Tiwari, and R.C. Tiwari. 2013. Radon and thoronanomalies along Mat fault in Mizoram, India. Journal of Earth System Science122(6): 1507–1513.
Jaishi HP, Singh S, Tiwari RP, and Tiwari RC (2014a) Correlation of radonanomalies with seismic events along Mat fault in Serchhip District, Mizoram,India. Applied Radiation and Isotopes 86:79–84.
Jaishi HP, Singh S, Tiwari RP, and Tiwari RC (2014b) Temporal variation of soilradon and thoron concentrations in Mizoram (India), associated withearthquakes. Natural Hazards 72(2):443–454.
Jaishi HP, Singh S, Tiwari RP, and Tiwari RC (2014c) Analysis of soil radon data inearthquake precursory studies. Annals of Geophysics 57(5): S0544; doi:10.4401/ag-6513.
Jonsson, G. 1995. Radon gas- where from and what to do? RadiaiationMeasurements 25: 1–4.
Kawabe, I. 1985. Anomalous changes of CH4/Ar ratio in subsurface gas bubblesas seismogeochemical precursors at Matsuyama, Japan. Pure and AppliedGeophysics 122(2–4): 196–214.
Kayal, J.R. 1998. Seismicity of Northeast India and surroundings: Developmentover the past 100 years. Journal of Geophysics 19(1): 9–34.
King, C.Y. 1985. Impulsive radon emanation on a creeping segment of the SanAndreas Fault, California. Pure and Applied Geophysics 122(2–4): 340–352.
King, C.Y., W.C. Evans, T. Presser, and R.H. Husk. 1981. Anomalous chemicalchanges in well water and possible relation to earthquakes. GeophysicalResearch Letters 8(5): 425–428.
Klusman, R.W. 1981. Variations in mercury and radon emission at an aseismic site.Geophysical Research Letters 8(5): 461–464.
Kraner, H.W., G.L. Schroeder, and R.D. Evans. 1964. Measurement of the effects ofatmospheric variables on radon-222 flux and soil-gas concentrations.Symposium Proceedings Natural Radiation Environment, Houston, Texas, 10–13April 1963, 191–214. Chicago: University of Chicago Press.
Kristiansson K, Malmqvist L. 1984. The depth dependence of the concentration ofsup Rn-222 in soil gas near the surface and its implication for exploration.Geoexploration 22:17–41.
Mayya, Y.S., K.P. Eappen, and K.S.V. Nambi. 1998. Methodology for mixed fieldinhalation dosimetry in monazite areas using a twin-cup dosimeter withthree track detectors. Radiation Protection Dosimetry 77(3): 177–184.
Mjachkin, V.I., W.F. Brace, G.A. Sobolev, and J.H. Dieterich. 1975. Two models forearthquake forerunners. Pure and Applied Geophysics 113: 169–181.
Nersesov IL. 1984. Development of earthquake prediction in the USSR.International symposium on continental seismicity and earthquakeprediction, 373–383. Beijing (China): Seismological Press.
Ramola, R.C., Y. Prasad, G. Prasad, S. Kumar, and V.M. Choubey. 2008. Soil-gasradon as seismotectonic indicator in Garhwal Himalaya. Applied Radiationand Isotopes 66(10): 1523–1530.
Robinson, R., and N.E. Whitehead. 1986. Radon variations in the Wellingtonregion, New Zealand, and their relation to earthquakes. Earthquake PredictionResearch 4: 69–82.
Sarmah, S.K. 1999. The probability of occurrence of a high magnitude earthquakein Northeast India. Journal of Geophysics 20(3): 129–135.
Scholz, C.H., L.R. Sykes, and Y.P. Aggarwal. 1973. Earthquake prediction: a physicalbasis. Science 181: 803–810.
Singh M, Ramola RC, Singh B, Singh S, Virk HS (1991) Subsurface soil gas radonchanges associated with earthquakes. International Journal of RadiationApplications and Instrumentation. Part D. Nuclear Tracks and RadiationMeasurements 19(1):417–420.
Singh, S., H.P. Jaishi, R.P. Tiwari, and R.C. Tiwari. 2014. Variations of soil radonconcentrations along Chite Fault in Aizawl district, Mizoram, India. RadiationProtection Dosimetry. doi:10.1093/rpd/ncu221.
Sugisaki, R., and T. Sugiura. 1986. Gas anomalies at three mineral springs and afumaroles before an inland earthquake, Central Japan. Journal of GeophysicalResearch 91(B12): 12296–12304.
Tanner, A.B. 1964. Radon migration in the ground: A review, SymposiumProceedings Natural Radiation Environment, 161–190. Chicago: University ofChicago Press.
Thomas, D.M., K.E. Cuff, and M.E. Cox. 1986. The association between ground gasradon variations and geologic activity in Hawaii. Journal of GeophysicalResearch 91(B12): 12186–12199.
Virk, H.S. 1996. A critique of empirical scaling relationship between earthquakemagnitude, epicentral distance and precursor time for interpretation ofradon data. Journal of Earthquake Prediction Research 5: 574–583.
Virk, H.S., V. Walia, A.K. Sharma, N. Kumar, and R. Kumar. 2000. Correlation ofradon with microsiesmic events in Kangra and Chamba Valleys of N-WHimalaya. Geofisica Internacional 39(3): 222–227.
Walia, V., H.S. Virk, T.F. Yang, S. Mahajan, M. Walia, and B.S. Bajwa. 2005.Earthquake prediction studies using radon as a precursor in NW Himalayas,India: a case study. Terristrial Atmospheric and Oceanic Sciences 16(4): 775–804.
Walia, V., S.J. Lin, W.L. Hong, C.C. Fu, T.F. Yang, W.L. Wen, and C.H. Chen. 2009.Continuous temporal soil-gas composition variations for earthquakeprecursory studies along Hsincheng and Hsinhua faults in Taiwan.Radiation Measurements 44(9): 934–939.
Whitcomb JH. 1983. Modeling of tectonophysical distortion from measurementsof long base-line geodetic data and other geophysical paramaters. NASAGrant No. NAG5-22 Semi-annual report, Colorado University. March-August1980, 20p.
Yang, T.F., V. Walia, L.L. Chyi, C.C. Fu, C.H. Chen, T.K. Liu, S.R. Song, C.Y. Lee, and M.Lee. 2005. Variations of soil radon and thoron concentrations in a fault zoneand prospective earthquakes in SW Taiwan. Radiation Measurements 40(2):496–502.