nonlinear computational analysis of postural stability...
TRANSCRIPT
i
NONLINEAR COMPUTATIONAL ANALYSIS OF POSTURAL
STABILITY AND ITS RELATIONSHIP TO ESTROGEN
DEFICIENCY IN POSTMENOPAUSAL WOMEN
by
Zachary Mitchell
A thesis submitted to the faculty of The University of Mississippi in partial fulfillment of
the requirements of the Sally McDonnell Barksdale Honors College.
Oxford
May 2018
Approved by
__________________________
Advisor: Dr. Dwight Waddell
__________________________
Reader: Dr. Matthew Morrison
__________________________
Reader: Dr. Elliott Hutchcraft

ii
© 2018
Zachary Lloyd Mitchell
ALL RIGHTS RESERVED
iii
ABSTRACT
This study aims to determine if multi-scale entropy analysis will more
accurately differentiate the postural stability of postmenopausal women as a
function of their estrogen status than traditional measures of postural assessment.
The study participants included 7 non-Hormone Replacement Therapy (HRT)
postmenopausal women (mean age = 57) and 4 HRT postmenopausal women (mean
age = 55). Postural stability was measured with the NeuroCom Equitest and the use
of conditions 1-4 of the Sensory Organization Test (SOT). The subjects received an
equilibrium score for each condition with a score near 100 representing good
postural stability. A modification of the “Multi-Scale Entropy Analysis” Matlab
program created by Costa et al. was used to analyze the raw center of pressure
(COP) trajectory data measured for each condition in both the medial lateral (x-
direction) and anterior posterior (y-direction) directions. The Matlab program
created complexity index (CI) scores where a high CI is indicative of low postural
stability and a low CI is representative of good postural stability.
A basic t-test of unequal variances was performed on the CI scores between
non-HRT and HRT subjects, in addition to the equilibrium scores between non-HRT
and HRT subjects. The t-test revealed both the NeuroCom Equitest and MSE analysis
identified a significant difference in postural stability between non-HRT subjects
and HRT subjects an equal number of times (n=2), where HRT subjects exhibited
better postural stability than non-HRT. The MSE analysis method was able to
significantly differentiate postural stability between non-HRT and HRT subjects in
SOT 1 (p=0.0432), whereas the NeuroCom Equitest did not. This is of significance
iv
because the subject is standing still on the force plate without having their balance
disrupted. Previous studies have had to manipulate the surroundings and perturb
the subject’s balance to significantly differentiate postural stability between non-
HRT and HRT subjects. The findings from this study indicate that MSE analysis may
provide a higher level of sensitivity necessary to assess postural stability as a
function of estrogen status. The effect of estrogen on the preservation of postural
stability in postmenopausal women may provide further evidence for the
consideration of estrogen as a neuro-protectant.
v
TABLE OF CONTENTS
LIST OF FIGURES…………………………………………….….………vi
LIST OF TABLES………………………………………………….….....vii
INTRODUCTION……………………………………………….…………1
CHAPTER I: TESTING STABILITY………………………………….….5
CHAPTER II: SUBJECTS AND METHODS……………………….…...14
CHAPTER III: RESULTS…………………………………………..….…19
CHAPTER IV: CONCLUSION……………………………………….….21
LIST OF REFERENCES…………………………………………..……..24
vi
LIST OF FIGURES
Figure 1 The Six Conditions of the Sensory Organization Test…….……6
Figure 2 Sensory Organization Test Example Results…………….……..7
Figure 3 The Six Condition of the Motor Control Test…………………..8
Figure 4 Motor Control Test Sample Results…………………………...10
Figure 5 The Relationship Between Age, Variability, and Complexity...11
Figure 6 NeuroCom Balance Equitest…………………………………..15
Figure 7 Center of Pressure Trace………………………………………17
Figure 8 Sample Entropy Scores for Two Different Subjects…………..18

vii
LIST OF TABLES
Table 1 Clinical Score Analysis……………………………………………20
Table 2 Multiscale Entropy Analysis………………………………………20
1
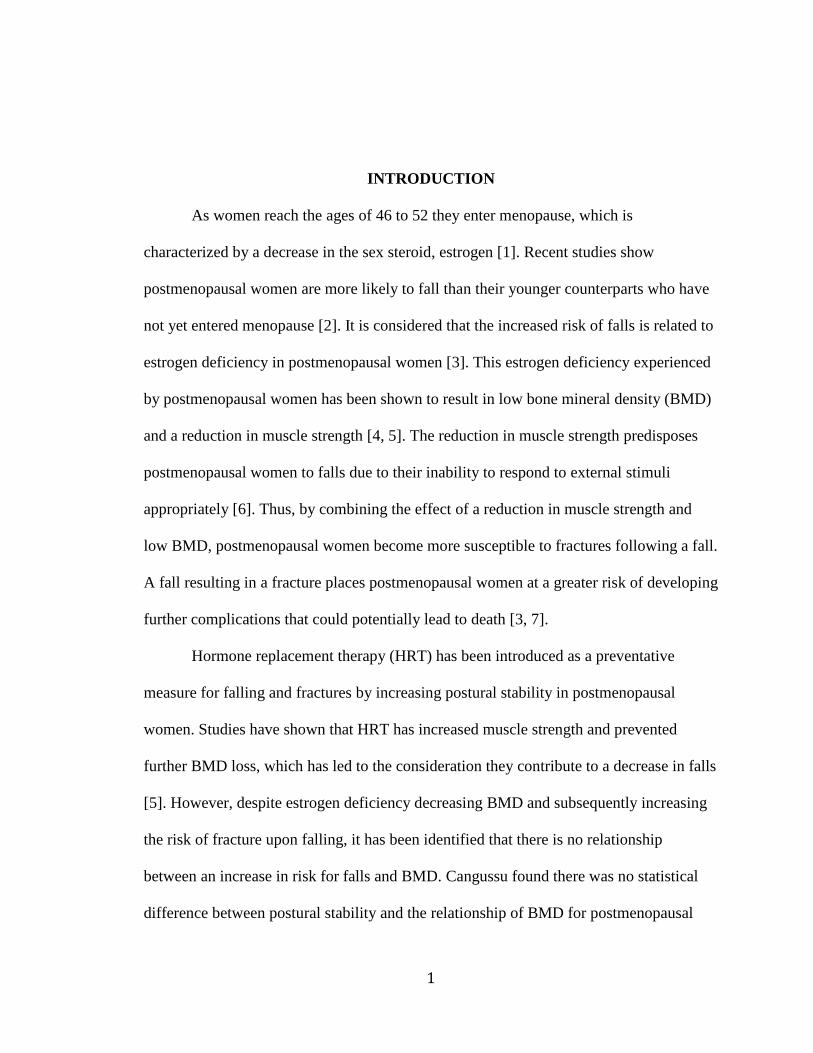
INTRODUCTION
As women reach the ages of 46 to 52 they enter menopause, which is
characterized by a decrease in the sex steroid, estrogen [1]. Recent studies show
postmenopausal women are more likely to fall than their younger counterparts who have
not yet entered menopause [2]. It is considered that the increased risk of falls is related to
estrogen deficiency in postmenopausal women [3]. This estrogen deficiency experienced
by postmenopausal women has been shown to result in low bone mineral density (BMD)
and a reduction in muscle strength [4, 5]. The reduction in muscle strength predisposes
postmenopausal women to falls due to their inability to respond to external stimuli
appropriately [6]. Thus, by combining the effect of a reduction in muscle strength and
low BMD, postmenopausal women become more susceptible to fractures following a fall.
A fall resulting in a fracture places postmenopausal women at a greater risk of developing
further complications that could potentially lead to death [3, 7].
Hormone replacement therapy (HRT) has been introduced as a preventative
measure for falling and fractures by increasing postural stability in postmenopausal
women. Studies have shown that HRT has increased muscle strength and prevented
further BMD loss, which has led to the consideration they contribute to a decrease in falls
[5]. However, despite estrogen deficiency decreasing BMD and subsequently increasing
the risk of fracture upon falling, it has been identified that there is no relationship
between an increase in risk for falls and BMD. Cangussu found there was no statistical
difference between postural stability and the relationship of BMD for postmenopausal
2
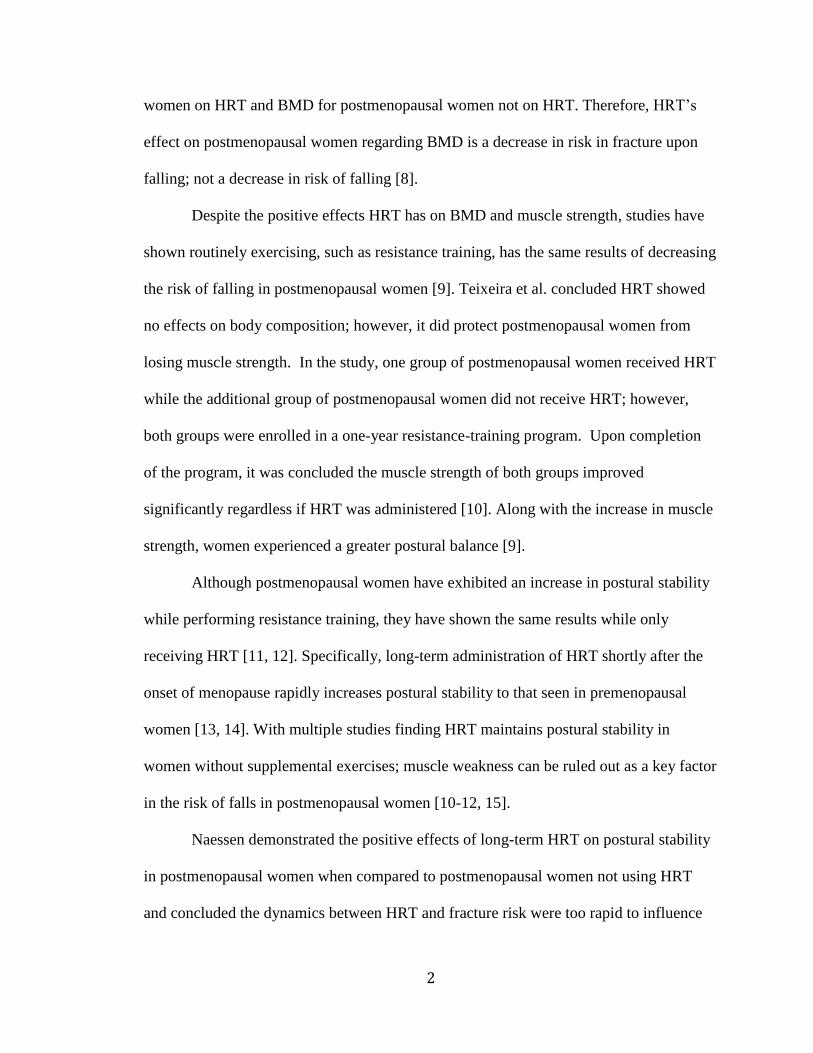
women on HRT and BMD for postmenopausal women not on HRT. Therefore, HRT’s
effect on postmenopausal women regarding BMD is a decrease in risk in fracture upon
falling; not a decrease in risk of falling [8].
Despite the positive effects HRT has on BMD and muscle strength, studies have
shown routinely exercising, such as resistance training, has the same results of decreasing
the risk of falling in postmenopausal women [9]. Teixeira et al. concluded HRT showed
no effects on body composition; however, it did protect postmenopausal women from
losing muscle strength. In the study, one group of postmenopausal women received HRT
while the additional group of postmenopausal women did not receive HRT; however,
both groups were enrolled in a one-year resistance-training program. Upon completion
of the program, it was concluded the muscle strength of both groups improved
significantly regardless if HRT was administered [10]. Along with the increase in muscle
strength, women experienced a greater postural balance [9].
Although postmenopausal women have exhibited an increase in postural stability
while performing resistance training, they have shown the same results while only
receiving HRT [11, 12]. Specifically, long-term administration of HRT shortly after the
onset of menopause rapidly increases postural stability to that seen in premenopausal
women [13, 14]. With multiple studies finding HRT maintains postural stability in
women without supplemental exercises; muscle weakness can be ruled out as a key factor
in the risk of falls in postmenopausal women [10-12, 15].
Naessen demonstrated the positive effects of long-term HRT on postural stability
in postmenopausal women when compared to postmenopausal women not using HRT
and concluded the dynamics between HRT and fracture risk were too rapid to influence
3
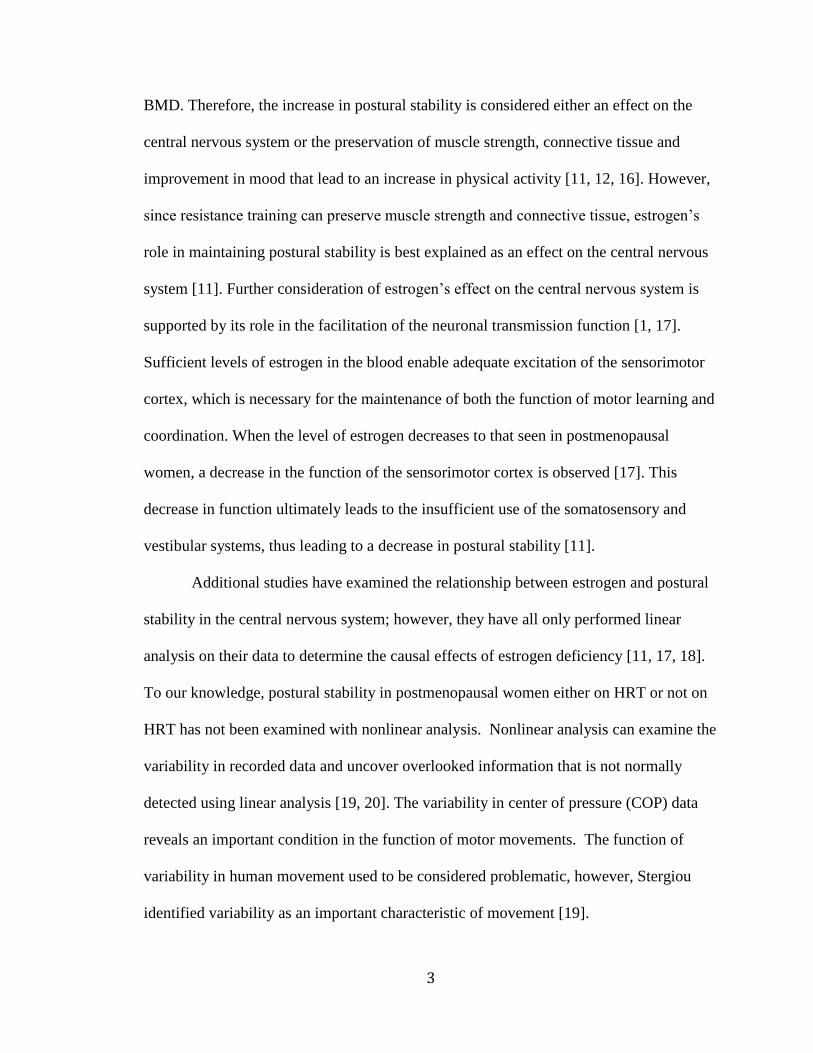
BMD. Therefore, the increase in postural stability is considered either an effect on the
central nervous system or the preservation of muscle strength, connective tissue and
improvement in mood that lead to an increase in physical activity [11, 12, 16]. However,
since resistance training can preserve muscle strength and connective tissue, estrogen’s
role in maintaining postural stability is best explained as an effect on the central nervous
system [11]. Further consideration of estrogen’s effect on the central nervous system is
supported by its role in the facilitation of the neuronal transmission function [1, 17].
Sufficient levels of estrogen in the blood enable adequate excitation of the sensorimotor
cortex, which is necessary for the maintenance of both the function of motor learning and
coordination. When the level of estrogen decreases to that seen in postmenopausal
women, a decrease in the function of the sensorimotor cortex is observed [17]. This
decrease in function ultimately leads to the insufficient use of the somatosensory and
vestibular systems, thus leading to a decrease in postural stability [11].
Additional studies have examined the relationship between estrogen and postural
stability in the central nervous system; however, they have all only performed linear
analysis on their data to determine the causal effects of estrogen deficiency [11, 17, 18].
To our knowledge, postural stability in postmenopausal women either on HRT or not on
HRT has not been examined with nonlinear analysis. Nonlinear analysis can examine the
variability in recorded data and uncover overlooked information that is not normally
detected using linear analysis [19, 20]. The variability in center of pressure (COP) data
reveals an important condition in the function of motor movements. The function of
variability in human movement used to be considered problematic, however, Stergiou
identified variability as an important characteristic of movement [19].
4
The present study aims to build off the consideration that estrogen’s effect on the
central nervous system plays a vital role in the maintenance of postural stability [11, 12].
Through nonlinear analysis of the variability in movement of postmenopausal women, we
expect to identify a decrease in estrogen in postmenopausal women results in a decrease
in postural stability and an increase in risk of falling compared to postmenopausal women
on HRT. The nonlinear analysis of variability in movement will give insight into the
complexity of the subject’s physiological system. If the subject exhibits a large amount of
complexity, then their physiological system is considered to possess the required
flexibility to adequately respond to external stimuli, thus providing sufficient postural
stability. Whereas, a subject displaying low levels of complexity cannot sufficiently
respond to external stimuli and will, therefore, exhibit low postural stability [21].
According to the “Loss of Complexity Hypothesis,” as individuals age, the complexity of
interactions in their physiological system begins to decrease [22, 23]. Since the average
age of the subjects is n= 56, independent of menopause, they are already experiencing a
decrease in complexity in their system due to the process of aging.
The results of the study are expected to show postmenopausal women on HRT
exhibit a greater amount of complexity in their movement compared to non-HRT users.
The rationale behind this consideration is based on the results that elderly long-term HRT
postmenopausal women reported a better postural balance function than non-HRT users
[11]. Therefore, if HRT users exhibit a better postural balance than non-HRT users, then
their physiological system will possess a larger degree of complexity than that of non-
HRT users [21].
5
CHAPTER I: TESTING STABILITY
Postural stability is measured using the NeuroCom Balance Manager assessment
device through the Sensory Organization Test (SOT) and the Motor Control Test (MCT).
The NeuroCom Balance Manager records the center of pressure (COP) movements of the
subject throughout the tests by utilizing the force platform beneath the subject. The SOT
examines somatosensory, visual and vestibular systems. Whereas, the MCT determines
the subject’s ability to recover from an unexpected disturbance in the force platform.
Together, the results from both the SOT and MCT are interpreted together to depict an
accurate profile of the subject’s postural stability [24].
During the SOT, sway referencing is utilized because the force platform beneath
the patient moves in addition to the surroundings in response to the subject’s
anterior/posterior (AP) sway. Sway referencing refers to the tilting of the force platform
or visual surrounding as the subject’s AP sway fluctuates. Involving sway referencing
requires the subject to rely on their nervous system to more accurately interpret the
sensory inputs from their surroundings. Combining sway referencing with the presence or
absence of eyesight in the subject further increases the subject’s reliance on their
vestibular and somatosensory systems [24].
There are six different conditions in the SOT, however, for this study only
conditions one through four are performed due to their real-world applicability. The four
conditions consist of (1) eyes open and fixed platform; (2) eyes closed and fixed
platform; (3) eyes open and sway-referenced surrounding; (4) eyes open and sway-
6
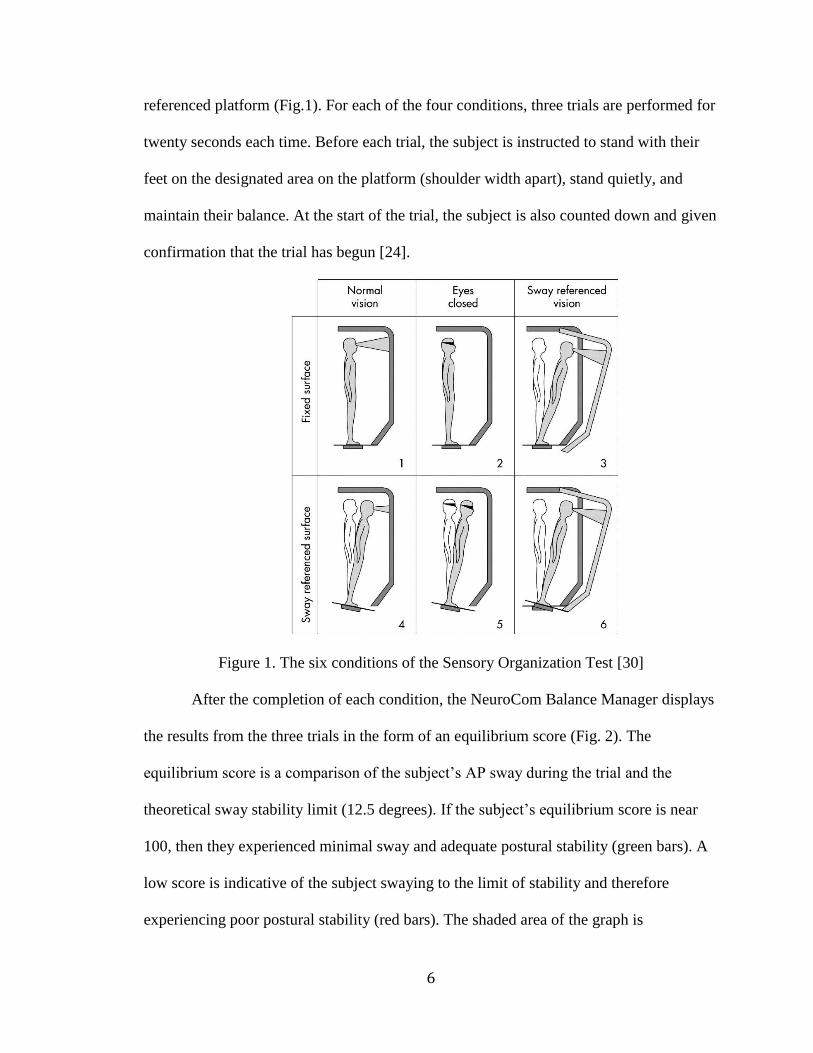
referenced platform (Fig.1). For each of the four conditions, three trials are performed for
twenty seconds each time. Before each trial, the subject is instructed to stand with their
feet on the designated area on the platform (shoulder width apart), stand quietly, and
maintain their balance. At the start of the trial, the subject is also counted down and given
confirmation that the trial has begun [24].
Figure 1. The six conditions of the Sensory Organization Test [30]
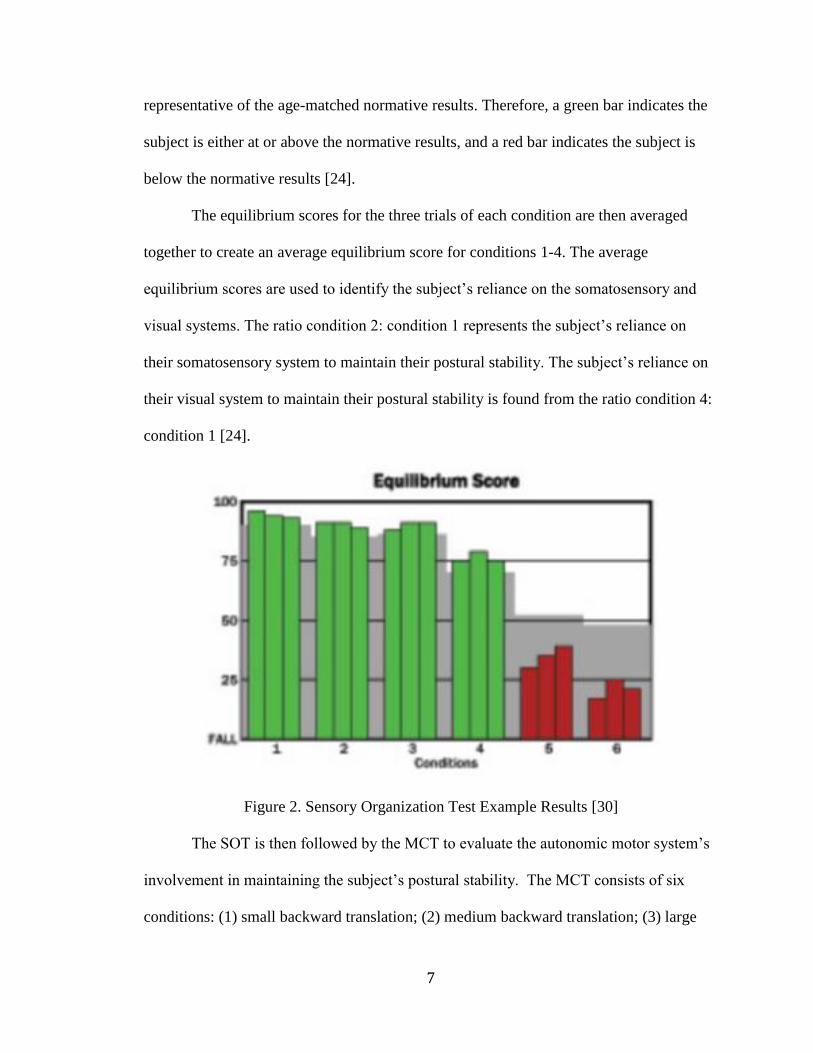
After the completion of each condition, the NeuroCom Balance Manager displays
the results from the three trials in the form of an equilibrium score (Fig. 2). The
equilibrium score is a comparison of the subject’s AP sway during the trial and the
theoretical sway stability limit (12.5 degrees). If the subject’s equilibrium score is near
100, then they experienced minimal sway and adequate postural stability (green bars). A
low score is indicative of the subject swaying to the limit of stability and therefore
experiencing poor postural stability (red bars). The shaded area of the graph is
7
representative of the age-matched normative results. Therefore, a green bar indicates the
subject is either at or above the normative results, and a red bar indicates the subject is
below the normative results [24].
The equilibrium scores for the three trials of each condition are then averaged
together to create an average equilibrium score for conditions 1-4. The average
equilibrium scores are used to identify the subject’s reliance on the somatosensory and
visual systems. The ratio condition 2: condition 1 represents the subject’s reliance on
their somatosensory system to maintain their postural stability. The subject’s reliance on
their visual system to maintain their postural stability is found from the ratio condition 4:
condition 1 [24].
Figure 2. Sensory Organization Test Example Results [30]
The SOT is then followed by the MCT to evaluate the autonomic motor system’s
involvement in maintaining the subject’s postural stability. The MCT consists of six
conditions: (1) small backward translation; (2) medium backward translation; (3) large
8
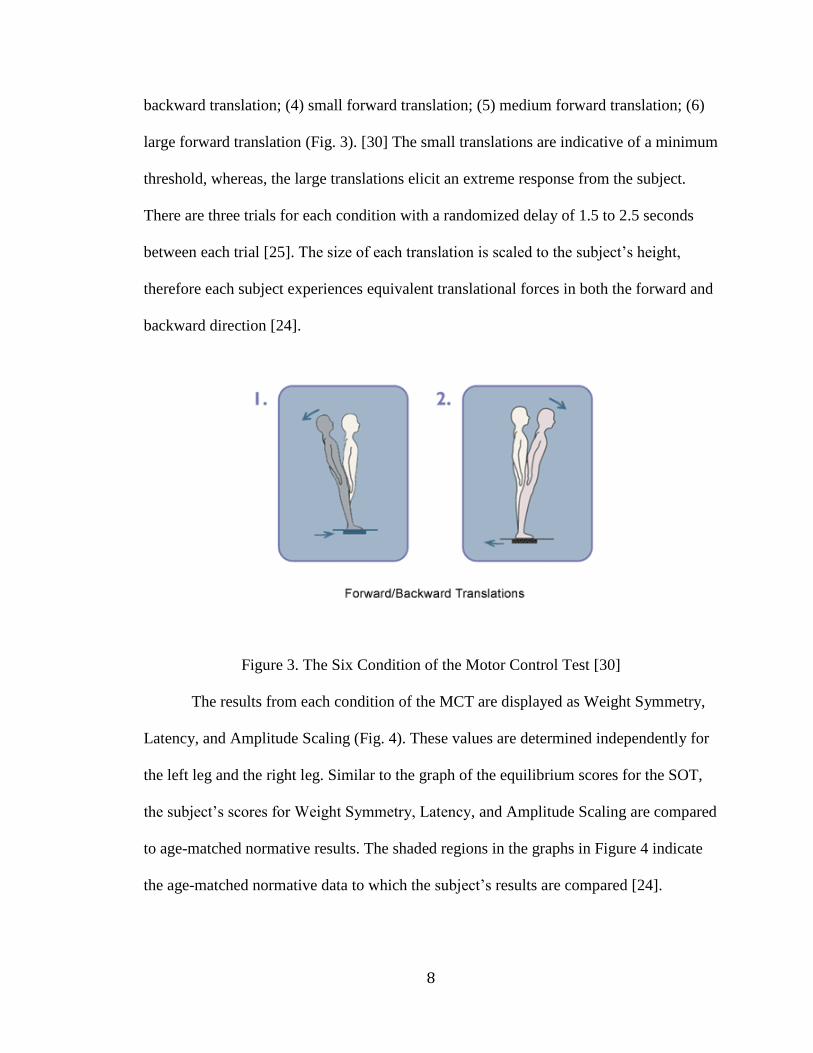
backward translation; (4) small forward translation; (5) medium forward translation; (6)
large forward translation (Fig. 3). [30] The small translations are indicative of a minimum
threshold, whereas, the large translations elicit an extreme response from the subject.
There are three trials for each condition with a randomized delay of 1.5 to 2.5 seconds
between each trial [25]. The size of each translation is scaled to the subject’s height,
therefore each subject experiences equivalent translational forces in both the forward and
backward direction [24].
Figure 3. The Six Condition of the Motor Control Test [30]
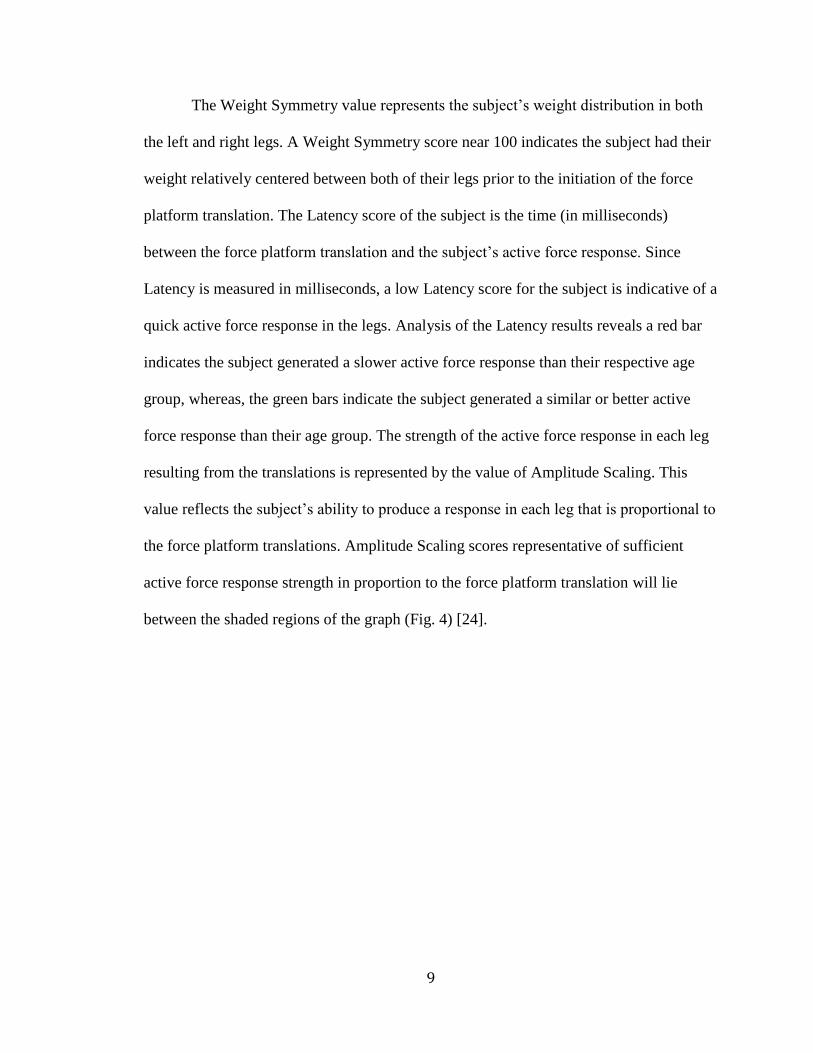
The results from each condition of the MCT are displayed as Weight Symmetry,
Latency, and Amplitude Scaling (Fig. 4). These values are determined independently for
the left leg and the right leg. Similar to the graph of the equilibrium scores for the SOT,
the subject’s scores for Weight Symmetry, Latency, and Amplitude Scaling are compared
to age-matched normative results. The shaded regions in the graphs in Figure 4 indicate
the age-matched normative data to which the subject’s results are compared [24].
9
The Weight Symmetry value represents the subject’s weight distribution in both
the left and right legs. A Weight Symmetry score near 100 indicates the subject had their
weight relatively centered between both of their legs prior to the initiation of the force
platform translation. The Latency score of the subject is the time (in milliseconds)
between the force platform translation and the subject’s active force response. Since
Latency is measured in milliseconds, a low Latency score for the subject is indicative of a
quick active force response in the legs. Analysis of the Latency results reveals a red bar
indicates the subject generated a slower active force response than their respective age
group, whereas, the green bars indicate the subject generated a similar or better active
force response than their age group. The strength of the active force response in each leg
resulting from the translations is represented by the value of Amplitude Scaling. This
value reflects the subject’s ability to produce a response in each leg that is proportional to
the force platform translations. Amplitude Scaling scores representative of sufficient
active force response strength in proportion to the force platform translation will lie
between the shaded regions of the graph (Fig. 4) [24].
10
Figure 4. Motor Control Test Sample Results [30]
For the present study, nonlinear analysis is performed on the results from the SOT
and MCT. The reasoning for using nonlinear analysis on the SOT and MCT results is that
healthy systems exhibit dynamics representative of an extremely adaptable
neuromuscular system. Through nonlinear analysis using entropy techniques, the extreme
adaptability of a healthy physiological system can be identified as complexity in the
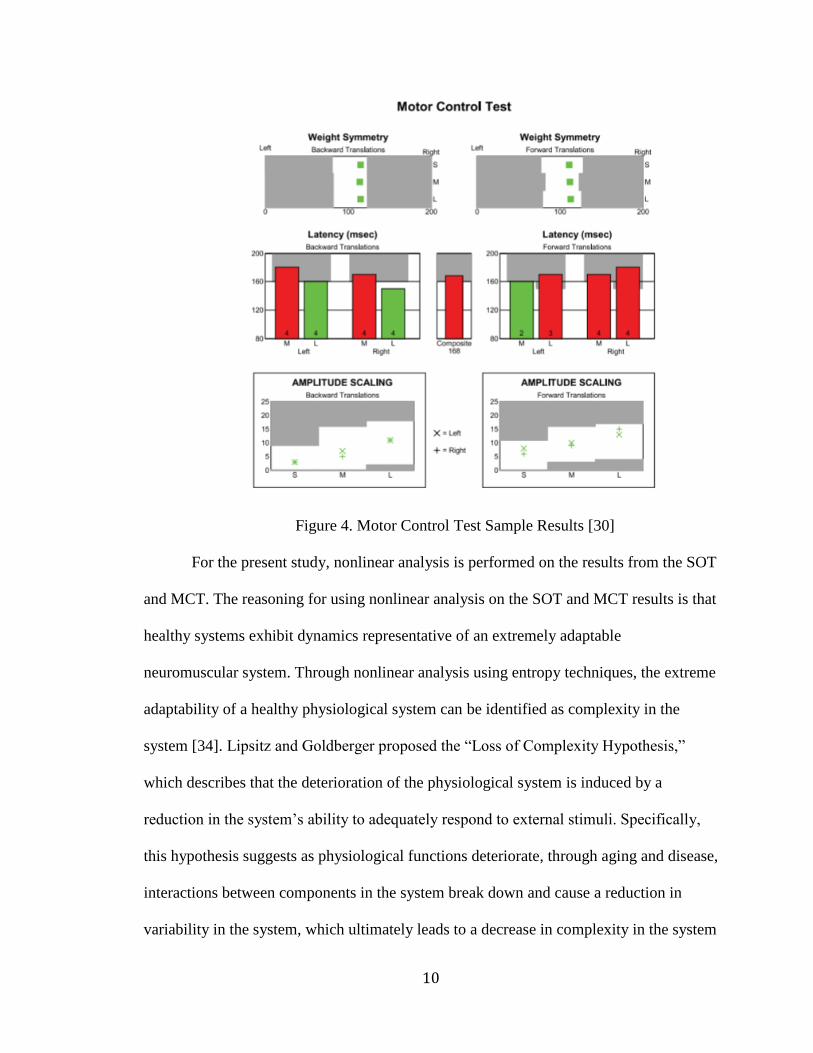
system [34]. Lipsitz and Goldberger proposed the “Loss of Complexity Hypothesis,”
which describes that the deterioration of the physiological system is induced by a
reduction in the system’s ability to adequately respond to external stimuli. Specifically,
this hypothesis suggests as physiological functions deteriorate, through aging and disease,
interactions between components in the system break down and cause a reduction in
variability in the system, which ultimately leads to a decrease in complexity in the system
11
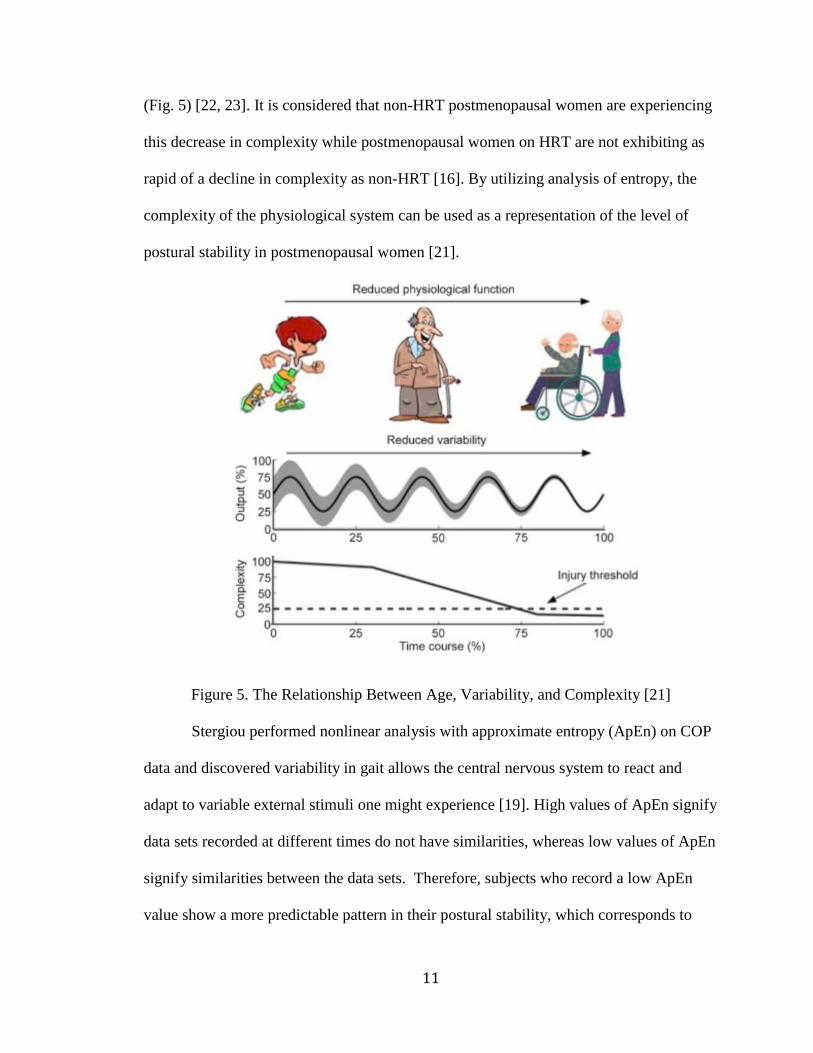
(Fig. 5) [22, 23]. It is considered that non-HRT postmenopausal women are experiencing
this decrease in complexity while postmenopausal women on HRT are not exhibiting as
rapid of a decline in complexity as non-HRT [16]. By utilizing analysis of entropy, the
complexity of the physiological system can be used as a representation of the level of
postural stability in postmenopausal women [21].
Figure 5. The Relationship Between Age, Variability, and Complexity [21]
Stergiou performed nonlinear analysis with approximate entropy (ApEn) on COP
data and discovered variability in gait allows the central nervous system to react and
adapt to variable external stimuli one might experience [19]. High values of ApEn signify
data sets recorded at different times do not have similarities, whereas low values of ApEn
signify similarities between the data sets. Therefore, subjects who record a low ApEn
value show a more predictable pattern in their postural stability, which corresponds to
12
both low variability and postural stability. Whereas, higher values of ApEn correspond to
data that do not show similarities, and therefore correspond to both greater variability and
postural stability [19, 26]. Although ApEn measures the predictability of the data, it is
quite sensitive to the length of data [26]. As for SampEn, it has been observed to show
much less sensitivity than ApEn to the length of data it is processing [27]. However, in
both ApEn and SampEn, higher values correspond to greater variability and less
predictability, whereas lower values resemble low variability and greater predictability.
Despite the similarities of ApEn and SampEn in their function, SampEn provides more
consistent results while remaining less sensitive to the data length [26-28].
While the use of ApEn and SampEn provide an insight into the regularity and
predictability of variability, they only consider a one-time scale of measurement.
Analyzing physiological functions at a single time scale does not fully incorporate the
complexity of the entire system. Investigating multiple time scales can detect the
relationship between the various elements of the physiological system that contribute to
the maintenance of postural stability. Therefore, for this study, multiple scale entropy
(MSE) is applied due to its inclusion of multiple time scales. MSE utilizes the SampEn
method by including a coarse-graining procedure, which allows the identification
variations over multiple time scales. The advantages of including multiple time scales are
the complexity can be analyzed at shorter or longer time scales and the measurement of
the overall complexity of the physiological system [21].
Since changes in the physiological system due to aging and disease cannot be
contained to one-time scale, MSE is used to identify the time scales where the
deterioration of the physiological system occurs. In postmenopausal women, this
13
deterioration in the physiological system is attributed to a decrease in estrogen levels in
the blood [16]. Through analysis of MSE on the SOT results, the role of estrogen in the
nervous system’s ability to utilize the sensorimotor and visual systems to maintain
postural stability can be identified. Determining the relationship between estrogen
deficiency and the timescales when postural stability is most affected can provide
valuable evidence for the benefit of HRT in postmenopausal women [21]
14
CHAPTER II: SUBJECTS AND METHODS
The study participants included 7 non-HRT postmenopausal women (mean age =
57) and 4 HRT postmenopausal women (mean age = 55). These women were recruited
through the “UM Today Daily Edition” and flyers passed out to organizations in the
Oxford/Lafayette community. If an individual expressed interest in the study, we
contacted them and conducted a preliminary screening over the phone to verify they were
a candidate for the study. The preliminary screening consisted of (1) Identifying if the
individual is postmenopausal or perimenopausal and (2) If the individual is on or not on
HRT. If the individual identifies as perimenopausal, then they are thanked for their
interest but removed from consideration for the study. An individual identifying as
postmenopausal and on HRT is asked to provide the name of their medication and the
dose. Once the individuals are cleared to participate in the study, they provide written
consent upon arrival to the Neuromechanics laboratory.
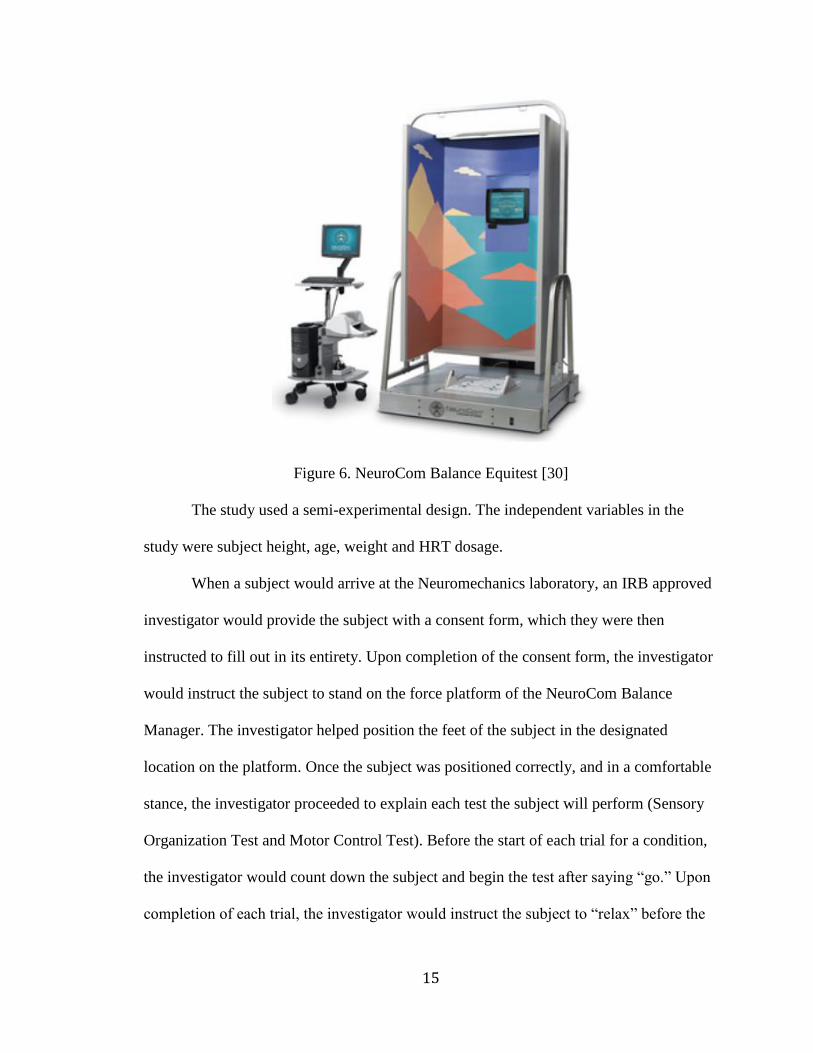
The testing apparatus used for the study is the NeuroCom Balance Manager
assessment device (Fig. 6). This device is a commonly used balance testing device found
in assessment clinics. It has a medical insurance number for when a physician orders the
test. The NeuroCom Balance Manager is connected to a computer that actively records
data while each for each test performed.
15
Figure 6. NeuroCom Balance Equitest [30]
The study used a semi-experimental design. The independent variables in the
study were subject height, age, weight and HRT dosage.
When a subject would arrive at the Neuromechanics laboratory, an IRB approved
investigator would provide the subject with a consent form, which they were then
instructed to fill out in its entirety. Upon completion of the consent form, the investigator
would instruct the subject to stand on the force platform of the NeuroCom Balance
Manager. The investigator helped position the feet of the subject in the designated
location on the platform. Once the subject was positioned correctly, and in a comfortable
stance, the investigator proceeded to explain each test the subject will perform (Sensory
Organization Test and Motor Control Test). Before the start of each trial for a condition,
the investigator would count down the subject and begin the test after saying “go.” Upon
completion of each trial, the investigator would instruct the subject to “relax” before the
16
beginning of the next trial. After the completion of both the Sensory Organization Test
and Motor Control Test, the investigator gave the subject a $20 gift card to Wal Mart for
their participation in the study. Upon receiving the gift card, the subject is then instructed
by the investigator to fill out an “incentive payment list” verifying they received a gift
card for completing the study.
Data Collection and Analysis
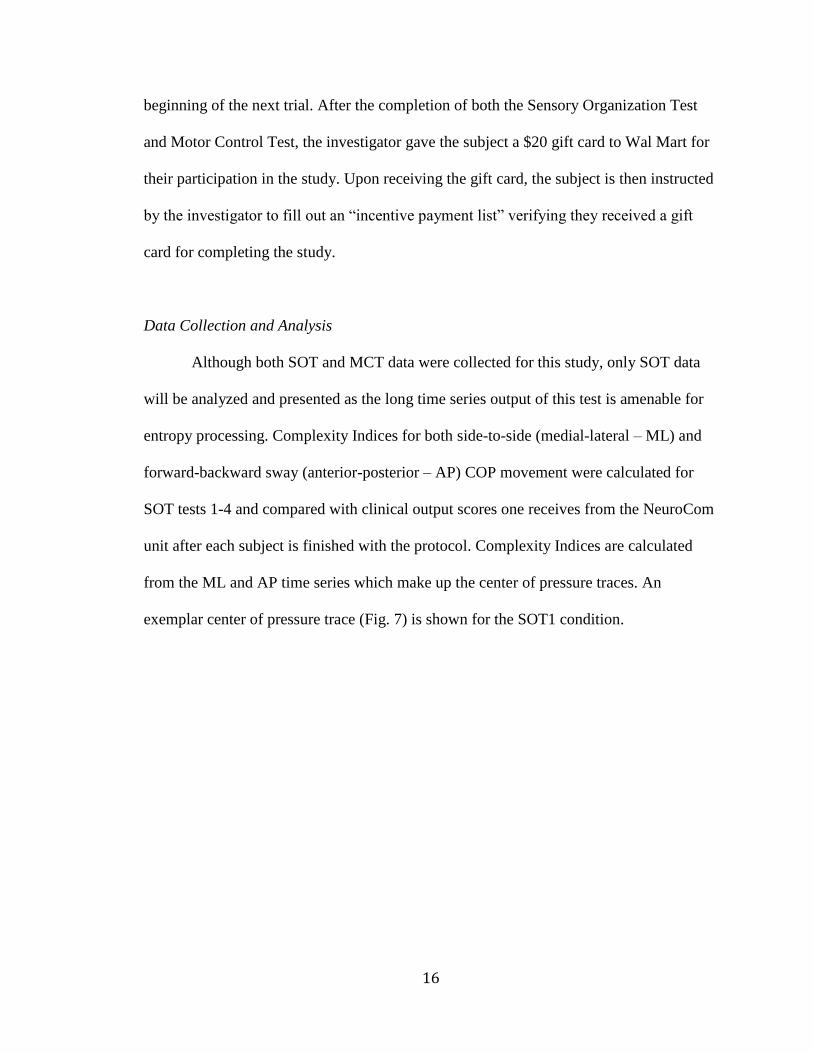
Although both SOT and MCT data were collected for this study, only SOT data
will be analyzed and presented as the long time series output of this test is amenable for
entropy processing. Complexity Indices for both side-to-side (medial-lateral – ML) and
forward-backward sway (anterior-posterior – AP) COP movement were calculated for
SOT tests 1-4 and compared with clinical output scores one receives from the NeuroCom
unit after each subject is finished with the protocol. Complexity Indices are calculated
from the ML and AP time series which make up the center of pressure traces. An
exemplar center of pressure trace (Fig. 7) is shown for the SOT1 condition.
17
-0.1
-0.08
-0.06
-0.04
-0.02
0
0.02
0.04
0.06
0.08
0.1
-0.04 -0.03 -0.02 -0.01 0 0.01 0.02 0.03 0.04
An
terio
r P
ost
erio
r M
ovem
en
t (M
)
Medial Lateral Movement (M)
Center of Pressure Trajectory
Figure 7. Center of Pressure Trace
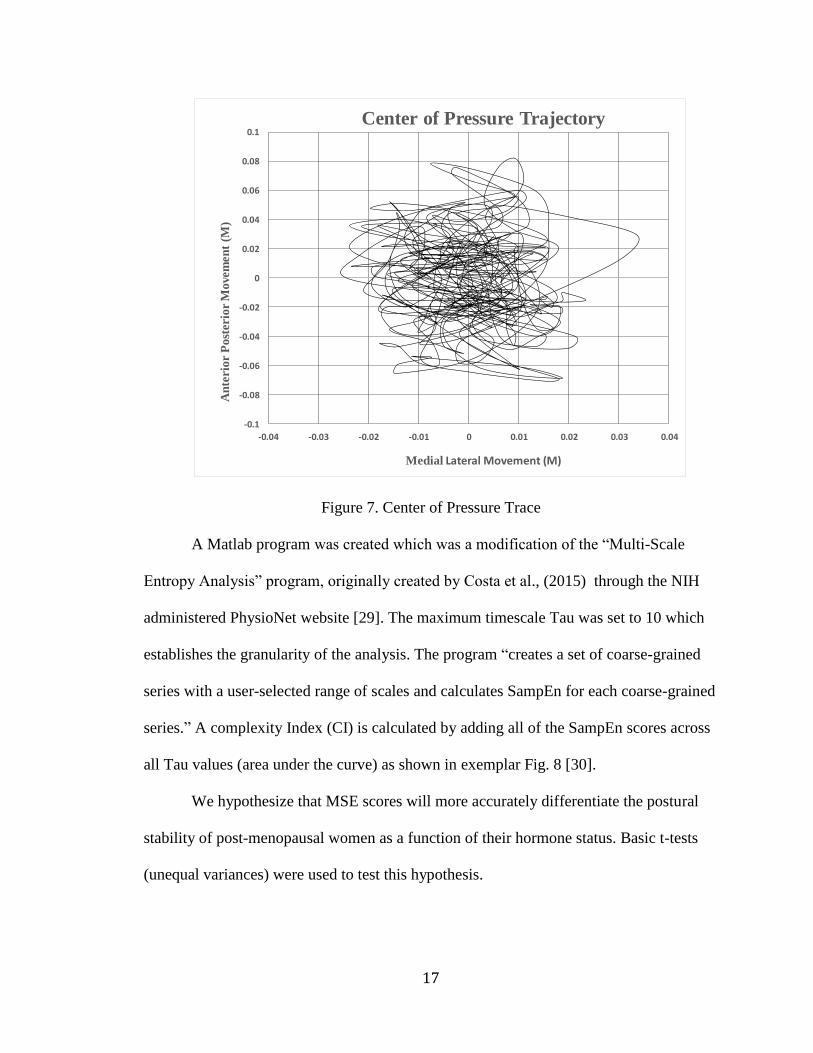
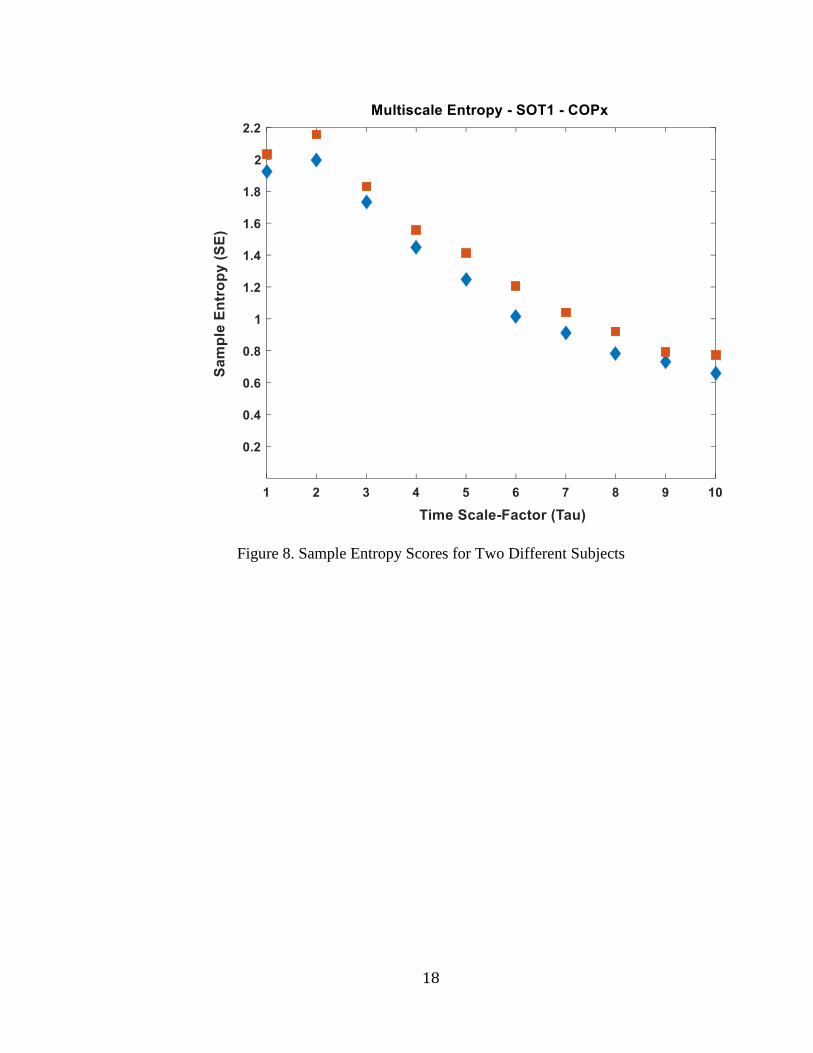
A Matlab program was created which was a modification of the “Multi-Scale
Entropy Analysis” program, originally created by Costa et al., (2015) through the NIH
administered PhysioNet website [29]. The maximum timescale Tau was set to 10 which
establishes the granularity of the analysis. The program “creates a set of coarse-grained
series with a user-selected range of scales and calculates SampEn for each coarse-grained
series.” A complexity Index (CI) is calculated by adding all of the SampEn scores across
all Tau values (area under the curve) as shown in exemplar Fig. 8 [30].
We hypothesize that MSE scores will more accurately differentiate the postural
stability of post-menopausal women as a function of their hormone status. Basic t-tests
(unequal variances) were used to test this hypothesis.
18
Figure 8. Sample Entropy Scores for Two Different Subjects
19
CHAPTER III: RESULTS
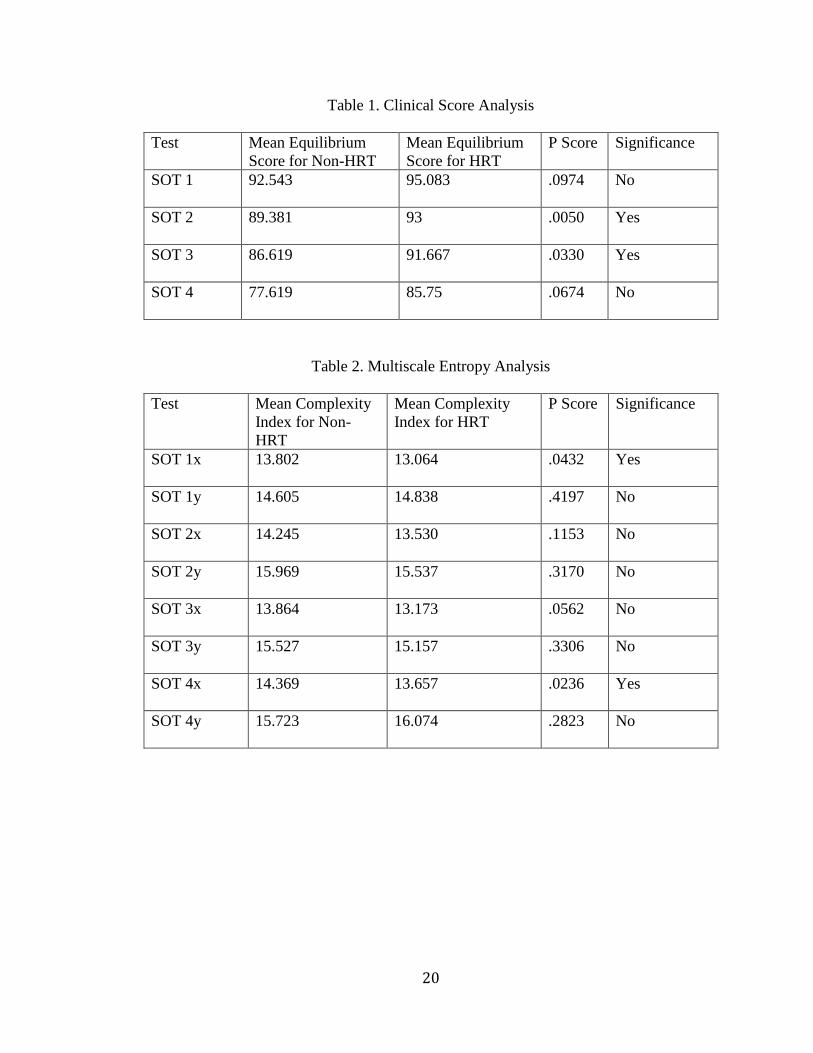
The results from the NeuroCom Equitest show HRT subjects exhibit a larger
mean equilibrium score than non-HRT subjects, which is indicative of greater postural
stability (Table 1). The MSE method created CI scores in both the medial-lateral (x) and
anterior/posterior (y) directions where a low CI is representative of good postural
stability. In Table 2, it is evident that HRT subjects display a lower CI than non-HRT
subjects in all conditions except for SOT 1y and SOT 4y. Therefore, both methods of
analysis were able to produce results consistent with those found in previous studies [11,
12].
Further analysis of the traditional clinical scores and complexity indices reveals
both methods determined there to be a significant difference in postural stability between
postmenopausal women on HRT and non-HRT postmenopausal women an equal number
of times (n=2). The NeuroCom assessment device identified a significant difference
between HRT and non-HRT postmenopausal women in SOT 2 (p≤ 0.05) and SOT 3
(p≤ 0.05) (Table 1). Whereas, the MSE method determined there to be a significant
difference between HRT and non-HRT postmenopausal women in SOT 1x (p≤ 0.05)
and SOT 4x (p≤ 0.05) (Table 2).
20
Table 1. Clinical Score Analysis
Test Mean Equilibrium
Score for Non-HRT
Mean Equilibrium
Score for HRT
P Score Significance
SOT 1 92.543 95.083 .0974 No
SOT 2 89.381 93 .0050 Yes
SOT 3 86.619 91.667 .0330 Yes
SOT 4 77.619 85.75 .0674 No
Table 2. Multiscale Entropy Analysis
Test Mean Complexity
Index for Non-
HRT
Mean Complexity
Index for HRT
P Score Significance
SOT 1x 13.802 13.064 .0432 Yes
SOT 1y 14.605 14.838 .4197 No
SOT 2x 14.245 13.530 .1153 No
SOT 2y 15.969 15.537 .3170 No
SOT 3x 13.864 13.173 .0562 No
SOT 3y 15.527 15.157 .3306 No
SOT 4x 14.369 13.657 .0236 Yes
SOT 4y 15.723 16.074 .2823 No
21
CHAPTER IV: CONCLUSION
The results from both the NeuroCom and MSE method were consistent with the
findings from previous studies in showing that postmenopausal women on HRT exhibit
better postural stability than non-HRT postmenopausal women [11, 12]. The MSE
analysis for SOT 1y and SOT 4y showed non-HRT subjects have greater postural
stability than HRT subjects, however, these results may be due to the limited availability
of subjects on HRT in the present study. Despite SOT 1y and SOT 4y, graphical analysis
of all the SampEn scores across all Tau values for the remaining SOT conditions
indicates HRT subjects exhibit lower SampEn scores and thus a high degree of
complexity in their COP movement (Fig. 8). These findings support the “Loss of
Complexity Hypothesis” in showing that HRT subjects exhibit less of a breakdown of
complexity in their movements compared to non-HRT subjects [17, 23].
The present study sought to use MSE as a method to more accurately assess the
postural stability of postmenopausal women with regards to the presence/absence of
estrogen in their system. A t-test performed on both the NeuroCom results and MSE
results indicated that both methods accurately detect a significant difference in postural
stability between HRT and non-HRT postmenopausal women an equal number of times
(n=2). NeuroCom analysis found a significant difference in SOT 2 and SOT 3, however,
since the subject is blinded in SOT 2 and their surrounding is sway-referenced in SOT 3,
we expected the NeuroCom to detect a difference in the subjects. Previous studies have
had success in differentiating postural stability in non-HRT and HRT subjects, however,
22
they have only done so by creating conditions for the subjects similar to those found in
SOT 2 and SOT 3 [12]. For the present study, we are interested in determining if the
MSE method can detect a difference in the subjects without needing to manipulate the
conditions to elicit a fall.
When the MSE method was applied, a significant difference was identified in
SOT 1x and SOT 4x. Although the MSE method was unable to detect more differences
than the NeuroCom, it was able to identify a significant difference in SOT 1, whereas, the
NeuroCom was not. To our knowledge, this is the first instance to identify a significant
difference in the postural stability of non-HRT and HRT postmenopausal women
experiencing the conditions present in SOT 1. Previous studies have not shown these
results because their use of traditional assessment methods does not possess the required
sensitivity to differentiate an HRT subject and a non-HRT subject without trying to elicit
a fall in the subject [12]. Therefore, applying the MSE method to analyze COP data may
introduce a higher level of sensitivity necessary to assess postural stability as a function
of estrogen status.
MSE may be more likely to detect the complex interactions between the sensory,
motor and central processing systems involved in postural stability, however, prospective
studies are needed to show if the proposed method is more accurate than traditional
methods. Currently, if used in conjunction with the NeuroCom, the MSE method can
create a more accurate representation of a postmenopausal woman’s postural stability as a
function of the presence of estrogen than previous traditional methods. Thus, we can
apply the results from both methods of analysis to support the assumption presented by
Naessen et al that estrogen can counteract the deterioration of complexity in movement

23
through an effect on the central nervous system. Additional research on the MSE method
and its ability to analyze postural stability in postmenopausal women may provide further
evidence of estrogen’s role as a neuroprotectant and protective factor for risk of falling.
24
LIST OF REFERENCES
1. Sipilä, S., T. Finni, and V. Kovanen, Estrogen Influences on Neuromuscular Function in Postmenopausal Women. Calcified Tissue International, 2015. 96(3): p. 222-233.
2. Haber, N.E.L., et al., Relationship between age and measures of balance, strength and gait: linear and non-linear analyses. Clin Sci, 2008. 114.
3. Rosner, C., Menopause Puts Women At Higher Risk Of Fall-Related Injuries. 2017, WNPR: wnpr.org/post/menopause-puts-women-higher-risk-fall-related-injuries.
4. Arnold, C.M., et al., The relationship of intrinsic fall risk factors to a recent history of falling in older women with osteoporosis. J Orthop Sports Phys Ther, 2005. 35(7): p. 452-60.
5. Heikkinen, J., et al., HRT and exercise: effects on bone density, muscle strength and lipid metabolism. A placebo controlled 2-year prospective trial on two estrogen-progestin regimens in healthy postmenopausal women. Maturitas. 26(2): p. 139-149.
6. Phillips, S.K., et al., Muscle weakness in women occurs at an earlier age than in men, but strength is preserved by hormone replacement therapy. Clinical Science, 1993. 84(1): p. 95-98.
7. Prieto-Alhambra, D., et al., An increased rate of falling leads to a rise in fracture risk in postmenopausal women with self-reported osteoarthritis: a prospective multinational cohort study (GLOW). Annals of the Rheumatic Diseases, 2012.
8. Cangussu, L.M., et al., Evaluation of postural balance in postmenopausal women and its relationship with bone mineral density- a cross sectional study. BMC Musculoskeletal Disorders, 2012. 13(1): p. 2.
9. Charette, S.L., et al., Muscle hypertrophy response to resistance training in older women. Journal of Applied Physiology, 1991. 70(5): p. 1912-1916.
10. Teixeira, P., et al., Resistance training in postmenopausal women with and without hormone therapy. Medicine and science in sports and exercise, 2003. 35(4): p. 555.
11. Naessen, T., B. Lindmark, and H.-C. Larsen, Better postural balance in elderly women receiving estrogens. American Journal of Obstetrics & Gynecology. 177(2): p. 412-416.
12. Naessen, T., B. Lindmark, and H.C. Larssen, Early postmenopausal hormone therapy improves postural balance. Menopause, 2007. 14.
13. Ekblad, S., et al., Disturbances in postural balance are common in postmenopausal women with vasomotor symptoms. Climacteric, 2000. 3(3): p. 192-198.
14. Figueroa, A., et al., Effects of exercise training and hormone replacement therapy on lean and fat mass in postmenopausal women. J Gerontol A Biol Sci Med Sci, 2003. 58(3): p. 266-70.
25
15. Ribom, E.L., et al., Six months of hormone replacement therapy does not influence muscle strength in postmenopausal women. Maturitas. 42(3): p. 225-231.
16. L. Hammar, M., et al., Effects of hormonal replacement therapy on the postural balance among postmenopausal women. Obstetrics & Gynecology, 1996. 88(6): p. 955-960.
17. Smith, S.S., Estrogen administration increases neuronal responses to excitatory amino acids as a long-term effect. Brain Research, 1989. 503(2): p. 354-357.
18. Bergstrom, I., B.-M. Landgren, and I. Pyykko, Training or EPT in perimenopause on balance and flushes. Acta Obstetricia et Gynecologica Scandinavica, 2007. 86(4): p. 467-472.
19. Harbourne, R.T. and N. Stergiou, Movement Variability and the Use of Nonlinear Tools: Principles to Guide Physical Therapist Practice. Physical Therapy, 2009. 89(3): p. 267-282.
20. Peng, C.K., Fractal mechanisms in neuronal control : human heartbeat and gait dynamics in healthy and disease. Self-Organized Biological Dynamics & Nonlinear Control, 2000: p. 66-96.
21. Busa, M.A. and R.E.A. van Emmerik, Multiscale entropy: A tool for understanding the complexity of postural control. Journal of Sport and Health Science, 2016. 5(1): p. 44-51.
22. Lipsitz, L.A., Dynamics of StabilityThe Physiologic Basis of Functional Health and Frailty. The Journals of Gerontology: Series A, 2002. 57(3): p. B115-B125.
23. Lipsitz, L.A. and A.L. Goldberger, Loss of complexity and aging: Potential applications of fractals and chaos theory to senescence. JAMA, 1992. 267(13): p. 1806-1809.
24. Neurocom. NeuroCom. Objective Quantification of Balance and Mobility. . 25. Vanicek, N., et al., Computerized Dynamic Posturography for Postural Control
Assessment in Patients with Intermittent Claudication. Journal of Visualized Experiments : JoVE, 2013(82): p. 51077.
26. Richman, J.S. and J.R. Moorman, Physiological time-series analysis using approximate entropy and sample entropy. American Journal of Physiology-Heart and Circulatory Physiology, 2000. 278(6): p. H2039-H2049.
27. Ramdani, S., et al., On the use of sample entropy to analyze human postural sway data. Medical Engineering and Physics. 31(8): p. 1023-1031.
28. Smith, B., et al., Sample Entropy Identifies Differences in Spontaneous Leg Movement Behavior between Infants with Typical Development and Infants at Risk of Developmental Delay. Technologies, 2017. 5(3): p. 55.
29. Costa, M., A.L. Goldberger, and C.K. Peng, Multiscale entropy analysis of biological signals. Physical Review E, 2005. 71(2): p. 021906.
30. Costa, M., A.L. Goldberger, and C.K. Peng, Multiscale Entropy Analysis of Complex Physiologic Time Series. Physical Review Letters, 2002. 89(6): p. 068102.