non-communicable diseases risk factors in bangladesh 2018
TRANSCRIPT

National Institute of Preventive and Social Medicine (NIPSOM) Mohakhali, Dhaka1212
National STEPS Survey for Non-communicable Diseases Risk Factors
in Bangladesh 2018

ii
National STEPS Survey for
Non-communicable Diseases Risk Factors
in Bangladesh 2018

iii
The STEPS survey of non-communicable disease (NCD) is the first ever population based
national survey in Bangladesh. It is the first ever STEPS survey in the world to be done
using digital technology, Bangladesh society is a proud part of this history.
I gratefully admire and acknowledge the attitude of DGHS and Ministry of Health and Family
Welfare towards us for their wholehearted support to the investigators. I also acknowledge
and sincerely express my gratitude to the WHO, for its technical support to the investigators
team for smooth completion of the project. Especially I can’t help mentioning Dr M Mostafa
Zaman, without active support of him and his team it wouldn’t be possible to complete the
task in time.
I must covey my gratitude to the investigators team, field supervisors and enumerators, the
IT specialists and above all the participants who spent their valuable time to provide data. I
would like to extend my gratitude to the Advisory Committee for guiding the study.
Because this survey has given nationally representative data on NCD risk factors, this report
will help in formulating the prevention strategy on NCDs in Bangladesh.
Professor Dr Baizid Khoorshid Riaz
Director
NIPSOM, Mohakhali, Dhaka
PREFACE

iv
NCDs are major causes of preventable deaths and disabilities. The second National Survey
on NCD Risk Factors provides information on the prevalence of important risk factors
comparable across countries.
I am pleased to see that National Survey on NCD Risk Factor in Bangladesh was completed
successfully even in spite of various limitations. I commend the Ministry of Health and Family
Welfare for their leadership in conducting the survey. NIPSOM has done a good job to
generate evidences.
This survey used electronic data capture machines, which has contributed substantially to
capacity building of the country to conduct large and standardized surveys using information
technology. The same machines are now can be used in any further national surveys.
The National Survey on NCD Risk Factors report has gathered important data on various
aspects of the non-communicable diseases and their risk factors in Bangladesh. I am
confident that this report will be useful in designing and implementing effective NCD control
policies and interventions in Bangladesh. This will also help reporting to the Global NCD
Monitoring Framework.
WHO Representative to Bangladesh

v
Research Team
Principal Investigator:
Prof Dr Baizid Khoorshid Riaz, Director and Head, Dept of Public Health and Hospital Administration, NIPSOM
Co-Principal Investigators:
Prof Dr Md. Ziaul Islam, Head, Dept of Community Medicine, NIPSOM
Dr ANM Shamsul Islam, Program Coordinator and Associate Professor, Dept of Public Health and Hospital Administration, NIPSOM
Co-Investigators:
Prof M A Hafez, Head, Dept of Biostatistics, BUHS, Mirpur, Dhaka.
Prof Dr Emdadul Haque, Head, Dept of Nutrition & Biochemistry, NIPSOM
Dr Nirmeen Rifat Khan, Associate Professor, Dept of Community Medicine, NIPSOM
Dr Hafiza Sultana, Associate Professor and Head,Dept of Health Education,
NIPSOM
Dr Shaheda Hamid, Assistant Professor, Dept of Maternal & Child Health, NIPSOM
Dr Fahmida Khanam, Assistant Professor, Dept of Parasitology, NIPSOM
Dr Monira Akhter Moni, Assistant Professor, Dept of Epidemiology, NIPSOM
Dr KM Bayzid Amin, Lecturer, NIPSOM
Dr Irfan Nowroze Noor, Lecturer, NIPSOM
Dr Mahfuzur Rahman Bhuiya, Grants Manager, Campaign for Tobacco Free Kids,
Dhaka.

vi
Advisory Committee
1. Ms Roxana Quader, Additional Secretary (Public Health and
WHO), Ministry of Health & Family Welfare (MoH&FW)
Chairperson
2. Prof AHM Enayet Hussain, Additional Director General (Planning
& Development) and Line Director, NCDC, DGHS
Member
3. Prof Liaquat Ali, Vice Chancellor, Bangladesh University of
Health Sciences (BUHS)
Member
4. Prof Dr Md Mujibur Rahman, Prof of Medicine, Dhaka Medical
College Hospital (DMCH) Dhaka
Member
5. Prof Dr Md Ridwanur Rahman, Prof of Medicine, Universal
Medical College, Dhaka
Member
6. Mr Ruhul Quddus, Coordinator, National Tobacco Control Cell
(NTCC), MoH&FW
Member
7. Dr Md Faruk Ahmed Bhuiya, Senior Scientist, IEDCR Member
8. Dr M Mostafa Zaman, Adviser–Research and Publication, World Health Organization, Bangladesh
Member
9. Prof Dr Sohel Reza Chowdhury, Dept of Epidemiology and Research, National Heart Foundation (NHF)
Member
10. Mr Md Motaher Hossain, Deputy Secretary (WHO), MoH&FW Member
11. Dr Md Masud Alam, Director, Demography and Health Wing,
Bangladesh Bureau of Statistics (BBS)
Member
12. Dr Sk Md Mahbubus Sobhan, Program Officer, NTCC Member
13. ProfDr Baizid Khoorshid Riaz, Director, NIPSOM Member Secretary
Contributors to the Research Protocol
1. Professor Dr Md. Ziaul Islam, Head, Department of Community Medicine, NIPSOM 2. Dr Manju Rani, Regional Adviser, NCD and Tobacco Surveillance 3. Dr M Mostafa Zaman, Adviser, Research and Publication, WHO Bangladesh
Contributors to the Report NIPSOM
1. Professor Dr Md. Ziaul Islam, Head, Department of Community Medicine, NIPSOM
2. Dr Irfan Nowroze Noor, Lecturer, NIPSOM
WHO
3. Dr M Mostafa Zaman, Adviser, Research and Publication, WHO Bangladesh
4. Dr Manju Rani, Regional Adviser, NCD and Tobacco Surveillance
5. Ms Yvonne Yiru Xu, Consultant, SEARO
6. Mr Naveen Agarwal, Surveillance Management Associate
7. Dr Ferdous Hakim, National Consultant - EIP, WHO Bangladesh
8. Mr Rijwan Bhuiyan, Data Assistant, WHO Bangladesh

vii
List of Acronyms
BBS Bangladesh Bureau of Statistics
BMI Body Mass Index
BP Blood Pressure
COPD Chronic Obstructive Pulmonary Disease
CVD Cardiovascular Disease
DBP Diastolic Blood Pressure
DM Diabetes Mellitus
HHQ Household Questionnaire
MET Metabolic Equivalent
NCD Non-communicable Disease
NIPSOM National Institute of Preventive and Social Medicine
PSU Primary Sampling Unit
SBP Systolic Blood Pressure
FCTC Framework Convention on Tobacco Control
STEPS STEP wise Surveillance
WHO World Health Organization

viii
ACKNOWLEDGEMENTS
The support, suggestions comments, and guidance, as applicable, provided by the following organization/ persons are duly appreciated and acknowledged.
A. Sampling frame for the survey
Bangladesh Bureau of Statistics Professor Dr Md. Ziaul Islam, Head, Department of Community Medicine, NIPSOM
B. Accommodation for the
field team Civil Surgeons and UHFPOs of 64 districts
Technical reviewers of the report
Professor Dr Abul Kalam Azad, DG, DGHS Professor Dr Enayet Hussain, ADG, DGHS Dr Meher Parveen, Director - PMR, DGHS Dr Ridwanur Rahman Shamim, NCDC, DGHS Dr Manju Rani, Regional Adviser - NCD and Tobacco Surveillance, WHO-SEARO Dr Tara Kessaram, MO- NCD, WHO Bangladesh
C.
D. Data Management and Analysis
Dr M Mostafa Zaman, Adviser–Research and Publication, WHO Bangladesh Dr Ferdous Hakim,National Consultant–EIP, Research and Publication, WHO Bangladesh Mr Rijwan Bhuiyan, Data Assistant, WHO Bangladesh Dr Stefan Savin, WHO–HQ Dr Leanne Riley, WHO–HQ Mr Naveen Agarwal, Surveillance Management Associate, WHO-SEARO Mst. Khaleda Akter, Team Assistant–Research and Publication, WHO Bangladesh Professor Dr Md. Ziaul Islam, Head, Department of Community Medicine, NIPSOM Dr Irfan Nowroze Noor, Lecturer, NIPSOM
E. F.
Training of Investigators Dr M Mostafa Zaman, Adviser–Research and Publication, WHO Bangladesh Dr Manju Rani, Regional Adviser– NCD and Tobacco Surveillance, WHO-SEARO Dr Leanne Riley, WHO–HQ
G. Production Associate Mst. Khaleda Akter, Team Assistant–Research and Publication, WHO Bangladesh

STEPS Bangladesh 2018 Report

STEPS Bangladesh 2018
2
Contents Executive Summary ................................................................................................................................ 5
Bangladesh at a Glance ........................................................................................................................ 11
Chapter 1 Introduction ........................................................................................................................... 12
1.1 Background ................................................................................................................................. 12
1.2 STEP survey and NCD surveillance ........................................................................................... 13
1.3 Objectives ................................................................................................................................... 13
Chapter 2 Survey Methodology ............................................................................................................ 15
2.1 Survey design ............................................................................................................................. 15
2.2 Survey population ....................................................................................................................... 15
2.3 Sampling design .......................................................................................................................... 15
2.4 Data collection tools .................................................................................................................... 19
2.5 Data collection technique ........................................................................................................... 20
2.6 Physical measurements: Anthropometry and blood pressure .................................................... 21
Results .................................................................................................................................................. 29
Chapter 3 Characteristics of respondents and households .................................................................. 29
Key findings ....................................................................................................................................... 29
Introduction........................................................................................................................................ 29
3.1 Basic characteristics of survey respondents ............................................................................... 29
3.2 Education .................................................................................................................................... 30
3.3 Employment ................................................................................................................................ 30
3.4 Household characteristics and assets (Table 3.3) ...................................................................... 31
3.5 Household wealth index .............................................................................................................. 31
Chapter 4 Tobacco ................................................................................................................................ 38
Key findings ....................................................................................................................................... 38
Introduction........................................................................................................................................ 39
4.1 Tobacco use ................................................................................................................................ 40
4.2 Types of Tobacco products use .................................................................................................. 47
4.3 Age at initiation of tobacco use ................................................................................................... 53
4.4 Tobacco cessation ...................................................................................................................... 55
4.5 Electronic cigarettes .................................................................................................................... 57
Chapter 5 Alcohol .................................................................................................................................. 68
Key findings ....................................................................................................................................... 68
Introduction........................................................................................................................................ 68
5.1 Alcohol consumption – life-time abstainers, former drinks, and current drinks ......................... 70
5.2 Heavy episodic drinking .............................................................................................................. 72
5.3 Unrecorded Alcohol use .............................................................................................................. 75
Chapter 6 Diet ....................................................................................................................................... 81
Key findings ....................................................................................................................................... 81
Introduction........................................................................................................................................ 81

STEPS Bangladesh 2018
3
6.1 Consumption of fruits and vegetables ......................................................................................... 82
6.2 Knowledge on recommended fruits and vegetable intakes ........................................................ 83
6.3 Fats and oils used for cooking and outside-of-home food consumption (Table 6.4) .................. 84
6.4 Consumption of outside-of-home meals and snacks (Table 6.5) ............................................... 85
Chapter 7 Dietary Salt ........................................................................................................................... 91
Key findings ....................................................................................................................................... 93
Introduction........................................................................................................................................ 91
7.1 Mean population 24-hour salt intake ........................................................................................... 92
7.2 Behaviour around dietary salt intake: .......................................................................................... 93
7.3. Perceptions about levels of salt intake ....................................................................................... 95
7.4 Knowledge on salt intake, recommendations and health consequences ................................... 96
7.5 Practices and methods to reduce salt intake .............................................................................. 97
Chapter 8 Physical activity Key findings ............................................................................................. 107
Key findings ..................................................................................................................................... 109
Introduction...................................................................................................................................... 107
8.1 Time spent on physical activity ................................................................................................. 109
8.2 Insufficient levels of physical activity ......................................................................................... 111
8.3. Percent contribution to physical activity from each domain. .................................................... 111
8.4 Time spent on sedentary activities ............................................................................................ 112
Chapter 9 Anthropometry .................................................................................................................... 118
Key findings ..................................................................................................................................... 118
Introduction...................................................................................................................................... 118
9.1 Nutritional Status ....................................................................................................................... 119
9.2 Waist Circumference and Waist-Hip Ratio................................................................................ 120
9.3 Disease risk based on body-mass index and waist circumference .......................................... 121
Chapter 10 Blood Pressure: screening, prevalence and treatment .................................................... 127
Key findings ..................................................................................................................................... 127
Introduction...................................................................................................................................... 128
10.1. Prevalence of raised blood pressure based on measurement and medications history ....... 129
10.2. Diagnosis and treatment gap ................................................................................................. 130
10.3. Screening coverage ............................................................................................................... 132
10.4. Prescription of medications and compliance with treatment (Table 10.2) ............................ 133
10.5. Sources of care for treatment and advice and medications for raised BP ............................. 134
10.6. Consultation with traditional healers and use of herbal remedies ......................................... 136
10.7. Reasons for not on treatment ................................................................................................ 137
Chapter 11 Diabetes: screening, prevalence and treatment .............................................................. 145
Key findings ..................................................................................................................................... 145
Introduction...................................................................................................................................... 146
11.1. Prevalence of raised blood glucose based on measurement and medications history ......... 147
11.2. Diagnosis and treatment gap (Table 11.1) ............................................................................ 148
STEPS Bangladesh 2018
4
11.3. Screening coverage (Table 11.2) ........................................................................................... 150
Chapter 12 Cholesterol: screening, prevalence and treatment .......................................................... 162
Key findings ..................................................................................................................................... 162
Introduction...................................................................................................................................... 163
12.1. Prevalence of raised blood cholesterol based on measurement and medications history .... 163
12.2. Diagnosis and treatment gap ................................................................................................. 164
12.3. Screening coverage ............................................................................................................... 166
12.4. Prescription of medications and compliance with treatment (Table 12.2) ............................ 166
12.5. Sources of care for treatment and advice and medications for raised blood cholesterol ...... 166
12.6. Consultation with traditional healers and use of herbal remedies ......................................... 168
12.7. Reasons for not on treatment ................................................................................................ 169
Chapter 13 Cardiovascular diseases history, predicted CVD risk and life-style advice ..................... 177
Key findings .................................................................................................................................... 177
Introduction...................................................................................................................................... 177
13.1 History of Cardiovascular disease .......................................................................................... 179
13.2 Predicted 10-year cardiovascular disease risk ....................................................................... 180
13.3 Lifestyle advice ........................................................................................................................ 180
Chapter 14 Cervical Cancer: Screening and Treatment ..................................................................... 187
Key findings .................................................................................................................................... 187
Introduction...................................................................................................................................... 187
14.1 Testing for cervical cancer ...................................................................................................... 190
14.2 Sources of care for cervical cancer ......................................................................................... 191
14.3 Treatment for cervical cancer ................................................................................................. 192
Chapter 15 Oral health ........................................................................................................................ 196
Key findings ..................................................................................................................................... 198
Introduction...................................................................................................................................... 197
15.1 Oral hygiene practices ............................................................................................................ 198
15.2 Care seeking for oral health issues with dentist ..................................................................... 198
15.3 Self-reported oral health issues .............................................................................................. 199
15.4 Sources of care for oral health issues ..................................................................................... 199
15.5 Reasons for not seeking care for oral health issues ............................................................... 201
Chapter 16 Policy Recommendations ................................................................................................ 208
Annexure
A. Map of Bangladesh showing data collection areas (PSUs) ………………….…..…………………211
B. Questionnaire: English …………………………………………………….........................................212
C. Questionnaire: Bangla …………………………………………………….........................................242
D. Template of Report on blood glucose and lipid levels …………….…………………………..…….283
E. Picture show cards ……………………………………………………...............................................284

STEPS Bangladesh 2018
5
Executive Summary
Non-communicable diseases (NCDs), also known as chronic diseases, tend to be of long
duration and are the result of a combination of genetic, physiological, environmental and
behavioral factors. Globally, more than seventy percent deaths occurred due to these
pandemic NCDs. Most of the NCDs are preventable if the risk factors can be minimized. So
information regarding distribution and determinants of those diseases and their risk factors is
essential for launching appropriate community programs to reduce death and disabilities from
NCDs. Current nationwide survey was conducted to get the distribution of NCD risk factors
among Bangladeshi adult population both in urban and rural areas.
METHODS
A cross–sectional survey was carried out from February to May 2018 among adult population
aged l8-69 years including men and women residing in the households in all the divisions of
Bangladesh. Sampling was done by multistage, geographically stratified probability based
sampling on the basis of Primary Sampling Unit (PSU) developed by Bangladesh Bureau of
Statistics (BBS) for census 2011. The sample size was calculated considering prevalence of
different NCD risk factors, relative precision rate and feasibility of the survey.
To calculate the final sample size, the design effect and non-response rate at the household
and individual level were considered. Considering the findings of Demographic Health survey
and previous BBS surveys, the person non-response rate and household non-coverage rate
and design effect, security issue and non-clearance of local administration, the final adjusted
sample size was 9,900 adults of 495 PSUs. However, based-on eligibility, refusal etc. finally,
out of 9900 complete data were gotten from 8185 respondents, physical measurements could
be done in 7208 participants, and blood and urine sample was collected from 7065 and 7028
respondents respectively. Both the blood and urine samples were given by 6901participants.
RESULTS
1. Population characteristics
Among the total 8185 respondents 3804 were men and 4381 were women. Response ration
men: women was1:1.15.Mean age was 39.3 years. They had a mean 5.5 years of education
(5.9 years in men and 5.2 years in women). Mean number of years of education was found to
be higher in both men (7.0 years) and women (6.3 years) residing in urban area than in rural
(men 4.7 years, women 4.2 years) area. By occupation, most of the women were homemakers
whereas, businessmen, farmers, day laborer and service holders were dominant among the
men respondents.

STEPS Bangladesh 2018
6
2. Tobacco use
Current tobacco consumption in any form was found in 59.6% men and 28.3% women.
Smoking was habit of 46.6% men and 1.0% women among the respondents. Daily smoker
was 44.4% of men and 0.9% of women. Smoking prevalence was higher among 33-59 years
aged men (51%), and 60-69 years aged women. On an average people started smoking at
17.7 years. The average duration of smoking in the survey population was 23.7 years.
Cigarettes were being smoked by 83.0% and 33.8% responded smoked bidi. Frequencies of
manufactured cigarettes were 7.3 per day and bidi smoking was 13 per day. Overall
prevalence of smokeless tobacco consumption was 27.5% and daily user was 23.9%. There
was no substantial difference between prevalence of smokeless tobacco consumption of men
and women. Consumption of smokeless tobacco was increased with age. Among the
smokeless tobaccos, jarda by 77.3%, sadapata by 28.9% and gul was used by 15% survey
population.
The prevalence of smoking was slightly higher in rural areas (23.0%) than the urban areas
(21.7%). Smokeless tobacco use was slightly more in rural area (31.3%) than urban area
(26.0%). Any form of tobacco consumption smoking or smokeless was done by 65% men and
32.4% women. However, both forms of tobacco were consumed by 12.8% men and 0.4%
women.
3. Diet
a. Fruit and vegetables intake
On an average, fruits were being taken by the survey population 1.6 days a week. Men
consumed fruits more days (1.7 days/week) than women (1.6 days/week). Frequency of
vegetables consumption was5.9 days a week. Consumption of vegetable was higher in
women (6.1 days/week) than men (5.6 days/week). Among the survey population,
consumption of both fruit and vegetables was higher in urban respondents (2 days/ week, 5.9
days/week respectively) than rural (1.3 days/ week, 5.8 days/week respectively).
Regarding quantity of intake, per capita mean consumptions of fruit and vegetables were 0.4
and 2.3 servings per day respectively. Mean number of servings of fruits and/or vegetables
on average per day was 2.6. Considering the minimum requirement of servings of fruits or
vegetables (at least 5 servings per day), 89.6% respondents did not consume adequately on
an average day.
b. Salt Intake
Overall, 48.2% (men 44.9% and women 51.5%) of the respondents were used to always or
often add salt to their food before eating or as they are eating. Usage of salty sauce to their
food was found among 1.8% and processed foods high in salt was taken by 13.5%
respondents. Mean intake of salt was 16.5 grams per day.

STEPS Bangladesh 2018
7
4. Physical activity
Insufficient physical activity (<150 minutes of moderate-intensity activity per week, or
equivalent) was done by 12.3% respondents (men 9.6% and women 14.8%). Among the
respondents, high level physical activities and moderate level physical activities were reported
by 57.7% and 27.2% people. High level physical activity was reported by more men (66.3%)
than women (50.2%) but more women (32.5%) than men (21.2%) were in moderate level
physical activity. Mean total activity time was 193.4 minutes (men 258.7 minutes and women
136.9 minutes. All types of activity time such as work related, transports related etc. were
higher in men compared to women.
5. Alcohol consumption
Alcohol consumption was very low as only 1.5% respondents drank within last 30 days and
3.7% consumed within past 12 months. Alcohol consumption was found more among urban
population than rural in both the respondent who drank within last 30 days (urban 1.6% vs
rural 1%) and among those who consumed within past 12 months (urban 5.0% vs rural 2.5%).
However, 91.4% survey participants were lifetime abstainer of alcohol. This percentage was
higher in rural (94.5%) than urban (90.1%). Among the alcohol users, only 4.2% were daily
drinker. Current drinkers consumed at least one standard drink in each occasion of average
4.8 occasions in past 30 days. Percentage who engaged in heavy episodic drinking (6 or
more drinks on any occasion in the past 30 days) was only 0.5%. Appreciating that, 13.7%
respondents did not consume within last 12 months ago due to health reasons.
6. Obesity
Body mass index (BMI) was ≥25.0 kg/m2 among 25.9% respondents. Based on BMI 5.4%
people were obese (BMI≥ 30 kg/m2) and the proportion was much higher among women
(9.8%) than men (3.3%). About 13% respondents were underweight (BMI<18.5). Men (15.3%)
were found more in underweight category than women.
Among the survey population 31.4% population had increased waist circumference (men ≥94
cm, women ≥80 cm) and 15.2% had substantially increased (men ≥102 cm, women ≥88 cm)
waist circumference. Percentage of women (increased 48.3%, substantially increased 25.9%)
in both cases were much higher than men (increased 12.6%, substantially increased 3.4%).
So, both BMI and central adiposity (waist circumference) was higher among women which
increases risk of NCDs among them.

STEPS Bangladesh 2018
8
7. Blood pressure
Prevalence of self-reported hypertension was 14% in men and 20.0% in women and one-third
(32.9%) of the population never measured their blood pressure. About 26% survey participants
never measured blood pressure (BP). Antihypertensive drugs were being taken by 45.7%
respondents. Reduction of salt was the most common advice of the physicians to the self-
reported hypertensive patients (60.3%).
On spot measurement, 17.3% men and 24.4% women of the survey participants were having
stage I hypertension (BP>140/90 mmHg) and 7.8% had stage II hypertension (BP>160/100
mmHg). Prevalence of hypertension tended to increase with age irrespective of medication
and age. Even with medication 18.2% respondents were hypertensive. Among the
hypertensive 63.2% respondents were not taking any medication.
8. Diabetes mellitus
Around 75% survey population never measured their blood glucose level in lifetime. Self-
reported diabetic patients were 6.6% but only 2.8% were taking medication. Oral medication
was being taken by 57.1% (men 65.0% and women 50.7% and insulin was being taken by
20.3% (men 23.8%) and women 17.4%) respondents. Again 2.2% diabetic people were taking
medication from traditional healer during data collection.
On spot measurement, 8.4% of the respondents were found having raised blood glucose
(≥126mg/dl) and impaired fasting glucose (>110 to 126 mg/dl) was found among 6.2%
respondents. Among the population 1.7 % respondents were having raised blood glucose
those were not diagnosed previously. Again, 2.9 % of the survey population with diagnosed
raised blood glucose previously was not on medication and women (3.5%) were found higher
in proportion than men (2.2%).
9. Total cholesterol
About 94% of the survey population never measured their serum cholesterol level but 3.6% of
them were found to have self-reported raised total cholesterol. Among those with raised total
cholesterol level, 40.8% (men 46.5% and women 34.7%) were taking medications. Again 2.0%
people with raised total cholesterol were taking medication from traditional healer.
On measurement, the mean total cholesterol among the survey population was found 4.4
mmol/L. blood cholesterol ≥190mg/dl was found in 29.4% and ≥240mg/dl was found in 5.6%
of the respondents. High density lipid level <40 mg/dl was found in 74.7% respondents (men
88.6%, women 62.8%). Triglyceride level >180 mg/dl was found 39.8% of the survey
population (men 46.8% and women 33.8%).

STEPS Bangladesh 2018
9
10. Cardiovascular diseases
Cardiovascular diseases were reported by about 11% respondents and women (11.1%) were
found more than men (9.8%). Among the patients, 2.7% (men 3.3% and women 2.2%) were
taking aspirin and 2.1% (men 2.4% and women 1.8%) were taking statin.
11. Oral health
About 39.5% of the respondents had pain or discomfort caused by their teeth or mouth during
the past 12 months. Forty nine percent respondents were used to clean their teeth at least
once a day and the proportion was higher among the18-29 years age group. Toothpaste was
used by 55.7% respondents, of which 47.7% respondents used fluoride containing toothpaste.
12.Cervical Cancer Screening
Cervical cancer screening test was ever done by 6.1% of 30-49 years aged women.
Summary of Combined Risk Factors
Following risk factors were identified in the survey
• Current daily smokers
• Less than 5 servings of fruits & vegetables per day
• Insufficient physical activity
• Overweight (BMI ≥ 25 kg/m2)
• Raised BP (SBP ≥ 140 and/or DBP ≥ 90 mmHg or currently on medication for raised BP)
About 1.9% men and 4% women had none of the above risk factors. Overall, 26.2% people of
18-69 years age had three or more of the above risk factors. The proportion was higher among
the 60-69 years aged people (40.1%) than the 18-29 years aged people (16.5%).
POLICY RECOMMENDATIONS
This second nationally representative survey provides essential information on key indicators
of NCD risk factors and creates an opportunity for policy makers, program managers,
academicians, development partners and researchers to adopt necessary interventions to
combat the burden of NCDs in Bangladesh. Inadequate intake of fruit and vegetables, use of
tobacco, low physical activity, obesity (especially central), high blood pressure, diabetes
mellitus, extra salt intake, dyslipidemia and binge drinking among drinkers are identified risk
factors for NCDs in Bangladeshi adults. Majority (70.9%) has at least one risk factor and
substantial proportion of people have two or more risk factors. Based on these findings, the
specific recommendations are:

STEPS Bangladesh 2018
10
1. To build mass awareness on the risk factors of NCDs, multidimensional and
multilateral collaborative health education interventions are warranted through mass
media, campaigns and school curricula.
2. To raise awareness of the people on non-communicable diseases, comprehensive
population-based approach using community-oriented health care system for NCD
prevention is essential to in Bangladesh.
3. Effective strategies to promote accessibility and availability of fruits and vegetables
round the year for all people should be devised and implemented.
4. To promote empowering environment for physical activity in both urban and rural
settings, appropriate measures should be undertaken, with emphasis on physical
activity, leisure time physical activity in particular,
5. For early detection and treatment of hypertension or high blood pressure, initiatives
and health programs for periodic checkup of blood pressure should be launched
throughout the country.
6. To reduce the prevalence of diabetes mellitus, early diagnosis and prompt treatment
through primary health care system should be established throughout the country.
7. To establish national database on NCD risk factors, digital NCD surveillance system
must be developed under the leadership of relevant public health institute.
8. To reduce tobacco consumption behavior of the people, adequate enforcement of the
Act is necessary. Necessary amendment of the Act is also required to match with the
provisions of WHO Framework Convention on Tobacco Control and close all the loop
holes in the tobacco control program.
9. To prevent obesity and dyslipidemia, relevant health information communication and
health education interventions are indispensable to implement throughout the country
with special emphasis on the urban people.
10. Diseases specific screening programs also should be launched for early detection
NCDs like cervical cancer among the females.
11. To improve oral health status of the people, awareness building interventions on dental
care, oral hygiene and healthcare utilization should be commenced in the country with
special emphasis on the rural people.
12. To reduce the risk of NCDs, drug abuse, alcohol addiction, special measures and
interventions focused on lifestyle modification and behavior change communication
are necessary to be portrayed in the country.

STEPS Bangladesh 2018
11
Bangladesh at a Glance
Bangladesh, officially the People’s Republic of Bangladesh is one of the world’s most
densely populated countries. Bangladesh is situated in a delta of rivers that empty into the
Bay of Bengal and sharing borders with India and Myanmar. Bangladesh has an estimated
total population of 161.4 million
people1 with steadily decreasing
rural population of 63.4% in 20182.
Estimated Gross National Income
per capita (GNI) was 1750 (current
USD) in 20183 and ranked 136
globally in United Nation’s Human
Development Index (0.608) in
20174. The majority of
Bangladeshis are Muslim followed
by Hindus and some Buddhist and
Christians.
The average life expectancy at birth
in Bangladesh is 72 years in 2017
(74 for women, 70 for men)5.
Administratively, Bangladesh is
divided into 8 divisions. Each
division is further sub-divided into
progressively smaller units: districts,
sub-districts (Upazila), unions, wards, and villages. Current existing government health
services include community clinics, union health and family welfare centers, Upazila health
complex, district sadar hospitals, medical college hospitals and specialized hospitals.
1 United Nations. United nations world population prospects 2019. Available from: https://data.worldbank.org/indicator/SP.POP.TOTL?locations=BD Accessed on Dec 4, 2019. 2 The World Bank. Rural population % of total population – estimates based on the United Nations Population Divisions: World Urbanization Prospects. Available from: https://data.worldbank.org/indicator/SP.RUR.TOTL.ZS?locations=BD Accessed on Dec 4, 2019. 3 The World Bank. World Bank national accounts data, and OECD National Accounts data files. Available from: https://data.worldbank.org/indicator/NY.GNP.PCAP.CD?locations=BD. Accessed on Dec 4, 2019 4 United Nations Human Development Programme. Human development index and its components. Available
from: http://hdr.undp.org/en/indicators/137506 Accessed on Dec 4, 2019.
5 The World Bank. United Nations Population Division. World Population Prospects: 2019 Revision. Available from: https://data.worldbank.org/indicator/SP.DYN.LE00.MA.IN?locations=BD . Accessed on Dec 4, 2019.
Map of Bangladesh showing divisions
Source: https://www.mapsofworld.com/bangladesh/bangladesh-political-
map.html

STEPS Bangladesh 2018
12
Chapter 1 Introduction
1.1 Background
The global burden of non-communicable diseases (NCDs) continues to increase, accounting
for 73.4% (41 million) of all deaths in 2017 with the greatest burden occurring in developing
countries with significant health, social and economic consequences6. In Bangladesh, NCDs
are estimated to account for 73.2% of all deaths in 2017. Four main groups of NCDS – CVD
(36.1%), cancers (11.2%), chronic respiratory diseases (9.3%), and diabetes mellitus (5.8%)
– are responsible for majority of theses NCD related deaths7.
The Sustainable Development Goals 3.4
targets to reduce by one-third premature
mortality from NCDs and promote mental
health and well-being8. This is further
supplemented by the Global Action Plan
for the Prevention and Control of NCDs
2013-2020 with 9 voluntary global
targets to be attained by 2025 with 2010
as the reference year (Figure 1.1)9.
Bangladesh has incorporated all 9
targets in its 3-year multisectoral action
plan for 2018-202510.
The key to controlling the global
epidemics of NCDs is primary prevention
based on comprehensive population-
wide programmes. This requires the
identification and surveillance of the most common NCD risk factors identified by the World
Health Organization (WHO) which are shared between most common NCDs: tobacco use,
6 Roth GA, Abate D, Abate KH, et al. Global, regional, and national age-sex-specific mortality for 282 causes of death in 195 countries and territories, 1980–2017: a systematic analysis for the Global Burden of Disease Study 2017. The Lancet. 2018;392(10159):1736-1788. doi:10.1016/S0140-6736(18)32203-7 7 Noncommunicable diseases country profiles 2018. Geneva: World Health Organization; 2018. Licence: CC BY-NC-SA 3.0 IGO. 8 United Nations General Assembly. Transforming our world: the 2030 Agenda for Sustainable Development [Internet] 2015 [Accessed on 2019 Oct 22] Available from: https://sustainabledevelopment.un.org/post2015/transformingourworld 9 World Health Organization. Global action plan for the prevention and control of NCDs 2013-2020. Geneva. 10 Multi-sectorial action plan for prevention and control of non-communicable diseases 2018-2025 (2018). Dhaka: Non-communicable Disease Control Programme, Directorate General of Health Services.
Figure 1.1 Nine targets in Bangladesh Multisectoral Action Plan for the Prevention and Control of NCDs 2014–2020

STEPS Bangladesh 2018
13
harmful use of alcohol, unhealthy diet (low fruits and vegetables consumption, high salt
intake), physical inactivity, overweight and obesity, raised blood pressure, raised blood
glucose and cholesterol.
The WHO STEP-wise approach to noncommunicable disease risk factor surveillance
facilitates countries to track national NCDs status including the 25 key indicators (except the
indicator on NCD mortality and per capital alcohol consumption) highlighted in the NCD
Global Monitoring Framework which will help Bangladesh track progress and guide policy
and program planning in NCD prevention and control11.
1.2 STEP survey and NCD surveillance
STEP surveys are an integral part of nationwide NCD surveillance to track trends in key
NCD risk factors and health system response including service coverage and utilization. As
part of this surveillance system, this is Bangladesh’s 2nd national STEPs survey. The first
national STEP survey conducted in 2010 did not include biochemical measurements. This
second nationwide STEP survey along with biochemical measurement for blood glucose and
lipid profile will help to assess change in key indicators and provide Information that will
guide appropriate programs to reduce death and disabilities from NCDs. National Institute of
Preventative and Social Medicine in Bangladesh implemented the survey with technical
supports of WHO.
1.3 Objectives
General Objective
• To assess the prevalence of selected NCD risk factors among 18-69 years old
population in Bangladesh
Specific Objectives
• To measure the prevalence of behavioral risk factors (tobacco use, harmful use of
alcohol, low fruits and vegetable consumptions, average population salt
consumption, and physical inactivity)
• To measure the prevalence of biological risk factors (raised blood pressure,
overweight, obesity, raised blood glucose and total cholesterol and abnormal blood
lipids)
11 World Health Organization (2017). WHO STEPS Surveillance Manual: The WHO STEPwise approach to chronic disease risk factor surveillance. Geneva, World Health Organization.

STEPS Bangladesh 2018
14
• To assess responses of national health system in terms of coverage with early
detection and treatment of key physiological risk factors (ie. diabetes, hypertension,
tobacco cessation) and cervical cancer screening and source of care.
• To assess the oral health practices of the adult population.
• To assess the coverage, availability and use of cervical cancer screening/testing
services and reasons for not getting screened or treated.

STEPS Bangladesh 2018
15
Chapter 2 Survey Methodology
2.1 Survey design
STEPs- 2018 is a national cross-sectional population-based survey that used multi-stage
cluster sampling design to sample households and eligible adult men and women (18-69
years of age) for interview and physical examination (anthropometry, blood pressure
measurement, blood glucose and cholesterol an urine sample for salt) was adopted.
2.2 Survey population
Survey population included men and women aged 18-69 years who have been the usual
residents of the household for at least six months and have stayed in the household the
night before the survey regardless of citizenship. People with the following characteristics
were not included:
• Those whose primary place of residence was in a military base or group quarters
• Those residing in hospitals, prisons, nursing homes and other institutions
• Those too frail and mentally unfit to participate in the study
• those with any physical disability or were severely ill.
• those unable or unwilling to give informed consent
2.3 Sampling design
Samples were collected by multistage, geographically stratified probability based sampling on
the basis of Primary Sampling Unit (PSU) developed by Bangladesh Bureau of Statistics
(BBS) for census 2011. To ensure generalization and reliability of the survey results to the
entire target population in Bangladesh, the sample size calculator as recommended by WHO
(sample size calculator STEPS) was used to derive a sample size. The sample size was
calculated that is sufficient to produce reliable estimates for all the indicators for men and
women and for 4 age-groups (18-24, 25-39, 40-54, 55-69).
2.3.1 Sample size
The sample size was calculated considering prevalence of different NCD risk factor, relative
precision rate (20%) and feasibility of the survey. Using the prevalence of obesity (based on
BMI), 472 people was required for effective analysis for each group (8 groups: 4 age-groups
and 2 gender categories).To calculate the final sample size, the design effect and non-
response rate at the household and individual level were considered. Considering the findings
of Demographic Health survey and previous BBS surveys, the person non-response rate
shared around 10% and household non-coverage rate around 10%. So, in the proposed
survey, overall 20% non-response rate and design effect of 2 were considered. Initially the
survey considered 496 Primary Sampling Units (PSUs) (248 each from rural and urban area)

STEPS Bangladesh 2018
16
as updated by BBS for GATS survey 2017. But during field work, one PSU was excluded due
to inaccessibility. As a result, the final adjusted sample size is 9,900 adults of 495 PSUs.
1st STEP: sample size by risk factor/condition per group (8 groups: 4 age group, 2 gender
group)
Sample size was calculated12 as follows: 𝑛 = (𝑧^2 )𝑞/(𝑑^2 )𝑝
Where,
p =Proportion of population having events, (here, p=16.9%)
q = Proportion of population having events (1-p) =q (here q=0.831)
z = The value of standard normal variety at a given level (here, 1.96)
r = Relative Precision (Here, r= 20% = 0.20)
Table 2.1: Calculation of initial sample size
Risk Factors/ Conditions
z2 Prevalence (p)
q Relative Precision (r =20%)
n = (z^2*q)/r^2*p
Margin of error (e)
Rounding
Reference for prevalence
Hypertension 3.84 0.208 0.792 0.20 365.5384615 3.7 366 NCD risk factor survey Bangladesh 2010
Diabetes mellitus 3.84 0.056 0.944 0.20 864 2.7 1618 Bulletin of the World Health Organization 2014;92:204-213
Fruit/Veg. <5 Serving
3.84 0.918 0.082 0.20 8.575163399 2.5 9 NCD risk factor survey Bangladesh 2010
Low physical activity 3.84 0.345 0.655 0.20 182.2608696 4.3 182 NCD risk factor survey Bangladesh 2010
Overweight (BMI≥25)
3.84 0.169 0.831 0.20 472.0473373 3.4 472 NCD risk factor survey Bangladesh 2010
Central Obesity 3.84 0.211 0.789 0.20 358.9763033 3.7 360 NCD risk factor survey Bangladesh 2010
Tobacco use 3.84 0.510 0.490 0.20 125.7090069 4.5 92 NCD risk factor survey Bangladesh 2010
High Cholesterol (≥200mg/dl)
3.84 0.013 0.987 0.20 7288.615385 1.1 7290 Zaman MM, Choudhury SR, Ahmed J. Blood Glucose….STEPS 2006 survey
𝑛 = ((〖1.96〗^2 ) ∗ 0.831)/((〖0.2〗^2 ) ∗ 0.169), for each group without taking into account
the non-response and design effect
2nd Step: adjusting for design effect of 2, response rate of 80%, and 8 groups, sample size
was calculated.
𝑛 = (472 ∗ 2 ∗ 8)/0.8 = 9440
One adult was sampled from each sampled household. Twenty households were selected by
systematic random sampling on the basis of estimated sampling interval from each out of 495
PSU. So, the calculated final sample size was = 495*20= 9,900. (sample size a national
level)
12 Lwanga SK, Lemeshow S, World Health Organization. Sample size determination in health studies: a practical manual. Geneva: World Health Organization; 1991..

STEPS Bangladesh 2018
17
The final sample size of the survey was 9,900 adults of Bangladesh, which allows national
estimated disaggregates by gender and 4 main age groups.
2.3.2 Sampling Frame and primary sampling unit
The sampling frame for the survey was the complete list of Primary Sampling Unit (PSU) i.e.
Enumeration Areas (EAs) (about 293,533) covering the whole country prepared by the BBS
for the 2011 Population and Housing Census of the People’s Republic of Bangladesh. A PSU
is a geographic area covering 100 to 220 households with an average of 113 households. The
sampling frame contained information about the PSU location, type of residence (urban or
rural), and the estimated number of residential households. A sketch map that delineates the
PSU geographic boundaries was available for each PSU. The population coverage rate of this
Census 2011 was around 95.85% of the total population. (Annexure A)
A special zonal operation was carried out by BBS before 2011 census in 2010 whereby both
the urban and rural areas were subdivided with updating of mauzas (rural) and
mahallas(urban) maps with demarcation of PSU boundaries comprising of 100 to 120
(average) houses. Thus based on 2011 census, the sampling frame for the survey was about
293,533 PSUs for both rural and urban areas. The urban stratum included urban and city
corporation areas. In Bangladesh, 23.3% of the households are in urban areas; 8.2% are in
city corporations, and 15.1% are in other than city corporations.
A new division has been added in 2014 after conclusion of census 2011. So, all the PSUs in
the 2011 census were mapped out as per the latest divisions. Thus the sampling frame for
STEPS survey 2018 in Bangladesh comprised of 293,533 PSUs: 65,193 urban and 228,340
rural PSUs. Table 2 describes the complete sampling frame by division and by urban and rural
areas.
Table 2.2: Sampling frame used for 2017 STEPS NCD Risk Factor Survey based on Census 2011
Name of Division Rural Urban Total
PSU HHs PSU HH PSU HH
Barishal 14812 1561303 2688 301538 17500 1862841 Chattogram 40019 4211325 12241 1411240 52260 5622565 Dhaka 41249 4600373 27377 3133637 68626 7734010 Khulna 27485 3072496 5646 664774 33131 3737270 Mymensingh 25064 2668255 3650 427080 28714 3095335 Rajshahi 34101 3712882 6599 772370 40700 4485252 Rangpur 29388 3333437 4273 482940 33661 3816377 Sylhet 16222 1511519 2719 278890 18941 1790409 Bangladesh 228340 24671590 65193 7472469 293533 32144059
PSU: Primary sampling unit HH: Household

STEPS Bangladesh 2018
18
Households in this survey was defined according to BBS as “A dwelling in which persons
either related or unrelated living together and taking food from the same kitchen”.
2.3.3 Sampling strategy
This survey used the same 496 PSUs which were sampled and used during a recently
concluded GATS-II survey. In GATS Bangladesh 2017 these PSUs were equally allocated to
each division (62 each), and within each division, were equally allocated to urban and rural
stratum (248 PSUs each to both urban and rural strata). The rural and urban PSUs were
arranged by population size in terms of household numbers for both urban and rural stratum
in each division. In each stratum (rural and urban), 31 PSUs were selected independently in
each division by probability proportional to size (PPS) sampling
Table 2.3: Number of sampled PSUs* and households by division for 2018 STEPS NCD risk factor survey based on Census 2011 sampling frame
Division Rural Urban Total
PSUs HHs PSUs HHs PSUs HHs
Barishal 31 620 31 620 62 1240
Chattogram 30 600 31 620 61 1240
Dhaka 31 620 31 620 62 1240
Khulna 31 620 31 620 62 1240
Mymensingh 31 620 31 620 62 1240
Rajshahi 31 620 31 620 62 1240
Rangpur 31 620 31 620 62 1240
Sylhet 31 620 31 620 62 1240
Total 248 4800 248 4800 496 9900 *Same sampled PSUs as used in Global adult Tobacco Survey Bangladesh 2017, no fresh sampling of PSUs was carried out for this survey
A household listing operation was carried out in all the selected PSUs by BBS during GATS-
II survey in July 2017 was used and no new household listing was carried out for this survey.
As the survey used the same PSUs as used during GATS-II survey, HHs lists prepared by
BBS during GATS-II survey in July 2017 served as sampling frame for the selection of
households in the second stage.
A fixed number of 20 households were systematically selected from each sampled PSU with
an equal probability using a fractional interval technique. Selected households in all the
selected PSUs were randomly assigned as “male” or “female” in a ratio that produced equal
numbers of male and female households. The 20 selected HHs in a PSU were divided into
two groups as 1) male HHs for interview of a male member and 2) female HHs for interview

STEPS Bangladesh 2018
19
of a female member. All the sampled HHs from each PSU were listed sequentially, and
alternate house was assigned as female or male household, with the first household in the list
assigned as female household.
Finally, one individual was sampled randomly from all the eligible adults in a participating
household using the survey app in android tablets. No replacements and no changes of the
pre-selected households were allowed at the implementing stage to prevent bias.
2.4 Data collection tools
The survey was conducted using the WHO NCD STEPS instrument version 3.213. The
questionnaire consisted of three STEPS for measuring the NCD risk factors. Each step
consisted of a number of core, expanded and country specific questions that were modified
to suit local needs. Bangladesh included all core modules and optional modules: oral health
and cervical cancer screening. The questionnaire was translated into Bengali. Validation of
the translated questionnaire was done by back translation. (Annexure B and Annexure C)
STEP I (questionnaire) included:
• Demographic information: date of birth/age, sex, religion, marital status, years at
school, primary occupation, possession of specific household assets ( to compute
household wealth index as a proxy for economic status in place of
income/expenditure).
• Fruit and vegetable consumption
• Dietary salt
• Physical activity
• Tobacco use
• Alcohol consumption, practices, knowledge and perceptions
• Oral health status and care seeking behaviour
• Cervical cancer screening
• History of raised blood pressure, raised blood glucose, and sources of care and
reasons, for non-treatment.
• History of cardiovascular diseases
• Lifestyle advice from health workers
13 World Health Organization. WHO STEPS instrument (core and expanded). Geneva, Switzerland:
WHO URL: https://www.who.int/ncds/surveillance/steps/instrument/STEPS_Instrument_V3.2.pdf

STEPS Bangladesh 2018
20
STEP II included physical measurements: weight, height, waist/hip circumference and blood
pressure.
STEP III included biochemical measurements: fasting blood glucose, total cholesterol, lipid
profile and urine sample for testing of sodium and creatinine levels. (Annexure D)
2.5 Data collection technique
Based on the sampling frame outlined above (2.3 Sampling design), field workers visited the
sampled households with the assistance of registrars from 495 BBS PSU’s to in finding the
selected household . The appointed person was remunerated on daily basis including per
diem and travel allowance. Each household was followed up at least twice in case of non-
availability of the respondents during the first visit. A respondent who could not be contacted
even after the second attempt was counted as a non-response. An interview tracking form
was completed to record brief information about the respondents. If the sampled household
member was present on the first visit, s/he was requested to participate in the study and
written consent was obtained. If s/he was not available at home during the first visit, a
second visit was made. Once the consent was obtained, the STEP I and II questionnaire
were completed, urine container with QR code was assigned. After completing STEPS I and
II. participants were given a feedback form. This form included information on their height,
weight, hip and waist circumference, blood pressure (third reading) and heart rate (third
reading).
An appointment/clinic card was also given to every participant for biochemical measurement
containing fasting instructions. This card contained the appointment date, time and place for
blood glucose and lipid measurement. On the given date and time, the enumerators made
biochemical assessment (Fasting blood glucose and lipid) using cardio-check.
Participants were instructed to fast overnight for 12 hours and diabetic patients on
medication were requested to bring their medicine/insulin with them and take their medicine
after providing the blood sample. To ensure high response rate for STEP3, the enumerators
called the respondents on the day of testing if he/she failed to come as per the appointment.
Similarly, for the purpose of population salt estimation, urine containers with QR code pasted
on them were provided to participants to collect spot urine. The instruction for sport urine
collection was given and asked them to bring the urine sample with them to the appointment
for blood testing the next morning.

STEPS Bangladesh 2018
21
The questionnaire was administered by trained interviewers through face to face interviews
and responses as well as physical measurement were recorded in the survey app (ODK
software) on android tablets. Data from the tablets were submitted to cloud-based server
after completing the data collection.
Assistive pictorial show cards were shown to the participants during the interview to provide
visual references including various tobacco, alcohol products, servings sizes of different
fruits and vegetables (one standard serving of fruit or vegetable equals 80 grams), various
salty sauces and processed foods, various levels of physical activity and sedentary activities
(Annexure E)
2.6 Physical measurements: Anthropometry and blood pressure
2.6.1 Anthropometry
Height, weight, hip and waist circumference were measured for all sampled individuals who
gave their consent for STEP 2.
Height was measured with a portable stadiometer (Seca Measuring Scale 213®). For the
height measurement, respondents were asked to remove footwear (shoes, slippers, sandals)
and any hat or hair ties. Respondents were requested to stand on the stadiometer facing the
interviewer with their feet together and knees straight. They were asked to look straight
ahead and not tilt their head up, making sure that their eyes are at the same level as their
ears. Height was recorded in centimeters.
Weight was measured with portable digital weighing scale (Tanita). The instrument was
place on a firm, flat surface. Participants were requested to remove their footwear and
socks, wear light clothes, stand on the scale with one food on each side of the scale, face
forward, place arms idly at their side and wait until asked to step off. Weight was recorded in
kilograms.
Waist and hip circumference were measured using a constant tension tape (Seca,
Germany). A private area, such as separate room with in the house, was used and the
measurement was taken over light clothing. Waist circumference was taken at the end of a
normal expiration with the arms relaxed at the sides at the midpoint between the lower
margin of the last palpable rib and the top of the iliac crest of hip bone). Hip circumference
was taken at the maximum circumference over the buttocks. Participants were requested to
wrap the tape around them. The measurement was read at the level of the tape to the
nearest 0.1 cm, making sure to keep the measuring tape snug.

STEPS Bangladesh 2018
22
2.6.2 Blood Pressure
Blood pressure and pulse was measured with a digital, automated blood pressure monitor
(BP–BOSO–Medicus Control with universal cuff®) with uniform cuff-size. Before taking the
measurements, participants were asked to sit quietly and rest for 15 minutes with legs
uncrossed. Three readings of the systolic and diastolic blood pressure were obtained.
Participants were requested to rest for three minutes between each reading. The mean of the
second and third readings was calculated. The sphygmomanometer cuff was placed on the
left arm while the participant rests their forearm on a table with the palm facing upward.
Participants were requested to remove or rollup clothing on the arm. The cuff was kept above
the elbow aligning the mark for artery on the cuff with the brachial artery and making sure the
lower edge of the cuff is placed 1.2 to 2.5 cm above the inner side of the elbow joint and with
the level of the cuff at the same level as the heart.
2.7 Biochemical measurements
2.7.1 Blood glucose and lipids
After STEP 1 and STEP 2 of data collection at sampled households, biochemical
assessments were performed the next day at a designated place for each PSU for blood
glucose and total cholesterol, measured in venous blood samples. Concentrations of glucose,
total cholesterol and HDL cholesterol were measured in plasma samples. Fasting samples
were taken to measure raised blood glucose.
Participants were instructed to fast overnight for 12 hours at the time of household visit for
Step I and II. During the appointment, participant was asked to sit in comfortable position with
exposing forearm in a table or if patient could not sit in that case at supine position. If the
technician was not able to collect blood despite two attempts, he/she didn’t try to attempt the
3rd prick, and just recorded the reason for non-collection of sample in laboratory and interview
tracking sheet. Each participant was given 50 taka and made him / her rest and then allowed
to go).
The ante-cubital fossa was cleaned with disinfectant (70% alcohol) and identified the ante-
cubital vein. Then 5ml of blood will be collected by disposable syringe. 2 ml of this blood was
transferred to Fluoride-oxalate vacutainer (brown top) for serum glucose testing and 3 ml of
the blood was kept in a normal tube and allowed to stand for separation of plasma (for lipid
profile) with proper labeling. The sample for blood glucose was left in upright position in
vacutainer rack and then centrifuged and separated serum was keep in the cold box (2–80C)
surrounded by ice packs and sent to the NIPSOM Lab within 24 hours.

STEPS Bangladesh 2018
23
Each sample tube was labeled with the participant identification number using autogenerated
ID tablet, as automatically generated during the questionnaire administration. The medical
technologist labeled the laboratory ID (Based on PSU and HH number) against the
corresponding participant ID on the appointment card following their lists.
Disposable sterile gloves in multiple sizes: The medical technologist and lab staffs used sterile
gloves during blood collection from the participant. Each time the medical technologist washed
his/her hands including gloves with Chlorhexidine Gluconate (0.5%) and Isopropyl alcohol (70%)
(Hexisol®) and collect blood sample with sterile syringes and needles. A single-use disposable
needles, and syringes or lancing devices were in sufficient numbers to ensure that each
patient has a sterile needle and collection device or equivalent for each blood sampling. All
the used syringes and all other used materials were collected in a supplied biohazard bag.
The needles were stored in hard plastic container/box. All the medical wastes created for
sample collections were sent within biohazard bag to NIPSOM. Finally all the medical wastes
were disposed centrally scientifically by PRISM14, the specific agency concerned with
management of biomedical wastes. NIPSOM had an agreement with PRISM for management
of all laboratory and biomedical wastes. Sufficient laboratory sample tubes were supplied to
prevent reuse and manual washing.
Immediately after reaching to the NIPSOM laboratory, the samples were properly registered
with lab ID and sent for measuring blood glucose, lipid profile with biochemistry auto analyzer
(Selectrao Pro M) for blood glucose, Human®, Germany; for HDL with control, Elitech®; TG,
Elitech®; with control, Humatrol/ serodos®; cholesterol, Elitech® with control Humatrol®,
Germany.
2.7.2 Spot urine testing for estimation of 24-hour salt intake
Spot urine collection was done to identify the level of sodium (Na), potassium (K) and
creatinine.
Spot urine sample collection process
Urine sample were collected from all respondents age 18–69 who consented to STEP 3-
biochemical measures component of the survey. Respondents were excluded if they were
pregnant; were fasting before collecting the urine sample; have contaminated urine samples
14 PRISM Bangladesh Foundation. Aims and Objectives. [Internet].2020. [Cited: 22 March 2020] Available from: http://pbf.org.bd/

STEPS Bangladesh 2018
24
with blood. Urine samples were self-collected by respondents the night of the survey
interview at home before fasting for blood sample collection the next day during their
scheduled appointment. The respondents were requested to void into the urine containers
provided, fill half of the container and record time of collection. Instructions were given to
store the sample in a cool, dark place without direct sunlight before they brought the sample
container to the collection centre the next morning during their appointment. Urine analysis
was conducted at NIPSOM using reagent: Easylyte plus® 400mL solution pack® with the
analyzer: Easylyte plus Na/K/Cl analyzer® by Medica Corporation, USA. Urine samples
were matched with respondents using identification number attached to each urine sample
that corresponds to respondent’s unique identification number. Sodium data was received in
units of mmol/L, while creatinine was received in mg/dl.
24-h salt intake estimation
The STEPs survey utilizes spot urine sample as a proxy to 24h urine samples for the
estimation of mean population salt intake. WHO has long supported the use of 24 hour urine
sample as the preferred method for the assessment of population mean salt intake, despite
so, the challenges faced during sample collection due to high participant burden has
significantly reduced the use of the tool. The relative convenience of spot urine samples
have provided a more appealing alternative. Current literature supports the use of spot urine
samples to estimating mean population salt intake1. Three main studies developed the
estimation of 24-h urinary sodium intake from spot urine samples that are used in our STEP
survey: Kawasaki2, INTERSALT3and Tanaka4. However, limited evidence support the
preferential use of one equation over another in a given population/context. Hence, to
facilitate comparison of results and assessment of trends, equations used in previous survey
rounds was maintained in current survey round. This is the first year urinary salt was
measured in the Bangladesh STEPs Survey and the Tanaka equation was used.
Tanaka equation
21.98 × (𝑁𝑎𝑠𝑝𝑜𝑡(𝑚𝑚𝑜𝑙/𝐿)/(𝐶𝑟𝑠𝑝𝑜𝑡(𝑚𝑔/𝑑𝐿) ∗ 10) × 𝑃𝑟𝑈𝑋𝑟24ℎ(𝑚𝑔/𝑑𝑎𝑦))^0.392
𝑃𝑟𝑈𝐶𝑟24ℎ = 14.89 × 𝑊𝑒𝑖𝑔ℎ𝑡(𝑘𝑔) + 16.14 × 𝐻𝑒𝑖𝑔ℎ𝑡(𝑐𝑚) − 2.04 × 𝐴𝑔𝑒(𝑦𝑒𝑎𝑟) − 2244.45
Additional information that are required by the equations include respondent weight, height,
age, sex. When conversion of creatinine from mg/dl to mmol/L was called for, creatinine in
mg/dl was multiplied with a conversion factor of 0.00884. The equations above derive 24
hour sodium intake, which is then converted to salt intake by the division of 17.1 (or
multiplication of 2.54/1000*23) as a conversion factor to obtain the final estimated salt intake
of interest in grams.

STEPS Bangladesh 2018
25
2.8 Quality assurance and pretest
This study adopted the validated WHO STEPs instrument version 3.2.13 The survey protocol
development followed standard format of WHO with explicit explanations of all scientific
issues. Extensive literature review was done to develop the survey protocol. The protocol was
finalized through workshop presentation and reviewing with WHO. All members of the field
team were extensively trained on the research objectives, research design and methods, data
collection instruments and techniques (see below). Data collection instruments were pre-
tested and corrected as per requirements. The instruments were translated into Bangla and
was back translated and validated among the adults of similar urban and rural communities.
The android devices were programmed with the help of WHO technical advisors and were
used for data collection after extensive pretesting.
2.9 Staff and Field work
Staff
The technical committee of the survey was composed of one coordinator, two co-principal
investigators and ten co-investigators. In addition to that one finance and budget officer, one
IT-cum data manger, one data analyst was recruited in the survey. Investigators were involved
in planning and conduction of the study. Field supervisors, responsible for coordination and
supervision of field work, all had previous experience in conducting community based surveys
with a minimum of a graduate degree that were selected by written tests and interviews.
Enumerators who had a minimum of a graduate degree, and qualified laboratory technologist
were recruited. In whole, the field staff body included 30 field supervisor, 60 enumerator, and
30 laboratory technologist forming a total of 30 field teams.
All field staff undergone an extensive 3-day-training at NIPSON on survey protocol
questionnaire, field procedure manual, interview technique, physical measurements, aseptic
collection, storage and transportation of blood and urine samples, super vision of field
activities, safety of subjects, privacy, confidentiality and data collection by WHO technical
experts between Feb 17-22, 2018.
Field work
Field work was carried out between March to May in 2018. Each field team comprised of 1
field supervisor, 2 enumerators (one male and one female) and one laboratory technologist.
Each team surveyed 16–17 PSU and visited on average 330 households and conducted the
similar number of surveys. Each team was supplied with 2 android tablets. Each team

STEPS Bangladesh 2018
26
completed field work in 1 PSU within 4 days with interview/visit of 5 households per day. Two
recall visits were done for each participant for Step1 and Step2.
2.10 Quality control
To ensure quality of data, quality control procedures were put in place through regular field
supervision of interviews and daily review of collected data. Trained medical technologist
collected the biomedical samples for the participant following standard guidelines. On the day
before sample collection, the enumerator/medical technologist provided detailed instructions
regarding urine sample collection and fasting blood sample and provide urine container to
each participant. They motivated the participant to collect the samples following standard
procedure and instruments.
Laboratory instruments were calibrated following standard procedure and the findings were
validated with the same sample findings of other standard national laboratory. The blood and
urine samples were tested in the NIPSOM central laboratory dividing the sample samples into
multiple samples and same samples in multiples times to compare the findings and to validate
the instruments and procedure.
To ensure accurate findings of the biochemical samples; pretesting was done in both urban
and rural areas from where samples were sent to NIPSOM laboratory. Accordingly samples
were received at different time’s interval after collection and were tested in different time
period. The findings of different times were also be compared and on the basis of this; samples
were sent at the NIPSOM laboratory within short possible time (Within 24 hours).
2.11 Data processing and analysis
2.11.1 Data management and processing
The survey data was entered directly in the ODK software on the PDAs. As soon as data entry
for STEPS 1 and 2 and STEPs 3 was completed, data were sent electronically and stored in
ONA data base server. The same applied to urine test results. Frequent monitoring and
supervision was done during data collection period. Furthermore, field team uploaded the data
on daily basis to the server and the data were downloaded at central office for consistency
check. The central data management team checked the data for any inconsistencies and
incompleteness. The enumerators were alerted and advice in every steps of data collection
and provide guidance if any inconsistency persist. The data stored were downloaded into
Microsoft Excel® format. Each survey participants had a unique identifier QR-code and
personal identification number (PID) which was used for merging data for steps 1,2,3 and
urine data. Once the survey was completed the data were cleaned and analyzed according to

STEPS Bangladesh 2018
27
guidelines of WHO STEP wise approach to surveillance. For the validity of study, all steps
were followed as per the guideline of WHO STEP wise approach to surveillance.
2.11.2 Data analysis
Data analysis was primarily performed using STATA version 15.0 and Epi Info version 3.4 was
used as a reference for programming purposes and cross-validation of STATA outputs, with
appropriate methods for the complex sample design of the survey. The prevalence and
measures of central tendency of NCD risk factors were estimated. Outcome measures
(prevalence and mean variance) and differences between groups were calculated with a 95%
confidence interval. Data analysis and report writing was carried out by the NIPSOM team.
2.12 Response rates
Survey could be done in 495 PSUs. One PSU could not be visited due to movement
restrictions imposed by the local authority. A total of 9162 households out of 9353 eligible
households participated (response proportion: 0.98). In next step, 8185 individuals completed
the step-1 and 2 out of 8423 eligible subjects (response proportion: (0.972). Finally, 7065
completed step-3 (response proportion: 0.863). Therefore, the overall response rate was
(0.98*0.863) 84.6%.
Table 2.4: Disposition codes for household roster, steps 1, 2 and 3.
2.13 Ethical considerations
The survey was conducted maintaining all possible ethical considerations. Ethical approval for
the study was obtained from Bangladesh Medical Research Council (BMRC). Informed written
Level/Step Number
Household level: Roster completed 9162 Not a household 11 Group accommodation 40 Locked/vacant 431 Broken household 65 Others 104 Refused 87 Total 9900
Individual level: Step 1 and 2 -
Completed 8185 No eligible respondent 739 Incomplete Refused 39 Refused 199
Step 3 - Blood collection 7056

STEPS Bangladesh 2018
28
consent form was obtained from all participants prior to collection of survey data or specimens.
Detailed study related information were read out and explained in the local language from a
printed handout including information on objectives, methods of the study, duration, frequency,
physical measurement and biochemical measurements, risks & benefits of the study. Finger
impressions were obtained from the participant who can’t sign.
The information were dealt with highest confidentiality and was used only for this study.
Privacy of the respondents was maintained during data collection and no physical harm or risk
on the study population occurred as no hazardous procedure were involved in the survey.
Before data collection, formal permission was also obtained from the respective community
leaders.
Additionally, every participant was provided 50 taka, after the fasting blood collection to buy
breakfast. The participants were offered due respect and they were given full freedom to
withdraw their consent of participation at any stage of the study.
Respondents were also informed about their anthropometry and test results (BMI, BP, fasting
blood glucose and total cholesterol). Respondents with out of range values were advised and
referred to nearby health facilities for further evaluation and necessary care in writing through
a courier/mail. An educational sheet on the best practices on diet, salt consumption, tobacco
and alcohol use, and physical activity was given to each participant after completion of data
collection in all steps. It was given to raise their awareness of the participants regarding major
NCD risk factors and to encourage healthy lifestyle.

STEPS Bangladesh 2018
29
Results
Chapter 3 Characteristics of respondents and households
Key findings
o Age: two-thirds of all respondents were less than 40 years of age.
o Marital status: 85.5% of women and 79.8% of men were currently married, while 4.9%
of women and 20.0% of men have never married.
o Education: 44.1% of respondents have either no education or less than primary followed
by 34.8% have completed primary level, more than one-tenth (12.1%) have attained
secondary, and 8.7% completed higher secondary education or university level.
o Occupation: 9.1% of women and 63.5% of men were currently employed either in
government or private jobs.
o Religion: 87.3% of respondents belonged to Islam and 11.9% were Hindu.
o Household wealth: A vast majority (89.4%) of households in the country have access to
electricity and own a mobile phone (96.7%). Dhaka division have the highest proportion
of individuals in the wealthiest quintile and lowest proportion was observed in Rangpur
division.
Introduction
This chapter presents information on demographic and socioeconomic characteristics of the
survey respondents such as age, education, place of residence, marital status, occupation
and wealth status; and of household characteristics (in terms of household possessions).
This information is useful in understanding the epidemiology of NCD risk factors and factors
that affect health care seeking and other behaviors as well prevalence of health inequities.
3.1 Basic characteristics of survey respondents
The 2018 STEPS Survey interviewed 4,381 women and 3,804 men age 18-69 years. Nearly
two-thirds (63.7%) of the respondents were less than 40 years of age. A majority of women
(85.5%) and men (79.8%) were currently married, while 4.9% of women and 20.0% of men
were never married. 9.6% of women and 0.3% of men were divorced, separated or widowed.
More than three-fourth (78.5%) of respondent lived in rural areas whereas 21.5% of them
from urban (Table 3.1).
Most of the respondents belonged to Islam (87.3%) religion, 11.9% were Hindu followed by
0.3% Christian and 0.6% Buddhist respondents (Table 3.5)

STEPS Bangladesh 2018
30
3.2 Education
Nearly half (44.1%) of adults reported that they haven’t had formal schooling or not
completed primary level, more than one-third (34.8%) had completed primary-level of
education whereas more than one-tenth (12.1%) of adults completed secondary level of
education while only 8.7% were having higher than secondary education (Table 3.1).
Patterns by background characteristics (Table 3.2)
• Age and educational level: An inverse relationship was seen between level of
education and age, with younger age-cohorts less likely to report no education or
less than primary education (18.5% in 18-24 years versus 64.4% in 40-54 years and
72.8% in 55-69 years age group).
• Household wealth and educational level: The likelihood of no formal schooling or less
than primary education decreased with increasing wealth from 70.2% of respondents
in lowest wealth quintile to 16.8% in the highest wealth quintile. The reverse
relationship was seen with secondary and more than secondary education as well as.
• Residence and educational level: Adults who lived in rural were more likely report
lower education levels. Nearly half (47%) of adults in rural areas reported no
education or incomplete primary-level compared to 32.9% in urban areas. The similar
inverse difference was seen in the secondary and more than secondary level
education in these areas.
3.3 Employment
More than half of men (63.5%) and 9.1% of women - overall 35.9% - were currently
employed either as government, non-governmental or self-employed. Overall 10.9% of
respondents (21.8% men and 0.3% women) were businessman either small or big. 0.8% of
women and 3.5% of men were unemployed. Overall 43.7% (85.9% of women and 0.3% of
men) reported as homemakers. (Table 3.2)
Patterns by background characteristics (Table 3.2)
• Age, sex and occupational status: Respondents at the lowest of age group (18-24
years) were less likely to be report being employed. Highest proportion of
respondents reported being employed in two age groups (25-39 and 40-54 years).
More men reported as being employed (63.5%) than women (9.1%).
• Household wealth and occupation status: Overall, the likelihood of being employed
increased with increasing wealth from 39.3% of respondents in lowest wealth quintile
to 42.8% in the middle wealth quintile, however then decreased from 32.1% in fourth

STEPS Bangladesh 2018
31
wealth quantile to 25.4% in highest wealth quintile. The likelihood of being a
businessman increased with household wealth index. The reverse relationship was
seen with being a home-maker.
• Residence and occupational status: There was no significant different in being
employed by rural/urban residence (36.6% in rural and 36.7% in urban). By division,
the likelihood of being employed varied from 29.4% in Barishal to 40.0% in Rajshahi
and Sylhet.
3.4 Household characteristics and assets (Table 3.3)
The survey collected data on type of household roof, access to electricity, and selected
household durable goods (mobile phones, televisions, radio) and means of transportation to
assess the overall household wealth. In addition to this survey also collected data on family
type. Nearly three-fourth (71.6%) of respondent reported living as nuclear family and 28.5%
of respondents in joint family. A vast majority (89.4%) of households in the country have
access to electricity (96.3% in urban and 87.4% in rural). A variety of roofing materials are
used in households - the most common being Tin/Tiles (81.3%), cement/concrete (16.4%)
and katcha - Bamboo/Thatched/Straw/Gunny (2.3%).
Household cosumer goods:
Almost all houshoeld (96.7%) have at least one mobile phone, however only 0.5% of
households have fixed land-line telephones (0.1% in rural and 1.9% in urban). Overall more
than half (52.7%) of housholds reported to own a TV, while the ownership of TV is much
higer among urban compared to rural households (78.9% versus 45.9%). The ownership
pattern of TV increased with increasing wealth from 6.6% of respondents in lowest wealth
quintile to 93.1% in the highest wealth quintile. Only 6.7% of households reported having a
computer/laptop/tablet, much higher in the urban (15.5%) than in the rural
households(4.1%).
3.5 Household wealth index
Household wealth assessed on the basis of selected household characteristics (e.g. type of
roof, access to electricity), mean of transporation used and possession of seleceted
consumer good was used as indicator of economic status rather than direct assessment of
household income or other traditional measurs of income--consumtion/expenditure levels, as
the former is easier to assess in household surveys and was found to be valid marker of
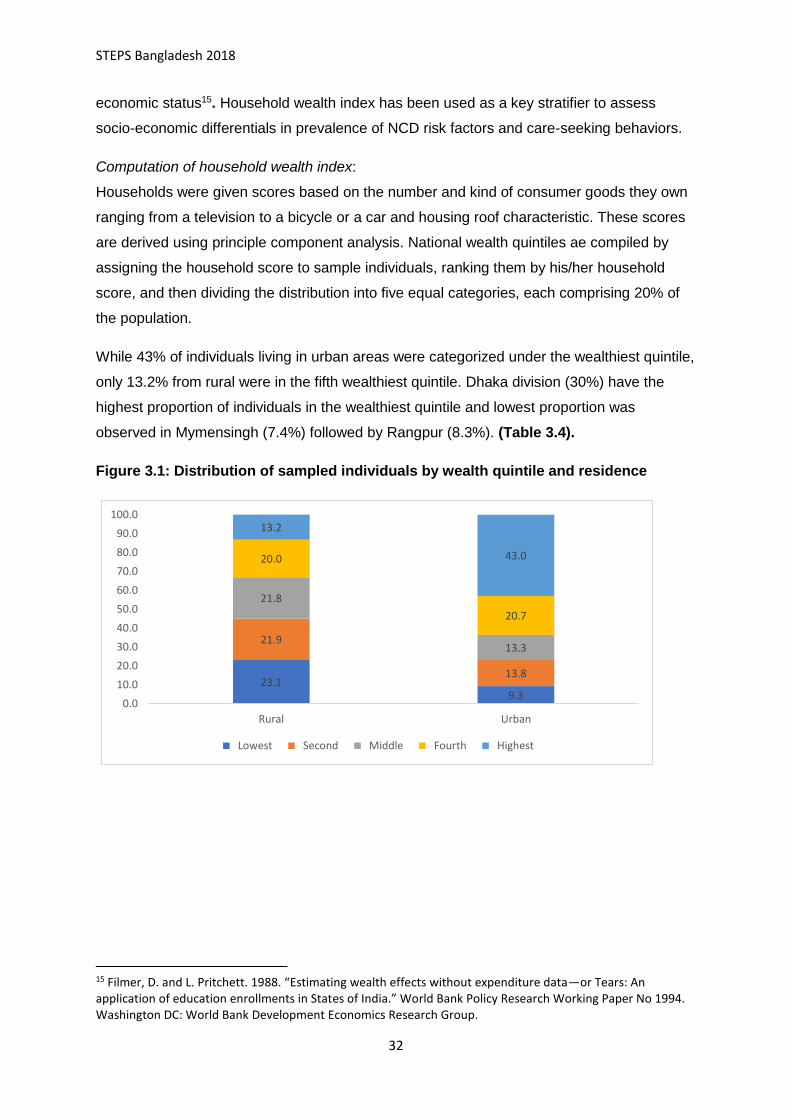
STEPS Bangladesh 2018
32
economic status15. Household wealth index has been used as a key stratifier to assess
socio-economic differentials in prevalence of NCD risk factors and care-seeking behaviors.
Computation of household wealth index:
Households were given scores based on the number and kind of consumer goods they own
ranging from a television to a bicycle or a car and housing roof characteristic. These scores
are derived using principle component analysis. National wealth quintiles ae compiled by
assigning the household score to sample individuals, ranking them by his/her household
score, and then dividing the distribution into five equal categories, each comprising 20% of
the population.
While 43% of individuals living in urban areas were categorized under the wealthiest quintile,
only 13.2% from rural were in the fifth wealthiest quintile. Dhaka division (30%) have the
highest proportion of individuals in the wealthiest quintile and lowest proportion was
observed in Mymensingh (7.4%) followed by Rangpur (8.3%). (Table 3.4).
Figure 3.1: Distribution of sampled individuals by wealth quintile and residence
15 Filmer, D. and L. Pritchett. 1988. “Estimating wealth effects without expenditure data—or Tears: An application of education enrollments in States of India.” World Bank Policy Research Working Paper No 1994. Washington DC: World Bank Development Economics Research Group.
23.19.3
21.9
13.8
21.8
13.3
20.0
20.7
13.2
43.0
0.0
10.0
20.0
30.0
40.0
50.0
60.0
70.0
80.0
90.0
100.0
Rural Urban
Lowest Second Middle Fourth Highest

STEPS Bangladesh 2018
33
Figure 3.2: Percent of households in the poorest quintile by division.
List of Tables:
For more information on background characteristics, see the following tables:
Table 3.1 Percent distribution of respondents age 18-69 by selected background
characteristics and sex.
Table 3.2 Educational and occupational status of respondents by selected background
characteristics.
Table 3.3 household characteristics based on roofing material and other household assets
by residence and household wealth quintile.
Table 3.4 Percent distribution of sampled individual in different wealth quintiles by residence
and province
Table 3.5 Percent distribution of households by religion
25.2
8.7
14.2
19.3
30.8
28.2
36.6
18.6

STEPS Bangladesh 2018
34
Table 3.1 Background characteristics of respondents by sex
Percent distribution of respondents age 18-69 by selected background characteristics, [Bangladesh STEPs, 2018]
Background characteristic Women
Men
Total
Weighted %
n
weighted %
n
weighted %
n
Age
18-24 25.8 621
22.1 405
23.9 1026 25-39 40.1 2019
39.4 1470
39.7 3489
40-54 19.5 1284
19.9 1219
19.7 2503 55-69 14.7 457
18.7 710
16.6 1167
Residence
Rural 78.5 2264
76.5 1919
77.5 4183 Urban 21.5 2117
23.5 1885
22.5 4002
Division
Barishal 5.7 540
5.5 446
5.6 986 Chattogram 22.0 552
18.8 501
20.4 1053
Dhaka Rural 23.8 520
25.5 477
24.6 997 Khulna 11.1 560
11.9 480
11.5 1040
Mymensingh 9.1 552
7.9 469
8.5 1021 Rajshahi 12.0 569
14.0 497
13.0 1066
Rangpur 9.6 543
10.1 466
9.9 1009 Sylhet 6.7 545
6.3 468
6.5 1013
Marital status
Never married 4.9 125
20.0 410
12.3 535 Currently married 85.5 3865
79.8 3385
82.7 7250
Ever married1 9.6 391
0.3 9
5.0 400 Education
No education/less than primary 44.1 1960
43.5 1718
43.8 3678 Primary 34.8 1525
27.2 1008
31.0 2533
Secondary 12.1 434
13.1 454
12.6 888 More than secondary 8.7 441
16.3 624
12.5 1065
Wealth quintile
Lowest 22.4 978
17.6 661
20.0 1639 Second 20.3 912
19.9 758
20.1 1670
Middle 17.1 725
22.8 726
19.9 1451 Fourth 19.2 718
21.1 788
20.1 1506
Highest 21.1 1048
18.7 871
19.9 1919 Total (18-69)
4381
3804
8185
1 Separated/Divorced/Widowed

STEPS Bangladesh 2018
35
Table 3.2 Educational and occupation status of respondents
Percent distribution of educational and occupational status of respondents age 18-69 by selected background characteristics, [Bangladesh STEPs, 2018]
Background characteristic
Education
Occupation
n No education/ less
than primary Primary Secondary More than
secondary
Employed1 Businessman2 Student Homemaker Unemployed3 Others4
Age
18-24 18.5 36.2 23.2 22.2
24.0 5.9 23.8 44.3 2.0 0.0
1026 25-39 36.7 39.5 11.9 11.8
40.4 13.0 1.0 44.2 1.0 0.4
3489
40-54 64.4 21.9 6.0 7.3
40.1 13.4 0.0 44.8 1.0 0.7
2503 55-69 72.8 14.3 6.7 6.2
37.2 9.8 0.0 40.3 6.5 6.1
1167
Sex
Women 44.1 34.8 12.1 8.7
9.1 0.3 3.5 85.9 0.8 0.6 4381 Men 43.5 27.2 13.1 16.3
63.5 21.8 8.8 0.3 3.5 2.1 3804
Residence
Rural 47.0 32.0 10.8 10.1
35.6 10.1 5.4 45.7 2.1 1.0 4183
Urban 32.9 27.8 18.6 20.7
36.7 13.3 8.4 36.9 2.3 2.3 4002 Division
Barishal 39.0 35.2 13.4 12.5
29.4 9.6 8.8 47.2 3.3 1.7
986 Chattogram 43.5 31.7 13.3 11.5
32.5 11.2 3.8 48.8 3.2 0.5
1053
Dhaka Rural 39.5 29.4 17.5 13.6
37.6 12.4 6.1 39.5 2.3 2.1
997 Khulna 38.6 37.7 11.4 12.4
35.6 11.3 8.4 42.2 1.5 1.1
1040
Mymensingh 57.1 25.2 4.9 12.4
35.4 8.7 5.5 47.5 1.3 1.5
1021 Rajshahi 47.6 26.5 12.2 13.7
40.0 10.7 6.7 40.6 1.1 0.7
1066
Rangpur 49.5 29.9 9.3 11.3
40.0 9.5 5.9 44.0 0.1 0.6
1009 Sylhet 40.8 38.1 8.8 10.8
32.3 9.2 6.6 44.4 4.8 2.9
1013
Marital status
Never married 14.7 25.2 22.9 37.1
31.2 12.5 45.3 5.9 5.0 0.1
535 Currently married 46.2 32.7 11.5 9.5
37.9 11.2 0.6 47.2 1.7 1.4
7250
Ever married5 75.4 17.6 5.4 1.0
14.9 0.8 0.3 78.8 3.0 2.3
400 Wealth quintile
Lowest 70.2 20.8 5.6 3.2
39.3 6.0 2.3 50.3 1.3 0.7
1639 Second 58.4 28.5 8.6 4.2
39.8 7.4 4.5 45.6 2.0 0.7
1670
Middle 38.9 40.3 11.0 9.7
42.8 11.6 6.6 35.0 3.0 1.0
1451 Fourth 34.5 35.4 15.2 14.9
32.1 14.9 6.8 42.8 2.3 1.1
1506
Highest 16.8 30.2 22.5 30.6
25.4 14.4 10.3 44.7 2.1 3.1
1919 Total (18-69) 43.8 31.0 12.6 12.5
35.9 10.9 6.1 43.7 2.1 1.3
1 Government/Non-Government/Self-Employed/Labourer; 2 Small/Large business; 3 Able to work/Unable to work; 4 Retried, Others; 5 Separated/Divorced/Widowed
STEPS Bangladesh 2018
36
Table 3.3 Characteristics of sampled households
Percentage of households having different roof types and household possessions by residence and household wealth quintile, [Bangladesh STEPs, 2018]
Household characteristic Residence
Wealth quintile
Total
Rural Urban Lowest Second Middle Fourth Highest
Weighted % n
Roofing material
Katcha1 2.7 1.1
3.0 4.0 2.8 1.3 0.6
2.3 185 Tin/Tiles 87.6 59.4
96.6 95.4 94.8 89.1 30.2
81.3 6411
Cement/Concrete 9.7 39.5
0.4 0.6 2.4 9.6 69.2
16.4 1589 Family type
Nuclear family 70.3 75.9
77.1 75.6 72.4 69.4 63.2
71.6 6653 Joint family 29.7 24.1
22.9 24.4 27.6 30.6 36.8
28.5 1532
Household possessions
Electricity 87.4 96.3
64.3 88.4 95.5 99.0 99.8
89.4 7400 Flush toilet 20.7 30.3
2.9 8.2 19.6 29.6 54.2
22.8 1700
Land Phone 0.1 1.9
0.1 0.1 0.2 0.2 2.0
0.5 69 Mobile phone 96.6 97.3
87.5 98.1 99.1 99.5 99.5
96.7 7846
Television 45.9 75.9
6.6 25.1 54.8 83.9 93.1
52.7 4552 Refrigerator 24.5 52.4
0.3 1.0 9.4 54.5 88.7
30.7 2729
Washing machine 0.2 1.7
0.0 0.0 0.0 0.1 2.4
0.5 61 Sewing machine 12.4 18.8
1.7 5.4 12.8 17.5 31.8
13.8 1166
Almirah / wardrobe 56.4 70.8
8.6 35.1 69.9 88.5 96.5
59.6 4673 Table 84.7 85.4
49.9 86.7 91.7 97.2 98.7
84.8 6990
Khat/ Chowki 98.8 98.6
94.9 99.4 99.8 99.8 100.0
98.8 8063 Chair or Bench 93.5 89.9
76.7 93.8 96.1 97.8 99.2
92.7 7571
Watch or Clock 37.4 57.2
3.3 17.8 44.3 60.4 84.0
41.9 3504 Computer/ Laptop/Tab 4.1 15.5
0.1 0.1 1.5 4.0 28.0
6.7 694
Means of transport
Bicycle 34.6 20.1
28.5 31.8 38.3 31.5 26.6
31.3 2377 Moped/scooter/motorcycle/Auto-Rickshaw 10.9 12.8
0.5 5.5 10.4 15.1 25.4
11.4 953
Car 0.3 1.4
0.0 0.0 0.1 0.2 2.3
0.5 51 Shallow Machine/Power Tiller/Tractor 9.4 2.4
7.0 5.5 10.6 8.1 8.2
7.9 448
Rickshaw 1.3 1.6
3.6 1.0 1.8 0.2 0.3
1.4 152 Ownership of domestic animal2 51.0 15.2
62.2 41.7 52.9 35.5 22.5
43.0 2874
1 Bamboo/Thatched/Straw/Gunny 2 Cow/ Buffalo/ Goat

STEPS Bangladesh 2018
37
Table 3.4: Household Wealth quintiles
Percentage distribution of the sampled individuals in different wealth quintiles by residence and division, [Bangladesh STEPs, 2018]
Residence/ Division
Wealth quintile
Lowest Second Middle Fourth Highest
Residence
Rural 23.1 21.9 21.8 20.0 13.2
Urban 9.3 13.8 13.3 20.7 43.0
Division
Barishal 25.2 30.5 14.5 13.7 16.1
Chattogram 8.7 19.3 21.5 29.4 21.0
Dhaka Rural 14.2 13.9 18.7 23.3 30.0
Khulna 19.3 18.3 22.4 19.5 20.5
Mymensingh 30.8 26.1 19.9 15.8 7.4
Rajshahi 28.2 21.1 18.2 16.3 16.3
Rangpur 36.6 25.2 19.6 10.3 8.3
Sylhet 18.6 22.9 23.5 13.9 21.1
Table 3.5: Religion
Percentage distribution of the sampled individuals by religion, residence and division [Bangladesh STEPs, 2018]
Residence/ Division
Religion
Islam Hindu Christian Buddhist Total
Residence
Rural 87.2 11.9 0.3 0.6 100.0
Urban 87.5 11.9 0.2 0.4 100.0
Division
Barishal 88.1 11.8 0.2 0.0 100.0
Chattogram 81.0 16.3 0.0 2.7 100.0
Dhaka Rural 91.4 8.6 0.1 0.0 100.0
Khulna 83.3 16.5 0.2 0.0 100.0
Mymensingh 92.6 7.3 0.2 0.0 100.0
Rajshahi 93.2 6.8 0.0 0.0 100.0
Rangpur 78.7 19.1 2.0 0.2 100.0
Sylhet 92.3 7.7 0.0 0.0
Total (%) 87.3 11.9 0.3 0.6 100.0
Total (n) 7124 994 33 34 8185

STEPS Bangladesh 2018
38
Chapter 4 Tobacco
Key findings
Tobacco use
• In 2018, 43.7% of adults aged 18-69 years (59.6 % men,
28.3% women) currently used any tobacco product (smoked or
smokeless).
• 23.5% of adults (46.6 % men, 1% women) were current
tobacco smokers and 27.5% (26.9 % men, 28.1% women)
were current users of any smokeless tobacco product and
7.2% of adults used both smoke and smokeless tobacco
products
Tobacco use status
• In the overall population, 69.6% adults never smoked tobacco,
7% smoked formerly (5.8%-daily and 1.2%-non-daily) and
23.5% were current smokers (22.3%-daily and 1.2%-non-daily). 69.9% of the adults
never used smokeless tobacco, 2.7% used formerly and 27.49% were current users of
smokeless tobacco (23.9% daily and 3.6% non-daily).
Type of Tobacco products used
Smoked tobacco products
• In the overall population, 23.3% of adults smoked cigarettes, 7.6% smoked bidis, and
less than 1% smoked products like pipes, cigars, hookah/dhaba and shisha. (0.8%
smoked pipes/cigars/cigarellos and 0.3% smoked hookah/dhaba/shisha).
• Amongst the current users, cigarettes and bidis were the most commonly used smoked
tobacco products reported by 99.3% and 32.5% of current tobacco smokers,
respectively.
Smokeless tobacco products
• In the overall population, 20.2% adults use betel quid with zarda (bqz), 7.8% reported
using betel quid with sadapata (bqs), 2,5% reported using pan masala with tobacco,
3.8% reported using gul and about 3.2% reported using other smokeless tobacco
products (khoinee, sadapata chewing and nossi).
• Amongst the current users of smokeless tobacco,73.4% reported using bqz, followed by
28.2% of the users consuming bqs, 13.7% using gul and 9.2% using pan masala with
tobacco.
Age at initiation of tobacco use
• The average age at initiation of smoking tobacco in Bangladesh was 18 years (men-17.9
years, and women- 24.5 years).
Tobacco cessation and cessation methods
• Among the current users of tobacco (18-69 years) - 46% of smokers (men -46% and
women-44.4%) tried to stop smoking during the past 12 months.
• 60.5% of current smokers of tobacco (men -60.3% and women-65.8%) received advise
to quit smoking during any visit to a doctor or a health worker in the past 12 months.
Source 1: Report of Fifth Global Youth Tobacco Survey (GYTS) Myanmar-2016
Figure 4. 1 MPOWER Policy Package

STEPS Bangladesh 2018
39
Electronic cigarettes
• 9.3% of all adults (18-69 years) reported that they have heard of e-cigarette and among
them 13.2% had ever used an e-cigarette and 6.7% of were currently using the product.
Introduction
Tobacco use is a leading modifiable behavioral risk factor contributing to NCDs. Tobacco
use kills more than 8 million people each year. More than 7 million of those deaths are the
result of direct tobacco use while around 1.2 million are the result of non-smokers being
exposed to second-hand smoke.16 In 2003, WHO Framework Convention on Tobacco
Control (WHO FCTC) was the first evidence based treaty developed for tobacco control and
currently there are 180 signatories, including Bangladesh, to the convention. In 2007,
MPOWER (Figure 4. 1)-- a policy package---was developed and adopted by the countries to
end the tobacco epidemic and to enable implementation of WHO FCTC. As a signatory to
FCTC, Bangladesh has also taken steps to monitor the use of tobacco, protect people from
further or continued use, offer assistance in quitting, raise awareness about the dangers of
tobacco and curtail the creation of new demand by enforcing bans on promotions and by
raising taxes on various tobacco products.
Strengthening the implementation of WHO FCTC is recognized as an important means to
achieve SDG 3 – Good health and well-being. Furthermore, Bangladesh has also set a
target of 30% relative reduction in prevalence of current tobacco use in persons aged 15+
years by 2025 in its current multisectoral action plan (2018-2025) aligned with target set in
WHO’s Global Action plan for the prevention and control of NCDs. Furthermore, it has set a
vision of a tobacco-free Bangladesh by 2040.17
This chapter focuses on indicators related to tobacco use in Bangladesh. This data will help
Bangladesh to analyze the differentials across different population groups defined by age,
gender, residence, education, administrative divisions and wealth quintile, which can then
strengthen the various programs designed for the implementation of the tobacco control
programs and policies.
16 World Health Organization. WHO report on the global tobacco epidemic 2019 [Internet]. 2020.
[cited 25 Mar 2020]. Available from: https://www.who.int/tobacco/global_report/en/
17 Multi-sectoral action plan for prevention and control of non-communicable diseases 2018-2025. 2018. Dhaka: Non-communicable Disease Control Programme, Directorate General of Health Services

STEPS Bangladesh 2018
40
Current relevant policies and programs in Bangladesh for tobacco control
• Smoking and Usage of Tobacco Products (Control) act, first enacted in 2005, and
amended in 2013 with new rules in 2015 that prohibited all forms of tobacco advertising
(except in Internet), prohibited tobacco smoking in public transportation and public
places (but allowed smoking in designated areas) and prohibited sales of all tobacco
products to or by people younger than 18 years of age.
• National Tobacco Control Policy; and the Policy to Curb Tobacco Cultivation
• Multisectoral Action Plan for the Prevention and Control of Non-Communicable Diseases
(2018-2025)
• In March 2016, introduced pictorial health warnings on all tobacco products covering at
least 50% of the package surface area.
4.1 Tobacco use
The tobacco-related questions used in the survey were based on the core tobacco module of
STEP Survey (Version 3.2)13 and were aligned with the Tobacco Questions for Surveys
(TQS) developed by CDC and WHO. The respondents were men and women between the
ages of 18-69 years, and the analysis has been presented for the said age group, unless
otherwise stated.
4.2.1 Tobacco use, smoked tobacco, smokeless tobacco use
The prevalence of tobacco use has been estimated by asking all adults if they currently
smoked any tobacco products (cigarettes- manufactured and hand-rolled, bidis,
cigars/cigarellos pipes, hookah, shisha or any other) or used any smokeless tobacco
products (betel quid with zarda, zarda only or zarda with supari, betel quid with sadapata,
pan masala with tobacco, sadapata chewing, gul, khoinee, nossi)
Figure 4.2 Percent of all adults (18-69 years) that currently use any tobacco product, smoke tobacco, smokeless tobacco and use both smoked and smokeless tobacco, Bangladesh STEP Survey 2018
• In 2018, the prevalence of tobacco use (tobacco product of any kind) amongst all adults
was 43.7%;
44%
24%28%
7%
0%
10%
20%
30%
40%
50%
Any tobacco use Smoke tobacco Smokeless tobacco Both

STEPS Bangladesh 2018
41
• 23.5% of all adults reported current use of any smoked tobacco product and 27.5%
reported current use of any smokeless tobacco product;
• 7.2% of respondents used both smoke and smokeless tobacco products.
Patterns by background characteristics
• The reported current tobacco use increased with age, lowest among 18-24 years of age
(22.3%) and increasing to 68.4% among 55-69 years of age. Similar patterns were seen
with use of both smoked and smokeless tobacco.
• Prevalence of any tobacco use was significantly higher among men (59.6%) than women
(28.3%). However, different patterns were seen for smoked and smokeless tobacco.
While differential was much wider for smoked tobacco (1% women and 26.9% men), no
significant differentials were seen for smokeless tobacco (28.1% for women and 26.9%
for men). Accordingly, the dual use was much higher among men (13.9%) than women
(0.8%). (Figure 4.3).
• Residents of rural areas had a higher prevalence of any tobacco use (45.2%) as
compared to urban residents (38.8%), with much wider difference for smokeless tobacco
than for smoked tobacco.
Figure 4.3 Prevalence of tobacco use amongst all men and women aged 18-69 years
• Dhaka Rural had the lowest prevalence of any tobacco use, compared to the national
average of 43.7%. Mymensingh and Sylhet had the highest prevalence of any tobacco
use, 56.5%.
28%
1%
28%
1%
60%
47%
27%
14%
0%
10%
20%
30%
40%
50%
60%
70%
Any tobacco use Smoke tobacco Smokeless tobacco Both
Women Men

STEPS Bangladesh 2018
42
Figure 4. 4 Variation in tobacco use amongst all adults, aged 18-69 years, by division, Bangladesh STEPs survey, 2018
• The reported tobacco use decreased with increase in education levels, with highest
usage amongst people with no or less than primary education (60.2%), decreasing to
22.8% for people with more than secondary education. The declining gradient is much
stronger for smokeless tobacco than smoked tobacco.
• The reported tobacco use decreased with an increase in wealth, the highest amongst
those belonging to the lowest wealth quintile (51.6%) and lowest amongst those in
highest wealth quintile (31.6%). This declining pattern was more due to pattern of
smokeless tobacco use, much less differentials were observed for smoked tobacco, with
no consistent declining pattern (though tobacco smoking was still the lowest in the
highest wealth quintile). (Figure 4.5).
Figure 4.5 Differentials in tobacco use amongst all adults, aged 18-69 years, by levels of education (A) and by wealth (B), Bangladesh STEPs survey, 2018
60%
30%
42%
11%
36%
19% 21%
5%
27%19%
11%3%
23%17%
10%4%
0%
20%
40%
60%
80%
Any tobacco use Smoke tobacco Smokeless tobacco Both
A
No formal education Primary or less Secondary/higher secondary More than higher secondary
48.5% 42.4%
39.0%
41.1%
56.5%
39.3%
45.1%
56.5%
0.0%-39.0%
39.0%< - 44.8%
44.8%< - 50.7%
50.7%< - 56.5%

STEPS Bangladesh 2018
43
4.2.2 Tobacco use status - current, former, and never
All adults, aged 18-69 years were asked if they were current users of smoked tobacco and of
smokeless tobacco products, respectively. Those that answered in the affirmative were then
further enquired if they smoked tobacco or used smokeless tobacco products on a daily
basis. The adults who were not current users, were asked about their former tobacco use
status (separately for smoked and smokeless products) and the frequency of use in the past
(daily or non-daily for smoked tobacco).
69.6% adults never smoked tobacco, 7% smoked formerly (5.8%-daily and 1.2%-non-daily)
and 23.5% were current smokers (22.3%-daily and 1.2%-non-daily). 69.9% of the adults
never used smokeless tobacco, 2.7% used formerly and 27.5% were current users of
smokeless tobacco (23.9% daily and 3.6% non-daily).
Figure 4.6 Tobacco use status in the overall population - current, former and never, by smoke and smokeless tobacco product
4.2.3 Tobacco smoking status – current, former, and never (Figure 4.6)
Patterns by background characteristics
• With an increase in age, the proportion of adults that currently smoked or were former
smokers increased - 30% of adults in age group 55-69 years currently smoked tobacco,
52%
24%
38%
10%
51%
26%34%
10%
44%
25% 25%
7%
41%
23% 23%
4%
32%
19% 18%
5%
0%
10%
20%
30%
40%
50%
60%
Any tobacco use Smoke tobacco Smokeless tobacco Both
B
Lowest Second Middle Fourth Highest
23%
27%
7%
3%
70%
70%
0% 10% 20% 30% 40% 50% 60% 70% 80% 90% 100%
Smoke tobacco
Use smokeless tobacco
Current Former Never Used

STEPS Bangladesh 2018
44
whereas 15.7% of adults in age group 18-24 years currently smoked tobacco; the
proportion of adults who never smoked decreased with increasing age, 82.2% of adults
in the age group 18-24 years had never smoked tobacco, as compared to 51.6% in the
older age group of 55-69 years. Figure 4.7
• 98% of women never smoked, compared to 40.3% of men. There was no significant
difference in the proportion of adults smoking tobacco in urban and rural areas and also,
no significant variations across different divisions.
• With increasing levels of education and wealth, there was a decline in the proportion of
adults who currently smoked daily or formerly smoked (daily and non-daily),
correspondingly the percentage of adults who never smoked increased with an increase
in levels of education and wealth. Figure 4.8
Figure 4.7 Differentials in prevalence of current and former smoking, amongst all adults age 18-69 years - by age, Bangladesh STEP Survey, 2018
Figure 4.8 Differentials in prevalence of current and former smoking, amongst all adults age 18-69 years– by levels of education (A) and by wealth (B), Bangladesh STEP Survey 2018
16%
2%
24%
4%
26%
9%
30%
18%
0%
10%
20%
30%
40%
Currently smoke tobacco Formerly smoke tobacco
18-24 25-39 40-54 55-69
30%
9%
19%
5%
19%
7%
17%
6%
0%
10%
20%
30%
40%
Currently smoke tobacco Formerly smoke tobacco
A
No formal education Primary or less Secondary/higher secondary More than higher secondary

STEPS Bangladesh 2018
45
4.2.4 Smokeless tobacco use status – current former and never. (Figure 4.6)
Patterns by background characteristics
• With increasing age, the percentage of smokeless tobacco users increased, with lowest
proportion of users being in the age group age group of 18-24 years, 9.9% and highest
being 49.7% (43.2% daily and 6.6% non-daily) in the older age group of 55-69 years.
Figure 4.9
• The current use of smokeless tobacco wasn’t very different for women and men (28.1%
versus 26.9%) and was higher in rural areas (29.1%) compared to urban areas (21.8%).
• The proportion of adults who used smokeless tobacco was lowest in Dhaka (21.2%).
However, in divisions like Mymensingh, Barishal it was much higher than the national
average of 27.5%; the highest proportion of adults using smokeless tobacco products
resided in Sylhet (43.1%). Figure 4.10
• With an increase in levels of education, the proportion of adults who used smokeless
tobacco declined, 41.8%% of adults with no or less than primary education used
smokeless tobacco (37% daily), whereas only 9.9% of adults (8.2% daily) with more than
secondary education, used it regularly.
• Figure 4.11. Similar, yet less pronounced patterns were observed for former use of
smokeless tobacco amongst adults with an increase in level of education.
• The proportion of adults, using smokeless tobacco, declined with an increase in
household wealth. 37.8% of adults, in the lowest wealth quintile, used smokeless
tobacco products on daily and non-daily basis, however only 17.5% of adults, in the
highest wealth quintile were smokeless tobacco users.
24%
8%
26%
7%
25%
7%
23%
8%
19%
5%
0%
10%
20%
30%
Currently smoke tobacco Formerly smoke tobacco
B
Lowest Second Middle Fourth Highest

STEPS Bangladesh 2018
46
Figure 4.9 Differentials in current and former use of smokeless tobacco, amongst all adults age 18-69 years - by age, Bangladesh STEP survey 2018
Figure 4.10 Variation in current use of smokeless tobacco amongst all adults, aged 18-69 years, by division, Bangladesh STEPs survey, 2018
Figure 4.11 Differentials in current and former use of smokeless tobacco, amongst all adults age 18-69 years– by levels of education (A) and by wealth (B), Bangladesh STEP Survey 2018
10%
1%
21%
2%
43%
3%
50%
6%
0%
10%
20%
30%
40%
50%
60%
Currently use smokeless tobacco Formerly use smokeless tobacco
18-24 25-39 40-54 55-69
42%
3%
21%
2%
11%
2%
10%
2%
0%
10%
20%
30%
40%
50%
Currently use smokeless tobacco Formerly use smokeless tobacco
No formal education Primary or less Secondary/higher secondary More than higher secondary
38.7% 27.2%
21.2%
24.7%
38.8%
21.8%
28.4%
43.1%
0.0%-21.2%
21.2%< - 28.5%
28.5%< - 35.8%
35.8%< - 43.1%

STEPS Bangladesh 2018
47
4.2 Types of Tobacco products use
STEPs Survey collected the data on different types of tobacco products used (smoke and
smokeless) on a daily or a weekly basis. The product mix was analyzed both for all adults
and amongst the current tobacco users. See Table 4.3.1 and 4.3.2.
4.3.1 Tobacco products smoked
Information was elicited on daily/weekly use of cigarettes (manufactured and hand rolled),
pipes, cigars, bidis, and hookah/ dhaba, shisha. In the overall population, 23.3% of adults
smoked cigarettes, 7.6% smoked bidis, and less than 1% smoked products like pipes,
cigars, hookah/ dhaba and shisha. (0.8% smoked pipes/ cigars/ cigarillos and 0.3% smoked
hookah/ dhaba/ shisha). Amongst the current users, cigarettes and bidis were the most
commonly used smoked tobacco products reported by 99.3% and 32.5% of current tobacco
smokers, respectively. Figure 4.12
Figure 4.12 Use of different tobacco smoking products amongst all adults (A) and current smokers (B), aged 18-69 years, Bangladesh STEP Survey, 2018
38%
2%
34%
2%
25%
2%
23%
3%
18%
3%
0%
10%
20%
30%
40%
Currently use smokeless tobacco Formerly use smokeless tobacco
B
Lowest Second Middle Fourth Highest
23%
8%1% 0%
0%
10%
20%
30%
40%
Cigarette (manufactured orhand-rolled)
Bidis Pipes/cigars/cigarellos Hookah/ Dhaba/Shisha
A
99%
32%
3% 1% 2%0%
20%
40%
60%
80%
100%
Cigarette (manufacturedor hand-rolled)
Bidis Pipes/cigars/cigarellos Hookah/ Dhaba/Shisha Others
B

STEPS Bangladesh 2018
48
Patterns by background characteristics
• Across the population, the usage of cigarettes and bidis and other products increased
with an increase in age.
• However, amongst the current smokers, cigarettes were the most commonly smoked
tobacco product reported by almost ~99% of the smokers, across all ages. Usage of
bidis increased with increasing age – 57.6% of adults in the age group 55-69 years
smoked bidis, whereas 13.3% of smokers in the age group 18-24 years used it. Usage of
hookah was also much higher in older age group (4.1% among 55-69 years old)
compared to in the younger age group (1.1% among 18-24 years old). Figure 4.13
Figure 4.13 Differentials in use of different smoking tobacco products, amongst all adults (A) and current tobacco smokers B), aged 18-69 years - by age, Bangladesh STEP Survey, 2018
Note 1: The total across different products may not add to 100% due to dual use
• In the overall population only 1% of women reported using cigarettes and bidis,
compared to 46.2% and 14.5% of men, respectively.
• Amongst the smokers, while cigarettes were the most popular smoking tobacco products
used by both men and women smokers (99.2% and100% respectively), 89.9% of women
smokers used bidis compared to only 30.5% of men smokers. Figure 4.14 B
15%
2% 0% 0%
24%
5% 1% 0%
26%
11%1% 0%
29%
17%
1% 1%
0%
20%
40%
Cigarette (manufactured orhand-rolled)
Bidis Pipes/cigars/cigarellos Hookah/ Dhaba/Shisha
A
18-24 25-39 40-54 55-69
97%
13%0% 1% 2%
100%
22%4% 0% 3%
100%
42%
3% 1% 2%
99%
58%
5% 4% 1%0%
50%
100%
Cigarette (manufacturedor hand-rolled)
Bidis Pipes/cigars/cigarellos Hookah/ Dhaba/Shisha Others
B
18-24 25-39 40-54 55-69

STEPS Bangladesh 2018
49
Figure 4.14 Differentials in use of different smoking tobacco products among all adults (A) and current tobacco smokers (B), aged 18-69 years - by sex, Bangladesh STEPS survey 2018
Note 2: The total across different products may not add to 100% due to dual use
• There was no significant difference in usage of cigarettes by residence areas for the
overall population and amongst smokers. However, 8.8% of the population reported
using bidis in rural areas, compared to only 3.4% of the population in urban areas.
o Amongst the current smokers, 37.2% of smokers in rural areas used bidis,
compared to 15.2% of smokers in urban area.
• In the overall population, with increasing levels of education and household wealth, there
was a decline in the use of cigarettes and bidis.
• Amongst the current smokers, while cigarettes were the most commonly used product
(>97% of smokers) across all wealth quintiles and levels of education, the use of bidis,
pipes, hookahs declined with increasing levels of education and wealth. Figure 4. 15
1% 1% 0% 0%
46%
15%1% 1%
-10%
10%
30%
50%
Cigarette (manufactured orhand-rolled)
Bidis Pipes/cigars/cigarellos Hookah/ Dhaba/Shisha
A
Women
Men
100% 90%
7% 6% 0%
99%
31%3% 1% 2%
0%
50%
100%
Cigarette (manufacturedor hand-rolled)
Bidis Pipes/cigars/cigarellos Hookah/ Dhaba/Shisha Others
B
Women Men

STEPS Bangladesh 2018
50
Figure 4.15 Differentials in use of different smoking tobacco products, amongst current tobacco smokers, age 18-69 years, by levels of education (A) and wealth (B), Bangladesh STEPS Survey, 2018
4.3.2 Smokeless Tobacco products
Information was elicited on use of betel quid with zarda, (zarda only or zarda with supari),
betel quid with sadapata, pan masala with tobacco, gul and other (sadapata chewing,
khoinee, and nossi). In the overall population, 20.2% adults use betel quid with zarda (bqz),
7.8% reported using betel quid with sadapata (bqs), 2,5% reported using pan masala with
tobacco, 3.8% reported using gul and about 3.2% reported using other smokeless tobacco
products (khoinee, sadapata chewing and nossi). Amongst the current users of smokeless
tobacco,73.4% reported using bqz, followed by 28.2% of the users consuming bqs, 13.7%
using gul and 9.2% using pan masala with tobacco. Figure 4.16
100%
44%
5% 2% 2%
98%
23%1% 1% 3%
99%
16%1% 0% 1%
100%
5% 2% 0% 0%0%
50%
100%
Cigarette (manufacturedor hand-rolled)
Bidis Pipes/cigars/cigarellos Hookah/ Dhaba/Shisha Others
A
No formal education Primary or less Secondary/higher secondary More than higher secondary
99%
51%
4% 2% 4%
100%
41%
3% 0% 3%
100%
32%
5% 4% 2%
97%
20%3% 0% 0%
100%
12% 1% 1% 1%0%
50%
100%
Cigarette (manufacturedor hand-rolled)
Bidis Pipes/cigars/cigarellos Hookah/ Dhaba/Shisha Others
B
Lowest Second Middle Fourth Highest

STEPS Bangladesh 2018
51
Figure 4.16 Use of different smokeless tobacco products amongst all adults (A) and current users of smokeless tobacco (B), aged 18-69 years, Bangladesh STEP Survey, 2018
Patterns by background characteristics
• Across the population, the usage of bqz and bqs, pan masala with tobacco, gul and other
products (including khoinee, nossi and sadapata chewing) increased with an increase in
age. Figure 4.17 A
• However, amongst the current users of smokeless tobacco, the use of bqz decreased
with an increase in age - 85.3% of adults, in age group 18-24 years, reported using bqz,
whereas 66.8% of adults, in the age group 55-69 years reported using the product. No
significant differentials by age existed for use of pan masala with tobacco and gul. For
remaining products, the differentials by age followed the same patterns amongst current
users as they did for all the population. Figure 4.17 B
• In the overall population, men reported a higher user of bqz as compared to women
(22.7% versus 17.8%), however, 11% of women reported using bqs as compared to
4.5% of men. The same pattern emerged when considering the current users of
smokeless tobacco - 84.3% of men used bqz, compared to 63.3% of women and 39% of
women used bqs compared to only 16.7% of men. Figure 4.18 A & B.
• Both, amongst the overall population and amongst current users, adults in rural areas
reported a higher use of bqz, bqs and other smokeless tobacco products, compared to
urban areas.
20%
8%
3% 4% 3%
0%
5%
10%
15%
20%
25%
Betel quid with zarda Betel quid with sadapata Pan masala with tobacco Gul Other (including Khoinee,nossi, sadapata)
A
73%
28%
9% 14% 12%
0%
20%
40%
60%
80%
Betel quid with zarda Betel quid with sadapata Pan masala with tobacco Gul Other (including Khoinee,nossi, sadapata)
B

STEPS Bangladesh 2018
52
Figure 4.17 Differentials in use of different smokeless tobacco products, amongst all adults (A) and current smokeless tobacco users (B), age 18-69 years - by age, Bangladesh STEP Survey, 2018
Figure 4.18 Differentials in use of different smokeless tobacco products among all adults (A) and among current tobacco smokeless product users (B), aged 18-69 years - by sex, Bangladesh STEPS survey 2018
8%1% 1% 1% 1%
16%
4% 2% 3% 2%
32%
12%4% 6% 6%
33%
21%
4% 6% 7%
0%
20%
40%
Betel quid with zarda Betel quid with sadapata Pan masala with tobacco Gul Other (including Khoinee,nossi, sadapata)
A
18-24 25-39 40-54 55-69
85%
12% 10% 15%6%
74%
20%9% 13% 10%
75%
27%10% 15% 13%
67%
42%
8% 13% 14%
0%
50%
100%
Betel quid with zarda Betel quid with sadapataPan masala with tobacco Gul Other (including Khoinee, nossi, sadapata)
B
18-24 25-39 40-54 55-69
18%11%
2% 4% 4%
23%
4% 3% 4% 2%
0%
10%
20%
30%
Betel quid with zarda Betel quid with sadapataPan masala with tobacco Gul Other (includingKhoinee, nossi,
sadapata)
A
Women Men
63%39%
7% 14% 15%
84%
17% 11% 14% 8%
0%
50%
100%
Betel quid with zarda Betel quid withsadapata
Pan masala withtobacco
Gul Other (includingKhoinee, nossi,
sadapata)
B
Women Men
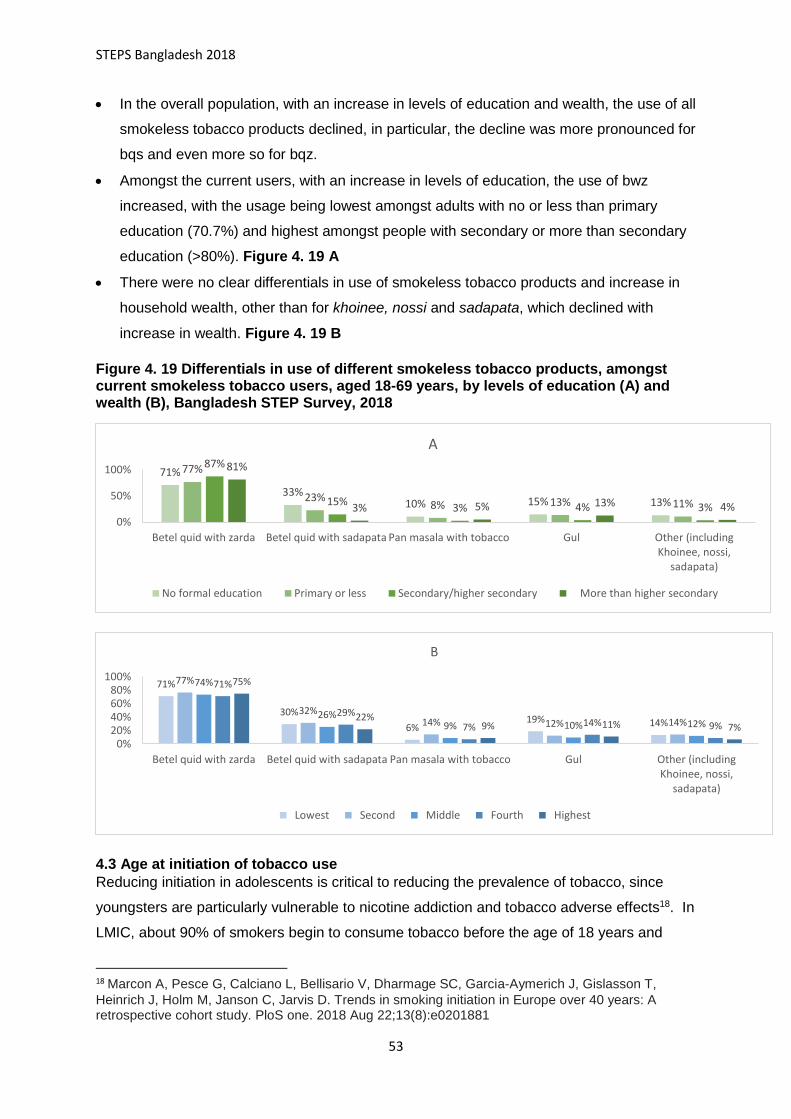
STEPS Bangladesh 2018
53
• In the overall population, with an increase in levels of education and wealth, the use of all
smokeless tobacco products declined, in particular, the decline was more pronounced for
bqs and even more so for bqz.
• Amongst the current users, with an increase in levels of education, the use of bwz
increased, with the usage being lowest amongst adults with no or less than primary
education (70.7%) and highest amongst people with secondary or more than secondary
education (>80%). Figure 4. 19 A
• There were no clear differentials in use of smokeless tobacco products and increase in
household wealth, other than for khoinee, nossi and sadapata, which declined with
increase in wealth. Figure 4. 19 B
Figure 4. 19 Differentials in use of different smokeless tobacco products, amongst current smokeless tobacco users, aged 18-69 years, by levels of education (A) and wealth (B), Bangladesh STEP Survey, 2018
4.3 Age at initiation of tobacco use
Reducing initiation in adolescents is critical to reducing the prevalence of tobacco, since
youngsters are particularly vulnerable to nicotine addiction and tobacco adverse effects18. In
LMIC, about 90% of smokers begin to consume tobacco before the age of 18 years and
18 Marcon A, Pesce G, Calciano L, Bellisario V, Dharmage SC, Garcia-Aymerich J, Gislasson T,
Heinrich J, Holm M, Janson C, Jarvis D. Trends in smoking initiation in Europe over 40 years: A retrospective cohort study. PloS one. 2018 Aug 22;13(8):e0201881
71%
33%10% 15% 13%
77%
23%8% 13% 11%
87%
15%3% 4% 3%
81%
3% 5% 13% 4%0%
50%
100%
Betel quid with zarda Betel quid with sadapata Pan masala with tobacco Gul Other (includingKhoinee, nossi,
sadapata)
A
No formal education Primary or less Secondary/higher secondary More than higher secondary
71%
30%
6%19% 14%
77%
32%14% 12% 14%
74%
26%9% 10% 12%
71%
29%
7% 14% 9%
75%
22%9% 11% 7%
0%20%40%60%80%
100%
Betel quid with zarda Betel quid with sadapata Pan masala with tobacco Gul Other (includingKhoinee, nossi,
sadapata)
B
Lowest Second Middle Fourth Highest

STEPS Bangladesh 2018
54
because of the strongly addictive nature of tobacco use, smoking during adolescence tends
to track into adulthood19.
In addition to long-term consequences of tobacco use in terms of increased risk of different
non-communicable diseases, smoking at a young age also increases the risk of many
diseases among adolescents including respiratory illness, asthma, and reduced pulmonary
function19. Article 16 of FCTC requires parties to prohibit the sales of tobacco products to or
by persons under the age set by domestic law, national law or 18 years, as well as other
measures limiting the access of underage persons to tobacco products.
In STEP Survey, all adults, 18-69 years that reported currently smoking any tobacco product
were asked about the age at which they started smoking. The average age at initiation of
smoking tobacco in Bangladesh was 17.9 years (17.9 years for men and 24.5 years for
women). The median age, or the age by which 50% of current smokers started smoking was
17 years (17 years for men and 20 years for women).
Patterns by background characteristics
• With an increase in age, the average age at initiation of smoking increased, with 16.5
years being average age amongst adults, aged 18-24 years, and 18.5 years for adults in
the age group 55-69. Figure 4.20 A.
• Average age at initiation of smoking for women was 25 years, compared to 18 years for
men.
• There weren’t significant differences in age at initiation of smoking for adults residing in
rural or urban areas or with an increase in level of household wealth.
• However, with an increase in levels of education, there was a slight increase in the
average age at initiation of smoking for adults. Amongst the existing smokers, those with
primary or higher level of education started to smoke at or after turning 18 years of age.
Figure 4.21
19 Xi B, Liang Y, Liu Y, Yan Y, Zhao M, Ma C, Bovet P. Tobacco use and second-hand smoke
exposure in young adolescents aged 12–15 years: data from 68 low-income and middle-income countries. The Lancet Global Health. 2016 Nov 1;4(11):e795-805

STEPS Bangladesh 2018
55
Figure 4.20 Differential in mean age at initiation of smoking among adult age 18-69 years, who currently smoke any tobacco products - by age (A) and by sex (B), Bangladesh STEP Survey, 2018
Figure 4.21 Differential in median age at initiation of smoking among adult age 18-69 years, who currently smoke any tobacco products, by levels of education (A) and wealth (B), Bangladesh STEP Survey, 2018
4.4 Tobacco cessation
Article 14 of FCTC concerns the provision of support for reducing tobacco dependence and
cessation, including counselling, psychological support, nicotine replacement, and education
programmes. To assist the population in quitting smoking, the most effective combination of
interventions is face-to-face behavioral support together with combination nicotine
replacement therapy (NRT).20 Nonetheless, a brief advice from a health-care worker,
telephone helplines, automated text messaging, printed self-help materials are
recommended health-care interventions to promote and assist smoking cessation.20 Among
the current users of tobacco, the survey asked if they tried to stop smoking in the past 12
20 West R, Raw M, McNeill A, Stead L, Aveyard P, Bitton J, Stapleton J, McRobbie H, Pokhrel S,
Lester‐George A, Borland R. Health‐care interventions to promote and assist tobacco cessation: a review of efficacy, effectiveness and affordability for use in national guideline development. Addiction. 2015 Sep;110(9):1388-403
17.718.0
18.818.5
17.0
17.5
18.0
18.5
19.0
Mean age at initiation of smokingMea
n a
ge a
t in
itia
tio
n o
f sm
oki
ng
(yea
rs)
A
No formal education Primary or less Secondary/higher secondary More than higher secondary
16
1818
19
15
16
16
17
17
18
18
19
19
Mean age at initiation of smoking
Mea
n a
ge a
t in
itia
tio
n o
f sm
oki
ng
(yea
rs)
A
18-24 25-39 40-54 55-69
25
18
0
5
10
15
20
25
30
Mean age at initiation of smoking
B
Women Men

STEPS Bangladesh 2018
56
months, and if yes, during any visit to a doctor or health worker, in the past 12 months, were
they advised to quit smoking tobacco.
Among the current users of tobacco - 46% of smokers had tried to stop smoking and 60.5%
of the adults were advised to quit smoking if they visited a doctor or health worker.
Patterns by background characteristics
• The percentage of current tobacco smokers, who tried to quit, increased with increasing
age. However, with an increase in age, a decreasing proportion of current tobacco
smokers received advise to quit smoking, the lowest being 40.2% of current tobacco
smokers in the age group 55-69 years and the highest being 80.3% of smokers in age
group 18-24 years. Figure 4.22
Figure 4.22 Differentials in tobacco cessation (attempt to stop and advise received to quit), by age, Bangladesh STEP Survey 2018
• The percentage of current tobacco smokers, who tried to quit, increased with increasing
levels of education and wealth. Figure 4.23 A. The proportion of current smokers, who
were advised to quit smoking during any medical check-up increased with increase in
levels of education. 58.1% of current smokers with no or less than primary level of
education were advised to quit, the proportion going up to 66.8% for current smokers
with more than higher secondary level of education. Similar differentials were observed
with an increase in wealth. Figure 4.23 B
41%
80%
44%
68%
48%55%
51%
40%
0%
10%
20%
30%
40%
50%
60%
70%
80%
90%
Tried to stop smoking Advised to quit
18-24 25-39 40-54 55-69

STEPS Bangladesh 2018
57
Figure 4.23 Differentials in tobacco cessation (attempt to stop and advise received to quit), by levels of education (A) and wealth (B), Bangladesh STEP Survey 2018
4.5 Electronic cigarettes
Electronic cigarettes include any product that uses batteries or other methods to produce a
vapor which contains nicotine. They have various other names such as e-cigarette, vape-
pen, e-shisha, e-pipes. All adults were asked if they had heard of e-cigarette, and if they
had, they were asked if they have ever used it or were using it at the time regularly. 9.3% of
all adults (18-69 years) reported that they have heard of e-cigarette and 6.7% amongst them
were using the product.
Patterns by background characteristics
• Awareness and usage of e-cigarettes declined with an increase in age. While 16% of 18-
24 years old had heard about e-cigarettes, only 3.1% of 55-69 years had heard about
them. Similar pattern was observed with use of e-cigarettes. Figure 4.24 A
• Awareness and usage were much higher amongst men (14.7%, 8.5%), compared to
women (4%, 0%). Awareness about cigarettes was much higher in urban areas (14.3%)
as compared to rural areas (7.8%). Figure 4.24 B
45%
58%
45%
63%
42%
61%56%
67%
0%
20%
40%
60%
80%
Tried to stop smoking Advised to quit
A
No formal education Primary or less Secondary/higher secondary More than higher secondary
39%
56%
41%
61%50%
65%
51%61%
50%58%
0%
20%
40%
60%
80%
Tried to stop smoking Advised to quit
B
Lowest Second Middle Fourth Highest

STEPS Bangladesh 2018
58
Figure 4.24 Differentials in awareness and usage of electronic cigarettes, by age (A) and sex (B), Bangladesh STEP survey, 2018
• While there was an increase in the awareness about e-cigarettes with an increase in
levels of education, there wasn’t a significant differential in its usage with higher levels of
education
• With an increase in wealth, the awareness and usage of e-cigarettes increased as well –
17.9% of all adults belonging to the highest wealth quintiles had heard of e-cigarettes,
and of them, 10.9% were using the product. While, 4.3% of the adults belonging to the
lowest wealth quintile had ever heard about e-cigarettes and only 1.2% of them were
using the product. See Figure 4.25 B
16%
7%10% 9%
5%2%3% 2%
0%
5%
10%
15%
20%
Ever heard about e-Cigarettes Among those who heard about e-cigarettes, currently usinge-cigarettes
A
18-24 25-39 40-54 55-69
4%
0%
15%
9%
0%
5%
10%
15%
20%
Ever heard about e-Cigarettes Among those who heard about e-cigarettes, currently usinge-cigarettes
B
Women Men

STEPS Bangladesh 2018
59
Figure 4.25 Differentials in awareness and usage of electronic cigarettes, by levels of education (A) and wealth (B), Bangladesh STEP Survey, 2018
List of tables
For more information, please see the following tables
Table 4.1 Tobacco use: All Respondents
Table 4.2.1 Tobacco smoking status (current, former, never)
Table 4.2.2 Smokeless tobacco use: current, former, never
Table 4.3.1 Use of different smoking tobacco products: Among all respondents and current
smokers
Table 4.3.2 Use of different smokeless tobacco products: all respondents and current users
Table 4.4 Age at initiation of smoking: all respondents
Table 4.5 Tobacco cessation
Table 4.6 Electronic cigarettes: all respondents
4%8%9% 8%
14%
3%
24%
7%
0%
10%
20%
30%
Ever heard about e-Cigarettes Among those who heard about e-cigarettes, currently usinge-cigarettes
A
No formal education Primary or less Secondary/higher secondary More than higher secondary
4%1%
5% 4%
11%
5%8%
5%
18%
11%
0%
5%
10%
15%
20%
Ever heard about e-Cigarettes Among those who heard about e-cigarettes, currently usinge-cigarettes
B
Lowest Second Middle Fourth Highest
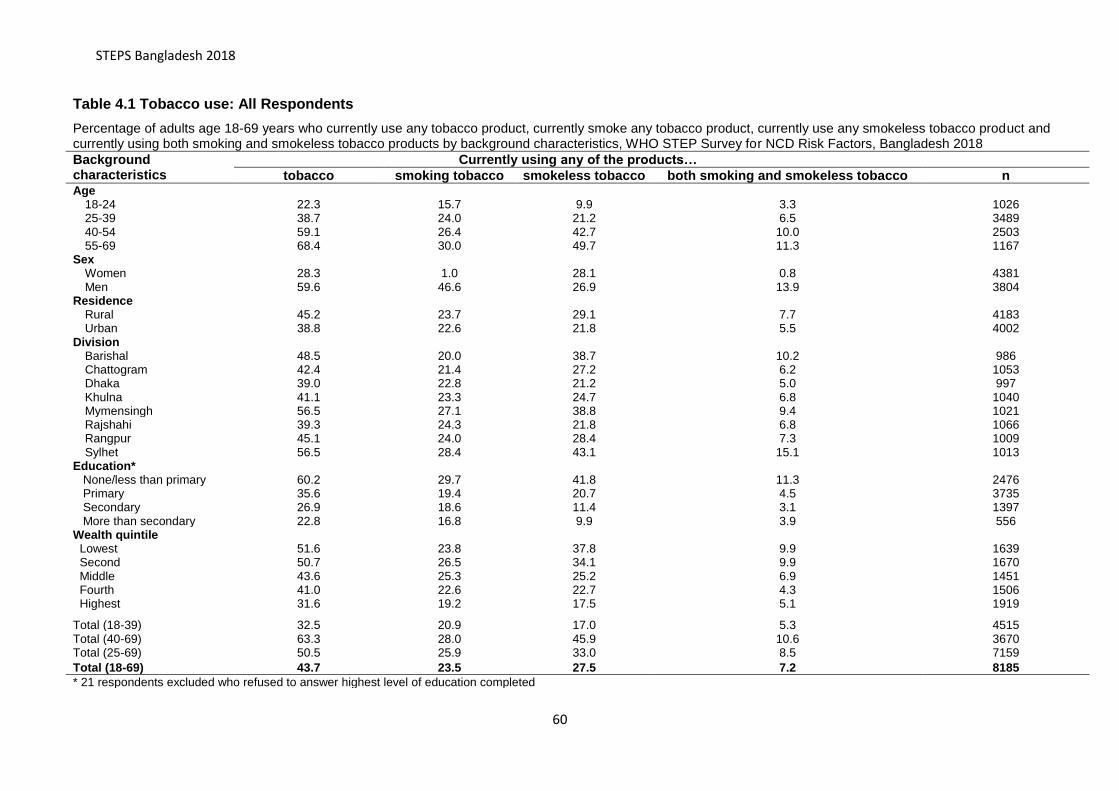
STEPS Bangladesh 2018
60
Table 4.1 Tobacco use: All Respondents
Percentage of adults age 18-69 years who currently use any tobacco product, currently smoke any tobacco product, currently use any smokeless tobacco product and currently using both smoking and smokeless tobacco products by background characteristics, WHO STEP Survey for NCD Risk Factors, Bangladesh 2018
Background characteristics
Currently using any of the products…
tobacco smoking tobacco smokeless tobacco both smoking and smokeless tobacco n Age
18-24 22.3 15.7 9.9 3.3 1026 25-39 38.7 24.0 21.2 6.5 3489 40-54 59.1 26.4 42.7 10.0 2503 55-69 68.4 30.0 49.7 11.3 1167
Sex Women 28.3 1.0 28.1 0.8 4381 Men 59.6 46.6 26.9 13.9 3804
Residence
Rural 45.2 23.7 29.1 7.7 4183 Urban 38.8 22.6 21.8 5.5 4002
Division
Barishal 48.5 20.0 38.7 10.2 986 Chattogram 42.4 21.4 27.2 6.2 1053 Dhaka 39.0 22.8 21.2 5.0 997 Khulna 41.1 23.3 24.7 6.8 1040 Mymensingh 56.5 27.1 38.8 9.4 1021 Rajshahi 39.3 24.3 21.8 6.8 1066 Rangpur 45.1 24.0 28.4 7.3 1009 Sylhet 56.5 28.4 43.1 15.1 1013
Education*
None/less than primary 60.2 29.7 41.8 11.3 2476 Primary 35.6 19.4 20.7 4.5 3735 Secondary 26.9 18.6 11.4 3.1 1397 More than secondary 22.8 16.8 9.9 3.9 556 Wealth quintile
Lowest 51.6 23.8 37.8 9.9 1639 Second 50.7 26.5 34.1 9.9 1670 Middle 43.6 25.3 25.2 6.9 1451 Fourth 41.0 22.6 22.7 4.3 1506 Highest 31.6 19.2 17.5 5.1 1919
Total (18-39) 32.5 20.9 17.0 5.3 4515 Total (40-69) 63.3 28.0 45.9 10.6 3670 Total (25-69) 50.5 25.9 33.0 8.5 7159
Total (18-69) 43.7 23.5 27.5 7.2 8185
* 21 respondents excluded who refused to answer highest level of education completed

STEPS Bangladesh 2018
61
Table 4.2.1 Tobacco smoking status (current, former, never)
Percentage of adults age 18-69 years who currently smoke tobacco, formerly smoked tobacco, daily or non-daily; percentage smoked among all respondents, among current smokers and among former smokers by background characteristics, WHO STEP Survey for NCD Risk Factors, Bangladesh 2018 Background characteristics
Among all respondents Number of respondents
Among current smokers
Number of respondents
Among former smokers
Number of respondents Currently smoke
tobacco Formerly smoked
tobacco Never
smoked tobacco Daily Non-daily Daily Non-daily Daily Non-daily Daily Non-daily
Age 18-24 13.6 2.1 1.3 0.8 82.2 1026 86.8 13.2 153 62.2 37.9 22 25-39 23.1 0.9 2.6 1.6 71.8 3489 96.2 3.8 782 62.0 38.0 156 40-54 25.9 0.5 7.6 1.2 64.9 2503 98.1 1.9 638 86.7 13.3 211 55-69 28.8 1.1 17.8 0.6 51.6 1167 96.2 3.8 350 96.6 3.4 234
Sex
Women 0.9 0.1 0.7 0.3 98.0 4381 86.1 13.9 37 72.5 27.5 30 Men 44.4 2.2 11.0 2.1 40.3 3804 95.3 4.7 1886 84.3 15.7 593
Residence
Rural 22.7 1.1 5.8 1.1 69.4 4183 95.4 4.6 1006 84.5 15.5 312 Urban 21.2 1.4 5.6 1.4 70.4 4002 93.8 6.2 917 79.7 20.3 311
Division
Barishal 18.5 1.6 7.8 2.7 69.5 986 92.2 7.8 188 74.5 25.5 102 Chattogram 19.9 1.5 6.4 1.2 71.0 1053 92.8 7.2 237 84.2 15.8 87 Dhaka Rural 22.0 0.8 5.5 0.9 70.8 997 96.6 3.4 234 86.1 13.9 70 Khulna 22.4 0.9 6.5 0.9 69.3 1040 96.3 3.7 223 87.4 12.6 80 Mymensingh 26.2 0.9 3.6 0.6 68.7 1021 96.8 3.2 277 85.6 14.4 58 Rajshahi 23.0 1.3 5.5 0.7 69.5 1066 94.6 5.4 233 87.9 12.1 71 Rangpur 22.6 1.4 6.6 2.0 67.5 1009 94.2 5.8 240 77.0 23.0 88 Sylhet 27.3 1.1 4.5 1.4 65.6 1013 96.0 4.0 291 76.4 23.6 67
Education
None/less than primary 28.8 1.0 8.0 0.6 61.6 2476 96.76 3.238 734 92.7 7.3 224 Primary 18.3 1.2 4.0 1.2 75.3 3735 94.06 5.937 823 76.9 23.1 241 Secondary 17.6 0.9 4.5 2.1 74.8 1397 94.94 5.064 276 68.0 32.1 110 More than secondary 14.7 2.0 3.7 1.9 77.7 556 87.89 12.11 89 66.3 33.7 48 Wealth quintile
Lowest 22.9 0.9 6.7 0.8 68.7 1639 96.4 3.6 381 89.7 10.3 111 Second 25.6 0.9 5.6 1.1 66.8 1670 96.5 3.5 441 83.2 16.8 120 Middle 24.2 1.1 6.1 1.3 67.2 1451 95.6 4.4 381 82.4 17.6 124 Fourth 20.6 1.9 6.7 0.9 69.8 1506 91.5 8.5 374 87.8 12.2 130 Highest 18.3 0.9 3.9 1.6 75.3 1919 95.1 4.9 346 70.3 29.7 138
Total (18-39) 19.5 1.4 2.1 1.3 75.7 4515 93.5 6.5 935 62.0 38.0 178 Total (40-69) 27.2 0.8 12.3 0.9 58.8 3670 97.1 2.9 988 93.1 6.9 445 Total (25-69) 25.1 0.9 7.2 1.3 65.6 7159 96.7 3.3 1770 85.1 14.9 601
Total (18-69) 22.3 1.2 5.8 1.2 69.6 8185 95.1 4.9 1923 83.4 16.6 623

STEPS Bangladesh 2018
62
Table 4.2.2 Smokeless tobacco use: current, former, never
Percentage of adults age 18-69 years who currently use smokeless tobacco products daily or non-daily; percentage former user and never user of smokeless tobacco; among all respondents and current users by background characteristics, WHO STEP Survey for NCD Risk Factors, Bangladesh 2018
Background characteristics
Among all respondents Among current users
Number of respondents Currently use
smokeless tobacco
Formerly use smokeless tobacco
Never used smokeless tobacco
Number of respondents
Daily Non-daily Daily Non-daily
Age
18-24 6.9 3.0 0.9 89.2 1026
70.0 30.1 119 25-39 18.2 3.0 1.9 76.8 3489
85.8 14.2 902
40-54 39.5 3.2 3.2 54.1 2503
92.4 7.6 1053 55-69 43.2 6.6 6.3 44.0 1167
86.8 13.2 548
Sex
Women 25.4 2.7 2.2 69.7 4381
90.3 9.7 1412 Men 22.3 4.6 3.2 69.9 3804
82.9 17.1 1210
Residence
Rural 25.4 3.7 2.8 68.1 4183
87.2 12.8 1456 Division
Barishal 34.6 4.1 1.7 59.7 986
89.5 10.5 394 Chattogram 22.2 4.9 1.3 71.6 1053
81.9 18.1 291
Dhaka Rural 17.9 3.3 2.5 76.4 997
84.5 15.5 257 Khulna 21.4 3.3 6.1 69.2 1040
86.6 13.4 261
Mymensingh 33.7 5.1 2.1 59.1 1021
86.9 13.1 423 Rajshahi 18.6 3.2 3.3 74.9 1066
85.3 14.7 226
Rangpur 26.2 2.2 2.2 69.4 1009
92.4 7.6 326 Sylhet 40.6 2.5 2.5 54.4 1013
94.3 5.7 444
Education
None/less than primary
37.0 4.8 3.3 54.9 2476
88.6 11.4 1148
Primary 17.7 3.0 2.4 76.9 3735
85.6 14.4 1159 Secondary 8.3 3.1 1.8 86.8 1397
72.8 27.2 226
More than secondary
8.2 1.7 1.9 88.2 556
82.5 17.5 72
Wealth quintile
Lowest 33.6 4.3 2.0 60.1 1639
88.7 11.3 687 Second 30.9 3.2 2.3 63.6 1670
90.7 9.3 637
Middle 20.6 4.6 2.5 72.3 1451
81.9 18.1 478 Fourth 18.9 3.8 3.1 74.2 1506
83.1 16.9 417
Highest 15.2 2.4 3.3 79.1 1919
86.6 13.4 403
Total (18-39) 14.0 3.0 1.6 81.5 4515
82.3 17.7 1021 Total (40-69) 41.2 4.8 4.6 49.5 3670
89.7 10.4 1601
Total (25-69) 29.2 3.8 3.2 63.8 7159
88.4 11.7 2503
Total (18-69) 23.9 3.6 2.7 69.9 8185 86.8 13.2 2622

STEPS Bangladesh 2018
63
Table 4.3.1 Use of different smoking tobacco products: Among all respondents and current smokers
Percentage of adult age 18-69 years who currently use different smoking tobacco products among all respondents and among current smokers by background characteristics, WHO STEP Survey for NCD Risk Factors, Bangladesh 2018
Background characteristics
Among all respondents Among current smokers
Cigarette (manufactured or hand-rolled)
Bidis Pipes/cigars/ cigarellos
Hookah/ Dhaba/Shisha
Any smoking products
Number of respondents
Cigarette (manufactured or hand-rolled)
Bidis Pipes/cigars/ cigarellos
Hookah/ Dhaba/Shisha
Others Number of respondents
Age
18-24 15.3 1.9 0.1 0.2 15.3 1026
97.4 13.3 0.5 1.1 1.8 153
25-39 24.0 5.0 0.9 0.1 24.0 3489
99.9 21.5 3.9 0.3 2.9 782 40-54 26.3 10.9 0.7 0.3 26.4 2503
99.9 42.2 2.5 1.2 2.3 638
55-69 29.5 17.1 1.4 1.2 29.8 1167
98.8 57.6 4.7 4.1 1.0 350 Sex
Women 1.0 0.9 0.1 0.1 1.0 4381
100.0 89.9 6.9 6.5 0.5 37 Men 46.2 14.5 1.5 0.6 46.3 3804
99.2 31.2 3.1 1.3 2.2 1886
Residence
Rural 23.5 8.8 0.6 0.4 23.6 4183
99.2 37.2 2.6 1.7 2.3 1006 Urban 22.4 3.4 1.3 0.1 22.5 4002
99.5 15.2 5.6 0.4 1.9 917
Division
Barishal 20.0 11.0 0.6 0.4 20.0 986
100.0 55.1 3.2 1.8 0.6 188 Chattogram 21.3 5.4 1.1 0.9 21.4 1053
99.7 25.4 5.3 4.2 1.3 237
Dhaka Rural 22.3 4.3 1.2 0.1 22.4 997
97.8 19.1 5.1 0.5 5.7 234 Khulna 23.2 6.4 0.1 0.1 23.2 1040
99.5 27.6 0.6 0.4 0.3 223
Mymensingh 27.1 17.0 0.6 0.3 27.1 1021
100.0 62.6 2.3 1.2 2.9 277 Rajshahi 24.2 8.6 0.7 0.1 24.2 1066
99.5 35.5 3.0 0.5 0.0 233
Rangpur 24.0 7.8 0.3 0.0 24.0 1009
99.8 32.3 1.2 0.1 0.6 240 Sylhet 28.1 11.5 0.2 0.8 28.4 1013
100.0 40.5 0.6 2.9 2.3 291
Education
None/less than primary
29.8 15.1 1.2 0.4 30.0 2476
99.7 44.0 4.7 2.3 2.5 1058
Primary 22.2 5.9 0.7 0.5 22.2 3735
98.1 23.4 1.4 0.7 2.7 499 Secondary 17.7 2.3 0.3 0.0 17.7 1397
99.1 16.5 0.6 0.0 1.2 184
More than secondary
17.3 0.7 0.0 0.0 17.3 556
100.0 4.9 2.0 0.1 0.1 181
Wealth quintile Lowest 23.6 12.1 1.1 0.4 23.8 1639
99.4 51.1 4.5 1.6 4.0 381
Second 26.4 10.9 0.7 0.1 26.5 1670
99.9 41.3 2.6 0.5 3.0 441 Middle 25.3 8.2 1.2 0.9 25.3 1451
99.8 32.3 4.6 3.6 1.9 381
Fourth 21.9 4.4 0.6 0.0 22.0 1506
97.5 19.6 2.6 0.0 0.5 374 Highest 19.1 2.4 0.3 0.3 19.1 1919
99.6 12.3 1.5 1.5 1.3 346
Total (18-39) 20.7 4.0 0.6 0.1 20.7 4515
99.2 19.2 2.9 0.6 2.6 935 Total (40-69) 27.8 14.0 1.0 0.7 27.9 3670
99.4 49.8 3.6 2.6 1.6 988
Total (25-69) 25.8 9.4 1.0 0.4 25.9 7159
99.6 36.1 3.7 1.5 2.3 1770
Total (18-69) 23.3 7.6 0.8 0.3 23.3 8185 99.3 32.5 3.2 1.5 2.2 1923

STEPS Bangladesh 2018
64
Table 4.3.2 Use of different smokeless tobacco products: all respondents and current users
Percentage of people age 18-69 who currently use different smokeless tobacco products -among all respondents and among current smokeless tobacco users by background characteristics, WHO STEP Survey for NCD Risk Factors, Bangladesh 2018
Background characteristics
Among all respondents Among current users
Betel quid with
zarda
Betel quid with
sadapata
Pan masala
with tobacco
Gul Other (including Khoinee,
nossi, sadapata)
Any smokeless
tobacco product
Number of respondents
Betel quid with
zarda
Betel quid with
sadapata
Pan masala
with tobacco
Gul Other (including Khoinee, nossi,
sadapata)
Any smokeless
product
Number of respondents
Age
18-24 8.4 1.2 0.9 1.5 0.6 9.1 1026 85.3 12.2 9.5 15.2 5.7 91.9 119 25-39 15.8 4.3 1.9 2.8 2.1 19.9 3489 74.5 20.4 8.8 13.0 9.7 93.6 902 40-54 32.2 11.7 4.5 6.3 5.7 41.1 2503 75.5 27.4 10.4 14.8 13.4 96.2 1053 55-69 33.2 20.7 4.1 6.4 6.9 48.4 1167 66.8 41.6 8.1 12.9 13.8 97.4 548
Sex
Women 17.8 11.0 2.0 3.9 4.2 26.8 4381 63.3 39.0 7.3 13.9 14.9 95.5 1412 Men 22.7 4.5 3.0 3.6 2.2 25.6 3804 84.3 16.7 11.2 13.6 8.3 95.3 1210
Residence
Rural 21.3 8.9 2.7 3.9 3.6 27.9 4183 72.9 30.4 9.2 13.3 12.4 95.9 1456 Urban 16.5 4.0 2.0 3.4 1.9 20.3 4002 75.6 18.2 9.0 15.5 8.7 93.1 1166
Division
Barishal 30.4 21.2 10.2 0.8 8.7 37.0 986 78.6 54.9 26.4 2.1 22.4 95.5 394 Chattogram 20.5 11.9 3.9 0.7 2.8 26.7 1053 75.5 43.8 14.4 2.6 10.3 98.5 291 Dhaka Rural 16.2 3.0 0.2 1.7 4.0 18.9 997 76.6 14.2 1.1 7.9 18.7 89.4 257 Khulna 14.2 6.9 1.5 6.5 0.8 22.6 1040 57.4 27.9 6.2 26.5 3.3 91.8 261 Mymensingh 28.9 8.0 2.3 5.8 4.9 36.7 1021 74.4 20.7 5.9 15.1 12.6 94.7 423 Rajshahi 18.2 3.3 1.9 5.7 1.3 21.5 1066 83.4 15.3 8.7 26.3 6.0 98.4 226 Rangpur 19.5 4.0 1.9 11.4 1.8 28.0 1009 68.8 14.2 6.6 40.3 6.3 98.7 326 Sylhet 29.6 17.0 4.5 0.7 5.1 42.4 1013 68.7 39.5 10.4 1.6 11.9 98.3 444
Education
None/less than primary 29.6 13.7 4.4
6.1 5.5 40.2 2476 70.7 32.9 10.5 14.7 13.2 96.3 1619
Primary 15.9 4.7 1.6 2.8 2.2 19.5 3735 76.8 22.6 7.9 13.5 10.6 94.2 688 Secondary 10.0 1.7 0.3 0.4 0.4 10.5 1397 87.3 14.8 2.6 3.7 3.4 91.9 148 More than secondary 8.1 0.3 0.5 1.2
0.4 9.1
556 81.5 2.7 5.0 12.6 4.3 92.3 150
Wealth quintile
Lowest 26.9 11.2 2.4 7.1 5.1 35.8 1639 71.2 29.5 6.3 18.8 13.5 94.8 687 Second 26.1 10.8 4.9 4.3 4.8 33.5 1670 76.6 31.5 14.3 12.5 14.1 98.3 637 Middle 18.5 6.4 2.2 2.4 3.0 23.9 1451 73.5 25.5 8.9 9.6 11.9 94.9 478 Fourth 16.1 6.6 1.6 3.1 2.0 21.8 1506 71.0 28.9 6.9 13.7 8.9 96.0 417 Highest 13.1 3.9 1.5 1.9 1.2 15.9 1919 74.9 22.0 8.8 11.0 6.7 90.9 403 Total (18-39) 13.0 3.2 1.5 2.3 1.5 15.8 4515 76.9 18.6 9.0 13.5 8.8 93.2 1021 Total (40-69) 32.7 15.8 4.3 6.4 6.2 44.5 3670 71.2 34.5 9.3 13.9 13.6 96.8 1601 Total (25-69) 23.9 9.8 3.0 4.5 4.1 31.6 7159 72.3 29.7 9.1 13.6 12.3 95.7 2503 Total (18-69) 20.2 7.8 2.5 3.8 3.2 26.2 8185 73.4 28.2 9.2 13.7 11.7 95.4 2622

STEPS Bangladesh 2018
65
Table 4.4 Age at initiation of smoking: all respondents
Mean and median age at initiation of smoking among adult age 18-69 years who currently smoke any tobacco products by background characteristics, WHO STEP Survey for NCD Risk Factors, Bangladesh 2018
Background characteristics
Mean age at initiation of smoking
Median age at initiation of smoking
Number of respondents
Age 18-24 16.45 16 153 25-39 18.14 17 782 40-54 18.34 17 638 55-69 18.54 16 350
Sex
Women 24.50 20 37 Men 17.90 17 1886
Residence
Rural 18.10 17 1006 Urban 17.80 17 917
Division
Barishal 17.78 18 188 Chattogram 18.33 17 237 Dhaka Rural 17.96 18 234 Khulna 17.07 16 223 Mymensingh 16.70 16 277 Rajshahi 18.57 18 233 Rangpur 19.91 18 240 Sylhet 17.03 15 291
Education
None/less than primary 17.75 16 734 Primary 18.04 17 823 Secondary 18.83 18 276 More than secondary 18.50 18 89 Wealth quintile
Lowest 17.80 16 381 Second 18.01 16 441 Middle 18.21 17 381 Fourth 17.91 17 374 Highest 18.05 18 346
Total (18-39) 17.67 17 935 Total (40-69) 18.43 17 988 Total (25-69) 18.29 17 1770
Total (18-69) 18.0 17 1923

STEPS Bangladesh 2018
66
Table 4.5 Tobacco cessation
Percentage of adults age 18-69 years who tried to stop smoking in the past 12 months and who were advised to quit smoking during a visit to a health worker in the past 12 months by background characteristics, WHO STEP Survey for NCD Risk Factors, Bangladesh 2018
Background characteristics
Tried to stop smoking
Number of respondents
Advised to quit smoking
Number of respondents
Age
18-24 40.9 53 80.3 95 25-39 44.1 348 67.7 551 40-54 47.8 305 55.3 472 55-69 51.4 163 40.2 264
Sex
Women 44.4 37 65.8 29 Men 46.0 1886 60.3 1353
Residence
Rural 45.6 1006 60.1 731 Urban 47.4 917 61.6 651
Division
Barishal 36.0 188 72.1 145 Chattogram 44.0 237 58.8 151 Dhaka Rural 53.2 234 56.7 191 Khulna 53.8 223 67.8 188 Mymensingh 55.5 277 76.1 250 Rajshahi 41.5 233 49.6 132 Rangpur 29.6 240 54.2 174 Sylhet 40.2 291 51.8 151
Education
None/less than primary 45.5 1058 58.1 755 Primary 45.0 499 63.4 361 Secondary 42.2 184 61.2 131 More than secondary 56.1 181 66.8 134 Wealth quintile
Lowest 39.1 381 56.2 260 Second 40.8 441 60.9 318 Middle 50.3 381 64.8 279 Fourth 50.9 374 61.3 283 Highest 50.0 346 58.1 242
Total (18-39) 43.2 935 71.0 646 Total (40-69) 49.6 988 47.8 736 Total (25-69) 46.9 1770 57.1 1287 Total (18-69) 46.0 1923 60.5 1382

STEPS Bangladesh 2018
67
Table 4.6 Electronic cigarettes: all respondents
Percentage of adults age 18–69 years who heard about electronics cigarettes, ever used, currently using or correctly identified an e-cig by background characteristics, WHO STEP Survey for NCD Risk Factors, Bangladesh 2018
Background characteristics
Ever heard about e-Cigarettes
Number of respondents
Among those who heard about e-cigarettes
Ever used e-cigarettes
Currently using e-cigarettes
Correctly identified an e-cig
users
Age 18-24 16.0 1026 15.9 6.7 78.7 25-39 9.8 3482 13.0 8.6 92.3 40-54 5.1 2498 8.9 1.5 86.2 55-69 3.1 1164 2.7 2.3 93.0
Sex
Women 4.0 4367 0.0 0.0 60.9 Men 14.7 3803 16.8 8.5 93.1
Residence
Rural 7.8 4171 9.5 4.9 83.3 Urban 14.3 3999 20.1 10.1 90.3
Division
Barishal 6.1 986 3.3 0.0 87.8 Chattogram 8.6 1053 5.7 3.5 90.0 Dhaka Rural 13.0 997 18.0 8.2 92.9 Khulna 4.9 1038 8.4 0.4 79.3 Mymensingh 10.7 1020 2.9 1.4 75.1 Rajshahi 9.5 1066 20.3 8.6 72.3 Rangpur 6.1 1006 17.7 15.6 73.7 Sylhet 10.2 1004 15.9 12.6 94.3
Education
None/less than primary 4.1 3670 8.9 8.0 84.8 Primary 8.7 2530 20.7 7.5 87.2 Secondary 13.7 888 6.3 3.3 75.1 More than secondary 24.3 1064 13.0 7.0 91.8 Wealth quintile
Lowest 4.3 1633 4.0 1.2 86.6 Second 4.9 1669 3.4 3.6 72.3 Middle 11.1 1448 14.8 4.8 78.4 Fourth 8.3 1504 11.3 4.8 94.0 Highest 17.9 1916 17.9 10.9 90.0
Total (18-39) 12.1 4508 14.4 7.7 85.4 Total (40-69) 4.2 3662 6.8 1.8 88.3 Total (25-69) 7.2 7144 11.3 6.7 91.2 Total (18-69) 9.3 8170 13.2 6.7 85.9

STEPS Bangladesh 2018
68
Chapter 5 Alcohol
Key findings
Alcohol Consumption
• In 2018, the prevalence of current alcohol consumption (people who consumed alcohol
in the past 12 months) amongst all the adults was 4.4%. In addition, 1.5% of all adults
were current drinkers (consumed alcohol in the past 30 days). 91.4% of adults were
life-time abstainers and 4.4% were former drinks.
Heavy Episodic Drinking
• In the total population 0.8% of adults engaged in HED and amongst the current drinkers
(past 30 days), 52.5% adults engaged in HED21.
Unrecorded alcohol use
• In the total population, 0.3% of adults consumed unrecorded alcohol and amongst the
current drinkers22, 17.5% consumed unrecorded alcohol. Amongst the current drinkers,
the proportion of unrecorded alcohol consumed as a fraction of overall alcohol was only
0.15%.
Introduction
In 2016, the harmful use of alcohol resulted in some 3 million deaths (5.3% of all deaths)
worldwide and 5.1% of all DALYs in that year. Harmful use of alcohol caused some 1.7
million deaths from noncommunicable diseases in 2016, including some 1.2 million deaths
from digestive and cardiovascular diseases (0.6 million for each condition) and 0.4 million
deaths from cancers. Globally an estimated 0.9 million injury deaths were attributable to
alcohol, including around 370 000 deaths due to road injuries, 150 000 due to self-harm and
around 90 000 due to interpersonal violence. Of the road traffic injuries, 187 000 alcohol-
attributable deaths were among people other than drivers. In the World Health Organization
(WHO) South-East Asia Region, home to 1.9 billion people (29% of world’s population), 1 in
20 deaths were attributed to alcohol consumption23.
In 2018, WHO launched a SAFER initiative to reduce death, disease and injuries caused by
the harmful use of alcohol using high-impact, evidence-based, cost-effective interventions.
21 Even though the prevalence of HED in general population is low, often, the adults who engage in HED are at high risk of dependency. 22 For section 5.3, current drinkers are people who consumed alcohol in the past 30 days, unless specified otherwise. 23Global status report on alcohol and health 2018. Geneva: World Health Organization; 2018. Licence: CC BY-NC-SA 3.0 IGO

STEPS Bangladesh 2018
69
Current relevant policies and programs in Bangladesh for alcohol24
• Multisectoral Action Plan for the Prevention and Control of Non-Communicable Diseases
(2018–2025)10
• Bangladesh has had the intoxicant control act since the 1990s. The current policies
entail a total ban on alcohol advertisement, promotions and sponsorships. There is
provision for detection and penalties for marketing infringements. To restrict physical
availability the country uses tools like licensing at different levels of alcohol market
((imports, production, distribution, retail sales), restriction on the days/hours of sale, and
places and events where alcohol can be sold. Additionally, there is a ban on alcohol
consumption in public places, and a total prohibition of alcohol sales and consumption
(hence there is no legal minimum purchase age regulation).19 Moreover, it has drunk-
driving countermeasures such as specifying blood alcohol concentration limit (zero
tolerance) for general population and drivers, random breath testing and penalties for
drink driving. It also levies excise taxes on alcohol to reduce the affordability of alcoholic
beverages.
• SDG Goal 3.5 aims for a relative reduction of 10% in per capita alcohol consumption by
2025. The same goal has been part of nine global NCD indicators as well and has been
adopted in the Bangladesh’s multisectoral action plan as well.
This chapter focuses on indicators related to patterns of alcohol consumption, incidence of
heavy episodic drinking, including consumption of unrecorded alcohol. The survey used the
whole core module related to alcohol included in WHO STEPs questionnaire version 3.2.13
This information will help Bangladesh assess trends and progress towards alcohol control
targets specified in its multisectoral action plan as well as evaluation of current policies and
programs in place to reduce population alcohol consumption. These will also guide future
policy and programs to reduce alcohol intake at population level.
24 World Health Organization. 2019. Making South-East Asia SAFER from alcohol-related harm: Current status and way forward.

STEPS Bangladesh 2018
70
5.1 Alcohol consumption – life-time abstainers, former drinks, and current drinks25
The prevalence of alcohol consumption has been calculated by asking all the adults if they
have ever consumed alcohol (beer, wine, spirits, tari, cholai, ram, bangla, chuani, keru,
vodka, gin, whisky) and if they have consumed in the past 12 months and in the past 30
days. In 2018, the prevalence of current alcohol consumption (people who consumed
alcohol in the past 12 months) amongst all the adults was 4.4% and that of life-time
abstainers was 91.4%. 4.4% were former drinkers. 1.5% of all adults reported consuming
alcohol in the past 30 days.
Figure 5.26 Proportion of all adults (18-69 years) that consumed alcohol (former, current – consumption in past 12 months and 30 days), Bangladesh STEP Survey 2018
Patterns by background characteristics
• With an increase in age, the proportion of current drinkers (those who consumed in the
past 12 months and 30 days) declined. 7.7% adults in the age group 18-24 years were
current drinkers26, and this proportion declined with an increase in age, going down to
0.6% for adults in 55-69 years of age. Correspondingly, the proportion of life time
abstainers increased with an increase in age (not shown in graph27). See Figure 5.27
25 Alcohol use referenced includes current drinks who consumed alcohol in the past 12 months, unless otherwise stated) 26 (consumed alcohol in the past 12 months. For the purpose of section 5.1 current drinkers would
refer to people who consumed alcohol in the past 12 months, unless otherwise stated) 27 See Table 5.1
4.3% 4.4%
1.5%
0.0%
1.0%
2.0%
3.0%
4.0%
5.0%
Former drinkers (haven't consumedalcohol in past 12 months)
Current drinkers (consumed alcohol inthe past 12 month)
Current drinker (consumed alcohol inpast 30 days)

STEPS Bangladesh 2018
71
Figure 5.27 Differentials in proportion of current and former drinkers, amongst all adults age 18-69 years - by age, Bangladesh STEP Survey, 2018
• Men were significantly more likely to consume alcohol than women. 0.2% of women
were current drinkers28, compared to 8.7% of men.
• Urban areas had a higher current use of alcohol in the past 12 months as compared to
rural areas (6.5% versus 3.8%).
• Dhaka and Rajshahi had the highest prevalence of current alcohol consumption in the
country (6% for both), compared to the national average of 4.4%. Barishal had the
highest prevalence of current alcohol consumption, 1.1%. See
• Figure 5.28
Figure 5.28 Variations in proportion of current drinkers, amongst all adults age 18-69 years - by division, Bangladesh STEP Survey, 2018
• Proportion of current drinkers increased with an increase in the level of education and
increased with household wealth. The highest proportion of current drinkers (6.2%) had
28 Consumed alcohol in the past 12 months.
0.0%-1.1%
1.1%< - 2.7%
2.7%< - 4.3%
4.3%< - 6.0%
3%
8%
2%
5% 5%
2%
0%
5%
10%
15%
20%
Former drinkers (haven't consumedalcohol in past 12 months)
Current drinkers (consumed alcoholin the past 12 month)
Current drinker (consumed alcohol inpast 30 days)
18-24 25-39 40-54 55-69

STEPS Bangladesh 2018
72
more than secondary level of education and 6.6%, belonged to the highest wealth
quintile.
• Correpondingly though, the proportion of former drinkers also increased with an increase
in levels of education and wealth. see
• Figure 5.29 A & B.
Figure 5.29 Differentials in proportion of former and current drinkers, amongst all adults age 18-69 years - by levels of education (A) and wealth (B), Bangladesh STEP Survey, 2018
5.2 Heavy episodic drinking
Heavy episodic drinking (HED) is defined as consumption of 60 or more grams of pure
alcohol (6+ standard drinks in most countries) on at least one single occasion in the 30 days
prior to survey29. The indicator is presented in the overall population (among all adults
irrespective of their drinking status ) as well as among current drinkers only (those who
consumed any alcohol within the past 30 days). In the total population 0.8% of adults
engaged in HED and amongst the current drinkers, 52.5% adults engaged in HED30.
29 For section 5.2, current drinkers would refer to people who consumed alcohol in the past 30 days, unless otherwise specified. The denominator for the proportions of adults would be total population and current drinkers who consumed alcohol in the past 30 days. 30 Even though the prevalence of HED in general population is low, often, the adults who engage in HED are at high risk of dependency.
3.6% 3.6%1.2%
4.7% 5.0%2.0%
4.0% 3.8%1.4%
5.9% 6.2%
1.1%
0.0%
5.0%
10.0%
15.0%
20.0%
Former drinkers (haven't consumedalcohol in past 12 months)
Current drinkers (consumed alcohol inthe past 12 month)
Current drinker (consumed alcohol inpast 30 days)
A
None/less than primary Primary Secondary More than secondary
2.8% 2.7% 1.4%2.1% 3.4%1.1%
6.0%4.4%
1.9%4.9% 4.8%
1.5%
5.5% 6.6%
1.3%
0.0%
5.0%
10.0%
15.0%
20.0%
Former drinkers (haven't consumedalcohol in past 12 months)
Current drinkers (consumed alcohol inthe past 12 month)
Current drinker (consumed alcohol inpast 30 days)
B
Lowest Second Middle Fourth Highest

STEPS Bangladesh 2018
73
Patterns by background characteristics
• The incidence of HED drinking decreased with increasing age in the total population.
However, there was no significant pattern in HED amongst current drinkers. In the total
population, 1.6% of adults in the age group 18-24 years indulged in HED, which declined
to 0.2% among 55-69-year olds. Amongst current drinkers, the variation in incidence of
HED ranged from 46.5% to 63.6%.
Figure 5.30 Differentials in incidence of HED, amongst all adults (A) and amongst current drinkers (B), aged 18-69 years - by age, Bangladesh STEP Survey, 2018
• A higher proportion of men engaged in HED than women. 1.5% of men (in total
population) engaged in HED compared to 0.02% of women. However, amongst the
current drinkers, 55.1% of women engaged in HED, compared to 52.2% of men.
• Amongst the current drinkers, HED was higher in rural areas compared to urban areas
(55.1% versus 44.7%). There wasn’t any difference in prevalence of HED in urban and
rural areas, for the entire population.
• Barring Rajshahi (1.2%) and Sylhet (2.3%), the incidence of HED in all the other
divisions was less than 1% for the total population31. However, amongst the current
drinkers, there were massive variations in incidence of HED across divisions. The
highest being in Mymensingh (100%), Sylhet (86.8%) and Barishal (92%).32 Figure 5.31
31 See Table 5.2 32 HED in total population See Table 5.2
1.6%
0.6% 0.7%
0.2%
0.0%
1.0%
2.0%
HED-Total population
A
18-24 25-39 40-54 55-69
64%
37%
69%47%
0%
50%
100%
HED-Current Drinkers (past 30 days)
B
18-24 25-39 40-54 55-69

STEPS Bangladesh 2018
74
Figure 5.31 Variations in incidence of HED amongst current drinkers, aged 18-69 years - by division, Bangladesh STEP Survey, 2018
• While the engagement in HED drinking had no significant patterns with increase in levels
of education and wealth in the total population, the incidence of HED did follow a slight u-
shaped. There is no consistent trend of HED with household wealth.
• Amongst the current drinkers, there was a clear increase in incidence of HED with an
increase in education. The incidence of HED followed a similar slight u-shaped pattern
with an increase in wealth. Figure 5.32
Figure 5.32 Differentials in incidence of HED, amongst all adults (A) and amongst current drinkers (B), aged 18-69 years - by levels of education (IA and IB) and wealth (IIA and IIB), Bangladesh STEP Survey, 2018
0.5%
1.1% 1.0%0.8%
0.0%
0.5%
1.0%
1.5%
HED-Total population
I A
None/less than primary Primary
Secondary More than secondary
39%55%
71% 68%
0%
50%
100%
HED-Current Drinkers (past 30 days)
I B
None/less than primary Primary
Secondary More than secondary
92.0% 30.5%
38.5%
69.5%
100.0%
51.2%
50.7%
86.8%
0.0%-30.5%
30.5%< - 53.7%
53.7%< - 76.8%
76.8%< - 100.0%

STEPS Bangladesh 2018
75
5.3 Unrecorded Alcohol use
Unrecorded alcohol refers to alcohol that is not taxed in the country where it is consumed
because it is usually produced, distributed and sold outside the formal channels under
government control. Unrecorded alcohol consumption in a country includes consumption of
home-made or informally produced alcohol (legal or illegal), smuggled alcohol, alcohol
intended for industrial or medical uses and alcohol obtained through cross-border shopping
(which is recorded under a different jurisdiction). Sometimes, these alcoholic beverages are
traditional drinks that are produced and consumed in the community or in homes. Home-
made or informally produced alcoholic beverages are mostly fermented products made from
sorghum, millet, maize, rice, wheat or fruits. All adults who ever consumed alcohol were
asked if they consumed unrecorded alcohol (homebrewed, untaxed, cross-border or alcohol
not intended for drinking) in the past 7 days and the number of standard drinks of
unrecorded alcohol. In the total population, 0.3% of adults consumed unrecorded alcohol.
Patterns by background characteristics
• In the total population, the consumption of unrecorded alcohol was less than 0.5%
across all age groups, and followed a u-shaped pattern. Amongst the current drinkers,
the proportion of adults consuming unrecorded alcohol increased with an increase in
age. Mean percentage of unrecorded alcohol consumed as a fraction of total alcohol
consumption amongst current drinkers follows the same trend33. Figure 5.33.
33 See Table 5.3
0.5%
0.8%
1.2%
0.5%0.7%
0.0%
0.5%
1.0%
1.5%
HED-Total population
II A
Lowest Second Middle Fourth Highest
38%
76%64%
33%
53%
0%
20%
40%
60%
80%
HED-Current Drinkers (past 30 days)
II B
Lowest Second Middle Fourth Highest

STEPS Bangladesh 2018
76
Figure 5.33 Differentials in consumption of unrecorded alcohol, amongst all adults (A) and amongst current drinkers (B), aged 18-69 years - by age, Bangladesh STEP Survey, 2018
• 0.6% of men consumed unrecorded alcohol in the total population and 17.7% of men
consumed it amongst the current drinkers. No women reported any consumption of
unrecorded alcohol.
• There weren’t significant differentials in consumption of unrecorded alcohol in urban-rural
areas– both in the total population and amongst current drinkers.
• In the total population, the consumption of unrecorded alcohol was less than 0.5%
across all levels of education and wealth, and followed a slightly skewed u-shaped
pattern.
• Amongst the current drinkers, with increasing levels of education, there was a decrease
in consumption of unrecorded alcohol. 25.1% of adults with no or less than primary
education were the highest consumers of unrecorded alcohol, whereas only 6.9% and
9.2% of current drinkers, with secondary or more than secondary education reported
consuming unrecorded alcohol.
• There was no significant pattern in consumption of unrecorded alcohol and increase in
wealth.
0.1%
0.4%0.3%
0.2%
0.0%
0.2%
0.4%
0.6%
Unrecorded alcohol-Total Population
A
18-24 25-39 40-54 55-69
5%
21%31%
51%
0%
20%
40%
60%
Unrecorded alcohol-Current Drinkers (Past 30 days)
B
18-24 25-39 40-54 55-69

STEPS Bangladesh 2018
77
Figure 5.34 Differentials in consumption of unrecorded alcohol, amongst all adults (A) and amongst current drinkers (B), aged 18-69 years - by levels of education (IA and IB) and wealth (IIA and IIB), Bangladesh STEP Survey, 2018
List of Tables:
For more information on diet, see the following tables:
Table 5.1 Alcohol consumption: all participants: Percentage of people age 18-69 who are life
abstainers, former drinkers and current drinkers; by background characteristics
Table Alcohol 5.2 Heavy episodic drinking: in total population and among current drinkers
Table Alcohol 5.3 Consumption of unrecorded alcohol
0.2%
0.3%
0.4% 0.4%
0.0%
0.1%
0.2%
0.3%
0.4%
0.5%
unrecorded alcohol-Total population
II A
Lowest Second Middle Fourth Highest
15.1%
23.4%
16.7%
24.7%
0.0%
10.0%
20.0%
30.0%
unrecorded alcohol-Current Drinkers (past 30 days)
II B
Lowest Second Middle Fourth Highest
0.3%0.4%
0.1%0.2%
0.0%
0.1%
0.2%
0.3%
0.4%
unrecorded alcohol-Total population
I A
None/less than primary Primary
Secondary More than secondary
25%
16%
7%9%
0%
10%
20%
30%
unrecorded -Current Drinkers (past 30 days)
I B
None/less than primary Primary
Secondary More than secondary

STEPS Bangladesh 2018
78
Table 5.1 alcohol consumption: all participants
Percentage of people age 18-69 who are life abstainers, former drinkers and current drinkers; by background characteristics, [Bangladesh, 2018] Background
characteristic Life-time abstainers (Never consumed
alcohol)
Former drinkers (haven't consumed alcohol in past
12 months)
Current drinkers (consumed alcohol in the
past 12 month)
Consumed alcohol in past 12 months Current drinker (consumed alcohol
in past 30 days)
No. of People
Daily or almost daily
1-4 days/ week
1-3 days/months or < than a month
Age 18-24 89.4 2.9 7.7 0.0 0.388 7.296 2.4 1026 25-39 89.7 5.5 4.8 0.4 0.520 3.890 1.5 3489 40-54 93.3 4.1 2.6 0.1 0.252 2.297 1.0 2503 55-69 95.8 3.6 0.6 0.0 0.207 0.385 0.4 1167
Sex Women 99.6 0.2 0.2 0.0 0.020 0.139 0.0 4381 Men 82.9 8.4 8.7 0.4 0.758 7.587 2.9 3804
Residence Rural 92.5 3.7 3.8 0.2 0.411 3.164 1.4 4183 Urban 87.4 6.1 6.5 0.2 0.287 6.032 1.8 4002
Division Barishal 96.4 2.5 1.1 0.0 0.000 1.063 0.3 986 Chattogram 93.9 2.9 3.2 0.5 0.538 2.185 1.5 1053 Dhaka Rural 86.0 8.1 6.0 0.0 0.187 5.796 1.3 997 Khulna 92.2 3.8 4.0 0.0 0.000 4.013 1.3 1040 Mymensingh 96.5 1.9 1.6 0.0 0.161 1.432 0.6 1021 Rajshahi 90.9 3.2 6.0 0.3 0.427 5.285 2.3 1066 Rangpur 91.7 3.0 5.3 0.3 0.577 4.408 1.5 1009 Sylhet 92.0 3.7 4.4 0.2 1.554 2.621 2.7 1013
Education None/less than primary
92.8 3.6 3.6 0.4 0.3154 2.888 1.2 3678
Primary 90.3 4.7 5.0 0.1 0.5357 4.424 2.0 2533 Secondary 92.2 4.0 3.8 0.0 0.3104 3.511 1.4 888 More than secondary
88.0 5.9 6.2 0.0 0.32 5.846 1.1 1065
Wealth quintile Lowest 94.5 2.8 2.7 0.7 0.171 1.845 1.4 1639 Second 94.5 2.1 3.4 0.1 0.267 3.039 1.1 1670 Middle 89.7 6.0 4.4 0.1 0.479 3.817 1.9 1451 Fourth 90.3 4.9 4.8 0.0 0.444 4.356 1.5 1506 Highest 87.9 5.5 6.6 0.0 0.558 5.997 1.3 1919
Total (18-39) 89.6 4.5 5.9 0.2 0.470 5.171 1.9 4515 Total (40-69) 94.4 3.9 1.7 0.1 0.231 1.422 0.7 3670 Total (25-69) 92.0 4.7 3.3 0.2 0.382 2.710 1.1 7159 Total 18-69 91.4 4.3 4.4 0.2 0.4 3.8 1.5 8185

STEPS Bangladesh 2018
79
Table alcohol.5.2 Heavy episodic drinking: total
Percentage of population aged 18-69 years who engaged in heavy episodic drinking (drank 6 or more standard drinks in a single occasion) in the past 30 days, by background characteristics, [Bangladesh, 2018]
Background characteristic In total population Among current drinkers
Age
18-24 1.6 1026 63.6 20
25-39 0.6 3489 36.5 50
40-54 0.7 2503 69.2 27
55-69 0.2 1167 46.9 9
Sex
Women 0.0 4381 55.1 3
Men 1.5 3804 52.2 103
Residence
Rural 0.8 4183 55.1 43
Urban 0.8 4002 44.7 63
Division
Barishal 0.2 986 92.0 2
Chattogram 0.4 1053 30.5 18
Dhaka Rural 0.5 997 38.5 11
Khulna 0.9 1040 69.5 12
Mymensingh 0.6 1021 100.0 7
Rajshahi 1.2 1066 51.2 15
Rangpur 0.7 1009 50.7 17
Sylhet 2.3 1013 86.8 24
Education
None/less than primary 0.5 3678 39.2 42
Primary 1.1 2533 54.5 41
Secondary 1.0 888 70.9 15
More than secondary 0.8 1065 67.9 8
Wealth quintile
Lowest 0.5 1639 37.5 19
Second 0.8 1670 75.6 16
Middle 1.2 1451 63.7 22
Fourth 0.5 1506 33.1 26
Highest 0.7 1919 53.4 23
Total (18-39) 0.9 4515 49.8 70
Total (40-69) 0.5 3670 63.0 36
Total (25-69) 0.5 7159 44.64 86
Total 18-69 0.8 8185 52.2 106

STEPS Bangladesh 2018
80
Table Alcohol 5.3 Consumption of unrecorded alcohol
Percentage of population aged 18-69 years who reporting consuming unrecorded alcohol* in the past 7 days in the past 30 days, by background characteristics, [Bangladesh, 2018]
Background characteristic
In total population
Percentage of current drinkers who drank unrecorded alcohol in the past 7 days
All %
n All % N Mean percentage of total unrecorded alcohol out of total alcohol drank in the last 7 days
Age 18-24 0.1 1026 5.3 20 0.1 25-39 0.4 3489 21.1 45 0.2 40-54 0.3 2503 30.8 26 0.2 55-69 0.2 1167 51.3 9 0.2
Sex Women 0.0 4381 0.0 3 0.0 Men 0.6 3804 17.7 97 0.2
Residence Rural 0.3 4183 18.4 42 0.2 Urban 0.4 4002 15.2 58 0.1
Division Barishal 0.0 986 8.0 2 0.0 Chattogram 0.1 1053 8.5 18 0.0 Dhaka Rural 0.2 997 14.4 11 0.1 Khulna 0.6 1040 33.9 9 0.3 Mymensingh 0.1 1021 13.6 7 0.1 Rajshahi 0.1 1066 4.0 14 0.0 Rangpur 0.5 1009 35.4 16 0.4 Sylhet 1.0 1013 38.1 23 0.3
Education None/less than primary 0.3 3678 25.1 41 0.2 Primary 0.4 2533 15.7 39 0.1 Secondary 0.1 888 6.9 13 0.1 More than secondary 0.2 1065 9.2 7 0.1 Wealth quintile
Lowest 0.2 1639 15.1 19 0.2 Second 0.3 1670 23.4 15 0.2 Middle 0.4 1451 16.7 19 0.1 Fourth 0.4 1506 24.7 24 0.2 Highest 0.1 1919 8.2 23 0.1
Total (18-39) 0.3 4515 13.1 65 0.1 Total (40-69) 0.3 3670 36.6 35 0.2 Total (25-69) 0.3 7159 26.1 27 0.2 Total 18-69 0.3 8185 17.5 100 0.15
Current drinkers who consumed alcohol in the past 30 days

STEPS Bangladesh 2018
81
Chapter 6 Diet
Key findings
Consumption of fruits and vegetables and knowledge:
o Average servings of fruits and vegetables consumed per day: 2.6 servings (0.4
servings of fruit and 2.3 servings of vegetables per day).
o Prevalence of insufficient fruits and vegetables intake (< 5 servings a day): 89.6% in
adults (89.3% women, 90.0% men).
Knowledge on recommended intake for fruits and vegetables:
o Knowledge on recommended intake: Only 11.3% of adults reported the correct
servings for recommended fruits and vegetables intake per day (12.5% women; 10.1%
men).
Fats and oils used for cooking:
o Cooking oil/fats: Soybean oil (89.4%) is the most commonly used cooking oil for food
preparation followed mustard oil (8.9%) and palm oil (1.2%).
Consumption of outside-of-home meals and snacks:
o Meals eaten at a restaurant or takeaway per week: 1.2 times
o Snacks eaten per day: 0.8 times
Introduction
An unhealthy diet is one of the 5 main risk factors for NCDs and the promotion of a healthy
diet is one of the recommended components for policies and programs in the Global Action
Plan against NCDs34. WHO recommends mean population intake of least 5 servings (400g)
of fruits and vegetables as part of a healthy balanced diet which provides a rich mix of
nutrients and bioactive substances for the prevention of diet-related non-communicable
diseases35.
This chapter summarizes average fruits and vegetables consumption levels to reflect
national average intake as well as populational knowledge on dietary recommendations on
servings of fruits and vegetables to be consumed. Additionally, information on oils and fats
used for meal preparation and average number of meals per day eaten that were not
prepared at home were also summarized. The indicators presented will help Bangladesh
34 World Health Organization. The Updated Appendix of 3 of the Global Action Plan for the Prevention and Control of NCDs 2013-2020. World Health Organization. Global action plan for the prevention and control of NCDs 2013-2020. Geneva. 35 Joint WHO/FAO Consultation on Diet, Nutrition and the Prevention of Chronic Diseases (2002: Geneva, Switzerland)
Diet, nutrition and the prevention of chronic diseases: report of a joint WHO/FAO expert consultation, Geneva, 28 January – 1 February 2002.

STEPS Bangladesh 2018
82
assess current trends in dietary patterns and guide policy and programs targeting the
improvement of population dietary intake. Salt intake is summarized in Chapter-6.
Summary of current national policy and programs10:
• Multisectoral Action Plan for the Prevention and Control of Non-Communicable
Diseases 2018-2025
• The Food Safety Act 2013 of Bangladesh provides basis to ensure safe food
products including content labeling. Promote nutritional labeling, according to but not
limited to international standards, in particular the Codex Alimentarius, for all pre-
packaged foods including those for which nutrition or health claims are made.
• Disseminate the Bangladesh national dietary recommendations in mass media and
through other channels.
• Conduct public campaigns through mass media and social media to inform
consumers about a healthy diet that is high in fruits and vegetables and low in
saturated fats, sugars and salt.
• Implement national salt reduction campaigns in mass media, schools and institutions.
• Support consumer protection groups in Bangladesh to advocate and discourage
marketing of unhealthy foods and non-alcoholic beverages to children.
• Increase collaboration between salt/sodium reduction programmes and salt iodization
programmes for increased public health gains and higher programme efficiency.
• Place a higher tax on sugar-sweetened beverages.
• Conduct counter advertisement to regulate marketing of unhealthy foods.
• Ban advertising, promotion and sponsorship of unhealthy diet.
6.1 Consumption of fruits and vegetables
Information on consumption levels of fruits and vegetables amongst adults was elicited by
asking number of days fruits and vegetables are consumed and usual number of servings
consumed each of these days.
Average daily consumption of fruits and vegetables was 2.6 servings amongst adults.
Average daily fruit consumption was 0.4 servings compared with average daily vegetable
consumption of 2.3 servings. The prevalence of inadequate intake of fruits and vegetables
per day (i.e. less than 5 servings a day) was 89.6% (Table 6.1 and Table 6.2).

STEPS Bangladesh 2018
83
Patterns by background characteristics (Table 6.1 and Table 6.2):
• Younger adults, urban residents, and
those who are more educated (Figure 6.1) and
wealthier (Figure 6.2) have higher average
fruit consumption than their counterparts.
• Vegetable intake did not vary
significantly by age, sex, level of education
(Figure 6.1) or household wealth (Figure 6.2).
• Adults aged 25-39 had the lowest
prevalence of inadequate fruits and vegetables
intake and the highest prevalence was amongst
adults aged 55-69.
• Prevalence of inadequate fruits and vegetables intakes are higher amongst adults
who are urban residents, with lower education and are less wealthy (Figure 6.3)
• Highest prevalence of inadequate consumption of fruits and vegetable was in
Rangpur (95.6%), and lowest was in Khulna (72.1%).
6.2 Knowledge on recommended fruits and
vegetable intakes
Only 11.3% of adults reported the correct amount of
servings for recommended intake of fruits and
vegetables. This question is included in the Bangladesh
survey for the first time.
0.2 0.3 0.4 0.4 0.6
2.1 2.12.4 2.3
2.4
0.0
1.0
2.0
3.0
4.0
Lowest Second Middle Fourth Highest
serv
ings p
er
day
Figure 6.2 Fruits and vegetables intake by wealth amongst adults aged 18-69,
Bangladesh STEPs Survey 2018
Fruits Vegetables
0.2 0.4 0.5 0.6
2.12.4 2.3 2.3
0.0
0.5
1.0
1.5
2.0
2.5
3.0
3.5
Noeducation
Primary Secondary More thansecondary
Serv
ings p
er
day
Figure 6.1 Fruits and vegetables intake by education amongst adults
aged 18-69, Bangladesh STEPs Survey 2018
Fruits Vegetables
92.292.290.8
88.9
87.186.4
92.1
88.9
91.1
88.1 87.6
82
84
86
88
90
92
94
Rural vs Urban Increasing levels ofeducation
Increasing levels ofwealth
Perc
ent
Figure 6.3 Differentials in prevalence of inadequate intakes of fruits and vegetables by residence,
education and wealth amongst adults aged 18-69, Bangladesh STEPs Survey 2018

STEPS Bangladesh 2018
84
Patterns by background characteristics (Table 6.3):
• The proportion of adults with correct knowledge is low across all age groups.
• Adults who are women, rural residents and more educated (Figure 6.4) are more
aware of the recommendation.
• Adults with the highest household wealth are most aware of recommendations
however large variation exists across other wealth quintiles.
• Awareness is high in Khulna (33.4%), Mymensingh (16.6%) and Sylhet (26.3%),
which are also the divisions with the highest prevalence of adequate fruits and
vegetables intakes as noted before. ( Figure 6.6)
6.3 Fats and oils used for cooking and outside-of-home food consumption (Table 6.4)
Most commonly used cooking oil for food preparation is soybean oil (89.4%) followed by
mustard oil (8.9%) and palm oil (1.2%).
Patterns by background characteristics
(Table 5.4):
• Use of soybean oil increases with
increased wealth and education level,
while the opposite occurs with mustard oil
(Figure 6.5 and Figure 6.6).
83.3
14.8
86.6
10.6
91.7
7.4
91.7
7.7
94.0
3.9
0.0
20.0
40.0
60.0
80.0
100.0
Soybean Oil Mustard Oil
Perc
ent
Figure 6.5 Use of cooking oils by wealth amongst adults aged 18-69, Bangladesh
STEPs Survey 2018
Lowest Second Middle Fourth Highest
41.2 44.1 45.455.4
0.0
20.0
40.0
60.0
Noeducation
Primary Secondary More thansecondary
Perc
ent
Figure 6.4 Awareness of recommendations for fruits and vegetables intake by education
amognst adults aged 18-69, Bangaldesh STEPS Survey 2018
87.6
10.5
89.4
9.2
94.7
4.6
91.0
6.7
0.0
20.0
40.0
60.0
80.0
100.0
Soybean Oil Mustard Oil
Perc
ent
Figure 6.6 Use of cooking oils by education amongst adults aged 18-69,
Bangladesh STEPs Survey 2018
No education Primary Secondary More than secondary

STEPS Bangladesh 2018
85
6.4 Consumption of outside-of-home meals and snacks (Table 6.5)
Adults eat on average 1.2 times per week meals from a restaurant or takeaway and eat
snacks such as singara, samucha, puri, chips and chanachur 0.8 times per day.
Patterns by background characteristics (Table 6.5):
• Adults who are men, younger and urban residents consume meals from outside-of-
home significantly and snacks more often than their counterpart.
• Consumption of outside-of-home meals did not differ by education or household
wealth.
• Consumption of snacks increased with increased household wealth
List of Tables:
For more information on diet, see the following tables:
Table Diet 6.1 Mean Servings of fruit and vegetable consumption.
Table Diet 6.2 Prevalence of adequate consumption of fruits and vegetable
Table Diet 6.3 Knowledge on adequate fruits and vegetable recommendations
Table Diet 6.4 Types of oil or fat most often used for meal preparation
Table Diet 6.5 Frequency of eating meals not prepared at a home

STEPS Bangladesh 2018
86
Table Diet.6.1 Mean Servings of fruit and vegetable consumption: Total
Mean number of servings of fruit and vegetable intake per day of adults aged 18-69, according to background characteristics [Bangladesh 2018]
Background characteristic Mean servings of fruit intake per day:
Mean servings of vegetable intake per day:
Mean servings of fruit and vegetable intake per day*:
Mean 95% CI Number of adults
Mean 95% CI Number of adults
Mean 95% CI Number of adults
Age 18-24 0.4 0.4 0.5 1016 2.3 2.1 2.5 1020 2.7 2.5 2.9 1026 25-39 0.4 0.3 0.4 3396 2.4 2.2 2.5 3456 2.7 2.6 2.9 3483 40-54 0.3 0.3 0.3 2413 2.2 2.1 2.3 2485 2.5 2.3 2.6 2499 55-69 0.3 0.2 0.3 1106 2.1 1.9 2.2 1151 2.3 2.1 2.5 1161 Sex
Women 0.4 0.3 0.4 4336 2.4 2.2 2.5 4342 2.7 2.6 2.8 4379 Men 0.4 0.3 0.4 3595 2.2 2.0 2.3 3779 2.5 2.3 2.7 3790 Residence
Rural 0.3 0.3 0.4 4034 2.4 2.2 2.5 4148 2.7 2.5 2.8 4173 Urban 0.5 0.4 0.5 3897 1.9 1.8 2.1 3973 2.4 2.2 2.5 3996 Division
Barishal 0.3 0.3 0.4 976 1.7 1.5 1.9 983 2.0 1.7 2.3 986 Chattogram 0.3 0.2 0.3 1037 2.0 1.7 2.2 1052 2.3 2.0 2.5 1052 Dhaka Rural 0.4 0.3 0.5 992 2.0 1.8 2.2 996 2.4 2.2 2.6 997 Khulna 0.6 0.5 0.7 1025 3.4 2.9 3.9 1005 3.9 3.4 4.4 1039 Mymensingh 0.3 0.2 0.3 969 2.6 2.3 3.0 1016 2.9 2.5 3.3 1017 Rajdhani 0.3 0.3 0.4 1038 2.2 2.0 2.4 1053 2.5 2.2 2.8 1060 Rangpur 0.3 0.2 0.3 939 1.8 1.6 1.9 1005 2.0 1.8 2.2 1006 Sylhet 0.3 0.2 0.3 955 3.2 2.8 3.7 1011 3.5 3.0 3.9 1012 Education
No education 0.2 0.2 0.2 3517 2.1 2.0 2.3 3639 2.3 2.2 2.5 3668 Primary 0.4 0.4 0.5 2473 2.4 2.3 2.6 2517 2.8 2.7 3.0 2530 Secondary 0.5 0.4 0.5 874 2.3 2.1 2.5 883 2.7 2.5 3.0 886 More than secondary 0.6 0.5 0.7 1047 2.3 2.1 2.5 1061 2.9 2.7 3.1 1064 Wealth quintile
Lowest 0.2 0.1 0.2 1565 2.1 2.0 2.3 1612 2.3 2.1 2.5 1631 Second 0.3 0.2 0.3 1606 2.1 2.0 2.3 1657 2.4 2.2 2.5 1668 Middle 0.4 0.3 0.4 1400 2.4 2.3 2.7 1443 2.9 2.7 3.1 1450 Fourth 0.4 0.3 0.4 1471 2.3 2.1 2.4 1497 2.6 2.4 2.8 1501 Highest 0.6 0.6 0.7 1889 2.4 2.1 2.5 1912 2.9 2.7 3.1 1919
Total (18-39) 0.4 0.4 0.4 4412 2.3 2.2 2.4 4485 2.7 2.6 2.8 4509 Total (40-69) 0.3 0.3 0.3 3519 2.1 2.0 2.3 3636 2.4 2.3 2.5 3660 Total (25-69) 0.3 0.3 0.4 6915 2.3 2.1 2.4 7101 2.6 2.5 2.7 7143 Total (18-69) 0.4 0.3 0.4 7931 2.3 2.2 2.4 8121 2.6 2.5 2.7 8169 *Respondents who's response was missing or who's response was "don't know" to one of either fruit or vegetable intake questions were assumed to be 0 and summed to produce mean fruits and vegetables intake. Respondents who's response was either missing or who's response was "don't know" to both fruits and vegetables intake questions were excluded from the total sample.

STEPS Bangladesh 2018
87
Table Diet.6.2 Prevalence of adequate consumption of fruits and vegetable*
Background characteristic
Total
Women
Men
<5 servings/ day
>= 5 servings/day Number of respondents (N)
<5 servings/ day
>= 5 servings/day Number of women (N)
<5 servings/ day
> =5 servings/day Number of men (N)
Age
18-24 90.5 9.5 1026
89.7 10.3 621
91.4 8.6 405 25-39 87.3 12.7 3483
86.6 13.4 2017
88.0 12.1 1466
40-54 91.1 8.9 2499
91.6 8.4 1284
90.6 9.4 1215 55-69 92.3 7.7 1161
93.1 7.0 457
91.7 8.3 704
Sex
Women 89.3 10.7 4379
N/A N/A N/A
N/A N/A N/A Men 90.0 10.1 3790
N/A N/A N/A
N/A N/A N/A
Residence
Rural 88.9 11.1 4173
88.7 11.3 2263
89.1 10.9 1910 Urban 92.1 7.9 3996
91.5 8.5 2116
92.7 7.3 1880
Division
Barishal 94.9 5.1 986
93.1 6.9 540
96.9 3.1 446 Chattogram 94.9 5.1 1052
98.3 1.7 552
90.8 9.2 500
Dhaka 94.0 6.0 997
94.1 5.9 520
93.9 6.1 477 Khulna 72.1 27.9 1039
80.8 19.3 559
63.8 36.2 480
Mymensingh 83.0 17.1 1017
69.9 30.1 552
98.5 1.5 465 Rajdhani 92.8 7.2 1060
91.0 9.1 569
94.4 5.6 491
Rangpur 95.6 4.4 1006
93.6 6.4 542
97.6 2.4 464 Sylhet 76.5 23.5 1012
71.3 28.7 545
82.2 17.8 467
Education
No education 92.2 7.8 3668
92.8 7.2 1958
91.5 8.5 1710 Primary 87.1 12.9 2530
86.9 13.1 1525
87.3 12.7 1005
Secondary 88.9 11.1 886
89.3 10.7 434
88.4 11.6 452 More than secondary 88.1 11.9 1064
82.1 17.9 441
91.4 8.6 623
Wealth quintile
Lowest 92.2 7.8 1631
91.0 9.1 977
93.9 6.1 654 Second 90.8 9.2 1668
91.3 8.7 911
90.2 9.8 757
Middle 86.4 13.6 1450
85.5 14.5 725
87.1 12.9 725 Fourth 91.1 8.9 1501
90.2 9.8 718
92.0 8.0 783
Highest 87.6 12.4 1919
88.0 12.0 1048
87.1 12.9 871 Total (18-39) 88.5 11.5 4509
87.8 12.2 2638
89.2 10.8 1871
Total (40-69) 91.7 8.3 3660
92.2 7.8 1741
91.1 8.9 1919 Total (25-69) 89.4 10.6 7143
89.2 10.8 3758
89.5 10.5 3385
Total (18-69) 89.6 10.4 8169
89.3 10.7 4379
90.0 10.1 3790 *Respondents who's response was missing or who's response was "don't know" to one of either fruit or vegetable intake questions were assumed to be 0 and summed to produce mean fruits and vegetables intake. Respondents who's response was either missing or who's response was "don't know" to both fruits and vegetables intake questions were excluded from the total sample.

STEPS Bangladesh 2018
88
Table Diet.6.3 Knowledge on adequate fruits and vegetable recommendations
Percent of men and women aged 18-69 who are aware of adequate fruits and vegetables intake recommendations, according to background characteristics [Bangladesh, 2018]
Background characteristic
Total
Women
Men
<5 servings
/ day)
>= 5 servings/
day
Don't know
Number of
adults (N)
<5
servings / day)
>= 5 servings/
day
Don't know
Number of
women (N)
<5
servings / day)
>= 5 servings/
day
Don't know
Number of men
(N)
Age
18-24 47.3 11.9 40.8 1026
50.6 12.9 36.5 621
43.2 10.7 46.1 405 25-39 45.2 11.7 43.1 3489
50.1 14.1 35.8 2019
40.1 9.3 50.7 1470
40-54 44.4 11.5 44.1 2503
51.0 11.5 37.5 1284
37.7 11.6 50.7 1219 55-69 38.0 9.2 52.8 1167
42.8 8.5 48.7 457
34.1 9.7 56.2 710
Sex
Women 49.4 12.5 38.2 4381
N/A N/A N/A N/A
N/A N/A N/A N/A Men 39.2 10.1 50.7 3804
N/A N/A N/A N/A
N/A N/A N/A N/A
Residence
Rural 44.2 12.2 43.7 4183
49.6 13.5 36.9 2264
38.5 10.8 50.8 1919 Urban 44.9 8.3 46.7 4002
48.5 8.7 42.7 2117
41.5 8.0 50.5 1885
Division
Barishal 43.8 2.2 54.0 986
28.5 2.5 68.9 540
60.0 1.8 38.2 446 Chattogram 61.0 5.0 34.1 1053
73.8 3.6 22.6 552
45.5 6.6 47.9 501
Dhaka Rural 37.9 7.8 54.3 997
30.3 6.5 63.2 520
45.1 9.2 45.7 477 Khulna 22.7 33.4 43.8 1040
25.6 34.8 39.6 560
20.0 32.1 47.9 480
Mymensingh 56.6 16.6 26.8 1021
43.0 24.9 32.1 552
72.7 6.8 20.5 469 Rajdhani 47.2 7.4 45.4 1066
68.6 4.0 27.3 569
28.3 10.4 61.4 497
Rangpur 43.9 3.2 52.9 1009
71.7 5.6 22.8 543
16.8 0.9 82.3 466 Sylhet 34.2 26.3 39.4 1013
35.9 42.2 21.9 545
32.4 8.9 58.7 468
Education
No education 41.2 10.2 48.6 3678
47.7 10.6 41.8 1960
34.4 9.9 55.7 1718 Primary 44.1 12.6 43.3 2533
49.3 15.6 35.1 1525
37.2 8.6 54.2 1008
Secondary 45.4 10.0 44.6 888
47.7 9.9 42.4 434
43.3 10.2 46.6 454 More than secondary
55.4 13.4 31.2 1065
61.6 13.4 25.0 441
52.0 13.4 34.7 624
Wealth quintile
Lowest 42.4 9.7 48.0 1639
50.9 11.9 37.2 978
31.2 6.7 62.2 661 Second 42.4 11.8 45.8 1670
49.6 14.3 36.1 912
34.8 9.2 56.0 758
Middle 46.0 12.5 41.5 1451
54.0 13.6 32.5 725
39.9 11.6 48.5 726 Fourth 43.4 9.3 47.3 1506
46.7 10.8 42.5 718
40.2 7.9 51.9 788
Highest 47.7 13.3 39.0 1919
46.2 11.8 42.0 1048
49.4 15.1 35.6 871
Total (18-39) 46.0 11.8 42.2 4515
50.3 13.6 36.1 2640
41.2 9.8 49.0 1875 Total (40-69) 41.5 10.4 48.1 3670
47.5 10.2 42.3 1741
36.0 10.6 53.4 1929
Total (25-69) 43.4 11.1 45.5 7159
48.9 12.3 38.8 3760
38.0 9.9 52.0 3399
Total (18-69) 44.3 11.3 44.3 8185 49.4 12.5 38.2 4381 39.2 10.1 50.7 3804

STEPS Bangladesh 2018
89
Table Diet.6.4 Types of oil or fat most often used for meal preparation
Percent of adults (18-69) who responded to using different types of oils/fat for meal preparation, according to background characteristics [Bangladesh, 2018]
Background characteristic
Percent of adults who responded to using different types of oils/fat for meal preparation:
Number of respondents (N) Soybean
Oil Palm Oil
Mustard Oil
Sunflower oil/Rice bran/ Ghee/ Others
Total (%)
Age
18-24 91.8 1.0 7.0 0.2 100.0 1026 25-39 89.6 1.0 8.9 0.5 100.0 3489 40-54 87.9 2.0 9.4 0.7 100.0 2503 55-69 87.5 0.9 11.1 0.5 100.0 1167 Sex
Women 90.2 1.1 8.2 0.5 100.0 4381 Men 88.7 1.4 9.6 0.4 100.0 3804 Residence
Rural 88.0 1.2 10.5 0.2 100.0 4183 Urban 94.3 1.1 3.4 1.1 100.0 4002 Division
Barishal 79.5 11.5 8.9 0.1 100.0 986 Chattogram 92.5 0.4 7.0 0.1 100.0 1053 Dhaka Rural 92.3 0.6 6.1 1.0 100.0 997 Khulna 91.7 0.8 7.2 0.3 100.0 1040 Mymensingh 85.2 0.4 14.4 0.0 100.0 1021 Rajshahi 83.7 0.7 15.5 0.1 100.0 1066 Rangpur 87.5 0.7 11.6 0.2 100.0 1009 Sylhet 93.7 0.9 3.8 1.6 100.0 1013 Education
No education 87.6 1.8 10.5 0.1 100.0 3678 Primary 89.4 1.1 9.2 0.3 100.0 2533 Secondary 94.7 0.3 4.6 0.4 100.0 888 More than secondary 91.0 0.5 6.7 1.8 100.0 1065 Wealth quintile
Lowest 83.3 1.8 14.8 0.1 100.0 1639 Second 86.6 2.5 10.6 0.2 100.0 1670 Middle 91.7 0.8 7.4 0.1 100.0 1451 Fourth 91.7 0.5 7.7 0.1 100.0 1506 Highest 94.0 0.2 3.9 1.8 100.0 1919
Total (18-39) 90.4 1.0 8.2 0.4 100.0 4515 Total (40-69) 87.7 1.5 10.2 0.6 100.0 3670 Total (25-69) 88.7 1.3 9.5 0.5 100.0 7159 Total (18-69) 89.4 1.2 8.9 0.5 100.0 8185

STEPS Bangladesh 2018
90
Table Diet 6.5 Frequency of eating meals not prepared at a home
Mean number of times adults aged 18-69 eat in a restaurant or take away per week; mean number of times eat snacks per day, according to background characteristics [Bangladesh,2018]
Background characteristic
Mean number of times eat in a restaurant or take away per week:
Mean number of times eat snacks* per day
Mean 95%CI Number of respondents (n)
Mean 95%CI Number of
respondents (n)
Age
18-24 1.3 1.1 1.6 999
1.0 0.9 1.1 1014
25-39 1.4 1.3 1.6 3394
0.9 0.8 1.0 3422
40-54 1.2 1.1 1.4 2397
0.6 0.6 0.7 2416
55-69 0.7 0.5 0.8 1116
0.4 0.3 0.5 1122
Sex
Women 0.3 0.2 0.4 4339
0.6 0.5 0.7 4343
Men 2.2 2.0 2.4 3567
0.9 0.8 1.0 3631
Residence
Rural 1.1 1.0 1.2 4025
0.7 0.6 0.8 4084
Urban 1.7 1.5 2.0 3881
1.0 0.9 1.1 3890
Division
Barishal 0.9 0.7 1.1 983
0.6 0.5 0.8 985
Chattogram 1.6 1.2 2.0 1038
0.8 0.6 0.9 1041
Dhaka 1.0 0.8 1.3 991
0.8 0.6 0.9 993
Khulna 0.7 0.5 0.9 1036
1.1 0.9 1.2 1039
Mymensingh 0.9 0.7 1.1 912
0.6 0.4 0.8 929
Rajshahi 1.5 1.2 1.8 1059
0.5 0.3 0.7 1059
Rangpur 1.7 1.4 2.1 967
1.0 0.8 1.3 972
Sylhet 1.3 1.0 1.6 920
0.8 0.7 0.9 956
Education
No education 1.3 1.1 1.5 3548
0.6 0.6 0.7 3573
Primary 1.2 1.0 1.4 2450
0.9 0.8 0.9 2469
Secondary 1.2 0.9 1.4 859
0.9 0.8 1.0 877
More than secondary
1.2 0.9 1.4 1029
0.9 0.8 1.0 1034
Wealth quintile
Lowest 1.0 0.8 1.2 1586
0.6 0.5 0.7 1593
Second 1.3 1.1 1.6 1606
0.7 0.6 0.8 1628
Middle 1.3 1.1 1.5 1390
0.9 0.8 1.0 1407
Fourth 1.3 1.1 1.5 1460
0.7 0.7 0.8 1470
Highest 1.2 1.0 1.5 1864
0.9 0.8 1.0 1876
Total (18-39) 1.4 1.2 1.5 4393
0.9 0.8 1.0 4436
Total (40-69) 1.0 0.8 1.1 3513
0.5 0.5 0.6 3538
Total (25-69) 1.2 1.1 1.3 6907
0.7 0.7 0.8 6960
Total (18-69) 1.2 1.1 1.4 7906
0.8 0.7 0.8 7974
*snacks suggested include: singara, samucha, puri, chips, chanachur, fuchka, chotpoti, jhal muri, salted biscuits etc.

STEPS Bangladesh 2018
91
Chapter 7 Dietary Salt
Key findings
Estimated salt intake
o Estimated average population salt intake based on spot urine testing is 9.0 grams per
day (9.0g/d women, 9.0 g/d men)
Behaviors around dietary salt intake
o Adding salt to foods while eating: 48.2% of adults (51.5% of women, 44.9% of men)
reported adding salt often or always to food right before or while eating.
o Adding salty sauces to foods while eating: 1.8% of adults (1.3% of women, 2.3% of
men) reported adding salty sauce often or always to food right before or while eating.
o Consumption of processed foods: 13.5% of adults (16.0% of women, 10.9% of men)
reported consuming processed foods often or always that are high in salt.
Perceptions about levels of salt intake
o Perception of salt intake: 61.2% of adults perceived their salt intake to be “just right”
and only 13.5% of adults perceived it to be’ far too much or too much’.
o Importance of salt reduction: 69.6 % of adults (70.0% of women, 69.2% of men) think
that lowering salt is very important or somewhat important.
Knowledge on salt intake, recommendations and health consequences
o Knowledge on recommended intake: 73.9% of adults (73.6% of women, 74.2% of
men) had incorrect knowledge on or did not know of the maximum amount of salt
recommended for optimum health.
o Knowledge on health consequences: 36.8% of adults (32.6% of women, 41.2% of
men) correctly identified the health consequences related to excessive salt or salty
sauce intake.
Practices and methods to reduce salt intake
o 10.8% of adults (14.4% of women, 7.1% of men) reported currently doing something
to reduce salt intake.
o The most common method reported to reduce salt intake was stopping or reducing
added salt (93.3%); avoid eating foods prepared outside of home (66.2%); avoiding
or minimizing consumption of processed foods (60.2%).
Introduction
Excessive salt intake is a major risk factor for hypertension, which is a major cause of premature
deaths worldwide. WHO recommends consuming less than 2 grams of sodium or 5 grams of
salt per day amongst adults to reduce blood pressure and the risk of cardiovascular disease,

STEPS Bangladesh 2018
92
stroke and coronary heart disease36. Policies to reduce salt intake (food product reformulation;
establishing supportive environment in public institutions; communication and mass media
campaigns; front-of-pack labelling) at population-level are one of the most cost-effective
interventions or ‘best buys’ to prevent and control non-communicable diseases37.
A 30% relative reduction in mean population intake of salt/sodium by 2025 relative to 2010 levels
is one of the nine voluntary global targets set under WHO global action plan38. Bangladesh has
also incorporated it as one of the key targets in its 3-year multisectoral action plan for 2018-
202510 and its predecessor39.
This chapter focuses on indicators related to dietary sodium intake by estimating average
population 24-hour salt intake based on spot urine sodium and creatinine levels; assessing the
knowledge, behaviours, perceptions and practice around salt intake. This information will help
Bangladesh assess trends and progress towards salt intake targets specified in its multisectoral
action plan as well as evaluation of current policies and programs in place to reduce population
salt-intake. These will also guide future policy and programs to reduce salt intake at population
level.
Current relevant policies and programs in Bangladesh for control of salt intake4:
• Food Item Based Dietary Guidelines (in development)
• Food labelling required based under The Food Safety Act 2013
• Regulation of salt content through Bangladesh Standards and Testing Institute
(BSTI) and Bangladesh Food Safety Authority (BFSA)
7.1 Mean population 24-hour salt intake
Population mean salt intake can be assessed using 24-h urinary sodium excretion, however
STEPs survey has, instead, adopted spot urine sodium as a proxy due to ease of collection of
spot urine samples lower cost and higher response rates vis-à-vis 24-hour urine samples, in
population-based household surveys. Three main studies investigated the estimation of 24-h
urinary sodium excretion from spot urine samples in the literature: Kawasaki40, INTERSALT41
36 WHO. Guideline: Sodium intake for adults and children. Geneva, World Health Organization (WHO), 2012. 37 WHO. The Updated Appendix of 3 of the Global Action Plan for the Prevention and Control of NCDs 2013-2020. 38 World Health Organization. Global action plan for the prevention and control of NCDs 2013-2020. Geneva. 39 Strategic Plan for Surveillance and Prevention of Non-Communicable Diseases in Bangladesh 2011-2015. Dhaka: Non-communicable Disease Unit, Directorate General of Health Services. 40 Kawasaki T, Itoh K, Uezono K, Sasaki H. A simple method for estimating 24 h urinary sodium and potassium excretion from second morning voiding urine specimen in adults. Clin Exp Pharmacol Physiol. 1993;20(1):7-14. 41 Brown IJ, Dyer AR, Chan Q, et al. Estimating 24-Hour Urinary Sodium Excretion From Casual Urinary Sodium Concentrations in Western Populations. American Journal of Epidemiology. 2013;177(11):1180-1192. doi:10.1093/aje/kwt066

STEPS Bangladesh 2018
93
and Tanaka42 (Refer to section 2.6 under Survey Methodology). So far, there is no scientific
consensus on equation to be used in a given population/context. The estimation in this survey
maintained the use of the same equation as in previous survey rounds to facilitate comparison
of results and assessment of trends.
Using the Tanaka equation, the mean population salt intake was estimated to be 9.0 g per day
amongst all adults (9.0 g/d for women, 9.0 g/d for men) (Table 7.1).
Patterns by background characteristics:
• Estimated salt intake generally did not vary by age, sex, education and household wealth
quintile.
• Rural populations have higher mean salt intake compared to urban populations
(9.0g/day versus 8.9g/day).
• Highest average salt intake was observed in
Barishal division of 9.3g/day and lowest
average (8.6 g/day) was observed in Sylhet
(Figure 7.1).
7.2 Behaviour around dietary salt intake:
48.2% of adults reported adding salt often or always
while only 1.8% adults reported so for adding salty
sauces (Table 7.2). This shows that salty sauces
are not an important source of salt intake in
Bangladesh.
13.5% of adults report often or always consuming
processed foods high in salt (16.0% women, 10.9%
men) (Table 7.4).
An average of 1.1 teaspoon of extra salt is added to
food based on self-reporting by adults (1.1 tsp
women, 1.1 tsp men) (Table 7.8)
42 Tanaka T, Okamura T, Miura K, et al. A simple method to estimate populational 24-h urinary sodium and potassium excretion using a casual urine specimen. J Hum Hypertens. 2002;16(2):97-103. doi:10.1038/sj.jhh.1001307
9.30%
9.0%
9.0%
9.1%
9.2%
9.2%
8.60%
Figure 7.1 Differentials in estimated meaan salt intake by division amongst adults 18-69 years,
Bangladesh STEPS Survey 2018

STEPS Bangladesh 2018
94
Patterns for adding salt and salty sauces by background characteristic (Table 7.2):
• A higher percentage of women 51.5% reported adding salt often or always compared to
44.9% of men. Though a reverse trend was seen for consumption of salty sauce (2.3%
men vs 1.3% of women).
• Older adults, rural population, people from lower education levels and lower wealth
quintile (Figure 7.2 and Figure 7.3) reported adding salt more frequently than their
counterparts. The reverse relationship is seen for adding salty sauces.
• Barishal (78.5%), and Rangpur
(28.1%) had the highest and lowest
proportion of adults, respectively,
that reported adding salt often or
always while eating.
Patterns for consumption of
processed foods by background
characteristic (Table 7.4):
oThe percentage of adults who often
or always consume processed foods
increases with younger age, urban
living, higher education and higher household wealth (Figure 7.4, 7.5, 7.6).
51.0 53.048.9 48.2
40.0
0.5 1.3 2.0 1.9 3.3
0.0
10.0
20.0
30.0
40.0
50.0
60.0
Lowest Second Middle Fourth Highest
Perc
ent
Figure 7.3 Percent adults aged 18-69 who reported often or always adding salt and
salty sauces to food by wealth, Bangladesh STEPs Survey 2018
Salt Salty sauces
53.948.7 45.7
30.3
1.1 1.7 2.2 3.8
0.0
10.0
20.0
30.0
40.0
50.0
60.0
Noeducation
Primary Secondary More thansecondary
Perc
ent
Figure 7.2 Percent adults aged 18-69 who reported often or always adding salt and
salty sauces to food by education, Bangladesh STEPs Survey 2018
Salt Salty sauces

STEPS Bangladesh 2018
95
7.3. Perceptions about levels of salt
intake
In contrast to relatively high estimated
population mean salt intake reported
earlier, majority of adults (61.2%) think
they consume ‘just the right amount of
salt’, with only 13.5% reporting
consuming ‘far too much or too much’
salt. 60.3% reported never consuming salty sauces Therefore, only a small percentage (0.7%)
of adults perceived salty sauces intake to be `far too much or too much and 27.6% of adults
perceived it to be ` far too little or too little’ (Table 7.3). However, when asked about the
importance of lowering dietary salt, 69.6% of adults find it ‘very important or somewhat important’
(Table 7.5).
Patterns by background characteristics (Table 7.3 and Table 7.5):
• Perception of salt intake does not vary much by age, sex and household wealth.
• More urban residents and men perceived their salt intake to be `just right’ compared to
their counterparts.
• Rangpur (76.2%), Khulna (68.9%) and Rajshahi (68.1%) have notably higher percentage
of adults who perceive their salt intake to be `just right’.
• Percentage of adults who perceive salt intake to be ‘just right’ increases as education
level increases.
• Younger adults and urban residents were more likely to report lowering salt to be
important.
• Barishal has the highest percentage of adults, who find importance in lowering salt
(82.6%), followed by Sylhet (78.9%).
9.411.9 13.2
15.017.9
0.0
5.0
10.0
15.0
20.0
Lowest Second Middle Fourth Highest
Perc
ent
Figure 7.6 Differentials in percent adults aged 18-69 who reported always or often consuming processed food by wealth, Bangladesh STEPs
Survey 2018
19.8
14.410.1
6.3
0.0
10.0
20.0
30.0
18-24 25-39 40-54 55-69
Perc
ent
Figure 7.4 Differentials in percent adults aged 18-69 who report always or often consuming processed food by age group, Bangladesh STEPs
Survey 2018
9.216.3
20.114.7
0.0
10.0
20.0
30.0
Noeducation
Primary Secondary More thansecondary
Perc
ent
Figure 7.5 Differentials in percent adults aged 18-69 who often or always
consume processed foods by education, Bangladesh STEPs Survey
2018
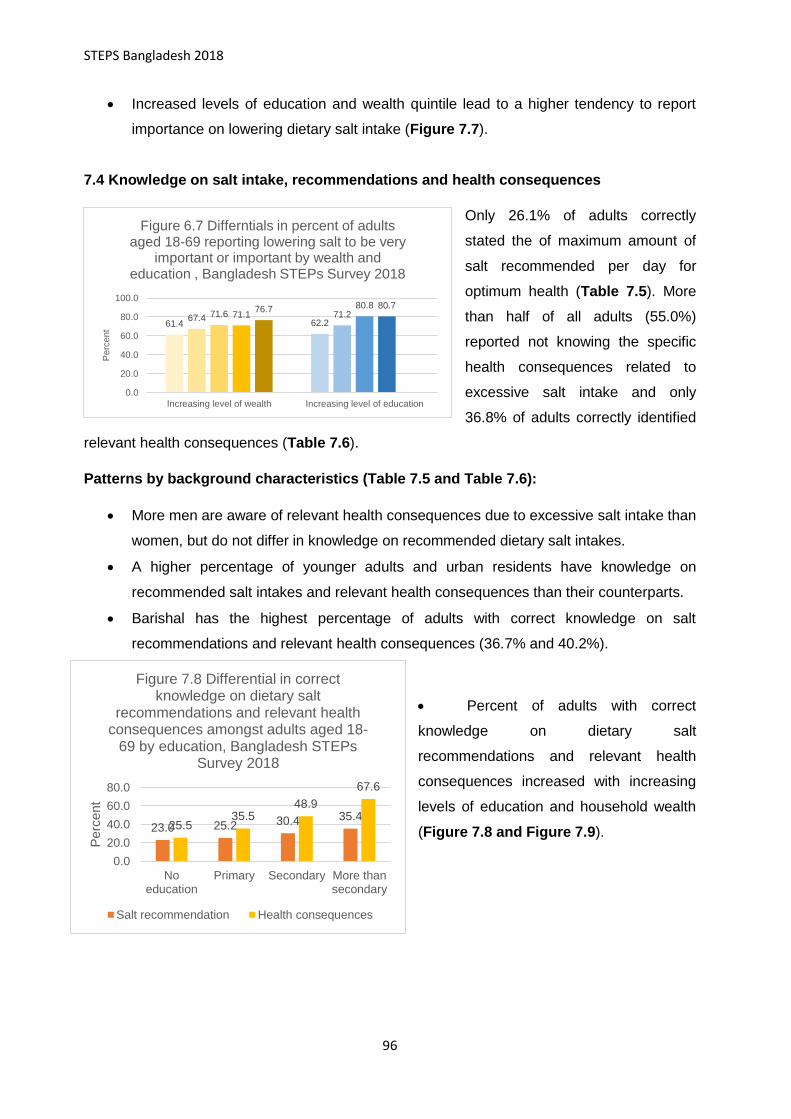
STEPS Bangladesh 2018
96
• Increased levels of education and wealth quintile lead to a higher tendency to report
importance on lowering dietary salt intake (Figure 7.7).
7.4 Knowledge on salt intake, recommendations and health consequences
Only 26.1% of adults correctly
stated the of maximum amount of
salt recommended per day for
optimum health (Table 7.5). More
than half of all adults (55.0%)
reported not knowing the specific
health consequences related to
excessive salt intake and only
36.8% of adults correctly identified
relevant health consequences (Table 7.6).
Patterns by background characteristics (Table 7.5 and Table 7.6):
• More men are aware of relevant health consequences due to excessive salt intake than
women, but do not differ in knowledge on recommended dietary salt intakes.
• A higher percentage of younger adults and urban residents have knowledge on
recommended salt intakes and relevant health consequences than their counterparts.
• Barishal has the highest percentage of adults with correct knowledge on salt
recommendations and relevant health consequences (36.7% and 40.2%).
• Percent of adults with correct
knowledge on dietary salt
recommendations and relevant health
consequences increased with increasing
levels of education and household wealth
(Figure 7.8 and Figure 7.9).
61.4 62.267.4 71.271.6
80.871.1
80.776.7
0.0
20.0
40.0
60.0
80.0
100.0
Increasing level of wealth Increasing level of education
Perc
ent
Figure 6.7 Differntials in percent of adults aged 18-69 reporting lowering salt to be very
important or important by wealth and education , Bangladesh STEPs Survey 2018
23.0 25.2 30.4 35.425.5
35.548.9
67.6
0.0
20.0
40.0
60.0
80.0
Noeducation
Primary Secondary More thansecondary
Perc
ent
Figure 7.8 Differential in correct knowledge on dietary salt
recommendations and relevant health consequences amongst adults aged 18-
69 by education, Bangladesh STEPs Survey 2018
Salt recommendation Health consequences

STEPS Bangladesh 2018
97
7.5 Practices and methods to reduce salt intake
Only 10.8% of adults reported currently doing something to control salt intake. Amongst those
who are currently doing
something to control their
salt intake, the most
common methods were:
stopping or reducing added
salt (93.3%) ; avoiding
eating foods prepared
outside of home (66.2%);
avoiding and minimizing
consumption of processed
foods (60.2%) (Table 7.7).
Patterns by background characteristics (Table 7.7):
• Women were twice more likely to report currently doing something to control their salt
intake compared to men (14.4% vs7.1%).
• The age group 40-54 had the highest percentage of adults who are currently doing
something to control their salt intake (11.2%) and lowest amongst 55-69-year age-group
(9.8%).
Notable difference in salt controlling
behavior exist across divisions. Khulna had
the highest percentage (23.7%) of adults
currently trying to reduce salt and
Mymensingh the lowest (5.0%). Stopping
and reducing added salt is consistently the
most common method across all divisions.
(Figure 7.10)
• The percentage of adults reporting
salt reducing behaviors increase with as
education and household wealth
increases. (Figure 7.11)
22.325.2 24.8 25.6
32.8
21.6
27.4
38.041.0
56.3
0.0
10.0
20.0
30.0
40.0
50.0
60.0
Lowest Second Middle Fourth Highest
Perc
ent
Figure 7.9 Differentials in correnct knowledge on dietary salt recommendations and relevant health
consequences amongst adults aged 18-69 by wealth, Bangladesh STEPs Survey 2018
Salt recommendation Health consequences
6.9
10.8
5.9
23.7
5.0
4.8
18.0
19.0
0.0 5.0 10.0 15.0 20.0 25.0
Barisal
Chittagong
Dhaka Rural
Khulna
Mymensing
Rajshahi
Rangpur
Syleht
Percent
Figure 7.10 Percent adults aged 18-69 who are currently doing something to reduce salt by division, Bangladesh
STEPs Survey 2018

STEPS Bangladesh 2018
98
For more information on dietary salt intake, see the following tables:
Table Salt. 7.1 Estimated average population salt intake
Table Salt. 7.2 Practice of adding salt and salty sauces to food while eating
Table Salt. 7.3 Perceived intake of salt and salty sauce
Table Salt .7.4 Consumption of processed food high in salt
Table Salt. 7.5 Attitude and knowledge on salt intake and recommendations
Table Salt. 7.6 Knowledge on salt intake and health consequences
Table Salt. 7.7 Currently controlling salt intake and methods
Table Salt. 7.8 Self-reported amount of added salt to foods
9.2 9.712.0
8.29.9 9.3
14.5
10.4
16.6
0.0
5.0
10.0
15.0
20.0
Increasing level of education Increasng level of wealth
Perc
ent
Figure 7.11 Differentials in percent adults aged 18-69 currently doing something to
control salt by education and wealth, Bangladesh STEPs Survey 2018

STEPS Bangladesh 2018
99
Table Salt. 7.1 Estimated average population salt intake
Estimated average population salt intake amongst adults aged 18-69 based on spot urinary sodium, according to background characteristics [Bangladesh, 2018]
Background
characteristic
Average daily salt intake (g/day)
Mean 95% CI Number of respondents (N)
Age 18-24 9.1 8.9 9.3 765 25-39 9.0 8.9 9.1 2901 40-54 9.0 8.9 9.1 2186 55-69 8.9 8.8 9.1 1042 Sex
Women 9.0 8.9 9.2 3665 Men 9.0 8.9 9.1 3229
Residence
Rural 9.0 8.9 9.1 3670 Urban 8.9 8.7 9.0 3224
Division
Barishal 9.3 9.1 9.5 829 Chattogram 8.9 8.6 9.1 815 Dhaka Rural 9.0 8.8 9.1 752 Khulna 9.0 8.8 9.2 940 Mymensingh 9.0 8.8 9.2 902 Rajshahi 9.2 8.9 9.4 959 Rangpur 9.2 9.0 9.5 883 Sylhet 8.6 8.4 8.8 814
Education
No education 8.9 8.8 9.0 3221 Primary 9.2 9.0 9.3 2133 Secondary 9.0 8.7 9.2 697 More than secondary 9.1 8.9 9.3 827
Wealth quintile
Lowest 8.9 8.8 9.1 1442 Second 9.1 8.9 9.2 1463 Middle 9.1 9.0 9.3 1233 Fourth 8.9 8.7 9.1 1254 Highest 9.0 8.8 9.2 1502
Total (18-39) 9.0 8.9 9.1 3,666 Total (40-69) 9.0 8.9 9.1 3,228 Total (25-69) 9.0 8.9 9.1 6,129 Total (18-69) 9.0 8.9 9.1 6,894
*Estimations derived from Tanaka equation:
Table Salt.7.2 Practice of adding salt and salty sauces to food while eating

STEPS Bangladesh 2018
100
Percent distribution of adults aged 18-69 by frequency of adding salt or salty sauces to food while eating, according to background characteristics [Bangladesh, 2018]
Background characteristic
Percent of adults who add salt to food while eating
Percent of adults who add salty sauces to food while eating
Percent of adults who always or often add either salt or salty sauces to food while eating
Often / always
Some-times
Rarely / never
Number of respondents
Often / always
Some-times
Rarely / never
Number of respondents
Often / always
Number of respondents
Age
18-24 46.8 13.7 39.5 1026 2.4 24.8 72.8 1026 48.2 1026
25-39 46.5 10.8 42.7 3486 2.2 20.4 77.4 3484 47.4 3489
40-54 51.1 11.5 37.5 2503 1.6 15.7 82.7 2493 51.8 2503
55-69 51.3 14.3 34.4 1167 0.4 13.0 86.6 1160 51.5 1167
Sex
Women 51.5 12.3 36.1 4380 1.3 15.4 83.3 4370 52.1 4381
Men 44.9 12.1 43.0 3802 2.3 23.3 74.4 3793 46.1 3804
Residence
Rural 49.5 12.7 37.7 4181 1.3 17.0 81.7 4170 50.1 4183
Urban 43.8 10.4 45.7 4001 3.4 27.2 69.3 3993 45.8 4002
Division
Barishal 78.5 7.4 14.2 986 1.2 14.5 84.4 985 78.9 986
Chattogram 48.3 14.9 36.8 1053 3.3 26.7 70.0 1049 49.8 1053
Dhaka Rural 55.0 12.9 32.0 995 1.6 25.0 73.4 997 56.0 997
Khulna 51.3 8.3 40.4 1040 2.4 13.7 83.9 1038 52.4 1040
Mymensingh 45.0 14.5 40.5 1021 0.7 11.9 87.4 1015 45.4 1021
Rajshahi 39.3 9.5 51.2 1066 0.2 13.8 86.0 1064 39.5 1066
Rangpur 28.1 14.8 57.1 1008 0.9 15.3 83.9 1002 28.7 1009
Sylhet 43.7 10.7 45.6 1013 3.1 15.4 81.5 1013 45.4 1013 Education
No education 53.9 12.8 33.3 3677 1.1 12.8 86.1 3661 54.2 3,678
Primary 48.7 11.3 40.0 2533 1.7 18.6 79.7 2529 49.5 2,533
Secondary 45.7 12.3 42.0 887 2.2 27.7 70.1 887 46.9 888
More than secondary 30.3 12.2 57.5 1064 3.8 35.6 60.6 1065 33.0 1065 Wealth quintile
Lowest 51.0 11.2 37.8 1639 0.5 7.9 91.5 1628 51.2 1639
Second 53.0 13.8 33.1 1669 1.3 11.2 87.5 1666 53.3 1670
Middle 48.9 11.5 39.6 1451 2.0 22.4 75.7 1448 50.0 1451
Fourth 48.2 12.4 39.5 1504 1.9 22.4 75.7 1503 49.1 1506
Highest 40.0 12.2 47.8 1919 3.3 32.8 64.0 1918 42.0 1919
Total (18-39) 46.6 11.9 41.5 4512 2.2 22.1 75.7 4510 47.7 4515
Total (40-69) 51.2 12.8 36.1 3670 1.0 14.5 84.5 3653 51.7 3670
Total (25-69) 48.7 11.7 39.5 7156 1.6 17.6 80.8 7137 49.5 7159
Total (18-69) 48.2 12.2 39.5 8182 1.8 19.3 78.9 8163 49.2 8185
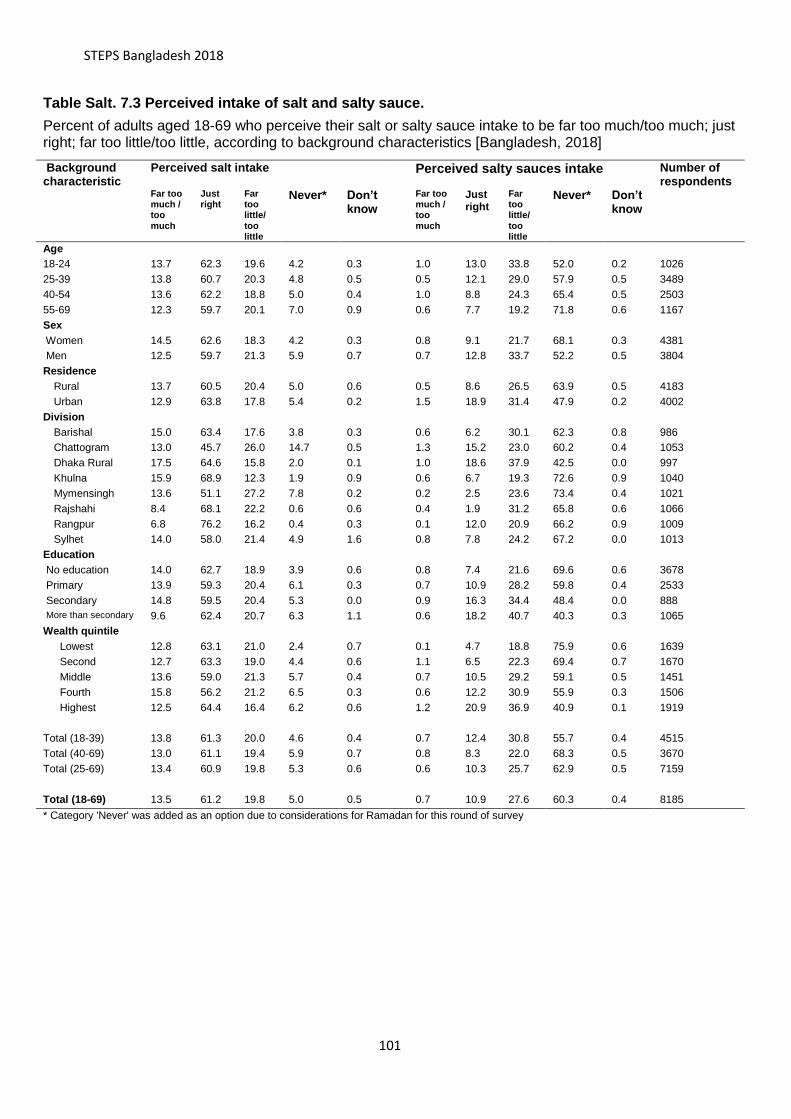
STEPS Bangladesh 2018
101
Table Salt. 7.3 Perceived intake of salt and salty sauce.
Percent of adults aged 18-69 who perceive their salt or salty sauce intake to be far too much/too much; just right; far too little/too little, according to background characteristics [Bangladesh, 2018]
Background characteristic
Perceived salt intake Perceived salty sauces intake Number of respondents
Far too much / too much
Just right
Far too little/ too little
Never* Don’t know
Far too much / too much
Just right
Far too little/ too little
Never* Don’t know
Age
18-24 13.7 62.3 19.6 4.2 0.3
1.0 13.0 33.8 52.0 0.2 1026
25-39 13.8 60.7 20.3 4.8 0.5
0.5 12.1 29.0 57.9 0.5 3489
40-54 13.6 62.2 18.8 5.0 0.4
1.0 8.8 24.3 65.4 0.5 2503
55-69 12.3 59.7 20.1 7.0 0.9
0.6 7.7 19.2 71.8 0.6 1167
Sex
Women 14.5 62.6 18.3 4.2 0.3
0.8 9.1 21.7 68.1 0.3 4381
Men 12.5 59.7 21.3 5.9 0.7
0.7 12.8 33.7 52.2 0.5 3804
Residence
Rural 13.7 60.5 20.4 5.0 0.6
0.5 8.6 26.5 63.9 0.5 4183
Urban 12.9 63.8 17.8 5.4 0.2
1.5 18.9 31.4 47.9 0.2 4002
Division
Barishal 15.0 63.4 17.6 3.8 0.3
0.6 6.2 30.1 62.3 0.8 986
Chattogram 13.0 45.7 26.0 14.7 0.5
1.3 15.2 23.0 60.2 0.4 1053
Dhaka Rural 17.5 64.6 15.8 2.0 0.1
1.0 18.6 37.9 42.5 0.0 997
Khulna 15.9 68.9 12.3 1.9 0.9
0.6 6.7 19.3 72.6 0.9 1040
Mymensingh 13.6 51.1 27.2 7.8 0.2
0.2 2.5 23.6 73.4 0.4 1021
Rajshahi 8.4 68.1 22.2 0.6 0.6
0.4 1.9 31.2 65.8 0.6 1066
Rangpur 6.8 76.2 16.2 0.4 0.3
0.1 12.0 20.9 66.2 0.9 1009
Sylhet 14.0 58.0 21.4 4.9 1.6
0.8 7.8 24.2 67.2 0.0 1013
Education
No education 14.0 62.7 18.9 3.9 0.6
0.8 7.4 21.6 69.6 0.6 3678
Primary 13.9 59.3 20.4 6.1 0.3
0.7 10.9 28.2 59.8 0.4 2533
Secondary 14.8 59.5 20.4 5.3 0.0
0.9 16.3 34.4 48.4 0.0 888
More than secondary 9.6 62.4 20.7 6.3 1.1
0.6 18.2 40.7 40.3 0.3 1065
Wealth quintile
Lowest 12.8 63.1 21.0 2.4 0.7
0.1 4.7 18.8 75.9 0.6 1639
Second 12.7 63.3 19.0 4.4 0.6
1.1 6.5 22.3 69.4 0.7 1670
Middle 13.6 59.0 21.3 5.7 0.4
0.7 10.5 29.2 59.1 0.5 1451
Fourth 15.8 56.2 21.2 6.5 0.3
0.6 12.2 30.9 55.9 0.3 1506
Highest 12.5 64.4 16.4 6.2 0.6
1.2 20.9 36.9 40.9 0.1 1919
Total (18-39) 13.8 61.3 20.0 4.6 0.4
0.7 12.4 30.8 55.7 0.4 4515
Total (40-69) 13.0 61.1 19.4 5.9 0.7
0.8 8.3 22.0 68.3 0.5 3670
Total (25-69) 13.4 60.9 19.8 5.3 0.6
0.6 10.3 25.7 62.9 0.5 7159
Total (18-69) 13.5 61.2 19.8 5.0 0.5
0.7 10.9 27.6 60.3 0.4 8185
* Category 'Never' was added as an option due to considerations for Ramadan for this round of survey

STEPS Bangladesh 2018
102
Table Salt.7.4 Consumption of processed food high in salt.: men and women
Percent of men and women aged 18-69 who often to always, sometimes, never to rarely eat processed foods high in salt, according to background characteristics [Bangladesh, 2018]
Background characteristic Total Women Men
Often/ always
Some-times
Rarely/ never
Number of respondents (N)
Often / always
Some-times
Rarely/ never
Number of women (N)
Often/ always
Age 18-24 19.8 63.6 16.7 1,025 21.3 64.0 14.7 621 18.0 25-39 14.4 60.8 24.8 3,482 17.6 60.2 22.2 2016 11.0 40-54 10.1 51.6 38.4 2,498 12.7 49.8 37.5 1282 7.4 55-69 6.3 46.5 47.2 1,166 6.7 48.4 44.9 457 6.0 Residence
Rural 12.9 56.7 30.5 4,176 15.5 57.5 27.0 2261 10.0 Urban 15.7 59.2 25.1 3,995 17.8 57.0 25.2 2115 13.6
Division
Barishal 18.2 40.2 41.6 986 17.3 32.0 50.8 540 19.3 Chattogram 15.6 59.6 24.8 1,052 22.9 59.5 17.6 552 6.9 Dhaka Rural 14.6 66.0 19.4 995 11.0 73.4 15.6 518 18.0 Khulna 11.8 46.7 41.6 1,038 18.9 46.7 34.4 560 4.9 Mymensingh 12.7 56.8 30.6 1,021 13.1 61.5 25.4 552 12.1 Rajshahi 8.1 55.1 36.8 1,065 11.6 44.7 43.8 569 5.0 Rangpur 11.5 60.8 27.7 1,007 12.4 52.2 35.4 541 10.6 Sylhet 16.6 49.4 34.0 1,007 22.4 57.7 19.8 544 10.1
Education
No education 9.2 55.1 35.6 3669 10.0 54.8 35.2 1957 8.4 Primary 16.3 55.9 27.8 2532 18.3 57.8 23.9 1525 13.7 Secondary 20.1 60.5 19.4 887 27.0 58.3 14.7 434 13.4 More than secondary 14.7 65.0 20.3 1062 21.9 68.7 9.4 439 10.8
Wealth quintile
Lowest 9.4 52.0 38.6 1,636 8.6 54.9 36.5 976 10.5 Second 11.9 56.8 31.3 1,669 12.8 55.4 31.8 912 11.0 Middle 13.2 57.7 29.0 1,450 20.5 55.7 23.8 725 7.7 Fourth 15.0 61.2 23.9 1,501 17.7 60.9 21.4 717 12.4 Highest 17.9 58.5 23.6 1,915 21.8 60.3 17.9 1046 13.4
Total (18-39) 16.4 61.8 21.8 4,507 19.1 61.7 19.3 2637 13.5 Total (40-69) 8.3 49.2 42.4 3,664 10.1 49.2 40.7 1739 6.7 Total (25-69) 11.5 55.3 33.2 7,146 14.2 55.1 30.7 3755 8.9 Total (18-69) 13.5 57.2 29.3 8,171 16.0 57.4 26.6 4376 10.9

STEPS Bangladesh 2018
103
Table Salt.7.5 Attitude and knowledge on salt intake and recommendations: Total
Percent of adults aged 18-69 who find importance in lowering salt intake; percentage who's knowledge on maximum salt intake per day is within WHO recommendations; percent who think too much salt relate to health consequence, according to background characteristics [Bangladesh, 2018] Background characteristic
Percent who think lowering salt intake to be:
Percent who's knowledge on maximum salt intake per day is within WHO recommendations
Number of respondents (N)
Very important/ somewhat important
Not important or unaware
Within recommendations (<=1 tsp or 5 g/day)
Above recommendation (> 1tsp or 5g/day)
Don't know
Age
18-24 72.0 28.0 26.1 33.5 40.4 1026 25-39 72.3 27.7 28.3 30.6 41.1 3489 40-54 68.0 32.0 24.9 30.0 45.1 2503 55-69 61.6 38.4 22.4 27.9 49.7 1167 Sex
Women 70.0 30.0 26.4 37.1 36.5 4381 Men 69.2 30.8 25.8 24.2 50.0 3804
Residence
Rural 69.1 30.9 24.3 33.2 42.6 4183 Urban 71.4 28.6 32.5 22.2 45.3 4002
Division
Barishal 82.6 17.4 36.7 10.1 53.2 986 Chattogram 61.1 38.9 29.3 36.1 34.5 1053 Dhaka Rural 70.8 29.2 32.3 19.2 48.5 997 Khulna 60.6 39.4 12.1 40.0 47.8 1040 Mymensingh 77.7 22.3 28.0 42.3 29.7 1021 Rajshahi 69.5 30.5 20.2 37.9 41.9 1066 Rangpur 74.4 25.6 22.9 21.7 55.4 1009 Sylhet 78.9 21.1 22.8 42.4 34.8 1013
Education
No education 62.2 37.8 23.0 32.1 44.9 3,678 Primary 71.2 28.8 25.2 32.6 42.2 2,533 Secondary 80.8 19.2 30.4 24.1 45.5 888 More than
secondary 80.7 19.4
35.4 27.8 36.8 1,065 Wealth quintile
Lowest 61.4 38.6 22.3 31.9 45.8 1639 Second 67.4 32.6 25.2 30.6 44.2 1670 Middle 71.6 28.4 24.8 34.9 40.3 1451 Fourth 71.1 28.9 25.6 27.0 47.4 1506 Highest 76.7 23.3 32.8 29.2 38.1 1919
Total (18-39) 72.2 27.8 27.5 31.7 40.9 4515 Total (40-69) 65.0 35.0 23.8 29.0 47.2 3670 Total (25-69) 68.9 31.1 26.1 29.8 44.0 7159 Total (18-69) 69.6 30.4 26.1 30.7 43.2 8185

STEPS Bangladesh 2018
104
Table Salt.7.6 Knowledge on salt intake and health consequences: Total
Percent of adults aged 18-69 who think too much salt is related to health consequence, according to background characteristics [Bangladesh, 2018]
Background characteristic
Percent who correctly identified that salt intake is related to increased
blood pressure or kidney diseases:
Percent who think that too much salt is related to:
Correct Incorrect Total (%)
No health
consequences Increased
blood pressure /
kidney disease
Other consequences:
asthma / cancer / tuberculosis/
others
Don't know
Number of respondents
(N)
Age 18-24 41.6 58.4 100.0 2.1 41.6 4.2 49.7 1026 25-39 37.3 62.7 100.0 2.1 37.3 4.5 54.4 3489 40-54 34.3 65.7 100.0 2.7 34.3 3.0 57.0 2503 55-69 32.0 68.0 100.0 2.3 32.0 3.7 61.8 1167
Sex Women 32.6 67.4 100.0 2.1 32.6 3.5 55.7 4381 Men 41.2 58.8 100.0 2.4 41.2 4.5 54.3 3804
Residence Rural 34.0 66.0 100.0 2.4 34.0 4.1 57.2 4183 Urban 46.7 53.3 100.0 1.9 46.7 3.5 47.3 4002
Division Barishal 40.2 59.8 100.0 9.8 40.2 2.7 48.9 986 Chattogram 40.3 59.7 100.0 0.4 40.3 6.5 48.8 1053 Dhaka Rural 44.1 55.9 100.0 0.3 44.1 3.9 51.3 997 Khulna 34.4 65.6 100.0 1.1 34.4 2.3 62.9 1040 Mymensingh 32.6 67.4 100.0 0.6 32.6 5.7 49.5 1021 Rajshahi 33.8 66.2 100.0 0.8 33.8 2.1 64.4 1066 Rangpur 25.2 74.8 100.0 4.8 25.2 3.8 64.9 1009 Sylhet 28.7 71.3 100.0 12.3 28.7 2.3 53.3 1013
Education No education 25.5 74.5 100.0 3.0 25.5 2.9 64.9 3678 Primary 35.5 64.5 100.0 2.0 35.5 3.8 55.8 2533 Secondary 48.9 51.1 100.0 1.4 48.9 4.9 44.3 888 More than
secondary 67.6 32.4
100.0 1.0 67.6 7.4 29.1 1065
Wealth quintile Lowest 21.6 78.4 100.0 3.1 21.6 3.6 66.4 1639 Second 27.4 72.6 100.0 3.1 27.4 2.9 61.1 1670 Middle 38.0 62.0 100.0 3.1 38.0 5.0 54.8 1451 Fourth 41.0 59.0 100.0 1.2 41.0 3.7 53.7 1506 Highest 56.3 43.7 100.0 0.7 56.3 4.9 38.9 1919
Total (18-39) 38.9 61.1 100.0 2.1 38.9 4.4 52.6 4515 Total (40-69) 33.2 66.8 100.0 2.5 33.2 3.3 59.2 3670 Total (25-69) 35.3 64.7 100.0 2.3 35.3 3.9 56.7 7159
Total (18-69) 36.8 63.2 100.0 2.3 36.8 4.0 55.0 8185

STEPS Bangladesh 2018
105
Table Salt 7.7 Currently controlling salt intake and methods: Total
Percent of adults aged 15-69 who often to always, sometimes, never to rarely eat processed foods high in salt, according to background characteristics [Bangladesh, 2018] Background characteristic
Percent who are currently doing something to control salt intakes:
Amongst adults who are currently doing anything to controlling salt intake, percent of adults that use the method of:
Percent Number of respondents (N)
Avoid/ minimize consumption of processed foods
Look at the salt or sodium content on food label
Buy low salt/ sodium alternatives
Use spices other than salt when cooking
Avoid eating foods prepared outside of home
Stop/Reduce added salt
Number of respondents (N)
Age
18-24 10.9 1014
65.6 39.6 41.3 20.2 69.4 93.4 110 25-39 10.9 3443
54.6 28.7 38.8 22.1 62.3 91.2 418
40-54 11.2 2463
65.7 39.6 39.7 28.8 74.4 94.8 314 55-69 9.8 1136
58.7 28.7 35.6 18.7 59.9 96.6 123
Sex
Women 14.4 4343
52.3 30.6 37.7 22.2 65.3 95.7 703 Men 7.1 3713
76.8 39.9 42.0 23.2 68.0 88.2 262
Residence
Rural 10.7 4125
58.4 30.8 37.8 22.2 68.7 93.3 462 Urban 11.2 3931
66.1 42.9 43.6 23.5 57.7 93.1 503
Division
Barishal 6.9 978
48.2 26.9 21.7 21.7 38.1 83.1 77 Chattogram 10.8 1016
30.1 12.2 15.4 10.6 37.5 97.3 119
Dhaka Rural 5.9 988
69.5 42.5 46.0 16.9 57.5 88.6 57 Khulna 23.7 1023
60.6 23.3 15.1 6.4 84.9 92.2 230
Mymensingh 5.0 992
27.3 11.7 9.6 17.4 46.3 99.2 59 Rajshahi 4.8 1062
47.4 30.5 24.3 9.0 29.5 89.0 62
Rangpur 18.0 1007
95.4 82.8 91.2 85.6 97.1 98.1 204 Sylhet 19.0 990
71.7 23.1 73.3 3.0 75.1 90.4 157
Education
No education 9.2 3609
58.8 31.6 35.5 29.1 65.4 94.3 352 Primary 12.0 2492
59.5 29.8 39.4 17.4 72.9 92.5 318
Secondary 9.9 878
59.3 42.9 42.8 23.6 58.8 92.8 117 More than
secondary 14.5 1056
65.5 39.3 44.1 17.8 59.5 93.0 177
Wealth quintile
Lowest 9.7 1609
71.8 41.6 41.8 38.0 74.7 95.0 165 Second 8.2 1649
64.1 38.1 49.7 32.6 69.6 94.8 163
Middle 9.3 1431
52.6 25.9 31.8 15.1 70.7 87.6 133 Fourth 10.4 1481
57.2 31.6 32.6 19.6 61.4 96.1 147
Highest 16.6 1886
57.6 32.2 40.5 14.4 59.9 92.9 357
Total (18-39) 10.9 4457
58.8 32.8 39.8 21.4 65.0 92.0 528 Total (40-69) 10.6 3599
62.8 35.0 38.0 24.6 68.3 95.6 437
Total (25-69) 10.8 7042
58.5 31.7 38.4 23.3 65.1 93.2 855 Total (18-69) 10.8 8056 60.2 33.6 39.1 22.5 66.2 93.3 965

STEPS Bangladesh 2018
106
Table Salt. 7.8 Self-reported amount of added salt to foods
Self-reported amount of extra salt (in teaspoons) added to food amongst adults aged 15-69 , according to background characteristics [Bangladesh, 2018]
Background characteristic Extra Salt added to food Mean 95% CI Number of respondents (n)
Age 18-24 1.1 1.1 1.1 651 25-39 1.1 1.1 1.1 2166 40-54 1.1 1.1 1.1 1590 55-69 1.1 1.1 1.1 777 Sex
Women 1.1 1.1 1.1 2913 Men 1.1 1.1 1.1 2271
Residence
Rural 1.1 1.1 1.1 2860 Urban 1.1 1.1 1.1 2324
Division
Barishal 1.1 1.1 1.1 822 Chattogram 1.1 1.0 1.1 692 Dhaka Rural 1.1 1.1 1.1 732 Khulna 1.1 1.0 1.1 658 Mymensingh 1.1 1.1 1.2 659 Rajdhani 1.1 1.1 1.2 538 Rangpur 1.0 1.0 1.0 469 Sylhet 1.0 1.0 1.1 614
Education
No education 1.1 1.1 1.1 2532 Primary 1.1 1.1 1.1 1645 Secondary 1.1 1.1 1.1 486 More than secondary 1.1 1.0 1.1 505
Wealth quintile
Lowest 1.1 1.1 1.1 1107 Second 1.1 1.1 1.1 1157 Middle 1.1 1.1 1.1 963 Fourth 1.1 1.1 1.1 966 Highest 1.1 1.1 1.1 991
Total (18-39) 1.1 1.1 1.1 2817 Total (40-69) 1.1 1.1 1.1 2367 Total (25-69) 1.1 1.1 1.1 4533 Total (18-69) 1.1 1.1 1.1 5184

STEPS Bangladesh 2018
107
Chapter 8 Physical activity
Key findings
Time spent on physical activity
o Total physical activity (in moderate-intensity minutes):
▪ On average 247.9 minutes per day
▪ Half of the population spent 132.0 or more minutes (median) per day.
Insufficient levels of physical activity
o Among adults aged 18-69 years: 12.3% of adults (14.8% in women, and 9.6% men)
have insufficient levels of physical activity defined as <150 minutes of moderate-intensity
activity per week.
Percent contribution to total physical activity from each domain:
o Work: 73.4%.
o Travelling from and to places: 22.1%
o Recreational activities: 4.6% of total physical activity minutes
Time spent on sedentary activities
o On average adults (15-69 years) spend 174.8 minutes per day sitting or reclining.
o Half of the population spent 140.0 minutes or more per day (median) sitting or
reclining
Introduction
Insufficient physical activity and sedentary behaviour is a leading risk factor for NCD related
mortality and has major implications for the rising prevalence of NCDs43. Additionally, it
accrues staggering economic cost through increased health-care expenditure and loss of
productivity44. Participation in regular physical activity and reducing sedentary behaviours has
substantial effects on increasing life expectancy and the primary prevention of several chronic
43 Lee I-M, Shiroma EJ, Lobelo F, Puska P, Blair SN, Katzmarzyk PT. Effect of physical inactivity on major non-communicable diseases worldwide: an analysis of burden of disease and life expectancy. The Lancet. 2012;380(9838):219-229. doi:10.1016/S0140-6736(12)61031-9.
44 Ding D, Lawson KD, Kolbe-Alexander TL, et al. The economic burden of physical inactivity: a global analysis of major non-communicable diseases. The Lancet. 2016;388(10051):1311-1324. doi:10.1016/S0140-6736(16)30383-X

STEPS Bangladesh 2018
108
diseases such as, cardiovascular diseases, diabetes, hypertension, cancer, obesity and
mental health at a population level45,46,47.
The 2025 global physical activity target aims for a 10% reduction in prevalence of insufficient
physical activity relative to 201038. Bangladesh has also incorporated it as one of the key
targets in its 3-year multisectoral action plan for 2018-202510 and its predecessor39.Policies to
promote physical activity (mass media campaigns combined with community-based education,
motivational and environmental programmes aimed at supporting behavioral change) are one
of the recommended interventions to prevent and control non-communicable diseases48.
This chapter focuses on indicators related to physical activity and sedentary behavior. This
information will help Bangladesh assess trends and progress towards physical activity targets
specified in its multisectoral action plan as well as evaluation of current policies and programs
in place.
Current relevant policies and programs in Bangladesh for promoting physical
activity:
▪ Healthy city project, 199049
▪ Health promoting model schools
Current WHO physical activity guidelines (Figure 8.1) for adults are expressed in minutes of
physical activity throughout the week at two levels of intensities for ease of understanding
amongst the public. The underlying standardized measurement to assess both quantity and
intensity of physical activity is MET, metabolic equivalent of task, which is assigned to each
domain of activity and levels of intensity as shown in Figure 8.2 which is based on the Global
Physical Activity Questionnaire (GPAQ)50. An example is given on the calculations for
standardized conversion between regular minutes of varying intensity -level and MET minutes.
45 Reiner M, Niermann C, Jekauc D, Woll A. Long-term health benefits of physical activity – a systematic review of longitudinal studies. BMC Public Health. 2013;13(1):813. doi:10.1186/1471-2458-13-813 46 Ekelund U, Steene-Johannessen J, Brown WJ, et al. Does physical activity attenuate, or even eliminate, the detrimental association of sitting time with mortality? A harmonised meta-analysis of data from more than 1 million men and women. The Lancet. 2016;388(10051):1302-1310. doi:10.1016/S0140-6736(16)30370-1 47 Warburton DER. Health benefits of physical activity: the evidence. Canadian Medical Association Journal. 2006;174(6):801-809. doi:10.1503/cmaj.051351 48 WHO. The Updated Appendix of 3 of the Global Action Plan for the Prevention and Control of NCDs 2013-2020. 49 Burton S. Evaluation of healthy city projects: Stakeholder analysis of two projects in Bangladesh. Environment
and Urbanization. 1999 Apr;11(1):41-52. 50 Armstrong T, Bull F. Development of the World Health Organization Global Physical Activity Questionnaire (GPAQ). J Public Health 2006; 14:66-70.

STEPS Bangladesh 2018
109
Figure 8.1. WHO Physical activity guidelines 201051:
5-17 years ▪ at least 60 minutes of moderate- to vigorous-intensity physical activity
daily for children and adolescents aged 5-17.
18 years and
above
▪ at least 150 minutes of moderate-intensity physical activity per week
OR
▪ 75 minutes of vigorous-intensity physical activity per week OR
▪ an equivalent combination of moderate- and vigorous intensity
physical activity which equates to 600 MET-minutes per week
*refer to guidelines for more detailed guidelines.
Figure 8.2 Metabolic equivalent of task per domain and intensity
Domain Intensity level and MET value per minute
Work Moderate-intensity = 4 MET per minute
Vigorous-intensity = 8 MET per minute
Transport
(Cycling and walking)
Moderate-intensity = 4 MET
Recreation Moderate-intensity = 4 MET per minute
Vigorous-intensity = 8 MET per minute
8.1 Time spent on physical activity
Total minutes of physical activity were obtained by inquiring respondents about time spent on
physical activity in three key domains (work, transport, and recreational) at moderate and
vigorous intensity level on a typical day each week. The vigorous intensity minutes were
converted into moderate intensity minutes using a multiplication factor of 2 and ‘total’ physical
activity minutes were expressed as moderate-intensity minutes per day.
On average, adults aged 18-69 in Bangladesh spent 247.9 minutes on moderate-intensity or
equivalent level physical activity per day while the median was 132.0 minutes. In other words,
50% of the population engaged in 132.0 or less minutes of moderate-intensity physical activity
each day which is insufficient according to current WHO recommendations (Table 8.1).
In terms of intensity, the population average minutes per day for vigorous- and moderate-
intensity physical activity were 55.6 and 136.9 minutes, respectively. More than half of the
51 WHO. Global recommendations on physical activity for health. Geneva, World Health Organization (WHO), 2010
Example:
Activity: 30 minutes of
moderate-intensity
physical activity and 60
min of vigorous-intensity
physical activity in one day.
MET value per day:
(30 min x 4) METs + (60
min x 8) METs =600 METs
/day

STEPS Bangladesh 2018
110
population did not engage (0.0 minute) in any vigorous-intensity physical activity per day while
the median for moderate-intensity activity was 90.0 minutes (Table 8.1).
Patterns by background characteristics (Table 8.1):
• Total average minutes of physical activity is consistently higher than the median, which
suggest the average is influenced by a number of adults that reported very long hours
of engagement in physical activity.
• Average total minutes of physical activity was highest amongst 25-39 and 40-54 age
groups, 272.2 min and 291.8 min respectively (Table 8.1).
• Women had lower average total
minutes of physical activity than men
(144.8 min vs 354.6 min), as well as
lower average minutes of vigorous-
intensity and moderate intensity
physical activity (Figure 8.3).
• Engagement in physical activity
was higher amongst rural residents
than urban residents (Figure 8.3)
• Rajshahi had the highest average total minutes of physical activity (322.1 min) and
Khulna had the highest median (202.1 min), while the lowest average (203.7 min) and
median minutes (93.4 min) of total physical activity was in Dhaka Rural (Table 8.1).
• Total minutes of
physical activity
decreased with
increasing levels of
education and
household wealth
(Figure 8.4).
262.7
144.8196.7
354.6
0.0
100.0
200.0
300.0
400.0
Rural Urban Women Men
min
ute
s o
f m
odera
te-
inte
nsity a
ctivity p
er
day
Figure 8.3 Differentials in total minutes of physical activity by residence and sex
amongst adults aged 18-69, Bangladesh STEPs Survey 2018
288.1 294.0
237.2
284.8
216.0
295.9
166.5
210.2
154.7
0.0
50.0
100.0
150.0
200.0
250.0
300.0
350.0
Increasing levels of education Increasing levels of wealth
Min
ute
s p
er
day (
in m
odera
te-
inte
nsity)
Figure 8.4 Average total time spent on physical activity by education and wealth amongst adults aged 18-69,
Bangladesh STEPs Survey 2018

STEPS Bangladesh 2018
111
8.2 Insufficient levels of physical activity
The prevalence of insufficient levels
of physical activity was 12.3%
amongst adults aged 18-69 years
(Table 8.2).
Patterns by background
characteristic (Table 8.2):
• The highest proportion of
adults with insufficient levels of
physical activity was in the oldest
age group for both men and women.
However, a much higher proportion
of women aged 55-69 had
insufficient levels of physical activity
compared to all other groups
(Figure 8.5)
• Prevalence of insufficient
physical activity is higher amongst
urban residents than rural residents
(11.7% vs 14.2%), however this
relation is differential across sex (Table
8.2). A higher percentage of women who
are rural residents had insufficient levels of
physical activity, while the opposite is seen
amongst men (Figure 8.6 and Table 8.2).
• Sylhet and Mymensingh have the
highest prevalence of insufficient physical
activity, while the lowest prevalence is
seen in Rajshahi (Figure 8.7)
8.3. Percent contribution to physical
activity from each domain.
Amongst adults who engaged in some
level of physical activity, 73.4% of the total
physical activity minutes contributed from
14.7
7.07.8 9.712.6
10.0
36.6
12.2
0.0
10.0
20.0
30.0
40.0
Women Men
Perc
ent
Figure 8.5 Prevalence of insufficient levels of physical activities by age group amongst
women and men aged 18-69, Bangladesh STEPs Survey 2018
18-24 25-39 40-54 55-69
15.113.8
8.1
14.6
0.0
5.0
10.0
15.0
20.0
Rural Urban
Figure 8.6 Differentials in percent of women and men aged 18-69 who have insufficient
levels of physical activity by residence, Bangladesh STEPs Survey 2018
Women Men
14.2%
11.2%
13.1%
9.6%
17.3%8.4%
9.4%
20.9%
Figure 8.7 Prevalence of insufficient levels of physical activity amongst adults aged 18-69 by
division, Bangladesh STEPs Survey 2018

STEPS Bangladesh 2018
112
work, 22.1% from travel, and only 4.6% were from recreational activities.
Patterns by background characteristics (Table 8.3):
• Adults aged 18-24 were most likely to engage in recreational activities (10.4%) as part
of their physical activity while adults aged
40-54 were mostly engaged in physical
activity through work (76.0%).
• Women engaged in less
recreational physical activities and more
work-related activities compared to men.
Much of men’s physical activity came
from travelling to and from the places
(31.5%).
• Rural residents engaged in more
physical activities that were work-related or travel-related compared to urban residents.
• The proportional contribution from work to the total physical activity declines with
increasing household wealth (Figure 8.10), while the reverse is true for physical activity
from travel and recreational activities. Similar patterns were observed with increasing
educational levels. (Figure 8.11).
8.4 Time spent on sedentary activities
On average, adults spend 174.8 minutes per day on sedentary activities such as sitting or
reclining excluding sleep time. Fifty percent of adults spent 140.0 minutes or more per day on
sedentary activities.
13.1 12.810.4 10.911.9
8.5
14.015.6
13.4
0.0
5.0
10.0
15.0
20.0
Increasing levelseducation
Increasing levels ofwealth
Perc
ent
Figure 8.8 Differentials in prevalence of insufficient physical activity by education and
wealth amongst adults age 18-69, Bangladesh STEPs Survey 2018
79.1 75.267.7
54.4
19.5 21.024.1
32.0
1.4 3.8 8.2 13.7
0.0
10.0
20.0
30.0
40.0
50.0
60.0
70.0
80.0
90.0
100.0
Noeducation
Primary Secondary More thansecondary
Perc
ent
Figure 8.11 Contribution to total physical activity from each domain by education
level amongst adults aged 18-69, Bangladesh STEPs Survey 2018
Work Travel Recreational
83.4 79.9 73.5 69.0 60.6
15.017.6
21.325.6
31.3
1.6 2.5 5.3 5.4 8.1
0.0
10.0
20.0
30.0
40.0
50.0
60.0
70.0
80.0
90.0
100.0
Lowest Second Middle Fourth Highest
Perc
ent
Figure 8.10 Contribution to total physical activity from each domain by wealth
amongst adults aged 18-69, Bangladesh STEPs Survey 2018
Work Travel Recreational
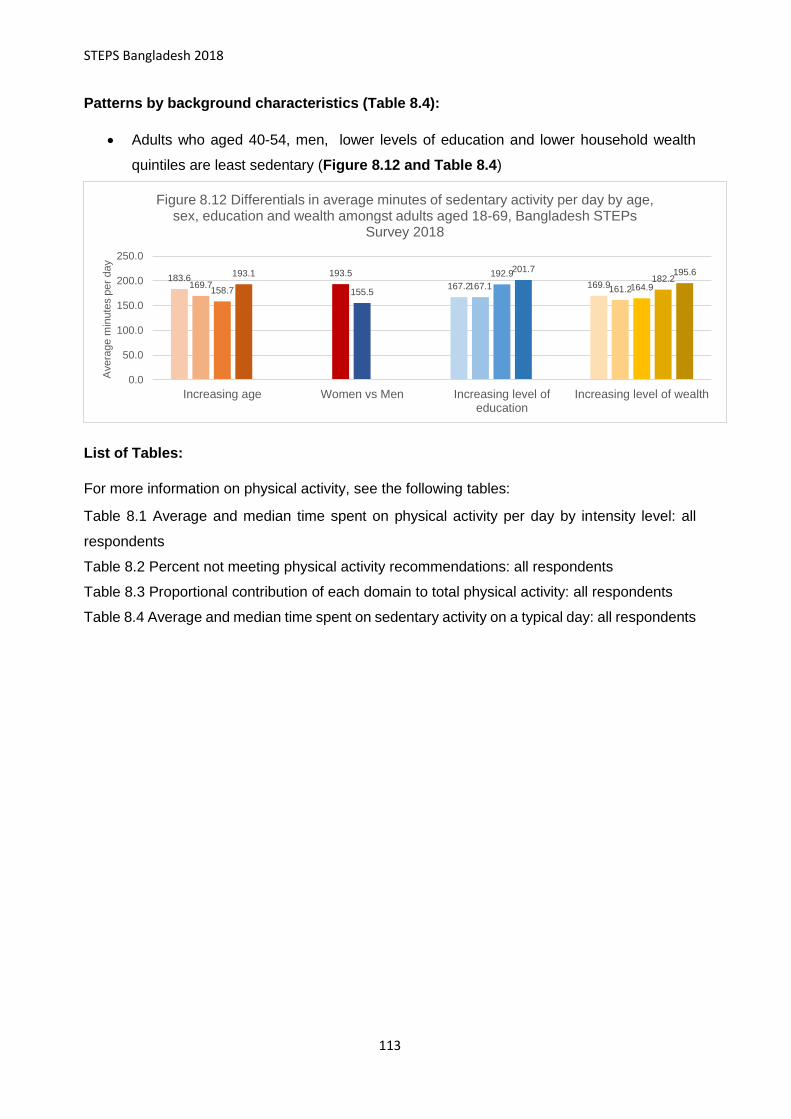
STEPS Bangladesh 2018
113
Patterns by background characteristics (Table 8.4):
• Adults who aged 40-54, men, lower levels of education and lower household wealth
quintiles are least sedentary (Figure 8.12 and Table 8.4)
List of Tables:
For more information on physical activity, see the following tables:
Table 8.1 Average and median time spent on physical activity per day by intensity level: all
respondents
Table 8.2 Percent not meeting physical activity recommendations: all respondents
Table 8.3 Proportional contribution of each domain to total physical activity: all respondents
Table 8.4 Average and median time spent on sedentary activity on a typical day: all respondents
183.6167.2 169.9169.7
193.5
167.1 161.2158.7 155.5
192.9
164.9
193.1 201.7182.2
195.6
0.0
50.0
100.0
150.0
200.0
250.0
Increasing age Women vs Men Increasing level ofeducation
Increasing level of wealth
Avera
ge m
inute
s p
er
day
Figure 8.12 Differentials in average minutes of sedentary activity per day by age, sex, education and wealth amongst adults aged 18-69, Bangladesh STEPs
Survey 2018

STEPS Bangladesh 2018
114
Table 8.1 Average and median time spent on physical activity per day by intensity level: All respondents.
Average and median time (minutes per day) spent on vigorous- and moderate-intensity physical activity amongst adults (18-69 years), according to background characteristics [Bangladesh, 2018] Background characteristic
Vigorous intensity physical activity (min. per day)
Total (N)
Moderate intensity physical activity (min. per day)
Total (N)
Total physical activity in minutes of moderate- intensity activity (min. per day)**
Total respondents (N) Average Median IQR Average Median IQR Average Median IQR
p25 p75 p25 p75 p25 p75 Age
18-24 45.0 0.0 0.0 25.7 1023 122.8 80.0 33.6 160.0 1019 213.3 114.3 51.4 265.7 1017 25-39 60.7 0.0 0.0 38.6 3482 151.7 111.4 45.0 200.0 3460 272.2 150.0 64.3 374.3 3454 40-54 72.0 0.0 0.0 68.6 2500 147.9 105.7 40.0 200.0 2487 291.8 158.6 60.0 400.0 2484 55-69 39.5 0.0 0.0 17.1 1165 108.7 60.0 17.1 150.0 1165 187.7 90.0 25.7 255.7 1163
Sex
Women 11.2 0.0 0.0 0.0 4379 122.3 90.0 38.6 171.4 4349 144.8 100.0 42.9 180.0 4347 Men 101.6 17.1 0.0 154.3 3791 151.9 94.3 30.0 222.9 3782 354.6 235.0 68.6 557.1 3771
Residence
Rural 61.2 0.0 0.0 51.4 4713 140.6 96.4 37.1 188.6 4159 262.7 147.9 60.0 360.0 4151 Urban 36.4 0.0 0.0 0.0 3997 124.0 72.9 30.0 150.0 3792 196.7 98.6 38.6 231.4 3967
Division
Barishal 49.9 0.0 0.0 25.7 986 111.3 85.7 40.7 150.0 983 211.2 115.7 60.0 265.7 983 Chattogram 48.2 0.0 0.0 21.4 1053 129.0 94.3 51.4 147.9 1051 224.9 120.0 60.0 244.3 1051 Dhaka Rural 45.8 0.0 0.0 17.1 995 111.7 60.0 25.7 141.4 996 203.7 94.3 38.6 241.4 994 Khulna 50.2 0.0 0.0 21.4 1040 176.8 128.6 42.1 282.9 1015 278.2 202.1 60.0 428.6 1015 Mymensingh 55.1 0.0 0.0 42.9 1018 175.4 120.0 30.0 270.0 1015 285.1 180.0 50.0 420.0 1012 Rajshahi 82.2 0.0 0.0 102.9 1065 160.3 121.4 60.0 222.9 1060 322.1 186.4 90.0 497.1 1059 Rangpur 60.1 0.0 0.0 51.4 1004 135.7 98.6 32.1 201.4 1003 256.4 154.3 55.7 360.0 999 Sylhet 71.4 0.0 0.0 40.0 1009 114.4 88.6 28.6 150.0 1008 257.1 114.3 30.0 276.4 1005
Education
No education 75.1 0.0 0.0 80.0 3670 138.8 90.0 30.0 182.1 3655 288.1 160.0 59.3 407.1 3648 Primary 45.9 0.0 0.0 17.1 2527 145.2 92.1 45.0 197.1 2515 237.2 120.0 60.0 301.4 2510 Secondary 42.8 0.0 0.0 17.1 888 129.6 88.6 30.7 175.0 879 216.0 120.0 45.0 240.0 879 More than secondary 24.8 0.0 0.0 17.1 1064 116.9 74.3 30.0 154.3 1061 166.5 105.0 37.1 201.4 1060
Wealth quintile
Lowest 77.5 0.0 0.0 102.9 1636 140.5 90.0 31.4 210.0 1625 294.0 171.4 60.0 430.0 1623 Second 71.9 0.0 0.0 72.9 1667 141.5 94.3 35.7 195.0 1659 284.8 150.0 60.0 397.1 1656 Middle 73.4 0.0 0.0 68.6 1445 148.3 102.9 40.0 185.7 1438 295.9 167.1 64.3 415.7 1433 Fourth 35.7 0.0 0.0 8.6 1504 138.5 90.0 30.0 180.0 1499 210.2 120.0 45.0 270.0 1497 Highest 19.8 0.0 0.0 0.0 1918 115.4 77.1 30.0 150.0 1910 154.7 90.0 40.0 184.3 1909 Total (25-69) 59.0 0.0 0.0 38.6 7147 141.3 94.3 34.3 187.1 7112 258.7 141.4 57.1 360.0 7101 Total (18-69) 55.6 0.0 0.0 34.3 8,170 136.9 90.0 34.3 180.0 8131 247.9 132.0 53.6 330.0 8118 *MET( Metabolic equivalent of task): for vigorous activity 1 minute equate to 8 units of MET; for moderate activity 1 minute equate to 4 units of MET. **Minutes spent on vigorous-intensity activities per day are multiplied by 2, to derive equivalent minutes of moderate-intensity activities, which is then summed up to derive total physical activity in minutes of moderate-intensity activity per day.

STEPS Bangladesh 2018
115
Table Physical activity.8.2 Percent not meeting physical activity recommendations: All respondents
Percent of men and women (18-69 years) not meeting physical activity recommendations*, according to background characteristics [Bangladesh, 2018]
Background characteristic
Total Women Men
Percent n Percent n Percent n
Age
18-24 11.2 1017
14.7 615
7.0 402
25-39 8.8 3454
7.8 2000
9.7 1454
40-54 11.3 2484
12.6 1276
10.0 1208
55-69 23.1 1163
36.6 456
12.2 707
Residence
Rural 11.7 4151
15.1 2252
8.1 1899
Urban 14.2 3967
13.8 2095
14.6 1872
Division
Barishal 14.2 983
18.4 538
9.7 445
Chattogram 11.2 1051
14.2 552
7.6 499
Dhaka Rural 13.1 994
13.1 518
13.1 476
Khulna 9.6 1015
9.2 535
10.0 480
Mymensingh 17.3 1012
25.6 547
7.4 465
Rajshahi 8.4 1059
10.9 569
6.0 490
Rangpur 9.4 999
6.8 543
12.1 456
Sylhet 20.9 1005
32.6 545
7.8 460
Education
No education 13.1 3648
17.9 1948
8.1 1700
Primary 10.4 2510
10.3 1512
10.4 998
Secondary 11.9 879
14.5 427
9.4 452
More than secondary 14.0 1060
16.5 439
12.6 621
Wealth quintile
Lowest 12.8 1623
16.9 973
7.5 650
Second 10.9 1656
12.4 903
9.3 753
Middle 8.5 1433
12.7 717
5.2 716
Fourth 15.6 1497
18.3 712
13.0 785
Highest 13.4 1909
13.3 1042
13.6 867
Total (25-69) 12.6 7101
14.8 3732
10.4 3369
Total (18-69) 12.3 8118
14.8 4347
9.6 3771
*WHO physical activity recommendations per age group: [15-17 years] At least 60 minutes of moderate- to vigorous-intensity physical activity daily; [18-64] At least 600 METs (metabolic equivalent of tasks) of physical activity throughout the week or 150 minutes of moderate-intensity physical activity per week or 75 minutes of vigorous-intensity physical activity per week; [65 years and above] same as age group 18-64 years. (For complete recommendation, please refer to Global recommendation on physical activity for health, 2010).

STEPS Bangladesh 2018
116
Table Physical Activity.8.3 Proportional contribution of each domain to total physical activity: all respondents
Proportional share of total physical activity from work, travel and recreational activities amongst adults (18-69) who participate in some level of physical activity, according to background characteristics* [Bangladesh, 2018]
Background characteristic
Average percent contribution to overall physical activity from:
Total (%)
Total respondents (n)**
Work Travel from and to places
Recreational activities
Age
18-24 71.6 18.1 10.4 100.0 954 25-39 75.9 21.0 3.1 100.0 3292 40-54 76.0 22.2 1.9 100.0 2319 55-69 65.9 31.6 2.5 100.0 1028
Sex
Women 85.9 12.8 1.3 100.0 4,021 Men 60.7 31.5 7.8 100.0 3,572
Residence
Rural 75.6 20.4 4.0 100.0 3,934 Urban 65.6 28.1 6.3 100.0 3,659
Division
Barishal 71.1 23.4 5.5 100.0 908 Chattogram 71.1 26.1 2.8 100.0 999 Dhaka Rural 70.3 22.7 7.0 100.0 957 Khulna 76.4 18.7 5.0 100.0 964 Mymensingh 74.8 22.8 2.4 100.0 932 Rajshahi 78.6 17.4 4.0 100.0 1007 Rangpur 77.6 18.3 4.1 100.0 972 Sylhet 69.6 26.9 3.5 100.0 854
Education
No education 79.1 19.5 1.4 100.0 3426 Primary 75.2 21.0 3.8 100.0 2364 Secondary 67.7 24.1 8.2 100.0 826 More than
secondary 54.4 32.0 13.7 100.0 962
Wealth quintile
Lowest 83.4 15.0 1.6 100.0 1540 Second 79.9 17.6 2.5 100.0 1585 Middle 73.5 21.3 5.3 100.0 1357 Fourth 69.0 25.6 5.4 100.0 1393 Highest 60.6 31.3 8.1 100.0 1718
Total (25-69) 73.9 23.4 2.7 100.0 6,639 Total (18-69) 73.4 22.1 4.6 100.0 7,593 *proportion calculation based on amount of METs per activity among total amount of METs of total physical activity ** Adults who reported no participation in any type of physical activities were excluded.

STEPS Bangladesh 2018
117
Table Physical Activity.8.4 Average and median time spent on sedentary activity on a typical day: all respondents
Average time (minutes per day) spent sitting or reclining among adults (18-69 years), according to background characteristics [Bangladesh, 2018]
Background characteristic
Average 95% CI Median Interquartile range
Total respondents (n) p25 p75
Age 18-24 183.6 170.6 196.6 150.0 90.0 240.0 1026 25-39 169.7 158.5 180.9 120.0 60.0 240.0 3489 40-54 158.7 146.2 171.1 120.0 60.0 210.0 2503 55-69 193.1 176.3 210.0 150.0 80.0 270.0 1167
Sex Women 193.5 181.1 205.8 150.0 90.0 270.0 4381 Men 155.5 143.9 167.0 120.0 60.0 205.0 3804
Residence Rural 173.7 162.0 185.4 135.0 60.0 240.0 4183 Urban 178.4 162.9 193.8 150.0 60.0 240.0 4002
Division Barishal 146.7 134.8 158.6 120.0 60.0 180.0 986 Chattogram 156.1 144.4 167.9 120.0 90.0 205.0 1053 Dhaka Rural 214.8 182.9 246.6 185.0 60.0 300.0 997 Khulna 186.6 158.6 214.6 150.0 90.0 240.0 1040 Mymensingh 166.7 126.9 206.5 120.0 60.0 240.0 1021 Rajshahi 186.9 173.3 200.5 155.0 90.0 300.0 1066 Rangpur 110.6 88.5 132.8 80.0 30.0 150.0 1009 Sylhet 168.3 153.9 182.7 150.0 90.0 220.0 1013
Education No education 167.2 155.0 179.4 120.0 60.0 240.0 3678 Primary 167.1 156.1 178.1 121.0 60.0 240.0 2533 Secondary 192.9 175.2 210.7 150.0 90.0 240.0 888 More than secondary 201.7 184.7 218.8 180.0 90.0 300.0 1065
Wealth quintile Lowest 169.9 152.6 187.3 120.0 60.0 240.0 1639 Second 161.2 145.6 176.9 120.0 60.0 210.0 1670 Middle 164.9 150.7 179.1 120.0 60.0 210.0 1451 Fourth 182.2 170.1 194.4 150.0 90.0 240.0 1506 Highest 195.6 183.8 207.3 180.0 90.0 270.0 1919 Total (25-69) 172.0 161.8 182.1 120.0 60.0 240.0 7159 Total (18-69)

Bangladesh, 2018
118
Chapter 9 Anthropometry
Key findings
Nutritional status:
o Underweight: 13.7% of adults (11.6% women, 15.7% men)
o Overweight: 20.5% of adults (25.1% women, 16.0% men)
o Obesity: 4.3% of adults (8.6% women, 2.3% men)
o Mean population Body-mass Index (BMI): 22.7 kg/m2 (23.5 kg/m2 in women, 21.9 kg/m2
in men)
Waist circumference and waist-hip ratio:
o High waist circumference (>88cm for women, >104 for men): 10.9% (20.1% in women,
1.8% in men)
o High waist-hip ratio (>= 0.85 for women, >=0.90 for men): 42.7% (42.2% in women,
43.2% in men)
Disease risk based on body-mass index and waist circumference:
o Increased risk:18.6% (18.9% women, 18.2% men)
o High risk: 7.8% (13.2% women, 8.5% men)
o Very high risk: 4.9% (8.5% women, 1.3% men)
Introduction
The global epidemic of overweight and obesity is rapidly becoming a major public health
problem that paradoxically coexists with undernutrition in many developing countries. The
increasing prevalence of overweight and obesity is associated with many chronic diseases
including type 2 diabetes mellitus, cardiovascular disease (CVD), stroke, hypertension, non-
alcoholic fatty liver disease, and certain cancers52,53. One of the nine voluntary global targets
set under WHO Global Action Plan against NCDs54 is to halt the rise in diabetes and obesity
by 2025. Hence, Bangladesh has incorporated it as one of the key targets in its 5-year
multisectoral action plan for 2018-202510 and its predecessor39.
52 Lu, Y., Hajifathalian, K., Ezzati, M., Woodward, M., Rimm, E.B. and Danaei, G., 2014. Metabolic mediators of the effects of body-mass index, overweight, and obesity on coronary heart disease and stroke: a pooled analysis of 97 prospective cohorts with 1· 8 million participants. 53 The GBD 2015 Obesity Collaborators. Health Effects of Overweight and Obesity in 195 Countries over 25 Years. N Engl J Med. 2017;377(1):13-27. doi:10.1056/NEJMoa1614362 54 WHO. The Updated Appendix of 3 of the Global Action Plan for the Prevention and Control of NCDs 2013-2020. World
Health Organization. Global action plan for the prevention and control of NCDs 2013-2020. Geneva.

Bangladesh, 2018
119
Current relevant policies and programs in Bangladesh for nutritional status
• Multisectoral Action Plan for the Prevention and Control of Non-Communicable Diseases
2018-202510
• National Nutrition Policy 201555
This chapter summarizes anthropometric parameters that reflect both general obesity (body-
mass Index (BMI)), and abdominal obesity as measured by waist circumference (WC) and
waist-to-hip ratio (WHR) and its associated disease risk. The indicators presented will help
Bangladesh assess current trends in overall nutrition status and the risk for chronic diseases
and metabolic disorders and the effectiveness of current policy and programs.
9.1 Nutritional Status
In 2018, mean population BMI of adult population (15-69 years) was 22.7kg/m2 which is
within normal weight range (i.e. 18.5 to 24.9 kg/m2). 13.7% of adults were underweight
(BMI<18.5 kg/m2) while 20.5% and 5.4% of adults were overweight (BMI-25-29.9) and
obese (BMI>=30), respectively (Table 9.1).
Patterns by background characteristics for nutritional status (Table 9.1):
• Mean BMI was significantly higher in age groups 25-39 and 40-54 compared to older
and younger age groups.
• Women had significantly higher mean BMI than men (23.5 kg/m2 vs 21.9 kg/m2)
which is also reflected in prevalence of overweight and obesity (33.7% vs 18.3%)
(Table 9.1)
• Adults who are urban residents, with higher education levels and higher household
wealth had significantly higher mean BMI and prevalence of overweight and obesity
(Figure 9.1). While the opposite relationship is seen for underweight (Figure 9.2)
55 National Nutrition policy 2015. Available at : http://extwprlegs1.fao.org/docs/pdf/bgd152517.pdf

Bangladesh, 2018
120
• Dhaka rural had the highest prevalence of overweight and obesity (31.6%) and
Mymensingh had the highest prevalence of underweight (21.1%) (Table 9.1).
9.2 Waist Circumference and Waist-Hip Ratio
While BMI is a population-level measure for overweight and obesity, it does not reflect
variation in body fat distribution and lean body mass. Both WC and WHR correlate more
closely to abdominal obesity which in-turn is more reflective of metabolic abnormalities such
as decreased glucose tolerance, reduced insulin sensitivity and adverse lipid profiles56.
There are no definite evidence on appropriate universal or population-specific cut offs for
WC or WHR57 and variations in outcome measures used for reference. For the purpose of
this report, cut-offs commonly attributed to WHO6,58 (used for discussion below) and South
Asian specific cut-offs established by International Diabetes Federation59 (only shown in
56 WHO. Waist circumference and waist-hip ratio: report of a WHO expert consultation, Geneva, 2008. 57 Lear SA, James PT, Ko GT, Kumanyika S. Appropriateness of waist circumference and waist-to-hip ratio
cutoffs for different ethnic groups. Eur J Clin Nutr. 2010;64(1):42-61. doi:10.1038/ejcn.2009.70 58 WHO. Obesity: preventing and managing the global epidemic: report a WHO consultation. Geneva, 2000. 59 Alberti KGMM, Zimmet P, Shaw J. Metabolic syndrome-a new world-wide definition. A Consensus
Statement from the International Diabetes Federation. Diabet Med. 2006;23(5):469-480. doi:10.1111/j.1464-
5491.2006.01858.x
18.913.6
23.527.3
16.7
34.329.8
22.7
39.6
30.9
46.2
0.0
10.0
20.0
30.0
40.0
50.0
Rural vs urban Increasing level of education Increase level of wealth
Perc
ent
Figure 9.1 Differentials in prevalence of overweight and obesity amongst adults aged 18-69, by residence, education and wealth,
Bangladesh STEPs Survey 2018
19.521.8
14.112.8
17.5
12.1
8.8
13.5
5.7
10.9
4.4
0.0
5.0
10.0
15.0
20.0
25.0
Rural vs urban Increasing level of education Increase level of wealth
Perc
ent
Figure 9.2 Differentials in prevalence of underweight amongst adulst aged 18-69 by residence, education and wealth, Bangladesh
STEPs Survey 2018
Bangladesh, 2018
121
Table 9.2) that both have been widely cited across studies were utilized for cross country
comparison and trend analysis. Further analysis using validated country or population
specific cut-offs may be required for more sensitive population risk assessment.
The population mean WC of all adults (18-69 years) was 78.6 cm and mean WHR was 0.87
(Table 9.2). 10.9% of adults had high WC (>88 cm for women, > 102 cm for men). 42.7% of
adults have high WHR (Table 9.2).
Patterns by background characteristics for waist circumference and waist-hip ratio
(Table 9.2):
• Although mean WC did not differ significantly between men and women, a substantially
higher proportion of women had high WC compared to men (20.1% vs 1.8%).
• Women had significantly lower mean WHR than men (0.84 vs 0.89) but did not differ
much in prevalence of high WHR.
• A higher proportion of adults who are urban residents and are of higher household
wealth had high WC and high WHR (Figure 9.3).
• Chattogram and Khulna are amongst the divisions with the highest prevalence of high
WC or high WHR. Interestingly, Although Rangpur has the second highest prevalence
of high WC(43.1%) , only 8.4% of adults have high WC. (Table 9.2)
9.3 Disease risk based on body-mass index and waist circumference
Information from BMI and WC can be combined to capture both general obesity and
abdominal obesity for the better categorization of risk status relative to individuals who have
normal BMI and normal WC (Figure 9.6).
5.5
32.7
20.1
7.1
42.2
33.7
1.87.4
43.239.2
13.2
48.9
21.6
59.4
0.0
10.0
20.0
30.0
40.0
50.0
60.0
70.0
Rural vs Urban Increasing level of wealth Rural vs Urban Increasing level of wealth
Waist circumference Wasi-thip ratio
Per
cen
t
Figure 9.3 Percent adults aged 15-69 with high waist circumference and high wasit-hip ratio by residence and wealth,
Bangladesh STEPs Survey 2018

Bangladesh, 2018
122
Figure 9.6 Classification of Overweight and Obesity by BMI, Waist Circumference, and Associated Disease Risk* (adapted from: NHLBI Obesity Education Initiative (2000)60)
Waist Circumference
BMI categories** Men<=102cm, Women <=88cm Men<102cm, Women <88cm
Normal (BMI 18.5-24.9) Normal risk Increased risk
Overweight (BMI 25.0-29.9) Increased risk High risk
Obese (BMI>=30.0) High risk Very high risk
*Disease risk is relative to normal weight and waist circumference **Excluded underweight category
In Bangladesh 69.2% of adults had both a normal BMI and a normal WC and hence falls in
the normal risk group for chronic diseases (Table 9.3). 19.9% of adults were in “increased”
risk group, while 7.5% and 3.3% of all adults were categorized into “high” and “very-high”
risk group respectively (Table 9.3).
Patterns by background characteristics (Table 9.3):
• A substantially higher proportion of men and rural residence compared to their
counterparts.
• Rangpur has the highest percent of adults with normal risk (78.2%) and the lowest in
Dhaka rural (63.9%)
• Increasing levels of education and household wealth is associated with a higher
prevalence of disease risk (Figure 9.7 & Figure 9.8).
60 National Institutes of Health. National Heart, Lung, and Blood Institute. NIH Publication Number 00-4084.
October 2000. NHLBI Obesity Education Initiative.
12.320.6 19.3
29.46.9
8.2 8.6
7.4
5.6
4.4 5.1
5.2
0.0
10.0
20.0
30.0
40.0
50.0
Noeducation
Primary Secondary More thansecondary
Perc
ent
Figure 9.8 Differentials in disease risk based on BMI and WC by education
level amongst adults aged 18-69, Bangladesh STEPs Survey 2018
Increased risk High risk Very high risk
11.2 13.8 17.6 21.9 26.54.45.7
6.28.5
13.4
2.52.1
3.1
6.1
10.0
0.0
10.0
20.0
30.0
40.0
50.0
60.0
Lowest Second Middle Fourth Highest
Perc
ent
Figure 9.7 Differentials in disease risk based on BMI and WC by wealth amongst
adults aged 18-69, Bangladesh STEPs Survey 2018
Increased risk High risk Very high risk
Bangladesh, 2018
123
List of Tables:
For more information on anthropometry, see the following tables:
Table 9.1 Nutritional status based on body-mass index: all respondents (excluding pregnant
women)
Table 9.2 Nutritional status based on waist circumference and waist-hip ratio: all respondents
(excluding pregnant women)
Table 9.3 Disease risk based on body-mass index and waist circumference: all respondents
(excluding pregnant women)

Bangladesh, 2018
124
Table 9.1 Nutritional status based on body-mass Index: all respondents (excluding pregnant women)
Mean population BMI and percentage of adults aged 15-69 who had normal BMI, were underweight, overweight or obese; by background characteristics, [Bangladesh, 2018] Background characteristic
Mean BMI* (kg/m2)
95% CI Percent respondents who's weight status is:
Normal (BMI 18.5-24.9)
Underweight (BMI<18.5)
Overweight (BMI 25.0-29.9)
Obese (BMI >= 30.0)
Number of respondents (n)
Age
18-24 21.6 21.3 - 22.0 69.4 14.8 13.0 2.9 966
25-39 23.2 23.0 - 23.4 57.1 11.5 25.7 5.7 3378
40-54 23.0 22.8 - 23.3 57.6 13.6 21.1 7.7 2484
55-69 22.3 21.8 - 22.7 59.3 17.1 18.0 5.6 1157
Sex
Women 23.5 23.2 - 23.7 54.7 11.6 25.1 8.6 4206
Men 21.9 21.7 - 22.0 66.0 15.7 16.0 2.3 3779
Residence
Rural 22.4 22.2 - 22.6 62.4 14.1 18.9 4.6 4087
Urban 23.6 23.3 - 23.9 53.5 12.1 26.0 8.3 3898
Division
Barishal 22.5 22.2 - 22.8 62.5 13.8 18.9 4.8 967
Chattogram 23.0 22.6 - 23.4 60.6 11.1 22.2 6.2 1016
Dhaka Rural 23.1 22.8 - 23.5 56.3 12.1 25.4 6.2 974
Khulna 23.0 22.6 - 23.4 59.7 12.2 20.6 7.4 1023
Mymensingh 21.5 21.1 - 21.9 62.9 21.1 13.6 2.5 995
Rajshahi 22.8 22.3 - 23.3 59.0 13.4 21.3 6.3 1040
Rangpur 21.9 21.4 - 22.4 67.2 15.3 14.3 3.3 987
Sylhet 21.6 21.3 - 22.0 64.3 18.4 14.9 2.4 983
Education
No education 21.8 21.6 - 22.1 61.6 19.5 13.5 5.4 2443
Primary 22.8 22.6 - 23.0 60.0 12.8 22.4 4.9 3622
Secondary 23.2 22.9 - 23.5 61.5 8.8 23.4 6.4 1352
More than secondary 24.0 23.3 - 24.7 54.7 5.7 33.0 6.6 547
Wealth quintile
Lowest 21.2 20.9 - 21.4 64.6 21.8 11.2 2.4 1602
Second 21.7 21.4 - 21.9 65.8 17.5 14.5 2.2 1637
Middle 22.3 22.0 - 22.7 63.8 13.5 18.7 4.0 1405
Fourth 23.2 22.9 - 23.6 58.2 10.9 24.1 6.9 1471
Highest 24.9 24.6 - 25.3 49.4 4.4 34.4 11.8 1870
Total (18-39) 22.6 22.5 - 22.8 61.6 12.7 21.0 4.7 4344
Total (40-69) 22.7 22.4 - 22.9 58.3 15.2 19.7 6.8 3641
Total (25-69) 23.0 22.8 - 23.1 57.7 13.3 22.8 6.2 7019
Total (18-69) 22.7 22.5 - 22.8 60.4 13.7 20.5 5.4 7985
* underweight BMI<18.5; overweight BMI >=25.0-29.9; obese BMI>=30.0. For respondents aged 15-18, BMI classification is based on age: underweight BMI<-2SD, overweight BMI >=1-2SD, obese BMI>=2SD (https://www.who.int/growthref/who2007_bmi_for_age/en/)

Bangladesh, 2018
125
Table 9.2: Nutritional status based on waist circumference and waist-hip ratio: all respondents (excluding pregnant women)
Mean waist circumference and waist/hip ratio and Percentage of people age 18-69 (excluding pregnant women) who have high waist circumference and at-risk and high-risk waist-hip ratio; by background characteristics, [Bangladesh, 2018] Background characteristic Mean WC
(cm) 95% CI Percent adults with high WC based on
cut-offs:
Mean WHR ***
95% CI Percent adults with high WHR (>=0.85 women, >=0.90 men
Number of respondents (n)
women >88cm men >102cm*
women >80cm men >90cm**
Age
18-24 74.5 73.7 - 75.3 4.9 16.2
0.83 0.83 - 0.84 22.5 972 25-39 79.4 78.8 - 80.0 10.8 30.5
0.87 0.86 - 0.87 43.9 3388
40-54 80.4 79.7 - 81.0 14.1 32.5
0.88 0.88 - 0.88 51.9 2490 55-69 80.4 79.2 - 81.7 15.6 31.9
0.90 0.89 - 0.90 56.6 1163
Sex
Women 78.2 77.5 - 78.8 20.1 41.1
0.84 0.84 - 0.85 42.2 4229 Men 79.1 78.5 - 79.6 1.8 14.7
0.89 0.89 - 0.90 43.2 3784
Residence
Rural 77.8 77.3 - 78.3 9.6 25.4
0.86 0.86 - 0.87 40.7 4104 Urban 81.4 80.7 - 82.1 15.5 36.2
0.88 0.87 - 0.88 49.5 3909
Division
Barishal 78.2 77.4
79.1 9.9 24.5
0.86 0.85
0.87 37.4 970 Chattogram 80.0 78.7 - 81.2 14.6 33.8
0.88 0.87 - 0.88 48.3 1022
Dhaka Rural 79.2 78.4 - 80.0 9.8 28.3
0.86 0.86 - 0.87 40.0 976 Khulna 79.8 78.7 - 80.9 14.8 30.9
0.87 0.86 - 0.88 43.3 1024
Mymensingh 77.1 76.0 - 78.3 8.4 24.9
0.87 0.86 - 0.88 43.3 999 Rajshahi 78.3 77.0 - 79.6 10.7 27.9
0.87 0.86 - 0.88 42.4 1046
Rangpur 76.1 75.1 - 77.1 6.0 18.5
0.87 0.86 - 0.87 43.6 989 Sylhet 76.9 75.6 - 78.1 8.4 22.3
0.86 0.85 - 0.87 37.8 987
Education
No education 76.7 75.9 - 77.5 10.1 22.4
0.87 0.86 - 0.87 41.1 2451 Primary 78.7 78.1 - 79.4 11.5 29.5
0.86 0.86 - 0.87 41.5 3637
Secondary 79.9 79.1 - 80.8 11.0 29.8
0.87 0.86 - 0.88 43.1 1357 More than secondary 83.8 82.1 - 85.5 10.4 36.8
0.89 0.88 - 0.90 59.7 547
Wealth quintile
Lowest 74.0 73.3 - 74.6 5.5 14.0
0.85 0.85 - 0.86 32.7 1606 Second 75.6 74.8 - 76.3 7.1 19.1
0.85 0.85 - 0.86 33.7 1645
Middle 78.1 77.3 - 79.0 7.4 23.2
0.87 0.86 - 0.87 39.2 1411 Fourth 80.8 79.9 - 81.8 13.2 34.1
0.88 0.87 - 0.89 48.9 1477
Highest 84.8 83.8 - 85.7 21.6 49.1
0.89 0.88 - 0.90 59.4 1874
Total (18-39) 77.6 77.1 - 78.1 8.6 25.2
0.85 0.85 - 0.86 36.0 4360 Total (40-69) 80.4 79.7 - 81.1 14.8 32.2
0.89 0.88 - 0.89 54.0 3653
Total (25-69) 79.9 79.4 - 80.4 12.7 31.3
0.88 0.87 - 0.88 48.8 7041.0 Total (18-69) 78.6 78.2 - 79.1 10.9 27.8
0.87 0.86 - 0.87 42.7 8013
*WHO cut-offs for substantially increased risk by WC: >88 cm for women and >102 cm for men. ** International Diabetes Federation(IDF) cut-offs for increased risk by WC for South Asians: >80cm for women and >90 cm for men. ***WHO cut offs for increased risk by WHR:>=0.85 for women, >=0.90 for men.

Bangladesh, 2018
126
Table 9.3 Disease risk based on body-mass index and waist circumference: all respondents (excluding pregnant women)
Prevalence of different levels of disease risk* based on Body Mass Index and waist circumference amongst adults aged 18-69, by background characteristics, [Bangladesh, 2018]
Background characteristic
Percent of adults who's disease risk is: Total Number of respondents (N) Normal
risk** Increased risk High
risk Very high risk
Age
18-24 80.7 13.3 3.6 2.4 100.0 826 25-39 63.9 22.7 8.9 4.5 100.0 3002 40-54 64.9 19.0 8.6 7.4 100.0 2175 55-69 68.5 15.0 10.1 6.3 100.0 965
Sex
Women 59.5 18.9 13.2 8.5 100.0 3755 Men 78.2 18.2 2.4 1.3 100.0 3213
Residence
Rural 71.3 17.6 6.9 4.2 100.0 3466 Urban 59.7 21.8 11.2 7.3 100.0 3502
Division
Barishal 71.0 17.2 7.9 3.8 100.0 863 Chattogram 65.5 19.3 9.6 5.6 100.0 910 Dhaka Rural 63.9 22.5 9.0 4.6 100.0 861 Khulna 67.1 16.5 8.5 8.0 100.0 921 Mymensingh 77.6 13.4 6.1 2.9 100.0 801 Rajshahi 66.9 21.1 5.8 6.3 100.0 917 Rangpur 78.2 14.4 4.8 2.6 100.0 869 Sylhet 77.7 12.7 7.0 2.6 100.0 826
Education
No education 75.3 12.3 6.9 5.6 100.0 1994 Primary 66.8 20.6 8.2 4.4 100.0 3174 Secondary 67.1 19.3 8.6 5.1 100.0 1256 More than
secondary 57.9 29.4 7.4 5.2 100.0 530
Wealth quintile
Lowest 81.9 11.2 4.4 2.5 100.0 1248 Second 78.4 13.8 5.7 2.1 100.0 1373 Middle 73.1 17.6 6.2 3.1 100.0 1217 Fourth 63.5 21.9 8.5 6.1 100.0 1332 Highest 50.1 26.5 13.4 10.0 100.0 1798
Total (18-39) 69.9 19.3 7.0 3.8 100.0 3828 Total (40-69) 66.5 17.2 9.3 6.9 100.0 3140 Total (25-69) 65.1 20.1 9.1 5.7 100.0 6142 Total (18-69) 68.7 18.6 7.8 4.9 100.0 6968 * Disease risk for type 2 diabetes, hypertension and CVD. Normal risk: Normal BMI and normal WC; increased risk: normal BMI and high WC or overweight and normal WC; High risk: overweight and high WC or Obese and normal WC; very high risk: obese and high WC. ** Adults who are underweight were excluded. Source: NHLBI Obesity Education Initiative (2000)

Bangladesh, 2018
127
Chapter 10 Blood Pressure: screening, prevalence and treatment
Key findings
Prevalence of raised blood pressure (BP) among adults age 18-69 yrs.
o Based on actual measurement: Based on the criteria of Systolic BP> 140 or diastolic
BP>90mm Hg, the prevalence of raised blood pressure was 21.0%. This includes
people on medication who were normotensive at the time of the survey.
o Self-reported prevalence: Among adults who had ever had their BP measured, 13.7%
adults were ever told by a doctor or health care provider that they have raised BP.
Diagnosis and treatment gap among those noted to have raised BP at the time of
survey
o Unaware about their raised BP: 51.3% adults
o Not on treatment: 13.8% of adults knew their raised BP but were not on treatment.
o On treatment but not controlled: 20.8% of adults.
o On treatment and controlled: 14.1% of adults.
Screening coverage, prescription of medications, treatment compliance
o Screening coverage: 70.1% of adults (78.8 % among 40-69 years old) had had their
BP ever measured by a doctor or a health care provider.
o Treatment compliance: Among adults who were told to have raised 77.3% reported
ever taking medications and 41.4% reported currently taking their prescribed
medication in the two weeks prior to the survey.
Sources of care and medications
o Public and private sources of care: 77.2% and 14.0% of adults reported seeking
treatment and advice for raised BP usually from only private and public facilities,
respectively. 6.3% reported seeking care from either government or private facilities.
o Sources of drugs/medications: Majority of the adults (97.5%) who were prescribed
medication reported usually getting them only from private sources and only 1.0%
reported getting their medications only from government facilities.
o Only 1.4% of adults reported ever seeking care from local healers while 0.3% reported
using herbal medications to control their raised BP.
Reasons for not taking medications among those prescribed medication to control
their hypertension
o “Medication not necessary” and “blood pressure got normal” were the most common
reasons given for not taking medication-- reported by 68.1% adults.

Bangladesh, 2018
128
Introduction
Elevated blood pressure or hypertension is a serious medical condition which significantly
increases the risk of developing heart, brain, kidney and other diseases. An individual is
considered hypertensive if when measured on two consecutive occasions, their systolic
blood pressure is >140mm Hg and their diastolic blood pressure is > 90mm Hg on both
occasions.61
Hypertension if often considered a “silent killer” as most people with hypertension are
unaware of the problem and the condition may represent no warning signs or symptoms.
Several modifiable risk factors may lead to hypertension. These include unhealthy diets
(excessive salt consumption, a diet high in saturated fat and trans fats, low intake of fruits
and vegetables), physical inactivity, consumption of tobacco and alcohol, and being
overweight or obese.61
Under the WHO Global Action Plan, one of the nine voluntary targets is to achieve 25%
relative reduction in the prevalence of raised blood pressure by 2025 relative to 2010
levels.62 Hence, Bangladesh has incorporated it as one of the key targets in its 5-year
multisectoral action plan for 2018-202510 and its predecessor39.
Current relevant policies and programs in Bangladesh for nutritional status
• Multisectoral Action Plan for the Prevention and Control of Non-Communicable Diseases
2018-202510
• National guidelines for management of hypertension in Bangladesh63
This chapter focuses on indicators related to blood pressure; assessing prevalence,
diagnosis and treatment gaps and care seeking behaviors around blood pressure
management. This information will help Bangladesh assess trends and progress towards
hypertension management as specified in its multisectoral action plan as well as evaluation
of current policies and programs in place to reduce population blood pressure levels. These
will also guide future policy and programs to manage hypertension at population level.
Blood Pressure Measurement
61 World Health Organization (WHO). Hypertension [Internet]. Geneva, Switzerland: WHO; 13 Sep 2019 [ cited 30 Mar 2020]. Available from: https://www.who.int/news-room/fact-sheets/detail/hypertension# 62 World Health Organization. Global action plan for the prevention and control of NCDs 2013-2020. Geneva, Switzerland: WHO; 2013. 63 World Health Organization. Country Office for Bangladesh. (2013). National guidelines for management of hypertension in Bangladesh. World Health Organization. Country Office for Bangladesh. https://apps.who.int/iris/handle/10665/279486

Bangladesh, 2018
129
Blood pressure was measured with a digital, automated blood pressure monitor. Before
taking the measurements, participants were asked to sit quietly and rest for 15 minutes with
legs uncrossed. Three readings of systolic and diastolic blood pressure were obtained.
Participants rested for three minutes between each reading. The mean of the second and
third readings was calculated. A universal cuff size was used for all participants. The
sphygmomanometer cuff was placed on the left arm while the participant rested their
forearm on a table with the palm facing upward. Participants were requested to remove or
roll up clothing on the arm. The cuff was kept above the elbow aligning the mark for artery
(ART) on the cuff with the brachial artery and making sure the lower edge of the cuff was
placed 1.2 to 2.5 cm above the inner side of the elbow joint and with the level of the cuff at
the same level as the heart.
Analysis
Hypertension was defined as having systolic blood pressure >140 mm Hg and/or diastolic
blood pressure >90 mm Hg during the study, or normotensive at the time of survey but
previously diagnosed as having hypertension and currently taking medications to control
blood pressure.
Observations which had systolic BP < 40 mm Hg or >300 mm Hg were and Diastolic BP <30
mm Hg or > 200 mm Hg were excluded, though none of adults were recorded in this range.
In case the third reading was invalid, the average of the first two readings was considered.
10.1. Prevalence of raised blood pressure based on measurement and medications
history
Self-reported prevalence is likely to underestimate the true prevalence as many people may
be asymptomatic and not aware of their BP status. Therefore, carrying out measurements in
order to determine the actual prevalence is essential to understanding the overall risk of
hypertension across the population.
Overall 21.0% of adults were measured to have raised BP based on both the measurement
and medications history (Table 10.1). On the other hand, based on self-reports among
adults who ever got their BP measured, the prevalence was only 13.7% (Table 10.2).
Patterns by background characteristics (Table 10.1):
• The prevalence of hypertension increased with age. The prevalence increased
substantially after the age 40 (34.4% prevalence among adults aged 40-54 years).
Prevalence of hypertension was significantly higher in women compared to men
(24.1% vs 17.9%).
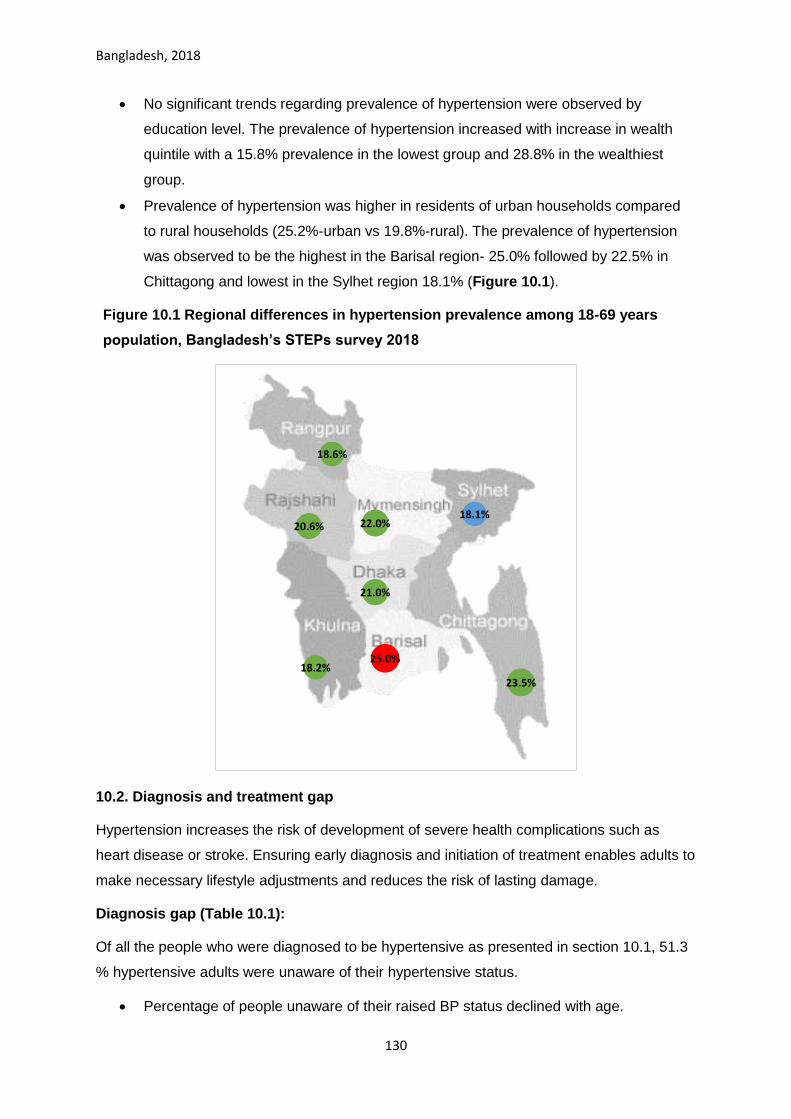
Bangladesh, 2018
130
• No significant trends regarding prevalence of hypertension were observed by
education level. The prevalence of hypertension increased with increase in wealth
quintile with a 15.8% prevalence in the lowest group and 28.8% in the wealthiest
group.
• Prevalence of hypertension was higher in residents of urban households compared
to rural households (25.2%-urban vs 19.8%-rural). The prevalence of hypertension
was observed to be the highest in the Barisal region- 25.0% followed by 22.5% in
Chittagong and lowest in the Sylhet region 18.1% (Figure 10.1).
Figure 10.1 Regional differences in hypertension prevalence among 18-69 years
population, Bangladesh’s STEPs survey 2018
10.2. Diagnosis and treatment gap
Hypertension increases the risk of development of severe health complications such as
heart disease or stroke. Ensuring early diagnosis and initiation of treatment enables adults to
make necessary lifestyle adjustments and reduces the risk of lasting damage.
Diagnosis gap (Table 10.1):
Of all the people who were diagnosed to be hypertensive as presented in section 10.1, 51.3
% hypertensive adults were unaware of their hypertensive status.
• Percentage of people unaware of their raised BP status declined with age.
25.0%
23.5%
21.0%
18.2%
22.0%20.6%
18.6%
18.1%

Bangladesh, 2018
131
• More men were unaware of their raised BP status than women (56.4%- men vs
47.6%-women)
• The proportion of adults who were unaware of their diagnosis status decreased with
increased education level and with increased household wealth. (Figure 10.3)
Treatment gap (Table 10.1):
Overall, 18.2 % of the people with raised BP at the time of survey were aware of diagnosis
but were not on treatment. Out of remaining 17.5% of adults with raised BP who reported to
be on treatment, 16.5% adults still have raised BP (uncontrolled) at the time of survey and
only 11% of adults were on treatment and controlled.
• Similar to diagnosis gap, the proportion of adults who were on treatment increased
with increasing age.
• A higher proportion of urban residents were on treatment when compared to rural
residing hypertensive adults.
• The proportion of adults who were on treatment increased with increase in education
level and increase in wealth. (Figure 10.3)
Quality of treatment (Table 10.1): Adults on treatment and controlled
• Overall, 14.1 % of adults were on treatment with BP within normal limits at the time of
survey.
• A higher proportion of men were on treatment which could control their raised BP
when women with raised BP (14.7%-men vs 13.6%-women)
• A higher proportion of urban residents were on treatment which could control their
raised BP when compared to rural residing adults with raised BP (15.3%-Urban vs
13.6%-Rural)
• The proportion of adults who were on treatment with controlled BP increased
progressively with increase in education level and increase in wealth quintile (Figure
10.3)

Bangladesh, 2018
132
Figure 10.3 Diagnosis and Treatment gaps among adults aged 18-69 years by wealth quintile, Bangladesh’s' STEPs survey 2018
10.3. Screening coverage
Early detection of raised BP through regular (at least annual) screening of healthy adults is
one of the key public health strategies for reduction the morbidity and mortality associated
with hypertension. Though data were not elicited about annual screening, 70.1% adults (78.8
% among the age group 40-69 years old) had had their blood pressure ever measured by a
doctor or a health care provider.
Patterns by background characteristics (Table 10.2):
• More women reported ever having their BP measured (82.9 %- women versus
57.0%- men).
• Younger adults age 15-24 years were much less likely to report their BP ever
measured compared to other age-groups (Figure 10.4).
• The likelihood of ever having BP measured did not vary by residence types and but
varied by region. The screening coverage in the Chittagong region was highest
(77.2%) followed by the Khulna region (74.5%) and was least in the Rangpur region
(57.6%). (Figure 10.5).
• The likelihood of having had BP measured increased significantly by household
wealth (Figure 10.4).
59.5 54.1 57.045.3 46.7 54.3
9.5 19.5 13.514.3 12.4
18.2
19.0 18.4 16.921.9 24.9
16.5
11.9 8.0 12.7 18.5 16.0 11.0
0%
20%
40%
60%
80%
100%
Lowest Second Middle Fourth Highest Overall
Treated andcontrolledTreated butuncontrolledDiagnosed butuntreated

Bangladesh, 2018
133
Figure 10.4: Percent of adults who have ever had their BP measured by a doctor or health care provider among adults aged 18-69 years, Bangladesh’s STEPs survey 2019
Figure 10.5 Percent of adults who have ever had their BP measured by a Doctor or Health Care provider among adults age 18-69 years, Bangladesh’s STEPs survey 2018
10.4. Prescription of medications and compliance with treatment (Table 10.2)
Monitoring of prescription practices and treatment compliance is an important strategy for
evaluating the outcomes at individual and at population level. Hypertension is a chronic risk
factor, requiring treatment over the lifetime of a person, which may reduce the compliance
with treatment as observed with many other chronic conditions such as HIV/AIDS or
tuberculosis.
60.570.8 64.9
74.4 69.7 67.377.7
68.0 67.283.3 77.5 70.4
80.9
0.0
50.0
100.0
Increasing age Increasing level of education Increading household wealth
Per
cen
tage
69.7%
77.2%
68.5%
74.5%
67.9%68.8%
57.6%
71.3%

Bangladesh, 2018
134
Overall, 13.7% of adults who were ever told to have raised BP, 77.3% ever took medicines
to control their BP and 41.4% reported currently taking the medications, showing poor
compliance with the prescriptions.
• Compliance with treatment increased with age. So, if a person is diagnosed and
prescribed medicine in 30-44-year age group, he/she is less likely to take drug
compared to adults 45-69 years of age.
• The likelihood of ever taking medications varied inversely with educational level.
However, the likelihood of having taken medications in the past two weeks prior to the
survey increased with increase in education level.
• The proportion of the adults who reported ever taking or currently taking medications
increased directly with household wealth.
10.5. Sources of care for treatment and advice and medications for raised BP
Overall a much higher proportion of adults sought treatment advise and care from Private
facilities (which include NGO run centers) (77.2%) than from government (14.0%) or other
sources (such as Ayurvedic, homeopathic or naturopathic hospital/clinic, medicine shops,
pharmacies, etc.) (10.9%) (Table 10.3). Similarly, for medications, majority of the adults
approached only private providers (97.5%), and only 0.8% of adults went to government
providers. 1.0% of adults mentioned both government and private sources for medications
for raised BP. (Table 10.4)
Background patterns: (Table 10.3 and 10.4)
• The proportion of adults who usually visited private facilities for care and medication
increased with increasing age. Highest proportion of adults sought care-treatment and
advice from private sources (77.2%)
• Men were more likely to seek both treatment/advice (16.0%- men vs 12.6%-women)
and medications (1.4%- men vs 0.8%-women) only from government facilities.
• Sources of care and household wealth: More than half of all adults, even in the poorest
wealth quintile sought care from private facilities. The proportion of adults seeking
treatment and advice at government had a reverse relationship with wealth quintile
(Figure 10.7). Lower wealth quintiles were more likely to seek advice and consultation
from government facilities (17.8% in the lowest wealth index group) while higher wealth
quintiles usually seek care form private facilities 15.4% in the wealthiest group).
• Source of care and region: In all the provinces and irrespective of the residence in
urban or rural residences, more than 50% of adults sought both care/advice and
medications from private providers. The use of government facilities for

Bangladesh, 2018
135
advice/consultation was lowest in the Chittagong and Mymensingh regions, and higher
in the Rangpur, Khulna and Rajshahi. (Figure 10.8).
• Source of care and residence: By residence, while use of government facilities was
much higher in urban residences for consultation and advice for raised BP compared
rural residences, the same was not true for source of medication.
Figure 10.7 Percent of adults (who were ever told to have raised BP) who sought treatment care/advise and medications from government and private facilities with respect to wealth quintile, Bangladesh’s STEPs survey 2018
17.811.4 13.1 12.4 15.4
0.0 2.0 0.1 0.3 2.0
69.8 77.2 79.9 80.1 76.997.0 95.5 99.5 98.4 97.0
8.5 6.7 6.0 6.3 5.3 2.0 0.2 0.4 0.9 0.50.5 1.5 0.0 1.0 1.2 0.6 1.9 0.0 0.4 0.3
0%
10%
20%
30%
40%
50%
60%
70%
80%
90%
100%
Low
est
Seco
nd
Mid
dle
Fou
rth
Hig
he
st
Low
est
Seco
nd
Mid
dle
Fou
rth
Hig
he
st
Advise/Care Medication
Other
Both
Only Private
Only Government

Bangladesh, 2018
136
Figure 10.8 Percent of adults (who were ever told to have raised BP) who sought treatment care/advise from government facilities with respect to province, Bangladesh's STEPs survey 2018
10.6. Consultation with traditional healers and use of herbal remedies
1.4% of adults with raised BP who reported visiting a traditional healer for treatment and
advise of which 0.3% adults reported currently taking herbal or traditional remedies for their
raised blood pressure.
Background patterns: (Table 10.5)
• The proportion of adults who reported taking herbal or traditional remedies for their
raised blood pressure was highest in the 40-55 years age group- 1.1%. Women were
more likely to have ever visited a local healer as compared to men (1.9%- women vs
0.6%- men). Additionally, a higher proportion of women reported currently taking
herbal or traditional remedies to control their BP among adults who had ever visited a
traditional healer. (0.5%-women vs 0%-men)
• Rural residents were more likely to have ever visited a local healer as compared to
urban residents.
15.1%
10.0%
14.8%
16.8%
13.5%15.2%
17.9%
11.9%

Bangladesh, 2018
137
• The proportion of adults who had ever visited a local healer and currently taking
herbal or traditional remedies to control their BP decreased with increase in
education level.
Figure 10.9 Percent of adults (who were ever told to have raised BP) who had ever visited a traditional healer with respect to region, Bangladesh’s STEPs survey 2018
10.7. Reasons for not on treatment
69.8% of adults who were prescribed medications cited “didn’t think the drugs were
necessary” and “their blood pressure got normal “as reasons for not currently taking
medications/treatment (Table 10.6). The second most common reason given for not taking
medications was “too expensive/ drugs not available” as cited by 19.6% adults
Patterns by background characteristics (Table 10.6):
• The highest proportion of adults who reported “too expensive/ drugs not available”
were within the ages 40-54 years (24.1%).
• A higher proportion of men (77.8 %) gave the reasons “did not think drugs were
necessary” or “their blood pressure was under control” compared to women (61.2%).
• The proportion of adults who reported did not think drugs were necessary” or “their
blood pressure was under control” increased with increase in education level and
increased household wealth.
2.4%5.5%
1.4%1.6%
1.9%
1.3%

Bangladesh, 2018
138
Figure 10.11 Reasons for which hypertensive adults reported not taking drugs for raised BP, Bangladesh 2018.
List of Tables:
For more information on raised blood pressure prevalence, screening and treatment coverage
or sources of care, see the following tables:
Table: 10.1 Prevalence of raised BP and diagnosis, treatment and control rates
Table: 10.2 Measurement of BP, prescription of medications, treatment compliance
Table: 10.3 sources of care for raised BP
Table: 10.4 sources of medications for raised BP
Table: 10.5 Care seeking from traditional healers and use of traditional/herbal remedies
Table: 10.6 Reasons for not taking medications among those told to have raised BP and have
been prescribed medications.
68.1
2.4
17.8
4.9
don’t think drugs are necessary/BP got normal
fear or have side effects
too expensive/not available
Medicines not advised by doctor
N=765

Bangladesh, 2018
139
Table NCD.10.1 Prevalence of raised BP and diagnosis, treatment and control rates: All
Percentage of people 18-69 who had raised BP at the time of survey or on BP medications and who were aware of their diagnosis, on treatment or have their BP controlled or uncontrolled with medications , by background characteristics, [Bangladesh, 2018]
Background characteristic Prevalence of raised BP1
(n) Among those with raised BP1
Not aware of diagnosis
Aware of diagnosis but not treatment
On treatment but not controlled
On treatment and controlled
Total (n)
Age
15-24 8.8 1919 69.7 9.8 6.6 14.0 177 25-39 20.7 3439 58.1 15.8 16.7 9.5 762 40-54 34.4 2098 43.5 16.5 24.5 15.5 816 55-69 46.9 563 39.7 11.4 31.3 17.6 266 Sex
Women 24.1 4306 47.6 14.5 24.3 13.6 1215 Men 17.9 3713 56.4 12.9 15.9 14.7 806 Residence
Rural 19.8 4106 54.0 14.9 17.5 13.6 887 Urban 25.2 3913 43.9 10.8 30.0 15.3 1134
Region
Barishal 25.0 975 43.6 15.5 18.9 21.9 299 Chattogram 23.5 1031 47.8 14.4 19.7 18.1 236 Dhaka Ru 21.0 975 52.5 14.1 22.4 11.0 251 Khulna 18.2 1021 51.2 11.3 24.9 12.6 260 Mymensingh 22.0 991 49.4 13.4 23.3 13.9 230 Rajshahi 20.6 1045 57.7 17.0 15.2 10.1 263 Rangpur 18.6 986 62.7 12.1 20.6 4.6 234 Sylhet 18.1 995 40.4 8.5 23.1 28.1 248 Education
No education 22.7 3604 53.9 13.8 19.9 12.4 850 Primary 19.5 2486 53.1 14.2 18.5 14.3 616 Secondary 16.8 866 42.4 14.7 24.7 18.3 225
More than secondary 23.2 1042 45.4 12.5 25.8 16.3 327
Wealth quintile
Lowest 15.8 1604 59.5 9.5 19.0 11.9 301 Second 17.8 1639 54.1 19.5 18.4 8.0 338 Middle 18.0 1425 57.0 13.5 16.9 12.7 296 Fourth 24.8 1479 45.3 14.3 21.9 18.5 427 Highest 28.8 1872 46.7 12.4 24.9 16.0 659 Total (18-39) 12.0 4447 65.2 12.8 10.7 11.3 663 Total (40-69) 37.0 3572 43.3 14.4 26.7 15.7 1358 Total (25-69) 25.0 7008 48.7 14.4 22.1 14.9 1945 Total (18-69) 21.0 8019 51.3 13.8 20.8 14.1 2021 1 based on measurement of BP and medications history

Bangladesh, 2018
140
Table NCD.10.2 Blood Pressure measured, self-reported prevalence and treatment of raised blood pressure: All
Percentage of respondents age 18-69 who have ever had their blood pressure measured and who have been told by a health care provider that they have raised blood pressure; among people who have been told they have raised blood pressure, the percentage told in the past 12 months they have raised blood pressure, and percentage taking medication to control blood pressure, by background characteristics, [Bangladesh, 2018] Background characteristic
Ever had blood pressure measured by doctor or health care provider
Ever told have raised blood pressure by doctor or health care provider
Number of respondents
Among respondents who have been told by a doctor or health care provider they have raised blood pressure, the percentage who were:
Told in the past 12 months have raised blood pressure
ever taken medication to control blood pressure
currently taking medication to control blood pressure
Number of respondents
Age
18-24 60.5 5.5 1942 75.8 55.1 27.4 126 25-39 74.4 12.9 3505 79.8 72.8 34.0 511 40-54 77.7 23.5 2152 82.2 85.0 48.2 586 55-69 83.3 30.8 586 89.6 87.4 50.1 186 Sex
Women 82.9 16.2 4381 83.8 81.7 43.1 878 Men 57.0 11.2 3804 80.2 70.6 38.7 531 Residence
Rural 69.9 12.7 4183 80.1 76.7 34.9 618 Urban 71.0 17.2 4002 88.1 78.7 57.8 791 Region
Barishal 69.7 17.6 986 84.1 79.9 41.8 221 Chattogram 77.2 14.6 1053 89.3 83.1 39.2 154 Dhaka 68.5 12.9 997 80.9 80.3 50.3 160 Khulna 74.5 13.4 1040 80.9 75.3 41.3 188 Mymensingh 67.9 14.9 1021 76.7 73.6 38.4 172 Rajshahi 68.8 12.0 1066 76.4 71.2 29.6 165 Rangpur 57.6 11.3 1009 78.4 68.1 34.4 138 Sylhet 71.3 17.0 1013 87.3 75.0 48.2 211 Education
No education 68.9 13.7 3678 81.1 80.3 38.0 544 Primary 71.9 13.2 2533 82.0 75.5 40.2 446 Secondary 69.2 11.5 888 89.2 75.4 49.6 165
More than secondary 70.9 16.9 1065 82.4 73.3 48.1 243
Wealth quintile
Lowest 64.9 10.1 1639 72.5 78.7 39.0 196 Second 67.3 11.5 1670 77.9 70.2 31.1 221 Middle 67.2 11.7 1451 81.1 75.1 35.4 219 Fourth 70.4 16.9 1506 83.9 75.9 38.6 298 Highest 80.9 18.5 1919 89.9 83.5 55.5 475 Total (18-39) 65.2 7.6 4515 77.6 62.6 28.8 455 Total (40-69) 78.8 24.4 3670 84.9 85.2 48.2 954 Total (25-69) 74.8 16.6 7159 82.7 79.0 42.5 1361 Total (18-69) 70.1 13.7 8185 82.4 77.3 41.4 1409

Bangladesh, 2018
141
Table NCD.10.3 Source of care for treatment and advise for BP: All
Percentage of people 18-69 who were ever told to have raised BP and who mentioned different sources of care for treatment/advise and for medication, by background characteristics, [Bangladesh, 2018] Background characteristic
Government Facility
Private/NGO Facility
Both government and private
Any alternative/ traditional provider
Government facilities Private* n
Primary secondary tertiary Primary secondary
Age
18-24 10.2 81.3 2.7 1.4 10.4 0.8 2.0
32.5 2.8 126 25-39 15.7 76.9 4.4 1.6 10.8 4.2 5.2
34.6 1.7 511
40-54 13.9 77.1 7.9 0.7 10.2 5.2 7.4
37.0 1.6 586 55-69 14.8 75.0 8.9 0.0 8.4 7.0 8.6
39.0 2.3 186
Sex
Women 12.6 77.3 7.9 0.8 9.2 4.7 7.0
36.5 2.2 878 Men 16.0 77.1 4.0 1.1 11.1 4.5 4.9
35.5 1.7 531
Residence
Rural 13.1 78.5 5.5 1.1 10.5 4.2 4.2
33.4 1.3 618 Urban 16.2 74.1 8.4 0.3 8.5 5.7 11.3
43.0 3.7 791
Region
Barisal 15.1 69.6 8.2 5.2 10.4 6.4 7.7
37.1 0.0 221 Chittagong 10.0 88.2 0.7 0.3 6.7 0.6 3.3
27.4 0.0 154
Dhaka Ru 14.8 75.0 9.7 0.0 7.9 4.3 12.3
32.6 4.3 160 Khulna 16.8 77.2 4.0 1.7 14.9 2.4 4.0
41.6 2.3 188
Mymensingh 13.5 71.3 12.0 0.0 11.7 6.7 7.4
33.9 0.1 172 Rajshahi 15.2 77.6 2.1 0.1 6.0 11.5 1.9
38.4 1.4 165
Rangpur 17.9 70.7 9.0 2.1 16.8 5.9 4.7
36.1 3.6 138 Sylhet 11.9 73.7 10.2 1.0 14.0 4.3 4.2
60.4 3.4 211
Education
No education 10.9 80.2 6.9 0.5 10.1 4.8 3.5
35.0 1.7 544 Primary 16.3 76.6 4.5 1.3 9.2 5.2 7.0
35.3 0.8 446
Secondary 11.0 81.0 7.8 0.1 5.5 1.9 11.4
37.0 1.3 165 More than secondary 19.4 69.0 6.3 1.6 12.5 4.7 8.9
40.1 5.8 243
Wealth quintile
Lowest 17.8 69.8 8.5 0.5 14.8 8.5 3.5
30.5 0.4 196 Second 11.4 77.2 6.7 1.5 12.1 3.3 3.6
25.1 4.2 221
Middle 13.1 79.9 6.0 0.0 9.7 5.1 4.2
33.3 1.9 219 Fourth 12.4 80.1 6.3 1.0 8.7 4.7 5.5
40.0 0.0 298
Highest 15.4 76.9 5.3 1.2 7.2 3.0 11.1
44.4 3.4 475 Total (18-39) 13.1 78.4 4.0 1.6 10.6 3.0 3.7
32.2 1.8 455
Total (40-69) 14.4 76.6 7.6 0.5 9.6 5.5 7.5
38.3 2.1 954 Total (25-69) 13.9 77.5 6.7 0.7 9.6 5.0 6.6
37.5 2.2 1361
Total (18-69) 14.0 77.2 6.3 0.9 10.0 4.6 6.2
36.1 2.0 1409 * Private includes NGO clinics and hospitals

Bangladesh 2018
142
Table NCD.10.4: Source of drugs/medications for BP: All
Percentage of people 18-69 who have ever taken medication for raised BP and who mentioned different sources medications, by background characteristics, [Bangladesh, 2018] Background characteristic
Government Only
Private* Only
Both government and private
Any alternative/ traditional provider
n
Age
18-24 3.9 94.0 2.1 0.0 71 25-39 0.0 97.7 0.7 1.4 370 40-54 0.8 97.6 1.0 0.5 500 55-69 0.8 98.8 0.1 0.1 164 Sex
Women 0.8 97.7 0.6 0.8 708 Men 1.4 97.3 1.2 0.2 397 Residence
Rural 1.2 97.5 0.5 0.7 476 Urban 0.4 97.5 1.4 0.2 629
Region
Barishal 0.6 97.8 0.8 0.0 181 Chattogram 2.0 97.2 0.7 0.2 122 Dhaka 0.0 100.0 0.0 0.0 130 Khulna 0.7 95.8 0.2 3.1 145 Mymensingh 0.9 96.0 2.5 0.3 132 Rajshahi 0.2 99.8 0.0 0.0 112 Rangpur 4.1 94.1 0.6 1.2 106 Sylhet 0.0 94.8 3.6 0.8 177 Education
No education 0.5 97.6 0.9 0.8 427 Primary 0.7 97.9 0.8 0.6 355 Secondary 0.1 99.8 0.1 0.0 124 More than secondary
3.6 95.3 0.8 0.2 190
Wealth quintile
Lowest 0.0 97.0 2.0 0.6 159 Second 2.0 95.5 0.2 1.9 160 Middle 0.1 99.5 0.4 0.0 166 Fourth 0.3 98.4 0.9 0.4 229 Highest 2.0 97.0 0.5 0.3 391 Total (18-39) 1.7 96.1 1.4 0.7 299 Total (40-69) 0.7 98.1 0.5 0.5 806 Total (25-69) 0.6 97.9 0.8 0.6 1081 Total (18-69) 1.0 97.5 0.8 0.6 1105

Bangladesh 2018
143
Table NCD.10.6 Care seeking from traditional healers and use of traditional/herbal remedies: All
Percentage of people 18-69 who have been ever told to have raised blood pressure and who sought care from a traditional healer or currently using a traditional/herbal remedy , by background characteristics, [Bangladesh, 2018] Background characteristic
For raised BP
ever seen a local healer
Total Number (N)
currently taking a herbal remedy
Total Number (n)
Age
18-24 0.2 126 0.0 126 25-39 3.0 511 1.0 511 40-54 1.1 586 0.2 586 55-69 0.9 186 0.0 186 Sex
Women 1.9 878 0.5 878 Men 0.6 531 0.0 531 Residence
Rural 1.6 618 0.3 618 Urban 0.8 791 0.4 791
Region
Barishal 2.4 221 0.3 221 Chattogram 0.0 154 0.0 154 Dhaka 0.0 160 0.0 160 Khulna 5.5 188 1.7 188 Mymensingh 1.4 172 0.0 172 Rajshahi 1.6 165 0.2 165 Rangpur 1.9 138 0.7 138 Sylhet 1.3 211 0.3 211 Education
No education 1.6 544 0.4 544 Primary 2.1 446 0.4 446 Secondary 0.1 165 0.1 165 More than secondary 0.2 243 0.0 243 Wealth quintile
Lowest 1.4 196 1.2 196 Second 2.9 221 0.2 221 Middle 0.6 219 0.5 219 Fourth 1.5 298 0.1 298 Highest 0.8 475 0.1 475 Total (18-39) 1.5 455 0.3 455 Total (40-69) 1.3 954 0.3 954 Total (25-69) 1.5 1,361 0.3 1,361 Total (18-69) 1.4 1,409 0.3 1,409

Bangladesh 2018
144
Table NCD.10.5 Reasons for not taking medications for raised BP: All
Percentage of people 18-69 who have been ever advised to take drugs but not taking drugs in the past 2 weeks and specified different reasons for not taking medication for raised BP , by background characteristics, [Bangladesh, 2018]
Background characteristic
don’t think drugs are
necessary/BP got normal
fear or have side
effects
too expensive/not
available
Medicines not advised by doctor
(n)
Age
15-24 82.4 4.2 12.7 7.4 96 25-39 73.8 1.9 20.0 5.8 316 40-54 67.4 2.1 24.1 3.3 278 55-69 47.5 1.9 12.0 3.3 75 Sex
Women 61.2 1.4 19.1 5.0 466 Men 77.8 3.9 16.0 4.8 299 Residence
Rural 67.1 2.6 18.7 4.3 387 Urban 72.3 1.8 14.1 7.4 378
Region
Barishal 58.6 10.1 23.2 6.2 132 Chattogram 54.0 0.0 12.9 1.8 88 Dhaka 71.7 4.2 17.8 1.4 75 Khulna 79.0 1.1 10.8 3.0 91 Mymensingh 68.1 0.0 16.2 4.7 103 Rajshahi 78.0 1.4 22.8 16.5 110 Rangpur 66.8 0.5 25.5 6.4 76 Sylhet 78.3 7.7 22.1 2.5 90 Education
No education 56.4 1.9 23.3 4.4 307 Primary 81.5 2.3 11.8 2.4 247 Secondary 79.0 0.4 14.6 6.7 85 More than secondary 70.9 4.7 12.9 11.5 118 Wealth quintile
Lowest 48.4 3.1 45.0 9.1 113 Second 66.3 3.1 19.9 4.5 148 Middle 69.5 1.6 19.2 5.6 138 Fourth 67.7 2.4 5.0 0.9 164 Highest 84.1 2.2 10.4 6.7 202 Total (18-39) 81.4 3.0 15.8 6.5 313 Total (40-69) 58.2 2.0 19.3 3.7 452 Total (25-69) 66.2 2.3 18.1 4.1 726 Total (18-69) 68.1 2.4 17.8 4.9 765

Bangladesh 2018
145
Chapter 11 Diabetes: screening, prevalence and treatment
Key findings
Prevalence of raised blood glucose among adults age 15-69 yrs.
o Actual measurement: Based on the criteria of fasting blood glucose > 126 mg/dl, the
prevalence of raised blood glucose was 8.3 %. This includes people on medication whose
blood glucose levels were normal at the time of survey.
o Self-reported prevalence: Among adults who had ever had their blood glucose measured,
5.1% adults were ever told by a doctor or a health care provider that they have raised blood
glucose.
Diagnosis and treatment gap among those noted to have raised blood glucose at the time of
survey
o Unaware about their raised blood glucose: 51.4% adults
o Not on treatment: 10.4% for adults knew they had raised blood glucose but were not on
treatment.
o On treatment but not controlled: 24.7% of adults.
o On treatment and controlled: 13.6% of adults.
Screening coverage, prescription of medications, treatment compliance
o Screening coverage: 25.1% of adults (36.7% among 40-69 years old) had had their blood
glucose ever measured by a doctor or a health care provider.
o Treatment compliance: 79.8% adults who were told to have raised blood glucose reported ever
taking any medications to control their blood glucose. 58.5% adults reported currently taking
their prescribed medications (including insulin) in the two weeks prior to the survey.
Sources of care and medications
o Sources of care: 62.1% of adults usually sought treatment and advice for raised blood glucose
from private facilities only, and 26.9% reported so from government facilities only. 5.7% sought
care from both government and private facilities.
o Sources of drugs/medication: Majority of the adults who were prescribed medication reported
usually getting them only from private facilities (95.2%) and 1.1% reported getting their
medication only from government facilities.
o 4.3% visiting a traditional healer for controlling their diabetes or raised blood glucose.
Reasons for not taking medications among those prescribed medication to control their
blood glucose
“Medication not necessary” and “blood glucose got normal” were the most common reasons given
for not taking medication - reported by 51.7% adults who were ever prescribed medications.

Bangladesh 2018
146
Introduction
Diabetes is a chronic metabolic disorder characterized by raised blood glucose or hyperglycemia
that occurs when the pancreas does not produce sufficient insulin (Type 1 diabetes) or when the
body cannot effectively use the insulin it produces (Type 2 diabetes). Over time, diabetes can cause
damage to the heart, blood vessels, eyes, kidneys and nerves. Type 2 diabetes is much more
common and affects older people (generally 35 years or older) around the world. The risk for Type 2
diabetes arises increases among obese and physically inactive individuals .1 Smoking also notably
increases the risk of diabetes and other cardiovascular diseases1. An individual is considered to be
hyperglycemic/diabetic if their fasting blood glucose is >7 mmol/L or >126 mg/ml 64.
Simple lifestyle changes have been shown to be effective in preventing or delaying the onset of type
2 diabetes. These include being physically active (at least 30 minutes of regular, moderate intensity
activity on most days), achieving and maintaining a healthy body weight, eating a healthy diet and
avoiding tobacco use.
Under the WHO Global Action Plan, two of the nine voluntary targets are directed at global diabetes
control. These include attaining a 25% relative reduction in risk of premature mortality from
cardiovascular diseases, cancer, diabetes, or chronic respiratory diseases and halting the rise in
diabetes and obesity62. Hence, Bangladesh has incorporated it as one of the key targets in its 5-year
multisectoral action plan for 2018-202510 and its predecessor39.
Current relevant policies and programs in Bangladesh for nutritional status
• Multisectoral Action Plan for the Prevention and Control of Non-Communicable Diseases 2018-
2025
• Diabetes Care BADAS Guideline 201965
• Guidelines for Care Of Type 2 diabetes mellitus In Bangladesh66
This chapter focuses on indicators related to raised blood glucose; assessing prevalence, diagnosis
and treatment gaps and care seeking behaviors around blood glucose and diabetes management.
This information will help Bangladesh assess trends and progress towards diabetes management as
specified in its multisectoral action plan as well as evaluation of current policies and programs in
64 World Health Organization (WHO). Diabetes [Internet]. Geneva, Switzerland: WHO; 30 Oct 2018 [ cited 30 Mar 2020]. Available from: https://www.who.int/news-room/fact-sheets/detail/diabetes 65 Diabetes treatment guideline and diabetes journey app launched. The Daily Star [Internet]. 2019 Dec 18 [cited 30 Mar 2020; Health. Available from: https://www.thedailystar.net/health/news/diabetes-treatment-guideline-and-diabetes-journey-app-launched-1827913 66 Mahtab H, Khan AR, Latif ZA, Pathan MF, Ahmed T. Guidelines for care of type 2 diabetes mellitus in Bangladesh. BIRDEM Clinical Research Group. 2003 Feb 28. Available at http://www.whoban.org/pdf/diabetes.pdf

Bangladesh 2018
147
place to reduce population blood glucose levels. These will also guide future policy and programs to
manage diabetes at population level.
Blood Glucose Measurement
Blood glucose was measured in the step 3 of the Survey and a sample of venous blood was
obtained as mentioned in the data collection section. Appropriate consent was obtained from the
respondents to carry out to obtain blood sample and carry out the biochemical measurements.
Analysis
Hyperglycemia or raised blood glucose was defined as having fasting blood glucose >126 mg /dl
during the study, or blood glucose <126 mg/dl but currently taking medications to lower blood
glucose based on previous diagnosis.
Observations which had fasting blood glucose < 18 mg /dl Hg or > 630 mg /dl were excluded, though
none of adults were recorded in this range in the survey.
11.1. Prevalence of raised blood glucose based on measurement and medications history
Self-reported prevalence is likely to underestimate the true prevalence as many people with raised
blood glucose may not have any symptoms in the initial stages and few asymptomatic people get
their blood glucose measured regularly. Therefore, carrying out actual measurements of blood
glucose levels is essential to determine the actual population-based prevalence.
Overall 8.3% of adults were measured to have raised blood glucose based on both the
measurement and prior diagnosis and medications history. On the other hand, based on self-reports
among individuals who ever got their blood glucose measured, the prevalence was only 5.1%.
Patterns by background characteristics (Table 11.1):
• The prevalence of raised blood glucose increased with age. The prevalence increases
substantially after the age 40 (12.7% prevalence among adults aged 40-69 years).
Prevalence of diabetes was higher in men compared to women (8.9%-men vs 7.9%-women).
(Figure 11.1)
• The prevalence of raised blood glucose increased directly with increasing household wealth.
(4.6% in the lowest group and 16.4% in the wealthiest group) (Figure 11.1)
• Adults from urban residences were more likely to have raised blood glucose (13.2%)
compared to adults from rural residences (7.1%). The raised blood glucose prevalence was
highest in Chattogram (12%) and lowest in Rangpur (4.8%). (Figure 11.2)

Bangladesh 2018
148
Figure 11.1 Prevalence raised blood glucose among adults aged 18-69 years by age and
household wealth, Bangladesh's STEPs survey 2018
Figure 11.2 Regional differences in diabetes prevalence among 18-69 years population,
Bangladesh’s STEPs survey 2018
11.2. Diagnosis and treatment gap (Table 11.1)
diabetes increases the risk of development of severe health complications such as heart disease or
problems with nerves, blood vessels, eyes and kidneys. Ensuring early diagnosis and initiation of
treatment enables adults to make necessary lifestyle adjustments and reduces the risk of lasting
damage. Hence, early detection of diabetes by regular screening using fasting blood glucose levels
(at least annually is an important secondary prevention strategy to control morbidity and mortality
associated with diabetes.
7.9
4.6
8.9
5.7 5.6
10.7
16.4
0.0
5.0
10.0
15.0
20.0
Women vs Men Increasing household wealth
Per
cen
tage
9.012.0
9.6
8.5
4.97.1
4.8
5.7

Bangladesh 2018
149
Diagnosis gap
Of all the adults who were diagnosed to be diabetic as presented in section 11.1, 51.4 % diabetic
adults were unaware of their raised blood glucose status. The largest proportion amongst this group
was observed to be between the ages 15-24 years (86.7%).
• Percentage of diabetic adults unaware of their raised blood glucose status declined with age .
• More diabetic men were unaware of their raised blood glucose status than women (54.5%-
men vs 48.4%- women)
• Diabetic residents of rural areas were more likely to be unaware of their blood glucose status
compared to urban residents. (56.7%- rural vs 40.2%- urban)
• The proportion of adults who were unaware of their diagnosis status decreased with
increased education level (Figure 11.2), but no consistent trends were seen with household
wealth.
Treatment gap:
Overall, 10.4% of the people with raised blood glucose were aware of diagnosis but not on
treatment.
• The proportion of adults who were aware of their status not on treatment was highest in the
age group of 40-69 years (10.6 %)
• There were no consistent trends for adults on treatment in terms of household wealth (Figure
11.2) or education level.
Quality of treatment: controlled or uncontrolled while on treatment
Overall, 13.6 % of adults with raised blood glucose were on treatment which had their blood glucose
under control and 24.7 % were on treatment but still had raised blood glucose levels.
The proportion of adults with raised blood glucose who were on treatment which did not control their
blood glucose increased with increasing age group (3.1% in the 15-24 years age group to 34.9% in
the 55-69 years age group). The proportion of adults who were aware of their diagnosis and were on
treatment that controlled was highest in the age group of 55-69 years (27.5%).

Bangladesh 2018
150
Figure 11.3 Diagnosis and Treatment gaps among adults aged 18-69 years by wealth quintile, Bangladesh’s STEPs survey 2018
11.3. Screening coverage (Table 11.2)
Early detection of raised blood glucose through regular (at least annual) screening of healthy
individuals is one of the key public health strategies for reduction the morbidity and mortality
associated with diabetes. Though data were not elicited about annual screening, 25.1% adults
(36.7% among the age group 40-69 years old) had had their blood glucose ever measured by a
doctor or a health care provider.
Patterns by background characteristics (Figure 11.6):
• Younger adults age 15-24 years were much less likely to report their blood glucose ever
measured compared to other age-groups.
• Women were more likely to have ever had their blood glucose measured compared to men
(27.5%-women vs 22.6%-men)
• The likelihood of ever having blood glucose measured was higher among residents from
urban areas (34.5%) compared to those from rural residences (22.3%). The likelihood of ever
measurement of blood glucose also varied by region. The screening coverage in the Dhaka
region was highest (30.3%) followed by Chattogram (28.8%) and lowest in the Rangpur
region (12.5%). (Table 11.2)
• The likelihood of having had blood glucose measured increased by both household wealth
and education level.
67.7 64.7 66.2 54.532.6
51.4
4.2 13.9 11.29.6
11.2
10.4
22.9 12.8 11.123.9
35.724.7
5.2 8.5 12.0 20.5 13.6
0%
20%
40%
60%
80%
100%
Lowest Second Middle Fourth Highest Overall
Treated and controlled
Treated but uncontrolled
Diagnosed but untreated
Undiagnosed

Bangladesh 2018
151
Figure 11.4 Percent of adults who have ever had their blood glucose measured by a doctor or health care provide among adults aged 18-69 years, Bangladesh’s STEPs survey 2018
Figure 11.5 Percent of adults who have ever had their blood glucose measured by a doctor or health care provide among adults aged 18-69 years by province, Bangladesh’s STEPs survey 2019
11.4. Prescription of medications and compliance with treatment (Table 11.2)
Monitoring of prescription practices and treatment compliance is an important strategy for evaluating
the outcomes at individual and at population level. Raised blood glucose is a chronic risk factor,
13.8
21.2
13.4
28.5
23.3
17.2
34.429.8
21.6
43.7 44.0
30.0
43.3
0.0
10.0
20.0
30.0
40.0
50.0
Increasing age Increasing level of education Increasing household wealth
28.1
28.8
30.3
26.4
18.823.3
12.5
19.4

Bangladesh 2018
152
requiring treatment over the lifetime of a person, which may reduce the compliance with treatment as
observed with many other chronic conditions such as HIV/AIDS or tuberculosis.
Overall, a majority of the adults who were ever told to have raised blood glucose 79.8% ever took
the medicines and 58.5% reported currently taking the medications, showing fairly good compliance
with the prescriptions.
• The likelihood of compliance with treatment increased with age being highest in 40-69
years age groups (82.5% ever taken medication, 63.3% currently taking medication).
• The likelihood of ever taking medications or currently taking medications increased with
increase in education level and household wealth.
11.5. Sources of care for treatment and advice and medications for raised blood glucose
Overall a much higher proportion of adults sought treatment advise and care from Private facilities
(which include NGO run centers) (62.1 %) than from government (26.9%) or other sources (such as
Alternative medicine practitioners- Homeo, Ayurveda, Unani and Traditional healers) (5.7%) (Table
10.3). Similarly, for medications, majority of the adults approached only private providers (95.2%),
and only 1.1% of adults went to government providers. 2.7% of adults mentioned both government
and private sources for medications for raised blood glucose. (Table 11.4)
Background patterns: (Table 11.3 and 11.4)
• The proportion of adults who usually visited government facilities for care- treatment and
advise increased with increasing age.
• Women were more likely to seek both treatment/advice (33.3%- women vs 23.3%-men) and
medications (1.2%- women vs 1%-men) only from government facilities.
• Sources of care and household wealth: More than half of all adults, even in the poorest wealth
quintile sought care from private facilities. Lower wealth quintiles were more likely to seek
advice and consultation from government facilities (33.6% in the lowest wealth index group)
while higher wealth quintiles usually seek care form private facilities 59.9% in the wealthiest
group) (Figure 11.6).
• Source of care and region: In all the provinces and irrespective of the residence in urban and
rural residences, more than 50% of adults sought both care/advice and medications from
private providers. The use of government facilities for advice/consultation was lowest in the
Rajshahi and Sylhet regions. (Figure 11.7).

Bangladesh 2018
153
• Source of care and residence: By residence, while use of government facilities was much
higher in urban residences for consultation, advice and medication for raised blood glucose
compared rural residences.
Figure 11.6 Percent of adults (who were ever told to have raised blood glucose) who sought treatment care/advise and medications from government and private facilities with respect to wealth quintile, Bangladesh’s STEPs survey 2018
11.6. Consultation with traditional healers and use of herbal remedies
4.3% of adults with raised blood glucose who reported visiting a traditional healer for treatment and
advise of which 29.2% adults reported currently taking herbal or traditional remedies for their raised
blood pressure.
Background patterns: (Table 11.5)
• The proportion of adults who reported taking herbal or traditional remedies for their raised
blood pressure was highest in the 40-54 years age group- 5.9%. Women were more likely to
have ever visited a local healer as compared to men (6%- women vs 2%- men).
• Rural residents were more likely to have ever visited a local healer as compared to urban
residents (5%-rural vs 3%-urban).
• The proportion of adults who had ever visited a local healer and currently taking herbal or
traditional remedies to control their blood glucose decreased with increase in education level.
17.8 11.4 13.1 12.4 15.40.0 1.4 0.1 0.3 1.8
69.8 77.2 79.9 80.1 76.997.7 95.7 99.4 97.7 96.9
8.5 6.7 6.0 6.3 5.3 1.5 0.1 0.5 1.4 0.70.5 1.5 0.0 1.0 1.2 0.8 2.6 0.0 0.6 0.4
0%10%20%30%40%50%60%70%80%90%
100%
Low
est
Seco
nd
Mid
dle
Fou
rth
Hig
he
st
Low
est
Seco
nd
Mid
dle
Fou
rth
Hig
he
st
Advise/Care Medication
Other
Both
Only Private
Only Government

Bangladesh 2018
154
Figure 11.7 Percent of adults (who were ever told to have raised blood glucose) who had ever visited a traditional healer with respect to region, Bangladesh’s STEPs survey 2018
10.7. Reasons for not on treatment
51.7% of adults who were prescribed medications cited “didn’t think the drugs were necessary” and
“their blood pressure got normal “as reasons for not currently taking medications/treatment (Table
11.6). The second most common reason given for not taking medications was “too expensive/
drugs not available” as cited by 17.8% adults
Patterns by background characteristics (Table 11.6):
• The highest proportion of adults who reported “too expensive/ drugs not available” were
within the ages 15-24 years (29.6%).
• A higher proportion of men (60 %) gave the reasons “did not think drugs were necessary” or
“their blood pressure was under control” compared to women (45.5%).
• The proportion of adults who reported did not think drugs were necessary” or “their blood
pressure was under control” increased with increase in education level and increased
household wealth.
3.9
3.7
6.0
8.4
1.2 2.4

Bangladesh 2018
155
Figure 11.8 Reasons for which diabetic adults reported not taking drugs for raised blood glucose, Bangladesh 2018
List of Tables:
For more information on raised blood glucose prevalence, screening and treatment coverage or
sources of care, see the following tables:
Table: 11.1 Prevalence of raised blood glucose and diagnosis, treatment and control rates
Table: 11.2 Measurement of blood glucose, prescription of medications, treatment compliance
Table: 11.3 sources of care for raised blood glucose
Table:11.4 sources of medications for raised blood glucose
Table: 11.5 Care seeking from traditional healers and use of traditional/herbal remedies
Table: 11.6 Reasons for not taking medications among those told to have raised blood band have
been prescribed medications.
51.7
0.4
17.8
5.6
don’t think drugs are necessary/BP got normal
fear or have side effects
too expensive/not available
Medicines not advised by doctor

Bangladesh 2018
156
Table NCD.11.1 Prevalence of raised blood glucose and diagnosis, treatment and control rates: All
Percentage of people1 15-69 who had raised blood glucose at the time of survey or on blood glucose medications and who were aware of their diagnosis, on treatment or have their blood glucose controlled or uncontrolled with medications, by background characteristics, [Bangladesh, 2018] Background characteristic
Prevalence of raised Blood glucose1
(n) Among those with raised blood glucose1 Not aware of diagnosis
Aware of diagnosis but not treatment
On treatment but not controlled
On treatment and controlled
Total (n)
Age
15-24 2.9 1,553 86.7 7.0 3.1 3.2 53 25-39 8.1 3,072 60.3 11.6 18.9 9.2 257 40-54 12.4 1,910 39.8 13.1 32.0 15.1 274 55-69 16.3 521 34.8 2.8 34.9 27.5 93 Sex
Women 7.9 3,807 48.4 11.6 24.5 15.5 345 Men 8.9 3,249 54.5 9.1 24.8 11.6 332 Residence
Rural 7.1 3,736 56.7 9.8 20.9 12.6 259 Urban 13.2 3,320 40.2 11.6 32.5 15.8 418 Region
Barishal 9.0 843 58.3 11.6 23.9 6.2 88 Chattogram 12.0 854 57.2 6.4 19.2 17.3 112 Dhaka 9.6 765 38.2 17.3 26.8 17.7 83 Khulna 8.5 948 52.1 12.8 23.3 11.7 100 Mymensingh 4.9 913 73.5 8.6 13.0 4.9 55 Rajshahi 7.1 982 43.1 6.5 37.2 13.1 91 Rangpur 4.8 906 59.6 3.6 30.4 6.4 71 Sylhet 5.7 845 61.8 9.6 24.5 4.1 77 Education
No education 7.4 2,206 64.1 9.9 15.1 11.0 159 Primary 8.0 3,266 46.6 10.6 27.2 15.6 302 Secondary 8.3 1,138 51.1 6.9 28.7 13.4 134 More than 18.6 427 35.1 16.4 35.4 13.1 82 Wealth quintile
Lowest 4.6 1,475 67.7 4.2 22.9 5.2 68 Second 5.7 1,495 64.7 13.9 12.8 8.5 86 Middle 5.6 1,269 66.2 11.2 11.1 11.4 98 Fourth 10.7 1,290 54.5 9.6 23.9 12.0 131 Highest 16.4 1,527 32.6 11.2 35.7 20.5 294 Total (18-39) 5.1 3810 72.1 10.0 11.5 6.4 212 Total (40-69) 12.7 3246 40.3 10.6 31.7 17.5 465 Total (25-69) 9.6 6242 49.9 10.8 25.6 13.8 658 Total (18-69) 8.3 7056 51.4 10.4 24.7 13.6 677

Bangladesh 2018
157
Table NCD.11.2 Blood glucose measured, self-reported prevalence and treatment of raised blood glucose: All
Percentage of respondents age 15-69 who have ever had their blood glucose measured and who have been told by a health care provider that they have raised blood glucose; among people who have been told they have raised blood glucose, the percentage told in the past 12 months they have raised blood glucose, and percentage taking medication to control blood pressure, by background characteristics, [Bangladesh, 2018]
Background characteristic
Ever had blood glucose measured by doctor or health care provider
Ever told have raised blood glucose by doctor or health care provider
Number of respondents
Among respondents who have been told by a doctor or health care provider they have raised blood glucose, the percentage who were:
Told in the past 12 months have raised blood glucose
Ever taken medication to control blood glucose
Currently taking medication to control blood glucose
Number of respondents
Age
18-24 13.8 0.5 1942 75.5* 51.9* 34.9* 15* 25-39 28.5 4.5 3505 77.7 76.4 50.4 179 40-54 34.4 10.2 2152 84.4 74.1 60.3 248 55-69 43.7 15.8 586 75.6 91.9 65.3 96 Sex
Women 27.5 5.7 4381 74.8 74.9 54.3 298 Men 22.6 4.5 3804 85.0 85.4 64.0 240 Residence
Rural 22.3 4.1 4183 74.8 76.6 52.2 180 Urban 34.5 8.7 4002 86.4 84.3 68.8 358 Region
Barishal 28.1 6.3 986 61.7 62.3 37.3 71 Chattogram 28.8 6.8 1053 77.5 82.5 62.5 86 Dhaka 30.3 6.3 997 87.8 82.5 62.8 84 Khulna 26.4 5.9 1040 79.7 74.5 45.0 82 Mymensingh 18.8 2.0 1021 64.2 69.6 44.8 44 Rajshahi 23.3 4.5 1066 81.9 81.0 69.5 75 Rangpur 12.5 2.8 1009 65.3 74.0 58.5 43 Sylhet 19.4 2.1 1013 76.3 93.8 59.5 53 Education
No education 21.2 4.9 2476 66.8 78.8 44.8 112 Primary 23.3 5.0 3735 83.8 79.1 64.5 228 Secondary 29.8 4.6 1397 79.9 74.6 55.9 122 More than secondary 44.0 9.6 556 93.4 92.1 75.4 75 Wealth quintile
Lowest 13.4 2.7 1639 75.5 59.7 49.7 42 Second 17.2 3.1 1670 58.4 73.8 37.1 51 Middle 21.6 1.9 1451 78.1 70.9 49.4 52 Fourth 30.0 6.7 1506 71.8 83.6 53.7 117 Highest 43.3 11.3 1919 90.6 84.3 71.0 276 Total (18-39) 18.4 1.6 4515 72.6 67.9 39.9 119 Total (40-69) 36.7 11.3 3670 80.9 82.5 63.3 419 Total (25-69) 29.6 6.6 7159 79.6 80.0 58.6 532 Total (18-69) 25.1 5.1 8185 79.2 79.8 58.5 538
*interpret data with caution due to small sample size

Bangladesh 2018
158
Table NCD.11.3 source of care for treatment and advise for diabetes: All
Percentage of people 15-69 who were ever told to have raised blood glucose and who mentioned different sources of care for treatment/advise and for medication, by background characteristics, [Bangladesh, 2018] Background characteristic
Government Facility
Private/ NGO Facility
Both government and private
Any alternative/ traditional provider
government facilities Private n
Primary secondary tertiary
Primary secondary
Age
18-24 12.2* 78.2* 0* 0* 0* 0* 12.2*
36.4* 0* 15* 25-39 27.1 61.8 7.5 2.9 13.9 3.5 17.6
36.2 0.8 179
40-54 25.1 66.4 4.2 0.0 7.1 4.7 18.7
27.5 0.9 248 55-69 36.2 53.5 4.8 0.0 12.5 12.7 17.3
41.5 4.4 96
Sex
298 Women 33.3 57.6 4.5 1.3 12.1 7.4 18.8
36.1 0.7 240
Men 23.3 65.8 5.8 0.0 8.2 6.6 16.1
33.6 3.9
Residence
Rural 26.6 62.6 4.8 0.9 14.3 6.8 10.7
37.3 0.3 180 Urban 32.8 58.8 5.6 0.4 4.1 7.5 29.0
31.2 4.9 358
Region
71 Barishal 25.8 55.7 11.8 0.6 19.5 3.0 15.4
51.9 0.4 86
Chattogram 28.3 67.6 1.2 0.4 8.1 10.6 11.2
28.1 0.0 84 Dhaka 32.4 61.6 5.0 1.0 4.4 6.8 27.4
30.6 5.2 82
Khulna 35.6 50.4 9.1 0.0 21.8 7.2 17.7
37.5 2.1 44 Mymensingh 42.9 50.1 4.8 0.0 4.6 5.9 37.3
29.4 1.1 75
Rajshahi 11.2 70.2 0.2 2.4 6.4 3.1 2.6
43.6 0.3 43 Rangpur 35.0 50.4 6.5 0.0 30.6 2.1 11.1
35.9 1.9 53
Sylhet 19.1 55.0 26.0 0.0 5.5 11.6 31.1
67.2 1.3
Education
No education 26.6 66.8 2.1 0.0 17.4 5.7 7.1
40.0 0.9 112 Primary 31.8 55.9 5.7 0.7 11.2 8.5 18.7
32.5 0.4 228
Secondary 29.9 61.2 8.1 0.0 2.3 8.5 28.1
30.7 0.5 122 More than secondary 21.7 68.3 5.4 3.9 1.3 2.2 24.5
38.7 15.4 75
Wealth quintile
Lowest 33.6 52.6 7.8 0.0 27.6 1.3 12.5
26.3 0.4 42 Second 37.2 54.2 6.3 2.3 22.4 8.7 12.4
34.6 0.3 51
Middle 25.7 61.4 9.1 0.0 18.2 8.5 16.0
37.6 0.9 52 Fourth 22.0 69.9 4.4 0.2 7.6 9.9 9.2
35.2 1.1 117
Highest 30.2 59.9 3.8 0.9 3.3 6.0 25.6
36.6 3.8 276
Total (18-39) 13.0 73.2 7.2 4.3 8.7 2.9 9.9
42.5 0.7 119 Total (40-69) 31.1 58.7 5.3 0.0 10.8 8.1 19.6
33.1 2.4 419
Total (25-69) 27.2 61.7 5.8 1.0 10.6 7.2 18.0
35.0 2.1 532
Total (18-69) 26.9 62.1 5.7 1.0 10.4 7.0 17.6 35.0 2.1 538 * Private includes NGO clinics and hospitals

Bangladesh 2018
159
Table NCD.11.4 source of drugs/medications for diabetes: All
Percentage of people 18-69 who have ever taken medication for raised blood glucose and who mentioned different sources medications, by background characteristics, [Bangladesh, 2018]
Background characteristic
Government Only
Private* Only
Both government and private
Any alternative/ traditional provider
n
Age
18-24 0* 100* 0* 0* 12* 25-39 1.4 94.1 0.7 2.9 150 40-54 1.6 97.5 0.6 0.0 208 55-69 0.6 93.5 5.9 0.0 76 Sex
Women 1.2 96.0 1.3 2.8 253 Men 1.0 94.4 0.0 0.0 193 Residence
Rural 0.7 94.3 0.9 2.4 159 Urban 1.7 96.3 0.4 0.0 287 Region
Barishal 3.7 96.3 0.0 0.6 58 Chattogram 1.4 97.7 0.9 0.4 72 Dhaka 0.0 98.6 0.0 1.0 69 Khulna 1.9 96.0 1.6 0.0 65 Mymensingh 7.0 87.7 2.6 0.0 40 Rajshahi 1.7 76.7 18.0 2.4 62 Rangpur 0.0 100.0 0.0 0.0 36 Sylhet 0.0 100.0 0.0 0.0 44 Education
No education 0.0 96.7 3.3 0.0 104 Primary 1.8 93.5 3.5 0.7 187 Secondary 1.1 97.9 1.0 0.0 98 More than 0.7 95.0 0.9 3.9 56 Wealth quintile
Lowest 0.0 89.6 10.5 0.0 40 Second 0.0 94.8 0.0 2.3 47 Middle 1.8 97.0 1.3 0.0 47 Fourth 1.5 98.5 0.0 0.2 96 Highest 1.2 94.3 3.4 0.9 216 Total (18-39) 0.0 93.2 1.0 3.3 99 Total (40-69) 1.3 95.5 3.0 0.1 347 Total (25-69) 1.1 95.1 2.7 0.7 443
Total (18-69) 1.1 95.2 2.7 0.7 446
*interpret data with caution due to small sample size

Bangladesh 2018
160
Table NCD.11.5 Care seeking from traditional healers and use of traditional/herbal remedies: All
Percentage of people 18-69 who have been ever told to have raised blood glucose and who sought care from a traditional healer or currently using a traditional/herbal remedy, by background characteristics, [Bangladesh, 2018]
Background characteristic
For raised blood glucose
Ever seen a local healer
Total Number (n)
currently taking a herbal remedy
Total Number (n)
Age
18-24 0* 15* 0* 0* 25-39 3.3 179 30.9* 8* 40-54 5.9 248 47.3* 12* 55-69 3.8 96 0* 3* Sex
Women 6.0 298 29.0* 18* Men 2.0 240 29.7* 5* Residence
Rural 5.0 180 13.9* 10* Urban 3.0 358 70.3* 13* Region
Barishal 3.9 71 58.3* 3* Chattogram 3.7 86 9.9* 3* Dhaka 6.0 84 25* 7* Khulna 8.4 82 45.7* 8* Mymensingh 1.2 44 100* 1* Rajshahi 0.0 75 0* 0* Rangpur 0.0 43 0* 0* Sylhet 2.4 53 0* 0* Education
No education 7.0 112 16.9* 6* Primary 3.5 228 46.1* 11* Secondary 3.4 122 7.3* 3* More than 1.6 75 100* 3* Wealth quintile
Lowest 6.6 42 16.4* 3* Second 13.4 51 21.8* 4* Middle 1.5 52 0* 1* Fourth 0.2 117 100* 1* Highest 4.1 276 40.1* 14* Total (18-39) 1.6 119 66.3* 5* Total (40-69) 4.9 419 26.1* 18* Total (25-69) 4.3 532 29.2* 23* Total (18-69) 4.3 538 29.2* 23*
*interpret data with caution due to small sample size

Bangladesh 2018
161
Table NCD.11.6 Reasons for not taking medications for raised diabetes: All
Percentage of people 18-69 who have been ever advised to take drugs but not taking drugs in the past 2 weeks and specified different reasons for not taking medication for raised blood glucose, by background characteristics, [Nepal, 2018]
Background characteristic
don’t think drugs are necessary/blood glucose got normal
fear or have side effects
too expensive/not available
Medicines not advised by doctor
(n)
Age
15-24 61.4* 0* 29.6* 15.7* 12* 25-39 57.0 0.5 18.8 6.9 150 40-54 53.4 0.1 21.9 7.2 208 55-69 45.6 0.8 11.9 2.2 76 Sex
Women 45.5 0.2 18.5 6.5 253 Men 60.0 0.8 16.9 4.5 193 Residence
Rural 49.9 0.0 23.7 7.4 159 Urban 55.0 1.2 7.4 2.5 287 Region
Barishal 47.3 2.3 40.8 6.3 58 Chattogram 40.2 0.4 20.8 1.4 72 Dhaka 59.2 0.0 8.8 3.4 69 Khulna 70.0 0.0 18.5 12.6 65 Mymensingh 46.4 0.0 12.4 8.5 40 Rajshahi 52.9 0.0 19.2 16.2 62 Rangpur 54.8 2.9 14.4 5.2 36 Sylhet 19.3 0.8 33.7 0.0 44 Education
No education 47.6 0.3 22.1 3.9 104 Primary 46.2 0.5 20.9 7.3 187 Secondary 63.8 0.6 9.3 6.1 98 More than 68.3 0.5 5.2 3.3 56 Wealth quintile
Lowest 44.3 0.0 31.2 7.9 40 Second 45.3 0.0 38.4 13.0 47 Middle 48.6 3.3 31.0 14.3 47 Fourth 57.9 0.4 17.5 3.4 96 Highest 52.6 0.2 5.1 2.3 216 Total (18-39) 62.5 0.7 21.6 9.0 99 Total (40-69) 49.0 0.4 16.9 4.7 347 Total (25-69) 51.7 0.4 17.9 5.7 443 Total (18-69) 51.7 0.4 17.8 5.6 446
Notes: *interpret data with caution due to small sample size

Bangladesh, 2018
162
Chapter 12 Cholesterol: screening, prevalence and treatment
Key findings
Prevalence of raised blood cholesterol among adults age 18-69 yrs.
o Actual measurement: Based on the criteria of total cholesterol > 190 mg/dl, the
prevalence of raised blood cholesterol was 28.4%. This includes people on medication
whose blood cholesterol levels were normal at the time of survey.
o Self-reported prevalence: Among adults who had ever had their blood cholesterol
measured, 4.6% adults were ever told by a doctor or a health care provider that they
have raised blood cholesterol.
Diagnosis and treatment gap among those noted to have raised blood cholesterol at
the time of survey
o Unaware about their raised blood cholesterol: 94.8% adults
o Not on treatment: 2.5% for adults knew they had raised blood cholesterol but were not
on treatment.
o On treatment but not controlled: 0.7% of adults.
o On treatment and controlled: 2.0% of adults.
Screening coverage, prescription of medications, treatment compliance
o Screening coverage: 4.6% of adults (7.6% among 40-69 years old) had had their blood
cholesterol ever measured by a doctor or a health care provider.
o Treatment compliance: 78.9% adults who were told to have raised blood cholesterol
reported ever taking any medications to control their blood cholesterol. 40.2% reported
currently taking their prescribed medications in the two weeks prior to the survey.
Sources of care and medications
o Sources of care: 70.2% of adults usually sought treatment and advice for raised blood
cholesterol from private facilities only, and 20.1% reported so from government
facilities only.
o Sources of drugs/medications: Majority of the adults who were prescribed medication
reported usually getting them only from private facilities (95.2%) and none of them
reported getting their medications only from only government facilities.
o 4.9% adult reported visiting a traditional healer for controlling their raised blood
cholesterol.

Bangladesh, 2018
163
Introduction
Raised blood cholesterol was defined as having a lipid profile (total cholesterol, HDL and
triglycerides) of ≥ 190 mg/dl during the study, or normal cholesterol levels at the time of
survey but previously diagnosed as having raised blood cholesterol and currently taking
medications to control blood cholesterol.
Observations which had cholesterol levels <75 mg/dl or > 470mg/dl were excluded, though
none of adults were recorded in this range.
12.1. Prevalence of raised blood cholesterol based on measurement and medications
history
Self-reported prevalence is likely to underestimate the true prevalence as many people may
be asymptomatic and not aware of their raised blood cholesterol status. Therefore, carrying
out measurements in order to determine the actual prevalence is essential to understanding
the overall risk of raised cholesterol across the population
Overall 28.4% of adults were measured to have raised cholesterol; based on both the
measurement and medications history (Table 12.1). The prevalence based on self-reports
among individuals who ever got their blood cholesterol measured (4.6%), was higher
reported to be 46.8% (Table 12.2).
Patterns by background characteristics (Table 12.1):
• The prevalence of raised cholesterol increased with age. The prevalence increased
substantially after the age 40 (35.7 % prevalence among adults aged 40- 69 years).
Prevalence of raised cholesterol was higher in women compared to men (29.3% vs
27.4%).
• The prevalence of raised cholesterol was observed to be highest in adults with “more
than secondary level” education (36.1%). Raised cholesterol prevalence were
observed to increase with increase in household wealth.
• Adults from urban residences were more likely to have raised cholesterol compared
to those from rural residences (32.4%-Urban vs 27.4%-Rural). By region, the highest
prevalence of raised cholesterol was observed in Barishal (34.9%) followed by
Khulna (33%) and was lowest in Mymensingh (20.9%). (Figure 12.1).

Bangladesh, 2018
164
Figure 12.1 Regional differences in raised cholesterol prevalence among 18-69 years population, Bangladesh’s STEPs survey 2018
12.2. Diagnosis and treatment gap
Raised blood cholesterol increases the risk of development of severe health
complications such as heart disease or stroke. Ensuring early diagnosis and initiation of
treatment enables adults to make necessary lifestyle adjustments and reduces the risk of
lasting damage.
Diagnosis gap (Table 12.1):
Of all the people who were diagnosed to have raised blood cholesterol as presented in
section 12.1, 94.8% adults with raised blood cholesterol were unaware of their raised
blood cholesterol status (Figure 12.2).
• Percentage of people unaware of their raised cholesterol status declined with age.
• More women were unaware of their raised blood cholesterol status than men (95.3%-
women vs 94.2%-men)
• The proportion of adults who were unaware of their diagnosis status decreased with
increase in wealth and educational level.
34.9
31.6
29.1
33.0
20.925.0
22.1
31.6

Bangladesh, 2018
165
Treatment gap (Table 12.1):
Overall, 2.5% of the people with raised blood cholesterol at the time of survey were
aware of diagnosis but were not on treatment. Out of remaining adults with raised blood
cholesterol who reported to be on treatment, 0.7 % adults still have raised blood
cholesterol (uncontrolled) at the time of survey and 2% of adults were on treatment and
controlled.
• Similar to diagnosis gap, the proportion of adults who were on treatment increased
with increasing age.
• The proportion of adults with raised blood cholesterol who were on treatment
increased with increasing age group. More women were on treatment which did not
control their blood cholesterol than men (0.9%-women vs 0.4%- men)
• The proportion of adults who were on treatment increased with increasing household
wealth, but no consistent trends were seen with education level.
Quality of treatment (Table 12.1): Adults on treatment and controlled
Only 2% of the adults surveyed reported being on treatment which controlled this blood
cholesterol, this is likely due to the majority of adults surveyed being unaware of their
raised blood cholesterol status.
Figure 12.2 Diagnosis and Treatment gaps among adults aged 18-69 years by wealth quintile, Bangladesh’s STEPs survey 2018
99.6
96.599.0
93.1
88.8
94.8
3.0
0.9
2.2
5.2
2.5
0.4 0.1
1.01.6
0.7
0.5
3.7 4.42.0
82%
84%
86%
88%
90%
92%
94%
96%
98%
100%
Lowest Second Middle Fourth Highest Overall
Treated and controlled
Treated but uncontrolled
Diagnosed but untreated
Undiagnosed

Bangladesh, 2018
166
12.3. Screening coverage
Early detection of raised blood cholesterol through regular (at least annual) screening of
healthy individuals is one of the key public health strategies for reduction the morbidity and
mortality associated with high cholesterol. Though data were not elicited about annual
screening, 4.6 % adults (7.6 % among the age group 40-69 years old) had had their blood
cholesterol ever measured by a doctor or a health care provider.
12.4. Prescription of medications and compliance with treatment (Table 12.2)
Monitoring of prescription practices and treatment compliance is an important strategy for
evaluating the outcomes at individual and at population level. Raised blood cholesterol is a
chronic risk factor, requiring treatment over the lifetime of a person, which may reduce the
compliance with treatment as observed with many other chronic conditions such as
HIV/AIDS or tuberculosis.
Overall, of the adults who were ever told to have raised blood cholesterol 78.9% ever took
the medicines and 40.2% reported currently taking the medications, showing poor
compliance with the prescriptions.
• The likelihood of compliance with treatment increased with age. So, if a person is
diagnosed and prescribed medicine in 30-44-year age group, he/she is less likely to
take drug compared to adults 45-69 years of age.
• There were no significant variation in compliance with treatment observed with
regard to education level or household wealth.
12.5. Sources of care for treatment and advice and medications for raised blood
cholesterol
Overall a much higher proportion of adults sought treatment advise and care from only
Private facilities (which include NGO run centers) (70.2%) than from only government
facilities (20.1%) or other sources (such as Alternative medicine practitioners- Homeo,
Ayurveda, Unani and Traditional healers.) (0.2%) (Table 12.3). Similarly, for medications,
majority of the adults approached only private providers (95.2%), and 0% of adults went to
government providers. 2.7% of adults mentioned both government and private sources for
medications for raised blood cholesterol. (Table 12.4)

Bangladesh, 2018
167
Background patterns: (Table 10.3 and 10.4)
• The proportion of adults who usually visited private facilities for care and medication
decreased with increasing age. Highest proportion of adults sought care-treatment
and advice from private sources (70.2%)
• Sources of care and household wealth: Most of all adults, even in the poorest wealth
quintile sought care from private facilities. The proportion of adults seeking treatment
and advice at both government and private facilities increased directly with increase in
wealth quintile (Figure 12.3).
• Source of care and region: In all the provinces and irrespective of the residence in
urban or rural residences, more than 50% of adults sought both care/advice and
medications from private providers. The use of government facilities for
advice/consultation was lowest in the Rajshahi and Rangpur regions, and higher in the
Mymensingh and Dhaka regions. (Figure 12.4).
Figure 12.3 Percent of adults (who were ever told to have raised blood cholesterol) who sought treatment care/advise and medications from government and private facilities with respect to wealth quintile, Bangladesh’s STEPs survey 2018
50.8 46.135.6 28.1 20.2 26.2 24.3 25.4
6.1 5.7
35.7 36.151.8 57.8 66.2
66.3 63.063.8
83.9 80.0
5.5 2.3 4.2 7.0 3.44.4 0.0
10.1 9.54.4
7.4 7.0 7.8 6.2 8.7 0.0 0.0 0.0 0.0 8.2
0%10%20%30%40%50%60%70%80%90%
100%
Low
est
Seco
nd
Mid
dle
Fou
rth
Hig
he
st
Low
est
Seco
nd
Mid
dle
Fou
rth
Hig
he
st
Advise/Care Medication
Other
Both
Only Private
Only Government

Bangladesh, 2018
168
Figure 12.4 Percent of adults (who were ever told to have raised blood cholesterol) who sought treatment care/advise from government facilities with respect to province, Bangladesh's STEPs survey 2018
12.6. Consultation with traditional healers and use of herbal remedies
4.9% of adults with raised blood cholesterol reported visiting a traditional healer like
treatment and advise. Of which, 33.9% adults reported currently taking herbal remedies for
their raised blood cholesterol
Background patterns: (Table 12.5)
• The proportion of adults who reported taking herbal or traditional remedies for their
raised blood cholesterol was highest in the 40-55 years age group- 28.3%. Women
were more likely to have ever visited a local healer as compared to men (7.5%-
women vs 2.9%- men). However, a higher proportion of men reported currently
taking herbal or traditional remedies to control their blood cholesterol among adults
who had ever visited a traditional healer. (53.0%-men vs 25.0%-women)
24.4
14.1
29.5
20.8
31.211.2
12.8
24.0

Bangladesh, 2018
169
• Rural residents were more likely to have ever visited a local healer as compared to
urban residents.
• The proportion of adults who had ever visited a local to control their blood cholesterol
decreased with increase in education level and wealth quintile.
12.7. Reasons for not on treatment
81.9% of adults who were prescribed medications cited “didn’t think the drugs were
necessary” and “their blood cholesterol got normal “as reasons for not currently taking
medications/treatment (Table 12.6). The second most common reason given for not taking
medications was “too expensive/ drugs not available” as cited by 11.4% adults
Patterns by background characteristics (Table 12.6):
• The highest proportion of adults who reported “too expensive/ drugs not available”
were within the ages 40-54 years (86.1%).
• A higher proportion of men (82.5 %) gave the reasons “did not think drugs were
necessary” or “their blood pressure was under control” compared to women (80.8%).
• The proportion of adults who reported did not think drugs were necessary” or “their
blood pressure was under control” increased with increase in education level
however, no consistent trends were observed with regards to household wealth.
Figure 12.5 Reasons for which adults with high blood cholesterol reported not taking drugs for raised Blood cholesterol, Bangladesh 2018.
81.6
2.3
11.4
9.6
0.0 10.0 20.0 30.0 40.0 50.0 60.0 70.0 80.0 90.0
don’t think drugs are necessary/Cholesterol got normal
fear or have side effects
too expensive/not available
Medicines not advised by doctor
N=148

Bangladesh, 2018
170
List of Tables:
For more information on raised blood cholesterol prevalence, screening and treatment
coverage or sources of care, see the following tables:
Table: 12.1 Prevalence of raised blood cholesterol and diagnosis, treatment and control
rates
Table: 12.2 Measurement of blood cholesterol, prescription of medications, treatment
compliance
Table: 12.3 sources of care for raised blood cholesterol
Table: 12.4 sources of medications for raised blood cholesterol
Table: 12.5 Care seeking from traditional healers and use of traditional/herbal remedies
Table: 12.6 Reasons for not taking medications among those told to have raised blood
cholesterol and have been prescribed medications.
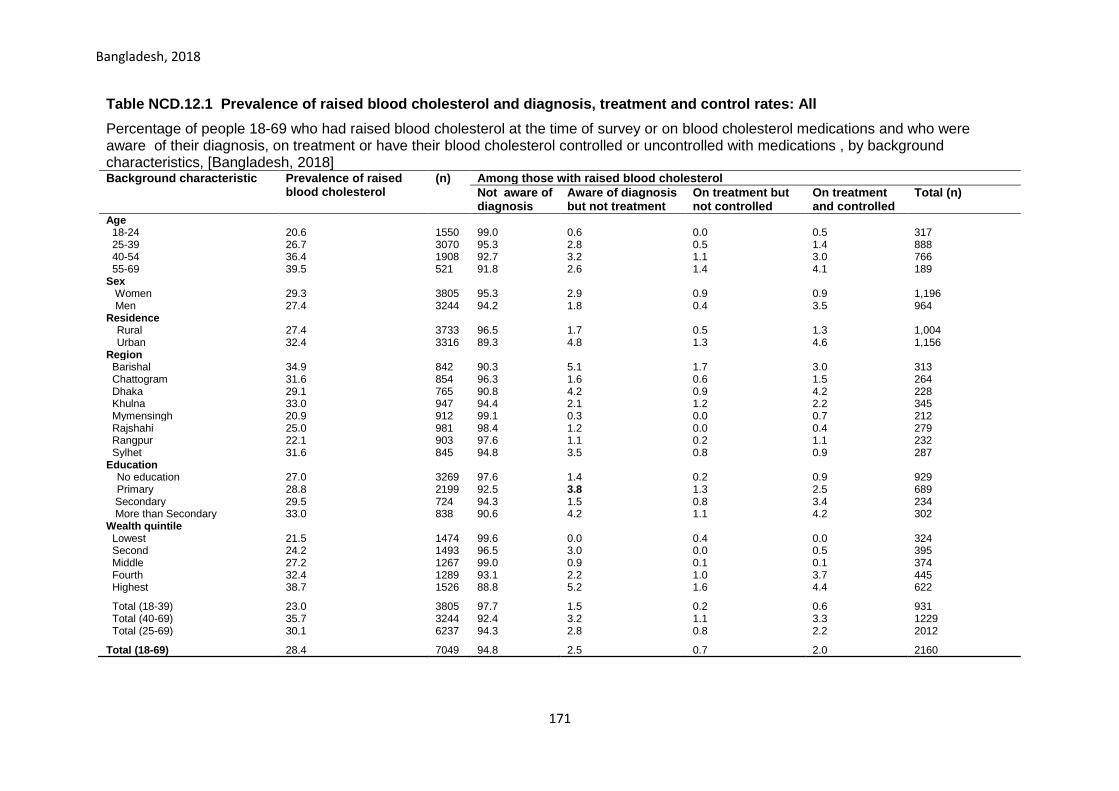
Bangladesh, 2018
171
Table NCD.12.1 Prevalence of raised blood cholesterol and diagnosis, treatment and control rates: All
Percentage of people 18-69 who had raised blood cholesterol at the time of survey or on blood cholesterol medications and who were aware of their diagnosis, on treatment or have their blood cholesterol controlled or uncontrolled with medications , by background characteristics, [Bangladesh, 2018] Background characteristic Prevalence of raised
blood cholesterol (n) Among those with raised blood cholesterol
Not aware of diagnosis
Aware of diagnosis but not treatment
On treatment but not controlled
On treatment and controlled
Total (n)
Age 18-24 20.6 1550 99.0 0.6 0.0 0.5 317 25-39 26.7 3070 95.3 2.8 0.5 1.4 888 40-54 36.4 1908 92.7 3.2 1.1 3.0 766 55-69 39.5 521 91.8 2.6 1.4 4.1 189 Sex
Women 29.3 3805 95.3 2.9 0.9 0.9 1,196 Men 27.4 3244 94.2 1.8 0.4 3.5 964 Residence
Rural 27.4 3733 96.5 1.7 0.5 1.3 1,004 Urban 32.4 3316 89.3 4.8 1.3 4.6 1,156
Region
Barishal 34.9 842 90.3 5.1 1.7 3.0 313 Chattogram 31.6 854 96.3 1.6 0.6 1.5 264 Dhaka 29.1 765 90.8 4.2 0.9 4.2 228 Khulna 33.0 947 94.4 2.1 1.2 2.2 345 Mymensingh 20.9 912 99.1 0.3 0.0 0.7 212 Rajshahi 25.0 981 98.4 1.2 0.0 0.4 279 Rangpur 22.1 903 97.6 1.1 0.2 1.1 232 Sylhet 31.6 845 94.8 3.5 0.8 0.9 287 Education
No education 27.0 3269 97.6 1.4 0.2 0.9 929 Primary 28.8 2199 92.5 3.8 1.3 2.5 689
Secondary 29.5 724 94.3 1.5 0.8 3.4 234 More than Secondary 33.0 838 90.6 4.2 1.1 4.2 302 Wealth quintile
Lowest 21.5 1474 99.6 0.0 0.4 0.0 324 Second 24.2 1493 96.5 3.0 0.0 0.5 395 Middle 27.2 1267 99.0 0.9 0.1 0.1 374 Fourth 32.4 1289 93.1 2.2 1.0 3.7 445 Highest 38.7 1526 88.8 5.2 1.6 4.4 622
Total (18-39) 23.0 3805 97.7 1.5 0.2 0.6 931 Total (40-69) 35.7 3244 92.4 3.2 1.1 3.3 1229 Total (25-69) 30.1 6237 94.3 2.8 0.8 2.2 2012
Total (18-69) 28.4 7049 94.8 2.5 0.7 2.0 2160

Bangladesh, 2018
172
Table NCD.12.2 Blood cholesterol measured, self-reported prevalence and treatment of raised blood cholesterol: All
Percentage of respondents age 18-69 who have ever had their blood cholesterol measured and who have been told by a health care provider that they have raised blood cholesterol; among people who have been told they have raised cholesterol, the percentage told in the past 12 months they have raised cholesterol, and percentage taking medication to control cholesterol, by background characteristics, [Bangladesh]
Background characteristic
Ever had blood cholesterol measured by doctor or health care provider
Number of respondents
Ever told have raised cholesterol by doctor or health care provider
Number of respondents
Among respondents who have been told by a doctor or health care provider they have raised blood cholesterol, the percentage who were:
Told in the past 12 months have raised cholesterol
ever taken medications
currently taking medication to control cholesterol
Number of respondents
Age
18-24 2.1 1942 27.7 45 49.5* 89.5* 12.2* 12* 25-39 5.1 3505 42.3 196 55.2 72.4 22.0 88 40-54 7.5 2152 58.3 208 76.3 85.6 56.3 115 55-69 8.5 586 54.8 65 79.3 71.9 50.3 35 Sex
Women 4.3 4381 44.8 247 72.0 77.0 29.9 121 Men 5.0 3804 48.5 267 64.9 80.4 48.5 129 Residence
Rural 3.2 4183 43.1 155 65.9 84.2 34.6 71 Urban 9.5 4002 51.0 359 70.2 73.7 45.7 179
Region
Barishal 7.8 986 49.5 94 65.1 85.1 29.7 45 Chattogram 3.7 1053 54.0 55 63.9* 92.6* 45.2* 32* Dhaka 7.9 997 50.7 99 66.0 78.2 45.3 54 Khulna 3.4 1040 51.3 63 91.7 82.5 50.7 35 Mymensingh 3.6 1021 27.4 52 97.5* 27.5* 12.6* 17* Rajshahi 1.9 1066 48.4* 33* 45.4* 54.0* 9.4 18* Rangpur 1.8 1009 30.5* 32* 91.9* 60.6* 44.7* 12* Sylhet 5.9 1013 27.1 86 54.5 92.1 30.0 37 Education
No education 2.3 3678 41.3 94 73.2 70.3 38.3 42 Primary 5.1 2533 53.6 145 73.1 95.6 41.6 85 Secondary 5.0 888 44.5 88 51.1 87.4 53.7 45
More than Secondary
11.3 1065 44.0 187 65.6 57.8 33.4 78
Wealth quintile
Lowest 1.3 1639 14.0* 20* 50.1* 95.7* 32.7* 5* Second 1.7 1670 48.9* 32* 73.3* 89.9* 10.3* 14* Middle 2.1 1451 34.2 38 56.6* 69.6* 3.3* 16* Fourth 6.4 1506 45.2 109 74.5 86.1 61.1 55 Highest 11.9 1919 53.0 315 66.2 74.7 38.7 160 Total (18-39) 2.9 4515 30.8 173 49.4 83.4 13.3 57 Total (40-69) 7.6 3670 57.4 341 74.8 77.3 49.9 193 Total (25-69) 5.6 7159 48.3 492 68.6 79.0 41.0 243 Total (18-69) 4.6 8185 46.8 514 68.1 78.9 40.2 250
*interpret with caution due to small sample size

Bangladesh, 2018
173
Table NCD.12.3 source of care for treatment and advise for blood cholesterol: All
Percentage of people 18-69 who were ever told to have raised blood cholesterol and who mentioned different sources of care for treatment/advise and for medication, by background characteristics, [Bangladesh, 2018]
Background characteristic
Government Facility
Private/NGO Facility
Both government and private
Any alternative/ traditional provider
government facilities
Private n
Primary secondary tertiary
Primary secondary
Age
18-24 100.0 95.5 100.0 0* 0.0 0.0 0.0
42.0 13.7 12* 25-39 80.3 72.7 95.1 0.8 2.7 7.8 14.1
25.9 0.0 88
40-54 79.9 71.5 92.6 0.0 4.3 3.6 21.4
43.8 0.7 115 55-69 70.4 54.1 83.8 0.0 5.9 0.6 39.3
32.8 0.0 35
Sex
Women 20.1 70.0 8.5 0.5 0.8 1.4 26.9
42.7 3.9 121 Men 20.2 70.3 7.7 0.0 6.3 5.4 17.0
30.2 0.0 129
Residence
Rural 15.9 70.7 12.6 0.0 6.9 4.8 16.9
37.5 0.0 71 Urban 24.2 69.7 3.5 0.5 0.8 2.5 25.9
34.1 3.5 179
Region
Barishal 17.2 53.4 28.9 0.0 3.8 7.6 35.2
66.6 2.3 45 Chattogram 8.2 90.6 0.0 1.2 0.0 5.6 2.6
21.2 0.0 32*
Dhaka 27.5 65.4 6.1 0.0 1.6 1.8 30.2
20.1 3.4 54 Khulna 18.5 73.2 8.3 0.0 5.2 3.8 17.8
67.9 0.0 35
Mymensingh 25.7 33.9 40.4 0* 50.5 0.0 15.6
58.1 0.0 17* Rajshahi 8.5 82.3 0.0 0* 0.0 7.2 8.5
58.8 0.0 18*
Rangpur 11.0 73.3 0.0 0* 8.9 2.2 8.9
49.1 0.0 12* Sylhet 19.4 79.6 1.0 0.0 0.0 4.9 15.5
64.5 0.0 37
Education
No education 22.5 58.9 16.1 0* 12.9 3.0 26.0
26.7 0* 42 Primary 14.8 77.4 7.8 0.0 1.5 0.8 20.5
41.1 4.5 85
Secondary 31.4 61.0 4.5 0.0 0.0 10.1 25.9
37.1 0.0 45 More than Secondary
20.7 71.9 4.7 0.8 2.7 5.0 17.7
34.0 0.0 78
Wealth quintile
Lowest 17.2 37.0 45.8 0.0 45.8 0.0 17.2
78.5 0.0 5* Second 22.2 77.9 0.0 0.0 0.0 0.0 22.2
58.8 0.0 14*
Middle 12.2 29.4 58.4 0.0 29.1 0.6 40.9
52.3 0.0 16* Fourth 20.9 71.4 5.9 0.0 1.5 9.6 16.0
22.9 0.0 55
Highest 20.4 74.2 3.3 0.4 1.3 1.8 21.8
35.8 3.1 160
Total (18-39) 8.7 86.1 2.2 0.9 1.1 1.2 8.6
31.1 5.8 57
Total (40-69) 24.2 64.5 10.1 0.0 4.8 4.5 26.0
37.5 0.3 193 Total (25-69) 21.2 69.1 8.5 0.2 4.0 3.8 22.6
35.6 1.9 243
Total (18-69) 20.1 70.2 8.0 0.2 3.8 3.6 21.4
35.8 1.8 250
* Private includes NGO clinics and hospitals

Bangladesh NCD STEPs 2018
174
Table NCD.12.4 source of drugs/medications for blood cholesterol: All
Percentage of people 18-69 who have ever taken medication for raised blood cholesterol and who mentioned different sources medications, by background characteristics, [Bangladesh, 2018]
Background characteristic
Government Only
Private* Only
Both government and private
Any alternative/ traditional provider
n
Age
18-24 0.0 100.0 0.0 0.0 9* 25-39 0.0 94.1 0.7 2.9 61 40-54 0.0 97.5 0.6 0.0 91 55-69 0.0 93.5 5.9 0.0 26* Sex
Women 0.0 96.0 0.8 1.3 89 Men 0.0 94.4 4.6 0.0 98 Residence
Rural 0.0 94.3 3.4 0.9 58 Urban 0.0 96.3 1.8 0.4 129
Region
Barishal 0.0 96.3 0.0 0.6 35 Chattogram 0.0 97.7 0.9 0.4 27* Dhaka 0.0 98.6 0.0 1.0 42 Khulna 0.0 96.0 1.6 0.0 26* Mymensingh 0.0 87.7 2.6 0.0 8* Rajshahi 0.0 76.7 18.0 2.4 9* Rangpur 0.0 100.0 0.0 0.0 9* Sylhet 0.0 100.0 0.0 0.0 31* Education
No education 0.0 97.2 2.8 0.0 28* Primary 0.0 91.4 4.2 1.0 74 Secondary 0.0 96.6 1.7 0.0 37
More than Secondary
0.0 96.6 0.6 2.7 48
Wealth quintile
Lowest 0.0 89.6 10.5 0.0 4* Second 0.0 94.8 0.0 2.3 11* Middle 0.0 97.0 1.3 0.0 13* Fourth 0.0 98.5 0.0 0.2 42 Highest 0.0 94.3 3.4 0.9 117 Total (18-39) 0.0 93.2 1.0 3.3 41 Total (40-69) 0.0 95.5 3.0 0.1 146 Total (25-69) 0.0 95.1 2.7 0.7 183 Total (18-69) 0.0 95.2 2.7 0.7 187
*interpret with caution due to small sample size

Bangladesh NCD STEPs 2018
175
Table NCD.12.5 Care seeking from traditional healers and use of traditional/herbal remedies: All
Percentage of people 18-69 who have been ever told to have raised blood cholesterol and who sought care from a traditional healer or currently using a traditional/herbal remedy , by background characteristics, [Bangladesh, 2018]
Background characteristic
For raised blood cholesterol
ever seen a local healer
Total Number (n) currently taking a herbal remedy
Total Number (n)
Age
18-24 0.0 12* 0.0 0* 25-39 4.0 88 74.6 4* 40-54 7.1 115 28.3 7* 55-69 5.2 35 9.6 0* Sex
Women 7.5 121 25.0 10* Men 2.9 129 53.0 3* Residence
Rural 6.6 71 12.5 5* Urban 3.3 179 75.9 8*
Region
Barishal 17.5 45 6.6 5* Chattogram 5.5 32* 100.0 2* Dhaka 1.6 54 0.0 1* Khulna 13.7 35 32.6 3* Mymensingh 0.0 17* 0.0 0* Rajshahi 0.0 18* 0.0 0* Rangpur 0.0 12* 0.0 0* Sylhet 3.4 37 74.9 2* Education
No education 10.3 42 51.9 4* Primary 6.1 85 4.8 6* Secondary 3.3 45 100.0 2*
More than Secondary
0.6 78 74.9 1*
Wealth quintile
Lowest 45.8 5* 0.0 1* Second 10.1 14* 0.0 1* Middle 22.8 16* 7.9 3* Fourth 3.8 55 100.0 2* Highest 1.7 160 57.8 6* Total (18-39) 1.9 57 82.0 2* Total (40-69) 6.0 193 28.5 11* Total (25-69) 5.2 243 33.9 13* Total (18-69) 4.9 250 33.9 13*
*interpret with caution due to small sample size

Bangladesh NCD STEPs 2018
176
Table NCD.12.6 Reasons for not taking medications for raised blood cholesterol: All
Percentage of people 18-69 who have been ever advised to take drugs but not taking drugs in the past 2 weeks and specified different reasons for not taking medication for raised blood cholesterol , by background characteristics, [Bangladesh, 2018]
Background characteristic
don’t think drugs are necessary/Cholesterol got normal
fear or have side effects
too expensive/not available
Medicines not advised by doctor
(n)
Age
15-24 88.5* 0.0* 0.0* 10.8* 11* 25-39 65.1 4.3 17.5 14.4 63 40-54 86.1 2.6 11.6 5.1 55 55-69 100* 0* 9.4* 5.9* 19* Sex
Women 80.8 0.0 8.3 17.1 79 Men 82.5 4.8 14.8 1.4 69 Residence
Rural 76.2 3.7 16.2 9.6 45 Urban 88.0 0.6 5.8 9.6 103
Region
Barishal 76.6* 0.7 25* 25.4* 30* Chattogram 94.0* 0.0* 5.9* 5.3* 19* Dhaka 78.9* 3.2* 13.1* 8.0* 28* Khulna 86.4* 9.0* 3.1* 4.6* 18* Mymensingh 97.2* 0.0* 0.0* 2.8* 11* Rajshahi 81.2* 0.0* 2.3* 10.1* 16* Rangpur 53.9* 0.0* 6.3* 39.8* 6* Sylhet 64.3* 3.3* 25.6* 2.9* 20* Education
No education 71.2* 0.0* 24.4* 9.9* 29* Primary 81.2 1.8 11.0 11.7 47 Secondary 96.3* 1.9* 0.0* 6.0* 23*
More than Secondary
83.9 4.4 7.6 8.2 49
Wealth quintile
Lowest 100* 0.0* 0.0* 0.0* 4* Second 62.0* 0.0* 21.3* 17.8* 11* Middle 83.8* 6.5* 28.3* 11.6* 13* Fourth 63.5* 7.6* 33.9* 7.5* 29* Highest 89.8 0.5 0.3 8.7 91 Total (18-39) 80.8 0.2 7.5 11.1 42 Total (40-69) 82.1 3.6 13.9 8.7 106 Total (25-69) 80.3 2.4 12.2 10.3 142 Total (18-69) 81.6 2.3 11.4 9.6 148
Notes:*interpret data with caution due to small sample size

Bangladesh NCD STEPs 2018
177
Chapter 13 Cardiovascular diseases history, predicted CVD risk and life-style advice
Key findings
History of cardiovascular disease
o 10.0% of adults 18-69 years of age (12.2% in women, 7.8% in men) and 11.8% of 40-
69 years old adults reported ever having a heart attack or chest pain from heart
disease (angina) or a stroke (cerebrovascular accident or incident).
Predicted 10-year cardiovascular disease risk
o 15.5% of adults aged 40-69 (14.3% of men and 16.7% of women) have a predicted
30% or more chance of having a fatal or non-fatal major cardiovascular event
(myocardial infarction or stroke) in the next 10 years based on WHO/ISH risk prediction
charts.
Lifestyle advice
o The adults, who visited a health provider in the previous 12 months, most commonly
reported receiving lifestyle advices from doctors and other health workers on: (1) “eat
at least five servings of fruit and/or vegetables each day” (43.7%), (2) “reduce salt in
your diet” (36.7%) and (3) “reduce fat in your diet” (20.9%).
Introduction
Cardiovascular diseases (CVDs), the most common NCD, are responsible for over 17.8
million deaths globally and of which more than three quarters are in lower middle income
countries 67. In the WHO SEA region, CVDs are estimated to cause almost 44% of all the
NCD-related deaths (~8.6 million deaths) and almost half of these deaths occur in the
economically productive years between 30-69 years of age 68. Therefore, reducing the
burden of CVDs is critical to achieve the target of a 25% relative reduction in risk of
premature mortality from NCDs62.
CVDs include diseases of the heart and blood vessels and vascular diseases of the brain.
Atherosclerosis – a complex process involving deposits of plaques made in the blood
vessels leading to the narrowing of blood vessels and formation of blood clots (thrombus) is
67Roth GA, Abate D, Abate KH, et al. Global, regional, and national age-sex-specific mortality for 282 causes of
death in 195 countries and territories, 1980–2017: a systematic analysis for the Global Burden of Disease Study
2017. The Lancet. 2018;392(10159):1736-1788. doi:10.1016/S0140-6736(18)32203-7
68 Global Burden of Disease Collaborative Network. Global burden of disease study 2016(GBD 2016) Results. Seattle: Institute for Health Metrics and Evaluation (IHME), 2017. http://ghdx.healthdata.org/gbd-results-tool - accessed 24 May 2018.
Bangladesh NCD STEPs 2018
178
implicated in many cases of CVD69. Modification of certain behaviour (tobacco use, physical
inactivity, unhealthy diet, harmful alcohol use) and managing metabolic risk factors (raised
blood pressure, raised blood glucose and cholesterol) can slow down the development of
atherosclerosis and overall cardiovascular risk70.
While national health policies that address population-wide health are important tools for
reducing behavioural risk factors, strategies targeted at high-risk individuals are essential in
managing and reducing metabolic risks. WHO/ISH cardiovascular disease risk charts
developed71 and revised72 for different WHO regions and sub-regions in 2007 are being used
for clinical decision-making by physicians as well as for predicting the proportion of
population with different levels of CVD risk for the purpose of planning of health service
delivery and resource allocation73. These risk prediction charts take into account the age,
sex, blood pressure, smoking status, total blood cholesterol and presence or absence of
diabetes mellitus to compute the overall risk/probability of developing a CVD event in the
next 10 years.
At the time of writing, WHO is working to revise the risk prediction charts. However, pending
the availability of revised charts, this report uses 2007 risk prediction charts (SEAR D).
Bangladesh is committed to reducing CVDs burden and has included the 25% relative
reduction in premature death from NCDs as one of the targets in its 3-year multisectoral action
plan for 2018-202510 and its predecessor39.
Current relevant policies and programs in Bangladesh for the prevention and
treatment of CVDs:
• WHO PEN Package
• Multisectoral action plan for prevention and control of NCDs 2018–2025
69 World Health Organization. Global Atlas on Cardiovascular Disease Prevention and Control. Mendis S, Puska P, Norrving B editors. World Health Organization, Geneva; 2011. 70 World Health Organization. (2007). Prevention of cardiovascular disease : guidelines for assessment and
management of total cardiovascular risk. World Health Organization. https://apps.who.int/iris/handle/10665/43685 71 Mendis S, Lindholm LH, Mancia G, et al. World Health Organization (WHO) and International Society of Hypertension (ISH) risk prediction charts: assessment of cardiovascular risk for prevention and control of cardiovascular disease in low and middle-income countries: Journal of Hypertension. 2007;25(8):1578-1582. doi:10.1097/HJH.0b013e3282861fd3 72 Kaptoge S, Pennells L, De Bacquer D, et al. World Health Organization cardiovascular disease risk charts: revised models to estimate risk in 21 global regions. The Lancet Global Health. 2019;7(10):e1332-e1345. doi:10.1016/S2214-109X(19)30318-3 73 Otgontuya D, Oum S, Buckley BS, Bonita R. Assessment of total cardiovascular risk using WHO/ISH risk prediction charts in three low and middle income countries in Asia. BMC Public Health. 2013;13(1):539. doi:10.1186/1471-2458-13-539

Bangladesh NCD STEPs 2018
179
This chapter describes self-reported history of cardiovascular diseases and lifestyle advice
received from doctors or health workers. Additionally, 10-year cardiovascular disease risk is
predicted for Bangladesh’s population. This information will help Bangladesh assess trends
and progress towards the reduction in CVDs burden as well as the evaluation of current
policies and programs in place.
13.1 History of Cardiovascular disease
10.0% of adults age 18-69 years reported ever having a CVD event including heart attacks
or chest pain from a heart disease or a stroke (Table 13.1). Amongst high risk age group
(i.e. 40 years old and above), 11.8% of adults reported ever having a heart attack or chest
pain (Table 13.1). However, these data may underestimate true prevalence of heart
attacks/stroke due to survivor bias (people who died from fatal cardiovascular events were
excluded from the survey), recall bias, and failure to take into account asymptomatic or
undiagnosed non-fatal events.
Patterns by background characteristics (Table 13.1):
• Women have significantly higher
prevalence of self-reported CVD
events compared to men ( 12.2% vs
7.8%).
• Chattogram (17.8%) and
Mymensingh (11.2%) had
significantly higher self-reported
prevalence of CVD events compared
to other divisions (Figure 13. 1).
• Adults with no education were
more likely to report CVD events than
adults with more than secondary
level education ( 11.6% vs 6.3%).
10%
17.8%
7.4%
7.5%
11.2%9.3%
6.8%
5.3%
Figure 13. 1 Percent of adults aged 15-69 who reported ever having a CVD event by province, Bangladesh STEPs Survey 2018

Bangladesh NCD STEPs 2018
180
13.2 Predicted 10-year cardiovascular
disease risk
10-year cardiovascular disease risk at
population-level was estimated using
WHO/ICH risk prediction chart (2007) for
South-East Asia (SEAR D)71. To calculate
predicted risk for fatal or non-fatal CVD event
(myocardial infarction or stroke), respondents
information on age, sex, systolic blood
pressure, total cholesterol and the presence
or absence of type 2 diabetes are utilized and
combined10.
Amongst adults aged 40-69, 15.5% of adults
have a predicted 10-year CVD risk of 30% or
more.
Patterns by background characteristics (Table 13.2)
• Chattogram division had the highest percentage of adults aged 40-69 with 30% or
more CVD risk than almost all other provinces (24.7%) (Figure 13.2).
13.3 Lifestyle advice
Individual-based intervention involving life-style advice from doctors and health workers to
modify key risk behavioral among high-risk individuals have an important place for overall
NCD prevention and control along with population-based measured targeted at the whole
population.
Amongst those who visited a doctor or health worker in the past 12 months, the three most
common lifestyle advices that adults received were: (1) “eat at least five servings of fruit and/or
vegetables each day” (43.7%), (2) “reduce salt in your diet” (36.7%) and (3) “reduce fat in your
diet” (20.9%) (Table 13.3 and Figure 13. 3). Only 13.9% of adults received advice to reduce
glucose beverages in the diet.
Figure 13.2 Percent adults aged 40-69 who have a 30% or higher predicted 10-year cardiovascular disease risk, Bangladesh STEPs Survey 2018
15%
25.5%
12.4%
15.8%
17.6%13.6%
16.9%
11.9%

Bangladesh NCD STEPs 2018
181
Figure 13. 3 Percent adults aged 18-69 who have received different lifestyle advice from a doctor or health worker, Bangladesh STEPs Survey 2018
Patterns by background characteristic (Table 13.3):
• The likelihood of receiving a lifestyle advice increased with age.
• A much higher percentage of men were given advice to quit using tobacco or don’t
start than women (40.0% vs 8.2%).
• Adults who were of the lowest and highest wealth quintile were more likely to receive
some kind of life-style advice than adults who were of the middle wealth quintile
(Figure 13.4).
Figure 13.4 Differentials in lifestyle advice received amongst adults aged 18-69 by wealth, Bangladesh STEPs Survey 2018
20.3
35.7
43.7
20.9
19.2
16.6
13.9
0.0 5.0 10.0 15.0 20.0 25.0 30.0 35.0 40.0 45.0 50.0
quit using tobacco or don't start
reduce salt in your diet
eat at least five servings of fruit and/or vegetableseach day
reduce fat in your diet
start or do more physical activity
maintain a healthy body weight or lose weight
reduce sugar beverages in your diet
Perc
ent
44.5
35.9
15.3
22.319.3 20.4
14.6
44.8
39.9
30.8 30.6
15.5
26.3
21.6
0.0
5.0
10.0
15.0
20.0
25.0
30.0
35.0
40.0
45.0
50.0
fruit and/orvegetables
salt healthy bodyweight
fat tobacco physical activity sugar
Lowest
Second
Middle
Fourth
Highest

Bangladesh NCD STEPs 2018
182
Patterns by disease and risk conditions (Table 13.4):
• Presence of a physiological risk factor increased the probability of receiving an advice
to reduce salt and dietary fat, increase physical activity or quit tobacco. Similarly, a
significantly higher proportion of smokers reported receiving an advice to quit or not to
initiate smoking then never smokers.
• Adults with predicted 10-year cardiovascular disease risk of 30% or more received
slightly more lifestyle advice than their counterparts.
List of Tables:
For more information on cardiovascular diseases, see the following tables:
Table 13.1 History of cardiovascular disease: all respondents
Table 13.2 Predicted 10-year cardiovascular disease risk: all respondents
Table 13.3 Lifestyle advice from doctors and other health workers: all respondents (By
background characteristics)
Table 13.4 Lifestyle advice from doctors and other health workers: all respondents (by
presence of a disease condition and/or risk factor)

Bangladesh NCD STEPs 2018
183
Table 13.1 History of cardiovascular disease: all respondents
Percent of adults aged 18-69 who self-reported ever having a heart attack or chest pain from heart disease or stroke, by background characteristics, [Bangladesh, 2018] Background characteristic
Ever having a heart attack or chest pain from heart disease or stroke
95 % CI Number of respondents (N)
Age 18-24 4.4 2.7 6.9 1026 25-39 9.2 7.4 11.5 3489 40-54 13.3 11.3 15.6 2503 55-69 16.3 12.9 20.3 1167 Sex
Women 12.2 10.0 14.9 4381 Men 7.8 6.6 7.8 3804
Residence
Rural 10.1 8.5 11.9 4183 Urban 9.8 7.9 12.1 4002
Division
Barishal 9.5 7.0 12.9 986 Chattogram 17.8 13.0 23.9 1053 Dhaka Rural 7.4 5.4 10.1 997 Khulna 7.5 5.5 10.1 1040 Mymensingh 11.2 8.3 14.9 1021 Rajshahi 9.3 6.7 12.7 1066 Rangpur 6.8 4.8 9.7 1009 Sylhet 5.3 3.4 8.2 1013 No education 11.6 9.9 13.6 2476 Primary 10.0 8.0 12.5 3735 Secondary 8.3 5.7 12.1 1397 More than secondary 6.3 4.4 9.0 556
Wealth quintile
Lowest 11.2 9.1 13.7 1639 Second 9.7 7.8 12.0 1670 Middle 8.1 6.1 10.8 1451 Fourth 10.2 7.7 13.2 1506 Highest 11.0 8.5 14.2 1919
Total (18-39) 7.4 6.0 9.1 4515 Total (40-69) 14.7 12.6 17.0 3670 Total (25-69) 11.8 10.3 13.5 7159 Total (18-69) 10.0 8.7 11.5 8185
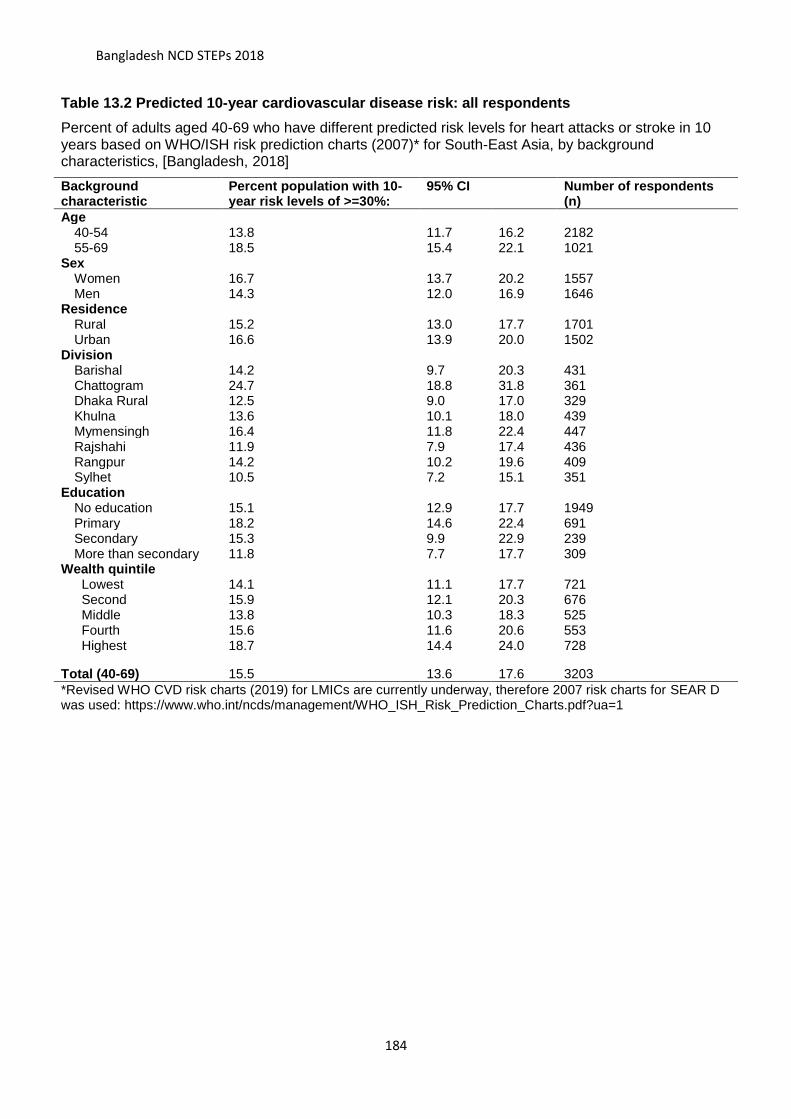
Bangladesh NCD STEPs 2018
184
Table 13.2 Predicted 10-year cardiovascular disease risk: all respondents
Percent of adults aged 40-69 who have different predicted risk levels for heart attacks or stroke in 10 years based on WHO/ISH risk prediction charts (2007)* for South-East Asia, by background characteristics, [Bangladesh, 2018]
Background characteristic
Percent population with 10-year risk levels of >=30%:
95% CI Number of respondents (n)
Age
40-54 13.8 11.7 16.2 2182 55-69 18.5 15.4 22.1 1021
Sex
Women 16.7 13.7 20.2 1557 Men 14.3 12.0 16.9 1646
Residence
Rural 15.2 13.0 17.7 1701 Urban 16.6 13.9 20.0 1502
Division
Barishal 14.2 9.7 20.3 431 Chattogram 24.7 18.8 31.8 361 Dhaka Rural 12.5 9.0 17.0 329 Khulna 13.6 10.1 18.0 439 Mymensingh 16.4 11.8 22.4 447 Rajshahi 11.9 7.9 17.4 436 Rangpur 14.2 10.2 19.6 409 Sylhet 10.5 7.2 15.1 351
Education
No education 15.1 12.9 17.7 1949 Primary 18.2 14.6 22.4 691 Secondary 15.3 9.9 22.9 239 More than secondary 11.8 7.7 17.7 309
Wealth quintile
Lowest 14.1 11.1 17.7 721 Second 15.9 12.1 20.3 676 Middle 13.8 10.3 18.3 525 Fourth 15.6 11.6 20.6 553 Highest 18.7 14.4 24.0 728
Total (40-69) 15.5 13.6 17.6 3203
*Revised WHO CVD risk charts (2019) for LMICs are currently underway, therefore 2007 risk charts for SEAR D was used: https://www.who.int/ncds/management/WHO_ISH_Risk_Prediction_Charts.pdf?ua=1

Bangladesh NCD STEPs 2018
185
Table 13.3 Lifestyle advice from doctors and other health workers: all respondents (By background characteristics)
Percent of adults aged 15-69 who have ever visited a doctor or health worker and received lifestyle advice on behavioural risk factors for non-communicable diseases by background characteristics, [Bangladesh, 2018] Background characteristic
Percent adults who reported receiving lifestyle advice to: Number of respondents quit using tobacco
or don't start reduce salt in your diet
eat at least five servings of fruit and/or vegetables each day
reduce fat in your diet
start or do more physical activity
maintain a healthy body weight or lose weight
reduce glucose beverages in your diet
Age 18-24 8.7 24.8 43.1 14.0 13.3 12.2 9.2 463 25-39 16.5 30.8 42.1 19.7 18.5 15.8 12.2 1649 40-54 25.4 43.7 45.9 27.5 24.8 19.6 18.2 1232 55-69 35.6 49.7 45.0 24.0 21.6 20.1 18.0 633 Sex
Women 8.2 36.7 41.4 19.9 13.5 16.2 11.3 2564 Men 40.0 34.2 47.4 22.4 28.6 17.4 18.1 1413
Residence
Rural 21.2 34.4 43.7 19.4 17.0 13.5 12.4 1931 Urban 17.6 39.8 43.6 25.2 25.8 26.1 18.3 2046
Division
Barishal 15.5 48.9 61.9 28.6 24.8 23.3 21.8 509 Chattogram 17.3 34.9 44.5 15.0 13.2 10.4 13.6 456 Dhaka 22.6 41.7 37.9 21.6 24.7 21.6 12.7 502 Khulna 12.5 30.8 37.8 22.7 13.4 10.4 11.5 591 Mymensingh 26.7 35.8 50.8 16.8 9.7 11.3 6.8 454 Rajshahi 18.4 24.4 40.1 17.0 23.9 22.0 12.9 542 Rangpur 28.5 36.7 47.7 26.9 27.5 24.8 20.8 419 Sylhet 24.9 34.6 50.5 28.1 14.3 7.9 17.6 504
Education
No education 28.1 39.0 44.5 18.4 16.6 12.5 11.4 1634 Primary 15.5 34.6 43.1 21.0 17.2 14.6 13.4 1292 Secondary 12.2 33.0 41.2 19.6 22.3 22.8 15.3 466 More than
secondary 15.7 31.1 45.3 29.4 28.9 27.9 21.1 570
Wealth quintile
Lowest 27.3 37.1 43.7 18.6 17.2 13.0 10.4 689 Second 23.8 35.0 44.9 16.2 15.8 11.9 10.7 728 Middle 17.3 29.8 40.3 13.6 14.2 8.1 9.8 711 Fourth 19.3 35.9 44.5 22.3 20.4 15.3 14.6 722 Highest 15.5 39.9 44.8 30.6 26.3 30.8 21.6 1127
Total (18-39) 13.6 28.6 42.5 17.6 16.6 14.5 11.1 2112 Total (40-69) 30.5 46.7 45.5 25.8 23.2 19.9 18.1 1865 Total (25-69) 23.6 38.9 43.8 22.8 20.9 17.9 15.2 3514 Total (18-69) 20.3 35.7 43.7 20.9 19.2 16.6 13.9 3977

Bangladesh NCD STEPs 2018
186
Table 13.4 Lifestyle advice from doctors and other health workers: all respondents (by disease and risk conditions)
Percent of adults aged 18-69 who have ever visited a doctor or health worker and received lifestyle advice on behavioural risk factors for non-communicable diseases by disease and risk conditions, [Bangladesh, 2018] Disease and risk condition Percent adults who reported receiving lifestyle advice to: Number of
respondents Quit using tobacco or don't start
Reduce salt in your diet
Eat at least five servings of fruit and/or vegetables each day
Reduce fat in your diet
Start or do more physical activity
Maintain a healthy body weight or lose weight
Reduce glucose beverages in your diet
Smoking status Current smokers 68.0 34.6 49.6 22.5 24.4 13.3 17.7 638 Previous smokers 42.7 49.2 51.4 30.1 32.7 23.8 23.1 291 Never smokers 7.9 34.8 41.7 19.7 16.9 16.7 12.2 3048
Blood Pressure status
Raised blood pressure 21.8 52.5 46.8 30.4 28.5 26.3 21.5 1227 Normal blood pressure 19.7 29.1 42.5 17.4 15.3 12.7 10.5 2641
diabetes
Raised blood glucose/ diabetes
25.5 55.7 56.7 37.7 37.0 41.0 39.2 453
Normal blood-glucose/ diabetes
20.1 33.6 42.6 18.8 17.0 12.9 10.9 3007
Cholesterol
Raised cholesterol 22.1 44.1 47.4 25.5 23.0 22.5 16.2 1194 Normal cholesterol 20.1 32.4 42.8 18.9 17.6 13.2 13.1 2262
Nutrition Status
Obese 15.4 50.4 46.7 48.9 40.6 57.9 22.8 350 Overweight 15.7 40.5 39.5 24.2 22.8 25.6 15.4 1011 Normal and underweight 23.4 32.9 44.3 17.0 16.2 8.8 12.6 2472
Predicted 10-year CVD risk (adults aged 40-69)
>=30% 38.5 61.2 60.4 40.7 27.8 28.0 24.7 316 <30% 27.8 42.6 41.5 20.9 21.6 17.4 16.0 1321
Total (18-69) 20.3 35.7 43.7 20.9 19.2 16.6 13.9 3977

Bangladesh NCD STEPs 2018
187
Chapter 14 Cervical Cancer: Screening and Treatment
Key findings
Testing for cervical cancer
o Ever tested for cervical cancer: 6.1% (4.3% in the last 5 years) and 4.3% (2.6% in the
last five years) of women age 30-49 years and 18-69 years, respectively, reported ever
getting a cervical cancer test.
o Main reason for testing: 49.0% of women (18-69 years) reported getting test done as
they were experiencing pain or other symptom; 30.3% women reported the test as
recommended by health care provider.
o 93.3% of women received back the results of their most recent test.
Source (type of facility) for the most recent test for cervical cancer (18-69 years)
o 55.6% of women got their most recent test at private clinics, NGO or community-run
hospitals.
o 43.2% and 42.6% of women received their most recent test at private hospitals and
government hospital respectively.
Treatment for cervical cancer
o Treatment: 74.5% of women who received abnormal or inconclusive test results
received treatment
o Follow-up: 68.5% of women who received abnormal or inconclusive test results
received a follow-up visit.
Introduction
Cervical cancer is the second most common cause of cancer morbidity and mortality among
women in the South-east Asia Region. The burden is particularly high in low- and middle-
income countries (LMICs) accounting for 85% of deaths related to cervical cancer
worldwide74,75. It is the second most common cancer among women in Bangladesh76.
Human papillomavirus (HPV) infection is the main cause of cervical cancer and when
74 Bray F, Ferlay J, Soerjomataram I, Siegel RL, Torre LA, Jemal A. Global cancer statistics 2018: GLOBOCAN estimates of incidence and mortality worldwide for 36 cancers in 185 countries. CA: A Cancer Journal for Clinicians. 2018;68(6):394-424. doi:10.3322/caac.21492
75 Ferlay J, Soerjomataram I, Dikshit R, et al. Cancer incidence and mortality worldwide: Sources, methods and major patterns in GLOBOCAN 2012: Globocan 2012. Int J Cancer. 2015;136(5):E359-E386. doi:10.1002/ijc.29210
76 International Agency for Research on Cancer. Bangladesh: World Health Organization; 2018 [updated March 2019; cited 2019 30 April]. Available from: http://gco.iarc.fr/today/data/factsheets/populations/50-bangladesh-fact-sheets.pdf.

Bangladesh NCD STEPs 2018
188
detected early, cervical cancer is largely preventable and treatable form of cancer2,77.
However, lack of access to timely and effective health services (vaccination, screening and
treatment); social stigma and lack of awareness has posed major barriers to the reduction of
cervical cancer related morbidity and mortality in low resource settings78.
It is estimated that without further
intervention there would be 44.4 million
cervical cancer cases diagnosed
globally over the period 2020–69, with
almost two-thirds of cases occurring in
LMICs79. In May 2018, the WHO
Direction-General made a global call for
action to eliminate80 cervical cancer as
a public health problem 81 and proposed
targets for 2030 (Figure 14.1)82.
Current WHO recommendation for cervical cancer prevention and treatment include83: (1)
HPV vaccination for girls aged 9-13 before they initiate sexual activity; (2) Every woman
aged 30-49 should be screened for cervical cancer at least once in a life-time regardless of
vaccination status and should be repeated at least every 5 years if previous results are
negative; (3) Adopt the “screen-and-treat” approach where treatment is given ideally on the
same day and same location after positive diagnosis of pre-cancerous lesions to prevent
loss to follow-up and delayed treatment.
77 Franco EL, Duarte-Franco E, Ferenczy A. Cervical cancer: epidemiology, prevention and the role of human papillomavirus infection. CMAJ. 2001;164(7):1017-1025. 78 WHO. Comprehensive cervical cancer control: a guide to essential practice – 2nd ed. 2014 Geneva. 79 Simms KT, Steinberg J, Caruana M, et al. Impact of scaled up human papillomavirus vaccination and cervical screening and the potential for global elimination of cervical cancer in 181 countries, 2020–99: a modelling study. The Lancet Oncology. 2019;20(3):394-407. doi:10.1016/S1470-2045(18)30836- 80 Elimination defined as age-adjusted incidence rate less than 4 per 100,000 women-years. 81 Ghebreyesus, T., Cervical Cancer: An NCD We Can Overcome. 2018, World Health Organization: Geneva, Switzerland. 82 WHO. [Draft] Global Strategy Towards the Elimination of Cervical Cancer as a Public Health Problem. 2019, World Health
Organization: Geneva, Switzerland. [Assessed on: Sep 24, 2019] https://www.who.int/docs/default-
source/documents/cervical-cancer-elimination-draft-strategy.pdf
83 Not an exhaustive list of recommendations, please see original document for comprehensive guidelines. WHO. Comprehensive cervical cancer control: a guide to essential practice – 2nd ed. 2014 World Health Organization: Geneva, Switzerland.
Figure 14.1 Global Targets for the
elimination of Cervical Cancer by 2030
• 90% of girls fully vaccinated with HPV vaccine by 15 years of age.
• 70% of women are screened with a high-precision test at 35 and 45 years of age.
• 90% of women identified with cervical disease receive treatment and care.

Bangladesh NCD STEPs 2018
189
In Bangladesh, the National Cervical Cancer Screening program was launched in 200584 and
the expansion of its cervical cancer screening program has been included in the National
Strategy for Cervical Cancer Prevention and Control Bangladesh (2017-2022)85.
Current relevant policies and programs in Bangladesh for the prevention and
treatment of cervical cancer:
▪ Introduce and scale up delivery of HPV vaccine to girls aged 9 to 13 years through a
coordinated multisectoral approach including EPI.
▪ Implement and scale up organized cervical cancer screening programmes utilizing
evidence based, cost-effective interventions through public health service delivery
system across different levels of health care.
▪ Strengthen health systems and quality assurance mechanism to ensure quality and
equitable access to cervical cancer screening services with particular attention to
socioeconomically disadvantaged population groups.
▪ Augment management facilities for invasive cancer cervix as part of a
comprehensive cancer control programme.
▪ Introduce palliative care services into all level of health system as part of a
comprehensive cancer control programme.
▪ Encourage convergence with related health programmes to ensure a coordinated
approach for cervical cancer control within the health system.
▪ Initiate and augment a structured advocacy and educational campaign for cervical
cancer control. 8. Establish a Monitoring & Evaluation framework for the cervical
cancer control.
▪ To contribute towards establishment of a National Cancer Registry comprising
several hospitals based and one population based cancer registry as a ready source
of data for further research.
This chapter focuses on the health service component of cervical cancer prevention and
treatment. This information will help Bangladesh assess trends and progress towards the
elimination of cervical cancer as well as the evaluation of current policies and programs in
place.
84 Basu, P., et al., Evaluation of the National Cervical Cancer Screening Programme of Bangladesh and the formulation of
quality assurance guidelines. BMJ Sexual & Reproductive Health, 2010. 36(3): p. 131-134 85 National Strategy for Cervical Cancer Prevention and Control Bangladesh (2017-2022). Dhaka: Directorate General of Health Services, Health Services Division, Ministry of Health and Family Welfate, Government of the People’s Republic of Bangladesh, 2017. [Accessed on Oct 3, 2019]: http://www.searo.who.int/bangladesh/cervical-cancer-strategy-english-book250118.pdf?ua=1
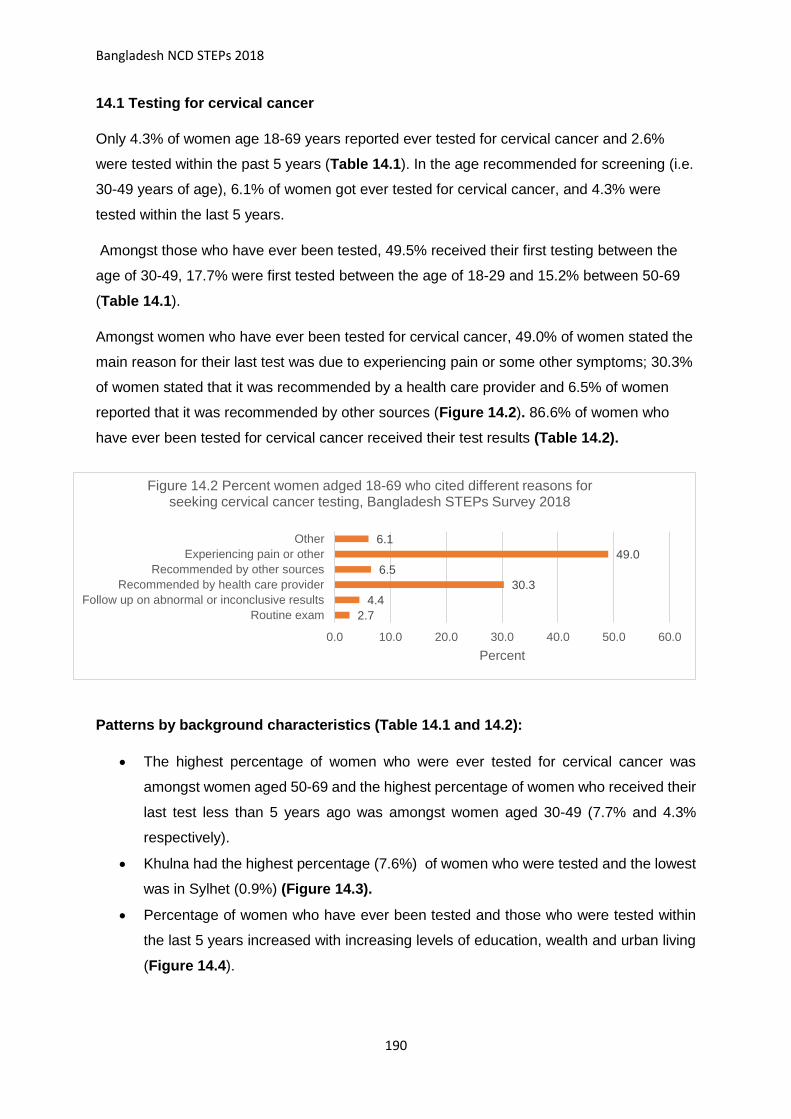
Bangladesh NCD STEPs 2018
190
14.1 Testing for cervical cancer
Only 4.3% of women age 18-69 years reported ever tested for cervical cancer and 2.6%
were tested within the past 5 years (Table 14.1). In the age recommended for screening (i.e.
30-49 years of age), 6.1% of women got ever tested for cervical cancer, and 4.3% were
tested within the last 5 years.
Amongst those who have ever been tested, 49.5% received their first testing between the
age of 30-49, 17.7% were first tested between the age of 18-29 and 15.2% between 50-69
(Table 14.1).
Amongst women who have ever been tested for cervical cancer, 49.0% of women stated the
main reason for their last test was due to experiencing pain or some other symptoms; 30.3%
of women stated that it was recommended by a health care provider and 6.5% of women
reported that it was recommended by other sources (Figure 14.2). 86.6% of women who
have ever been tested for cervical cancer received their test results (Table 14.2).
Patterns by background characteristics (Table 14.1 and 14.2):
• The highest percentage of women who were ever tested for cervical cancer was
amongst women aged 50-69 and the highest percentage of women who received their
last test less than 5 years ago was amongst women aged 30-49 (7.7% and 4.3%
respectively).
• Khulna had the highest percentage (7.6%) of women who were tested and the lowest
was in Sylhet (0.9%) (Figure 14.3).
• Percentage of women who have ever been tested and those who were tested within
the last 5 years increased with increasing levels of education, wealth and urban living
(Figure 14.4).
2.7
4.4
30.3
6.5
49.0
6.1
0.0 10.0 20.0 30.0 40.0 50.0 60.0
Routine exam
Follow up on abnormal or inconclusive results
Recommended by health care provider
Recommended by other sources
Experiencing pain or other
Other
Percent
Figure 14.2 Percent women adged 18-69 who cited different reasons for seeking cervical cancer testing, Bangladesh STEPs Survey 2018

Bangladesh NCD STEPs 2018
191
• Chattogram had the lowest percent of women
who tested for cervical cancer and subsequently
received their test result (62.0%) compared to
all other divisions
14.2 Sources of care for cervical cancer
43.2% of women (18-69 year of age) received their
most recent test at private hospitals and 42.6%
received the test at government hospitals (Table 14.3
and Figure 14.5).
4.12.53.5 3.9
2.7
7.3
4.2 3.0
6.54.4
8.7
0.0
5.0
10.0
15.0
20.0
Rural vs Urban Increasing levels of education Increasing levels of wealth
Perc
ent
Figure 14.4 Percent women aged 18-69 who received their test results, Bangladesh STEPS Survey 2018
9.7
43.2
0.5
0.5
42.6
0.7
0.0 10.0 20.0 30.0 40.0 50.0
Private Doctor's Chamber
Private Hospitals
Health camp
Community clinic
Government Hospital
Others
Figure 14.5 Sources of care for testing and treatment of cervical cancer amongst women aged 18-69, Bangladesh STEPs Survey
2018
4.3%
4.2%
4.4%
7.6%
6.2%1.1%
5.2%
0.9%
Figure 14.3 Percent of women aged 18-69 who have ever received testing for cervical cancer by division, Bangladesh STEPs Survey 2018
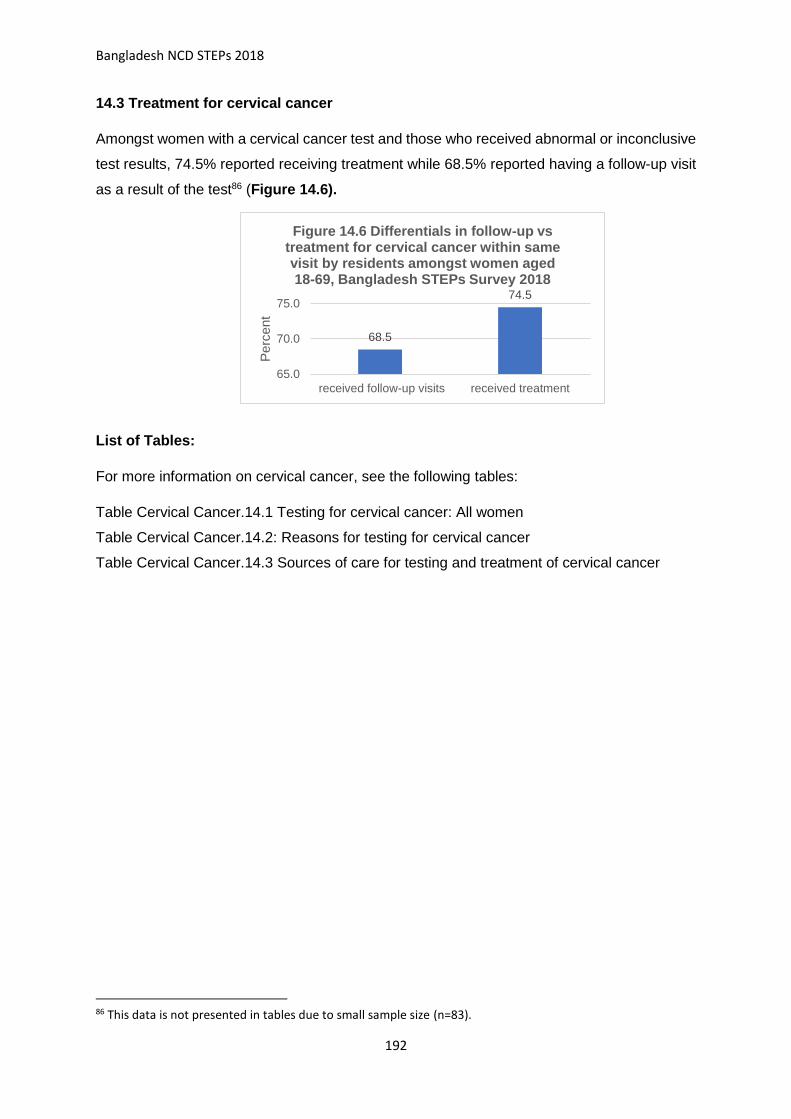
Bangladesh NCD STEPs 2018
192
14.3 Treatment for cervical cancer
Amongst women with a cervical cancer test and those who received abnormal or inconclusive
test results, 74.5% reported receiving treatment while 68.5% reported having a follow-up visit
as a result of the test86 (Figure 14.6).
List of Tables:
For more information on cervical cancer, see the following tables:
Table Cervical Cancer.14.1 Testing for cervical cancer: All women
Table Cervical Cancer.14.2: Reasons for testing for cervical cancer
Table Cervical Cancer.14.3 Sources of care for testing and treatment of cervical cancer
86 This data is not presented in tables due to small sample size (n=83).
68.5
74.5
65.0
70.0
75.0
received follow-up visits received treatment
Perc
ent
Figure 14.6 Differentials in follow-up vs treatment for cervical cancer within same visit by residents amongst women aged 18-69, Bangladesh STEPs Survey 2018

Bangladesh NCD STEPs 2018
193
Table Cervical Cancer.14.1 Testing for cervical cancer: All women Percent of women aged 18-69 who have ever tested for cervical cancer; timing of the last test; age of first testing, amongst women aged 18-69, by background characteristics [ Bangladesh, 2018] Background characteristic
Percent women ever tested for cervical cancer
Percent women whose most recent test was less than 5 years ago*
Number of women (n)
Amongst those who have ever been tested for cervical cancer:
percent who received their first test at age*
Percent who received test results from most recent test
Number of women (n)
18-29 30-49 50-69
Age
18-29 1.3 1.3 1158 89.6 0.0 0.0 99.3 25** 30-49 6.1 4.3 2405 10.8 89.2 0.0 84.1 182 50-69 7.7 2.2 755 0.0 56.5 43.5 85.4 63 Residence
Rural 3.5 1.9 2225 12.7 69.0 17.0 88.1 92 Urban 7.3 5.1 2093 26.4 60.0 12.1 83.9 178 Division
Barishal 4.3 3.0 531 67.1 15.2 0.0 89.9 35 Chattogram 4.2 1.9 546 7.4 47.6 45.0 62.0 29** Dhaka 4.4 2.8 515 22.3 77.7 0.0 91.5 27** Khulna 7.6 4.0 555 27.8 68.4 3.8 92.7 66 Mymensingh 6.2 4.7 538 28.6 46.3 16.8 91.8 46 Rajshahi 1.1 1.1 564 5.8 68.8 14.9 100.0 17** Rangpur 5.2 2.9 541 2.6 86.8 10.7 98.8 36 Sylhet 0.9 0.7 528 3.3 88.2 8.4 100.0 14** Education
No education 4.1 2.0 1921 7.6 61.5 28.9 90.6 95 Primary 3.9 2.4 1507 28.7 61.9 7.7 82.4 89 Secondary 4.2 2.7 432 21.7 78.3 0.0 77.1 35 More than secondary 6.5 5.6 437 20.4 75.1 4.5 91.8 49 Wealth quintile
Lowest 2.5 1.5 962 18.4 70.3 4.5 93.4 28** Second 2.7 2.2 888 8.4 68.4 23.2 87.8 33** Middle 3.0 1.9 716 24.6 72.7 0.9 84.3 35 Fourth 4.4 2.0 709 9.7 43.8 46.5 76.3 35 Highest 8.7 5.2 1043 21.9 71.5 5.9 89.5 139 Total (18-69) 4.3 2.6 4318 17.7 65.7 15.2 86.6 270
* Women who refused to respond or stated "don't know" for these two questions are not presented here but included in the denominator at the time of the analysis. ** Interpret with caution due to small sample size

Bangladesh NCD STEPs 2018
194
Table Cervical Cancer.14.2: Reasons for testing for cervical cancer: All women
Percent of women aged 18-69 who have ever received cervical cancer testing and cited different reasons for seeking the test, by background characteristics [Bangladesh, 2018] Background characteristic
Percent whose main reason for the last test was*: Number of women (N) Routine exam Follow up on
abnormal or inconclusive results
Recommended by health care provider
Recommended by other sources
Experiencing pain or other
Other
Age
18-29 4.4 6.0 17.7 9.2 62.7 0.0 25** 30-49 2.3 2.3 38.9 3.5 44.5 8.4 181 50-69 2.6 7.0 22.5 9.9 50.3 5.0 63 Residence
Rural 0.7 5.1 30.5 5.6 51.4 6.6 92 Urban 6.0 3.2 29.9 8.1 44.9 5.2 177
Division
Barishal 9.4 0.0 46.0 5.6 37.5 0.7 35 Chattogram 0.0 0.9 43.0 9.0 45.2 1.9 29** Dhaka Rural 1.6 4.0 18.5 0.0 65.2 6.8 27** Khulna 2.2 0.0 26.9 15.5 47.8 7.5 66 Mymensingh 0.7 22.3 35.3 2.6 24.4 14.8 46 Rajshahi 21.2 0.0 36.6 7.1 31.6 3.6 16** Rangpur 4.3 3.2 25.0 0.0 63.8 3.7 36 Sylhet 6.6 0.0 8.4 50.9 30.7 3.3 14**
Education
No education 1.7 4.9 29.0 6.5 55.0 3.0 95 Primary 3.9 5.9 32.7 6.2 41.9 9.4 89 Secondary 2.2 4.2 18.3 3.0 54.3 9.7 35 More than secondary 3.5 0.0 41.0 6.9 43.8 4.9 48
Wealth quintile
Lowest 0.0 6.3 34.5 14.0 34.8 3.1 28** Second 0.0 16.6 39.5 3.8 33.4 6.7 33 Middle 0.0 0.0 33.5 10.4 49.1 7.0 35 Fourth 3.5 0.0 18.8 5.1 72.6 0.0 35 Highest 4.6 3.6 30.7 4.6 47.0 9.3 138
Total (18-69) 2.7 4.4 30.3 6.5 49.0 6.1 269
* Women who refused to respond or stated "don't know" for these two questions are not presented here but included in the denominator at the time of the analysis. ** Interpret with caution due to small sample size

Bangladesh NCD STEPs 2018
195
Table Cervical Cancer.14.3 Sources of care for testing and treatment of cervical cancer
Percent of women aged 18-69 who received screening/testing from difference sources by background characteristics [Bangladesh, 2018]. Background characteristics
Source of care for testing Number of women (n)
Private Doctor's Chamber
Private Hospitals
Health camp
Community clinic
Government Hospital
Others
Age
18-29 20.6 17.5 0.0 0.0 56.3 0.0 25** 30-49 11.8 47.6 0.9 1.1 35.7 1.4 182 50-69 2.5 46.5 0.0 0.0 47.4 0.0 63 Residence
Rural 11.5 40.6 0.7 0.9 41.2 0.6 92 Urban 6.6 47.6 0.0 0.0 44.9 0.9 178
Division
Barishal 19.5 39.6 0.0 0.0 41.0 0.0 35 Chattogram 13.5 30.0 0.0 0.0 56.5 0.0 29** Dhaka Rural 0.0 52.0 0.0 0.0 48.0 0.0 27** Khulna 11.8 57.6 0.0 0.0 23.3 0.9 66 Mymensingh 14.7 25.6 0.0 0.0 46.6 1.0 46 Rajshahi 0.0 49.1 0.0 0.0 50.9 0.0 17** Rangpur 12.6 44.6 4.0 0.0 35.6 3.2 36 Sylhet 2.5 40.8 0.0 40.7 12.8 3.3 14**
Education
No education 7.8 37.4 1.1 0.0 46.8 0.2 95 Primary 11.2 51.0 0.0 0.0 37.4 0.5 89 Secondary 6.0 33.1 0.0 0.0 57.3 3.6 35 More than secondary 16.1 54.0 0.0 0.0 29.6 0.3 49
Wealth quintile
Lowest 14.4 33.7 0.0 4.2 32.0 0.0 28** Second 9.7 42.5 0.0 0.0 47.8 0.0 33** Middle 9.4 39.7 3.9 0.0 40.2 0.0 35 Fourth 9.8 33.1 0.0 0.0 57.1 0.0 35 Highest 8.4 51.8 0.0 0.0 38.2 1.7 139
Total (18-69) 9.7 43.2 0.5 0.5 42.6 0.7 270
* Women who refused to respond or stated "don't know" for these two questions are not presented here but included in the denominator at the time of the analysis. ** Interpret with caution due to small sample size

STEPS Bangladesh 2018
196
Chapter 15 Oral health
Key findings
Oral hygiene practices
o Cleaning of teeth: Nearly all adults (99.2%) reported that they clean their teeth daily or
twice in a day.
o Cleaning materials: most of the respondents used toothbrush (65.2%) and toothpaste
(56.7%).
Care seeking for oral health issues
o Ever visited dentist: 29.0% of adults (29.1% in women, 29.0% in men) reported that
they have ever visited dentist in the past.
o Timing of recent visit: Amongst those who have ever seen a dentist less than half
(45.4%) visited within last one year followed by 32.8% visited between 1-5 years and
rest of them (21.8%) visited more than 5 years ago.
o Reason for visit: among those who ever visited a dentist, only 1.1% of adults visited for
a preventive visit while others (98.9%) visited for consultation or treatment.
Self-reported oral health issues
o 38.0% of adults (40.5% in women, 35.3% in men) reported experiencing pain,
swelling, bleeding or discomfort of the teeth, gums or mouth, followed by difficulty in
chewing (27.2%) and difficulty in speaking (13.2%).
Sources of care for oral health issues
o Visited health facility: More than half (51.7%) of adults who experienced any oral health
issue (49.8% in women, 54.2% in men) reported that they visited health facility for their
oral health issues.
o Source of care: Among those who visited health facility, 47.1% of adults visited medical
shops, village doctors and other alternative sources and 36.0% visited private chamber
or clinics. Only 11.3% of adults visited only government health facilities and 8.7%
visited private facilities.
Reason for not seeking care for oral health issues
o Main demand side reason: more than half 63.5% of adults reported that they didn’t
think it was required.
o Main supply-side reasons: 37.1% said services were too expensive.

STEPS Bangladesh 2018
197
Introduction
Oral diseases are of the most common noncommunicable diseases affecting 3.6 billion people
worldwide in 2016. Amongst those, the majority of oral diseases (2.4 billion) are caries of the
permanent teeth, followed by periodontal diseases and caries of deciduous teeth 87.
Oral health implies being free of chronic oro-facial pain, oral and pharyngeal cancers, oral
tissue lesions, birth defects such as cleft lip and palate, and other diseases and disorders that
affect the oral, dental and craniofacial tissues88. It is integral and essential to general health
and quality of life and have significant economic implications from both direct treatment costs
and costs incurred due to loss of productivity89.
Most oral diseases and conditions share modifiable risk factors (such as tobacco use, alcohol
consumption and unhealthy diets high in free sugars) common to the other NCDs. Rapidly
increasing levels of oral disease, have been observed in LMICs in parallel with changes in
living conditions and the increasing adoption of unhealthy lifestyles. However, unequal
distribution of oral health professionals, lack of appropriate health facilities, lack of awareness
and socio-economic inequalities in most LMICs means that access to primary oral health
services is often low90,91.
Oral health care systems often focus on disease treatment which require intensive health care
resources and personnel’s that are often in critical shortage in LMICS, while attention on
primary prevention and oral
health promotion is lacking92.
South-East Asia Regional oral
health strategy suggested two
overall targets for 2025: (1) A
25% relative reduction of
premature mortality from oral
87 Global, regional, and national incidence, prevalence, and years lived with disability for 328 diseases and
injuries for 195 countries, 1990–2016: a systematic analysis for the Global Burden of Disease Study 2016. The
Lancet. 2017;390(10100):1211-1259. doi:10.1016/S0140-6736(17)32154-2 88 P.E.Petersen. World Oral Health Report 2003. Geneva: World Health Organization. 89 Listl, S. et al. Global economic impact of dental diseases. J. Dent. Res. 94, 1355–1361 (2015) 90 Hosseinpoor AR, Itani L, Petersen PE. Socio-economic Inequality in Oral Healthcare Coverage: Results from
the World Health Survey. J Dent Res. 2012;91(3):275-281. doi:10.1177/0022034511432341 91 Kandelman D, Arpin S, Baez RJ, Baehni PC, Petersen PE. Oral health care systems in developing and
developed countries: Oral health care systems. Periodontology 2000. 2012;60(1):98-109. doi:10.1111/j.1600-
0757.2011.00427.x 92 Listl, S. et al. Global economic impact of dental diseases. J. Dent. Res. 94, 1355–1361 (2015)
Figure 15. 1 Strategy for oral health in South-East Asia (2013 - 2020)
5 priority action areas:
(1) Integrating oral diseases into prevention and control of NCDs
(2) Addressing oral cancer
(3) Promoting oral health through fluorides
(4) Increasing and diversifying the health workforce
(5) Oral health through school health

STEPS Bangladesh 2018
198
cancer (2) A 25% relative reduction of prevalence of dental caries. It also highlighted 5 priority
action areas (Figure 15. 1) 93.
Bangladesh’s oral health situation/policy:
▪ Bangladesh Essential Health Service Package (ESP)94
This chapter focuses on oral hygiene practices, reported oral health issues and access and
usage of oral health services. This information will help Bangladesh to assess trends and
progress of the national oral health status as well as the evaluation of current policies and
programs in place that are related to oral health.
15.1 Oral hygiene practices
Almost all adults age 18-69 in Bangladesh practice daily or twice a day teeth-cleaning, in
which only 65.2% of adults reported using toothbrush and 56.7% uses toothpaste (Table
15.1). Additionally 22.6% of adults reported using other methods such as tooth powder,
plastic toothpicks or thread and 22.2% reported using charcoal (Table 15.1).
Patterns by background characteristics (Table 15.1)
• Adults who are older, less educated and of the lowest household wealth were less
likely to use toothpaste or toothbrush for cleaning their teeth compared to their
counterparts. While the opposite relationship is seen for use of other materials or
charcoal.
• Residents of Sylhet were least likely to use toothpaste or toothbrush and most likely
to use other materials compared to other divisions.
15.2 Care seeking for oral health issues with dentist
29.0% of adults reported ever visiting a dentist (Table 15.2). Amongst those 45.4% reported
their last visit to be within the past one year and all (98.9%) reported the reason for visit to
be for a consultation/treatment (Table 15.2). It is clear that the utilization of dental services is
primarily for treatment of oral health issues rather than prevention.
93 World Health Organization Regional Office for South-East Asia. Strategy for oral health in South-East Asia, 20-13-202. New Delhi, India: World Health Organization Regional Office for South-East Asia, 2013. 94 Ministry of Health and Family Welfare of Bangladesh. Bangladesh essential health service package (ESP). Dhaka, Bangladesh; 2016.

STEPS Bangladesh 2018
199
Patterns by background characteristics (Table 15.3):
• A higher percentage of adults who were older, and were urban residents with higher
household wealth reported ever visiting a dentist compared to their counterparts (
• Figure 15.2).
•
•
• Percentage of adults who have ever visited a dentist was lowest in Rangpur (16.4%)
and the highest was 37.1% in Barishal (Figure 15. 3).
15.3 Self-reported oral health issues
38.0% of adults aged 18-69 reported pain,
swelling, bleeding or discomfort of the teeth, gum
or mouth in the past 12 months (Table 15.3).
27.2% reported having difficulties with chewing
followed by difficulty in speaking (12.2%) (Table
15.3).
Patterns by background characteristics
(Table 15.3):
• For reported oral health issues including
pain, swelling, bleeding or discomfort of the
teeth, gum or mouth, difficulty chewing,
persistent wound, more adults who are women,
older, and have lower levels of education and
household wealth are more likely to report oral
health issues.
Figure 15.2 Differentials in percent of aged 18-69 who have ever visited a dentist by age, residence and wealth, Bangladesh STEPs Survey 2018
Figure 15. 3 Percentage of adults
aged 18-69 who have ever visited a
dentist by division, Bangladesh
STEPs Survey 2018
19.9 22.428.4 27.3
24.3
33.4 34.9
28.5
38.5
31.7
38.5
0.0
10.0
20.0
30.0
40.0
50.0
Increasing age Rural vs Urban Increasing levels of wealth
37.1%
26.6%
36.4%
32.1%
20.9%28.9%
16.4%
26.9%

STEPS Bangladesh 2018
200
15.4 Sources of care for oral health issues
Amongst adults who reported existing oral health issues, over half (51.7%) stated that they
visited a health facility for it (Table 15.4). Within the types of health facilities visited, the most
common source was medicine shops, village doctors and others (47.1%), followed by private
chambers or clinics (36.0%) while only 11.3% accessed government health facilities only
(Table 15.4).
Patterns by background characteristics (Table 15.4):
• Amongst adults with oral health issues, more adults who are urban residents with
higher levels of household wealth have visited a health facility for oral health issues
compared to their counterparts.
• A higher percentage of urban residents access private health facilities (12.5% vs
7.4%) and private chambers or clinics (45.7% vs 32.7%), while more rural residents
tend to access medicine shops, village doctors and other sources for oral health
issues(51.7% vs 33.5%) (Table 15.4).
• Adults with higher levels of education and wealth were more likely to access
government health facilities, private chambers and clinics, and less likely to access
medicine shops, village doctors and other sources for oral health issues (Figure 15.4
and
• Figure 15.5).
Figure 15.4 Differentials in different sources of care for oral health issues by education amongst adults aged 18-69, Bangladesh STEPs Survey 2018
9.5
32.4
55.7
10.4
35.946.6
12.8
34.439.9
21.4
55.7
14.0
0.0
20.0
40.0
60.0
Govt. health facilities only private chambers or clinic Medicine shops, villagedoctors and others
Per
cen
t
Sources of care
No education
Primary
Secondary
More than secondary

STEPS Bangladesh 2018
201
Figure 15.5 Differentials in different sources of care for oral health issues by education amongst adults aged 18-69, Bangladesh STEPs Survey 2018
• Mymensingh had the highest percentage of adults who accessed government health
facilities (25.6%) for oral health issues and lowest use of private chamber and
clinics(19.2%). While use of medicine shops, village doctors and other sources was
highest in Sylhet (64.7%), followed by Rangpur (57.4%) and Chattogram (57.1%)
(Table 15.4)
15.5 Reasons for not seeking care for oral health issues
The most common reason for not seeking care from the service demand side amongst
adults with existing oral health issues was “Not serious enough to require treatment”
(63.5%); from the service supply side, the most common reasons was “too expensive”
(37.1%) (Table 15.6).
Patterns by background characteristics (Table 15.6):
• Adults who were younger were more likely to report “don’t think it’s required” as their
reason for not seeking care, and less likely to find services “too expensive”, followed
by also more likely to report “don’t know how/where to get treatment”.
• Adults with lower levels of education and household wealth were less likely to state
“don’t think it’s required”, and more likely to find care services “too expensive” and
“health center too far”( Figure 15.6 and Figure 15.7).
• On the service supply side, Sylhet and Chattogram had the highest reporting of care
services being too expensive, 47.7% and 46.9% respectively. Mymensingh and
Rajshahi had the highest reporting of health center being too far, 14.8% and 10.3%
respectively.
10.2
24.3
65.6
8.5
26.6
60.4
15.3
37.145.2
9.8
40.7 41.8
12.9
47.2
28.7
0.010.020.030.040.050.060.070.0
Govt. health facilities only private chambers or clinic Medicine shops, village doctorsand others
Perc
ent
Sources of care
Lowest
Second
Middle
Fourth
Highest

STEPS Bangladesh 2018
202
Figure 15.6 Differentials in reasons for not seeking care amongst adults aged 15-69 with existing oral health issues by education, Bangladesh STEPs Survey 2018
List of Tables:
For more information on oral health, see the following tables:
Table 15.1 Oral hygiene practices: all respondents
Table 15.2 Care seeking for oral health issues through visiting a dentist: all respondents
Table 15.3 Self-reported oral health issues/problems: all respondents
Table 15.4 Care seeking for oral health issues through different health facilities: all
respondents with existing oral health issues
54.8
6.8
48.0
6.2
69.7
5.2
29.0
2.4
71.8
8.7
22.1
0.7
87.2
6.3 9.20.6
0.0
10.0
20.0
30.0
40.0
50.0
60.0
70.0
80.0
90.0
100.0
Don't think it's required Don't know how/where toget treatment
Too expensive Health centre too far
Service demand Service supply
Perc
ent
Increasing level of education
Figure 15.7 Differentials in reasons for not seeking care amongst adults aged 15-69 with existing oral health issues by wealth, Bangladesh STEPs Survey 2018
44.7
15.0
54.9
9.3
61.6
6.2
46.3
5.4
67.5
2.9
32.1
3.4
71.1
2.9
27.5
0.6
83.0
3.510.7
0.20.0
10.020.030.040.050.060.070.080.090.0
Don't think it's required Don't know how /where toget treatment
Too expensive Health centre too far
Service demand Service supply
Perc
ent
Increasing level of wealth

STEPS Bangladesh 2018
203
Table 15.5 Reason for not seeking care for oral health issues: respondents with existing oral
health issues

STEPS Bangladesh 2018
204
Table 15.1 Oral hygiene practices: all respondents
Percent distribution of respondents age 18-69 years with different oral hygiene practices, by background characteristics, [Bangladesh, 2018] Background characteristic Cleaning of teeth Number of
respondents (N) Percent of respondents using different cleaning materials on usual basis among those who
cleaned their teeth
Daily1 Non-daily2
Never Toothpaste Toothbrush Wooden toothpicks3
Charcoal Chewstick/ Miswak/ Dattiwan
Others4 Number of respondents (N)
Age
18-24 100.0 0.0 0.0 1026
74.5 82.6 2.1 17.3 9.3 15.9 1025 25-39 99.4 0.3 0.2 3489
62.2 73.1 4.1 18.2 14.0 22.2 3483
40-54 98.8 0.9 0.3 2503
45.1 52.0 7.8 27.3 19.4 26.5 2499 55-69 98.0 1.2 0.9 1167
31.3 36.9 7.5 32.7 24.3 28.5 1157
Sex
Women 99.8 0.2 0.0 4381
52.3 61.9 3.5 26.3 9.1 22.3 4378 Men 98.6 0.8 0.6 3804
61.2 68.7 6.3 17.9 22.4 22.9 3786
Residence
Rural 99.2 0.5 0.3 4183
51.5 60.8 5.0 24.3 17.0 24.4 4172 Urban 99.3 0.5 0.2 4002
74.5 80.5 4.5 14.7 11.1 16.4 3992
Division
Barishal 99.9 0.1 0.0 986
54.2 59.9 0.6 33.0 17.8 15.6 986 Chattogram 98.2 1.0 0.8 1053
50.3 52.8 1.4 35.4 2.4 15.7 1044
Dhaka Rural 99.3 0.5 0.2 997
69.5 75.0 4.1 15.9 14.8 25.6 995 Khulna 99.8 0.2 0.0 1040
56.1 76.1 3.3 10.8 16.3 6.8 1039
Mymensingh 99.6 0.3 0.0 1021
43.2 53.7 4.0 33.4 16.4 27.1 1019 Rajshahi 98.6 0.9 0.5 1066
64.0 74.2 12.3 10.3 34.2 24.0 1061
Rangpur 99.9 0.1 0.1 1009
56.1 71.1 5.8 23.6 24.9 24.1 1007 Sylhet 99.9 0.1 0.0 1013
35.2 41.2 10.2 22.1 5.2 55.3 1013
Education
No education 98.6 0.9 0.5 3678
35.0 44.4 5.4 33.1 18.2 28.1 3662 Primary 99.6 0.2 0.2 2533
63.6 73.6 4.0 18.4 13.5 22.1 2530
Secondary 99.8 0.2 0.0 888
82.0 87.9 3.4 11.0 11.3 12.5 887 More than secondary 99.6 0.3 0.2 1065
90.4 95.3 6.2 4.7 16.4 14.0 1064
Wealth quintile
Lowest 99.0 0.7 0.2 1639
33.3 46.4 4.2 33.1 22.4 27.6 1635 Second 98.9 0.5 0.6 1670
43.9 55.2 4.8 30.2 14.3 25.2 1663
Middle 99.1 0.4 0.6 1451
56.0 66.0 4.6 19.9 17.3 25.3 1444 Fourth 99.3 0.7 0.0 1506
66.8 71.8 6.3 17.1 13.9 20.4 1505
Highest 99.7 0.2 0.1 1919
83.5 86.9 4.5 10.5 10.3 14.3 1917 Total (18-69) 99.2 0.5 0.3 8185
56.7 65.2 4.9 22.2 15.6 22.6 8164
1 Once, or more than once a day; 2 Once/2-3 times a month or Once/2-6 times a week; 3 Neem stick; 4 Plastic toothpicks /Thread (Dental floss) / tooth powder

STEPS Bangladesh 2018
205
Table 15.2 Care seeking for oral health issues through visiting a dentist: all respondents
Percent distribution of respondents age 18-69 who ever visited a dentist, timing of and reasons for last visit, by background characteristics, [Bangladesh, 2018]
Background characteristic
Ever visited a dentist
Number of respondents (n)
Timing of most recent visit among those ever visited (year)
Reason for most recent visit among those ever visited
Number of respondents (n)
<1 1–5 >5 consultation/ treatment
preventative
Age
18-24 19.9 1026 55.1 30.4 14.6
99.0 1.0 223 25-39 28.4 3489 45.1 35.2 19.7
99.1 0.9 1039
40-54 33.4 2503 42.8 35.7 21.6
99.5 0.5 856 55-69 38.5 1167 41.3 27.5 31.3
98.1 1.9 423
Sex
Women 29.1 4381 46.6 30.3 23.1
98.1 1.9 1375 Men 29.0 3804 44.1 35.4 20.5
99.8 0.2 1166
Residence
Rural 27.3 4183 43.9 34.3 21.8
99.2 0.8 1174 Urban 34.9 4002 49.3 28.8 21.9
98.2 1.8 1367
Division
Barishal 37.1 986 42.0 37.5 20.5
99.7 0.3 361 Chattogram 26.6 1053 50.2 30.2 19.6
95.9 4.1 285
Dhaka Rural 36.4 997 46.2 29.9 23.9
99.5 0.5 371 Khulna 32.1 1040 53.7 22.6 23.7
99.9 0.1 348
Mymensingh 20.9 1021 36.1 42.2 21.7
99.8 0.2 246 Rajshahi 28.9 1066 34.2 44.1 21.7
99.5 0.5 379
Rangpur 16.4 1009 46.2 39.4 14.4
99.6 0.4 212 Sylhet 26.9 1013 45.3 31.7 23.0
99.6 0.4 339
Education
No education 27.2 3678 47.5 29.8 22.7
99.0 1.0 998 Primary 31.2 2533 45.1 33.2 21.7
99.2 0.8 822
Secondary 29.0 888 43.2 30.2 26.6
98.4 1.6 306 More than secondary 30.5 1065 41.5 43.5 15.0
98.5 1.5 410
Wealth quintile
Lowest 22.4 1639 50.3 28.9 20.8
99.5 0.5 343 Second 24.3 1670 45.3 31.7 23.0
100.0 0.0 425
Middle 28.5 1451 42.8 32.6 24.6
99.3 0.7 431 Fourth 31.7 1506 43.6 34.6 21.7
97.7 2.3 509
Highest 38.5 1919 45.8 34.4 19.7
98.7 1.3 833 Total (18-69) 29.0 8185 45.4 32.8 21.8 98.9 1.1 2541

STEPS Bangladesh 2018
206
Table 15.3 Self-reported oral health issues/problems: all respondents
Percent distribution of respondents age 18-69 who reported experiencing different oral health problems in the past 12 months, by background characteristics, [Bangladesh, 2018] Background characteristic
Oral health issues Number of respondents (N)
Pain, swelling, bleeding or discomfort of the teeth, gums or mouth
Difficulty in chewing
Difficulty in speaking
Persistent wound
Patch in mouth
Days not at work due to teeth/ mouth
Reduced participation in social activities
Age
18-24 29.6 19.7 10.5 6.1 5.0 2.3 2.9 1026 25-39 36.2 24.8 10.4 7.7 5.2 2.6 2.4 3489 40-54 44.1 33.9 17.0 10.8 7.8 4.9 4.5 2503 55-69 46.9 35.8 19.2 9.2 4.2 4.9 3.2 1167 Sex
Women 40.5 31.9 16.7 9.6 5.4 2.9 2.5 4381 Men 35.3 22.4 9.5 6.6 5.6 3.9 3.6 3804
Residence
Rural 37.6 26.9 13.6 8.2 5.2 3.5 3.1 4183 Urban 39.1 28.0 11.6 8.1 6.6 3.0 2.9 4002
Division
Barishal 41.5 30.7 11.6 13.5 6.0 3.1 1.4 986 Chattogram 40.5 31.7 18.3 9.8 5.1 3.7 4.6 1053 Dhaka Rural 39.2 27.6 12.2 9.8 5.7 2.9 2.2 997 Khulna 33.6 24.1 13.2 4.8 2.9 3.2 2.2 1040 Mymensingh 40.2 24.4 15.1 7.3 4.1 5.8 12.0 1021 Rajshahi 37.2 25.8 8.1 3.8 7.0 2.1 0.6 1066 Rangpur 31.5 21.7 8.2 7.2 5.8 1.6 0.5 1009 Sylhet 38.2 28.7 16.7 9.6 8.6 6.4 1.9 1013
Education
No education 42.2 31.6 16.7 9.6 6.5 4.8 3.8 3678 Primary 37.3 27.0 11.8 7.9 4.3 2.9 2.5 2533 Secondary 33.8 21.4 9.6 6.3 6.6 1.9 2.9 888 More than secondary 28.9 18.1 7.5 5.9 3.9 1.0 2.0 1065
Wealth quintile
Lowest 40.1 28.0 13.7 6.9 5.3 3.6 3.8 1639 Second 37.7 28.2 14.9 8.8 7.2 4.4 4.6 1670 Middle 34.5 25.1 13.6 7.8 4.8 3.3 2.3 1451 Fourth 38.2 28.9 13.6 8.5 4.3 3.1 2.4 1506 Highest 39.3 25.7 9.9 8.9 6.1 2.4 2.3 1919
Total (18-69) 38.0 27.2 13.2 8.2 5.5 3.4 3.1 8185

STEPS Bangladesh 2018
207
Table 15.4 Care seeking for oral health issues through different health facilities: all respondents with existing oral health issues
Percent distribution of respondents age 18-69 who reported seeking care from different types of health facilities amongst those with reported existing oral health issues, by background characteristics, [Bangladesh, 2018] Background characteristic
Visited health facility for existing oral health issues
Number of respondents (N)
Source of care for oral health issues1 n Govt. health facilities only
Private health facilities only
Both govt. & private health facilities
Private Chamber/ clinic
Medicine shops, village doctors and others2
Age
18-24 51.4 249
7.9 4.4 0.0 38.2 50.4 123 25-39 53.0 1025
12.8 13.0 0.0 34.7 44.8 539
40-54 49.3 886
15.0 7.4 0.8 35.6 44.5 440 55-69 52.2 467
7.7 6.0 0.5 36.9 51.0 225
Sex
Women 49.8 1543
9.3 8.3 0.0 36.9 47.7 760 Men 54.2 1084
13.9 9.2 0.6 35.0 46.3 567
Residence
Rural 50.0 1372
11.3 7.4 0.3 32.7 51.7 637 Urban 57.2 1255
11.4 12.5 0.3 45.7 33.5 690
Division
Barishal 39.0 339
14.2 2.1 0.0 47.2 41.2 147 Chattogram 47.8 371
10.6 11.7 0.0 21.7 57.1 179
Dhaka Rural 64.0 326
13.1 12.6 0.9 48.6 27.8 204 Khulna 51.8 264
8.3 6.8 0.0 42.7 50.2 138
Mymensingh 31.5 376
25.6 4.6 0.0 19.2 49.2 139 Rajshahi 55.6 323
8.3 5.1 0.0 37.1 58.6 172
Rangpur 50.8 259
7.1 3.9 0.0 31.6 57.4 140 Sylhet 54.6 369
5.7 4.7 0.0 27.2 64.7 208
Education
No education 48.6 1349
9.5 5.4 0.0 32.4 55.7 602 Primary 55.5 781
10.4 10.8 0.9 35.9 46.6 442
Secondary 51.7 233
12.8 16.4 0.0 34.4 39.9 124 More than
secondary 56.7 254
21.4 10.0 0.0 55.7 14.0 155
Wealth quintile
Lowest 44.6 565
10.2 2.9 0.0 24.3 65.6 219 Second 44.3 577
8.5 5.0 0.6 26.6 60.4 256
Middle 51.0 425
15.3 9.8 0.0 37.1 45.2 222 Fourth 56.6 483
9.8 9.1 0.3 40.7 41.8 263
Highest 63.0 577
12.9 14.9 0.5 47.2 28.7 367 Total (18-69) 51.7 2627
11.3 8.7 0.3 36.0 47.1 1327
1 This is a multiple choice questions, statistics for "private chamber/clinics" and "medicine shops, village doctors and others" are non-exclusive to other categories. 2Other includes alternative medicines, ayurvedic/homeopathic/Unani providers and traditional healers and others.

STEPS Bangladesh 2018
208
Table 15.5 Reason for not seeking care for oral health issues: respondents with existing oral health issues
Percent distribution of respondents age 18-69 that gave different reasons for not seeking care for existing oral health issues, by background characteristics, [Bangladesh, 2018] Background characteristic
Service demand
Service supply Number of respondents (n)
Don't think it's required
Don't know how /where to get treatment
Didn't have time
Fear of procedure
Family member did not allow
Too expensive
Health centre too far
Poor service
Age
18-24 74.9 9.2 1.3 5.0 0.8
19.9 0.4 0.0 126 25-39 64.8 7.9 7.9 1.0 1.3
35.7 3.4 0.4 486
40-54 57.8 5.3 4.8 2.2 0.5
46.4 4.9 0.5 446 55-69 57.8 4.0 3.2 2.6 0.4
44.0 8.9 2.0 242
Sex
Women 56.6 8.5 2.1 3.2 1.0
45.9 6.8 1.0 783 Men 73.9 4.0 9.2 1.1 0.5
23.9 0.5 0.2 517
Residence
Rural 62.1 7.4 5.1 1.9 0.7
39.9 5.1 0.7 735 Urban 69.1 4.0 4.3 4.2 1.3
26.1 1.0 0.6 565
Division
Barishal 65.4 6.4 7.6 4.0 0.7
44.1 0.5 0.0 192 Chattogram 61.8 2.7 7.3 3.8 0.5
46.9 2.5 2.4 192
Dhaka 66.0 2.3 3.0 1.7 1.0
24.1 0.0 0.4 122 Khulna 73.6 0.9 2.5 0.8 1.9
29.0 1.1 0.0 126
Mymensingh 57.9 33.9 4.8 1.9 0.4
41.2 14.8 0.1 237 Rajshahi 72.6 0.7 0.7 1.2 0.8
24.7 10.3 0.0 151
Rangpur 50.1 0.8 3.9 2.3 0.0
40.4 1.9 0.0 119 Sylhet 58.4 3.5 10.3 2.3 2.0
47.7 3.6 0.1 161
Education
No education 54.8 6.8 4.1 3.3 0.4
48.0 6.2 0.9 747 Primary 69.7 5.2 4.9 0.6 1.9
29.0 2.4 0.0 339
Secondary 71.8 8.7 6.2 2.8 0.4
22.1 0.7 1.5 109 More than
secondary 87.2 6.3 9.1 1.7 0.0
9.2 0.6 1.0 99
Wealth quintile
Lowest 44.7 15.0 2.7 3.1 0.7
54.9 9.3 0.0 346 Second 61.6 6.2 3.9 0.9 0.6
46.3 5.4 1.4 321
Middle 67.5 2.9 8.7 3.9 1.1
32.1 3.4 0.7 203 Fourth 71.1 2.9 5.1 2.0 1.5
27.5 0.6 1.1 220
Highest 83.0 3.5 5.7 2.3 0.0
10.7 0.2 0.2 210
Total (18-69) 63.5 6.7 4.9 2.4 0.8
37.1 4.3 0.7 1300
* interpret with caution due to small sample size

STEPS Bangladesh 2018
209
Chapter 16 Policy Recommendations
This second nationally representative survey provides essential information on key indicators
of NCD risk factors and creates an opportunity for policy makers, program managers,
academicians, development partners and researchers to adopt necessary interventions to
combat the burden of NCDs in Bangladesh. Inadequate intake of fruit and vegetables, use of
tobacco, low physical activity, obesity (especially central), high blood pressure, diabetes
mellitus, extra salt intake, dyslipidemia and binge drinking among drinkers are identified risk
factors for NCDs in Bangladeshi adults. Majority (70.9%) has at least one risk factor and
substantial proportion of people have two or more risk factors. Based on these findings, the
specific recommendations are:
1. To build mass awareness on the risk factors of NCDs, multidimensional and
multilateral collaborative health education interventions are warranted through mass
media, campaigns and school curricula.
2. To raise awareness of the people on non-communicable diseases, comprehensive
population-based approach using community-oriented health care system for NCD
prevention is essential to in Bangladesh
3. Effective strategies to promote accessibility and availability of fruits and vegetables
round the year for all people should be devised and implemented.
4. To promote empowering environment for physical activity in both urban and rural
settings, appropriate measures should be undertaken, with emphasis on physical
activity, leisure time physical activity in particular,
5. For early detection and treatment of hypertension or high blood pressure, initiatives
and health programs for periodic checkup of blood pressure should be launched
throughout the country.
6. To reduce the prevalence of diabetes mellitus, early diagnosis and prompt treatment
through primary health care system should be established throughout the country.
7. To establish national database on NCD risk factors, digital NCD surveillance system
must be developed under the leadership of relevant public health institute.
8. To reduce tobacco consumption behavior of the people, adequate enforcement of the
Act is necessary. Necessary amendment of the Act is also required to match with the
provisions of WHO Framework Convention on Tobacco Control and close all the loop
holes in the tobacco control program.
9. To prevent obesity and dyslipidemia, relevant health information communication and
health education interventions are indispensable to implement throughout the country
with special emphasis on the urban people.

STEPS Bangladesh 2018
210
10. Diseases specific screening programs also should be launched for early detection
NCDs like cervical cancer among the females.
11. To improve oral health status of the people, awareness building interventions on dental
care, oral hygiene and healthcare utilization should be commenced in the country with
special emphasis on the rural people.
12. To reduce the risk of NCDs, drug abuse, alcohol addiction, special measures and
interventions focused on lifestyle modification and behavior change communication
are necessary to be portrayed in the country.

211
Annexure A
Annexure B
Map of Bangladesh showing study sites of STEPS Bangladesh 2018

212
Questionnaire (English)

213

214

215

216

217

218

219

220

221

222

223

224

225
226

227

228

229
230
231

232

233
234

235

236

237

238
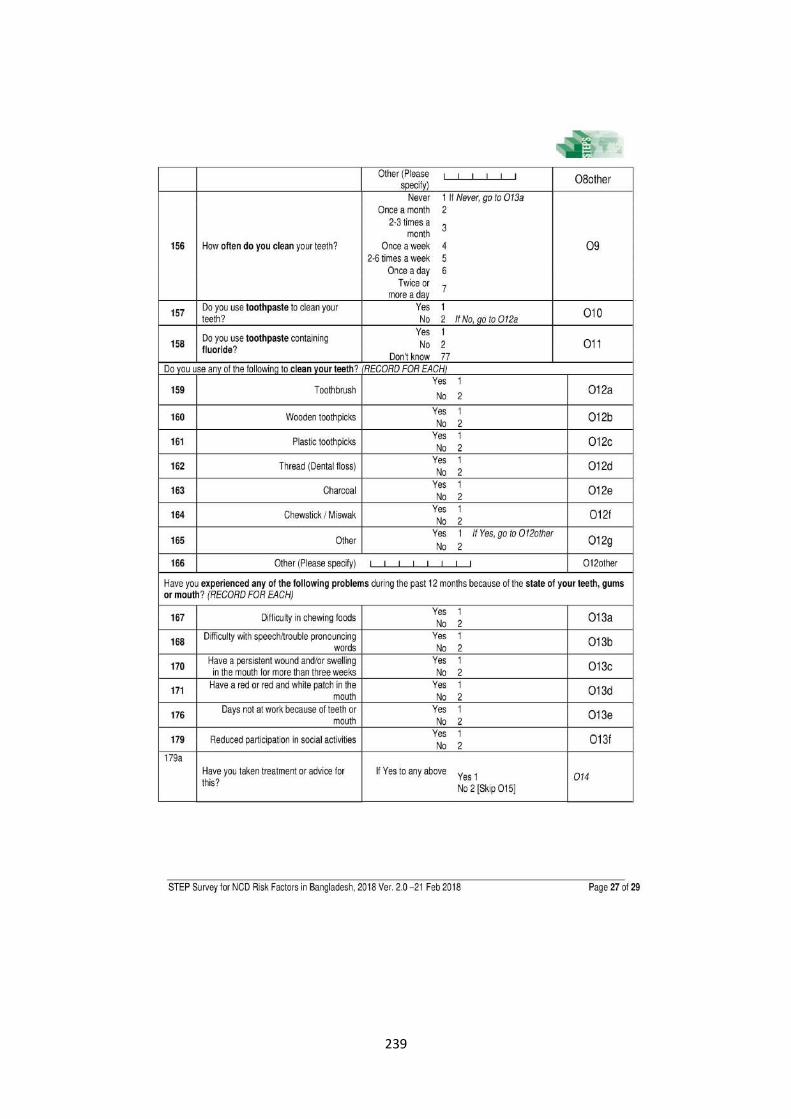
239

240

241

242
Annexure C
Questionnaire (Bangla)

243

244

245

246

247

248

249

250

251
252

253

254

255

256

257

258

259

260

261
262

263

264

265

266

267
268

269

270

271

272

273

274

275

276

277

278

279

280

281

282

283
Annexure D
Template of Report on blood glucose and lipid levels (STEP 3)

284
Annexure E
Show cards
Photo credit: Dr. Irfan Nowroze Noor
Photo credit: Dr. Irfan Nowroze Noor

285
Photo credit: Dr. Irfan Nowroze Noor
Photo credit: Dr. Irfan Nowroze Noor

286
Photo credit: Dr. Irfan Nowroze Noor
Photo credit: Dr. Irfan Nowroze Noor

287
Photo credit: Dr. Irfan Nowroze Noor and open source [internet]
Photo credit: Dr. Irfan Nowroze Noor
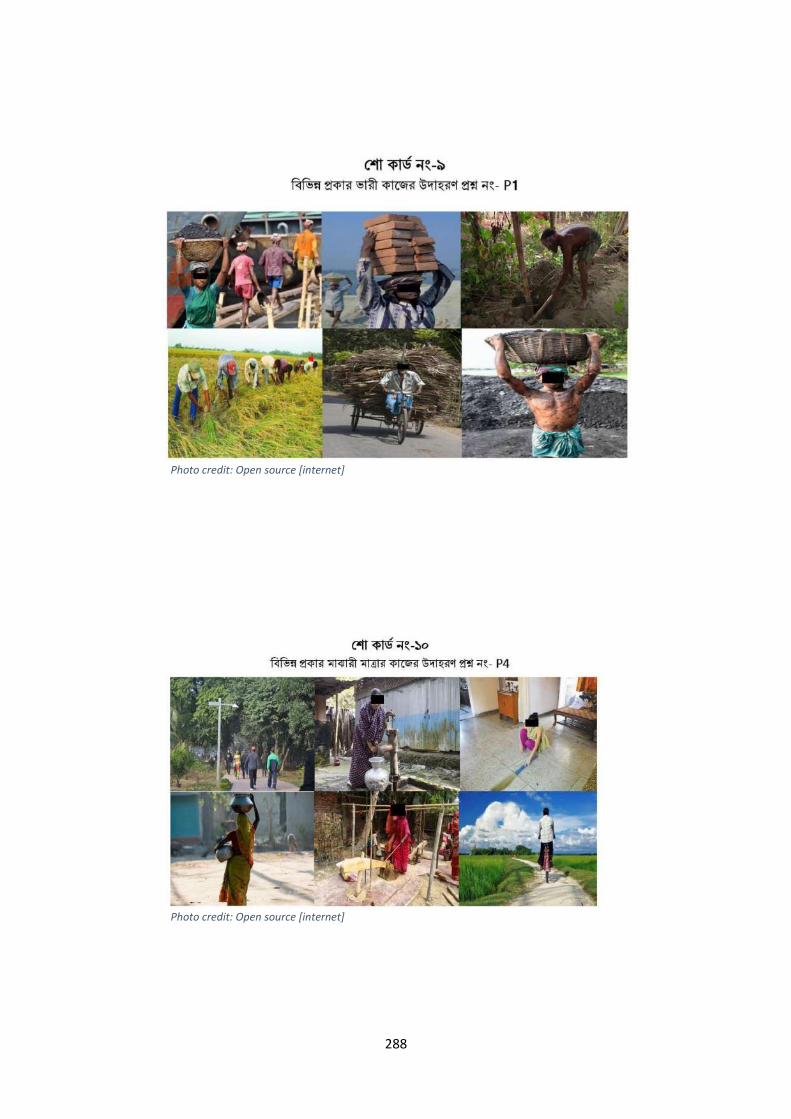
288
Photo credit: Open source [internet]
Photo credit: Open source [internet]

289
Photo credit: Open source [internet]
Photo credit: Open source [internet]

290
Photo credit: Dr. Irfan Nowroze Noor and open source [internet]
Photo credit: Dr. Irfan Nowroze Noor and open source [internet]

291
Photo credit: Dr. Irfan Nowroze Noor and open source [internet]
Photo credit: Dr. Irfan Nowroze Noor and open source [internet]

292
Photo credit: Open source [internet]
Photo credit: Open source [internet]

293
Photo credit: Open source [internet]
Photo credit: Open source [internet]

294
Photo credit: Open source [internet]