nokia generation
TRANSCRIPT
THE USE OF MOBILE PHONES BY GENERATION Y
STUDENTS AT TWO UNIVERSITIES IN THE CITY OF
JOHANNESBURG
by
ELENI KOUTRAS
submitted in fulfilment of the requirements for the degree of
MASTER OF COMMERCE
in the subject
BUSINESS MANAGEMENT
at the
UNIVERSITY OF SOUTH AFRICA
SUPERVISOR: PROF JW STRYDOM
JOINT SUPERVISOR: PROF A BRINK
JUNE 2006
Student Number: 35310030
I declare that “ The use of mobile phones by Generation Y students at two universities
in the city of Johannesburg” is my own work and that all the sources that I have used
or quoted have been indicated and acknowledged by means of complete references.
………………………. ……………………… Signature Date
Eleni Koutras
ii
ACKNOWLEDGMENTS
I would like to thank the following people for their various contributions to this
masters’ dissertation:
• My supervisors, Professor Johan Wilhem Strydom and Annekie Brink, for their
constant advice, assistance and guidance throughout the study
• Professor Deon Tustin of the BMR, for his valuable insights into the research
results and the statistics associated with them
• The Bureau of Market Research (BMR) at UNISA for their help with the
statistical analysis
• All the Generation Y respondents who participated in the study, for their valuable
contribution and the time they gave so willingly
• Alexa Barnby, for her professional editing of the manuscript
• My family and friends, for their patience and support during this study
iii
SUMMARY
THE USE OF MOBILE PHONES BY GENERATION Y STUDENTS AT TWO
UNIVERSITIES IN THE CITY OF JOHANNESBURG
The main purpose of this study was to examine the use of mobile phones by
Generation Y students in the city of Johannesburg in order to increase understanding
of this segment’s consumer behaviour. Generation Y is an important market segment
in that it is making more independent purchase-related decisions and has a large
amount of disposable income. The primary data for this study is based on focus group
interviews and a quantitative study of a sample of 200 Generation Y tertiary students.
Some of the findings are as follows:
• Generation Y’s use of mobile phones: Generation Y respondents have owned a
mobile phone for between three to five years; the majority own Nokia mobile
phones, are on prepaid packages and are not big spenders on airtime; furthermore,
SMS is seen as the most cost-effective way to communicate.
• Competition in the mobile phone market: The perceptions of this segment are that
Vodacom is the “cool” operator, MTN is the most “expensive” network operator
and Cell C is “cheap and youthful”.
• Mobile phone brand awareness: Nokia was the most cited brand of mobile phone
and was found to be the first choice of many of the respondents. Samsung was
reported as the second most cited brand with Motorola, Siemens and Sony
Ericsson following.
The results have implications for network providers, handset manufacturers and
marketers alike as they will ultimately improve these stakeholder’s chances of
marketing effectively to this dynamic youth market.
iv
KEY TERMS Generation Y; consumer behaviour; mobile phones; marketing; university students;
young people; mobile phone usage
v
TABLE OF CONTENTS
Page
CHAPTER 1: BACKGROUND TO THE STUDY……………………………...1 1.1 INTRODUCTION 1 1.2 BACKGROUND 3 1.2.1 A brief overview of the mobile phone industry in South Africa 3 1.2.2 Preliminary literature review 8 1.3 PROBLEM DEFINITION 10 1.4 OBJECTIVES OF THE STUDY 10 1.4.1 Main objective 10 1.4.2 Secondary objectives 11 1.5 LIMITATIONS OF THE STUDY 11 1.6 RESEARCH METHODOLOGY 12 1.7 CHAPTER LAYOUT 13
CHAPTER 2: THE SOUTH AFRICAN MOBILE PHONE BUSINESS ENVIRONMENT………………………………………………………………….14 2.1 INTRODUCTION 14 2.2 THE BUSINESS ENVIRONMENT 14 2.3 MICRO ENVIRONMENT 16 2.3.1 South Africa’s mobile network operators 17 2.3.1.1 Growth of mobile phone penetration 17 2.3.1.2 Profitability of the South African mobile network operators 18 2.3.1.3 Benchmarking 19 2.3.1.4 Market share 21 2.3.1.5 Market strategies 22 2.3.2 Vodacom Mobile Network Operator 24 2.3.2.1 Vodacom’s market share 24 2.3.2.2 Vodacom’s ownership structure 26 2.3.2.3 Vodacom’s products and services 27 2.3.2.4 Mobile applications 34 2.3.2.5 Vodacom’s network 36 2.3.2.6 Vodacom’s market Strategy 38 2.3.3 MTN Mobile Network Operator 39 2.3.3.1 MTN’s market share 40 2.3.3.2 MTN’s ownership structure 40 2.3.3.3 MTN’s products and services 42 2.3.3.4 MTN’s market strategy 44
vi
2.3.4 Cell C Network Provider 46 2.3.4.1 Cell C’s market share 47 2.3.4.2 Cell C’s ownership structure 48 2.3.4.3 Cell C’s products and services 49 2.3.4.4 Cell C’s market strategy 51 2.3.5 SWOT analysis of mobile network operators 53 2.4 MARKET ENVIRONMENT 57 2.4.1 Market and consumers 57 2.4.1.1 South African population 58 2.4.1.2 Disposable income of South African consumers 59 2.4.1.3 Life stages and life planes of South African consumers 61 2.4.1.4 Unemployment 63 2.4.1.5 Fixed-line phone and mobile phone ownership 65 2.4.2 Intermediaries 67 2.4.3 Suppliers 69 2.4.3.1 Telecommunications equipment vendors 69 2.4.4 Competitors 72 2.4.4.1 Porter’s 5 forces model 72 2.4.4.1.1 Threat of new entrants 74 2.4.4.1.2 Threat of new substitutes 75 2.4.4.1.3 Bargaining power of buyers and suppliers 76 2.4.4.1.4 Degree of rivalry amongst existing competitors 77 2.4.5 Opportunities and threats 78 2.5 MACRO-ENVIRONMENT 79 2.5.1 Technological environment 80 2.5.1.1 Convergence between broadcasting and telecommunications 82 2.5.1.2 Convergence between fixed and wireless networks 82 2.5.1.3 Convergence between voice and data 84 2.5.2 Economic environment 86 2.5.2.1 GDP growth 86 2.5.2.2 Inflation rates 90 2.5.3 Social environment 92 2.5.3.1 Changing role of women 92 2.5.3.2 Impact of mobile phone industry on social environment 93 2.5.4 Physical environment 95 2.5.5 Institutional-Political environment 95 2.5.6 International Environment 98 2.5.6.1 The international economy 98 2.5.6.1.1 The international economy key variables and projections 99 2.5.6.1.2 Exchange rates 101 2.5.6.2 Global regulation bodies 101 2.6 FUTURE TRENDS OF THE SOUTH AFRICAN MOBILE MARKET 103 2.7 CONCLUSION 105
vii
CHAPTER 3: THE CONSUMER BEHAVIOUR AND MOBILE PHONE USAGE OF GENERATION Y STUDENTS IN THE CITY OF JOHANNESBURG…………………………………………………...……………106 3.1 INTRODUCTION 106 3.2 THE GENERATION Y CONSUMER 106 3.2.1 Generation Y and attitudes towards branding 107 3.2.2 Generation Y and coming of age technology 108 3.2.3 Generation Y and disposable income 108 3.2.4 Generation Y and mobile phone usage 110 3.2.5 Mobile phone usage in South Africa 112 3.3 CONSUMER BEHAVIOUR OF GENERATION Y CONSUMERS 114 3.4 DETERMINANTS INFLUENCING CONSUMER BEHAVIOUR 115 3.4.1 External influences 116 3.4.1.1 Family 117 3.4.1.1.1 Family role behaviour 117 3.4.1.2 Reference groups 119 3.4.1.2.1 Types of reference groups 119 3.4.1.3 Opinion leader 121 3.4.1.4 Culture groups 121 3.4.1.5 Sub-culture 122 3.4.1.5.1 Age-based sub-culture 122 3.4.1.6 Social class 125 3.4.2 Internal influences 126 3.4.2.1 Motivation 126 3.4.2.2 Consumer attitudes 129 3.4.2.2.1 Attitudes and the mobile phone 131 3.4.2.3 Consumer perceptions 132 3.4.2.4 Learning ability 137 3.4.2.5 Personality traits 138 3.4.2.5.1 Psychoanalytic theory 139 3.4.2.5.2 Socio-Psychological theory 139 3.4.2.5.3 Trait-Factor theory 139 3.4.2.6 Lifestyle 140 3.4.2.6.1 Impact of mobile phones on lifestyle 140 3.4.3 Personal characteristics 141 3.4.3.1 Race 141 3.4.3.2 Gender 142 3.4.3.3 Age 142 3.5 THE CONSUMER DECISION-MAKING PROCESS 143 3.5.1 Step 1: Need recognition 144 3.5.2 Step 2: Search for information 145 3.5.3 Step 3: Evaluation of alternatives 147 3.5.4 Step 4: Purchase decision 149 3.4.5 Step 5: Post-purchase behaviour 149 3.6 ADOPTION OF MOBILE PHONES 150 3.7 CONCLUSION 155
viii
CHAPTER 4: RESEARCH METHODOLOGY………………………………...156 4.1 INTRODUCTION 156 4.2 THE MARKETING RESEARCH PROCESS 156 4.2.1 STEP 1: Problem definition 157 4.2.2 STEP 2: Development of an approach to the research problem 158 4.2.3 STEP 3: Research design formulation 159 4.2.3.1 Secondary data analysis 159 4.2.3.2 Qualitative research 160 4.2.3.3 Methods of collecting quantitative data 162 4.2.3.4 Measurement and scaling procedures 162 4.2.3.5 Questionnaire design 164 4.2.3.5.1 Questionnaire layout 165 4.2.3.5.2 Wording consistency and appropriate type of questions 166 4.2.3.5.3 Pilot testing of questionnaire 166 4.2.3.6 Sampling process and sample size 166 4.2.4 STEP 4: Fieldwork/data collection 168 4.2.5 STEP 5: Data preparation and analysis 170 4.2.5.1 Microsoft Excel 170 4.2.5.2 SPSS 170 4.2.6 STEP 6: Report preparation and presentation 171 4.3 CONCLUSION 171 CHAPTER 5: RESEARCH RESULTS…………………………………………..172 5.1 INTRODUCTION 172 5.2 DESCRIPTIVE STATISTICS AND RESULTS ON A QUESTION-BY-
QUESTION BASIS 173 5.2.1 Screening questions 173 5.2.2 Section A: Demographic information 176 5.2.3 Section B: Mobile phone ownership 181 5.2.4 Section C: Mobile phone usage patterns 195 5.2.5 Section D: Attitudes towards mobile phones 201 5.3 CROSS TABULATIONS 209 5.3.1 Age versus number of years of owning a mobile phone 209 5.3.2 Age versus mobile calling plan 209 5.3.3 Gender versus mobile calling plan 210 5.3.4 Age versus pocket money received 210 5.3.5 Age versus average monthly mobile phone bill 211 5.3.6 Age versus person responsible for monthly mobile phone bill 212 5.3.7 Gender versus person responsible for monthly mobile phone bill 213 5.3.8 Average monthly mobile phone bill versus person responsible for
mobile phone bill 213 5.3.9 Employment status versus person responsible for monthly mobile phone bill 214 5.3.10 Pocket money received versus person responsible for monthly mobile
phone bill 215 5.3.11 Age versus number of mobile phone calls made and received per day 215 5.3.12 Age versus average length of mobile phone call 216
ix
5.3.13 Gender versus average length of mobile phone call 217 5.3.14 Age versus number of SMS messages sent per day 218 5.3.15 Gender versus number of SMS messages sent per day 218 5.3.16 Gender versus person contacted most regularly on mobile phone 219 5.3.17 Mobile phone brand awareness versus brand of mobile phone owned 219 5.3.18 Brand of mobile Phone owned versus brand loyalty 220 5.3.19 Brand of mobile phone owned versus reason for choosing particular brand
of mobile phone 221 5.3.20 Brand of mobile phone owned versus the mobile phone as a fashion
Statement 222
5.4 FACTOR ANALYSIS 223 5.4.1 Construction of the correlation matrix 224 5.4.2 Determining the method of factor analysis 225 5.4.3 Determining the number of factors 226 5.4.3.1 Determination based on eigenvalues 226 5.4.3.2 Determination based on the percentage of variance 227 5.4.3.3 Determination based on scree plot 227 5.4.4 Reliability testing 229 5.5 CONCLUSION 230 CHAPTER 6: CONCLUSIONS AND RECOMMENDATIONS………………231 6.1 INTRODUCTION 231 6.2 TESTING FOR THE RESEARCH OBJECTIVES 231 6.2.1 Primary research objective 231 6.2.1.1 Generation Y mobile phone usage 232 6.2.2 Secondary research objectives 233 6.2.3 Recommendations to network providers 235 6.2.4 Recommendations to handset manufacturers 238 6.3 AREAS FOR FUTURE STUDY 240
6.4 CONCLUSION 241 BIBLIOGRAPHY…………………………………………………………………243 APPENDIX A……………………………………………………………………... 253
x
LIST OF TABLES Table 1.1 South African mobile phone market as at the end of June 2004… ……… 4 Table 2.1 Mobile network operators growth revenue……………………………. 18 Table 2.2 Mobile penetration rates in Africa for 2004…………………………….. 20 Table 2.3 Comparative national ICT indicators for 2005………………………….. 21 Table 2.4 Vodacom’s prepaid packages……………………………………………. 29 Table 2.5 Summary of Vodacom’s contract packages.…..………………………… 30 Table 2.6 Vodacom tariffs: prepaid versus contract……………………………….. 32 Table 2.7 MTN’s prepaid packages………………………………………………… 42 Table 2.8 MTN’s contract tariff structures………………………………………... 43 Table 2.9 Cell C: A short history with significant growth………………………… 46 Table 2.10 Cell C’s prepaid tariffs…………………………………………………... 49 Table 2.11 Cell C’s youth brand: CY……………………………………………….. 50 Table 2.12 Cell C contract packages………………………………………………… 50 Table 2.13 Cell C contract tariffs…………………………………………………… 51 Table 2.14 SWOT analysis for Vodacom, MTN and Cell C………………………… 54 Table 2.15 South Africa: Summary of the three mobile network operators
(Vodacom, MTN and Cell C)……………………………………………..56 Table 2.16 South Africa’s population by province, population group and gender…. 58 Table 2.17 South Africa’s population by province (2005)…………………………… 59 Table 2.18 Life stages of South African households………………………………... 61 Table 2.19 Life planes of South African consumers ………………………………… 61 Table 2.20 South African annual household expenditure by life plane and
stage (in R’000)…………………………………………………………. 62 Table 2.21 South Africa’s unemployment figures for 2004 64 Table 2.22 Summary of indicators regarding unemployment among youth
in South Africa………………... …………………………………………. 65 Table 2.23 South African households by whether they have a telephone in the
dwelling or regular use of a mobile phone, and population group and gender of the household head…………………………………………… 66
Table 2.24 Top 20 global telecommunications equipment vendors……………….. 71 Table 2.25 South African national accounts (2002-2006)…………………………... 87 Table 2.26 South Africa Real GDP growth outlook (Sectors) 2004-2006………….. 90 Table 2.27 The evolution of the South African telecommunications policy………... 97 Table 2.28 Quarterly international indicators (2003-2004)…………………………... 99 Table 2.29 The international economy key variables and projections (2001-2006)... 99 Table 3.1 Factors that impact on the interaction with information of South African
teenagers…………………………………………………………………. 116 Table 3.2 Role differentiation in decision-making in the family…………………. 118 Table 3.3 Types of reference groups………………………………………………. 120 Table 3.4 Comparison of selected age cohorts across marketing-related issues…. 125 Table 3.5 Economic criteria in customer decision-making……………………….. 128 Table 3.6 Youth’s five basic emotional needs…………………………………….. 129 Table 3.7 Stages in the decision-making process when buying a mobile phone….. 145 Table 3.8 Where, how much, when and how buyers purchase……………………. 149 Table 4.1 Characteristics of focus groups………………………………………….. 161 Table 4.2 Measurement levels and scale types in the questionnaire……………... 164 Table 4.3 Summary of questionnaire layout……………………………………….. 165 Table 5.1 Age, gender, ethnic background and employment status breaks
versus university…………………………………………………………. 175 Table 5.2 Sample demographics……………………………………………………. 176 Table 5.3 Frequency table for ethnic background…………………………………. 180 Table 5.4 Perceptions of Vodacom………………………………………………….. 186
xi
Table 5.5 Perceptions of MTN……………………………………………………… 187 Table 5.6 Perceptions of Cell C……………………………………………………... 188 Table 5.7 Aspects of service (Frequency*)…………………………………………. 190 Table 5.8 Mobile phone brand awareness …………………………………………. 190 Table 5.9 Reasons for choosing particular brand of mobile phone………………… 193 Table 5.10 Person responsible for monthly mobile phone bill……………………… 195 Table 5.11 Age (Section A question1) and number of years of owning
a mobile phone (Section B question 5)…………………………………… 209 Table 5.12 Age (Section A question 1) and mobile calling plan
(Section B question 6)……………………………………………………. 210 Table 5.13 Gender (Section A question 2) and mobile calling plan
(Section B question 6)……………………………………………………. 210 Table 5.14 Age (Section A question 1) and pocket money received
(Section B question 14)…………………………………………………... 211 Table 5.15 Age (Section A question 1) and average monthly mobile phone bill
(Section B question 15)…………………………………………………... 211 Table 5.16 Age (Section A question 1) and person responsible for monthly
mobile phone bill (Section B Question 16)………………………………. 212 Table 5.17 Gender (Section A question 2) and Person responsible for monthly
mobile phone bill (Section B question 16)……………………………….. 213 Table 5.18 Average monthly mobile phone bill (Section B question 15) and
person responsible for mobile phone bill (Section B question 16)………. 214 Table 5.19 Employment status (Section A question 4) and person responsible
for mobile phone bill (Section B question 16)……………………………. 214 Table 5.20 Pocket money received (Section B question 14) and person responsible
for mobile phone bill (Section B question 16)……………………………. 215 Table 5.21 Age (Section A question 1) and number of mobile phone calls
made per day (Section C Question 17a)………………………………….. 216 Table 5.22 Age (Section A question 1) and Number of mobile phone calls
received per day (Section C Question 17b)………………………………. 216 Table 5.23 Age (Section A question 1) and average length of mobile phone call
(Section C Question 18)…………………………………………………... 217 Table 5.24 Gender (Section A question 2) and average length of mobile phone call
(Section C Question 18)…………………………………………………... 217 Table 5.25 Age (Section A question 1) and number of SMS sent per day
(Section C Question 19)…………………………………………………... 218 Table 5.26 Gender (Section A question 2) and number of SMS sent per day
(Section C Question 19)…………………………………………………... 218 Table 5.27 Gender (Section A question 2) and person contacted most regularly on
mobile phone (Section C question 20)……………………………………. 219 Table 5.28 Mobile phone brand awareness (Section B question 10) and
brand of mobile phone owned (Section B question 11)………………….. 220 Table 5.29 Brand of mobile phone owned (Section B question 11) and
brand Loyalty (Section B question 12)…………………………………… 221 Table 5.30 Brand of mobile phone owned (Section B question 11) and reason for
choosing particular brand of mobile phone (Section B question 13)…….. 222 Table 5.31 Brand of mobile phone owned (Section B question 11) and statement
“The mobile phone you have tells how fashionable you are” (Section D question 23 statement 11)……………………………………..223
Table 5.32 Eleven attitudes towards mobile phones………………………………… 224 Table 5.33 Correlation matrix………………………………………………………. 224 Table 5.34 KMO and Bartlett’s Test…………………………………………………. 225 Table 5.35 Communalities……………………………………………………………. 226 Table 5.36 Total variance explained…………………………………………………. 227 Table 5.37 Reliability statistics………………………………………………………. 229
xii
Table 5.38 Split-half method………………………………………………………… 229 Table 6.1 Generation Y student demographic information………………………… 234 Table 6.2 Network provider’s branding and marketing strategies
to the youth segment…………………………………………………….. 236 Table 6.3 Mobile phone brand awareness …………………………………………. 238
xiii
LIST OF FIGURES
Figure 1.1 Total South African mobile market (millions of customers)…………….. 5 Figure 1.2 Mobile phone subscribers added versus fixed-line subscribers added,
1994-2004………………………………………………………………… 6 Figure 1.3 Income of contract and prepaid mobile phone subscribers in
South Africa………………………………………………………………. 6 Figure 1.4 Mobile market base profile-AMPS……………………………………… 7 Figure 1.5 Employment status of mobile phone users in South Africa……………. 7 Figure 2.1 The composition of the business environment…………………………. 16 Figure 2.2 Number of subscribers and penetration in South Africa- mobile versus
fixed-line communications……………………………………………… 17 Figure 2.3 Benchmarking: prepaid subscribers and market penetration……………. 19 Figure 2.4 Market share according to total subscribers (2005)……………………. 22 Figure 2.5 Product/market expansion grid…………………………………………. 23 Figure 2.6 Vodacom’s market share………………………………………………… 25 Figure 2.7 Vodacom’s total customers and South African market share……….…. 26 Figure 2.8 Vodacom’s ownership and corporate structure…………………………. 27 Figure 2.9 CST’s market share in June 2005……………………………………….. 37 Figure 2.10 Vodacom’s market strategy……………………………………………… 38 Figure 2.11 Mobile market share historical development…………………………… 40 Figure 2.12 MTN’s ownership structure……………………………………………... 41 Figure 2.13 MTN’ s market strategy………………………………………………. 44 Figure 2.14 Cell C shows healthy subscriber growth……………………………….. 47 Figure 2.15 Cell C’s ownership structure…………………………………………….. 48 Figure 2.16 Cell C’s marketing strategy……………………………………………… 51 Figure 2.17 Products and services of the three MNO’s: Contracts…………………… 53 Figure 2.18 Share of the respective population groups in personal and personal
disposable income in South Africa, 1960-2005…………………………. 60 Figure 2.19 Analysing the intermediaries in the South African mobile market……… 68 Figure 2.20 Porter’s five competitive forces model…………………………………. 73 Figure 2.21 H-H Index of competitiveness-arrival of Cell C spurs competition……… 77 Figure 2.22 The South African communications market 2003-2008………………… 85 Figure 2.23 Growth in real household income and GDP (annualised)……………… 88 Figure 2.24 Percentage contribution to GDP by industry at current prices: Transport
and Communication (Unit: percentage contribution to annual GDP)….. 89 Figure 2.25 South Africa’s inflation expectations for 2006…………………………. 91 Figure 2.26 The Rand’s performance against the US Dollar, Euro, GBP…………….. 101 Figure 2.27 Forecast: South African mobile subscribers 2001-2008………………… 103 Figure 2.22 Forecast: South African mobile penetration 2001-2008…………………. 104 Figure 2.23 Forecast: South African mobile service revenue 2001-2008……………. 105 Figure 3.1 Average annual consumer spending by 5-24 year olds (2002/2004)
in selected markets………………………………………………………... 109 Figure 3.2 Youth spending (2003/2006) in 38 selected markets……………………. 110 Figure 3.3 An overall model of consumer behaviour ……………………….…….… 115 Figure 3.4 Maslow’s hierarchy of needs……………………………………………. 127 Figure 3.5 The perceptual process………………………………………………….. 133 Figure 3.6 Estimated 2004 South African mobile marketing and sponsorship spend in R (millions)…………………………………………………….. 136 Figure 3.7 Customer satisfaction levels with MNO’s Vodacom, MTN and Cell C and fixed-line operator Telkom………………………………. 137 Figure 3.8 Elements of learning……………………………………………………… 138 Figure 3.9 Stages in the purchase decision-making process ………………………... 143 Figure 3.10 The search for and processing of information…………………………… 146
xiv
Figure 3.11 How to choose the right tariff plan to suit different needs…………… 148 Figure 3.12 Models of Adoption/Diffusion process…………………………………... 151 Figure 3.13 Rogers’ model of the innovation decision process……………………… 152 Figure 3.14 The model of technology appropriation………………………………… 154 Figure 4.1 The marketing research process…………………………………………. 157 Figure 5.1 University attended by Generation Y respondents-Wits vs UJ………….. 174 Figure 5.2a Age composition of respondents (in years)……………………………... 177 Figure 5.2b Age group composition of respondents (in years)……………………… 178 Figure 5.3 Gender composition of respondents…………………………………….. 179 Figure 5.4 Ethnic background composition of respondents ………………………... 180 Figure 5.5 Employment status composition of respondents………………………... 181 Figure 5.6 Number of years of owning a mobile phone…………………………….. 182 Figure 5.7 Prepaid versus contract…………………………………………………... 183 Figure 5.8 Age-based usage………………………………………………………….. 184 Figure 5.9 Gender-based usage……………………………………………………… 184 Figure 5.10 Vodacom, MTN or Cell C………………………………………………... 185 Figure 5.11 More than one of the network operators used…………………………… 189 Figure 5.12 Mobile phone brands owned…………………………………………….. 191 Figure 5.13 Brand loyalty…………………………………………………………….. 192 Figure 5.14 Pocket money received per month……………………………………… 193 Figure 5.15 Monthly mobile phone bill………………………………………………. 194 Figure 5.16 Monthly mobile phone bill and choice of package
(contract versus prepaid)………………………………………………… 194 Figure 5.17 Number of calls made per day…………………………………………… 196 Figure 5.18 Number of calls received per day………………………………………... 196 Figure 5.19 Minutes per day of average mobile phone call…………………………. 197 Figure 5.20 Number of SMS messages sent per day………………………………….. 197 Figure 5.21 People contacted most regularly on mobile phone………………………. 198 Figure 5.22 Time of day when calls are most often made…………………………… 199 Figure 5.23 Use of mobile phone besides for voice calls………………………………200 Figure 5.24 Use of mobile phone for emergency/safety purposes…………………… 201 Figure 5.25 Use of mobile phone for convenience…………………………………… 202 Figure 5.26 Connection to friends by owning a mobile phone………………………. 203 Figure 5.27 Saving SMS messages received…………………………………………... 203 Figure 5.28 Multitasking and owning a mobile phone……………………………….. 204 Figure 5.29 Speed of doing things by owning a Mobile Phone……………………… 205 Figure 5.30 Interference of Mobile Phone in day-to-day activities…………………… 205 Figure 5.31 Making life easier by owning a mobile phone…………………………… 206 Figure 5.32 Supervision by parents on mobile phone………………………………... 206 Figure 5.33 Freedom and ownership of a mobile phone……………………… ……… 207 Figure 5.34 Mobile phone as a fashion statement…………………………………….. 207 Figure 5.35 Scree plot………………………………………………………………… 228 Figure 6.1 Perceptions of the three operators: Vodacom, MTN and Cell C………… 235 Figure 6.2 Mobile phone brand awareness in percentage………………………….. 238 Figure 6.3 Mobile communication industry value chain…………………………… 240
xv
CHAPTER 1
BACKGROUND TO THE STUDY
1.1 INTRODUCTION
Over the last few years the use of mobile phones has increased dramatically
throughout the world, especially in South Africa, where mobile phones and services
are already a multi-billion rand industry. A new survey on mobile phone usage in
Africa, conducted by the Geneva-based International Telecommunications Union, has
found that the continent is now the fastest growing mobile phone market in the world,
and the first continent to have more mobile phone users than land-line subscribers
(Ryu, 2004). It has also been found that South Africa is the leader in
telecommunications on the African continent, with a third of all main lines and three
quarters of all mobile subscribers (African Cellular Statistics, 2004). The
telecommunications environment in South Africa has experienced immense changes
and has grown substantially over the last decade. Wireless telecommunications were
introduced in South Africa in 1994 when South Africa’s first democratic government
granted mobile phone licences to two operators, Vodacom and MTN. The third
mobile network, Cell C, was introduced in December 2001 (African Cellular
Statistics, 2004).
According to Taylor (2004) the evolution of the South African wireless industry will
depend not only on engineering innovation but, more importantly, on understanding
what the consumers want, what will fit their particular lifestyles, and what will
enhance their lives in the future. Besides the obvious need to keep in touch, mobile
communication has transcended simple voice communication, especially in the case
of the South African youth market. In this market owning a mobile phone is also
influenced by self-expression and additional factors such as status and peer pressure
(Taylor, 2004). As a result of the mobile youth generation’s preoccupation with
mobile phones and the fact that the South African mobile market is reaching
saturation point, service providers will need to reinforce their image by developing
appropriate products and services that will appeal to the youth generation.
1
Teenagers are more knowledgeable than ever before and authentic and creative
market strategies are needed in order to reach them (Reuters, 2005). Many studies
have found that Generation Y consumers (also known as ‘Echo Boomers’ and the
Millenium generation) are technology-wise and have more disposable income than
past generations (Cant & Machado, 2005). For the purpose of the study Generation Y
is defined as “the children of the Boomers who are probably going to be, or are
already, the most sophisticated and seasoned customers yet (Cant, Brink & Brijball,
2005:106).”Generation Y can be further divided into three subcategories: adults (aged
between 19 and 24), teenagers (aged between 13 and 18) and children (aged between
8 and 12) (Cant et al., 2005:106).
Generation Y consumers influence spending of between R6 billion and R7 billion a
year, and their pocket money amounts to R5 billion a year (Cant & Machado, 2005).
According to the Wireless World Forum, a UK-based telecommunications market
research company (Lowman, 2005), it was estimated that Generation Y would spend
10 percent of their disposable income on mobile services in 2005. It was also
predicted in 2005 that spending on mobile services by this target audience would
amount to over $100 billion by 2005 with messaging applications being the largest
contributor behind voice (Lowman, 2005).
The youth market is a unique segment that needs its own tailored marketing approach.
Service providers wishing to connect with this youth audience and tap this market
need to understand that the youth culture is far from homogeneous; hence, marketers
need to try new approaches or risk losing the attention and money of this fickle
audience (Reuters, 2005). An important aspect of selling to this market segment is
that customers will carry brand loyalties through into adulthood (Cant et al.,
2005:107). Therefore, the acquisition and retention of customers in their youth is
crucial to maximising customer lifetime value (Detecon, 2005).
All the above findings highlight the value Generation Y is able to offer and the
importance of the mobile phone in the lives of Generation Y consumers. This study
aims to uncover the factors underlying the consumer behaviour of South African
Generation Y’ers and, more specifically, that of Generation Y’ers in the city of
Johannesburg.
2
This chapter presents a basic background sketch in which the problem statement and
research objectives of the study are outlined. Furthermore, it discusses certain
limitations regarding this particular study, a description of the methodology, and the
chapter layout.
1.2 BACKGROUND SKETCH
A brief overview of the mobile phone industry and a preliminary literature review will
be presented as part of the background sketch.
1.2.1 A brief overview of the mobile phone industry in South Africa
The mobile phone market in South Africa has undergone immense changes and may
be described as a vibrant market that has seen a rapid adoption of GSM (Global
System for Mobile Communications) in the past few years. According to the Census
(2001) it was estimated that about 2.7 million households have access to a telephone
within their dwellings and 3.6 million households have access to a mobile phone.
Table 1.1 provides an overview of the South African mobile phone market as at the
end of June 2004. As illustrated in Table 1.1 the size of the South African mobile
market size was 18.7 million users in June 2004, of which 80 percent were active
users. Experts predict that this figure will reach 19 million potential users by 2006
(South African Cellular Statistics, 2004).
Furthermore, the mobile phone industry is rather unique and, as a result of its
phenomenal growth over the past several years, provides interesting research
material- sources indicate that the South African market is currently worth R23 billion
and will grow to around R54 billion by 2007 (African Cellular Statistics, 2004).
(See Table 1.1)
3
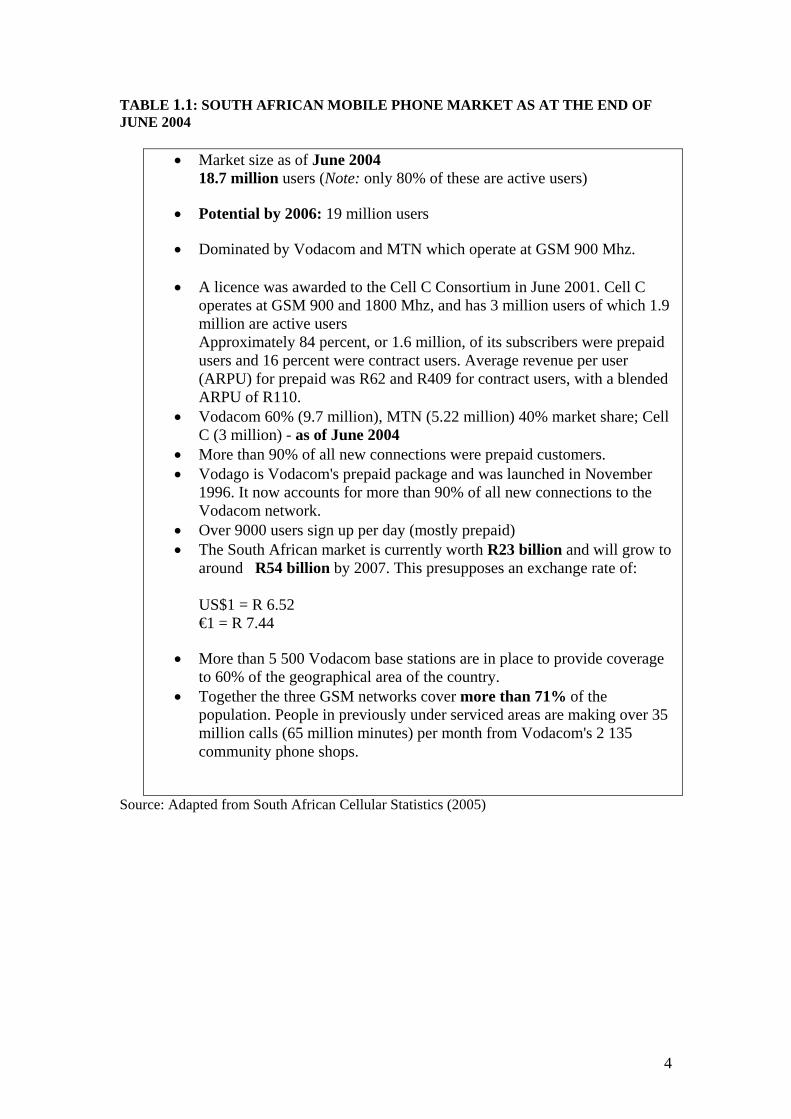
TABLE 1.1: SOUTH AFRICAN MOBILE PHONE MARKET AS AT THE END OF JUNE 2004
• Market size as of June 2004 18.7 million users (Note: only 80% of these are active users)
• Potential by 2006: 19 million users
• Dominated by Vodacom and MTN which operate at GSM 900 Mhz.
• A licence was awarded to the Cell C Consortium in June 2001. Cell C operates at GSM 900 and 1800 Mhz, and has 3 million users of which 1.9 million are active users Approximately 84 percent, or 1.6 million, of its subscribers were prepaid users and 16 percent were contract users. Average revenue per user (ARPU) for prepaid was R62 and R409 for contract users, with a blended ARPU of R110.
• Vodacom 60% (9.7 million), MTN (5.22 million) 40% market share; Cell C (3 million) - as of June 2004
• More than 90% of all new connections were prepaid customers. • Vodago is Vodacom's prepaid package and was launched in November
1996. It now accounts for more than 90% of all new connections to the Vodacom network.
• Over 9000 users sign up per day (mostly prepaid) • The South African market is currently worth R23 billion and will grow to
around R54 billion by 2007. This presupposes an exchange rate of: US$1 = R 6.52 €1 = R 7.44
• More than 5 500 Vodacom base stations are in place to provide coverage to 60% of the geographical area of the country.
• Together the three GSM networks cover more than 71% of the population. People in previously under serviced areas are making over 35 million calls (65 million minutes) per month from Vodacom's 2 135 community phone shops.
Source: Adapted from South African Cellular Statistics (2005)
4
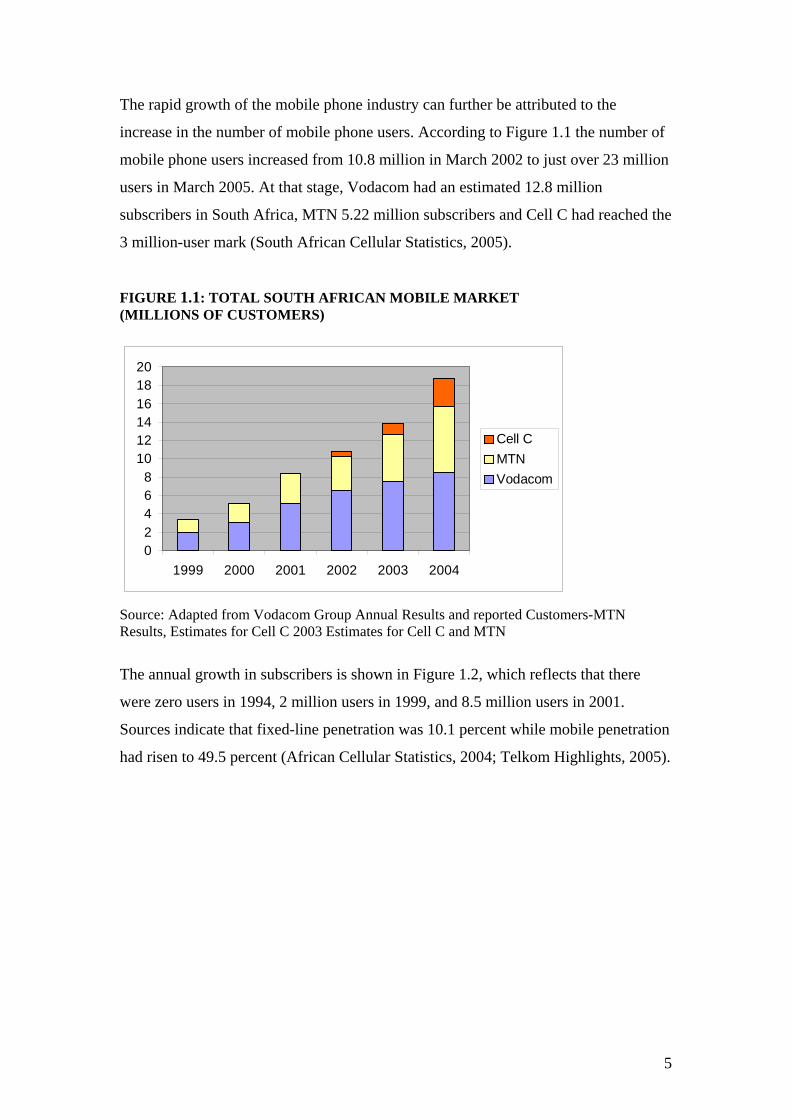
The rapid growth of the mobile phone industry can further be attributed to the
increase in the number of mobile phone users. According to Figure 1.1 the number of
mobile phone users increased from 10.8 million in March 2002 to just over 23 million
users in March 2005. At that stage, Vodacom had an estimated 12.8 million
subscribers in South Africa, MTN 5.22 million subscribers and Cell C had reached the
3 million-user mark (South African Cellular Statistics, 2005).
FIGURE 1.1: TOTAL SOUTH AFRICAN MOBILE MARKET (MILLIONS OF CUSTOMERS)
02468
101214161820
1999 2000 2001 2002 2003 2004
Cell CMTNVodacom
Source: Adapted from Vodacom Group Annual Results and reported Customers-MTN Results, Estimates for Cell C 2003 Estimates for Cell C and MTN
The annual growth in subscribers is shown in Figure 1.2, which reflects that there
were zero users in 1994, 2 million users in 1999, and 8.5 million users in 2001.
Sources indicate that fixed-line penetration was 10.1 percent while mobile penetration
had risen to 49.5 percent (African Cellular Statistics, 2004; Telkom Highlights, 2005).
5
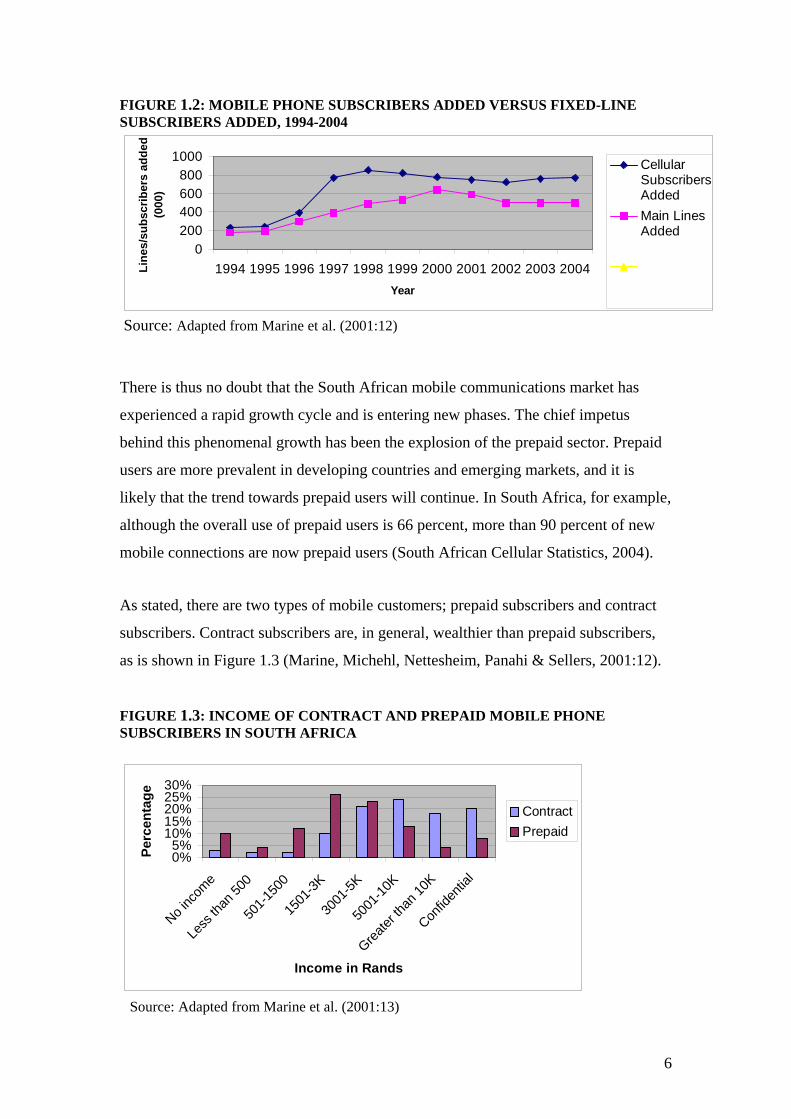
FIGURE 1.2: MOBILE PHONE SUBSCRIBERS ADDED VERSUS FIXED-LINE SUBSCRIBERS ADDED, 1994-2004
0200400600800
1000
1994 1995 1996 1997 1998 1999 2000 2001 2002 2003 2004Year
Line
s/su
bscr
iber
s ad
ded
(000
)CellularSubscribersAddedMain LinesAdded
Source: Adapted from Marine et al. (2001:12)
There is thus no doubt that the South African mobile communications market has
experienced a rapid growth cycle and is entering new phases. The chief impetus
behind this phenomenal growth has been the explosion of the prepaid sector. Prepaid
users are more prevalent in developing countries and emerging markets, and it is
likely that the trend towards prepaid users will continue. In South Africa, for example,
although the overall use of prepaid users is 66 percent, more than 90 percent of new
mobile connections are now prepaid users (South African Cellular Statistics, 2004).
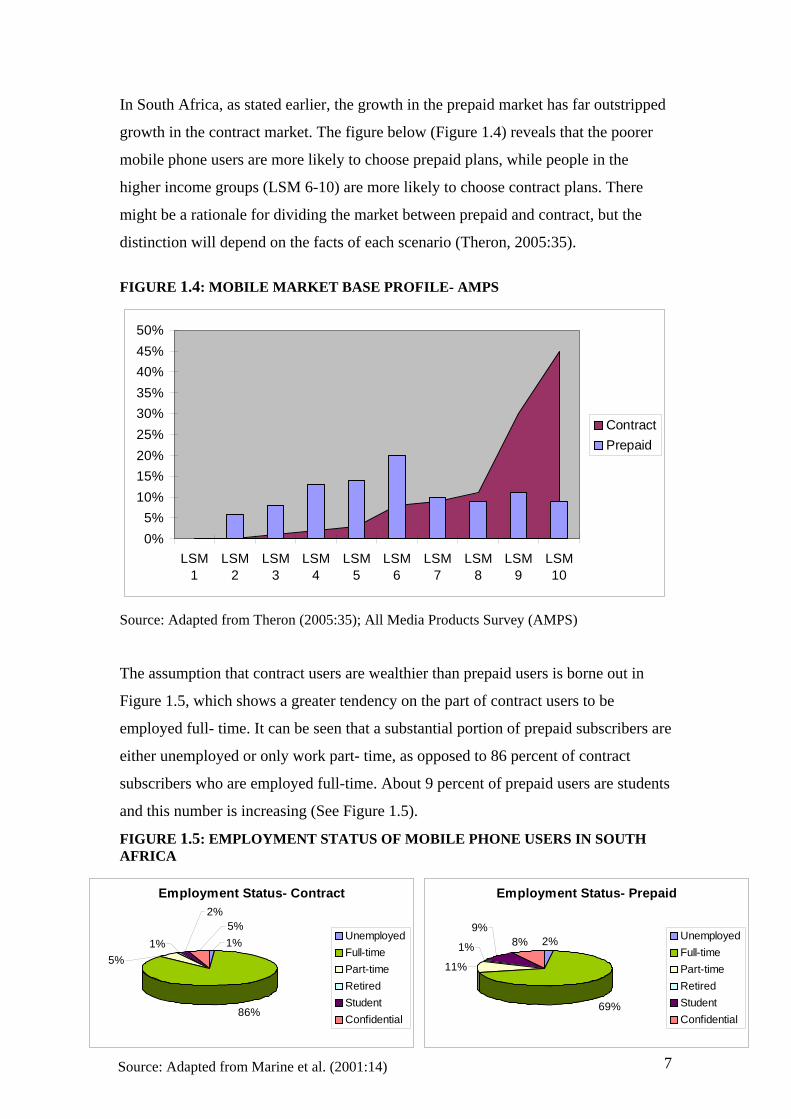
As stated, there are two types of mobile customers; prepaid subscribers and contract
subscribers. Contract subscribers are, in general, wealthier than prepaid subscribers,
as is shown in Figure 1.3 (Marine, Michehl, Nettesheim, Panahi & Sellers, 2001:12).
FIGURE 1.3: INCOME OF CONTRACT AND PREPAID MOBILE PHONE SUBSCRIBERS IN SOUTH AFRICA
0%5%
10%15%20%25%30%
No inc
ome
Less
than
500
501-1
500
1501
-3K
3001
-5K
5001
-10K
Greater
than
10K
Confid
entia
l
Income in Rands
Perc
enta
ge
ContractPrepaid
Source: Adapted from Marine et al. (2001:13)
6
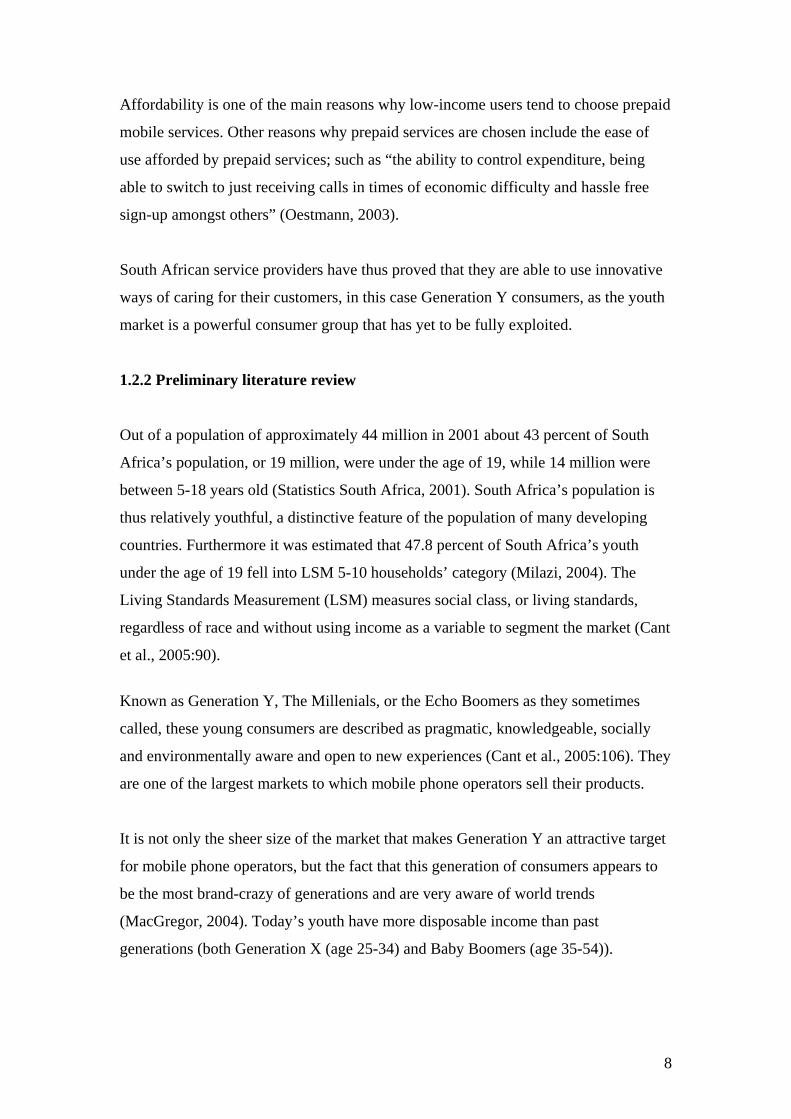
In South Africa, as stated earlier, the growth in the prepaid market has far outstripped
growth in the contract market. The figure below (Figure 1.4) reveals that the poorer
mobile phone users are more likely to choose prepaid plans, while people in the
higher income groups (LSM 6-10) are more likely to choose contract plans. There
might be a rationale for dividing the market between prepaid and contract, but the
distinction will depend on the facts of each scenario (Theron, 2005:35).
FIGURE 1.4: MOBILE MARKET BASE PROFILE- AMPS
0%5%
10%15%20%25%30%35%40%45%50%
LSM1
LSM2
LSM3
LSM4
LSM5
LSM6
LSM7
LSM8
LSM9
LSM10
ContractPrepaid
Source: Adapted from Theron (2005:35); All Media Products Survey (AMPS)
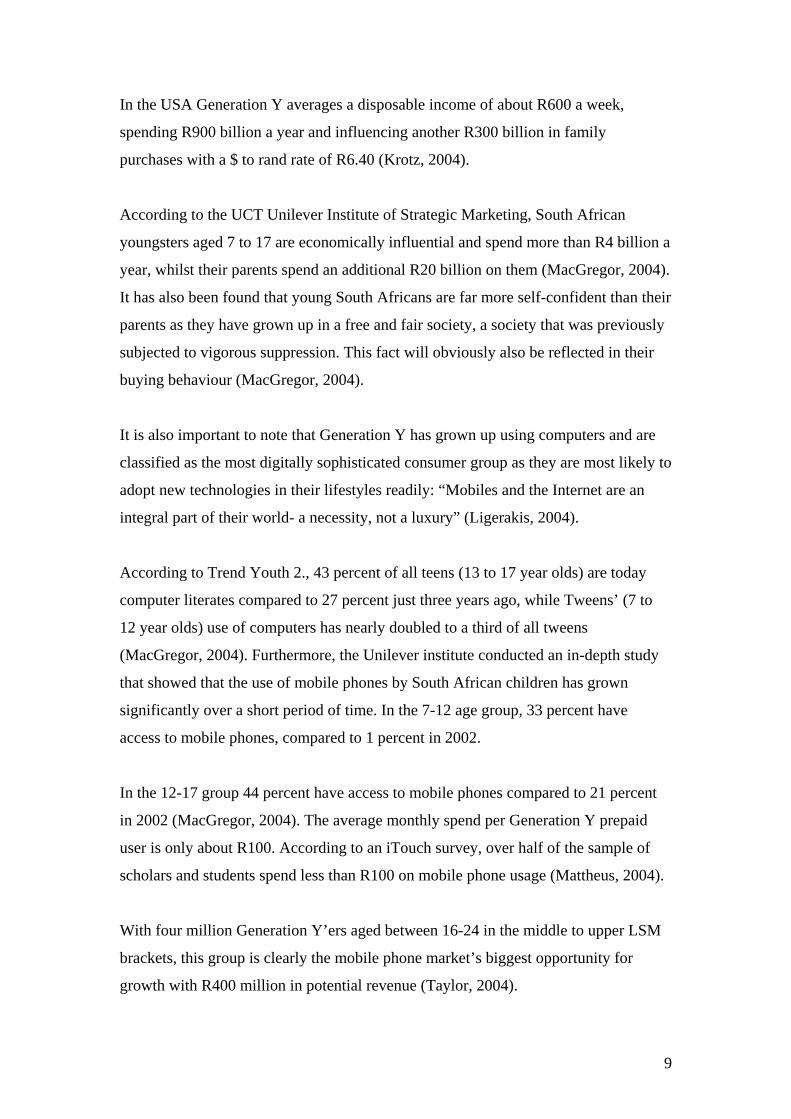
The assumption that contract users are wealthier than prepaid users is borne out in
Figure 1.5, which shows a greater tendency on the part of contract users to be
employed full- time. It can be seen that a substantial portion of prepaid subscribers are
either unemployed or only work part- time, as opposed to 86 percent of contract
subscribers who are employed full-time. About 9 percent of prepaid users are students
and this number is increasing (See Figure 1.5).
FIGURE 1.5: EMPLOYMENT STATUS OF MOBILE PHONE USERS IN SOUTH AFRICA
7
Employment Status- Contract
86%
1%5%
1%5%
2%
UnemployedFull-timePart-timeRetiredStudentConfidential
Employment Status- Prepaid
2%
69%
11%
1%
9%8% Unemployed
Full-timePart-timeRetiredStudentConfidential
Source: Adapted from Marine et al. (2001:14)
Affordability is one of the main reasons why low-income users tend to choose prepaid
mobile services. Other reasons why prepaid services are chosen include the ease of
use afforded by prepaid services; such as “the ability to control expenditure, being
able to switch to just receiving calls in times of economic difficulty and hassle free
sign-up amongst others” (Oestmann, 2003).
South African service providers have thus proved that they are able to use innovative
ways of caring for their customers, in this case Generation Y consumers, as the youth
market is a powerful consumer group that has yet to be fully exploited.
1.2.2 Preliminary literature review
Out of a population of approximately 44 million in 2001 about 43 percent of South
Africa’s population, or 19 million, were under the age of 19, while 14 million were
between 5-18 years old (Statistics South Africa, 2001). South Africa’s population is
thus relatively youthful, a distinctive feature of the population of many developing
countries. Furthermore it was estimated that 47.8 percent of South Africa’s youth
under the age of 19 fell into LSM 5-10 households’ category (Milazi, 2004). The
Living Standards Measurement (LSM) measures social class, or living standards,
regardless of race and without using income as a variable to segment the market (Cant
et al., 2005:90).
Known as Generation Y, The Millenials, or the Echo Boomers as they sometimes
called, these young consumers are described as pragmatic, knowledgeable, socially
and environmentally aware and open to new experiences (Cant et al., 2005:106). They
are one of the largest markets to which mobile phone operators sell their products.
It is not only the sheer size of the market that makes Generation Y an attractive target
for mobile phone operators, but the fact that this generation of consumers appears to
be the most brand-crazy of generations and are very aware of world trends
(MacGregor, 2004). Today’s youth have more disposable income than past
generations (both Generation X (age 25-34) and Baby Boomers (age 35-54)).
8
In the USA Generation Y averages a disposable income of about R600 a week,
spending R900 billion a year and influencing another R300 billion in family
purchases with a $ to rand rate of R6.40 (Krotz, 2004).
According to the UCT Unilever Institute of Strategic Marketing, South African
youngsters aged 7 to 17 are economically influential and spend more than R4 billion a
year, whilst their parents spend an additional R20 billion on them (MacGregor, 2004).
It has also been found that young South Africans are far more self-confident than their
parents as they have grown up in a free and fair society, a society that was previously
subjected to vigorous suppression. This fact will obviously also be reflected in their
buying behaviour (MacGregor, 2004).
It is also important to note that Generation Y has grown up using computers and are
classified as the most digitally sophisticated consumer group as they are most likely to
adopt new technologies in their lifestyles readily: “Mobiles and the Internet are an
integral part of their world- a necessity, not a luxury” (Ligerakis, 2004).
According to Trend Youth 2., 43 percent of all teens (13 to 17 year olds) are today
computer literates compared to 27 percent just three years ago, while Tweens’ (7 to
12 year olds) use of computers has nearly doubled to a third of all tweens
(MacGregor, 2004). Furthermore, the Unilever institute conducted an in-depth study
that showed that the use of mobile phones by South African children has grown
significantly over a short period of time. In the 7-12 age group, 33 percent have
access to mobile phones, compared to 1 percent in 2002.
In the 12-17 group 44 percent have access to mobile phones compared to 21 percent
in 2002 (MacGregor, 2004). The average monthly spend per Generation Y prepaid
user is only about R100. According to an iTouch survey, over half of the sample of
scholars and students spend less than R100 on mobile phone usage (Mattheus, 2004).
With four million Generation Y’ers aged between 16-24 in the middle to upper LSM
brackets, this group is clearly the mobile phone market’s biggest opportunity for
growth with R400 million in potential revenue (Taylor, 2004).
9
According to marketing directors, mobile operators have yet to break through the 21
percent penetration barrier in the 16-24 market (Taylor, 2004).
This study will focus on two age groups, and specifically on two age groups in the
medium and upper income age group as this is where the spending power lies- this
consumer group has reached adulthood and many of them are making consumption
and purchase-related decisions on their own. The assumption here is that it is mostly
the medium to higher income groups in South Africa that are able to afford to enrol
students for tertiary education.
The above statistics alone justify the importance of the buying behaviour of
Generation Y consumers especially where wireless services are concerned. Previous
research has been done into the consumer behaviour of South Africa’s Generation
Y’ers and this target market tends to exhibit ever changing behavioural attitudes that
need to be monitored constantly. This study will gain insight into how this generation
is utilising technology and will focus more specifically on mobile phone usage by this
group.
1.3 PROBLEM STATEMENT
From the above discussion it is clear that there should be great interest in researching
the consumer behaviour in connection with mobile phone usage on the part of
Generation Y students in the city of Johannesburg. Generation Y needs to be
sufficiently researched so as to increase the understanding of the attitudes and
behaviour of the youth towards mobile phones. This is necessary in order to devise an
effective way to market to this group. It is important to investigate this group because
Generation Y, as opposed to the general population of South Africa, exhibits different
attitudes and behaviours towards, and an acceptance of, the wireless device such as
the mobile phone. To summarise the problem statement is to determine the behaviour
patterns of Generation Y consumers as they are a growth market, and not enough is
known about their consumer behaviour patterns regarding the use of mobile phones in
South Africa.
10
1.4 OBJECTIVES OF THE STUDY
1.4.1 Main objective
The main objective of this study is to gain primary information regarding the use of
mobile phones by Generation Y students in the city of Johannesburg.
1.4.2 Secondary objectives
The following secondary objectives were identified, namely to determine
• The demographics of Generation Y students in the city of Johannesburg
• The perceptions of Generation Y regarding the competitive situation in the mobile
phone market
• The mobile phone brand awareness of Generation Y
• Further areas of study in this dynamic youth market
1.5 LIMITATIONS OF THE STUDY
There are several limitations regarding this particular research. The results are limited
as the target group was restricted to young people who owned mobile phones and who
attended universities for tertiary studies. This causes a certain degree of bias, and thus
any general inferences regarding the total population of South Africa would be prone
to bias. The inferences drawn from the study will enable the reader to distinguish the
underlying trends, but the study does not provide conclusive evidence regarding social
characteristics of the total population of South Africa.
In addition, a larger sample would have yielded results with a higher confidence
interval. The sample was chosen from among the overall population of young people
in Johannesburg attending residential universities. Furthermore, the study focused on
students in the medium and upper income groups, and there are bound to be major
differences between them and the youth in lower income groups. Narrowing the
research down to Generation Y students is not representative of all the Generation Y
consumers in Johannesburg. In view of the fact that the survey was conducted
amongst a sample rather than the whole population, it is not directly proportionate to
11
the total youth population, and the data may be subject to a margin of error- the total
population might therefore manifest different characteristics. As a result of the
findings being based upon the research conducted in Johannesburg, these findings
may not be applicable to other cities or provinces in South Africa in respect of
contextual factors.
Finally it should be mentioned that surveys such as this one need to be undertaken
periodically in order to predict changing consumer perceptions over time correctly.
At best this study provides an indication of what is happening in the Generation Y
market at tertiary education level in Johannesburg- this is better than not knowing
anything about this growing market.
1.6 RESEARCH METHODOLOGY
A combination of research methods was used in order to address the research
objectives. A body of literature relevant to the objectives of the study was consulted
so as to identify key trends in the mobile phone market. Secondary research was
collected from fairly recent publications such as marketing journals, magazines and
the Internet. Secondary sources consulted are mentioned in the bibliography.
Furthermore, a discussion forum in the form of a focus group was held so as to
generate ideas about and gain insights into issues of interest to the researcher.
This type of primary research was best suited to this study as it uncovers the attitudes
and perceptions of respondents without limiting their choice of answers, and allows
them to express themselves freely in a relaxed environment.
A survey questionnaire was developed within the focus group and handed out to 200
young people aged between 18 and 24 chosen from amongst the overall population of
young people in Johannesburg who are students at the universities of the
Witwatersrand and Johannesburg (see Appendix A and Chapter 4 for more detail
regarding the research methodology and the research instrument used). This survey is
not directly proportionate to the total youth population as it is a sample of the mobile
phone-owning youth sector, and the population might therefore manifest different
characteristics as was previously mentioned in section 1.5.
12
For the purpose of this study, a combination of both probability sampling and non-
probability sampling was undertaken in the form of quota sampling and systematic
sampling.
1.7 CHAPTER LAYOUT
The chapters were structured as follows:
Chapter 1: Background to the study
This chapter included the background to the study, problem definition and objectives.
Chapter 2: The South African mobile phone business environment
Chapter 2 covered the South African mobile phone business environment. The micro,
macro and market environments, and the major industry players such as the mobile
phone operators were among the topics discussed.
Chapter 3: The consumer behaviour and mobile phone usage of Generation Y
students in the city of Johannesburg
This chapter dealt with the consumer behaviour patterns of Generation Y students.
The consumer decision-making process and an overview of the determinants
influencing consumer behaviour formed part of this chapter.
Chapter 4: Research methodology
Chapter 4 describes the research methodology used leading up to the development of
the survey questionnaire.
Chapter 5: Results of research
Chapter 5 presented the findings of the study and the results were discussed on a
question-to-question basis.
Chapter 6: Conclusions and recommendations
Chapter 6 concluded the study and contains recommendations for future research.
13
CHAPTER 2
THE BUSINESS ENVIRONMENT OF THE MOBILE PHONE
INDUSTRY IN SOUTH AFRICA 2.1 INTRODUCTION Technological advances, such as wireless applications, have had a profound impact on
communications all over the world resulting in the development of new technologies
to transcend distance and time. The mobile phone industry has impacted on the social
behaviour of consumers in terms of purchasing behaviour and lifestyles. A priority of
this industry is to keep abreast of changes in the business environment, to identify
new market opportunities and threats (for example competitors) , and to ultimately
increase profitability. “Coping with the constantly changing environment is probably
the most important determinant of a company’s success or failure in a free enterprise
(Rowe, Mason and Dickel quoted in Kuratko and Hodgetts 1998:193).” The
environment has an enormous impact on the mobile market as far as the
technological, economic, social, politico-governmental and international
environments are concerned. This chapter discusses the composition of the business
environment and the influence this has on the South African mobile phone industry.
2.2 THE BUSINESS ENVIRONMENT
The business environment has many definitions in existing literature. Marx, Van
Rooyen, Bosch and Reynders (1998:38) quoted in Ali (2003:31) define the business
environment as “ the sum of all the variables or forces that have a positive or negative
effect on the establishment, survival, growth and goal achievement of the enterprise.”
The definition of the business environment by Cronje, Du Toit, Marais and Motlatla
(2004:85) is given as “all those factors or variables, both inside as well as outside the
business organisation, which may influence the continued and successful existence of
the business organisation.”
14
Figure 2.1 can act as a visual model that depicts the composition of the business
environment of the mobile phone industry. It is clear from the figure that the business
environment of any given organisation comprises: the micro or internal environment
(variables within an organisation), the market or task environment and the macro or
external environment (variables outside an organisation). The business environment
as applied to the mobile phone industry includes:
• The micro-environment of each mobile network operator (MNO) which consists
of the business itself over which management has control. The key variables in
this environment are the goals and objectives of the mobile network operator
(MNO), the ownership structure, market share, products and services offered and
the network coverage of the MNO.
• The market environment is encountered immediately outside the business
organisation. The key variables in this environment are: consumers, competitors,
intermediaries and suppliers.
• The macro- environment is external to both the organisation and the market
environment and consists of the technological, economic, social, physical,
institutional-political and international environments.
The three sub-environments (the micro-environment, the market environment and the
macro-environment) and the interactions between them will be discussed thoroughly
throughout this chapter and each sub-environment will in turn be discussed further.
Cronje, Du Toit, Marais and Motlatla (2004) were deemed to have defined the most
suitable theoretical framework for the evaluation of the business environment of the
mobile phone industry in South Africa and this framework was used for the purpose
of this study.
15
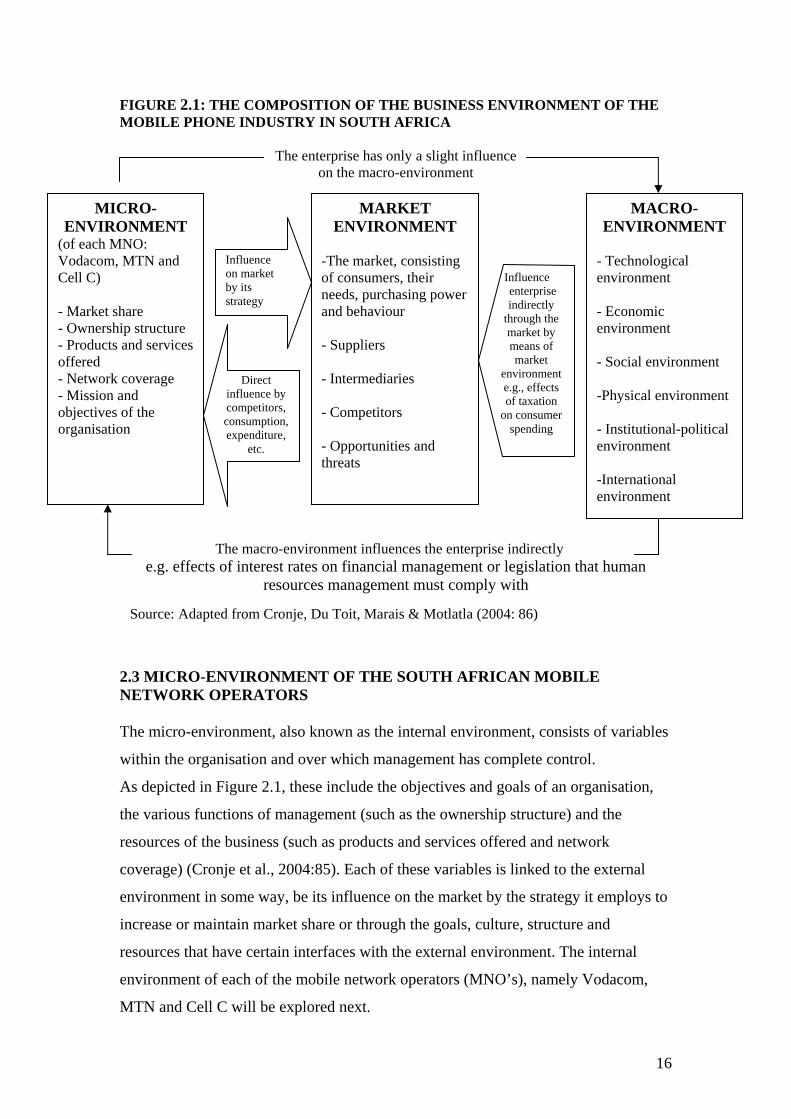
FIGURE 2.1: THE COMPOSITION OF THE BUSINESS ENVIRONMENT OF THE MOBILE PHONE INDUSTRY IN SOUTH AFRICA
The enterprise has only a slight influence on the macro-environment
MARKET ENVIRONMENT
-The market, consisting of consumers, their needs, purchasing power and behaviour - Suppliers - Intermediaries - Competitors - Opportunities and threats
MICRO-ENVIRONMENT
(of each MNO: Vodacom, MTN and Cell C) - Market share - Ownership structure - Products and services offered - Network coverage - Mission and objectives of the organisation
MACRO-
ENVIRONMENT - Technological environment - Economic environment - Social environment -Physical environment - Institutional-political environment -International environment
The macro-environment influences the enterprise indirectly
Influence on market by its strategy
Direct influence by competitors, consumption, expenditure,
etc.
Influence enterprise indirectly
through the market by means of market
environment e.g., effects of taxation
on consumer spending
e.g. effects of interest rates on financial management or legislation that human resources management must comply with
2.3 Micro-Environment
Source: Adapted from Cronje, Du Toit, Marais & Motlatla (2004: 86)
2.3 MICRO-ENVIRONMENT OF THE SOUTH AFRICAN MOBILE NETWORK OPERATORS The micro-environment, also known as the internal environment, consists of variables
within the organisation and over which management has complete control.
As depicted in Figure 2.1, these include the objectives and goals of an organisation,
the various functions of management (such as the ownership structure) and the
resources of the business (such as products and services offered and network
coverage) (Cronje et al., 2004:85). Each of these variables is linked to the external
environment in some way, be its influence on the market by the strategy it employs to
increase or maintain market share or through the goals, culture, structure and
resources that have certain interfaces with the external environment. The internal
environment of each of the mobile network operators (MNO’s), namely Vodacom,
MTN and Cell C will be explored next.
16
2.3.1 South Africa’s mobile network operators The mobile phone industry in South Africa, with the mobile network operators
Vodacom, MTN and Cell C, is one of the fastest developing in the world and plays an
important role in the development of the South African economy. It will be argued
that the South African mobile market can be classified as an oligopoly, or even a
duopoly, with two organisations, namely Vodacom and MTN of more or less the
same size dominating the market (Theron, 2005:28). On the one hand, Theron
(2005:28) argues that both Vodacom and MTN have market shares that exceed 35
percent, have similar cost and pricing strategies and control the market resulting in a
duopoly. On the other hand, Cant and Machado (2005:4) describe the competitive
mobile situation in South Africa as an oligopoly. An oligopoly is described as a
competitive situation where there are few suppliers of the service and the strategies of
the suppliers are based on what the competitors are doing.
2.3.1.1 Growth of mobile phone penetration
Unlike its fixed-line telecommunications market, South Africa boasts a vibrant and
competitive mobile phone market that is growing quickly (see Figure 2.2). As
illustrated in Figure 2.2, this market has experienced rapid growth in the number of
mobile users increasing from 10.8 million users in March 2002, to just over 23 million
users in March 2005, resulting in mobile penetration increasing from 24.2 percent to
49.5 percent during the same period. Mobile phone penetration is defined as the
number of mobile phone added per 100 inhabitants (otherwise known as mobile
phone ownership). Furthermore, one of the reasons for the remarkable success of
mobile in South Africa has been the stagnation of the fixed line-market. Mobile
phones have proven a far more efficient technology in providing access to
communications especially in the lower income population of South Africa (Cant &
Machado, 2005:7). Profitability of the mobile network operators results from this
growth in mobile phone penetration and will be discussed in the next section.
17
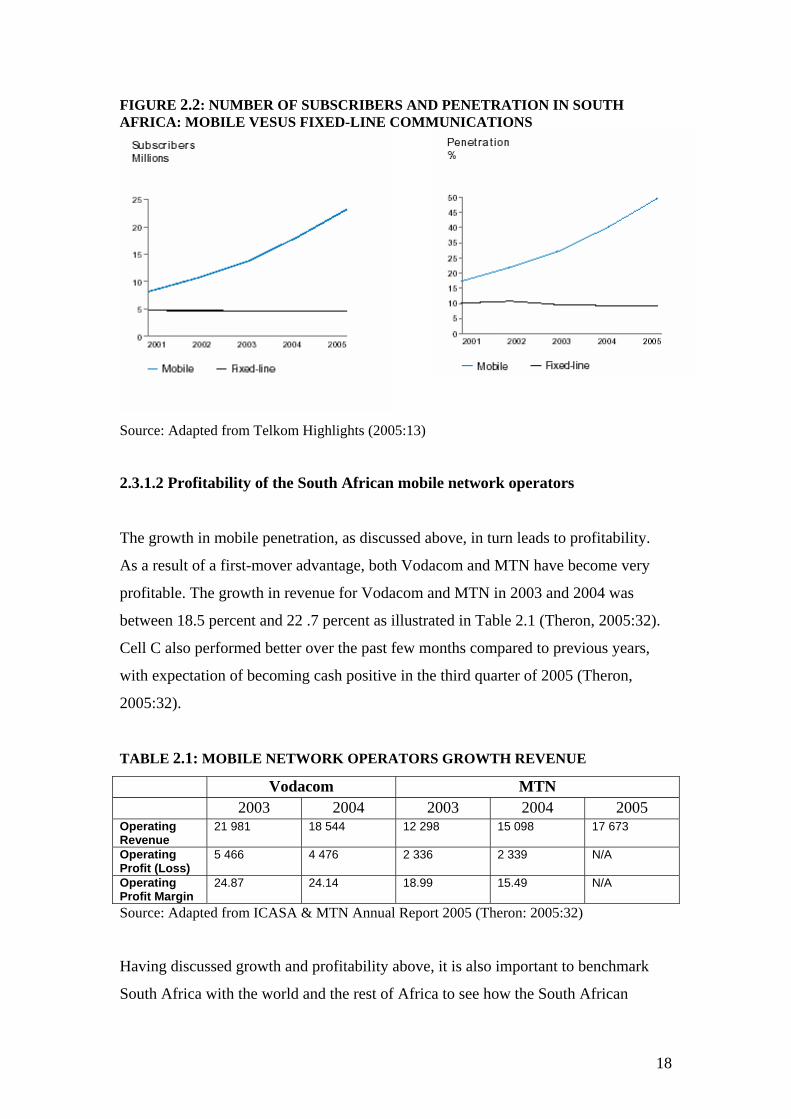
FIGURE 2.2: NUMBER OF SUBSCRIBERS AND PENETRATION IN SOUTH AFRICA: MOBILE VESUS FIXED-LINE COMMUNICATIONS
Source: Adapted from Telkom Highlights (2005:13)
2.3.1.2 Profitability of the South African mobile network operators
The growth in mobile penetration, as discussed above, in turn leads to profitability.
As a result of a first-mover advantage, both Vodacom and MTN have become very
profitable. The growth in revenue for Vodacom and MTN in 2003 and 2004 was
between 18.5 percent and 22 .7 percent as illustrated in Table 2.1 (Theron, 2005:32).
Cell C also performed better over the past few months compared to previous years,
with expectation of becoming cash positive in the third quarter of 2005 (Theron,
2005:32).
TABLE 2.1: MOBILE NETWORK OPERATORS GROWTH REVENUE Vodacom MTN 2003 2004 2003 2004 2005 Operating Revenue
21 981 18 544 12 298 15 098 17 673
Operating Profit (Loss)
5 466 4 476 2 336 2 339 N/A
Operating Profit Margin
24.87 24.14 18.99 15.49 N/A
Source: Adapted from ICASA & MTN Annual Report 2005 (Theron: 2005:32)
Having discussed growth and profitability above, it is also important to benchmark
South Africa with the world and the rest of Africa to see how the South African
18
mobile phone industry and mobile phone network operators’ performance compares
against other similar markets.
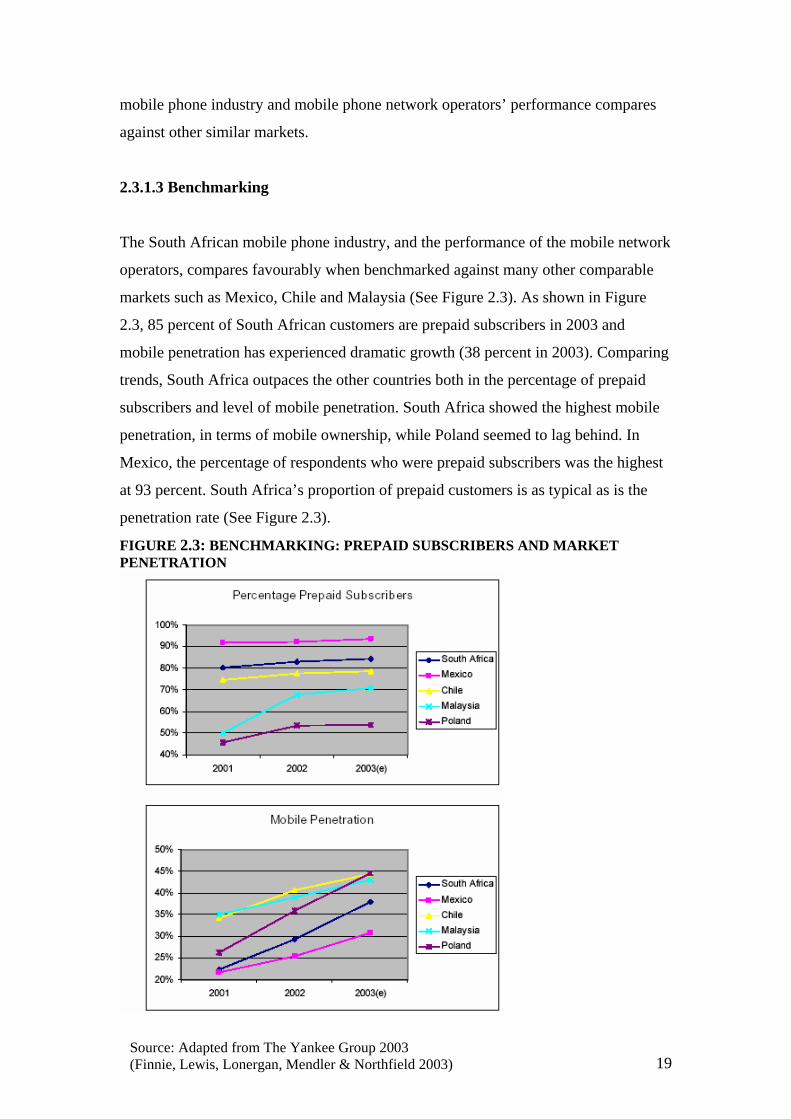
2.3.1.3 Benchmarking
The South African mobile phone industry, and the performance of the mobile network
operators, compares favourably when benchmarked against many other comparable
markets such as Mexico, Chile and Malaysia (See Figure 2.3). As shown in Figure
2.3, 85 percent of South African customers are prepaid subscribers in 2003 and
mobile penetration has experienced dramatic growth (38 percent in 2003). Comparing
trends, South Africa outpaces the other countries both in the percentage of prepaid
subscribers and level of mobile penetration. South Africa showed the highest mobile
penetration, in terms of mobile ownership, while Poland seemed to lag behind. In
Mexico, the percentage of respondents who were prepaid subscribers was the highest
at 93 percent. South Africa’s proportion of prepaid customers is as typical as is the
penetration rate (See Figure 2.3).
FIGURE 2.3: BENCHMARKING: PREPAID SUBSCRIBERS AND MARKET PENETRATION
19Source: Adapted from The Yankee Group 2003 (Finnie, Lewis, Lonergan, Mendler & Northfield 2003)
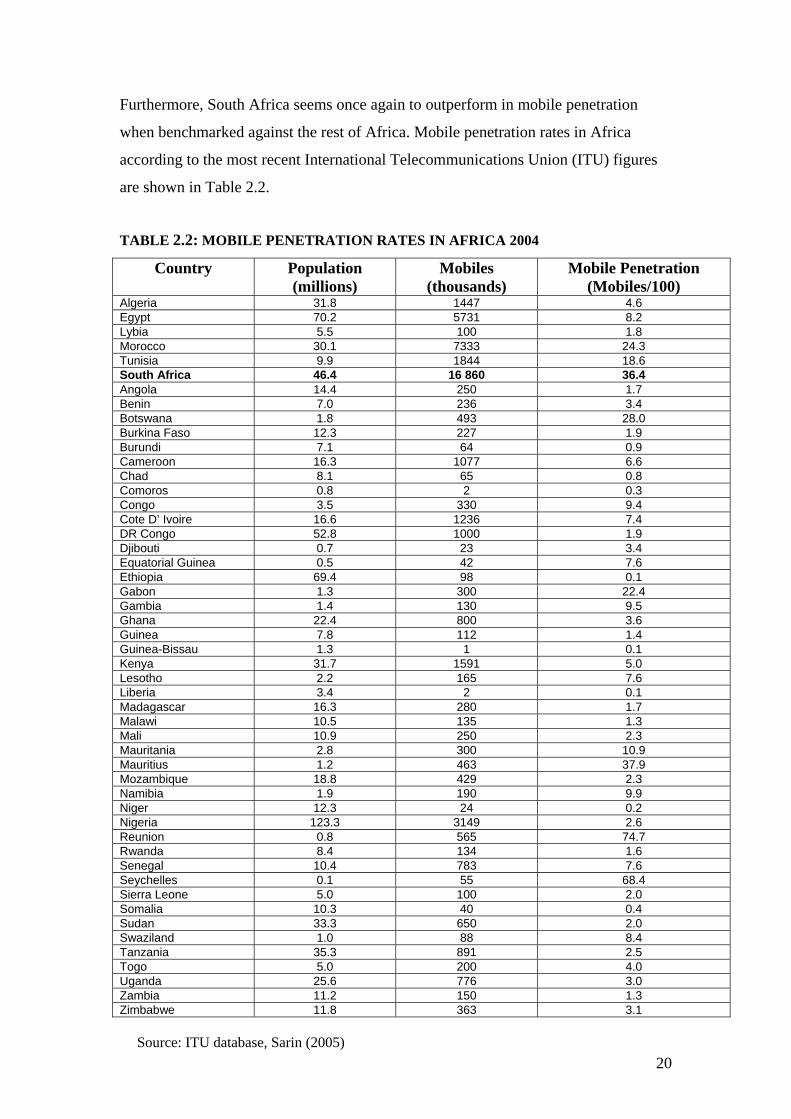
Furthermore, South Africa seems once again to outperform in mobile penetration
when benchmarked against the rest of Africa. Mobile penetration rates in Africa
according to the most recent International Telecommunications Union (ITU) figures
are shown in Table 2.2.
TABLE 2.2: MOBILE PENETRATION RATES IN AFRICA 2004
Country Population (millions)
Mobiles (thousands)
Mobile Penetration (Mobiles/100)
Algeria 31.8 1447 4.6 Egypt 70.2 5731 8.2 Lybia 5.5 100 1.8 Morocco 30.1 7333 24.3 Tunisia 9.9 1844 18.6 South Africa 46.4 16 860 36.4 Angola 14.4 250 1.7 Benin 7.0 236 3.4 Botswana 1.8 493 28.0 Burkina Faso 12.3 227 1.9 Burundi 7.1 64 0.9 Cameroon 16.3 1077 6.6 Chad 8.1 65 0.8 Comoros 0.8 2 0.3 Congo 3.5 330 9.4 Cote D’ Ivoire 16.6 1236 7.4 DR Congo 52.8 1000 1.9 Djibouti 0.7 23 3.4 Equatorial Guinea 0.5 42 7.6 Ethiopia 69.4 98 0.1 Gabon 1.3 300 22.4 Gambia 1.4 130 9.5 Ghana 22.4 800 3.6 Guinea 7.8 112 1.4 Guinea-Bissau 1.3 1 0.1 Kenya 31.7 1591 5.0 Lesotho 2.2 165 7.6 Liberia 3.4 2 0.1 Madagascar 16.3 280 1.7 Malawi 10.5 135 1.3 Mali 10.9 250 2.3 Mauritania 2.8 300 10.9 Mauritius 1.2 463 37.9 Mozambique 18.8 429 2.3 Namibia 1.9 190 9.9 Niger 12.3 24 0.2 Nigeria 123.3 3149 2.6 Reunion 0.8 565 74.7 Rwanda 8.4 134 1.6 Senegal 10.4 783 7.6 Seychelles 0.1 55 68.4 Sierra Leone 5.0 100 2.0 Somalia 10.3 40 0.4 Sudan 33.3 650 2.0 Swaziland 1.0 88 8.4 Tanzania 35.3 891 2.5 Togo 5.0 200 4.0 Uganda 25.6 776 3.0 Zambia 11.2 150 1.3 Zimbabwe 11.8 363 3.1
20Source: ITU database, Sarin (2005)
Mobile penetration rates in Africa ranged from 0.1 per 100 in Guinea-Bissau and 0.14
in Ethiopia to 68.18 percent in Seychelles and 74.14 percent in Reunion according to
Table 2.2 (Sarin, 2005). Penetration rates lie in the 20-40 % range in most of the
continent’s biggest economies, except for Egypt (8.26%) and Nigeria (2.55%) (Sarin,
2005:6).
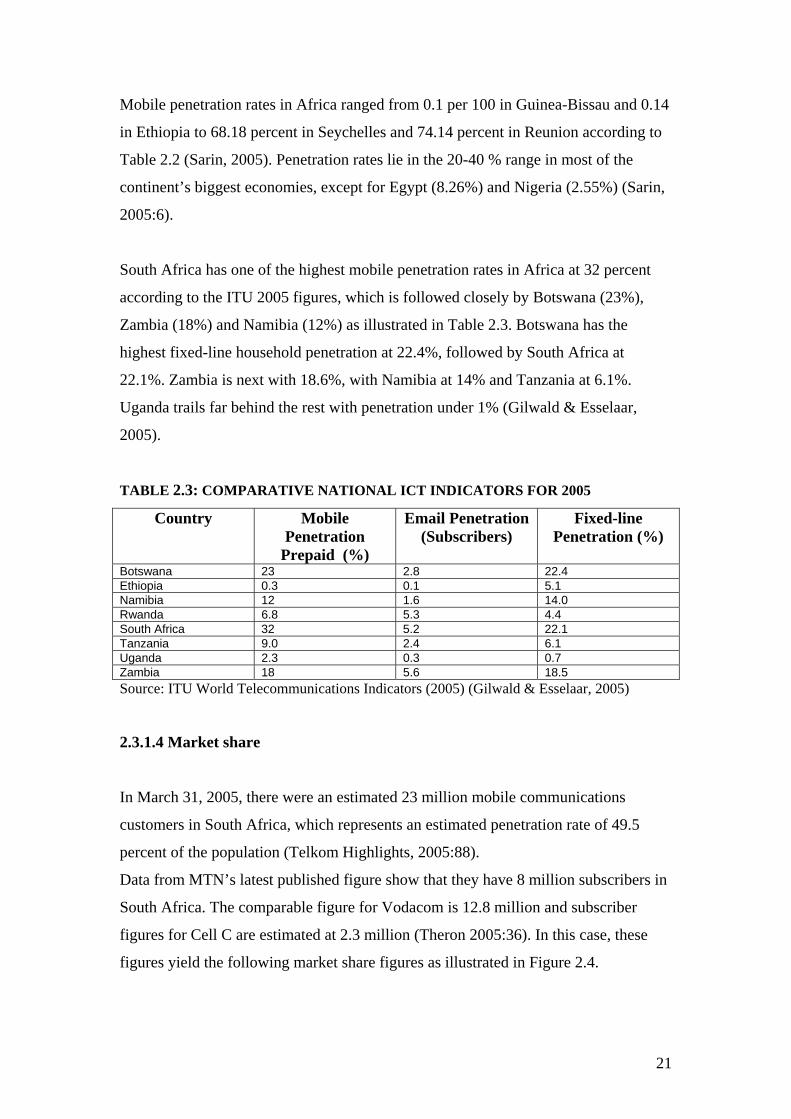
South Africa has one of the highest mobile penetration rates in Africa at 32 percent
according to the ITU 2005 figures, which is followed closely by Botswana (23%),
Zambia (18%) and Namibia (12%) as illustrated in Table 2.3. Botswana has the
highest fixed-line household penetration at 22.4%, followed by South Africa at
22.1%. Zambia is next with 18.6%, with Namibia at 14% and Tanzania at 6.1%.
Uganda trails far behind the rest with penetration under 1% (Gilwald & Esselaar,
2005).
TABLE 2.3: COMPARATIVE NATIONAL ICT INDICATORS FOR 2005
Country Mobile Penetration
Prepaid (%)
Email Penetration(Subscribers)
Fixed-line Penetration (%)
Botswana 23 2.8 22.4 Ethiopia 0.3 0.1 5.1 Namibia 12 1.6 14.0 Rwanda 6.8 5.3 4.4 South Africa 32 5.2 22.1 Tanzania 9.0 2.4 6.1 Uganda 2.3 0.3 0.7 Zambia 18 5.6 18.5 Source: ITU World Telecommunications Indicators (2005) (Gilwald & Esselaar, 2005)
2.3.1.4 Market share
In March 31, 2005, there were an estimated 23 million mobile communications
customers in South Africa, which represents an estimated penetration rate of 49.5
percent of the population (Telkom Highlights, 2005:88).
Data from MTN’s latest published figure show that they have 8 million subscribers in
South Africa. The comparable figure for Vodacom is 12.8 million and subscriber
figures for Cell C are estimated at 2.3 million (Theron 2005:36). In this case, these
figures yield the following market share figures as illustrated in Figure 2.4.
21
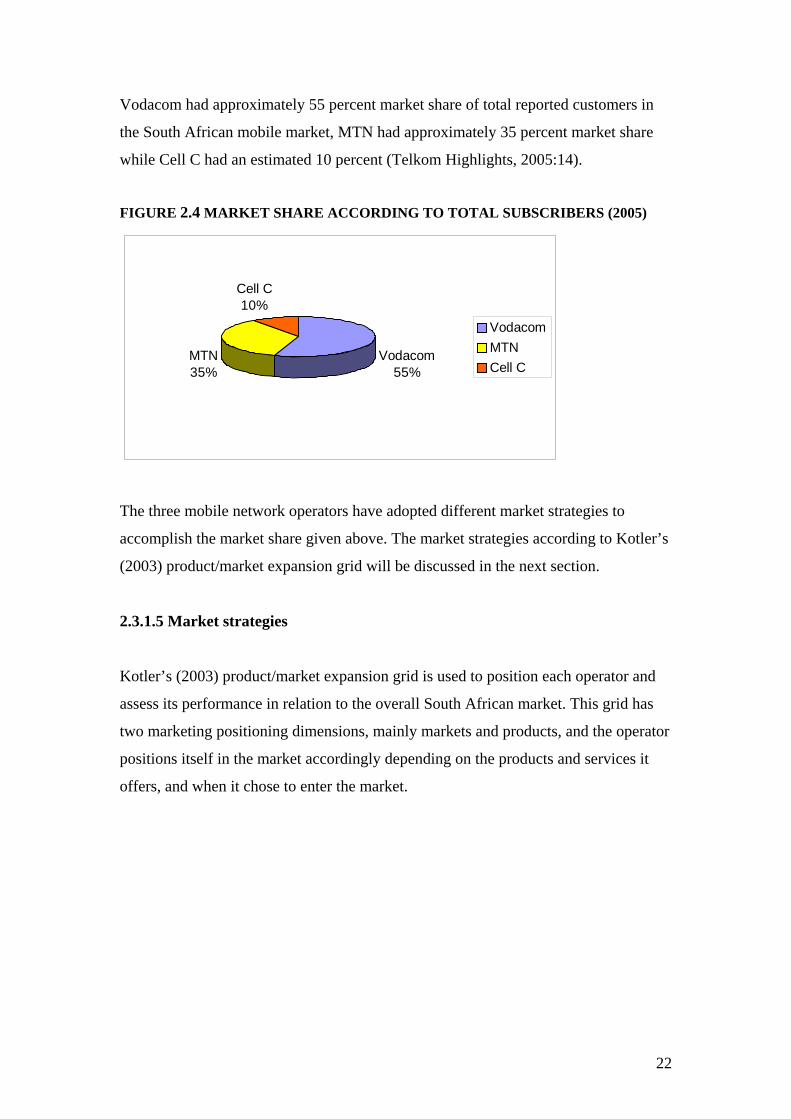
Vodacom had approximately 55 percent market share of total reported customers in
the South African mobile market, MTN had approximately 35 percent market share
while Cell C had an estimated 10 percent (Telkom Highlights, 2005:14).
FIGURE 2.4 MARKET SHARE ACCORDING TO TOTAL SUBSCRIBERS (2005)
Vodacom55%
MTN35%
Cell C10%
VodacomMTNCell C
The three mobile network operators have adopted different market strategies to
accomplish the market share given above. The market strategies according to Kotler’s
(2003) product/market expansion grid will be discussed in the next section.
2.3.1.5 Market strategies
Kotler’s (2003) product/market expansion grid is used to position each operator and
assess its performance in relation to the overall South African market. This grid has
two marketing positioning dimensions, mainly markets and products, and the operator
positions itself in the market accordingly depending on the products and services it
offers, and when it chose to enter the market.
22
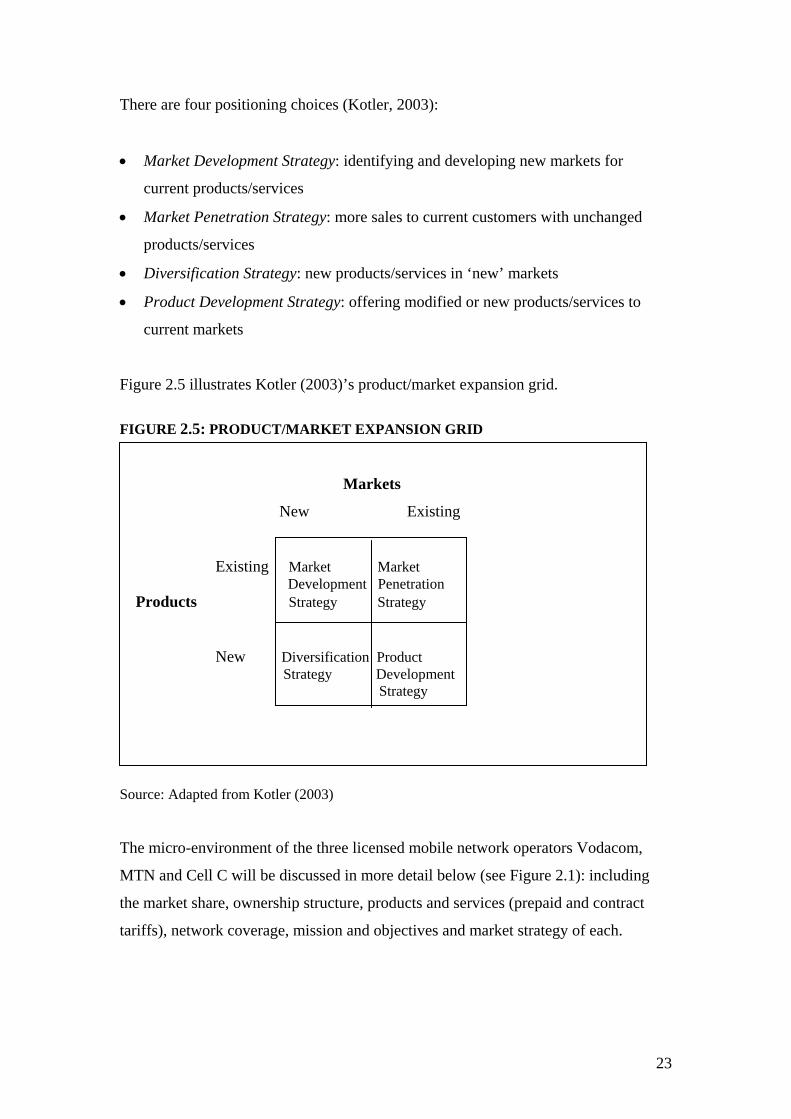
There are four positioning choices (Kotler, 2003):
• Market Development Strategy: identifying and developing new markets for
current products/services
• Market Penetration Strategy: more sales to current customers with unchanged
products/services
• Diversification Strategy: new products/services in ‘new’ markets
• Product Development Strategy: offering modified or new products/services to
current markets
Figure 2.5 illustrates Kotler (2003)’s product/market expansion grid.
FIGURE 2.5: PRODUCT/MARKET EXPANSION GRID Markets
New Existing
Existing Market Market Development Penetration Products Strategy Strategy
New Diversification Product Strategy Development
Strategy
Source: Adapted from Kotler (2003)
The micro-environment of the three licensed mobile network operators Vodacom,
MTN and Cell C will be discussed in more detail below (see Figure 2.1): including
the market share, ownership structure, products and services (prepaid and contract
tariffs), network coverage, mission and objectives and market strategy of each.
23
2.3.2 Vodacom Mobile Network Operator
Vodacom has experienced substantial growth in its mobile customer base since its
inception in 1994 increasing its market share from 54 percent in 2004 to an estimated
55 percent in 2005. Vodacom is the leading mobile network provider in South Africa
based on the total estimated customers. (Telkom Highlights, 2005:88).
Vodacom has grown fast in terms of revenues, profits, and subscribers and this is
largely attributed to the first-mover advantage it had when commencing with mobile
services on 1 June 1994 (Cant & Machado, 2005:4). Its early access to large amounts
of capital and its main shareholder, Telkom, are two of Vodacom’s key advantages
when it captured the market.
Furthermore, a number of innovative new products, services and technologies were
introduced during last year, such as Third Generation technology (Vodacom was the
first operator to introduce 3G to its customers in South Africa), Vodafone live!, the
GPRS (General Packet Radio Service- Internet connection that is always switched on)
Blackberry and prepaid product offerings, which included fully itemised billing,
prepaid passport, a new 4U Super Six starter pack, enhanced Vodago Super Six starter
pack and airtime transfer (Telkom Highlights, 2005).
2.3.2.1 Vodacom’s market share
As depicted in Figure 2.1 market share is the first component of an MNO’s micro-
environment. Vodacom has retained its leadership in the highly competitive South
African market but although Vodacom has been highly successful in retaining its
market share, the strong competition in the market and the sheer volume of gross
connections have inevitably resulted in a margin squeeze (Vodacom, 2004). However,
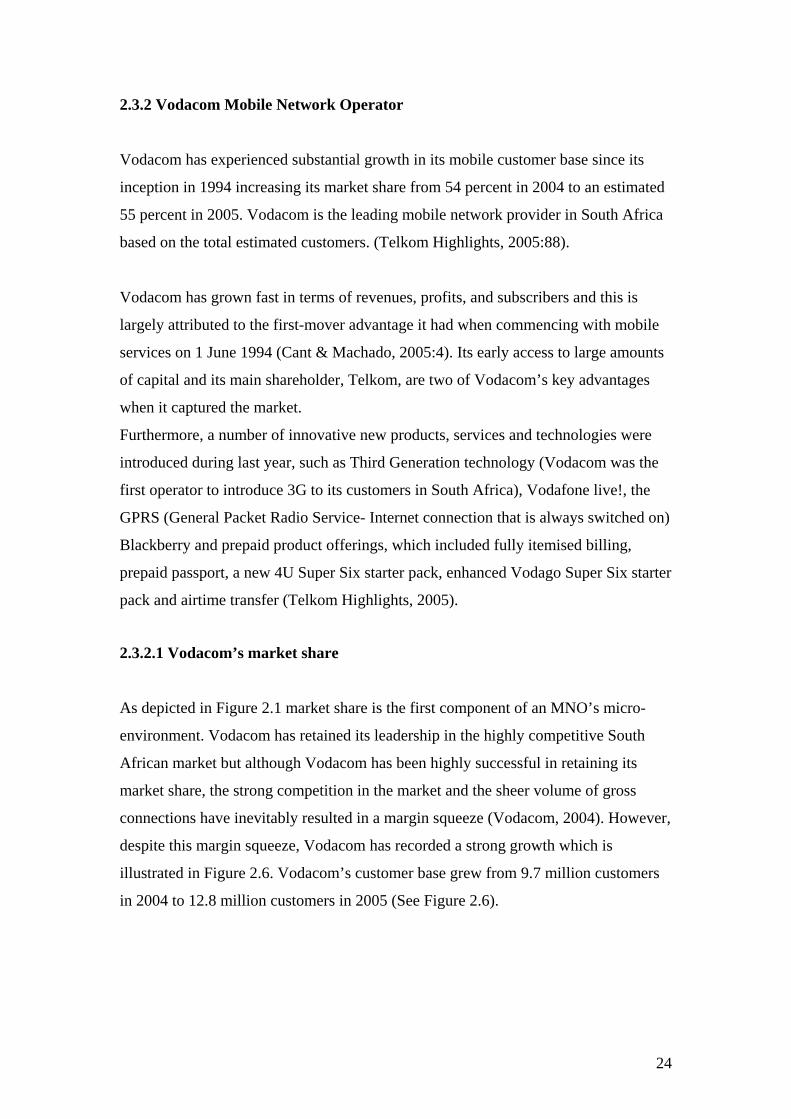
despite this margin squeeze, Vodacom has recorded a strong growth which is
illustrated in Figure 2.6. Vodacom’s customer base grew from 9.7 million customers
in 2004 to 12.8 million customers in 2005 (See Figure 2.6).
24
FIGURE 2.6: VODACOM’S MARKET SHARE
Source: Vodacom Group (Proprietary) Limited For the year ended 31 March 2005 (2005:10)
Although Vodacom has been highly successful in extending its market, it has
experienced mounting competitive pressure, especially from the third placed operator
Cell C, which has grown its market share largely at Vodacom’s expense.
As Figure 2.7 shows, Vodacom’s total subscribers grew from 29.7 percent to 11.2
million subscribers in the year 2004 (Cant & Machado, 2005:5). At this stage,
Vodacom has 15.5 million customers in South Africa alone, an increase of 38 percent
for the year (Vodacom Group Annual Results, 2005).
Vodacom ended March 2005 with 56 percent market share as illustrated by Figure 2.7
(Vodacom Group Annual Results, 2005).
25
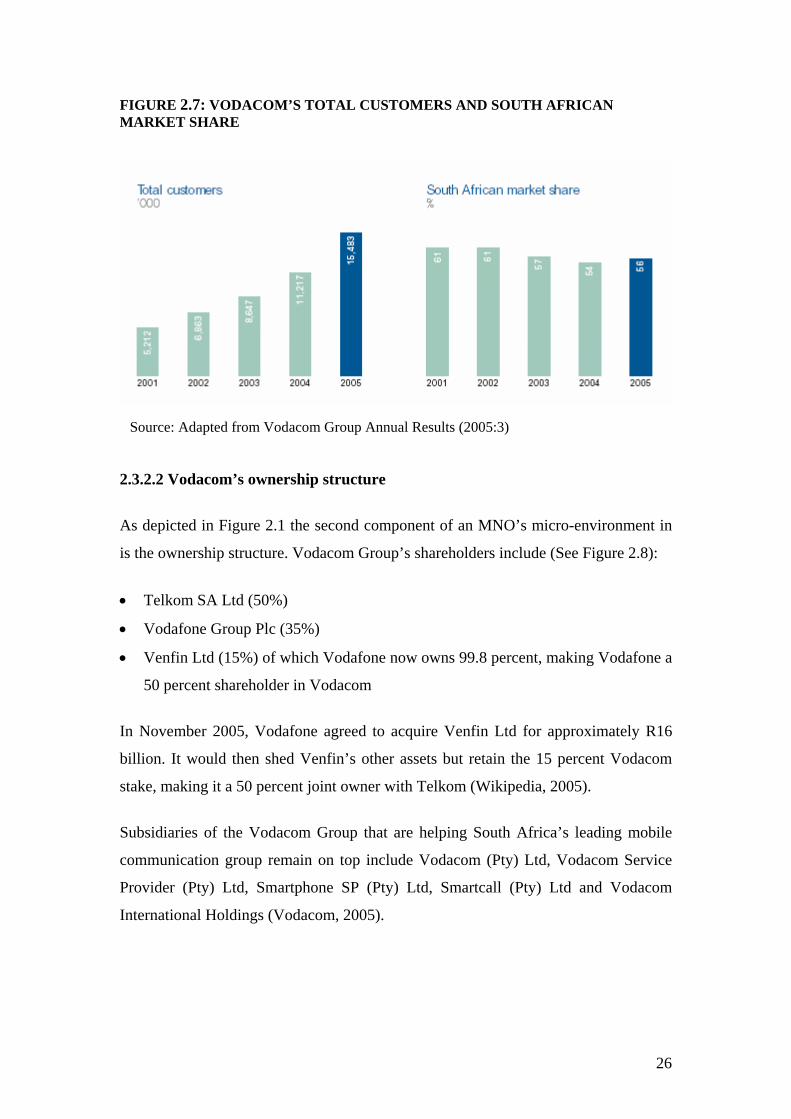
FIGURE 2.7: VODACOM’S TOTAL CUSTOMERS AND SOUTH AFRICAN MARKET SHARE
Source: Adapted from Vodacom Group Annual Results (2005:3)
2.3.2.2 Vodacom’s ownership structure
As depicted in Figure 2.1 the second component of an MNO’s micro-environment in
is the ownership structure. Vodacom Group’s shareholders include (See Figure 2.8):
• Telkom SA Ltd (50%)
• Vodafone Group Plc (35%)
• Venfin Ltd (15%) of which Vodafone now owns 99.8 percent, making Vodafone a
50 percent shareholder in Vodacom
In November 2005, Vodafone agreed to acquire Venfin Ltd for approximately R16
billion. It would then shed Venfin’s other assets but retain the 15 percent Vodacom
stake, making it a 50 percent joint owner with Telkom (Wikipedia, 2005).
Subsidiaries of the Vodacom Group that are helping South Africa’s leading mobile
communication group remain on top include Vodacom (Pty) Ltd, Vodacom Service
Provider (Pty) Ltd, Smartphone SP (Pty) Ltd, Smartcall (Pty) Ltd and Vodacom
International Holdings (Vodacom, 2005).
26
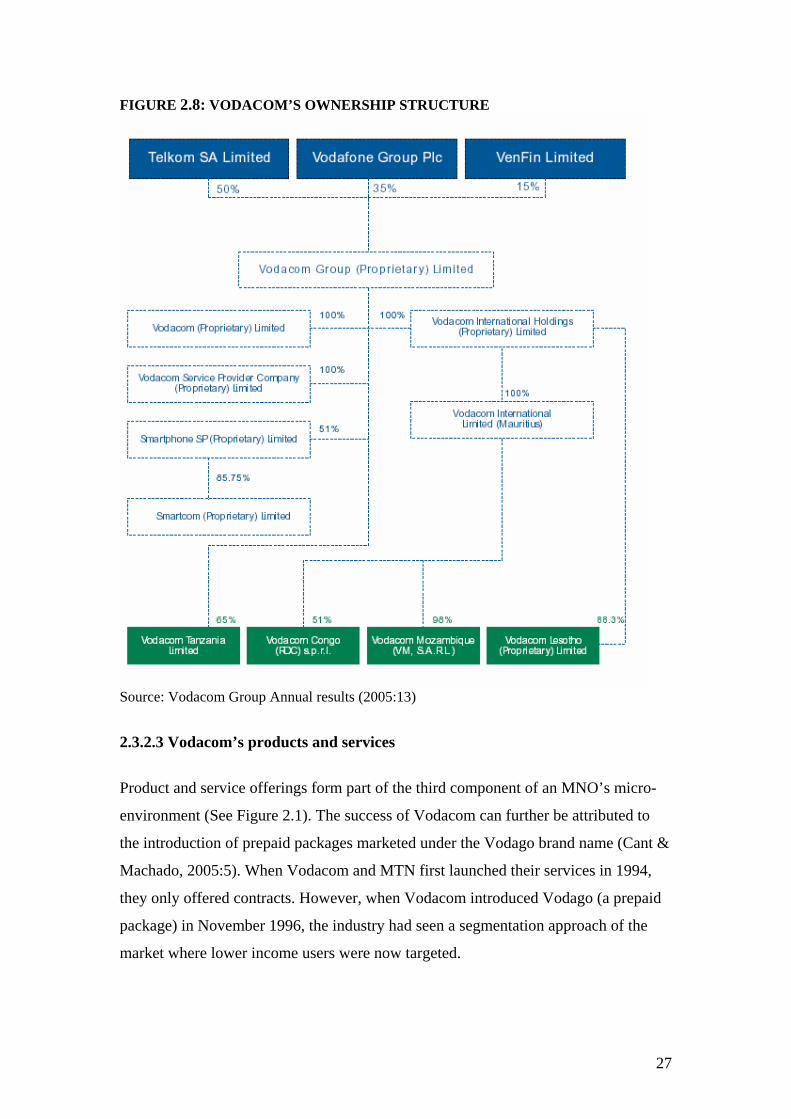
FIGURE 2.8: VODACOM’S OWNERSHIP STRUCTURE
Source: Vodacom Group Annual results (2005:13)
2.3.2.3 Vodacom’s products and services
Product and service offerings form part of the third component of an MNO’s micro-
environment (See Figure 2.1). The success of Vodacom can further be attributed to
the introduction of prepaid packages marketed under the Vodago brand name (Cant &
Machado, 2005:5). When Vodacom and MTN first launched their services in 1994,
they only offered contracts. However, when Vodacom introduced Vodago (a prepaid
package) in November 1996, the industry had seen a segmentation approach of the
market where lower income users were now targeted.
27
This in turn fuelled spectacular growth in the mobile phone industry as the
introduction of a prepaid package option was seen as a solution to unexpected mobile
phone bills and the problem of the poor credit history of some potential customers.
Subscribers on Vodacom’s Vodago program could thus purchase prepaid packages
that provide for unlimited incoming phone calls during a limited time period that
usually ranges from two weeks to six months (African Cellular Statistics, 2004).
In 2001, Vodacom’s Vodago and 4U prepaid packages accounted for 78 percent of all
new connections. The majority of Vodacom’s customers are prepaid customers and at
the end of March 2005, prepaid customers comprised 85.2 percent of the customer
base (Vodacom, 2005). Vodacom offers a number of packages to users: there are
three prepaid options in Vodacom’s prepaid rates (See Table 2.4) and six contract
options (See Table 2.5). The choice of packages and mobile calling plans formed part
of the survey.
On the one hand, Vodacom offers prepaid packages with no monthly subscription
tariff for those users who believe that a monthly subscription tariff is a barrier to entry
(Telkom Highlights, 2005:89). Vodacom has three prepaid packages namely (See
Table 2.4):
• Vodago Standard: For customers who make calls during peak and off-peak
periods
• Vodago Smartstep: For customers who make calls which are longer than one
minute mainly during peak periods
• 4U: For customers who make calls mostly during off-peak periods. This option
has per second billing from the first second and is primarily aimed at the youth
market. In March 2005, 70.7 percent of Vodacom’s prepaid customers comprised
4U customers proving that the 4U package is highly successful (Vodacom, 2005).
SMS charges are the same (80 cents during peak period and 35 cents during off-peak
period) for each prepaid option with only the voice calls varying according to the
package (See Table 2.4).
28
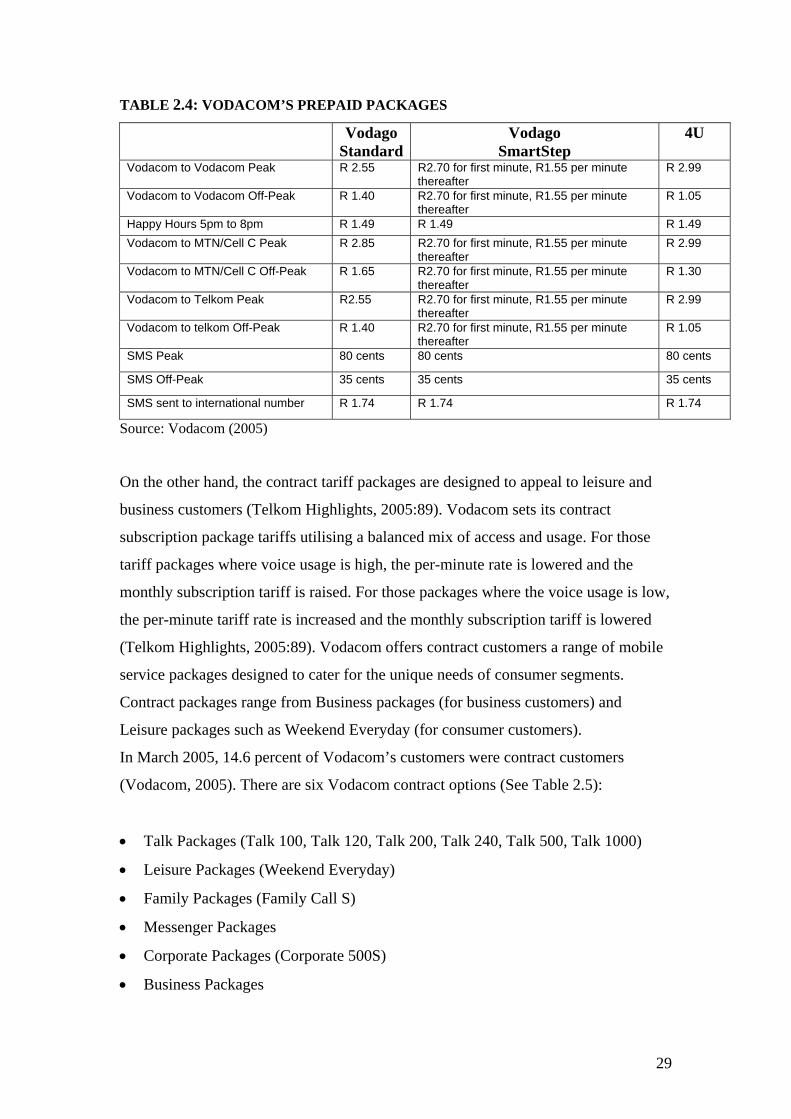
TABLE 2.4: VODACOM’S PREPAID PACKAGES Vodago
StandardVodago
SmartStep 4U
Vodacom to Vodacom Peak R 2.55 R2.70 for first minute, R1.55 per minute thereafter
R 2.99
Vodacom to Vodacom Off-Peak R 1.40 R2.70 for first minute, R1.55 per minute thereafter
R 1.05
Happy Hours 5pm to 8pm R 1.49 R 1.49 R 1.49 Vodacom to MTN/Cell C Peak R 2.85 R2.70 for first minute, R1.55 per minute
thereafter R 2.99
Vodacom to MTN/Cell C Off-Peak R 1.65 R2.70 for first minute, R1.55 per minute thereafter
R 1.30
Vodacom to Telkom Peak R2.55 R2.70 for first minute, R1.55 per minute thereafter
R 2.99
Vodacom to telkom Off-Peak R 1.40 R2.70 for first minute, R1.55 per minute thereafter
R 1.05
SMS Peak 80 cents 80 cents 80 cents
SMS Off-Peak 35 cents 35 cents 35 cents
SMS sent to international number R 1.74 R 1.74 R 1.74
Source: Vodacom (2005)
On the other hand, the contract tariff packages are designed to appeal to leisure and
business customers (Telkom Highlights, 2005:89). Vodacom sets its contract
subscription package tariffs utilising a balanced mix of access and usage. For those
tariff packages where voice usage is high, the per-minute rate is lowered and the
monthly subscription tariff is raised. For those packages where the voice usage is low,
the per-minute tariff rate is increased and the monthly subscription tariff is lowered
(Telkom Highlights, 2005:89). Vodacom offers contract customers a range of mobile
service packages designed to cater for the unique needs of consumer segments.
Contract packages range from Business packages (for business customers) and
Leisure packages such as Weekend Everyday (for consumer customers).
In March 2005, 14.6 percent of Vodacom’s customers were contract customers
(Vodacom, 2005). There are six Vodacom contract options (See Table 2.5):
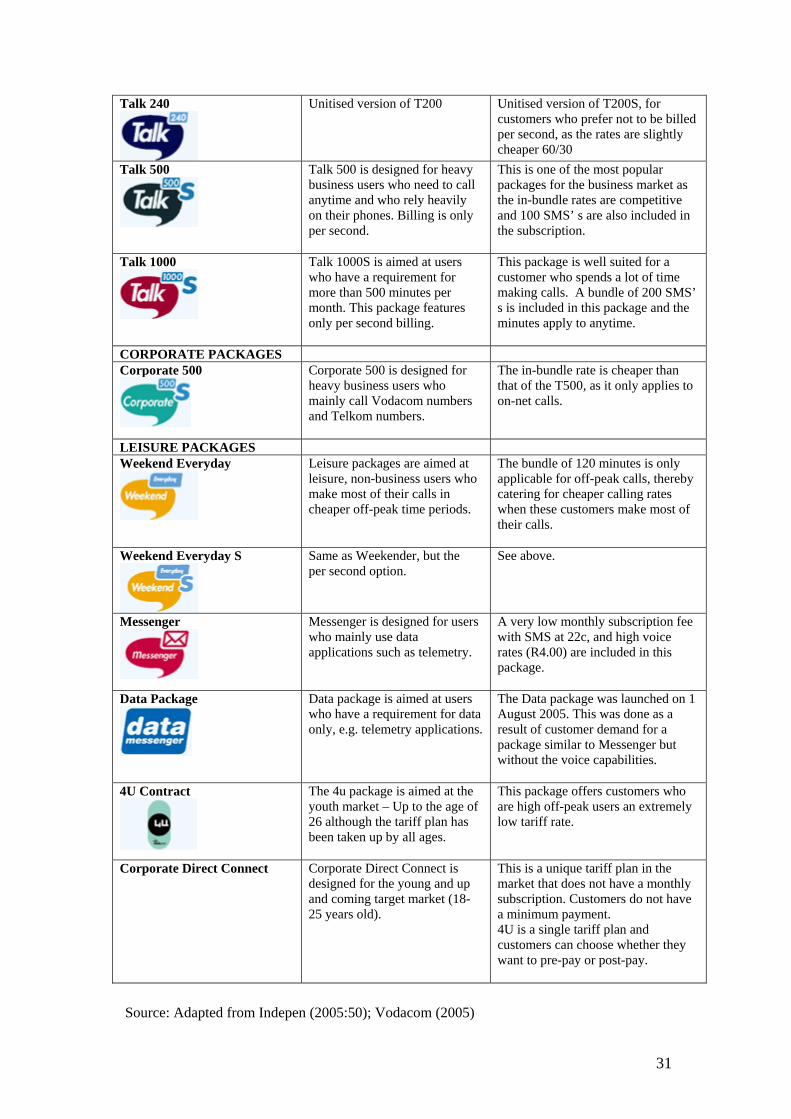
• Talk Packages (Talk 100, Talk 120, Talk 200, Talk 240, Talk 500, Talk 1000)
• Leisure Packages (Weekend Everyday)
• Family Packages (Family Call S)
• Messenger Packages
• Corporate Packages (Corporate 500S)
• Business Packages
29
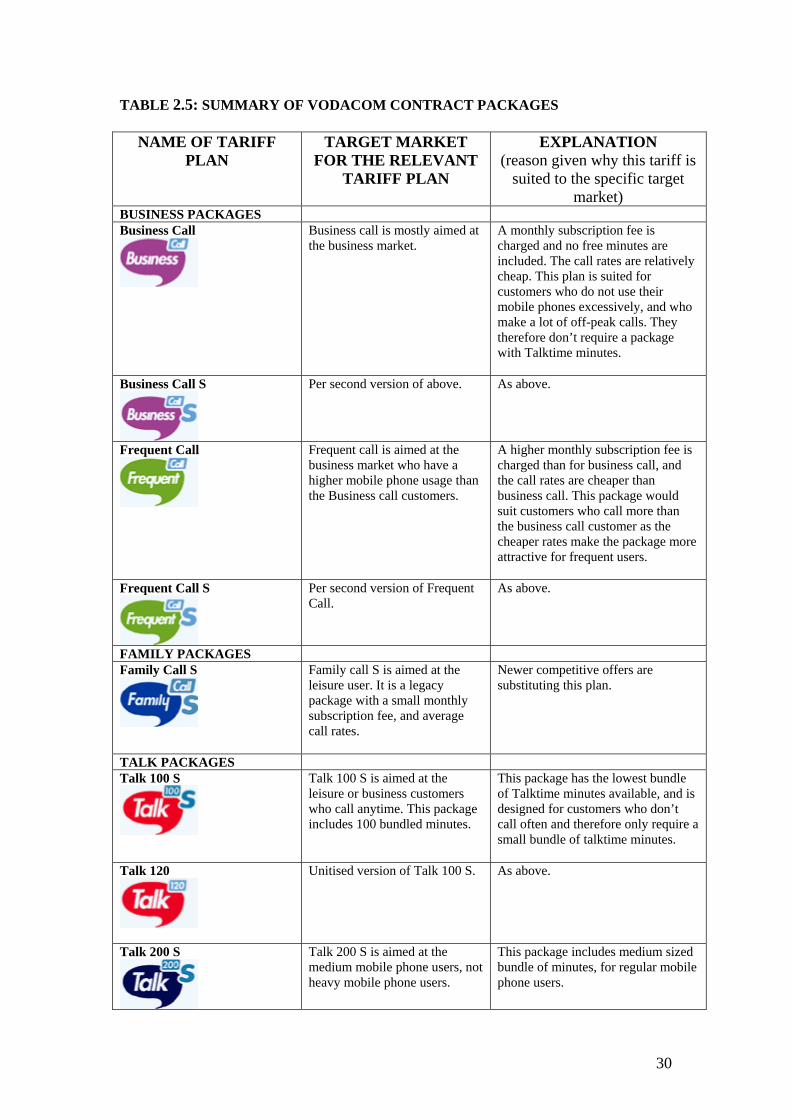
TABLE 2.5: SUMMARY OF VODACOM CONTRACT PACKAGES
NAME OF TARIFF PLAN
TARGET MARKET FOR THE RELEVANT
TARIFF PLAN
EXPLANATION (reason given why this tariff is
suited to the specific target market)
BUSINESS PACKAGES Business Call
Business call is mostly aimed at the business market.
A monthly subscription fee is charged and no free minutes are included. The call rates are relatively cheap. This plan is suited for customers who do not use their mobile phones excessively, and who make a lot of off-peak calls. They therefore don’t require a package with Talktime minutes.
Business Call S
Per second version of above. As above.
Frequent Call
Frequent call is aimed at the business market who have a higher mobile phone usage than the Business call customers.
A higher monthly subscription fee is charged than for business call, and the call rates are cheaper than business call. This package would suit customers who call more than the business call customer as the cheaper rates make the package more attractive for frequent users.
Frequent Call S
Per second version of Frequent Call.
As above.
FAMILY PACKAGES Family Call S
Family call S is aimed at the leisure user. It is a legacy package with a small monthly subscription fee, and average call rates.
Newer competitive offers are substituting this plan.
TALK PACKAGES Talk 100 S
Talk 100 S is aimed at the leisure or business customers who call anytime. This package includes 100 bundled minutes.
This package has the lowest bundle of Talktime minutes available, and is designed for customers who don’t call often and therefore only require a small bundle of talktime minutes.
Talk 120
Unitised version of Talk 100 S. As above.
Talk 200 S
Talk 200 S is aimed at the medium mobile phone users, not heavy mobile phone users.
This package includes medium sized bundle of minutes, for regular mobile phone users.
30
Talk 240
Unitised version of T200
Unitised version of T200S, for customers who prefer not to be billed per second, as the rates are slightly cheaper 60/30
Talk 500
Talk 500 is designed for heavy business users who need to call anytime and who rely heavily on their phones. Billing is only per second.
This is one of the most popular packages for the business market as the in-bundle rates are competitive and 100 SMS’ s are also included in the subscription.
Talk 1000
Talk 1000S is aimed at users who have a requirement for more than 500 minutes per month. This package features only per second billing.
This package is well suited for a customer who spends a lot of time making calls. A bundle of 200 SMS’ s is included in this package and the minutes apply to anytime.
CORPORATE PACKAGES Corporate 500
Corporate 500 is designed for heavy business users who mainly call Vodacom numbers and Telkom numbers.
The in-bundle rate is cheaper than that of the T500, as it only applies to on-net calls.
LEISURE PACKAGES Weekend Everyday
Leisure packages are aimed at leisure, non-business users who make most of their calls in cheaper off-peak time periods.
The bundle of 120 minutes is only applicable for off-peak calls, thereby catering for cheaper calling rates when these customers make most of their calls.
Weekend Everyday S
Same as Weekender, but the per second option.
See above.
Messenger
Messenger is designed for users who mainly use data applications such as telemetry.
A very low monthly subscription fee with SMS at 22c, and high voice rates (R4.00) are included in this package.
Data Package
Data package is aimed at users who have a requirement for data only, e.g. telemetry applications.
The Data package was launched on 1 August 2005. This was done as a result of customer demand for a package similar to Messenger but without the voice capabilities.
4U Contract
The 4u package is aimed at the youth market – Up to the age of 26 although the tariff plan has been taken up by all ages.
This package offers customers who are high off-peak users an extremely low tariff rate.
Corporate Direct Connect Corporate Direct Connect is designed for the young and up and coming target market (18-25 years old).
This is a unique tariff plan in the market that does not have a monthly subscription. Customers do not have a minimum payment. 4U is a single tariff plan and customers can choose whether they want to pre-pay or post-pay.
Source: Adapted from Indepen (2005:50); Vodacom (2005)
31
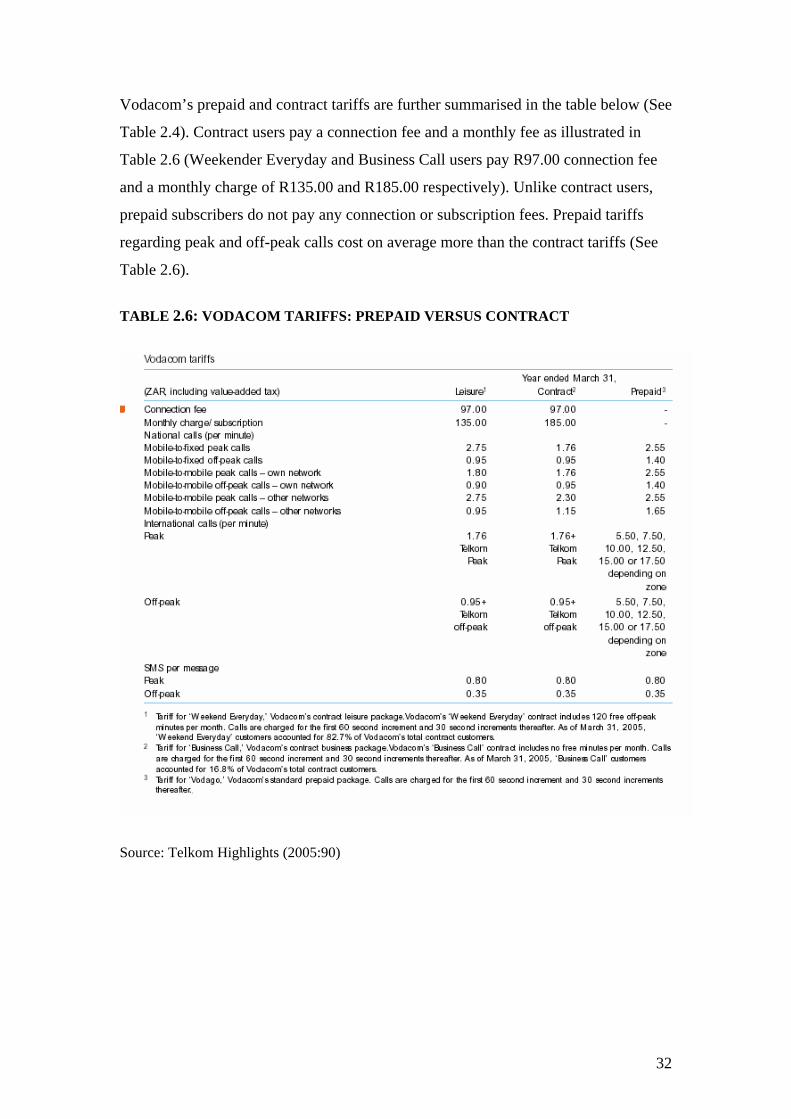
Vodacom’s prepaid and contract tariffs are further summarised in the table below (See
Table 2.4). Contract users pay a connection fee and a monthly fee as illustrated in
Table 2.6 (Weekender Everyday and Business Call users pay R97.00 connection fee
and a monthly charge of R135.00 and R185.00 respectively). Unlike contract users,
prepaid subscribers do not pay any connection or subscription fees. Prepaid tariffs
regarding peak and off-peak calls cost on average more than the contract tariffs (See
Table 2.6).
TABLE 2.6: VODACOM TARIFFS: PREPAID VERSUS CONTRACT
Source: Telkom Highlights (2005:90)
32
Telecommunications companies in South Africa had recently come under fire for
charging uncompetitive high prices for their services, placing a burden on individuals
and businesses, and hampering economic growth (South African Good News, 2005).
The mobile operators were accused of raking in enormous profits at the expense of the
consumer and the country as a whole. In response, Vodacom started offering the
cheapest peak-time call tariff in the world on the 29 August 2005. Vodacom cut
prepaid tariffs twice in a week, arguing the new rates would attract more customers
from the lower end of the market. The first cut prompted a drop in the share price of
MTN and Vodacom’s majority shareholder Telkom.
The new tariff, which unfortunately only applies to Vodacom-to-Vodacom calls, saw
a standard on-network call rate of R1.49 per minute (including VAT) for prepaid and
contract customers (South African Good News, 2005).
The new rate also meant that Vodacom offered its customers the cheapest peak time
video call tariff in the world. The new tariff was effective immediately for all prepaid
customers with no special subscription, starter pack or mobile phone number required
and from 1 October for all contract subscribers, subject to ICASA’s approval (South
African Good News, 2005).
Having discussed the prepaid and contract rates, it is also important to understand the
services the mobile network operators offer. New emerging mobile applications have
been developed and some in particular may appeal to the youth market such as:
enhanced text messaging (SMS), multi media messaging (MMS), wireless application
protocol (WAP), mobile gaming, enhanced ringtones and sending pictures. All of
these will be discussed in more detail below.
33
2.3.2.4 Mobile applications
• Text messaging (SMS)
Text messaging, or short messaging system (SMS) as it is more commonly known, is
the most widely used application. Available sources have found that Generation Y
consumers love to text as text messaging is an extremely user-friendly medium and
relatively cheap compared with a mobile phone call (Spero & Stone, 2004:157).
Taylor and Harper (2002:4) found that “the use of SMS was ubiquitous and that
young people’s motivations for texting seemed normative, complex and deeply rooted
in their perceptions of social relations.” The authors showed how mobile phones
provided young people with a means of gift-giving in the form of SMS messages that
embody shared meanings thus providing them with new ways of sustaining their
relationships and reaffirming friendships. According to Spero and Stone (2004:157)
these rituals have always been played out, but immediate access, flexibility, and
privacy are newfound considerations associated with the increased use of text
messaging.
According to Cheskin (2001:19) mobile phones that combine voice communications
and text messaging seem to be more successful in satisfying the behavioural needs of
the youth market. Predictive text and new keypad interfaces makes text messaging
easier. Cheskin (2001:19) defines predictive text as “a technology embedded in the
mobile phone that uses a built-in dictionary to predict the word you are trying to spell
as you are typing it. You can write by pressing one key per letter, instead of two or
three as an ordinary phone keypad.” Furthermore, code language in text messaging
has been embraced by the youth- for example the use of smiley face icons and words
such as “Great” is spelled “Gr8” (Cheskin, 2001:20).
Furthermore, Cheskin (2001:10) discusses four reasons why text messaging is so
compelling to young people:
34
1) information can be broadcasted immediately and simultaneously to a large group of
people
2) does not disrupt current interactions the same way as a phone call does
3) allows for anonymity and convenience of message delivery
4) allows the youth to adopt multiple personalities with different friends.
• Wireless Application Protocol (WAP)
Wireless Application Protocol (WAP) allows users to browse the Internet using their
mobile phones. WAP has never really taken off in South Africa as a result of cost, yet
it appears that very few are willing to buy a phone without that particular feature.
• Wireless mobile gaming
Mobile gaming has become a regular activity for mobile phone users especially
among young people. Games like Snake, Memory, and Sports have been taken to a
whole new level. According to Cheskin (2001) most wireless games are designed for
short play sessions of about three to five minutes to alleviate boredom.
“Since teens and adults are used to a high level of stimulus, this “gap-filling” quality
of wireless games takes advantage of a timeless behavioural pattern of young people”
(Cheskin, 2001:21).
• Music downloads
Downloading music into mobile phones has not taken off yet here in South Africa as a
result of limited bandwidth of the current 2G wireless infrastructure. Third generation
applications (3G) will allow faster downloads of music hence making it a more viable
feature in mobile phones. Downloading ringtones is another opportunity for music in
mobile phones. Many websites offer this service where ringtones can be emailed
directly into phones (Cheskin, 2001:24).
35
• Sending pictures and photos
The capabilities of sending images and audio will become more prominent with third
generation applications (3G). The introduction of Multimedia Message Service
(MMS) or Enhanced Messaging Service (EMS) has enhanced the Short Messaging
System (SMS) to allow for the transmission of audio (sound) and images (pictures,
graphics and animation) along with text. Combining a digital camera with a mobile
phone has been one of the features given interest by the young market according to
Cheskin (2001). This will not only help young people in personalising their
communication but will also allow them to be more socially expressive.
In the next section, Vodacom’s network and coverage will be discussed.
2.3.2.5 Vodacom’s network
Vodacom’s coverage, the fourth component of an MNO’ s micro-environment (See
Figure 2.1), is achieved using a GSM 900 technology network. Some of the services
offered are voice, mobile data and fax, voicemail message and callback. The major
equipment suppliers are Siemens, Alcatel and Motorola. On the African continent,
Vodacom operates in South Africa, Tanzania, Lesotho, Mozambique and the
Democratic Republic of Congo (refer to Figure 2.8).
Vodacom Tanzania has further consolidated its position as market leader in that
country with a 57 percent market share at year-end. The Tanzanian market remains
highly competitive but it still promises further potential (Vodacom, 2005).
Vodacom Congo has significantly grown its market share since the re-launch of the
operation under the Vodacom brand in May 2002 and has increased its market share
from 9 percent at that time to 47 percent at year-end. Vodacom Congo has the lowest
estimated mobile penetration of all of Vodacom’s African operations (Vodacom,
2005).
Vodacom Lesotho has positioned itself to capitalise on any future market growth and
minimise the impact of competitive activity. It has positioned itself well to minimise
the impact of competitive activity and has maintained 80 percent market share.
36
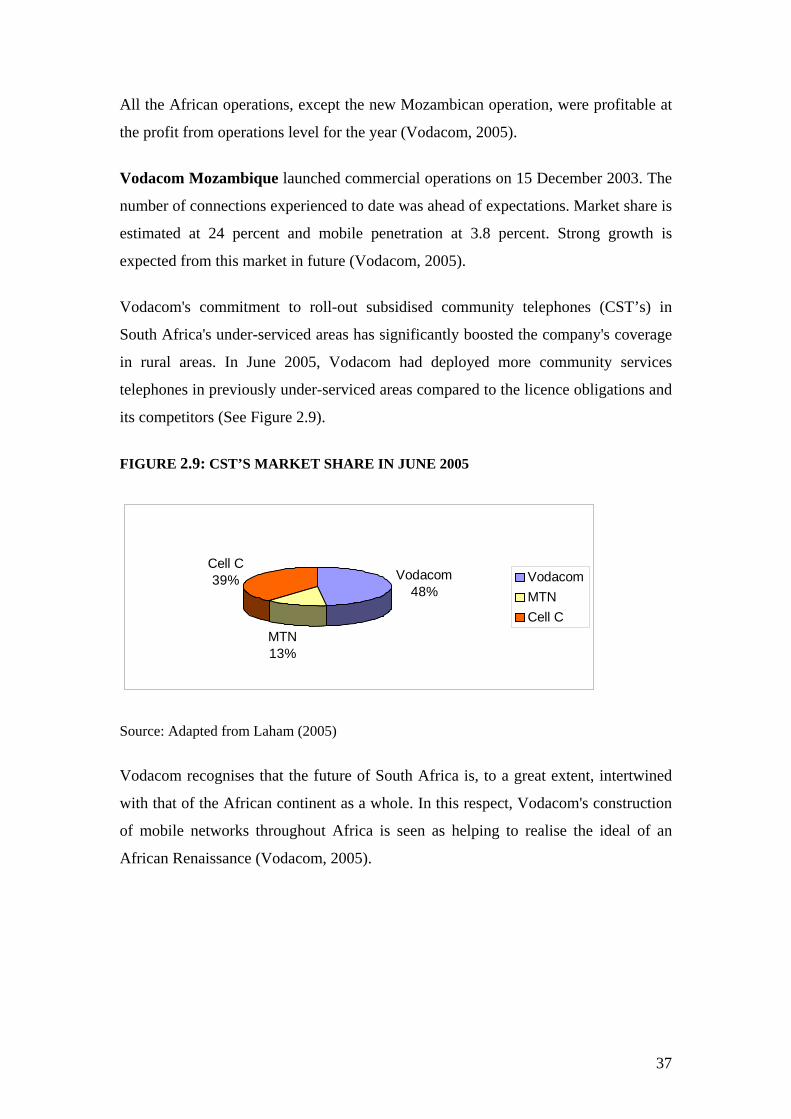
All the African operations, except the new Mozambican operation, were profitable at
the profit from operations level for the year (Vodacom, 2005).
Vodacom Mozambique launched commercial operations on 15 December 2003. The
number of connections experienced to date was ahead of expectations. Market share is
estimated at 24 percent and mobile penetration at 3.8 percent. Strong growth is
expected from this market in future (Vodacom, 2005).
Vodacom's commitment to roll-out subsidised community telephones (CST’s) in
South Africa's under-serviced areas has significantly boosted the company's coverage
in rural areas. In June 2005, Vodacom had deployed more community services
telephones in previously under-serviced areas compared to the licence obligations and
its competitors (See Figure 2.9).
FIGURE 2.9: CST’S MARKET SHARE IN JUNE 2005
Vodacom48%
MTN13%
Cell C39% Vodacom
MTNCell C
Source: Adapted from Laham (2005)
Vodacom recognises that the future of South Africa is, to a great extent, intertwined
with that of the African continent as a whole. In this respect, Vodacom's construction
of mobile networks throughout Africa is seen as helping to realise the ideal of an
African Renaissance (Vodacom, 2005).
37
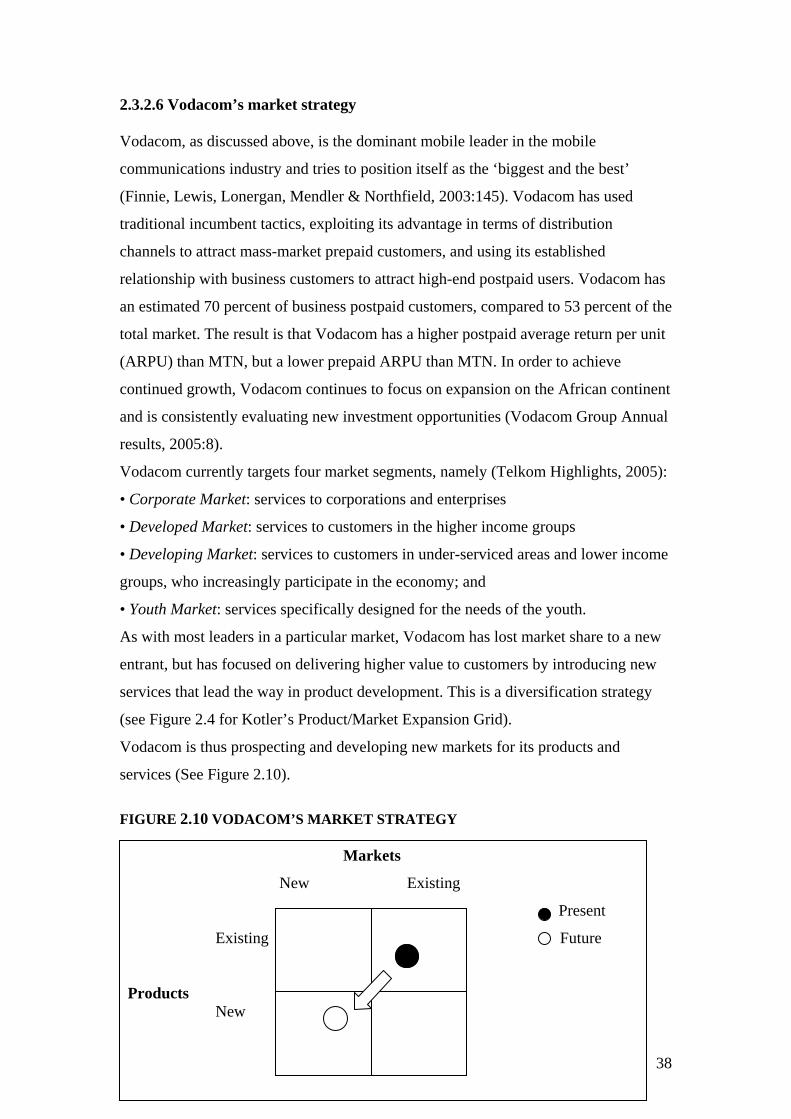
2.3.2.6 Vodacom’s market strategy Vodacom, as discussed above, is the dominant mobile leader in the mobile
communications industry and tries to position itself as the ‘biggest and the best’
(Finnie, Lewis, Lonergan, Mendler & Northfield, 2003:145). Vodacom has used
traditional incumbent tactics, exploiting its advantage in terms of distribution
channels to attract mass-market prepaid customers, and using its established
relationship with business customers to attract high-end postpaid users. Vodacom has
an estimated 70 percent of business postpaid customers, compared to 53 percent of the
total market. The result is that Vodacom has a higher postpaid average return per unit
(ARPU) than MTN, but a lower prepaid ARPU than MTN. In order to achieve
continued growth, Vodacom continues to focus on expansion on the African continent
and is consistently evaluating new investment opportunities (Vodacom Group Annual
results, 2005:8).
Vodacom currently targets four market segments, namely (Telkom Highlights, 2005):
• Corporate Market: services to corporations and enterprises
• Developed Market: services to customers in the higher income groups
• Developing Market: services to customers in under-serviced areas and lower income
groups, who increasingly participate in the economy; and
• Youth Market: services specifically designed for the needs of the youth.
As with most leaders in a particular market, Vodacom has lost market share to a new
entrant, but has focused on delivering higher value to customers by introducing new
services that lead the way in product development. This is a diversification strategy
(see Figure 2.4 for Kotler’s Product/Market Expansion Grid).
Vodacom is thus prospecting and developing new markets for its products and
services (See Figure 2.10).
FIGURE 2.10 VODACOM’S MARKET STRATEGY Markets
New Existing
Present
Existing Future
Products New
38
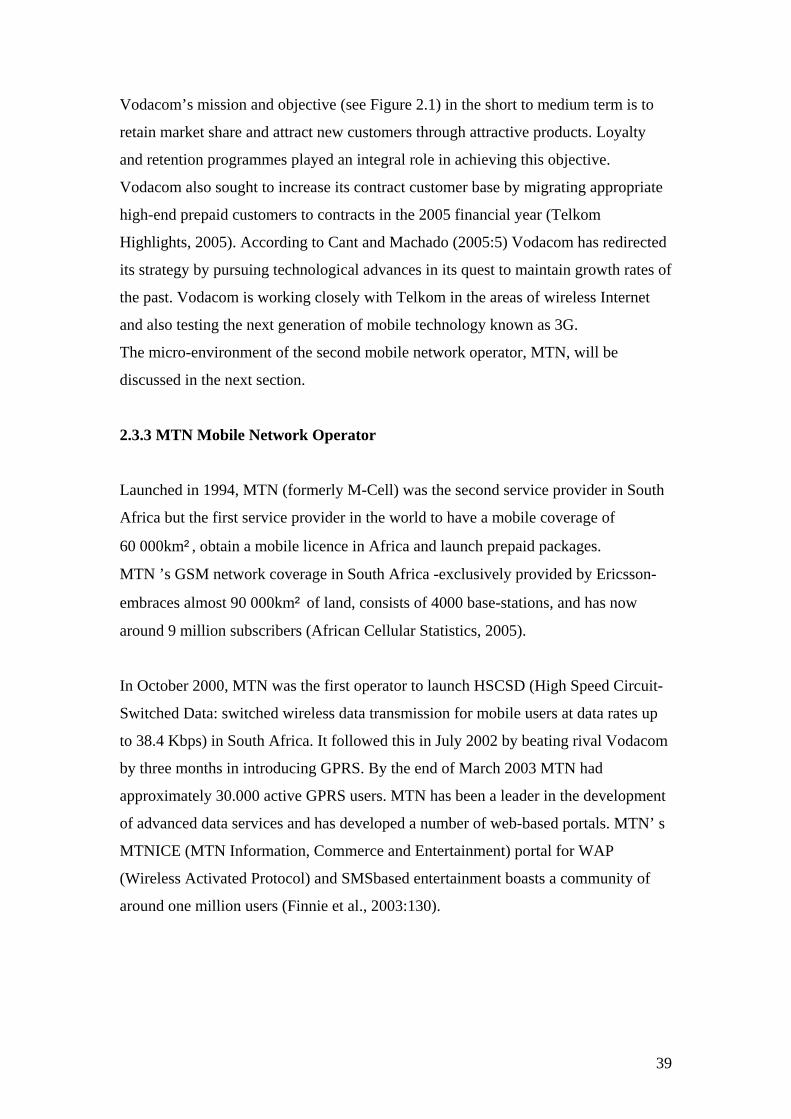
Vodacom’s mission and objective (see Figure 2.1) in the short to medium term is to
retain market share and attract new customers through attractive products. Loyalty
and retention programmes played an integral role in achieving this objective.
Vodacom also sought to increase its contract customer base by migrating appropriate
high-end prepaid customers to contracts in the 2005 financial year (Telkom
Highlights, 2005). According to Cant and Machado (2005:5) Vodacom has redirected
its strategy by pursuing technological advances in its quest to maintain growth rates of
the past. Vodacom is working closely with Telkom in the areas of wireless Internet
and also testing the next generation of mobile technology known as 3G.
The micro-environment of the second mobile network operator, MTN, will be
discussed in the next section.
2.3.3 MTN Mobile Network Operator
Launched in 1994, MTN (formerly M-Cell) was the second service provider in South
Africa but the first service provider in the world to have a mobile coverage of
60 000km², obtain a mobile licence in Africa and launch prepaid packages.
MTN ’s GSM network coverage in South Africa -exclusively provided by Ericsson-
embraces almost 90 000km² of land, consists of 4000 base-stations, and has now
around 9 million subscribers (African Cellular Statistics, 2005).
In October 2000, MTN was the first operator to launch HSCSD (High Speed Circuit-
Switched Data: switched wireless data transmission for mobile users at data rates up
to 38.4 Kbps) in South Africa. It followed this in July 2002 by beating rival Vodacom
by three months in introducing GPRS. By the end of March 2003 MTN had
approximately 30.000 active GPRS users. MTN has been a leader in the development
of advanced data services and has developed a number of web-based portals. MTN’ s
MTNICE (MTN Information, Commerce and Entertainment) portal for WAP
(Wireless Activated Protocol) and SMSbased entertainment boasts a community of
around one million users (Finnie et al., 2003:130). Telecommunications M 2003
39
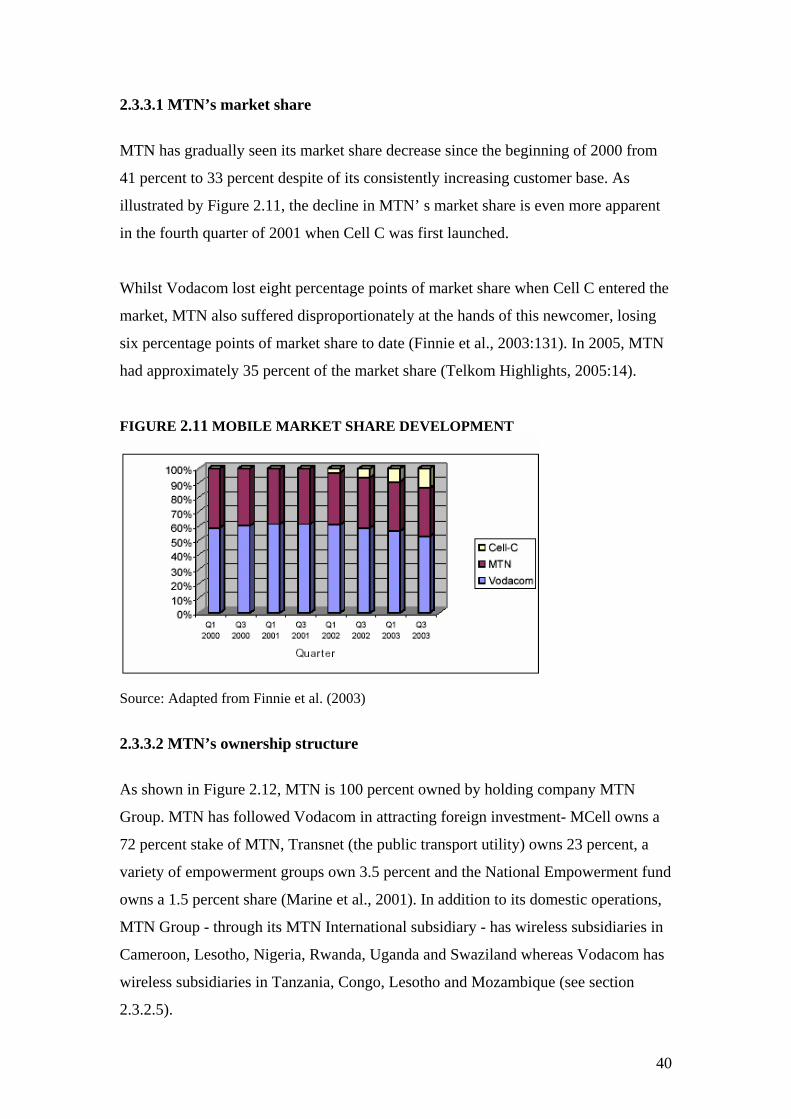
2.3.3.1 MTN’s market share
MTN has gradually seen its market share decrease since the beginning of 2000 from
41 percent to 33 percent despite of its consistently increasing customer base. As
illustrated by Figure 2.11, the decline in MTN’ s market share is even more apparent
in the fourth quarter of 2001 when Cell C was first launched.
Whilst Vodacom lost eight percentage points of market share when Cell C entered the
market, MTN also suffered disproportionately at the hands of this newcomer, losing
six percentage points of market share to date (Finnie et al., 2003:131). In 2005, MTN
had approximately 35 percent of the market share (Telkom Highlights, 2005:14).
FIGURE 2.11 MOBILE MARKET SHARE DEVELOPMENT
Source: Adapted from Finnie et al. (2003)
2.3.3.2 MTN’s ownership structure
As shown in Figure 2.12, MTN is 100 percent owned by holding company MTN
Group. MTN has followed Vodacom in attracting foreign investment- MCell owns a
72 percent stake of MTN, Transnet (the public transport utility) owns 23 percent, a
variety of empowerment groups own 3.5 percent and the National Empowerment fund
owns a 1.5 percent share (Marine et al., 2001). In addition to its domestic operations,
MTN Group - through its MTN International subsidiary - has wireless subsidiaries in
Cameroon, Lesotho, Nigeria, Rwanda, Uganda and Swaziland whereas Vodacom has
wireless subsidiaries in Tanzania, Congo, Lesotho and Mozambique (see section
2.3.2.5).
40
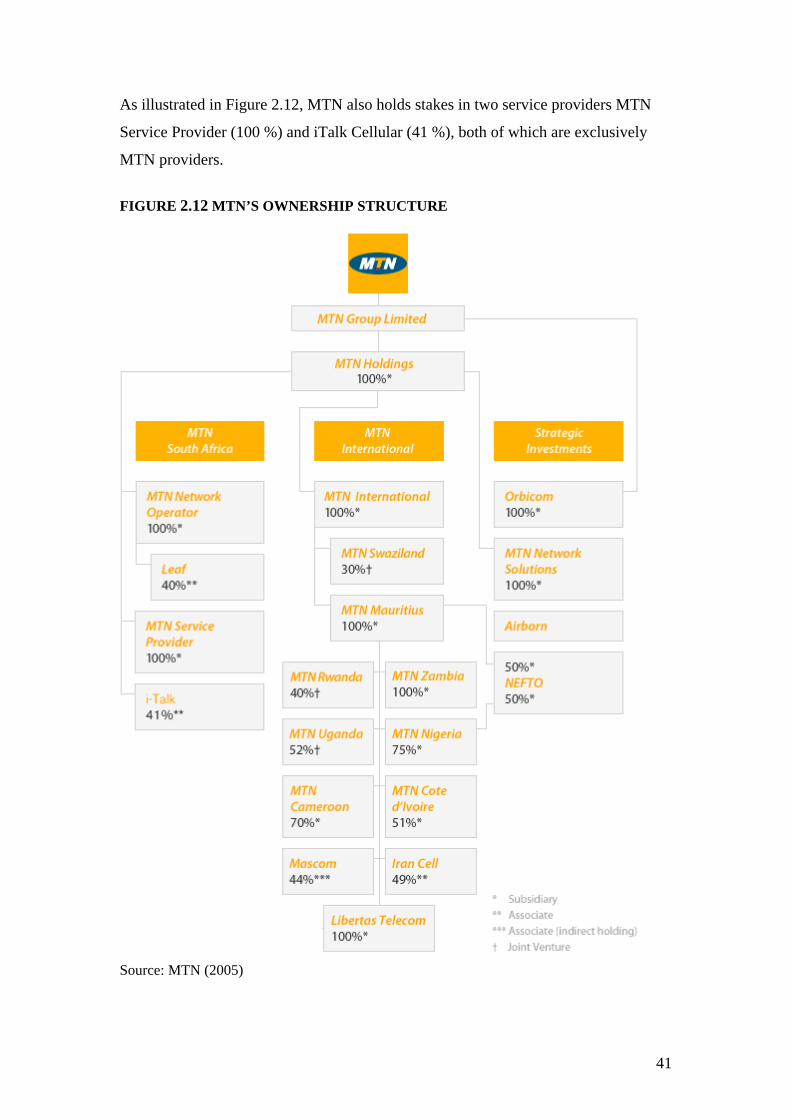
As illustrated in Figure 2.12, MTN also holds stakes in two service providers MTN
Service Provider (100 %) and iTalk Cellular (41 %), both of which are exclusively
MTN providers.
FIGURE 2.12 MTN’S OWNERSHIP STRUCTURE
Source: MTN (2005)
41
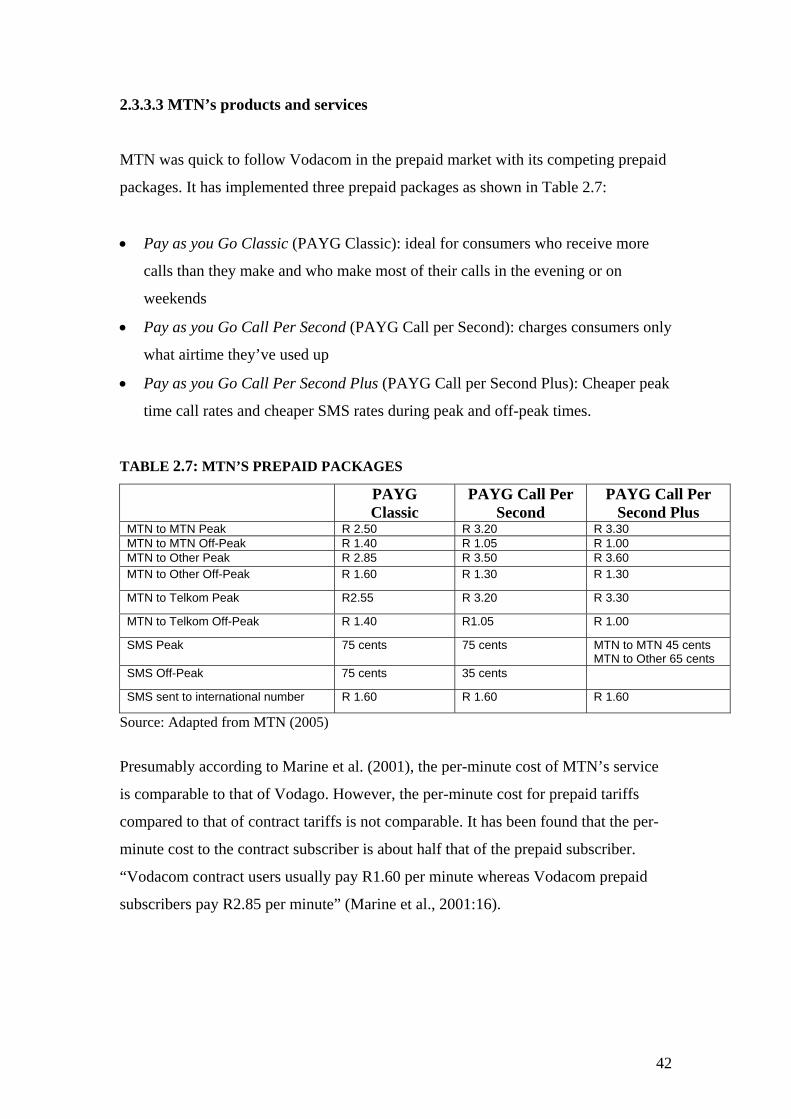
2.3.3.3 MTN’s products and services
MTN was quick to follow Vodacom in the prepaid market with its competing prepaid
packages. It has implemented three prepaid packages as shown in Table 2.7:
• Pay as you Go Classic (PAYG Classic): ideal for consumers who receive more
calls than they make and who make most of their calls in the evening or on
weekends
• Pay as you Go Call Per Second (PAYG Call per Second): charges consumers only
what airtime they’ve used up
• Pay as you Go Call Per Second Plus (PAYG Call per Second Plus): Cheaper peak
time call rates and cheaper SMS rates during peak and off-peak times.
TABLE 2.7: MTN’S PREPAID PACKAGES PAYG
Classic PAYG Call Per
Second PAYG Call Per
Second Plus MTN to MTN Peak R 2.50 R 3.20 R 3.30 MTN to MTN Off-Peak R 1.40 R 1.05 R 1.00 MTN to Other Peak R 2.85 R 3.50 R 3.60 MTN to Other Off-Peak R 1.60 R 1.30 R 1.30
MTN to Telkom Peak R2.55 R 3.20 R 3.30
MTN to Telkom Off-Peak R 1.40 R1.05 R 1.00
SMS Peak 75 cents 75 cents MTN to MTN 45 cents MTN to Other 65 cents
SMS Off-Peak 75 cents 35 cents
SMS sent to international number R 1.60 R 1.60 R 1.60
Source: Adapted from MTN (2005)
Presumably according to Marine et al. (2001), the per-minute cost of MTN’s service
is comparable to that of Vodago. However, the per-minute cost for prepaid tariffs
compared to that of contract tariffs is not comparable. It has been found that the per-
minute cost to the contract subscriber is about half that of the prepaid subscriber.
“Vodacom contract users usually pay R1.60 per minute whereas Vodacom prepaid
subscribers pay R2.85 per minute” (Marine et al., 2001:16).
42
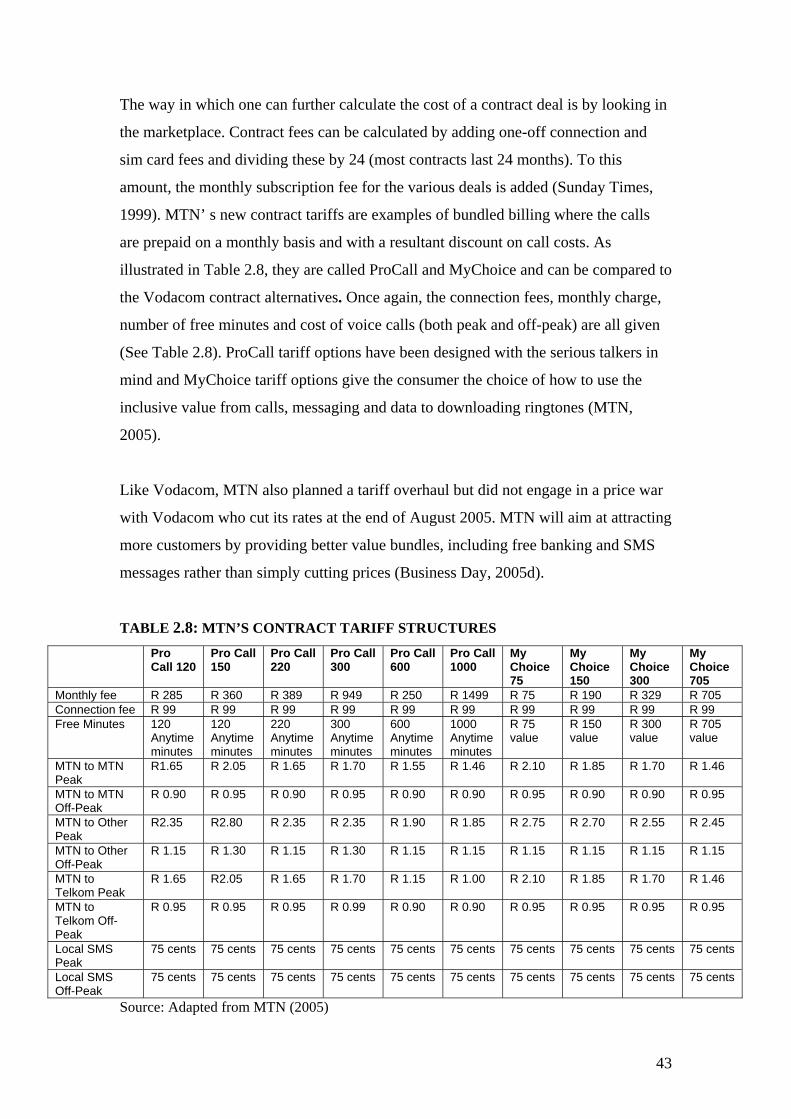
The way in which one can further calculate the cost of a contract deal is by looking in
the marketplace. Contract fees can be calculated by adding one-off connection and
sim card fees and dividing these by 24 (most contracts last 24 months). To this
amount, the monthly subscription fee for the various deals is added (Sunday Times,
1999). MTN’ s new contract tariffs are examples of bundled billing where the calls
are prepaid on a monthly basis and with a resultant discount on call costs. As
illustrated in Table 2.8, they are called ProCall and MyChoice and can be compared to
the Vodacom contract alternatives. Once again, the connection fees, monthly charge,
number of free minutes and cost of voice calls (both peak and off-peak) are all given
(See Table 2.8). ProCall tariff options have been designed with the serious talkers in
mind and MyChoice tariff options give the consumer the choice of how to use the
inclusive value from calls, messaging and data to downloading ringtones (MTN,
2005).
Like Vodacom, MTN also planned a tariff overhaul but did not engage in a price war
with Vodacom who cut its rates at the end of August 2005. MTN will aim at attracting
more customers by providing better value bundles, including free banking and SMS
messages rather than simply cutting prices (Business Day, 2005d).
TABLE 2.8: MTN’S CONTRACT TARIFF STRUCTURES Pro
Call 120 Pro Call 150
Pro Call 220
Pro Call 300
Pro Call 600
Pro Call 1000
My Choice 75
My Choice 150
My Choice 300
My Choice 705
Monthly fee R 285 R 360 R 389 R 949 R 250 R 1499 R 75 R 190 R 329 R 705 Connection fee R 99 R 99 R 99 R 99 R 99 R 99 R 99 R 99 R 99 R 99 Free Minutes 120
Anytime minutes
120 Anytime minutes
220 Anytime minutes
300 Anytime minutes
600 Anytime minutes
1000 Anytime minutes
R 75 value
R 150 value
R 300 value
R 705 value
MTN to MTN Peak
R1.65 R 2.05 R 1.65 R 1.70 R 1.55 R 1.46 R 2.10 R 1.85 R 1.70 R 1.46
MTN to MTN Off-Peak
R 0.90 R 0.95 R 0.90 R 0.95 R 0.90 R 0.90 R 0.95 R 0.90 R 0.90 R 0.95
MTN to Other Peak
R2.35 R2.80 R 2.35 R 2.35 R 1.90 R 1.85 R 2.75 R 2.70 R 2.55 R 2.45
MTN to Other Off-Peak
R 1.15 R 1.30 R 1.15 R 1.30 R 1.15 R 1.15 R 1.15 R 1.15 R 1.15 R 1.15
MTN to Telkom Peak
R 1.65 R2.05 R 1.65 R 1.70 R 1.15 R 1.00 R 2.10 R 1.85 R 1.70 R 1.46
MTN to Telkom Off-Peak
R 0.95 R 0.95 R 0.95 R 0.99 R 0.90 R 0.90 R 0.95 R 0.95 R 0.95 R 0.95
Local SMS Peak
75 cents 75 cents 75 cents 75 cents 75 cents 75 cents 75 cents 75 cents 75 cents 75 cents
Local SMS Off-Peak
75 cents 75 cents 75 cents 75 cents 75 cents 75 cents 75 cents 75 cents 75 cents 75 cents
Source: Adapted from MTN (2005)
43
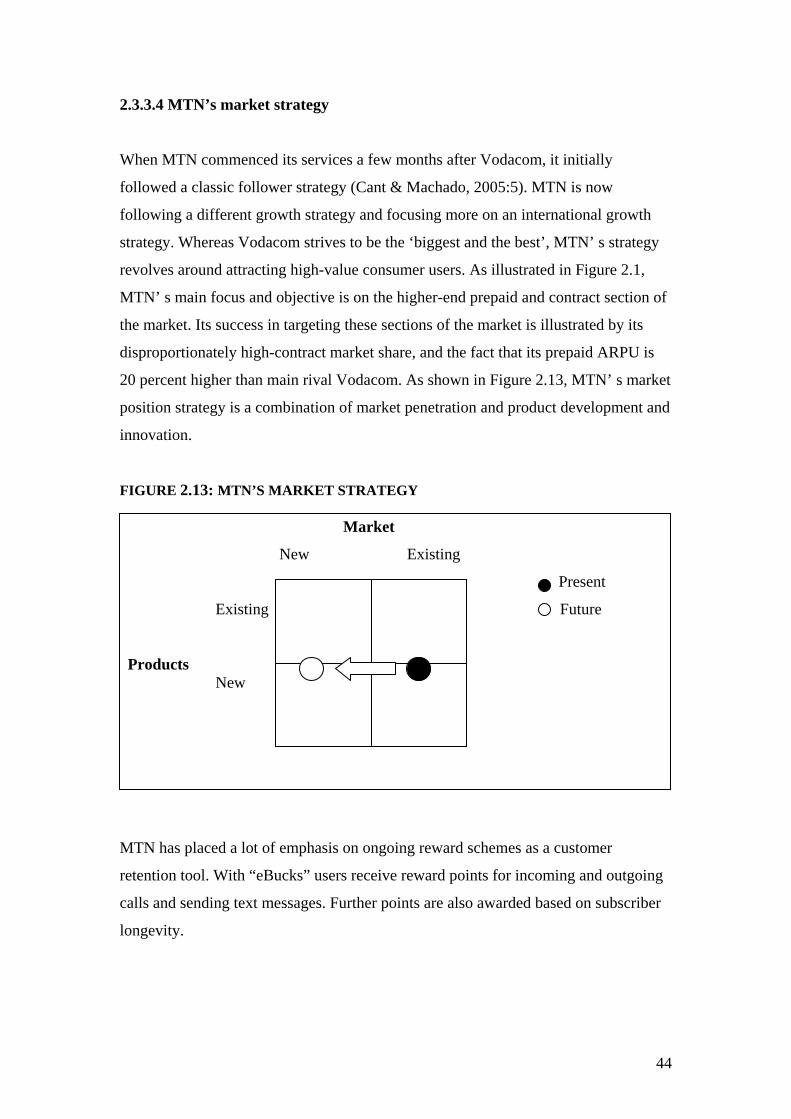
2.3.3.4 MTN’s market strategy
When MTN commenced its services a few months after Vodacom, it initially
followed a classic follower strategy (Cant & Machado, 2005:5). MTN is now
following a different growth strategy and focusing more on an international growth
strategy. Whereas Vodacom strives to be the ‘biggest and the best’, MTN’ s strategy
revolves around attracting high-value consumer users. As illustrated in Figure 2.1,
MTN’ s main focus and objective is on the higher-end prepaid and contract section of
the market. Its success in targeting these sections of the market is illustrated by its
disproportionately high-contract market share, and the fact that its prepaid ARPU is
20 percent higher than main rival Vodacom. As shown in Figure 2.13, MTN’ s market
position strategy is a combination of market penetration and product development and
innovation.
FIGURE 2.13: MTN’S MARKET STRATEGY Market
New Existing
Present
Existing Future
Products New
MTN has placed a lot of emphasis on ongoing reward schemes as a customer
retention tool. With “eBucks” users receive reward points for incoming and outgoing
calls and sending text messages. Further points are also awarded based on subscriber
longevity.
44
These can be exchanged for airtime or non-mobile goods and services. There are even
more loyalty schemes available for prepaid customers- the “Big Bonus” plan is an
example of such a loyalty scheme and consists of two main parts (Finnie et al.,
2003:135):
• Daily Free SMS Bonus: users receive one free SMS for every chargeable call of over
one minute, although the SMS must be used on that day;
• High Usage Bonus rewards: users with airtime for spending over R500 or R1000
per month will see their rewards ramping up the longer the subscriber stays with
MTN.
MTN has had some success in adopting a “services not technologies” approach to
non-voice applications. In promotional literature there is no mention of GPRS or
HSCSD, instead being substituted for brands such as MTNdataFAST and
MTNdataLIVE. The terms SMS (Short Message Service) and MMS (Multimedia
Message Service) are used, but these have already entered common parlance to a
significant degree (Finnie et al., 2003:136).
The third mobile network provider, Cell C, will be discussed in the next section.
45
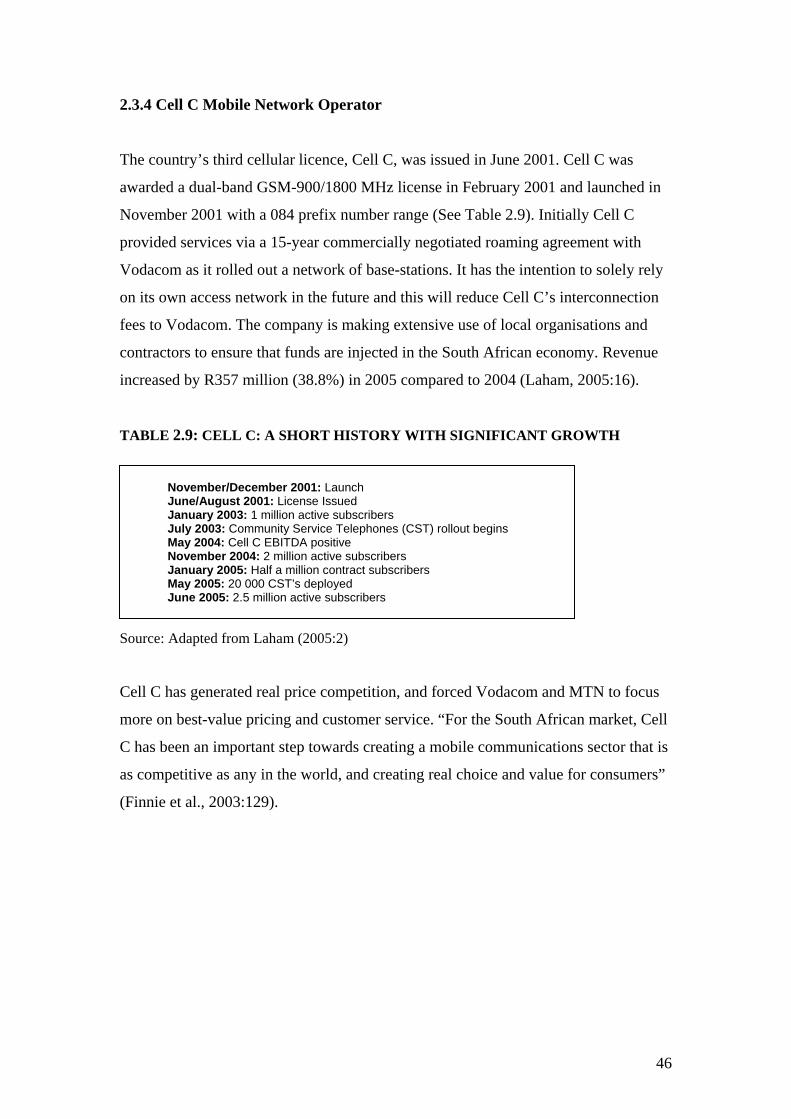
2.3.4 Cell C Mobile Network Operator
The country’s third cellular licence, Cell C, was issued in June 2001. Cell C was
awarded a dual-band GSM-900/1800 MHz license in February 2001 and launched in
November 2001 with a 084 prefix number range (See Table 2.9). Initially Cell C
provided services via a 15-year commercially negotiated roaming agreement with
Vodacom as it rolled out a network of base-stations. It has the intention to solely rely
on its own access network in the future and this will reduce Cell C’s interconnection
fees to Vodacom. The company is making extensive use of local organisations and
contractors to ensure that funds are injected in the South African economy. Revenue
increased by R357 million (38.8%) in 2005 compared to 2004 (Laham, 2005:16).
TABLE 2.9: CELL C: A SHORT HISTORY WITH SIGNIFICANT GROWTH
November/December 2001: Launch June/August 2001: License Issued January 2003: 1 million active subscribers July 2003: Community Service Telephones (CST) rollout begins May 2004: Cell C EBITDA positive November 2004: 2 million active subscribers January 2005: Half a million contract subscribers May 2005: 20 000 CST’s deployed June 2005: 2.5 million active subscribers
Source: Adapted from Laham (2005:2)
Cell C has generated real price competition, and forced Vodacom and MTN to focus
more on best-value pricing and customer service. “For the South African market, Cell
C has been an important step towards creating a mobile communications sector that is
as competitive as any in the world, and creating real choice and value for consumers”
(Finnie et al., 2003:129).
46
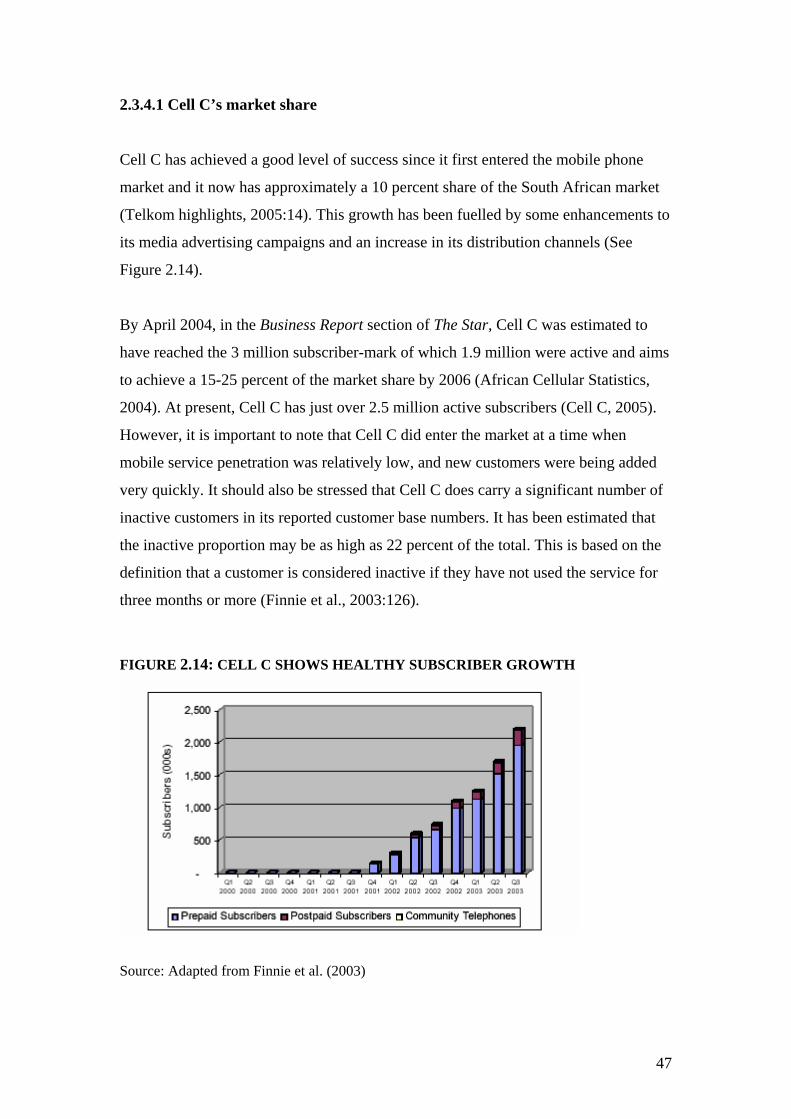
2.3.4.1 Cell C’s market share
Cell C has achieved a good level of success since it first entered the mobile phone
market and it now has approximately a 10 percent share of the South African market
(Telkom highlights, 2005:14). This growth has been fuelled by some enhancements to
its media advertising campaigns and an increase in its distribution channels (See
Figure 2.14).
By April 2004, in the Business Report section of The Star, Cell C was estimated to
have reached the 3 million subscriber-mark of which 1.9 million were active and aims
to achieve a 15-25 percent of the market share by 2006 (African Cellular Statistics,
2004). At present, Cell C has just over 2.5 million active subscribers (Cell C, 2005).
However, it is important to note that Cell C did enter the market at a time when
mobile service penetration was relatively low, and new customers were being added
very quickly. It should also be stressed that Cell C does carry a significant number of
inactive customers in its reported customer base numbers. It has been estimated that
the inactive proportion may be as high as 22 percent of the total. This is based on the
definition that a customer is considered inactive if they have not used the service for
three months or more (Finnie et al., 2003:126).
FIGURE 2.14: CELL C SHOWS HEALTHY SUBSCRIBER GROWTH
Source: Adapted from Finnie et al. (2003)
47
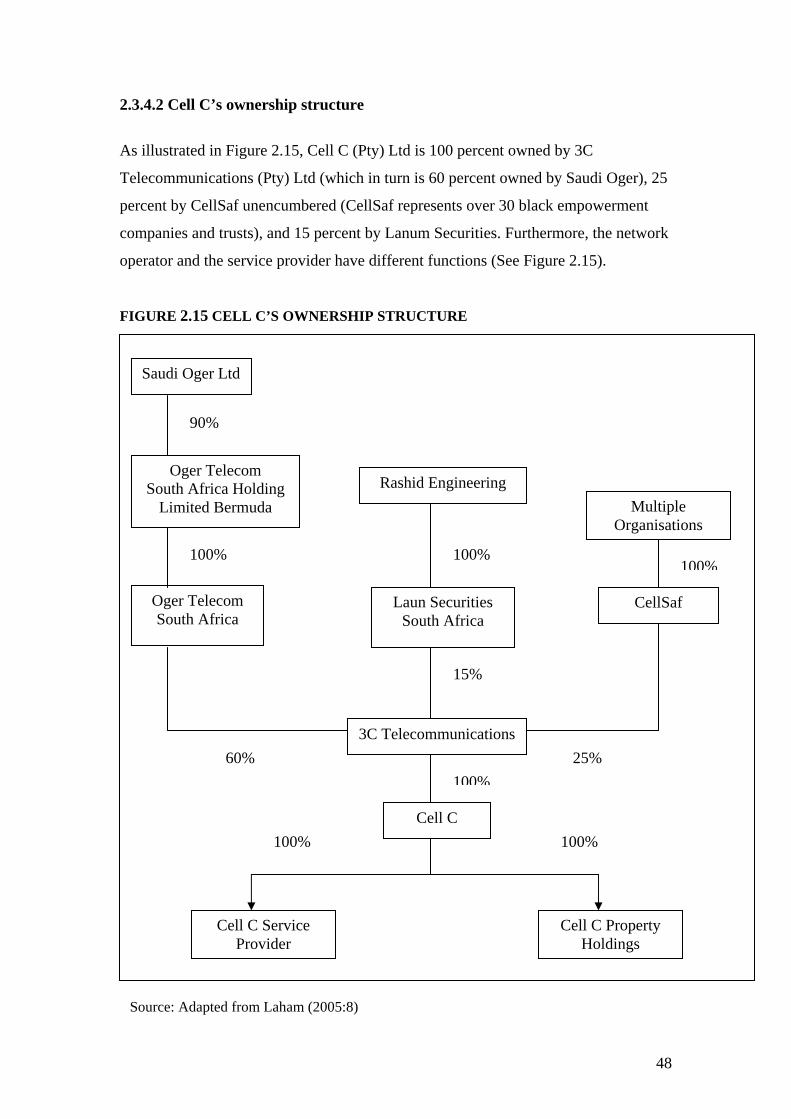
2.3.4.2 Cell C’s ownership structure
As illustrated in Figure 2.15, Cell C (Pty) Ltd is 100 percent owned by 3C
Telecommunications (Pty) Ltd (which in turn is 60 percent owned by Saudi Oger), 25
percent by CellSaf unencumbered (CellSaf represents over 30 black empowerment
companies and trusts), and 15 percent by Lanum Securities. Furthermore, the network
operator and the service provider have different functions (See Figure 2.15).
FIGURE 2.15 CELL C’S OWNERSHIP STRUCTURE
Oger Telecom South Africa Holding
Limited Bermuda
Oger Telecom South Africa
Rashid Engineering
Laun Securities South Africa
3C Telecommunications
Multiple Organisations
CellSaf
100%
15%
25% 60%
100% 100%
90%
Cell C 100% 100%
Saudi Oger Ltd
100%
Cell C Service
Provider Cell C Property
Holdings
Source: Adapted from Laham (2005:8)
48
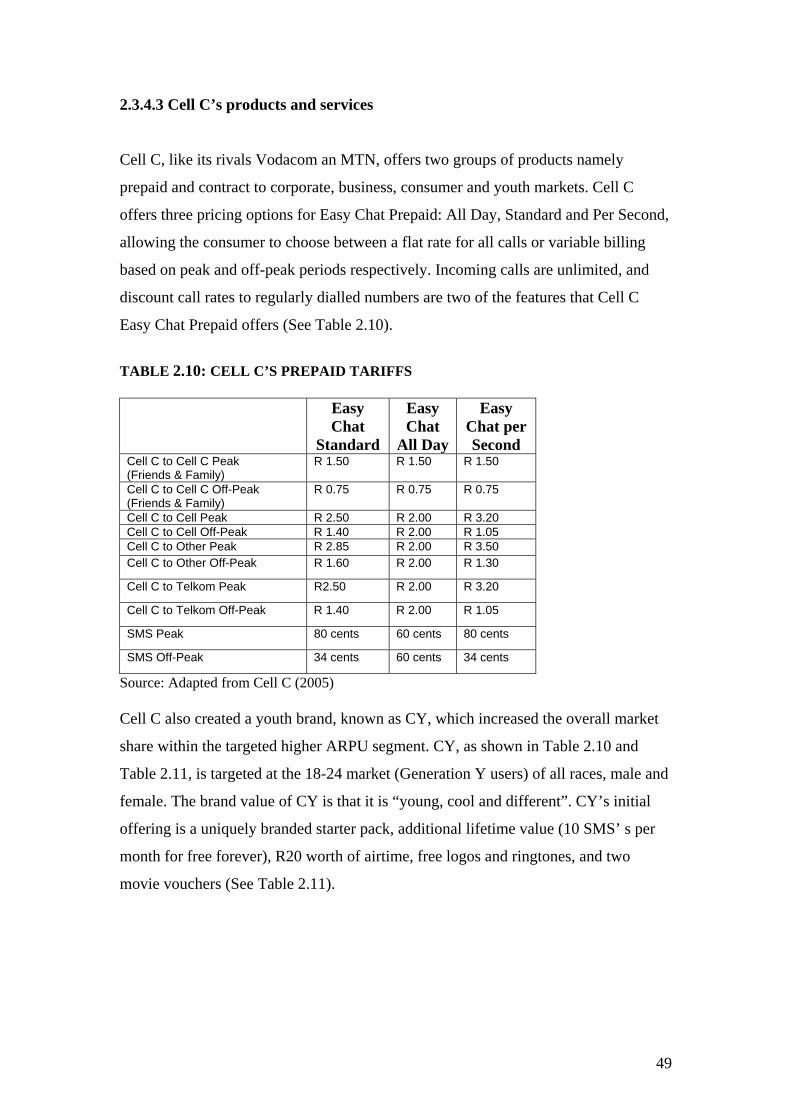
2.3.4.3 Cell C’s products and services
Cell C, like its rivals Vodacom an MTN, offers two groups of products namely
prepaid and contract to corporate, business, consumer and youth markets. Cell C
offers three pricing options for Easy Chat Prepaid: All Day, Standard and Per Second,
allowing the consumer to choose between a flat rate for all calls or variable billing
based on peak and off-peak periods respectively. Incoming calls are unlimited, and
discount call rates to regularly dialled numbers are two of the features that Cell C
Easy Chat Prepaid offers (See Table 2.10).
TABLE 2.10: CELL C’S PREPAID TARIFFS
Easy Chat
Standard
Easy Chat
All Day
Easy Chat per Second
Cell C to Cell C Peak (Friends & Family)
R 1.50 R 1.50 R 1.50
Cell C to Cell C Off-Peak (Friends & Family)
R 0.75 R 0.75 R 0.75
Cell C to Cell Peak R 2.50 R 2.00 R 3.20 Cell C to Cell Off-Peak R 1.40 R 2.00 R 1.05 Cell C to Other Peak R 2.85 R 2.00 R 3.50 Cell C to Other Off-Peak R 1.60 R 2.00 R 1.30
Cell C to Telkom Peak R2.50 R 2.00 R 3.20
Cell C to Telkom Off-Peak R 1.40 R 2.00 R 1.05
SMS Peak 80 cents 60 cents 80 cents
SMS Off-Peak 34 cents 60 cents 34 cents
Source: Adapted from Cell C (2005) Cell C also created a youth brand, known as CY, which increased the overall market
share within the targeted higher ARPU segment. CY, as shown in Table 2.10 and
Table 2.11, is targeted at the 18-24 market (Generation Y users) of all races, male and
female. The brand value of CY is that it is “young, cool and different”. CY’s initial
offering is a uniquely branded starter pack, additional lifetime value (10 SMS’ s per
month for free forever), R20 worth of airtime, free logos and ringtones, and two
movie vouchers (See Table 2.11).
49
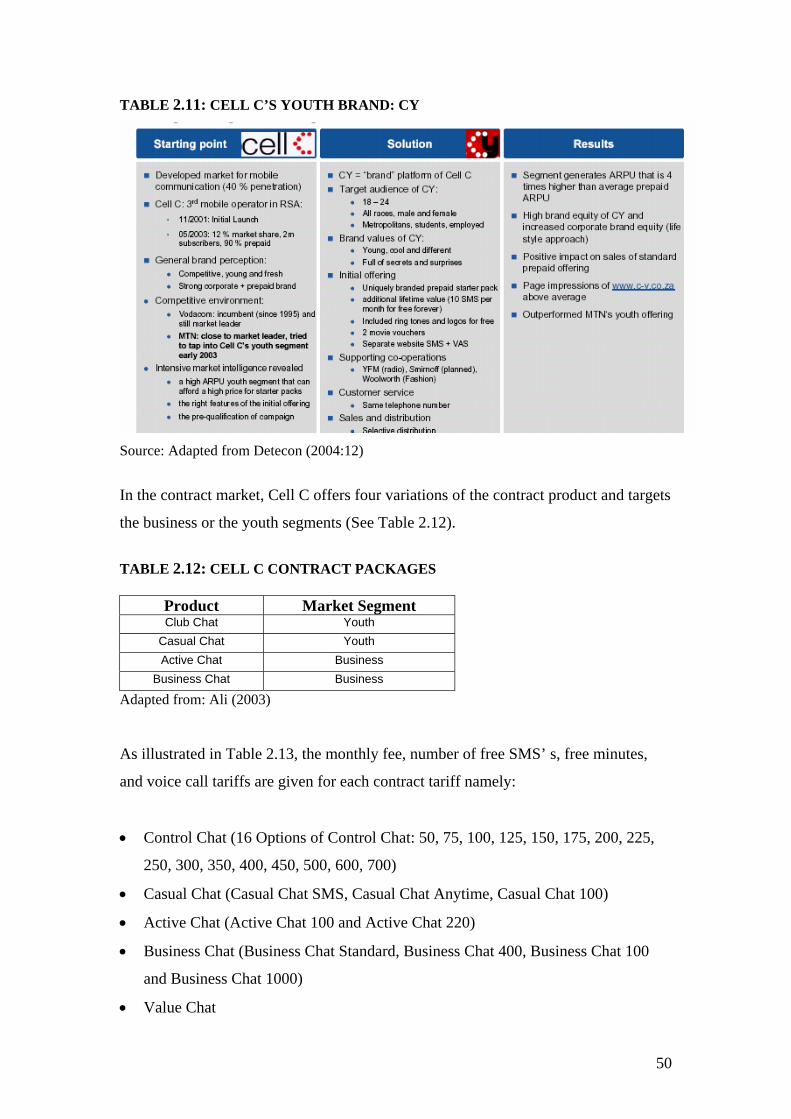
TABLE 2.11: CELL C’S YOUTH BRAND: CY
Source: Adapted from Detecon (2004:12)
In the contract market, Cell C offers four variations of the contract product and targets
the business or the youth segments (See Table 2.12).
TABLE 2.12: CELL C CONTRACT PACKAGES
Product Market Segment Club Chat Youth
Casual Chat Youth Active Chat Business
Business Chat Business
Adapted from: Ali (2003) As illustrated in Table 2.13, the monthly fee, number of free SMS’ s, free minutes,
and voice call tariffs are given for each contract tariff namely:
• Control Chat (16 Options of Control Chat: 50, 75, 100, 125, 150, 175, 200, 225,
250, 300, 350, 400, 450, 500, 600, 700)
• Casual Chat (Casual Chat SMS, Casual Chat Anytime, Casual Chat 100)
• Active Chat (Active Chat 100 and Active Chat 220)
• Business Chat (Business Chat Standard, Business Chat 400, Business Chat 100
and Business Chat 1000)
• Value Chat
50
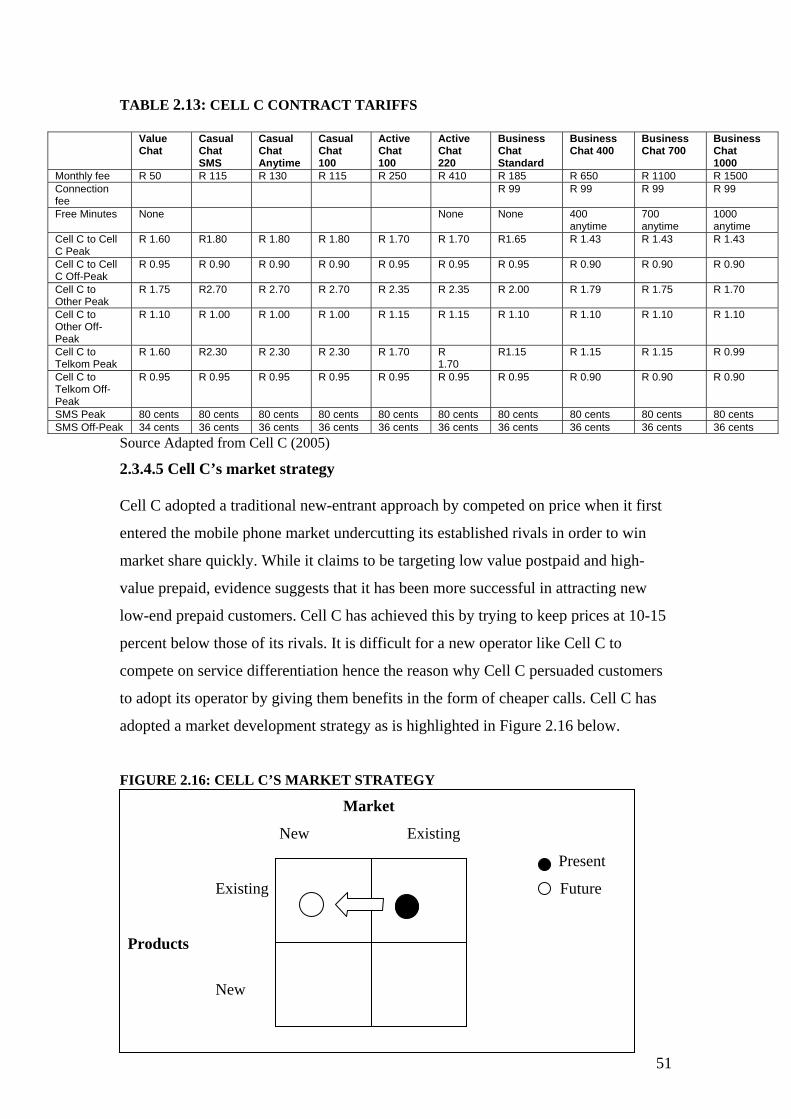
TABLE 2.13: CELL C CONTRACT TARIFFS
Value Chat
Casual Chat SMS
Casual Chat Anytime
Casual Chat 100
Active Chat 100
Active Chat 220
Business Chat Standard
Business Chat 400
Business Chat 700
Business Chat 1000
Monthly fee R 50 R 115 R 130 R 115 R 250 R 410 R 185 R 650 R 1100 R 1500 Connection fee
R 99 R 99 R 99 R 99
Free Minutes None None None 400 anytime
700 anytime
1000 anytime
Cell C to Cell C Peak
R 1.60 R1.80 R 1.80 R 1.80 R 1.70 R 1.70 R1.65 R 1.43 R 1.43 R 1.43
Cell C to Cell C Off-Peak
R 0.95 R 0.90 R 0.90 R 0.90 R 0.95 R 0.95 R 0.95 R 0.90 R 0.90 R 0.90
Cell C to Other Peak
R 1.75 R2.70 R 2.70 R 2.70 R 2.35 R 2.35 R 2.00 R 1.79 R 1.75 R 1.70
Cell C to Other Off-Peak
R 1.10 R 1.00 R 1.00 R 1.00 R 1.15 R 1.15 R 1.10 R 1.10 R 1.10 R 1.10
Cell C to Telkom Peak
R 1.60 R2.30 R 2.30 R 2.30 R 1.70 R 1.70
R1.15 R 1.15 R 1.15 R 0.99
Cell C to Telkom Off-Peak
R 0.95 R 0.95 R 0.95 R 0.95 R 0.95 R 0.95 R 0.95 R 0.90 R 0.90 R 0.90
SMS Peak 80 cents 80 cents 80 cents 80 cents 80 cents 80 cents 80 cents 80 cents 80 cents 80 cents SMS Off-Peak 34 cents 36 cents 36 cents 36 cents 36 cents 36 cents 36 cents 36 cents 36 cents 36 cents
Source Adapted from Cell C (2005)
2.3.4.5 Cell C’s market strategy Cell C adopted a traditional new-entrant approach by competed on price when it first
entered the mobile phone market undercutting its established rivals in order to win
market share quickly. While it claims to be targeting low value postpaid and high-
value prepaid, evidence suggests that it has been more successful in attracting new
low-end prepaid customers. Cell C has achieved this by trying to keep prices at 10-15
percent below those of its rivals. It is difficult for a new operator like Cell C to
compete on service differentiation hence the reason why Cell C persuaded customers
to adopt its operator by giving them benefits in the form of cheaper calls. Cell C has
adopted a market development strategy as is highlighted in Figure 2.16 below.
FIGURE 2.16: CELL C’S MARKET STRATEGY
Market
New Existing
Present
Existing Future
Products
New
51
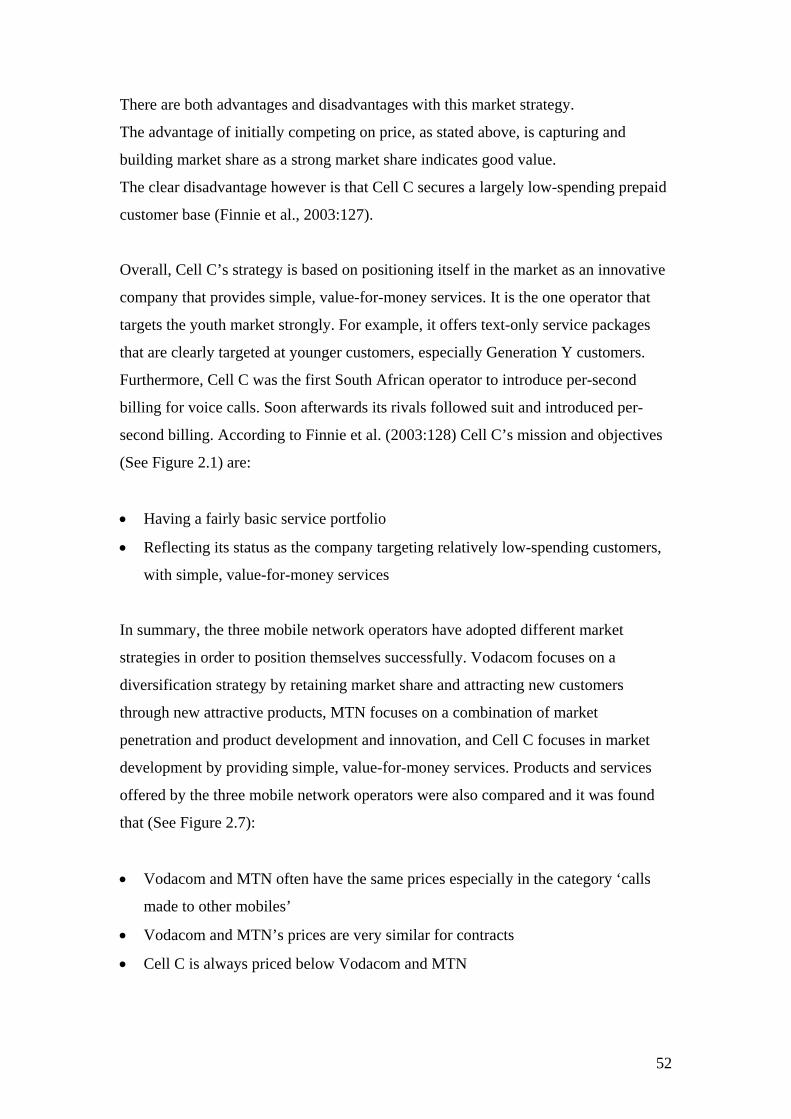
There are both advantages and disadvantages with this market strategy.
The advantage of initially competing on price, as stated above, is capturing and
building market share as a strong market share indicates good value.
The clear disadvantage however is that Cell C secures a largely low-spending prepaid
customer base (Finnie et al., 2003:127).
Overall, Cell C’s strategy is based on positioning itself in the market as an innovative
company that provides simple, value-for-money services. It is the one operator that
targets the youth market strongly. For example, it offers text-only service packages
that are clearly targeted at younger customers, especially Generation Y customers.
Furthermore, Cell C was the first South African operator to introduce per-second
billing for voice calls. Soon afterwards its rivals followed suit and introduced per-
second billing. According to Finnie et al. (2003:128) Cell C’s mission and objectives
(See Figure 2.1) are:
• Having a fairly basic service portfolio
• Reflecting its status as the company targeting relatively low-spending customers,
with simple, value-for-money services
In summary, the three mobile network operators have adopted different market
strategies in order to position themselves successfully. Vodacom focuses on a
diversification strategy by retaining market share and attracting new customers
through new attractive products, MTN focuses on a combination of market
penetration and product development and innovation, and Cell C focuses in market
development by providing simple, value-for-money services. Products and services
offered by the three mobile network operators were also compared and it was found
that (See Figure 2.7):
• Vodacom and MTN often have the same prices especially in the category ‘calls
made to other mobiles’
• Vodacom and MTN’s prices are very similar for contracts
• Cell C is always priced below Vodacom and MTN
52
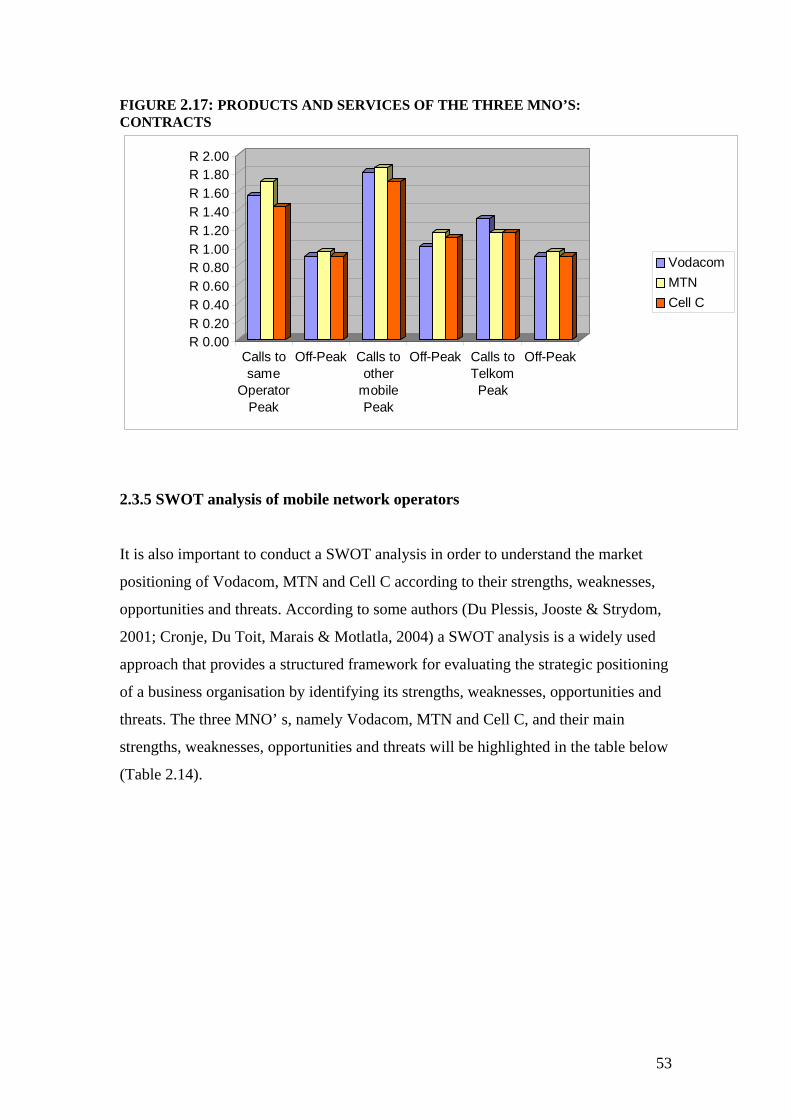
FIGURE 2.17: PRODUCTS AND SERVICES OF THE THREE MNO’S: CONTRACTS
R 0.00R 0.20R 0.40R 0.60R 0.80R 1.00R 1.20R 1.40R 1.60R 1.80R 2.00
Calls tosame
OperatorPeak
Off-Peak Calls toother
mobilePeak
Off-Peak Calls toTelkomPeak
Off-Peak
Vodacom MTNCell C
2.3.5 SWOT analysis of mobile network operators It is also important to conduct a SWOT analysis in order to understand the market
positioning of Vodacom, MTN and Cell C according to their strengths, weaknesses,
opportunities and threats. According to some authors (Du Plessis, Jooste & Strydom,
2001; Cronje, Du Toit, Marais & Motlatla, 2004) a SWOT analysis is a widely used
approach that provides a structured framework for evaluating the strategic positioning
of a business organisation by identifying its strengths, weaknesses, opportunities and
threats. The three MNO’ s, namely Vodacom, MTN and Cell C, and their main
strengths, weaknesses, opportunities and threats will be highlighted in the table below
(Table 2.14).
53

TABLE 2.14: SWOT ANALYSIS FOR VODACOM, MTN AND CELL C
54
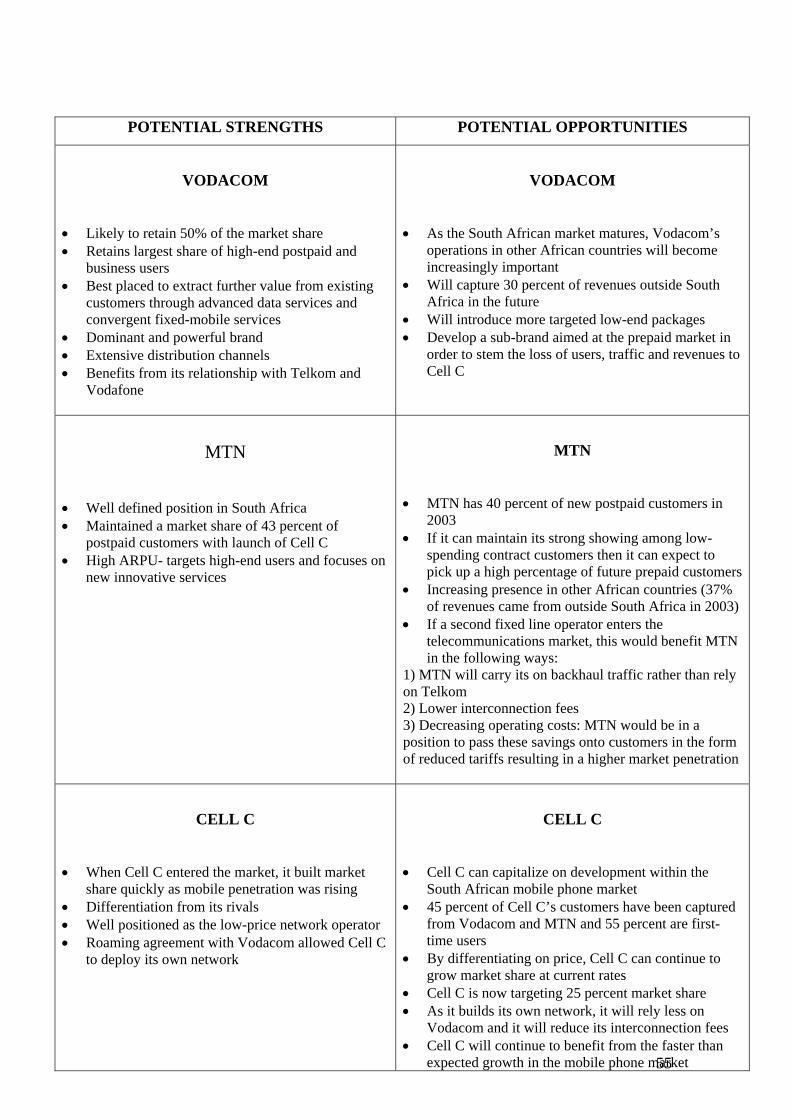
POTENTIAL STRENGTHS POTENTIAL OPPORTUNITIES
VODACOM
• Likely to retain 50% of the market share • Retains largest share of high-end postpaid and
business users • Best placed to extract further value from existing
customers through advanced data services and convergent fixed-mobile services
• Dominant and powerful brand • Extensive distribution channels • Benefits from its relationship with Telkom and
Vodafone
VODACOM
• As the South African market matures, Vodacom’s operations in other African countries will become increasingly important
• Will capture 30 percent of revenues outside South Africa in the future
• Will introduce more targeted low-end packages • Develop a sub-brand aimed at the prepaid market in
order to stem the loss of users, traffic and revenues to Cell C
MTN
• Well defined position in South Africa • Maintained a market share of 43 percent of
postpaid customers with launch of Cell C • High ARPU- targets high-end users and focuses on
new innovative services
MTN
• MTN has 40 percent of new postpaid customers in 2003
• If it can maintain its strong showing among low-spending contract customers then it can expect to pick up a high percentage of future prepaid customers
• Increasing presence in other African countries (37% of revenues came from outside South Africa in 2003)
• If a second fixed line operator enters the telecommunications market, this would benefit MTN in the following ways:
1) MTN will carry its on backhaul traffic rather than rely on Telkom 2) Lower interconnection fees 3) Decreasing operating costs: MTN would be in a position to pass these savings onto customers in the form of reduced tariffs resulting in a higher market penetration
CELL C
CELL C
• Cell C can capitalize on development within the South African mobile phone market
• 45 percent of Cell C’s customers have been captured from Vodacom and MTN and 55 percent are first-time users
• By differentiating on price, Cell C can continue to grow market share at current rates
• When Cell C entered the market, it built market share quickly as mobile penetration was rising
• Differentiation from its rivals • Well positioned as the low-price network operator • Roaming agreement with Vodacom allowed Cell C
to deploy its own network
• Cell C is now targeting 25 percent market share • As it builds its own network, it will rely less on
Vodacom and it will reduce its interconnection fees
55• Cell C will continue to benefit from the faster than
expected growth in the mobile phone market
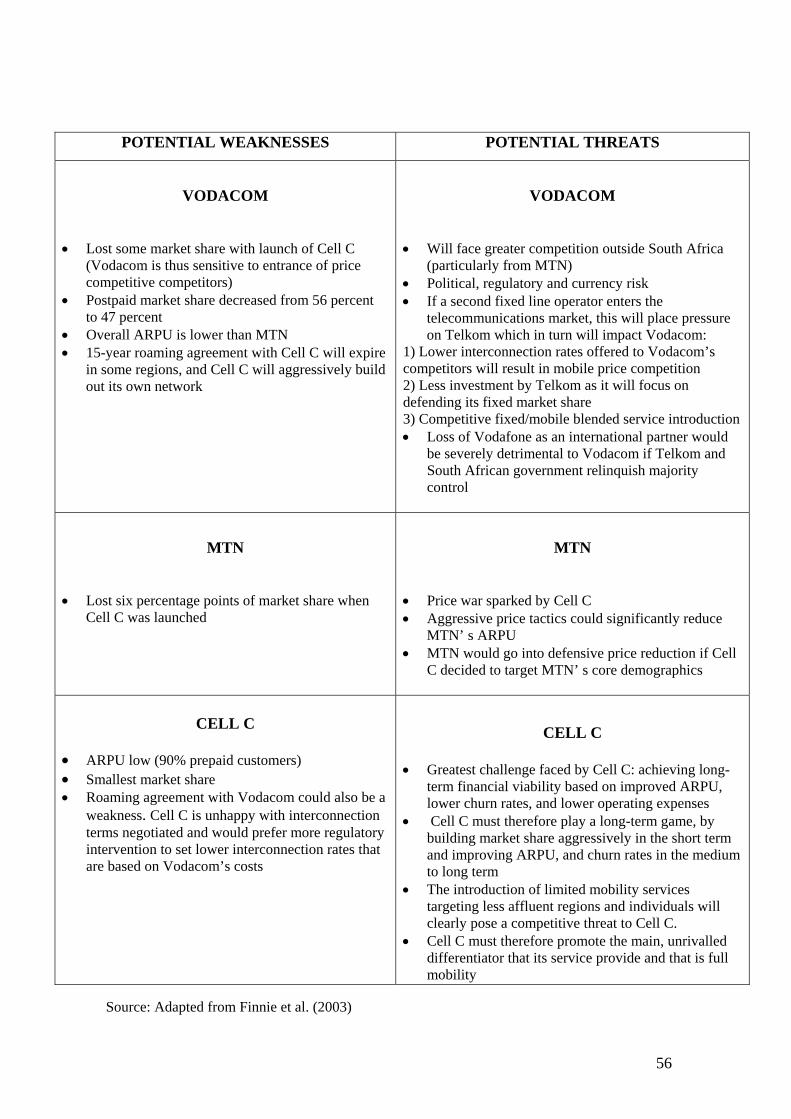
POTENTIAL WEAKNESSES POTENTIAL THREATS
VODACOM
• Lost some market share with launch of Cell C (Vodacom is thus sensitive to entrance of price competitive competitors)
• Postpaid market share decreased from 56 percent to 47 percent
• Overall ARPU is lower than MTN • 15-year roaming agreement with Cell C will expire
in some regions, and Cell C will aggressively build out its own network
VODACOM
• Will face greater competition outside South Africa (particularly from MTN)
• Political, regulatory and currency risk • If a second fixed line operator enters the
telecommunications market, this will place pressure on Telkom which in turn will impact Vodacom:
1) Lower interconnection rates offered to Vodacom’s competitors will result in mobile price competition 2) Less investment by Telkom as it will focus on defending its fixed market share 3) Competitive fixed/mobile blended service introduction • Loss of Vodafone as an international partner would
be severely detrimental to Vodacom if Telkom and South African government relinquish majority control
MTN MTN
• Price war sparked by Cell C • Aggressive price tactics could significantly reduce
MTN’ s ARPU • MTN would go into defensive price reduction if Cell
C decided to target MTN’ s core demographics
• Lost six percentage points of market share when Cell C was launched
CELL C • ARPU low (90% prepaid customers) • Smallest market share • Roaming agreement with Vodacom could also be a
weakness. Cell C is unhappy with interconnection terms negotiated and would prefer more regulatory intervention to set lower interconnection rates that are based on Vodacom’s costs
CELL C
• Greatest challenge faced by Cell C: achieving long-term financial viability based on improved ARPU, lower churn rates, and lower operating expenses
• Cell C must therefore play a long-term game, by building market share aggressively in the short term and improving ARPU, and churn rates in the medium to long term
• The introduction of limited mobility services targeting less affluent regions and individuals will clearly pose a competitive threat to Cell C.
• Cell C must therefore promote the main, unrivalled differentiator that its service provide and that is full mobility
Source: Adapted from Finnie et al. (2003)
56
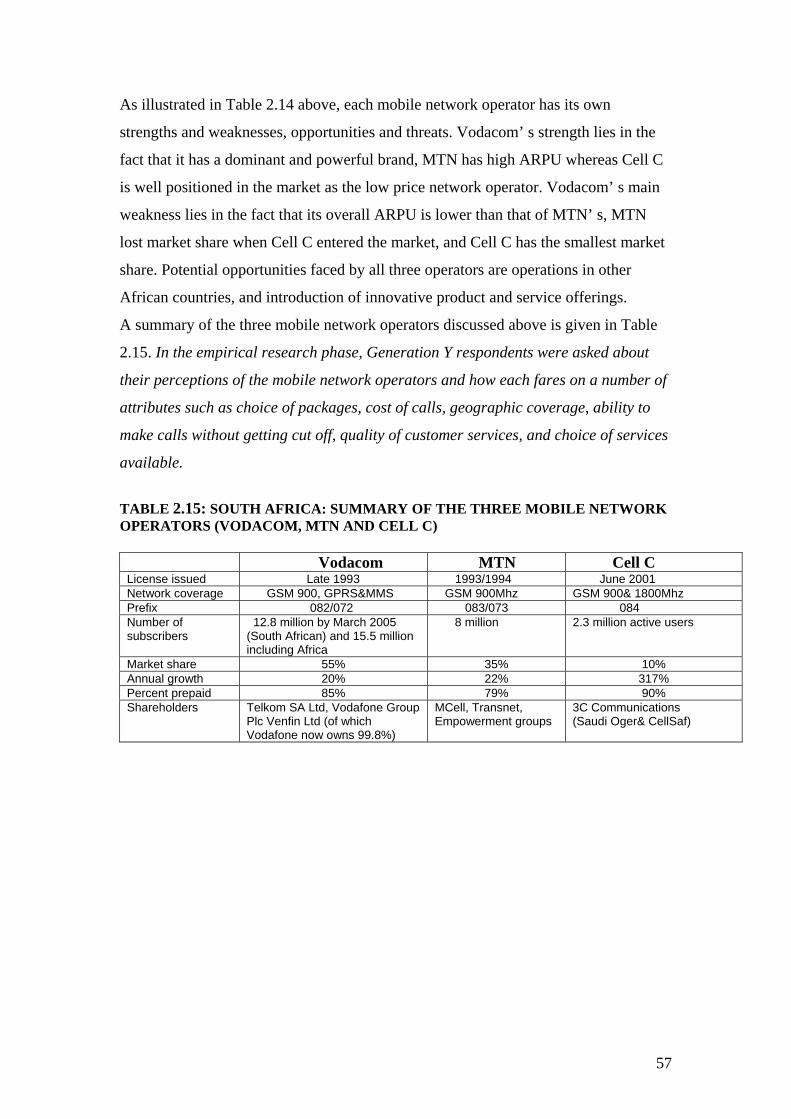
As illustrated in Table 2.14 above, each mobile network operator has its own
strengths and weaknesses, opportunities and threats. Vodacom’ s strength lies in the
fact that it has a dominant and powerful brand, MTN has high ARPU whereas Cell C
is well positioned in the market as the low price network operator. Vodacom’ s main
weakness lies in the fact that its overall ARPU is lower than that of MTN’ s, MTN
lost market share when Cell C entered the market, and Cell C has the smallest market
share. Potential opportunities faced by all three operators are operations in other
African countries, and introduction of innovative product and service offerings.
A summary of the three mobile network operators discussed above is given in Table
2.15. In the empirical research phase, Generation Y respondents were asked about
their perceptions of the mobile network operators and how each fares on a number of
attributes such as choice of packages, cost of calls, geographic coverage, ability to
make calls without getting cut off, quality of customer services, and choice of services
available.
TABLE 2.15: SOUTH AFRICA: SUMMARY OF THE THREE MOBILE NETWORK OPERATORS (VODACOM, MTN AND CELL C)
Vodacom MTN Cell C License issued Late 1993 1993/1994 June 2001 Network coverage GSM 900, GPRS&MMS GSM 900Mhz GSM 900& 1800Mhz Prefix 082/072 083/073 084 Number of subscribers
12.8 million by March 2005 (South African) and 15.5 million including Africa
8 million 2.3 million active users
Market share 55% 35% 10% Annual growth 20% 22% 317% Percent prepaid 85% 79% 90% Shareholders Telkom SA Ltd, Vodafone Group
Plc Venfin Ltd (of which Vodafone now owns 99.8%)
MCell, Transnet, Empowerment groups
3C Communications (Saudi Oger& CellSaf)
57
2.4 MARKET ENVIRONMENT
Figure 2.1 (column 2) shows that the market environment, also known as the task
environment, is the second component of the business environment and is found just
outside the business organisation. All the variables depicted in Figure 2.1 are
important for every organisation in a particular industry as they determine both the
strength and nature of the competition. The key variables in the market environment
are (Strydom, Jooste & Cant, 2000:43):
• Consumers with a particular buying power and behaviour (to be discussed in
Chapter 3). Consumers determine the number of entrants to the market
• Suppliers who supply products, raw materials, services and even financing the
business
• Intermediaries who compete against each other to handle the business’ products
• Competitors including existing, new and potential competitors who are either
established in the market or wish to maintain and improve their position.
All these variables in turn create particular opportunities or threats and it is within the
market environment that management finds its most important tasks of identifying
and taking advantage of opportunities in the market to meet competition (Cronje et
al., 2004:87). In order to understand this interaction between the business organisation
and its market environment, it is important to look at each of the variables in the
market environment more closely. Although management has no control over the
variables in the market environment, it can influence the variables through its
strategy.
2.4.1 Market and consumers
The South African business organisation operates in a complex market environment
where the needs of customers need to be satisfied. According to Strydom, Jooste and
Cant (2000:44) the market “consists of people with specific needs that need to be
satisfied and who have the financial ability to satisfy them.”
58
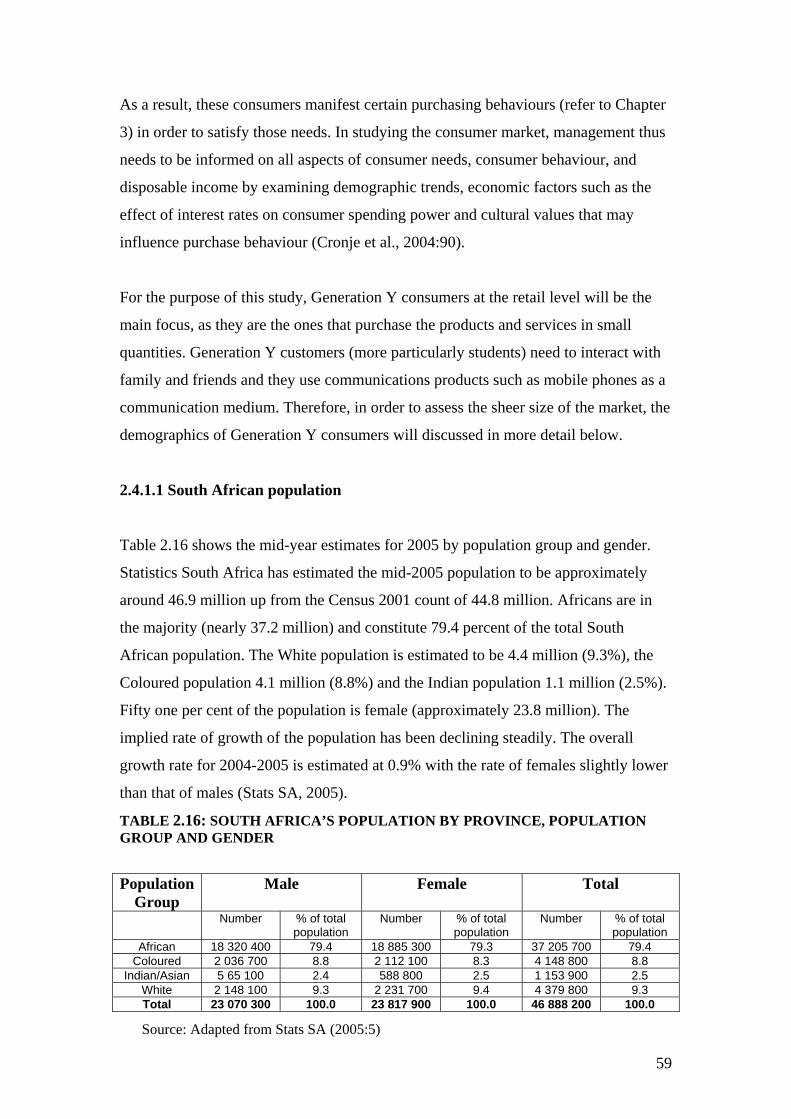
As a result, these consumers manifest certain purchasing behaviours (refer to Chapter
3) in order to satisfy those needs. In studying the consumer market, management thus
needs to be informed on all aspects of consumer needs, consumer behaviour, and
disposable income by examining demographic trends, economic factors such as the
effect of interest rates on consumer spending power and cultural values that may
influence purchase behaviour (Cronje et al., 2004:90).
For the purpose of this study, Generation Y consumers at the retail level will be the
main focus, as they are the ones that purchase the products and services in small
quantities. Generation Y customers (more particularly students) need to interact with
family and friends and they use communications products such as mobile phones as a
communication medium. Therefore, in order to assess the sheer size of the market, the
demographics of Generation Y consumers will discussed in more detail below.
2.4.1.1 South African population
Table 2.16 shows the mid-year estimates for 2005 by population group and gender.
Statistics South Africa has estimated the mid-2005 population to be approximately
around 46.9 million up from the Census 2001 count of 44.8 million. Africans are in
the majority (nearly 37.2 million) and constitute 79.4 percent of the total South
African population. The White population is estimated to be 4.4 million (9.3%), the
Coloured population 4.1 million (8.8%) and the Indian population 1.1 million (2.5%).
Fifty one per cent of the population is female (approximately 23.8 million). The
implied rate of growth of the population has been declining steadily. The overall
growth rate for 2004-2005 is estimated at 0.9% with the rate of females slightly lower
than that of males (Stats SA, 2005).
TABLE 2.16: SOUTH AFRICA’S POPULATION BY PROVINCE, POPULATION GROUP AND GENDER
Population Group
Male Female Total
Number % of total population
Number % of total population
Number % of total population
African 18 320 400 79.4 18 885 300 79.3 37 205 700 79.4 Coloured 2 036 700 8.8 2 112 100 8.3 4 148 800 8.8
Indian/Asian 5 65 100 2.4 588 800 2.5 1 153 900 2.5 White 2 148 100 9.3 2 231 700 9.4 4 379 800 9.3 Total 23 070 300 100.0 23 817 900 100.0 46 888 200 100.0
59
Source: Adapted from Stats SA (2005:5)
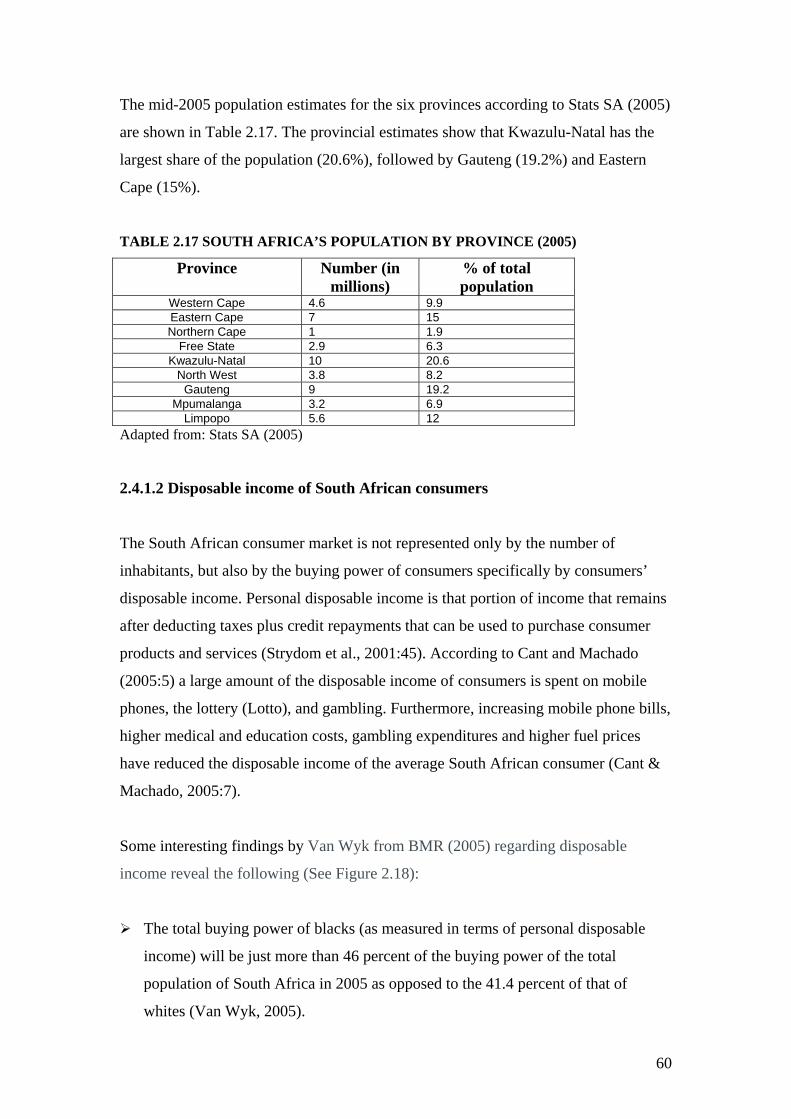
The mid-2005 population estimates for the six provinces according to Stats SA (2005)
are shown in Table 2.17. The provincial estimates show that Kwazulu-Natal has the
largest share of the population (20.6%), followed by Gauteng (19.2%) and Eastern
Cape (15%).
TABLE 2.17 SOUTH AFRICA’S POPULATION BY PROVINCE (2005)
Province Number (in millions)
% of total population
Western Cape 4.6 9.9 Eastern Cape 7 15 Northern Cape 1 1.9
Free State 2.9 6.3 Kwazulu-Natal 10 20.6
North West 3.8 8.2 Gauteng 9 19.2
Mpumalanga 3.2 6.9 Limpopo 5.6 12
Adapted from: Stats SA (2005)
2.4.1.2 Disposable income of South African consumers
The South African consumer market is not represented only by the number of
inhabitants, but also by the buying power of consumers specifically by consumers’
disposable income. Personal disposable income is that portion of income that remains
after deducting taxes plus credit repayments that can be used to purchase consumer
products and services (Strydom et al., 2001:45). According to Cant and Machado
(2005:5) a large amount of the disposable income of consumers is spent on mobile
phones, the lottery (Lotto), and gambling. Furthermore, increasing mobile phone bills,
higher medical and education costs, gambling expenditures and higher fuel prices
have reduced the disposable income of the average South African consumer (Cant &
Machado, 2005:7).
Some interesting findings by Van Wyk from BMR (2005) regarding disposable
income reveal the following (See Figure 2.18):
The total buying power of blacks (as measured in terms of personal disposable
income) will be just more than 46 percent of the buying power of the total
population of South Africa in 2005 as opposed to the 41.4 percent of that of
whites (Van Wyk, 2005).
60
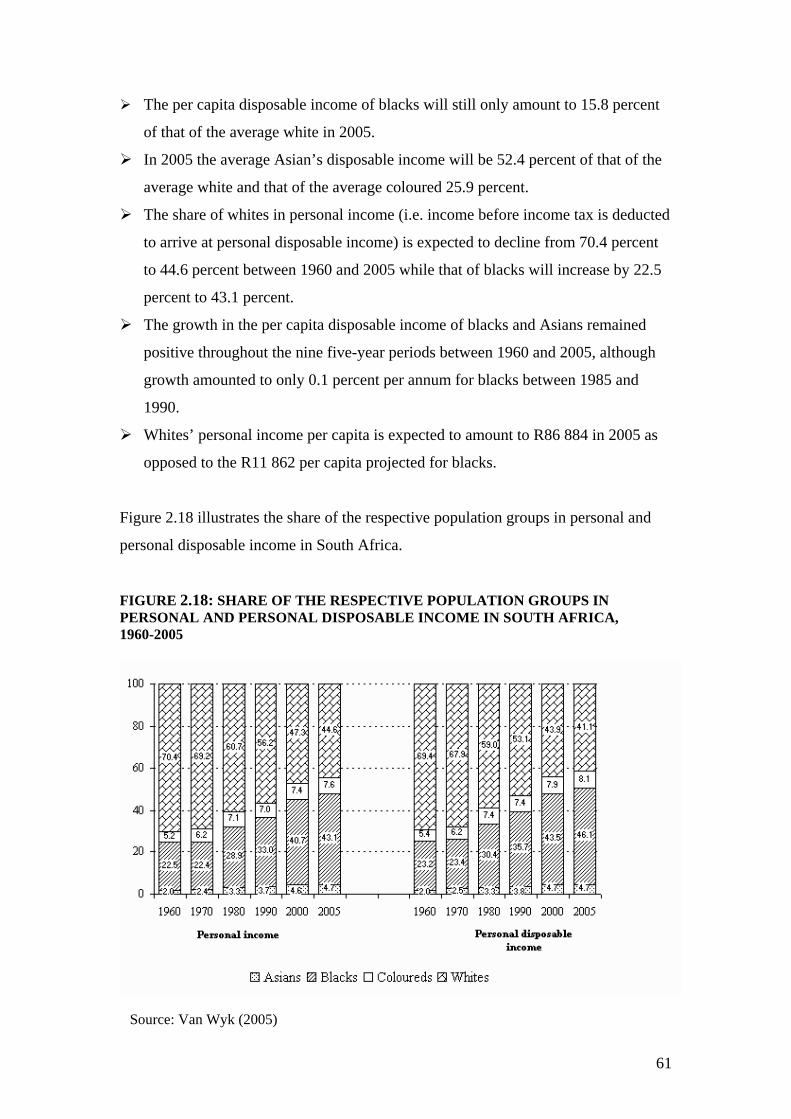
The per capita disposable income of blacks will still only amount to 15.8 percent
of that of the average white in 2005.
In 2005 the average Asian’s disposable income will be 52.4 percent of that of the
average white and that of the average coloured 25.9 percent.
The share of whites in personal income (i.e. income before income tax is deducted
to arrive at personal disposable income) is expected to decline from 70.4 percent
to 44.6 percent between 1960 and 2005 while that of blacks will increase by 22.5
percent to 43.1 percent.
The growth in the per capita disposable income of blacks and Asians remained
positive throughout the nine five-year periods between 1960 and 2005, although
growth amounted to only 0.1 percent per annum for blacks between 1985 and
1990.
Whites’ personal income per capita is expected to amount to R86 884 in 2005 as
opposed to the R11 862 per capita projected for blacks.
Figure 2.18 illustrates the share of the respective population groups in personal and
personal disposable income in South Africa.
FIGURE 2.18: SHARE OF THE RESPECTIVE POPULATION GROUPS IN PERSONAL AND PERSONAL DISPOSABLE INCOME IN SOUTH AFRICA, 1960-2005
Source: Van Wyk (2005)
61
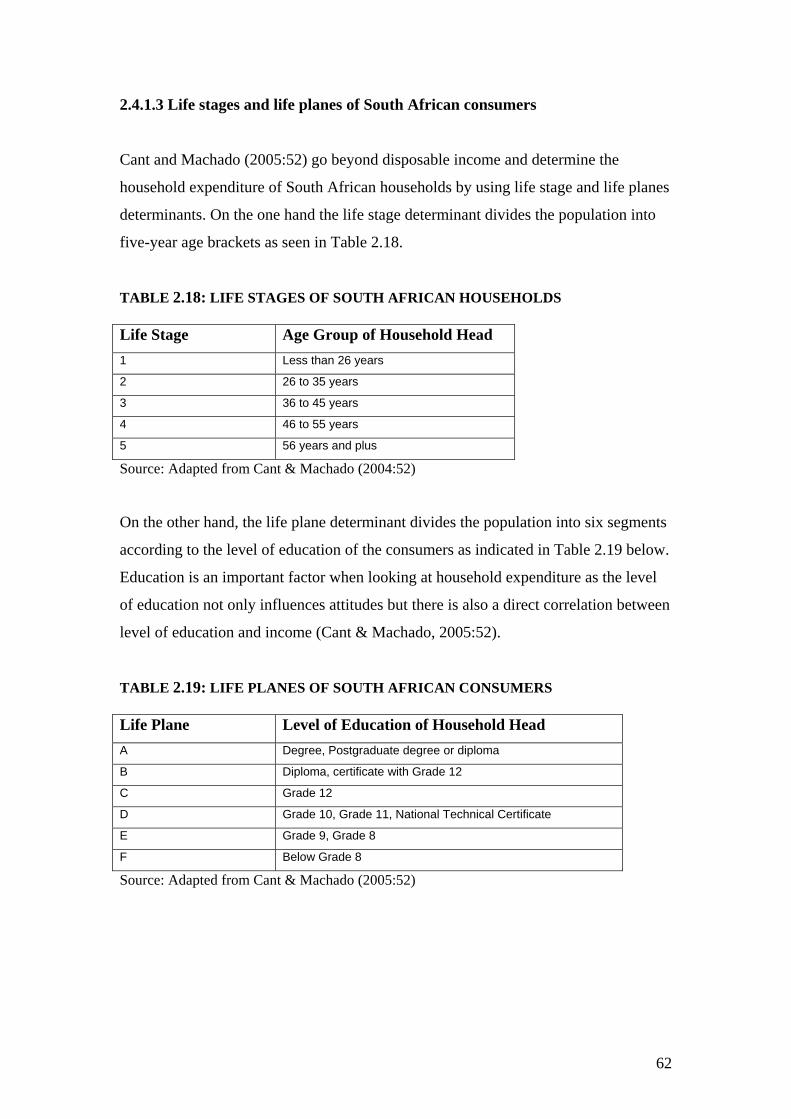
2.4.1.3 Life stages and life planes of South African consumers
Cant and Machado (2005:52) go beyond disposable income and determine the
household expenditure of South African households by using life stage and life planes
determinants. On the one hand the life stage determinant divides the population into
five-year age brackets as seen in Table 2.18.
TABLE 2.18: LIFE STAGES OF SOUTH AFRICAN HOUSEHOLDS Life Stage Age Group of Household Head 1 Less than 26 years
2 26 to 35 years
3 36 to 45 years
4 46 to 55 years
5 56 years and plus
Source: Adapted from Cant & Machado (2004:52)
On the other hand, the life plane determinant divides the population into six segments
according to the level of education of the consumers as indicated in Table 2.19 below.
Education is an important factor when looking at household expenditure as the level
of education not only influences attitudes but there is also a direct correlation between
level of education and income (Cant & Machado, 2005:52).
TABLE 2.19: LIFE PLANES OF SOUTH AFRICAN CONSUMERS Life Plane Level of Education of Household Head A Degree, Postgraduate degree or diploma
B Diploma, certificate with Grade 12
C Grade 12
D Grade 10, Grade 11, National Technical Certificate
E Grade 9, Grade 8
F Below Grade 8
Source: Adapted from Cant & Machado (2005:52)
62
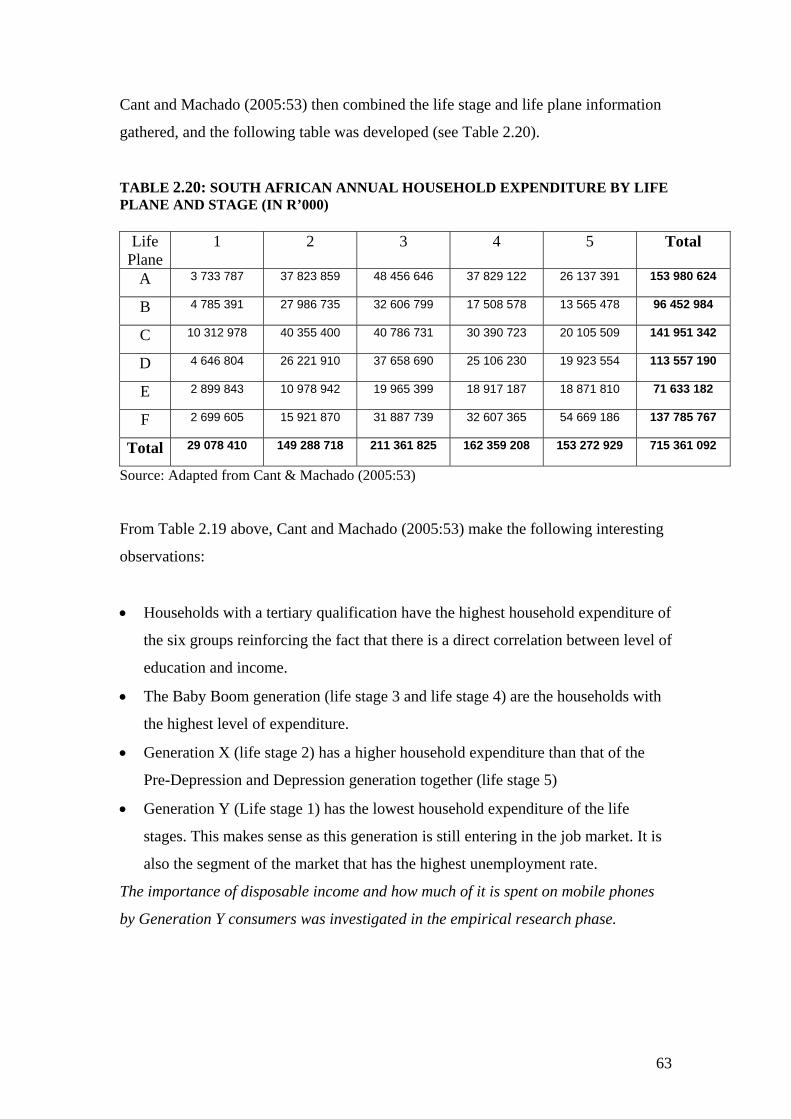
Cant and Machado (2005:53) then combined the life stage and life plane information
gathered, and the following table was developed (see Table 2.20).
TABLE 2.20: SOUTH AFRICAN ANNUAL HOUSEHOLD EXPENDITURE BY LIFE PLANE AND STAGE (IN R’000)
1 2 3 4 5 Total Life Plane
A 3 733 787 37 823 859 48 456 646 37 829 122 26 137 391 153 980 624
B 4 785 391 27 986 735 32 606 799 17 508 578 13 565 478 96 452 984
C 10 312 978 40 355 400 40 786 731 30 390 723 20 105 509 141 951 342
D 113 557 190 4 646 804 26 221 910 37 658 690 25 106 230 19 923 554
E 71 633 182 2 899 843 10 978 942 19 965 399 18 917 187 18 871 810
F 137 785 767 2 699 605 15 921 870 31 887 739 32 607 365 54 669 186
Total 29 078 410 149 288 718 211 361 825 162 359 208 153 272 929 715 361 092
Source: Adapted from Cant & Machado (2005:53)
From Table 2.19 above, Cant and Machado (2005:53) make the following interesting
observations:
• Households with a tertiary qualification have the highest household expenditure of
the six groups reinforcing the fact that there is a direct correlation between level of
education and income.
• The Baby Boom generation (life stage 3 and life stage 4) are the households with
the highest level of expenditure.
• Generation X (life stage 2) has a higher household expenditure than that of the
Pre-Depression and Depression generation together (life stage 5)
• Generation Y (Life stage 1) has the lowest household expenditure of the life
stages. This makes sense as this generation is still entering in the job market. It is
also the segment of the market that has the highest unemployment rate.
The importance of disposable income and how much of it is spent on mobile phones
by Generation Y consumers was investigated in the empirical research phase.
63
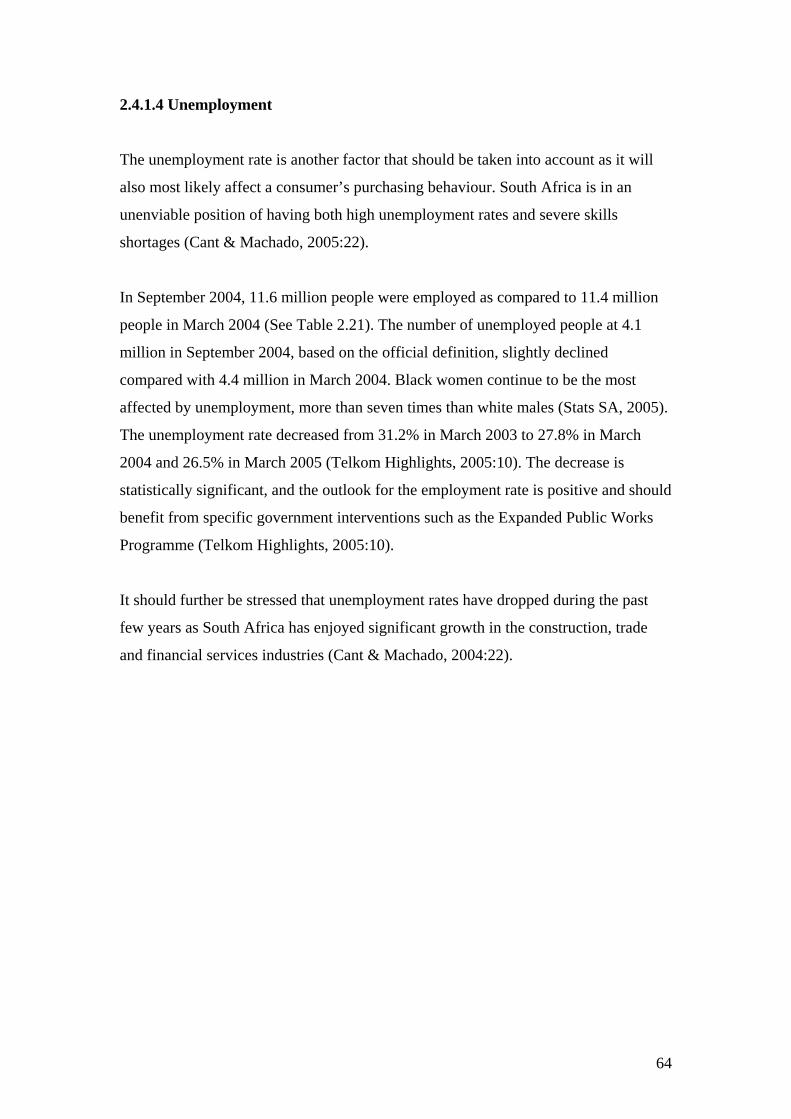
2.4.1.4 Unemployment
The unemployment rate is another factor that should be taken into account as it will
also most likely affect a consumer’s purchasing behaviour. South Africa is in an
unenviable position of having both high unemployment rates and severe skills
shortages (Cant & Machado, 2005:22).
In September 2004, 11.6 million people were employed as compared to 11.4 million
people in March 2004 (See Table 2.21). The number of unemployed people at 4.1
million in September 2004, based on the official definition, slightly declined
compared with 4.4 million in March 2004. Black women continue to be the most
affected by unemployment, more than seven times than white males (Stats SA, 2005).
The unemployment rate decreased from 31.2% in March 2003 to 27.8% in March
2004 and 26.5% in March 2005 (Telkom Highlights, 2005:10). The decrease is
statistically significant, and the outlook for the employment rate is positive and should
benefit from specific government interventions such as the Expanded Public Works
Programme (Telkom Highlights, 2005:10).
It should further be stressed that unemployment rates have dropped during the past
few years as South Africa has enjoyed significant growth in the construction, trade
and financial services industries (Cant & Machado, 2004:22).
64
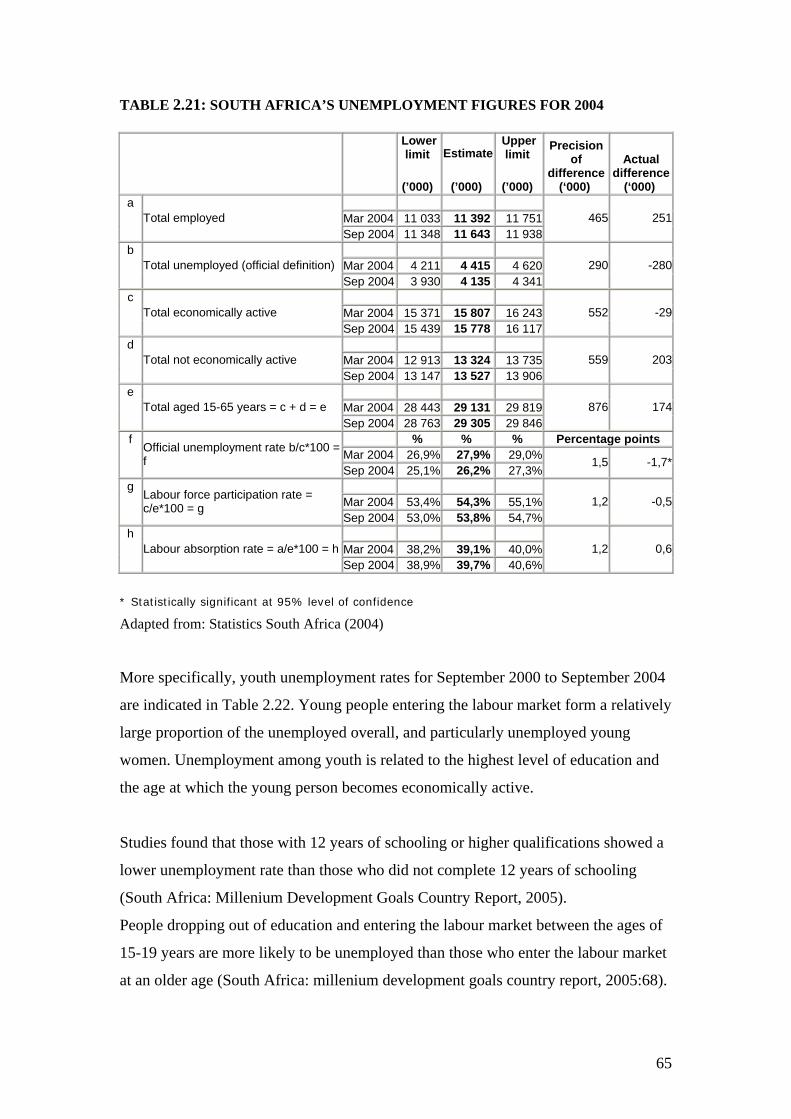
TABLE 2.21: SOUTH AFRICA’S UNEMPLOYMENT FIGURES FOR 2004
Lower limit
(’000)
Estimate
(’000)
Upper limit
(’000)
Precision of
difference (‘000)
Actual difference
(‘000) Mar 2004 11 033 11 392 11 751
a Total employed
Sep 2004 11 348 11 643 11 938 465 251
Mar 2004 4 211 4 415 4 620
b Total unemployed (official definition)
Sep 2004 3 930 4 135 4 341 290 -280
Mar 2004 15 371 15 807 16 243
c Total economically active
Sep 2004 15 439 15 778 16 117 552 -29
Mar 2004 12 913 13 324 13 735
d Total not economically active
Sep 2004 13 147 13 527 13 906 559 203
Mar 2004 28 443 29 131 29 819
e Total aged 15-65 years = c + d = e
Sep 2004 28 763 29 305 29 846 876 174
% % % Percentage pointsMar 2004 26,9% 27,9% 29,0%
f Official unemployment rate b/c*100 = f
Sep 2004 25,1% 26,2% 27,3% 1,5 -1,7*
Mar 2004 53,4% 54,3% 55,1%
g Labour force participation rate = c/e*100 = g
Sep 2004 53,0% 1,2 -0,5
53,8% 54,7% Mar 2004 38,2% 39,1% 40,0%
h Labour absorption rate = a/e*100 = h
Sep 2004 38,9% 39,7% 40,6% 1,2 0,6
* Statistically significant at 95% level of confidence
Adapted from: Statistics South Africa (2004)
More specifically, youth unemployment rates for September 2000 to September 2004
are indicated in Table 2.22. Young people entering the labour market form a relatively
large proportion of the unemployed overall, and particularly unemployed young
women. Unemployment among youth is related to the highest level of education and
the age at which the young person becomes economically active.
Studies found that those with 12 years of schooling or higher qualifications showed a
lower unemployment rate than those who did not complete 12 years of schooling
(South Africa: Millenium Development Goals Country Report, 2005).
People dropping out of education and entering the labour market between the ages of
15-19 years are more likely to be unemployed than those who enter the labour market
at an older age (South Africa: millenium development goals country report, 2005:68).
65
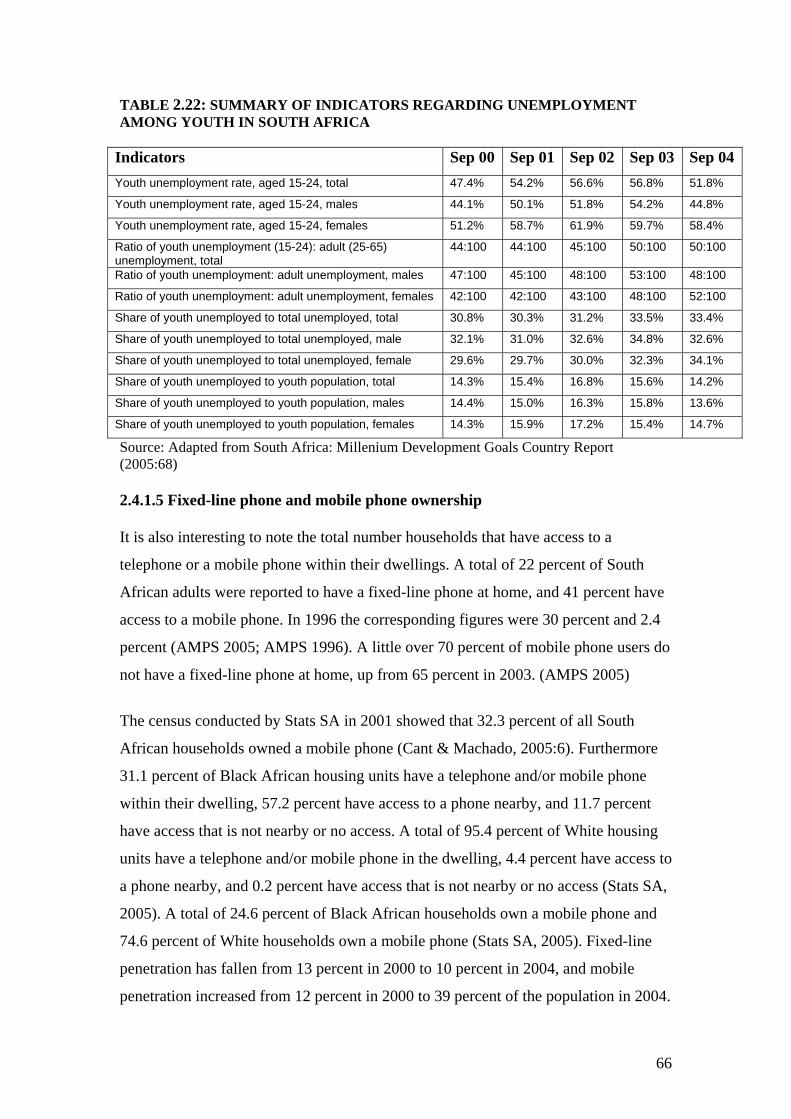
TABLE 2.22: SUMMARY OF INDICATORS REGARDING UNEMPLOYMENT AMONG YOUTH IN SOUTH AFRICA
Indicators Sep 00 Sep 01 Sep 02 Sep 03 Sep 04Youth unemployment rate, aged 15-24, total 47.4% 54.2% 56.6% 56.8% 51.8%
Youth unemployment rate, aged 15-24, males 44.1% 50.1% 51.8% 54.2% 44.8%
Youth unemployment rate, aged 15-24, females 51.2% 58.7% 61.9% 59.7% 58.4%
Ratio of youth unemployment (15-24): adult (25-65) unemployment, total
44:100 44:100 45:100 50:100 50:100
Ratio of youth unemployment: adult unemployment, males 47:100 45:100 48:100 53:100 48:100
Ratio of youth unemployment: adult unemployment, females 42:100 42:100 43:100 48:100 52:100
Share of youth unemployed to total unemployed, total 30.8% 30.3% 31.2% 33.5% 33.4%
Share of youth unemployed to total unemployed, male 32.1% 31.0% 32.6% 34.8% 32.6%
Share of youth unemployed to total unemployed, female 29.6% 29.7% 30.0% 32.3% 34.1%
Share of youth unemployed to youth population, total 14.3% 15.4% 16.8% 15.6% 14.2%
Share of youth unemployed to youth population, males 14.4% 15.0% 16.3% 15.8% 13.6%
Share of youth unemployed to youth population, females 14.3% 15.9% 17.2% 15.4% 14.7%
Source: Adapted from South Africa: Millenium Development Goals Country Report (2005:68) 2.4.1.5 Fixed-line phone and mobile phone ownership
It is also interesting to note the total number households that have access to a
telephone or a mobile phone within their dwellings. A total of 22 percent of South
African adults were reported to have a fixed-line phone at home, and 41 percent have
access to a mobile phone. In 1996 the corresponding figures were 30 percent and 2.4
percent (AMPS 2005; AMPS 1996). A little over 70 percent of mobile phone users do
not have a fixed-line phone at home, up from 65 percent in 2003. (AMPS 2005)
The census conducted by Stats SA in 2001 showed that 32.3 percent of all South
African households owned a mobile phone (Cant & Machado, 2005:6). Furthermore
31.1 percent of Black African housing units have a telephone and/or mobile phone
within their dwelling, 57.2 percent have access to a phone nearby, and 11.7 percent
have access that is not nearby or no access. A total of 95.4 percent of White housing
units have a telephone and/or mobile phone in the dwelling, 4.4 percent have access to
a phone nearby, and 0.2 percent have access that is not nearby or no access (Stats SA,
2005). A total of 24.6 percent of Black African households own a mobile phone and
74.6 percent of White households own a mobile phone (Stats SA, 2005). Fixed-line
penetration has fallen from 13 percent in 2000 to 10 percent in 2004, and mobile
penetration increased from 12 percent in 2000 to 39 percent of the population in 2004.
66
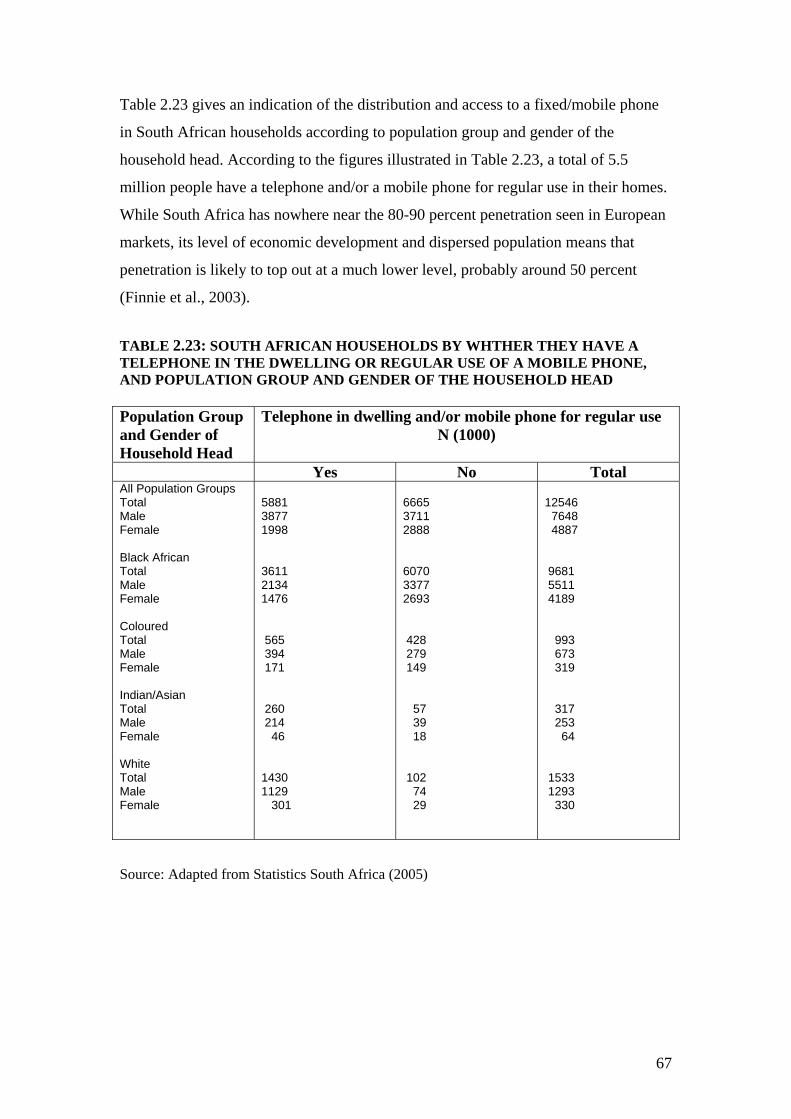
Table 2.23 gives an indication of the distribution and access to a fixed/mobile phone
in South African households according to population group and gender of the
household head. According to the figures illustrated in Table 2.23, a total of 5.5
million people have a telephone and/or a mobile phone for regular use in their homes.
While South Africa has nowhere near the 80-90 percent penetration seen in European
markets, its level of economic development and dispersed population means that
penetration is likely to top out at a much lower level, probably around 50 percent
(Finnie et al., 2003).
TABLE 2.23: SOUTH AFRICAN HOUSEHOLDS BY WHTHER THEY HAVE A TELEPHONE IN THE DWELLING OR REGULAR USE OF A MOBILE PHONE, AND POPULATION GROUP AND GENDER OF THE HOUSEHOLD HEAD Population Group and Gender of Household Head
Telephone in dwelling and/or mobile phone for regular use N (1000)
Yes No Total All Population Groups Total Male Female Black African Total Male Female Coloured Total Male Female Indian/Asian Total Male Female White Total Male Female
5881 3877 1998 3611 2134 1476 565 394 171 260 214 46 1430 1129 301
6665 3711 2888 6070 3377 2693 428 279 149 57 39 18
12546 7648 4887 9681 5511 4189 993 673 319 317 253 64
102 1533 74 1293 29 330
Source: Adapted from Statistics South Africa (2005)
67
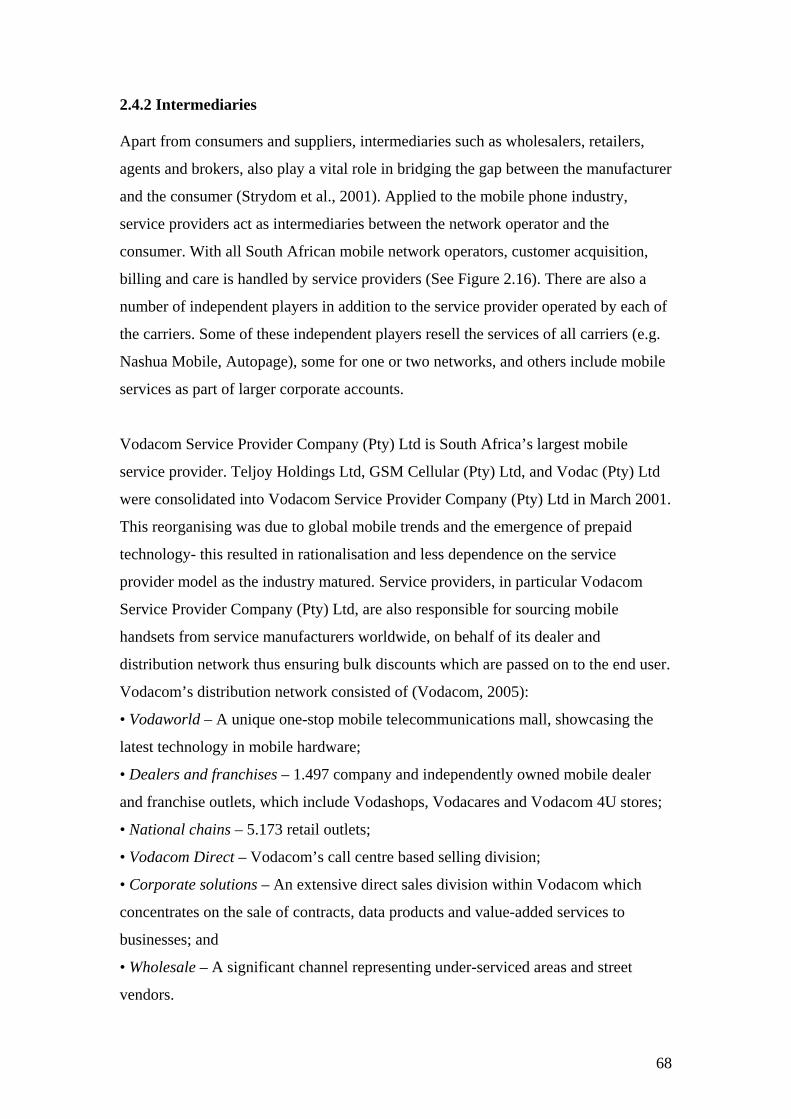
2.4.2 Intermediaries Apart from consumers and suppliers, intermediaries such as wholesalers, retailers,
agents and brokers, also play a vital role in bridging the gap between the manufacturer
and the consumer (Strydom et al., 2001). Applied to the mobile phone industry,
service providers act as intermediaries between the network operator and the
consumer. With all South African mobile network operators, customer acquisition,
billing and care is handled by service providers (See Figure 2.16). There are also a
number of independent players in addition to the service provider operated by each of
the carriers. Some of these independent players resell the services of all carriers (e.g.
Nashua Mobile, Autopage), some for one or two networks, and others include mobile
services as part of larger corporate accounts.
Vodacom Service Provider Company (Pty) Ltd is South Africa’s largest mobile
service provider. Teljoy Holdings Ltd, GSM Cellular (Pty) Ltd, and Vodac (Pty) Ltd
were consolidated into Vodacom Service Provider Company (Pty) Ltd in March 2001.
This reorganising was due to global mobile trends and the emergence of prepaid
technology- this resulted in rationalisation and less dependence on the service
provider model as the industry matured. Service providers, in particular Vodacom
Service Provider Company (Pty) Ltd, are also responsible for sourcing mobile
handsets from service manufacturers worldwide, on behalf of its dealer and
distribution network thus ensuring bulk discounts which are passed on to the end user.
Vodacom’s distribution network consisted of (Vodacom, 2005):
• Vodaworld – A unique one-stop mobile telecommunications mall, showcasing the
latest technology in mobile hardware;
• Dealers and franchises – 1.497 company and independently owned mobile dealer
and franchise outlets, which include Vodashops, Vodacares and Vodacom 4U stores;
• National chains – 5.173 retail outlets;
• Vodacom Direct – Vodacom’s call centre based selling division;
• Corporate solutions – An extensive direct sales division within Vodacom which
concentrates on the sale of contracts, data products and value-added services to
businesses; and
• Wholesale – A significant channel representing under-serviced areas and street
vendors.
68
MTN subsidiaries, MTN SP and iTalk Cellular, both exclusively sell MTN mobile
services, as does independent corporate service provider Orion Cellular (Finnie et al.,
2003:135). Three other service providers sell MTN services as part of a multiple
operator portfolio: Nashua Mobile, Autopage Cellular and Supercall Cellular. Cell C
also works with three service providers- Cell C Service Provider as well as Autopage
and Nashua Mobile which both also sell the services of MTN and Vodacom. Cell C
uses a diverse range of channels, in keeping with its competitors, and its distribution
footprint is not comparable to those of MTN and Vodacom (Finnie et al., 2003).
Besides the important role the service provider plays, there is also a wide range of
different types of outlets for mobile phones as seen in Figure 2.19. These include
specialist retailers who are independent of the major networks, retailers that are linked
to a particular network provider (e.g. Vodacom shop), and non- specialist outlets
(Woolworths and supermarket chains).
FIGURE 2.19: ANALYSING THE INTERMEDIARIES IN THE SOUTH AFRICAN MOBILE MARKET
Regulatory Environment
Socio-Political Environment
Service Provider Service Provider Service Provider (Aligned) (Dual) (Aligned)
Dealer Dealer (Aligned) (Aligned)
Subscribers
Economic Environment Technological
Environment
Source: Adapted from Du Toit (1996:28)
69
2.4.3 Suppliers A business organisation also requires inputs from the environment so that it can
convert them into outputs for sale in the market environment. Suppliers form part of
the market environment as illustrated in Figure 2.1. The inputs provided by suppliers
are mainly material (raw materials), equipment energy, capital and labour (Cronje et
al., 2004:91). The interaction that exists between a business organisation and its
supplier is critical for it to achieve any success in the competitive market place.
2.4.3.1 Telecommunications equipment vendors
The South African telecommunications equipment-manufacturing sector is small in
global standards but is yet the largest and most advanced sector in Africa. South
Africa will need a strong telecommunications supply industry in order to attract more
investment, generate economic activity and employment to fulfill the development
needs of the country. The telecommunications sector provides employment for
thirteen thousand people and has an annual turnover of R3 billion (Ali, 2003:92).
This industry is dominated by a number of manufacturing organisations such as
Siemens SA, Ericsson SA, Telephone Manufacturers SA (Pty) Ltd (TEMSA), Alcatel
Altech Telecoms (AAT), and Grintek Telekom (Grinaker). Altech was South Africa’s
first exclusive supplier of transmission equipment whilst Siemens, Altech, and Temsa
provided switches. Siemens also supplied telex, teletex equipment, and telephone
exchange power supply equipment. Temsa, originally set up by the local Plessey and
GEC companies, was the sole manufacturer of standard telephones (Alcatel, 2005).
Each of these leading telecommunications equipment players will be discussed in
more detail below:
(1) Siemens SA. Siemens has been operating in South Africa since 1860 and in that
time has been a driving force in the development of the country's telecommunication
infrastructure both fixed and mobile. Siemens Southern Africa plans to double
turnover to more than R10 billion ($1.3 billion) by 2005. Dr Klaus Döring, Chief
Executive Officer of Siemens South Africa Ltd, stated that the company achieved
sales of R5.3 billion in its last financial year, generating pre-tax profit of R431
70
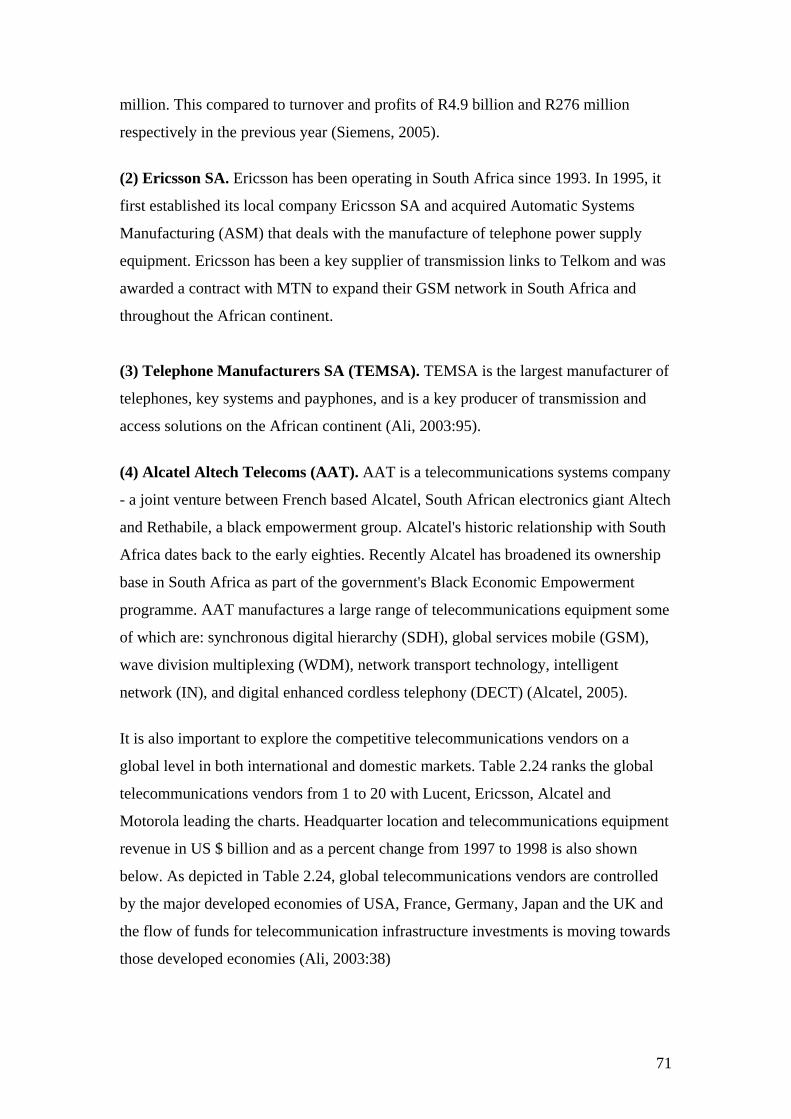
million. This compared to turnover and profits of R4.9 billion and R276 million
respectively in the previous year (Siemens, 2005).
(2) Ericsson SA. Ericsson has been operating in South Africa since 1993. In 1995, it
first established its local company Ericsson SA and acquired Automatic Systems
Manufacturing (ASM) that deals with the manufacture of telephone power supply
equipment. Ericsson has been a key supplier of transmission links to Telkom and was
awarded a contract with MTN to expand their GSM network in South Africa and
throughout the African continent.
(3) Telephone Manufacturers SA (TEMSA). TEMSA is the largest manufacturer of
telephones, key systems and payphones, and is a key producer of transmission and
access solutions on the African continent (Ali, 2003:95).
(4) Alcatel Altech Telecoms (AAT). AAT is a telecommunications systems company
- a joint venture between French based Alcatel, South African electronics giant Altech
and Rethabile, a black empowerment group. Alcatel's historic relationship with South
Africa dates back to the early eighties. Recently Alcatel has broadened its ownership
base in South Africa as part of the government's Black Economic Empowerment
programme. AAT manufactures a large range of telecommunications equipment some
of which are: synchronous digital hierarchy (SDH), global services mobile (GSM),
wave division multiplexing (WDM), network transport technology, intelligent
network (IN), and digital enhanced cordless telephony (DECT) (Alcatel, 2005).
It is also important to explore the competitive telecommunications vendors on a
global level in both international and domestic markets. Table 2.24 ranks the global
telecommunications vendors from 1 to 20 with Lucent, Ericsson, Alcatel and
Motorola leading the charts. Headquarter location and telecommunications equipment
revenue in US $ billion and as a percent change from 1997 to 1998 is also shown
below. As depicted in Table 2.24, global telecommunications vendors are controlled
by the major developed economies of USA, France, Germany, Japan and the UK and
the flow of funds for telecommunication infrastructure investments is moving towards
those developed economies (Ali, 2003:38)
71
TABLE 2.24: TOP 20 GLOBAL TELECOMMUNICATIONS EQUIPMENT VENDORS
Telecom equipment revenue Rank 1998
Company Headquarters US$
billion % change 1997-98
As % of total sales
1 Lucent a) USA 26.8 16.5% 89%2 Ericsson Sweden 21.5 10.0% 95%3 Alcatel France 20.9 14.2% 84%4 Motorola USA 20.5 -0.7% 70%5 Nortel Canada 17.3 11.7% 98%6 Siemens a) Germany 16.8 10.7% 25%7 Nokia Finland 14.7 59.4% 94%8 NEC b) Japan 12.6 -13.1% 31%9 Cisco c) USA 8.4 31.2% 100%
10 Hughes USA 5.7 19.7% 96%11 Fujitsu b) Japan 5.7 -14.8% 13%12 Samsung Elec. Korea (Rep.) 5.5 8.8% 33%13 3Com d) USA 5.4 -3.3% 100%14 IBM USA 5.1 4.0% 6%15 Matsushita Comm.
b)Japan 4.3 4.0% 58%
16 HP e) USA 3.2 9.7% 7%17 GEC b) UK 3.1 8.3% 24%18 Qualcomm a) USA 2.9 65.2% 86%19 Bosch Germany 2.8 0.0% 10%20 Italtel Italy 2.2 -12.8% 95%
Top 20 205 10.3% 40%
Note: a) Year ending 30 September. b) Year beginning 1 April. c) Year ending July 25. d) Year ending 31 May. e) Year ending 31 October.
Source: International Telecommunications Union (2004)
The three companies, Lucent, Ericsson and Alcatel were cited as the top three
telecommunication equipment vendors followed closely by Motorola, Nortel and
Siemens. Bosh and Italtel are ranked 19th and 20th respectively with the former
amounting revenues of $2.8 billion and the latter $2.2 billion (See Table 2.24).
Competitors in the market environment (refer to Figure 2.1) will be discussed in the
next section.
72
2.4.4 Competitors Competitors within the market environment, as illustrated in Figure 2.1, determine
how much of a given product can be sold and at what price can be asked for it.
Cronje, Du Toit, Marais and Motlatla (2004:93) define competition as “a situation in
the market environment in which several businesses, offering more or less the same
kind of product or service, compete for the support of the same customers”
The current state of the mobile phone industry in South Africa can be assessed using
Porter’s five forces model (Porter, 1992). This is a widely used and proven model that
identifies five potential competitive forces. 2.4.4.1 Porter’s 5 forces model
According to Porter (1980, 1985) and Porter and Millar (1985) an organisation
develops its business strategies in order to obtain competitive advantage (i.e., increase
profits) over its competitors. It does this by responding to five primary forces (Shin,
2001). These forces will help identify the presence of potential returns. If Porter’s five
forces are weak, the greater the potential exists for organisations to experience higher
profitability and thus the better the chances for success. Since the mobile phone
industry dramatically affects these competitive forces, mobile network operators
should take these forces into account when formulating their strategies (Shin, 2001).
In his recent study, Porter (2001) reemphasized the importance of analysing the five
competitive forces in developing strategies for competitive advantage. “Although
some have argued that today’s rapid pace of technological change makes industry
analysis less valuable, the opposite is true. Analysing the forces illuminates an
industry’s fundamental attractiveness, exposes the underlying drivers of average
industry profitability, and provides insight into how profitability will evolve in the
future. The five competitive forces still determine profitability even if suppliers,
channels, substitutes, or competitors change” (Porter, 2001:66).
73
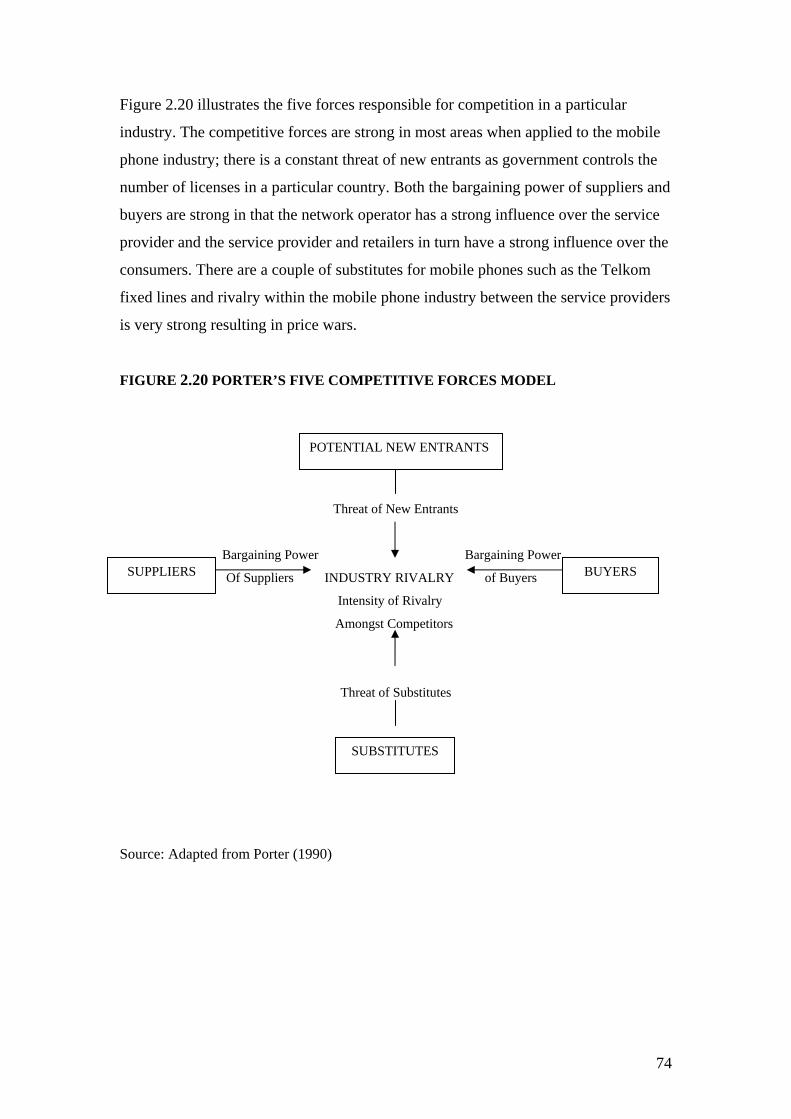
Figure 2.20 illustrates the five forces responsible for competition in a particular
industry. The competitive forces are strong in most areas when applied to the mobile
phone industry; there is a constant threat of new entrants as government controls the
number of licenses in a particular country. Both the bargaining power of suppliers and
buyers are strong in that the network operator has a strong influence over the service
provider and the service provider and retailers in turn have a strong influence over the
consumers. There are a couple of substitutes for mobile phones such as the Telkom
fixed lines and rivalry within the mobile phone industry between the service providers
is very strong resulting in price wars.
FIGURE 2.20 PORTER’S FIVE COMPETITIVE FORCES MODEL
POTENTIAL NEW ENTRANTS
Threat of New Entrants
Bargaining Power Bargaining Power
Of Suppliers INDUSTRY RIVALRY of Buyers
Intensity of Rivalry
Amongst Competitors
Threat of Substitutes
SUPPLIERS BUYERS
SUBSTITUTES
Source: Adapted from Porter (1990)
74
2.4.4.1.1 Threat of new entrants
As illustrated in Figure 2.20, potential new entrants are organisations that identify the
opportunities for making excess returns to enter the respective market. New entrants
are likely to increase competition subject to the entry barriers. High barriers exist in
the mobile phone industry due to government policy but the threat of new entrants is
always real. This threat became real when the Independent Commission Authority of
South Africa (ICASA) awarded Cell C the third mobile network licence. The South
African mobile market has become more competitive as a result of the third license
and each company must thus consolidate and retain its position in the market place.
There is fierce competition between Vodacom and MTN for market share but with
Cell C entering the market, market share was redistributed amongst the three
networks. At the moment, it seems that the threat of potential entrants is quite low
when looking at the overview of the mobile phone industry. High set up costs and
government regulations regarding the operation of a licence are the main reasons for a
low threat of potential entrants (Van der Wal, Pampallis & Bond, 2002).
Recently however, the Ministry of Communications announced in September 2004
new policy directives aimed at opening up the mobile phone market and said it has
completed a feasibility study for the allocation of a fourth licence. A fourth licence
would have to battle two firmly entrenched players in Vodacom and MTN and a
relative newcomer in Cell C. The attitude of Vodacom towards new entrants has
baffled many. Vodacom welcomed the entry of Cell C in 2001 saying greater
competition would stimulate the market and that it would even be content if there
were five operators in the country (Sewsunker, 2004).
Furthermore, one of the potential benefits of introducing competition in the fixed-line
telecommunications market would be for operators to be able to build out their own
links to base-stations, or to secure those services from an alternative provider and to
create competition for Telkom. The introduction of competition should in turn drive
down network operating costs (Finnie et al., 2003:67).
75
2.4.4.1.2 Threat of substitutes
Substitute products in Figure 2.20 are products that offer similar utility to customers
according to their needs. The threat of substitute products depends on (Du Plessis,
Jooste & Strydom, 2001:46):
• Buyers’ willingness to substitute (landline phones for mobile phones)
• The relative price and performance of substitutes
• The advantages that substitutes offer over traditional products
• The cost of switching to substitutes
• The image/identity of substitutes
The most important option for consumers in terms of product substitution in the
mobile phone industry is Telkom’ s fixed lines. Both Telkom fixed line phones and
mobile phones satisfy the user’s need for communication. However, mobile
connections in South Africa far exceed those of fixed line connections. Furthermore,
Telkom’s fixed line monopoly expired in February 2005 and new role players are
likely to enter the market and offer new services they were never allowed to be
launched before. Telkom’s monopoly has long prevented other players from
flourishing and bringing with them better and more innovative services to the public
(Business Day, 2005b). Findings further reveal that the number of mobile phones
being used in Africa outstripped the number of fixed-line phones and many analysts
agree that fixed-line phones are in a declining stage. Furthermore, the lack of fixed
line facilities and Telkom’s history of poor service delivery has been a major cause of
customer dissatisfaction. Telkom is aiming to prove everyone wrong by operating in
other African countries. With its streamlined organisation, cash flows of R9 billion in
financial 2004, years of technical experience, Telkom is eager to embrace cheaper
modern technologies such as the amalgamation of fixed-line services with mobile
services- for example, introducing mobile services that allows individuals to send
SMS’ s over a fixed line phone. This will be priced competitively, possibly at 10
percent cheaper that the mobile equivalent, enabling Telkom to compete with the
mobile operators on cost, as its fixed-line traffic is connected on its own network
(Business Day, 2005b).
76
Furthermore as a result of Telkom being a major shareholder in Vodacom, Telkom is
receiving income from a competitor making it less vulnerable to competition from
substitute products.
Another substitute for mobile phone services is the emergence of wireless satellite
telephony. This refers to telecommunication networks that use radio and satellite
equipment as the chief component of their infrastructure, in order to provide
telecommunication services (Ali, 2003:99). As a result of the convergence of
telecommunication and information technology industries, voice and data traffic will
be carried on new worldwide-integrated technology platforms. The convergence of
voice and data into a next generation industry is creating new challenges for the
telecommunication industries as well as for cable and Internet providers (Van der Wal
et al., 2002).
2.4.4.1.3 Bargaining power of buyers and suppliers
Whereas competitors have the ability to influence an industry by either demanding
increased quality, forcing prices down or ultimately engage competitors against each
other, suppliers and buyers can use their bargaining power to affect the profit margin
of the organisation (See Figure 2.20). The profit margin of the organisation would be
reduced if suppliers demand high prices for their supply and buyers ask for a
relatively low price for the final product. Buyers can enjoy a position of strength over
the firm from which they purchase products by superior bargaining power. Suppliers
have the ability to influence an industry by either reducing the quality of their
offerings, raising their prices or withholding access to key technologies such as in the
case of the mobile phone industry. Currently, South African mobile consumers are
price-takers, in other words, they do exert not much influence on the determination of
price for products and services.
77
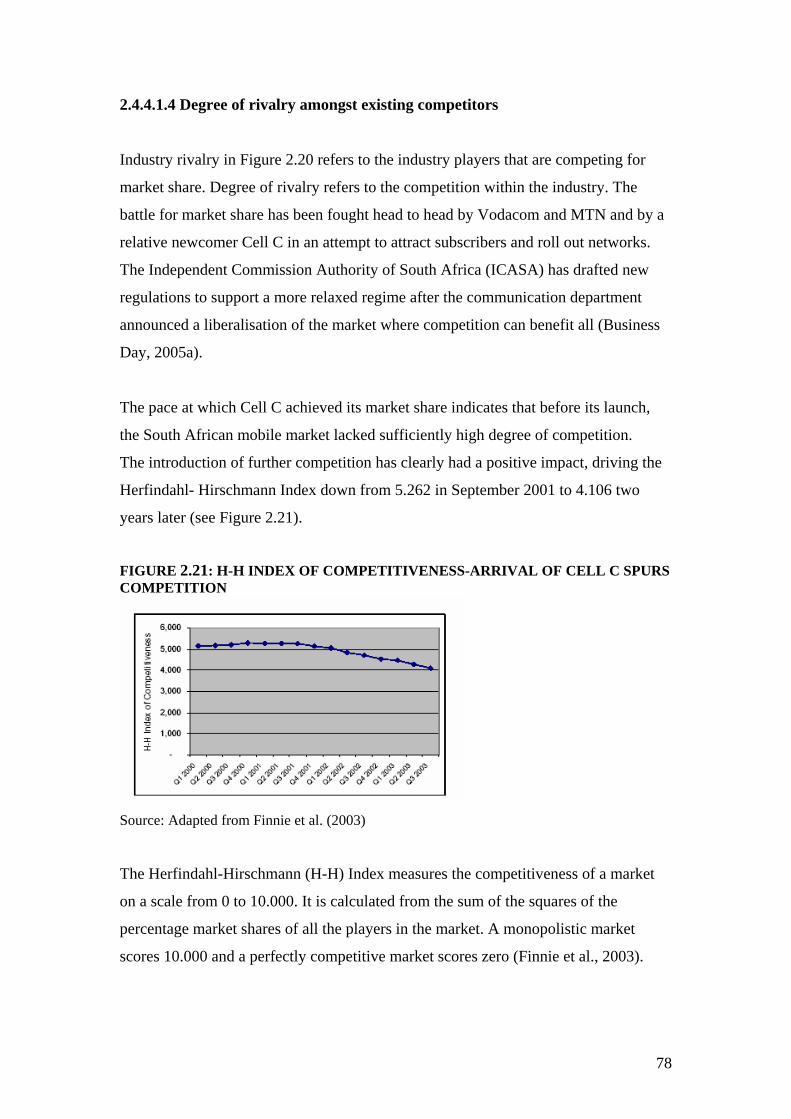
2.4.4.1.4 Degree of rivalry amongst existing competitors
Industry rivalry in Figure 2.20 refers to the industry players that are competing for
market share. Degree of rivalry refers to the competition within the industry. The
battle for market share has been fought head to head by Vodacom and MTN and by a
relative newcomer Cell C in an attempt to attract subscribers and roll out networks.
The Independent Commission Authority of South Africa (ICASA) has drafted new
regulations to support a more relaxed regime after the communication department
announced a liberalisation of the market where competition can benefit all (Business
Day, 2005a).
The pace at which Cell C achieved its market share indicates that before its launch,
the South African mobile market lacked sufficiently high degree of competition.
The introduction of further competition has clearly had a positive impact, driving the
Herfindahl- Hirschmann Index down from 5.262 in September 2001 to 4.106 two
years later (see Figure 2.21).
FIGURE 2.21: H-H INDEX OF COMPETITIVENESS-ARRIVAL OF CELL C SPURS COMPETITION
Source: Adapted from Finnie et al. (2003)
The Herfindahl-Hirschmann (H-H) Index measures the competitiveness of a market
on a scale from 0 to 10.000. It is calculated from the sum of the squares of the
percentage market shares of all the players in the market. A monopolistic market
scores 10.000 and a perfectly competitive market scores zero (Finnie et al., 2003).
78
2.4.5 Opportunities and threats
An interaction between a business organisation and its customers, suppliers and
competitors can result in opportunities and threats to a business within the market
environment. According to Kotler (2003) an environmental threat “is a challenge
posed by an unfavourable trend or development that would lead, in the absence of
defensive marketing action, a deterioration in sales or profit.” He further defines an
opportunity as “an area of buyer need in which a company can perform profitably”
(Kotler, 2003).
South Africa has a strong mobile phone industry that includes the largest and most
sophisticated mobile network operators in Africa. However, like any industry in the
world, it faces opportunities like the liberalisation of the telecommunications market,
the convergence of ICT products and services (superior technology available through
3G) and the penetration into new markets in Africa. In the spirit of convergence, new
partnerships will emerge between different sectors of the market creating
opportunities emerging between these players. Potential threats could come in the
form of competitors, environmental risks (e.g. disposable phones), health effects (e.g.
radiation), telecommunication regulations and global economic changes. A fresh
wave of competition into the market, like any change, could pose a threat to the
existing organisation but could simultaneously bring opportunities to those can
successfully exploit them (Ali, 2003).
79
2.5 MACRO-ENVIRONMENT
The third and last component of the business environment as highlighted in Figure 2.1
(column 3) is the macro-environment. The macro-environment includes more general
forces and consists of six distinct sub-environments: the technological, economic,
social, physical, institutional, and international or global environments which impact
on the mobile phone industry in various ways (Cronje et al., 2004:87). Although these
forces do not directly affect the activities of an organisation, they do influence its
long-run decisions:
• The technological environment includes the technology responsible for innovation
and introducing change
• The economic environment includes interest rates, inflation rates, exchange rates
and trade and budget deficits that influence the prosperity of the business
organisation
• The social environment includes people’s lifestyles, values and lifestyles that
make demands on the business organisations
• The physical environment comprises natural resources such as mineral wealth,
flora and fauna and man-made improvements such as roads and bridges
• The institutional environment includes governmental rules and regulations
• The international or global environment includes all the world market trends
where local and foreign political trends and events affect the business
organisation’s micro-environment as well as the market environment
For decades, South Africa has been isolated politically, economically and socially
from the rest of the continent (South Africa’s business presence occasional paper,
2004). In the early 1990’s, South Africa reintegrated itself at a time when the global
environment boomed with the explosion of ICT. This caused an increase in flow of
information and a new ease of global communications between people and countries.
Each of these macro-environment forces will be discussed in detail in the next
sections.
80
2.5.1 Technological environment
Technology is one of the variables in the macro-environment that has the most direct
effect on the mobile phone industry as this industry relies on technology for its
survival. Technology is the driving force behind the developments of the mobile
phone as mobile phones can be used not only for voice communication but also as
multimedia devices. The technological environment is responsible for innovation and
change, and technological innovation is occurring at different speeds and with
different benefits and risks in both the developed and developing economies.
Furthermore, technology has always been a driving force in community development
and plays a critical role in the success of an organisation; it allows for access to
information flows and is the bridge for the digital divide between people,
organisations and countries. South Africa needs to know where the technological
trends are going and harness these technological forces if it is to stay ahead of the
game.
In understanding globalisation and the effect this has on the mobile phone industry, it
is important to sort out the different effects of exploitation of technology. This implies
changes in perceptions of time and place where technological developments drive
globalisation and globalisation stimulates the need and adoption of technologies.
There is widespread agreement that convergence occurs at the technological level.
Convergence will change how one conducts business, interacts within society and this
can been seen to be a viable commercial success that is changing the way people
behave. As technology convergence proceeds, this allows both traditional and new
communications to be combined- whether between broadcasting and
telecommunications, fixed and wireless and voice and data. The mobile phone
industry is already converging at different levels with several other industries like
entertainment, news, imaging and Internet services. It is this convergence that
industry players and regulators should focus on if they are to benefit from the full
range of opportunities that will be presented by the mobile phone industry over the
next five years (Finnie et al., 2003:35).
81
Furthermore, it should be taken into account that Generation Y consumers are
valuable early adopters. New technologies are picked up quickly, provided that they
observe the basic rules of economy, adaptability, technical pervasiveness, and market
pervasiveness (Spero & Stone, 2004:155). Generation Y wants the freshest in digital
development and want to try out the latest trend-setting capabilities, sounds and
graphics a mobile phone can offer (Mattheus, 2004). This generation has embraced
technological advances and the convergence of the mobile phone industry with the
entertainment industry will satisfy this technology-obsession and build image
extending the fascination of Generation Y consumers (Mattheus, 2004).
There are three important types of convergence, as mentioned above, in technological
markets (Finnie et al., 2003:35):
• Convergence between broadcasting and telecommunications (e.g. data services
over digital broadcasting platforms);
• Convergence between fixed and wireless networks (e.g. email access on mobile
phones);
• Convergence between voice and data networks (e.g. voice on the Internet).
In principle convergence can have one or (usually) more of the following effects. It
can (Finnie et al., 2003):
• reduce the cost of existing applications
• allow development of converged applications that have a greater functionality
• enable wider access to existing applications and content
• enable entry by competitors into previously closed markets
• disrupt the business models of existing service providers, especially well-established
service providers
• disrupt or obsolete existing regulation and regulatory concepts
82
2.5.1.1 Convergence between broadcasting and telecommunications Convergence between broadcasting and telecommunications has been driven by
technology and by the broadcast industry. This type of convergence will impact the
way people consume content. There have been a variety of new technologies that have
made it easier to deliver digital entertainment (video, audio and games) via the
Internet. These technologies include new digital compression schemes, video and
audio streaming, and broadband access networks. South Africa is not a market leader
in terms of broadcast services, thus, it is not likely to be at the forefront of the
convergence of wireless and broadcast services (Finnie et al., 2003).
2.5.1.2 Convergence between fixed and wireless networks
Convergence between fixed and wireless communications is also being driven
predominantly by technology and has already started taking off in South Africa.
However, it will take several years for fixed and wireless networks to be fully
integrated. Substitution of voice traffic from fixed to mobile networks will be a more
likely scenario at this point in time. There is also more cause for optimism
surrounding convergence of fixed and mobile content services.
With the help of Third Generation Mobile (3G) as a technological revolution of
Second Generation Mobile (2G), this type of convergence seeks to cost effectively
bridge the advantages of mobile to that of high-speed wireless data. Together with
mobile’s easy to use traits, 3G will allow wireless data to make its mark faster than
the Internet has been able to do (Murray & Chitamu, 2003).
The convergence of mobile and fixed Internet services will thus increase Internet
usage and this is achieved through WAP-based applications on mobile phones, or via
mobile data cards connected to laptop computers. There is an opportunity to use the
high mobile penetration rates to promote “mobile Internet” access to existing
consumers. For rural consumers, this can be through WAP services. For technology-
knowledgeable and business users, access to the “fixed Internet” can be delivered by
the network operators via general packet radio services (GPRS) data cards, or using
existing GPRS networks as modems for laptop computers.
83
The Vodacom launch of a third-generation (3G) technology product, the Vodafone
Mobile Connect card (retailing for R599 a month), and the intention of MTN and Cell
C to launch 3G technology services in 2005 could solve some of the internet problems
faced by the country (Masango, 2005).
Furthermore, the introduction of devices such as the BlackBerry mobile are a perfect
example for the convergence of mobile and fixed Internet services; the BlackBerry
mobile device has combined mobile phone, office and Internet technologies. The
always-on connection of this gadget delivers email directly to the Blackberry without
the user needing to dial-up. Users can receive, reply and forward emails as well as
view attachments, including Microsoft Word, Excel and Powerpoint. BlackBerry
users in Europe and the US said it had increased their productivity dramatically whilst
they were simultaneously spending less on dial-up fees and laptop computers
(Businessday, 2005c).
Convergence of fixed and mobile Internet in South Africa should be a low priority as
a result of its very low rates of residential Internet access. One of the reasons for this
is that convergence of fixed and mobile services in South Africa is far behind most
European countries and the high cost of mobile platform bandwidth is still likely to
militate against widespread usage of such 3G products (Masango, 2005). This view is
based on the simple fact that the fixed telecommunications infrastructure cannot be
compared to that of Europe’s. South Africa should therefore focus more on the
competition within the mobile phone industry rather than the convergence between
the fixed and mobile sectors (Finnie et al., 2003:36).
Furthermore, only a handful of businesses and tech-savvy consumers will be attracted
to 3G unless operators offer services that are easy to understand. According to Mark
Taylor, MD of Nashua Mobile who refers to a recent poll commissioned by
Netonomy in the UK, he found that 71 percent of South African respondents believe
mobile phone services are getting more complicated to understand and configure.
Only 41 percent of them were confident that they would find 3G phones and services
easy to use and a smaller number (4%) plan to upgrade to 3G.
84
To ensure that 3G is a success, devices should be delivered to users that are pre-
configured to take advantage of their services as well as be tied to 3G to “killer”
applications such as messaging for the mobile workforce and “cool” applications like
games, music, rich media news, and multimedia services for consumers.
2.5.1.3 Convergence between voice and data Convergence between voice and data networks is perhaps the major driver for change
in the mobile phone market as a result of its operational efficiency and customer
demand. “The rationale for convergence within the operator is coupled with customer
demand for new services reliant on next-generation infrastructure. In the consumer
market, uptake of interactive content depends on a transport infrastructure that
supports differentiated, high-fidelity delivery” (Finnie et al., 2003:5).
Convergence of voice and data networks is happening in two groups in South Africa-
the business sector and the telecommunications operator sector. These two groups will
focus internally on infrastructure convergence but will not be able to enjoy the
synergies provided by converged infrastructure because a regulatory boundary exists
between their network environments. For example, a South African business may use
an IP-based PBX to route international calls but it won’t be able to employ voice over
IP consistently for off-net calls.
From the perspective of IT and telecommunications convergence, South Africa is
already home to two global players in this area, Dimension Data and Datatec. These
network and systems integration companies are leaders in their field, and operate on a
global level to provide a range of IT and network-related services not only to
enterprises, but also to network operators across the globe. However, due to the high
cost of bandwidth of telecommunications, companies like Dimension Data cannot
host their own business information and applications locally.
Efforts are underway to stimulate the off-shore outsourcing of call and contact centers
to South Africa, led in part by the Department of Trade and Industry.
85
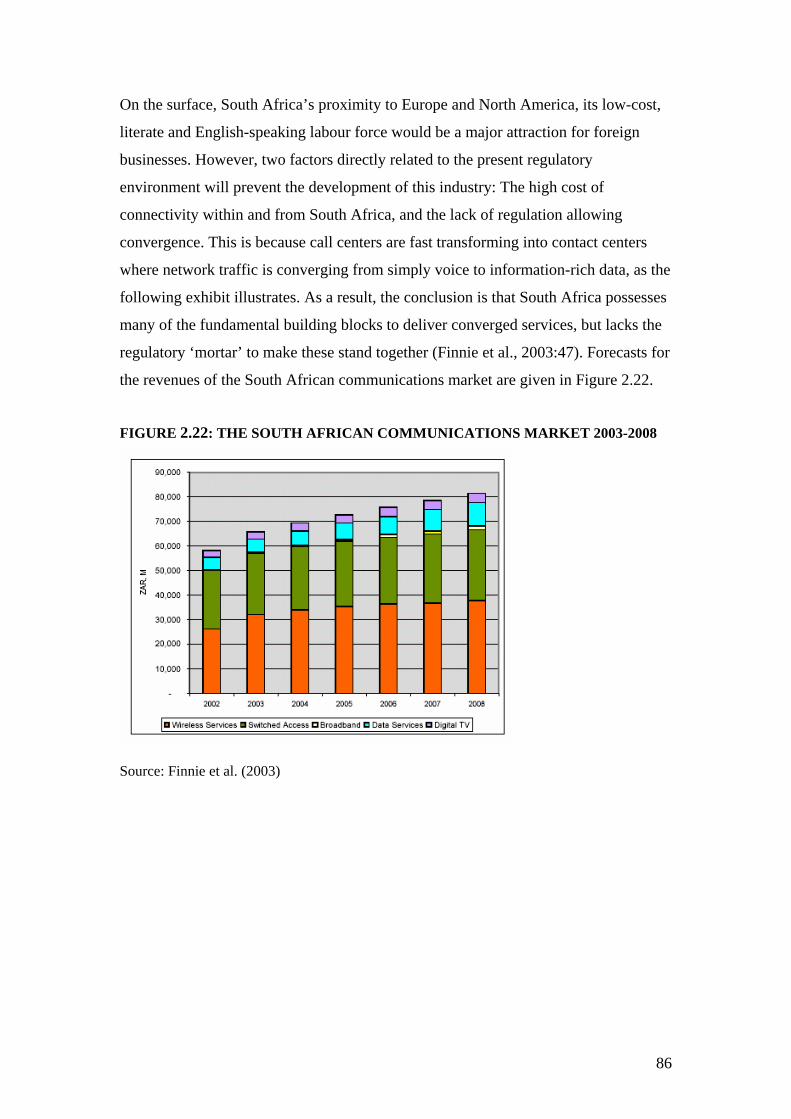
On the surface, South Africa’s proximity to Europe and North America, its low-cost,
literate and English-speaking labour force would be a major attraction for foreign
businesses. However, two factors directly related to the present regulatory
environment will prevent the development of this industry: The high cost of
connectivity within and from South Africa, and the lack of regulation allowing
convergence. This is because call centers are fast transforming into contact centers
where network traffic is converging from simply voice to information-rich data, as the
following exhibit illustrates. As a result, the conclusion is that South Africa possesses
many of the fundamental building blocks to deliver converged services, but lacks the
regulatory ‘mortar’ to make these stand together (Finnie et al., 2003:47). Forecasts for
the revenues of the South African communications market are given in Figure 2.22.
FIGURE 2.22: THE SOUTH AFRICAN COMMUNICATIONS MARKET 2003-2008
Source: Finnie et al. (2003)
86
2.5.2 Economic environment The second variable after technology is the economy (See Figure 2.1). The economic
environment plays a vital role in a particular industry and determines the success or
failure of an organisation. The South African economy has undergone rapid structural
change in the last ten years as a result of the dramatic change in the political
environment which brought about the end of economic and political isolation.
In 2005, South Africa’s economy appears to be experiencing one of its best periods in
many years; it was characterised by rising GDP growth, increased investment, robust
local business confidence, low inflation and interest rates, and signs of improvement
in formal employment levels (Telkom Highlights, 2005:10). The recovery in the pace
of the South African economic growth (measured quarter on quarter) has continued
throughout 2005 and relatively strong growth is expected throughout the forecast
period, until 2007 (Absa, 2006).
2.5.2.1 GDP growth
Gross domestic product (GDP) is defined as “the economic well being of a country
and is measured as the total value of all goods and services finally produced within
the borders of a country in a particular period (Cronje et al., 2004:99).” A high
economic growth rate suggests an increase in standards of living whilst a low
economic growth rate suggests just the opposite. South Africa should strive for a
growth rate of over 7 percent per year in real terms to provide employment and
alleviate poverty.
The South African economy has averaged a growth of over 3 percent per annum since
2000 and posted growth of 3 percent in 2003, 4.1 percent in 2004 and 4.1 percent in
2005 as can be seen from Table 2.24. Following a relatively modest real growth rate
of 3.5 percent in the first quarter of 2005, the South African economy picked up steam
in the second quarter with a real growth rate of 4.8 percent (Botha, 2005). This overall
real economic growth was as a result stronger exports in the second quarter in 2005,
improved agricultural conditions and inventory accumulation (Absa, 2006).
87
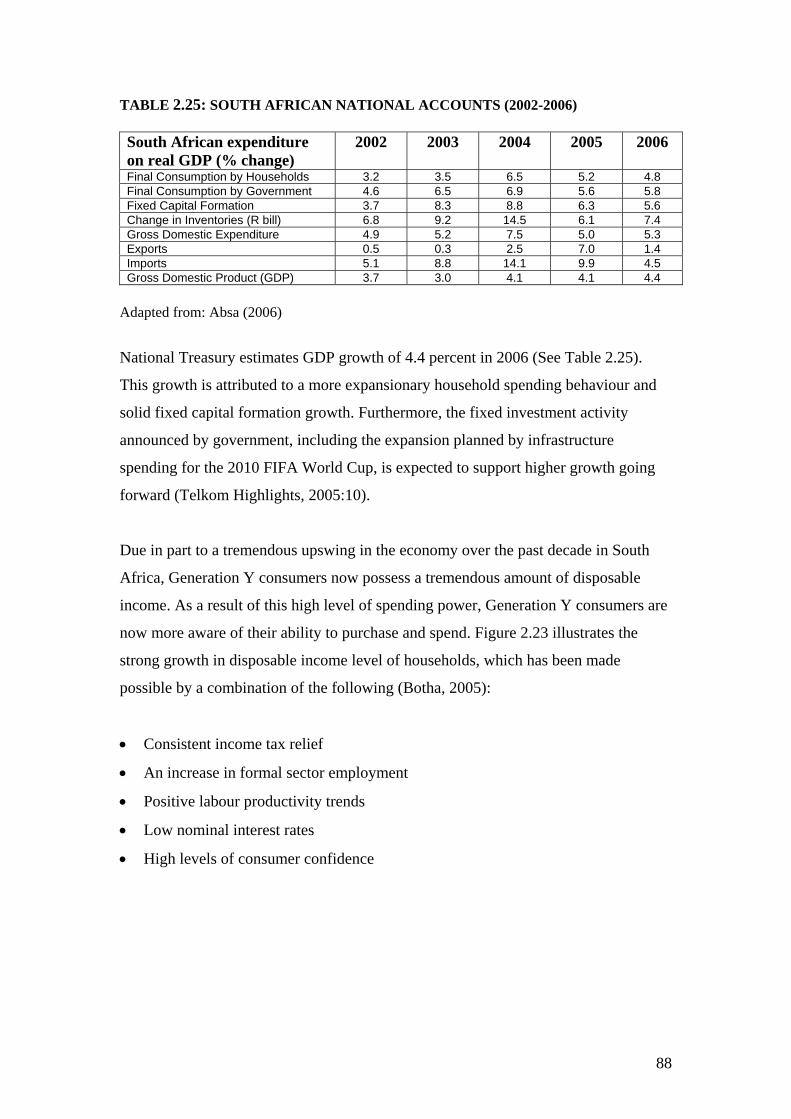
TABLE 2.25: SOUTH AFRICAN NATIONAL ACCOUNTS (2002-2006) South African expenditure on real GDP (% change)
2002
2003
2004
2005
2006
Final Consumption by Households 3.2 3.5 6.5 5.2 4.8 Final Consumption by Government 4.6 6.5 6.9 5.6 5.8 Fixed Capital Formation 3.7 8.3 8.8 6.3 5.6 Change in Inventories (R bill) 6.8 9.2 14.5 6.1 7.4 Gross Domestic Expenditure 4.9 5.2 7.5 5.0 5.3 Exports 0.5 0.3 2.5 7.0 1.4 Imports 5.1 8.8 14.1 9.9 4.5 Gross Domestic Product (GDP) 3.7 3.0 4.1 4.1 4.4
Adapted from: Absa (2006)
National Treasury estimates GDP growth of 4.4 percent in 2006 (See Table 2.25).
This growth is attributed to a more expansionary household spending behaviour and
solid fixed capital formation growth. Furthermore, the fixed investment activity
announced by government, including the expansion planned by infrastructure
spending for the 2010 FIFA World Cup, is expected to support higher growth going
forward (Telkom Highlights, 2005:10).
Due in part to a tremendous upswing in the economy over the past decade in South
Africa, Generation Y consumers now possess a tremendous amount of disposable
income. As a result of this high level of spending power, Generation Y consumers are
now more aware of their ability to purchase and spend. Figure 2.23 illustrates the
strong growth in disposable income level of households, which has been made
possible by a combination of the following (Botha, 2005):
• Consistent income tax relief
• An increase in formal sector employment
• Positive labour productivity trends
• Low nominal interest rates
• High levels of consumer confidence
88
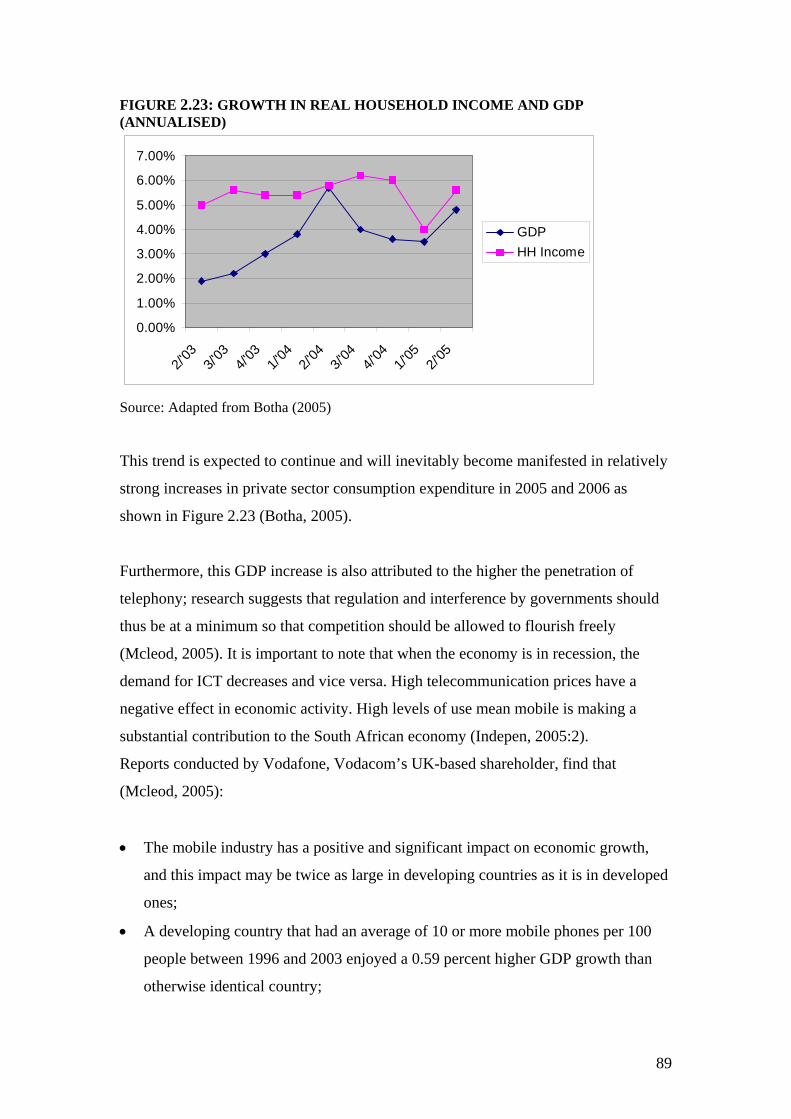
FIGURE 2.23: GROWTH IN REAL HOUSEHOLD INCOME AND GDP (ANNUALISED)
0.00%
1.00%
2.00%
3.00%
4.00%
5.00%
6.00%
7.00%
2/'03
3/'03
4/'03
1/'04
2/'04
3/'04
4/'04
1/'05
2/'05
GDPHH Income
Source: Adapted from Botha (2005)
This trend is expected to continue and will inevitably become manifested in relatively
strong increases in private sector consumption expenditure in 2005 and 2006 as
shown in Figure 2.23 (Botha, 2005).
Furthermore, this GDP increase is also attributed to the higher the penetration of
telephony; research suggests that regulation and interference by governments should
thus be at a minimum so that competition should be allowed to flourish freely
(Mcleod, 2005). It is important to note that when the economy is in recession, the
demand for ICT decreases and vice versa. High telecommunication prices have a
negative effect in economic activity. High levels of use mean mobile is making a
substantial contribution to the South African economy (Indepen, 2005:2).
Reports conducted by Vodafone, Vodacom’s UK-based shareholder, find that
(Mcleod, 2005):
• The mobile industry has a positive and significant impact on economic growth,
and this impact may be twice as large in developing countries as it is in developed
ones;
• A developing country that had an average of 10 or more mobile phones per 100
people between 1996 and 2003 enjoyed a 0.59 percent higher GDP growth than
otherwise identical country;
89
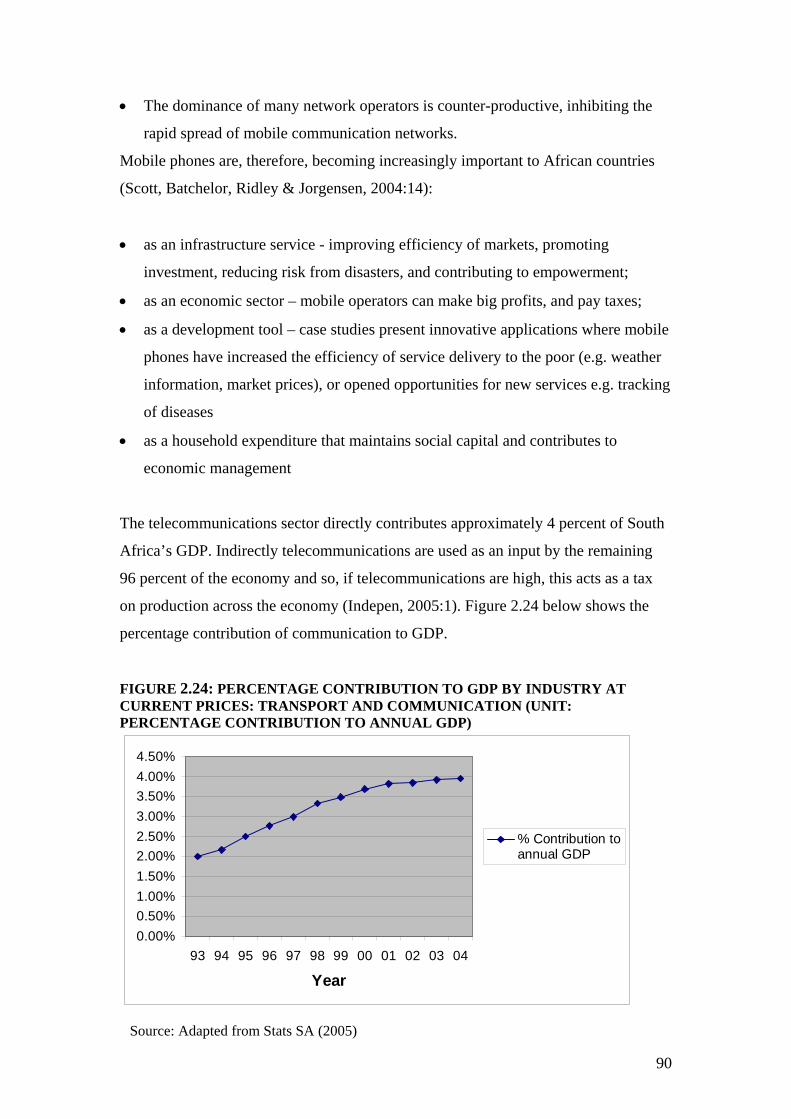
• The dominance of many network operators is counter-productive, inhibiting the
rapid spread of mobile communication networks.
Mobile phones are, therefore, becoming increasingly important to African countries
(Scott, Batchelor, Ridley & Jorgensen, 2004:14):
• as an infrastructure service - improving efficiency of markets, promoting
investment, reducing risk from disasters, and contributing to empowerment;
• as an economic sector – mobile operators can make big profits, and pay taxes;
• as a development tool – case studies present innovative applications where mobile
phones have increased the efficiency of service delivery to the poor (e.g. weather
information, market prices), or opened opportunities for new services e.g. tracking
of diseases
• as a household expenditure that maintains social capital and contributes to
economic management
The telecommunications sector directly contributes approximately 4 percent of South
Africa’s GDP. Indirectly telecommunications are used as an input by the remaining
96 percent of the economy and so, if telecommunications are high, this acts as a tax
on production across the economy (Indepen, 2005:1). Figure 2.24 below shows the
percentage contribution of communication to GDP.
FIGURE 2.24: PERCENTAGE CONTRIBUTION TO GDP BY INDUSTRY AT CURRENT PRICES: TRANSPORT AND COMMUNICATION (UNIT: PERCENTAGE CONTRIBUTION TO ANNUAL GDP)
0.00%0.50%1.00%1.50%2.00%2.50%3.00%3.50%4.00%4.50%
93 94 95 96 97 98 99 00 01 02 03 04
Year
% Contribution toannual GDP
90
Source: Adapted from Stats SA (2005)
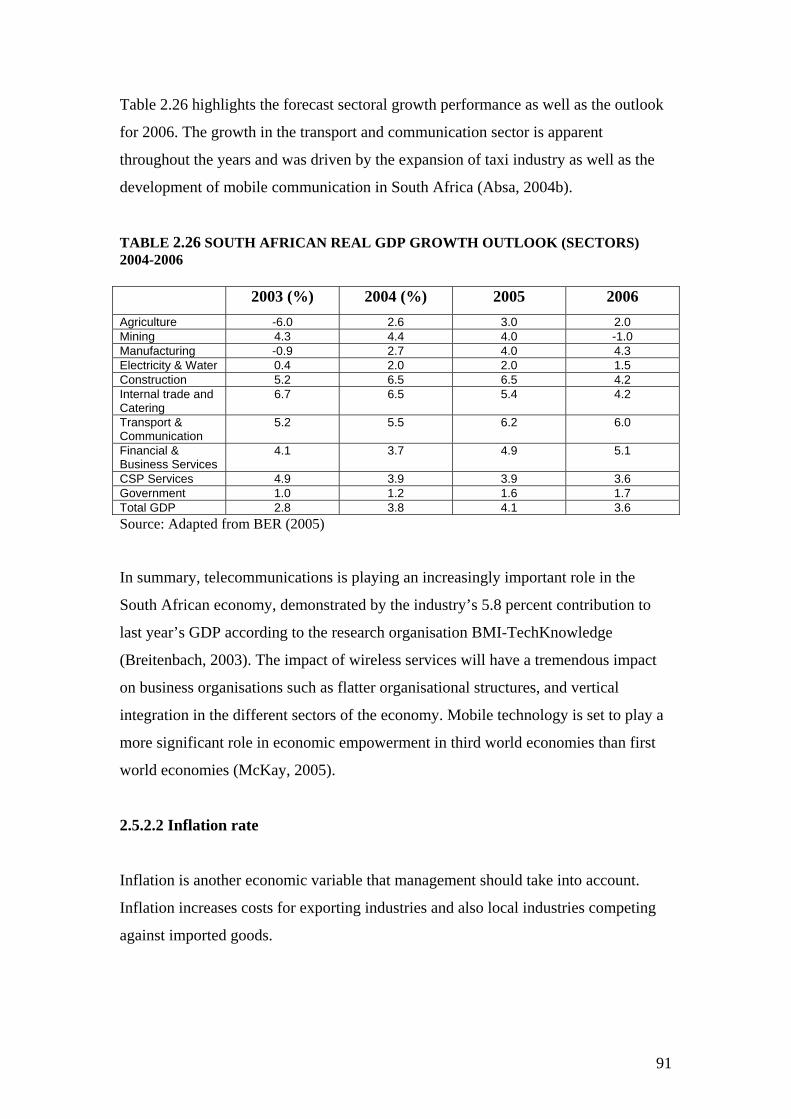
Table 2.26 highlights the forecast sectoral growth performance as well as the outlook
for 2006. The growth in the transport and communication sector is apparent
throughout the years and was driven by the expansion of taxi industry as well as the
development of mobile communication in South Africa (Absa, 2004b).
TABLE 2.26 SOUTH AFRICAN REAL GDP GROWTH OUTLOOK (SECTORS) 2004-2006 2003 (%) 2004 (%) 2005 2006 Agriculture -6.0 2.6 3.0 2.0 Mining 4.3 4.4 4.0 -1.0 Manufacturing -0.9 2.7 4.0 4.3 Electricity & Water 0.4 2.0 2.0 1.5 Construction 5.2 6.5 6.5 4.2 Internal trade and Catering
6.7 6.5 5.4 4.2
Transport & Communication
5.2 5.5 6.2 6.0
Financial & Business Services
4.1 3.7 4.9 5.1
CSP Services 4.9 3.9 3.9 3.6 Government 1.0 1.2 1.6 1.7 Total GDP 2.8 3.8 4.1 3.6 Source: Adapted from BER (2005)
In summary, telecommunications is playing an increasingly important role in the
South African economy, demonstrated by the industry’s 5.8 percent contribution to
last year’s GDP according to the research organisation BMI-TechKnowledge
(Breitenbach, 2003). The impact of wireless services will have a tremendous impact
on business organisations such as flatter organisational structures, and vertical
integration in the different sectors of the economy. Mobile technology is set to play a
more significant role in economic empowerment in third world economies than first
world economies (McKay, 2005).
2.5.2.2 Inflation rate
Inflation is another economic variable that management should take into account.
Inflation increases costs for exporting industries and also local industries competing
against imported goods.
91
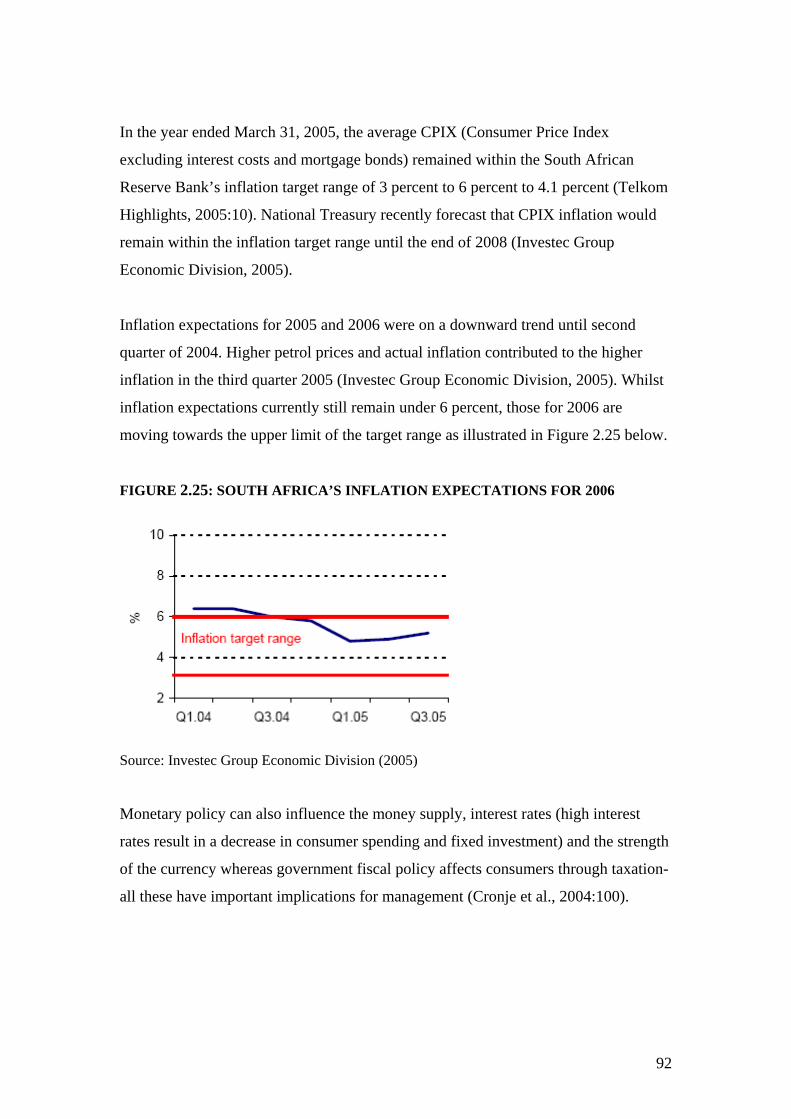
In the year ended March 31, 2005, the average CPIX (Consumer Price Index
excluding interest costs and mortgage bonds) remained within the South African
Reserve Bank’s inflation target range of 3 percent to 6 percent to 4.1 percent (Telkom
Highlights, 2005:10). National Treasury recently forecast that CPIX inflation would
remain within the inflation target range until the end of 2008 (Investec Group
Economic Division, 2005).
Inflation expectations for 2005 and 2006 were on a downward trend until second
quarter of 2004. Higher petrol prices and actual inflation contributed to the higher
inflation in the third quarter 2005 (Investec Group Economic Division, 2005). Whilst
inflation expectations currently still remain under 6 percent, those for 2006 are
moving towards the upper limit of the target range as illustrated in Figure 2.25 below.
FIGURE 2.25: SOUTH AFRICA’S INFLATION EXPECTATIONS FOR 2006
Source: Investec Group Economic Division (2005)
Monetary policy can also influence the money supply, interest rates (high interest
rates result in a decrease in consumer spending and fixed investment) and the strength
of the currency whereas government fiscal policy affects consumers through taxation-
all these have important implications for management (Cronje et al., 2004:100).
92
2.5.2 Social environment The social environment is likely to be the environmental variable that is the greatest
influenced by technology and the economy. The reason is that communities shape
people’s behaviours and ways of life through language, values, expectations and
customs. Social change is unavoidable and this affects management indirectly in the
form of consumers and directly in the form of employees (Cronje et al., 2004:102).
Rapid technological changes in South Africa make it difficult to quantify social
change yet it is essential for marketers to understand the social environment and the
effect this has on consumer behaviour.
2.5.2.1 Changing role of women
Marketers have always been interested in women because women buy most of the
household products. This interest is now intensifying as the role of women is
changing. Women’s role in society has changed from the ‘traditional women’,
portrayed as housewives running the household and looking after the children to a
more modern perception of women running their own careers (Cant, Brink, Brijball,
2005:96). It has been found that the female population is growing faster than the male
population in South Africa and the rest of the world making women play a prominent
part in buying decisions. Furthermore, South African women in particular are a
powerful economic force according to the statistics below (Cant et al., 2006:97):
• Women made up 34% of employees in 1990, 40% in 1999 and 50% in 2001
• Women made up 39% of graduates in 2001 and this figure is expected to increase
• There were 100 000 more female students than male students in 2002
• Women made up 19% of management in 1990 and 28% in 1999
• Women in business in South Africa in 2001: 35% had small-businesses, 40% had
medium-sized businesses, 32% had large businesses and 25% had corporations.
93
2.5.2.2 Impact of mobile phone industry on social environment
According to Cant and Machado (2005:21) South Africa is a culturally diverse society
with divisions along language, race, culture and religion and there is a drive to build a
sense of nationalism of different people in one country. This is the social mix in
which mobile operators currently operate and they need to be sympathetic to cultural
and regional differences (Cant & Machado, 2004:21). The mobile phone industry has
not only helped shaping business and economics but has had a major impact in
shaping society and culture. In an age of information and globalisation, new
communications technologies have allowed a virtual world to emerge which are
shrinking distance and reducing traditional borders and time; and the advantages of
greater knowledge and superior ability to learn are becoming even greater. The
remotest village has the possibility of tapping a global store of knowledge far beyond
what one would have imagined a century ago, faster and more cheaply than anyone
imagined only a few decades ago (The World Bank Group Knowledge Bank).
“The extension of affordable and accessible universal service will enhance social and
economic activities in historically disadvantaged communities by providing the
necessary infrastructure as well as by generating employment in the telecom sector
itself. In addition specific measures to promote economic empowerment will be taken
which include broadening equity ownership, employee share ownership schemes,
creating opportunities for meaningful employment and management, the effective
promotion of entrepreneurship, licensing opportunities and procurement and set aside-
policies” (Jordan, 1996).
However, it is important to note that converging technologies and disappearing
income differences across countries will not necessarily lead to homogenisation of
consumer behaviours. On the contrary, cultural differences may result in more
heterogeneous consumer behaviours (Cant et al., 2006:69).
94
Furthermore the digital divide- the gap between rich and poor nations in advanced
information communication technology (ICT)- in Africa is growing. There are various
definitions for the digital divide. The American Library Association (ALA), Office
for Information Technology Policy (OITP) defines the digital divide as (Chisenga,
2001):
Disparities/differences based on economic status, gender, race, physical abilities, and
geographic location between those who have or do not have:
access to information, the Internet, and other information technologies and
services, and
the skills, knowledge and abilities to use information, the Internet, and
other technologies. (ALA 2000).
From the above two definitions/descriptions, it is clear that the digital divide describes
the gap, caused by various factors, between those who have access and those who do
not have access to the following (Chisenga, 2000):
Computer facilities
Internet facilities
Telecommunications facilities (phone, fax, etc)
Information literacy and use skills
Computer literacy skills
Appropriate information content
All the issues mentioned above make it increasingly important for marketers to
understand the social environment and the impact it has on consumer values and
behaviour.
95
2.5.4 Physical environment
The physical environment in Figure 2.1, refers to the physical resources that
businesses need to support life and development. The environment is affected by the
operations of businesses as businesses obtain its physical resources and discharges its
waste in the environment (Cronje et al., 2004:109). The mobile phone industry is
constantly changing with new high-tech mobile phones and leaves old mobile phones
for waste. Mobile phone waste has been found to have harmful effects on the
environment and collecting old phones and recycling them is an option that needs to
be taken into account. There has also been widespread concern around the health
effects of long-term human exposure to radiation and magnetic fields from mobile
phones. Concerns have been raised about the normal mobile phone, which has the
antenna in the handset. In this case, the antenna is very close to the user's head whilst
he/she is on the mobile phone and there is concern about the level of microwave
emissions to which the brain is being exposed. These concerns all fall under the
physical environment and business organisations respond to the vulnerability of the
physical environment by trying to limit any harmful effects on the community by
giving a sense of social and environmental responsibility (Cronje et al., 2004:111).
2.5.5 Institutional-Political environment
As a component of the macro environment in Figure 2.1, the government and political
pressures also greatly affect the management decisions of a business organisation. The
government intervenes on a large scale and influences the macro-environment of a
business organisation by means of legislation, annual budget, taxation, price controls,
and can further influence the market through government expenditure (Cronje et al.,
2004:112). Business organisations need to adhere to certain laws and regulations in
order to operate successfully. Telecommunication companies have already expanded
speedily into new markets in Africa (Cant & Machado, 2004:23).
Major dramatic changes have occurred in the South African political front. In 1948,
the Nationalist Party (NP) introduced a policy of ‘apartheid’ in terms of which
population groups were segregated. Apartheid affected the telecommunications
market in South Africa in that Telkom was the sole provider of phone services and
96
this service was given to predominantly white urban areas, and was very limited in the
rural areas.
Political intervention in the mobile phone industry is at a maximum; in February
1990, the government of F. W. de Klerk legalised banned organisations, including the
African National Congress (ANC) and began the process of rescinding the formal
laws of apartheid. F. W. de Klerk, a then former minister of telecommunications,
introduced mobile licenses in order to enable South Africans to communicate. South
Africa’s first democratic election in 1994 brought to power the ANC and saw the birth
of the mobile phone industry when the government granted mobile phone licenses to
two operators: Vodacom and MTN.
The industry is regulated by ICASA, a regulatory body for the telecommunications
and broadcasting industries. ICASA currently serves as the primary regulatory and
licensing authority for the South African communications industry, except with
respect to those specific licences that can only be granted by the Minister of
Communications (Telkom Highlights, 2005:14).
“Driven by a need to provide citizens with access to telecommunications services and
lacking financial resources to accomplish this goal, The Independent Communications
Authority of South Africa (ICASA) awarded two mobile phone licenses to private
companies in 1994. ICASA stated three reasons for why it decided that two licenses
was the appropriate number at the time. First, the agency did not want to issue only
one license and create a monopoly. Second, the government did not want to open the
market to full competition. Third, it was not known if the market would support more
than two players” (Marine et al., 2001:6). The South African Telecommunications
Policy has undergone major reforms between 1994 and 2001 and these policies are
shown in Table 2.26 below.
97
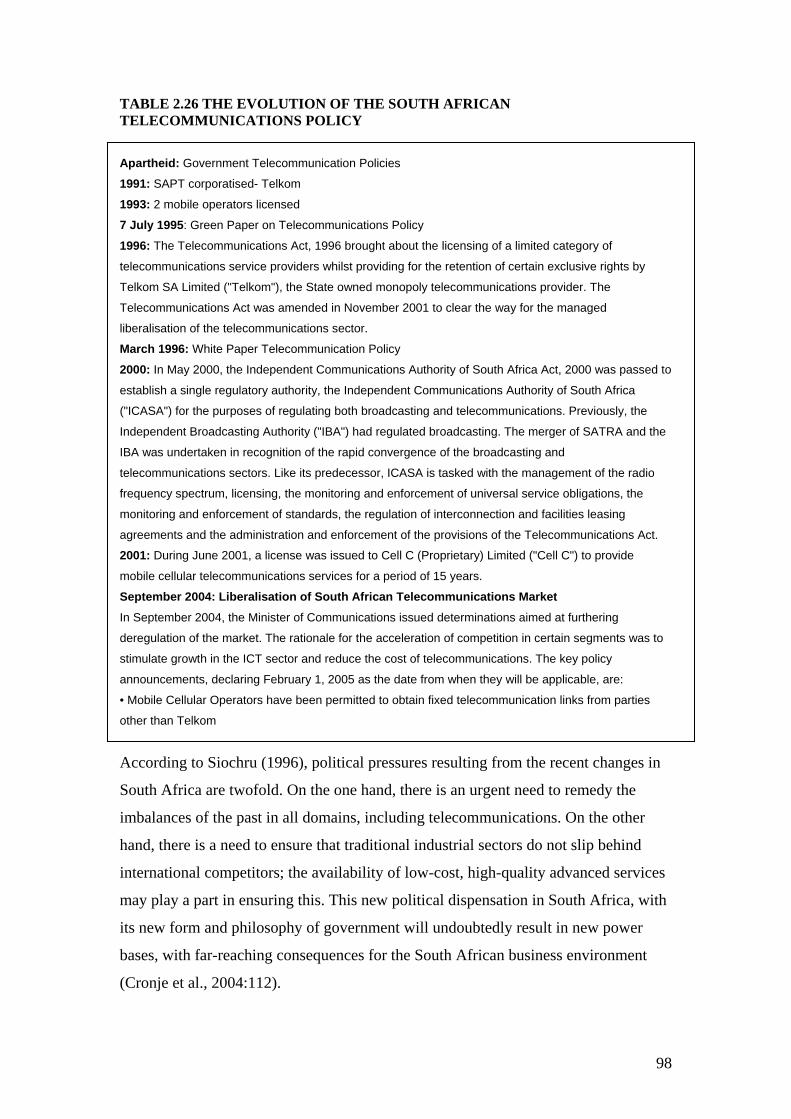
TABLE 2.26 THE EVOLUTION OF THE SOUTH AFRICAN TELECOMMUNICATIONS POLICY Apartheid: Government Telecommunication Policies
1991: SAPT corporatised- Telkom
1993: 2 mobile operators licensed
7 July 1995: Green Paper on Telecommunications Policy
1996: The Telecommunications Act, 1996 brought about the licensing of a limited category of
telecommunications service providers whilst providing for the retention of certain exclusive rights by
Telkom SA Limited ("Telkom"), the State owned monopoly telecommunications provider. The
Telecommunications Act was amended in November 2001 to clear the way for the managed
liberalisation of the telecommunications sector.
March 1996: White Paper Telecommunication Policy
2000: In May 2000, the Independent Communications Authority of South Africa Act, 2000 was passed to
establish a single regulatory authority, the Independent Communications Authority of South Africa
("ICASA") for the purposes of regulating both broadcasting and telecommunications. Previously, the
Independent Broadcasting Authority ("IBA") had regulated broadcasting. The merger of SATRA and the
IBA was undertaken in recognition of the rapid convergence of the broadcasting and
telecommunications sectors. Like its predecessor, ICASA is tasked with the management of the radio
frequency spectrum, licensing, the monitoring and enforcement of universal service obligations, the
monitoring and enforcement of standards, the regulation of interconnection and facilities leasing
agreements and the administration and enforcement of the provisions of the Telecommunications Act.
2001: During June 2001, a license was issued to Cell C (Proprietary) Limited ("Cell C") to provide
mobile cellular telecommunications services for a period of 15 years.
September 2004: Liberalisation of South African Telecommunications Market
In September 2004, the Minister of Communications issued determinations aimed at furthering
deregulation of the market. The rationale for the acceleration of competition in certain segments was to
stimulate growth in the ICT sector and reduce the cost of telecommunications. The key policy
announcements, declaring February 1, 2005 as the date from when they will be applicable, are:
• Mobile Cellular Operators have been permitted to obtain fixed telecommunication links from parties
other than Telkom
According to Siochru (1996), political pressures resulting from the recent changes in
South Africa are twofold. On the one hand, there is an urgent need to remedy the
imbalances of the past in all domains, including telecommunications. On the other
hand, there is a need to ensure that traditional industrial sectors do not slip behind
international competitors; the availability of low-cost, high-quality advanced services
may play a part in ensuring this. This new political dispensation in South Africa, with
its new form and philosophy of government will undoubtedly result in new power
bases, with far-reaching consequences for the South African business environment
(Cronje et al., 2004:112).
98
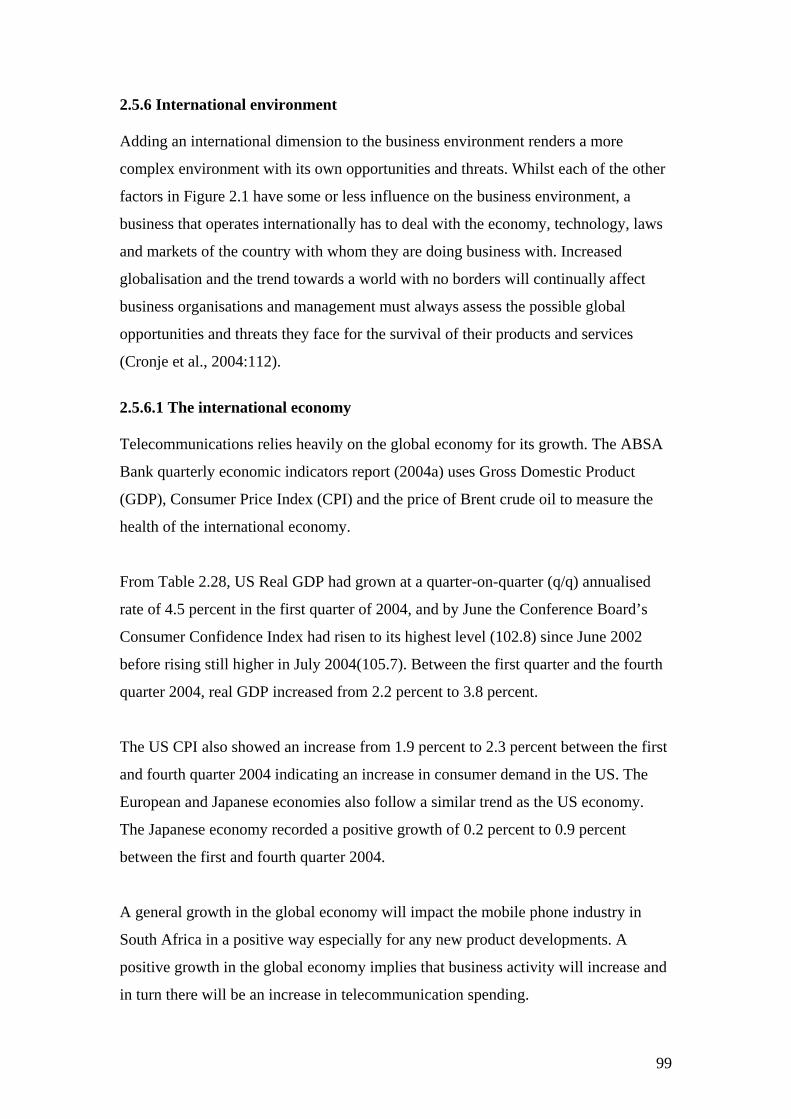
2.5.6 International environment Adding an international dimension to the business environment renders a more
complex environment with its own opportunities and threats. Whilst each of the other
factors in Figure 2.1 have some or less influence on the business environment, a
business that operates internationally has to deal with the economy, technology, laws
and markets of the country with whom they are doing business with. Increased
globalisation and the trend towards a world with no borders will continually affect
business organisations and management must always assess the possible global
opportunities and threats they face for the survival of their products and services
(Cronje et al., 2004:112).
2.5.6.1 The international economy Telecommunications relies heavily on the global economy for its growth. The ABSA
Bank quarterly economic indicators report (2004a) uses Gross Domestic Product
(GDP), Consumer Price Index (CPI) and the price of Brent crude oil to measure the
health of the international economy.
From Table 2.28, US Real GDP had grown at a quarter-on-quarter (q/q) annualised
rate of 4.5 percent in the first quarter of 2004, and by June the Conference Board’s
Consumer Confidence Index had risen to its highest level (102.8) since June 2002
before rising still higher in July 2004(105.7). Between the first quarter and the fourth
quarter 2004, real GDP increased from 2.2 percent to 3.8 percent.
The US CPI also showed an increase from 1.9 percent to 2.3 percent between the first
and fourth quarter 2004 indicating an increase in consumer demand in the US. The
European and Japanese economies also follow a similar trend as the US economy.
The Japanese economy recorded a positive growth of 0.2 percent to 0.9 percent
between the first and fourth quarter 2004.
A general growth in the global economy will impact the mobile phone industry in
South Africa in a positive way especially for any new product developments. A
positive growth in the global economy implies that business activity will increase and
in turn there will be an increase in telecommunication spending.
99
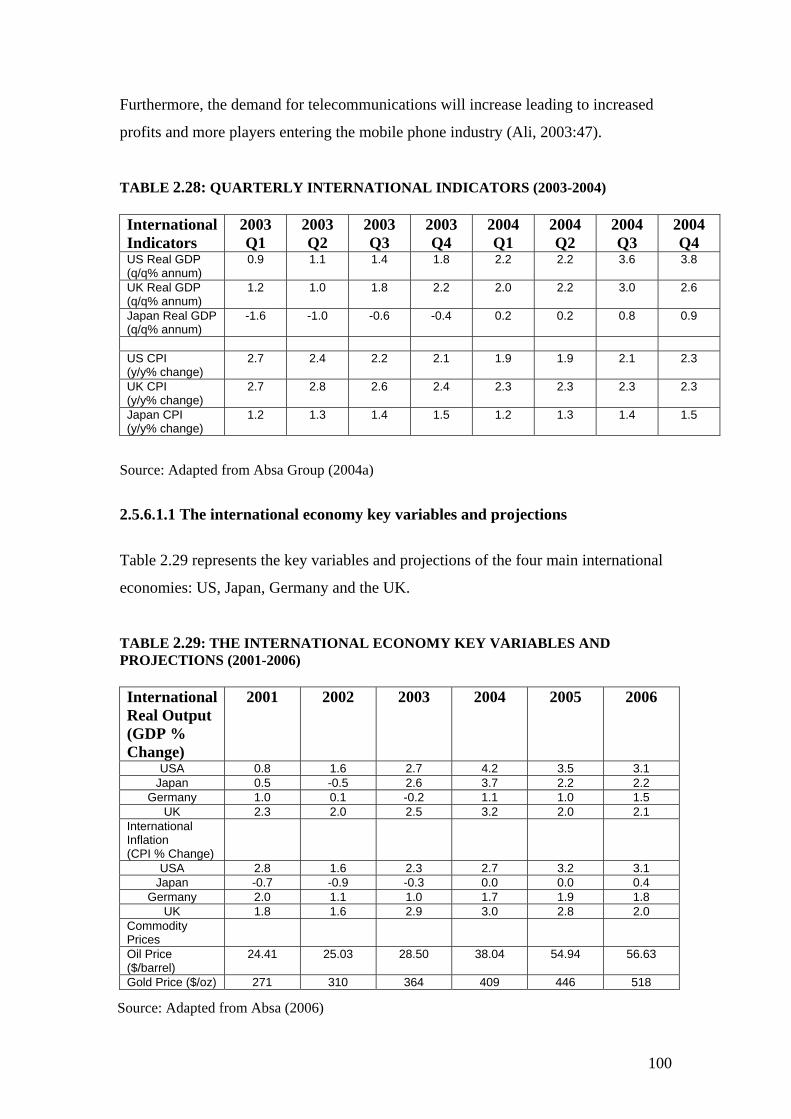
Furthermore, the demand for telecommunications will increase leading to increased
profits and more players entering the mobile phone industry (Ali, 2003:47).
TABLE 2.28: QUARTERLY INTERNATIONAL INDICATORS (2003-2004) International Indicators
2003 Q1
2003 Q2
2003 Q3
2003 Q4
2004 Q1
2004 Q2
2004 Q3
2004 Q4
US Real GDP 0.9 1.1 1.4 1.8 2.2 2.2 3.6 3.8 (q/q% annum) UK Real GDP (q/q% annum)
1.2 1.0 1.8 2.2 2.0 2.2 3.0 2.6
Japan Real GDP (q/q% annum)
-1.6 -1.0 -0.6 -0.4 0.2 0.2 0.8 0.9
US CPI 2.7 2.4 2.2 2.1 1.9 1.9 2.1 2.3 (y/y% change) UK CPI (y/y% change)
2.7 2.8 2.6 2.4 2.3 2.3 2.3 2.3
Japan CPI (y/y% change)
1.2 1.3 1.4 1.5 1.2 1.3 1.4 1.5
Source: Adapted from Absa Group (2004a)
2.5.6.1.1 The international economy key variables and projections
Table 2.29 represents the key variables and projections of the four main international
economies: US, Japan, Germany and the UK.
TABLE 2.29: THE INTERNATIONAL ECONOMY KEY VARIABLES AND PROJECTIONS (2001-2006) International Real Output
2001 2002 2003 2004 2005 2006
(GDP % Change)
USA 0.8 1.6 2.7 4.2 3.5 3.1 Japan 0.5 -0.5 2.6 3.7 2.2 2.2
Germany 1.0 0.1 -0.2 1.1 1.0 1.5 UK 2.3 2.0 2.5 3.2 2.0 2.1
International Inflation
(CPI % Change) USA 2.8 1.6 2.3 2.7 3.2 3.1
Japan -0.7 -0.9 -0.3 0.0 0.0 0.4 Germany 2.0 1.1 1.0 1.7 1.9 1.8
UK 1.8 1.6 2.9 3.0 2.8 2.0 Commodity Prices Oil Price ($/barrel)
24.41 25.03 28.50 38.04 54.94 56.63
Gold Price ($/oz) 271 310 364 409 446 518 Source: Adapted from Absa (2006)
100
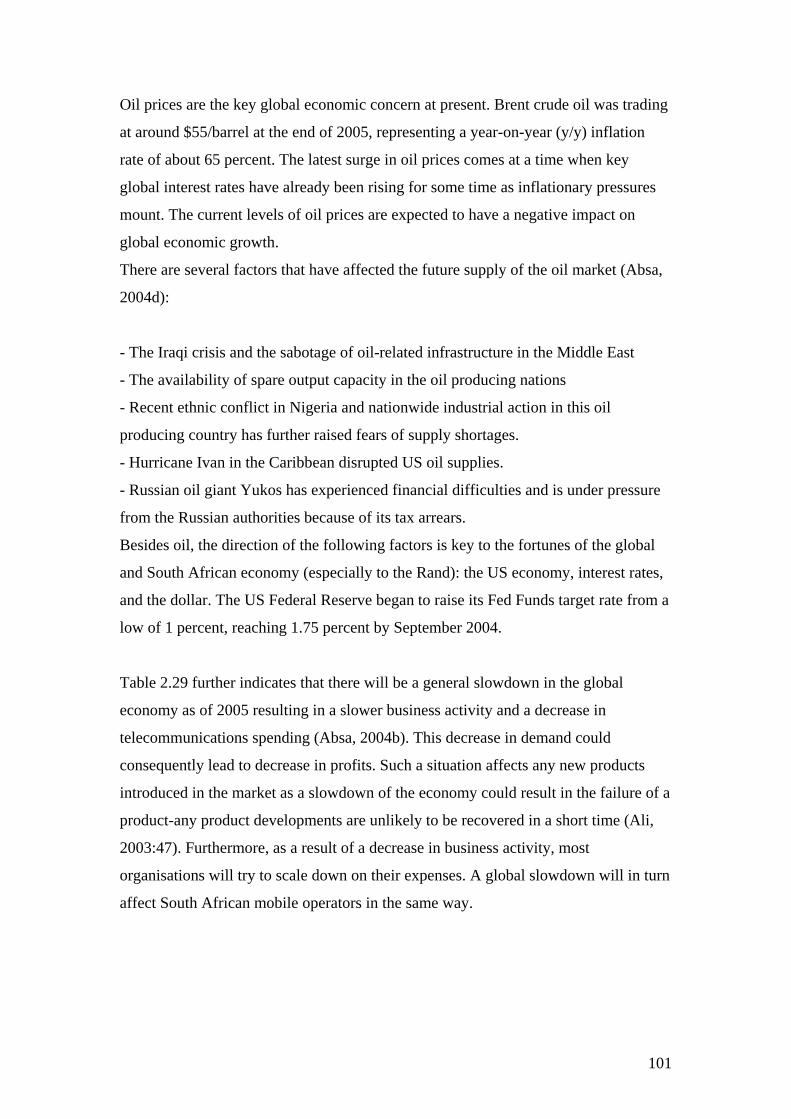
Oil prices are the key global economic concern at present. Brent crude oil was trading
at around $55/barrel at the end of 2005, representing a year-on-year (y/y) inflation
rate of about 65 percent. The latest surge in oil prices comes at a time when key
global interest rates have already been rising for some time as inflationary pressures
mount. The current levels of oil prices are expected to have a negative impact on
global economic growth.
There are several factors that have affected the future supply of the oil market (Absa,
2004d):
- The Iraqi crisis and the sabotage of oil-related infrastructure in the Middle East
- The availability of spare output capacity in the oil producing nations
- Recent ethnic conflict in Nigeria and nationwide industrial action in this oil
producing country has further raised fears of supply shortages.
- Hurricane Ivan in the Caribbean disrupted US oil supplies.
- Russian oil giant Yukos has experienced financial difficulties and is under pressure
from the Russian authorities because of its tax arrears.
Besides oil, the direction of the following factors is key to the fortunes of the global
and South African economy (especially to the Rand): the US economy, interest rates,
and the dollar. The US Federal Reserve began to raise its Fed Funds target rate from a
low of 1 percent, reaching 1.75 percent by September 2004.
Table 2.29 further indicates that there will be a general slowdown in the global
economy as of 2005 resulting in a slower business activity and a decrease in
telecommunications spending (Absa, 2004b). This decrease in demand could
consequently lead to decrease in profits. Such a situation affects any new products
introduced in the market as a slowdown of the economy could result in the failure of a
product-any product developments are unlikely to be recovered in a short time (Ali,
2003:47). Furthermore, as a result of a decrease in business activity, most
organisations will try to scale down on their expenses. A global slowdown will in turn
affect South African mobile operators in the same way.
101
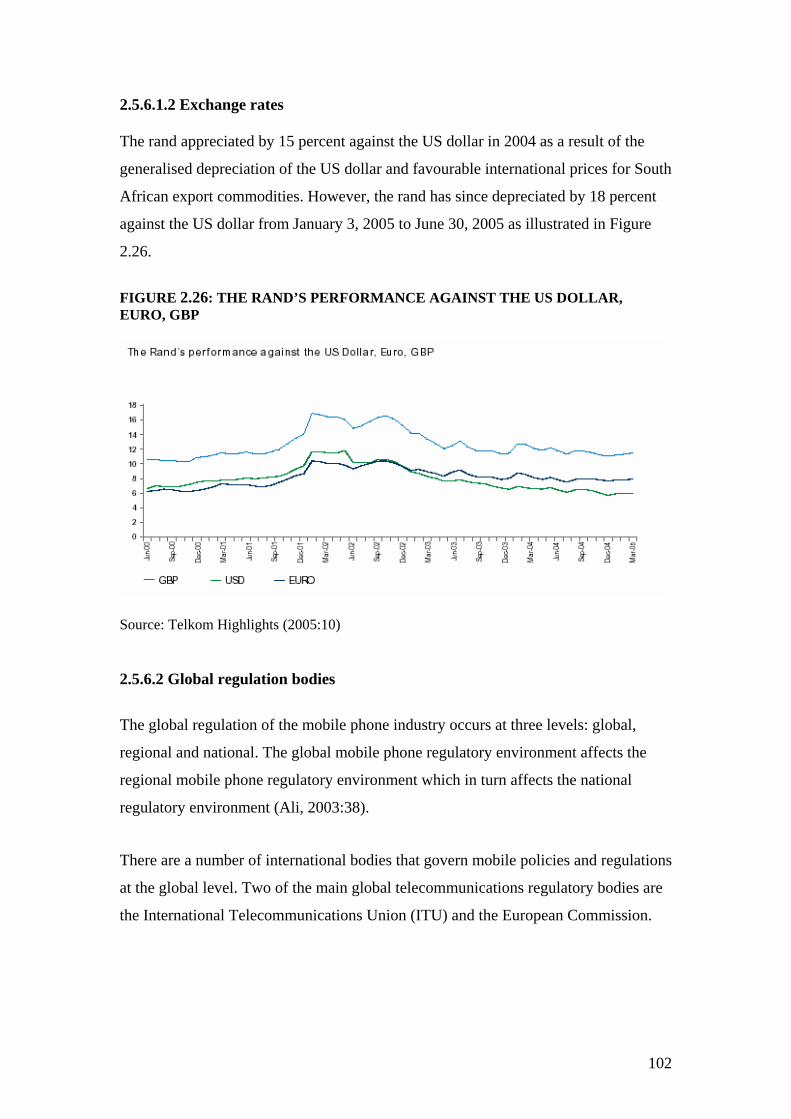
2.5.6.1.2 Exchange rates The rand appreciated by 15 percent against the US dollar in 2004 as a result of the
generalised depreciation of the US dollar and favourable international prices for South
African export commodities. However, the rand has since depreciated by 18 percent
against the US dollar from January 3, 2005 to June 30, 2005 as illustrated in Figure
2.26.
FIGURE 2.26: THE RAND’S PERFORMANCE AGAINST THE US DOLLAR, EURO, GBP
Source: Telkom Highlights (2005:10) 2.5.6.2 Global regulation bodies
The global regulation of the mobile phone industry occurs at three levels: global,
regional and national. The global mobile phone regulatory environment affects the
regional mobile phone regulatory environment which in turn affects the national
regulatory environment (Ali, 2003:38).
There are a number of international bodies that govern mobile policies and regulations
at the global level. Two of the main global telecommunications regulatory bodies are
the International Telecommunications Union (ITU) and the European Commission.
102
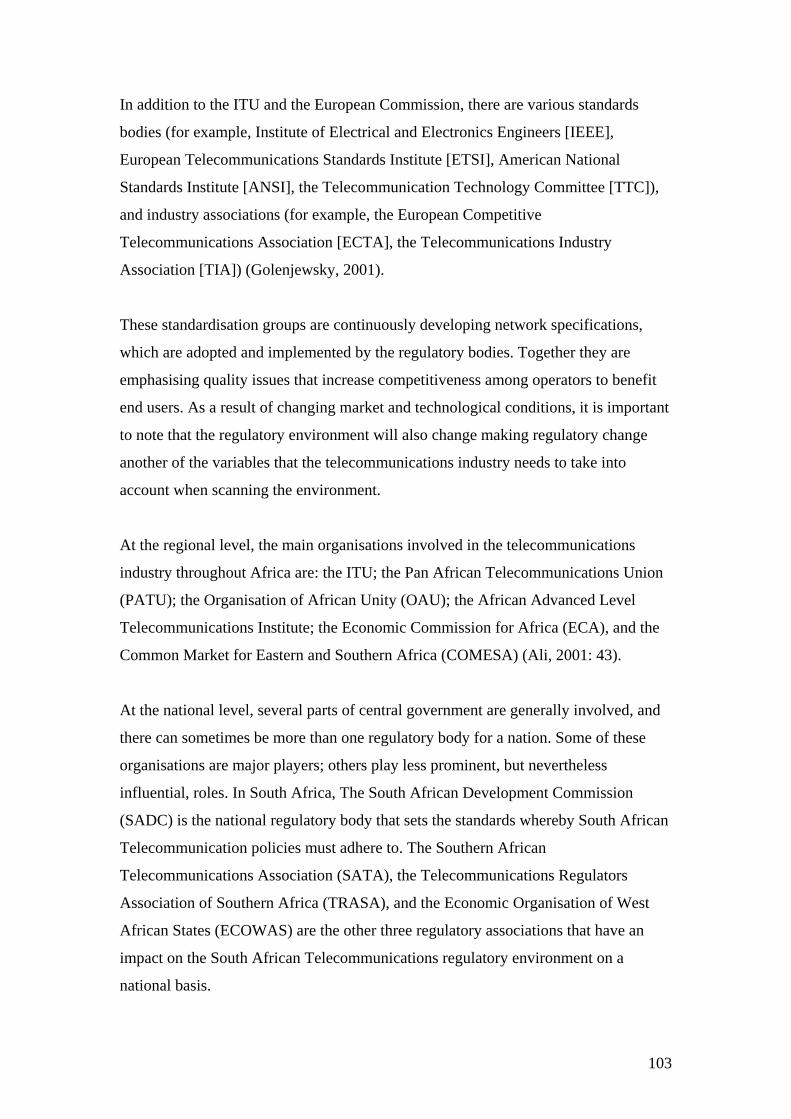
In addition to the ITU and the European Commission, there are various standards
bodies (for example, Institute of Electrical and Electronics Engineers [IEEE],
European Telecommunications Standards Institute [ETSI], American National
Standards Institute [ANSI], the Telecommunication Technology Committee [TTC]),
and industry associations (for example, the European Competitive
Telecommunications Association [ECTA], the Telecommunications Industry
Association [TIA]) (Golenjewsky, 2001).
These standardisation groups are continuously developing network specifications,
which are adopted and implemented by the regulatory bodies. Together they are
emphasising quality issues that increase competitiveness among operators to benefit
end users. As a result of changing market and technological conditions, it is important
to note that the regulatory environment will also change making regulatory change
another of the variables that the telecommunications industry needs to take into
account when scanning the environment.
At the regional level, the main organisations involved in the telecommunications
industry throughout Africa are: the ITU; the Pan African Telecommunications Union
(PATU); the Organisation of African Unity (OAU); the African Advanced Level
Telecommunications Institute; the Economic Commission for Africa (ECA), and the
Common Market for Eastern and Southern Africa (COMESA) (Ali, 2001: 43).
At the national level, several parts of central government are generally involved, and
there can sometimes be more than one regulatory body for a nation. Some of these
organisations are major players; others play less prominent, but nevertheless
influential, roles. In South Africa, The South African Development Commission
(SADC) is the national regulatory body that sets the standards whereby South African
Telecommunication policies must adhere to. The Southern African
Telecommunications Association (SATA), the Telecommunications Regulators
Association of Southern Africa (TRASA), and the Economic Organisation of West
African States (ECOWAS) are the other three regulatory associations that have an
impact on the South African Telecommunications regulatory environment on a
national basis.
103
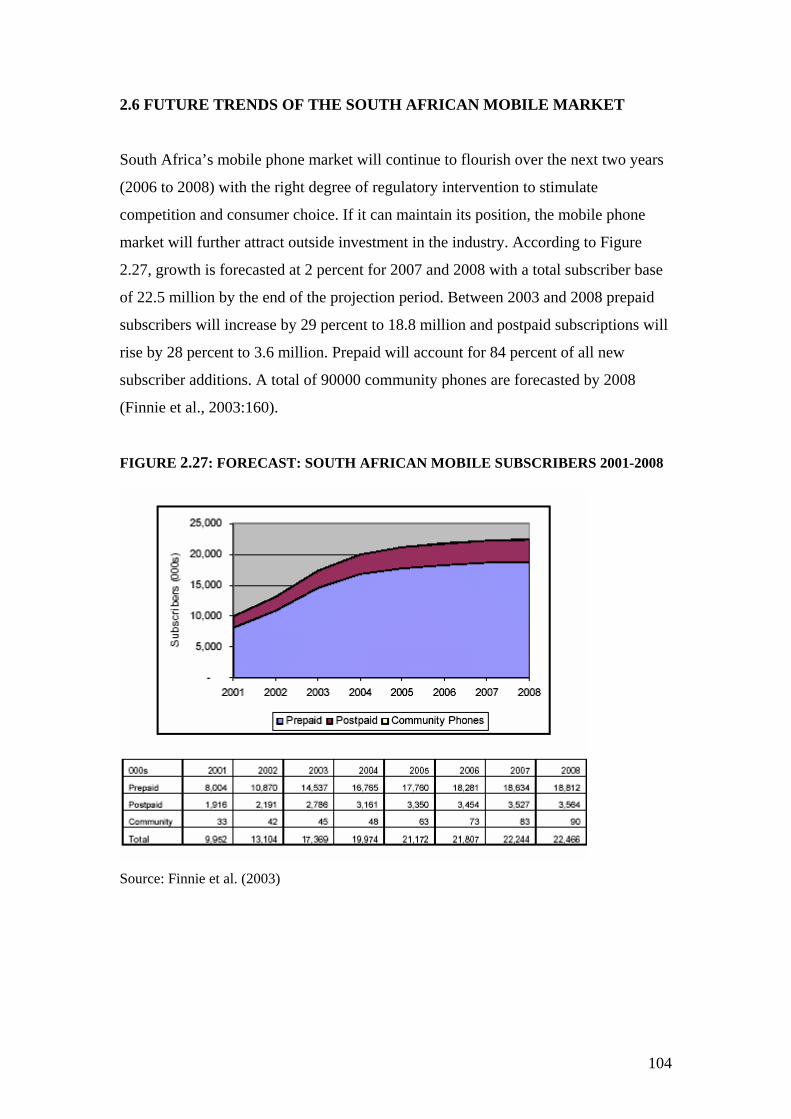
2.6 FUTURE TRENDS OF THE SOUTH AFRICAN MOBILE MARKET
South Africa’s mobile phone market will continue to flourish over the next two years
(2006 to 2008) with the right degree of regulatory intervention to stimulate
competition and consumer choice. If it can maintain its position, the mobile phone
market will further attract outside investment in the industry. According to Figure
2.27, growth is forecasted at 2 percent for 2007 and 2008 with a total subscriber base
of 22.5 million by the end of the projection period. Between 2003 and 2008 prepaid
subscribers will increase by 29 percent to 18.8 million and postpaid subscriptions will
rise by 28 percent to 3.6 million. Prepaid will account for 84 percent of all new
subscriber additions. A total of 90000 community phones are forecasted by 2008
(Finnie et al., 2003:160).
FIGURE 2.27: FORECAST: SOUTH AFRICAN MOBILE SUBSCRIBERS 2001-2008
Source: Finnie et al. (2003)
104
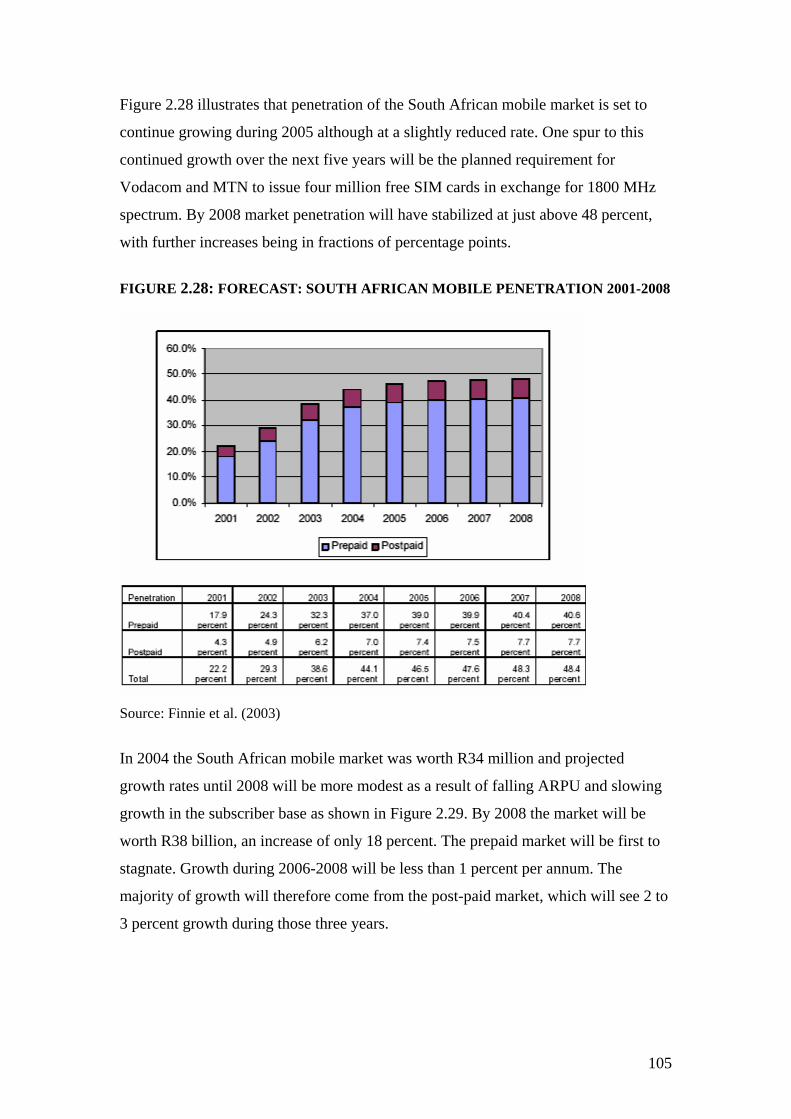
Figure 2.28 illustrates that penetration of the South African mobile market is set to
continue growing during 2005 although at a slightly reduced rate. One spur to this
continued growth over the next five years will be the planned requirement for
Vodacom and MTN to issue four million free SIM cards in exchange for 1800 MHz
spectrum. By 2008 market penetration will have stabilized at just above 48 percent,
with further increases being in fractions of percentage points.
FIGURE 2.28: FORECAST: SOUTH AFRICAN MOBILE PENETRATION 2001-2008
Source: Finnie et al. (2003)
In 2004 the South African mobile market was worth R34 million and projected
growth rates until 2008 will be more modest as a result of falling ARPU and slowing
growth in the subscriber base as shown in Figure 2.29. By 2008 the market will be
worth R38 billion, an increase of only 18 percent. The prepaid market will be first to
stagnate. Growth during 2006-2008 will be less than 1 percent per annum. The
majority of growth will therefore come from the post-paid market, which will see 2 to
3 percent growth during those three years.
105
There is a noticeable increase in revenues during 2008, which can be accounted for by
the reverse in the prevailing ARPU decline. For both prepaid and post-paid revenues,
growth is higher in 2008 than 2007 (Finnie et al., 2003:162).
FIGURE 2.29: FORECAST: SOUTH AFRICAN MOBILE SERVICE REVENUE 2001-2008
Source: Finnie et al. (2003) 2.7 CONCLUSION In this chapter, the South African mobile phone business environment and its
composition was discussed. This chapter gathered information on each of the
environments, the micro, market and macro environments, and discussed each of its
sub-environments and components. There is no doubt that the business environment is
made up of key variables that have a direct influence on the participants in an
industry. It is crucial for management to adapt to changes in the environment in order
to steer their business organisation in the right path to prosperity and be success. The
information gathered in Chapter 2 will be used as background information for the
discussion in Chapter 3. Chapter 3 will contain a discussion on the consumer
behaviour and mobile phone usage of Generation Y students in the city of
Johannesburg.
106

107
CHAPTER 3
THE CONSUMER BEHAVIOUR AND MOBILE PHONE USAGE
OF GENERATION Y STUDENTS IN THE CITY OF
JOHANNESBURG
3.1 INTRODUCTION
This chapter will detail the consumer behaviour of Generation Y consumers. It
appears that the mobile phone is, like any other technological innovation, well
embedded into society especially where Generation Y is concerned. There is a strong
correlation between Generation Y consumers and their mobile phones as a result of
high ownership and usage of such a device. Generation Y has adopted the mobile
phone after this device had been commercially available yet it now appears that this
generation is hooked on mobility making it one of the most important social changes
to have occurred in the last decade. The consumer decision-process model by Cronje,
Du Toit, Marais and Motlatla (2004) together with Cant, Brink and Brijball (2006),
and Schiffman and Kanuk (2000) will form the basis of the discussion of Generation
Y consumers and their consumer behaviour where mobile phone choice and usage are
concerned.
3.2 THE GENERATION Y CONSUMER
“Generation Y is the largest generation to hit global markets since the Baby Boomers.
In the United States, it’s already 60 million strong and more than three times the size
of Generation X. It accounts for almost a quarter of the population and, when fully
developed, will double the size of the local Boomer Generation, accounting for a
hefty 35 percent of the population by 2010” (Generation Y; Marketing Mix, January
2000:10).
106
In South Africa, the impact of Generation Y is even more important than in the United
States. Generation Y makes up about 64 percent of the local population and spend R2
billion a year. Their profile according to Cant, Brink and Brijball (2006:108) is
described as follows:
Nguni language speakers- 45%
Majority are female- 52%
Live in Gauteng, Kwazulu-Natal, Western and Eastern Cape- 65%
Have matric 20%
3.2.1 Generation Y and attitudes towards branding
According to Cant and Machado (2004), brand awareness at children can start as early
as age three. Marketing campaigns for products are thus beginning to target younger
and younger audiences making Generation Y the ideal target market because they
have a basic desire for anything new and fresh and they are increasingly able to
influence their parents’ spending habits (Cant & Machado, 2004:50).
The UCT Unilever Institute of Strategic Marketing conducted an in-depth study of
this market in 2003 and found the youth of today to be “influential, colour blind,
extremely materialistic and highly techno-literate.” Furthermore, they were seen as
understanding brands better than adults and even having the confidence to reject them
(Business Day, 2004).
Brands targeting young adults need to understand emerging behaviour to get closer to
their target audience in order to establish more relevant and credible relationships
with them (Spero & Stone, 2004:154). According to Spero and Stone (2004:154) a
brand will only be successful if young people connect with it emotionally and allow
them to feel independent, empowered, and free of moral judgements.
Looking at brands, Strydom (2004) finds that the favourite brand being mentioned by
Generation Y teenagers in South Africa was Billabong, followed by Levi’s, Diesel,
Roxy, Quicksilver and Addidas. Just more than 60 percent of Generation Y’ers say
they follow the fashion trends and buy accordingly.
107
The major sources of information for this generation’s decisions regarding brands and
what to buy are friends, magazines and television in that order indicating the
importance of word-of-mouth communication. With regard to the preferred mass
media types, these youngsters prefer television, followed by magazines, and radio to
gather information (Cant & Machado, 2004:51).
3.2.2 Generation Y and coming of age technology
Furthermore, Generation Y consumers are an attractive market segment as most have
grown up using computers and other technologies. According to the authors Robinson
and Codrington (2002), Generation Y play video games, listen to music on digital
compact discs, and they help their families program the computerized controls of
videocassette players. They have on their desks and at their fingertips access to more
information of every sort than any human beings have ever had in the whole of
history. They have in their homes more raw data processing power than most nations
have ever had.
This access to knowledge and level of data processing power have given children a
different way of interacting with information compared with previous generations:
mosaic rather than linear, skills-focussed rather than content-fixated, with a passion
for lifelong experiential learning (Robinson & Codrington, 2002).
3.2.3 Generation Y and disposable income
In addition of having grown up immersed in a world of computers, this generation
tends to have more disposable income than past generations. The spending power
exerted by Generation Y consumers is overtaking that of their parents and it is
important to note the power of young money and the influence young people have
over their parents’ buying behaviour. Surveys show that they are deeply involved in
family purchases (Spero & Stone, 2004; UCT Unilever Institute, 2003).
In the UK, 12 to 16 year olds spend on average £3 billion a year (Spero & Stone,
2004). In South Africa, according to the UCT Unilever Institute of Strategic
Marketing, youngsters aged 7 to 17 spend over R4 billion a year on brands, their
parents spend an additional R20 billion on them (Macgregor, 2004).
108
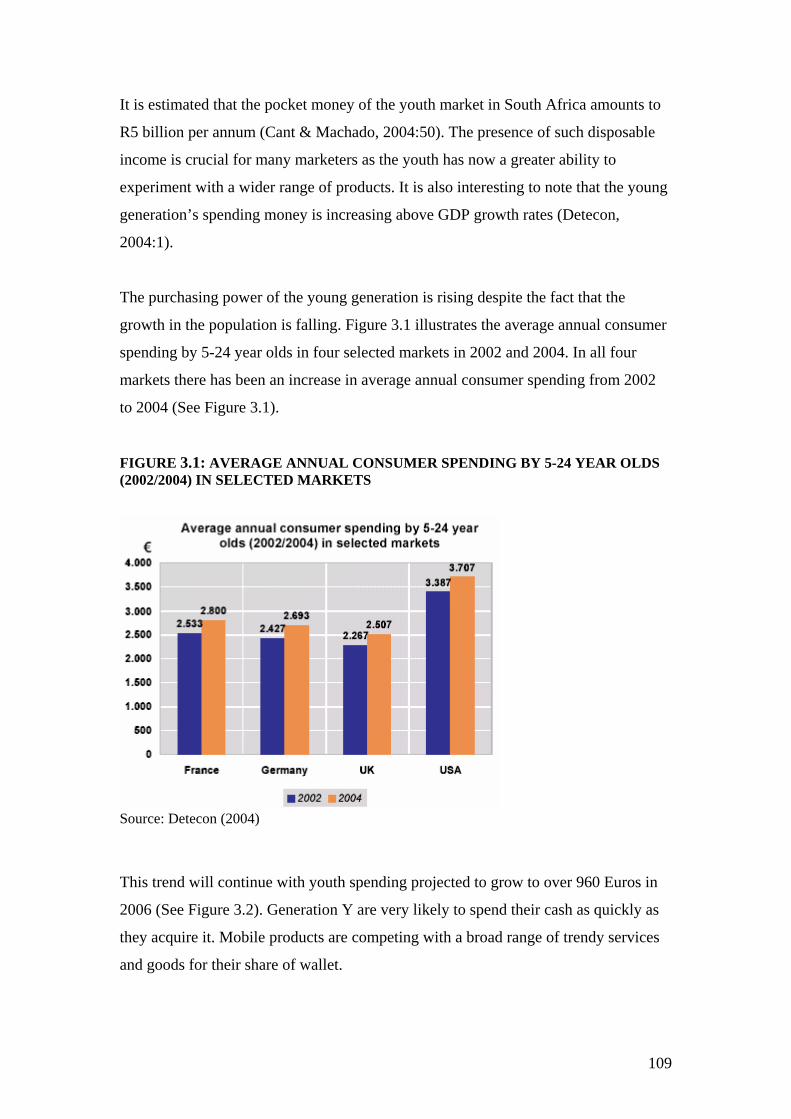
It is estimated that the pocket money of the youth market in South Africa amounts to
R5 billion per annum (Cant & Machado, 2004:50). The presence of such disposable
income is crucial for many marketers as the youth has now a greater ability to
experiment with a wider range of products. It is also interesting to note that the young
generation’s spending money is increasing above GDP growth rates (Detecon,
2004:1).
The purchasing power of the young generation is rising despite the fact that the
growth in the population is falling. Figure 3.1 illustrates the average annual consumer
spending by 5-24 year olds in four selected markets in 2002 and 2004. In all four
markets there has been an increase in average annual consumer spending from 2002
to 2004 (See Figure 3.1).
FIGURE 3.1: AVERAGE ANNUAL CONSUMER SPENDING BY 5-24 YEAR OLDS (2002/2004) IN SELECTED MARKETS
Source: Detecon (2004)
This trend will continue with youth spending projected to grow to over 960 Euros in
2006 (See Figure 3.2). Generation Y are very likely to spend their cash as quickly as
they acquire it. Mobile products are competing with a broad range of trendy services
and goods for their share of wallet.
109
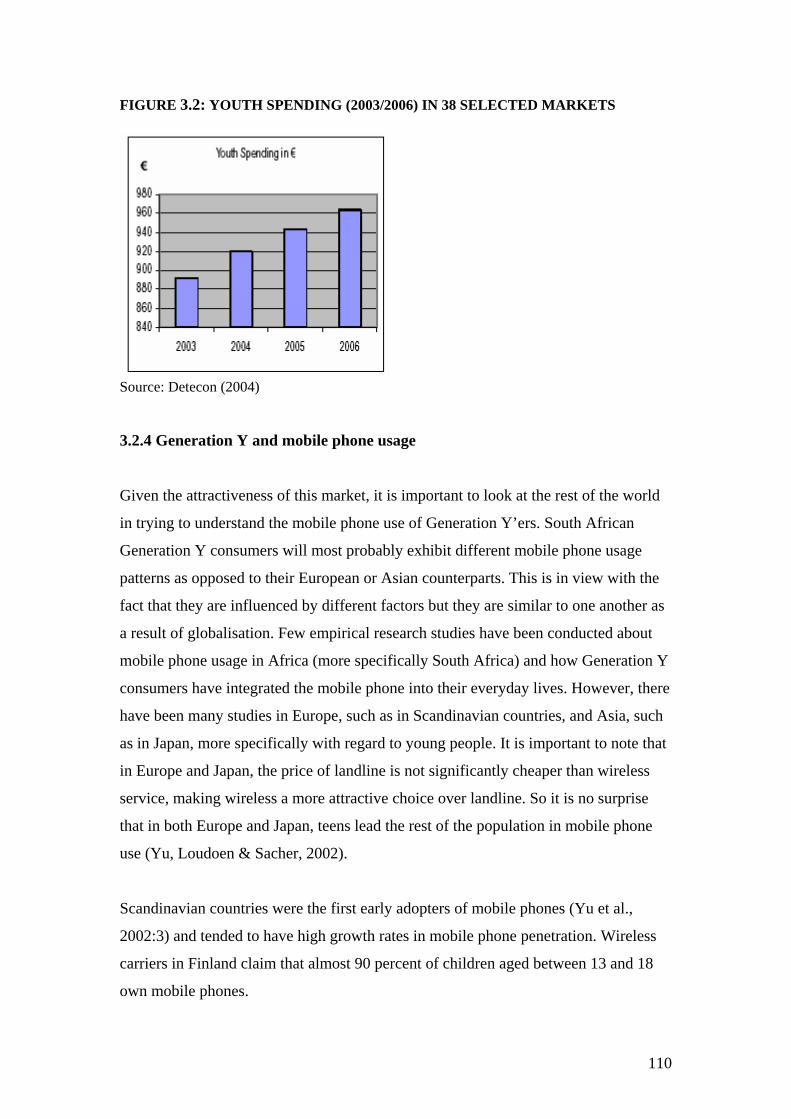
FIGURE 3.2: YOUTH SPENDING (2003/2006) IN 38 SELECTED MARKETS
Source: Detecon (2004)
3.2.4 Generation Y and mobile phone usage
Given the attractiveness of this market, it is important to look at the rest of the world
in trying to understand the mobile phone use of Generation Y’ers. South African
Generation Y consumers will most probably exhibit different mobile phone usage
patterns as opposed to their European or Asian counterparts. This is in view with the
fact that they are influenced by different factors but they are similar to one another as
a result of globalisation. Few empirical research studies have been conducted about
mobile phone usage in Africa (more specifically South Africa) and how Generation Y
consumers have integrated the mobile phone into their everyday lives. However, there
have been many studies in Europe, such as in Scandinavian countries, and Asia, such
as in Japan, more specifically with regard to young people. It is important to note that
in Europe and Japan, the price of landline is not significantly cheaper than wireless
service, making wireless a more attractive choice over landline. So it is no surprise
that in both Europe and Japan, teens lead the rest of the population in mobile phone
use (Yu, Loudoen & Sacher, 2002).
Scandinavian countries were the first early adopters of mobile phones (Yu et al.,
2002:3) and tended to have high growth rates in mobile phone penetration. Wireless
carriers in Finland claim that almost 90 percent of children aged between 13 and 18
own mobile phones.
110
The growing number of studies in Norway (Ling 2000, 2001, 2003) and Sweden
(Weilenmann & Larsson, 2002) find cross-cultural similarities in mobile phone use by
the youth among Scandinavian countries and other countries. In Norway, Ling and
some of his colleagues have done many surveys and interviews of a quantitative and
qualitative nature with teenagers and their families to get a picture of use, ownership,
diffusion, and conception of mobile phones (Ling, 2000, 2001, 2003).
In Sweden, Andersson and Heinonen (2002) conducted studies regarding young
people’s perspectives on mobile services in order to establish the acceptance of
mobile services within this market. Furthermore, Weilenmann and Larsson (2002)
focus on the local interaction of mobile phones amongst the youth in Sweden; the
ways in which phones are used and shared between friends, in different ways and
purposes.
At the same time, mobile phones became common in Japan, South Korea, and China.
Studies in Asia have been conducted on a bigger scale. In Japan, 59 percent of high
school juniors have mobile phones and spend up to $175 a month (Yu et al., 2002).
Furthermore, mobile phones in Japan do not only provide the obvious enhancement of
mobility (like in most Scandinavian countries) but are also used for purposes other
than calling. Teenagers in Japan now use mobile phones to send emails as a result of
the introduction of Wireless Internet Access (WAP). All these studies show that
mobile phones are an important integration in a teenager’s life.
Hulme and Peters (2001:2) find that “the mobile acts on many levels, as a fashion
statement, as a communicator, as a badge of identity and as a decoder.” Furthermore
according to Leps (2003) the “mobile me” ethos has become so established amongst
youngsters that regularly updating their mobile phone profiles has become second
nature; from the look and feel of the handset (bright colours and funky patterns) to
how the mobile phone sounds, the graphics it displays and how it helps users organise
their lives on the move are just a few of the profiles used by the youth.
111
3.2.5 Mobile phone usage in South Africa
In South Africa, a number of studies have been undertaken by independent research
organisations regarding South African consumers’ mobile habits. World Wide Worx,
with the backing of First National Bank, Cell C, and Sentech undertook the year-long
mobility 2005 research project and released “The Impact of Mobile Technologies on
the South African Consumer”. This study uses a nationally representative sample of
2400 South Africans who took part in telephonic interviews over a three-month period
in 2005 (Mobility, 2005).
The research unveils fascinating patterns in mobile phone usage and a detailed picture
of a very satisfied market (Mobility, 2005). Some of the findings are highlighted
below:
• South Africans love their mobile phones
• South Africans were highly satisfied with the impact of their mobile phones on
their lives rated across half a dozen dimensions. The highest satisfaction rating
was the impact of mobile phones on family (94.8% of the respondents gave a
positive rating). Satisfaction with the mobile phone’s performance and the impact
on the user’s own sense of security were tied at a 94.3% positive rating, followed
by impact on personal life at 93.6%, satisfaction with network service 93.2% and
impact on working life 92.1% positive
• More than half of the respondents said they obtained a new handset in the past
year. 44% of the respondents passed their old mobile phone onto family members,
18% kept it as spare, 14% sold it, 10% gave it to a friend and 5% simply threw it
away
• Nokia is far and away the first choice of mobile phone brand for South African
users, with Motorola and Samsung in distant second and third place. Almost two
thirds of all mobile phone owners use a Nokia handset. The next most popular
make of handset is Motorola, at 14%.
• Age was found to be the major differentiator in the way South Africans use their
mobile phones, particularly in the choice of contract versus prepaid accounts.
112
• The study found that while 33% of all users in this market segment are on contract
and 64% on prepaid, only 8% of those in the 16-19 age group are on contracts,
with 90% on prepaid. This doubles to 17% on contract in the 20-24 age group,
with 78% on prepaid. Contract users rise steadily through the age groups until it
peaks in the 46-49 age group, at 40%, and then decreases again. Cell C has the
highest proportion of contract subscribers, at 22% of the Cell C base. The
corresponding figures for Vodacom and MTN are 14% and 12% respectively.
• Over half of the respondents cited free/cheap mobile phones as the reason for
choosing their form of contract
• Contract users’ average monthly phone bill amounted to R384 whereas prepaid
users spent about R134, again indicating the impact that would be made on the
market should there be further shift to prepaid. Expenditure is lowest in the 16-19
age group, rising steadily to a peak in the 35-44 age group and then dropping
steadily as age increases. Vodacom subscribers have the highest monthly cell
phone bills, compared to both Cell C and MTN. This is true of both their prepaid
and contract customers. On average, people spend 3% of their incomes on cell
phones (AMPS, 2005).
• Gauteng has the highest penetration of mobile phones, at 48% of adults. Next is
the Western Cape with 43%, while the lowest penetration is the Eastern Cape, at
24% (AMPS, 2005)
• An ‘age gap’ exists between revenue and usage but adoption of non-voice
applications like picture messaging and 3G are stronger among younger people.
Mobile phone users over the age of 50 spend more on cell phone calls than
younger users (average monthly spend R145 vs. R135)
The adoption of mobile phones in South Africa will be investigated in the empirical
research phase to determine Generation Y’s usage patterns and will be contrasted
with the findings above (See Section C of questionnaire in Appendix A).
Scandinavian adoption of mobile phone use is clearly behind Japan while South
Africa’s adoption of mobile phone use is behind both countries as there is little
research exploring the mobile telephony environment especially where the third
generation applications (3G) are concerned.
113
Marketers needs to look beyond demographics, numbers and media speak to locate
the young market; the digital world is where Generation Y consumers play, work,
learn and communicate and it is the arena in which a brand communicates with its
young market (Spero & Stone, 2004:154).
3.3 CONSUMER BEHAVIOUR OF GENERATION Y CONSUMERS
The theoretical background of consumer behaviour as it relates to Generation Y will
be discussed in this section. It is not surprising that research into consumer behaviour
has expanded and has become more significant in the last couple of years. It is
important to gain insight into the consumer decision-making process in order to
understand the perceptions and expectations of the Generation Y market segment.
Consumer behaviour concerns all the activities and influences that occur before,
during and after the purchase itself (Cant, et al. 2006:2). Many definitions of
consumer behaviour exist, the most useful one being proposed by Schiffmann and
Kanuk (2000:5) who define the study of consumer behaviour as “how individuals
make decisions to spend their available resources (time, money, effort) on
consumption-related items.” This definition implies that consumers weigh the pros
and cons when deciding what product to buy.
The field of consumer behaviour further studies “ how individuals, groups and
organisations select, buy, use and dispose of goods, services, ideas or experiences to
satisfy their needs and desires and the impacts these processes have on consumer and
society (Hawkins, Best & Coney, 1998; Strydom, Jooste & Cant, 2000)” This
definition encompasses a variety of influences in the consumer behaviour process
where the term ‘consumer’ includes groups and organisations
Consumer behaviour has important implications for marketers because it may be
“explained, influenced and predicted (Cronje et al., 2004:292).” Teenagers and young
adults are important market segments and the study of their consumer behaviour will
enable marketers to understand and predict consumer-purchasing motives.
114
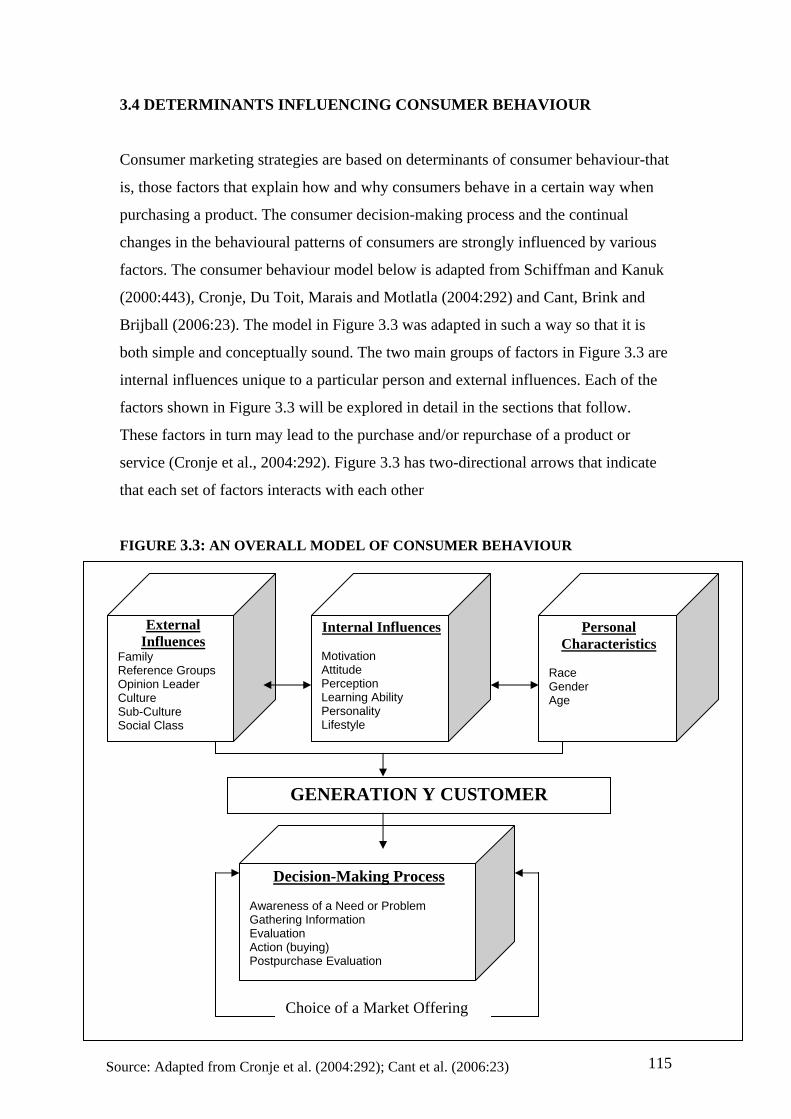
3.4 DETERMINANTS INFLUENCING CONSUMER BEHAVIOUR
Consumer marketing strategies are based on determinants of consumer behaviour-that
is, those factors that explain how and why consumers behave in a certain way when
purchasing a product. The consumer decision-making process and the continual
changes in the behavioural patterns of consumers are strongly influenced by various
factors. The consumer behaviour model below is adapted from Schiffman and Kanuk
(2000:443), Cronje, Du Toit, Marais and Motlatla (2004:292) and Cant, Brink and
Brijball (2006:23). The model in Figure 3.3 was adapted in such a way so that it is
both simple and conceptually sound. The two main groups of factors in Figure 3.3 are
internal influences unique to a particular person and external influences. Each of the
factors shown in Figure 3.3 will be explored in detail in the sections that follow.
These factors in turn may lead to the purchase and/or repurchase of a product or
service (Cronje et al., 2004:292). Figure 3.3 has two-directional arrows that indicate
that each set of factors interacts with each other
FIGURE 3.3: AN OVERALL MODEL OF CONSUMER BEHAVIOUR
Internal Influences Motivation Attitude Perception Learning Ability Personality Lifestyle
External Influences
Family Reference Groups Opinion Leader Culture Sub-Culture Social Class
Personal Characteristics
Race Gender Age
GENERATION Y CUSTOMER
Decision-Making Process Awareness of a Need or Problem Gathering Information Evaluation Action (buying) Postpurchase Evaluation
Choice of a Market Offering
115Source: Adapted from Cronje et al. (2004:292); Cant et al. (2006:23)
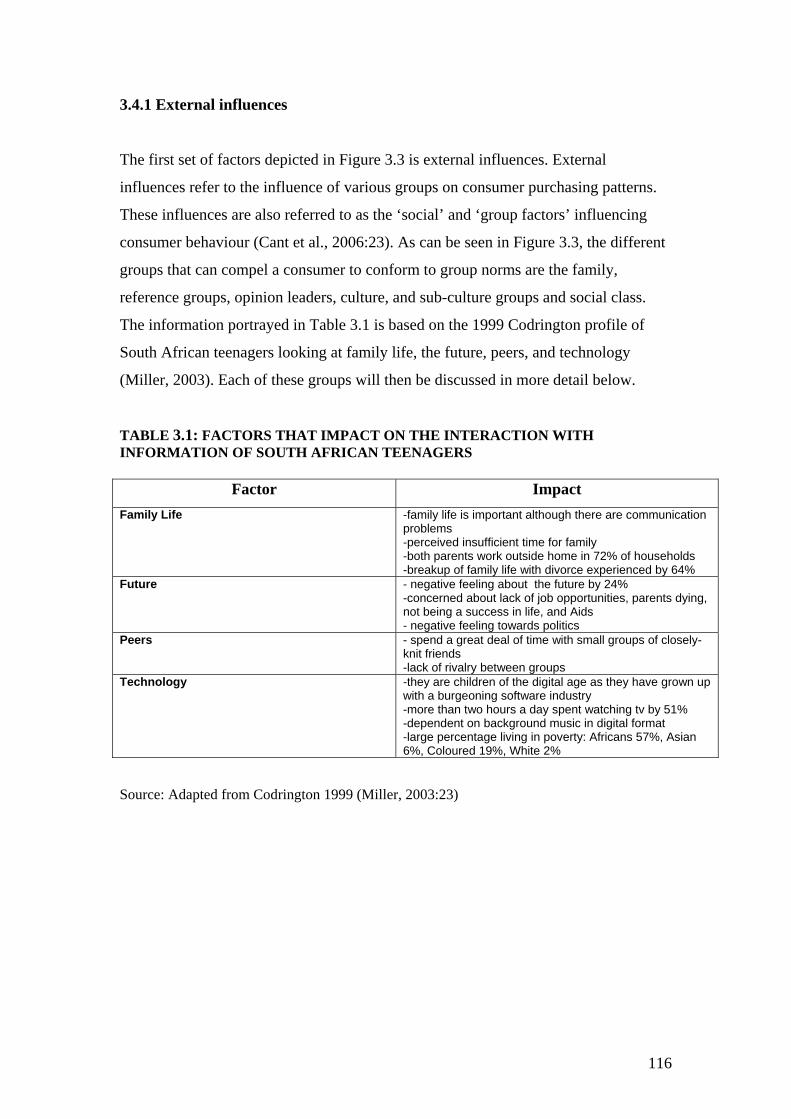
3.4.1 External influences
The first set of factors depicted in Figure 3.3 is external influences. External
influences refer to the influence of various groups on consumer purchasing patterns.
These influences are also referred to as the ‘social’ and ‘group factors’ influencing
consumer behaviour (Cant et al., 2006:23). As can be seen in Figure 3.3, the different
groups that can compel a consumer to conform to group norms are the family,
reference groups, opinion leaders, culture, and sub-culture groups and social class.
The information portrayed in Table 3.1 is based on the 1999 Codrington profile of
South African teenagers looking at family life, the future, peers, and technology
(Miller, 2003). Each of these groups will then be discussed in more detail below.
TABLE 3.1: FACTORS THAT IMPACT ON THE INTERACTION WITH INFORMATION OF SOUTH AFRICAN TEENAGERS
Factor Impact Family Life -family life is important although there are communication
problems -perceived insufficient time for family -both parents work outside home in 72% of households -breakup of family life with divorce experienced by 64%
Future - negative feeling about the future by 24% -concerned about lack of job opportunities, parents dying, not being a success in life, and Aids - negative feeling towards politics
Peers - spend a great deal of time with small groups of closely-knit friends -lack of rivalry between groups
Technology -they are children of the digital age as they have grown up with a burgeoning software industry -more than two hours a day spent watching tv by 51% -dependent on background music in digital format -large percentage living in poverty: Africans 57%, Asian 6%, Coloured 19%, White 2%
Source: Adapted from Codrington 1999 (Miller, 2003:23)
116
3.4.1.1 Family
The family in Figure 3.3 is a decision-making unit whose members live in close
contact to one another and who decide about purchasing products that will provide the
greatest satisfaction to the family as a whole. The importance of the family in
consumer behaviour is highlighted by the fact that many products are purchased and
consumed by a family unit and the buying decisions of members are influenced by
other members of the family. So it is no surprise that of all the groups influencing
purchasing behaviour, the individual maintains the closest contact with the family
(Strydom, Jooste & Cant, 2000:91). The family is thus the most obvious example of a
strongly influential primary reference group (Cant et al., 2006:210)
Cant, Brink and Brijball (2006:211) found three types of families that dominate
societies:
1) The married couple, a husband and wife, is the simplest structure
2) The nuclear family consists of a husband and wife and a child or children
3) The extended family consists of the nuclear family plus other relatives such as
grandparents, uncles and aunts, cousins and parents-in-law.
4) The single-parent family, consisting of one parents and at least one child, is
growing because of divorce, separation and out-of-wedlock births
The extended family seems to dominate in the majority of South Africa’s population.
These families are however diminishing especially in urban areas making the nuclear
family a more attractive alternative (Cant et al., 2006:211).
3.4.1.1.1 Family role behaviour
All the family members have certain roles for a family to function as a cohesive unit
making family decision-making highly complex. Role differentiation and the
influences exerted by family members on decision-making in the family are depicted
in Table 3.2. Families are ever changing in their structure and composition and family
roles may vary from family to family, from product to product (Cant et al., 2006:213).
117
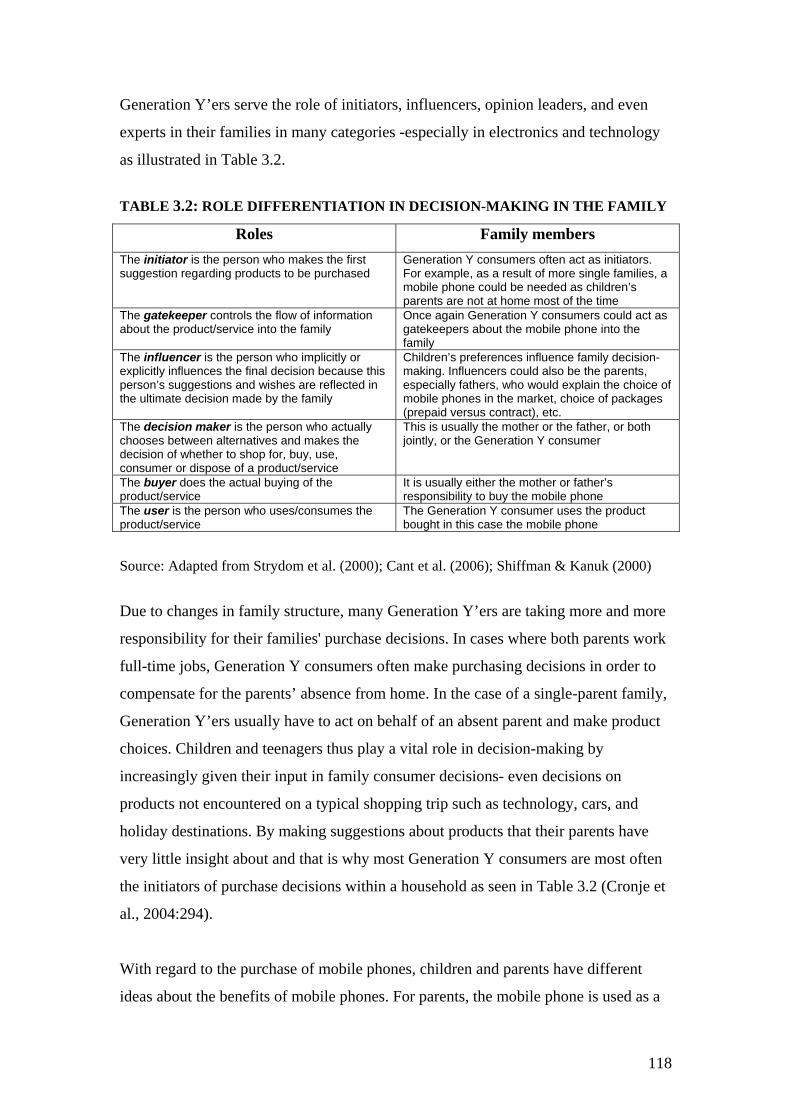
Generation Y’ers serve the role of initiators, influencers, opinion leaders, and even
experts in their families in many categories -especially in electronics and technology
as illustrated in Table 3.2.
TABLE 3.2: ROLE DIFFERENTIATION IN DECISION-MAKING IN THE FAMILY
Roles Family members The initiator is the person who makes the first suggestion regarding products to be purchased
Generation Y consumers often act as initiators. For example, as a result of more single families, a mobile phone could be needed as children’s parents are not at home most of the time
The gatekeeper controls the flow of information about the product/service into the family
Once again Generation Y consumers could act as gatekeepers about the mobile phone into the family
The influencer is the person who implicitly or explicitly influences the final decision because this person’s suggestions and wishes are reflected in the ultimate decision made by the family
Children’s preferences influence family decision-making. Influencers could also be the parents, especially fathers, who would explain the choice of mobile phones in the market, choice of packages (prepaid versus contract), etc.
The decision maker is the person who actually chooses between alternatives and makes the decision of whether to shop for, buy, use, consumer or dispose of a product/service
This is usually the mother or the father, or both jointly, or the Generation Y consumer
The buyer does the actual buying of the product/service
It is usually either the mother or father’s responsibility to buy the mobile phone
The user is the person who uses/consumes the product/service
The Generation Y consumer uses the product bought in this case the mobile phone
Source: Adapted from Strydom et al. (2000); Cant et al. (2006); Shiffman & Kanuk (2000)
Due to changes in family structure, many Generation Y’ers are taking more and more
responsibility for their families' purchase decisions. In cases where both parents work
full-time jobs, Generation Y consumers often make purchasing decisions in order to
compensate for the parents’ absence from home. In the case of a single-parent family,
Generation Y’ers usually have to act on behalf of an absent parent and make product
choices. Children and teenagers thus play a vital role in decision-making by
increasingly given their input in family consumer decisions- even decisions on
products not encountered on a typical shopping trip such as technology, cars, and
holiday destinations. By making suggestions about products that their parents have
very little insight about and that is why most Generation Y consumers are most often
the initiators of purchase decisions within a household as seen in Table 3.2 (Cronje et
al., 2004:294).
With regard to the purchase of mobile phones, children and parents have different
ideas about the benefits of mobile phones. For parents, the mobile phone is used as a
118
monitoring device-it is a practical way of keeping in touch with their children. For
young adolescents the mobile phone can be a status of symbol and an instant
communication medium for their social network.
According to Ling (2003) the mobile phone affects two areas of interaction when
considering the relationship of teens to their parents. It not only brings up issues
surrounding the emancipation of the teen but also allows for better coordination
within the family. The mobile phone allows for contact to be made when needed and
coordination of activities with the parents. Along with this coordination is the
freedom of the teen by increasing emancipation. “The mobile telephone is a device,
and a symbol, with which once can mark their growing emancipation” (Ling, 2000:6).
The notion of a mobile phone as a security device is another theme among the youth
as mobile phones are usually used in emergencies (Ling, 2000:7).
3.4.1.2 Reference groups
A reference group in Figure 3.3 is “any person or group of people that significantly
influences an individual’s behaviour” (Bearden & Etzel, 1982 quoted in Engel et al.,
1994:716). A more detailed definition given by Cant, Brink and Brijball (2006:73) is
that reference groups: “form part of group dynamics and can be defined as any person
or group that serves a point of comparison or referent for an individual consumer in
forming certain values, attitudes and behaviour patterns.” Being a member of a certain
group implies exhibiting similar habits and purchasing patterns of the group (Cronje
et al., 2004:295). The different types of reference groups found in South Africa will
be discussed in the next section.
3.4.1.2.1 Types of reference groups
Reference groups fall into four categories. These include:
1) Formal and informal reference groups
2) Primary and secondary reference groups
3) Membership and non-membership groups
4) Aspirational and dissociative groups.
Table 3.3 discusses each of these reference groups with examples in more detail
below:
119
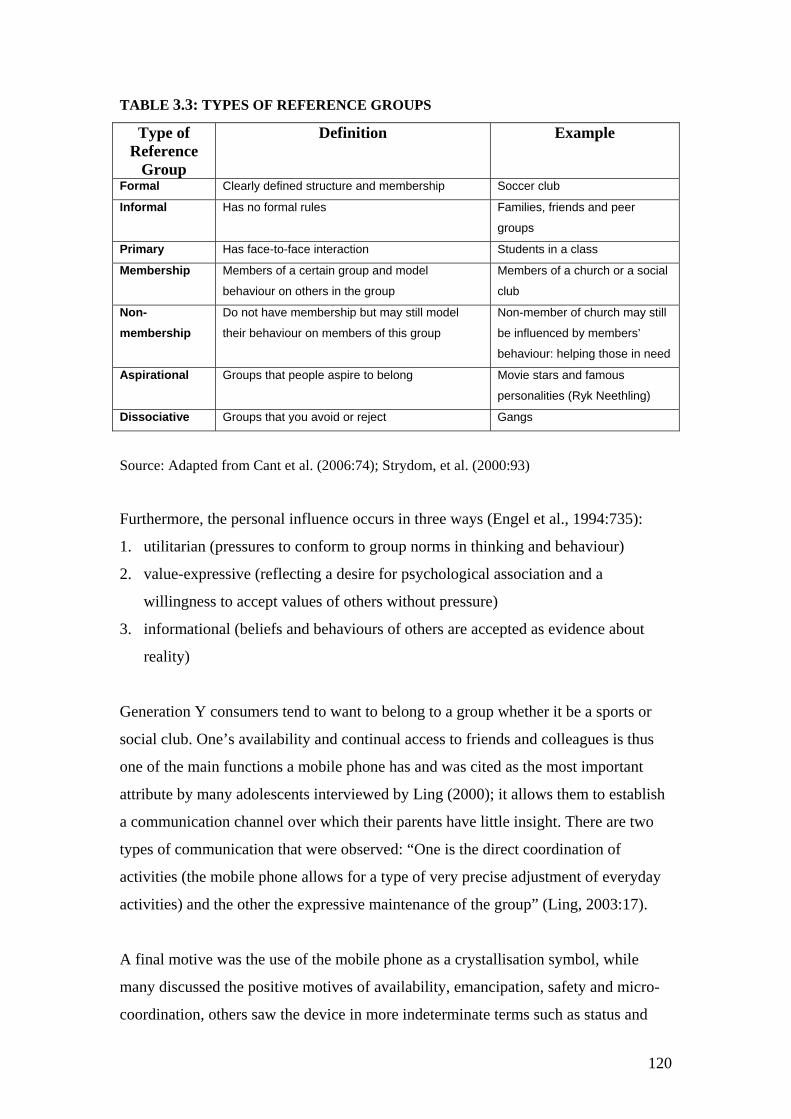
TABLE 3.3: TYPES OF REFERENCE GROUPS
Type of Reference
Group
Definition Example
Formal Clearly defined structure and membership Soccer club
Informal Has no formal rules Families, friends and peer
groups
Primary Has face-to-face interaction Students in a class
Membership Members of a certain group and model
behaviour on others in the group
Members of a church or a social
club
Non-membership
Do not have membership but may still model
their behaviour on members of this group
Non-member of church may still
be influenced by members’
behaviour: helping those in need
Aspirational Groups that people aspire to belong Movie stars and famous
personalities (Ryk Neethling)
Dissociative Groups that you avoid or reject Gangs
Source: Adapted from Cant et al. (2006:74); Strydom, et al. (2000:93)
Furthermore, the personal influence occurs in three ways (Engel et al., 1994:735):
1. utilitarian (pressures to conform to group norms in thinking and behaviour)
2. value-expressive (reflecting a desire for psychological association and a
willingness to accept values of others without pressure)
3. informational (beliefs and behaviours of others are accepted as evidence about
reality)
Generation Y consumers tend to want to belong to a group whether it be a sports or
social club. One’s availability and continual access to friends and colleagues is thus
one of the main functions a mobile phone has and was cited as the most important
attribute by many adolescents interviewed by Ling (2000); it allows them to establish
a communication channel over which their parents have little insight. There are two
types of communication that were observed: “One is the direct coordination of
activities (the mobile phone allows for a type of very precise adjustment of everyday
activities) and the other the expressive maintenance of the group” (Ling, 2003:17).
A final motive was the use of the mobile phone as a crystallisation symbol, while
many discussed the positive motives of availability, emancipation, safety and micro-
coordination, others saw the device in more indeterminate terms such as status and
120
identification (Ling, 2000:10). Alexander (2000) notes that the symbolic identity of
fashion and style is an important factor in social interaction and the identity of the
mobile phone is seen by the youth as a dynamic social technology.
3.4.1.3 Opinion leader
Personal influence on purchasing behaviour can also come through word-of-mouth
communication initiated by a person known as an opinion leader. The opinion leader,
as illustrated under external influences in Figure 3.3, is a credible person who is
accepted as a source of information about purchase and use. Opinion leaders act as a
go-between in what is known as the two-step flow of communication. The
information from mass media is usually channelled by the opinion leader who
interprets the information and then relays the acceptance or rejection of the message
to the other consumers in the target market (Strydom et al., 2000:94).
Every consumer is a member of different reference group and could be an opinion
leader for a certain product whilst being a follower for another. For a product to be
accepted within a market segment, marketers must identify a suitable reference group
and opinion leader for its product (Cronje et al., 2004:295).
3.4.1.4 Culture groups
According to many authors, culture is one of the important factors that influence
customer behaviour (Engel et al., 1994; Strydom, 2004). Culture refers to the “values,
ideas, artefacts and other meaningful symbols that help individuals communicate,
interpret and evaluate as members of society” (Engel et al., 1994:144). Cultural
groups comprises of these values, norms and symbols developed in a society over
time in which all its members share.
These cultural norms are transmitted from generation to generation to ensure survival
and to facilitate adaptation to circumstances. The cultural group also strongly
influences purchasing and consumption patterns. Sub-cultures exist within culture
groups and will be elaborated upon in the next section.
121
3.4.1.5 Sub-culture
Sub-culture (See Figure 3.3) is defined as “a distinct cultural group that exists as an
identifiable segment within larger, more complex societies” (Cant et al., 2006:59).
Subcultures are often categorised on the basis of demographics. According to Cant
and Machado (2004), sub-cultures make up important market segments in South
African society, such as language, e.g. Afrikaans speaking sub cultural group with
their preferences such as “braaivleis” (barbecue), biltong and rugby, racial groups,
e.g. Asians with their unique preferences regarding strong curry dishes and also
geographic regions, e.g. rural vs. urban subcultures. Each cultural group comprises of
four main sub-cultures: nationality, religion, race, and geographical area. Smaller sub-
cultures according to language, age, employment status can also be developed within
the main sub-cultures.
Different perspectives on the diversity of South Africa exist. South Africa is a perfect
example of a ‘melting pot’ where society is fragmented into many cultural groups and
sub-groups. Marketers should thus run integrated promotions aimed at all groups
(Cronje et al., 2004:296). The ‘rainbow nation’ metaphor is also used to describe the
strength and richness in diversity of the people in South Africa (Cant et al., 2006:59).
The age-based sub-culture is most likely to influence Generation Y consumers and
this is the reason why it will be discussed in more detail below.
3.4.1.5.1 Age-based sub-culture
The age-based subculture can be described as a generation or a group of people “who
have experienced a common social, political, historical and economic environment
(Cant & Machado, 2004:48).” Generations, which are roughly sub-divided into 20-
year blocks can help explain different consumer behaviours (Cant & Machado,
2004:48).
Cant and Machado (2004) identify five basic generations, namely:
122
• Pre-Depression Generation – born before 1930 this is a generation that
experienced the Great Depression as children and who were adults during
World War II. Some of this generation volunteered to fight in World War II,
whilst other joined the nationalist organisation called the Ossewa Brandwag
that was sympathetic to Nazi Germany. This generation today are the people
in old-age homes and living as the matriarch or patriarch of the extended
family. They have unique needs, more related to health and trying to cope with
an ever-increasing burden of medical costs and trying to make ends meet.
• The Depression Generation – born between 1930 and 1946 this generation
grew up in the relative affluent years in the 1950s and 1960s. They
experienced Rock n Roll first hand as well as Elvis Presley and are just retired
or in the last stage of their career. They are the grand parents of the generation
Y children. This generation is called the silent generation – they believe in
hard work, are conservative in nature and likes order, rules and a clearly
defined hierarchy.
• The Baby Boom generation – born between 1947 and 1964 this is one of the
largest generations in South Africa. They experienced the rise of the National
Party, the Apartheid years, the Rivonia trail, Sharpeville, racial discrimination,
sexual revolution, the Flower Power and Hippy era as represented in the
Woodstock music happening, recreational drugs and the effect of divorce
creating single parent households, pop groups such as the Beatles, the Rolling
Stones and The Who, who took Rock n Roll further than ever expected. They
were also the generation that saw the effect of Communism, the Cold War, the
Vietnam War and they were adults when the Berlin Wall fell and saw the
demise of Communism in Eastern Europe and Russia. They have a live for
today attitude.
• Generation X – is the generation born between 1965 and 1978. The term
comes from a book written by Douglas Copeland by the same name. In this
book the author described the fictional characters in the book as “
underemployed, overeducated, intensely private and unpredictable”. The
stereotype of Generation X is seen as “cynical, hopeless, frustrated and
unmotivated slackers who wear grunge clothing, listen to alternative music
and still live at home because they cannot get real jobs.”
123
In real life Generation X wants options and flexibility and they dislike close
supervision in the workplace. They prefer an output driven system where they
believe the organisation that they work for has bought their output – the
mechanics on how and when they do their work is irrelevant – they want the
freedom to do the work in their own time. This is the generation that
experienced dual income households with both parents away during working
hours. They bore the brunt of single parent households, which left emotional
scars and experienced a deteriorating environment and the Aids pandemic. In
South Africa they were the first generation influenced by television, which
was introduced in 1976. They were young adults when South Africa became a
democracy in 1994. These are the parents of the generation under investigation
• Generation Y – this is the generation born between 1979 and 1994 and is the
children of the baby boomers and grew up as the first generation that reaped
the fruit of democracy in South Africa. They grew up with computers, the
Internet and saw their parents losing their jobs in an economic slowdown
period. Generation Y exuberate independence and are much more optimistic,
confident and social than previous generations. They are also much more
street smart and technology minded than the previous generations. The South
African Generation Y forms part of the global youth culture that transcends all
boundaries in the world – they are truly part of the global village in their
needs, attitudes, perceptions and lifestyles.
Generation Y’ers, Generation X’ers and Baby Boomers, as discussed above, differ in
their purchasing behaviour, attitudes towards brand, and behaviour towards
advertisements. The main differences of these groups are illustrated in Table 3.4 (Cant
et al., 2006:108):
124
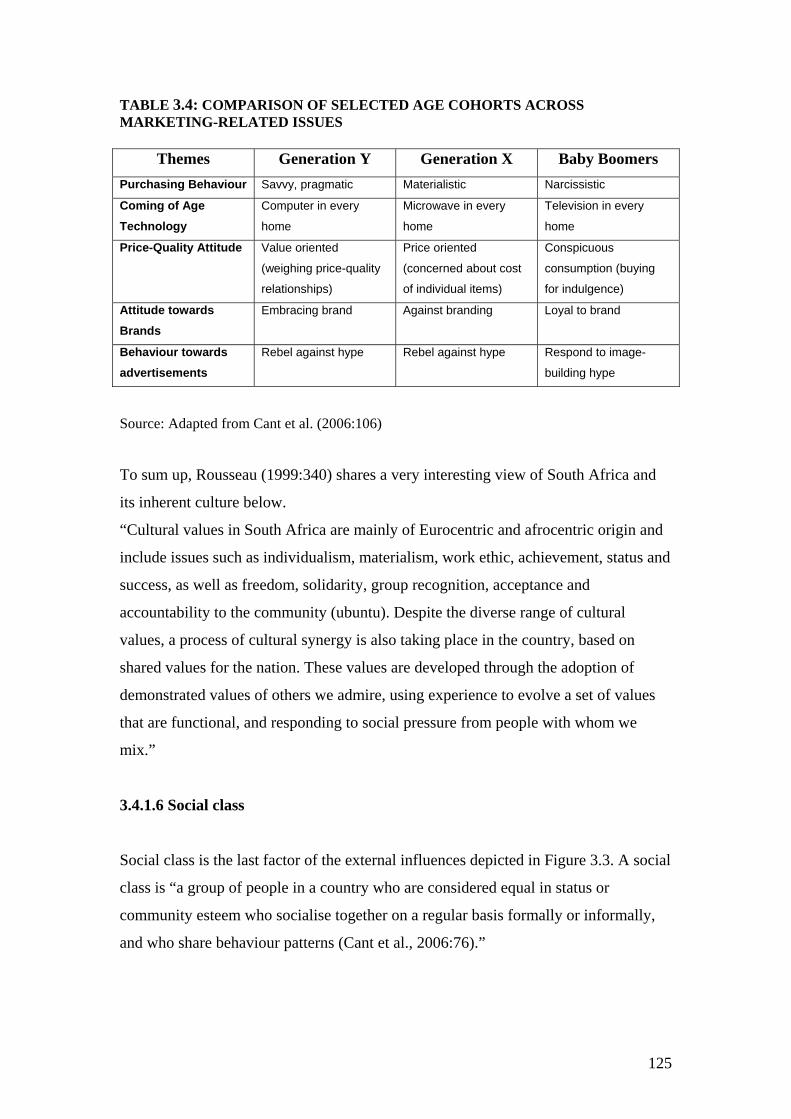
TABLE 3.4: COMPARISON OF SELECTED AGE COHORTS ACROSS MARKETING-RELATED ISSUES
Themes Generation Y Generation X Baby Boomers Purchasing Behaviour Savvy, pragmatic Materialistic Narcissistic
Coming of Age Technology
Computer in every
home
Microwave in every
home
Television in every
home
Price-Quality Attitude Value oriented
(weighing price-quality
relationships)
Price oriented
(concerned about cost
of individual items)
Conspicuous
consumption (buying
for indulgence)
Attitude towards Brands
Embracing brand Against branding Loyal to brand
Behaviour towards advertisements
Rebel against hype Rebel against hype Respond to image-
building hype
Source: Adapted from Cant et al. (2006:106)
To sum up, Rousseau (1999:340) shares a very interesting view of South Africa and
its inherent culture below.
“Cultural values in South Africa are mainly of Eurocentric and afrocentric origin and
include issues such as individualism, materialism, work ethic, achievement, status and
success, as well as freedom, solidarity, group recognition, acceptance and
accountability to the community (ubuntu). Despite the diverse range of cultural
values, a process of cultural synergy is also taking place in the country, based on
shared values for the nation. These values are developed through the adoption of
demonstrated values of others we admire, using experience to evolve a set of values
that are functional, and responding to social pressure from people with whom we
mix.”
3.4.1.6 Social class
Social class is the last factor of the external influences depicted in Figure 3.3. A social
class is “a group of people in a country who are considered equal in status or
community esteem who socialise together on a regular basis formally or informally,
and who share behaviour patterns (Cant et al., 2006:76).”
125
Social classes have distinctive behaviour patterns that are a function of occupation,
income and education. Every country has a different social class structure. South
Africa has a class structure that is triangular-shaped, meaning that a very small part of
the population is classified as the upper-class, more in the middle class and the
majority in the lower class. This is turn leads to a high Gini coefficient for South
Africa. A Gini coefficient represents the gap in income between the richest and the
poorest people in the country (Cant et al., 2006:77).
Social class thus strongly influences consumer lifestyles and in general is a good
indicator of the type of product that a consumer would be interested in buying. In
order to advance social standing in society, consumers of a particular class will buy
specific products. Studies found that the following five products were identified as
giving status to the respondents: a car, a music centre/radio, a suit/clothing, education,
and a television set. Mobile phones were also mentioned as a status symbol (Cant et
al., 2006:77). The research results from this investigation included students from
universities (i.e. tertiary education), implying that the Generation Y students surveyed
might exhibit similar attitudes and behaviours.
3.4.2 Internal influences
The second set of factors depicted in Figure 3.3 is internal influences. Individuals
differ in many ways and that in turn affects their purchasing behaviour. Internal
influences are also referred to as ‘psychological forces’ that influence consumer
behaviour (Cant et al. 2006:24). Motivation, attitudes, perceptions, learning ability,
personality, and lifestyle all fall in the “Internal Influences” bracket and determines
the type of products a consumer will buy (See Figure 3.3).
3.4.2.1 Motivation
Motivation, or more specifically needs, are the driving force behind all human
behaviour patterns (Cronje et al., 2004:293). There have been several theories of
classifying needs by many psychologists and marketers and some, like Maslow’s
Hierarchy of Needs, is worth discussing.
126
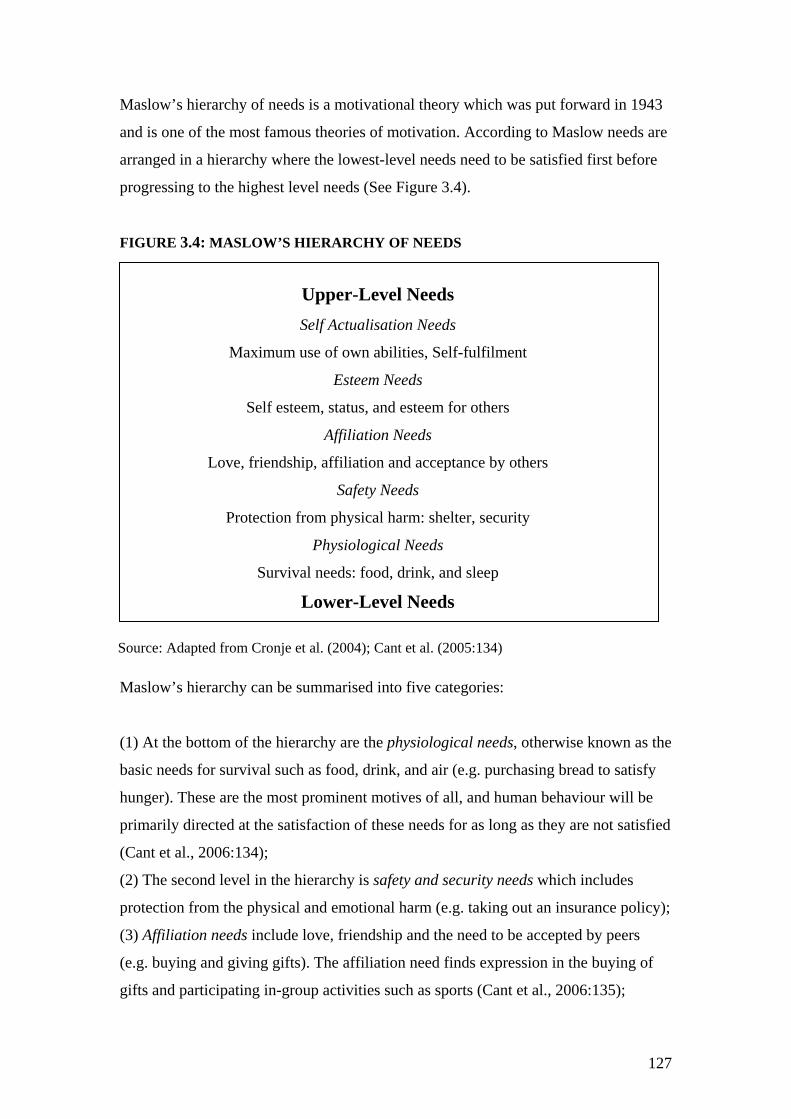
Maslow’s hierarchy of needs is a motivational theory which was put forward in 1943
and is one of the most famous theories of motivation. According to Maslow needs are
arranged in a hierarchy where the lowest-level needs need to be satisfied first before
progressing to the highest level needs (See Figure 3.4).
FIGURE 3.4: MASLOW’S HIERARCHY OF NEEDS
Upper-Level Needs
Self Actualisation Needs
Maximum use of own abilities, Self-fulfilment
Esteem Needs
Self esteem, status, and esteem for others
Affiliation Needs
Love, friendship, affiliation and acceptance by others
Safety Needs
Protection from physical harm: shelter, security
Physiological Needs
Survival needs: food, drink, and sleep
Lower-Level Needs
Source: Adapted from Cronje et al. (2004); Cant et al. (2005:134)
Maslow’s hierarchy can be summarised into five categories:
(1) At the bottom of the hierarchy are the physiological needs, otherwise known as the
basic needs for survival such as food, drink, and air (e.g. purchasing bread to satisfy
hunger). These are the most prominent motives of all, and human behaviour will be
primarily directed at the satisfaction of these needs for as long as they are not satisfied
(Cant et al., 2006:134);
(2) The second level in the hierarchy is safety and security needs which includes
protection from the physical and emotional harm (e.g. taking out an insurance policy);
(3) Affiliation needs include love, friendship and the need to be accepted by peers
(e.g. buying and giving gifts). The affiliation need finds expression in the buying of
gifts and participating in-group activities such as sports (Cant et al., 2006:135);
127
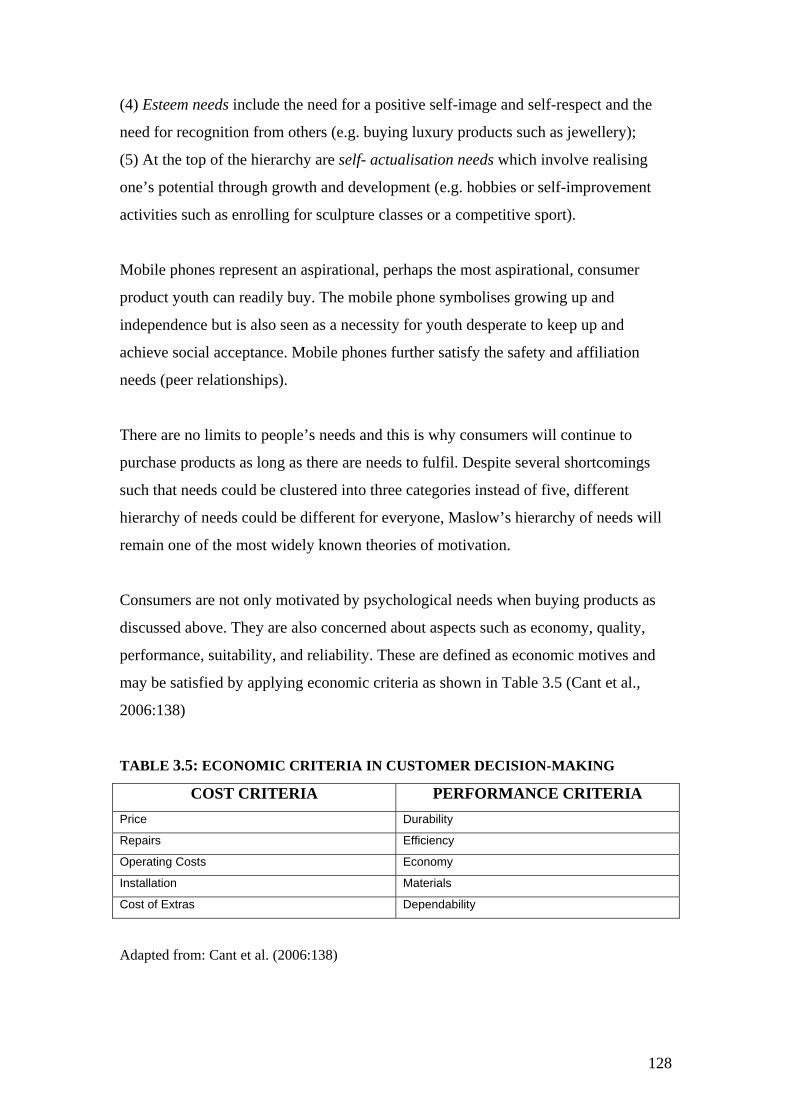
(4) Esteem needs include the need for a positive self-image and self-respect and the
need for recognition from others (e.g. buying luxury products such as jewellery);
(5) At the top of the hierarchy are self- actualisation needs which involve realising
one’s potential through growth and development (e.g. hobbies or self-improvement
activities such as enrolling for sculpture classes or a competitive sport).
Mobile phones represent an aspirational, perhaps the most aspirational, consumer
product youth can readily buy. The mobile phone symbolises growing up and
independence but is also seen as a necessity for youth desperate to keep up and
achieve social acceptance. Mobile phones further satisfy the safety and affiliation
needs (peer relationships).
There are no limits to people’s needs and this is why consumers will continue to
purchase products as long as there are needs to fulfil. Despite several shortcomings
such that needs could be clustered into three categories instead of five, different
hierarchy of needs could be different for everyone, Maslow’s hierarchy of needs will
remain one of the most widely known theories of motivation.
Consumers are not only motivated by psychological needs when buying products as
discussed above. They are also concerned about aspects such as economy, quality,
performance, suitability, and reliability. These are defined as economic motives and
may be satisfied by applying economic criteria as shown in Table 3.5 (Cant et al.,
2006:138)
TABLE 3.5: ECONOMIC CRITERIA IN CUSTOMER DECISION-MAKING
COST CRITERIA PERFORMANCE CRITERIA Price Durability
Repairs Efficiency
Operating Costs Economy
Installation Materials
Cost of Extras Dependability
Adapted from: Cant et al. (2006:138)
128
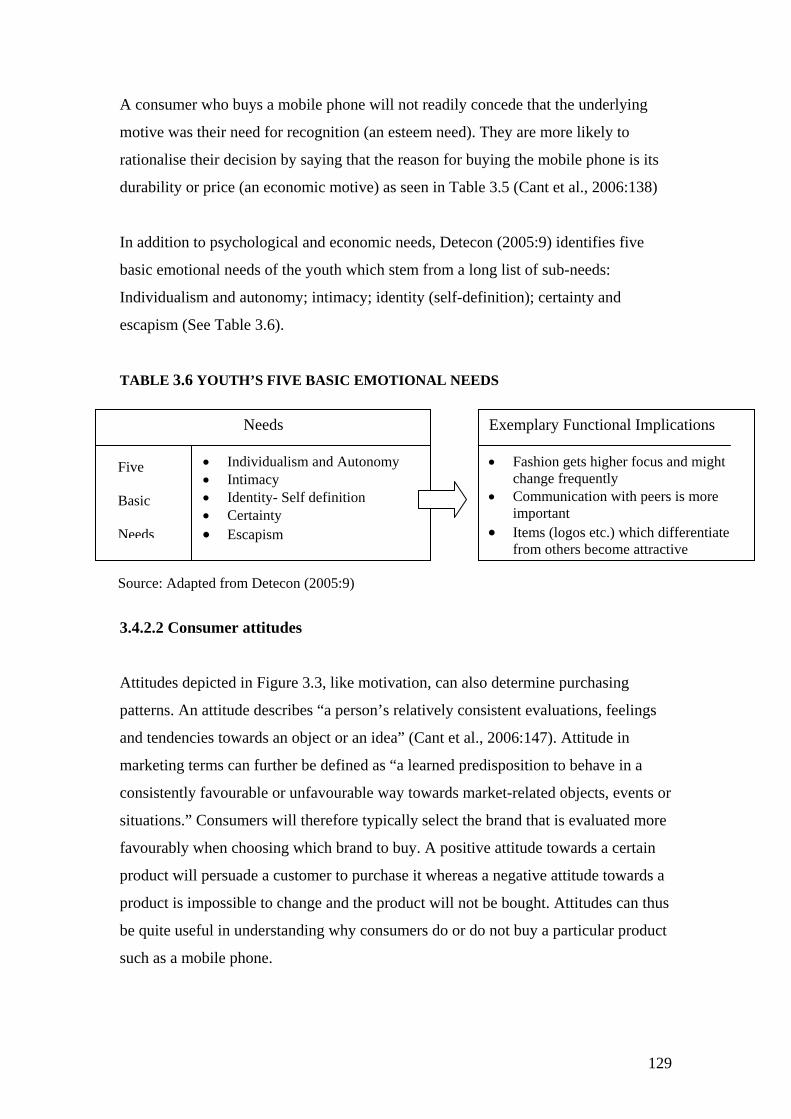
A consumer who buys a mobile phone will not readily concede that the underlying
motive was their need for recognition (an esteem need). They are more likely to
rationalise their decision by saying that the reason for buying the mobile phone is its
durability or price (an economic motive) as seen in Table 3.5 (Cant et al., 2006:138)
In addition to psychological and economic needs, Detecon (2005:9) identifies five
basic emotional needs of the youth which stem from a long list of sub-needs:
Individualism and autonomy; intimacy; identity (self-definition); certainty and
escapism (See Table 3.6).
TABLE 3.6 YOUTH’S FIVE BASIC EMOTIONAL NEEDS
3.4.1.2 Attitudes
Needs
• Individualism and Autonomy • Intimacy • Identity- Self definition • Certainty • Escapism
Five Basic Needs
Exemplary Functional Implications • Fashion gets higher focus and might
change frequently • Communication with peers is more
important • Items (logos etc.) which differentiate
from others become attractive
Source: Adapted from Detecon (2005:9)
3.4.2.2 Consumer attitudes
Attitudes depicted in Figure 3.3, like motivation, can also determine purchasing
patterns. An attitude describes “a person’s relatively consistent evaluations, feelings
and tendencies towards an object or an idea” (Cant et al., 2006:147). Attitude in
marketing terms can further be defined as “a learned predisposition to behave in a
consistently favourable or unfavourable way towards market-related objects, events or
situations.” Consumers will therefore typically select the brand that is evaluated more
favourably when choosing which brand to buy. A positive attitude towards a certain
product will persuade a customer to purchase it whereas a negative attitude towards a
product is impossible to change and the product will not be bought. Attitudes can thus
be quite useful in understanding why consumers do or do not buy a particular product
such as a mobile phone.
129
It is the marketer’s task to prevent the development of negative attitudes towards their
particular product by reinforcing existing positive attitudes or to change neutral
attitudes to favour their products through the successful use of marketing
communication messages (Cronje et al., 2004:293).
This is especially true when attitudes are linked to the knowledge consumers possess
about the specific product. Knowledge can facilitate search behaviour. Knowledge or
prior purchase experience is often found to have a negative relationship with external
search when the consumer relies more heavily on internal search during decision-
making. Alternatively, knowledge can enhance search; consumers will acquire more
information when they feel more confident about their ability to judge products.
Therefore knowledge may also be related positively to external search. These positive
and negative influences produce an inverted ‘U’ relationship between knowledge and
external search. There are three types of consumers; consumers with limited
knowledge, consumers with moderate knowledge and consumers possessing high
levels of knowledge.
Consumers that possess “extremely limited knowledge (such as first time buyers) may
feel incompetent to undertake an elaborate search and analysis”(Engel et al.,
1994:194). They usually rely on others to solve their consumption problem.
Consumers possessing moderate knowledge should have greater pre-purchase search
as they will have sufficient knowledge to explore and understand the information
environment.
Consumers possessing high levels of knowledge rely heavily on memory as opposed
to the other two types of consumers. Knowledgeable consumers need little pre-
purchase search as internal search may cover most if not all information needed for
decision-making (Engel et al., 1994:194).
130
3.4.2.2.1 Attitudes and the mobile phone
Applying the concept of knowledge and attitudes to the mobile phone environment,
Riqueleme (2001) conducted an experiment to identify how much self-knowledge
consumers have about an important purchase: choosing between mobile phones. A
total of 94 consumers provided ratings of the importance of six key attributes:
telephone features, connection fee, access cost, mobile-to-mobile phone rates, call
rates, and free calls and preference for several choices of mobile phone plans that
were advertised on the market.
The research shows that consumers have a relatively good predictive power of mobile
phone plans they have chosen, however this knowledge is not perfect; when
evaluating the mobile phone plans, consumers with prior experience about this
product tended to underestimate the importance of a monthly access fee, mobile-to-
mobile phone rates and the connection fee whilst they tended to overestimate the
importance of telephone features, call rates, and free calls.
In another paper, Liu (2002) tries to find the effects of different activities on
consumer choice of mobile phone brands in Asia. It was found that there were two
distinct attitudes to brands when choosing a mobile phone: attitudes towards the
mobile phone brand and attitudes towards the network. Choosing between mobile
phone brands were affected by new technology features such as SMS, memory
capacity, radio, and Internet connection. In contrast, price and regularity of service
dominate choices between network providers. The focus on size of the phone has
dropped off and the trend has moved to larger phones with better capability and larger
screens.
In a more recent study, Valor and Sieber (2003) have shown that young people’s
adoption of technology does not only depend on their technological knowledge but on
their overall environment. In Spain, young people seemed to adopt mobile phones
regardless of their technology expertise. Nevertheless, mobile phone usage varied
depending on the degree of technological knowledge of each teenager; those with
higher technology knowledge used their mobile phone as a multi-purpose device
(Valor & Sieber, 2003:9).
131
Young people pride themselves as technologically knowledgeable rather than
ignorant. Thus, understanding youth attitudes towards new technologies such as
wireless Internet and more specifically the use of mobile phones are important in
identifying new business opportunities and new needs of this younger market
resulting from the introduction of such new technologies. Attitudes of Generation Y
respondents towards mobile phones will be investigated in the research phase (See
Section D of questionnaire in Appendix A).
3.4.2.3 Consumer perceptions
Consumer perceptions, the third individual factor in Figure 3.3, is the “process of
receiving, organising and assigning meaning to information or stimuli detected by the
five senses” (Strydom et al., 2000:84; Kotler, 2000:173; Cant et al., 2006:115).
Perceptions of the mobile phone are already changing- mobile phones are not only
used for voice communication but are changing into more general communication
devices (Weilenman &Larsson, 2002). The mobile phone is taking on a new meaning
and has gone beyond voice telephony; it is increasingly perceived as a multi-purpose
device as mentioned above (Hulme & Peters, 2001). The mobile phone can be used as
a communicator through voice telephony, SMS text messaging, an entertainment
device through games, an alarm clock, and an address book.
Leung and Wei (2000) (quoted in Valor & Sieber, 2003:3) found six additional
gratifications: fashion/status, affection/ sociability, relaxation, immediate access,
instrumentality, and reassurance. In this way, the mobile phone covers the different
needs and motivations (Lin, 1996).
Furthermore, perception involves seeing, hearing, feeling, tasting, and smelling as this
determines what consumers pay attention to and what captures their interest. The
perceptual process consists of four stages, namely, exposure, attention, interpretation,
and memory (or recall) as shown in Figure 3.5.
132
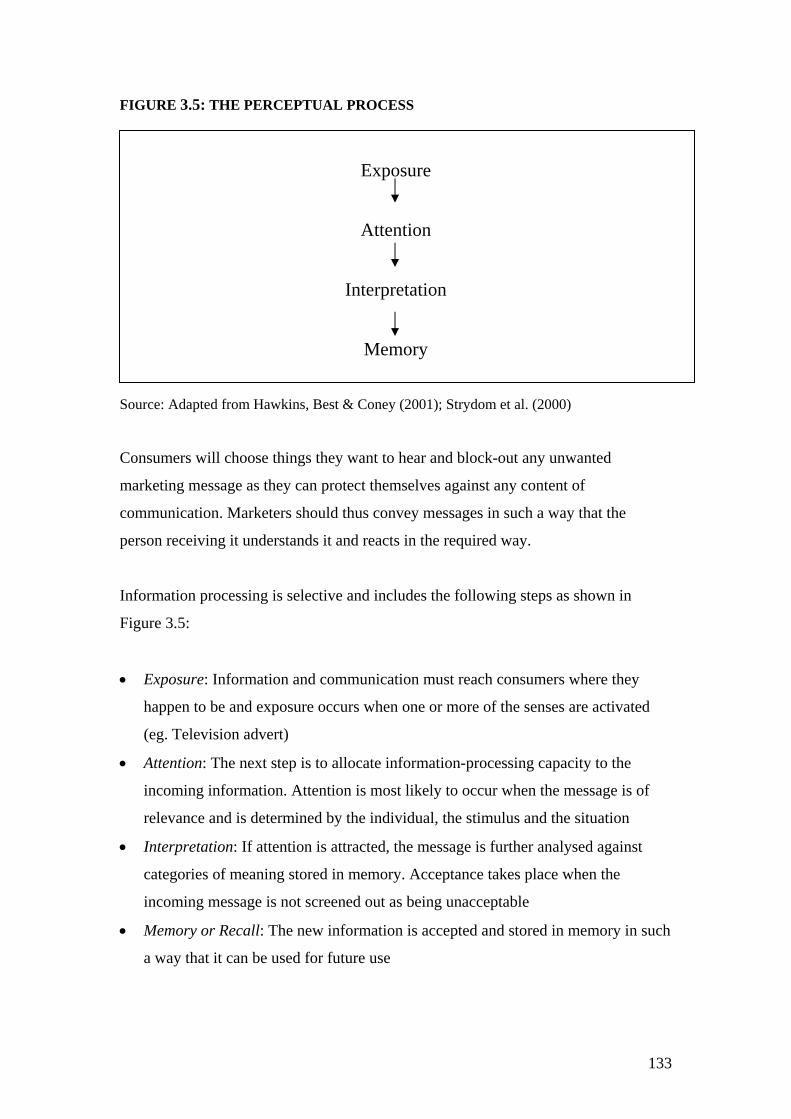
FIGURE 3.5: THE PERCEPTUAL PROCESS
Exposure
Attention
Interpretation
Memory
Source: Adapted from Hawkins, Best & Coney (2001); Strydom et al. (2000)
Consumers will choose things they want to hear and block-out any unwanted
marketing message as they can protect themselves against any content of
communication. Marketers should thus convey messages in such a way that the
person receiving it understands it and reacts in the required way.
Information processing is selective and includes the following steps as shown in
Figure 3.5:
• Exposure: Information and communication must reach consumers where they
happen to be and exposure occurs when one or more of the senses are activated
(eg. Television advert)
• Attention: The next step is to allocate information-processing capacity to the
incoming information. Attention is most likely to occur when the message is of
relevance and is determined by the individual, the stimulus and the situation
• Interpretation: If attention is attracted, the message is further analysed against
categories of meaning stored in memory. Acceptance takes place when the
incoming message is not screened out as being unacceptable
• Memory or Recall: The new information is accepted and stored in memory in such
a way that it can be used for future use
133
An advertisement should be kept simple and have some impact in attracting attention
for it to be successful otherwise consumers might choose to ignore it completely.
Gaining the consumer’s attention is one of the biggest challenges faced by marketers
hence the reason why the success of an advert is based on the likelihood of it gaining
consumers’ attention.
Generation Y is fast becoming the new target market of advertisers and marketers as a
result of their increasing purchasing power. To effectively target this market, many
advertisers and marketers will be forced to look for new trends that will influence the
consumer preferences of Generation Y consumers.
Furthermore, according to Mattheus (2004) product innovations from mobile
companies are making services increasingly affordable and accessible to the younger
audience. The three mobile network operators have come up with innovative and
youthful campaigns to attract the Generation Y market. Examples of these new
targeted products are Vodacom’s “4U”, MTN’s “Me2U” and Cell C’s “CY”.
Vodacom’s advertising consistently achieves high scores, resulting from the
humorous “Yebo Gogo” campaigns that have been highly successful in creating an
affinity for this character amongst all South Africans (Vodacom Group Annual
Results, 2005:41). Vodacom’s on screen family has been entertaining South Africa
television viewers for nearly ten years, from the early days when Yebo Gogo’s
bumbling friend locked himself out of his car to the most recent animated characters.
The youngest member of the family has also made a mark, getting a 4U tattoo and
getting launched into space as part of the campaign’s slogan “Make every second
count.” The launch of the “4U”brand in 2001 is undoubtedly one of the most
successful achievements by Vodacom because it was targeted at the youth market (16-
24 year olds). The objectives behind the 4U brand was to “turn on South Africa’s
youngsters to 4Us attitudes and lifestyle vibe, bringing the benefits of per second
billing to life in a meaningful way”(Dicey, 2004).
MTN has ran effective ad campaigns such as the Yellow Summer campaign and the
“Chicken Messenger” television advert and has gained top-of-mind awareness as the
“yuppie” cellular network- cool, trendy, self confident and aspirational.
134
Cell C’s ambitious plan for expansion are driven by a belief that it could capture the
younger, less moneyed segment of the mobile market with an innovative pricing
structure as well as an attractive branding campaign. An example would be the Cell C
advertisements, particularly the one which showcases a range of Generation Y South
Africans about their business in the city centre. The youngsters are different in terms
of home language or family background, race, religious background, and possibly
geographical origin and spending capacity. However the advertisement showcases
that they share similarities in their style of music, dress, their attitude towards life,
way of moving, and of course their use of mobile phones- the target of Cell C’s
campaign (Cant & Machado, 2004:51). This has also been expressed as “CY”, a new
product for young consumers. When a young consumer buys a R149 starter pack, they
will get ten free SMS’ s a month, five ringtones or logos, R20 increased airtime value
and as part of a promotional offer, and two free movie tickets. This product reflects
the core values of the innovative Cell C offering. As the company puts it “Choice is
reflected in the flexibility of the contract options, while product offerings are
refreshingly uncomplicated.”
In terms of value, all Cell C products come standard with per second billing. Cell C
has used a blend of above-the-line and below-the-line marketing in pursuit of
simplicity and reassurance in attracting the Generation Y consumer (Williams, 2003).
Furthermore, studies reveal that sponsorship is a more effective communication tool
than advertising and is more effective at driving brand affinity in the mobile phone
market. Combining sports that consumers love and one’s brands has been proved to
enhance brand affinity. In ten years of business and sports sponsorships Vodacom has
provided the biggest diversity of sponsorships- whether it be Vodacom Soccer
Challenge, Super 12 Rugby, or golf, Vodacom has provided a host of sponsorships
that have spectators talking. MTN has sponsored a smaller set of events such as
cricket, soccerzone and their once famous event Gladiators. Cell C scores low on the
sponsorship map compared to its competitors.
135
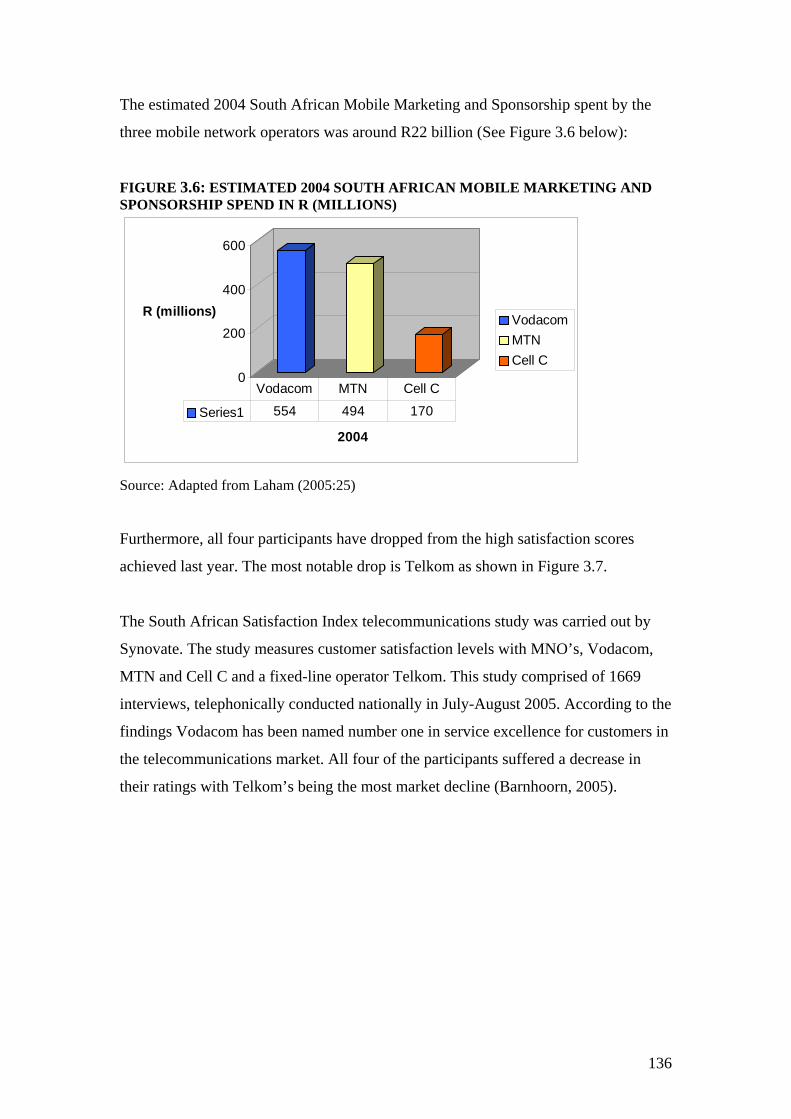
The estimated 2004 South African Mobile Marketing and Sponsorship spent by the
three mobile network operators was around R22 billion (See Figure 3.6 below):
FIGURE 3.6: ESTIMATED 2004 SOUTH AFRICAN MOBILE MARKETING AND SPONSORSHIP SPEND IN R (MILLIONS)
0
200
400
600
R (millions)
2004
VodacomMTNCell C
Series1 554 494 170
Vodacom MTN Cell C
Source: Adapted from Laham (2005:25)
Furthermore, all four participants have dropped from the high satisfaction scores
achieved last year. The most notable drop is Telkom as shown in Figure 3.7.
The South African Satisfaction Index telecommunications study was carried out by
Synovate. The study measures customer satisfaction levels with MNO’s, Vodacom,
MTN and Cell C and a fixed-line operator Telkom. This study comprised of 1669
interviews, telephonically conducted nationally in July-August 2005. According to the
findings Vodacom has been named number one in service excellence for customers in
the telecommunications market. All four of the participants suffered a decrease in
their ratings with Telkom’s being the most market decline (Barnhoorn, 2005).
136
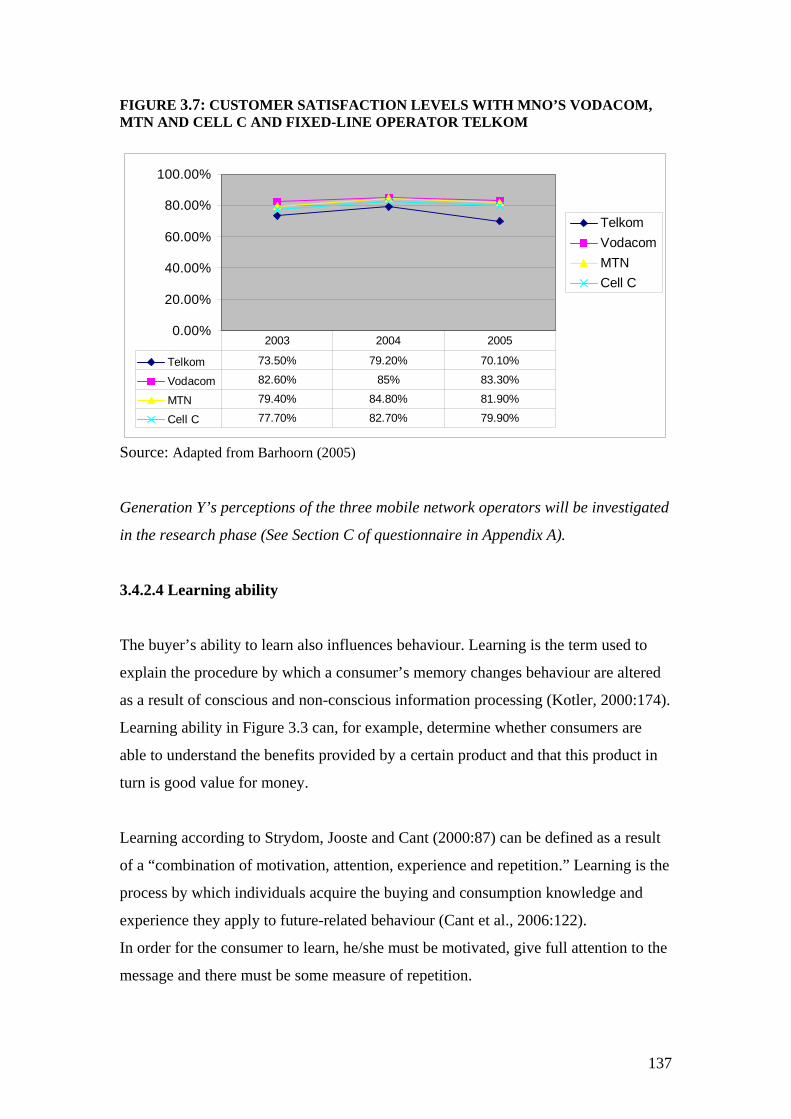
FIGURE 3.7: CUSTOMER SATISFACTION LEVELS WITH MNO’S VODACOM, MTN AND CELL C AND FIXED-LINE OPERATOR TELKOM
0.00%
20.00%
40.00%
60.00%
80.00%
100.00%
TelkomVodacomMTNCell C
Telkom 73.50% 79.20% 70.10%
Vodacom 82.60% 85% 83.30%
MTN 79.40% 84.80% 81.90%
Cell C 77.70% 82.70% 79.90%
2003 2004 2005
Source: Adapted from Barhoorn (2005)
Generation Y’s perceptions of the three mobile network operators will be investigated
in the research phase (See Section C of questionnaire in Appendix A).
3.4.2.4 Learning ability
The buyer’s ability to learn also influences behaviour. Learning is the term used to
explain the procedure by which a consumer’s memory changes behaviour are altered
as a result of conscious and non-conscious information processing (Kotler, 2000:174).
Learning ability in Figure 3.3 can, for example, determine whether consumers are
able to understand the benefits provided by a certain product and that this product in
turn is good value for money.
Learning according to Strydom, Jooste and Cant (2000:87) can be defined as a result
of a “combination of motivation, attention, experience and repetition.” Learning is the
process by which individuals acquire the buying and consumption knowledge and
experience they apply to future-related behaviour (Cant et al., 2006:122).
In order for the consumer to learn, he/she must be motivated, give full attention to the
message and there must be some measure of repetition.
137
A successful learning situation is a product of the effective combination of the three
elements given in Figure 3.8.
FIGURE 3.8: ELEMENTS OF LEARNING
Stimulus Response Reinforcement
Source: Adapted from Cant et al. (2006:123)
According to Cant, Brink and Brijball (2006:123), all individuals learn but not at the
same rate or in the same way. The three elements of learning as illustrated in Figure
are explained below (Cant et al., 2006:123):
• Stimulus: something that stimulates the learner’s interest
• Response: any action, reaction or state of mind resulting from a particular stimulus
• Reinforcement: satisfaction resulting successful behaviour that triggers human
memory of how the satisfaction was obtained
3.4.2.5 Personality traits
There are many definitions for personality in consumer studies. Engel, Blackwell and
Miniard (1994:433) define personality as the “consistent responses to environmental
stimuli and is the particular pattern of organisation that makes one individual unique
and different from all others.” Strydom, Jooste and Cant (2000:88) define personality
as “those psychological characteristics of people which both determine and reflect
their reaction to environment influences.” Research suggests that individual
personality traits are not good predictors of behaviour but marketers use personality
traits to differentiate and describe individuals.
In consumer research, there are three major theories that study and describe
personality so as to attempt to relate behaviour patterns to different personality type
consumers: psychoanalytic, socio-psychological, and trait-factor (Engel et al.,
1994:434).
138
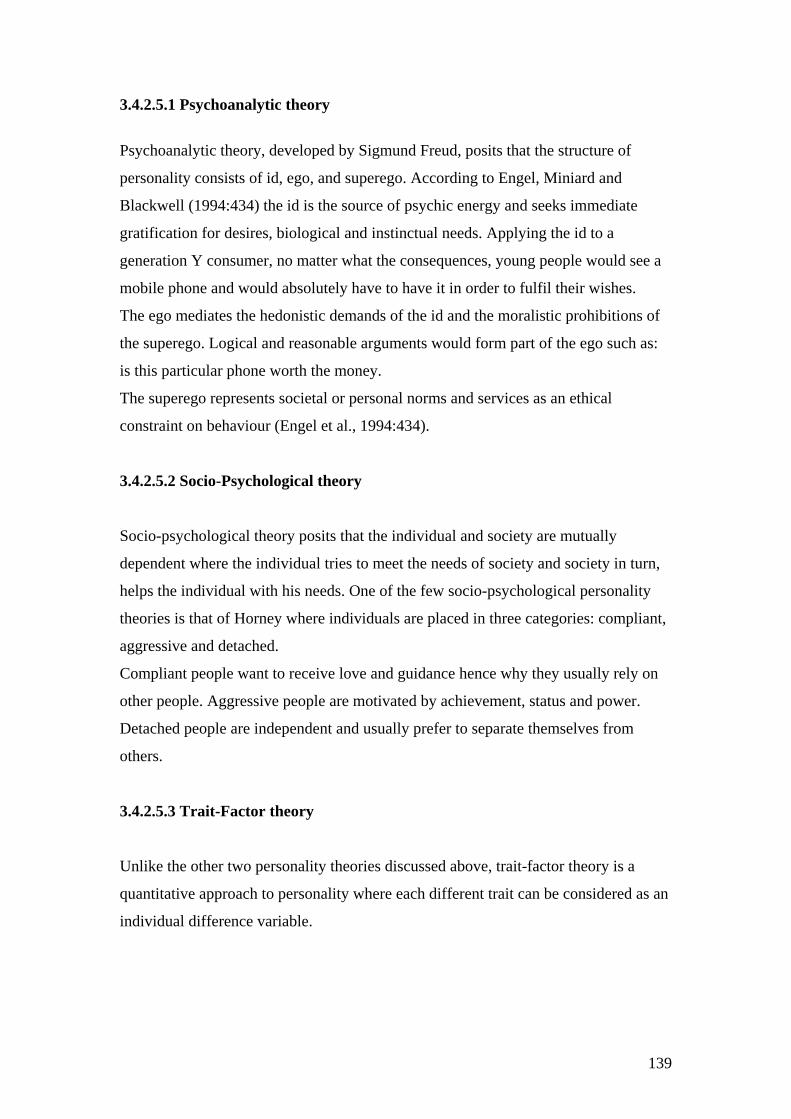
3.4.2.5.1 Psychoanalytic theory
Psychoanalytic theory, developed by Sigmund Freud, posits that the structure of
personality consists of id, ego, and superego. According to Engel, Miniard and
Blackwell (1994:434) the id is the source of psychic energy and seeks immediate
gratification for desires, biological and instinctual needs. Applying the id to a
generation Y consumer, no matter what the consequences, young people would see a
mobile phone and would absolutely have to have it in order to fulfil their wishes.
The ego mediates the hedonistic demands of the id and the moralistic prohibitions of
the superego. Logical and reasonable arguments would form part of the ego such as:
is this particular phone worth the money.
The superego represents societal or personal norms and services as an ethical
constraint on behaviour (Engel et al., 1994:434).
3.4.2.5.2 Socio-Psychological theory
Socio-psychological theory posits that the individual and society are mutually
dependent where the individual tries to meet the needs of society and society in turn,
helps the individual with his needs. One of the few socio-psychological personality
theories is that of Horney where individuals are placed in three categories: compliant,
aggressive and detached.
Compliant people want to receive love and guidance hence why they usually rely on
other people. Aggressive people are motivated by achievement, status and power.
Detached people are independent and usually prefer to separate themselves from
others.
3.4.2.5.3 Trait-Factor theory
Unlike the other two personality theories discussed above, trait-factor theory is a
quantitative approach to personality where each different trait can be considered as an
individual difference variable.
139
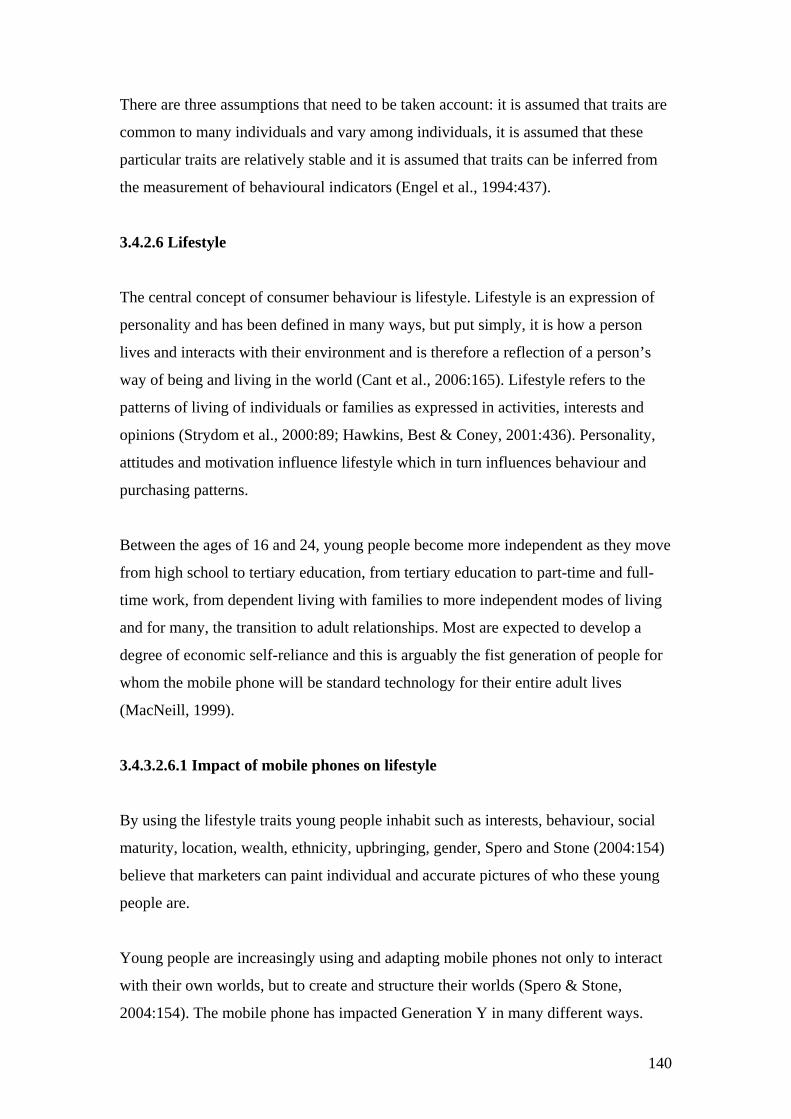
There are three assumptions that need to be taken account: it is assumed that traits are
common to many individuals and vary among individuals, it is assumed that these
particular traits are relatively stable and it is assumed that traits can be inferred from
the measurement of behavioural indicators (Engel et al., 1994:437).
3.4.2.6 Lifestyle
The central concept of consumer behaviour is lifestyle. Lifestyle is an expression of
personality and has been defined in many ways, but put simply, it is how a person
lives and interacts with their environment and is therefore a reflection of a person’s
way of being and living in the world (Cant et al., 2006:165). Lifestyle refers to the
patterns of living of individuals or families as expressed in activities, interests and
opinions (Strydom et al., 2000:89; Hawkins, Best & Coney, 2001:436). Personality,
attitudes and motivation influence lifestyle which in turn influences behaviour and
purchasing patterns.
Between the ages of 16 and 24, young people become more independent as they move
from high school to tertiary education, from tertiary education to part-time and full-
time work, from dependent living with families to more independent modes of living
and for many, the transition to adult relationships. Most are expected to develop a
degree of economic self-reliance and this is arguably the fist generation of people for
whom the mobile phone will be standard technology for their entire adult lives
(MacNeill, 1999).
3.4.3.2.6.1 Impact of mobile phones on lifestyle
By using the lifestyle traits young people inhabit such as interests, behaviour, social
maturity, location, wealth, ethnicity, upbringing, gender, Spero and Stone (2004:154)
believe that marketers can paint individual and accurate pictures of who these young
people are.
Young people are increasingly using and adapting mobile phones not only to interact
with their own worlds, but to create and structure their worlds (Spero & Stone,
2004:154). The mobile phone has impacted Generation Y in many different ways.
140
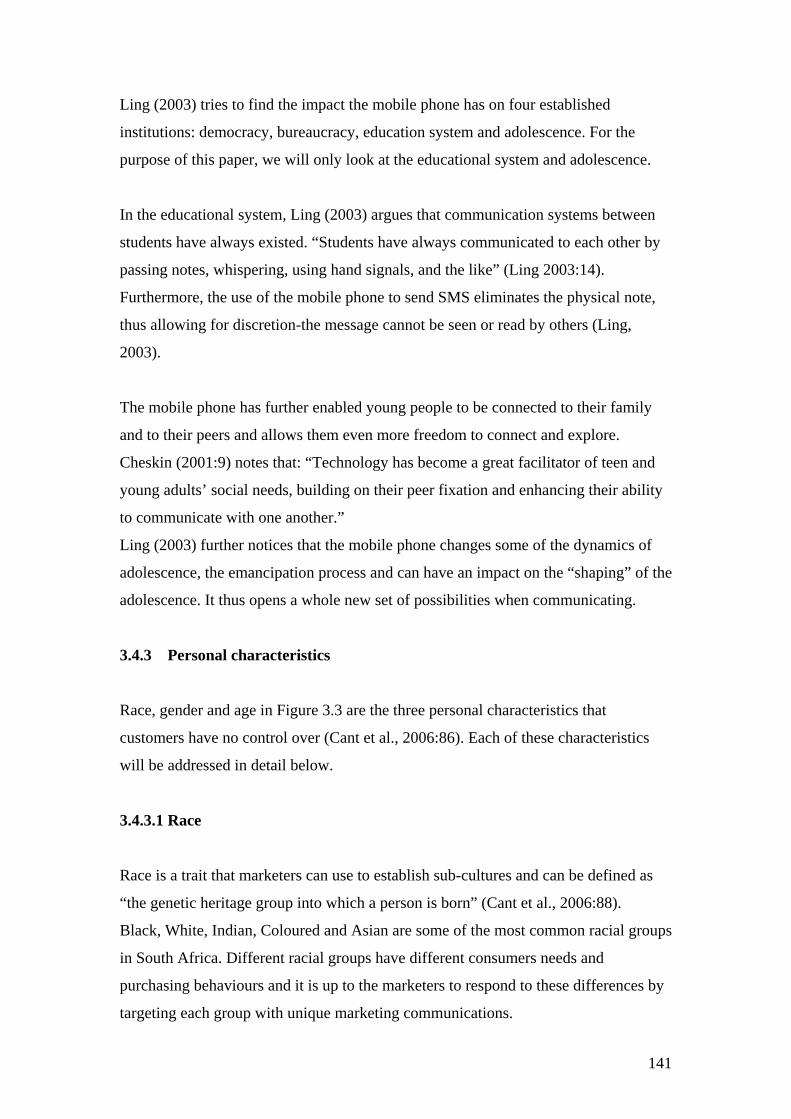
Ling (2003) tries to find the impact the mobile phone has on four established
institutions: democracy, bureaucracy, education system and adolescence. For the
purpose of this paper, we will only look at the educational system and adolescence.
In the educational system, Ling (2003) argues that communication systems between
students have always existed. “Students have always communicated to each other by
passing notes, whispering, using hand signals, and the like” (Ling 2003:14).
Furthermore, the use of the mobile phone to send SMS eliminates the physical note,
thus allowing for discretion-the message cannot be seen or read by others (Ling,
2003).
The mobile phone has further enabled young people to be connected to their family
and to their peers and allows them even more freedom to connect and explore.
Cheskin (2001:9) notes that: “Technology has become a great facilitator of teen and
young adults’ social needs, building on their peer fixation and enhancing their ability
to communicate with one another.”
Ling (2003) further notices that the mobile phone changes some of the dynamics of
adolescence, the emancipation process and can have an impact on the “shaping” of the
adolescence. It thus opens a whole new set of possibilities when communicating.
3.4.3 Personal characteristics
Race, gender and age in Figure 3.3 are the three personal characteristics that
customers have no control over (Cant et al., 2006:86). Each of these characteristics
will be addressed in detail below.
3.4.3.1 Race
Race is a trait that marketers can use to establish sub-cultures and can be defined as
“the genetic heritage group into which a person is born” (Cant et al., 2006:88).
Black, White, Indian, Coloured and Asian are some of the most common racial groups
in South Africa. Different racial groups have different consumers needs and
purchasing behaviours and it is up to the marketers to respond to these differences by
targeting each group with unique marketing communications.
141
3.4.3.2 Gender
Gender, just like race discussed above, will also impact on consumers’ values and
preferences. Gender will thus most likely affect purchasing patterns. Studies
compared loyalty patterns of men and women and found significant differences (Cant
et al., 2006:94):
• Men were more loyal to domestic or local retailers than women
• Women were more responsive to international retailers and were a more attractive
segment for the retailers entering a country
The South African population statistics by province, population group and gender was
given in Chapter 2, Section 2.4.1.1.
There are bound to be differences between men and women with regard to mobile
phone usage. These cross-gender comparisons will be investigated in the survey (See
Chapter 5)
3.4.3.3 Age
Age is one, if not the most important factor that affects consumer behaviour. As
discussed earlier in sub-cultures (Section 3.4.1.5 in Chapter 3), age groups can be
divided into age cohorts that will allow a marketer to predict an age group’s future
attitudes, values and behaviours. Different generations are most likely to exhibit
different consumer behaviours from the preceding one (Cant et al., 2006:100). Age
was found to be a major differentiator in the way South Africans use their mobile
phones, particularly in the choice of prepaid or contract (Mobility, 2005). In the 16-19
age group, it was found that 8% were on contract and 90% were on prepaid. This
figure doubles to 17% on contract in the 20-24 age group, with 78% on prepaid.
Contract users rise steadily through the age groups until it peaks in the 46-49 age
group, at 40%, then declines again (Mobility, 2005). Life stages and life planes of
South African consumers was discussed in detail in Chapter 2, Section 2.4.1.3.
142
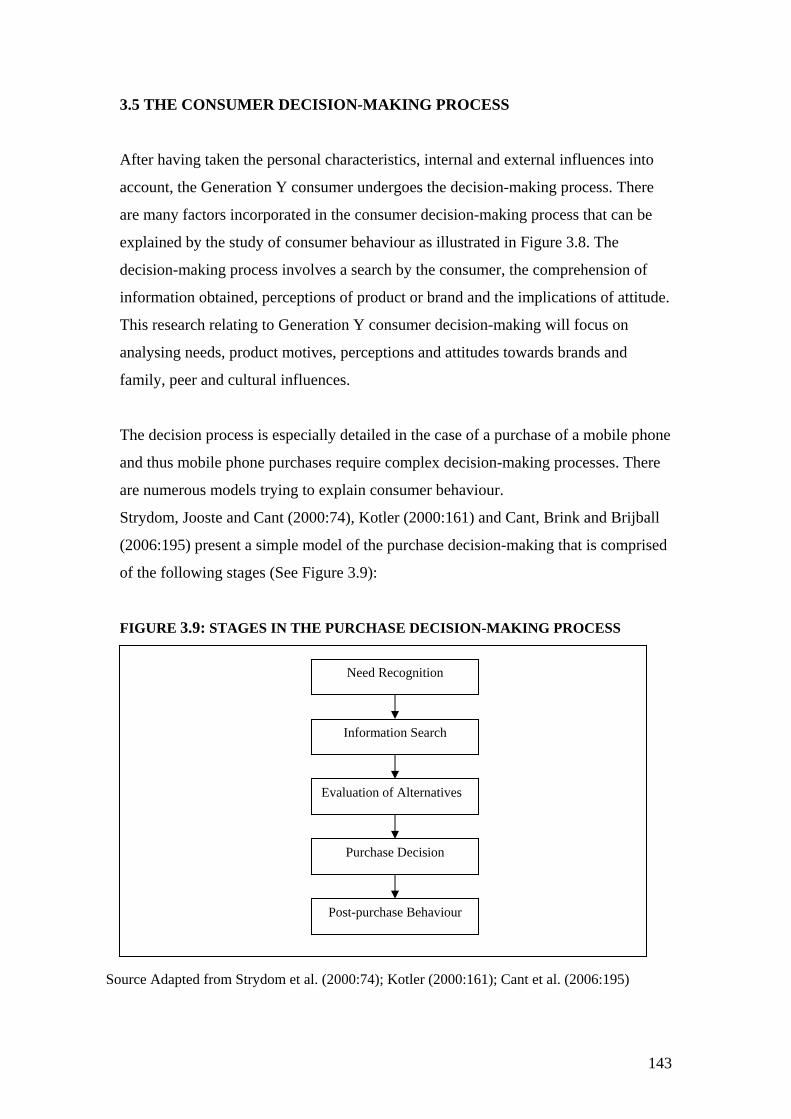
3.5 THE CONSUMER DECISION-MAKING PROCESS
After having taken the personal characteristics, internal and external influences into
account, the Generation Y consumer undergoes the decision-making process. There
are many factors incorporated in the consumer decision-making process that can be
explained by the study of consumer behaviour as illustrated in Figure 3.8. The
decision-making process involves a search by the consumer, the comprehension of
information obtained, perceptions of product or brand and the implications of attitude.
This research relating to Generation Y consumer decision-making will focus on
analysing needs, product motives, perceptions and attitudes towards brands and
family, peer and cultural influences.
The decision process is especially detailed in the case of a purchase of a mobile phone
and thus mobile phone purchases require complex decision-making processes. There
are numerous models trying to explain consumer behaviour.
Strydom, Jooste and Cant (2000:74), Kotler (2000:161) and Cant, Brink and Brijball
(2006:195) present a simple model of the purchase decision-making that is comprised
of the following stages (See Figure 3.9):
FIGURE 3.9: STAGES IN THE PURCHASE DECISION-MAKING PROCESS
Need Recognition
Information Search
Evaluation of Alternatives
Purchase Decision
Post-purchase Behaviour
Source Adapted from Strydom et al. (2000:74); Kotler (2000:161); Cant et al. (2006:195)
143
The decision making process consists of a sequence of five steps as illustrated in
Figure 3.9 (Kotler, 2000:179). This model implies that consumers pass through all of
these five stages in buying a product:
• Need recognition: Individuals recognise that a need has to be satisfied
• Information search: They look for information about possible solutions in the
external environment, or use the information stored in memory
• Evaluation of alternatives: They evaluate or assess the various alternatives, using
the information they have at hand to come to a decision
• Purchase decision: They buy the product they have chosen
• Post-purchase behaviour: They use the product and evaluate their satisfaction
levels with it
Each stage in the decision-making process should be seen as a whole and not as
separate (Kotler, 2000). Each step will be discussed in more detail below.
3.5.1 Step 1: Need recognition
The initial stage in any decision-making process is need recognition, also sometimes
called the problem recognition or problem awareness stage (See Figure 3.9). This is
where the Generation Y consumer becomes aware of a want that needs to be satisfied.
Need recognition can thus be further defined as the perception of difference between
the desired state of affairs and the actual situation sufficient to activate the decision
process (Strydom et al., 2000:75). The recognition may come from an internal
stimulus (such as hunger) or it may come from an external stimuli (such as an
advertisement). Either way, marketers need to make consumers aware of unsatisfied
or even dormant needs by using appropriate marketing messages (Strydom et al.,
2000:75). Three factors that affect need recognition are information stored in
memory, individual differences and environmental influences. Need recognition can
take place at every stage of the decision-making process as seen in Table 3.7.
144
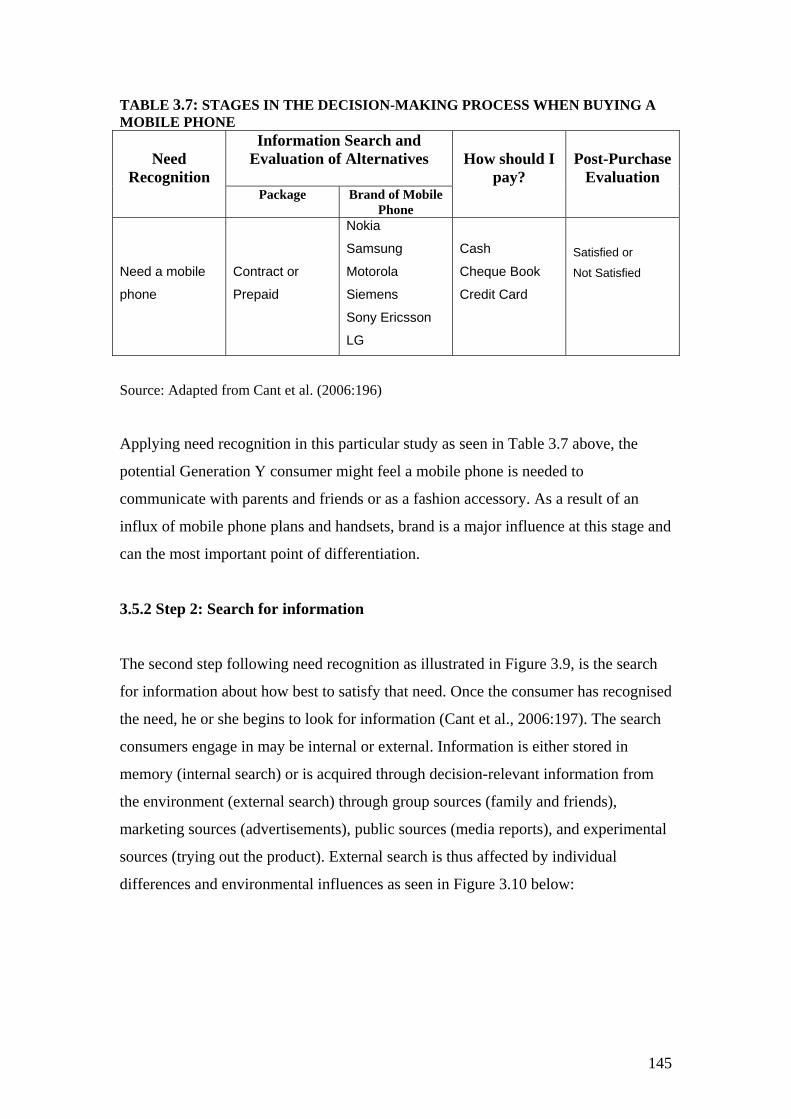
TABLE 3.7: STAGES IN THE DECISION-MAKING PROCESS WHEN BUYING A MOBILE PHONE
Information Search and Evaluation of Alternatives
Need
Recognition Package Brand of Mobile
Phone
How should I
pay?
Post-Purchase
Evaluation
Need a mobile
phone
Contract or
Prepaid
Nokia
Samsung
Motorola
Siemens
Sony Ericsson
LG
Cash
Cheque Book
Credit Card
Satisfied or
Not Satisfied
Source: Adapted from Cant et al. (2006:196)
Applying need recognition in this particular study as seen in Table 3.7 above, the
potential Generation Y consumer might feel a mobile phone is needed to
communicate with parents and friends or as a fashion accessory. As a result of an
influx of mobile phone plans and handsets, brand is a major influence at this stage and
can the most important point of differentiation.
3.5.2 Step 2: Search for information
The second step following need recognition as illustrated in Figure 3.9, is the search
for information about how best to satisfy that need. Once the consumer has recognised
the need, he or she begins to look for information (Cant et al., 2006:197). The search
consumers engage in may be internal or external. Information is either stored in
memory (internal search) or is acquired through decision-relevant information from
the environment (external search) through group sources (family and friends),
marketing sources (advertisements), public sources (media reports), and experimental
sources (trying out the product). External search is thus affected by individual
differences and environmental influences as seen in Figure 3.10 below:
145
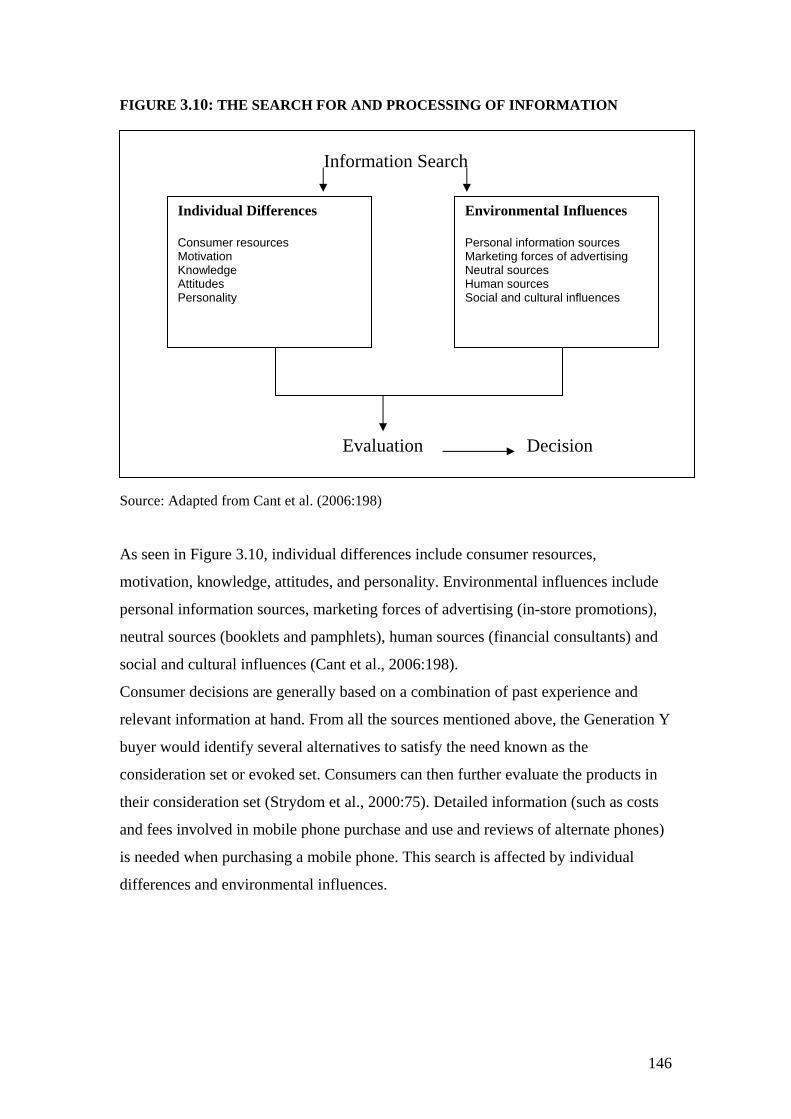
FIGURE 3.10: THE SEARCH FOR AND PROCESSING OF INFORMATION
Information Search
Individual Differences Consumer resources Motivation Knowledge Attitudes Personality
Environmental Influences Personal information sources Marketing forces of advertising Neutral sources Human sources Social and cultural influences
Evaluation Decision
Source: Adapted from Cant et al. (2006:198)
As seen in Figure 3.10, individual differences include consumer resources,
motivation, knowledge, attitudes, and personality. Environmental influences include
personal information sources, marketing forces of advertising (in-store promotions),
neutral sources (booklets and pamphlets), human sources (financial consultants) and
social and cultural influences (Cant et al., 2006:198).
Consumer decisions are generally based on a combination of past experience and
relevant information at hand. From all the sources mentioned above, the Generation Y
buyer would identify several alternatives to satisfy the need known as the
consideration set or evoked set. Consumers can then further evaluate the products in
their consideration set (Strydom et al., 2000:75). Detailed information (such as costs
and fees involved in mobile phone purchase and use and reviews of alternate phones)
is needed when purchasing a mobile phone. This search is affected by individual
differences and environmental influences.
146
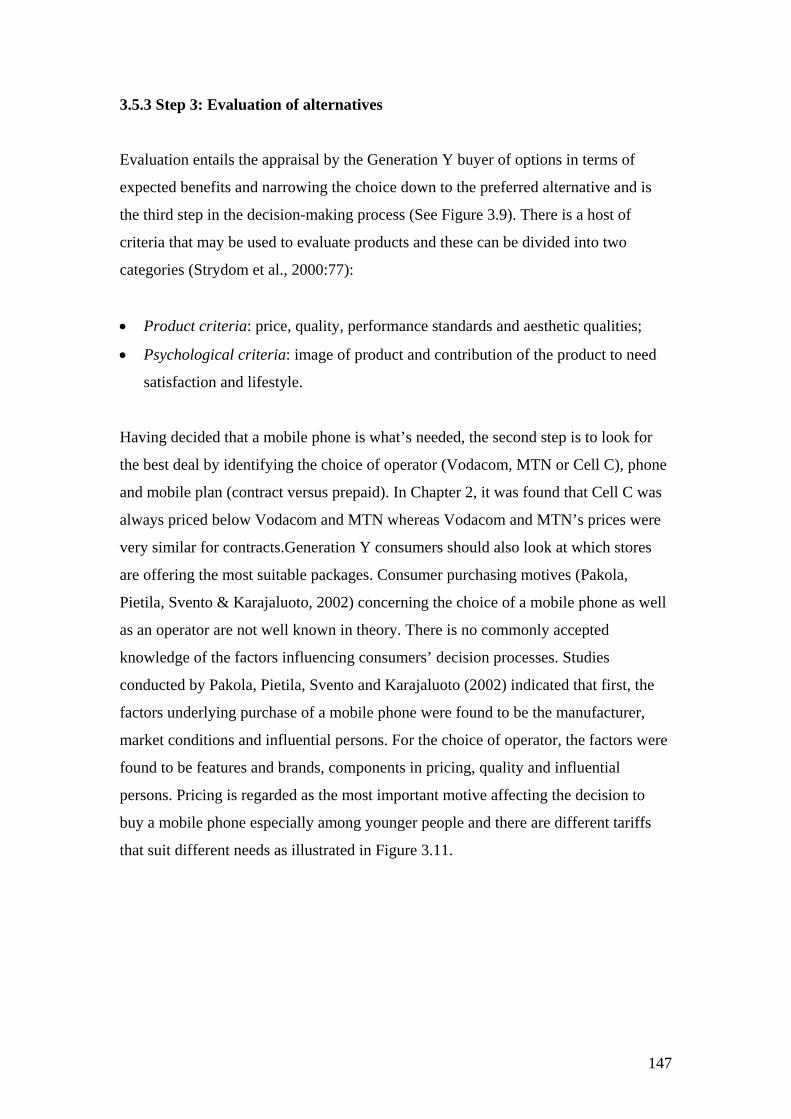
3.5.3 Step 3: Evaluation of alternatives
Evaluation entails the appraisal by the Generation Y buyer of options in terms of
expected benefits and narrowing the choice down to the preferred alternative and is
the third step in the decision-making process (See Figure 3.9). There is a host of
criteria that may be used to evaluate products and these can be divided into two
categories (Strydom et al., 2000:77):
• Product criteria: price, quality, performance standards and aesthetic qualities;
• Psychological criteria: image of product and contribution of the product to need
satisfaction and lifestyle.
Having decided that a mobile phone is what’s needed, the second step is to look for
the best deal by identifying the choice of operator (Vodacom, MTN or Cell C), phone
and mobile plan (contract versus prepaid). In Chapter 2, it was found that Cell C was
always priced below Vodacom and MTN whereas Vodacom and MTN’s prices were
very similar for contracts.Generation Y consumers should also look at which stores
are offering the most suitable packages. Consumer purchasing motives (Pakola,
Pietila, Svento & Karajaluoto, 2002) concerning the choice of a mobile phone as well
as an operator are not well known in theory. There is no commonly accepted
knowledge of the factors influencing consumers’ decision processes. Studies
conducted by Pakola, Pietila, Svento and Karajaluoto (2002) indicated that first, the
factors underlying purchase of a mobile phone were found to be the manufacturer,
market conditions and influential persons. For the choice of operator, the factors were
found to be features and brands, components in pricing, quality and influential
persons. Pricing is regarded as the most important motive affecting the decision to
buy a mobile phone especially among younger people and there are different tariffs
that suit different needs as illustrated in Figure 3.11.
147
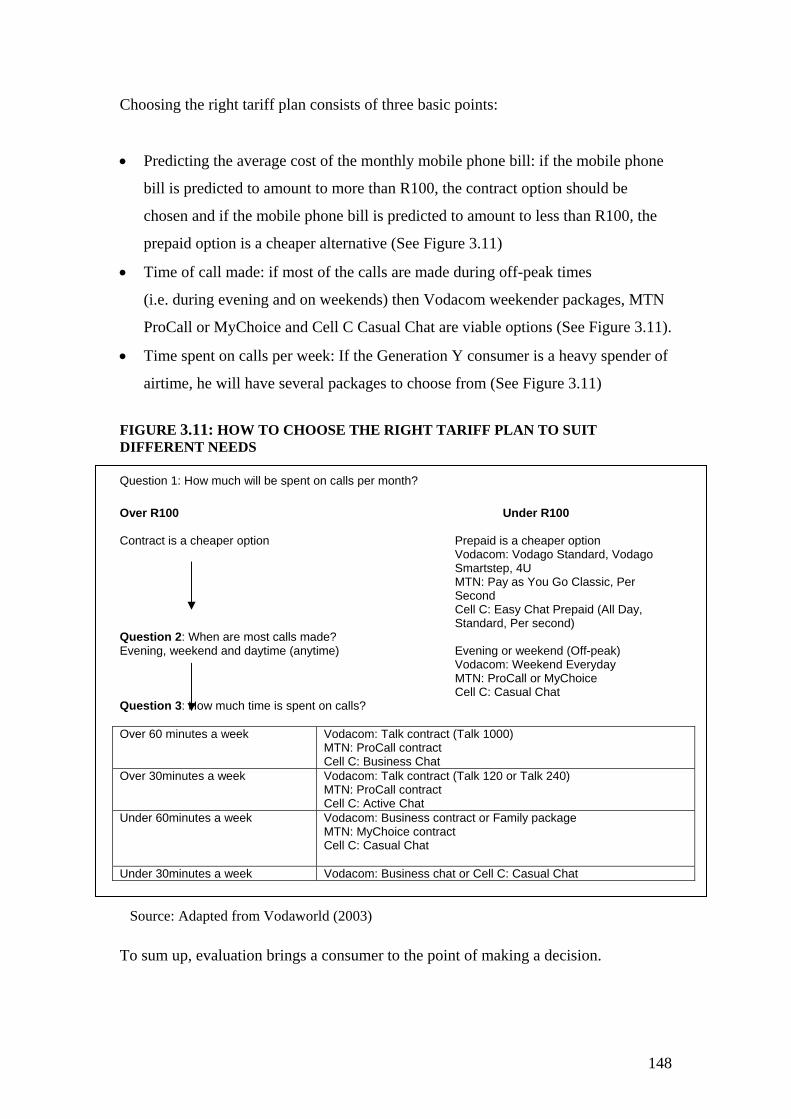
Choosing the right tariff plan consists of three basic points:
• Predicting the average cost of the monthly mobile phone bill: if the mobile phone
bill is predicted to amount to more than R100, the contract option should be
chosen and if the mobile phone bill is predicted to amount to less than R100, the
prepaid option is a cheaper alternative (See Figure 3.11)
• Time of call made: if most of the calls are made during off-peak times
(i.e. during evening and on weekends) then Vodacom weekender packages, MTN
ProCall or MyChoice and Cell C Casual Chat are viable options (See Figure 3.11).
• Time spent on calls per week: If the Generation Y consumer is a heavy spender of
airtime, he will have several packages to choose from (See Figure 3.11)
FIGURE 3.11: HOW TO CHOOSE THE RIGHT TARIFF PLAN TO SUIT DIFFERENT NEEDS
Question 1: How much will be spent on calls per month?
Over R100 Under R100 Contract is a cheaper option Prepaid is a cheaper option
Vodacom: Vodago Standard, Vodago Smartstep, 4U MTN: Pay as You Go Classic, Per Second Cell C: Easy Chat Prepaid (All Day, Standard, Per second)
Question 2: When are most calls made? Evening, weekend and daytime (anytime) Evening or weekend (Off-peak)
Vodacom: Weekend Everyday MTN: ProCall or MyChoice Cell C: Casual Chat Question 3: How much time is spent on calls? Over 60 minutes a week
Vodacom: Talk contract (Talk 1000) MTN: ProCall contract Cell C: Business Chat
Over 30minutes a week Vodacom: Talk contract (Talk 120 or Talk 240) MTN: ProCall contract Cell C: Active Chat
Under 60minutes a week
Vodacom: Business contract or Family package MTN: MyChoice contract Cell C: Casual Chat
Under 30minutes a week Vodacom: Business chat or Cell C: Casual Chat
Source: Adapted from Vodaworld (2003)
To sum up, evaluation brings a consumer to the point of making a decision.
148
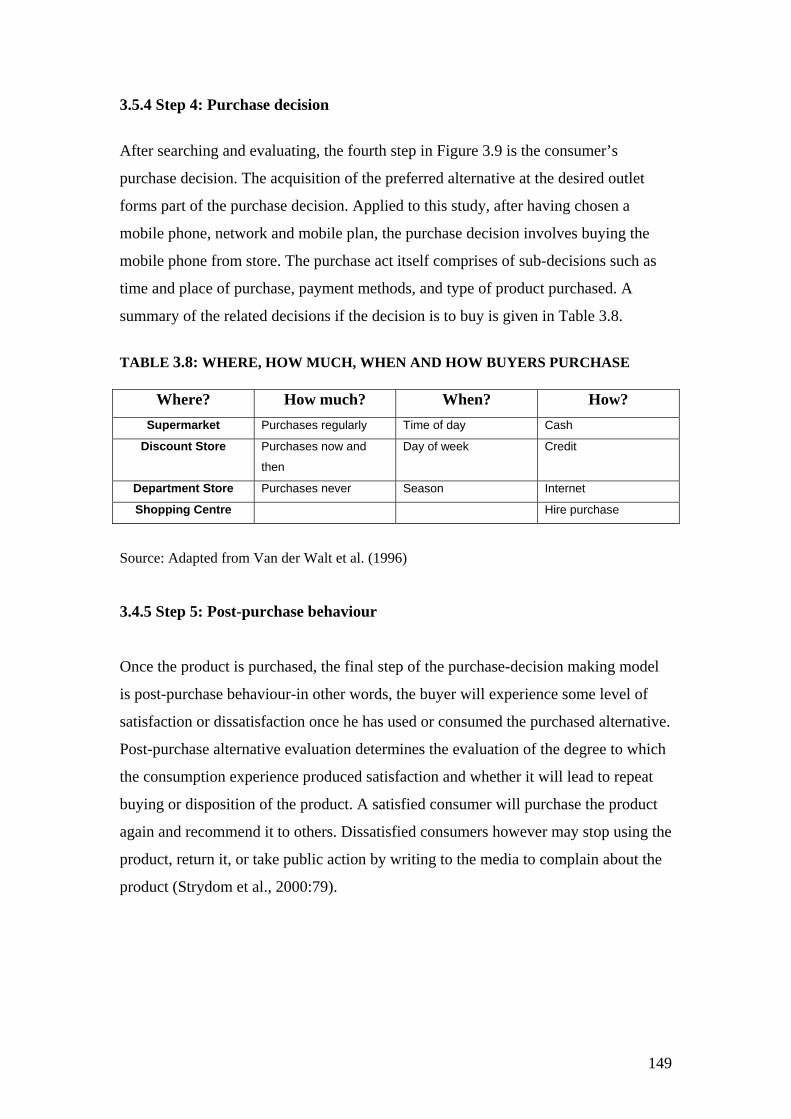
3.5.4 Step 4: Purchase decision
After searching and evaluating, the fourth step in Figure 3.9 is the consumer’s
purchase decision. The acquisition of the preferred alternative at the desired outlet
forms part of the purchase decision. Applied to this study, after having chosen a
mobile phone, network and mobile plan, the purchase decision involves buying the
mobile phone from store. The purchase act itself comprises of sub-decisions such as
time and place of purchase, payment methods, and type of product purchased. A
summary of the related decisions if the decision is to buy is given in Table 3.8.
TABLE 3.8: WHERE, HOW MUCH, WHEN AND HOW BUYERS PURCHASE
Where? How much? When? How? Supermarket Purchases regularly Time of day Cash
Discount Store Purchases now and
then
Day of week Credit
Department Store Purchases never Season Internet
Shopping Centre Hire purchase
Source: Adapted from Van der Walt et al. (1996)
3.4.5 Step 5: Post-purchase behaviour
Once the product is purchased, the final step of the purchase-decision making model
is post-purchase behaviour-in other words, the buyer will experience some level of
satisfaction or dissatisfaction once he has used or consumed the purchased alternative.
Post-purchase alternative evaluation determines the evaluation of the degree to which
the consumption experience produced satisfaction and whether it will lead to repeat
buying or disposition of the product. A satisfied consumer will purchase the product
again and recommend it to others. Dissatisfied consumers however may stop using the
product, return it, or take public action by writing to the media to complain about the
product (Strydom et al., 2000:79).
149
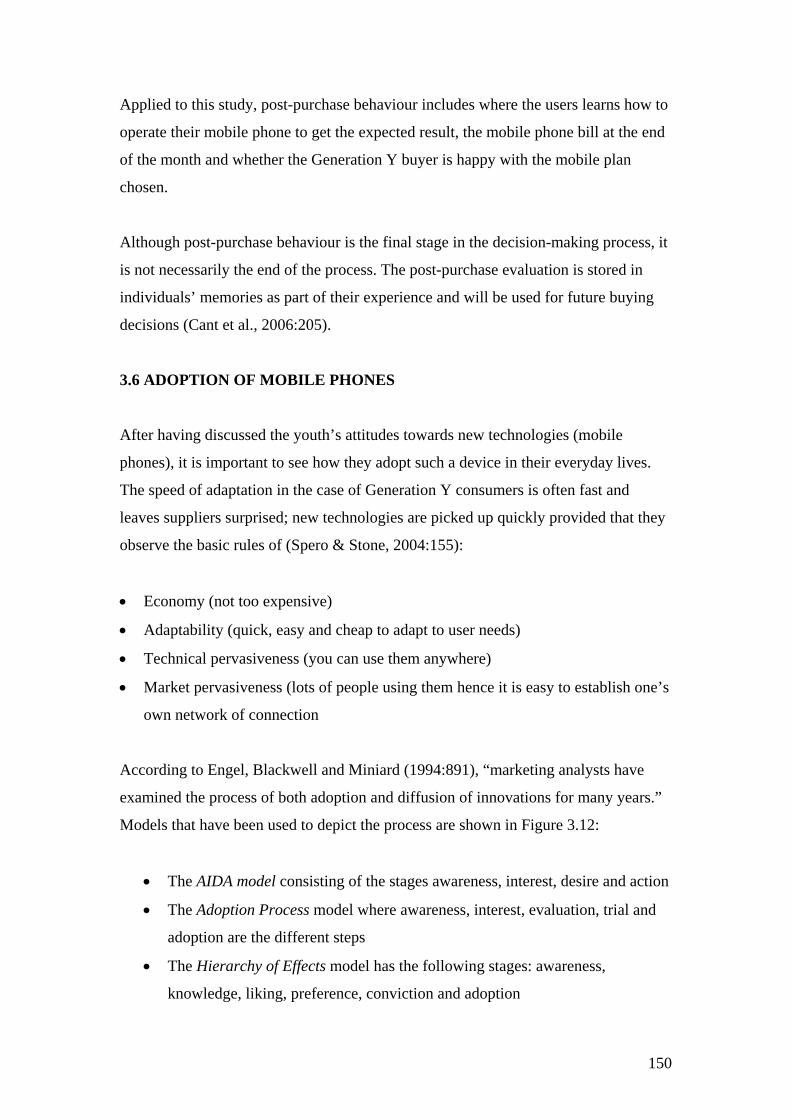
Applied to this study, post-purchase behaviour includes where the users learns how to
operate their mobile phone to get the expected result, the mobile phone bill at the end
of the month and whether the Generation Y buyer is happy with the mobile plan
chosen.
Although post-purchase behaviour is the final stage in the decision-making process, it
is not necessarily the end of the process. The post-purchase evaluation is stored in
individuals’ memories as part of their experience and will be used for future buying
decisions (Cant et al., 2006:205).
3.6 ADOPTION OF MOBILE PHONES
After having discussed the youth’s attitudes towards new technologies (mobile
phones), it is important to see how they adopt such a device in their everyday lives.
The speed of adaptation in the case of Generation Y consumers is often fast and
leaves suppliers surprised; new technologies are picked up quickly provided that they
observe the basic rules of (Spero & Stone, 2004:155):
• Economy (not too expensive)
• Adaptability (quick, easy and cheap to adapt to user needs)
• Technical pervasiveness (you can use them anywhere)
• Market pervasiveness (lots of people using them hence it is easy to establish one’s
own network of connection
According to Engel, Blackwell and Miniard (1994:891), “marketing analysts have
examined the process of both adoption and diffusion of innovations for many years.”
Models that have been used to depict the process are shown in Figure 3.12:
• The AIDA model consisting of the stages awareness, interest, desire and action
• The Adoption Process model where awareness, interest, evaluation, trial and
adoption are the different steps
• The Hierarchy of Effects model has the following stages: awareness,
knowledge, liking, preference, conviction and adoption
150
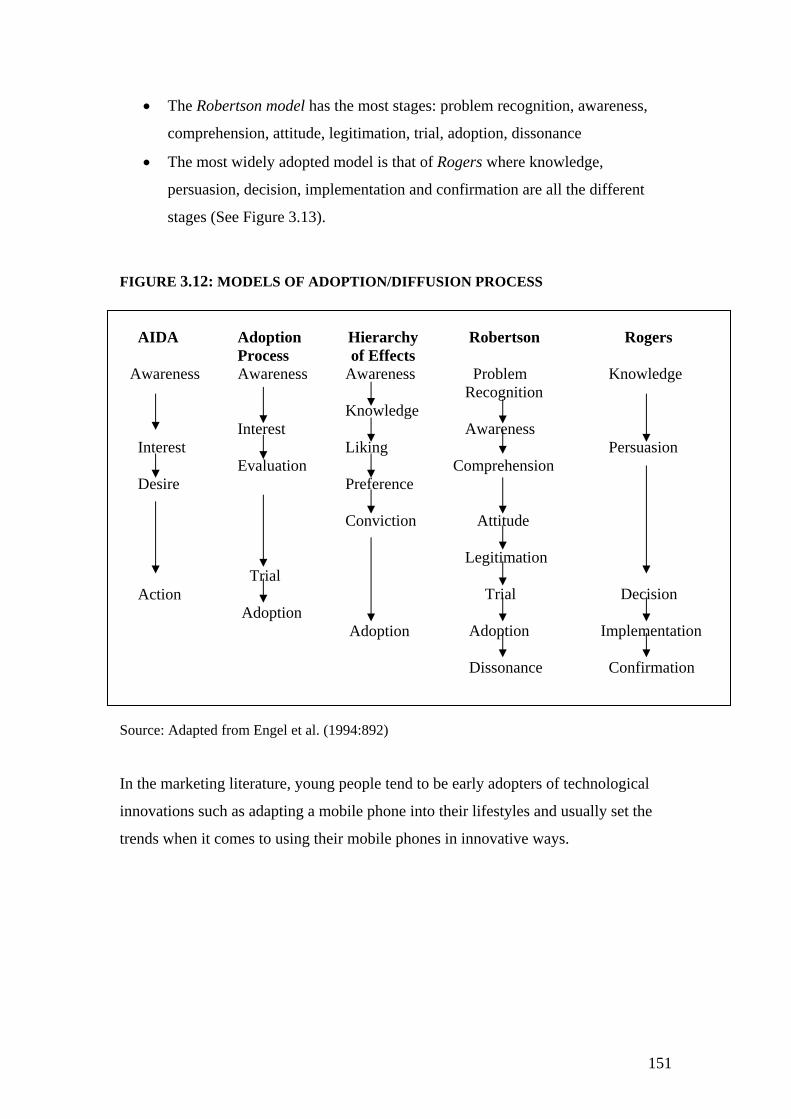
• The Robertson model has the most stages: problem recognition, awareness,
comprehension, attitude, legitimation, trial, adoption, dissonance
• The most widely adopted model is that of Rogers where knowledge,
persuasion, decision, implementation and confirmation are all the different
stages (See Figure 3.13).
FIGURE 3.12: MODELS OF ADOPTION/DIFFUSION PROCESS
AIDA Awareness Interest Desire Action
Adoption Process Awareness Interest Evaluation Trial Adoption
Hierarchy of Effects
Awareness Knowledge Liking Preference Conviction Adoption
Robertson Problem Recognition Awareness Comprehension Attitude Legitimation Trial Adoption Dissonance
Rogers Knowledge Persuasion Decision Implementation Confirmation
Source: Adapted from Engel et al. (1994:892)
In the marketing literature, young people tend to be early adopters of technological
innovations such as adapting a mobile phone into their lifestyles and usually set the
trends when it comes to using their mobile phones in innovative ways.
151
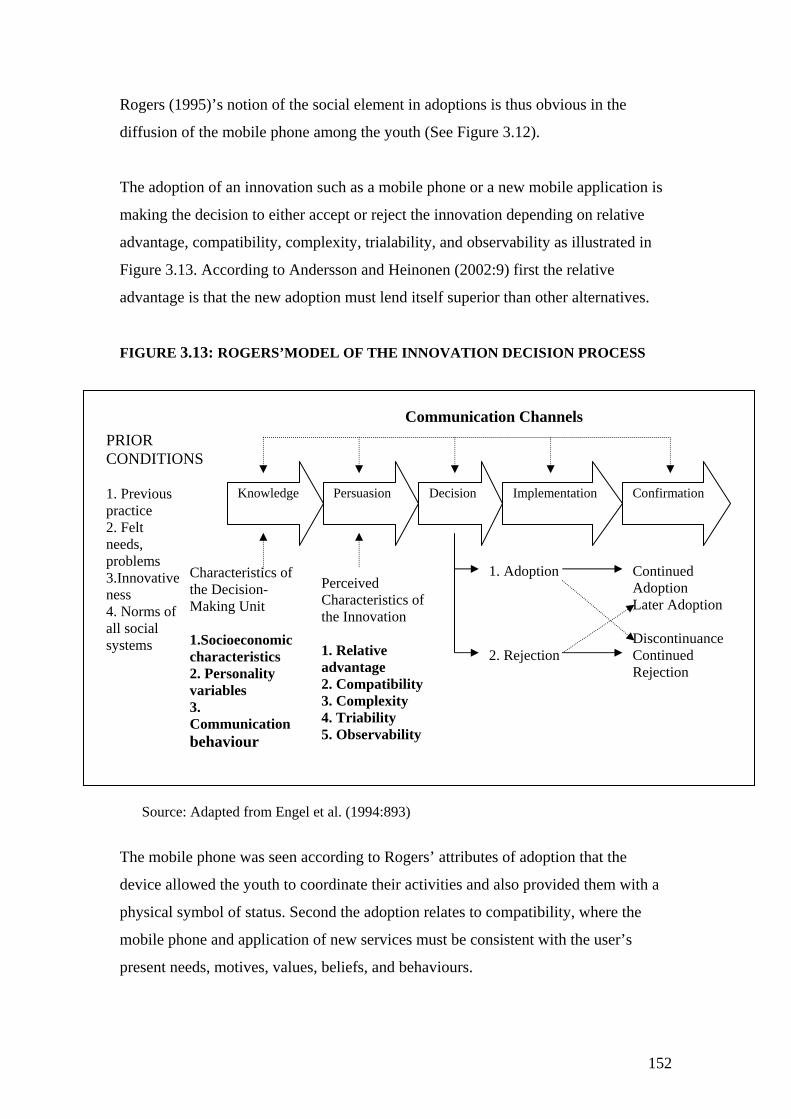
Rogers (1995)’s notion of the social element in adoptions is thus obvious in the
diffusion of the mobile phone among the youth (See Figure 3.12).
The adoption of an innovation such as a mobile phone or a new mobile application is
making the decision to either accept or reject the innovation depending on relative
advantage, compatibility, complexity, trialability, and observability as illustrated in
Figure 3.13. According to Andersson and Heinonen (2002:9) first the relative
advantage is that the new adoption must lend itself superior than other alternatives.
FIGURE 3.13: ROGERS’MODEL OF THE INNOVATION DECISION PROCESS
Communication Channels
1. Previous practice 2. Felt needs, problems 3.Innovativeness 4. Norms of all social systems
PRIOR CONDITIONS
Knowledge Confirmation Persuasion
Perceived Characteristics of the Innovation 1. Relative advantage 2. Compatibility 3. Complexity 4. Triability 5. Observability
Characteristics of the Decision-Making Unit 1.Socioeconomic characteristics 2. Personality variables 3. Communication behaviour
Decision
1. Adoption 2. Rejection
Continued Adoption Later Adoption Discontinuance Continued Rejection
Implementation
Source: Adapted from Engel et al. (1994:893)
The mobile phone was seen according to Rogers’ attributes of adoption that the
device allowed the youth to coordinate their activities and also provided them with a
physical symbol of status. Second the adoption relates to compatibility, where the
mobile phone and application of new services must be consistent with the user’s
present needs, motives, values, beliefs, and behaviours.
152
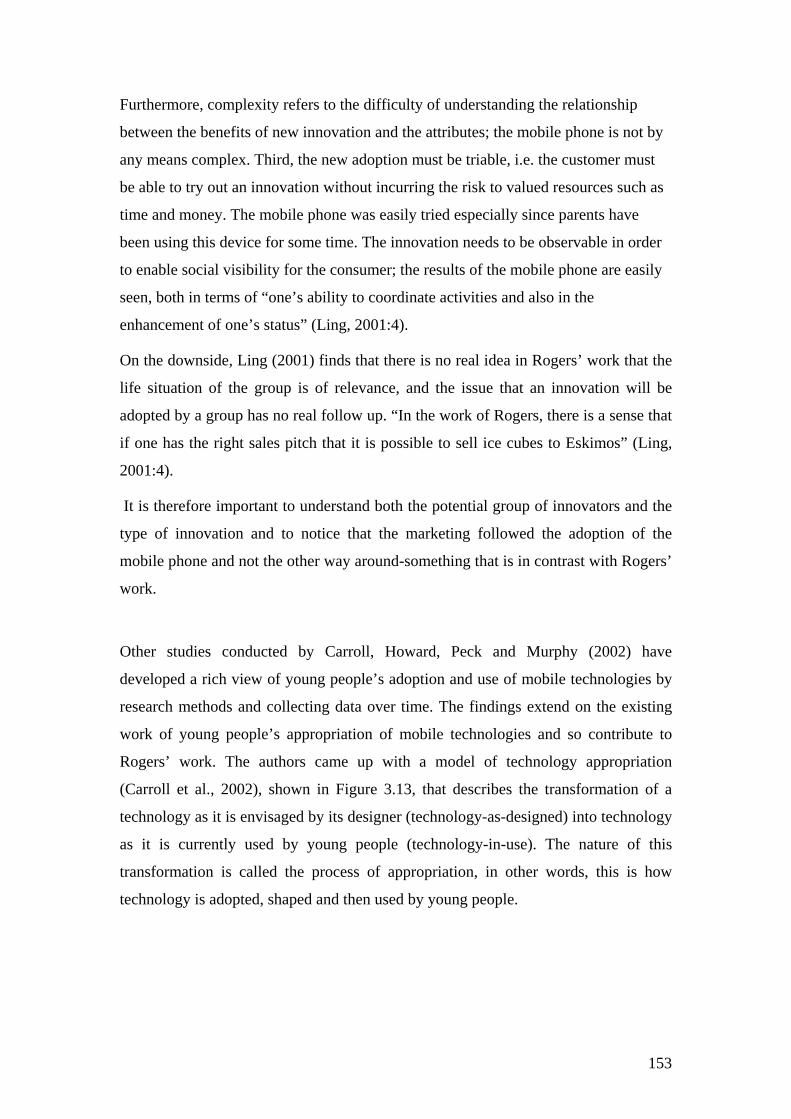
Furthermore, complexity refers to the difficulty of understanding the relationship
between the benefits of new innovation and the attributes; the mobile phone is not by
any means complex. Third, the new adoption must be triable, i.e. the customer must
be able to try out an innovation without incurring the risk to valued resources such as
time and money. The mobile phone was easily tried especially since parents have
been using this device for some time. The innovation needs to be observable in order
to enable social visibility for the consumer; the results of the mobile phone are easily
seen, both in terms of “one’s ability to coordinate activities and also in the
enhancement of one’s status” (Ling, 2001:4).
On the downside, Ling (2001) finds that there is no real idea in Rogers’ work that the
life situation of the group is of relevance, and the issue that an innovation will be
adopted by a group has no real follow up. “In the work of Rogers, there is a sense that
if one has the right sales pitch that it is possible to sell ice cubes to Eskimos” (Ling,
2001:4).
It is therefore important to understand both the potential group of innovators and the
type of innovation and to notice that the marketing followed the adoption of the
mobile phone and not the other way around-something that is in contrast with Rogers’
work.
Other studies conducted by Carroll, Howard, Peck and Murphy (2002) have
developed a rich view of young people’s adoption and use of mobile technologies by
research methods and collecting data over time. The findings extend on the existing
work of young people’s appropriation of mobile technologies and so contribute to
Rogers’ work. The authors came up with a model of technology appropriation
(Carroll et al., 2002), shown in Figure 3.13, that describes the transformation of a
technology as it is envisaged by its designer (technology-as-designed) into technology
as it is currently used by young people (technology-in-use). The nature of this
transformation is called the process of appropriation, in other words, this is how
technology is adopted, shaped and then used by young people.
153
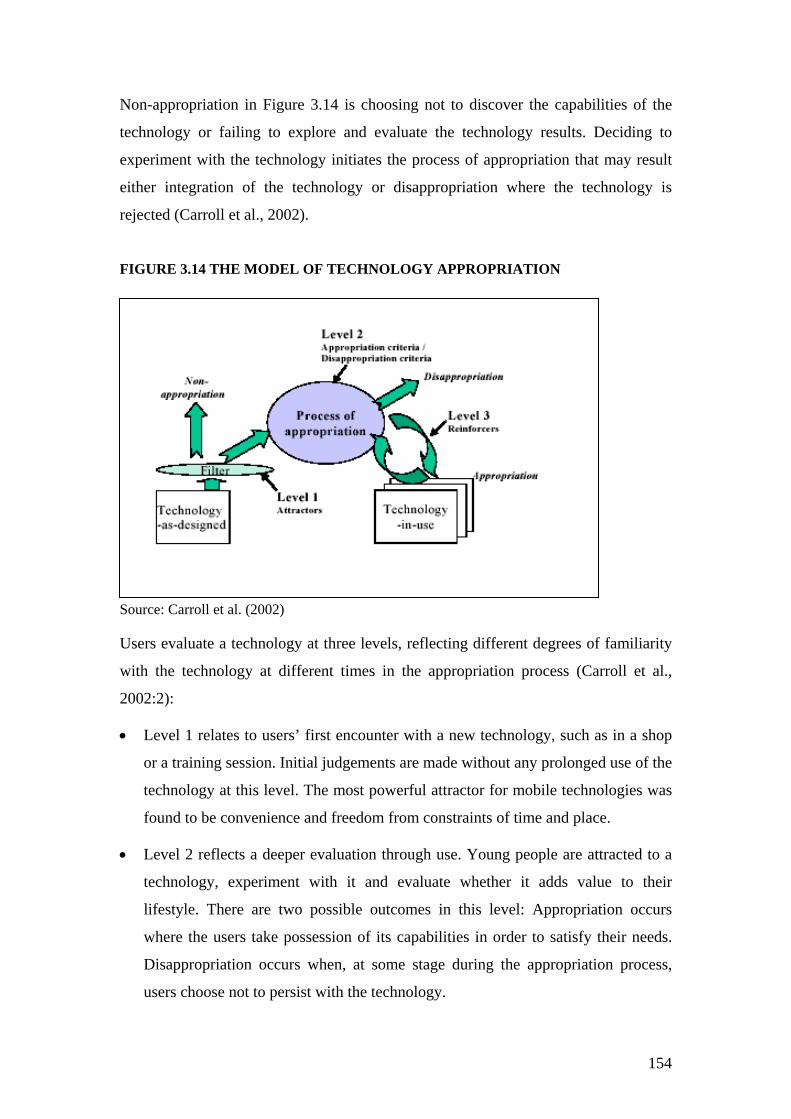
Non-appropriation in Figure 3.14 is choosing not to discover the capabilities of the
technology or failing to explore and evaluate the technology results. Deciding to
experiment with the technology initiates the process of appropriation that may result
either integration of the technology or disappropriation where the technology is
rejected (Carroll et al., 2002).
FIGURE 3.14 THE MODEL OF TECHNOLOGY APPROPRIATION
Source: Carroll et al. (2002)
Users evaluate a technology at three levels, reflecting different degrees of familiarity
with the technology at different times in the appropriation process (Carroll et al.,
2002:2):
• Level 1 relates to users’ first encounter with a new technology, such as in a shop
or a training session. Initial judgements are made without any prolonged use of the
technology at this level. The most powerful attractor for mobile technologies was
found to be convenience and freedom from constraints of time and place.
• Level 2 reflects a deeper evaluation through use. Young people are attracted to a
technology, experiment with it and evaluate whether it adds value to their
lifestyle. There are two possible outcomes in this level: Appropriation occurs
where the users take possession of its capabilities in order to satisfy their needs.
Disappropriation occurs when, at some stage during the appropriation process,
users choose not to persist with the technology.
154
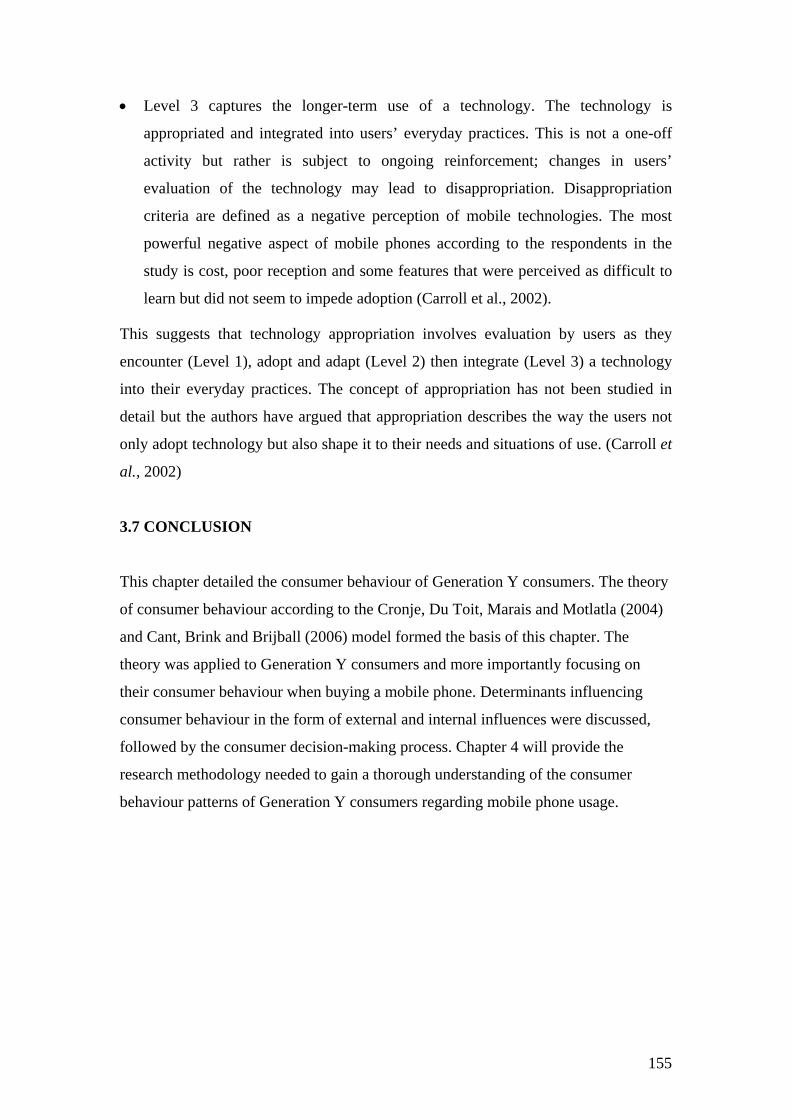
• Level 3 captures the longer-term use of a technology. The technology is
appropriated and integrated into users’ everyday practices. This is not a one-off
activity but rather is subject to ongoing reinforcement; changes in users’
evaluation of the technology may lead to disappropriation. Disappropriation
criteria are defined as a negative perception of mobile technologies. The most
powerful negative aspect of mobile phones according to the respondents in the
study is cost, poor reception and some features that were perceived as difficult to
learn but did not seem to impede adoption (Carroll et al., 2002).
This suggests that technology appropriation involves evaluation by users as they
encounter (Level 1), adopt and adapt (Level 2) then integrate (Level 3) a technology
into their everyday practices. The concept of appropriation has not been studied in
detail but the authors have argued that appropriation describes the way the users not
only adopt technology but also shape it to their needs and situations of use. (Carroll et
al., 2002)
3.7 CONCLUSION
This chapter detailed the consumer behaviour of Generation Y consumers. The theory
of consumer behaviour according to the Cronje, Du Toit, Marais and Motlatla (2004)
and Cant, Brink and Brijball (2006) model formed the basis of this chapter. The
theory was applied to Generation Y consumers and more importantly focusing on
their consumer behaviour when buying a mobile phone. Determinants influencing
consumer behaviour in the form of external and internal influences were discussed,
followed by the consumer decision-making process. Chapter 4 will provide the
research methodology needed to gain a thorough understanding of the consumer
behaviour patterns of Generation Y consumers regarding mobile phone usage.
155
CHAPTER FOUR
RESEARCH METHODOLOGY 4.1 INTRODUCTION
Market research comprises one of the most important facets of marketing. It plays a
crucial role in assessing information needs, and designing and implementing
successful marketing programmes in order to solve marketing problems (Malhotra,
1996:9). The American Marketing Association’s formal definition of marketing
research is “research that specifies the information required to address these issues:
designs the method for collecting information; manages and implements the data
collection process; analyses the results and communicates the findings and their
implications”. Chapter 4 describes the nature of the research methodology used in this
study and describes the practical execution of the research conducted. The
methodology and different methods of research are used to gain a thorough
understanding of the consumer behaviour patterns regarding mobile phone usage of
Generation Y students.
4.2 THE MARKETING RESEARCH PROCESS
The literature review on the marketing research process in this study includes a
combination of the following authors: Malhotra (1996); Aaker, Kumar and Day
(1998) and Strydom (2000). Malhotra (1996) was deemed to have defined the most
suitable framework for the stages of the marketing research problem.
The six steps of the marketing research process, as depicted in Figure 4.1, will be
discussed in greater detail in subsequent sections.
156
FIGURE 4.1: THE MARKETING RESEARCH PROCESS
STEP 1: PROBLEM DEFINITION
STEP 2: DEVELOPMENT OF AN APPROACH TO THE PROBLEM
STEP 3: RESEARCH DESIGN FORMULATION
STEP4: FIELDWORK OR DATA COLLECTION
STEP 5: DATA PREPARATION AND ANALYSIS
STEP 6: REPORT PREPARATION AND PRESENTATION
Source: Adapted from Malhotra (1996:25); Aaker, Kumar & Day (1998)
4.2.1 STEP 1: Problem definition
As depicted in Figure 4.1 defining the problem is the first step in any marketing
research project and is also the most important. Problem definition involves stating
the research problem and identifying its specific components (Malhotra, 1996:35).
The tasks involved in formulating the marketing research problem include discussions
with management, including the key decision makers, interviews with industry
experts and other knowledgeable individuals, analysis of secondary data, and
qualitative research. These tasks help the researcher understand the background to the
problem by analysing the environmental context of the problem.
157
Problem formulation should then result in a set of objectives and research questions.
The research objectives consist of the research question, the hypotheses, and the scope
of the research. Research questions are refined statements of the specific components
of the problem and, essentially, include questions such as What? Why? When?
Where? How? While hypotheses are possible answers to the research question, the
scope of the research defines the boundaries (Ali, 2003:295). It is only when the
marketing research problem or opportunity has been identified clearly that the
research may be designed and conducted properly.
The problem definition for this study was formulated in Chapter 1 (section 1.3). This
study attempts to explore the consumer behaviour in Gauteng regarding young
people’s mobile phone usage of the Generation Y consumer in the city of
Johannesburg. Adequate research was carried out on Generation Y by gathering
secondary information so as to increase the understanding the attitude and behaviour
of the youth towards mobile phones. This is necessary in order to come up with an
effective way to market to this group. It is important to investigate these issues
because Generation Y may, as opposed to the population at large, exhibit different
attitudes and behaviours towards, and an acceptance of a wireless device such as a
mobile phone.
4.2.2 STEP 2: Development of an approach to the research problem
As depicted in Figure 4.1 the second step in the marketing research process involves
developing an approach to the research problem. The components of such an
approach consist of objectives/theoretical framework, analytical models, research
questions, and characteristics influencing the research design. The main objective of
this study was to gain primary information regarding the use of mobile phones by
Generation Y students in the city of Johannesburg.
The research also wished to find out more information regarding, the secondary
objectives:
158
• The demographics of Generation Y students in the city of Johannesburg
• The perceptions of Generation Y regarding the competitive situation in the mobile
phone market
• The mobile phone brand awareness of Generation Y
• Further areas of study in this dynamic youth market
4.2.3 STEP 3: Research design formulation
Research design is an important step in the marketing research process and provides a
framework for conducting the market research (See Figure 4.1). This step details the
procedures which are necessary in order to obtain the required information. The
purpose of this step is to design a study that will provide answers to the research
questions and test the hypotheses. According to Malhotra (1996:25) formulating the
research design involves the following steps which will be discussed in more detail
throughout the chapter:
1) Secondary data analysis: Secondary data is data collected for purposes other than
for the problem at hand, and may be obtained from marketing journals, magazines,
industry reports, etc.
2) Qualitative research: Qualitative research is an unstructured, exploratory research
methodology based on small samples that provide insights into and understanding of
the problem setting (Malhotra, 1996:147)
3) Methods of collecting quantitative data: There are various methods for collecting
quantitative data such as telephone interviewing, personal interviewing, and mail and
electronic interviewing
4) Measurement and scaling procedures: There are four primary scales of
measurement: nominal, ordinal, interval and ratio
5) Questionnaire design: This involves designing a questionnaire which consists of a
series of questions answered by a respondent for the purpose of data collection
159
6) Sampling process and sample size: A sample is a subgroup of the elements of the
population selected for participation in the study (Malhotra, 1996:328)
7) Plan of the data analysis: Data analysis involves converting the information
collected by means of the questionnaire into relevant knowledge, and thereby giving
meaning to the data collected.
4.2.3.1. Secondary data analysis
According to Malhotra the first step in the research design is secondary data analysis.
In order to achieve the research objectives outlined in Step 1 of Figure 4.1 the
researcher used two kinds of data, namely, primary data and secondary data. Malhotra
(1996:112) defines primary data as “data originated by the researcher for the specific
purpose of addressing the research problem.”
In order to answer the questions posed by the research problem the researcher made
use of a focus group and a survey questionnaire as a primary data-gathering
instrument. Obtaining primary data may be expensive and time consuming whereas
secondary data may usually be located quickly and inexpensively. Secondary data,
according to Malhotra (1996:112), is data that has already been collected for purposes
other than for the problem at hand.
In this study sources of secondary data were international and local sources,
marketing journals, industry reports, the Internet, magazines and recent publications
(see also the bibliography in this regard), whilst primary information was gathered by
means of focus groups and survey questionnaires.
4.2.3.2 Qualitative research
As in the case of secondary data analysis mentioned above qualitative research is also
an important methodology used by researchers to define the problem and develop an
approach to the problem at hand. According to Malhotra (1996:147) the difference
between qualitative and quantitative research is that qualitative research provides
insights into and an understanding of the problem setting, whereas quantitative
160
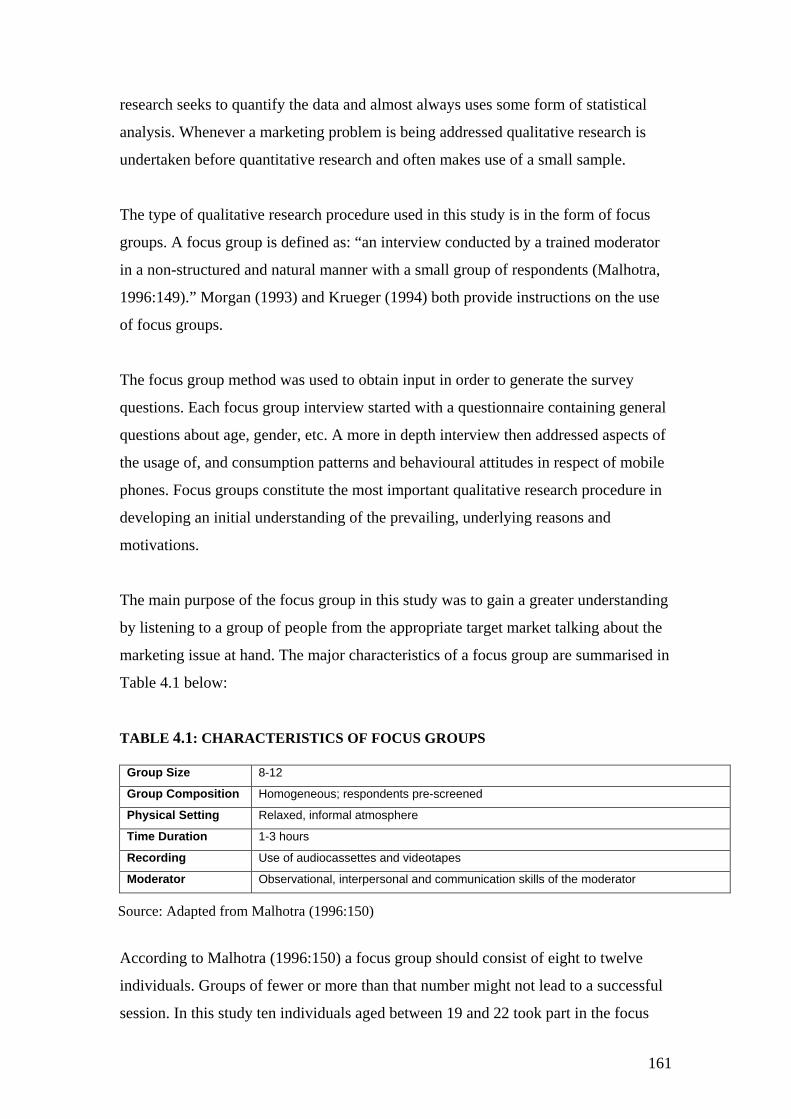
research seeks to quantify the data and almost always uses some form of statistical
analysis. Whenever a marketing problem is being addressed qualitative research is
undertaken before quantitative research and often makes use of a small sample.
The type of qualitative research procedure used in this study is in the form of focus
groups. A focus group is defined as: “an interview conducted by a trained moderator
in a non-structured and natural manner with a small group of respondents (Malhotra,
1996:149).” Morgan (1993) and Krueger (1994) both provide instructions on the use
of focus groups.
The focus group method was used to obtain input in order to generate the survey
questions. Each focus group interview started with a questionnaire containing general
questions about age, gender, etc. A more in depth interview then addressed aspects of
the usage of, and consumption patterns and behavioural attitudes in respect of mobile
phones. Focus groups constitute the most important qualitative research procedure in
developing an initial understanding of the prevailing, underlying reasons and
motivations.
The main purpose of the focus group in this study was to gain a greater understanding
by listening to a group of people from the appropriate target market talking about the
marketing issue at hand. The major characteristics of a focus group are summarised in
Table 4.1 below:
TABLE 4.1: CHARACTERISTICS OF FOCUS GROUPS
Group Size 8-12
Group Composition Homogeneous; respondents pre-screened
Physical Setting Relaxed, informal atmosphere
Time Duration 1-3 hours
Recording Use of audiocassettes and videotapes
Moderator Observational, interpersonal and communication skills of the moderator
Source: Adapted from Malhotra (1996:150)
According to Malhotra (1996:150) a focus group should consist of eight to twelve
individuals. Groups of fewer or more than that number might not lead to a successful
session. In this study ten individuals aged between 19 and 22 took part in the focus
161
group discussions on the 29 July 2005. Two important criteria regarding focus group
interviewing were adhered to (Malhotra, 1996)- not only was the focus group
homogeneous in terms of demographics and socio-economic characteristics, but the
group also shared sufficient experience of the issue under discussion (all the focus
group participants had had adequate exposure to mobile phones). The focus group
interview was led by the researcher, and special attention was given to ensuring a
relaxed and informal physical setting so as to encourage a free-flowing group
discussion. The focus group interview was kept within two hours and was recorded so
that it could be analysed.
The researcher had compiled a list of motives based on prior studies, but, as expected,
new motives emerged as a result of the focus group research.
Focus groups may be used to address issues such as understanding the perceptions,
preferences and behaviour of consumers. According to Aaker, Kumar and Day
(1995), focus groups may be classified into three types. Exploratory focus groups as
in this study are commonly used for the exploratory phase of the market research
process in order to aid in formulating a precise definition of the research problem.
They may also be viewed as a form of pilot testing.
The methodological applications of focus groups used in this particular study thus
include obtaining information helpful in structuring the questionnaire and in defining
the research problem more precisely.
4.2.3.3 Methods of collecting quantitative data
There are various methods for collecting quantitative data such as telephone
interviewing, personal interviewing, mail interviewing and electronic interviewing
(Malhotra, 1996:179). In this study information was obtained through the use of a
survey; in other words, a structured questionnaire was given to a sample of
Generation Y students to elicit specific information such as demographics, and
perceptions, attitudes and behaviour regarding mobile phones.
162
There are several advantages to the survey method in that this method is easy to
administer, code, analyse and interpret. The survey approach is by far the most
common method of primary data collection used in marketing research (Malhotra,
1996:179). The survey is then given to a sample that has been drawn and is being
used to represent the population that is of interest to the researcher. The sampling
process and sample size chosen for this study will be discussed in more detail in
Section 4.2.3.6.
4.2.3.4. Measurement and scaling procedures
Measurement is a process of assigning numbers to objects to represent quantities of
attributes (Dillon et al., 1994:302). Measurement may be undertaken at different
levels. Nominal measurement is a measurement whereby the numbers assigned allow
the researcher to place an object in one and only one of a set of mutually exclusive
and collectively exclusive classes with no implied ordering (Dillon et al., 1994:273).
Ordinal measurement is a measurement in which the response alternatively defines an
ordered sequence so that the choice listed first, is less (or greater) than the second, the
second less (or greater) than the first, and so forth (Dillon et al., 1994:274). Interval
measurement allows the researcher to indicate how far apart two or more objects are
with respect to the attribute being measured, and, consequently, to compare the
differences between the numbers assigned (Dillon et al., 1994:275).
In this questionnaire a number of rating scales were used. The questions were simple
category scales, multiple-choice single response, multiple-choice multiple response
and, lastly, the Likert scale. The closed end questions were divided into the following
categories (as mentioned above):
• Nominal- non-numerical scales such as Male and Female
• Ordinal- a ranking scale that ranks questions in order. Ordinal scales are usually
used to measure relative attitudes.
• Interval- equal numerical intervals where differences between objects may be
compared (for e.g. age categories may be grouped into categories of equal size)
163
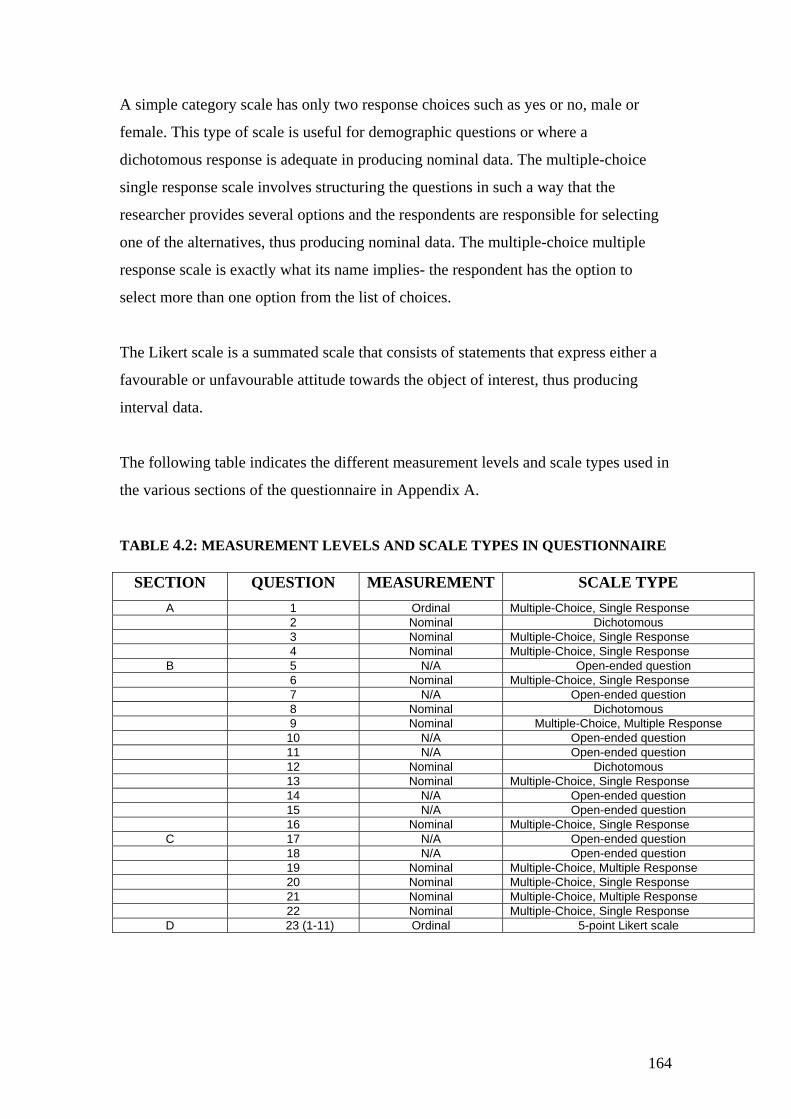
A simple category scale has only two response choices such as yes or no, male or
female. This type of scale is useful for demographic questions or where a
dichotomous response is adequate in producing nominal data. The multiple-choice
single response scale involves structuring the questions in such a way that the
researcher provides several options and the respondents are responsible for selecting
one of the alternatives, thus producing nominal data. The multiple-choice multiple
response scale is exactly what its name implies- the respondent has the option to
select more than one option from the list of choices.
The Likert scale is a summated scale that consists of statements that express either a
favourable or unfavourable attitude towards the object of interest, thus producing
interval data.
The following table indicates the different measurement levels and scale types used in
the various sections of the questionnaire in Appendix A.
TABLE 4.2: MEASUREMENT LEVELS AND SCALE TYPES IN QUESTIONNAIRE
SECTION QUESTION MEASUREMENT SCALE TYPE A 1 Ordinal Multiple-Choice, Single Response
2 Nominal Dichotomous 3 Nominal Multiple-Choice, Single Response 4 Nominal Multiple-Choice, Single Response
B 5 N/A Open-ended question 6 Nominal Multiple-Choice, Single Response 7 N/A Open-ended question 8 Nominal Dichotomous 9 Nominal Multiple-Choice, Multiple Response 10 N/A Open-ended question 11 N/A Open-ended question 12 Nominal Dichotomous 13 Nominal Multiple-Choice, Single Response
14 N/A Open-ended question 15 N/A Open-ended question 16 Nominal Multiple-Choice, Single Response
C 17 N/A Open-ended question 18 N/A Open-ended question 19 Nominal Multiple-Choice, Multiple Response
20 Nominal Multiple-Choice, Single Response 21 Nominal Multiple-Choice, Multiple Response 22 Nominal Multiple-Choice, Single Response
D 23 (1-11) Ordinal 5-point Likert scale
164
4.2.3.5 Questionnaire design
It was a relatively easy task to identify the population and to decide to survey part of
the population. The structured questionnaire itself was designed so as to make it easy
to answer and to cover most of the common research questions. Furthermore, the
questionnaire was designed so as to elicit information on both demographic and
psychographic aspects of the respondents.
Demographics include age, gender, ethnic background and employment status, and
psychographics include mobile phone usage patterns and attitudes towards mobile
phones.
4.2.3.5.1 Questionnaire layout
The questionnaire was divided into four distinct sections as may be seen in the final
questionnaire in Appendix A: Section A: Demographics; Section B: Mobile Phone
Ownership; Section C: Mobile Phone Usage Patterns; Section D: Attitudes towards
Mobile Phones. A summary of the questionnaire layout is given in Table 4.3.
165
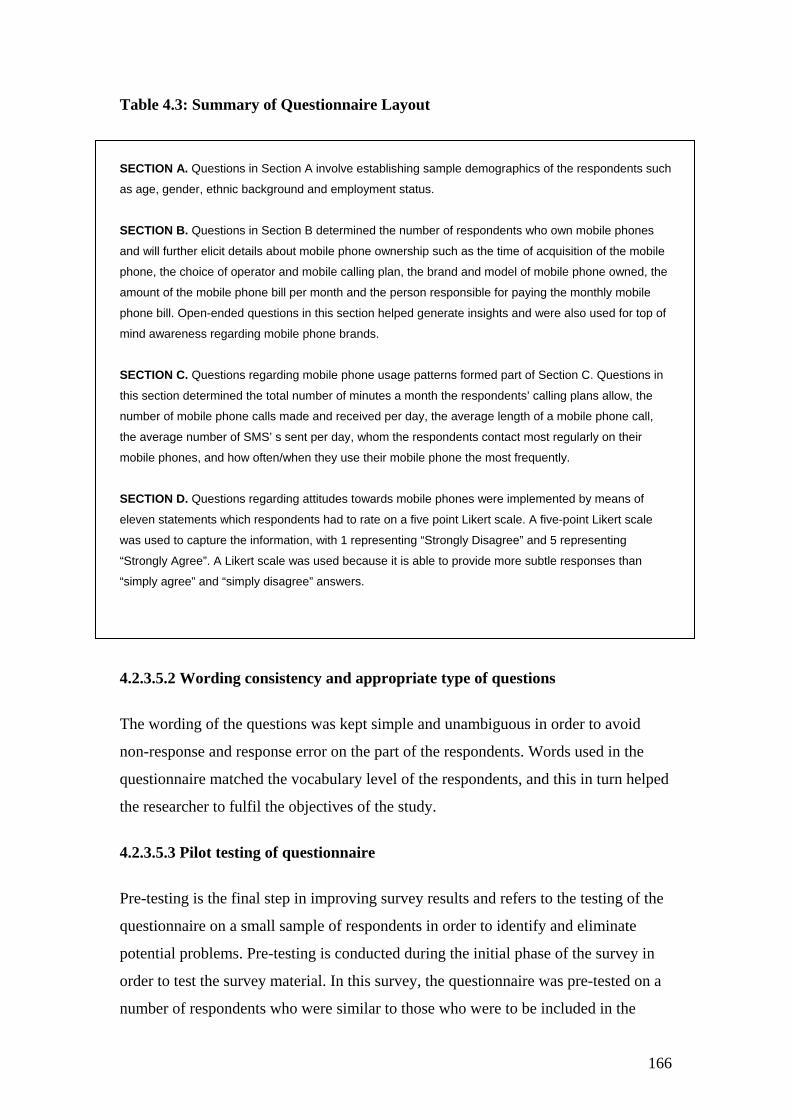
Table 4.3: Summary of Questionnaire Layout
SECTION A. Questions in Section A involve establishing sample demographics of the respondents such
as age, gender, ethnic background and employment status.
SECTION B. Questions in Section B determined the number of respondents who own mobile phones
and will further elicit details about mobile phone ownership such as the time of acquisition of the mobile
phone, the choice of operator and mobile calling plan, the brand and model of mobile phone owned, the
amount of the mobile phone bill per month and the person responsible for paying the monthly mobile
phone bill. Open-ended questions in this section helped generate insights and were also used for top of
mind awareness regarding mobile phone brands.
SECTION C. Questions regarding mobile phone usage patterns formed part of Section C. Questions in
this section determined the total number of minutes a month the respondents’ calling plans allow, the
number of mobile phone calls made and received per day, the average length of a mobile phone call,
the average number of SMS’ s sent per day, whom the respondents contact most regularly on their
mobile phones, and how often/when they use their mobile phone the most frequently.
SECTION D. Questions regarding attitudes towards mobile phones were implemented by means of
eleven statements which respondents had to rate on a five point Likert scale. A five-point Likert scale
was used to capture the information, with 1 representing “Strongly Disagree” and 5 representing
“Strongly Agree”. A Likert scale was used because it is able to provide more subtle responses than
“simply agree” and “simply disagree” answers. 4.2.3.5.2 Wording consistency and appropriate type of questions
The wording of the questions was kept simple and unambiguous in order to avoid
non-response and response error on the part of the respondents. Words used in the
questionnaire matched the vocabulary level of the respondents, and this in turn helped
the researcher to fulfil the objectives of the study.
4.2.3.5.3 Pilot testing of questionnaire
Pre-testing is the final step in improving survey results and refers to the testing of the
questionnaire on a small sample of respondents in order to identify and eliminate
potential problems. Pre-testing is conducted during the initial phase of the survey in
order to test the survey material. In this survey, the questionnaire was pre-tested on a
number of respondents who were similar to those who were to be included in the
166
survey in terms of background characteristics, and attitudes and behaviours of
interest, in order to ensure that the instructions and the meanings of the questions
were simple, clear, unambiguous and beneficial to the subjects. A total of six students
participated in the pilot study. Changes were made accordingly and the input of these
students was taken into consideration.
Minor modifications were made as it was discovered that some of the questions were
wordy and therefore had to be simplified, and also that the questionnaire was lengthy.
Lastly certain questions had to be rearranged and those questions considered to be
ambiguous were removed from the later versions of the questionnaire.
4.2.3.6 Sampling process and sample size
Sampling techniques may be broadly classified as probability sampling and non-
probability sampling. In probability sampling sampling units are selected by chance.
Every potential sample has an equal chance of being selected. Non-probability
sampling relies on the personal judgement of the researcher, rather than on chance, to
select sample elements. Non-probability samples may yield good estimates for the
population characteristics, but are not statistically projectable onto the population. For
the purpose of this study, a combination of both non-probability sampling and
probability sampling was undertaken in the form of quota sampling and systematic
sampling.
Quota sampling is a non-probability sampling technique and may be viewed as a
“two-stage restricted judgmental sampling. The first stage consists of developing
control categories, or quotas of population elements. In the second stage, sample
elements are selected based on convenience or judgment” (Malhotra, 1996:336). In
order to develop these quotas the research lists relevant control characteristics and
determines the distribution of these characteristics in the target population. The
relevant control characteristics in this study include gender and age.
According to Malhotra (1996:337) quota sampling is a less costly data capturing
technique than other sampling techniques, and usually attempts to obtain
representative samples.
167
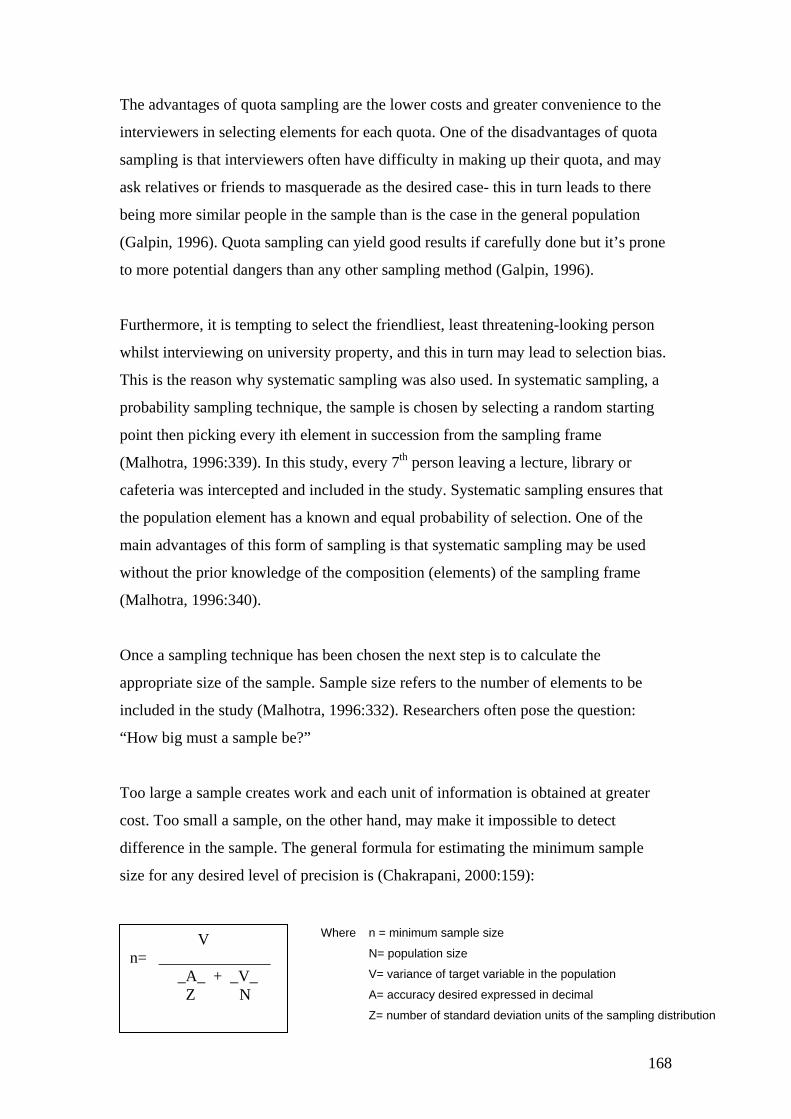
The advantages of quota sampling are the lower costs and greater convenience to the
interviewers in selecting elements for each quota. One of the disadvantages of quota
sampling is that interviewers often have difficulty in making up their quota, and may
ask relatives or friends to masquerade as the desired case- this in turn leads to there
being more similar people in the sample than is the case in the general population
(Galpin, 1996). Quota sampling can yield good results if carefully done but it’s prone
to more potential dangers than any other sampling method (Galpin, 1996).
Furthermore, it is tempting to select the friendliest, least threatening-looking person
whilst interviewing on university property, and this in turn may lead to selection bias.
This is the reason why systematic sampling was also used. In systematic sampling, a
probability sampling technique, the sample is chosen by selecting a random starting
point then picking every ith element in succession from the sampling frame
(Malhotra, 1996:339). In this study, every 7th person leaving a lecture, library or
cafeteria was intercepted and included in the study. Systematic sampling ensures that
the population element has a known and equal probability of selection. One of the
main advantages of this form of sampling is that systematic sampling may be used
without the prior knowledge of the composition (elements) of the sampling frame
(Malhotra, 1996:340).
Once a sampling technique has been chosen the next step is to calculate the
appropriate size of the sample. Sample size refers to the number of elements to be
included in the study (Malhotra, 1996:332). Researchers often pose the question:
“How big must a sample be?”
Too large a sample creates work and each unit of information is obtained at greater
cost. Too small a sample, on the other hand, may make it impossible to detect
difference in the sample. The general formula for estimating the minimum sample
size for any desired level of precision is (Chakrapani, 2000:159):
Where n = minimum sample size
N= population size
V= variance of target variable in the population
A= accuracy desired expressed in decimal
Z= number of standard deviation units of the sampling distribution
V n= ______________ _A_ + _V_ Z N
168
For this study the significance level is 0.05 with a 95% confidence interval (also
known as the level of uncertainty). The maximum variance is therefore 0.25 and the z
value for 95% is 1.96. N= 200
A total of 200 young mobile phone users was included in the survey. The sample was
chosen from the overall population of young people at universities in Johannesburg.
The sample is not directly proportionate to the total youth population as it is a sample
of the mobile phone owning youth sector, and therefore the population might manifest
different characteristics.
4.2.4 STEP 4: Fieldwork/data collection
Marketing research data is collected either by the person designing the research or by
field workers. According to Ali (2003:298) primary data collection may vary between
simple observations within one specific area, such as a specific area in a business, to
an observation over a large area, such as a corporate with many locations in different
parts of the world. Questionnaires and observations are all methods of data collection.
A questionnaire was designed specifically for the unique needs and objectives of this
study.
The data was collected by means of 200 closed-structured questionnaires in selected
educational institutions in the city of Johannesburg in the week of 16 to 23 August
2005. There were two target groups- the survey respondents were selected from two
universities in the city of Johannesburg. The first group comprised first year students
in the faculty of Business Sciences and Commerce at the University of Witwatersrand
and first year students in the faculty of Commerce at the University of Johannesburg
(age span 18-19). The second group included older students labelled as young adults
(age span 20-23). The age thus varied from 18 to 23. The respondents were in the
same age category as that described for Generation Y (see Chapter 3).
Students at the target universities were approached in person by the researcher of the
dissertation in locations on campus such as lecture rooms, libraries and cafeterias.
This in-person delivery technique for the survey may be summarised as follows:
169
1) Approach a person at the target university and ask whether he/she is a student at the
university and whether he/she owns a mobile phone (screening question).
2) If the answer is yes then the person is asked whether he/she would be willing to
participate in the survey. The person is also informed that he/she may ask any
questions at any time. This ensures that the respondents understand the questions and
answer them correctly.
3) If the answer to the question is yes, then a questionnaire is given to the respondent
and the author of the dissertation waits for the respondent to complete the
questionnaire.
4) The process is completed after the respondent has filled the questionnaire.
The results yielded the following:
• 105 of Generation Y students were in the 18 to 19 age group (52%) and the other
95 (48%) were in the 20-23 age group.
• There were 112 female students (56%) and 88 male students (44%) in the sample.
4.2.5 STEP 5: Data preparation and analysis
Data preparation includes the editing, coding, transcription and verification of data in
order to remove errors that may have occurred during the data collection process
(Malhotra, 1996:25). The next step is data analysis in terms of which the information
contained in the questionnaires has to be converted into relevant knowledge, thereby
giving meaning to the data collected. The data from the questionnaire was collated for
examination using two computer programs, viz. Microsoft Excel and SPSS.
4.2.5.1 Microsoft Excel
Microsoft Excel is a spreadsheet program with data analysis and descriptive
capabilities.
170
Excel was used to obtain a clear and visually descriptive picture of the demographics
of the Generation Y consumers-demographics- such as age, gender, ethnic
background and employment status by way of histogram distributions and pie charts.
4.2.5.2 SPSS
SPSS is a statistical program created for data encoding and design. The data from the
questionnaires was entered directly into SPSS after each questionnaire had been
validated. The program was used for bivariate statistical analysis which was achieved
through cross-tabulation programs that were run on a number of associations.
The second quantitative statistical test was the use of factor analysis. Factor analysis
is able to identify the structure of a set of variables as well as provide a process for
data reduction. This pertained to the testing of the attitudes and perceptions towards
mobile phones on the part of Generation Y consumers.
4.2.6 STEP 6: Report preparation and presentation
The entire project must then be documented in a written report which addresses the
specific research questions identified, describes the approach, the research design,
data collection, data analysis procedures adopted and presents the results and the
major findings. The research process closes with recommendations. Step 6 will be
discussed in Chapter 5.
4.3 CONCLUSION
In this chapter, the six steps of the marketing research process were discussed in order
to outline the methodology used to test the research questions and objectives.
Problem definition, development of an approach to the problem, research design
formulation, fieldwork/data collection, data preparation and analysis, report
preparation and presentation were all discussed. Chapter 5 will contain a discussion
on the results and findings of the research objectives as formulated in Chapter 1.
171
CHAPTER 5
RESEARCH RESULTS
5.1 INTRODUCTION
In this chapter, the results of the empirical survey are discussed. The main research
objective was to gain primary information regarding the use of mobile phones by
Generation Y students in the city of Johannesburg. The following secondary
objectives were identified, namely to determine:
• The demographics of Generation Y students in the city of Johannesburg
• The perceptions of Generation Y regarding the competitive situation in the mobile
phone market
• The mobile phone brand awareness of Generation Y
• Further areas of study in this dynamic youth market
The results were discussed in the sequence as followed in the questionnaire where the
data relating to demographics, mobile phone ownership, usage patterns, and attitudes
towards mobile phones was statistically analysed. The results are based on a question-
by-question basis and are represented graphically in tables and figures such as pie
charts, histograms, graphs, and various other charts in order to answer the primary and
secondary objectives. Microsoft Excel and SPSS Windows 12.0 were used to do the
statistical calculations. An analysis of the demographics of the Generation Y
respondents is provided (see Section 5.2.2). The mobile phone ownership was
presented in Section 5.2.3. This section also identified the respondent’s perceptions
regarding the mobile operators. Mobile phone usage patterns are discussed in Section
5.2.4. Finally Section 5.2.5 describes the respondents’ attitudes towards mobile
phones. A total of 200 respondents completed the questionnaire. A summary of the
research findings and testing of the objectives concludes the chapter.
172
5.2 DESCRIPTIVE STATISTICS AND RESULTS ON A QUESTION-BY-
QUESTION BASIS
Descriptive statistics summarise the variables in a dataset. In order to provide the
sample demographics of the Generation Y students in Gauteng (Section A of the
questionnaire), respondents were asked their age, gender, ethnic background, and
employment status. Each individual question of each section will be given with results
described by statistical analysis:
5.2.1 Screening questions
The screening questions, also known as filter questions, feature at the beginning of a
questionnaire and screen potential respondents to ensure that they meet the
requirements of the sample (Malhotra, 1996: 299). The screening questions in this
study were aimed at narrowing down the number of respondents to Generation Y
respondents who study at the particular university (University of the Witwatersrand or
University of Johannesburg) and who own a mobile phone. Respondents who did not
answer yes to both screening questions were omitted from this particular study.
QUESTION 1: Are you a student on campus?
Only students studying in the particular campuses completed the questionnaire and
therefore all 200 of the respondents were qualified as students and formed part of the
population for this study. There were 114 respondents (57%) from the University of
the Witwatersrand (Wits) and 86 respondents (43%) from the University of
Johannesburg (UJ) as illustrated in Figure 5.1.
173
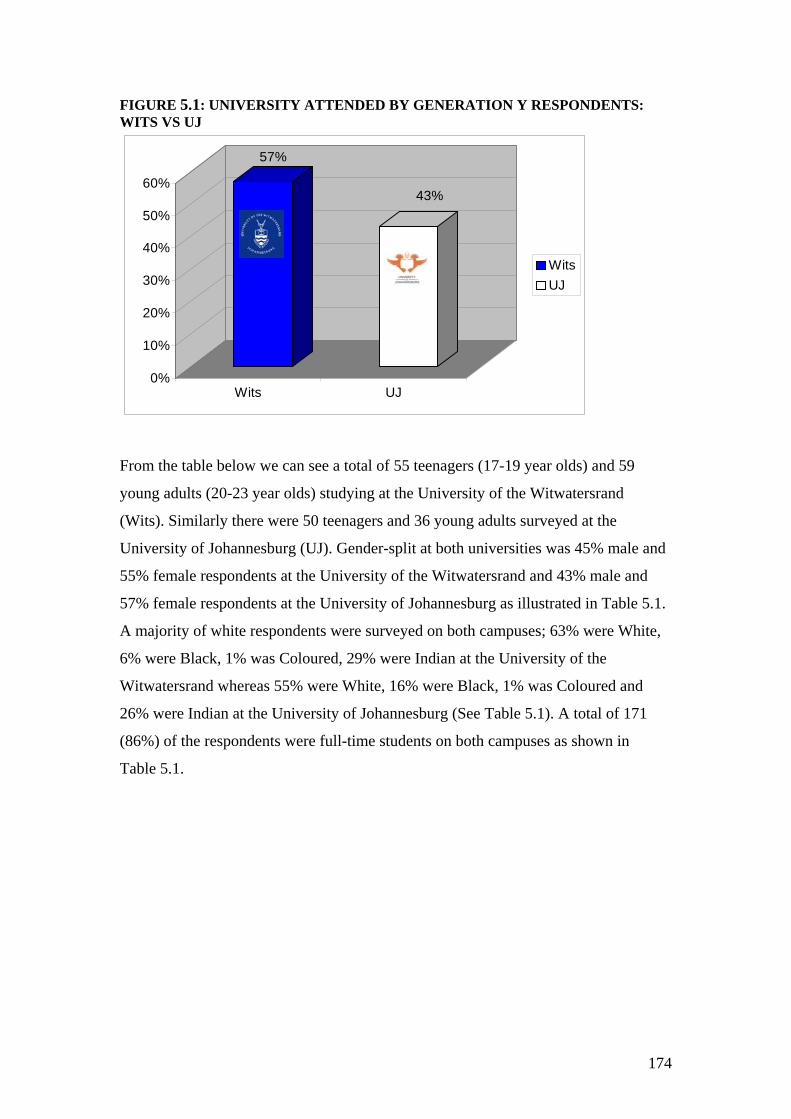
FIGURE 5.1: UNIVERSITY ATTENDED BY GENERATION Y RESPONDENTS: WITS VS UJ
57%
43%
0%
10%
20%
30%
40%
50%
60%
Wits UJ
WitsUJ
From the table below we can see a total of 55 teenagers (17-19 year olds) and 59
young adults (20-23 year olds) studying at the University of the Witwatersrand
(Wits). Similarly there were 50 teenagers and 36 young adults surveyed at the
University of Johannesburg (UJ). Gender-split at both universities was 45% male and
55% female respondents at the University of the Witwatersrand and 43% male and
57% female respondents at the University of Johannesburg as illustrated in Table 5.1.
A majority of white respondents were surveyed on both campuses; 63% were White,
6% were Black, 1% was Coloured, 29% were Indian at the University of the
Witwatersrand whereas 55% were White, 16% were Black, 1% was Coloured and
26% were Indian at the University of Johannesburg (See Table 5.1). A total of 171
(86%) of the respondents were full-time students on both campuses as shown in
Table 5.1.
174
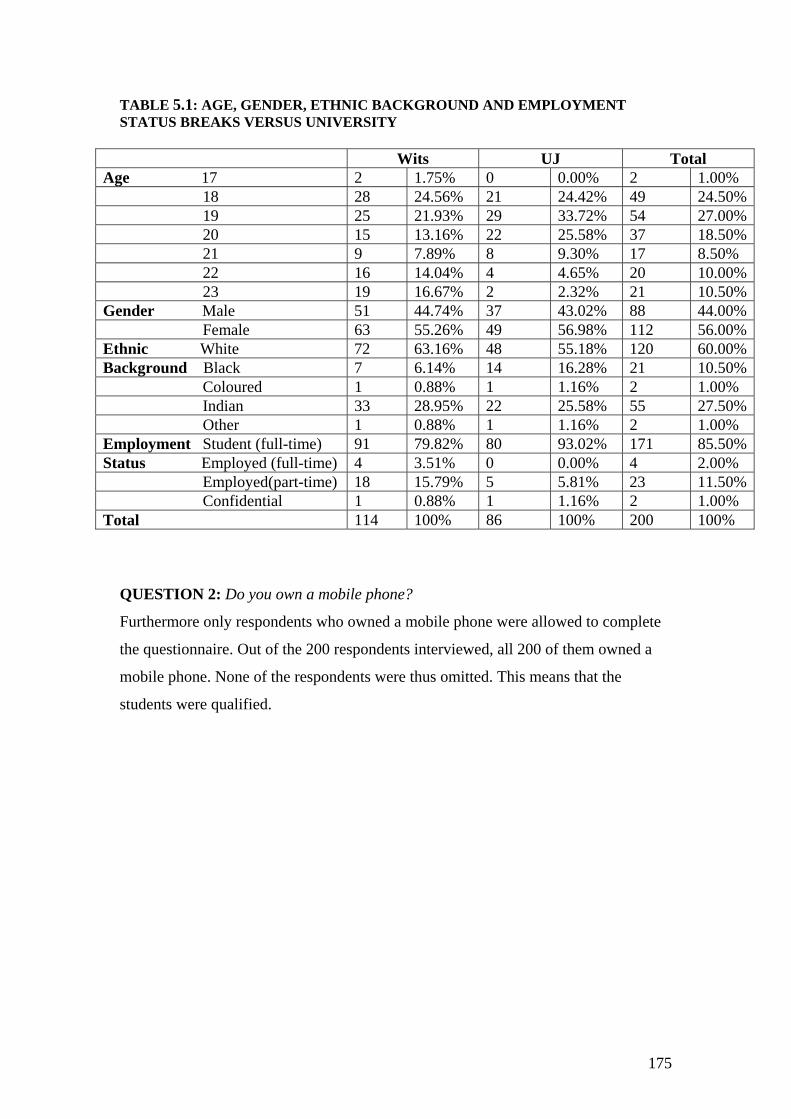
TABLE 5.1: AGE, GENDER, ETHNIC BACKGROUND AND EMPLOYMENT STATUS BREAKS VERSUS UNIVERSITY
Wits UJ Total Age 17 2 1.75% 0 0.00% 2 1.00% 18 28 24.56% 21 24.42% 49 24.50% 19 25 21.93% 29 33.72% 54 27.00% 20 15 13.16% 22 25.58% 37 18.50% 21 9 7.89% 8 9.30% 17 8.50% 22 16 14.04% 4 4.65% 20 10.00% 23 19 16.67% 2 2.32% 21 10.50%Gender Male 51 44.74% 37 43.02% 88 44.00% Female 63 55.26% 49 56.98% 112 56.00%Ethnic White 72 63.16% 48 55.18% 120 60.00%Background Black 7 6.14% 14 16.28% 21 10.50% Coloured 1 0.88% 1 1.16% 2 1.00% Indian 33 28.95% 22 25.58% 55 27.50% Other 1 0.88% 1 1.16% 2 1.00% Employment Student (full-time) 91 79.82% 80 93.02% 171 85.50%Status Employed (full-time) 4 3.51% 0 0.00% 4 2.00% Employed(part-time) 18 15.79% 5 5.81% 23 11.50% Confidential 1 0.88% 1 1.16% 2 1.00% Total 114 100% 86 100% 200 100%
QUESTION 2: Do you own a mobile phone?
Furthermore only respondents who owned a mobile phone were allowed to complete
the questionnaire. Out of the 200 respondents interviewed, all 200 of them owned a
mobile phone. None of the respondents were thus omitted. This means that the
students were qualified.
175
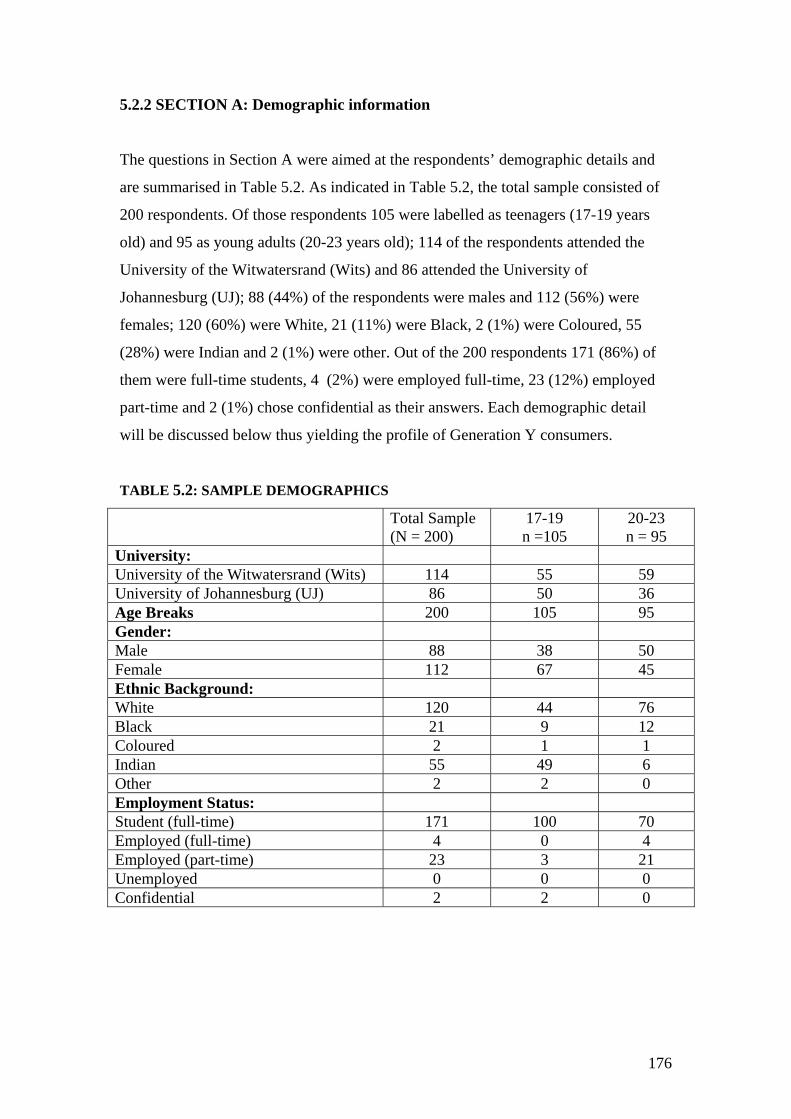
5.2.2 SECTION A: Demographic information
The questions in Section A were aimed at the respondents’ demographic details and
are summarised in Table 5.2. As indicated in Table 5.2, the total sample consisted of
200 respondents. Of those respondents 105 were labelled as teenagers (17-19 years
old) and 95 as young adults (20-23 years old); 114 of the respondents attended the
University of the Witwatersrand (Wits) and 86 attended the University of
Johannesburg (UJ); 88 (44%) of the respondents were males and 112 (56%) were
females; 120 (60%) were White, 21 (11%) were Black, 2 (1%) were Coloured, 55
(28%) were Indian and 2 (1%) were other. Out of the 200 respondents 171 (86%) of
them were full-time students, 4 (2%) were employed full-time, 23 (12%) employed
part-time and 2 (1%) chose confidential as their answers. Each demographic detail
will be discussed below thus yielding the profile of Generation Y consumers.
TABLE 5.2: SAMPLE DEMOGRAPHICS
Total Sample (N = 200)
17-19 n =105
20-23 n = 95
University: University of the Witwatersrand (Wits) 114 55 59 University of Johannesburg (UJ) 86 50 36 Age Breaks 200 105 95 Gender: Male 88 38 50 Female 112 67 45 Ethnic Background: White 120 44 76 Black 21 9 12 Coloured 2 1 1 Indian 55 49 6 Other 2 2 0 Employment Status: Student (full-time) 171 100 70 Employed (full-time) 4 0 4 Employed (part-time) 23 3 21 Unemployed 0 0 0 Confidential 2 2 0
176
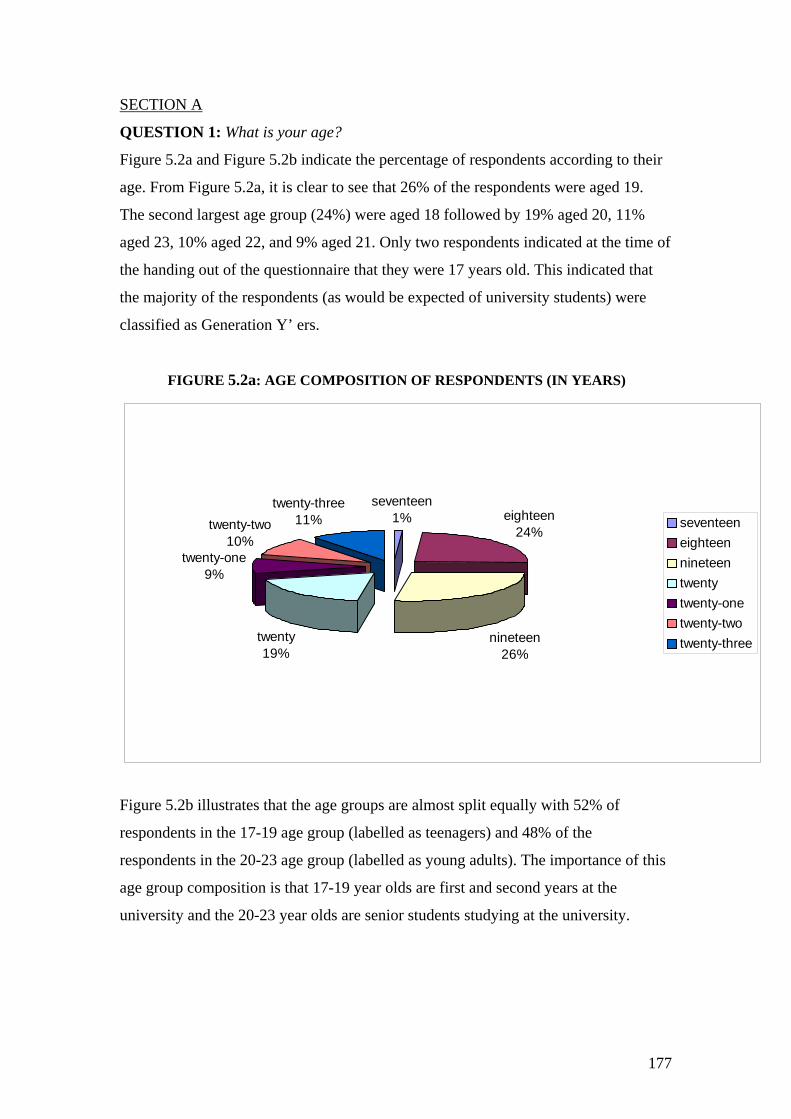
SECTION A
QUESTION 1: What is your age?
Figure 5.2a and Figure 5.2b indicate the percentage of respondents according to their
age. From Figure 5.2a, it is clear to see that 26% of the respondents were aged 19.
The second largest age group (24%) were aged 18 followed by 19% aged 20, 11%
aged 23, 10% aged 22, and 9% aged 21. Only two respondents indicated at the time of
the handing out of the questionnaire that they were 17 years old. This indicated that
the majority of the respondents (as would be expected of university students) were
classified as Generation Y’ ers.
FIGURE 5.2a: AGE COMPOSITION OF RESPONDENTS (IN YEARS)
seventeen1% eighteen
24%
nineteen26%
twenty19%
twenty-one9%
twenty-two10%
twenty-three11% seventeen
eighteennineteentwentytwenty-onetwenty-twotwenty-three
Figure 5.2b illustrates that the age groups are almost split equally with 52% of
respondents in the 17-19 age group (labelled as teenagers) and 48% of the
respondents in the 20-23 age group (labelled as young adults). The importance of this
age group composition is that 17-19 year olds are first and second years at the
university and the 20-23 year olds are senior students studying at the university.
177
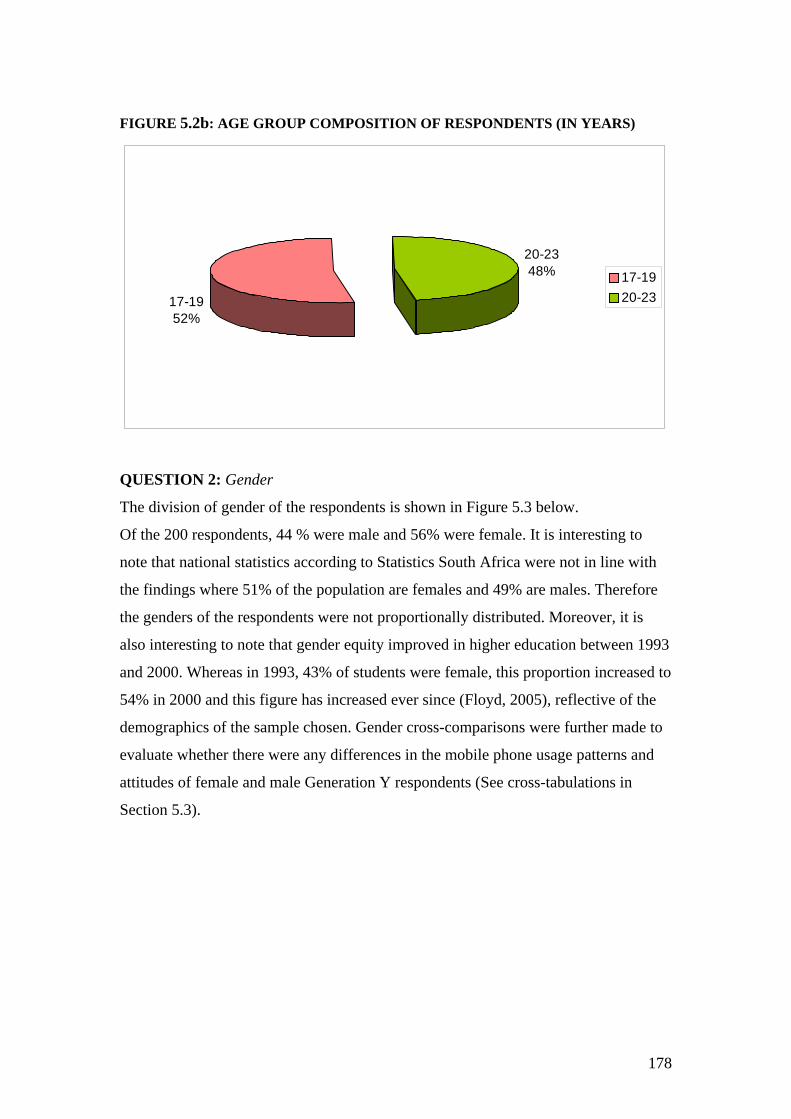
FIGURE 5.2b: AGE GROUP COMPOSITION OF RESPONDENTS (IN YEARS)
17-1952%
20-2348% 17-19
20-23
QUESTION 2: Gender
The division of gender of the respondents is shown in Figure 5.3 below.
Of the 200 respondents, 44 % were male and 56% were female. It is interesting to
note that national statistics according to Statistics South Africa were not in line with
the findings where 51% of the population are females and 49% are males. Therefore
the genders of the respondents were not proportionally distributed. Moreover, it is
also interesting to note that gender equity improved in higher education between 1993
and 2000. Whereas in 1993, 43% of students were female, this proportion increased to
54% in 2000 and this figure has increased ever since (Floyd, 2005), reflective of the
demographics of the sample chosen. Gender cross-comparisons were further made to
evaluate whether there were any differences in the mobile phone usage patterns and
attitudes of female and male Generation Y respondents (See cross-tabulations in
Section 5.3).
178
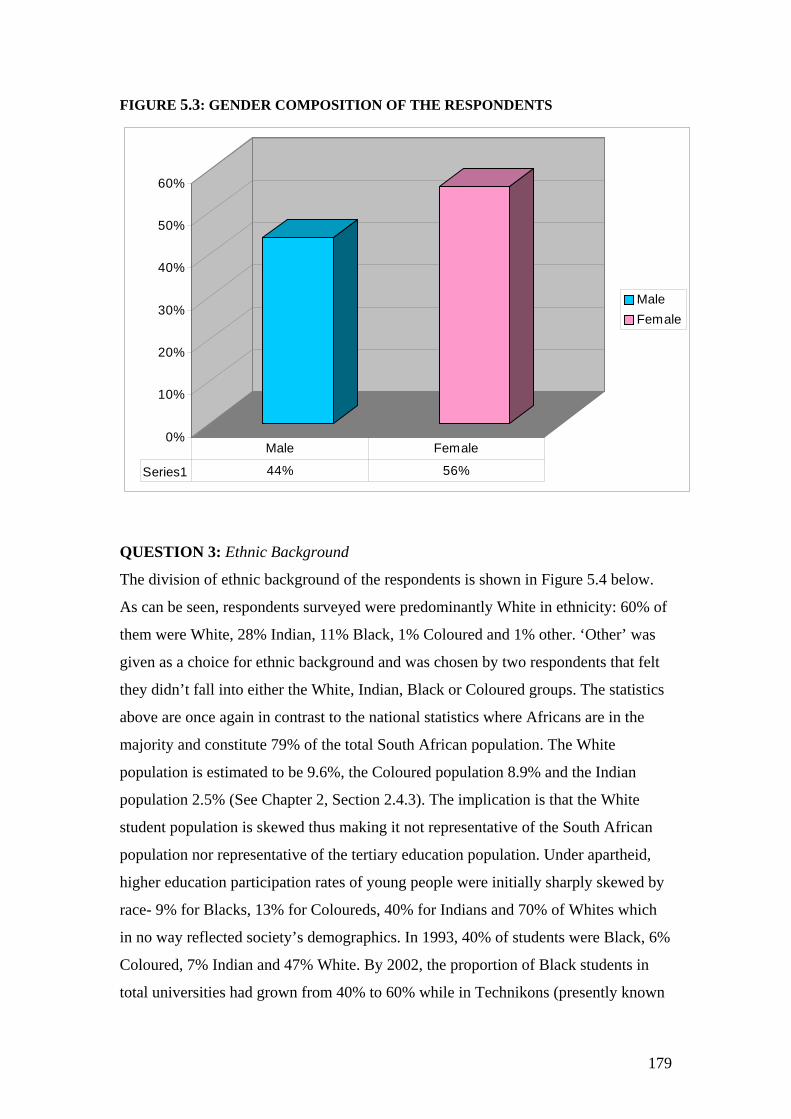
FIGURE 5.3: GENDER COMPOSITION OF THE RESPONDENTS
0%
10%
20%
30%
40%
50%
60%
MaleFemale
Series1 44% 56%
Male Female
QUESTION 3: Ethnic Background
The division of ethnic background of the respondents is shown in Figure 5.4 below.
As can be seen, respondents surveyed were predominantly White in ethnicity: 60% of
them were White, 28% Indian, 11% Black, 1% Coloured and 1% other. ‘Other’ was
given as a choice for ethnic background and was chosen by two respondents that felt
they didn’t fall into either the White, Indian, Black or Coloured groups. The statistics
above are once again in contrast to the national statistics where Africans are in the
majority and constitute 79% of the total South African population. The White
population is estimated to be 9.6%, the Coloured population 8.9% and the Indian
population 2.5% (See Chapter 2, Section 2.4.3). The implication is that the White
student population is skewed thus making it not representative of the South African
population nor representative of the tertiary education population. Under apartheid,
higher education participation rates of young people were initially sharply skewed by
race- 9% for Blacks, 13% for Coloureds, 40% for Indians and 70% of Whites which
in no way reflected society’s demographics. In 1993, 40% of students were Black, 6%
Coloured, 7% Indian and 47% White. By 2002, the proportion of Black students in
total universities had grown from 40% to 60% while in Technikons (presently known
179
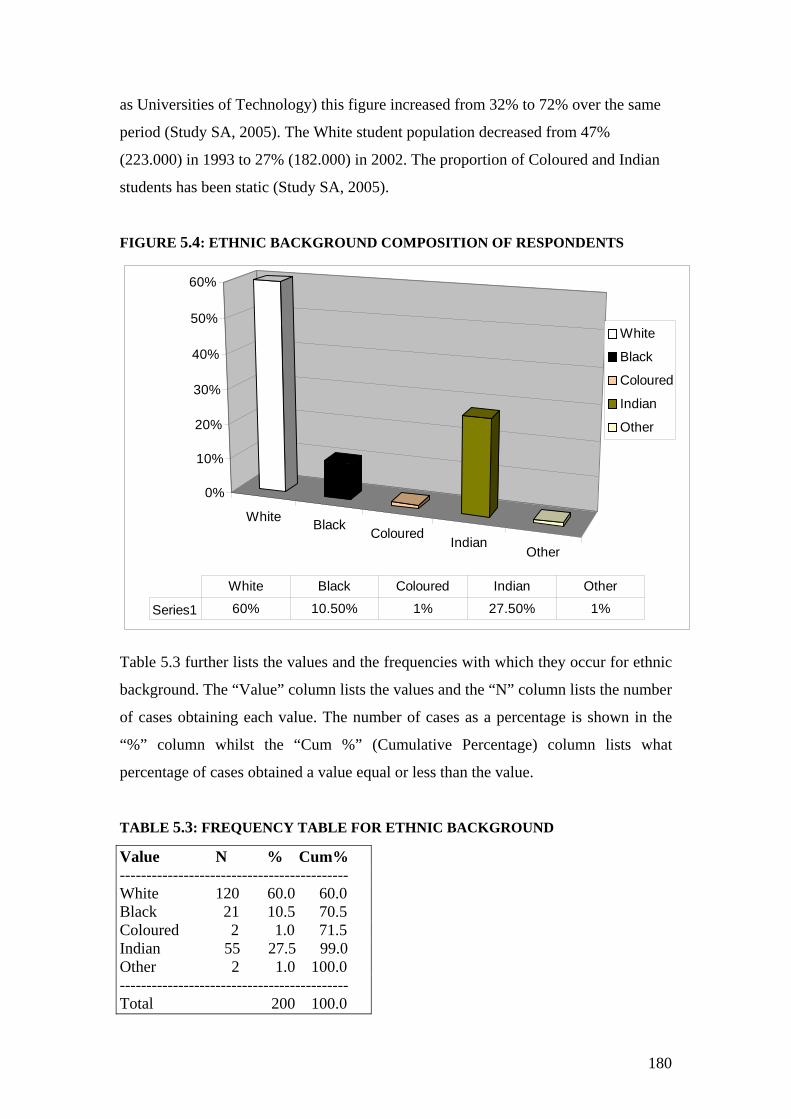
as Universities of Technology) this figure increased from 32% to 72% over the same
period (Study SA, 2005). The White student population decreased from 47%
(223.000) in 1993 to 27% (182.000) in 2002. The proportion of Coloured and Indian
students has been static (Study SA, 2005).
FIGURE 5.4: ETHNIC BACKGROUND COMPOSITION OF RESPONDENTS
White Black ColouredIndian
Other
0%
10%
20%
30%
40%
50%
60%
White
Black
Coloured
Indian
Other
Series1 60% 10.50% 1% 27.50% 1%
White Black Coloured Indian Other
Table 5.3 further lists the values and the frequencies with which they occur for ethnic
background. The “Value” column lists the values and the “N” column lists the number
of cases obtaining each value. The number of cases as a percentage is shown in the
“%” column whilst the “Cum %” (Cumulative Percentage) column lists what
percentage of cases obtained a value equal or less than the value.
TABLE 5.3: FREQUENCY TABLE FOR ETHNIC BACKGROUND
Value N % Cum% ------------------------------------------- White 120 60.0 60.0 Black 21 10.5 70.5 Coloured 2 1.0 71.5 Indian 55 27.5 99.0 Other 2 1.0 100.0 ------------------------------------------- Total 200 100.0
180
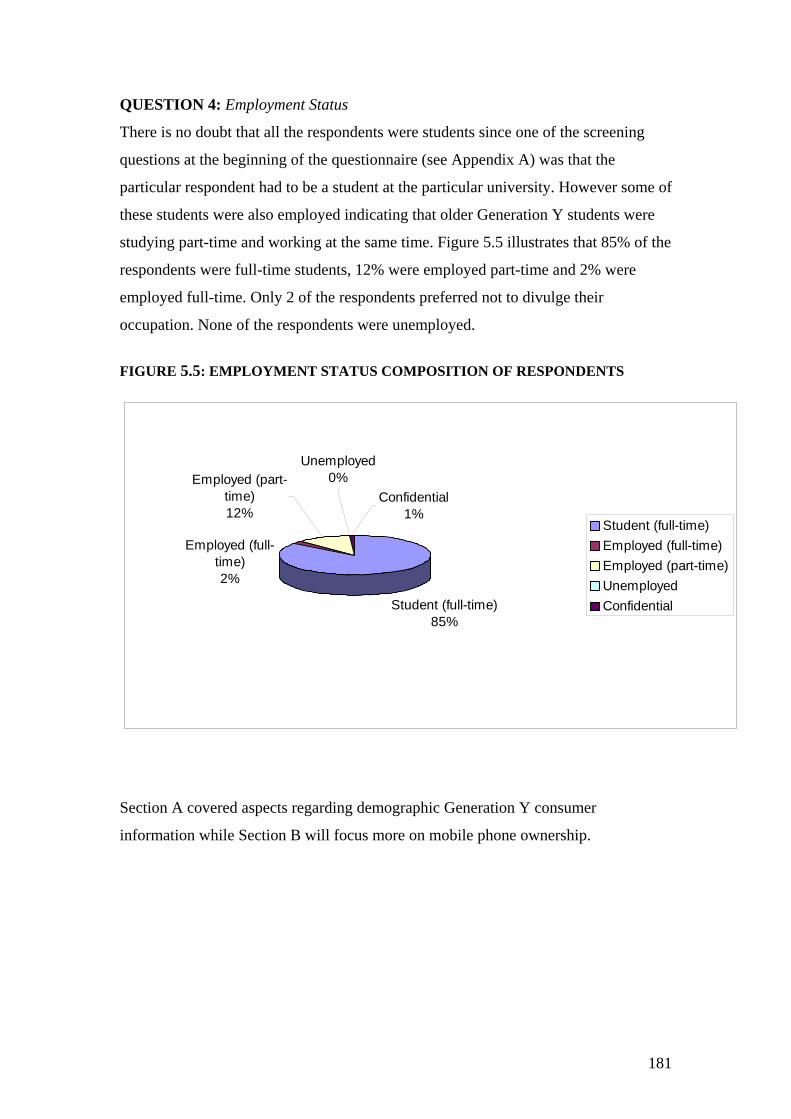
QUESTION 4: Employment Status
There is no doubt that all the respondents were students since one of the screening
questions at the beginning of the questionnaire (see Appendix A) was that the
particular respondent had to be a student at the particular university. However some of
these students were also employed indicating that older Generation Y students were
studying part-time and working at the same time. Figure 5.5 illustrates that 85% of the
respondents were full-time students, 12% were employed part-time and 2% were
employed full-time. Only 2 of the respondents preferred not to divulge their
occupation. None of the respondents were unemployed.
FIGURE 5.5: EMPLOYMENT STATUS COMPOSITION OF RESPONDENTS
Student (full-time)85%
Unemployed0%
Employed (full-time)2%
Employed (part-time)12%
Confidential1%
Student (full-time)Employed (full-time)Employed (part-time)UnemployedConfidential
Section A covered aspects regarding demographic Generation Y consumer
information while Section B will focus more on mobile phone ownership.
181

182
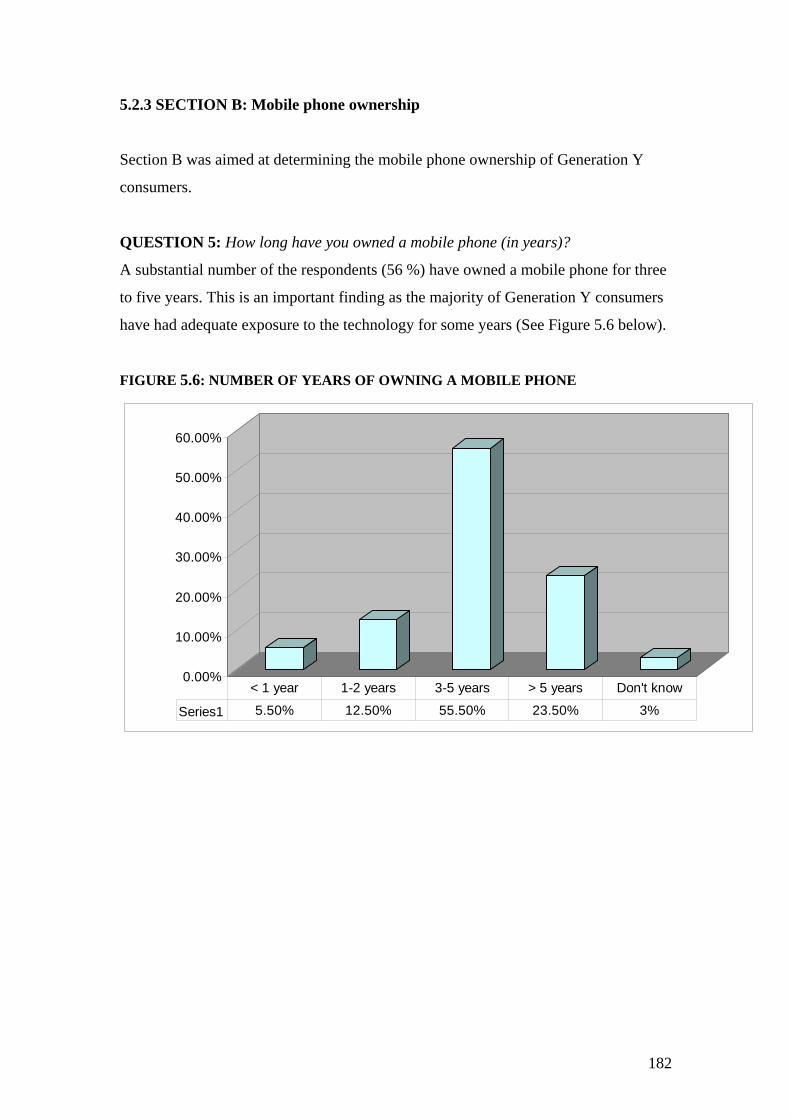
5.2.3 SECTION B: Mobile phone ownership
Section B was aimed at determining the mobile phone ownership of Generation Y
consumers.
QUESTION 5: How long have you owned a mobile phone (in years)?
A substantial number of the respondents (56 %) have owned a mobile phone for three
to five years. This is an important finding as the majority of Generation Y consumers
have had adequate exposure to the technology for some years (See Figure 5.6 below).
FIGURE 5.6: NUMBER OF YEARS OF OWNING A MOBILE PHONE
0.00%
10.00%
20.00%
30.00%
40.00%
50.00%
60.00%
Series1 5.50% 12.50% 55.50% 23.50% 3%
< 1 year 1-2 years 3-5 years > 5 years Don't know
182
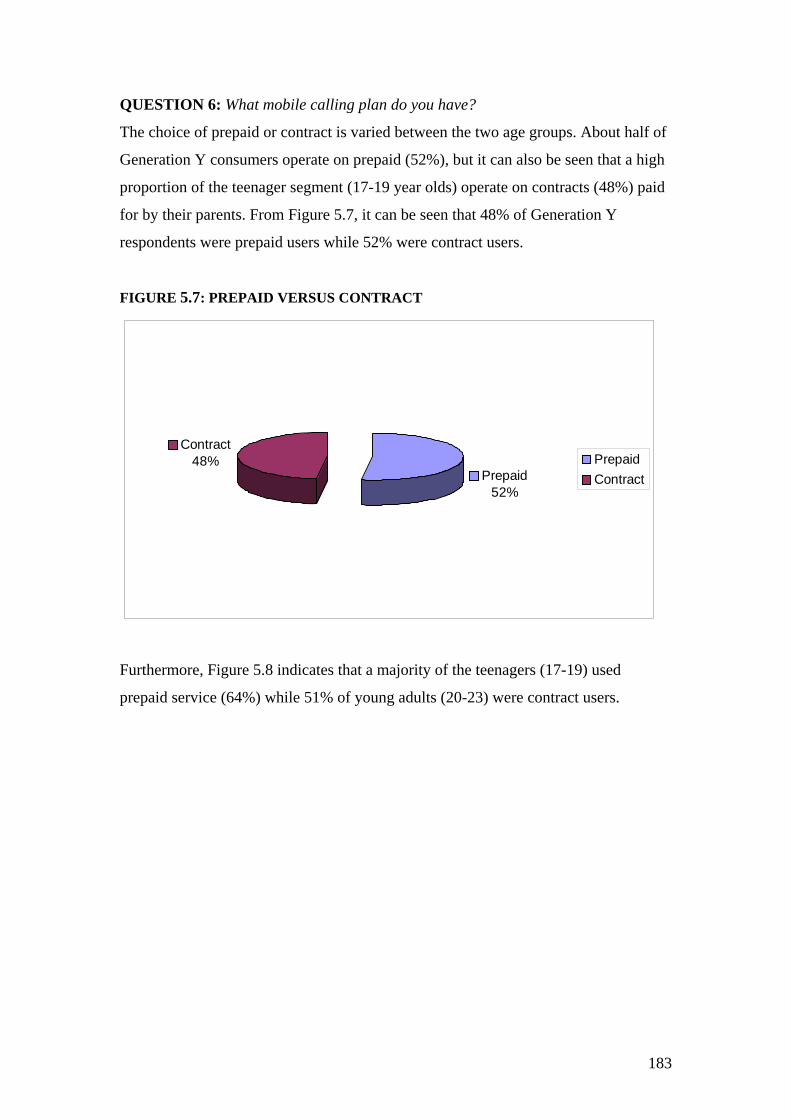
QUESTION 6: What mobile calling plan do you have?
The choice of prepaid or contract is varied between the two age groups. About half of
Generation Y consumers operate on prepaid (52%), but it can also be seen that a high
proportion of the teenager segment (17-19 year olds) operate on contracts (48%) paid
for by their parents. From Figure 5.7, it can be seen that 48% of Generation Y
respondents were prepaid users while 52% were contract users.
FIGURE 5.7: PREPAID VERSUS CONTRACT
Prepaid52%
Contract48% Prepaid
Contract
Furthermore, Figure 5.8 indicates that a majority of the teenagers (17-19) used
prepaid service (64%) while 51% of young adults (20-23) were contract users.
183

184
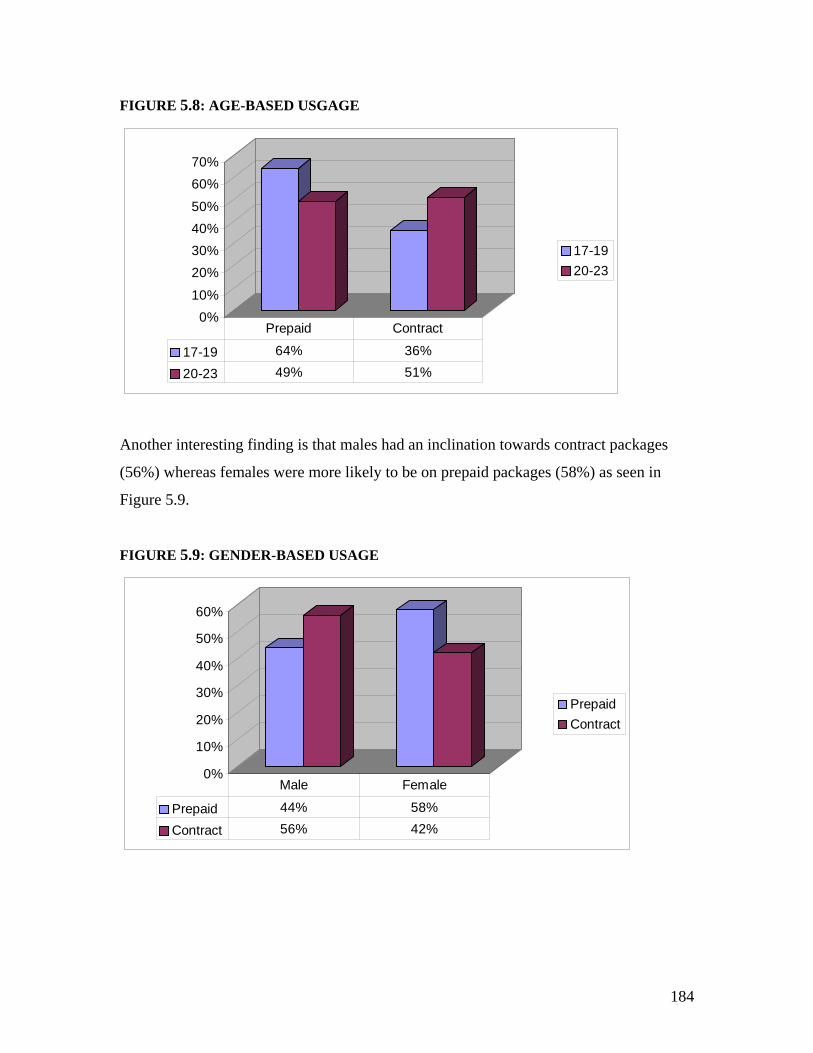
FIGURE 5.8: AGE-BASED USGAGE
0%10%
20%30%40%50%
60%70%
17-1920-23
17-19 64% 36%
20-23 49% 51%
Prepaid Contract
Another interesting finding is that males had an inclination towards contract packages
(56%) whereas females were more likely to be on prepaid packages (58%) as seen in
Figure 5.9.
FIGURE 5.9: GENDER-BASED USAGE
0%
10%
20%
30%
40%
50%
60%
PrepaidContract
Prepaid 44% 58%
Contract 56% 42%
Male Female
184
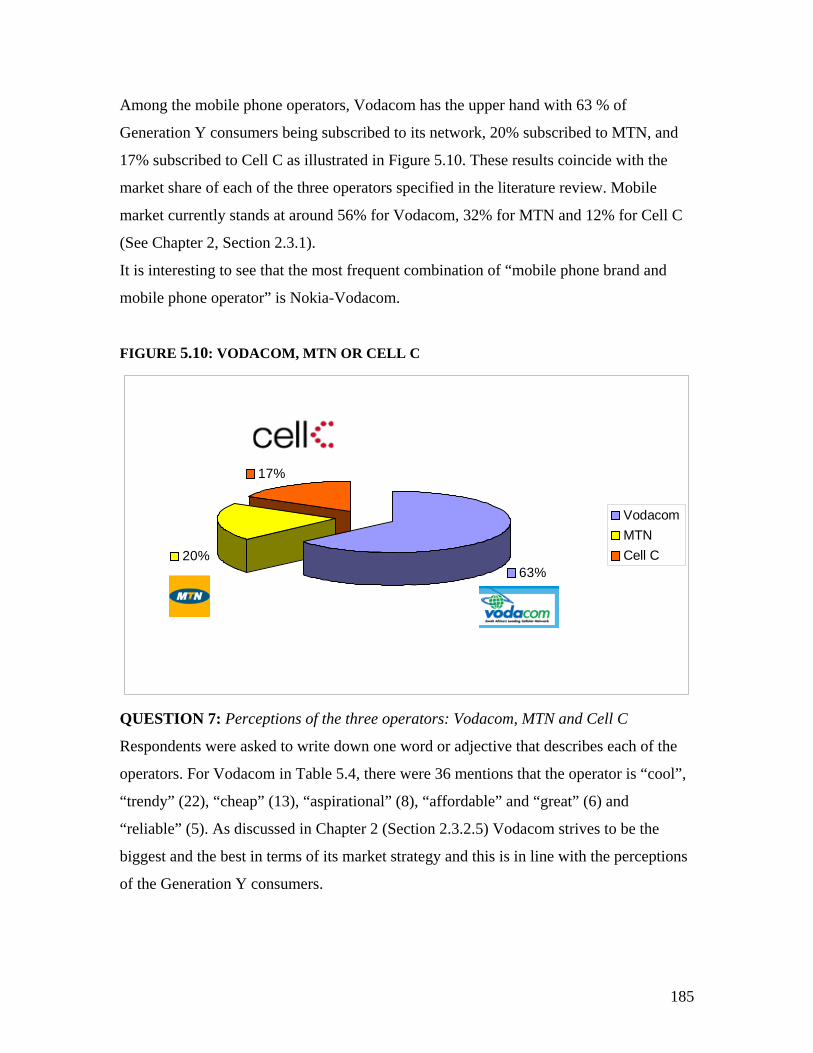
Among the mobile phone operators, Vodacom has the upper hand with 63 % of
Generation Y consumers being subscribed to its network, 20% subscribed to MTN, and
17% subscribed to Cell C as illustrated in Figure 5.10. These results coincide with the
market share of each of the three operators specified in the literature review. Mobile
market currently stands at around 56% for Vodacom, 32% for MTN and 12% for Cell C
(See Chapter 2, Section 2.3.1).
It is interesting to see that the most frequent combination of “mobile phone brand and
mobile phone operator” is Nokia-Vodacom.
FIGURE 5.10: VODACOM, MTN OR CELL C
63%20%
17%
VodacomMTNCell C
QUESTION 7: Perceptions of the three operators: Vodacom, MTN and Cell C
Respondents were asked to write down one word or adjective that describes each of the
operators. For Vodacom in Table 5.4, there were 36 mentions that the operator is “cool”,
“trendy” (22), “cheap” (13), “aspirational” (8), “affordable” and “great” (6) and
“reliable” (5). As discussed in Chapter 2 (Section 2.3.2.5) Vodacom strives to be the
biggest and the best in terms of its market strategy and this is in line with the perceptions
of the Generation Y consumers.
185

186
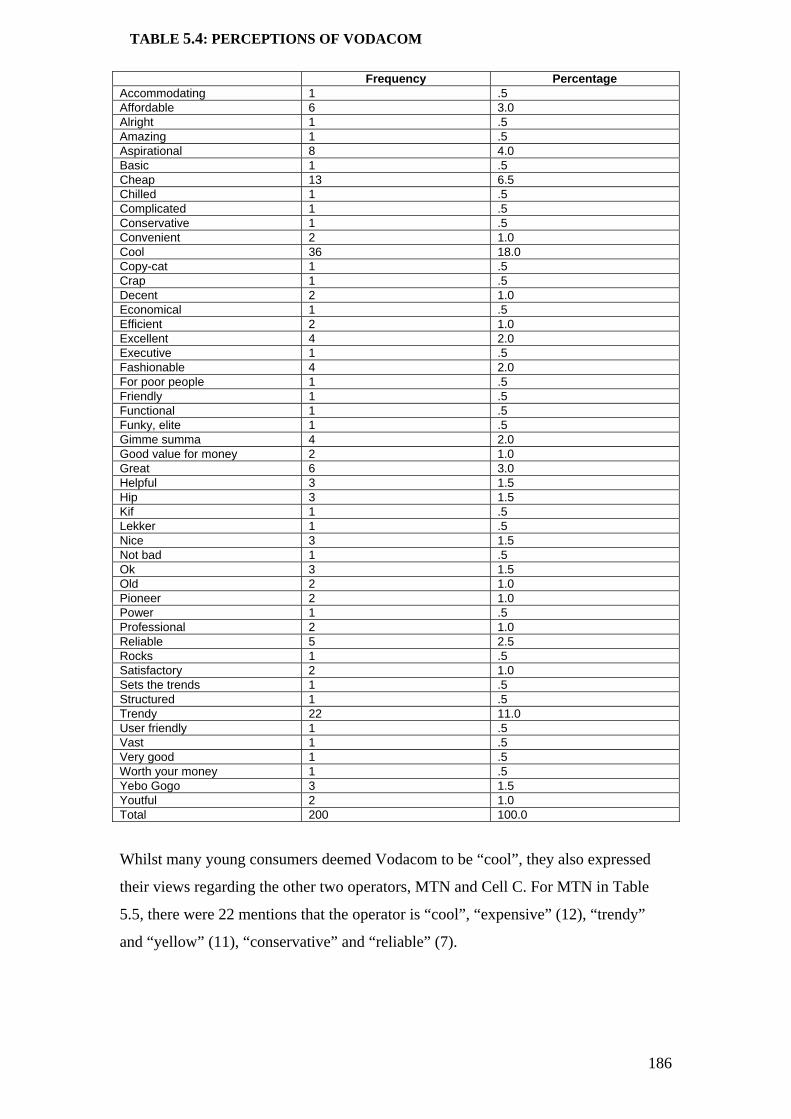
Frequency Percentage Accommodating 1 .5 Affordable 6 3.0 Alright 1 .5 Amazing 1 .5 Aspirational 8 4.0 Basic 1 .5 Cheap 13 6.5 Chilled 1 .5 Complicated 1 .5 Conservative 1 .5 Convenient 2 1.0 Cool 36 18.0 Copy-cat 1 .5 Crap 1 .5 Decent 2 1.0 Economical 1 .5 Efficient 2 1.0 Excellent 4 2.0 Executive 1 .5 Fashionable 4 2.0 For poor people 1 .5 Friendly 1 .5 Functional 1 .5 Funky, elite 1 .5 Gimme summa 4 2.0 Good value for money 2 1.0 Great 6 3.0 Helpful 3 1.5 Hip 3 1.5 Kif 1 .5 Lekker 1 .5 Nice 3 1.5 Not bad 1 .5 Ok 3 1.5 Old 2 1.0 Pioneer 2 1.0 Power 1 .5 Professional 2 1.0 Reliable 5 2.5 Rocks 1 .5 Satisfactory 2 1.0 Sets the trends 1 .5 Structured 1 .5 Trendy 22 11.0 User friendly 1 .5 Vast 1 .5 Very good 1 .5 Worth your money 1 .5 Yebo Gogo 3 1.5 Youtful 2 1.0 Total 200 100.0
TABLE 5.4: PERCEPTIONS OF VODACOM
Whilst many young consumers deemed Vodacom to be “cool”, they also expressed
their views regarding the other two operators, MTN and Cell C. For MTN in Table
5.5, there were 22 mentions that the operator is “cool”, “expensive” (12), “trendy”
and “yellow” (11), “conservative” and “reliable” (7).
186
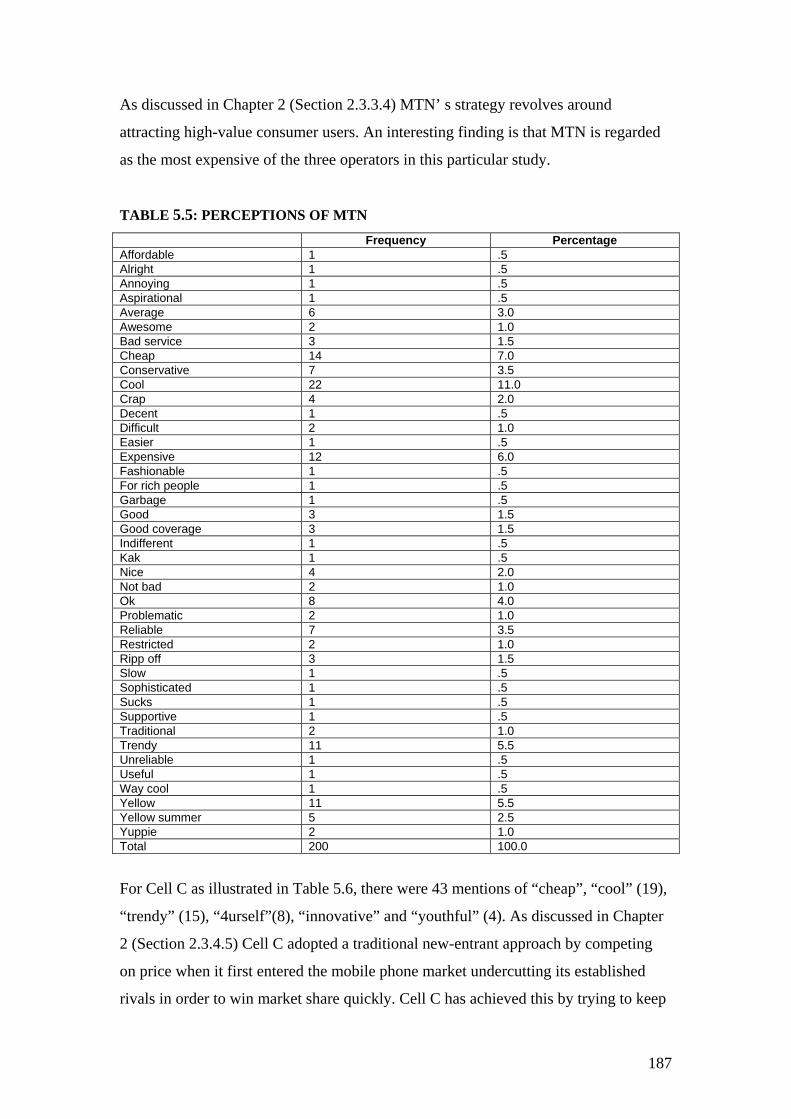
As discussed in Chapter 2 (Section 2.3.3.4) MTN’ s strategy revolves around
attracting high-value consumer users. An interesting finding is that MTN is regarded
as the most expensive of the three operators in this particular study.
TABLE 5.5: PERCEPTIONS OF MTN Frequency Percentage Affordable 1 .5 Alright 1 .5 Annoying 1 .5 Aspirational 1 .5 Average 6 3.0 Awesome 2 1.0 Bad service 3 1.5 Cheap 14 7.0 Conservative 7 3.5 Cool 22 11.0 Crap 4 2.0 Decent 1 .5 Difficult 2 1.0 Easier 1 .5 Expensive 12 6.0 Fashionable 1 .5 For rich people 1 .5 Garbage 1 .5 Good 3 1.5 Good coverage 3 1.5 Indifferent 1 .5 Kak 1 .5 Nice 4 2.0 Not bad 2 1.0 Ok 8 4.0 Problematic 2 1.0 Reliable 7 3.5 Restricted 2 1.0 Ripp off 3 1.5 Slow 1 .5 Sophisticated 1 .5 Sucks 1 .5 Supportive 1 .5 Traditional 2 1.0 Trendy 11 5.5 Unreliable 1 .5 Useful 1 .5 Way cool 1 .5 Yellow 11 5.5 Yellow summer 5 2.5 Yuppie 2 1.0 Total 200 100.0
For Cell C as illustrated in Table 5.6, there were 43 mentions of “cheap”, “cool” (19),
“trendy” (15), “4urself”(8), “innovative” and “youthful” (4). As discussed in Chapter
2 (Section 2.3.4.5) Cell C adopted a traditional new-entrant approach by competing
on price when it first entered the mobile phone market undercutting its established
rivals in order to win market share quickly. Cell C has achieved this by trying to keep
187
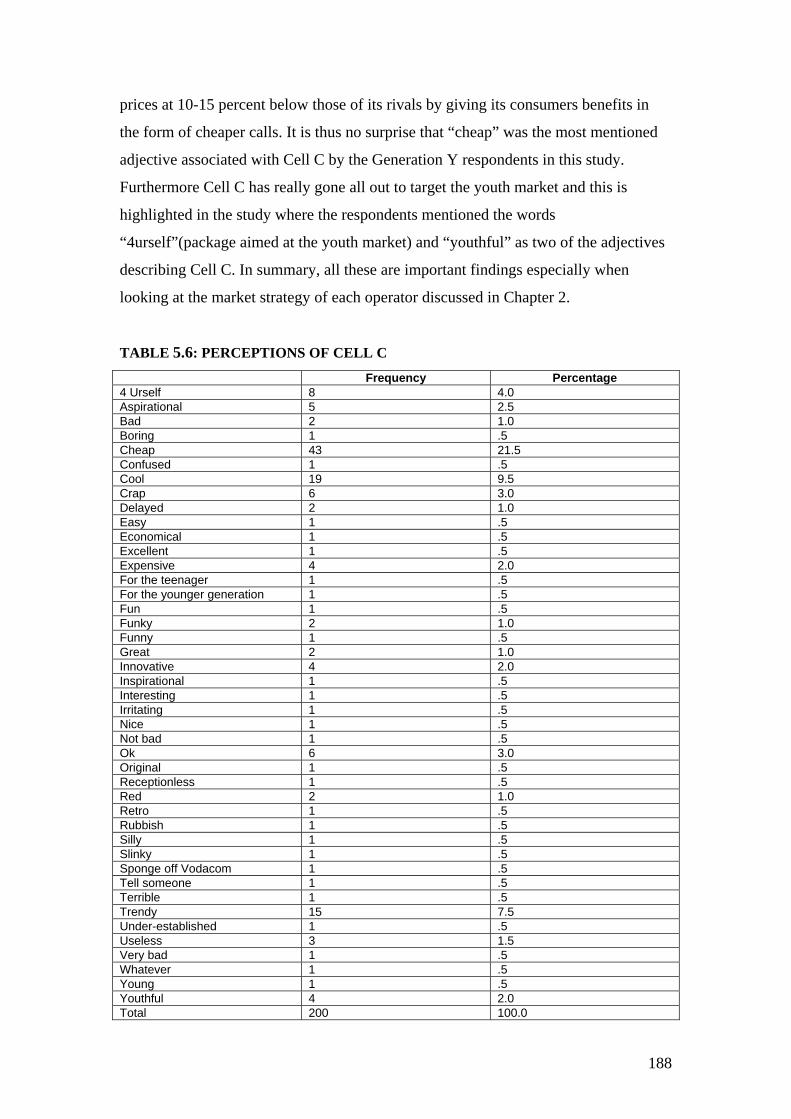
prices at 10-15 percent below those of its rivals by giving its consumers benefits in
the form of cheaper calls. It is thus no surprise that “cheap” was the most mentioned
adjective associated with Cell C by the Generation Y respondents in this study.
Furthermore Cell C has really gone all out to target the youth market and this is
highlighted in the study where the respondents mentioned the words
“4urself”(package aimed at the youth market) and “youthful” as two of the adjectives
describing Cell C. In summary, all these are important findings especially when
looking at the market strategy of each operator discussed in Chapter 2.
TABLE 5.6: PERCEPTIONS OF CELL C Frequency Percentage 4 Urself 8 4.0 Aspirational 5 2.5 Bad 2 1.0 Boring 1 .5 Cheap 43 21.5 Confused 1 .5 Cool 19 9.5 Crap 6 3.0 Delayed 2 1.0 Easy 1 .5 Economical 1 .5 Excellent 1 .5 Expensive 4 2.0 For the teenager 1 .5 For the younger generation 1 .5 Fun 1 .5 Funky 2 1.0 Funny 1 .5 Great 2 1.0 Innovative 4 2.0 Inspirational 1 .5 Interesting 1 .5 Irritating 1 .5 Nice 1 .5 Not bad 1 .5 Ok 6 3.0 Original 1 .5 Receptionless 1 .5 Red 2 1.0 Retro 1 .5 Rubbish 1 .5 Silly 1 .5 Slinky 1 .5 Sponge off Vodacom 1 .5 Tell someone 1 .5 Terrible 1 .5 Trendy 15 7.5 Under-established 1 .5 Useless 3 1.5 Very bad 1 .5 Whatever 1 .5 Young 1 .5 Youthful 4 2.0 Total 200 100.0
188

QUESTION 8: Have you used two or more of the operators above (Vodacom, MTN
and Cell C)?
As illustrated in Figure 5.11, a substantial number of Generation Y consumers have
not used more than one of the operators (75%) whereas 25% of them have used more
than one operator. This is interesting to note that Generation Y students seem to be
brand loyal and that they stick to one provider.
FIGURE 5.11: MORE THAN ONE OF THE NETWORK OPERATORS USED
Yes25%
No75%
YesNo
QUESTION 9: Which of the networks do you personally think is best on each of the
following aspects of service?
Mobile users who would select a network as the best would unsurprisingly most likely
to select the network they are currently using. Thus this question was answered by the
25% of Generation Y mobile customers who have used two or more of the mobile
operators. The respondents were asked which networks they thought were the best
(Table 5.7) in several aspects of service. Vodacom received the highest rating in
choice of package, tariffs available, and geographic coverage whilst Cell C received
the highest rating in cost of calls. It is interesting to note that MTN is seen as a me-too
competitor because it did not feature strongly on any of the service items. In most of
the other service aspects such as ability to make calls without getting cut off, quality
of customer service, and choice of services available, the most common answer given
was “don’t know” indicating that many Generation Y customers do not have a view
regarding which network is best in several aspects of service.
189

190
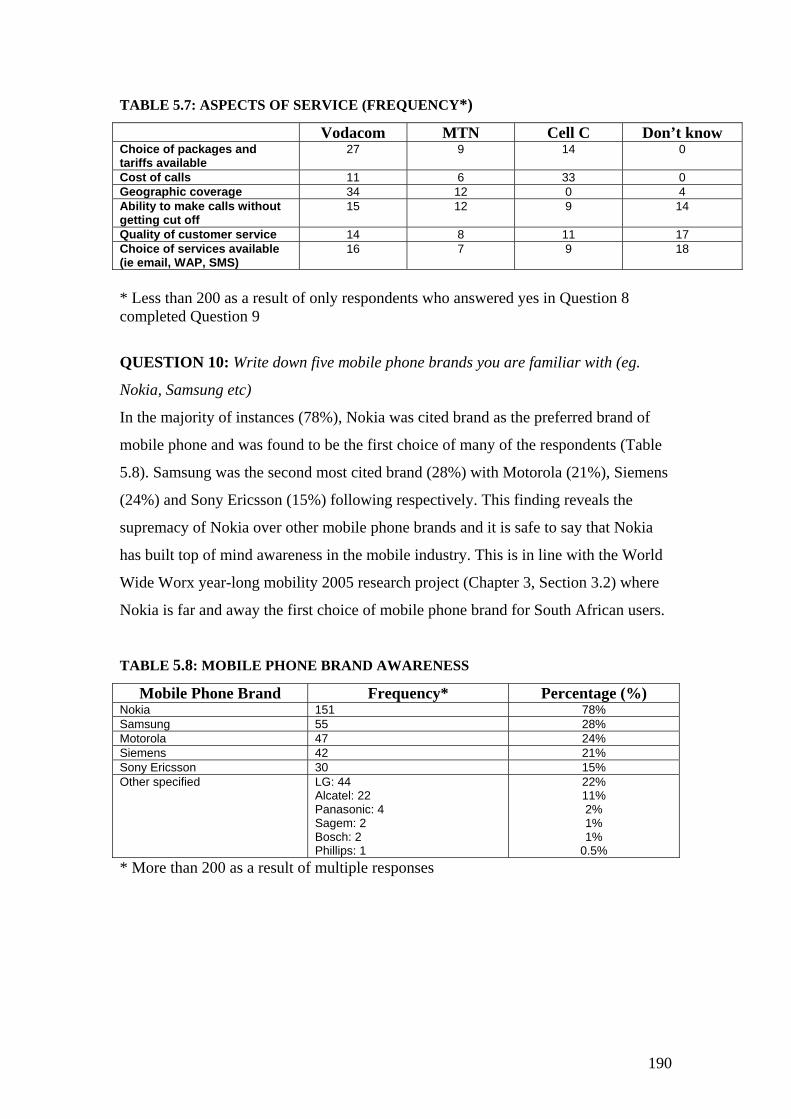
TABLE 5.7: ASPECTS OF SERVICE (FREQUENCY*) Vodacom MTN Cell C Don’t know Choice of packages and tariffs available
27 9 14 0
Cost of calls 11 6 33 0 Geographic coverage 34 12 0 4 Ability to make calls without getting cut off
15 12 9 14
Quality of customer service 14 8 11 17 Choice of services available (ie email, WAP, SMS)
16 7 9 18
* Less than 200 as a result of only respondents who answered yes in Question 8 completed Question 9
QUESTION 10: Write down five mobile phone brands you are familiar with (eg.
Nokia, Samsung etc)
In the majority of instances (78%), Nokia was cited brand as the preferred brand of
mobile phone and was found to be the first choice of many of the respondents (Table
5.8). Samsung was the second most cited brand (28%) with Motorola (21%), Siemens
(24%) and Sony Ericsson (15%) following respectively. This finding reveals the
supremacy of Nokia over other mobile phone brands and it is safe to say that Nokia
has built top of mind awareness in the mobile industry. This is in line with the World
Wide Worx year-long mobility 2005 research project (Chapter 3, Section 3.2) where
Nokia is far and away the first choice of mobile phone brand for South African users.
TABLE 5.8: MOBILE PHONE BRAND AWARENESS
Mobile Phone Brand Frequency* Percentage (%) Nokia 151 78% Samsung 55 28% Motorola 47 24% Siemens 42 21% Sony Ericsson 30 15% Other specified LG: 44
Alcatel: 22 Panasonic: 4 Sagem: 2 Bosch: 2 Phillips: 1
22% 11% 2% 1% 1%
0.5% * More than 200 as a result of multiple responses
190
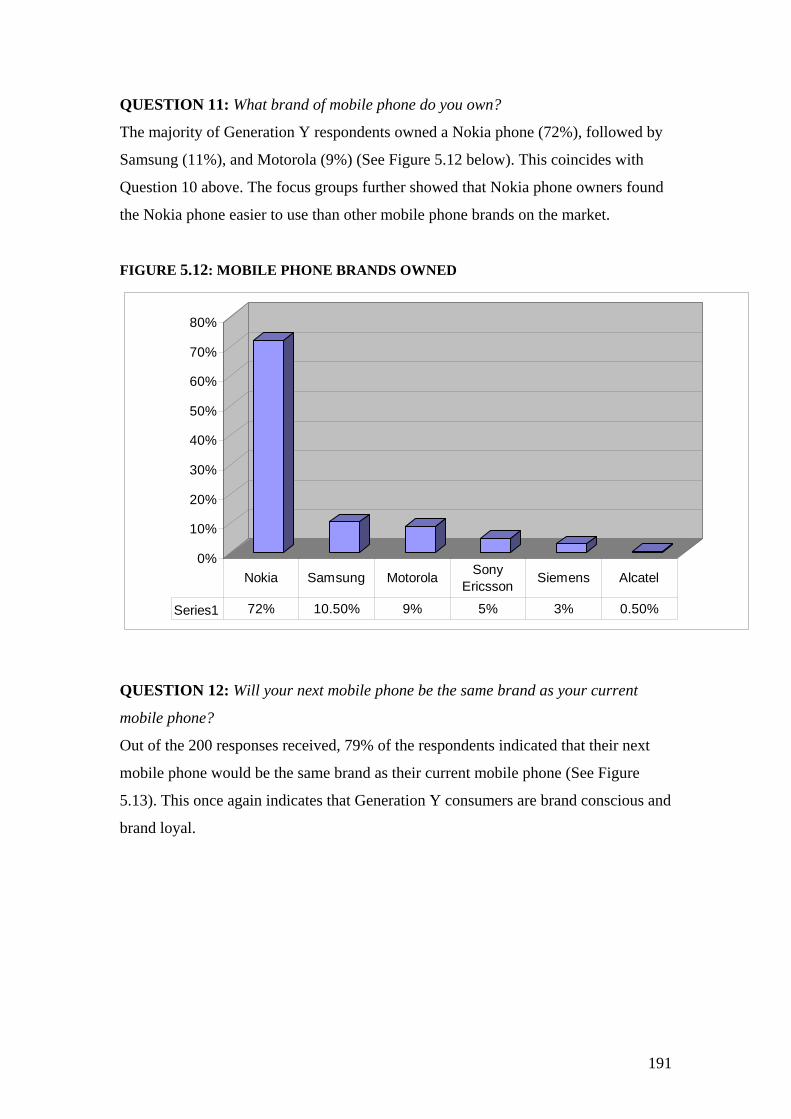
QUESTION 11: What brand of mobile phone do you own?
The majority of Generation Y respondents owned a Nokia phone (72%), followed by
Samsung (11%), and Motorola (9%) (See Figure 5.12 below). This coincides with
Question 10 above. The focus groups further showed that Nokia phone owners found
the Nokia phone easier to use than other mobile phone brands on the market.
FIGURE 5.12: MOBILE PHONE BRANDS OWNED
0%
10%
20%
30%
40%
50%
60%
70%
80%
Series1 72% 10.50% 9% 5% 3% 0.50%
Nokia Samsung Motorola Sony Ericsson Siemens Alcatel
QUESTION 12: Will your next mobile phone be the same brand as your current
mobile phone?
Out of the 200 responses received, 79% of the respondents indicated that their next
mobile phone would be the same brand as their current mobile phone (See Figure
5.13). This once again indicates that Generation Y consumers are brand conscious and
brand loyal.
191
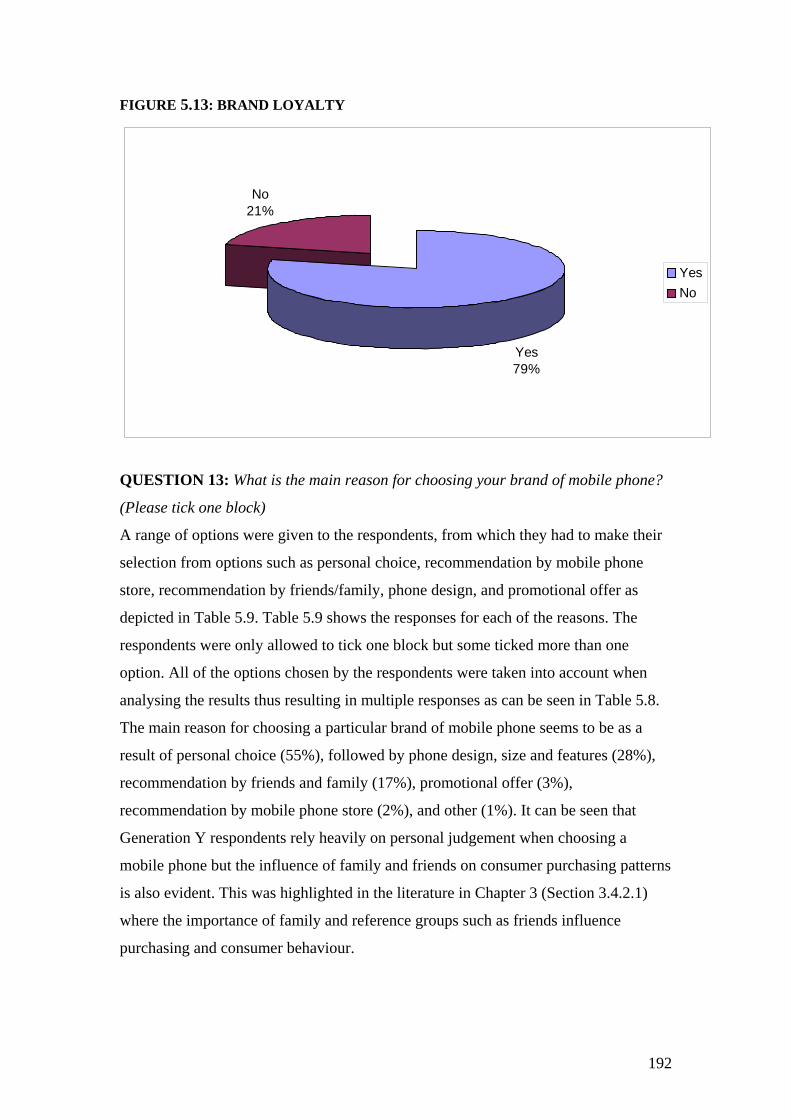
FIGURE 5.13: BRAND LOYALTY
Yes79%
No21%
YesNo
QUESTION 13: What is the main reason for choosing your brand of mobile phone?
(Please tick one block)
A range of options were given to the respondents, from which they had to make their
selection from options such as personal choice, recommendation by mobile phone
store, recommendation by friends/family, phone design, and promotional offer as
depicted in Table 5.9. Table 5.9 shows the responses for each of the reasons. The
respondents were only allowed to tick one block but some ticked more than one
option. All of the options chosen by the respondents were taken into account when
analysing the results thus resulting in multiple responses as can be seen in Table 5.8.
The main reason for choosing a particular brand of mobile phone seems to be as a
result of personal choice (55%), followed by phone design, size and features (28%),
recommendation by friends and family (17%), promotional offer (3%),
recommendation by mobile phone store (2%), and other (1%). It can be seen that
Generation Y respondents rely heavily on personal judgement when choosing a
mobile phone but the influence of family and friends on consumer purchasing patterns
is also evident. This was highlighted in the literature in Chapter 3 (Section 3.4.2.1)
where the importance of family and reference groups such as friends influence
purchasing and consumer behaviour.
192
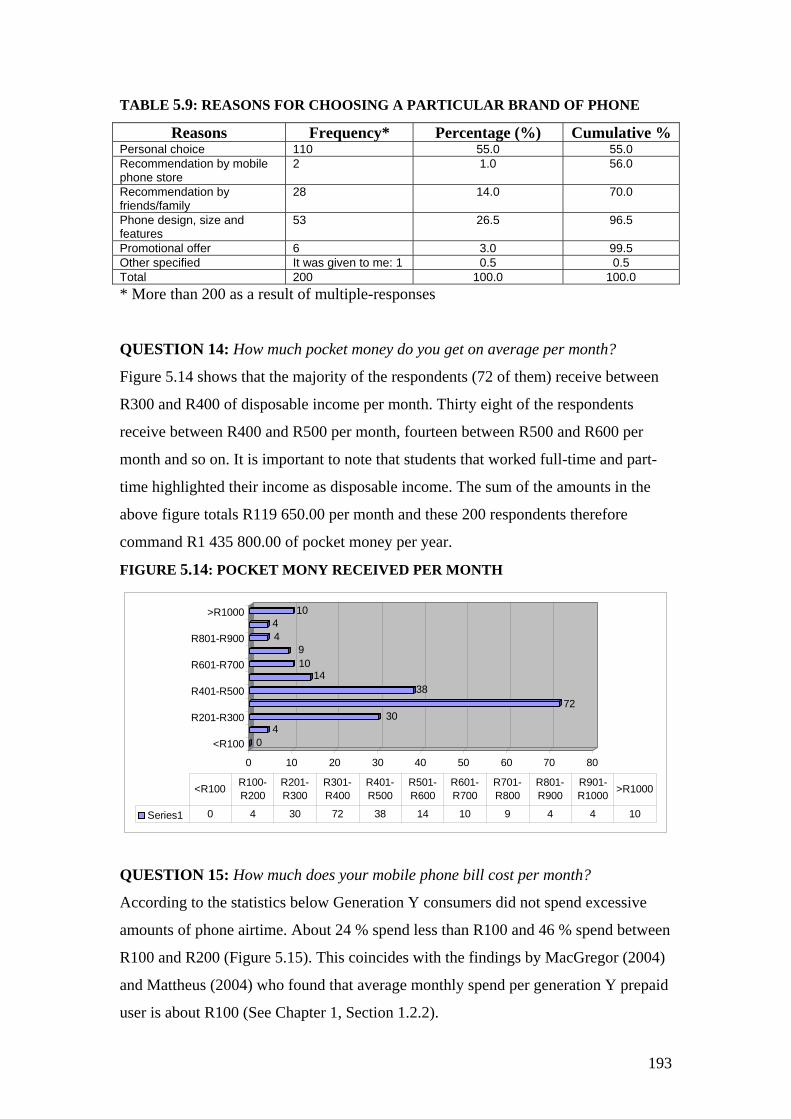
TABLE 5.9: REASONS FOR CHOOSING A PARTICULAR BRAND OF PHONE
Reasons Frequency* Percentage (%) Cumulative %Personal choice 110 55.0 55.0 Recommendation by mobile phone store
2 1.0 56.0
Recommendation by friends/family
28 14.0 70.0
Phone design, size and features
53 26.5 96.5
Promotional offer 6 3.0 99.5 Other specified It was given to me: 1 0.5 0.5 Total 200 100.0 100.0 * More than 200 as a result of multiple-responses
QUESTION 14: How much pocket money do you get on average per month?
Figure 5.14 shows that the majority of the respondents (72 of them) receive between
R300 and R400 of disposable income per month. Thirty eight of the respondents
receive between R400 and R500 per month, fourteen between R500 and R600 per
month and so on. It is important to note that students that worked full-time and part-
time highlighted their income as disposable income. The sum of the amounts in the
above figure totals R119 650.00 per month and these 200 respondents therefore
command R1 435 800.00 of pocket money per year.
FIGURE 5.14: POCKET MONY RECEIVED PER MONTH
04
3072
3814
109
44
10
0 10 20 30 40 50 60 70 80
<R100
R201-R300
R401-R500
R601-R700
R801-R900
>R1000
Series1 0 4 30 72 38 14 10 9 4 4 10
<R100 R100-R200
R201-R300
R301-R400
R401-R500
R501-R600
R601-R700
R701-R800
R801-R900
R901-R1000 >R1000
QUESTION 15: How much does your mobile phone bill cost per month?
According to the statistics below Generation Y consumers did not spend excessive
amounts of phone airtime. About 24 % spend less than R100 and 46 % spend between
R100 and R200 (Figure 5.15). This coincides with the findings by MacGregor (2004)
and Mattheus (2004) who found that average monthly spend per generation Y prepaid
user is about R100 (See Chapter 1, Section 1.2.2).
193

194
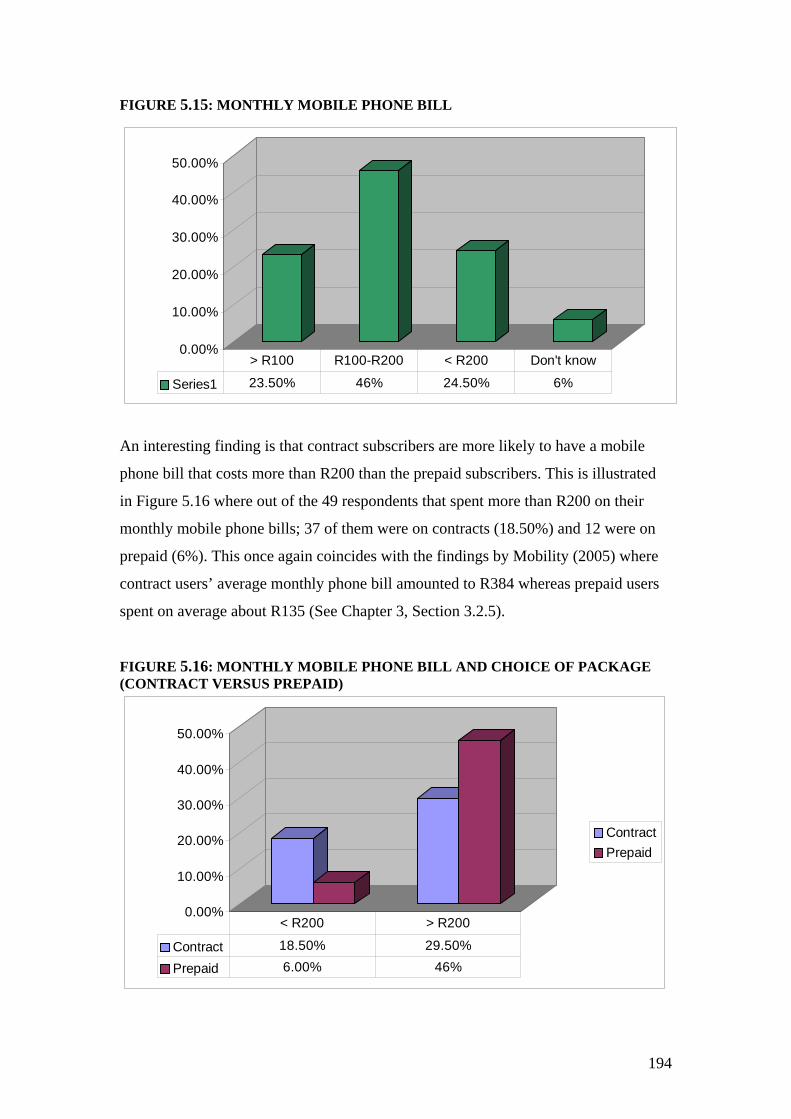
FIGURE 5.15: MONTHLY MOBILE PHONE BILL
0.00%
10.00%
20.00%
30.00%
40.00%
50.00%
Series1 23.50% 46% 24.50% 6%
> R100 R100-R200 < R200 Don't know
An interesting finding is that contract subscribers are more likely to have a mobile
phone bill that costs more than R200 than the prepaid subscribers. This is illustrated
in Figure 5.16 where out of the 49 respondents that spent more than R200 on their
monthly mobile phone bills; 37 of them were on contracts (18.50%) and 12 were on
prepaid (6%). This once again coincides with the findings by Mobility (2005) where
contract users’ average monthly phone bill amounted to R384 whereas prepaid users
spent on average about R135 (See Chapter 3, Section 3.2.5).
FIGURE 5.16: MONTHLY MOBILE PHONE BILL AND CHOICE OF PACKAGE (CONTRACT VERSUS PREPAID)
0.00%
10.00%
20.00%
30.00%
40.00%
50.00%
ContractPrepaid
Contract 18.50% 29.50%
Prepaid 6.00% 46%
< R200 > R200
194
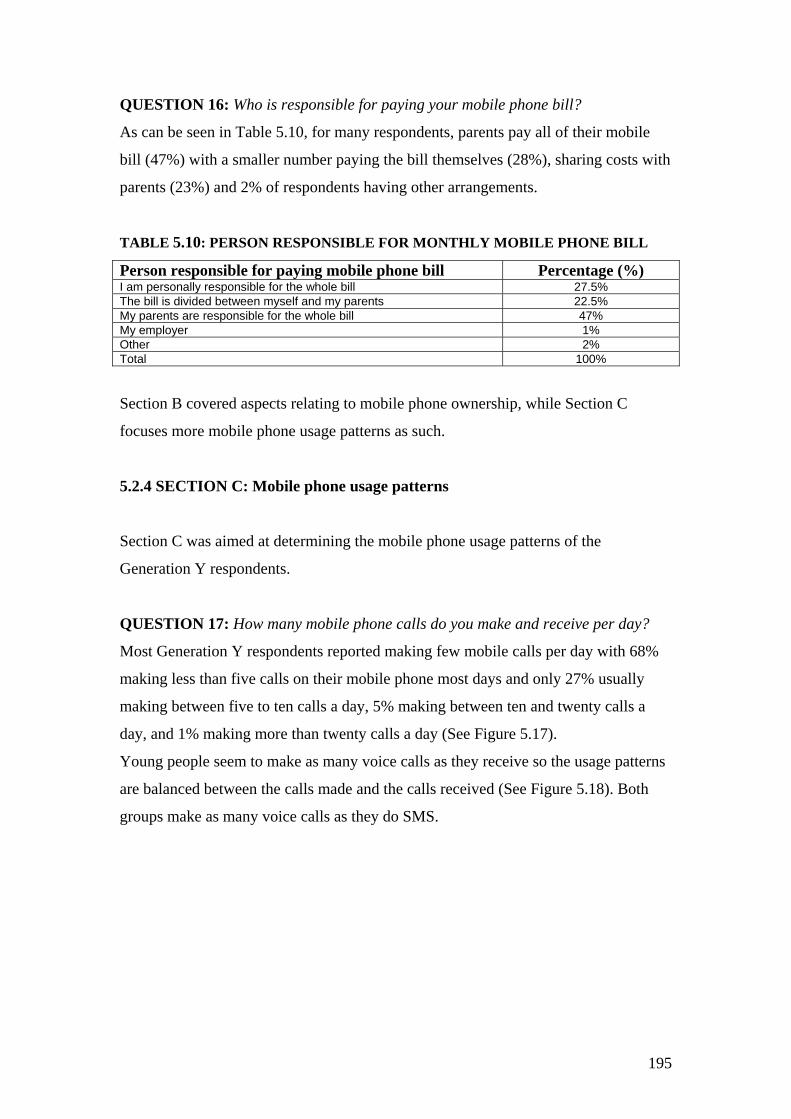
QUESTION 16: Who is responsible for paying your mobile phone bill?
As can be seen in Table 5.10, for many respondents, parents pay all of their mobile
bill (47%) with a smaller number paying the bill themselves (28%), sharing costs with
parents (23%) and 2% of respondents having other arrangements.
TABLE 5.10: PERSON RESPONSIBLE FOR MONTHLY MOBILE PHONE BILL
Person responsible for paying mobile phone bill Percentage (%) I am personally responsible for the whole bill 27.5% The bill is divided between myself and my parents 22.5% My parents are responsible for the whole bill 47% My employer 1% Other 2% Total 100%
Section B covered aspects relating to mobile phone ownership, while Section C
focuses more mobile phone usage patterns as such.
5.2.4 SECTION C: Mobile phone usage patterns
Section C was aimed at determining the mobile phone usage patterns of the
Generation Y respondents.
QUESTION 17: How many mobile phone calls do you make and receive per day?
Most Generation Y respondents reported making few mobile calls per day with 68%
making less than five calls on their mobile phone most days and only 27% usually
making between five to ten calls a day, 5% making between ten and twenty calls a
day, and 1% making more than twenty calls a day (See Figure 5.17).
Young people seem to make as many voice calls as they receive so the usage patterns
are balanced between the calls made and the calls received (See Figure 5.18). Both
groups make as many voice calls as they do SMS.
195
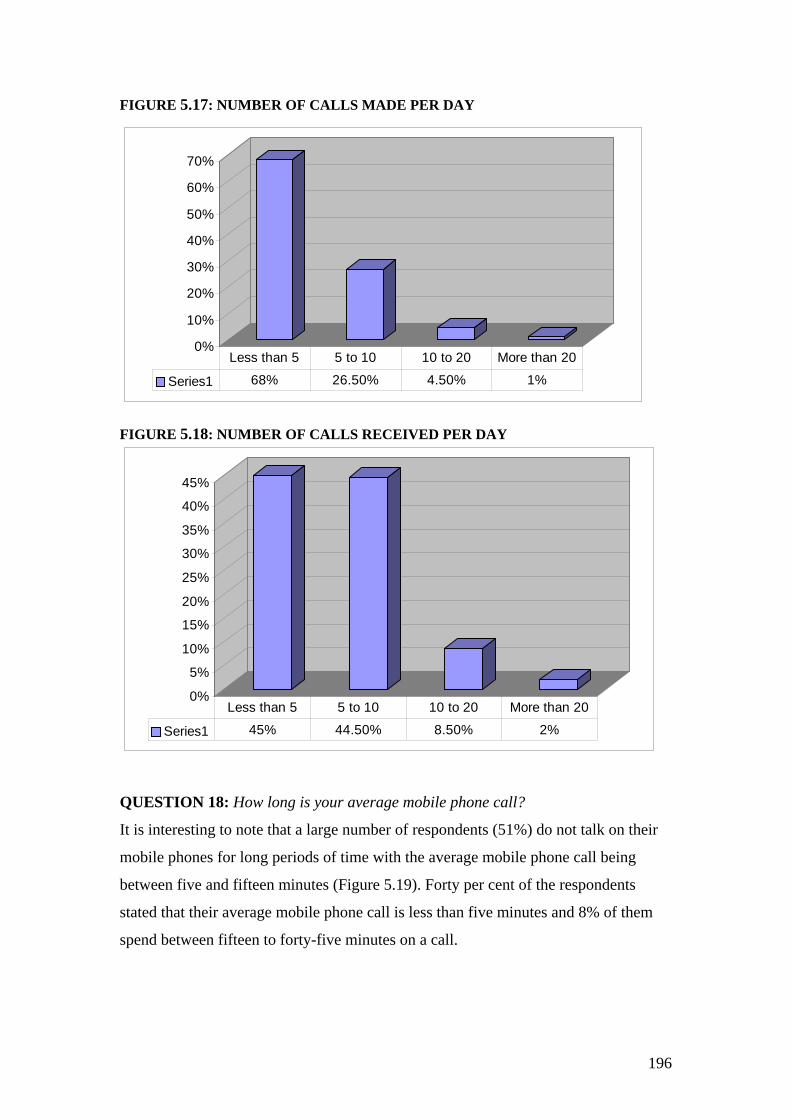
FIGURE 5.17: NUMBER OF CALLS MADE PER DAY
0%
10%
20%
30%
40%
50%
60%
70%
Series1 68% 26.50% 4.50% 1%
Less than 5 5 to 10 10 to 20 More than 20
FIGURE 5.18: NUMBER OF CALLS RECEIVED PER DAY
0%
5%
10%
15%
20%
25%
30%
35%
40%
45%
Series1 45% 44.50% 8.50% 2%
Less than 5 5 to 10 10 to 20 More than 20
QUESTION 18: How long is your average mobile phone call?
It is interesting to note that a large number of respondents (51%) do not talk on their
mobile phones for long periods of time with the average mobile phone call being
between five and fifteen minutes (Figure 5.19). Forty per cent of the respondents
stated that their average mobile phone call is less than five minutes and 8% of them
spend between fifteen to forty-five minutes on a call.
196
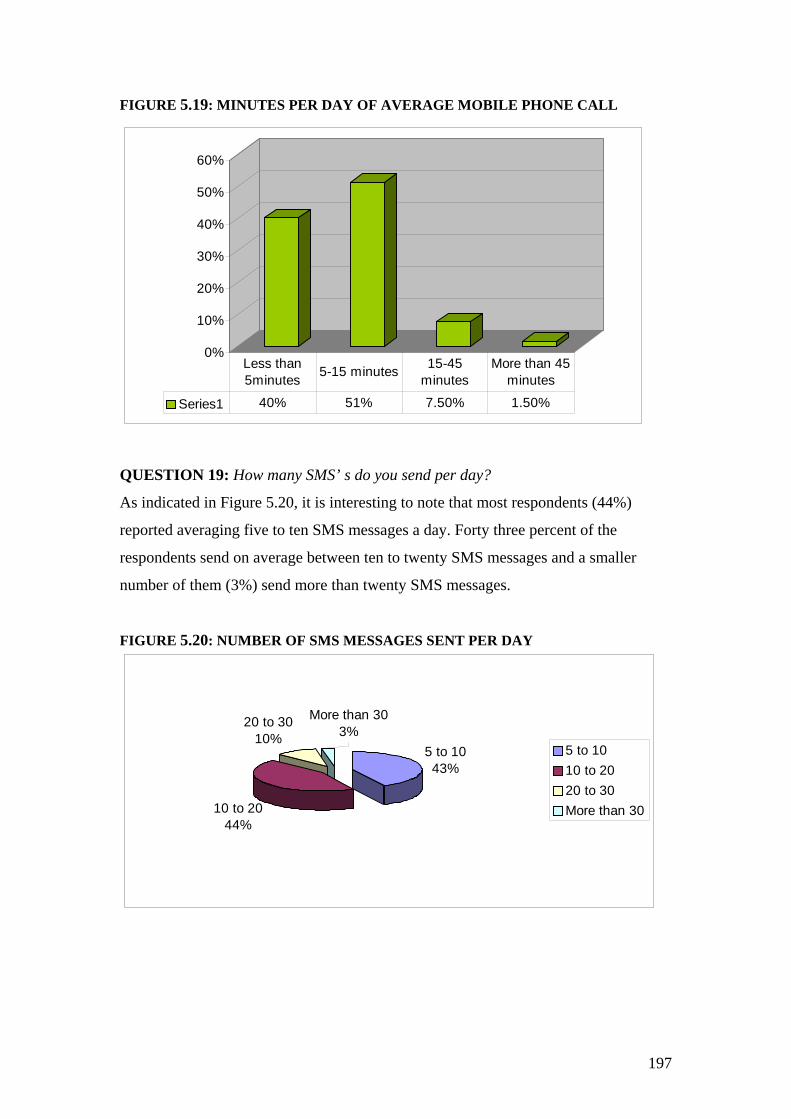
FIGURE 5.19: MINUTES PER DAY OF AVERAGE MOBILE PHONE CALL
0%
10%
20%
30%
40%
50%
60%
Series1 40% 51% 7.50% 1.50%
Less than 5minutes 5-15 minutes 15-45
minutesMore than 45
minutes
QUESTION 19: How many SMS’ s do you send per day?
As indicated in Figure 5.20, it is interesting to note that most respondents (44%)
reported averaging five to ten SMS messages a day. Forty three percent of the
respondents send on average between ten to twenty SMS messages and a smaller
number of them (3%) send more than twenty SMS messages.
FIGURE 5.20: NUMBER OF SMS MESSAGES SENT PER DAY
5 to 1043%
10 to 2044%
20 to 3010%
More than 303%
5 to 1010 to 2020 to 30More than 30
197
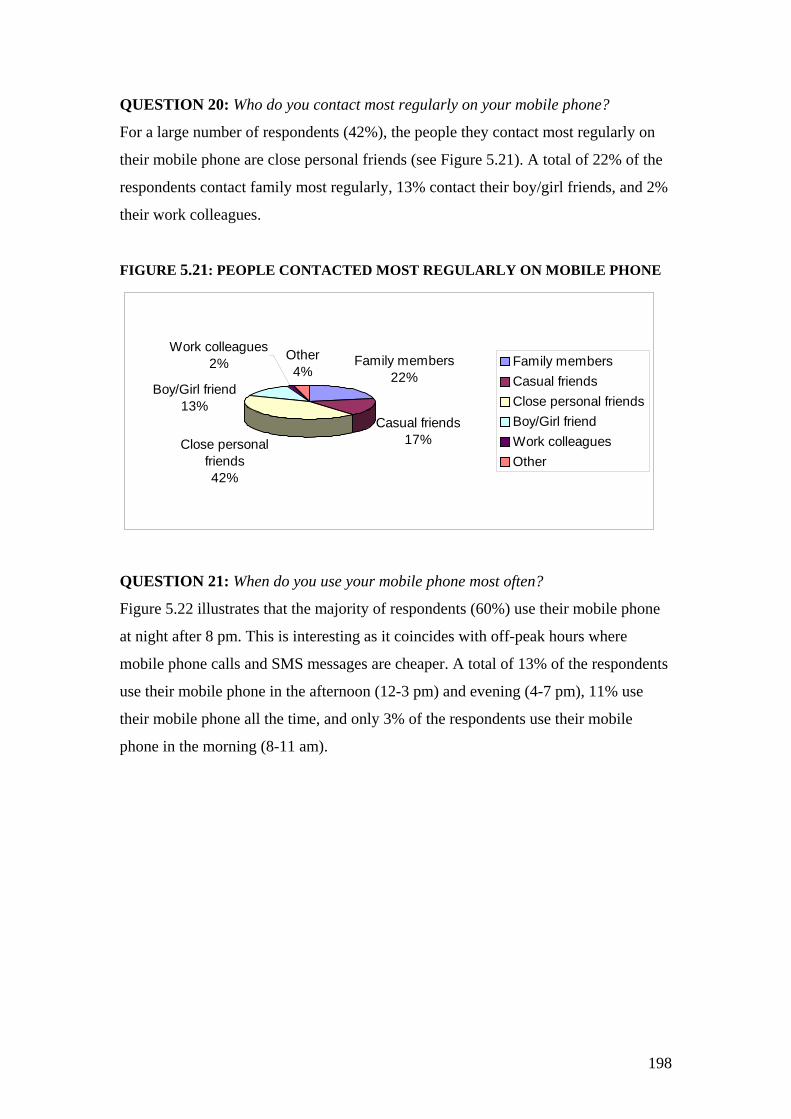
QUESTION 20: Who do you contact most regularly on your mobile phone?
For a large number of respondents (42%), the people they contact most regularly on
their mobile phone are close personal friends (see Figure 5.21). A total of 22% of the
respondents contact family most regularly, 13% contact their boy/girl friends, and 2%
their work colleagues.
FIGURE 5.21: PEOPLE CONTACTED MOST REGULARLY ON MOBILE PHONE
Family members22%
Casual friends17%Close personal
friends42%
Other4%
Boy/Girl friend13%
Work colleagues2% Family members
Casual friendsClose personal friendsBoy/Girl friendWork colleaguesOther
QUESTION 21: When do you use your mobile phone most often?
Figure 5.22 illustrates that the majority of respondents (60%) use their mobile phone
at night after 8 pm. This is interesting as it coincides with off-peak hours where
mobile phone calls and SMS messages are cheaper. A total of 13% of the respondents
use their mobile phone in the afternoon (12-3 pm) and evening (4-7 pm), 11% use
their mobile phone all the time, and only 3% of the respondents use their mobile
phone in the morning (8-11 am).
198
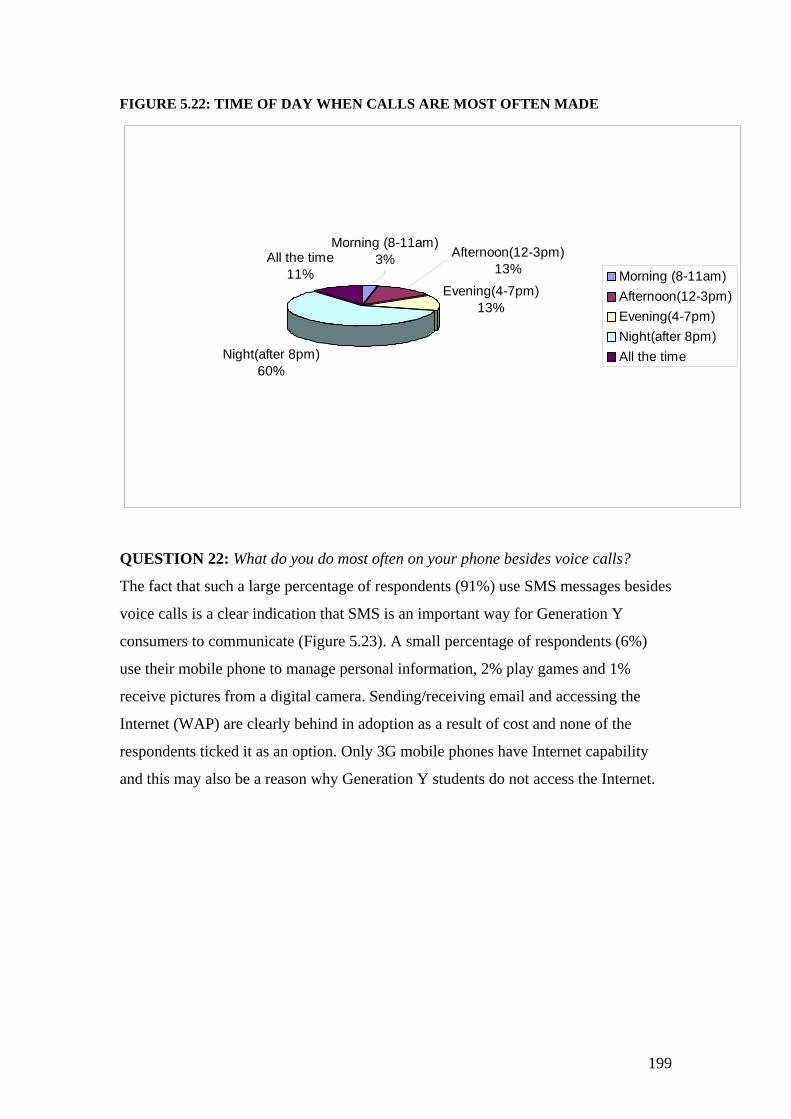
FIGURE 5.22: TIME OF DAY WHEN CALLS ARE MOST OFTEN MADE
Evening(4-7pm)13%
Night(after 8pm)60%
All the time11%
Morning (8-11am)3% Afternoon(12-3pm)
13% Morning (8-11am)Afternoon(12-3pm)Evening(4-7pm)Night(after 8pm)All the time
QUESTION 22: What do you do most often on your phone besides voice calls?
The fact that such a large percentage of respondents (91%) use SMS messages besides
voice calls is a clear indication that SMS is an important way for Generation Y
consumers to communicate (Figure 5.23). A small percentage of respondents (6%)
use their mobile phone to manage personal information, 2% play games and 1%
receive pictures from a digital camera. Sending/receiving email and accessing the
Internet (WAP) are clearly behind in adoption as a result of cost and none of the
respondents ticked it as an option. Only 3G mobile phones have Internet capability
and this may also be a reason why Generation Y students do not access the Internet.
199
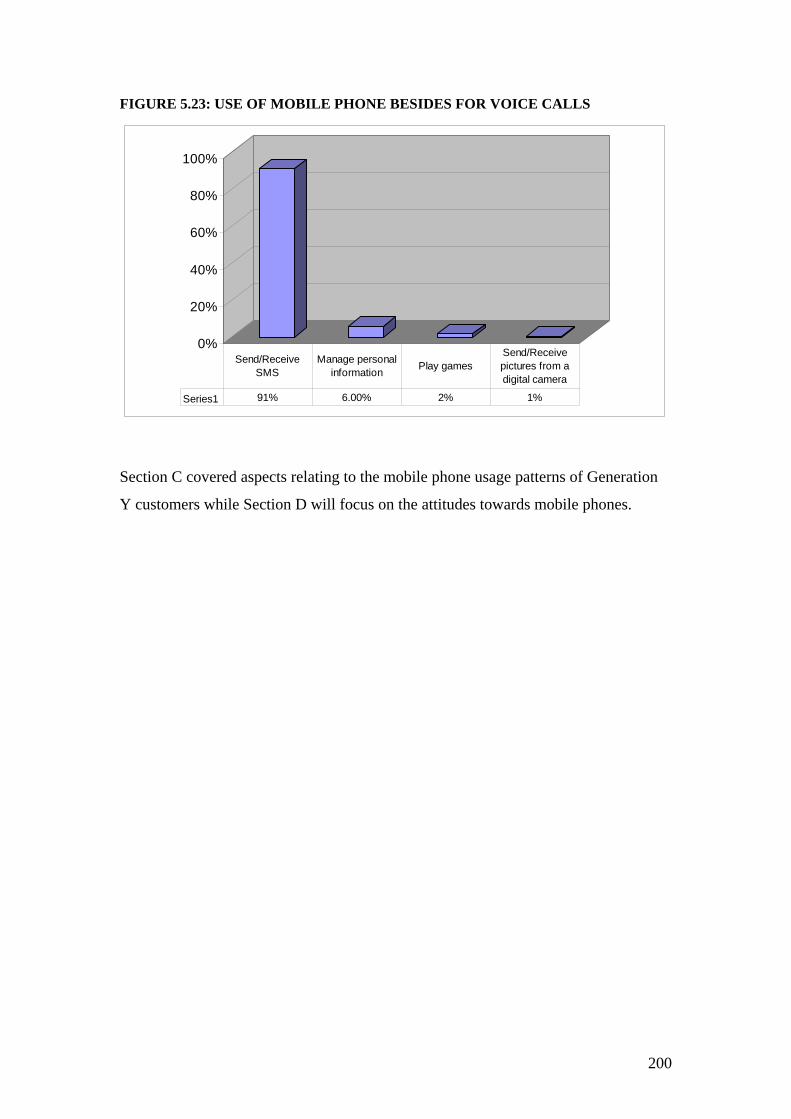
FIGURE 5.23: USE OF MOBILE PHONE BESIDES FOR VOICE CALLS
0%
20%
40%
60%
80%
100%
Series1 91% 6.00% 2% 1%
Send/Receive SMS
Manage personal information Play games
Send/Receive pictures from a digital camera
Section C covered aspects relating to the mobile phone usage patterns of Generation
Y customers while Section D will focus on the attitudes towards mobile phones.
200
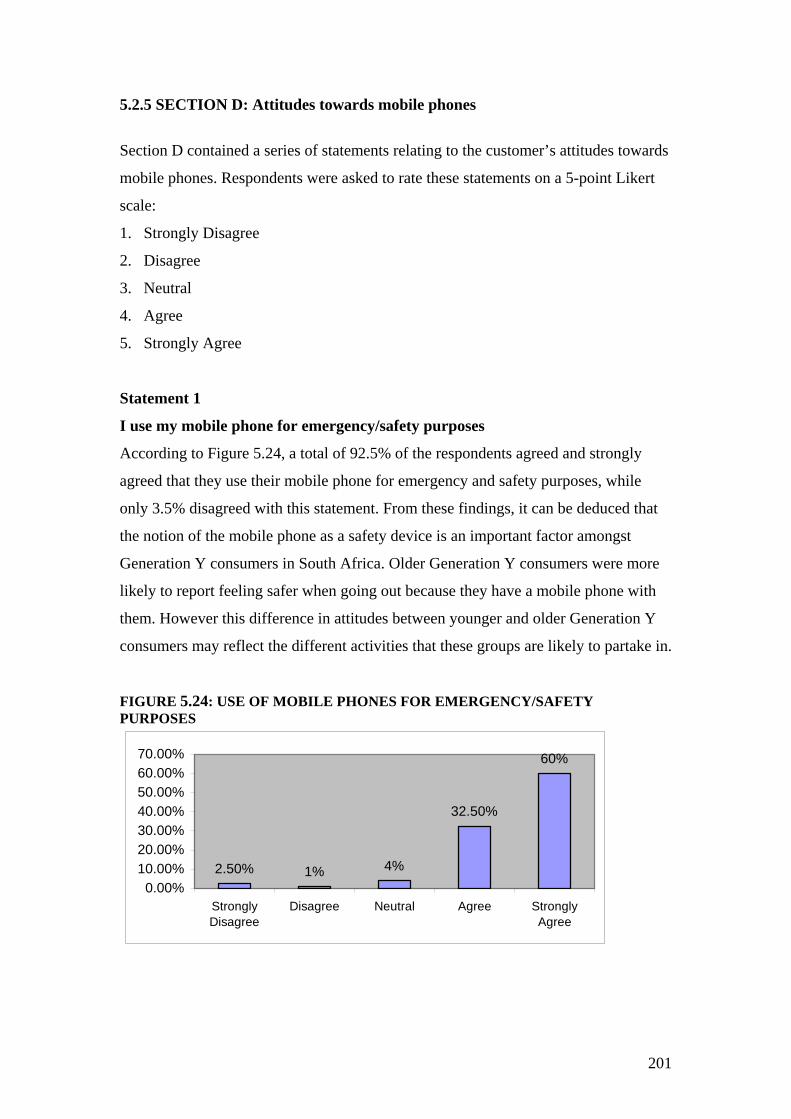
5.2.5 SECTION D: Attitudes towards mobile phones
Section D contained a series of statements relating to the customer’s attitudes towards
mobile phones. Respondents were asked to rate these statements on a 5-point Likert
scale:
1. Strongly Disagree
2. Disagree
3. Neutral
4. Agree
5. Strongly Agree
Statement 1
I use my mobile phone for emergency/safety purposes
According to Figure 5.24, a total of 92.5% of the respondents agreed and strongly
agreed that they use their mobile phone for emergency and safety purposes, while
only 3.5% disagreed with this statement. From these findings, it can be deduced that
the notion of the mobile phone as a safety device is an important factor amongst
Generation Y consumers in South Africa. Older Generation Y consumers were more
likely to report feeling safer when going out because they have a mobile phone with
them. However this difference in attitudes between younger and older Generation Y
consumers may reflect the different activities that these groups are likely to partake in.
FIGURE 5.24: USE OF MOBILE PHONES FOR EMERGENCY/SAFETY PURPOSES
2.50% 1% 4%
32.50%
60%
0.00%10.00%20.00%30.00%40.00%50.00%60.00%70.00%
StronglyDisagree
Disagree Neutral Agree StronglyAgree
201
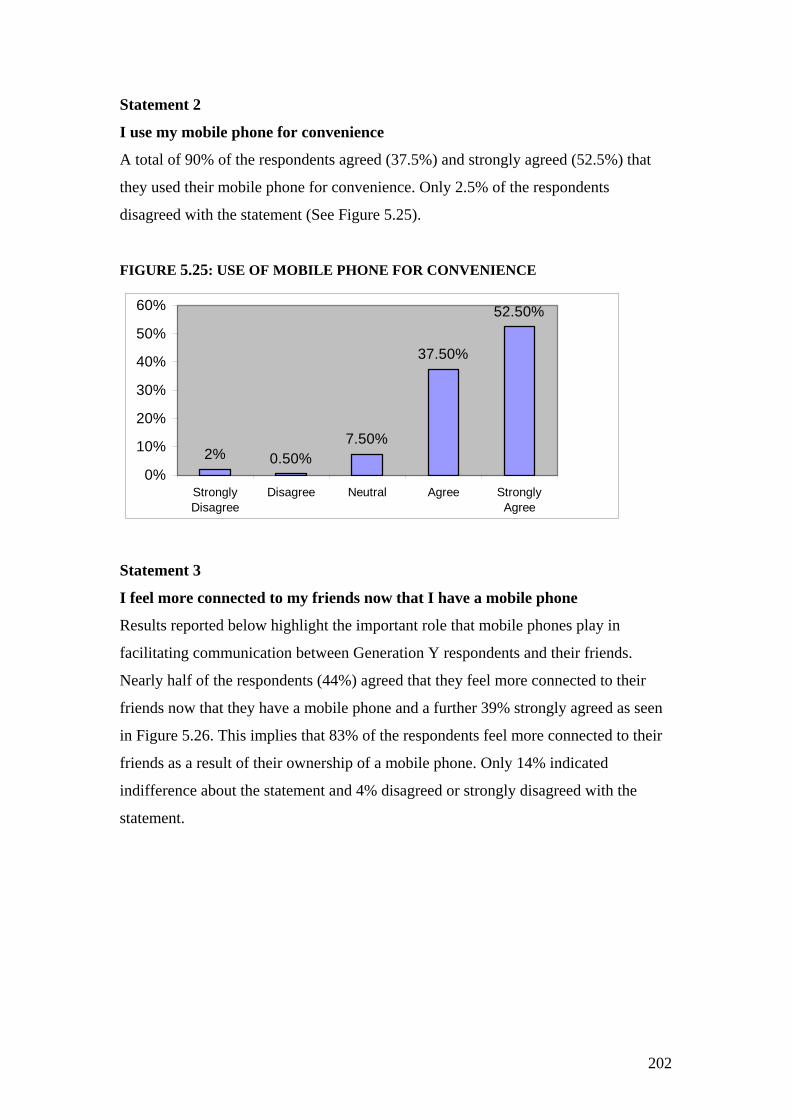
Statement 2
I use my mobile phone for convenience
A total of 90% of the respondents agreed (37.5%) and strongly agreed (52.5%) that
they used their mobile phone for convenience. Only 2.5% of the respondents
disagreed with the statement (See Figure 5.25).
FIGURE 5.25: USE OF MOBILE PHONE FOR CONVENIENCE
2% 0.50%7.50%
37.50%
52.50%
0%
10%
20%
30%
40%
50%
60%
StronglyDisagree
Disagree Neutral Agree StronglyAgree
Statement 3
I feel more connected to my friends now that I have a mobile phone
Results reported below highlight the important role that mobile phones play in
facilitating communication between Generation Y respondents and their friends.
Nearly half of the respondents (44%) agreed that they feel more connected to their
friends now that they have a mobile phone and a further 39% strongly agreed as seen
in Figure 5.26. This implies that 83% of the respondents feel more connected to their
friends as a result of their ownership of a mobile phone. Only 14% indicated
indifference about the statement and 4% disagreed or strongly disagreed with the
statement.
202
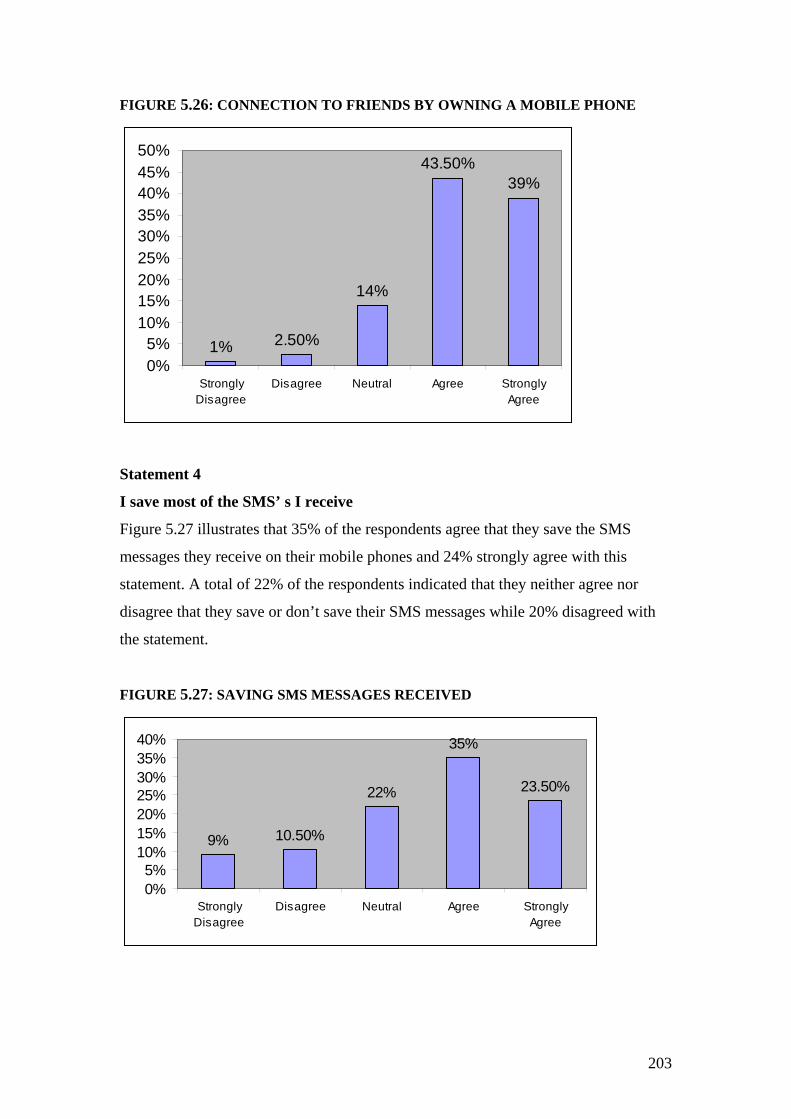
FIGURE 5.26: CONNECTION TO FRIENDS BY OWNING A MOBILE PHONE
1% 2.50%
14%
43.50%39%
0%5%
10%15%20%25%30%35%40%45%50%
StronglyDisagree
Disagree Neutral Agree StronglyAgree
Statement 4
I save most of the SMS’ s I receive
Figure 5.27 illustrates that 35% of the respondents agree that they save the SMS
messages they receive on their mobile phones and 24% strongly agree with this
statement. A total of 22% of the respondents indicated that they neither agree nor
disagree that they save or don’t save their SMS messages while 20% disagreed with
the statement.
FIGURE 5.27: SAVING SMS MESSAGES RECEIVED
9% 10.50%
22%
35%
23.50%
0%5%
10%15%20%25%30%35%40%
StronglyDisagree
Disagree Neutral Agree StronglyAgree
203

204
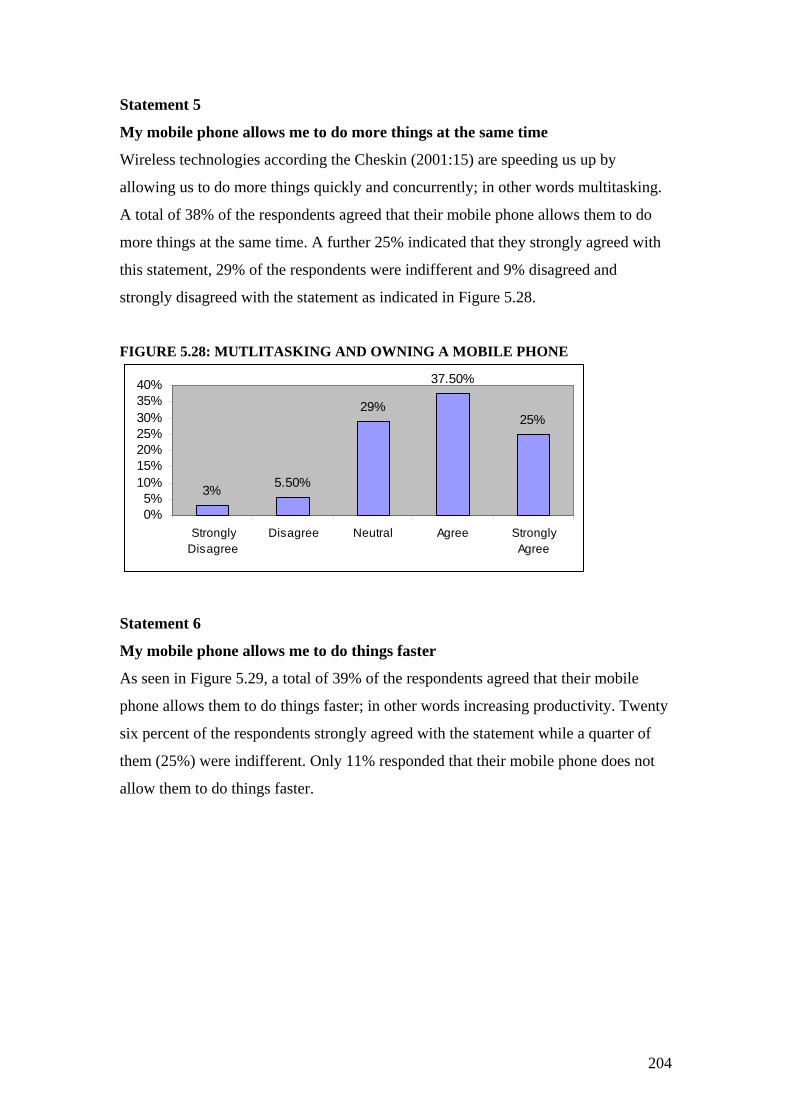
Statement 5
My mobile phone allows me to do more things at the same time
Wireless technologies according the Cheskin (2001:15) are speeding us up by
allowing us to do more things quickly and concurrently; in other words multitasking.
A total of 38% of the respondents agreed that their mobile phone allows them to do
more things at the same time. A further 25% indicated that they strongly agreed with
this statement, 29% of the respondents were indifferent and 9% disagreed and
strongly disagreed with the statement as indicated in Figure 5.28.
FIGURE 5.28: MUTLITASKING AND OWNING A MOBILE PHONE
3% 5.50%
29%
37.50%
25%
0%5%
10%15%20%25%30%35%40%
StronglyDisagree
Disagree Neutral Agree StronglyAgree
Statement 6
My mobile phone allows me to do things faster
As seen in Figure 5.29, a total of 39% of the respondents agreed that their mobile
phone allows them to do things faster; in other words increasing productivity. Twenty
six percent of the respondents strongly agreed with the statement while a quarter of
them (25%) were indifferent. Only 11% responded that their mobile phone does not
allow them to do things faster.
204
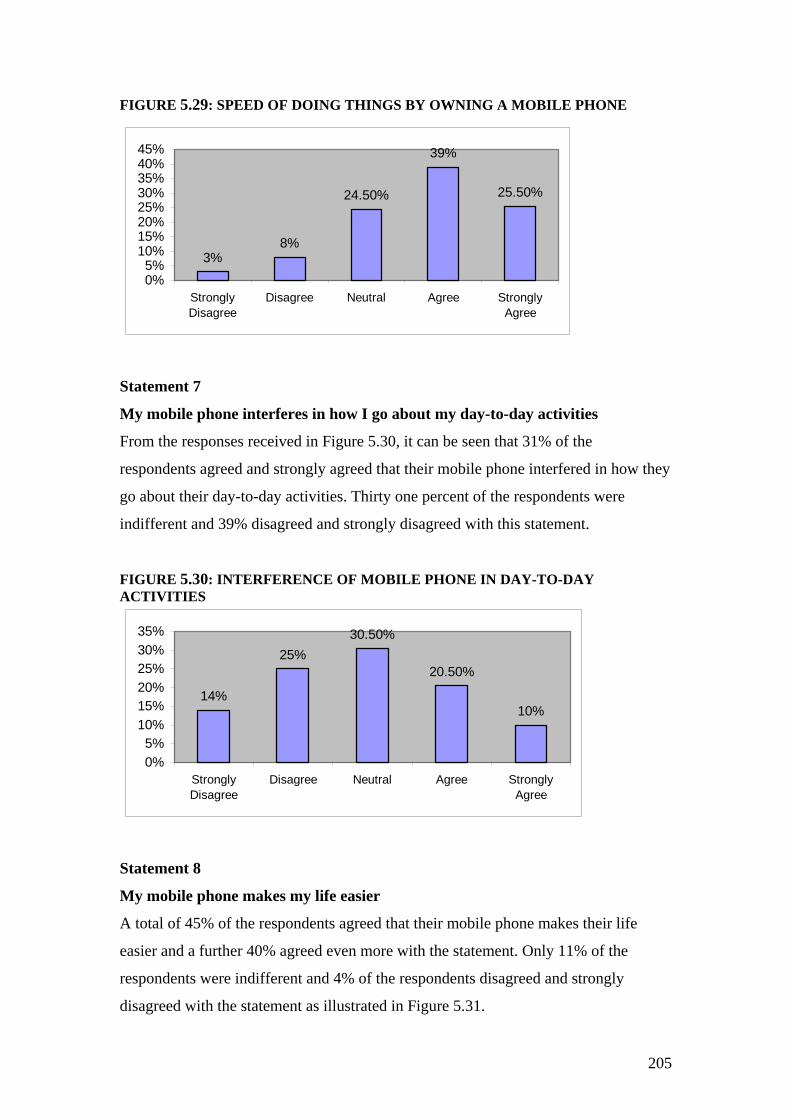
FIGURE 5.29: SPEED OF DOING THINGS BY OWNING A MOBILE PHONE
3%8%
24.50%
39%
25.50%
0%5%
10%15%20%25%30%35%40%45%
StronglyDisagree
Disagree Neutral Agree StronglyAgree
Statement 7
My mobile phone interferes in how I go about my day-to-day activities
From the responses received in Figure 5.30, it can be seen that 31% of the
respondents agreed and strongly agreed that their mobile phone interfered in how they
go about their day-to-day activities. Thirty one percent of the respondents were
indifferent and 39% disagreed and strongly disagreed with this statement.
FIGURE 5.30: INTERFERENCE OF MOBILE PHONE IN DAY-TO-DAY ACTIVITIES
14%
25%30.50%
20.50%
10%
0%5%
10%15%20%25%30%35%
StronglyDisagree
Disagree Neutral Agree StronglyAgree
Statement 8
My mobile phone makes my life easier
A total of 45% of the respondents agreed that their mobile phone makes their life
easier and a further 40% agreed even more with the statement. Only 11% of the
respondents were indifferent and 4% of the respondents disagreed and strongly
disagreed with the statement as illustrated in Figure 5.31.
205
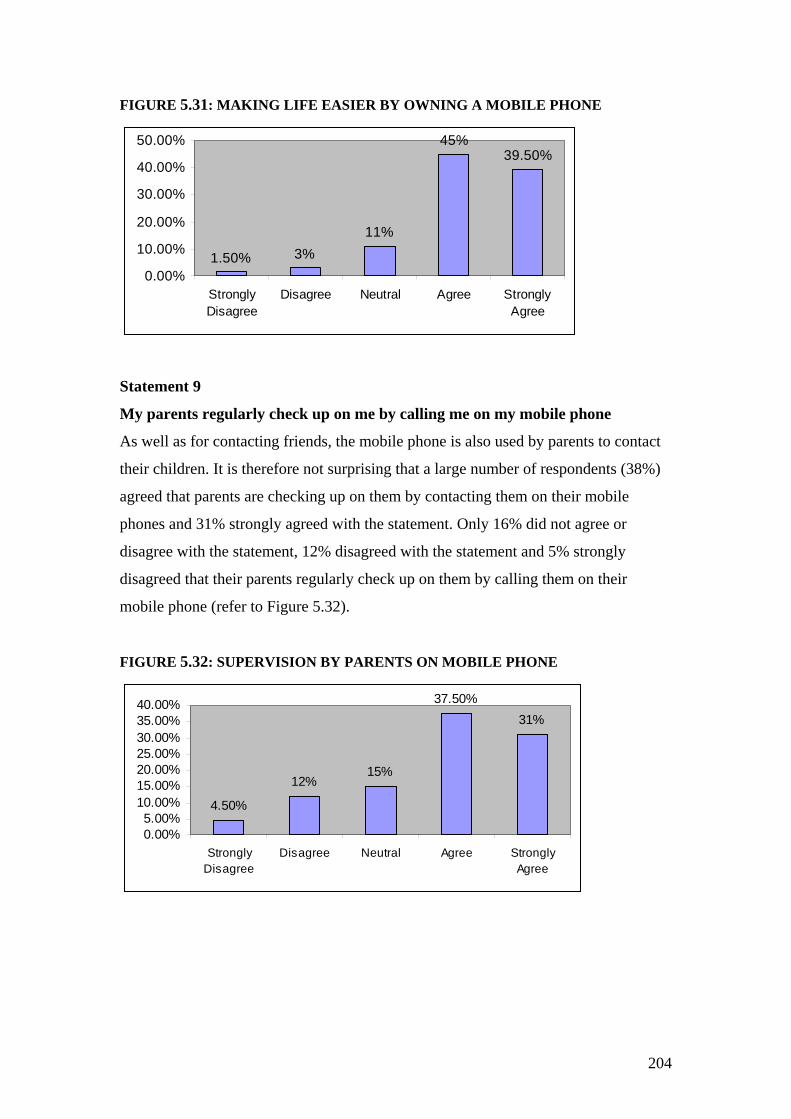
FIGURE 5.31: MAKING LIFE EASIER BY OWNING A MOBILE PHONE
1.50% 3%11%
45%39.50%
0.00%
10.00%
20.00%
30.00%
40.00%
50.00%
StronglyDisagree
Disagree Neutral Agree StronglyAgree
Statement 9
My parents regularly check up on me by calling me on my mobile phone
As well as for contacting friends, the mobile phone is also used by parents to contact
their children. It is therefore not surprising that a large number of respondents (38%)
agreed that parents are checking up on them by contacting them on their mobile
phones and 31% strongly agreed with the statement. Only 16% did not agree or
disagree with the statement, 12% disagreed with the statement and 5% strongly
disagreed that their parents regularly check up on them by calling them on their
mobile phone (refer to Figure 5.32).
FIGURE 5.32: SUPERVISION BY PARENTS ON MOBILE PHONE
4.50%
12%15%
37.50%31%
0.00%5.00%
10.00%15.00%20.00%25.00%30.00%35.00%40.00%
StronglyDisagree
Disagree Neutral Agree StronglyAgree
204
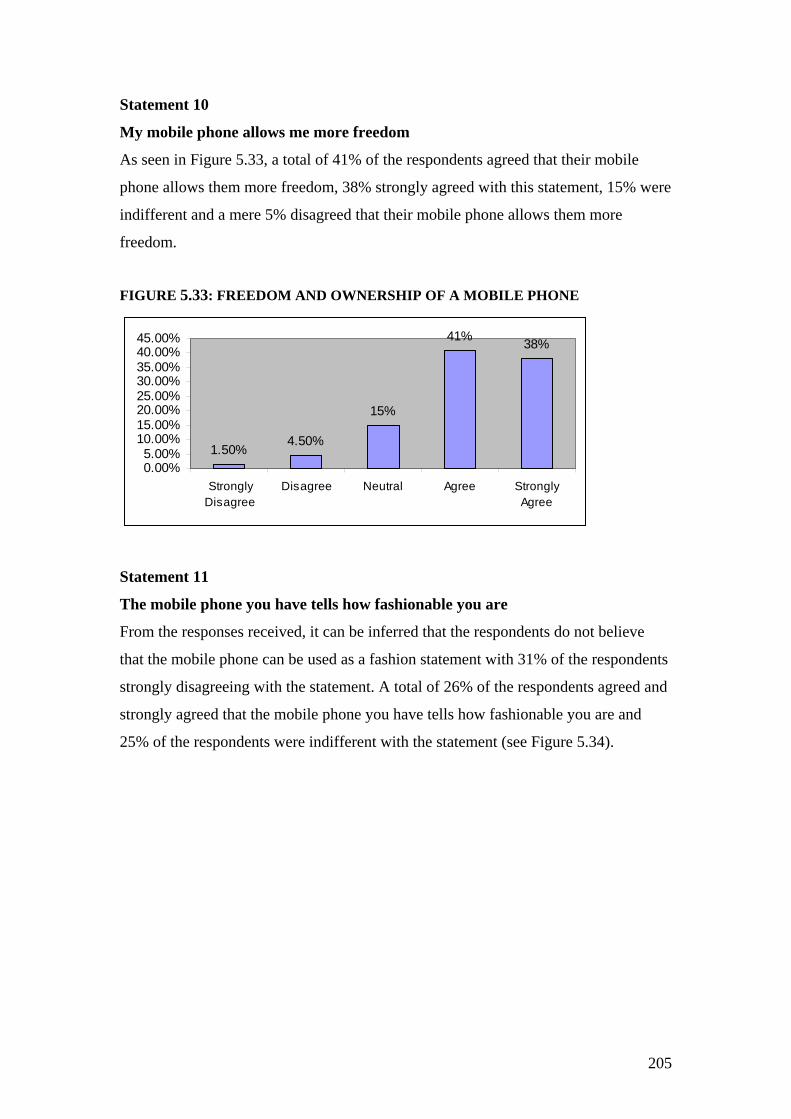
Statement 10
My mobile phone allows me more freedom
As seen in Figure 5.33, a total of 41% of the respondents agreed that their mobile
phone allows them more freedom, 38% strongly agreed with this statement, 15% were
indifferent and a mere 5% disagreed that their mobile phone allows them more
freedom.
FIGURE 5.33: FREEDOM AND OWNERSHIP OF A MOBILE PHONE
1.50%4.50%
15%
41% 38%
0.00%5.00%
10.00%15.00%20.00%25.00%30.00%35.00%40.00%45.00%
StronglyDisagree
Disagree Neutral Agree StronglyAgree
Statement 11
The mobile phone you have tells how fashionable you are
From the responses received, it can be inferred that the respondents do not believe
that the mobile phone can be used as a fashion statement with 31% of the respondents
strongly disagreeing with the statement. A total of 26% of the respondents agreed and
strongly agreed that the mobile phone you have tells how fashionable you are and
25% of the respondents were indifferent with the statement (see Figure 5.34).
205
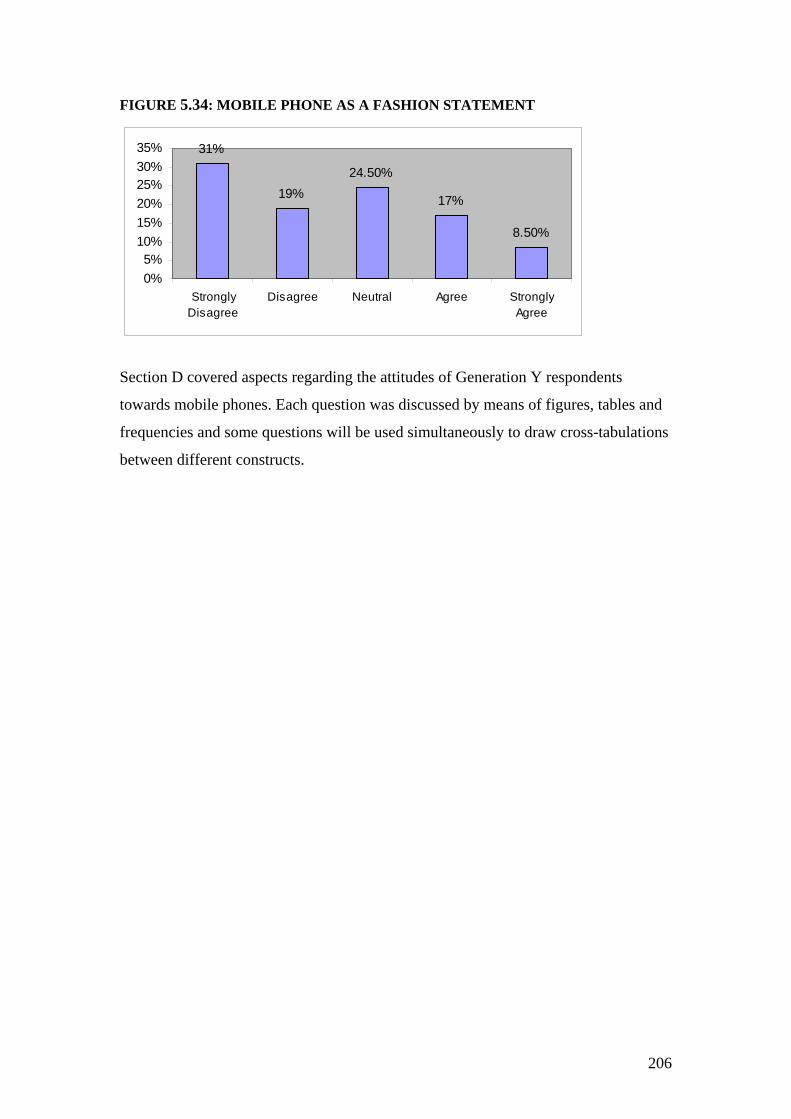
FIGURE 5.34: MOBILE PHONE AS A FASHION STATEMENT
31%
19%24.50%
17%
8.50%
0%5%
10%15%20%25%30%35%
StronglyDisagree
Disagree Neutral Agree StronglyAgree
Section D covered aspects regarding the attitudes of Generation Y respondents
towards mobile phones. Each question was discussed by means of figures, tables and
frequencies and some questions will be used simultaneously to draw cross-tabulations
between different constructs.
206
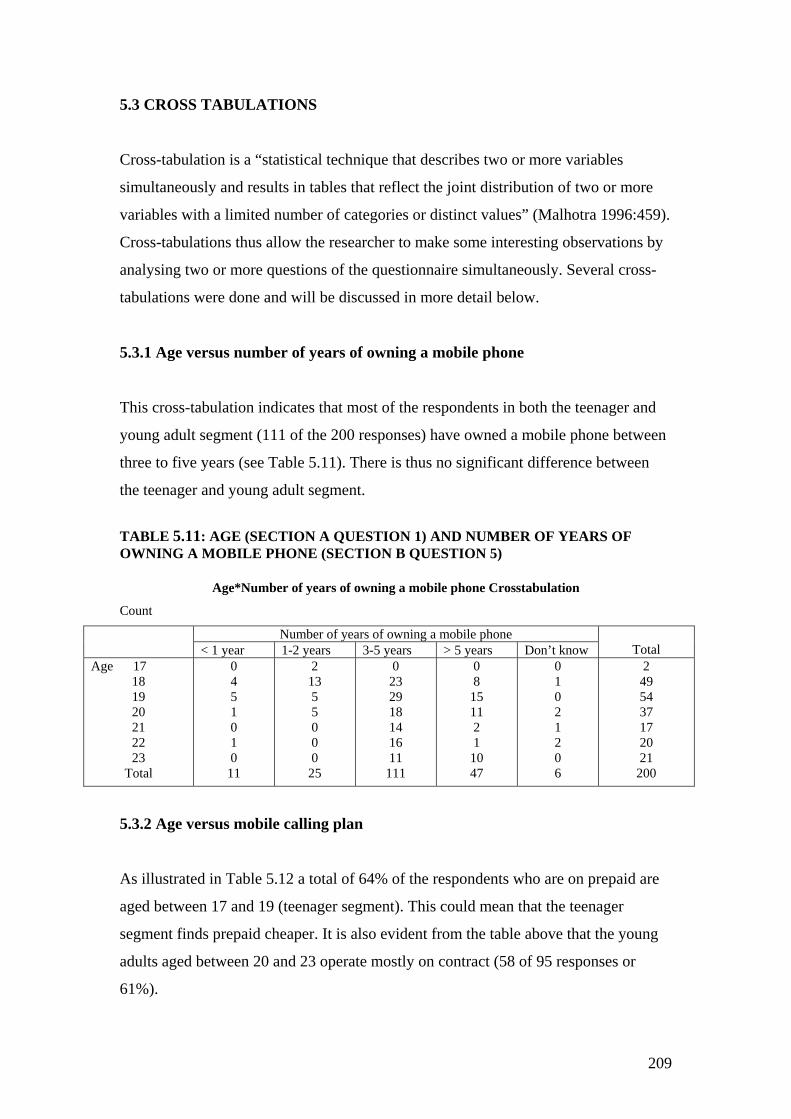
5.3 CROSS TABULATIONS
Cross-tabulation is a “statistical technique that describes two or more variables
simultaneously and results in tables that reflect the joint distribution of two or more
variables with a limited number of categories or distinct values” (Malhotra 1996:459).
Cross-tabulations thus allow the researcher to make some interesting observations by
analysing two or more questions of the questionnaire simultaneously. Several cross-
tabulations were done and will be discussed in more detail below.
5.3.1 Age versus number of years of owning a mobile phone
This cross-tabulation indicates that most of the respondents in both the teenager and
young adult segment (111 of the 200 responses) have owned a mobile phone between
three to five years (see Table 5.11). There is thus no significant difference between
the teenager and young adult segment.
TABLE 5.11: AGE (SECTION A QUESTION 1) AND NUMBER OF YEARS OF OWNING A MOBILE PHONE (SECTION B QUESTION 5)
Age*Number of years of owning a mobile phone Crosstabulation
Count
Number of years of owning a mobile phone < 1 year 1-2 years 3-5 years > 5 years Don’t know
Total
Age 17 18 19 20 21 22 23
Total
0 4 5 1 0 1 0
11
2 13 5 5 0 0 0
25
0 23 29 18 14 16 11
111
0 8
15 11 2 1
10 47
0 1 0 2 1 2 0 6
2 49 54 37 17 20 21
200
5.3.2 Age versus mobile calling plan
As illustrated in Table 5.12 a total of 64% of the respondents who are on prepaid are
aged between 17 and 19 (teenager segment). This could mean that the teenager
segment finds prepaid cheaper. It is also evident from the table above that the young
adults aged between 20 and 23 operate mostly on contract (58 of 95 responses or
61%).
209
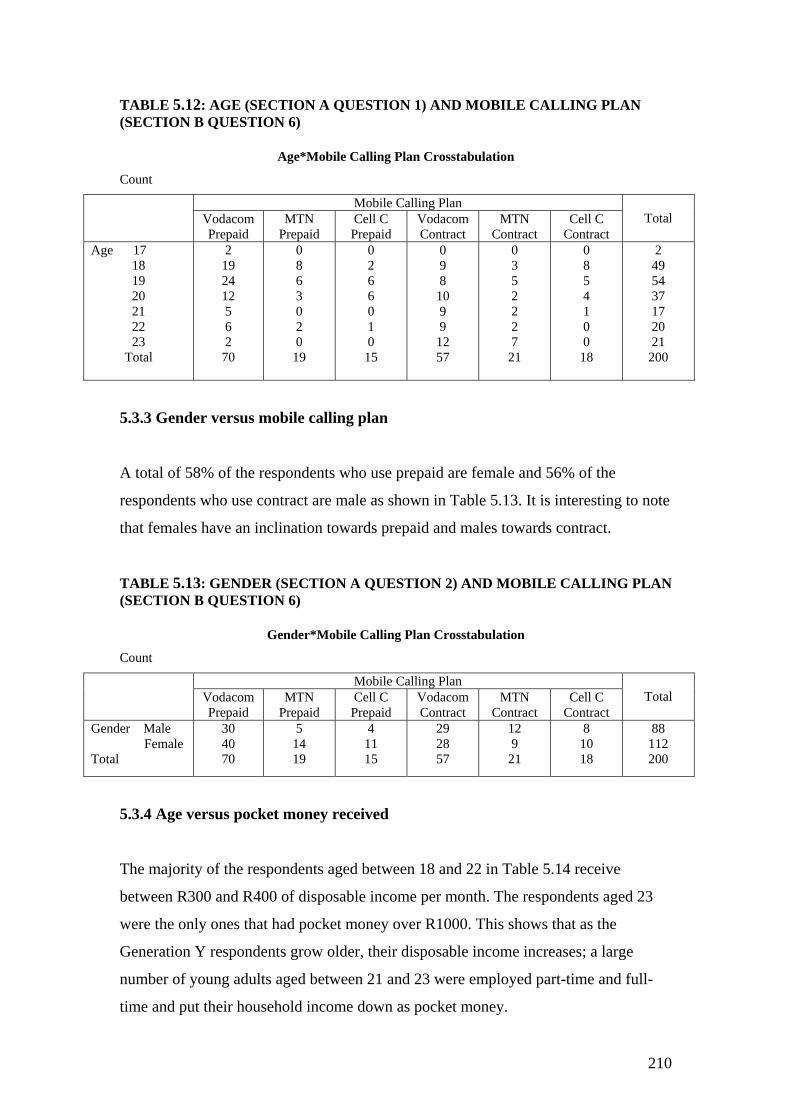
TABLE 5.12: AGE (SECTION A QUESTION 1) AND MOBILE CALLING PLAN (SECTION B QUESTION 6)
Age*Mobile Calling Plan Crosstabulation
Count
Mobile Calling Plan Vodacom Prepaid
MTN Prepaid
Cell C Prepaid
Vodacom Contract
MTN Contract
Cell C Contract
Total
Age 17 18 19 20 21 22 23
Total
2 19 24 12 5 6 2
70
0 8 6 3 0 2 0
19
0 2 6 6 0 1 0
15
0 9 8
10 9 9
12 57
0 3 5 2 2 2 7
21
0 8 5 4 1 0 0
18
2 49 54 37 17 20 21
200
5.3.3 Gender versus mobile calling plan
A total of 58% of the respondents who use prepaid are female and 56% of the
respondents who use contract are male as shown in Table 5.13. It is interesting to note
that females have an inclination towards prepaid and males towards contract.
TABLE 5.13: GENDER (SECTION A QUESTION 2) AND MOBILE CALLING PLAN (SECTION B QUESTION 6)
Gender*Mobile Calling Plan Crosstabulation
Count
Mobile Calling Plan Vodacom Prepaid
MTN Prepaid
Cell C Prepaid
Vodacom Contract
MTN Contract
Cell C Contract
Total
Gender Male Female Total
30 40 70
5 14 19
4 11 15
29 28 57
12 9
21
8 10 18
88 112 200
5.3.4 Age versus pocket money received
The majority of the respondents aged between 18 and 22 in Table 5.14 receive
between R300 and R400 of disposable income per month. The respondents aged 23
were the only ones that had pocket money over R1000. This shows that as the
Generation Y respondents grow older, their disposable income increases; a large
number of young adults aged between 21 and 23 were employed part-time and full-
time and put their household income down as pocket money.
210
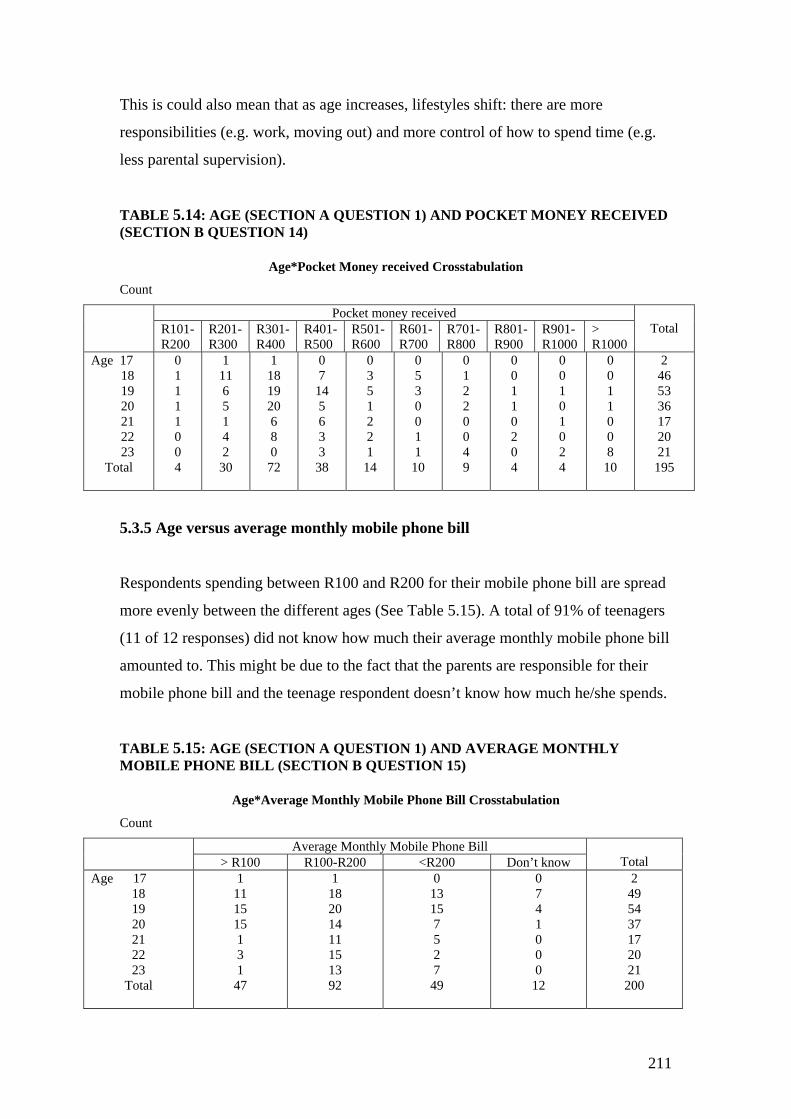
This is could also mean that as age increases, lifestyles shift: there are more
responsibilities (e.g. work, moving out) and more control of how to spend time (e.g.
less parental supervision).
TABLE 5.14: AGE (SECTION A QUESTION 1) AND POCKET MONEY RECEIVED (SECTION B QUESTION 14)
Age*Pocket Money received Crosstabulation
Count
Pocket money received R101-R200
R201-R300
R301-R400
R401-R500
R501-R600
R601-R700
R701-R800
R801-R900
R901-R1000
> R1000
Total
Age 17 18 19 20 21 22 23
Total
0 1 1 1 1 0 0 4
1 11 6 5 1 4 2
30
1 18 19 20 6 8 0
72
0 7
14 5 6 3 3
38
0 3 5 1 2 2 1
14
0 5 3 0 0 1 1
10
0 1 2 2 0 0 4 9
0 0 1 1 0 2 0 4
0 0 1 0 1 0 2 4
0 0 1 1 0 0 8
10
2 46 53 36 17 20 21 195
5.3.5 Age versus average monthly mobile phone bill
Respondents spending between R100 and R200 for their mobile phone bill are spread
more evenly between the different ages (See Table 5.15). A total of 91% of teenagers
(11 of 12 responses) did not know how much their average monthly mobile phone bill
amounted to. This might be due to the fact that the parents are responsible for their
mobile phone bill and the teenage respondent doesn’t know how much he/she spends.
TABLE 5.15: AGE (SECTION A QUESTION 1) AND AVERAGE MONTHLY MOBILE PHONE BILL (SECTION B QUESTION 15)
Age*Average Monthly Mobile Phone Bill Crosstabulation
Count
Average Monthly Mobile Phone Bill > R100 R100-R200 <R200 Don’t know
Total
Age 17 18 19 20 21 22 23
Total
1 11 15 15 1 3 1
47
1 18 20 14 11 15 13 92
0 13 15 7 5 2 7
49
0 7 4 1 0 0 0
12
2 49 54 37 17 20 21
200
211
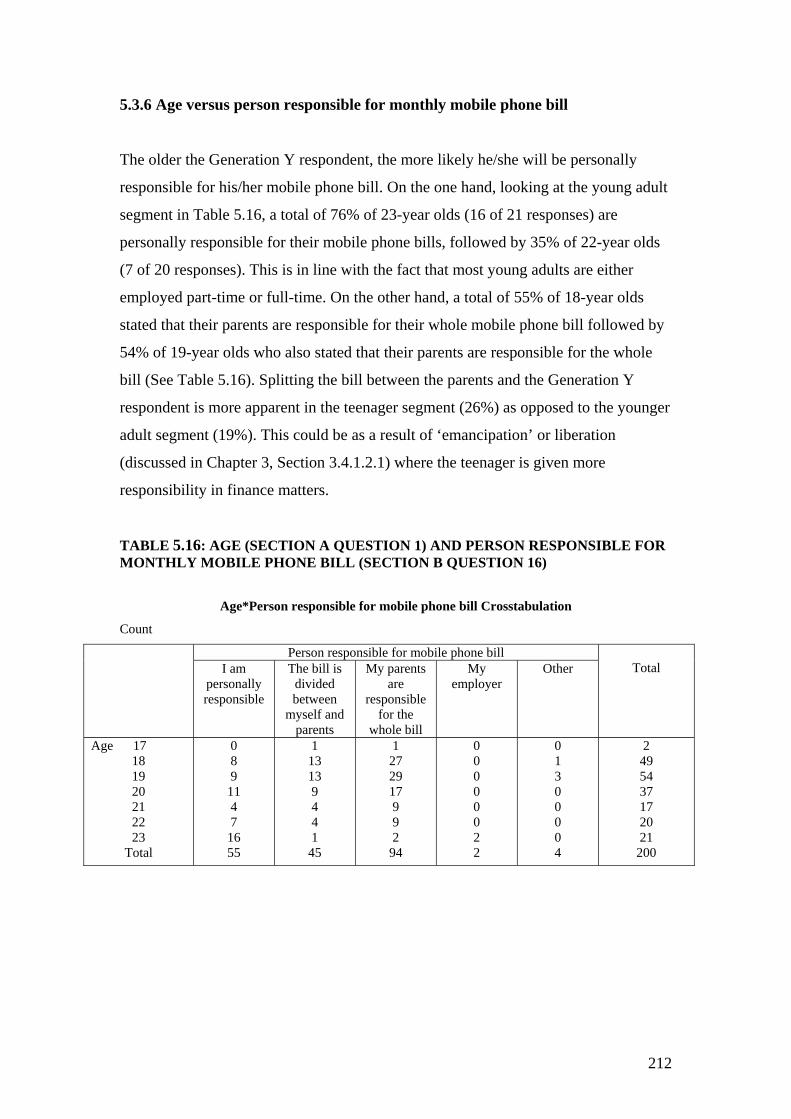
5.3.6 Age versus person responsible for monthly mobile phone bill
The older the Generation Y respondent, the more likely he/she will be personally
responsible for his/her mobile phone bill. On the one hand, looking at the young adult
segment in Table 5.16, a total of 76% of 23-year olds (16 of 21 responses) are
personally responsible for their mobile phone bills, followed by 35% of 22-year olds
(7 of 20 responses). This is in line with the fact that most young adults are either
employed part-time or full-time. On the other hand, a total of 55% of 18-year olds
stated that their parents are responsible for their whole mobile phone bill followed by
54% of 19-year olds who also stated that their parents are responsible for the whole
bill (See Table 5.16). Splitting the bill between the parents and the Generation Y
respondent is more apparent in the teenager segment (26%) as opposed to the younger
adult segment (19%). This could be as a result of ‘emancipation’ or liberation
(discussed in Chapter 3, Section 3.4.1.2.1) where the teenager is given more
responsibility in finance matters.
TABLE 5.16: AGE (SECTION A QUESTION 1) AND PERSON RESPONSIBLE FOR MONTHLY MOBILE PHONE BILL (SECTION B QUESTION 16)
Age*Person responsible for mobile phone bill Crosstabulation
Count
Person responsible for mobile phone bill I am
personally responsible
The bill is divided between
myself and parents
My parents are
responsible for the
whole bill
My employer
Other
Total
Age 17 18 19 20 21 22 23
Total
0 8 9
11 4 7
16 55
1 13 13 9 4 4 1
45
1 27 29 17 9 9 2
94
0 0 0 0 0 0 2 2
0 1 3 0 0 0 0 4
2 49 54 37 17 20 21
200
212
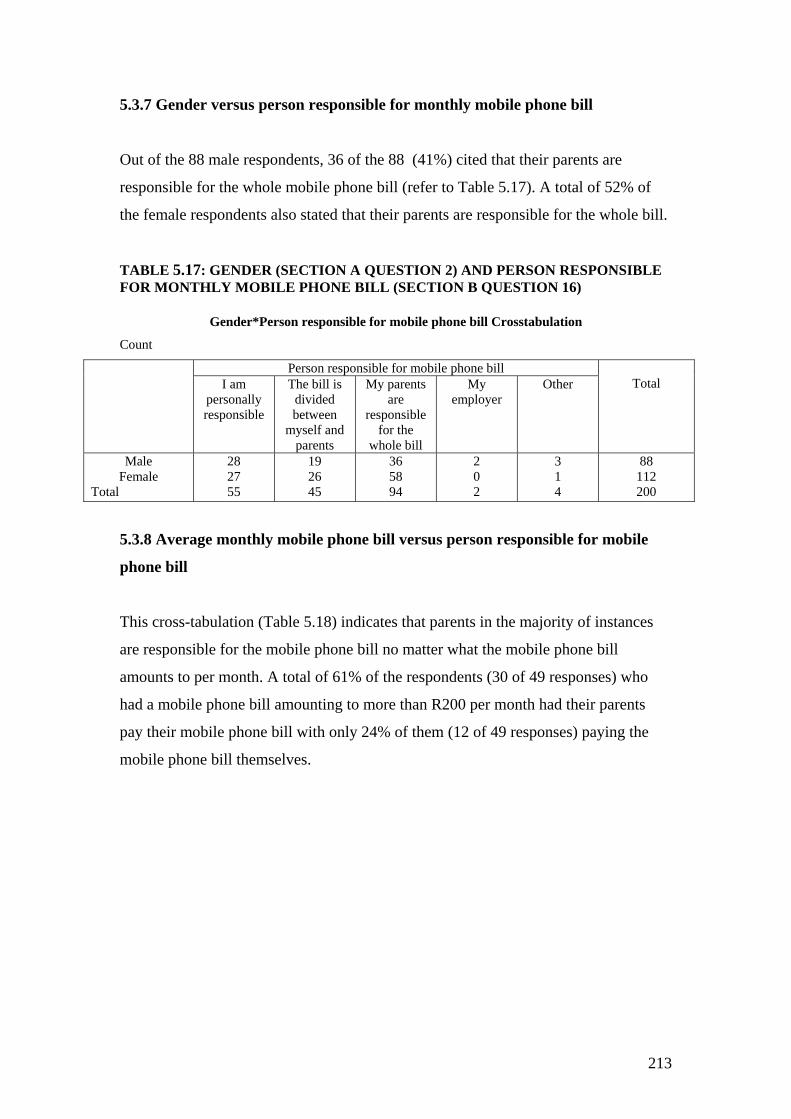
5.3.7 Gender versus person responsible for monthly mobile phone bill
Out of the 88 male respondents, 36 of the 88 (41%) cited that their parents are
responsible for the whole mobile phone bill (refer to Table 5.17). A total of 52% of
the female respondents also stated that their parents are responsible for the whole bill.
TABLE 5.17: GENDER (SECTION A QUESTION 2) AND PERSON RESPONSIBLE FOR MONTHLY MOBILE PHONE BILL (SECTION B QUESTION 16)
Gender*Person responsible for mobile phone bill Crosstabulation
Count
Person responsible for mobile phone bill I am
personally responsible
The bill is divided between
myself and parents
My parents are
responsible for the
whole bill
My employer
Other
Total
Male Female
Total
28 27 55
19 26 45
36 58 94
2 0 2
3 1 4
88 112 200
5.3.8 Average monthly mobile phone bill versus person responsible for mobile
phone bill
This cross-tabulation (Table 5.18) indicates that parents in the majority of instances
are responsible for the mobile phone bill no matter what the mobile phone bill
amounts to per month. A total of 61% of the respondents (30 of 49 responses) who
had a mobile phone bill amounting to more than R200 per month had their parents
pay their mobile phone bill with only 24% of them (12 of 49 responses) paying the
mobile phone bill themselves.
213
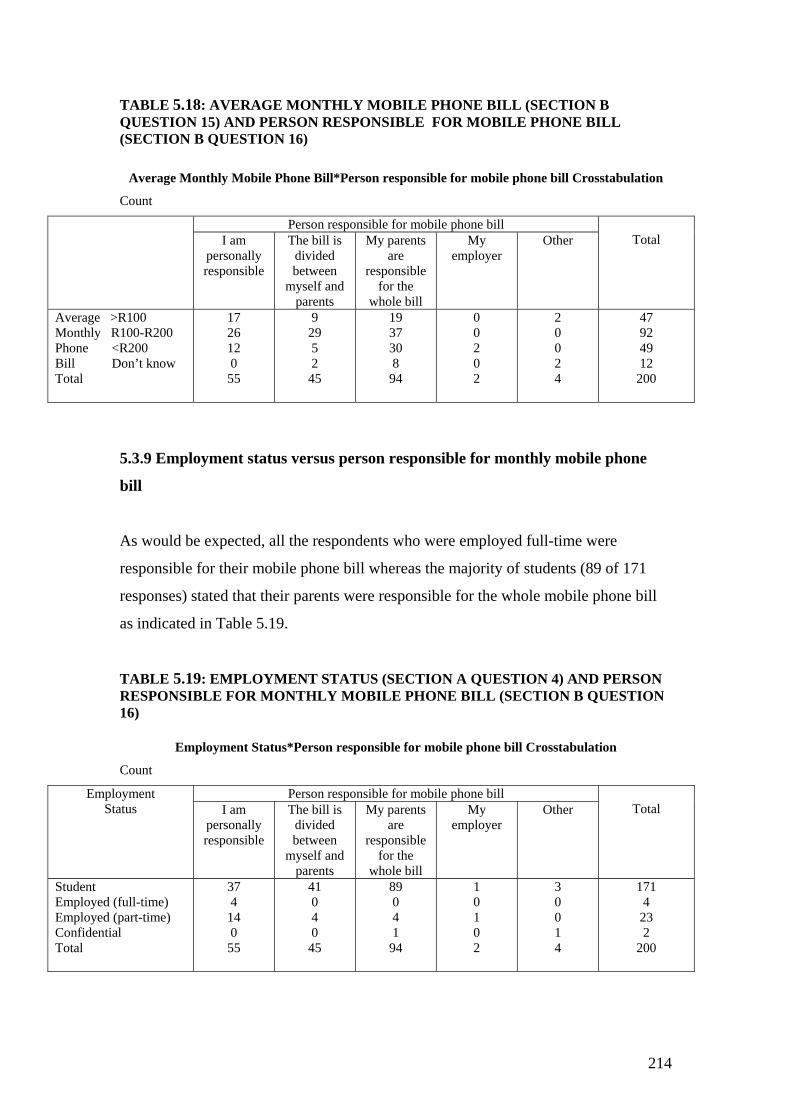
TABLE 5.18: AVERAGE MONTHLY MOBILE PHONE BILL (SECTION B QUESTION 15) AND PERSON RESPONSIBLE FOR MOBILE PHONE BILL (SECTION B QUESTION 16)
Average Monthly Mobile Phone Bill*Person responsible for mobile phone bill Crosstabulation
Count
Person responsible for mobile phone bill I am
personally responsible
The bill is divided between
myself and parents
My parents are
responsible for the
whole bill
My employer
Other
Total
Average >R100 Monthly R100-R200 Phone <R200 Bill Don’t know Total
17 26 12 0
55
9 29 5 2
45
19 37 30 8
94
0 0 2 0 2
2 0 0 2 4
47 92 49 12
200
5.3.9 Employment status versus person responsible for monthly mobile phone
bill
As would be expected, all the respondents who were employed full-time were
responsible for their mobile phone bill whereas the majority of students (89 of 171
responses) stated that their parents were responsible for the whole mobile phone bill
as indicated in Table 5.19.
TABLE 5.19: EMPLOYMENT STATUS (SECTION A QUESTION 4) AND PERSON RESPONSIBLE FOR MONTHLY MOBILE PHONE BILL (SECTION B QUESTION 16)
Employment Status*Person responsible for mobile phone bill Crosstabulation
Count
Person responsible for mobile phone bill Employment Status I am
personally responsible
The bill is divided between
myself and parents
My parents are
responsible for the
whole bill
My employer
Other
Total
Student Employed (full-time) Employed (part-time) Confidential Total
37 4
14 0
55
41 0 4 0
45
89 0 4 1
94
1 0 1 0 2
3 0 0 1 4
171 4
23 2
200
214
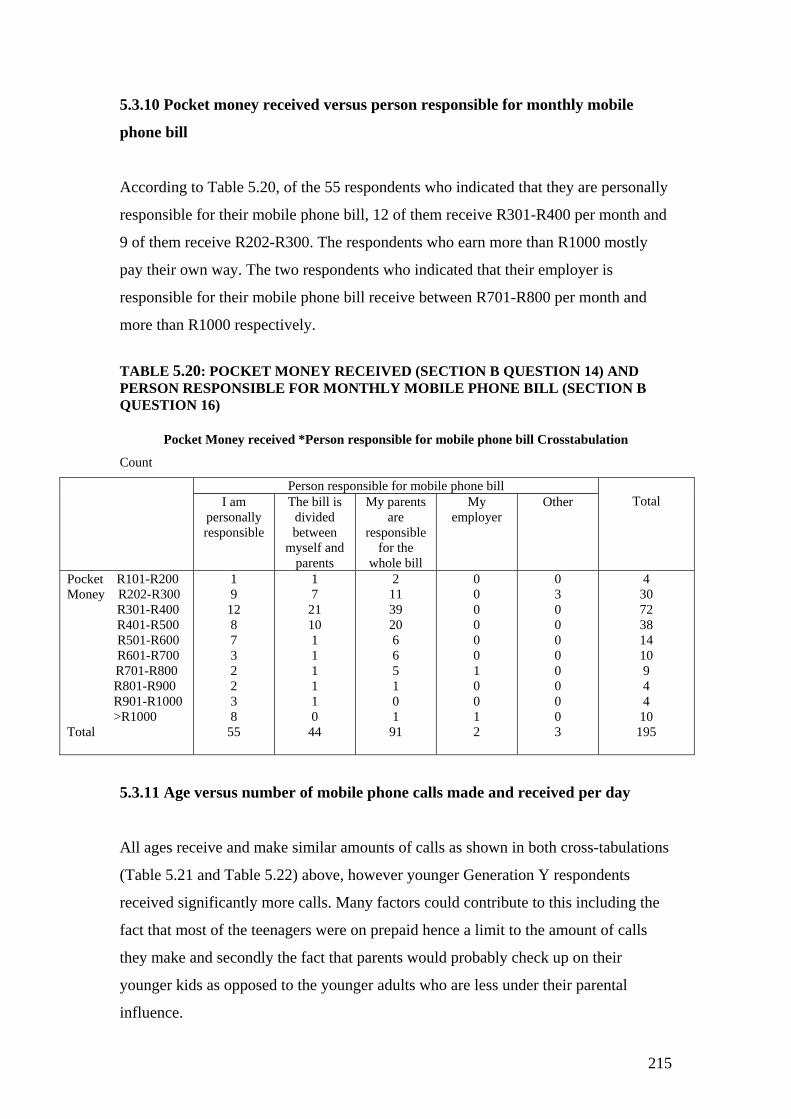
5.3.10 Pocket money received versus person responsible for monthly mobile
phone bill
According to Table 5.20, of the 55 respondents who indicated that they are personally
responsible for their mobile phone bill, 12 of them receive R301-R400 per month and
9 of them receive R202-R300. The respondents who earn more than R1000 mostly
pay their own way. The two respondents who indicated that their employer is
responsible for their mobile phone bill receive between R701-R800 per month and
more than R1000 respectively.
TABLE 5.20: POCKET MONEY RECEIVED (SECTION B QUESTION 14) AND PERSON RESPONSIBLE FOR MONTHLY MOBILE PHONE BILL (SECTION B QUESTION 16)
Pocket Money received *Person responsible for mobile phone bill Crosstabulation
Count
Person responsible for mobile phone bill I am
personally responsible
The bill is divided between
myself and parents
My parents are
responsible for the
whole bill
My employer
Other
Total
Pocket R101-R200 Money R202-R300 R301-R400 R401-R500
R501-R600 R601-R700 R701-R800
R801-R900 R901-R1000 >R1000 Total
1 9
12 8 7 3 2 2 3 8
55
1 7
21 10 1 1 1 1 1 0
44
2 11 39 20 6 6 5 1 0 1
91
0 0 0 0 0 0 1 0 0 1 2
0 3 0 0 0 0 0 0 0 0 3
4 30 72 38 14 10 9 4 4
10 195
5.3.11 Age versus number of mobile phone calls made and received per day
All ages receive and make similar amounts of calls as shown in both cross-tabulations
(Table 5.21 and Table 5.22) above, however younger Generation Y respondents
received significantly more calls. Many factors could contribute to this including the
fact that most of the teenagers were on prepaid hence a limit to the amount of calls
they make and secondly the fact that parents would probably check up on their
younger kids as opposed to the younger adults who are less under their parental
influence.
215
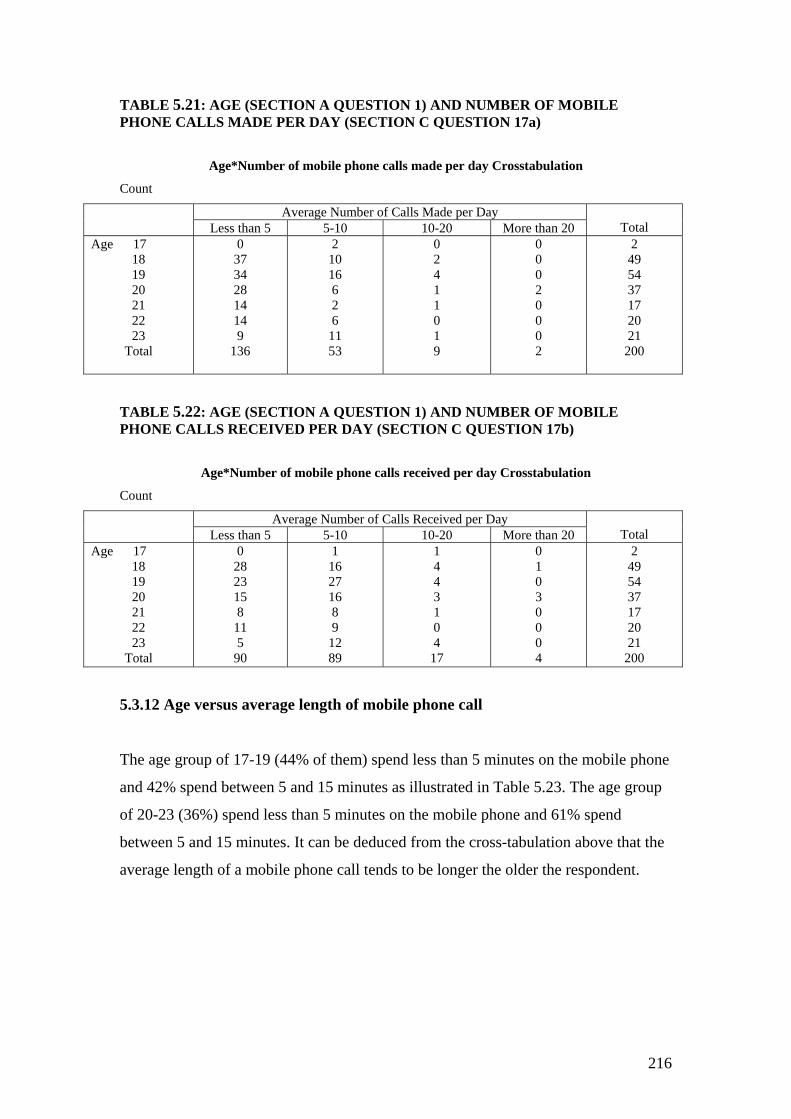
TABLE 5.21: AGE (SECTION A QUESTION 1) AND NUMBER OF MOBILE PHONE CALLS MADE PER DAY (SECTION C QUESTION 17a)
Age*Number of mobile phone calls made per day Crosstabulation
Count
Average Number of Calls Made per Day Less than 5 5-10 10-20 More than 20
Total
Age 17 18 19 20 21 22 23
Total
0 37 34 28 14 14 9
136
2 10 16 6 2 6
11 53
0 2 4 1 1 0 1 9
0 0 0 2 0 0 0 2
2 49 54 37 17 20 21
200
TABLE 5.22: AGE (SECTION A QUESTION 1) AND NUMBER OF MOBILE PHONE CALLS RECEIVED PER DAY (SECTION C QUESTION 17b)
Age*Number of mobile phone calls received per day Crosstabulation
Count
Average Number of Calls Received per Day Less than 5 5-10 10-20 More than 20
Total
Age 17 18 19 20 21 22 23
Total
0 28 23 15 8
11 5
90
1 16 27 16 8 9
12 89
1 4 4 3 1 0 4
17
0 1 0 3 0 0 0 4
2 49 54 37 17 20 21
200
5.3.12 Age versus average length of mobile phone call
The age group of 17-19 (44% of them) spend less than 5 minutes on the mobile phone
and 42% spend between 5 and 15 minutes as illustrated in Table 5.23. The age group
of 20-23 (36%) spend less than 5 minutes on the mobile phone and 61% spend
between 5 and 15 minutes. It can be deduced from the cross-tabulation above that the
average length of a mobile phone call tends to be longer the older the respondent.
216
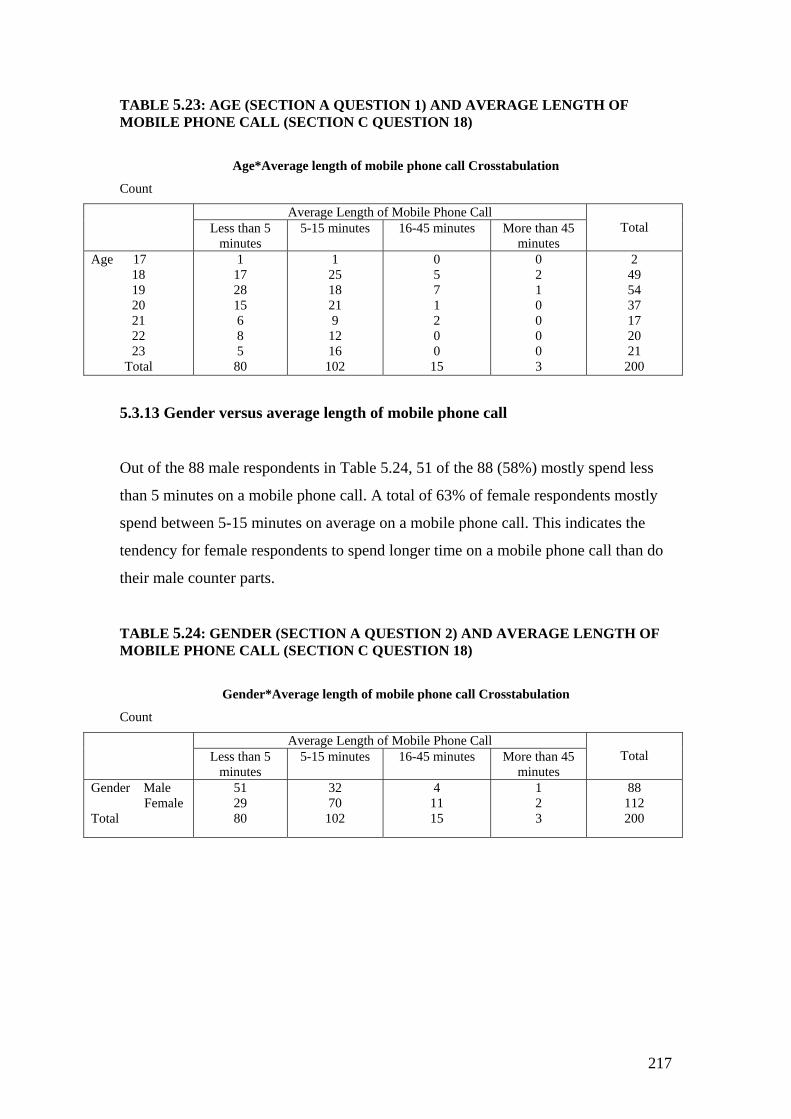
TABLE 5.23: AGE (SECTION A QUESTION 1) AND AVERAGE LENGTH OF MOBILE PHONE CALL (SECTION C QUESTION 18)
Age*Average length of mobile phone call Crosstabulation
Count
Average Length of Mobile Phone Call Less than 5
minutes 5-15 minutes 16-45 minutes More than 45
minutes
Total
Age 17 18 19 20 21 22 23
Total
1 17 28 15 6 8 5
80
1 25 18 21 9
12 16
102
0 5 7 1 2 0 0
15
0 2 1 0 0 0 0 3
2 49 54 37 17 20 21
200
5.3.13 Gender versus average length of mobile phone call
Out of the 88 male respondents in Table 5.24, 51 of the 88 (58%) mostly spend less
than 5 minutes on a mobile phone call. A total of 63% of female respondents mostly
spend between 5-15 minutes on average on a mobile phone call. This indicates the
tendency for female respondents to spend longer time on a mobile phone call than do
their male counter parts.
TABLE 5.24: GENDER (SECTION A QUESTION 2) AND AVERAGE LENGTH OF MOBILE PHONE CALL (SECTION C QUESTION 18)
Gender*Average length of mobile phone call Crosstabulation
Count
Average Length of Mobile Phone Call Less than 5
minutes 5-15 minutes 16-45 minutes More than 45
minutes
Total
Gender Male Female Total
51 29 80
32 70
102
4 11 15
1 2 3
88 112 200
217
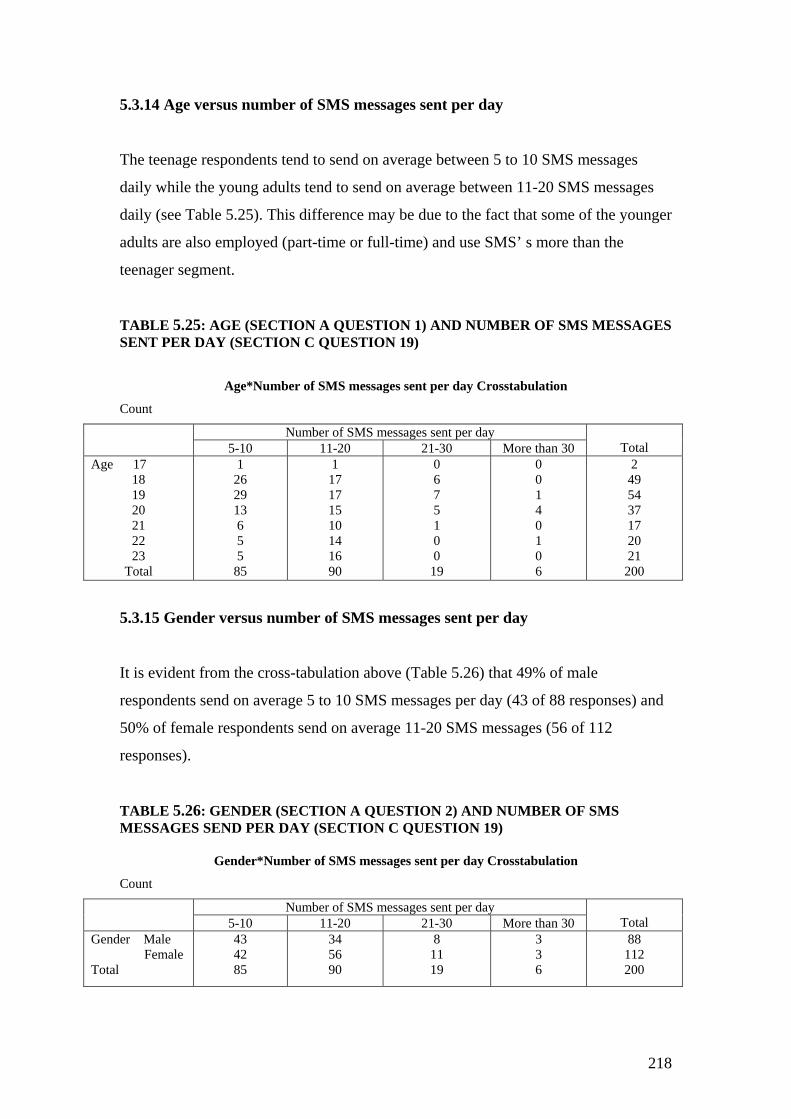
5.3.14 Age versus number of SMS messages sent per day
The teenage respondents tend to send on average between 5 to 10 SMS messages
daily while the young adults tend to send on average between 11-20 SMS messages
daily (see Table 5.25). This difference may be due to the fact that some of the younger
adults are also employed (part-time or full-time) and use SMS’ s more than the
teenager segment.
TABLE 5.25: AGE (SECTION A QUESTION 1) AND NUMBER OF SMS MESSAGES SENT PER DAY (SECTION C QUESTION 19)
Age*Number of SMS messages sent per day Crosstabulation
Count
Number of SMS messages sent per day 5-10 11-20 21-30 More than 30
Total
Age 17 18 19 20 21 22 23
Total
1 26 29 13 6 5 5
85
1 17 17 15 10 14 16 90
0 6 7 5 1 0 0
19
0 0 1 4 0 1 0 6
2 49 54 37 17 20 21
200
5.3.15 Gender versus number of SMS messages sent per day
It is evident from the cross-tabulation above (Table 5.26) that 49% of male
respondents send on average 5 to 10 SMS messages per day (43 of 88 responses) and
50% of female respondents send on average 11-20 SMS messages (56 of 112
responses).
TABLE 5.26: GENDER (SECTION A QUESTION 2) AND NUMBER OF SMS MESSAGES SEND PER DAY (SECTION C QUESTION 19)
Gender*Number of SMS messages sent per day Crosstabulation
Count
Number of SMS messages sent per day 5-10 11-20 21-30 More than 30
Total
Gender Male Female Total
43 42 85
34 56 90
8 11 19
3 3 6
88 112 200
218
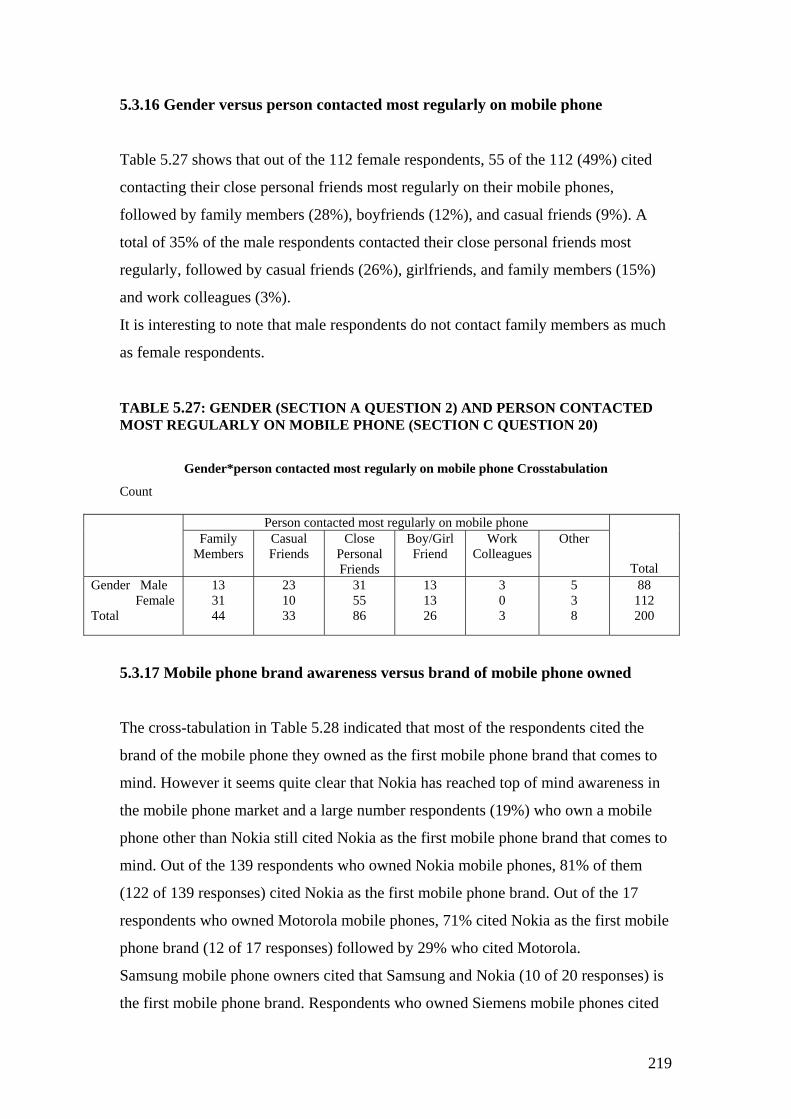
5.3.16 Gender versus person contacted most regularly on mobile phone
Table 5.27 shows that out of the 112 female respondents, 55 of the 112 (49%) cited
contacting their close personal friends most regularly on their mobile phones,
followed by family members (28%), boyfriends (12%), and casual friends (9%). A
total of 35% of the male respondents contacted their close personal friends most
regularly, followed by casual friends (26%), girlfriends, and family members (15%)
and work colleagues (3%).
It is interesting to note that male respondents do not contact family members as much
as female respondents.
TABLE 5.27: GENDER (SECTION A QUESTION 2) AND PERSON CONTACTED MOST REGULARLY ON MOBILE PHONE (SECTION C QUESTION 20)
Gender*person contacted most regularly on mobile phone Crosstabulation
Count
Person contacted most regularly on mobile phone Family
Members Casual Friends
Close Personal Friends
Boy/Girl Friend
Work Colleagues
Other
Total Gender Male Female Total
13 31 44
23 10 33
31 55 86
13 13 26
3 0 3
5 3 8
88 112 200
5.3.17 Mobile phone brand awareness versus brand of mobile phone owned
The cross-tabulation in Table 5.28 indicated that most of the respondents cited the
brand of the mobile phone they owned as the first mobile phone brand that comes to
mind. However it seems quite clear that Nokia has reached top of mind awareness in
the mobile phone market and a large number respondents (19%) who own a mobile
phone other than Nokia still cited Nokia as the first mobile phone brand that comes to
mind. Out of the 139 respondents who owned Nokia mobile phones, 81% of them
(122 of 139 responses) cited Nokia as the first mobile phone brand. Out of the 17
respondents who owned Motorola mobile phones, 71% cited Nokia as the first mobile
phone brand (12 of 17 responses) followed by 29% who cited Motorola.
Samsung mobile phone owners cited that Samsung and Nokia (10 of 20 responses) is
the first mobile phone brand. Respondents who owned Siemens mobile phones cited
219
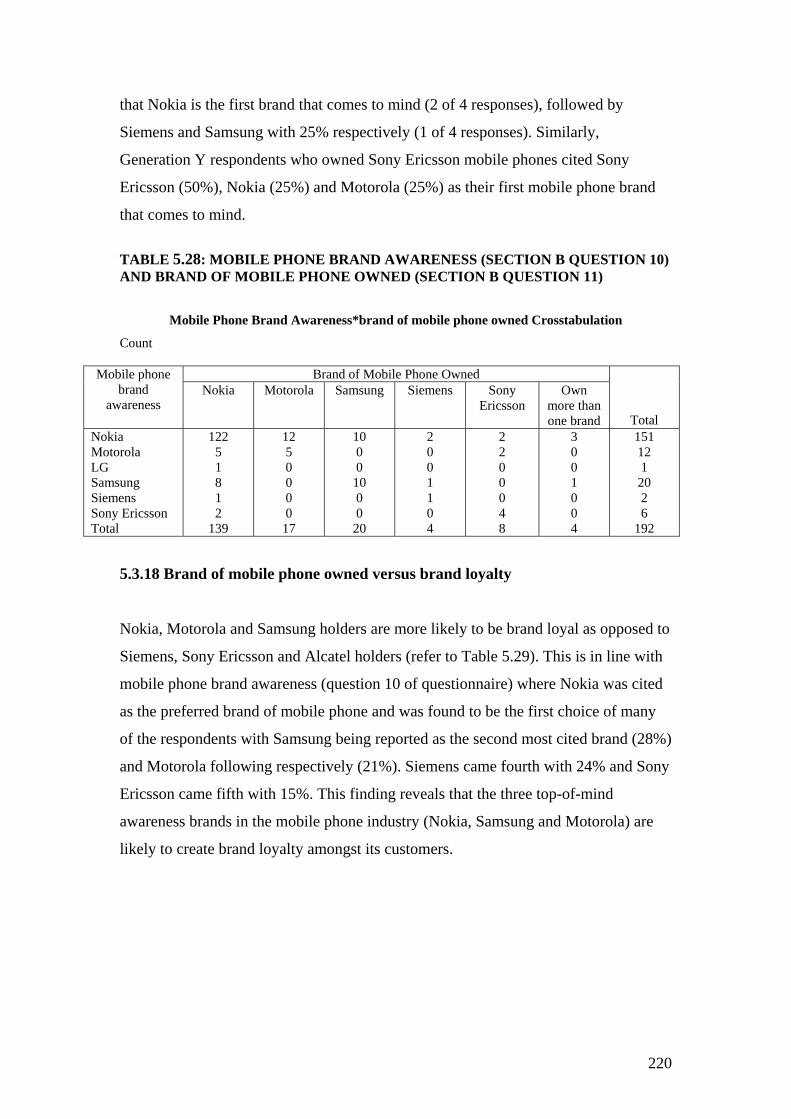
that Nokia is the first brand that comes to mind (2 of 4 responses), followed by
Siemens and Samsung with 25% respectively (1 of 4 responses). Similarly,
Generation Y respondents who owned Sony Ericsson mobile phones cited Sony
Ericsson (50%), Nokia (25%) and Motorola (25%) as their first mobile phone brand
that comes to mind.
TABLE 5.28: MOBILE PHONE BRAND AWARENESS (SECTION B QUESTION 10) AND BRAND OF MOBILE PHONE OWNED (SECTION B QUESTION 11)
Mobile Phone Brand Awareness*brand of mobile phone owned Crosstabulation
Count
Brand of Mobile Phone Owned Mobile phone brand
awareness Nokia Motorola Samsung Siemens Sony
Ericsson Own
more than one brand
Total Nokia Motorola LG Samsung Siemens Sony Ericsson Total
122 5 1 8 1 2
139
12 5 0 0 0 0
17
10 0 0
10 0 0
20
2 0 0 1 1 0 4
2 2 0 0 0 4 8
3 0 0 1 0 0 4
151 12 1
20 2 6
192
5.3.18 Brand of mobile phone owned versus brand loyalty
Nokia, Motorola and Samsung holders are more likely to be brand loyal as opposed to
Siemens, Sony Ericsson and Alcatel holders (refer to Table 5.29). This is in line with
mobile phone brand awareness (question 10 of questionnaire) where Nokia was cited
as the preferred brand of mobile phone and was found to be the first choice of many
of the respondents with Samsung being reported as the second most cited brand (28%)
and Motorola following respectively (21%). Siemens came fourth with 24% and Sony
Ericsson came fifth with 15%. This finding reveals that the three top-of-mind
awareness brands in the mobile phone industry (Nokia, Samsung and Motorola) are
likely to create brand loyalty amongst its customers.
220
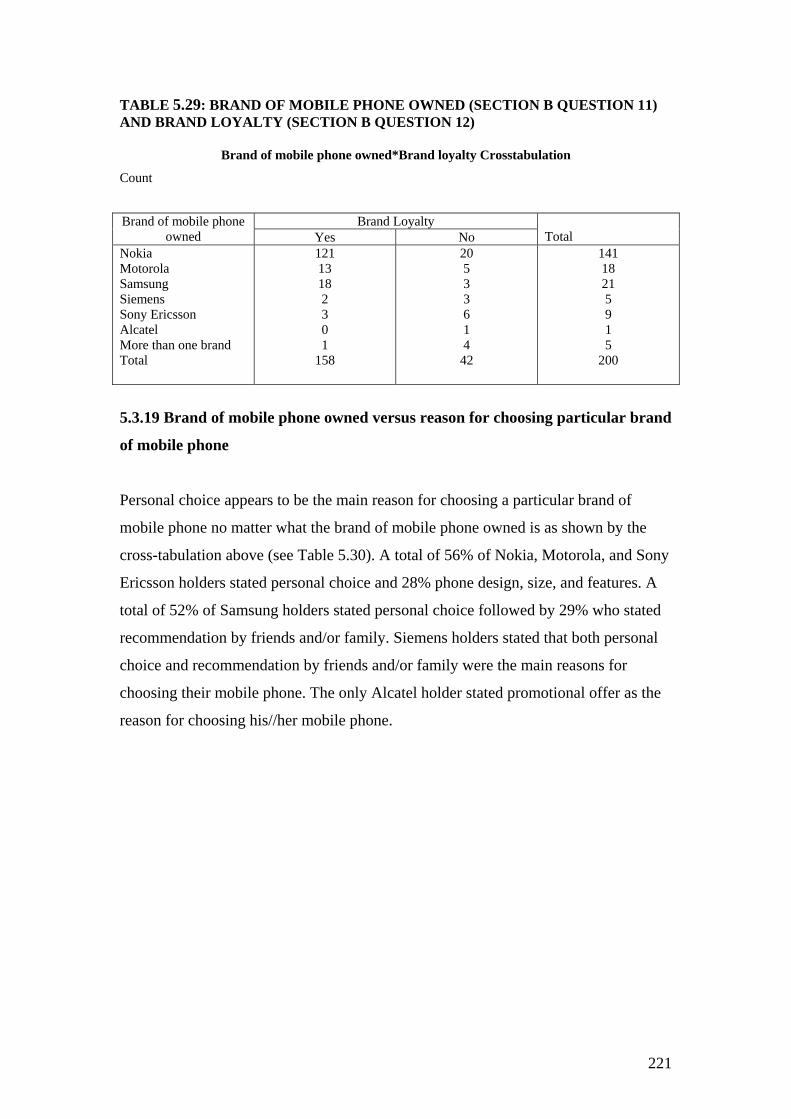
TABLE 5.29: BRAND OF MOBILE PHONE OWNED (SECTION B QUESTION 11) AND BRAND LOYALTY (SECTION B QUESTION 12)
Brand of mobile phone owned*Brand loyalty Crosstabulation
Count
Brand Loyalty Brand of mobile phone owned Yes No
Total
Nokia Motorola Samsung Siemens Sony Ericsson Alcatel More than one brand Total
121 13 18 2 3 0 1
158
20 5 3 3 6 1 4
42
141 18 21 5 9 1 5
200
5.3.19 Brand of mobile phone owned versus reason for choosing particular brand
of mobile phone
Personal choice appears to be the main reason for choosing a particular brand of
mobile phone no matter what the brand of mobile phone owned is as shown by the
cross-tabulation above (see Table 5.30). A total of 56% of Nokia, Motorola, and Sony
Ericsson holders stated personal choice and 28% phone design, size, and features. A
total of 52% of Samsung holders stated personal choice followed by 29% who stated
recommendation by friends and/or family. Siemens holders stated that both personal
choice and recommendation by friends and/or family were the main reasons for
choosing their mobile phone. The only Alcatel holder stated promotional offer as the
reason for choosing his//her mobile phone.
221
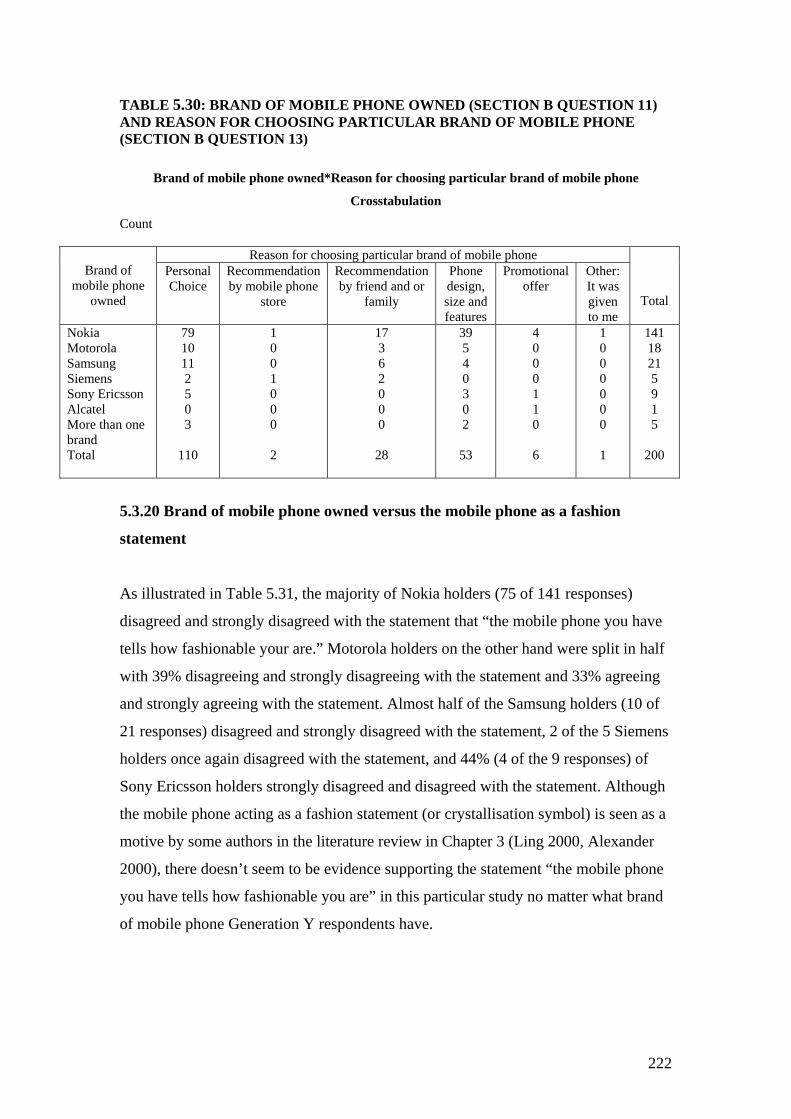
TABLE 5.30: BRAND OF MOBILE PHONE OWNED (SECTION B QUESTION 11) AND REASON FOR CHOOSING PARTICULAR BRAND OF MOBILE PHONE (SECTION B QUESTION 13)
Brand of mobile phone owned*Reason for choosing particular brand of mobile phone
Crosstabulation
Count
Reason for choosing particular brand of mobile phone Brand of
mobile phone owned
Personal Choice
Recommendation by mobile phone
store
Recommendation by friend and or
family
Phone design, size and features
Promotional offer
Other: It was given to me
Total
Nokia Motorola Samsung Siemens Sony Ericsson Alcatel More than one brand Total
79 10 11 2 5 0 3
110
1 0 0 1 0 0 0
2
17 3 6 2 0 0 0
28
39 5 4 0 3 0 2
53
4 0 0 0 1 1 0
6
1 0 0 0 0 0 0
1
141 18 21 5 9 1 5
200
5.3.20 Brand of mobile phone owned versus the mobile phone as a fashion
statement
As illustrated in Table 5.31, the majority of Nokia holders (75 of 141 responses)
disagreed and strongly disagreed with the statement that “the mobile phone you have
tells how fashionable your are.” Motorola holders on the other hand were split in half
with 39% disagreeing and strongly disagreeing with the statement and 33% agreeing
and strongly agreeing with the statement. Almost half of the Samsung holders (10 of
21 responses) disagreed and strongly disagreed with the statement, 2 of the 5 Siemens
holders once again disagreed with the statement, and 44% (4 of the 9 responses) of
Sony Ericsson holders strongly disagreed and disagreed with the statement. Although
the mobile phone acting as a fashion statement (or crystallisation symbol) is seen as a
motive by some authors in the literature review in Chapter 3 (Ling 2000, Alexander
2000), there doesn’t seem to be evidence supporting the statement “the mobile phone
you have tells how fashionable you are” in this particular study no matter what brand
of mobile phone Generation Y respondents have.
222
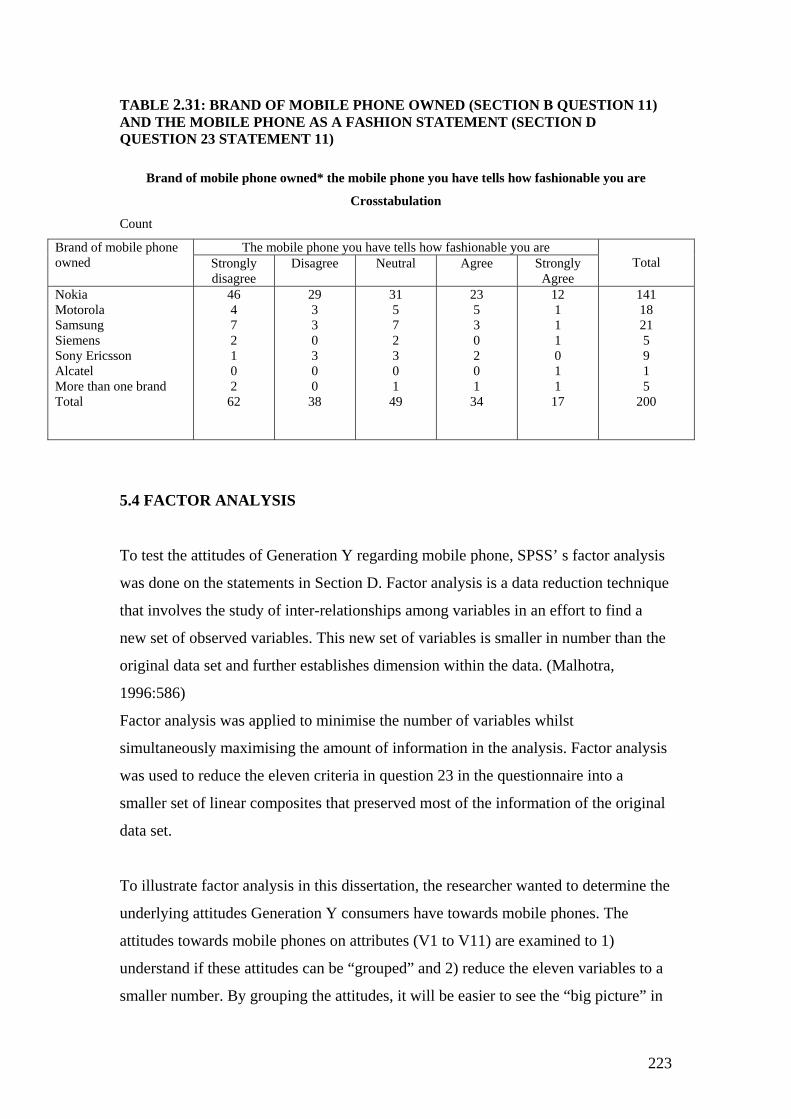
TABLE 2.31: BRAND OF MOBILE PHONE OWNED (SECTION B QUESTION 11) AND THE MOBILE PHONE AS A FASHION STATEMENT (SECTION D QUESTION 23 STATEMENT 11)
Brand of mobile phone owned* the mobile phone you have tells how fashionable you are
Crosstabulation
Count
The mobile phone you have tells how fashionable you are Brand of mobile phone owned Strongly
disagree Disagree Neutral Agree Strongly
Agree
Total
Nokia Motorola Samsung Siemens Sony Ericsson Alcatel More than one brand Total
46 4 7 2 1 0 2
62
29 3 3 0 3 0 0
38
31 5 7 2 3 0 1
49
23 5 3 0 2 0 1
34
12 1 1 1 0 1 1
17
141 18 21 5 9 1 5
200
5.4 FACTOR ANALYSIS
To test the attitudes of Generation Y regarding mobile phone, SPSS’ s factor analysis
was done on the statements in Section D. Factor analysis is a data reduction technique
that involves the study of inter-relationships among variables in an effort to find a
new set of observed variables. This new set of variables is smaller in number than the
original data set and further establishes dimension within the data. (Malhotra,
1996:586)
Factor analysis was applied to minimise the number of variables whilst
simultaneously maximising the amount of information in the analysis. Factor analysis
was used to reduce the eleven criteria in question 23 in the questionnaire into a
smaller set of linear composites that preserved most of the information of the original
data set.
To illustrate factor analysis in this dissertation, the researcher wanted to determine the
underlying attitudes Generation Y consumers have towards mobile phones. The
attitudes towards mobile phones on attributes (V1 to V11) are examined to 1)
understand if these attitudes can be “grouped” and 2) reduce the eleven variables to a
smaller number. By grouping the attitudes, it will be easier to see the “big picture” in
223
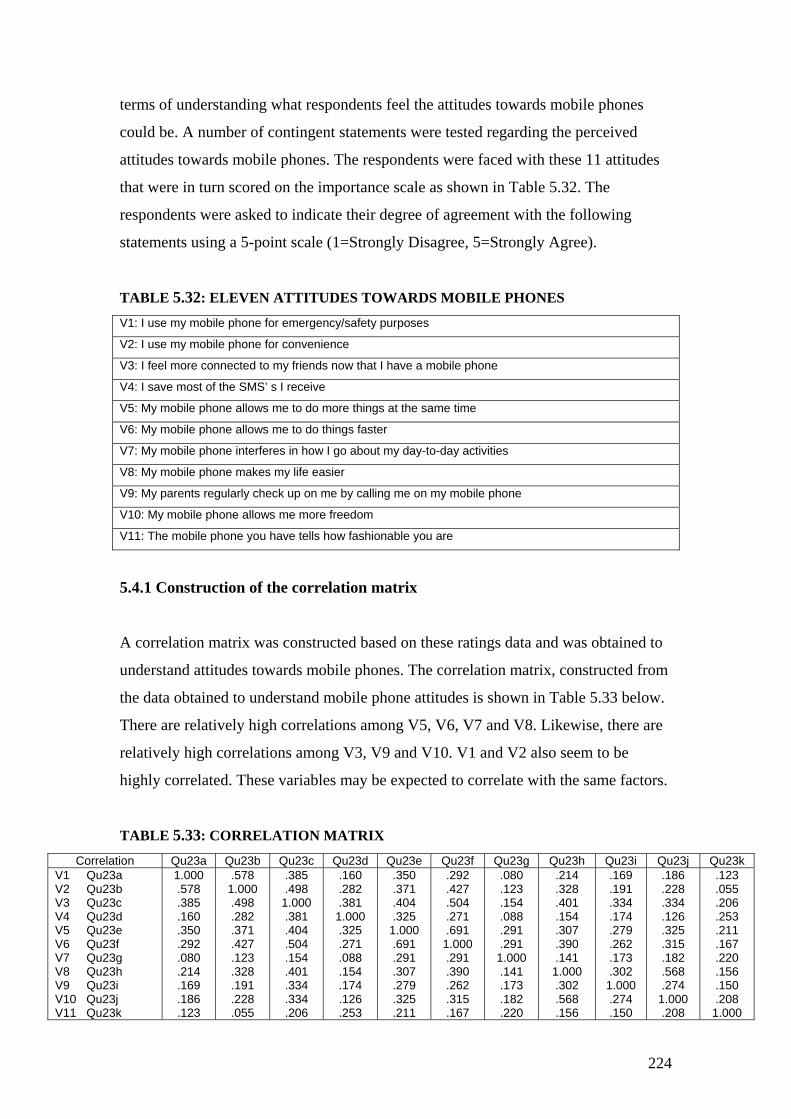
terms of understanding what respondents feel the attitudes towards mobile phones
could be. A number of contingent statements were tested regarding the perceived
attitudes towards mobile phones. The respondents were faced with these 11 attitudes
that were in turn scored on the importance scale as shown in Table 5.32. The
respondents were asked to indicate their degree of agreement with the following
statements using a 5-point scale (1=Strongly Disagree, 5=Strongly Agree).
TABLE 5.32: ELEVEN ATTITUDES TOWARDS MOBILE PHONES
V1: I use my mobile phone for emergency/safety purposes
V2: I use my mobile phone for convenience
V3: I feel more connected to my friends now that I have a mobile phone
V4: I save most of the SMS’ s I receive
V5: My mobile phone allows me to do more things at the same time
V6: My mobile phone allows me to do things faster
V7: My mobile phone interferes in how I go about my day-to-day activities
V8: My mobile phone makes my life easier
V9: My parents regularly check up on me by calling me on my mobile phone
V10: My mobile phone allows me more freedom
V11: The mobile phone you have tells how fashionable you are
5.4.1 Construction of the correlation matrix
A correlation matrix was constructed based on these ratings data and was obtained to
understand attitudes towards mobile phones. The correlation matrix, constructed from
the data obtained to understand mobile phone attitudes is shown in Table 5.33 below.
There are relatively high correlations among V5, V6, V7 and V8. Likewise, there are
relatively high correlations among V3, V9 and V10. V1 and V2 also seem to be
highly correlated. These variables may be expected to correlate with the same factors.
TABLE 5.33: CORRELATION MATRIX Correlation Qu23a Qu23b Qu23c Qu23d Qu23e Qu23f Qu23g Qu23h Qu23i Qu23j Qu23k
V1 Qu23a V2 Qu23b V3 Qu23c V4 Qu23d V5 Qu23e V6 Qu23f V7 Qu23g V8 Qu23h V9 Qu23i V10 Qu23j V11 Qu23k
1.000 .578 .385 .160 .350 .292 .080 .214 .169 .186 .123
.578 1.000 .498 .282 .371 .427 .123 .328 .191 .228 .055
.385
.498 1.000 .381 .404 .504 .154 .401 .334 .334 .206
.160
.282
.381 1.000 .325 .271 .088 .154 .174 .126 .253
.350
.371
.404
.325 1.000 .691 .291 .307 .279 .325 .211
.292
.427
.504
.271
.691 1.000 .291 .390 .262 .315 .167
.080
.123
.154
.088
.291
.291 1.000 .141 .173 .182 .220
.214
.328
.401
.154
.307
.390
.141 1.000 .302 .568 .156
.169
.191
.334
.174
.279
.262
.173
.302 1.000 .274 .150
.186
.228
.334
.126
.325
.315
.182
.568
.274 1.000 .208
.123
.055
.206
.253
.211
.167
.220
.156
.150
.208 1.000
224
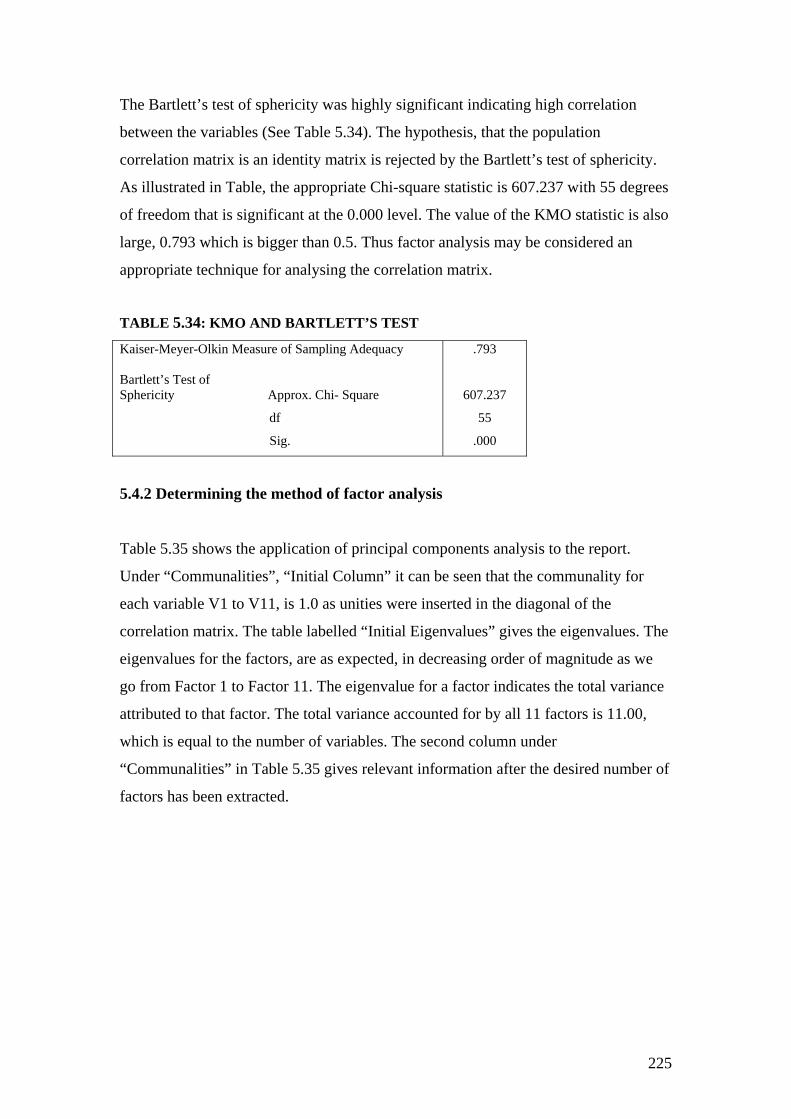
The Bartlett’s test of sphericity was highly significant indicating high correlation
between the variables (See Table 5.34). The hypothesis, that the population
correlation matrix is an identity matrix is rejected by the Bartlett’s test of sphericity.
As illustrated in Table, the appropriate Chi-square statistic is 607.237 with 55 degrees
of freedom that is significant at the 0.000 level. The value of the KMO statistic is also
large, 0.793 which is bigger than 0.5. Thus factor analysis may be considered an
appropriate technique for analysing the correlation matrix.
TABLE 5.34: KMO AND BARTLETT’S TEST Kaiser-Meyer-Olkin Measure of Sampling Adequacy Bartlett’s Test of Sphericity Approx. Chi- Square
df
Sig.
.793
607.237
55
.000
5.4.2 Determining the method of factor analysis
Table 5.35 shows the application of principal components analysis to the report.
Under “Communalities”, “Initial Column” it can be seen that the communality for
each variable V1 to V11, is 1.0 as unities were inserted in the diagonal of the
correlation matrix. The table labelled “Initial Eigenvalues” gives the eigenvalues. The
eigenvalues for the factors, are as expected, in decreasing order of magnitude as we
go from Factor 1 to Factor 11. The eigenvalue for a factor indicates the total variance
attributed to that factor. The total variance accounted for by all 11 factors is 11.00,
which is equal to the number of variables. The second column under
“Communalities” in Table 5.35 gives relevant information after the desired number of
factors has been extracted.
225
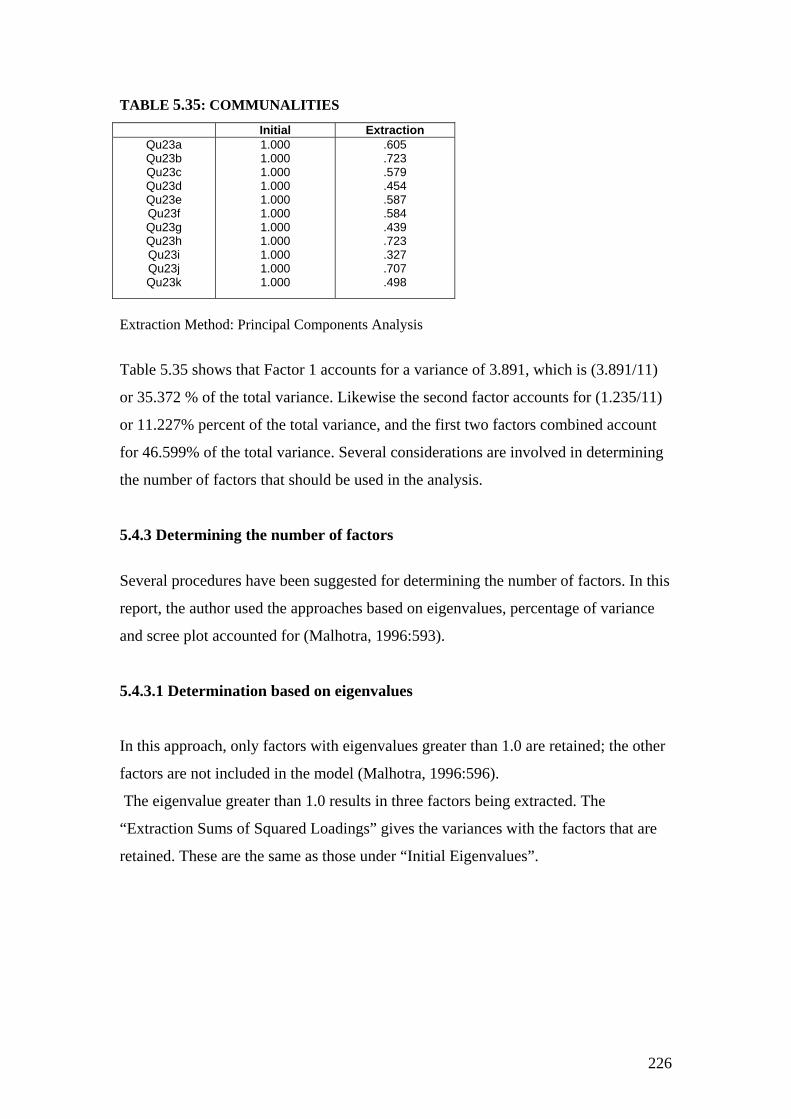
TABLE 5.35: COMMUNALITIES
Initial Extraction Qu23a Qu23b Qu23c Qu23d Qu23e Qu23f Qu23g Qu23h Qu23i Qu23j Qu23k
1.000 1.000 1.000 1.000 1.000 1.000 1.000 1.000 1.000 1.000 1.000
.605
.723
.579
.454
.587
.584
.439
.723
.327
.707
.498
Extraction Method: Principal Components Analysis
Table 5.35 shows that Factor 1 accounts for a variance of 3.891, which is (3.891/11)
or 35.372 % of the total variance. Likewise the second factor accounts for (1.235/11)
or 11.227% percent of the total variance, and the first two factors combined account
for 46.599% of the total variance. Several considerations are involved in determining
the number of factors that should be used in the analysis.
5.4.3 Determining the number of factors
Several procedures have been suggested for determining the number of factors. In this
report, the author used the approaches based on eigenvalues, percentage of variance
and scree plot accounted for (Malhotra, 1996:593).
5.4.3.1 Determination based on eigenvalues
In this approach, only factors with eigenvalues greater than 1.0 are retained; the other
factors are not included in the model (Malhotra, 1996:596).
The eigenvalue greater than 1.0 results in three factors being extracted. The
“Extraction Sums of Squared Loadings” gives the variances with the factors that are
retained. These are the same as those under “Initial Eigenvalues”.
226
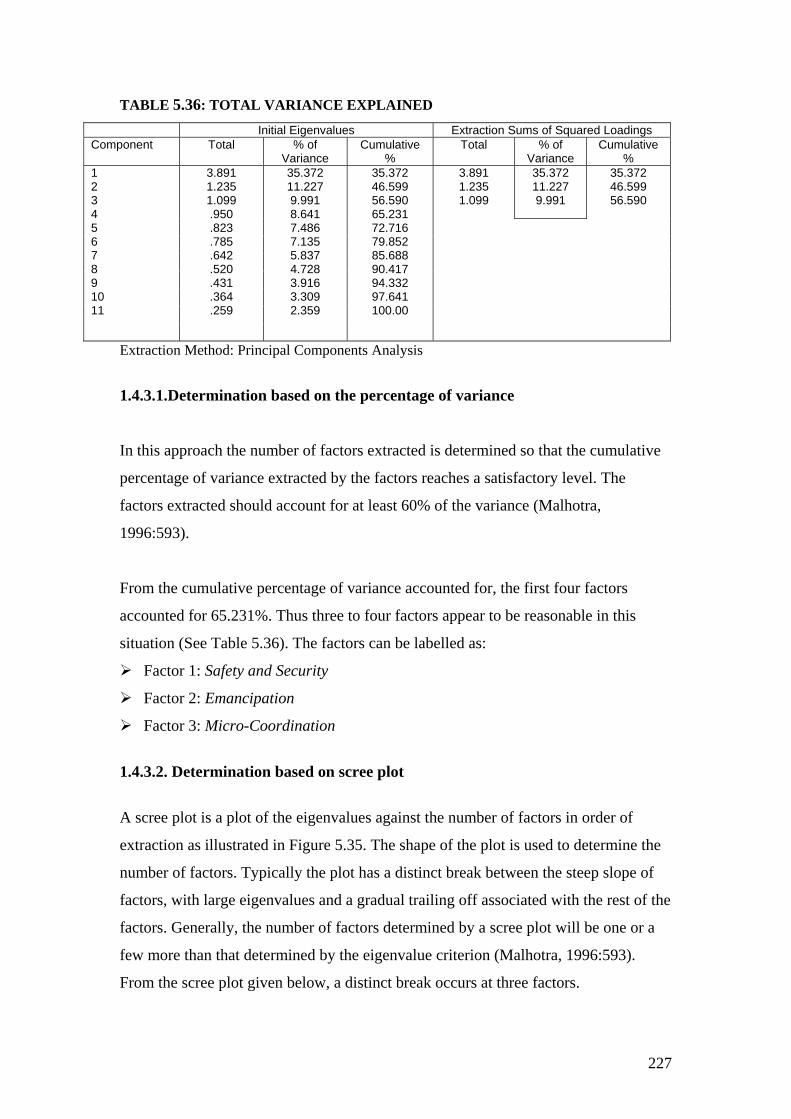
TABLE 5.36: TOTAL VARIANCE EXPLAINED Initial Eigenvalues Extraction Sums of Squared Loadings Component Total % of
Variance Cumulative
% Total % of
Variance Cumulative
% 3.891 1.235 1.099
35.372 11.227 9.991
35.372 46.599 56.590
1 2 3 4 5 6 7 8 9 10 11
3.891 1.235 1.099 .950 .823 .785 .642 .520 .431 .364 .259
35.372 11.227 9.991 8.641 7.486 7.135 5.837 4.728 3.916 3.309 2.359
35.372 46.599 56.590 65.231 72.716 79.852 85.688 90.417 94.332 97.641 100.00
Extraction Method: Principal Components Analysis
1.4.3.1.Determination based on the percentage of variance
In this approach the number of factors extracted is determined so that the cumulative
percentage of variance extracted by the factors reaches a satisfactory level. The
factors extracted should account for at least 60% of the variance (Malhotra,
1996:593).
From the cumulative percentage of variance accounted for, the first four factors
accounted for 65.231%. Thus three to four factors appear to be reasonable in this
situation (See Table 5.36). The factors can be labelled as:
Factor 1: Safety and Security
Factor 2: Emancipation
Factor 3: Micro-Coordination
1.4.3.2. Determination based on scree plot
A scree plot is a plot of the eigenvalues against the number of factors in order of
extraction as illustrated in Figure 5.35. The shape of the plot is used to determine the
number of factors. Typically the plot has a distinct break between the steep slope of
factors, with large eigenvalues and a gradual trailing off associated with the rest of the
factors. Generally, the number of factors determined by a scree plot will be one or a
few more than that determined by the eigenvalue criterion (Malhotra, 1996:593).
From the scree plot given below, a distinct break occurs at three factors.
227
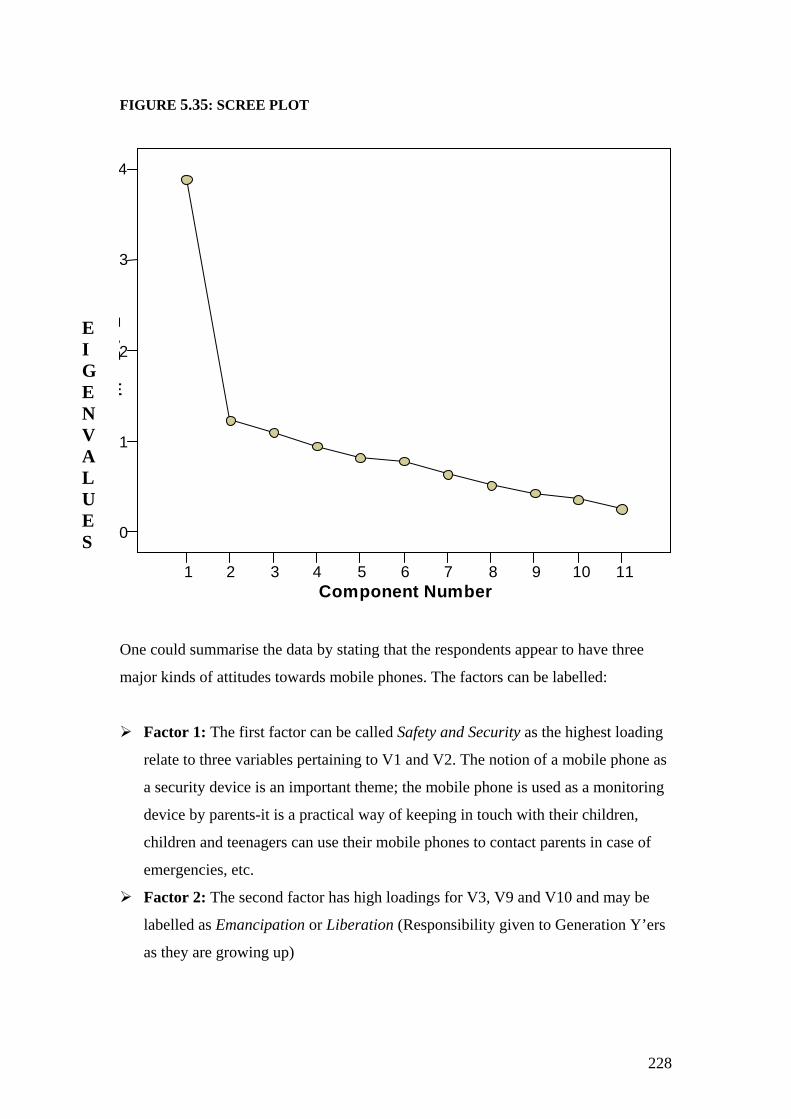
FIGURE 5.35: SCREE PLOT
1 2 3 4 5 6 7 8 9 10 11 Component Number
0
1
2
3
4
E
n v u
E I GENVALUE S
One could summarise the data by stating that the respondents appear to have three
major kinds of attitudes towards mobile phones. The factors can be labelled:
Factor 1: The first factor can be called Safety and Security as the highest loading
relate to three variables pertaining to V1 and V2. The notion of a mobile phone as
a security device is an important theme; the mobile phone is used as a monitoring
device by parents-it is a practical way of keeping in touch with their children,
children and teenagers can use their mobile phones to contact parents in case of
emergencies, etc.
Factor 2: The second factor has high loadings for V3, V9 and V10 and may be
labelled as Emancipation or Liberation (Responsibility given to Generation Y’ers
as they are growing up)
228
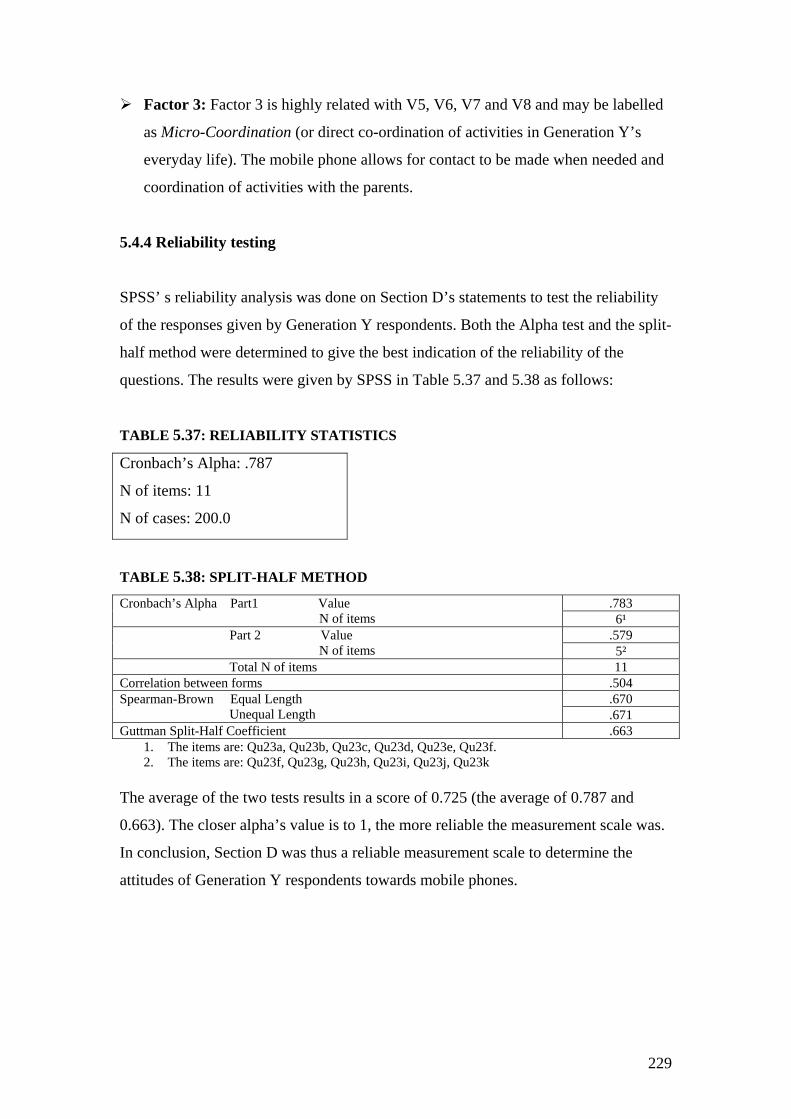
Factor 3: Factor 3 is highly related with V5, V6, V7 and V8 and may be labelled
as Micro-Coordination (or direct co-ordination of activities in Generation Y’s
everyday life). The mobile phone allows for contact to be made when needed and
coordination of activities with the parents.
5.4.4 Reliability testing
SPSS’ s reliability analysis was done on Section D’s statements to test the reliability
of the responses given by Generation Y respondents. Both the Alpha test and the split-
half method were determined to give the best indication of the reliability of the
questions. The results were given by SPSS in Table 5.37 and 5.38 as follows:
TABLE 5.37: RELIABILITY STATISTICS
Cronbach’s Alpha: .787
N of items: 11
N of cases: 200.0
TABLE 5.38: SPLIT-HALF METHOD .783 Cronbach’s Alpha Part1 Value
N of items 6¹ .579 Part 2 Value
N of items 5² Total N of items 11 Correlation between forms .504
.670 Spearman-Brown Equal Length Unequal Length .671 Guttman Split-Half Coefficient .663
1. The items are: Qu23a, Qu23b, Qu23c, Qu23d, Qu23e, Qu23f. 2. The items are: Qu23f, Qu23g, Qu23h, Qu23i, Qu23j, Qu23k
The average of the two tests results in a score of 0.725 (the average of 0.787 and
0.663). The closer alpha’s value is to 1, the more reliable the measurement scale was.
In conclusion, Section D was thus a reliable measurement scale to determine the
attitudes of Generation Y respondents towards mobile phones.
229
5.5 CONCLUSION
This chapter discussed the research results. Microsoft Excel and SPSS 12.0 statistical
software for Windows were used for the results. The results were presented on a
question-by-question basis and analysed using tables and graphs. Some cross-
tabulations were then made between some questions to indicate some interesting
findings regarding mobile phone behaviour by Generation Y respondents.
The main findings regarding mobile phone usage by Generation Y students in the city
of Johannesburg were as follows: Generation Y respondents surveyed were reported
to have owned a mobile phone for three to five years with a majority of them owning
Nokia mobile phones. Most Generation Y respondents were on prepaid packages and
were not big spenders of airtime with the average mobile phone bill amounting to
between R100-R200. Furthermore, SMS is seen as the more cost-effective way to
communicate. Regarding the competitive situation in the mobile phone market, the
perceptions of this segment is that Vodacom is perceived to be the “cool” operator,
MTN the most “expensive” network operator and Cell C as “cheap and youthful.”
A factor analysis was discussed for the attitudes towards mobile phones and was
followed by a reliability testing. The data extracted provided answers to the primary
and secondary objectives set in Chapter 1.
The following chapter, Chapter 6, will give recommendations and the conclusion of
the study based on the findings and results of this chapter.
230

231
CHAPTER 6
CONCLUSIONS AND RECOMMENDATIONS
6.1 INTRODUCTION
The results of the study were discussed in Chapter 5. In the last chapter of this study,
Chapter 6, general conclusions will be drawn based on the findings in Chapter 5. The
conclusions provide opportunities to make recommendations to academics, marketers,
network providers and handset manufacturers concerning future research in the field
of marketing in respect of Generation Y consumers in South Africa.
6.2 TESTING FOR THE RESEARCH OBJECTIVES
The objectives and sub-objectives of the study will be dealt with, together with
recommendations and conclusions, in the following sections.
6.2.1 Primary research objective
This study was conducted in order to increase the understanding of the mobile phone
usage of Generation Y consumers. The main objectives of the study indicate the
following. First of all, the primary research objective was to gain information
regarding the use of mobile phones by Generation Y consumers in the city of
Johannesburg. The information relating to this question is contained in Section C and
certain questions in Section B of the questionnaire in which mobile phone usage
patterns were discussed. The main results of the study indicate the following.
231
6.2.1.1 Generation Y mobile phone usage
Mobile phone ownership figures among Generation Y students of two universities in
the city of Johannesburg revealed the following facts. Students owning a mobile
phone at the time the survey was conducted were screened.
Generation Y respondents were reported to have owned a mobile phone for three to
five years with a majority of them owning a Nokia mobile phone, followed by
Samsung, Motorola, Sony Ericsson and Siemens. Most Generation Y respondents
were on prepaid packages and did not spend excessive amounts of airtime with the
average mobile phone bill amounting to between R100-R200 per month. The teenager
segment (17-19 years old) and the young adult segment (20-23 years old) reported
different behaviours regarding their mobile phone usage. The teenagers were more
likely to be prepaid users whereas a large proportion of young adults were contract
users due to higher incidence of employment. Thus, the older the Generation Y
respondent, the more likely he/she will be to be personally responsible for his/her
mobile phone bill. Furthermore Generation Y respondents reported making less than
five calls a day. Usage patterns are divided into calls made and calls received, with
young people receiving as many calls as they make (less than five). There were no
significant differences between the teenager and young adult segment regarding the
number of mobile phone calls made per day. However, younger Generation Y
respondents received significantly more calls than the young adults.
According to over half of the respondents, the average length of a mobile phone call is
between five and fifteen minutes. Furthermore, the average length of a mobile phone
call tended to be longer the older the respondent. The Generation Y respondents send
on average five to ten SMS’ s a day, with the younger adults using SMS’ s more than
the teenager segment due- once again this fact is attributable a higher incidence of
employment. This indicates a preference for SMS’ s which can be ascribed to reasons
such as convenience and cost. Unlike voice communications SMS’ s may be sent
anywhere, anytime and anyplace. Cost is the other important criteria for sending
SMS’ s. While a voice mobile phone call costs around R2.50, an SMS costs no more
than 70 cents during peak times (See Chapter 2, section on tariffs).
232
Close personal friends, family members, casual friends, boy/girl friends and work
colleagues are all people contacted by mobile phone in order of preference as
indicated by Generation Y. Peer relationships are highly regarded by this generation
and therefore it comes as no surprise that Generation Y contact their close personal
friends mostly on their mobile phones. Most Generation Y respondents indicated that
they use their mobile phones during off-peak hours (after 8pm); this is the period
during which calls and SMS’ s are cheaper, and also during which free minutes apply
if the callers are on contracts- This reveals the cost-conscious nature of the generation.
SMS’ s were the most frequently used feature after voice calls, indicating the
popularity of the SMS as an important way in which Generation Y respondents
communicate.
Generation Y respondents do on occasions use their mobile phone calls to manage
personal information, play games, and receive and send pictures from a digital
camera. Accessing the Internet (WAP) and sending and receiving email were not as
popular, indicating the slow uptake of such a feature by Generation Y. New
technologies such as WAP will be adopted by Generation Y consumers only once
tariffs for this service are in line with their budgets and needs. Generation Y has thus
refrained from excessive use of advanced 3G technologies as a result of cost.
For a detailed exposition on the main findings in this regard please consult Chapter 5.
6.2.2 Secondary research objectives
The first secondary research objective was to determine the demographics of
Generation Y respondents. The researcher thus used information retrieved from
Section A of the questionnaire to find out more about the demographics of Generation
Y consumers. The results provide interesting aspects of demographics for use by
network providers (See Table 6.1):
233
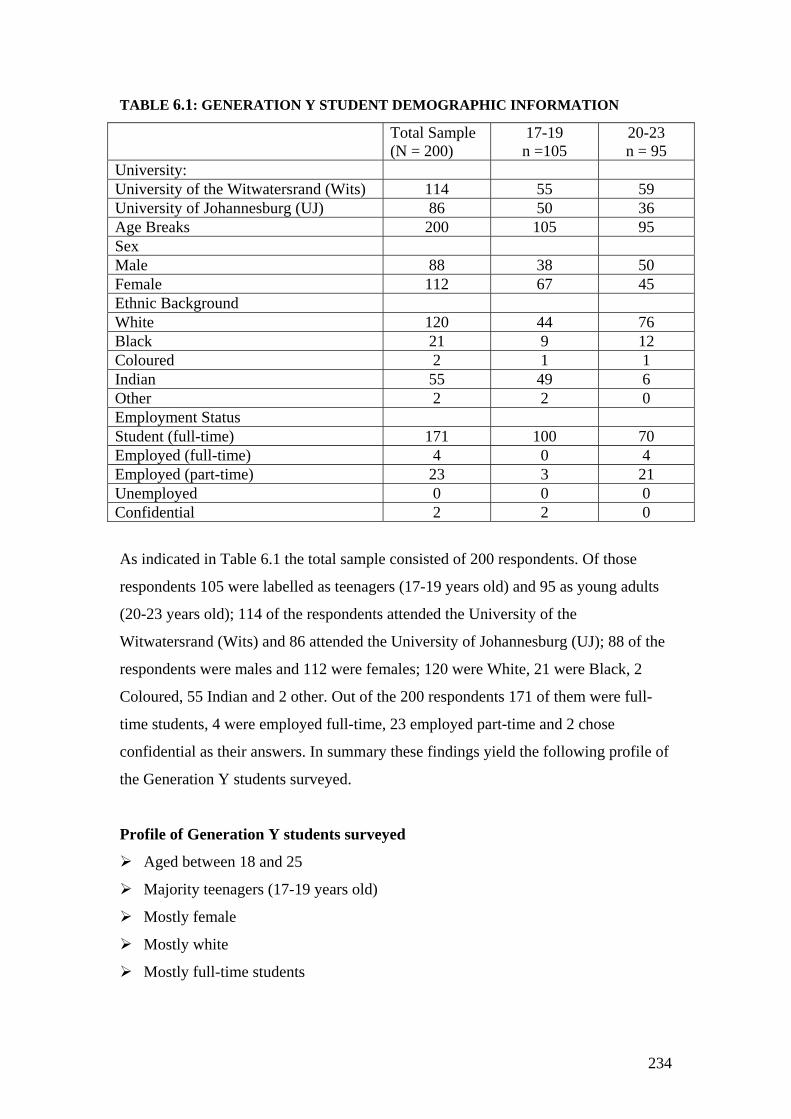
TABLE 6.1: GENERATION Y STUDENT DEMOGRAPHIC INFORMATION
Total Sample (N = 200)
17-19 n =105
20-23 n = 95
University: University of the Witwatersrand (Wits) 114 55 59 University of Johannesburg (UJ) 86 50 36 Age Breaks 200 105 95 Sex Male 88 38 50 Female 112 67 45 Ethnic Background White 120 44 76 Black 21 9 12 Coloured 2 1 1 Indian 55 49 6 Other 2 2 0 Employment Status Student (full-time) 171 100 70 Employed (full-time) 4 0 4 Employed (part-time) 23 3 21 Unemployed 0 0 0 Confidential 2 2 0
As indicated in Table 6.1 the total sample consisted of 200 respondents. Of those
respondents 105 were labelled as teenagers (17-19 years old) and 95 as young adults
(20-23 years old); 114 of the respondents attended the University of the
Witwatersrand (Wits) and 86 attended the University of Johannesburg (UJ); 88 of the
respondents were males and 112 were females; 120 were White, 21 were Black, 2
Coloured, 55 Indian and 2 other. Out of the 200 respondents 171 of them were full-
time students, 4 were employed full-time, 23 employed part-time and 2 chose
confidential as their answers. In summary these findings yield the following profile of
the Generation Y students surveyed.
Profile of Generation Y students surveyed
Aged between 18 and 25
Majority teenagers (17-19 years old)
Mostly female
Mostly white
Mostly full-time students
234
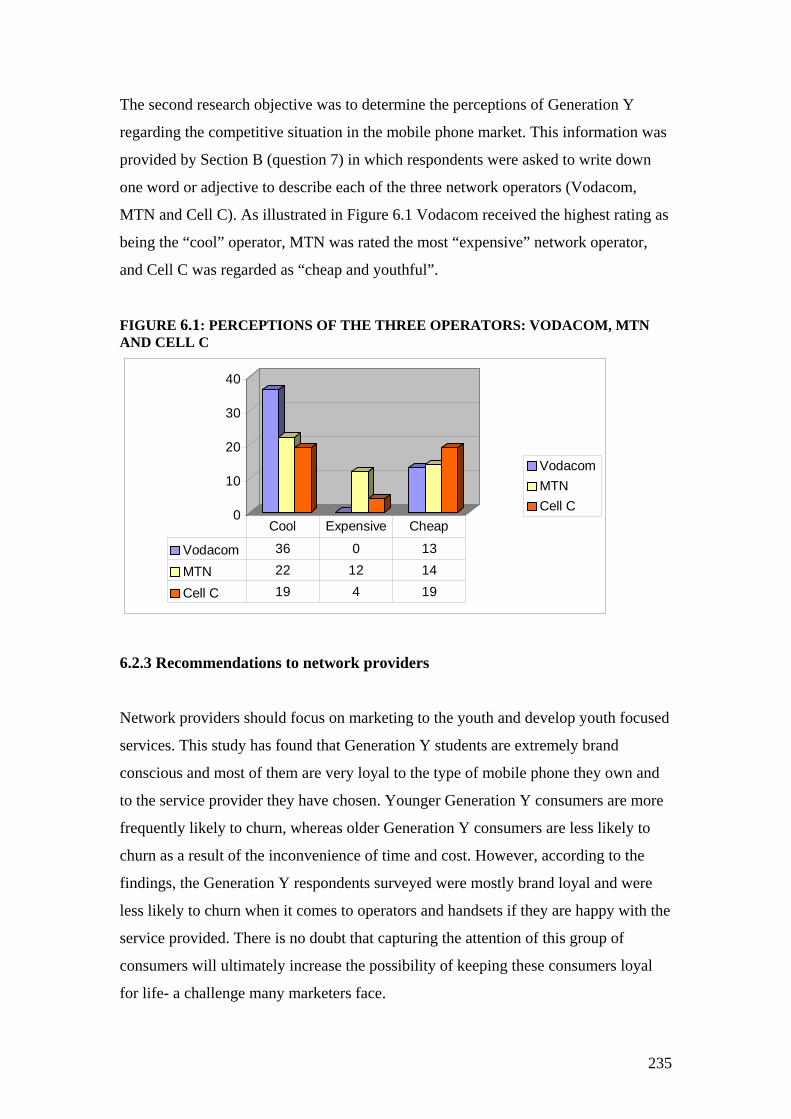
The second research objective was to determine the perceptions of Generation Y
regarding the competitive situation in the mobile phone market. This information was
provided by Section B (question 7) in which respondents were asked to write down
one word or adjective to describe each of the three network operators (Vodacom,
MTN and Cell C). As illustrated in Figure 6.1 Vodacom received the highest rating as
being the “cool” operator, MTN was rated the most “expensive” network operator,
and Cell C was regarded as “cheap and youthful”.
FIGURE 6.1: PERCEPTIONS OF THE THREE OPERATORS: VODACOM, MTN AND CELL C
0
10
20
30
40
VodacomMTNCell C
Vodacom 36 0 13
MTN 22 12 14
Cell C 19 4 19
Cool Expensive Cheap
6.2.3 Recommendations to network providers
Network providers should focus on marketing to the youth and develop youth focused
services. This study has found that Generation Y students are extremely brand
conscious and most of them are very loyal to the type of mobile phone they own and
to the service provider they have chosen. Younger Generation Y consumers are more
frequently likely to churn, whereas older Generation Y consumers are less likely to
churn as a result of the inconvenience of time and cost. However, according to the
findings, the Generation Y respondents surveyed were mostly brand loyal and were
less likely to churn when it comes to operators and handsets if they are happy with the
service provided. There is no doubt that capturing the attention of this group of
consumers will ultimately increase the possibility of keeping these consumers loyal
for life- a challenge many marketers face.
235
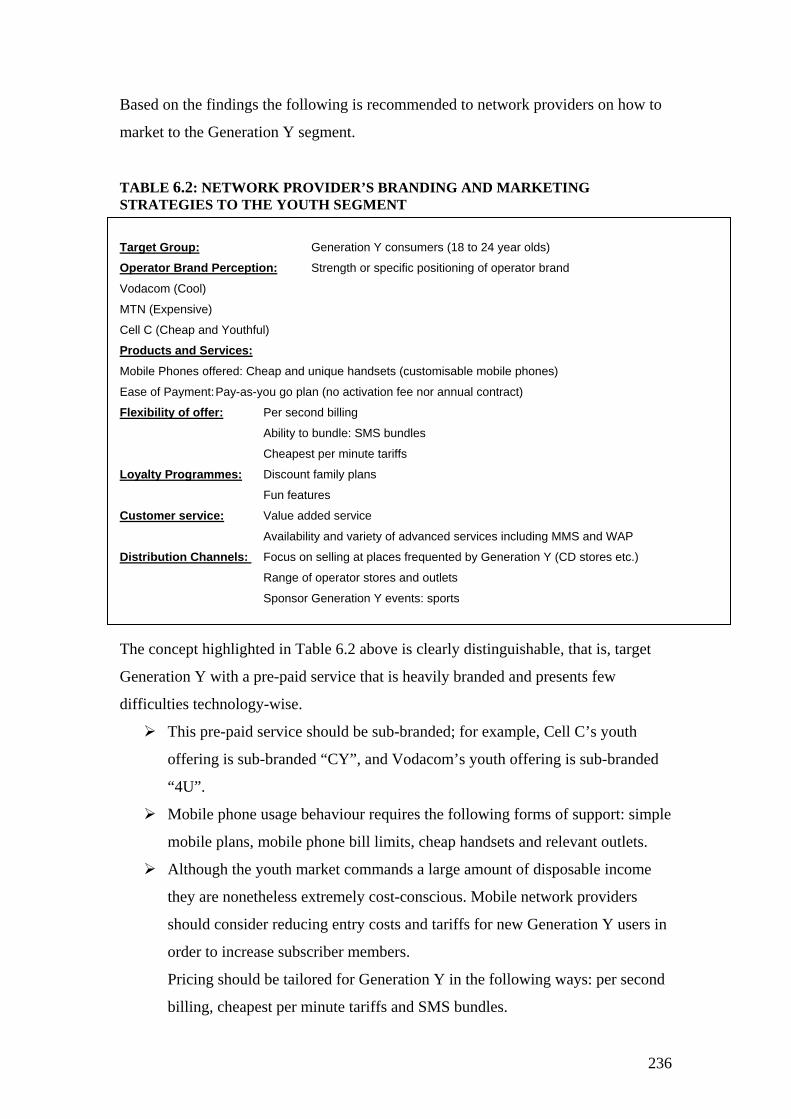
Based on the findings the following is recommended to network providers on how to
market to the Generation Y segment.
TABLE 6.2: NETWORK PROVIDER’S BRANDING AND MARKETING STRATEGIES TO THE YOUTH SEGMENT Target Group: Generation Y consumers (18 to 24 year olds)
Operator Brand Perception: Strength or specific positioning of operator brand
Vodacom (Cool)
MTN (Expensive)
Cell C (Cheap and Youthful)
Products and Services:
Mobile Phones offered: Cheap and unique handsets (customisable mobile phones)
Ease of Payment: Pay-as-you go plan (no activation fee nor annual contract)
Flexibility of offer: Per second billing
Ability to bundle: SMS bundles
Cheapest per minute tariffs
Loyalty Programmes: Discount family plans
Fun features
Customer service: Value added service
Availability and variety of advanced services including MMS and WAP
Distribution Channels: Focus on selling at places frequented by Generation Y (CD stores etc.)
Range of operator stores and outlets
Sponsor Generation Y events: sports
The concept highlighted in Table 6.2 above is clearly distinguishable, that is, target
Generation Y with a pre-paid service that is heavily branded and presents few
difficulties technology-wise.
This pre-paid service should be sub-branded; for example, Cell C’s youth
offering is sub-branded “CY”, and Vodacom’s youth offering is sub-branded
“4U”.
Mobile phone usage behaviour requires the following forms of support: simple
mobile plans, mobile phone bill limits, cheap handsets and relevant outlets.
Although the youth market commands a large amount of disposable income
they are nonetheless extremely cost-conscious. Mobile network providers
should consider reducing entry costs and tariffs for new Generation Y users in
order to increase subscriber members.
Pricing should be tailored for Generation Y in the following ways: per second
billing, cheapest per minute tariffs and SMS bundles.
236
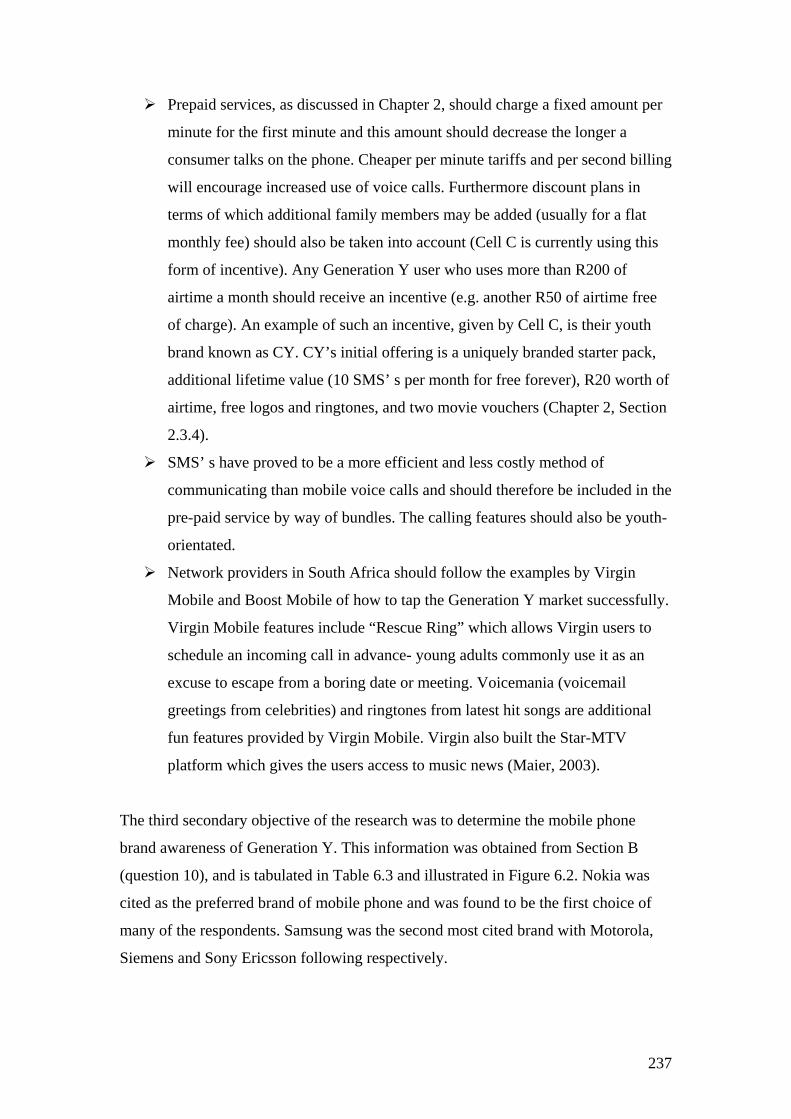
Prepaid services, as discussed in Chapter 2, should charge a fixed amount per
minute for the first minute and this amount should decrease the longer a
consumer talks on the phone. Cheaper per minute tariffs and per second billing
will encourage increased use of voice calls. Furthermore discount plans in
terms of which additional family members may be added (usually for a flat
monthly fee) should also be taken into account (Cell C is currently using this
form of incentive). Any Generation Y user who uses more than R200 of
airtime a month should receive an incentive (e.g. another R50 of airtime free
of charge). An example of such an incentive, given by Cell C, is their youth
brand known as CY. CY’s initial offering is a uniquely branded starter pack,
additional lifetime value (10 SMS’ s per month for free forever), R20 worth of
airtime, free logos and ringtones, and two movie vouchers (Chapter 2, Section
2.3.4).
SMS’ s have proved to be a more efficient and less costly method of
communicating than mobile voice calls and should therefore be included in the
pre-paid service by way of bundles. The calling features should also be youth-
orientated.
Network providers in South Africa should follow the examples by Virgin
Mobile and Boost Mobile of how to tap the Generation Y market successfully.
Virgin Mobile features include “Rescue Ring” which allows Virgin users to
schedule an incoming call in advance- young adults commonly use it as an
excuse to escape from a boring date or meeting. Voicemania (voicemail
greetings from celebrities) and ringtones from latest hit songs are additional
fun features provided by Virgin Mobile. Virgin also built the Star-MTV
platform which gives the users access to music news (Maier, 2003).
The third secondary objective of the research was to determine the mobile phone
brand awareness of Generation Y. This information was obtained from Section B
(question 10), and is tabulated in Table 6.3 and illustrated in Figure 6.2. Nokia was
cited as the preferred brand of mobile phone and was found to be the first choice of
many of the respondents. Samsung was the second most cited brand with Motorola,
Siemens and Sony Ericsson following respectively.
237
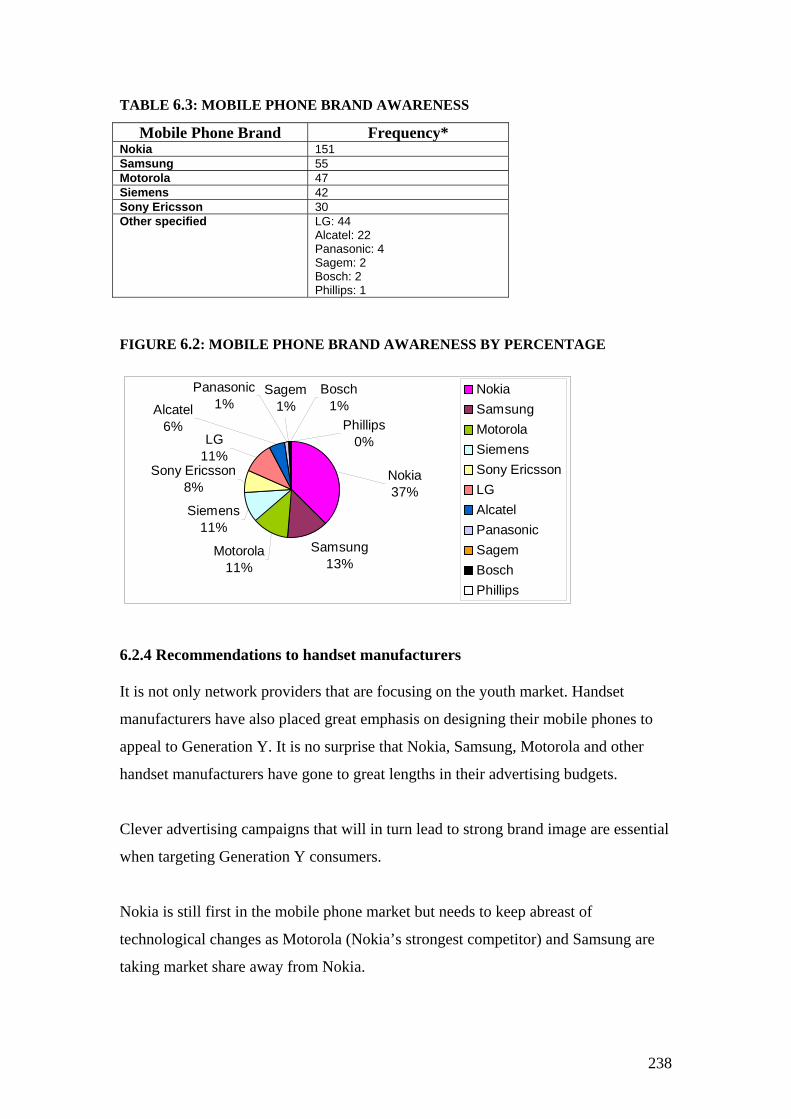
TABLE 6.3: MOBILE PHONE BRAND AWARENESS
Mobile Phone Brand Frequency* Nokia 151 Samsung 55 Motorola 47 Siemens 42 Sony Ericsson 30 Other specified LG: 44
Alcatel: 22 Panasonic: 4 Sagem: 2 Bosch: 2 Phillips: 1
FIGURE 6.2: MOBILE PHONE BRAND AWARENESS BY PERCENTAGE
Samsung13%
Motorola11%
Siemens11%
Sony Ericsson8%
LG11%
Alcatel6%
Nokia37%
Panasonic1%
Sagem1%
Bosch1%
Phillips0%
NokiaSamsungMotorolaSiemensSony EricssonLGAlcatelPanasonicSagemBoschPhillips
6.2.4 Recommendations to handset manufacturers It is not only network providers that are focusing on the youth market. Handset
manufacturers have also placed great emphasis on designing their mobile phones to
appeal to Generation Y. It is no surprise that Nokia, Samsung, Motorola and other
handset manufacturers have gone to great lengths in their advertising budgets.
Clever advertising campaigns that will in turn lead to strong brand image are essential
when targeting Generation Y consumers.
Nokia is still first in the mobile phone market but needs to keep abreast of
technological changes as Motorola (Nokia’s strongest competitor) and Samsung are
taking market share away from Nokia.
238
This loss of market share is partly due to Nokia’s refusal to incorporate new
technologies, and also to the improvement in quality in the manufacture of Motorola
and Samsung handsets.
Each handset manufacturer should carefully re-think its strategy when marketing to
Generation Y and focus on brand personality, brand positioning, product design and
differentiation (Temporal & Lee, 2001).
For example Nokia focuses on customer relationships- trust is at the heart of the
brand. It uses a combination of aspirational, benefit-based emotional features, and
competition-driven positioning strategies. Nokia owns the “human” element of the
mobile world- an understanding of what consumers want and what will fit in their
particular lifestyle (Temporal & Lee, 2001). In turn, product design is also very
important in the success of the brand. The way in which the consumer will experience
the brand and how that experience reflects its brand character are all taken into
account (the shape of the phone should be designed in such a way so as it is easy to
hold).
According to a report by Nokia (Ahem, Billings, Lee, Spring, Tran & Yang, 2005),
when Motorola first started to manufacture more technologically advanced phones,
Nokia predicted that mobile phones were eventually going to become a popular
product. Nokia adopted an off-core differentiation approach which made the brand
what it is today. Nokia believed that the mobile phone would become a fashion
statement and was the pioneer behind the idea of interchangeable faceplates. When
the technology of most handset manufacturers became similar they began to compete
over design. Samsung has begun to gain ascendancy over Nokia using Nokia’s
strategy. Samsung has recently joined Vogue in an attempt to lead the mobile phone
fashion. Nokia is said to dominate the value chain (see in Figure 6.3) through the
strength of its application developers, mobile operating systems and handsets (Ahem
et al., 2005). Nokia SA noted that, for the African youth market, the lifestyle aspect of
handsets is very important-this includes cameras, music and entertainment features.
Nokia recognised that handsets were no longer a communication tool only, but also an
important part of the individual’s life (Lowman, 2005).
239
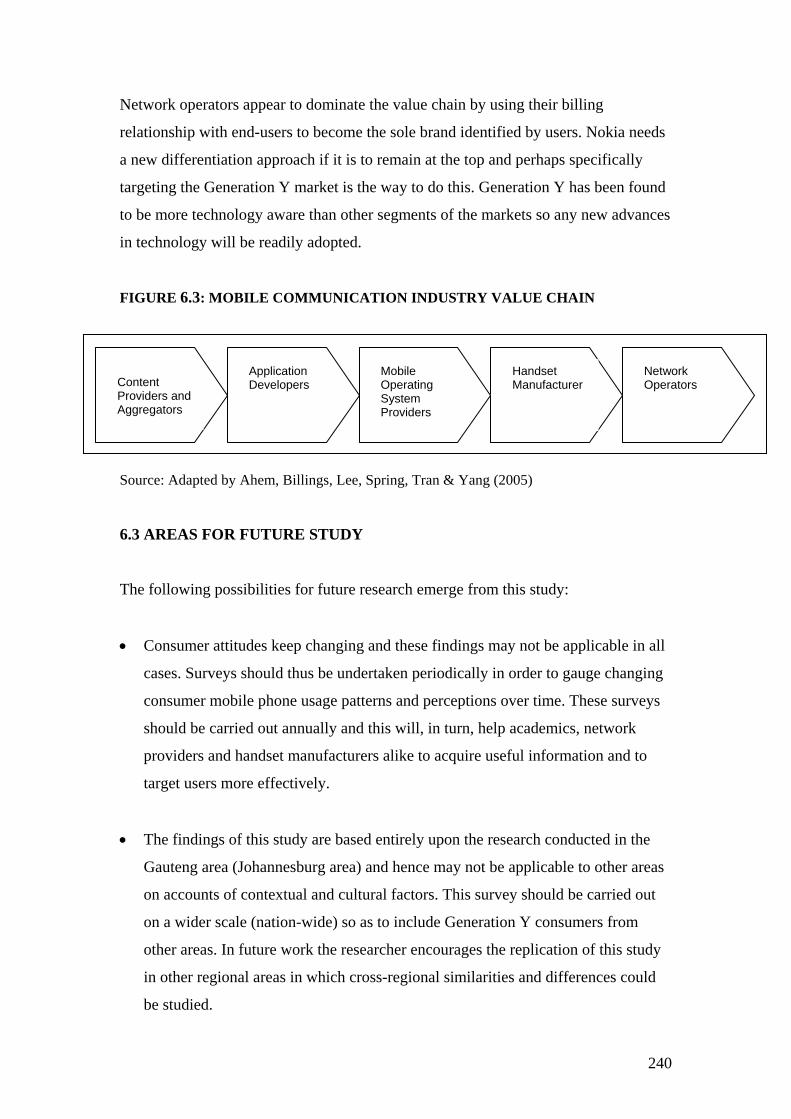
Network operators appear to dominate the value chain by using their billing
relationship with end-users to become the sole brand identified by users. Nokia needs
a new differentiation approach if it is to remain at the top and perhaps specifically
targeting the Generation Y market is the way to do this. Generation Y has been found
to be more technology aware than other segments of the markets so any new advances
in technology will be readily adopted.
FIGURE 6.3: MOBILE COMMUNICATION INDUSTRY VALUE CHAIN
Application Developers
Network Operators
Handset Manufacturer
Mobile Operating System Providers
Content Providers and Aggregators
Source: Adapted by Ahem, Billings, Lee, Spring, Tran & Yang (2005) 6.3 AREAS FOR FUTURE STUDY
The following possibilities for future research emerge from this study:
• Consumer attitudes keep changing and these findings may not be applicable in all
cases. Surveys should thus be undertaken periodically in order to gauge changing
consumer mobile phone usage patterns and perceptions over time. These surveys
should be carried out annually and this will, in turn, help academics, network
providers and handset manufacturers alike to acquire useful information and to
target users more effectively.
• The findings of this study are based entirely upon the research conducted in the
Gauteng area (Johannesburg area) and hence may not be applicable to other areas
on accounts of contextual and cultural factors. This survey should be carried out
on a wider scale (nation-wide) so as to include Generation Y consumers from
other areas. In future work the researcher encourages the replication of this study
in other regional areas in which cross-regional similarities and differences could
be studied.
240
Moreover, the population could also be extended to include tweens (7 to 12 year
olds) and teens (13 to 17 year olds), as the use of mobile phones by children has
increased significantly over the last years.
• The size of the sample in this study is relatively small. The results will thus vary
with those from a larger universe. A larger sample size would yield more accurate
results.
• More research is needed to analyse the differences between teenagers and young
adults, as well as to examine cross-gender differences. Differences between males
and females in this study are significant in certain cases but not always to the
extent one may have expected.
• Additional research exploring the way in which mobile phones influence the
communication patterns between young people and their parents, and amongst
themselves should be undertaken. The preservation of relationships as a result of
the mobile phone was a central theme and should be further explored.
• Each of the sub-topics covered in the literature review, for example, the
determinants influencing consumer behaviour (Chapter 3, Section 3.4), should be
analysed in greater depth.
Future research into the topics discussed above will not only contribute to the existing
literature on the mobile phone usage of Generation Y, but, more significantly, to an
improvement in our understanding of Generation Y’s future consumer behaviour.
A better understanding of this market will hopefully improve the marketing efforts of
mobile phone groups and result in better mobile products and services being delivered
to the market.
241
6.4 CONCLUSION
South Africa has a large youth population and ultimately their mobile phone usage
will account for growing revenue. This investigation of mobile phone usage among
Generation Y students in the city of Johannesburg provided several insights and clear
conclusions. Firstly, Generation Y is one of the most important demographics shaping
the landscape of consumer behaviour. This generation is fickle, lucrative, cost-
conscious and very brand aware. Secondly, usage patterns are likely to differ between
age groups and between genders.
There is no doubt that Generation Y will exhibit different attitudes and, behaviours
towards and acceptance of a wireless device such as a mobile phone as opposed to the
population at large, hence one tariff alone may not be sufficient to target this lucrative
market. A variety of bundled services offered by network providers could prove to be
a valuable method of retaining subscribers.
Signing up a greater number of Generation Y consumers will go beyond merely
increasing the number of subscribers as this target market is more likely to experiment
with new communications- they are the primary adopters of text-messaging
technologies including SMS and MMS. SMS has been found to be a more cost-
effective way to communicate with peers than voice calls. Furthermore, the
Generation Y respondents surveyed were brand loyal so branding and name
recognition are obviously in favour. Understanding the way in which Generation Y
consumers have incorporated the mobile phone into their everyday lives will be of
relevance for all future applications. Mobile network providers will ultimately
succeed if they custom design their products and services in order to serve this unique
segment of the market and if they tailor their companies around the Generation Y
consumer.
242

243
BIBLIOGRAPHY Aaker, D.A., Kumar, V. & Day, G.S. (1998) Marketing research. Sixth edition. New York: John Wiley& Sons. Absa (2004a) Quarterly economic indicators report, 2004 Absa (2004b) Key variables and projections. Available online:http://www.absa.co.za/ABSA/PDFFiles/EP_2004_Q1_English_projections_0.pdf Absa (2004c) Domestic economy. Available online:http://www.absa.co.za/ABSA/PDFFiles/EP_2004_Q1_English_Domestic_web_3.pdf Absa (2004d) The South African mobile macro environment. Available online:http://www.absa.co.za/ABSA/PDFFiles/PSE_2003_web_0.pdf Absa (2006) Economic perspective: first quarter 2006. Available online: http://www.absa.co.za/absacoza/generated/files/e873862ab8869010VgnVCM1000003511060aRCRD/1Q2006.pdf?F_C_ID=528747cd6f7a0010VgnVCM100000ce17040aRCRD Absa Group (2004a) International Economy. Available online:http://www.absa.co.za/ABSA/PDFFiles/EP_2004_Q1_English_International_web_4.pdf Absa Group (2004b) Economic perspective: first quarter 2004. African Cellular Statistics. Available online:http://www.cellular.co.za/stats/stats-africa.htm Ahem, S., Billings, A., Lee, A., Spring, M., Tran, T. & Yang, J. (2005) Nokia: How to break free from the carrier stranglehold. Available online:www.sims.berkeyley.edu/`tutran/files/Nokia.doc Alcatel (2005). Available online: http://www.alcatel.co.za Alexander, P.S. (2000) Teens and mobile phones growing up together: Understanding the reciprocal influences on the development of identity. Submission for the Wireless World Workshop, University of Surrey. Ali, F. (2003) New marketing opportunities for fixed-line telecommunication operators in South Africa: a strategic evaluation. Unpublished research report submitted in partial fulfilment of the requirements for the Doctor of Commerce degree, University of South Africa. AMPS (2005) Cellphone usage in South Africa. Eighty20 consumer information portal. Available online: http://www.eighty20.co.za/databases/fad/fad_archive.cgi?wk=2005-41
243
Andersson, P. & Heinonen, K. (2002) Acceptance of mobile services: insights from the Swedish market for mobile telephony. SSE/EFI Working Paper Series in Business Administration No 2002:16. Barnhoorn, C. (2005) Consumers rate Vodacom tops. Available online:http://www.proactive.co.za/images/Microsoft%20Word%20-%20Consumers%20Rate%20Vodacom%20Tops.pdf BER, (2005) Economic Outlook. Available online:http://www.capegateway.gov.za/Text/2005/3/pero_ch2.pdf Botha, R. (2005) Economic overview 2005: memorandum prepared for the 2005 CAASA AGM. Available online:http://www.caasa.co.za/new%20stuff%jan%2006/Economic%20report%202005.pdf Breitenbach, D. (2003) Boom times ahead for Africa. Available online:http://www.suntimes.co.za/2003/11/30/business/surveys/survey13.asp Business Day (2004) Cellphone- crazy kids a growing market. 23 April Business Day (2005a) Cheaper calls as monopoly ends. 4 February. Available online:http://www.businessday.co.za/Articles/TarkArticle.aspx?ID=1369435 Business Day (2005b) Telkom prepares to face competition. 4 February. Available online: http://www.businessday.co.za/Articles/TarkArticle.aspx?ID=1369366 Business Day (2005c) Lawyers try South Africa’s first BlackBerries. 10 March. Available online:http://www.businessday.co.za/Articles/TarkArticle.aspx?ID=1397079 Business Day (2005d) MTN tweaking tariffs, denies price war. 2 September. Available online: http://www.businessday.co.za/articles/topstories.aspx?ID=BD4A87532 Carroll, J., Howard, S., Vetere, F., Peck, J. & Murphy, J. (2002) Just what do the youth of today want? Technology appropriation by young people. Proceedings of the 35th Hawaii International Conference on System Sciences. Cant, M. & Machado, R. (2004) Marketing success stories. Fifth edition. Oxford University Press Cell C (2005) Available online: http://www.cellular.co.za/africa/south-africa/cell-c.htm Chakrapani, C. (2000) Marketing research: state-of-the art perspectives. Illinois: American Marketing Associations Cheskin (2001) The wireless future, a look at youth unplugged.
244
Chisenga, J. (2001) Facing the digital divide: ensuring access to digital information in sub-saharan Africa. Available online:http://home.imaginet.co.za/liasa/CHISENGA2001.doc Codrington, G. (1999) Profile of South African youth and families: a brief profile of South African teenagers at the end of the 20th century. Available online:http://www.upetd.up.ac.za/thesis/submitted/ etd-08022003-002315/unrestricted/09references.pdf Cronje, G.J., Du Toit, G.S, Marais, A. & Motlatla, M.D.C. (2004) Introduction to business management. Cape Town: Oxford University Press. Dicey, L. (2004) Vodacom: seizing the moment. Available online:Available online: http://www.adfocus.co.za/adfocus2004/zzwad.htm Dillon, W.R., Madden, T.J. & Firtle, N.H.(1994) Marketing research in a marketing environment. Third edition. Burr Ridge: Irwin. Du Plessis, P.J., Jooste, C.J. & Strydom, J.W. (2001) Applied strategic marketing. Heinemann. Du Toit, C.M.R. (1996) Hyper-competition in the cellular telephone industry. Unpublished research report submitted in partial fulfilment of the requirements for the MBA degree. Johannesburg, University of the Wiwatersrand Engel, J.F., Blackwell, R.D. & Miniard, P.W. (1994) Consumer behaviour. Eighth edition. New York: Dryden. Finnie, G., Lewis, C., Lonergan, D., Mendler, C. & Northfield, D. (2003) South African Communications, 2002-2008: market review and analysis. South African Communications Market Study prepared for the Department of Communications, South Africa, 11 December 2003. Available online:http://www.doc.gov.za/images/Yankee%20Group%20South%20Africa%20Market%20Review%20Final.pdf Floyd, N. (2005) Floyd’s perspectives. Available online:http://floydn.blogspot.com/2005_09_01_floydn_archive.html Galpin, J. (1998) Statistical research and design analysis. Unpublished course notes for Stats 511 Gilwald, A. & Esselaar, A. (2005) Chapter 2: a comparative analysis of ICT access and usage in 10 African countries. Available online:http://www.link.wits.ac.za/papers/e-index-comparative.pdf Golenjewsky, L. (2001) Understanding the telecommunications revolution. Available online: http://www.informit.com/articles/article.asp?p=24667
245
Government Information Services (GCIS) Communications, South African Year Book 2003/2004. Available online:http://www.gcis.gov.za/docs/publications/yearbook/6comm.pdf Hair, J.F., Anderson, R.E., Tatham, R.L. & Black, W.C. (1995) Multivariate data analysis with readings. Upper Saddle River, NJ: Prentice Hall. Hawkins, D.I., Best, R.J. & Coney, K.A. (2001) Consumer Behaviour. Eigth edition. New York: McGraw-Hill. Howkins, J. & Valantin, R. (1997) Development and the information age: four global scenarios for the future of information and communication technology. Available online: http://web.idrc.ca/en/ev-9368-201-1-DO_TOPIC.html Hulme, M. & Peters, S. (2001) Me, my phone and I: the role of the mobile phone. Available online:http://www.cs.colorado.edu/`palen/chi_workshop/papers/HulmePeters.pdf Indepen Diespeker Wharf (2005) Mobile in South Africa: contributing to improved economic and social outcomes- a report for Vodacom. London. Available online:http://www.indepen.co.uk/panda/docs/mobile-in-south-africa.pdf Intelecon Research and Consultancy Ltd. (2002) Rural ICT Market Opportunity Report, October. Available online:http://www.infodev.org/projects/telecommunications/351africa/SOUTH%20AFRICA%20Rural%20Market%20Assessment-%20FINAL.pdf International Telecommunications Union (2004) Available online:http://www.itu.int/ITU-D/ict/statistics/at_glance/Top2098.html Investec Group Economic Division (2006) The current state and future outlook of the domestic economic environment, first quarter 2006. South African Economic Research Prospect 2005-2010. Available online:http://www.investec.com/NR/rdonlyres/AE3D7A85-11A8-4COC-BED8-B2B2B08CD453/4834/ProspectsCovers_Q106.pdf Jain, S.C. (2000) Marketing planning and strategy. Sixth edition. South- Western College Publishing Jetham, Z.A. (1999) Determinants of service quality in the cellular provider industry. Unpublished research report submitted in partial fulfilment of the requirements for the MBA degree, University of the Witwatersrand. Jordan, Z.P. (1996) White Paper on Telecommunications Policy. The Ministry for Posts, Telecommunications and Broadcasting. Available online:http://www.polity.org.za/html/govdocs/white_papers/telewp.html?rebookmark=1 Kotler, P. (2000) Marketing management. Millenium edition, USA. Prentice-Hall. Kotler, P. (2003) Marketing management, analysis, planning, implementation and control. Upper Saddle River, NJ: Prentice Hall.
246
Krotz, J. (2004) Tough customers: how to reach Gen Y. Available online:http://www.microsoft.com/smallbusiness/issues/marketing/market_research/touch_customers Kuratko, D. F. & Hodgetts, R. M. (1998) Entrepreneurship: a contemporary approach. Fourth edition. Dryden. Laham, T. (2005) Cell C: Business Update. Available online:http://www.cellc.co.za/images/Media%20Briefings%20Aug%202005%20v94.pdf Leung, L. & Wei, R. (2000) More than just talk on the move: uses and gratifications of the cellular phone. J&MC Quarterly Vol.77: 308-320. Ligerakis, M. (2004) Move over Gen Y, here comes Generation W. Available online: http://www.bandt.com.au/news/fa/0c0180fa.asp Lin, C.A. (1996) Looking back: the contribution of Blumler and Katz’s uses of mass communication to communication research. Journal of Broadcasting and Electronic Media Vol. 40: 574-582. Ling, R. (2000) We will be reached: the use of mobile telephony among Norwegian youth. Information Technology and People 13(2): 102-120. Ling, R. (2001) The diffusion of mobile telephony among Norwegian teens: a report from the revolution. Presented at ICUST 2001 IN Paris, France. Ling, R. (2003) The impact of the mobile telephone on four established social institutions. Telenor R&D. Available online:http://www.telenor.no/fou/program/nomadiske/articles/03.pdf Liu, C.M. (2002) The effects of promotional activities on brand decision in the cellular telephone industry. Journal of Product and Brand Management 11(1): 42-51 Lowman, S. (2005) Youth spend $100bn on phones. Available online:http//www.itweb.co.za/sections/telecoms/2005/0504011200.asp?A=MAW&S=Mobile%20and%20Wireless%20Technology&O=FPT Macgregor, K. (2004) South Africa’s ‘Born Frees’ have grown up in a free and fair society that was previously heavily suppressed and divided by race. Available online: http://allafrica.com/stories/200412030183.html MacNeill, K. (1999) Mobile matters: young people and mobile phones. Andre Funston, Victoria University. Available online:http://www.ica.ogo.gov.au/paper99/funston.html Maier, M. (2003) Hooking up with Generation Y Boost and Virgin are showing major US Wireless Carriers how to tap one of the largest cellphone markets. Malhotra, N.K. (1996) Marketing research: an applied orientation. Second edition. Prentice-Hall.
247
Marine, Michehl, Nettesheim, Panahi and Sellers (2001) Wireless Telecommunications in South Africa. Marx, S., Van Rooyen, D.C., Bosch, J.K. &Reynders, H.J.J. (1998) Business management. Second edition. Pretoria: Van Schaik. Masango, G. (2005) Deregulation won't do much for residential consumers. Business Report 25 January. Available online: http://www.businessreport.co.za/index.php?fArticleId=2384427 Mattheus, D. (2004) South African youths’ love affair with cellphones. Available online:http://www.itweb.co.za/sections/techforum/2004/0404010733.asp?S=Cellular&A=CEL&O=FRGN Mattheus, D. (2004) Mobile youth trends burgeoning in South Africa. Available online: http://www.mobileyouth.org/news/mobileyouth1301.html McKay, G. (2005) Mobile commerce set to grow. Sunday Times, 21 April. Available online:http://www.suntimes.co.za/zones/sundaytimesNEW/basket10st/basket10st1114057386.aspx Mcleod, D. (2005) Leave us to get on with growth. Financial Mail 25 March. Milazi, A. (2004) Advertisers go ‘cradle-snatching’ for fresh market. Available online: http://www.adfocus.co.za/adfocus2004/zznad.htm Miller, P.A. (2003) How South Africa further education and training learners acquire, recall, process and present information in a digitally enabled environment. Chapter 2 Literature Review: Learners in a Digital Environment. Research Report submitted in partial fulfilment of the requirements for the degree Philosophiae Doctor, University of Pretoria. Available online:http://upetd.up.ac.za/thesis/submitted/etd-08022003-002315/unrestricted/02chapter2.pdf Mobile Phone Usage Situation (2002) Available online: http://www.videorco.jp/eng/report/life/mobile-evep2002.pdf Mobilethink (2001) Wireless teens: opportunities and trends. Available online: http://www.mobilethink.dk/downloads/WirelessTeens.pdf Mobility (2005) Impact of mobile wireless on South African consumers. Available online: http://www.theworx.biz/mobileose.htm MTN (2005) Available online: http://www.cellular.co.za/africa/south-africa/mtn.htm
248
Murray, J. & Chitamu, P.J. (2003) Fruition beyond 2.5G: mobilising South Africa’s wireless data transition. Johannesburg: Centre for Telecommunications Access and Services. School of Electrical Engineering, The University of the Witwatersrand. Naidoo, D. (2003) ITU/ESCAP/WTO Regional Seminar. Available online:http://www.unescap.org/tid/mtg/ituwtoesc_devan.pps Ngochi, Y. (2004) Teens hit by cellphone craze. Media & Marketing, The Star 1 May Oestmann, S. (2003) Mobile operators: their contribution to universal service and public access. Available online:http://rru.worldbank.org/documents/Mobile_operators.pdf Pakola, J., Pietila, M, Svento, R. & Karjaluoto, H. (2002) An investigation of consumer behaviour in mobile phone markets in Finland. Submission to 32nd EMAC conference, Track: New Technologies and E-Marketing. Faculty of Economics and Industrial Management, University of Oulu Porter, M. (1980) Competitive strategy. New York: Free Press. Porter, M. (1985) Competitive advantage. New York: Free Press. Porter, M. (2001) Strategy and the Internet. Harvard Business Review pp. 62-78. Porter, M. & Millar, V.E.(1985) How information gives you competitive advantage. Harvard Business Review, 63(4): 149-160. Reuters (2005) It takes creativity to reach Generation Y. Pretoria News July 14 Riquelme, H. (2001) Do consumers know what they want? Journal of Consumer Marketing 18 (5): 437-448 Robinson, K. & Codrington, G. (2002) Yesterday, today, tomorrow: a view on the generations in South Africa and their affinity with advertising. Available online:http://www.tomorrowtoday.biz/mindthegap/samra/yesterdaytodaytomorrow.doc Rogers, E. (1995) Diffusion of innovations. New York: Free Press. Ryu, A. (2004) Africa study: Africa is world’s fastest growing mobile phone market. Available online: http://quickstart.clari.net/voa/art/ha/B971818E-4C07-42AC-98CF4C25F70C24F3.html Sarin, A. (2005) Africa: the impact of mobile phones. Vodafone Policy Paper Series no2, March. Available online:http://www.sarpn.org.za/documents/d0001181/p1309_Vodafone_March2005.pdf Schiffman, L.G. & Kanuk, L.L. (1997) Consumer behaviour. Sixth edition. New Jersey: Prentice Hall.
249
Scott, N., Batchelor, S., Ridley, J. & Jorgensen, B. (2004) The impact of mobile phones in Africa. Available online:http://www.commissionforafrica.org/english/report/background/scott_et_al_background.pdfSewsunker, K. (2004) Cellphone market is still expanding. Media and Marketing April 17. Shin, N. (2001) Strategies for competitive advantage in electronic commerce. Available online: http://www.csulb.edu/web/journals/jecr/issues/20014/paper4.pdf Siemens (2005) Available online:http://www.siemens.co.za Siochrú, S.O. (1996) Telecommunications and universal service: international experience in the context of South African policy reform. Available online: http://web.idrc.ca/en/ev-9413-201-1-DO_TOPIC.html South Africa: Millenium development goals country report (2005). Available online:http://www.sarpn.org.za/documents/d0001538/RSA_MDG_report2005.pdf South Africa’s business presence occasional paper June 2004. Available online:http://www.safoundation.org.za/documents/SAinAfrica.pdf South African Cellular Statistics (2004) Available online: http://www.cellular.co.za/stats/statistics_south_africa.htm South Africa Good News (2005) Vodacom offers cheapest peak-time call tariffs in world. 29 August. Available online: http://www.sagoodnews.co.za/search/communication/477155.htm South Africa Year Book (2003/2004) Chapter 6: Communications. Available online: http://www.gcis.gov.za/docs/publications/yearbook/6comm.pdf Spero, I. & Stone, M. (2004) Agents of change: how young consumers are changing the world of marketing. Qualitative Market Research 7(2): 153-159. Statistics South Africa (2004) Mid-year population estimates, South Africa: key findings. Available online:http://www.statssa.gov.za/keyindicators/mye.asp Statistics South Africa (2004) Unemployment: labour force key findings. Available online: http://www.statssa.gov.za/keyindicators/lfs.asp Statistics SA General household survey July 2003. Available online:http://www.statssa.gov.za/Publications/P0318/P03182003.pdf Statistics SA (2005) Available online:http://www.statssa.gov.za/Publications/P0302/P03022005.pdf
250
Stones, L. (2005) Telkom sees future for fixed-line phones in African markets. Business Day 23 March. Strydom, J.W. (2004) The importance of subcultures: putting Generation Y into perspective. In Cant, M. and Machado, R. (2005) Marketing success stories. Fifth edition. Cape Town: Oxford University Press Strydom, J.W., Jooste, C.J. & Cant, M.C. (2000) Marketing management. Fourth Edition, Juta Study SA (2005) Lessons in diversity. Available online:http://www.studysa.co.za/index.php?option=com_content&task=view&id=38&Itemid=71 Sunday Times (1999) The sums of a network deal’s parts. Available online:http://www.suntimes.co.za/1999/06/06/news/news20.htm Taka, M. (2001) The internationalisation of the South African telecommunications sector 2001. Annual Forum at Misty Hills, Muldersdrift. Available online: http://www.tips.org.za/f2001/taka.pdf Taylor, A. (2004) Cell phone-crazy kids a growing market. Business Day April 23 Taylor, A.S. & Harper, R. (2001) The gift or the gab? : a design oriented sociology of young people’s use of ‘Mobilize!’ Digital World Research Centre Telkom Highlights (2005) Available online:http://telkom.quickreport.co.za/telkom_ar_2005/downloads/telkom_ar_2005_commentary.pdf Temporal, P. & Lee, K.C. (2001) Nokia: building a powerful technology brand In Hi-tech hi touch branding: creating brand power in the age of design technology. New York: John Wiley & Sons. http://www.brandingasia.com/cases/nokia.htm Theron, N. (2005) The macro-economic implications of micro-economic failures in telecommunications- the case of South Africa. Available online:http://www.essa.org.za/download/2005Conference/Theron.pdf Valor, J. & Sieber, S. (2003) Uses and attitudes of young people toward technology and mobile telephony. IESE Business School, Universidad de Navarra Van der Wal, R.W.E, Pampallis, A. & Bond, C. (2002) Service quality in a cellular telecommunications company: a South African experience. Managing service quality 12(5): 323-335. Van der Walt, A., Strydom, J.W., Marx, S. & Jooste, C.J. (1996) Marketing Management. Cape Town, Juta
251
Van Wyk, H. (2005) National personal income of South Africa by income group and population group. BMR, Research Report no 299. Available online:http://www.unisa.ac.za/Default.asp?Cmd=ViewContent&ContentID=2430 Vodacom: http://www.cellular.co.za/africa/south-africa/vodacom/vod-details.htm Vodacom Group Annual Results. Available online:http://www.vodacom.co.za/about/Vodacom%20Group%20Annual%20Results%2018%20June%202003.pdf Vodacom Group (Proprietary) Limited For the year ended 31 March 2005 June 6, 2005. Available online:http://www.vodacom.co.za/about/docs/Vodacom%20Annual%20Results%20presentation%202005.pdf Vodacom Group Annual Results (2005) Available online:http://www.vodacom.co.za/about/docs/Vodacom%20Group%20Annual%20Report%20Year%20End%202005.pdf Vodaworld (2003) Vodacom milestones: Going on 10 years. Worldwide Cellular Communications update Weilenmann, A. & Larsson, C. (2001) Local use and sharing of mobile phones. In B. Brown, N. Green & R. Harper (Eds) Wireless world: social and interactional aspects of mobile age (pp99-115). Godalming and Heidelburg: Springer Verlag Wikipedia, The Free Encyclopedia Available online:http://en.wikipedia.org/wiki/Vodacom Williams, D. (2003) You can CY students want to join the youngest network. Available online: http://free.financialmail.co.za/report/cellc03/bcellc.htm Yu, L. Louden,G. & Sacher, H. (2002) BuddySync: thinking beyond cell phones to create a third-generation wireless application for US teenagers. Revista de Estudios de Juventud, March Available online:http://www.pointforward.com/articles/news_item_buddy.html
252

253

APPENDIX A QUESTIONNAIRE
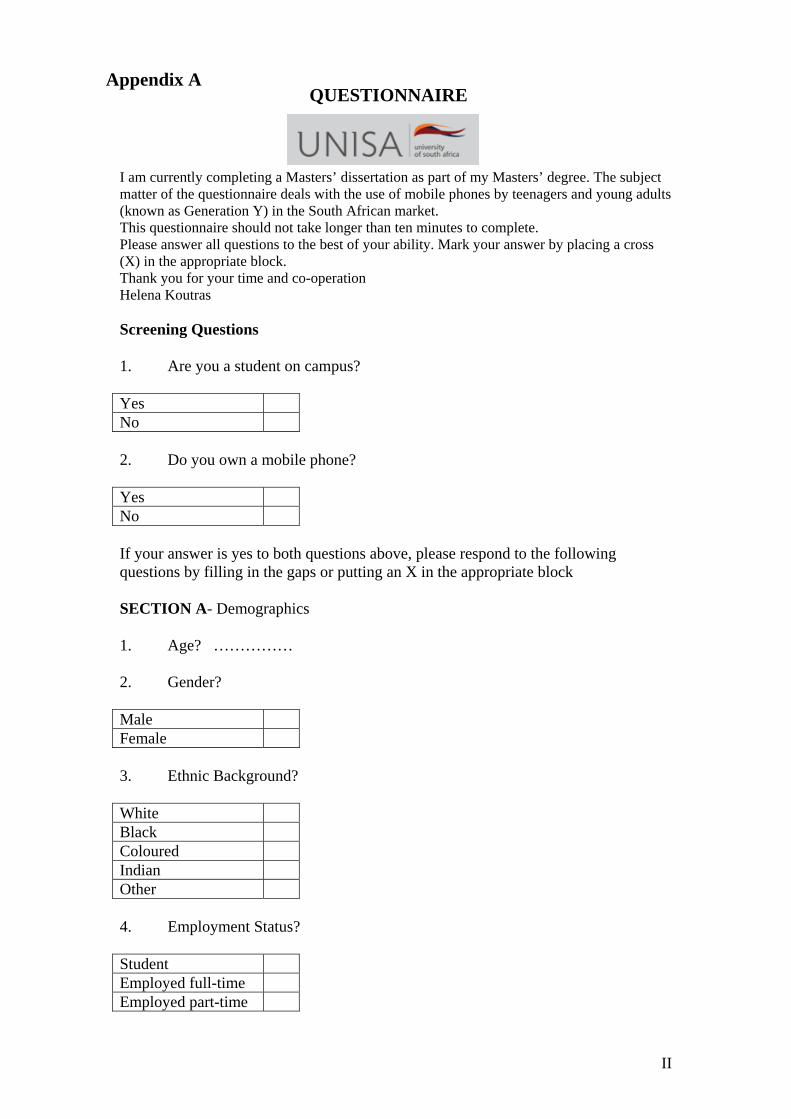
Appendix A
QUESTIONNAIRE
I am currently completing a Masters’ dissertation as part of my Masters’ degree. The subject matter of the questionnaire deals with the use of mobile phones by teenagers and young adults (known as Generation Y) in the South African market. This questionnaire should not take longer than ten minutes to complete. Please answer all questions to the best of your ability. Mark your answer by placing a cross (X) in the appropriate block. Thank you for your time and co-operation Helena Koutras Screening Questions 1. Are you a student on campus? Yes No 2. Do you own a mobile phone? Yes No If your answer is yes to both questions above, please respond to the following questions by filling in the gaps or putting an X in the appropriate block SECTION A- Demographics 1. Age? …………… 2. Gender? Male Female 3. Ethnic Background? White Black Coloured Indian Other 4. Employment Status? Student Employed full-time Employed part-time
II
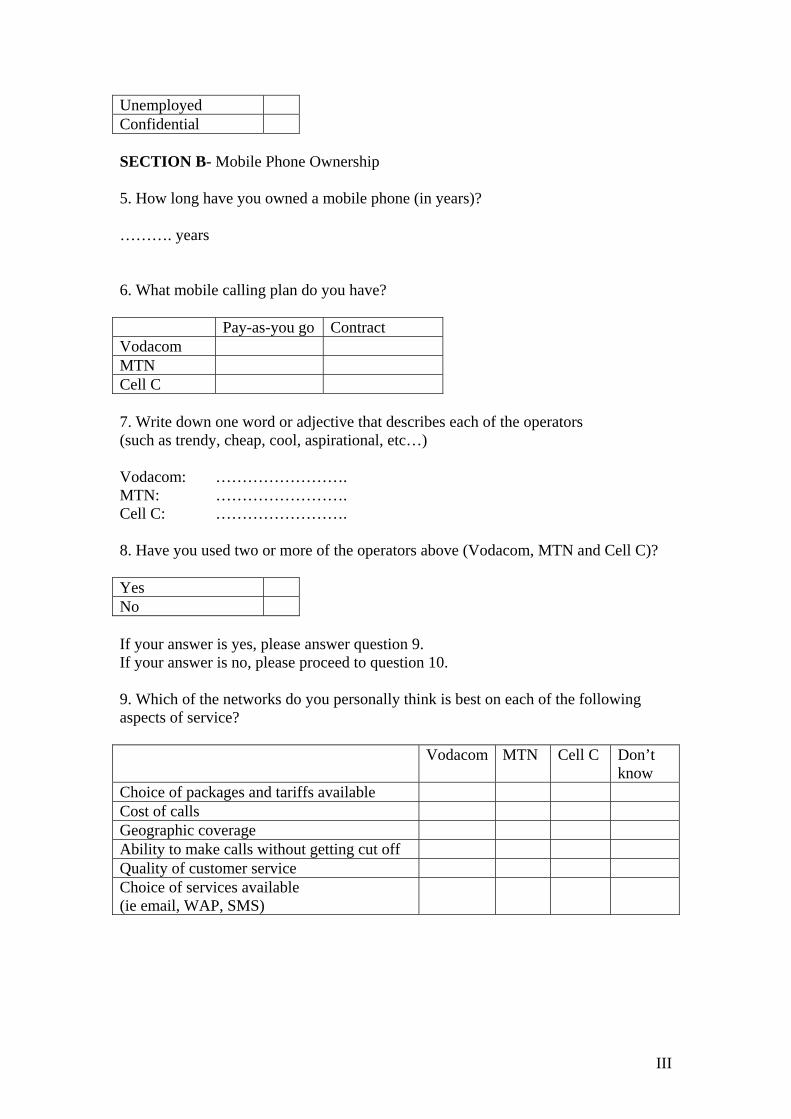
Unemployed Confidential SECTION B- Mobile Phone Ownership 5. How long have you owned a mobile phone (in years)? ………. years 6. What mobile calling plan do you have? Pay-as-you go Contract Vodacom MTN Cell C 7. Write down one word or adjective that describes each of the operators (such as trendy, cheap, cool, aspirational, etc…) Vodacom: ……………………. MTN: ……………………. Cell C: ……………………. 8. Have you used two or more of the operators above (Vodacom, MTN and Cell C)? Yes No If your answer is yes, please answer question 9. If your answer is no, please proceed to question 10. 9. Which of the networks do you personally think is best on each of the following aspects of service? Vodacom MTN Cell C Don’t
know Choice of packages and tariffs available Cost of calls Geographic coverage Ability to make calls without getting cut off Quality of customer service Choice of services available (ie email, WAP, SMS)
III
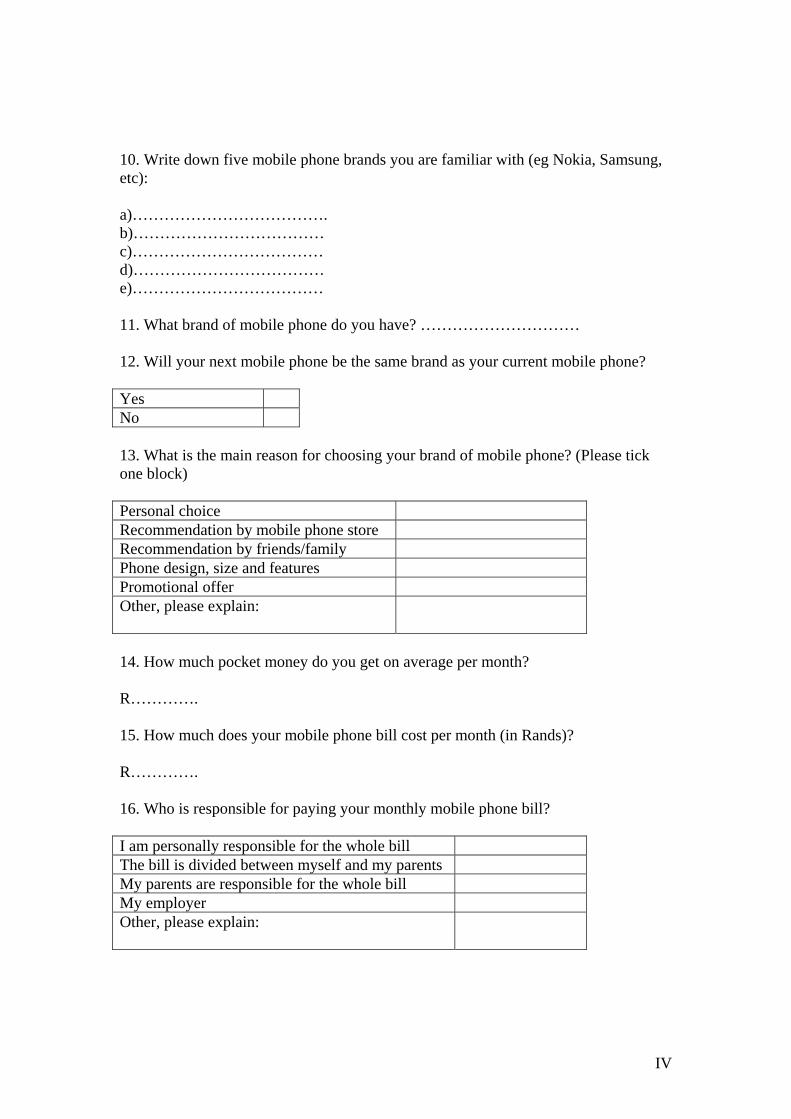
10. Write down five mobile phone brands you are familiar with (eg Nokia, Samsung, etc): a)………………………………. b)……………………………… c)……………………………… d)……………………………… e)……………………………… 11. What brand of mobile phone do you have? ………………………… 12. Will your next mobile phone be the same brand as your current mobile phone? Yes No 13. What is the main reason for choosing your brand of mobile phone? (Please tick one block) Personal choice Recommendation by mobile phone store Recommendation by friends/family Phone design, size and features Promotional offer Other, please explain:
14. How much pocket money do you get on average per month? R…………. 15. How much does your mobile phone bill cost per month (in Rands)? R…………. 16. Who is responsible for paying your monthly mobile phone bill? I am personally responsible for the whole bill The bill is divided between myself and my parents My parents are responsible for the whole bill My employer Other, please explain:
IV
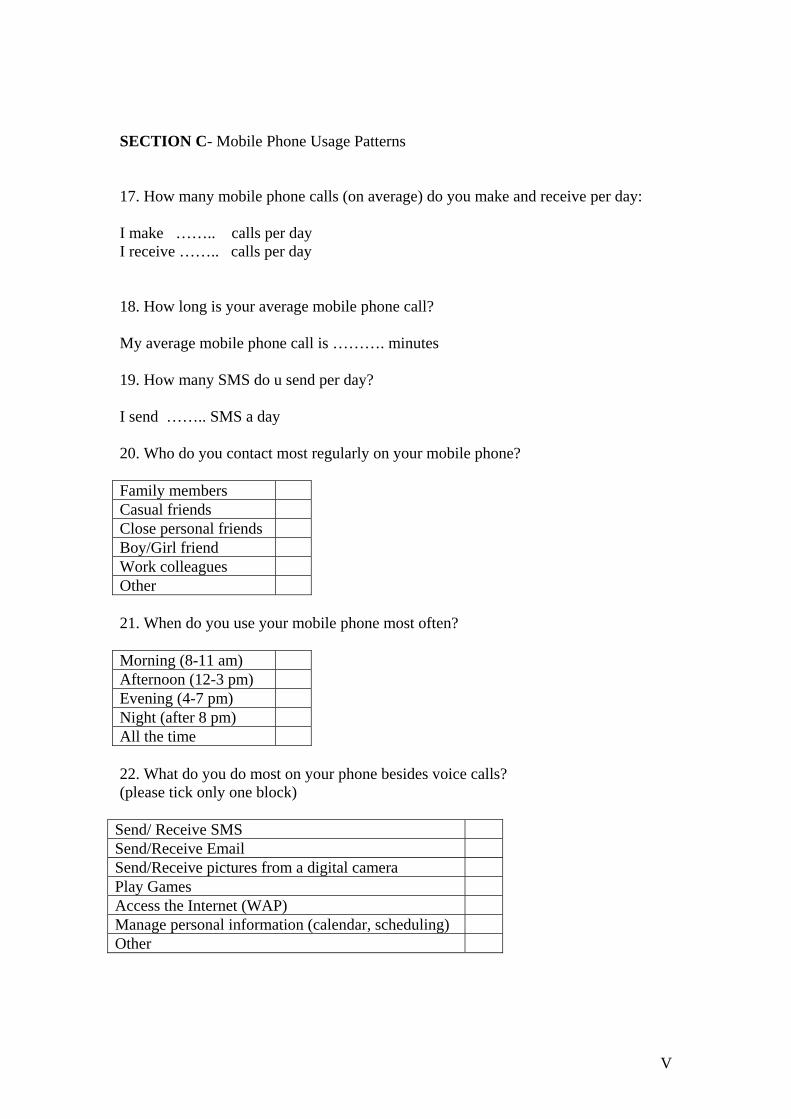
SECTION C- Mobile Phone Usage Patterns 17. How many mobile phone calls (on average) do you make and receive per day: I make …….. calls per day I receive …….. calls per day 18. How long is your average mobile phone call? My average mobile phone call is ………. minutes 19. How many SMS do u send per day? I send …….. SMS a day 20. Who do you contact most regularly on your mobile phone? Family members Casual friends Close personal friends Boy/Girl friend Work colleagues Other 21. When do you use your mobile phone most often? Morning (8-11 am) Afternoon (12-3 pm) Evening (4-7 pm) Night (after 8 pm) All the time 22. What do you do most on your phone besides voice calls? (please tick only one block)
Send/ Receive SMS Send/Receive Email Send/Receive pictures from a digital camera Play Games Access the Internet (WAP) Manage personal information (calendar, scheduling) Other
V
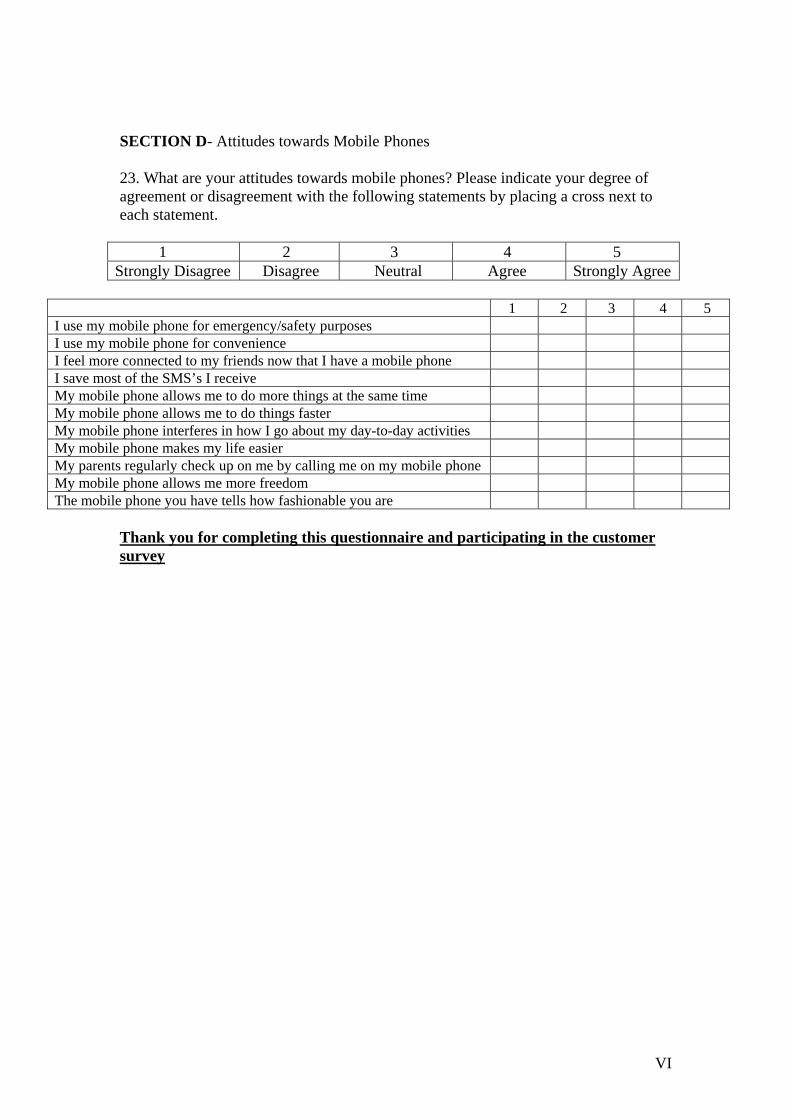
SECTION D- Attitudes towards Mobile Phones 23. What are your attitudes towards mobile phones? Please indicate your degree of agreement or disagreement with the following statements by placing a cross next to each statement.
1 2 3 4 5 Strongly Disagree Disagree Neutral Agree Strongly Agree
1 2 3 4 5 I use my mobile phone for emergency/safety purposes I use my mobile phone for convenience I feel more connected to my friends now that I have a mobile phone I save most of the SMS’s I receive My mobile phone allows me to do more things at the same time My mobile phone allows me to do things faster My mobile phone interferes in how I go about my day-to-day activities My mobile phone makes my life easier My parents regularly check up on me by calling me on my mobile phone My mobile phone allows me more freedom The mobile phone you have tells how fashionable you are
Thank you for completing this questionnaire and participating in the customer survey
VI

VII