no. 526 / september 2005 - ecb.europa.eu · ө 2000 8 ecb working paper series no. 526 september...
TRANSCRIPT

WORKING PAPER SER IESNO. 526 / SEPTEMBER 2005
ON SOME FISCAL EFFECTS ON MORTGAGEDEBT GROWTH IN THE EU
by Guido Wolswijk

In 2005 all ECB publications will feature
a motif taken from the
€50 banknote.
WORK ING PAPER S ER I E SNO. 526 / S EPTEMBER 2005
This paper can be downloaded without charge from http://www.ecb.int or from the Social Science Research Network
electronic library at http://ssrn.com/abstract_id=800505.
ON SOME FISCAL EFFECTS ON MORTGAGE
DEBT GROWTH IN THE EU 1
by Guido Wolswijk 2
1 ECB Fiscal Policies Division and ECB Monetary Policy Stance Division. I would like to thank ECB colleagues andan anonymous referee for comments on an earlier draft of the paper. The opinions expressed are those of the
author and do not necessarily reflect the views of the ECB.2 European Central Bank, Kaiserstrasse 29, 60311 Frankfurt am Main, Germany; e-mail: [email protected]

© European Central Bank, 2005
AddressKaiserstrasse 2960311 Frankfurt am Main, Germany
Postal addressPostfach 16 03 1960066 Frankfurt am Main, Germany
Telephone+49 69 1344 0
Internethttp://www.ecb.int
Fax+49 69 1344 6000
Telex411 144 ecb d
All rights reserved.
Any reproduction, publication andreprint in the form of a differentpublication, whether printed orproduced electronically, in whole or inpart, is permitted only with the explicitwritten authorisation of the ECB or theauthor(s).
The views expressed in this paper do notnecessarily reflect those of the EuropeanCentral Bank.
The statement of purpose for the ECBWorking Paper Series is available fromthe ECB website, http://www.ecb.int.
ISSN 1561-0810 (print)ISSN 1725-2806 (online)

3ECB
Working Paper Series No. 526September 2005
CONTENTS
Abstract 4
Non-technical summary 5
1 Introduction 7
2 Mortgage debt and fiscal policy 8
3 Some evidence on fiscal effects onmortgage debt 12
4markets 25
5 Conclusion 29
Annexes 30
References 34
European Central Bank working paper series 37
Fiscal instruments to influence housing
Abstract
This paper analyses some fiscal aspects of mortgage debt in the EU. It first describes the main
fiscal instruments that governments use to affect mortgage-financed home-ownership. In the
empirical part, real mortgage debt growth is analysed for 15 EU countries using pooled
regressions. Fiscal effects are included via after-tax interest rates. Other factors shown to be
relevant for mortgage debt growth are house prices, financial deregulation, and stock markets
fiscal measures in reducing housing market volatility is highlighted.
JEL classification: E51, E62, G21, H31, R21
Key words: mortgage credit, loans, tax policy, income tax, interest deductibility
4ECBWorking Paper Series No. 526September 2005
while the effects of household income and inflation are less evident. Finally, the role of structural
Non-technical summary
Mortgage debt in most EU countries has risen quickly in the last few years. In line with
its growing size, mortgage debt has taken up a prominent place in economic analysis and
macroeconomic policy-making. Changing property prices in combination with mortgage debt
changes may have macroeconomic consequences, e.g. via taking up mortgage debt for non-
housing consumption purposes (“mortgage equity withdrawal”). In addition, interest rate setting
on mortgage debt (fixed, variable) may have implications for monetary policy transmission.
Financial stability considerations may also rise in tandem with mortgage debt.
The aim of this paper is to analyse some effects of fiscal instruments on mortgage debt
growth in the EU. Empirical research on mortgage debt has largely ignored the role of fiscal
instruments affecting housing markets and mortgage credit. Nevertheless, it is obvious that
various government instruments affect mortgage-financing decisions. In particular, fiscal
measures may affect housing-related decisions via the taxation of imputed rent on own houses,
the deductibility of mortgage interest payments from income tax, and capital gains taxes on the
revenue of selling a house. Most EU governments subsidise owner-occupied housing, especially
when mortgage-financed, on account of foreseen social and macroeconomic benefits.
Simple analysis, based on a case-study (Sweden) and on a graphical comparison of
mortgage debt and the degree of fiscal subsidisation, already hints at potential effects of fiscal
instruments. The Swedish housing market crisis in the early 1990s reflected a substantial
reduction in fiscal subsidisation, as confirmed in a number of studies, although other factors also
were important. Comparing mortgage debt levels with the degree of fiscal subsidisation, it is
noteworthy that the Netherlands, the country with the highest mortgage debt-to-GDP level,
provides the highest degree of fiscal subsidisation, while Greece, a country with one of the lowest
debt ratios, on balance imposes a tax levy on mortgage-financed housing.
A more formalised approach to determinants of mortgage credit, and of the specific role
of fiscal factors in that, is undertaken by using pooled regressions for mortgage debt for 15 EU
countries, over the period 1982-2003. The estimates indicate that real mortgage lending growth is
positively affected by stock market growth, by house price increases and by financial
deregulation measures, while after-tax interest rates exerted a negative effect. The latter variable
includes housing subsidy elements via the deductibility of mortgage interest payments that is
allowed in most EU countries. Real growth of disposable income also positively affects mortgage
demand in some versions of the estimates but not in all. A negative effect of consumer price
inflation on mortgage growth was found in some estimates. These results are fairly robust: while
5ECB
Working Paper Series No. 526September 2005

changing the timeframe has some impact on the conclusions, the group of countries included in
the sample does not much affect results, nor does the estimation-technique employed.
Finally, the use of fiscal instruments in correcting housing market imbalances is briefly
discussed. In doing so, the need for an intervention is assumed, and policy options in other areas
such as supervision, are disregarded. Structural fiscal measures may contribute to reducing
volatility on housing and mortgage markets, for instance via increased reliance on automatic
stabilisation, or via reducing mortgage interest relief via tax deductibility. Supply-side measures
(e.g. a tenure-neutral fiscal system encouraging the development of a private rental sector as an
alternative to occupying a house) also may play a useful role in this respect. Caution is needed in
the active use of fine-tuning measures, such as changes to stamp duty rates, to correct housing
market imbalances, given doubts about possibilities for adequate timing and calibration of such
measures.
6ECBWorking Paper Series No. 526September 2005

1. Introduction
Mortgage debt in the EU has risen quickly in the last few years. As a consequence, its relevance
for economic policies has increased as well. In particular, there is increased attention for its
implications for macro-economic developments, money growth and financial stability. From a
macroeconomic point of view, mortgage lending may affect wealth and balance sheet effects of
asset prices, depending on opportunities for mortgage equity withdrawal: the use of mortgage
financing for non-housing purposes. From a monetary policy point of view, housing finance
aspects deserve close monitoring as bank loans to households for house purchase are a
counterpart to the monetary aggregate M3. Furthermore, mortgage markets may affect the
monetary transmission process, for instance via interest rate fixations (fixed or variable interest
rate mortgages). Financial stability considerations, finally, call for examination of the risk
implications of growing mortgage debt levels for both banks and consumers.
While a growing number of studies on mortgage debt and house prices emerge, the attention paid
to the role of fiscal factors usually is rather limited. The theoretical literature suggests that fiscal
instruments may have a potentially large role in affecting mortgage developments, but there is
only little empirical work in which such fiscal factors are included for European countries. This is
not very satisfactory, also taking into account that taxes and subsidies may be used as policy
instruments to steer housing and mortgage developments.
This paper considers the contribution of fiscal measures in the EU countries to trends in
household debt. In particular, we conduct an empirical analysis of the role of fiscal factors in
mortgage debt growth in the EU countries, and discuss the role of these fiscal instruments in
steering housing markets. While focussing on mortgage debt, inevitably we will also touch upon
housing market developments, as mortgage growth is much related to what happens in the
housing market. Taking a cross-country approach inevitably reduces country-specific elements
that can be included in the analysis. The availability and quality of relevant data differs
substantially across countries, while institutional characteristics specific to one country cannot be
taken into account. Thus, this study focuses on common elements in mortgage financing in the
EU.
7ECB
Working Paper Series No. 526September 2005

The outline of this paper is as follows. Section 2 describes recent mortgage developments and the
main fiscal instruments used by governments in the countries of the former EU-15 to steer
housing market developments. Section 3 then provides some evidence of the effects of fiscal
instruments on mortgage growth, using pooled regressions. The question whether fiscal
instruments could be used to address housing and mortgage market imbalances is taken up in
section 4. Section 5 contains the conclusions.
2. Mortgage debt and fiscal policy
Household indebtedness has grown quickly in the EU in the last decade. This mainly reflects a
sharp increase in mortgage debt, although there are remarkable differences between the EU
countries as regards level and growth rates (Table 1). In 2003, mortgage debt levels varied from
13% of GDP (Italy) to 100% of GDP (the Netherlands), resulting in the Dutch mortgage market
being more than double the size of Italian one. Real growth of mortgage debt varied from -1%
(Portugal) and +22% (Greece and Ireland) and - at first glance – do not appear to be closely
related to real house price increases.
Table 1. General EU mortgage and housing market characteristics, 2003.
Mortgage debt
(% of GDP)
Share in EU mortgage market
(%)
Real mortgage growth rate
(%)
Growth in real house prices
(%) Austria 26.4 1.4 9.0 -2.9§ Belgium 28.5 1.8 3.5 6.3 Denmark 87.5 3.9 4.8 -0.4 Finland 35.6 1.2 7.6 5.0 France 24.7 9.1 7.7 9.9 Germany 54.3 27.2 0.9 -2.4 Greece 17.4 0.6 21.6 2.3 Ireland 45.0 1.4 21.7 11.2 Italy 13.3 4.1 18.5 10.0 Luxembourg 33.4 0.2 15.6 5.1ө Netherlands 99.9 10.7 14.3 0.3 Portugal 50.6 1.6 -1.1 -1.6 Spain 42.1 7.4 16.4 14.5 Sweden 50.0 3.2 5.7 4.6 UK 70.4 26.4 3.4 18.1 Data sources: see annex 2. § 2002 ө 2000
8ECBWorking Paper Series No. 526September 2005
Differences in mortgage debt levels in Europe reflect a variety of factors, including social
preferences, the degree of financial deregulation, and governments’ past and current housing- and
mortgage-related policies. Governments affect mortgage debt growth and housing market
developments in numerous ways, ranging from restrictions on the use of land to mortgage interest
payment deductions from income tax, and from effects of government debt levels on (mortgage)
interest rates to subsidised housing loans from state banks.3 Below, we concentrate on three main
fiscal instruments:
• Tax on imputed rent
In a minority of the countries in the sample (Belgium, Italy, Luxembourg, the Netherlands),
owner-occupiers had to report imputed rent to their national tax offices in 2003. The background
to this tax is to put owning and occupying a house on an equal footing with other investments that
offer a financial return rather than services in kind. In countries were imputed rent is taxed, the
tax levy usually is relatively low reflecting the use of out-of-date market values as valuation base
Instead of taxing imputed rent, some governments have introduced a property tax, amongst others
on account of high enforcement costs of a tax on imputed rent (Freeman et al., 1996).
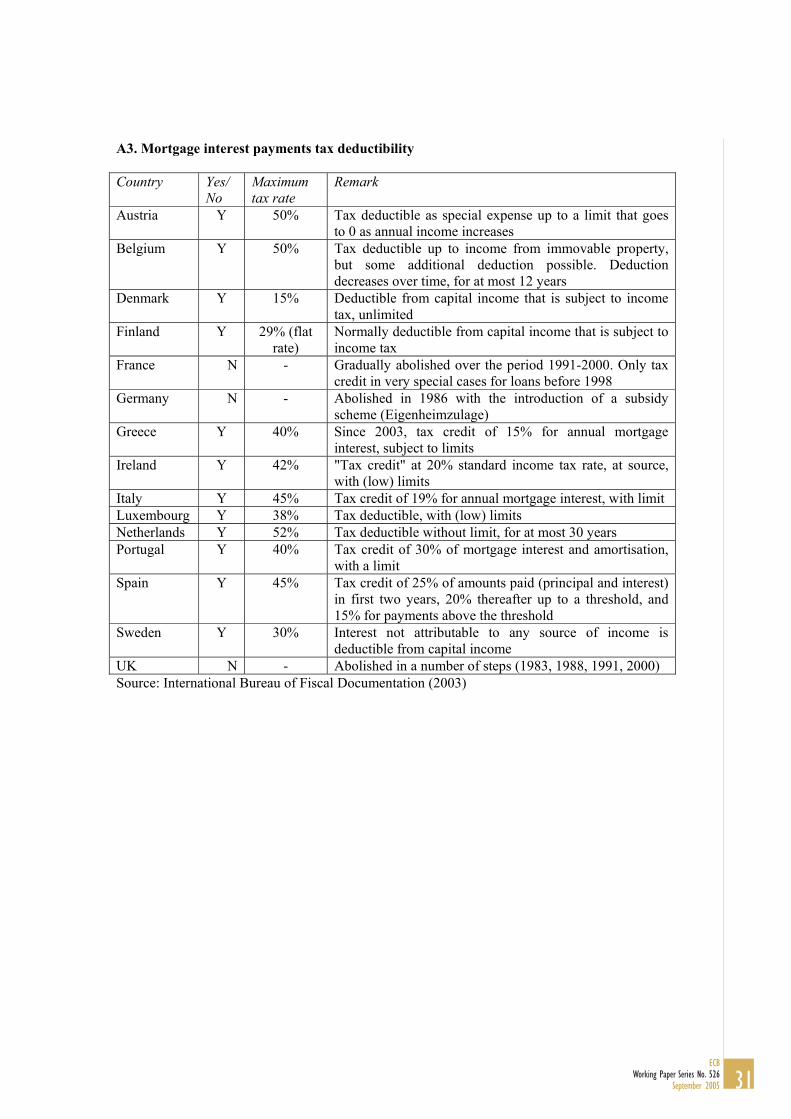
• Interest deductibility
Interest deductibility provides a fiscal advantage to house owners that finance their dwelling via a
mortgage rather than via own equity, thus increasing leverage. A large majority of EU countries
allows income tax deductibility of mortgage interest payments. Usually, the facility is open only
for owner-occupied dwelling, and there are limits to the amount deductible. While in some
countries it is eligible for all owner-occupiers (Spain, Italy, Denmark, Sweden, Finland, the
Netherlands), in others interest deductibility is targeted to specific households (Germany, France,
the United Kingdom). A few countries (Austria, Belgium) allow tax deductibility of part of the
reimbursement payments for a limited time period.
While this fiscal provision may increase the affordability of principal dwellings, and thus the
amount of mortgage debt taken up, it could also impact on the type of mortgage loan. In the
Netherlands, for instance, a mortgage loan coupled with a capital insurance used to be fiscally
favoured. Similarly, interest-only loans were introduced to take full advantage of the nearly
3 It should be recognised that, in their turn, housing market developments also have an effect on governments’ financial positions. Schuknecht and Eschenbach (2002) provide a detailed description of asset price effects on fiscal variables.
9ECB
Working Paper Series No. 526September 2005
unlimited deductibility of mortgage interest payments. In Germany, Bauspar loans were fiscally
favoured, limiting the development of other loan types (Mercer Oliver Wyman, 2003).
• Capital gains tax
In most countries the capital gain on the sale of principal owner-occupied dwellings is, in
principle, included in capital gains taxes. In practice, however, it is often exempted, particularly if
the owner has been occupying the dwelling for a number of years before selling it (“anti-
speculation clause”). Such exemptions usually do not apply to financial investments.
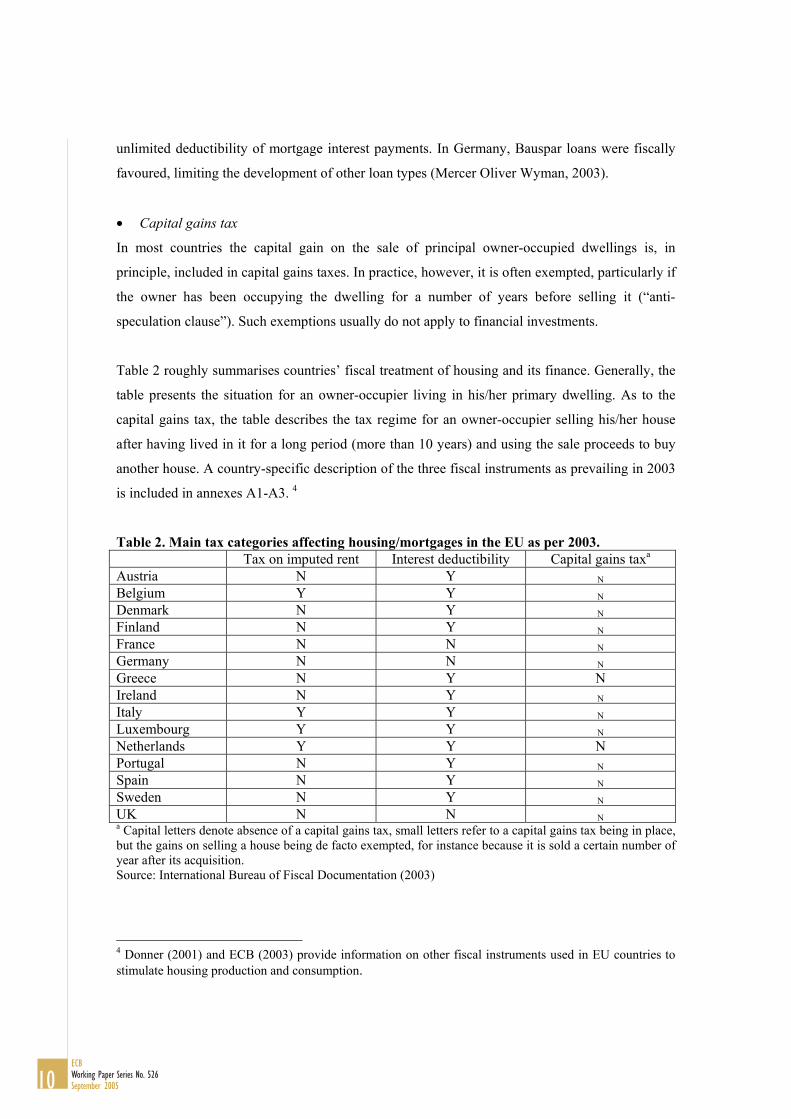
Table 2 roughly summarises countries’ fiscal treatment of housing and its finance. Generally, the
table presents the situation for an owner-occupier living in his/her primary dwelling. As to the
capital gains tax, the table describes the tax regime for an owner-occupier selling his/her house
after having lived in it for a long period (more than 10 years) and using the sale proceeds to buy
another house. A country-specific description of the three fiscal instruments as prevailing in 2003
is included in annexes A1-A3. 4
Table 2. Main tax categories affecting housing/mortgages in the EU as per 2003. Tax on imputed rent Interest deductibility Capital gains taxa Austria N Y N
Belgium Y Y N
Denmark N Y N
Finland N Y N
France N N N
Germany N N N
Greece N Y N Ireland N Y N
Italy Y Y N
Luxembourg Y Y N
Netherlands Y Y N Portugal N Y N
Spain N Y N
Sweden N Y N
UK N N N a Capital letters denote absence of a capital gains tax, small letters refer to a capital gains tax being in place, but the gains on selling a house being de facto exempted, for instance because it is sold a certain number of year after its acquisition. Source: International Bureau of Fiscal Documentation (2003)
4 Donner (2001) and ECB (2003) provide information on other fiscal instruments used in EU countries to stimulate housing production and consumption.
10ECBWorking Paper Series No. 526September 2005

Comparing the tax treatment of housing as described in the table with that of renting suggests that
government fiscal systems tend to favour ownership of dwellings over renting, and debt-financing
over other sources of financing. Thus, tax systems are not neutral, i.e. the decision for the owner
to occupy the residence himself or to rent it out is affected by tax considerations. In a neutral
system, imputed rent is taxed, mortgage interest payments are fully deductible, and capital gains
are subject to a capital gains tax, as these tax elements normally also applies to landlords.5
Governments seek to influence private agents' housing decisions as housing is considered a merit-
good with positive external effects, while income distribution arguments may also play a role.
However, the financial involvement in the housing market appears to be trending downward, with
a shift in emphasis from production to consumption subsidies, and an increased market
orientation (Ball and Grilli, 1997).
Van den Noord (2003) has quantified governments’ involvement in housing markets for the euro
area countries. He calculated the 1999 tax wedges and the resulting real cost of financing a house
(nominal interest rate plus tax wedge minus inflation), taking into account information on tax
interest deductibility, tax credits and imputed income from housing. His results, reproduced in
table 3, show that governments on balance subsidise housing, with few exceptions where it is
neutral (Belgium, France, Germany), and one in which, on balance, a tax is levied on mortgage-
financed housing (Greece). It should be noted, though, that explicit government subsidies have
not been included in the calculations. This would change the picture for instance for Germany
because of government expenditures for its Eigenheimzulage.
Table 3. Net housing subsidisation in the euro area, following Van den Noord (2003)
Real cost of financing
Tax wedgea Real cost of financing
Tax wedgea
Austria 3.6 -0.6 Ireland 1.4 -0.9 Belgium 3.6 0.0 Italy 2.6 -0.5 Finland 2.5 -0.9 Luxembourg 2.7 -1.0 France 4.1 0.0 Netherlands 0.6 -2.0 Germany 3.9 0.0 Portugal 2.4 -0.2 Greece 5.7 1.6 Spain 1.6 -0.9 a A minus-sign indicates net subsidisation of owner-occupied housing. Source: Van den Noord (2003)
5 Housing at the same time is also a consumption good. Tax neutrality in a broader sense thus would imply that houses also need to be taxed similar to durable consumption goods like cars.
11ECB
Working Paper Series No. 526September 2005
12ECBWorking Paper Series No. 526September 2005
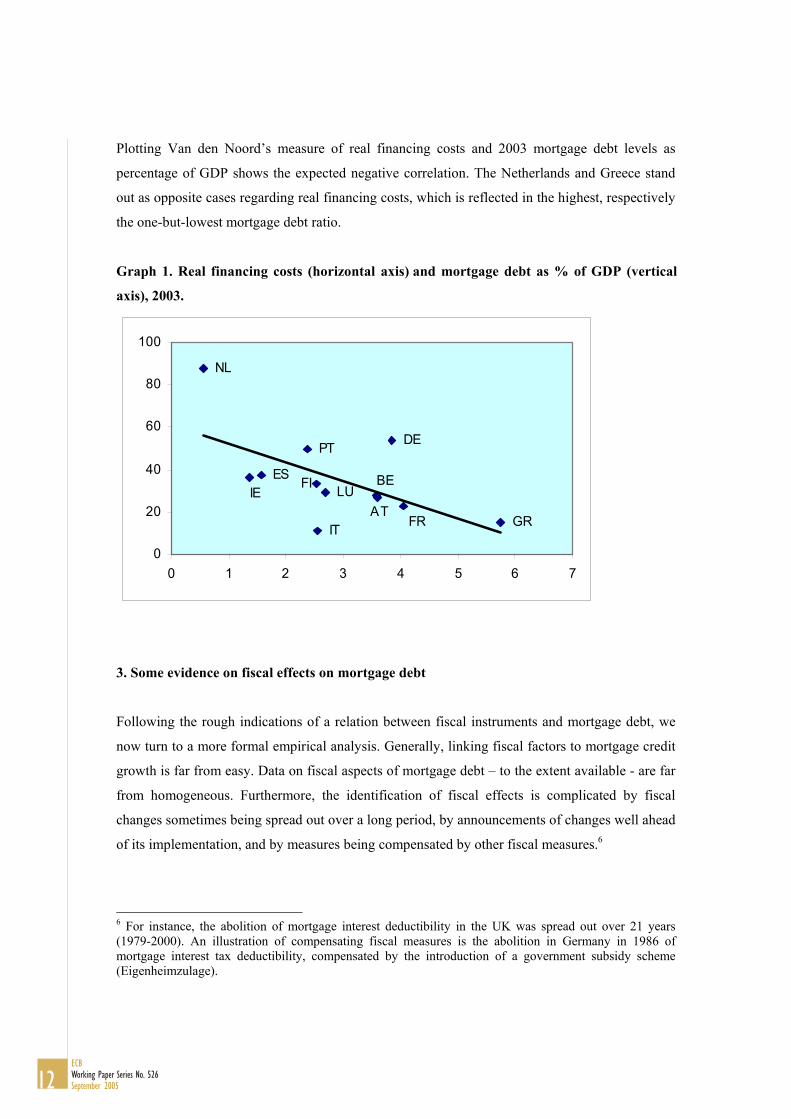
Plotting Van den Noord’s measure of real financing costs and 2003 mortgage debt levels as
percentage of GDP shows the expected negative correlation. The Netherlands and Greece stand
out as opposite cases regarding real financing costs, which is reflected in the highest, respectively
the one-but-lowest mortgage debt ratio.
Graph 1. Real financing costs (horizontal and mortgage debt as % of GDP (vertical
AT
BEFI LU
FR
IEES
IT
PT DE
GR
NL
0
20
40
60
80
100
0 1 2 3 4 5 6 7
Following the rough indications of a relation between fiscal instruments and mortgage debt, we
now turn to a more formal empirical analysis. Generally, linking fiscal factors to mortgage credit
growth is far from easy. Data on fiscal aspects of mortgage debt – to the extent available - are far
from homogeneous. Furthermore, the identification of fiscal effects is complicated by fiscal
changes sometimes being spread out over a long period, by announcements of changes well ahead
of its implementation, and by measures being compensated by other fiscal measures.6
6 For instance, the abolition of mortgage interest deductibility in the UK was spread out over 21 years
mortgage interest tax deductibility, compensated by the introduction of a government subsidy scheme (Eigenheimzulage).
axis), 2003.
3. Some evidence on fiscal effects on mortgage debt
(1979-2000). An illustration of compensating fiscal measures is the abolition in Germany in 1986 of
axis)

Studies on mortgage debt growth in Europe often focus on describing the effects of tax structures
in one or a few countries (e.g. Eschenbach and Schuknecht, 2002, and Debelle, 2004). Another
branch of the literature analyses cross-country differences in mortgage lending. Freeman et al.
(1996), analysing tax and subsidy systems in twelve OECD countries, conclude that tenure
patterns are associated with fiscal subsidies, but there are many more factors operating. Studies
that approach the subject from an empirical angle include Calza et al. (2001), studying total loan
growth (households and corporations) at the aggregate euro area level, using a VECM with GDP
growth and (before-tax) interest rates as explanatory factors. In addition, the determinants of bank
lending in single EU countries has been the subject of empirical research, as e.g. Fitzpatrick and
McQuinn (2004) for Ireland, De Greef and De Haas (2000) for the Netherlands, Fernandez-
Corugedo and Muellbauer (2003) for the UK, and Magri (2002) for Italy. Following the severe
housing crisis in Sweden in the early 1990s, a number of papers have assessed the causes of this
crisis, also paying attention to changes in fiscal conditions (Box 1).
Box 1. The housing market crisis in Sweden in the early 1990s The Swedish housing market crisis early 1990s was characterised by sharply falling mortgage credit and dwelling prices. This box recalls the main developments, focussing in particular on the role of changes in fiscal instruments. The Swedish housing market had experienced large increases in mortgage lending and rising prices at the end of the 1980s, following financial deregulation that started 1986, and foreign exchange markets deregulation. At the same time, the economy was growing fast, housing tax deductions were increased and interest subsidies were expanded, when real interest rates were already declining. This process reversed as of 1990, when an international recession hit the economy, interest rates rose, and banks started tightening mortgage lending standards, as reflected in higher loan-to-value ratios. House prices already were falling, when in 1991 a dual income tax system was introduced, with tenure neutrality as an objective. Mortgage interest payments could no longer be deducted at the marginal tax rate (up to 70%) but only at a standard capital income rate (30%). At the same time, the government abolished the tax on imputed rent, introduced a property tax, introduced VAT on new dwellings, and reduced subsidies to the construction sector. A number of empirical studies support the impression arising from this brief description that changes in fiscal parameters may have worked out pro-cyclical and contributed to the housing market crisis. In particular, Englund et al. (1995) estimate that the change in tax rates applying to deductible mortgage interest payments had a negative house price effect of 10-15% by 1993, on a total decline of 25%. In addition, the construction sector received a heavy blow. Housing completions in the 1990s where only around one-fourth of the levels seen in the build-up phase of the boom. Agell et al. (1995) also conclude that these tax rate changes had a strong negative impact on house prices (capitalisation effect), depressing private consumption. The much less favourable tax treatment of owner-occupied houses has been identified by Englund (1999) as one of the reasons for the breaking of the boom and the subsequent deep recession.
13ECB
Working Paper Series No. 526September 2005
This paper makes a first attempt to include relevant fiscal factors in empirical research on EU
mortgage credit growth. Specifically, we apply pooled regressions using an ad hoc specification.
Explanatory variables predominantly reflect demand factors, assuming mortgage supply to be
largely accommodating. While not ideal, we have chosen this approach in view of the data
limitations. For the same reason, this paper focuses on the 15 countries of the former EU only and
not on the current 25 EU members. Pooled regressions are used to generate sufficient
observations for tracking common determinants of real mortgage debt growth.
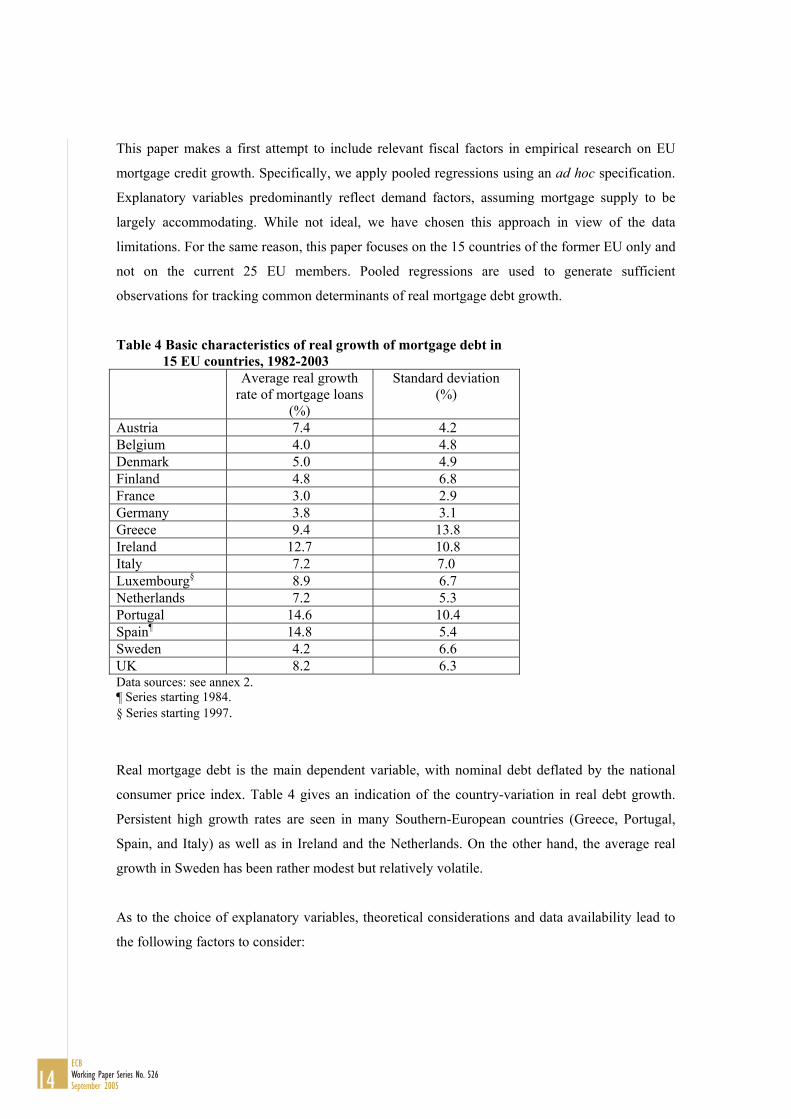
Table 4 Basic characteristics of real growth of mortgage debt in 15 EU countries, 1982-2003
Average real growth rate of mortgage loans
(%)
Standard deviation (%)
Austria 7.4 4.2 Belgium 4.0 4.8 Denmark 5.0 4.9 Finland 4.8 6.8 France 3.0 2.9 Germany 3.8 3.1 Greece 9.4 13.8 Ireland 12.7 10.8 Italy 7.2 7.0 Luxembourg§ 8.9 6.7 Netherlands 7.2 5.3 Portugal 14.6 10.4 Spain¶ 14.8 5.4 Sweden 4.2 6.6 UK 8.2 6.3 Data sources: see annex 2. ¶ Series starting 1984. § Series starting 1997.
Real mortgage debt is the main dependent variable, with nominal debt deflated by the national
consumer price index. Table 4 gives an indication of the country-variation in real debt growth.
Persistent high growth rates are seen in many Southern-European countries (Greece, Portugal,
Spain, and Italy) as well as in Ireland and the Netherlands. On the other hand, the average real
growth in Sweden has been rather modest but relatively volatile.
As to the choice of explanatory variables, theoretical considerations and data availability lead to
the following factors to consider:
14ECBWorking Paper Series No. 526September 2005

- Disposable income. Higher real disposable income per person increases the affordability of
houses, and thus would have a positive effect on mortgage-financing. Generally, owner-
occupation levels in Europe rise with income, with the exception of Greece.7 Higher income
may also increase economic confidence and job security, providing incentives to increase
debt for consumption-smoothing. A negative relation between income and mortgage debt
arises if households use higher income for debt repayment, for instance because debtless
ownership raises social status or facilitates early retirement. While positive effects dominate
in empirical studies in this area, exceptions have been reported for the US and Italy (Crook,
2003).
- After-tax interest rate/capital costs. Low mortgage interest rates increase households'
capacity to borrow while keeping the same debt servicing costs as per cent of income. Low
rates may also increase borrowing against real estate to finance consumption expenditures
(mortgage equity withdrawal). Whether a nominal or a real interest rate is more relevant is an
open issue; a real rate captures real financing costs, a nominal rate is more relevant for
assessing the maximum allowed mortgage, labelled the ‘tilt’ effect.8 Given tax deductibility
of mortgage interest payments in many countries, it is the after-tax interest rates that should
matter. Interest rates are an important element in the broader concept of capital costs of
housing, reflecting the costs of capital invested in housing.
In particular, we adopted the following measure:
CC = (1-t).r. M [1]
With CC = capital costs of mortgage-financed own housing t = relevant tax rate for mortgage interest deductibility r = nominal mortgage interests rate M = mortgage value
Dividing both sides by the house price then gives:
CC = (1-t).r. M [2] Vt Vt
With V = price of the house
7 Of the Greek households with less than 60% of the median income, 90% owns a home, compared to just over 80% of households with incomes of more than 140% of the median income. For the EU-15, the average numbers are 50% and 72% respectively (Eurostat, 2004). 8 Apart from demand effects, the interest rate effect may also capture decreased willingness of banks to extend credit in case of higher interest rates because of increased default risk (Hoffman, 2004).
15ECB
Working Paper Series No. 526September 2005

This reflects the nominal after-tax interest costs for the mortgage-financed part of the house
value, which is the variable used in the estimations below.
- Wealth. Higher wealth could lead households to invest more in houses, being part of the
investment portfolio. A positive effect may also arise from future home-owners building up
the required down-payment via financial investments. However, real estate can also be an
alternative to stock or bond market investment. Crook (2003) reports that for the US and Italy
positive relationships are the rule. We use national stock market indices as an indicator for
financial non-housing wealth.
- House prices. High house prices may choke off mortgage demand of starters on the housing
ladder, but may spur demand by current owners as it creates room for equity withdrawal
where allowed. In addition, higher house prices raise the amount of mortgage to be financed.
Furthermore, a positive coefficient could be expected on account of households’ speculative
behaviour. Using adaptive expectations formation, households may see current house price
increases as indicating an upward trend, creating incentives to buy and finance the dwelling
to profit from future capital gains.9 The comparability of house price data is rather low.
- Mortgage supply. Deregulation in the European financial markets has removed many
obstacles to a competitive supply of mortgages. Increased competition and decreasing
regulation have lowered the interest mark-up and caused a catch-up in mortgage lending. It
also paved the way to financial innovations, like interest-only loans, making mortgage
financing feasible for a larger part of the population. The timing and pace of liberalisation of
mortgage markets has varied substantially between countries (Girouard and Blöndal, 2001).
Financial deregulation is crudely approximated by dummies taking value 1 in years of major
reforms (see annex 3), lacking more elaborate banking competition measures on a euro area
wide basis.
9 For the US, evidence of adaptive expectations formation for house prices is reported by Case and Shiller (1988).
16ECBWorking Paper Series No. 526September 2005
- Consumer price inflation. Inflation operates through various ways on the demand for
mortgages. On the one hand, high inflation can be reflected in higher nominal interest rates,
lowering mortgage demand as the part of household income that has to be spent on housing
finance increases. In addition, high inflation shifts the burden of interest payments and
repayments to the initial phase of the loan, with negative effects on housing credit demand
(Nickell, 2002). High inflation variability, which usually increases with inflation, also may
exert a dampening effect on mortgage demand. On the other hand, to the extent that
households’ income increases in line with inflation, it may reduce the debt-to-income ratio
and thus create room for additional debt take-up. Furthermore, inflation may give rise to
additional housing demand from investors that regard real estate as a reasonably inflation-safe
hedge. Tsatsaronis & Zhu (2004) argue that this can be the case in particular if the prevailing
pension financing system is of a pay-as-you-go type, as this hinders the coming into being of
an equity investment culture. Finally, tax advantages of mortgage interest deductibility rise
with inflation as tax deductibility applies to nominal rather than real interest expenses.10
Outcomes
Information on the sources and the construction of the data to be used is included in Annex 2. The
logarithm of real mortgage debt is our main dependent variable, with nominal debt deflated by the
national consumer price index. The use of logs in this type of analysis is standard.11 Series have
been tested on unit roots (Annex 4). It appears that most variables are stationary when expressed
in changes in logarithms. While expressing the variables in log-levels in principle would be
preferable to detect longer-term relations, the stationarity tests indicate differences in the degree
of differencing needed to arrive at stationarity, thus not supporting estimations in levels.
Therefore, the change in the log of real mortgage debt is taken as the dependent variable, and
most independent variables are also expressed in change-in-log form.12
10 A numerical example may explain this. Assuming a 4% nominal interest rate, 2% inflation and a relevant tax rate of 50%, the after-tax real interest rate is (50%*4%)-2% = 0%. Assuming the inflation rate to increase by 2% to 4%, and be fully reflected in the nominal interest rate (6%) so that the real-interest rate is constant, the after-tax real interest rate decreases to -1%, i.e. (50%*6%)-4%. 11 Using logs takes into account that in countries with high debt levels the mortgage market may already be full-grown while high mortgage credit growth in other countries may reflect some catching-up from low initial levels. This choice is supported by a correlation coefficient of -0.62 between 1980 mortgage debt levels as % of GDP and average real mortgage growth rates over the 1981-2003 period. 12 A similar approach has been used by De Greef and De Haas (2000) studying real mortgage lending in the Netherlands.
17ECB
Working Paper Series No. 526September 2005

Table 5 contains the basic results for the estimations for the 15 EU countries. All estimates
include country-specific intercepts to capture mortgage-related factors peculiar to the country
concerned. This may, for instance, reflect differences in cultural values (e.g. the social status of
owning a debt-free house) and in legal efficiency (e.g. the time it takes for a bank to repossess a
house if the owner defaults). The second column shows results using pooled OLS over the entire
estimation period.
Table 5. Pooled estimates for real mortgage loans, 1982-2003 and sub-periods.
1982-2003 1982-1992 1993-2003
∆ LOG REAL LOANS (-1) 0.57 (12.8)**
0.38 (5.2)**
0.51 (7.4)**
∆ LOG REAL HOUSEHOLD INCOME PP 0.22 (2.5)**
0.20 (1.8)*
0.07 (0.3)
∆ CAPITAL COST -0.02 (-4.5)**
-0.02 (-3.1)**
-0.02 (-3.0)**
DEREGULATION DUMMY (-1) 0.05 (3.3)**
0.05 (3.0)**
0.01 (0.4)
∆ LOG REAL STOCK MARKET (-2) 0.03 (2.8)**
0.04 (2.7)**
0.03 (2.1)**
∆ LOG REAL HOUSE PRICE 0.14 (3.5)**
0.19 (3.5)**
0.19 (2.3)**
∆ LOG CONSUMER PRICE -0.36 (-3.4)**
-0.59 (-3.8)**
-0.80 (-2.6)**
Adjusted R-squared 0.71 0.75 0.74 S.E. of regression 0.0397 0.0364 0.0400 D-W 1.98 1.97 1.83 Nr of observations 275 124 151 Fixed country-effects are not shown. ** = significant at the 5% significance level, * = significant at the 10% significance level.
From this, we note the following results:
• Lagged changes in the log of real mortgage debt have a positive effect, which may reflect
adjustment time but could also indicate omitted variables. As noted before, the cross-country
nature of this study does not allow taking into account some factors that can be included in
single-country estimates.
• Higher real disposable income per person has a positive and significant effect on mortgage
demand, indicating that households take advantage of increased affordability to exert
additional mortgage demand.
18ECBWorking Paper Series No. 526September 2005

• Higher capital costs (the after-tax interest rate on the mortgage-financed part of the house
value) choke off demand for housing loans. Based on the empirical outcomes, changes in the
nominal rather than the real interest rates have been included.
• Major financial deregulation measures have had a positive effect on the demand for
mortgages.
• Booming stock markets add positively to the demand for mortgages, with a two year lag.
Most likely, this reflects a wealth effect. In addition, increased consumer confidence could be
a factor.
• Contemporaneous house price changes have a positive effect on mortgage loans granted.
• Inflation has a negative effect on real mortgage lending growth, possibly reflecting the
demand-reducing effect of higher initial debt burdens that results from inflation. The
coefficient value indicates that the negative impact is relatively strong.
The positive effect of house prices on mortgage lending could be related to house price increases
not being exogenous to mortgage credit. Higher house prices, for instance reflecting increasing
housing demand, are often accompanied by increased mortgage demand, also reflecting mortgage
equity withdrawal. At the same time, increasing mortgage supply for instance by looser bank
standards, may increase finance availability to larger parts of the population, thus putting upward
pressure on housing demand.
We formally tested for Granger-causality, and were not able to reject the hypothesis that
mortgage debt does not ‘cause’ house prices. Following the approach adopted by Follain and
Dunsky (1997), a (simple) equation for house price increases was run (table 6), and the estimated
values were included in the equation for real mortgage debt. This, however, did not affect the sign
of the coefficient, remaining positive and significant, providing indications that the above
equation-specification is not seriously biased. A significant effect of property prices on bank
lending is in line with Hoffman (2004), running a VECM model for 16 industrialised countries.
19ECB
Working Paper Series No. 526September 2005
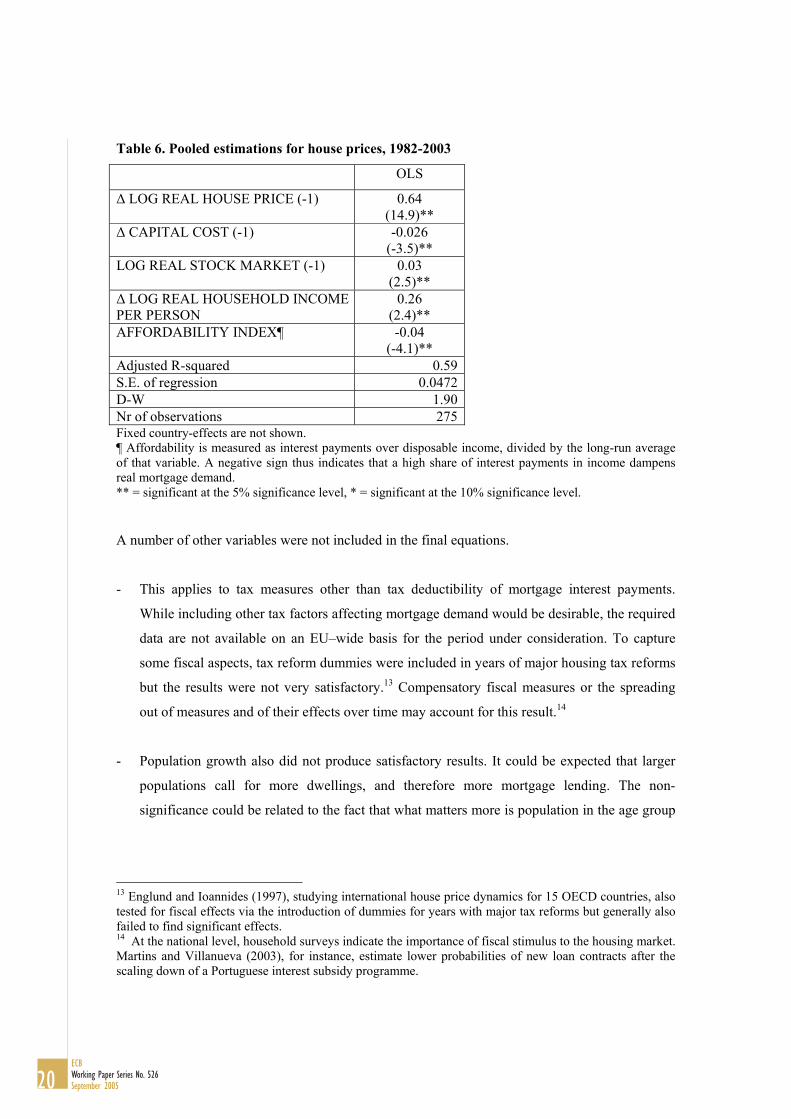
Table 6. Pooled estimations for house prices, 1982-2003
OLS
∆ LOG REAL HOUSE PRICE (-1) 0.64 (14.9)**
∆ CAPITAL COST (-1) -0.026 (-3.5)**
LOG REAL STOCK MARKET (-1) 0.03 (2.5)**
∆ LOG REAL HOUSEHOLD INCOMEPER PERSON
0.26 (2.4)**
AFFORDABILITY INDEX¶ -0.04 (-4.1)**
Adjusted R-squared 0.59S.E. of regression 0.0472D-W 1.90Nr of observations 275Fixed country-effects are not shown. ¶ Affordability is measured as interest payments over disposable income, divided by the long-run average of that variable. A negative sign thus indicates that a high share of interest payments in income dampens real mortgage demand. ** = significant at the 5% significance level, * = significant at the 10% significance level.
A number of other variables were not included in the final equations.
- This applies to tax measures other than tax deductibility of mortgage interest payments.
While including other tax factors affecting mortgage demand would be desirable, the required
data are not available on an EU–wide basis for the period under consideration. To capture
some fiscal aspects, tax reform dummies were included in years of major housing tax reforms
but the results were not very satisfactory.13 Compensatory fiscal measures or the spreading
out of measures and of their effects over time may account for this result.14
- Population growth also did not produce satisfactory results. It could be expected that larger
populations call for more dwellings, and therefore more mortgage lending. The non-
significance could be related to the fact that what matters more is population in the age group
13 Englund and Ioannides (1997), studying international house price dynamics for 15 OECD countries, also tested for fiscal effects via the introduction of dummies for years with major tax reforms but generally also failed to find significant effects. 14 At the national level, household surveys indicate the importance of fiscal stimulus to the housing market. Martins and Villanueva (2003), for instance, estimate lower probabilities of new loan contracts after the scaling down of a Portuguese interest subsidy programme.
20ECBWorking Paper Series No. 526September 2005
around 20-35. Furthermore, the number of households could be a more relevant factor than
the population size.15 Finally, demographic variables may matter only in the longer-term.
- Changes in the government pension expenditure ratios were also included, but without
success. Inclusion of this variable can be justified by arguing that high government spending
on old-age benefits reduces households’ incentives to invest in housing as a means of
securing income at retirement via absence of interest and principal payments. Doling and
Horsewood (2003) argue that outright house ownership enables the elderly to live rent-free,
and thus facilitates early retirement. However, no such effect was discernable in the data.
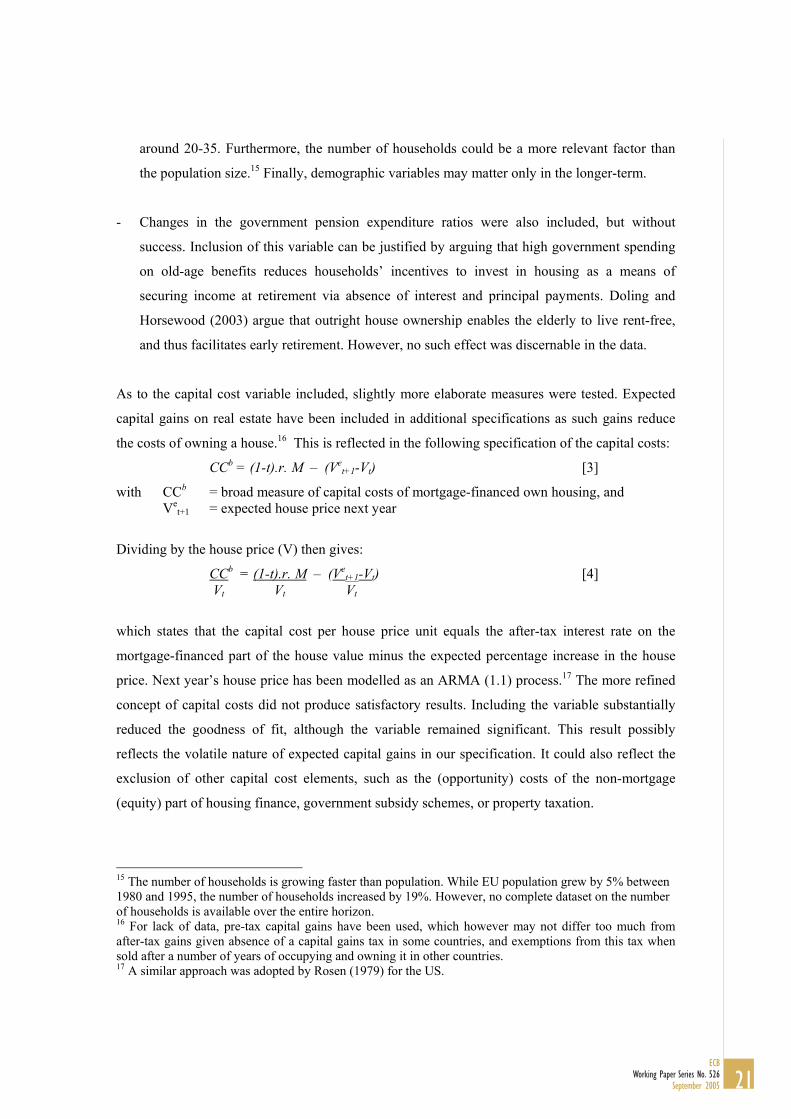
As to the capital cost variable included, slightly more elaborate measures were tested. Expected
capital gains on real estate have been included in additional specifications as such gains reduce
the costs of owning a house.16 This is reflected in the following specification of the capital costs:
CCb = (1-t).r. M – (Vet+1-Vt) [3]
with CCb = broad measure of capital costs of mortgage-financed own housing, and Ve
t+1 = expected house price next year
Dividing by the house price (V) then gives:
CCb = (1-t).r. M – (Vet+1-Vt) [4]
Vt Vt Vt
which states that the capital cost per house price unit equals the after-tax interest rate on the
mortgage-financed part of the house value minus the expected percentage increase in the house
price. Next year’s house price has been modelled as an ARMA (1.1) process.17 The more refined
concept of capital costs did not produce satisfactory results. Including the variable substantially
reduced the goodness of fit, although the variable remained significant. This result possibly
reflects the volatile nature of expected capital gains in our specification. It could also reflect the
exclusion of other capital cost elements, such as the (opportunity) costs of the non-mortgage
(equity) part of housing finance, government subsidy schemes, or property taxation.
15 The number of households is growing faster than population. While EU population grew by 5% between 1980 and 1995, the number of households increased by 19%. However, no complete dataset on the number of households is available over the entire horizon. 16 For lack of data, pre-tax capital gains have been used, which however may not differ too much from after-tax gains given absence of a capital gains tax in some countries, and exemptions from this tax when sold after a number of years of occupying and owning it in other countries. 17 A similar approach was adopted by Rosen (1979) for the US.
21ECB
Working Paper Series No. 526September 2005

Similarly, the empirical results did not improve when using the difference between housing
capital costs and renting costs. While this could be seen as a relevant cost measure for households
deciding between buying and renting a house, there was no empirical support for this hypothesis,
both when including and when excluding capital gains in the capital cost measure.
To test the robustness of the results, a number of alternative estimation procedures were followed.
This includes changes to the time period covered, to the estimation technique used, and to the
countries included.
As regards the time period, the sample was split in two, and separate equations were run for both
sub-periods (table 5, 3rd and 4th column). Statistical results for the deregulation dummy and for
real household income differ considerably between the sub-periods, with the coefficients loosing
statistical significance over time. Given the concentration of deregulation activities in the first
half of the sample, this is not very disturbing. As to real disposable income, decreased
significance possibly reflects increasing leanness of banks in offering mortgage credit, as is also
reflected in higher loan-to-value and loan-to-income standards over time. It might also indicate
that an increased share of the population is no longer liquidity-constrained, thus reducing the
relevance of current income and increasing the relevance of wealth. However, the latter
hypothesis is not fully consistent with our results, with stock market coefficients staying
marginally decreasing over time.
Next, the equations were re-estimated using White-consistent estimators and 2-Stage Least
Squares (2SLS), to test for sensitivity to the estimation techniques. The first estimator has been
applied to tackle possible heteroscedasticity, while 2SLS has been applied to take account of
possible effects of the dependent variable (mortgage loans) on independent variables, notably
house prices. Comparing results (table 7), household disposable income seizes to be significant
when applying 2SLS, as does consumer price inflation, while the stock market effect markedly
increases.
22ECBWorking Paper Series No. 526September 2005
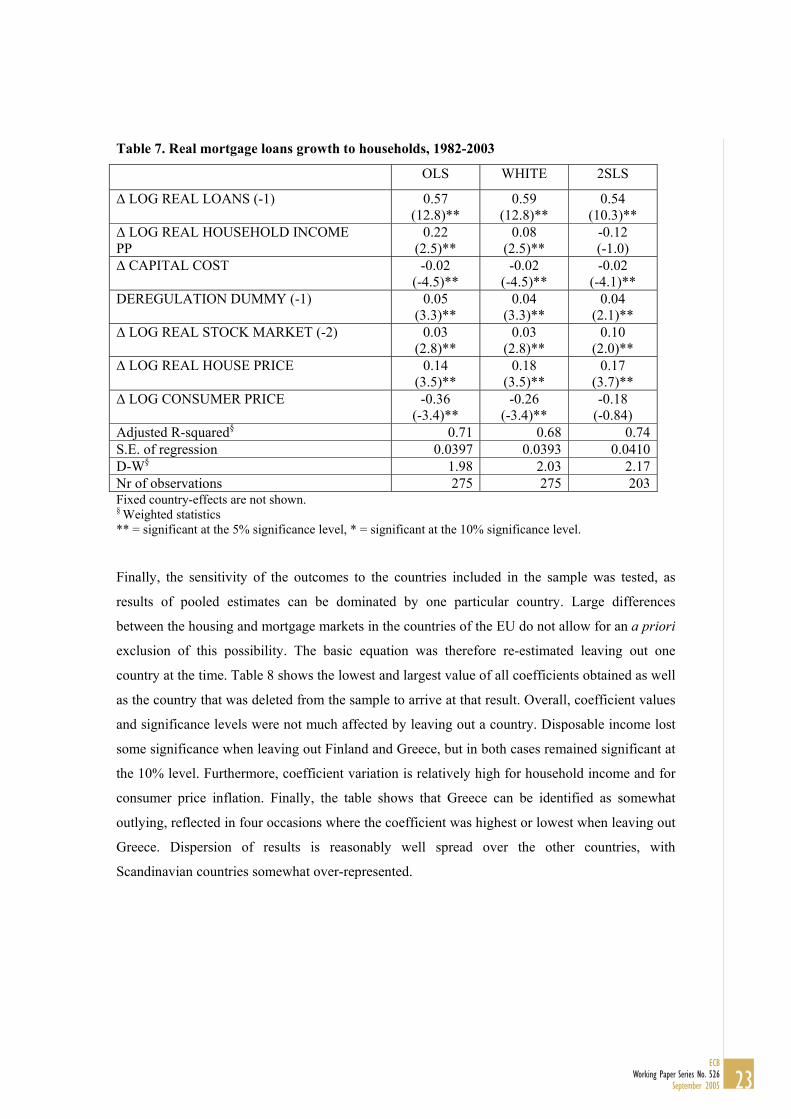
Table 7. Real mortgage loans growth to households, 1982-2003
OLS WHITE 2SLS
∆ LOG REAL LOANS (-1) 0.57 (12.8)**
0.59 (12.8)**
0.54 (10.3)**
∆ LOG REAL HOUSEHOLD INCOME PP
0.22 (2.5)**
0.08 (2.5)**
-0.12 (-1.0)
∆ CAPITAL COST -0.02 (-4.5)**
-0.02 (-4.5)**
-0.02 (-4.1)**
DEREGULATION DUMMY (-1) 0.05 (3.3)**
0.04 (3.3)**
0.04 (2.1)**
∆ LOG REAL STOCK MARKET (-2) 0.03 (2.8)**
0.03 (2.8)**
0.10 (2.0)**
∆ LOG REAL HOUSE PRICE 0.14 (3.5)**
0.18 (3.5)**
0.17 (3.7)**
∆ LOG CONSUMER PRICE -0.36 (-3.4)**
-0.26 (-3.4)**
-0.18 (-0.84)
Adjusted R-squared§ 0.71 0.68 0.74 S.E. of regression 0.0397 0.0393 0.0410 D-W§ 1.98 2.03 2.17 Nr of observations 275 275 203 Fixed country-effects are not shown. § Weighted statistics ** = significant at the 5% significance level, * = significant at the 10% significance level.
Finally, the sensitivity of the outcomes to the countries included in the sample was tested, as
results of pooled estimates can be dominated by one particular country. Large differences
between the housing and mortgage markets in the countries of the EU do not allow for an a priori
exclusion of this possibility. The basic equation was therefore re-estimated leaving out one
country at the time. Table 8 shows the lowest and largest value of all coefficients obtained as well
as the country that was deleted from the sample to arrive at that result. Overall, coefficient values
and significance levels were not much affected by leaving out a country. Disposable income lost
some significance when leaving out Finland and Greece, but in both cases remained significant at
the 10% level. Furthermore, coefficient variation is relatively high for household income and for
consumer price inflation. Finally, the table shows that Greece can be identified as somewhat
outlying, reflected in four occasions where the coefficient was highest or lowest when leaving out
Greece. Dispersion of results is reasonably well spread over the other countries, with
Scandinavian countries somewhat over-represented.
23ECB
Working Paper Series No. 526September 2005

Table 8. Coefficient characteristics§
OLS MIN MAX Coefficient dispersion*
∆ LOG LOANS (-1) 0.57
0.53 (Sweden)
0.59 (Italy)
10.6
∆ LOG REAL HOUSEHOLD INCOME PP
0.22
0. 16 (Greece)
0.30 (Denmark)
62.0
∆ CAPITAL COST -0.018
-0.020 (Luxembourg)
-0.015 (Greece)
26.2
DEREGULATION DUMMY (-1) 0.05
0.03 (Ireland)
0.05 (Italy)
45.6
∆ LOG REAL STOCK MARKET (-2)
0.028
0.024 (Greece)
0.034 (Finland)
32.7
∆ LOG REAL HOUSE PRICE 0.14
0.12 (Finland)
0.17 (Spain)
33.4
∆ LOG CONSUMER PRICE -0.36
-0.48 (Sweden)
-0.24 (Greece)
67.1
§ Name of country excluded in the estimation-equation in brackets. * The coefficient dispersion measures the difference between the maximum and the minimum coefficient value, divided by the full-sample OLS coefficient value.
Sub-grouping for countries was also applied to analyse whether countries can be grouped on the
basis of mortgage finance systems. Country sub-divisions according to Kasparova and White
(2001) and Tsatsaranis and Zhu (2004) did not produce results that deviate markedly from the
results for the EU total as shown in the tables above.18 We also considered the twelve euro area
countries as a specific sub-group. Compared to the larger sample of 15 EU countries, this subset
is more-monetary policy relevant, but on the other hand it results in the loss of a number of
observations. Again, results for the coefficient values and the significance levels did not depart
markedly from those reported above for the EU 15-sample of countries.
Overall, therefore, our results indicate that real mortgage debt in the EU is affected negatively by
after-tax interest rates, and positively by stock market growth, house price increases and financial
deregulation, while the impact of disposable income and inflation is less evident.
18 Based on mortgage finance systems, Tsatsaranis & Zhu (2004) distinguish three groups: Belgium, Germany, Spain, France, Italy, next Denmark, Finland, the Netherlands, and finally the United Kingdom, Ireland, and Sweden. Kasparova and White (2001) group the countries as follows: Austria, Belgium, Germany, France, Luxembourg and the Netherlands, then Spain, Italy, Greece, and Portugal, and finally Denmark, the United Kingdom, and Sweden.
24ECBWorking Paper Series No. 526September 2005
As mentioned in the introduction, one reason for focussing on fiscal aspects of mortgage debt is
that fiscal factors represent a policy instrument. While the previous sections only focused on a
very limited set of fiscal instruments, and fiscal aspects are underrepresented in economic
housing research, it is relevant to briefly discuss the use of fiscal instruments in avoiding or
correcting housing market imbalances. This issue is increasingly relevant as euro area countries
no longer have national monetary policies to their disposal, and the macroeconomic importance
of mortgage debt is growing with its size. Unlike in equity markets, national instruments affecting
housing and mortgage markets do not seem to have lost effectiveness due to increasing
internationalisation of markets. As mortgage developments are linked to underlying housing
market developments, this section also includes measures that impact on the demand and supply
of owner-occupied dwellings.
We first discuss government policies to reduce housing market volatility in general and next some
specific fine-tuning measures.19 In doing so, we will only hint at some main strengths and
weaknesses of the instruments, as its concrete use must depend heavily on country- and situation-
specific features. The effectiveness of certain instruments may be specific to certain conditions.
As an illustration, housing supply may be very inelastic in the short and medium-term because of
restrictive land policies. In such a case, increasing demand for houses on account of more
generous fiscal subsidies is likely to be reflected to a large extent in higher house prices. Such
subsidy capitalisation benefits current home-owners, turning the tax subsidy in an instrument of
redistribution rather than of allocation.20
Reducing housing market volatility
A number of structural fiscal measures can be considered that counterbalance sharp changes in
mortgage debt or house prices.
• High stamp duties can be used to stabilise housing markets. Stamp duties is a transaction tax
that is payable when buying a house, and it is one element in transaction costs, which for
instance also include property registration fees. Stamp duty rates in Europe vary from 0% (in
19 Alternative policy options, including prudential supervisory policy, regional policy, and improved information disclosure, fall outside the scope of this paper. 20 Berger et al. (2000) even conclude that government subsidies on interest rates in Sweden have been fully capitalised, although this is not undisputed.
25ECB
Working Paper Series No. 526September 2005
4. Fiscal instruments to influence housing markets

some cases in Finland and Ireland) up to 13% in Greece. Increasing stamp duties raises the
costs of moving, thus reducing housing speculation by reducing liquidity. However, it may
distort the choice of (potential) house owners and negatively impact on labour mobility.21
• Increasing the role of automatic stabilisers can also be considered, for example via a regular
updating of market values of dwellings as the tax base for real estate tax, property tax, wealth
tax and/or tax on imputed rent. Regular updating implies that taxes are levied on recent
market-based values. As a result, house price booms would automatically raise the tax
amount, thus raising the costs of housing and dampening demand. Not updating housing
values, on the other hand, usually results in regressive taxation as the tax burden as
percentage of the house price falls in case of rising house prices. Related to this, Muellbauer
(2003) advocates introducing property taxes with up-to-date market values as valuation basis,
attributing a major part of the stable housing development in Denmark to this type of tax.
• The capital gains tax could also include anti-cyclical (or anti-speculation) elements. Making
exemptions from capital gains taxes for primary houses depending on the number of years it
has been owner-occupied before it is sold provides fiscal incentives to keep dwellings longer.
However, increasing the cost of moving negatively affects labour mobility rates.
• Structural reductions in mortgage interest tax relief, lowering demand at given interest rates,
could also have a beneficial effect on housing market volatility. Indeed, Van den Noord
(2003) reports that house price variability is highest in countries with the largest tax wedges.
At the same time, reducing mortgage interest deductibility will increase the interest-
sensitivity of mortgage demand and - to the extent that this subsidy is capitalised - will cause
capital losses for current owners. Suggestions to restrict this type of subsidy can be found in
the Contact Group on Asset Prices (2002).
• A high elasticity of housing supply can reduce the likelihood of excessive housing market
developments. A case in point is Germany where low price volatility, amongst others, reflects
municipalities’ policies of releasing more land and building permits in housing market
upswings (Kasparova and While, 2001). In other countries, less strict regulations on land use
21 Van Ommeren and Van Leuvensteijn (2003) estimate for the Netherlands that a 1%-point increase in transaction costs (which apart from stamp duties also includes capital gains taxes and brokerage fees) relative to the house price decreases home-owners’ mobility by 8%.
26ECBWorking Paper Series No. 526September 2005

may be required to achieve this. However, annual new housing supply on average is only a
fraction of existing housing stock (around 1%), not sufficient to offset large price pressures,
while production time lags also need to be taken into account.
• A large private rental sector may act as a shock absorber, helping to contain housing market
shocks. Assuming private rents not to react instantaneously to house price changes, the rental
sector offers an alternative for those preferring to wait for a housing boom or bust to pass
over. By taking away fraction of the demand for own houses, price pressures may be limited
while at the same time labour mobility may be fostered as moving does not automatically
imply buying another house.22 In addition, owners of private rental houses may seek to sell
these houses during house price booms, thus increasing owner-occupied housing supply.
Changes in the degree of tenants’ protection, in rent regulation and in the often unfavourable
tax positions of landlords may be needed to increase rental supply.
Fine-tuning housing markets
While the above measures can be considered for reducing housing market volatility in general, in
specific circumstances these may not be sufficient as regards size or timing. Fine-tuning measures
then may need to be considered. We discuss VAT rates, stamp duties, property taxes, and
subsidies.
• In five EU countries, building and repairing houses is subject to the normal VAT rate, while
in the other ten, a reduced rate applies or it is even fully exempted. Varying rates according to
the cyclical state of the housing market could be considered but legal constraints from the EU
level need to be taken into account, and the supply response may take some time to realize.
• Raising stamp duties in a housing boom may cool off the market. In the UK, stamp tax
'holidays’ have been implemented in 1992, during which period the threshold for stamp
duties was raised. This lowers transaction costs of moving, and therefore should have a
positive effect on housing market activity. However, if anticipated, changes in these tax rates
could become a source of volatility rather than limiting it. Furthermore, its effectiveness may
be limited, given that costs can be spread out over the duration of mortgage contracts, there
22 For the UK, persons in private rented houses have highest mobility rates, according to Cameron and Muellbauer (1998).
27ECB
Working Paper Series No. 526September 2005
are numerous other costs involved in changing residence, and some countries allow such
costs to be included in the mortgage amount.
• Changes in property tax rates can be used to fine-tune housing market developments.
Maclennan et al. (1999) propose using the property tax to reduce house price volatility in the
UK, making the Bank of England responsible for setting the property tax rate.
• Subsidies may be temporarily raised or lowered with a view to stabilising housing markets.
This, for instance, has been applied in Portugal in 1999 when the government tightened
eligibility requirements for mortgage subsidies directed towards low-income families, with a
view to avoid overheating the housing market. Measures can equally be taken on the supply
side, extending or reducing temporary investment incentives.
The possibilities and effectiveness of fiscal fine-tuning of housing markets can be questioned (see
also Contact Group on Asset Prices, 2002). First, it needs to be established that there is
disequilibrium, and that serious repercussions from not stopping it could arise (Nickell, 2002).
Second, the timing and calibration of discretionary policies need to be appropriate. In this respect,
Stephens (1996), surveying the UK government responses during the housing market recession in
the early 1990s, found three out of the eight government measures to be anti-cyclical (for instance
the increase in the stamp duty threshold), two neutral, and two pro-cyclical.23 Finally, another
drawback of using fine-tuning measures could be that it creates uncertainty in the market and
could lead to anticipatory behaviour which may become a source of volatility too.
While in general structural measures seem to be preferable, exactly which measure to use in a
given situation and country very much depends on national characteristics of the mortgage and
housing markets, and the fiscal instruments available. In applying them, due account has to be
given to other considerations, notably effects on labour mobility, the effectiveness of the
instruments, and possible distortionary effects in housing markets. In addition, experiences as in
Sweden in the early 1990s suggest that small changes to fiscal instruments generally seem
preferable to avoid large disruptions to housing markets, with adverse effects on the economy and
on financial stability.
23 He also considered policy changes by lenders, building societies and insurance companies, and assessed most of their measures to be pro-cyclical, e.g. tightening capital adequacy requirements during housing recessions, widening margins to cover for provisions and write-offs, and lowering loan-to-value ratios.
28ECBWorking Paper Series No. 526September 2005

5. Conclusion
Mortgage market developments increasingly gain importance for economic analysis and
policymaking. While the role of fiscal instruments in affecting mortgage growth often is
acknowledged in the theoretical literature, the empirical follow-up has been minimal.
The empirical analysis for 15 EU countries, based on pooled regressions, indicates that real
mortgage lending is positively affected by financial deregulation measures, stock market growth,
and house price increases, while after-tax interest rates exert a negative effect. The latter includes
tax elements via the deductibility of interest payments. Real growth of disposable income may
positively affect mortgage debt, and inflation may do so negatively, although the evidence for
these two variables is rather mixed. Changes to the time period, the estimation-method and the
countries included indicate that these results are fairly robust. Nevertheless, caveats regarding
data-based analysis of fiscal effects on mortgage debt, notably related to data availability, quality
and comparability, call for caution in interpreting the results. Future work that may lead to a
further underpinning of the conclusions could focus on extending the fiscal aspects of mortgages
to be included in the empirical analysis. In addition, there may be benefits to a formal framework
for modelling housing and mortgage developments, separating mortgage demand from supply
factors and including explicit linkages between home-ownership and mortgage demand.
Finally, this paper briefly examined opportunities for and limitations on employing fiscal
instruments to correct housing market imbalances. Only main strengths and weaknesses of the
main instruments have been discussed as its concrete should depend on country- and situation-
specific features. In general, where needed, structural fiscal measures can be envisaged to reduce
housing market volatility, which could focus on reduced mortgage interest relief and on increased
reliance on automatic stabilisation, for instance via regular updates of housing values relevant for
property and other taxes. More reservations seem to be needed for applying fine-tuning measures
on the housing market, as doubts about appropriate timing and calibration prevail.
29ECB
Working Paper Series No. 526September 2005

Annex 1. Main tax instruments affecting housing/mortgages in EU countries, 2003
A1 Tax on imputed rents Country Yes/No Remark Austria N Belgium Y On the basis of average net rent values Denmark N Replaced in 2000 by county and municipal property taxes Finland N France N Abolished in 1965 Germany N Abolished in 1987 Greece N Abolished in 2003 Ireland N Italy Y But owner-occupied dwelling largely exempted Luxembourg Y But tax amount based on dated values Netherlands Y Up to 0.8% of market value, with a maximum Portugal N Spain N Unless owner does not occupy the dwelling, then imputed rent due Sweden N Replaced by a real estate tax in 1991 UK N Abolished in 1963 Source: International Bureau of Fiscal Documentation (2003) A2. Tax on capital gains Country Yes/No Tax rate
(max) applicable*
Remark
Austria Y 50% No taxation if sold more than 10 years after acquisition Belgium Y 16.5%
(flat) No taxation if sold more than 5 years after acquisition
Denmark Y 15% Owner-occupied dwellings excluded Finland Y 29% No taxation if used 2 years or more as primary
residence France Y 49.6% No taxation if principal residence Germany Y 48.5% Owner-occupied dwellings excluded Greece N - Ireland Y 20% No taxation on private residence Italy Y 45% Principal dwelling of owner excluded Luxembourg Y 38% Main residence exempted from taxation Netherlands N - Portugal Y 40% Exemption for permanent dwelling if gain reinvested
in permanent residence within certain time period Spain Y 25% Not taxation if reinvested in new primary residence Sweden Y 30%
(flat) Deferred taxation on major residence if gain exceeds a threshold
UK Y 40% Main residence excluded from taxation Source: International Bureau of Fiscal Documentation (2003) * The tax rates are not well comparable as they disregard thresholds applying, deductions allowed from the capital gains, the progression of the system, the number of years the dwelling has been owned and occupied, and local surcharges.
30ECBWorking Paper Series No. 526September 2005
31ECB
Working Paper Series No. 526September 2005
A3. Mortgage interest payments tax deductibility Country Yes/
No Maximum tax rate
Remark
Austria Y 50% Tax deductible as special expense up to a limit that goes to 0 as annual income increases
Belgium Y 50% Tax deductible up to income from immovable property, but some additional deduction possible. Deduction decreases over time, for at most 12 years
Denmark Y 15% Deductible from capital income that is subject to income tax, unlimited
Finland Y 29% (flat rate)
Normally deductible from capital income that is subject to income tax
France N - Gradually abolished over the period 1991-2000. Only tax credit in very special cases for loans before 1998
Germany N - scheme (Eigenheimzulage)
Greece Y 40% Since 2003, tax credit of 15% for annual mortgage interest, subject to limits
Ireland Y 42% "Tax credit" at 20% standard income tax rate, at source, with (low) limits
Italy Y 45% Tax credit of 19% for annual mortgage interest, with limit Luxembourg Y 38% Tax deductible, with (low) limits Netherlands Y 52% Tax deductible without limit, for at most 30 years Portugal Y 40% Tax credit of 30% of mortgage interest and amortisation,
with a limit Spain Y 45% Tax credit of 25% of amounts paid (principal and interest)
in first two years, 20% thereafter up to a threshold, and 15% for payments above the threshold
Sweden Y 30% Interest not attributable to any source of income is deductible from capital income
UK N - Abolished in a number of steps (1983, 1988, 1991, 2000) Source: International Bureau of Fiscal Documentation (2003)
Abolished in 1986 with the introduction of a subsidy
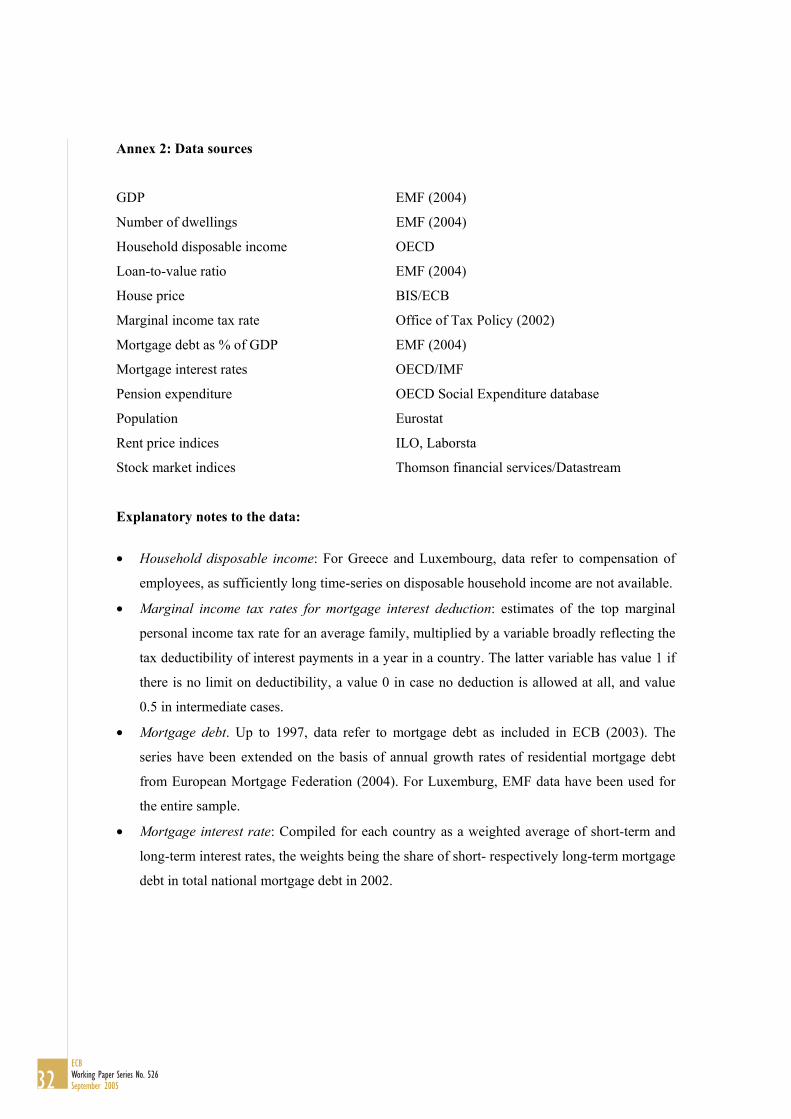
Annex 2: Data sources
GDP EMF (2004)
Number of dwellings EMF (2004)
Household disposable income OECD
Loan-to-value ratio EMF (2004)
House price BIS/ECB
Marginal income tax rate Office of Tax Policy (2002)
Mortgage debt as % of GDP EMF (2004)
Mortgage interest rates OECD/IMF
Pension expenditure OECD Social Expenditure database
Population Eurostat
Rent price indices ILO, Laborsta
Stock market indices Thomson financial services/Datastream
Explanatory notes to the data:
• Household disposable income: For Greece and Luxembourg, data refer to compensation of
employees, as sufficiently long time-series on disposable household income are not available.
• Marginal income tax rates for mortgage interest deduction: estimates of the top marginal
personal income tax rate for an average family, multiplied by a variable broadly reflecting the
tax deductibility of interest payments in a year in a country. The latter variable has value 1 if
there is no limit on deductibility, a value 0 in case no deduction is allowed at all, and value
0.5 in intermediate cases.
• Mortgage debt. Up to 1997, data refer to mortgage debt as included in ECB (2003). The
series have been extended on the basis of annual growth rates of residential mortgage debt
from European Mortgage Federation (2004). For Luxemburg, EMF data have been used for
the entire sample.
• Mortgage interest rate: Compiled for each country as a weighted average of short-term and
long-term interest rates, the weights being the share of short- respectively long-term mortgage
debt in total national mortgage debt in 2002.
32ECBWorking Paper Series No. 526September 2005

Annex 3: Major financial deregulation measures in EU countries
Year Financial Deregulation Measure
Belgium 1987 Abandoning of interest rate setting for deposits
Denmark 1982 Liberalisation of mortgage contracts and interest rate setting
Spain 1987 Deregulation of interest rates
Finland 1986/87 Interest rate deregulation/ withdrawal of mortgage lending guidelines
France 1987 Elimination of credit controls
Greece 1987 Interest rate deregulation
Ireland 1986 Elimination of credit controls
Italy 1994 Elimination distinction short- long-term credit institutions
Portugal 1984 Private banking allowed
Portugal 1996 Final stage of privatisation process
Sweden 1985 Interest rate deregulation, abolishment bank lending ceilings
Sources: Girouard and Blöndal (2001) for the larger countries, various publications for smaller countries. Annex 4: ADF test on unit roots, 1981-2003
Level Change
Log real mortgage loans to households 7.17 45.82**
Log consumer price level 103.44** 87.15***
Log real disposable income per person 9.86 99.58***
Capital costs 14.31 157.83***
Log real house prices 44.14** 74.27***
Log real stock index 19.44** 192.74***
Log pension expenditure (% of GDP) 21.12*** 115.56***
Log nominal rent index 88.59*** 84.49*** *** = significant at 1% level, ** = significant at 5% level.
33ECB
Working Paper Series No. 526September 2005
34ECBWorking Paper Series No. 526September 2005
References: Agell, J., L. Berg and P. Edin (1995), “The Swedish Boom-to-Bust Cycle: Tax Reform, Consumption and Asset Structure”, Swedish Economic Policy Review, 2, pp.271-314. Ball, M., and M. Grilli, (1997), Housing Markets and Economic Convergence in the European Union, Report for the Royal Institution of Chartered Surveyors and the European Institute. Berger, T., P. Englund, P. Hendershott, and B. Turner (2000), “The Capitalization of Interest Subsidies; Evidence from Sweden”, Journal of Money, Credit and Banking, 32, No. 2, pp. 199-218. Boelhouwer, P., M. Haffner, P. Neuteboom, and P. de Vries (2004), “House Prices and Income Tax in the Netherlands: An International Perspective”, Housing Studies, 19, No. 3, pp. 415-432. Calza, A., C. Gartner, and J. Sousa (2001), “Modelling the Demand for Loans to the Private Sector in the Euro Area”, ECB Working Paper, No. 55. Cameron, G., and J. Muellbauer (1998), “The Housing Market and Regional Commuting and Migration Choices”, The Scottish Journal of Political Economy, 45, 4, pp. 420-446. Case, K., and R. Shiller (1988), “The Behavior of Home Buyers in Boom and Post Boom Markets”, NBER Working Paper Series, No. 2748. Contact Group on Asset Prices (2002), Turbulence in Asset Markets: The Role of Micro Policies.
Crook, J. (2003), “The Demand and Supply for Household Debt: a Cross Country Comparison”, Credit Research Centre Working Paper, No. 1. Debelle, G. (2004), “Macroeconomic Implications of Rising Household Debt”, BIS Working Paper, no. 153. De Greef, I., and R. de Haas (2000), “Housing Prices, Bank Lending, and Monetary Policy”, DNB Research Series Supervision Paper, No. 31. Doling, J., and N. Horsewood (2003), “Home Ownership and Early Retirement: European Experience in the 1990s”, Journal of Housing and Built Environment, pp. 289-308. Donner, C. (2001), Housing Policies in the European Union; Theory and Practice, Vienna. ECB (2003), Structural Factors in the EU Housing Markets, March. Englund, P., P. Hendershott and B. Turner (1995), “The Tax Reform and the Housing Market”, Swedish Economic Policy Review, Vol. 2, No 2, pp. 318-356. Englund, P., and Y. Ioannides (1997), “House Price Dynamics: An International Perspective”, Journal of Housing Economics, 6, pp. 119-136 Englund, P. (1999), “The Swedish Banking Crisis: Roots and Consequences”, Oxford Review of Economic Policy, 15, No. 3, pp., 80-97.
35ECB
Working Paper Series No. 526September 2005
Eschenbach, F., and L. Schuknecht (2002), “The Fiscal Costs of Financial Instability Revisited”, ECB Working Paper, No. 191. European Mortgage Federation (2004), Hypostat 2003, Brussels. Eurostat (2004), Yearbook 2003.
Fitzpatrick, T., and K. McQuinn (2004), “House Prices and Mortgage Credit: Empirical Evidence for Ireland”, Central Bank & Financial Services Authority of Ireland Research Technical Paper, No. 5. Follain, J., and R. Dunsky (1997), “The Demand for Mortgage Debt and the Income Tax”, Journal of Housing Research, 8 (2), pp.155-199. Freeman, A., A. Holmand and C Whitehead (1996), Is the UK Different? International Comparisons of Tenure Patterns, Council of Mortgage Lenders. Girouard, N., and S. Blöndal (2001), “House Prices and Economic Activity”, OECD Economics Working Paper, No. 5. Hoffman, B. (2004), “The Determinants of Bank Credit in Industrialised Countries: Do Property Prices Matter?”, International Finance, 7, 2, pp. 203-234. International Bureau of Fiscal Documentation (2003), European Tax Handbook 2003, Amsterdam. Kasparova, D., and M. White (2001), “The Responsiveness of House Prices to Macroeconomic Forces: A Cross-Country Comparison”, European Journal of Housing Policy, 1, 3, pp. 385-416. Maclennan, D., J. Muellbauer, and M. Stephens (1999), “Asymmetries in Housing and Financial Market Institutions and EMU”, CEPR Discussion Paper, no. 2062. Magri, S. (2002), “Italian Households' Debt: Determinants of Demand and Supply”, Banca D 'Italia Temi di Discussione, No. 454. Martins, N., and E. Villanueva (2003), “The Impact of Mortgage-Interest Subsidies on Long-Term Household Debt”, Banco de Portugal Working Paper, No. 14. Mercer Oliver Wyman (2003), Study on the Financial Integration of European Mortgage Markets. Muellbauer, J., (2003), The U.K and the Euro – The Role of Asymmetries in Housing and Credit Markets, submission to the UK Treasury Five Tests review. Nickell, S. (2002), Monetary Policy Issues: Past, Present, Future, Speech at Business Link and the Coventry and Warwickshire Chamber of Commerce, Leamington Spa, June 19th.
Fernandez-Corugedo, E., and J. Muellbauer (2003), “Consumer Credit Conditions in the U.K.”, Bank of England Working Paper.
OECD (2003), Public social expenditure by main category. OECD (2004), Economic Survey of the UK, 2004. Office of Tax Policy (2002), World Tax Database. Reproduced by the OECD. Rosen, H. (1979), “Housing Decisions and the U.S. Income Tax”, Journal of Public Economics, 11, pp. 1-23. Schuknecht, L., and F. Eschenbach (2002), “Asset Prices and Fiscal Balances”, ECB Working Paper, No. 141. Stephens, M. (1996), “Institutional Responses to the UK Housing Market Recession”, Urban Studies, 33, No. 2, pp. 337-351. Tsatsaronis, K., and H. Zhu (2004), “What Drives Housing Price Dynamics: Cross-Country Evidence”, BIS Quarterly Review, March, pp. 65-78. Van den Noord, P. (2003), “Tax Incentives and House Price Volatility in the Euro Area: Theory and Evidence”, OECD Economics Department Working Paper, no. 356. Van Ommeren, J., and M. van Leuvensteijn (2003), “New Evidence of the Effects of Transaction Costs on Residential Mobility”, CPB Discussion Paper, no. 18.
36ECBWorking Paper Series No. 526September 2005

37ECB
Working Paper Series No. 526September 2005
European Central Bank working paper series
For a complete list of Working Papers published by the ECB, please visit the ECB’s website(http://www.ecb.int)
490 “Unions, wage setting and monetary policy uncertainty” by H. P. Grüner, B. Hayo and C. Hefeker,June 2005.
491 “On the fit and forecasting performance of New-Keynesian models” by M. Del Negro,F. Schorfheide, F. Smets and R. Wouters, June 2005.
492 “Experimental evidence on the persistence of output and inflation” by K. Adam, June 2005.
493 “Optimal research in financial markets with heterogeneous private information: a rationalexpectations model” by K. Tinn, June 2005.
494 “Cross-country efficiency of secondary education provision: a semi-parametric analysis withnon-discretionary inputs” by A. Afonso and M. St. Aubyn, June 2005.
495 “Measuring inflation persistence: a structural time series approach” by M. Dossche andG. Everaert, June 2005.
496 “Estimates of the open economy New Keynesian Phillips curve for euro area countries”by F. Rumler, June 2005.
497 “Early-warning tools to forecast general government deficit in the euro area:the role of intra-annual fiscal indicators” by J. J. Pérez, June 2005.
498 “Financial integration and entrepreneurial activity: evidence from foreign bank entry in emergingmarkets” by M. Giannetti and S. Ongena, June 2005.
499 “A trend-cycle(-season) filter” by M. Mohr, July 2005.
500 “Fleshing out the monetary transmission mechanism: output composition and the role of financialfrictions” by A. Meier and G. J. Müller, July 2005.
501 “Measuring comovements by regression quantiles” by L. Cappiello, B. Gérard, and S. Manganelli,July 2005.
502 “Fiscal and monetary rules for a currency union” by A. Ferrero, July 2005
503 “World trade and global integration in production processes: a re-assessment of import demandequations” by R. Barrell and S. Dées, July 2005.
504 “Monetary policy predictability in the euro area: an international comparison”by B.-R. Wilhelmsen and A. Zaghini, July 2005.
505 “Public good issues in TARGET: natural monopoly, scale economies, network effects and costallocation” by W. Bolt and D. Humphrey, July 2005.
506 “Settlement finality as a public good in large-value payment systems”by H. Pagès and D. Humphrey, July 2005.

38ECBWorking Paper Series No. 526September 2005
507 “Incorporating a “public good factor” into the pricing of large-value payment systems”by C. Holthausen and J.-C. Rochet, July 2005.
508 “Systemic risk in alternative payment system designs” by P. Galos and K. Soramäki, July 2005.
509 “Productivity shocks, budget deficits and the current account” by M. Bussière, M. Fratzscherand G. J. Müller, August 2005.
510 “Factor analysis in a New-Keynesian model” by A. Beyer, R. E. A. Farmer, J. Henryand M. Marcellino, August 2005.
511 “Time or state dependent price setting rules? Evidence from Portuguese micro data”by D. A. Dias, C. R. Marques and J. M. C. Santos Silva, August 2005.
512 “Counterfeiting and inflation” by C. Monnet, August 2005.
513 “Does government spending crowd in private consumption? Theory and empirical evidence forthe euro area” by G. Coenen and R. Straub, August 2005.
514 “Gains from international monetary policy coordination: does it pay to be different?”by Z. Liu and E. Pappa, August 2005.
515 “An international analysis of earnings, stock prices and bond yields”by A. Durré and P. Giot, August 2005.
516 “The European Monetary Union as a commitment device for new EU member states”by F. Ravenna, August 2005.
517 “Credit ratings and the standardised approach to credit risk in Basel II” by P. Van Roy,August 2005.
518 “Term structure and the sluggishness of retail bank interest rates in euro area countries”by G. de Bondt, B. Mojon and N. Valla, September 2005.
519 “Non-Keynesian effects of fiscal contraction in new member states” by A. Rzońca andP. Ciz· kowicz, September 2005.
520 “Delegated portfolio management: a survey of the theoretical literature” by L. Stracca,September 2005.
521 “Inflation persistence in structural macroeconomic models (RG10)” by R.-P. Berben,R. Mestre, T. Mitrakos, J. Morgan and N. G. Zonzilos, September 2005.
522 “Price setting behaviour in Spain: evidence from micro PPI data” by L. J. Álvarez, P. Burrieland I. Hernando, September 2005.
523 “How frequently do consumer prices change in Austria? Evidence from micro CPI data”by J. Baumgartner, E. Glatzer, F. Rumler and A. Stiglbauer, September 2005.
524 “Price setting in the euro area: some stylized facts from individual consumer price data”by E. Dhyne, L. J. Álvarez, H. Le Bihan, G. Veronese, D. Dias, J. Hoffmann, N. Jonker,P. Lünnemann, F. Rumler and J. Vilmunen, September 2005.

39ECB
Working Paper Series No. 526September 2005
525 “Distilling co-movements from persistent macro and financial series” by K. Abadir and
526 “On some fiscal effects on mortgage debt growth in the EU” by G. Wolswijk, September 2005.
G. Talmain, September 2005.