niversidad politecnica de ´ madridoa.upm.es/38700/1/marina_zapater_sancho.pdfpor delante! (sobre...
TRANSCRIPT

UNIVERSIDAD POLITECNICA DE MADRID
ESCUELA TECNICA SUPERIOR
DE INGENIEROS DE TELECOMUNICACION
TESIS DOCTORAL
PROACTIVE AND REACTIVE THERMAL AWARE
OPTIMIZATION TECHNIQUES TO MINIMIZE THE
ENVIRONMENTAL IMPACT OF DATA CENTERS
AUTOR:
Marina Zapater SanchoIngeniera de Telecomunicacion
Ingeniera Electronica
DIRECTORES:
Jose Manuel Moya FernandezDoctor Ingeniero de Telecomunicacion
Jose Luis Ayala RodrigoDoctor Ingeniero de Telecomunicacion
Licenciado en Ciencias Fısicas
2015

Marina Zapater SanchoE-mail: [email protected] site: http://marinazapater.es
c©2015 Marina Zapater Sancho
Permission is granted to copy, distribute and/or modify this document under the terms of the GNUFree Documentation License, Version 1.2 or any later version published by the Free SoftwareFoundation; with no Invariant Sections, no Front-Cover Texts, and no Back-Cover Texts. A copy of thelicense is included in the section entitled GNU Free Documentation License.

Ph.D. Thesis
Tıtulo: PROACTIVE AND REACTIVE THERMAL AWAREOPTIMIZATION TECHNIQUES TO MINIMIZE THEENVIRONMENTAL IMPACT OF DATA CENTERS
Autor: MARINA ZAPATER SANCHO
Tutor: JOSE MANUEL MOYA FERNANDEZJOSE LUIS AYALA RODRIGO
Departamento: DEPARTAMENTO DE INGENIERIA ELECTRONICA
Miembros del tribunal:
Presidente:Secretario:Vocal:Vocal:Vocal:
Suplente:Suplente:
Los miembros del tribunal arriba nombrados acuerdan otorgarla calificacion de:
Madrid, de de 2015


This research has been partly supported by a PICATA predoctoral fellowship of the MoncloaCampus of International Excellence (UCM-UPM), the Spanish Ministry of Economy and
Competitivity under research grants TIN2008-00508 and TEC2012-33892, by Oracle Corp.,and by a Collaboration Grant of the European Network of Excellence on High Performance
and Embedded Architecture and Compilation (HiPEAC).
The author thankfully acknowledges the computer resources, technical expertise andassistance provided by the Centro de Supercomputacion y Visualizacion de Madrid
(CeSViMa).


A mis padres.Y a Felix.


Dolca Catalunya,patria del meu cor,quan de tu un s’allunyad’enyoranca es mor.
— Jacint Verdaguer, L’emigrant
“I remember my youth and the feeling that will never comeback any more. The feeling that I could last for ever, outlast thesea the earth, and all men.”
— Joseph Conrad
Saeta que voladoracruza, arrojada al azar,y que no sabe dondetemblando se clavara;...eso soy yo, que al acasocruzo el mundo sin pensarde donde vengo ni a dondemis pasos mi llevaran
— Gustavo A. Becquer Rima II (Rimas y Leyendas)

Acknowledgements
“And if I ever lose my eyes, if my colors all run dry. Yes if Iever lose my eyes. Oh if... I won’t have to cry no more.”
— Cat Stevens, Moonshadow
Antes de empezar dire que mi sra. madre, cuando le dije “ya he acabado de escribir la tesis! solo me quedaredactar los agradecimientos”, me dio un breve pero importante consejo: “Hija, pues simplemente escribe:muchas gracias a todos. Ya veras como ası acabas pronto y ademas quedas bien con todos”. Pese a querazon no le faltaba, digo yo que despues de estos anos de venturas y desventuras, algo mas tendre que decir (ni quesea por deferencia a los que no entienden el ingles y aun y ası se miraran con carino e interes el tomo). Ası que allavamos!
En primer lugar, quiero dar las gracias a mis tutores de tesis: a Jose Manuel Moya, porque cuando todavıa noexistıa esta lınea de investigacion en el grupo, su vision nos permitio llegar donde estamos ahora. Por su pragma-tismo, optimismo y paciencia, que nos han ayudado a superar los momentos complicados. A Jose Luis Ayala, porquees un gran investigador y una mejor persona. Es para mı una referencia y un gran ejemplo a seguir, tanto en lopersonal como en lo profesional. Y en definitiva a ambos por hacer posible este trabajo.
I’d like also to thank Prof. Ayse Coskun, for her kind advice and guidance during both my stays at her researchgroup in Boston University. Also to Ata Turk, for his help and support (now every time I go to Barcelona I also sayhello from you). Thanks also to all the students of the PeacLab group. My stay at Boston wouldn’t have been thesame without you, folks! (if a new and better live awaits once you’re a Ph.D., I’ll let you know).
A todos los Green (y a los que lleva un Green en su interior :)), por haber comprendido mi necesidad de practicarla green-dieta y aun y ası seguirme queriendo tal y como soy (espero!). Porque los ultimos anos no han sido facilespero, gracias a vosotros, han sido fantasticos. Y por supuesto por todos los cafes juntos... y por los que nos quedanpor delante! (sobre todo ahora que la maquina de cafe nos cae cerquita, cerquita...).
A toda la gente de ArTECS, companeros y profesores de la UCM, que me han acogido como una mas desu grupo, ayudandome desde el principio, y que me han ensenado lo que es un grupo de investigacion. A loscompaneros y profesores del LSI y del DIE, y en particular a los ex-miembros del B105, con quienes compartı misprimeros proyectos de desarrollo y mis primeras publicaciones.
Last but not least, a mi famılia, tanto la de Barcelona, como la de Talavera! En especial a mis padres, por elapoyo incondicional en absolutamente todo (incluso cuando me voy a lugares donde solo se llega en avion). A mipadre, porque su teson es un ejemplo de que las cosas que merecen la pena en esta vida se consiguen con esfuerzo.Ambos sois y sereis siempre un ejemplo para mı.
A Felix, por estar siempre a mi lado, incluso cuando me da por irme de paseo por el mundo y estamos lejos. Portu apoyo. Porque todo es mejor cuando estas tu y porque contigo soy mejor persona.
A la Rosa Mari, que ens ensenya dia rere dia que passi el passi mai hem de deixar de somriure.
A todos aquellos que habeis estado a mi lado y me habeis apoyado durante estos anos.Y a los que me habeis hecho mas fuerte.
Muchas gracias a todos.
I


Abstract
“Learn from yesterday, live for today, hope for tomorrow. Theimportant thing is to not stop questioning.”
— Albert Einstein
Data centers are easily found in every sector of the worldwide economy. They consist oftens of thousands of servers, serving millions of users globally and 24-7. In the last years,e-Science applications such e-Health or Smart Cities have experienced a significant develop-ment. The need to deal efficiently with the computational needs of next-generation applica-tions together with the increasing demand for higher resources in traditional applications hasfacilitated the rapid proliferation and growing of data centers. A drawback to this capacitygrowth has been the rapid increase of the energy consumption of these facilities. In 2010, datacenter electricity represented 1.3% of all the electricity use in the world. In year 2012 alone,global data center power demand grew 63% to 38GW. A further rise of 17% to 43GW was esti-mated in 2013. Moreover, data centers are responsible for more than 2% of total carbon dioxideemissions.
This PhD Thesis addresses the energy challenge by proposing proactive and reactive ther-mal and energy-aware optimization techniques that contribute to place data centers on a morescalable curve. This work develops energy models and uses the knowledge about the energydemand of the workload to be executed and the computational and cooling resources availableat data center to optimize energy consumption. Moreover, data centers are considered as a cru-cial element within their application framework, optimizing not only the energy consumptionof the facility, but the global energy consumption of the application.
The main contributors to the energy consumption in a data center are the computing powerdrawn by IT equipment and the cooling power needed to keep the servers within a certaintemperature range that ensures safe operation. Because of the cubic relation of fan power withfan speed, solutions based on over-provisioning cold air into the server usually lead to ineffi-ciencies. On the other hand, higher chip temperatures lead to higher leakage power becauseof the exponential dependence of leakage on temperature. Moreover, workload characteristicsas well as allocation policies also have an important impact on the leakage-cooling tradeoffs.The first key contribution of this work is the development of power and temperature mod-els that accurately describe the leakage-cooling tradeoffs at the server level, and the proposalof strategies to minimize server energy via joint cooling and workload management from amultivariate perspective.
When scaling to the data center level, a similar behavior in terms of leakage-temperaturetradeoffs can be observed. As room temperature raises, the efficiency of data room coolingunits improves. However, as we increase room temperature, CPU temperature raises andso does leakage power. Moreover, the thermal dynamics of a data room exhibit unbalancedpatterns due to both the workload allocation and the heterogeneity of computing equipment.The second main contribution is the proposal of thermal- and heterogeneity-aware workloadmanagement techniques that jointly optimize the allocation of computation and cooling toservers. These strategies need to be backed up by flexible room level models, able to work onruntime, that describe the system from a high level perspective.
Within the framework of next-generation applications, decisions taken at this scope canhave a dramatical impact on the energy consumption of lower abstraction levels, i.e. the data
III
center facility. It is important to consider the relationships between all the computationalagents involved in the problem, so that they can cooperate to achieve the common goal ofreducing energy in the overall system. The third main contribution is the energy optimizationof the overall application by evaluating the energy costs of performing part of the process-ing in any of the different abstraction layers, from the node to the data center, via workloadmanagement and off-loading techniques.
In summary, the work presented in this PhD Thesis, makes contributions on leakage andcooling aware server modeling and optimization, data center thermal modeling and heterogeneity-aware data center resource allocation, and develops mechanisms for the energy optimizationfor next-generation applications from a multi-layer perspective.
Keywords — Energy, Energy-efficiency, Data Centers, Green Computing, Power modeling,Temperature prediction, Cooling, Resource management, Optimization
IV

Resumen
“Si buscas resultados distintos, no hagas siempre lo mismo.”
— Albert Einstein
Los Centros de Datos se encuentran actualmente en cualquier sector de la economıa mundial.Estan computestos por miles de servidores, dando servicio a los usuarios de forma global, las24 horas del dıa y los 365 dıas del ano. Durante los ultimos anos, las aplicaciones del ambitode la e-Ciencia, como la e-Salud o las Ciudades Inteligentes han experimentado un desarollomuy significativo. La necesidad de manejar de forma eficiente las necesidades de computo deaplicaciones de nueva generacion, junto con la creciente demanda de recursos en aplicacionestradicionales, han facilitado el rapido crecimiento y la proliferacion de los Centros de Datos.El principal inconveniente de este aumento de capacidad ha sido el rapido y dramatico incre-mento del consumo energetico de estas infraestructuras. En 2010, la factura electrica de losCentros de Datos representaba el 1.3% del consumo electrico mundial. Solo en el ano 2012, elconsumo de potencia de los Centros de Datos crecio un 63%, alcanzando los 38GW. En 2013se estimo un crecimiento de otro 17%, hasta llegar a los 43GW. Ademas, los Centros de Datosson responsables de mas del 2% del total de emisiones de dioxido de carbono a la atmosfera.
Esta tesis doctoral se enfrenta al problema energetico proponiendo tecnicas proactivas yreactivas conscientes de la temperatura y de la energıa, que contribuyen a tener Centros deDatos mas eficientes. Este trabajo desarrolla modelos de energıa y utiliza el conocimiento so-bre la demanda energetica de la carga de trabajo a ejecutar y de los recursos de computacion yrefrigeracion del Centro de Datos para optimizar el consumo. Ademas, los Centros de Datosson considerados como un elemento crucial dentro del marco de la aplicacion ejecutada, op-timizando no solo el consumo del Centro de Datos sino el consumo energetico global de laaplicacion.
Los principales componentes del consumo en los Centros de Datos son la potencia de com-putacion utilizada por los equipos de IT, y la refrigeracion necesaria para mantener los servi-dores dentre de un rango de temperatura de trabajo que asegure su correcto funcionamiento.Debido a la relacion cubica entre la velocidad de los ventiladores y el consumo de los mismos,las soluciones basadas en el sobre-aprovisionamiento de aire frıo al servidor generalmentetienen como resultado ineficiencias energeticas. Por otro lado, temperaturas mas elevadas enel procesador llevan a un consumo de fugas mayor, debido a la relacion exponencial del con-sumo de fugas con la temperatura. Ademas, las caracterısticas de la carga de trabajo y laspolıticas de asignacion de recursos tienen un impacto importante en los balances entre corri-ente de fugas y consumo de refrigeracion. La primera gran contribucion de este trabajo es eldesarrollo de modelos de potencia y temperatura que permiten describes estos balances en-tre corriente de fugas y refrigeracion; ası como la propuesta de estrategias para minimizar elconsumo del servidor por medio de la asignacion conjunta de refrigeracion y carga desde unaperspectiva multivariable.
Cuando escalamos a nivel del Centro de Datos, observamos un comportamiento similar enterminos del balance entre corrientes de fugas y refrigeracion. Conforme aumenta la temper-atura de la sala, mejora la eficiencia de la refrigeracion. Sin embargo, este incremente de latemperatura de sala provoca un aumento en la temperatura de la CPU y, por tanto, tambiendel consumo de fugas. Ademas, la dinamica de la sala tiene un comportamiento muy desigual,no equilibrado, debido a la asignacion de carga y a la heterogeneidad en el equipamiento de
V

IT. La segunda contribucion de esta tesis es la propuesta de tecnicas de asigacion conscientesde la temperatura y heterogeneidad que permiten optimizar conjuntamente la asignacion detareas y refrigeracion a los servidores. Estas estrategias necesitan estar respaldadas por mod-elos flexibles, que puedan trabajar en tiempo real, para describir el sistema desde un nivel deabstraccion alto.
Dentro del ambito de las aplicaciones de nueva generacion, las decisiones tomadas en elnivel de aplicacion pueden tener un impacto dramatico en el consumo energetico de nivelesde abstraccion menores, como por ejemplo, en el Centro de Datos. Es importante considerarlas relaciones entre todos los agentes computacionales implicados en el problema, de formaque puedan cooperar para conseguir el objetivo comun de reducir el coste energetico globaldel sistema. La tercera contribucion de esta tesis es el desarrollo de optimizaciones energeticaspara la aplicacion global por medio de la evaluacion de los costes de ejecutar parte del proce-sado necesario en otros niveles de abstraccion, que van desde los nodos hasta el Centro deDatos, por medio de tecnicas de balanceo de carga.
Como resumen, el trabajo presentado en esta tesis lleva a cabo contribuciones en el mod-elado y optimizacion consciente del consumo por fugas y la refrigeracion de servidores; elmodelado de los Centros de Datos y el desarrollo de polıticas de asignacion conscientes de laheterogeneidad; y desarrolla mecanismos para la optimizacion energetica de aplicaciones denueva generacion desde varios niveles de abstraccion.
VI

Contents
Acknowledgements I
Abstract III
Resumen V
1 Introduction 11.1 Motivation and Context . . . . . . . . . . . . . . . . . . . . . . . . . . . . . . . . 11.2 Overview of the State-of-the-Art . . . . . . . . . . . . . . . . . . . . . . . . . . . 3
1.2.1 Energy consumption breakdown . . . . . . . . . . . . . . . . . . . . . . . 31.2.2 Industry approaches to energy efficiency . . . . . . . . . . . . . . . . . . 41.2.3 Energy-efficient computing . . . . . . . . . . . . . . . . . . . . . . . . . . 51.2.4 Energy-efficient cooling . . . . . . . . . . . . . . . . . . . . . . . . . . . . 71.2.5 Joint strategies for IT and cooling . . . . . . . . . . . . . . . . . . . . . . . 81.2.6 Trends and open issues . . . . . . . . . . . . . . . . . . . . . . . . . . . . 8
1.3 Problem formulation and optimization paradigm . . . . . . . . . . . . . . . . . 91.4 Contributions of this Ph.D. Thesis . . . . . . . . . . . . . . . . . . . . . . . . . . . 101.5 Structure of this Ph.D. Thesis . . . . . . . . . . . . . . . . . . . . . . . . . . . . . 111.6 Publications . . . . . . . . . . . . . . . . . . . . . . . . . . . . . . . . . . . . . . . 12
1.6.1 Journal papers . . . . . . . . . . . . . . . . . . . . . . . . . . . . . . . . . 121.6.2 Conference papers . . . . . . . . . . . . . . . . . . . . . . . . . . . . . . . 131.6.3 Book chapters . . . . . . . . . . . . . . . . . . . . . . . . . . . . . . . . . . 131.6.4 Other publications . . . . . . . . . . . . . . . . . . . . . . . . . . . . . . . 13
1.7 Research Projects and Grants . . . . . . . . . . . . . . . . . . . . . . . . . . . . . 14
2 Server power and temperature modeling 172.1 Introduction . . . . . . . . . . . . . . . . . . . . . . . . . . . . . . . . . . . . . . . 172.2 Background on server modeling . . . . . . . . . . . . . . . . . . . . . . . . . . . 182.3 Experimental framework . . . . . . . . . . . . . . . . . . . . . . . . . . . . . . . . 19
2.3.1 Workload . . . . . . . . . . . . . . . . . . . . . . . . . . . . . . . . . . . . 192.3.2 Experimental set-up . . . . . . . . . . . . . . . . . . . . . . . . . . . . . . 202.3.3 Experimental exploration . . . . . . . . . . . . . . . . . . . . . . . . . . . 22
2.4 Server Power Modeling . . . . . . . . . . . . . . . . . . . . . . . . . . . . . . . . 232.4.1 Overview . . . . . . . . . . . . . . . . . . . . . . . . . . . . . . . . . . . . 242.4.2 CPU power . . . . . . . . . . . . . . . . . . . . . . . . . . . . . . . . . . . 242.4.3 Temperature-dependent CPU leakage . . . . . . . . . . . . . . . . . . . . 242.4.4 Dynamic CPU power . . . . . . . . . . . . . . . . . . . . . . . . . . . . . . 252.4.5 Memory power . . . . . . . . . . . . . . . . . . . . . . . . . . . . . . . . . 26
2.5 CPU temperature estimation . . . . . . . . . . . . . . . . . . . . . . . . . . . . . . 272.5.1 Steady-state estimation . . . . . . . . . . . . . . . . . . . . . . . . . . . . 272.5.2 Transient state modeling . . . . . . . . . . . . . . . . . . . . . . . . . . . . 28
2.6 Applying methodology to other servers . . . . . . . . . . . . . . . . . . . . . . . 292.6.1 Extension to Intel OCP server . . . . . . . . . . . . . . . . . . . . . . . . . 292.6.2 Power consumption comparison . . . . . . . . . . . . . . . . . . . . . . . 29
VII

CONTENTS
2.7 Models Summary . . . . . . . . . . . . . . . . . . . . . . . . . . . . . . . . . . . . 302.8 Conclusions . . . . . . . . . . . . . . . . . . . . . . . . . . . . . . . . . . . . . . . 31
3 Leakage and temperature aware workload and cooling management at the serverlevel 333.1 Introduction . . . . . . . . . . . . . . . . . . . . . . . . . . . . . . . . . . . . . . . 333.2 Related Work . . . . . . . . . . . . . . . . . . . . . . . . . . . . . . . . . . . . . . 34
3.2.1 Fan control . . . . . . . . . . . . . . . . . . . . . . . . . . . . . . . . . . . 343.2.2 Workload allocation . . . . . . . . . . . . . . . . . . . . . . . . . . . . . . 35
3.3 Experimental methodology . . . . . . . . . . . . . . . . . . . . . . . . . . . . . . 353.4 Cooling management policies . . . . . . . . . . . . . . . . . . . . . . . . . . . . . 35
3.4.1 Look-Up-Table based policy . . . . . . . . . . . . . . . . . . . . . . . . . . 363.4.2 Proactive fan control policy . . . . . . . . . . . . . . . . . . . . . . . . . . 36
3.5 Impact of workload allocation . . . . . . . . . . . . . . . . . . . . . . . . . . . . . 383.5.1 Allocation schemes . . . . . . . . . . . . . . . . . . . . . . . . . . . . . . . 393.5.2 Leakage-cooling tradeoffs . . . . . . . . . . . . . . . . . . . . . . . . . . . 393.5.3 Energy-performance tradeoffs . . . . . . . . . . . . . . . . . . . . . . . . 40
3.6 Results . . . . . . . . . . . . . . . . . . . . . . . . . . . . . . . . . . . . . . . . . . 423.6.1 Baseline policies . . . . . . . . . . . . . . . . . . . . . . . . . . . . . . . . 423.6.2 Workloads used . . . . . . . . . . . . . . . . . . . . . . . . . . . . . . . . . 433.6.3 Cooling management under synthetic workloads . . . . . . . . . . . . . 433.6.4 Joint workload and cooling management . . . . . . . . . . . . . . . . . . 45
3.7 Discussion on the impact at the data center . . . . . . . . . . . . . . . . . . . . . 473.8 Conclusions . . . . . . . . . . . . . . . . . . . . . . . . . . . . . . . . . . . . . . . 48
4 Data center room-level modeling using gramatical evolution techniques 514.1 Introduction . . . . . . . . . . . . . . . . . . . . . . . . . . . . . . . . . . . . . . . 514.2 Problem description . . . . . . . . . . . . . . . . . . . . . . . . . . . . . . . . . . 53
4.2.1 Data room thermal dynamics . . . . . . . . . . . . . . . . . . . . . . . . . 534.2.2 Temperature-energy tradeoffs . . . . . . . . . . . . . . . . . . . . . . . . . 53
4.3 Related work . . . . . . . . . . . . . . . . . . . . . . . . . . . . . . . . . . . . . . . 544.4 Modeling via Gramatical Evolution techniques . . . . . . . . . . . . . . . . . . . 56
4.4.1 Feature selection and model definition . . . . . . . . . . . . . . . . . . . . 564.4.2 Preventing premature convergence . . . . . . . . . . . . . . . . . . . . . . 584.4.3 Fitness and problem constraints . . . . . . . . . . . . . . . . . . . . . . . 59
4.5 Experimental methodology . . . . . . . . . . . . . . . . . . . . . . . . . . . . . . 594.5.1 Reduced scenario . . . . . . . . . . . . . . . . . . . . . . . . . . . . . . . . 594.5.2 Case study: CeSViMa data center . . . . . . . . . . . . . . . . . . . . . . . 604.5.3 Modeling framework . . . . . . . . . . . . . . . . . . . . . . . . . . . . . . 61
4.6 Results . . . . . . . . . . . . . . . . . . . . . . . . . . . . . . . . . . . . . . . . . . 624.6.1 Algorithm setup and performance . . . . . . . . . . . . . . . . . . . . . . 624.6.2 Comparison to other approaches . . . . . . . . . . . . . . . . . . . . . . . 664.6.3 Inlet temperature modeling . . . . . . . . . . . . . . . . . . . . . . . . . . 674.6.4 Data center modeling . . . . . . . . . . . . . . . . . . . . . . . . . . . . . 68
4.7 Discussion . . . . . . . . . . . . . . . . . . . . . . . . . . . . . . . . . . . . . . . . 694.7.1 Applicability . . . . . . . . . . . . . . . . . . . . . . . . . . . . . . . . . . 694.7.2 Computational effort . . . . . . . . . . . . . . . . . . . . . . . . . . . . . . 70
4.8 Conclusions . . . . . . . . . . . . . . . . . . . . . . . . . . . . . . . . . . . . . . . 71
5 Data center heterogeneity and application-aware workload and cooling management 735.1 Introduction . . . . . . . . . . . . . . . . . . . . . . . . . . . . . . . . . . . . . . . 735.2 Related Work . . . . . . . . . . . . . . . . . . . . . . . . . . . . . . . . . . . . . . 745.3 Heterogeneity-aware resource management . . . . . . . . . . . . . . . . . . . . . 75
5.3.1 Computing power reduction . . . . . . . . . . . . . . . . . . . . . . . . . 755.3.2 Cooling power reduction . . . . . . . . . . . . . . . . . . . . . . . . . . . 76
VIII

CONTENTS
5.4 Energy optimization algorithms . . . . . . . . . . . . . . . . . . . . . . . . . . . . 775.4.1 Static off-line data center server selection . . . . . . . . . . . . . . . . . . 775.4.2 Dynamic run-time allocation . . . . . . . . . . . . . . . . . . . . . . . . . 78
5.5 Results . . . . . . . . . . . . . . . . . . . . . . . . . . . . . . . . . . . . . . . . . . 795.5.1 Workload characterization and server parameters . . . . . . . . . . . . . 795.5.2 Data center server selection results . . . . . . . . . . . . . . . . . . . . . . 815.5.3 Runtime workload allocation results . . . . . . . . . . . . . . . . . . . . . 835.5.4 Cooling power reduction . . . . . . . . . . . . . . . . . . . . . . . . . . . 84
5.6 Conclusions . . . . . . . . . . . . . . . . . . . . . . . . . . . . . . . . . . . . . . . 86
6 Global optimization of the distributed application framework.A case study for e-Health scenarios 876.1 Introduction . . . . . . . . . . . . . . . . . . . . . . . . . . . . . . . . . . . . . . . 876.2 Related work . . . . . . . . . . . . . . . . . . . . . . . . . . . . . . . . . . . . . . . 886.3 Devised computer paradigm . . . . . . . . . . . . . . . . . . . . . . . . . . . . . 89
6.3.1 Energy optimization system . . . . . . . . . . . . . . . . . . . . . . . . . . 906.4 Case study . . . . . . . . . . . . . . . . . . . . . . . . . . . . . . . . . . . . . . . . 926.5 Power models used . . . . . . . . . . . . . . . . . . . . . . . . . . . . . . . . . . . 93
6.5.1 Node model . . . . . . . . . . . . . . . . . . . . . . . . . . . . . . . . . . . 946.5.2 Coordinator energy modeling . . . . . . . . . . . . . . . . . . . . . . . . . 956.5.3 Data Center power modeling . . . . . . . . . . . . . . . . . . . . . . . . . 96
6.6 Global Resource Allocation techniques . . . . . . . . . . . . . . . . . . . . . . . . 966.6.1 Task classification . . . . . . . . . . . . . . . . . . . . . . . . . . . . . . . . 966.6.2 Run-time allocation algorithm . . . . . . . . . . . . . . . . . . . . . . . . 98
6.7 Multi-layer integration . . . . . . . . . . . . . . . . . . . . . . . . . . . . . . . . . 1006.7.1 Integration with horizontal optimizations . . . . . . . . . . . . . . . . . . 1006.7.2 Overall energy savings . . . . . . . . . . . . . . . . . . . . . . . . . . . . . 100
6.8 New challenges . . . . . . . . . . . . . . . . . . . . . . . . . . . . . . . . . . . . . 1016.9 Conclusions . . . . . . . . . . . . . . . . . . . . . . . . . . . . . . . . . . . . . . . 102
7 Conclusions and Future Work 1037.1 Summary . . . . . . . . . . . . . . . . . . . . . . . . . . . . . . . . . . . . . . . . . 1037.2 Future Research Directions . . . . . . . . . . . . . . . . . . . . . . . . . . . . . . . 105
Appendix A Mapping process and relevant parameters in Gramatical Evolution 107A.1 Mapping process . . . . . . . . . . . . . . . . . . . . . . . . . . . . . . . . . . . . 107A.2 Fitness . . . . . . . . . . . . . . . . . . . . . . . . . . . . . . . . . . . . . . . . . . 109A.3 Problem constraints . . . . . . . . . . . . . . . . . . . . . . . . . . . . . . . . . . . 109
A.3.1 Problem constraints . . . . . . . . . . . . . . . . . . . . . . . . . . . . . . 109
Appendix B Classical modeling techniques 111B.1 ARMA models . . . . . . . . . . . . . . . . . . . . . . . . . . . . . . . . . . . . . . 111B.2 N4SID . . . . . . . . . . . . . . . . . . . . . . . . . . . . . . . . . . . . . . . . . . 112
Bibliography 123
IX

CONTENTS
X
List of Tables
3.1 Summary of dynamic power and CPU temperature at 2400RPM for selectedPARSEC and SPEC benchmarks running with 192 threads . . . . . . . . . . . . 40
3.2 Summary of performance counters (normalized to the highest value across bench-marks) of selected PARSEC and SPEC benchmarks with 192 threads. . . . . . . 41
3.3 Summary of relevant characteristics for SPEC and PARSEC benchmarks. Foreach parameter, benchmarks are ordered from high-to-low. . . . . . . . . . . . . 41
3.4 Summary of main characteristics for workload profiles. The profiles 1 and 3have a p(high) of 0.8, and the profiles 2 and 4 have a p(high) of 0.2. Arrival (λ)and service (µ) times are given in minutes. . . . . . . . . . . . . . . . . . . . . . 43
3.5 Summary of controller properties . . . . . . . . . . . . . . . . . . . . . . . . . . . 443.6 Summary of fan control results for all workloads under different allocation
schemes. . . . . . . . . . . . . . . . . . . . . . . . . . . . . . . . . . . . . . . . . . 463.7 EDP, Energy and performance for various allocation policies with proactive policy. 47
4.1 Phenotype, RMSE and MAE for the test set in the CPU temperature modelingreduced scenario . . . . . . . . . . . . . . . . . . . . . . . . . . . . . . . . . . . . 66
4.2 RMSE and MAE in CPU temperature prediction for each model (Grammaticalevolution - GE, ARMA and N4sid) . . . . . . . . . . . . . . . . . . . . . . . . . . 67
4.3 Phenotype and average error (in Celsius) in training and test set for CPU andinlet temperature modeling in a production data center . . . . . . . . . . . . . . 70
5.1 Server parameters for Setup A: 3-architecture, IT control only . . . . . . . . . . . . 795.2 Server parameters for Setup B: 2-architectures, IT + cooling control . . . . . . . . . 805.3 Data center server selection comparison for Setup A . . . . . . . . . . . . . . . . 825.4 Selected heterogeneous cluster configuration for each workload profile in Setup
B, with a computation limit of 160 cores . . . . . . . . . . . . . . . . . . . . . . . 825.5 Energy savings and performance for dynamic workload allocation of Setup A . 835.6 Energy consumption and execution time comparison between SLURM and op-
timized allocation for heavy, reference and light workload in Setup B . . . . . . 845.7 Comparison in energy consumption (KWh) for heavy, reference and light work-
load when using Slurm default allocation, optimized allocation and cooling con-trol for Setup B . . . . . . . . . . . . . . . . . . . . . . . . . . . . . . . . . . . . . . 86
6.1 Summary of optimizations for different elements of the architecture and abstrac-tion levels . . . . . . . . . . . . . . . . . . . . . . . . . . . . . . . . . . . . . . . . 91
6.2 Summary of properties for all architecture components in the e-Health application 926.3 Classification and main parameters for the tasks of the workload . . . . . . . . 936.4 Node lifetime for the different algorithms . . . . . . . . . . . . . . . . . . . . . . 956.5 Task classification for SPSS and SPEC tasks . . . . . . . . . . . . . . . . . . . . . 976.6 Selected heterogeneous cluster configuration for each workload . . . . . . . . . 1006.7 Summary of savings for each optimization . . . . . . . . . . . . . . . . . . . . . 1016.8 Overall energy savings (in kWh and percentage) for the whole architecture when
integrating all optimizations . . . . . . . . . . . . . . . . . . . . . . . . . . . . . . 101
XI

LIST OF TABLES
XII
List of Figures
1.1 Power consumption distribution in a typical data center. Taken from [159] . . . 31.2 Flovent software screenshot showing air distribution between hot and cold aisles 51.3 Main abstraction levels highlighted by hardware, server and data center scope 61.4 Overview of the proposed analysis and optimization system. . . . . . . . . . . . 91.5 Overview of the Ph.D. Thesis structure and chapter organization . . . . . . . . 12
2.1 Experimental setup and internal diagram of SPARC T3 server. . . . . . . . . . . 202.2 Decathlete server internal diagram. Taken from [79] . . . . . . . . . . . . . . . . 212.3 Processor temperature with different fan speed and utilization . . . . . . . . . . 232.4 Fan and leakage power for LoadGen running at 100% utilization . . . . . . . . . 232.5 Temperature-dependent CPU leakage model regression for both CPUs in the
system. . . . . . . . . . . . . . . . . . . . . . . . . . . . . . . . . . . . . . . . . . . 252.6 Temperature-dependent CPU leakage model validation for 128 copies of mcf
running on CPU0. . . . . . . . . . . . . . . . . . . . . . . . . . . . . . . . . . . . . 252.7 Dynamic CPU power vs. utilization for selected SPEC CPU workloads. . . . . . 262.8 Dynamic CPU power vs. IPC for 128 concurrent copies of selected SPEC CPU
workloads. . . . . . . . . . . . . . . . . . . . . . . . . . . . . . . . . . . . . . . . . 262.9 Server power vs. number of memory accesses for RandMem workload under
different fan speeds . . . . . . . . . . . . . . . . . . . . . . . . . . . . . . . . . . . 272.10 Steady-state temperature model and measured samples for three different fan
speeds. . . . . . . . . . . . . . . . . . . . . . . . . . . . . . . . . . . . . . . . . . . 282.11 Effect of ambient temperature on the leakage power plus fan power curve of mcf. . 282.12 Thermal time constant and maximum observed temperature under various fan
speeds . . . . . . . . . . . . . . . . . . . . . . . . . . . . . . . . . . . . . . . . . . 292.13 Leakage and fan speed power comparison between Intel and SPARC architectures. 302.14 Power consumption breakdown for SPARC and Intel server under various work-
loads and Low-Med fanspeed. . . . . . . . . . . . . . . . . . . . . . . . . . . . . . 30
3.1 Fan and leakage power for various workloads. . . . . . . . . . . . . . . . . . . . 353.2 Fan speed selection procedure for steady-state. . . . . . . . . . . . . . . . . . . . 373.3 Clustered vs distributed allocation schemes for 128 active threads. . . . . . . . . 393.4 Normalized EDP in clustered and distributed allocation schemes for SPEC CPU
and PARSEC benchmarks under various number of threads. . . . . . . . . . . . 403.5 Temperature sensor readings in Test-3 for the three different controllers. . . . . 453.6 Fixed speed, bang-bang, and proactive controller temperature and RPM traces
for workload profile 1. . . . . . . . . . . . . . . . . . . . . . . . . . . . . . . . . . 463.7 Normalized CeSViMa cooling plus IT power for the workload execution under
various PUE scenarios . . . . . . . . . . . . . . . . . . . . . . . . . . . . . . . . . 48
4.1 Typical raised-floor air-cooled data center layout . . . . . . . . . . . . . . . . . . 534.2 CPU temperature prediction diagram. CPU temperature is predicted given past
data measurements of various magnitudes (data window) and past CPU tem-perature predictions. . . . . . . . . . . . . . . . . . . . . . . . . . . . . . . . . . . 57
4.3 Training samples used for CPU temperature modeling . . . . . . . . . . . . . . 61
XIII

LIST OF FIGURES
4.4 CeSViMa data room layout. Models are developed for Power7 nodes 1,4 and 7at high c02 in racks 1 and 4. . . . . . . . . . . . . . . . . . . . . . . . . . . . . . . 62
4.5 CPU temperature error evolution for real and mixed models under differentpremature convergence prevention techniques: i) no technique applied, ii) ROG+ SDT keeping 5% of equal individuals and iii) ROG + SDT randomizing allequal individuals. . . . . . . . . . . . . . . . . . . . . . . . . . . . . . . . . . . . . 65
4.6 CPU temperature error evolution for real and mixed models under ROG + SDT5% when fitness is biased vs. not biased. . . . . . . . . . . . . . . . . . . . . . . . 65
4.7 Training and test set CPU temperature prediction vs. real measurements . . . . 664.8 Zoomed-in CPU temperature modeling comparison between Grammatical Evo-
lution (GE), ARMA(1,4) and N4sid models . . . . . . . . . . . . . . . . . . . . . 674.9 10-minute inlet temperature prediction in the reduced scenario for a mixed
model with SDT Packing 5% and simplified grammar . . . . . . . . . . . . . . . 684.10 Data center inlet temperature modeling for various racks . . . . . . . . . . . . . 694.11 Data center CPU temperature modeling for various servers in different racks . 69
5.1 Diagram of data center resource management principles . . . . . . . . . . . . . 765.2 Energy Characterization of the tasks for Setup A: 3-architectures, IT control only . 805.3 Energy for SPEC CPU 2006 benchmarks and SPSS in the servers of Setup B: 2-
architectures, IT + cooling control . . . . . . . . . . . . . . . . . . . . . . . . . . . . 815.4 Distribution of arrivals for high, medium and low loads for Setup B: 2-architectures,
IT + cooling control . . . . . . . . . . . . . . . . . . . . . . . . . . . . . . . . . . . . 815.5 Running and waiting jobs in Intel only scenario for various loads with different
number of coordinator nodes . . . . . . . . . . . . . . . . . . . . . . . . . . . . . 845.6 Evolution of the air-conditioning COP with room temperature . . . . . . . . . . 855.7 Cooling power for different air supply temperatures . . . . . . . . . . . . . . . . 855.8 IT power and CPU temperature for fully utilized server at various air supply
temperatures . . . . . . . . . . . . . . . . . . . . . . . . . . . . . . . . . . . . . . . 86
6.1 Overview of the proposed architecture for energy optimization in e-Health sce-narios . . . . . . . . . . . . . . . . . . . . . . . . . . . . . . . . . . . . . . . . . . . 90
6.2 Overview of the proposed energy analysis and optimization system for popu-lation analysis applications . . . . . . . . . . . . . . . . . . . . . . . . . . . . . . 91
6.3 Workload structure for the Data Dependant layer and the Application Depen-dant layer . . . . . . . . . . . . . . . . . . . . . . . . . . . . . . . . . . . . . . . . 94
6.4 Power dissipated in Shimmer during sampling, processing and transmission [100] 946.5 Correlation between IPC ∗ Time and LLC metric (left axis, lines) and Energy
(right axis, bars) . . . . . . . . . . . . . . . . . . . . . . . . . . . . . . . . . . . . . 976.6 Clusters obtained in k-means classification for SPSS and SPEC . . . . . . . . . . 976.7 Percentage of energy and time savings for each number of nodes and α =
{0.8, 1.0, 1.2} under the reference workload . . . . . . . . . . . . . . . . . . . . . 99
XIV
1. Introduction
Yo se un himno gigante y extranoque anuncia en la noche del alma una aurora,y estas paginas son de ese himnocadencias que el aire dilata en las sombras.
— Gustavo A. Becquer, Rima I (Rimas y Leyendas)
This introductory Chapter presents the motivation, problem context and a brief state of theart on the work presented in this Ph.D. Thesis. Besides, the main contributions of this workare highlighted and an overview of the structure of this Ph.D. Thesis is also provided.
1.1 Motivation and Context
Data centers often comprise thousands of enterprise servers that typically serve millions ofusers globally in a 24-7 fashion. The increasing demand for computing resources has recentlyfacilitated the rapid proliferation and growth of data center facilities. Nowadays, these infras-tructures can be found in every sector of the economy. They provide the required infrastruc-ture for the execution of a wide range of applications and services including social and busi-ness networking, Webmail, Web search, electronic banking, Internet marketing, distributedstorage, High Performance Computing (HPC), etc. In the last years, population monitoring ap-plications (such as e-Health applications or Ambient Intelligence), E-science and applicationsfor Smart Cities have experienced a significant development, mainly because of the advancesin the miniaturization of processors and the proliferation of embedded systems in many differ-ent objects and applications. Next-generation systems are composed by a large set of nodes,distributed among the population. Data obtained by these sensor nodes are communicatedto the embedded processing elements by means of wireless connections. Huge sets of datamust be processed, stored and analyzed. The need to deal efficiently with such computing-intensive tasks, and the increasing demand for higher computer resources has facilitated therapid proliferation and growth of data center facilities.
For decades, data centers have focused on performance, defined only as raw speed. Exam-ples include the TOP500 list of the world’s fastest supercomputers1, which calculates the speedmetric as floating-point operations per second (flops), and the annual Gordon Bell Awardsfor Performance and Price/Performance at the Supercomputing Conference2. However, rawspeed has increased tremendously over the past decade without relative and proportional en-ergy efficiency. In 2007, although there had been a 10.000-fold increase in speed since 1992,performance per watt was only improved 300-fold and performance per square foot only 65-fold. This huge performance improvement is mainly due to increases in three different dimen-sions: the number of transistors per processor, each processors operating frequency, and thenumber of processors in the system. Collectively, these factors yield an exponential increasein power needs of data centers that is not sustainable. The focus on just speed has let otherevaluation metrics go unchecked. Data centers consume a huge amount of electrical powerand generate a tremendous amount of heat.
1http://www.top500.org2http://www.sc-conference.org
1

1. Introduction
During 2008 world power consumption exceeded US $30 billion [136] when an averagedata center consumed as much energy as 25,000 households [85]. About 15% of this costsare due to removing the heat generated throughout the infrastructure [19]. The situation iscritical since the numbers are growing. Only in 2010, worldwide data center consumptionreached 1.5% of global energy, having increased by 56% since 2005, and reaching a densityof 60 kW/m2 [87]. In year 2012, global data center power consumption increased by 43% to38GW. A further rise of 17% to 43GW was estimated in 2013 [158].
When data centers are placed in urban areas, they face problems related to the insufficientenergy provided by the grid. Raskino et al. [99] estimate that at least a 50% of urban Data Cen-ters have achieved the maximum capacity of the grid. Major players in the data center andhigh-end computing markets often negotiate energy deals with electricity suppliers to buildor upgrade power substations, near or immediately next to their computing facilities. Alter-natively, when not enough power infrastructures can be built at or near computing facilities,many companies move their computing facilities to the power source, e.g.,Google [3], [101]and Microsoft [156].
In addition to the economic impact of excessive energy consumption, the environmen-tal impact has also affected the data center community. The heat and the carbon footprintemanated from cooling systems are dramatically harming the environment. According toMullins [115], U.S. data centers use about 59 billion kWh of electricity, exceeding US $4.1billion and generating 864 million metric tons of CO2 emissions released into the atmosphere,roughly a 2% of total worldwide emissions.
Both research and industry have recently proposed several approaches to tackle the powerconsumption issue in data center facilities. Industry has begun to shift their goal from perfor-mance to energy, reporting not only FLOPS, but FLOPS per watt and measuring the averagepower consumption when executing the LINPACK (HPL) benchmark [95]. This benchmark isused to elaborate the Green500 list 3, which ranks computers from the TOP500 list of super-computers in terms of energy efficiency. Cooling is one of the major contributors to overalldata center power consumption, representing from 30% to 50% of the total cost. Accordingto Amazon data centers estimations [70], expenses related to operational costs of the serversreach 53% of the budget, while energy costs add up to 42%, which are broken down into cool-ing (19%) and power consumption of the infrastructure (23%).
Reference companies around the world such as Google, IBM or Amazon are implementingmeasures to make their data centers more efficient, and begin to measure the Power UsageEffectiveness (PUE) of their facilities. PUE is one of the most representative metrics, and con-sists in the facility’s total power consumption divided by the computational power used onlyby servers, storage systems and network gear. A PUE close to 1 means that the data center isusing most of the power for the computing infrastructure instead of being lost or devoted tocooling devices.
According to a report by the Uptime Institute, average PUE improved from 2.5 in 2007 to1.89 in 2012, reaching 1.65 in 2013 [102]. This average PUE values are still far from the 1.1 to1.3 obtained in data centers using the most efficient free cooling techniques [37], that allow toreach values as low as the 1.13 achieved by Google Data Centers [66]. Moreover, according toKoomey [87], PUE in year 2011 ranged from 1.36 to 3.6, implying there were still a very largenumber of data centers using inefficient cooling mechanisms.
The current energy and environmental cost trends of data centers are thus unsustainable,and affect both the computing power used by IT equipment and the associated data room cool-ing costs. It is critically important to develop data center-wide power and thermal softwaremanagement solutions that improve the energy efficiency of data centers to place them on amore scalable curve. In the next subsections, we present an analysis on the current trends intrying to reduce power consumption at the server and the data center level.
This PhD Thesis proposes the development of proactive and reactive thermal and energy-aware optimization techniques to leverage energy efficiency in Data Centers. This work de-velops energy models and uses the knowledge about the energy demand of the workload
3http://www.green500.org
2
1.2. Overview of the State-of-the-Art
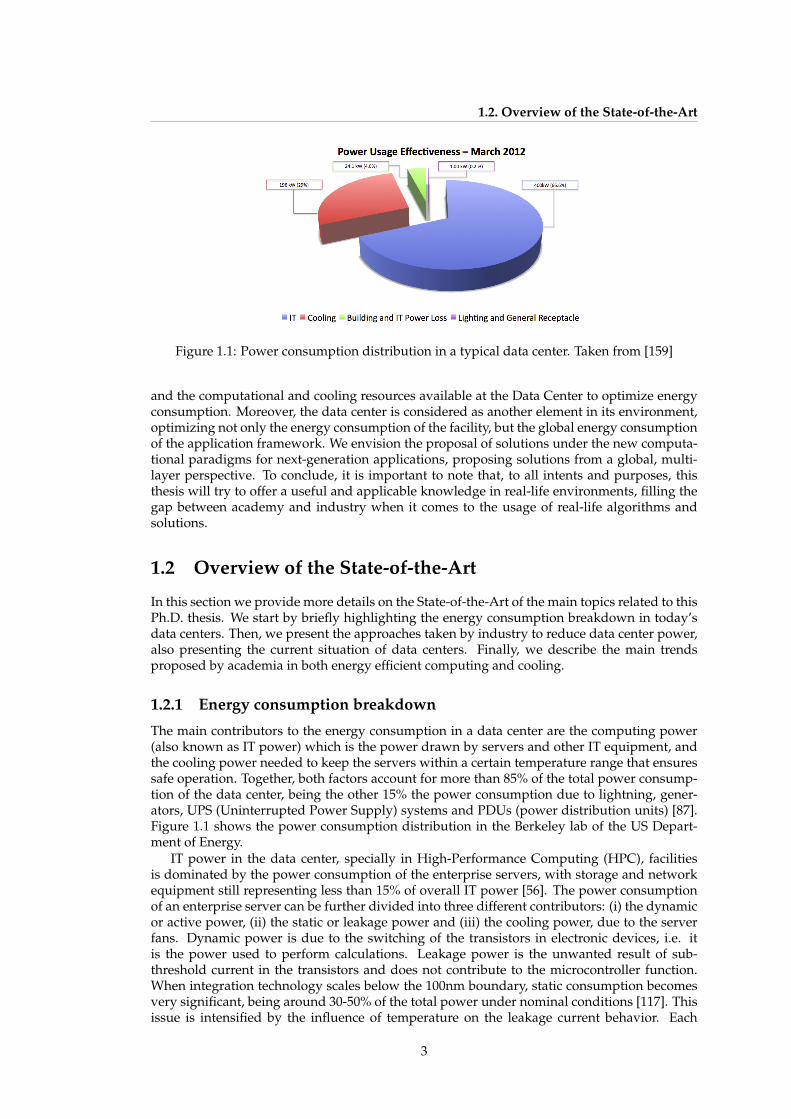
Figure 1.1: Power consumption distribution in a typical data center. Taken from [159]
and the computational and cooling resources available at the Data Center to optimize energyconsumption. Moreover, the data center is considered as another element in its environment,optimizing not only the energy consumption of the facility, but the global energy consumptionof the application framework. We envision the proposal of solutions under the new computa-tional paradigms for next-generation applications, proposing solutions from a global, multi-layer perspective. To conclude, it is important to note that, to all intents and purposes, thisthesis will try to offer a useful and applicable knowledge in real-life environments, filling thegap between academy and industry when it comes to the usage of real-life algorithms andsolutions.
1.2 Overview of the State-of-the-Art
In this section we provide more details on the State-of-the-Art of the main topics related to thisPh.D. thesis. We start by briefly highlighting the energy consumption breakdown in today’sdata centers. Then, we present the approaches taken by industry to reduce data center power,also presenting the current situation of data centers. Finally, we describe the main trendsproposed by academia in both energy efficient computing and cooling.
1.2.1 Energy consumption breakdown
The main contributors to the energy consumption in a data center are the computing power(also known as IT power) which is the power drawn by servers and other IT equipment, andthe cooling power needed to keep the servers within a certain temperature range that ensuressafe operation. Together, both factors account for more than 85% of the total power consump-tion of the data center, being the other 15% the power consumption due to lightning, gener-ators, UPS (Uninterrupted Power Supply) systems and PDUs (power distribution units) [87].Figure 1.1 shows the power consumption distribution in the Berkeley lab of the US Depart-ment of Energy.
IT power in the data center, specially in High-Performance Computing (HPC), facilitiesis dominated by the power consumption of the enterprise servers, with storage and networkequipment still representing less than 15% of overall IT power [56]. The power consumptionof an enterprise server can be further divided into three different contributors: (i) the dynamicor active power, (ii) the static or leakage power and (iii) the cooling power, due to the serverfans. Dynamic power is due to the switching of the transistors in electronic devices, i.e. itis the power used to perform calculations. Leakage power is the unwanted result of sub-threshold current in the transistors and does not contribute to the microcontroller function.When integration technology scales below the 100nm boundary, static consumption becomesvery significant, being around 30-50% of the total power under nominal conditions [117]. Thisissue is intensified by the influence of temperature on the leakage current behavior. Each
3

1. Introduction
passing day fan power is becoming a more important contributor to overall server power,accounting for up to 14% of overall data center power [80].
1.2.2 Industry approaches to energy efficiency
Both research and industry have recently proposed several approaches to tackle the powerconsumption issue in data center facilities. However, their approaches have been very differ-ent. For instance, industry has focused in the reduction of the cooling costs of the data center,diminishing the PUE value of this facilities. Traditionally, cooling costs accounted for 30% to50% of overall data center power; nowadays, we can find data centers with PUE values aslow as 1.02 or 1.03 [66]. This efficiency values are achieved by improving cooling performancevia hot or cold aisle containment and closed-coupled cooling. These techniques minimize airrecirculation in the data center by placing cooling units as close as possible to the IT load theyintend to cool, and containing the heat exhaust so that heated air cannot recirculate to theinlet of servers. Almost a 20% of large scale data centers are nowadays implementing thiskind of solutions, i.e. in-row or in-rack cooling techniques that cool IT equipment to increaseefficiency [102]. In all previous cases, cooling is performed by means of the heat exchange be-tween air and liquid (water or a refrigerant). Thus, an important percentage of overall coolingenergy is devoted to the chillers and towers that extract heat from the refrigerant. Because ofthis, to reduce the power consumption needed to extract the heat there is a generalized ten-dency to build data centers in cold areas of the world (Greenland, Finland, Sweden, etc.) inorder to be able to apply free cooling techniques and reduce the power consumption due towater chilling [82].
Because the previous approaches rely on renewing the cooling equipment, rising capitalexpenses in the data center, another very common technique consists on using higher dataroom ambient temperatures [102]. The performance of cooling subsystems increases in tandemwith room temperature and heat exhaust, improving cooling efficiency.
However, higher server inlet temperature has some drawbacks, the most important being:i) the possible harmful effects on reliability, ii) the reduction on the safety margins of serversand iii) the potential increase in IT power consumption.
There is much literature on the reliability effects of increased temperature at the server anddata center level. Solutions to the energy problem must not suppose a decrease in the lifetimeof servers or in their Mean Time To Failure (MTTF). A report by the Uptime Institute[150]showed that for every 10◦C degrees of temperature in excess of 21◦C in the inlet temperatureof servers, long-term reliability could be reduced by 50%. Recent research by El-Sayed et al. [54]shows that the effect of high data center temperatures on reliability is smaller than what hasbeen assumed. However, high temperatures at the chip level have irreversible adverse effectson the chips, such as electromigration that reduce the lifetime of the chip [14]. To preventharmful effects over servers due to high temperatures, enterprise servers are configured withCPU critical temperature thresholds, so that the whole server shuts down when there is a CPUthermal redlining.
Moreover, as the ambient temperature of the data center and CPU temperature increase,the safety margin for the server thermal shutdown is decreased. Data room modeling is stillan open issue, as the only feasible ways to model the thermal behavior of the data room andbe able to predict the inlet temperature of the servers are: i) by deploying temperature sen-sors in the data room that take measurements, or ii) by performing very time consuming andexpensive Computational Fluid Dynamics (CFD) simulations. CFD software, such as Men-tor Graphics Flovent [61] (see Figure 1.2), is the most common technique and uses numericalmethods to analyze the data room and model its behavior. However these simulations do notoften match the real environments and must be re-run every time the data center topologychanges.
The urge for reducing PUE, even by increasing room temperatures, has let other metricsgo unchecked. Lower PUE values imply an increase in cooling efficiency; however, PUE isonly a metric of cooling efficiency, not of overall data center efficiency. As such, it does notaccount for the aggregate fan power and CPU leakage power that exhibit a significant increase
4

1.2. Overview of the State-of-the-Art
Figure 1.2: Flovent software screenshot showing air distribution between hot and cold aisles
when room temperature rises. Moreover, PUE is a very sensitive metric to parameters suchas the climate and latitude at which the data center is located. Hence, the reliability of PUEas an energy-efficiency metric decreases as the leakage and fan power continue to increase innext-generation servers.
In summary, there exists a wide heterogeneity in terms of infrastructure in current datacenters. The vast majority of small- and medium-scale data centers hosts volume servers,achieving medium-low power densities (i.e. around 5kW per rack), and, thus, use traditionalcooling techniques based on air-cooled raise-floor data rooms without hot-cold aisle contain-ment. These facilities usually have PUE values above 1.8. On the other hand, high densitydata centers hosting power-hungry equipments have already migrated to more efficient cool-ing techniques, obtaining high efficiency in the cooling subsystem.
1.2.3 Energy-efficient computing
In academia, there is a number of different techniques to reduce the energy cost and powerdensity of IT equipment at different scopes: (i) hardware (ii) server and (iii) data center level.Optimizations within these scopes can be further divided into different abstractions levels asshown on Figure 1.3.
Hardware scope
The main achievements in energy-efficiency at the technology level mainly focus on technol-ogy scaling, voltage reduction, chip layout optimization and capacitance minimization [52].Duarte et al. [30] showed that scaling down technology reduces energy consumption consid-erably. The reduction to 0.07µm, 0.05µm and 0.035µm yielded savings of 8%, 16% and 23%respectively. Other techniques such as timing speculation have increased energy efficiencyby 13% for high-performance low-power CMOS and by 32% using ultra-low power CMOStechnology [88].
Logic-level design strategies focus on optimizing switching activity, minimizing switchingcapacitance [22]; via improving clock management and accurately modeling delay [120] orvia power gating techniques [6]. The PowerNap mechanism [103], featuring per-core powergating, has shown the reduction of server idle power decreasing power requirements by about20% when the processor is halted.
At the circuit-level, several techniques propose a more energy-efficient use of pipelines [144],or the reduction of logic depth between registers to increase pipeline stages [81]. Other ap-
5

1. Introduction
HARDWARESCOPE
SERVERSCOPE
DATA CENTER SCOPE
RM & Scheduling RM & Scheduling RM & SchedulingApplication Application ApplicationMiddleware Middleware Middleware
Run-time system Run-time system Run-time systemCompiler Compiler Compiler
Architectural Architectural ArchitecturalCircuit Circuit CircuitLogic Logic Logic
Technology Technology Technology
Figure 1.3: Main abstraction levels highlighted by hardware, server and data center scope
proaches aim at the reduction of energy consumption in the system bus. Research by Brahmb-hatt et al. [31] proposes an adaptive bus encoding algorithm to improve energy savings byaround 24%.
Server scope
From the server scope, we find optimization proposals at three different levels: i) architec-ture, ii) compiler and iii) run-time. Most of these techniques are inherited from the embeddedsystem and MPSoCs world, and only very recently have started to be applied to tackle theproblem of energy consumption in enterprise servers.
Power savings are typically achieved at the architectural-level by optimizing the balanceof the system components to avoid wasting power. Compared to other resources, CPU is themain contributor to power consumption [110], and, significant research focuses on increas-ing CPU energy efficiency. However, the power consumption breakdown of recent entepriseservers shows that the impact of memory power, disk and fans is not negligible, and thatno single component dominates the total power consumption of the server [103]. To this end,some authors have tried to dynamically regulate CPU power and frequency to optimize powerconsumption [29], [92]. Deng et al. [49] apply DVFS to memory management achieving 14%of energy savings. Pinheiro et al. [35] suggest the use of multi-speed disks, so that disks couldbe slowed down to reach lower energy consumption during low-load periods. As reported inthe research by Heo et al. [76], the usage of DVFS combined with Feedback On/Off techniquescan yield total power savings that reach 84% in low-load systems and 55% when workload isthe highest possible.
The goal of compiler-level optimizations is to generate code that reduces the energy con-sumption of the processor with or without a penalty in performance. In general, these ap-proaches rely on code transformation and optimization, profiling and annotation [59]. Workby Simunic et al. [83], [163] optimizes the implementation of an MP3 audio decoder for em-bedded systems, obtaining an energy consumption decrease of 77% over the original audiodecoding.
Several techniques can be used to reduce energy efficiency during the execution of theworkload, i.e. at runtime. In the field of Multiprocessor System on Chip (MPSoC) significantimprovements have been reached at run-time by proposing energy-aware workload schedul-
6
1.2. Overview of the State-of-the-Art
ing policies [167]. Several works use statistical models that allow run-time system-wide pre-diction of server power consumption [50], [93]. A prediction-based scheme for run-time adap-tation is presented by Curtis-Maury et al. [47] improving both performance and energy savingsby up to a 40%.
Data center scope
Optimization within the data center scope can also be further divided into three different ab-straction levels: i) middleware, ii) application and iii) resource management.
One of the major sources of inefficiency in data centers comes from the lack of proportional-ity in server energy consumption. Recent studies show that tipically, an idle server consumesup to 66% of the total power consumption [39]. Thus, maximizing resource utilization re-sults in energy savings due to the high power consumption for idle and underutilized servers.At the middleware level, the usage of virtualization and consolidation techniques increase theoverall utilization of servers and achieving up to 23% energy savings [41], [154]. Together withmachine turn-off policies, dynamic consolidation techniques can achieve up to 45% energysavings for cloud computing workloads without SLA violations [21]. However, the specificdemands of HPC clusters, where performance is a key aspect, often mismatch the assump-tions of virtualization. Virtualization techniques introduce an overhead, implying a certainperformance degradation. Virtualization for HPC clusters is still a very new area of research,but work so far highlights the possible future benefits of virtualization in HPC [106]. Han-dling the operating server set can be useful when considering the inherent periodic behaviorof workloads through time, and is a common technique used in several data centers. In thatsense, the totality of the resources might only be used at concrete time periods or at certaintimes of the day [24]. In HPC facilities, such as CeSViMa data center, it is common to turnoff unused server during low utilization periods. A periodic workload behavior is usually ob-served in HPC clusters, as can be seen when observing workloads from the Parallel WorkloadsArchive 4.
Optimizations at the application level aim to use the knowledge about the particular ap-plications that compose the workload of the data center to optimize energy efficiency. Forinstance, PowerPack [63] uses circuit-level application profiling to determine how and wherepower is consumed. In grid computing, approaches have also been made to efficiently dis-tribute compute-intensive parallel applications [62].
Resource management is a well known concept in the data center world and refers to theefficient and effective deployment of computational resources of the facility where they areneeded. Several algorithms and methodologies can be found in the literature to minimizeenergy consumption via allocation and scheduling techniques based on: i) load-balancing [34],[51], ii) linear programming techniques [183], iii) controller-based approaches [64], iv) greedyalgorithms [118] or v) other heuristics [182].
In general, the previous approaches do not consider an accurate power modeling of thecomputing resources, and results are tested in simulation space, not in real-life environmentsor with real production tools. Moreover, these solutions focus on minimizing IT power, butdisregard the data center cooling and the data room environment.
1.2.4 Energy-efficient cooling
Energy-efficient cooling strategies try to minimize the cooling costs, either by means of i)thermal-aware or ii) cooling-aware workload scheduling.
Thermal-aware workload scheduling aims at the reduction of hot-spots in servers, andparticularly in their CPU’s) and data centers, thus lowering the cooling effort and increasingenergy efficiency. This is the case for research on temperature-aware floor-planning of cores inMPSoCs [72], [78], which is devoted to getting the optimum floorplan that reduces the maxi-mum temperature of the chip. Hot-spots can also be reduced by means of temperature-aware
4http://www.cs.huji.ac.il/labs/parallel/workload/
7

1. Introduction
task allocation and scheduling algorithms [166] at the CPU level, at the operating-systemlevel [42], and even at the cluster level [27].
The goal of cooling-aware workload scheduling is to be able to reduce the cooling costsof the data center via scheduling techniques, allowing to increase the air supply temperatureof CRAC units and, thus, saving energy in the cooling subsystem. In traditional air-cooledraised-floor data centers, energy efficiency from the cooling perspective can exploit two dif-ferent facts: (i) placing the workload in areas that are more efficient to cool [114] or areas thatneed less cooling [165], also taking into account temperature imbalances [112]; or (ii) max-imizing cooling efficiency by increasing CRAC air supply temperature [152] or minimizingheat recirculation [151].
These approaches try to maximize the air supply temperature of CRAC units. For thatpurpose, they generally use CFD software to model the inlet temperature of servers in anhomogeneous data center or use simple linear models to describe heat interference acrossservers. However, the goal of these policies is not to reduce overall energy consumption of thedata center (i.e. cooling and IT power) but to minimize cooling power only. Moreover, theybase their optimizations on inlet temperature, disregarding CPU temperature and its effect onleakage power and fan power consumption.
1.2.5 Joint strategies for IT and cooling
At the server level, joint workload and cooling strategies consider fan control together withscheduling in a multi-objective optimization approach [16]. Work by Chan et al. [38] makes useof a joint energy, thermal and cooling management technique to reduce the server cooling andmemory energy costs. However, these contributions are not able to split the contributions ofleakage and cooling power, so their minimization strategy is unaware of the leakage-coolingtradeoffs.
At the data center level, research by Gutpa et al. [2] presents the data center as a distributedCyber-Physical System (CPS) in which both computational and physical parameters can bemeasured with the goal of minimizing energy consumption. However, the validation of theseworks is kept in the simulation space, and solutions so far are not applied in real data centerscenarios.
1.2.6 Trends and open issues
The impact of energy optimization in an environment that handles so impressively high fig-ures in both energy and economic costs as data centers, has motivated many researchers tofocus their academic work on proposing solutions to this challenge.
A great body of research has been devoted to addressing energy efficiency at differentabstraction levels. We observe that the benefits in terms of energy savings raise for higherabstraction levels. However, there are still open challenges at the server and data center ab-straction level that need further effort. Today’s data centers exhibit many degrees of hetero-geneity in their resources. The high costs of IT equipment promote the co-existence of differentgenerations of servers in data center rooms and thus, the heterogeneity in terms of hardware.However, current research at the resource management level does not accurately tackle re-source heterogeneity, which continues to be an open issue.
Workload management in the state-of-art lacks of accurate, flexible and scalable powerand energy models that support the proposed optimizations. These models need to be ableto explain the effect of temperature on power, as well as the leakage-cooling tradeoffs at theserver level, and the impact at the room level. Current data room models are based on timecostly CFD simulation techniques or on unrealistic static linear models, that often do not matchthe real dynamics of the data room and are not robust to changes. Most contributions lack avalidation in presently-shipping enterprise servers or data center scenarios.
There exists a lack of high-level orthogonal optimization techniques that can be appliedtogether to minimize overall energy consumption. Joint workload and cooling resource allo-cation (i.e. proactively and jointly optimizing the cooling and computational resources of the
8
1.3. Problem formulation and optimization paradigm
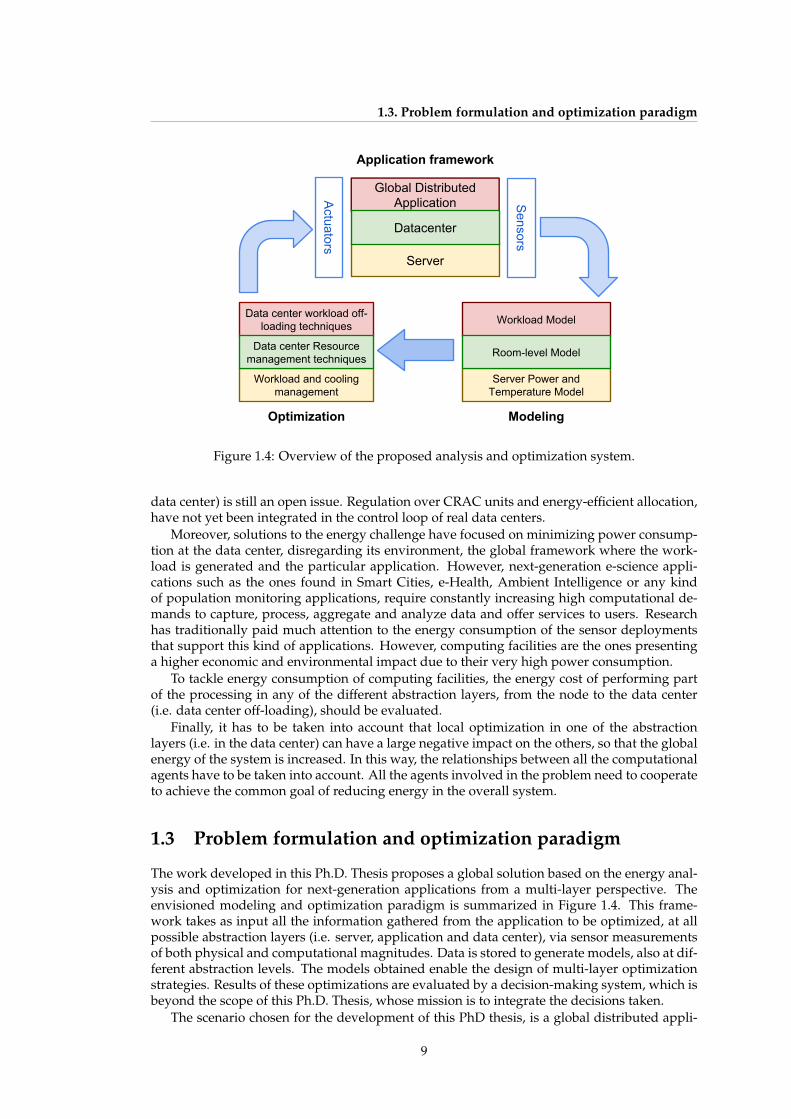
Workload Model
Sensors
Actuators
Server Power and Temperature Model
Workload and cooling management
Server
Global Distributed Application
Application framework
Data center workload off-loading techniques
ModelingOptimization
Datacenter
Room-level ModelData center Resource management techniques
Figure 1.4: Overview of the proposed analysis and optimization system.
data center) is still an open issue. Regulation over CRAC units and energy-efficient allocation,have not yet been integrated in the control loop of real data centers.
Moreover, solutions to the energy challenge have focused on minimizing power consump-tion at the data center, disregarding its environment, the global framework where the work-load is generated and the particular application. However, next-generation e-science appli-cations such as the ones found in Smart Cities, e-Health, Ambient Intelligence or any kindof population monitoring applications, require constantly increasing high computational de-mands to capture, process, aggregate and analyze data and offer services to users. Researchhas traditionally paid much attention to the energy consumption of the sensor deploymentsthat support this kind of applications. However, computing facilities are the ones presentinga higher economic and environmental impact due to their very high power consumption.
To tackle energy consumption of computing facilities, the energy cost of performing partof the processing in any of the different abstraction layers, from the node to the data center(i.e. data center off-loading), should be evaluated.
Finally, it has to be taken into account that local optimization in one of the abstractionlayers (i.e. in the data center) can have a large negative impact on the others, so that the globalenergy of the system is increased. In this way, the relationships between all the computationalagents have to be taken into account. All the agents involved in the problem need to cooperateto achieve the common goal of reducing energy in the overall system.
1.3 Problem formulation and optimization paradigm
The work developed in this Ph.D. Thesis proposes a global solution based on the energy anal-ysis and optimization for next-generation applications from a multi-layer perspective. Theenvisioned modeling and optimization paradigm is summarized in Figure 1.4. This frame-work takes as input all the information gathered from the application to be optimized, at allpossible abstraction layers (i.e. server, application and data center), via sensor measurementsof both physical and computational magnitudes. Data is stored to generate models, also at dif-ferent abstraction levels. The models obtained enable the design of multi-layer optimizationstrategies. Results of these optimizations are evaluated by a decision-making system, which isbeyond the scope of this Ph.D. Thesis, whose mission is to integrate the decisions taken.
The scenario chosen for the development of this PhD thesis, is a global distributed appli-
9
1. Introduction
cation framework for next-generation E-science applications such as the ones found in SmartCities, e-Health or Ambient Intelligence. These applications require constantly increasing highcomputational demands in order to capture, process, aggregate and analyze data and offerservices to users. Next-generation systems are composed by a large set of nodes, distributedamong the population. Data obtained by these sensor nodes are communicated to the em-bedded processing elements by means of wireless connections. Huge sets of data must beprocessed, stored and analyzed. In order to deal efficiently with such computationally inten-sive tasks, the use of data centers is devised.
To this end, the scenario chosen for the development of energy-aware techniques at thedata center level is a dedicated, non-virtualized, High-Performance Computing (HPC) datacenter. We assume this data center may be composed of different generations of servers, i.e. ithas a certain degree of heterogeneity in the IT equipment. We assume a traditional hot-coldaisle data center layout with CRAC-based cooling. In particular, at the data center level weconsider a raised-floor air-cooled data center where cold air is supplied via the floor plenumand extracted in the ceiling.
Without loss of generality, we propose the “Centro de Supercomputacion y Visualizacion deMadrid” (CeSViMa) 5 data center as a case study scenario for this PhD Thesis. CeSViMa is aninstitution belonging to Universidad PolitA c©cnica de Madrid that hosts the Magerit super-computer, a cluster composed of Intel Xeon and Power7 processors holding a total amountof 3920 processor and 7840GB of RAM. The data room is composed of 10 racks distributed ina hot/cold aisle scheme with raised-floor air-cooling. CeSViMa uses an open-source resourcemanagement software tool (SLURM) used to allocate the incoming workload to the computingnodes. The applications run in CeSViMa are, in general, CPU and memory intensive analysisand optimization applications performed by researchers.
However, the validation of the models and optimizations proposed in this PhD thesis arenot limited to the CeSViMa case study scenario. Several server architectures are tested bymeans of the monitoring and modeling of various presently-shipping enterprise servers. Also,at the data center scope other reduced scenarios are used to test the proposed optimizationpolicies.
1.4 Contributions of this Ph.D. Thesis
The main goal of this Ph.D. Thesis is the development of proactive and reactive thermal-awareoptimization techniques to improve the energy efficiency and minimize the environmentalimpact of data centers. This research proposes the development of orthogonal modeling andoptimization techniques to be applied at different abstraction levels: server, data center andthe global distributed application framework. These techniques are applied from a holisticperspective taking into account the knowledge of the applications to be executed and both thecooling and computing resources at the Data Center.
Particularly, the main contributions of this PhD thesis can be described as follows:
• Modeling and optimization at the server level:
– The design of empirical models to estimate various power components in enter-prise servers (e.g static and dynamic power, CPU and memory power), validatedin presently-shipping servers. The methodology proposed enables the extension ofthese models to various heterogeneous architectures. Moreover, because of theirlow computational overhead, the models can be scaled to describe the room-levelbehavior.
– The analysis of the leakage vs. cooling power tradeoffs, showing the importance oftemperature-dependent leakage in server energy consumption. This Ph.D. Thesisalso studies the relationship among power, temperature, application characteristicsand workload allocation.
5http://www.cesvima.upm.es
10

1.5. Structure of this Ph.D. Thesis
– The proposal of optimization techniques that aim to jointly reduce the computingand cooling energy of the servers in a data center, by managing the server fans andthe workload scheduling. These optimizations are faced from two perspectives: (i)a reactive approach, based on exploiting dynamic workload profiling mechanisms,and (ii) a proactive perspective that exploits the energy models.
• Modeling and optimization at the data center level:
– The development of data center room level models, based on Machine Learningtechniques, able to work on runtime with low computational overhead, to describethe system from a high level of abstraction, as opposed to other techniques suchas CFD. The proposed models are flexible, and incorporate a variable number ofpower consumption sources from IT and cooling equipment. These models aretrained and tested with traces from a real data center scenario at the Centro deSupercomputacion y Visualizacion de Madrid (CeSViMa).
– The design of heterogeneity-aware proactive and reactive optimizations that aimto reduce the computing power of the data center by properly assigning workloadto computational resources. The techniques proposed rely on the knowledge ofthe applications to be executed and on the computational resources available. Theoptimization problem is solved by using Mixed Integer Linear Programming, andhas low performance overhead to work on runtime.
– This work proposes optimizations to reduce the cooling power of the data center.These techniques aim to provide energy savings by making the servers work on safethermal regions (from the reliability perspective) that allow to reduce the coolingcosts at the room level.
– The development of joint computational and cooling optimizations, that come froman efficient combination of the above mentioned techniques. The joint approachcombines the modeling and optimization techniques at both the server and room-level, and provides energy savings to a greater extent, increasing the savings thatcome from applying either computational or cooling optimizations independently.
• Global distributed application framework optimization: one of the main objectives ofthis Ph.D. Thesis is the development of global energy optimization policies that takeinto account the energy relationship between different abstraction layers. By manag-ing orthogonal optimization techniques applied at the server, data center and the globaldistributed framework of a particular application, we obtain the maximum benefit ofenergy-aware policies. In particular, we leverage the usage of data center off-loadingtechniques in a case study for e-Health scenarios and show the benefits of integration alloptimizations in a multi-layer approach.
1.5 Structure of this Ph.D. Thesis
The rest of the document of this Ph.D. thesis is organized as follows:
• Chapter 2 presents the techniques developed to model the different contributors to thepower consumption of enterprise servers (i.e.,static, dynamic and cooling power) andthe estimation of server CPU temperature. Modeling results are shown for a presently-shipping enterprise server.
• Chapter 3 proposes joint cooling and workload management strategies to minimize en-ergy consumption at the server level. Experimental results are carried out in the samesystems where modeling was performed.
• Chapter 4 raises the level of abstraction to the data center level, developing automaticroom modeling techniques based on metaheuristics to predict the parameters of the dataroom that have an impact on cooling energy and control.
11

1. Introduction
Optimization
Optimization
Model
Model
Server
Data Center Global distributed application framework
Optimization
Chapter 3
Chapter 2
Chapter 4
Chapter 5
Chapter 6
Figure 1.5: Overview of the Ph.D. Thesis structure and chapter organization
• Chapter 5 describes resource management optimization techniques based on applicationand heterogeneity awareness to reduce the energy consumption at the data center.
• Chapter 6 shows how the developed models and optimization strategies can be appliedin the framework of an e-Health application, and how our multi-layer approach yieldsimportant benefits to the energy minimization of the overall application.
• Chapter 7 summarizes the conclusions derived from the research that is presented inthis Ph.D. thesis, as well as the contributions to the state-of-the-art on energy efficiencyin data centers. The Chapter also includes a summary on future research directions.
Figure 1.5 provides the reader with an overview of the structure of this Ph.D. thesis andhow the Chapters are organized. As can be seen, Chapters are arranged from lower to higherabstraction level, and describe the different modeling and optimization techniques developedin this work.
1.6 Publications
The results of this PhD Thesis, together with other related research have been published ininternational conferences and journals. In this section we briefly present these publicationsand highlight the chapter in which the specific contributions can be found.
1.6.1 Journal papers
In terms of scientific publications, this Ph.D. thesis has generated the following articles ininternational journals:
• M. Zapater et al., “Ommited for blind review”, IEEE Transactions on Evolutionary Com-putation (TEVC), [Submitted, under review] [JCR Q1 IF=5.545] (Chapter 4 of this Ph.D.Thesis)
• M. Zapater, O. Tuncer, J. L. Ayala, et al., “Leakage-aware cooling management for im-proving server energy efficiency”, IEEE Transactions on Parallel and Distributed Systems(TPDS), 2014, ISSN: 1045-9219. DOI: 10.1109/TPDS.2014.2361519 [JCR Q1 IF=2.173](Chapters 2 and 3 of this Ph.D. Thesis)
• M. Zapater, P. Arroba, J. L. Ayala, et al., “A novel energy-driven computing paradigmfor e-health scenarios”, Future Generation Computer Systems, vol. 34, pp. 138–154, 2014,ISSN: 0167-739X [JCR Q1 IF=1.864] (Chapters 1 (paradigm) and 6 of this Ph.D. Thesis)
12

1.6. Publications
• M. Zapater, C. Sanchez, J. L. Ayala, et al., “Ubiquitous green computing techniques forhigh demand applications in smart environments”, Sensors, vol. 12, no. 8, pp. 10 659–10 677, 2012, ISSN: 1424-8220 [JCR Q1 IF=1.953] (Chapter 6 of this Ph.D. Thesis)
• M. Zapater, P. Arroba, J. M. Moya, et al., “A State-of-the-Art on energy efficiency intoday’s datacentres: researcher’s contributions and practical approaches”, Green ICT:Trends and Challenges, vol. 12, no. 4, pp. 67–74, 2011, [Awarded best paper of the year2011.], ISSN: 1684-5285
1.6.2 Conference papers
Also, this Ph.D. thesis has generated the following articles in international peer-reviewed con-ferences:
• M. Zapater, J. L. Ayala, and J. M. Moya, “Proactive and reactive thermal aware opti-mization techniques to minimize the environmental impact of data centers”, in DesignAutomation Conference, ser. DAC’14, [PhD Forum], 2014 [Core A conference]
• M. Zapater, J. L. Ayala, J. M. Moya, et al., “Leakage and temperature aware server controlfor improving energy efficiency in data centers”, in DATE’13, 2013 [Core B conference](Chapters 2 and 3 of this Ph.D. Thesis)
• M. Zapater, J. L. Ayala, and J. M. Moya, “Leveraging heterogeneity for energy min-imization in data centers”, in CCGRID’12, 2012 [Core A conference] (Chapter 5 of thisPh.D. Thesis)
• M. Zapater, J.-M. de Goyeneche, J. M. Moya, et al., “Thermal-Aware optimization ofheterogeneous systems”, in 26th Conference on Design of Circuits and Integrated Systems,ser. DCIS’11, Nov. 2011 (Chapter 5 of this Ph.D. Thesis)
• M. Zapater, J. L. Risco, J. L. Ayala, et al., “Combined Dynamic-Static approach forThermal-Awareness in heterogeneous data centers”, in Innovative Architecture for FutureGeneration High Performance (IWIA), 2010 International Workshop on, ser. IWIA’10. 2010,pp. 75–82 (Chapter 5 of this Ph.D. Thesis)
1.6.3 Book chapters
This Ph.D. thesis has generated the following book chapters:
• M. Zapater, J. L. Ayala, and J. M. Moya, “Energy-aware policies in ubiquitous computingfacilities”, in Cloud Computing with e-Science Applications, O. Terzo and L. Mossuca, Eds.,CRC Taylor & Francis, 2014, pp. 265–284
• M. Zapater, J. L. Ayala, and J. Moya, “GreenDisc: a HW/SW energy optimization frame-work in globally distributed computation”, in Ubiquitous Computing and Ambient Intelli-gence, ser. Lecture Notes in Computer Science, J. Bravo, D. Lopez-de Ipina, and F. Moya,Eds., Springer Berlin Heidelberg, 2012, pp. 1–8 [Chapters 1 (paradigm) and 6 of this Ph.D.Thesis]
1.6.4 Other publications
Finally, the author has also contributed in the following articles in international peer-reviewedconferences and journals, not specifically related to the contents of this Ph.D. Thesis:
• M. Zapater, D. Fraga, P. Malagon, et al., “Self-organizing maps versus growing neuralgas in detecting anomalies in data centers”, Logic Journal of the IGPL, 2015, [In Press. Toappear in 2015] [JCR Q1 IF=1.136]
13

1. Introduction
• J. M. Colmenar, A. Cuesta, Z. Bankovic, et al., “Comparative study of meta-heuristic 3Dfloorplanning algorithms”, Neurocomputing, 2014, [In Press. To appear in 2014] [JCR Q1IF=2.005]
• P. Arroba, J. L. Risco-Martın, M. Zapater, et al., “Evolutionary power modeling for high-end servers in cloud data centers”, in Mathematical Modelling in Engineering & HumanBehaviour, 2014
• P. Arroba, J. L. Risco-Martın, M. Zapater, et al., “Server power modeling for Run-Timeenergy optimization of cloud computing facilities”, in International Conference on Sustain-ability in Energy and Buildings, ser. SEB’14, 2014
• P. Arroba, M. Zapater, J. L. Ayala, et al., “On the leakage-power modeling for optimalserver operation”, in IWIA, 2014
• J. Pagan, M. Zapater, O. Cubo, et al., “A Cyber-Physical approach to combined HW-SW monitoring for improving energy efficiency in data centers”, in Conference on Designof Circuits and Integrated Systems, ser. DCIS’13, [This publication is a result of the MSc.Thesis developed by J. Pagan under the supervision of the author.], 2013, pp. 140–145,ISBN: 978-84-8081-401-0
1.7 Research Projects and Grants
This author of this work has been awarded the following research grants:
• Pre-doctoral fellowship of the International Programme for Talent Recruitment (PICATA) ofthe Moncloa Campus of International Excellence, for the development of a Ph.D. The-sis coordinated by the Universidad Complutense de Madrid (UCM) and the Universi-dad Politecnica de Madrid (UPM), in the cluster of Global Change and New Energies[71,850e awarded on a competitive basis, March 2011].
• Mobility Grant from the Moncloa Campus of International Excellence, for a 3-month re-search stay at the Performance and Energy-Aware Computing Lab. (PeacLab) at BostonUniversity (Boston, MA, USA) [4,900e awarded, July 2012].
• Mobility Grant from the European Network of Excellence on High Performance and Em-bedded Architecture and Compilation (HiPEAC), for a 3-month research stay at the Per-formance and Energy-Aware Computing Lab. (PeacLab) at Boston University (Boston,MA, USA) [5,000e awarded on a competitive basis, September 2014]
Moreover, during the development of the Ph.D. Thesis the author has participated in thefollowing R&D projects and industrial contracts:
• CALEO project: Thermal-aware workload distribution to optimize the energy consump-tion of data centres. Funded by the Centro para el Desarrollo Tecnologico e Industrial(CDTI) of Spain. [September 2012]
• GreenDISC project: development of HW/SW Technologies for Energy Efficiency in Dis-tributed Computing Systems. The project proposes several research lines that target thepower optimization in computing systems. Funded by the National Programme for Fun-damental Research Projects (MINECO) of the Spanish Ministry of Economy and Com-petitiveness. [September 2013]
• LPCloud project: This project focuses on the optimum management of low-power modesfor cloud computing. Funded by the National Programme for Public-Private Coopera-tion, INNPACTO (MINECO) of the Spanish Ministry of Economy and Competitiveness.[September 2013]
14

1.7. Research Projects and Grants
• Industrial contract with Oracle, Inc. and Decision Detective Corporation (SBIR): Partici-pation in these industry contracts during both research stays at Boston University.
• GreenStack project: This project focuses on the development of energy optimization poli-cies in OpenStack, providing it with awareness of the behavior of the data center to accu-rately anticipate actual needs. Funded by the National R&D&i Programme for SocietalChallenges, RETOS-COLABORACION (MINECO) of the Spanish Ministry of Economyand Competitiveness. [September 2014]
In the next chapter...
the reader will find a description of the temperature, power and energy models developed atthe server level.
15


2. Server power and temperature modeling
En els teus fills i els teus nets, tu els hi has d’ensenyar, lesquatre regles primeres per ser un bon catala: Que s’had’estimar la llengua, que s’ha d’estimar la llar, que s’had’estimar la terra, que s’ha d’estimar la mar.
— Joan Anton Carrau, La meva avia – Havanera
The work presented in this chapter develops a methodology to accurately model the maincontributors to power consumption in enteprise servers. We design empirical models to esti-mate static and dynamic CPU power, memory power, and CPU temperature. This chapter alsoanalyzes the leakage vs. cooling power tradeoffs at the server level, showing the importance oftemperature-dependent leakage in server energy consumption. We also study the relationshipamong power, temperature, application characteristics and workload allocation.
The models are developed and validated on a presently shipping, highly multithreadedSPARC server. Moreover, we also show how our methodology can be applied to the modelingof an Intel Sandybridge-EP server belonging to the Open Compute Project.
2.1 Introduction
Each data center houses thousands of enterprise servers that need to run 24/7. The computa-tion requirements of these facilities make them power hungry. The power drawn by serversand other IT equipment accounts for around 60% of the total energy budget in traditionaldata centers. Another 30% of the electricity bill is needed to cool down the servers, keepingthem within reliable thermal operating conditions [33]. In the last years, a significant efforthas been devoted to decrease the cooling power. When changing cooling equipment is notan option due to the high capital expenses, raising the inlet temperature is one of the mostcommon strategies to increase efficiency [102]. The increase in room ambient temperature,however, also increases the fan speed of servers to keep all components below critical ther-mal thresholds. As fan power is a cubic function of fan speed, using high fan speeds leadsto a high cumulative server fan power. Fans have become an important contributor to powerconsumption, reaching up to 14% of the overall cooling power consumption [80].
Higher room temperatures also imply increasing the chip temperatures, which are alreadyhigh due to the rapid increment in CMOS power density [166]. This may cause potentialreliability problems as well as increased leakage power because of the exponential dependenceof leakage on temperature.
Even though dynamic power has historically dominated the power budget, leakage poweris becoming a more important contributor as CPU technology continues to shrink. Prior workanalyzing the effect of leakage on servers highlights that reducing cooling power by allowinghigher room temperatures may or may not be efficient depending on the specific data centerconfiguration [129].
The power drawn by servers and other IT equipment are the highest contributor to powerconsumption. To develop data center energy efficiency strategies we first need to understandhow power is being used by servers, and, moreover, we need to be able to predict the powerconsumption of servers under different conditions.
17
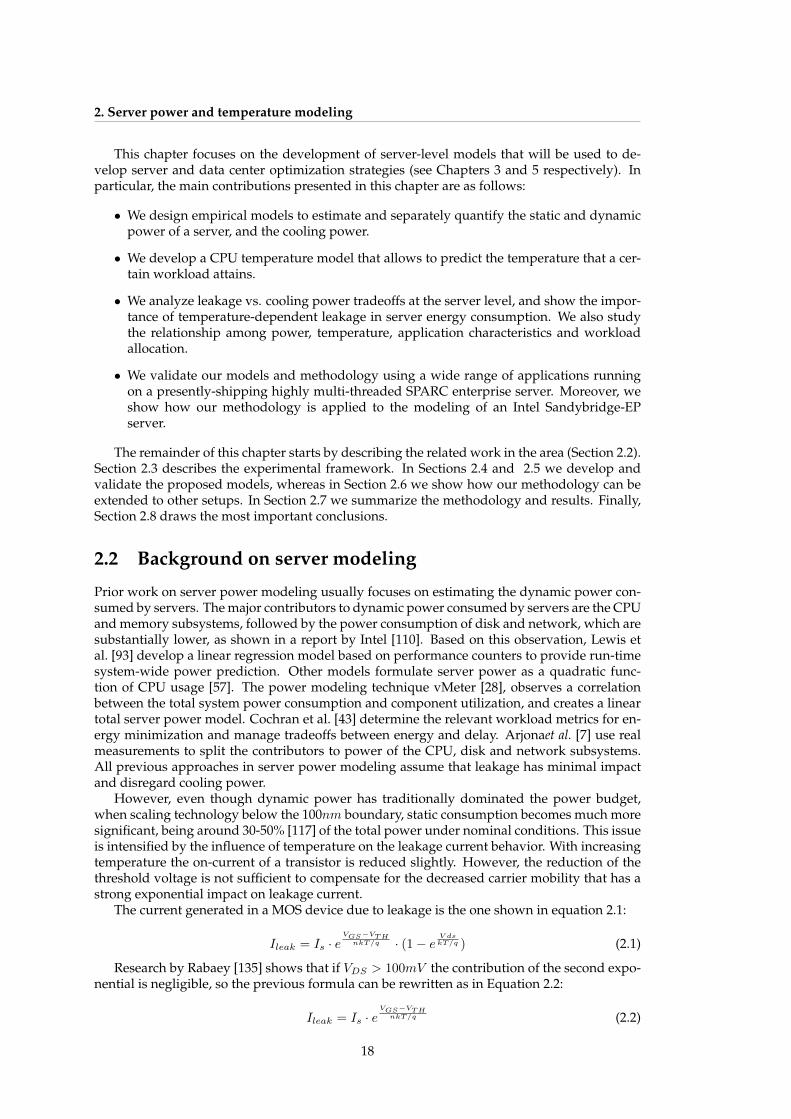
2. Server power and temperature modeling
This chapter focuses on the development of server-level models that will be used to de-velop server and data center optimization strategies (see Chapters 3 and 5 respectively). Inparticular, the main contributions presented in this chapter are as follows:
• We design empirical models to estimate and separately quantify the static and dynamicpower of a server, and the cooling power.
• We develop a CPU temperature model that allows to predict the temperature that a cer-tain workload attains.
• We analyze leakage vs. cooling power tradeoffs at the server level, and show the impor-tance of temperature-dependent leakage in server energy consumption. We also studythe relationship among power, temperature, application characteristics and workloadallocation.
• We validate our models and methodology using a wide range of applications runningon a presently-shipping highly multi-threaded SPARC enterprise server. Moreover, weshow how our methodology is applied to the modeling of an Intel Sandybridge-EPserver.
The remainder of this chapter starts by describing the related work in the area (Section 2.2).Section 2.3 describes the experimental framework. In Sections 2.4 and 2.5 we develop andvalidate the proposed models, whereas in Section 2.6 we show how our methodology can beextended to other setups. In Section 2.7 we summarize the methodology and results. Finally,Section 2.8 draws the most important conclusions.
2.2 Background on server modeling
Prior work on server power modeling usually focuses on estimating the dynamic power con-sumed by servers. The major contributors to dynamic power consumed by servers are the CPUand memory subsystems, followed by the power consumption of disk and network, which aresubstantially lower, as shown in a report by Intel [110]. Based on this observation, Lewis etal. [93] develop a linear regression model based on performance counters to provide run-timesystem-wide power prediction. Other models formulate server power as a quadratic func-tion of CPU usage [57]. The power modeling technique vMeter [28], observes a correlationbetween the total system power consumption and component utilization, and creates a lineartotal server power model. Cochran et al. [43] determine the relevant workload metrics for en-ergy minimization and manage tradeoffs between energy and delay. Arjonaet al. [7] use realmeasurements to split the contributors to power of the CPU, disk and network subsystems.All previous approaches in server power modeling assume that leakage has minimal impactand disregard cooling power.
However, even though dynamic power has traditionally dominated the power budget,when scaling technology below the 100nm boundary, static consumption becomes much moresignificant, being around 30-50% [117] of the total power under nominal conditions. This issueis intensified by the influence of temperature on the leakage current behavior. With increasingtemperature the on-current of a transistor is reduced slightly. However, the reduction of thethreshold voltage is not sufficient to compensate for the decreased carrier mobility that has astrong exponential impact on leakage current.
The current generated in a MOS device due to leakage is the one shown in equation 2.1:
Ileak = Is · eVGS−VTH
nkT/q · (1− eV dskT/q ) (2.1)
Research by Rabaey [135] shows that if VDS > 100mV the contribution of the second expo-nential is negligible, so the previous formula can be rewritten as in Equation 2.2:
Ileak = Is · eVGS−VTH
nkT/q (2.2)
18
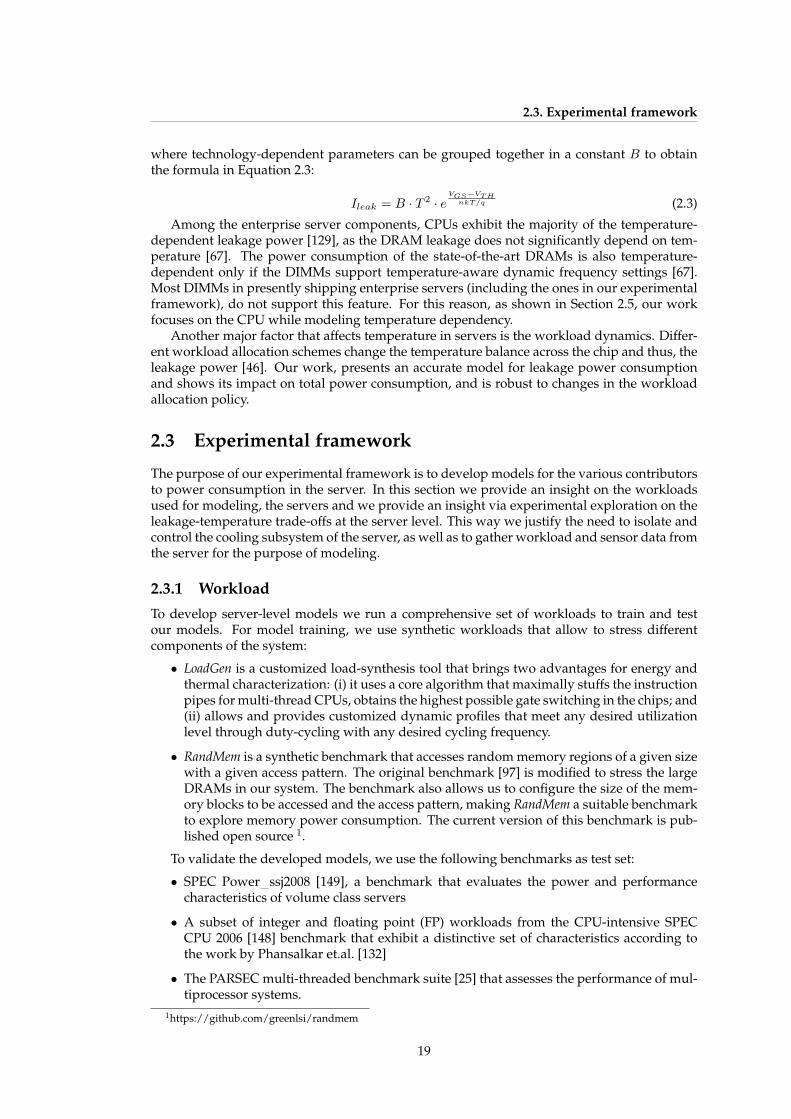
2.3. Experimental framework
where technology-dependent parameters can be grouped together in a constant B to obtainthe formula in Equation 2.3:
Ileak = B · T 2 · eVGS−VTH
nkT/q (2.3)
Among the enterprise server components, CPUs exhibit the majority of the temperature-dependent leakage power [129], as the DRAM leakage does not significantly depend on tem-perature [67]. The power consumption of the state-of-the-art DRAMs is also temperature-dependent only if the DIMMs support temperature-aware dynamic frequency settings [67].Most DIMMs in presently shipping enterprise servers (including the ones in our experimentalframework), do not support this feature. For this reason, as shown in Section 2.5, our workfocuses on the CPU while modeling temperature dependency.
Another major factor that affects temperature in servers is the workload dynamics. Differ-ent workload allocation schemes change the temperature balance across the chip and thus, theleakage power [46]. Our work, presents an accurate model for leakage power consumptionand shows its impact on total power consumption, and is robust to changes in the workloadallocation policy.
2.3 Experimental framework
The purpose of our experimental framework is to develop models for the various contributorsto power consumption in the server. In this section we provide an insight on the workloadsused for modeling, the servers and we provide an insight via experimental exploration on theleakage-temperature trade-offs at the server level. This way we justify the need to isolate andcontrol the cooling subsystem of the server, as well as to gather workload and sensor data fromthe server for the purpose of modeling.
2.3.1 WorkloadTo develop server-level models we run a comprehensive set of workloads to train and testour models. For model training, we use synthetic workloads that allow to stress differentcomponents of the system:
• LoadGen is a customized load-synthesis tool that brings two advantages for energy andthermal characterization: (i) it uses a core algorithm that maximally stuffs the instructionpipes for multi-thread CPUs, obtains the highest possible gate switching in the chips; and(ii) allows and provides customized dynamic profiles that meet any desired utilizationlevel through duty-cycling with any desired cycling frequency.
• RandMem is a synthetic benchmark that accesses random memory regions of a given sizewith a given access pattern. The original benchmark [97] is modified to stress the largeDRAMs in our system. The benchmark also allows us to configure the size of the mem-ory blocks to be accessed and the access pattern, making RandMem a suitable benchmarkto explore memory power consumption. The current version of this benchmark is pub-lished open source 1.
To validate the developed models, we use the following benchmarks as test set:
• SPEC Power ssj2008 [149], a benchmark that evaluates the power and performancecharacteristics of volume class servers
• A subset of integer and floating point (FP) workloads from the CPU-intensive SPECCPU 2006 [148] benchmark that exhibit a distinctive set of characteristics according tothe work by Phansalkar et.al. [132]
• The PARSEC multi-threaded benchmark suite [25] that assesses the performance of mul-tiprocessor systems.
1https://github.com/greenlsi/randmem
19

2. Server power and temperature modeling
1 2
3 4
5 6
DIMMS
CPU0
CPU1
Serviceprocessor
Data Loggingand Control PC
Power supply 1
Power supply 2
Power supply 3
FansHard
drivesPSUs
Server
Figure 2.1: Experimental setup and internal diagram of SPARC T3 server.
2.3.2 Experimental set-up
Oracle SPARC T3 Server
Experiments are carried out on a presently shipping enterprise server which contains twoSPARC T3 processors [146] in 2 sockets that provide a total of 256 hardware threads, 32 8GBmemory DIMMs, and 2 hard drives. Each processor has 16 cores, and each core has 8 hardwarethreads, providing a total number of 256 hardware threads on the server. The machine iscooled by 6 fans (distributed in 3 columns of 2), which blow air through the memory modules(DIMMs) to the processors. The Power Supply Units (PSUs) and hard disks are located on oneside of the server. The server internals are shown in Figure 2.1. We enable characterizationexperiments to be performed through customized fan control by replacing the original fanswith new ones of the same manufacturer and model, and setting the fan currents throughexternal Agilent E3644A power supplies.
We map the input current values to fan speeds, which are inferred with very high accuracyby taking the FFT of vibration sensors. Using this setup, we are able to accurately measureand isolate the cooling power of the server. In our work, we use a minimum fan speed of1800RPM, and a maximum of 4200RPM. 1800RPM is sufficiently low to observe how leakagebecomes dominant over fan power in our system. This will be shown later on Section 3.3.Moreover, fan speeds lower than 1800RPM lead to unstable fan behavior. On the other hand,4200RPM overcools the server under our experimental conditions, and is above the maximumserver default fan speed.
The fan speed can be remotely adjusted by software scripts in the Data Logging and Con-trol PC (DLC-PC), which also collects server sensor data through the Continuous SystemTelemetry Harness (CSTH) [69]. CSTH runs in the service processor of the enterprise server asa part of the existing system software stack; therefore, no overhead is introduced by the sensordata processing. For our experiments, we collect the following sensor data: (i) CPU and mem-ory temperature, (ii) per-CPU voltage and current, (iii) total server power. We poll the sensorsevery second to observe the power and thermal behavior with sufficient granularity.
We use Solaris 10 OS tools (sar, cpustat, busstat and iostat) to poll the hardware counters forworkload characterization. Hardware counters are a set of special-purpose registers built intomodern CPUs to store the counts of hardware-related events. Because they are integrated intothe architecture, polling these counters has a negligible overhead in the performance of theworkload being profiled. Modern servers come with a high number of performance countersthat can be polled.
20

2.3. Experimental framework
Figure 2.2: Decathlete server internal diagram. Taken from [79]
Intel SandyBridge-EP OCP Server
We use an Intel SandyBridge-EP server belonging to the Open Compute Project (OCP) 2 tovalidate our methodology in a different server and provide heterogeneous architectures foroptimization purposes.
The idea behind choosing an OCP server is to exploit the benefits of flexibility and scala-bility brought by open-hardware designs, allowing us to extend our customized monitoring,modeling and optimization setup easily to other platforms. The creation of the OCP initiative,led by Facebook Inc., brought a new dimension to data center management. The aim of thisproject is to bring together a community of engineers from around the globe whose mission isto develop the most efficient data center hardware.
The server chosen is an Intel S2600GZ, whose design is based on an Intel OCP v2.0 Decath-lete board. The board has two sockets, each can be equipped with a 6-core Intel SandyBridge-EP processor providing up to 12 hardware threads. The server is equipped with 8 4GB mem-ory DIMMs, 4 1TB hard drives, 2 PSUs and 5 fans. Figure 2.2 shows a diagram of the serverinternals.
The server runs a CentOS 6.5 Linux operating system. We use IPMI to poll the availableserver sensors: i) CPU temperature, ii) fan speed and iii) overall server power consumption.Fan speed in this server can be controlled by setting different PWM values to the fan controllersvia the BIOS [79]. We use the oprofile tool to poll the server hardware counters during runtime 3.
However, the original server monitoring via IPMI did not provide values for neither theCPU power nor the fan power. In order to apply our modeling methodology we need tosplit and quantify both fan power and CPU power. To this end, we deploy intrusive currentmeasument sensors in the critical board components: i) fans, ii) memory DIMMs and iii) harddisk drives. This way we are able to split the contribution from cooling power, memory anddisk from that of CPU power.
To measure power consumption, we use the commercial chip from Texas InstrumentsINA219. This chip uses an integrated power measurement circuit that measures the voltagedrop in a shunt resistor placed in series with the power supply of the device to be measured.This setup allows us to measure the power drawn by a memory DIMM, a fan, and the disks.To obtain the highest accuracy possible we need to select the highest resistance that ensures avoltage drop in the resistance that is low enought to keep the devices working.
Because fans and disks are powered directly via the PSU of the system, we can insert oursensor in between the power supply wires. However, because the memory DIMMs are pow-ered via the motherboard, we need to insert a memory expander that incorporates the shunt
2http://www.opencompute.org3http://oprofile.sourceforge.net/news/
21

2. Server power and temperature modeling
resistors to enable power measurement.The INA219 current measurement chip has an I2C interface that we connect to a wireless
sensor node that retrieves all the information from the chip and sends it wirelessly to a gatewaynode [124]. The wireless node can be placed either inside or top of the server, allowing us toplace the server inside a rack.
For more information on the monitoring setup the reader is referred to [143].
2.3.3 Experimental exploration
Leakage-temperature tradeoffs can have a high impact on the energy efficiency of enterpriseservers. To evaluate them, we first perform a series of experiments using the SPARC server.
All experiments take place under the same conditions as follows: (i) the server is in anisolated environment at an ambient temperature of 24◦C ; (ii) the machine always starts execu-tion from a cold state that has been previously forced by at least 10 minutes of idle executionwith fans rotating at 3600RPM; (iii) at the beginning of the execution (i.e., t = 0), fan speedis set to the appropriate value, and the machine is idle for another 5 minutes to allow tem-perature stabilization; (iv) the last 10 minutes of the experiments are always conducted withthe CPUs idle, to let temperature drop to a steady state. These conditions are selected so thatexperiments reflect realistic working conditions and isolate the thermal-energy issues that wewant to study. We first perform experiments to gather data at varying utilization levels andfan speeds.
To explore the system dynamics, we run LoadGen for 30 minutes at various utilizationlevels (10%, 25%, 40%, 50%, 60%, 75%, 90% and 100%) with different fan speeds (1800RPM,2400RPM, 3000RPM, 3600RPM and 4200RPM) at the highest CPU frequency. In this case, weset the same fan speed for all three pairs of fans. Figure 2.3(a) shows CPU0 temperature under100% utilization and all the fan speeds. These experiments show interesting results for boththe transient and the steady state. We observe significantly different time constants depend-ing on the fan speed. For 1800RPM the steady state is reached after 15 minutes of execution,whereas for the 4200RPM case, steady state is achieved after only 5 minutes. The magnitudeof the thermal time constant is important for designing control mechanisms. The lower the fanspeed, the slower the temperature reaction, which leaves more time for control decisions. Inaddition, the considerable change in thermal time constants indicate that thermal models/pre-dictors based on chip thermal modeling would need to take fan speeds into account to ensureaccuracy in real-life settings. Again, this effect can be observed in Figure 2.3(a), where we seehow temperature for a fan speed of 4200RPM stabilizes around 57◦C in less than 5 minutes,whereas it takes almost 15 minutes for temperature under 1800RPM to stabilize around 87◦C.
Figure 2.3(b) shows the temperature at different workload utilization levels using a fanspeed of 1800RPM. Thermal oscillations occur as LoadGen uses PWM to achieve a desired levelof utilization. This plot shows the two transient temperature trends: a fast trend that raises theCPU temperature by 5◦C to 8◦ in less than 30 seconds due to workload changes (from idle tohigh utilization), and the slow temperature increase taking up to 15 minutes due to the timeconstants.
The variation in CPU temperature attained by the same workload running under differentfan speed values lead to differences in terms of the overall power consumption due to leak-age. This effect can be observed in Figure 2.4, where we show how the sum of fan powerand leakage power describe a convex-like curve that reaches a minimum around 70◦C, whichcorresponds to a fan speed of 2400RPM, when we set LoadGen to 100% utilization. A similartrend is observed for other utilization level, but the fan speed that yields the minimum powervaries.
To motivate our work, it is interesting to discuss here the potential benefits of a predictivefan speed controller for this kind of application. At first sight, savings can be achieved byappropriately setting server cooling during runtime. It would seem convenient to propose apredictive controller that predicts power consumption under a certain workload, and followsthe trend of temperature to predict future temperature and leakage values and set fan speedaccordingly. However, the results previously shown in Figure 2.3(a) indicate that a prediction
22
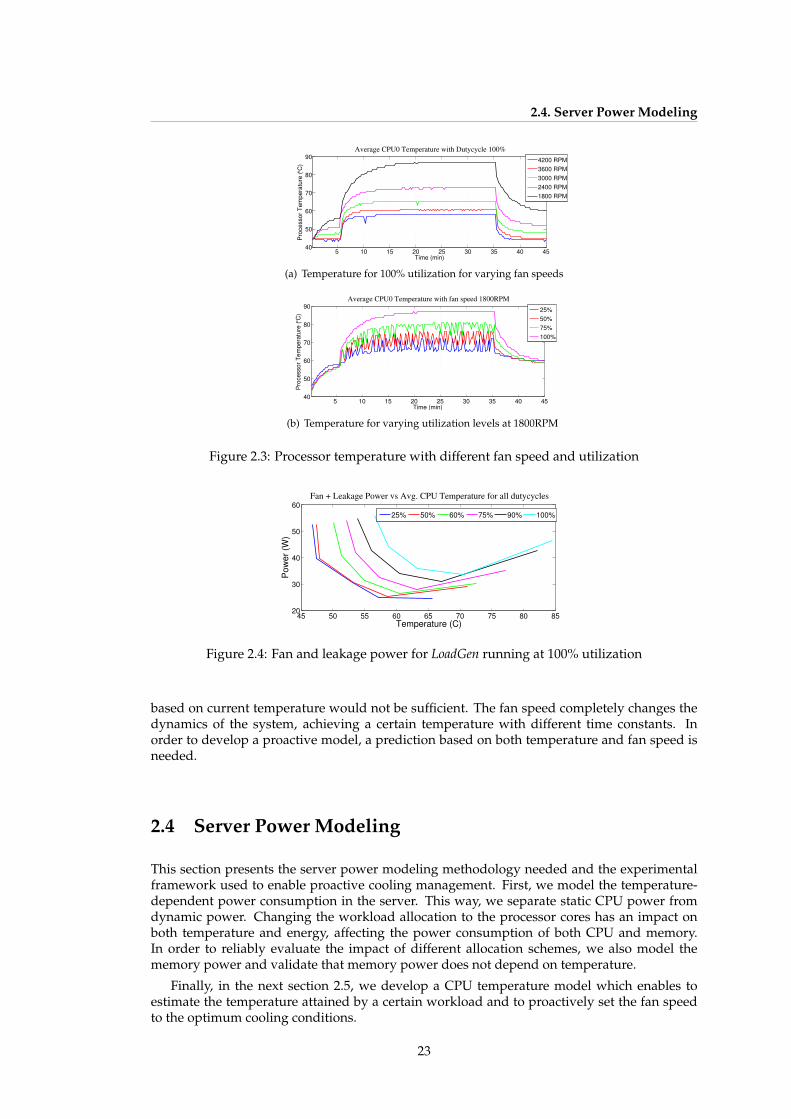
2.4. Server Power Modeling
5 10 15 20 25 30 35 40 4540
50
60
70
80
90
Pro
cessor
Tem
pera
ture
(°C
)
Time (min)
Average CPU0 Temperature with Dutycycle 100%
4200 RPM
3600 RPM
3000 RPM
2400 RPM
1800 RPM
(a) Temperature for 100% utilization for varying fan speeds
5 10 15 20 25 30 35 40 4540
50
60
70
80
90
Pro
cessor
Tem
pera
ture
(°C
)
Time (min)
Average CPU0 Temperature with fan speed 1800RPM
25%
50%
75%
100%
(b) Temperature for varying utilization levels at 1800RPM
Figure 2.3: Processor temperature with different fan speed and utilization
45 50 55 60 65 70 75 80 8520
30
40
50
60
Temperature (C)
Po
we
r (W
)
Fan + Leakage Power vs Avg. CPU Temperature for all dutycycles
25% 50% 60% 75% 90% 100%
Figure 2.4: Fan and leakage power for LoadGen running at 100% utilization
based on current temperature would not be sufficient. The fan speed completely changes thedynamics of the system, achieving a certain temperature with different time constants. Inorder to develop a proactive model, a prediction based on both temperature and fan speed isneeded.
2.4 Server Power Modeling
This section presents the server power modeling methodology needed and the experimentalframework used to enable proactive cooling management. First, we model the temperature-dependent power consumption in the server. This way, we separate static CPU power fromdynamic power. Changing the workload allocation to the processor cores has an impact onboth temperature and energy, affecting the power consumption of both CPU and memory.In order to reliably evaluate the impact of different allocation schemes, we also model thememory power and validate that memory power does not depend on temperature.
Finally, in the next section 2.5, we develop a CPU temperature model which enables toestimate the temperature attained by a certain workload and to proactively set the fan speedto the optimum cooling conditions.
23

2. Server power and temperature modeling
2.4.1 OverviewThe power consumption of a server can be split into three different contributors: (i) the dy-namic or active power, (ii) the static power, and (iii) the cooling power due to the server fans:
Pserver = Pstatic + Pdynamic + Pfan (2.4)
Static power consumption refers to the cumulative idle server power of all the server com-ponents and the temperature-dependent leakage power, whereas dynamic power is inherentto the execution of a certain workload. In our system, CSTH provides the overall power con-sumption (Pserver) using sensor measurements, whereas the cooling power (Pfan) is isolatedand can be measured independently.
We further divide Pstatic into two components as Pstatic = Pidle+PleakT , where Pidle repre-sents the idle power of all components when leakage is minimum, i.e., at the maximum serverfan speed (4200RPM in our experimental setup), and PleakT is the temperature-dependentleakage power due to the increase in temperature during workload execution.
Similarly, we divide the workload-induced dynamic power into its sub-components as fol-lows:
Pdynamic = PCPU,dyn + Pmem,dyn + Pother,dyn (2.5)
where PCPU,dyn is the dynamic CPU power, Pmem,dyn is the dynamic memory power, andPother is the contribution of other components. This last component is mainly composed ofdisk and network activity. Although its absolute value can be significant in some workloads,Pother has negligible dependence on workload allocation and temperature for the workloadswe run.
To find the optimum cooling conditions at runtime, we need to model the temperature-dependent leakage power PleakT . Additionally, to analyze the impact of workload allocation,we need to derive a model for memory power. In the next subsections, we provide a detailedexplanation on these models.
2.4.2 CPU powerAs the temperature-dependent leakage is mainly due to CPU leakage, we develop an empiricalCPU power model, and validate our assumption by observing that overall server leakage canbe expressed by the CPU leakage with sufficient accuracy.
Equation 2.6 shows how CPU power can be further divided into PCPU,idle, which con-tains a temperature-independent leakage plus the power consumption due to the OS running,a temperature-dependent leakage component (PCPU,leakT ), and the dynamic power due toworkload execution (PCPU,dyn):
PCPU = PCPU,idle + PCPU,leakT + PCPU,dyn (2.6)
As CSTH provides PCPU and PCPU,idle using voltage/current sensor readings, we onlyneed to model PCPU,leakT and PCPU,dyn. We start by modeling the temperature-dependentleakage power, PCPU,leakT .
2.4.3 Temperature-dependent CPU leakageTo train this model, we use LoadGen synthetic workload with full utilization. We run the sameworkload under different fan speeds ranging from 1800RPM to 4200RPM, and measure CPUpower and temperature from the two CPUs of the system. Because the workload is constant inall experiments and the only control knob is fan speed, power consumption can only changedue to the temperature-dependent leakage. As leakage power depends exponentially on tem-perature, we use the measured CPU temperature and power to regress the Taylor series ex-pansion of an exponential:
Pleak = α0 + α1 · TCPU + α2 · T 2CPU (2.7)
24
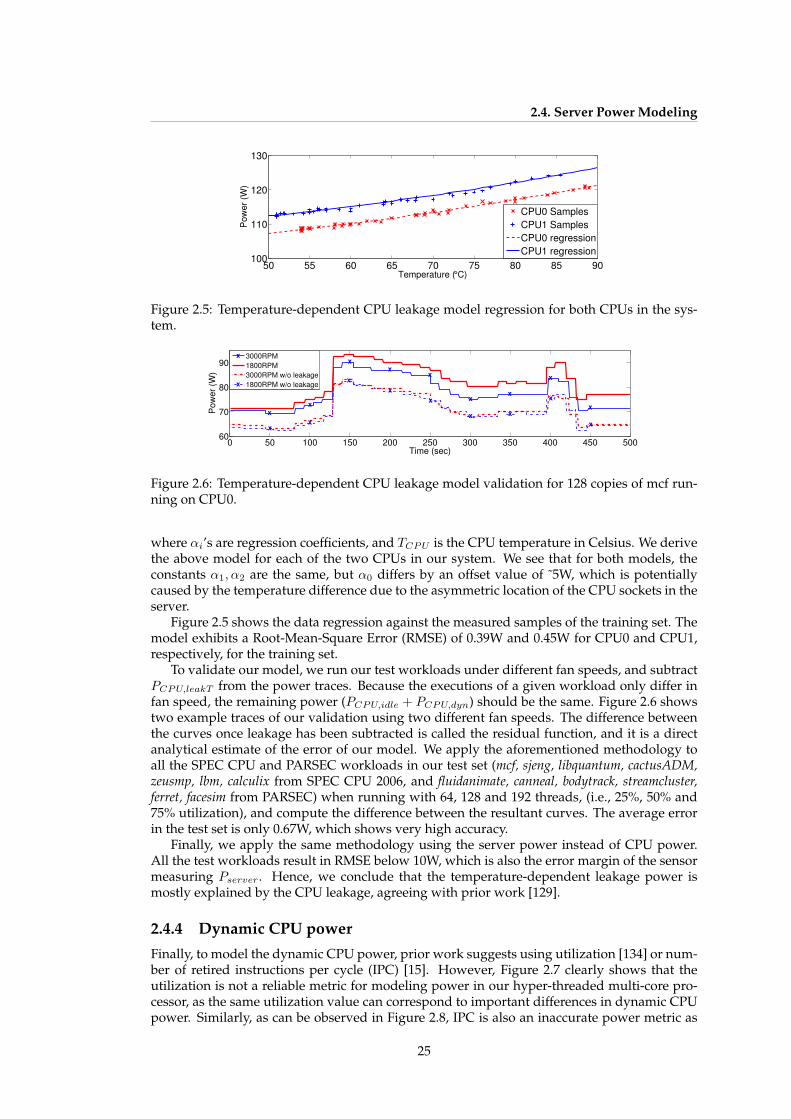
2.4. Server Power Modeling
50 55 60 65 70 75 80 85 90100
110
120
130
Temperature (°C)
Pow
er
(W)
CPU0 Samples
CPU1 Samples
CPU0 regression
CPU1 regression
Figure 2.5: Temperature-dependent CPU leakage model regression for both CPUs in the sys-tem.
0 50 100 150 200 250 300 350 400 450 50060
70
80
90
Time (sec)
Pow
er
(W)
3000RPM
1800RPM
3000RPM w/o leakage
1800RPM w/o leakage
x
x
x
x
x
x
x
xx
x
x
x
x
x
x
x
x
x
x
x
Figure 2.6: Temperature-dependent CPU leakage model validation for 128 copies of mcf run-ning on CPU0.
where αi’s are regression coefficients, and TCPU is the CPU temperature in Celsius. We derivethe above model for each of the two CPUs in our system. We see that for both models, theconstants α1, α2 are the same, but α0 differs by an offset value of ˜5W, which is potentiallycaused by the temperature difference due to the asymmetric location of the CPU sockets in theserver.
Figure 2.5 shows the data regression against the measured samples of the training set. Themodel exhibits a Root-Mean-Square Error (RMSE) of 0.39W and 0.45W for CPU0 and CPU1,respectively, for the training set.
To validate our model, we run our test workloads under different fan speeds, and subtractPCPU,leakT from the power traces. Because the executions of a given workload only differ infan speed, the remaining power (PCPU,idle + PCPU,dyn) should be the same. Figure 2.6 showstwo example traces of our validation using two different fan speeds. The difference betweenthe curves once leakage has been subtracted is called the residual function, and it is a directanalytical estimate of the error of our model. We apply the aforementioned methodology toall the SPEC CPU and PARSEC workloads in our test set (mcf, sjeng, libquantum, cactusADM,zeusmp, lbm, calculix from SPEC CPU 2006, and fluidanimate, canneal, bodytrack, streamcluster,ferret, facesim from PARSEC) when running with 64, 128 and 192 threads, (i.e., 25%, 50% and75% utilization), and compute the difference between the resultant curves. The average errorin the test set is only 0.67W, which shows very high accuracy.
Finally, we apply the same methodology using the server power instead of CPU power.All the test workloads result in RMSE below 10W, which is also the error margin of the sensormeasuring Pserver. Hence, we conclude that the temperature-dependent leakage power ismostly explained by the CPU leakage, agreeing with prior work [129].
2.4.4 Dynamic CPU powerFinally, to model the dynamic CPU power, prior work suggests using utilization [134] or num-ber of retired instructions per cycle (IPC) [15]. However, Figure 2.7 clearly shows that theutilization is not a reliable metric for modeling power in our hyper-threaded multi-core pro-cessor, as the same utilization value can correspond to important differences in dynamic CPUpower. Similarly, as can be observed in Figure 2.8, IPC is also an inaccurate power metric as
25

2. Server power and temperature modeling
0 20 40 60 80 1000
20
40
60
CPU utilization (%)
dyn
am
ic C
PU
po
we
r (W
)
calculix
mcf
Figure 2.7: Dynamic CPU power vs. utilization for selected SPEC CPU workloads.
0 0.05 0.1 0.15 0.20
10
20
30
40
50
IPC
dyn
am
ic C
PU
po
we
r (W
)
h264ref
gamess
wrf
milc
Figure 2.8: Dynamic CPU power vs. IPC for 128 concurrent copies of selected SPEC CPUworkloads.
the same IPC value can correspond to different dynamic CPU power levels. Because of theseoutcomes, our dynamic power prediction is based on our leakage model. We directly subtractthe estimated leakage power and idle power from the measured CPU power to obtain thedynamic power using Equation 2.6.
2.4.5 Memory power
This section presents our memory power model, which is used both to confirm that the mem-ory power does not depend on temperature and to explain the impact of workload allocationon server power.
We use a modified version of the synthetic benchmark RandMem to train our memorymodel. RandMem stresses the memory with desired number of read-write accesses. We gener-ate random read-write accesses using a memory space from 512Mb to 64GB and gather powerconsumption via CSTH and information on the number of per-bank read-write accesses persecond to the bus via the Solaris busstat tool. In particular we collect the following perfor-mance counters: i) per-bank read-write accesses per second and ii) per bank bank-busy stalls.We sum read-write per-bank accesses to obtain overall memory accesses, and use them toderive memory power.
In our system, we have two available power measurements: CPU voltage/current sensorsthat allow measuring PCPU , and power sensors that measure Pserver. As the benchmark Rand-Mem has negligible disk and network number of accesses, we directly use the power differencePserver − PCPU to train the model.
To check that our claim is correct and disk power is not having an impact in our modelingmethodology, we monitor the amount of disk accesses that take place during the execution ofRandMem stressing 64GB of memory with the iostat tool. We compare the results to the diskaccesses when the system is idle and find the disk activity of RandMem to be negligible.
Figure 2.9 shows how memory power grows linearly with the number of memory accessesper second. We experiment with three different fan speeds to test whether the memory powerdepends on temperature. As seen in the figure, samples representing different fan speeds aredistributed along the plot, indicating that there is no significant dependence between memorypower and temperature. Hence, we conclude that the temperature-dependent leakage poweris mostly explained by the CPU leakage, agreeing with prior work [129]. Based on this obser-
26
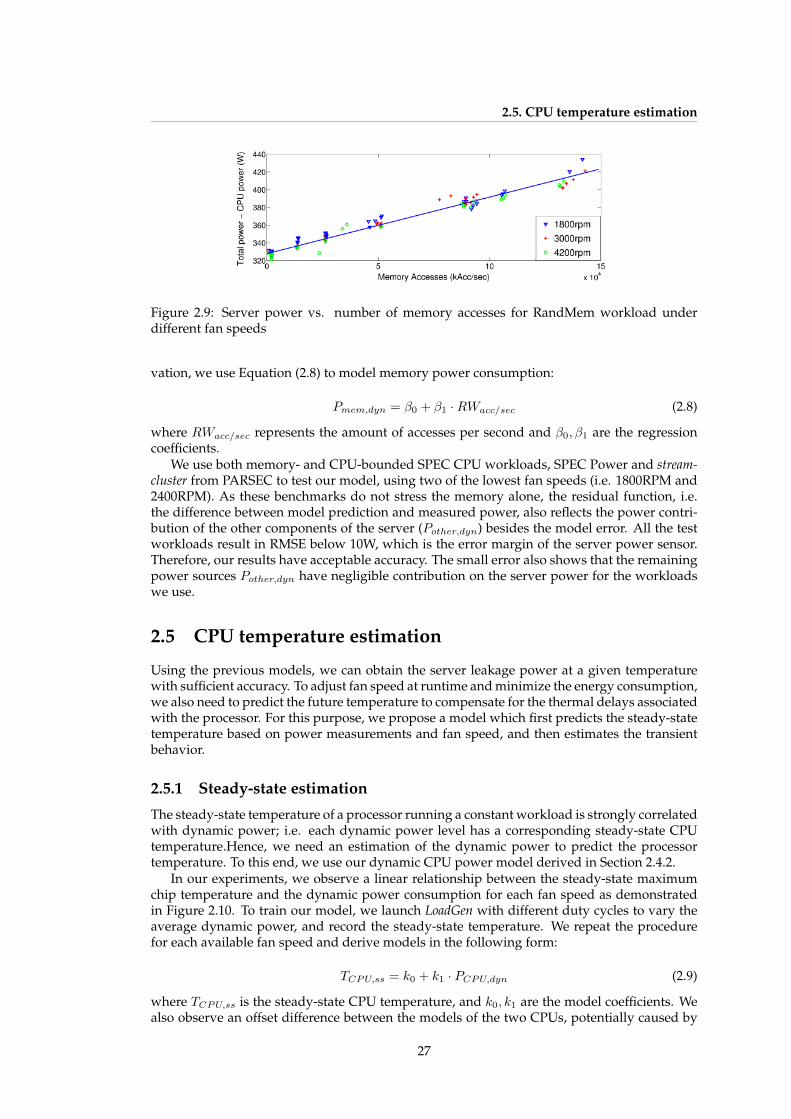
2.5. CPU temperature estimation
Figure 2.9: Server power vs. number of memory accesses for RandMem workload underdifferent fan speeds
vation, we use Equation (2.8) to model memory power consumption:
Pmem,dyn = β0 + β1 ·RWacc/sec (2.8)
where RWacc/sec represents the amount of accesses per second and β0, β1 are the regressioncoefficients.
We use both memory- and CPU-bounded SPEC CPU workloads, SPEC Power and stream-cluster from PARSEC to test our model, using two of the lowest fan speeds (i.e. 1800RPM and2400RPM). As these benchmarks do not stress the memory alone, the residual function, i.e.the difference between model prediction and measured power, also reflects the power contri-bution of the other components of the server (Pother,dyn) besides the model error. All the testworkloads result in RMSE below 10W, which is the error margin of the server power sensor.Therefore, our results have acceptable accuracy. The small error also shows that the remainingpower sources Pother,dyn have negligible contribution on the server power for the workloadswe use.
2.5 CPU temperature estimation
Using the previous models, we can obtain the server leakage power at a given temperaturewith sufficient accuracy. To adjust fan speed at runtime and minimize the energy consumption,we also need to predict the future temperature to compensate for the thermal delays associatedwith the processor. For this purpose, we propose a model which first predicts the steady-statetemperature based on power measurements and fan speed, and then estimates the transientbehavior.
2.5.1 Steady-state estimation
The steady-state temperature of a processor running a constant workload is strongly correlatedwith dynamic power; i.e. each dynamic power level has a corresponding steady-state CPUtemperature.Hence, we need an estimation of the dynamic power to predict the processortemperature. To this end, we use our dynamic CPU power model derived in Section 2.4.2.
In our experiments, we observe a linear relationship between the steady-state maximumchip temperature and the dynamic power consumption for each fan speed as demonstratedin Figure 2.10. To train our model, we launch LoadGen with different duty cycles to vary theaverage dynamic power, and record the steady-state temperature. We repeat the procedurefor each available fan speed and derive models in the following form:
TCPU,ss = k0 + k1 · PCPU,dyn (2.9)
where TCPU,ss is the steady-state CPU temperature, and k0, k1 are the model coefficients. Wealso observe an offset difference between the models of the two CPUs, potentially caused by
27

2. Server power and temperature modeling
Figure 2.10: Steady-state temperature model and measured samples for three different fanspeeds.
1500 2000 2500 3000 3500 4000 45000
20
40
60
Fan speed (rpm)
Pow
er
(W)
Fan power
27°C Fan + leakage
27°C Leakage
22°C Fan + leakage
22°C Leakage
Figure 2.11: Effect of ambient temperature on the leakage power plus fan power curve of mcf.
the asymmetric location of the CPU sockets. We put the model coefficients for all the availablefan speeds and CPUs in a Look-Up Table (LUT).
We derive our model using an ambient temperature of 22◦C. However, as shown in Fig-ure 2.11, ambient temperature affects the optimum fan speed, and including it in the model isnecessary for robustness. To consider different ambient temperatures, we use the known lin-ear relationship between the local ambient and the chip temperature [130]. We experimentallyobserve that if we add the difference in ambient temperature to our temperature estimation asan offset, the RMSE and maximum error do not increase. This approach ensures the robustnessof the model while keeping its simplicity.
We validate our model by running a set of SPEC CPU2006 workloads at two differentambient temperatures, 22◦C and 27◦C, where we obtain a maximum error of 6.6◦C and RMSEbelow 2.1◦C. This accuracy is sufficient for our purposes.
2.5.2 Transient state modeling
In our work, we are interested in the thermal behavior that is affected by the fan speed, wherethe temperature changes slowly due to the large thermal time constants introduced by the die,the heat spreader and the heat sink.
When processor power varies, temperature changes exponentially with a time constant.We compute the thermal time constant of each fan speed by fitting exponential curves to thetemperature measurements obtained while running LoadGen after the idle steady-state. Asseen in Figure 2.12, the time constants, maximum observable temperatures and temperaturerange decrease as the fan speed increases. As the small changes in temperature do not affectthe leakage power significantly, we only need to detect the large changes with time constantsin the order of minutes. With such long time constants, we predict the temperature only duringthe next minute. A more fine-grained temperature prediction will lead to better approxima-tions to the optimal fan speed by capturing small changes in the temperature; however, it will
28

2.6. Applying methodology to other servers
1500 2000 2500 3000 3500 4000 4500
80
120
160
200
Fan speed (rpm)
Tim
e c
on
sta
nt
(se
c)
60
70
80
90
ma
x t
em
pe
ratu
re (
°C
)
time constant
max temperature
Figure 2.12: Thermal time constant and maximum observed temperature under various fanspeeds
also induce unnecessary changes in fan speed and decrease the lifetime of the fans. The dura-tion of the temperature prediction should be selected considering this trade-off. We select thisduration heuristically both to capture the large changes in temperature and to approximatethe optimal fan speed selection while avoiding.
2.6 Applying methodology to other servers
The goal of this section is to show how our modeling methodology is extended to other serversetups, to enable the modeling and optimization of heterogeneous data center setups. Theprocedure to extend the methodology to other servers is equivalent.
2.6.1 Extension to Intel OCP serverAs a case study, we use the Intel Sandybridge-EP OCP server previously presented in Sec-tion 2.3. In a similar way than for the SPARC server, in the Intel SandyBridge-EP server, wehave isolated the different contributors to power consumption.
We model the system following the same procedure than for the SPARC server, and assum-ing again that Equations 2.4 and 2.5 stand true:
1. Leakage power modeling: We use the synthetic benchmark Lookbusy 4, to stress the CPUto its highest utilization possible, and change the default server fan speed in the BIOS,generating various temperatures in the CPU and, thus, different leakage values. Wederive the leakage model by fitting the Taylor series expansion of an exponential (seeEquation 2.7). Once we derive leakage power, we are able to subtract it from CPU powerand obtain dynamic CPU power.
2. Memory power modeling: We use our modified version of Randmem to stress the memorywith different utilization patterns, and collect power and performance counter values togenerate the memory power model (Equation 2.8).
3. CPU temperature modeling: We use dynamic CPU power measurements and CPU temper-ature measurements to derive several linear curves that describe the CPU temperatureunder different fan speed values (Equation 2.9).
2.6.2 Power consumption comparisonOnce we have developed the aforementioned models, we can perform some comparisons be-tween both architectures. This comparison is needed to provide an insight on the performancein terms of energy when executing various workloads.
Figure 2.13(a) shows a comparison between the fan power drawn by the SPARC and theDecathlete server. Because fan speed is highly dependant on the physical fan parameters
4http://www.devin.com/lookbusy/
29
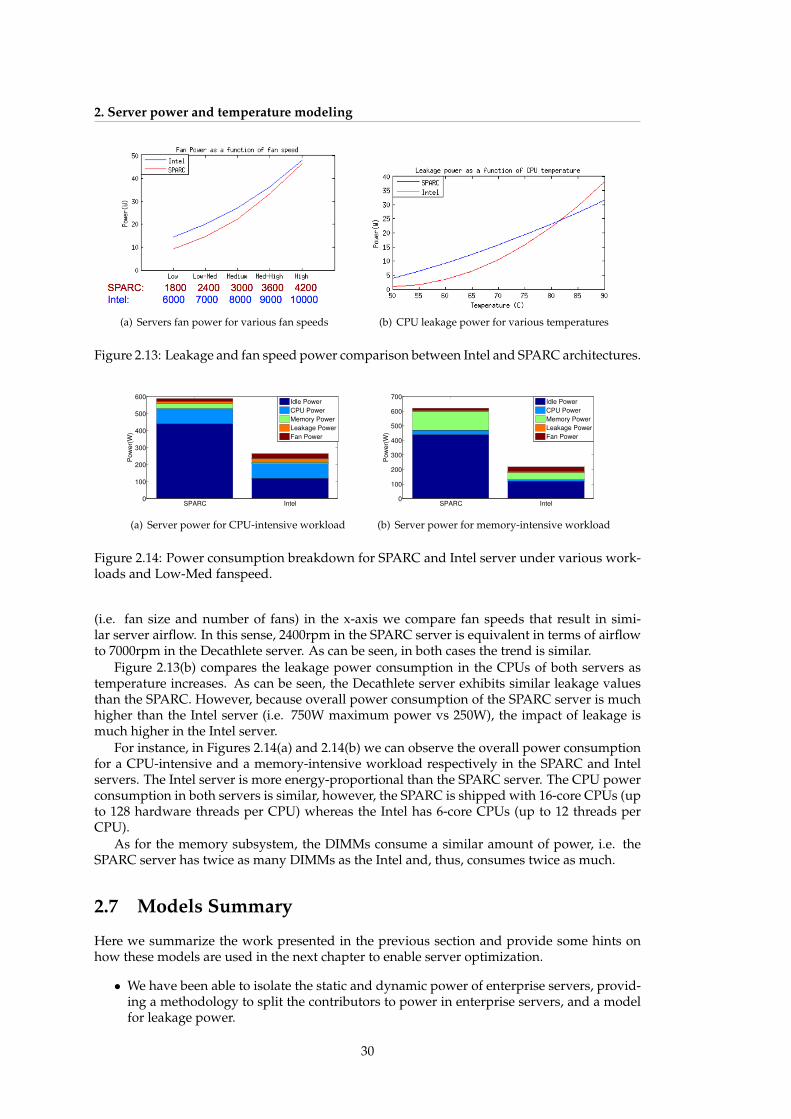
2. Server power and temperature modeling
(a) Servers fan power for various fan speeds (b) CPU leakage power for various temperatures
Figure 2.13: Leakage and fan speed power comparison between Intel and SPARC architectures.
SPARC Intel0
100
200
300
400
500
600
Pow
er(
W)
Idle Power
CPU Power
Memory Power
Leakage Power
Fan Power
(a) Server power for CPU-intensive workload
SPARC Intel0
100
200
300
400
500
600
700
Pow
er(
W)
Idle Power
CPU Power
Memory Power
Leakage Power
Fan Power
(b) Server power for memory-intensive workload
Figure 2.14: Power consumption breakdown for SPARC and Intel server under various work-loads and Low-Med fanspeed.
(i.e. fan size and number of fans) in the x-axis we compare fan speeds that result in simi-lar server airflow. In this sense, 2400rpm in the SPARC server is equivalent in terms of airflowto 7000rpm in the Decathlete server. As can be seen, in both cases the trend is similar.
Figure 2.13(b) compares the leakage power consumption in the CPUs of both servers astemperature increases. As can be seen, the Decathlete server exhibits similar leakage valuesthan the SPARC. However, because overall power consumption of the SPARC server is muchhigher than the Intel server (i.e. 750W maximum power vs 250W), the impact of leakage ismuch higher in the Intel server.
For instance, in Figures 2.14(a) and 2.14(b) we can observe the overall power consumptionfor a CPU-intensive and a memory-intensive workload respectively in the SPARC and Intelservers. The Intel server is more energy-proportional than the SPARC server. The CPU powerconsumption in both servers is similar, however, the SPARC is shipped with 16-core CPUs (upto 128 hardware threads per CPU) whereas the Intel has 6-core CPUs (up to 12 threads perCPU).
As for the memory subsystem, the DIMMs consume a similar amount of power, i.e. theSPARC server has twice as many DIMMs as the Intel and, thus, consumes twice as much.
2.7 Models Summary
Here we summarize the work presented in the previous section and provide some hints onhow these models are used in the next chapter to enable server optimization.
• We have been able to isolate the static and dynamic power of enterprise servers, provid-ing a methodology to split the contributors to power in enterprise servers, and a modelfor leakage power.
30
2.8. Conclusions
• We have modeled the contributors to power consumption that are affected by leakagepower and workload allocation, i.e. CPU and memory power.
• We have estimated the steady-state and the transient CPU temperature.
• We have shown how our methodology can be extended to other servers, to enable opti-mization in heterogeneous data center setups.
Given a certain workload, the models allow us (i) to separate the contribution of dynamicpower from that of leakage, (ii) to predict CPU temperature and thus leakage power for eachavailable cooling setup (i.e. fan speed) in the serve and (iii) to select the fan speed that min-imizes the leakage plus fan power. Moreover, the models enables us to evaluate the impact ofworkload allocation in the next Chapter 3.
2.8 Conclusions
The computational and cooling power demands of enterprise servers are increasing at an un-sustainable rate. Higher chip power densities brought by new process technologies causetemperatures to rise, which in turn, increases leakage power. Moreover, as data center coolingbecomes more efficient, the contribution of leakage and server fans become more significant.
Understanding the relationship between computational power, temperature, leakage, andcooling power is crucial to enable energy-efficient operation at the server and data center lev-els. This chapter has focused on the development of empirical models to estimate the contribu-tions of static and dynamic power consumption in enterprise servers for a wide range of work-loads, and analyzes the interactions between temperature, leakage, and cooling power for var-ious workload allocation policies. Moreover, we have shown how our proposed methodologycan be extended to other enteprise servers, which is particularly useful to minimize energy inheterogeneous data centers.
Our models allow us to split and separately quantify the different contributors to power,advancing the state-of-the-art by developing highly-accurate leakage and cooling-aware mod-els for arbitrary workload. Our solution enables the usage of proactive optimization strategiesboth at server and at data center levels.
In the next chapter...
the reader will find how the described server modeling is used to optimize energy at the serverlevel via power- and thermal-aware proactive cooling and workload management strategies.
31

3. Leakage and temperature aware workload andcooling management at the server level
C’etait l’automne, un automne ou il faisait beau.Une saison qui n’existe que dans le Nord de l’Amerique.La-bas on l’appelle l’ete indien.
— Joe Dassin, L’ete indien
Backed up by the models developed in the previous chapter, here we propose leakage-,power- and temperature-aware cooling management techniques that minimize server energyconsumption by setting the optimum fan speed during runtime, in a way that is robust toworkload allocation.
In particular, this chapter analyzes previous cooling management strategies in the state-of-the-art, and proposes two policies: i) a first version based on a Look-Up-Table (LUT) approachthat is unaware of the workload dynamics, which we use to motivate the need of server model-ing and workload-awareness; and ii) an improved version that works for arbitrary workloadsand allocation schemes.
Our experimental results on a presently shipping enterprise server demonstrate that in-cluding leakage awareness in workload and cooling management provides additional energysavings without any impact on performance.
3.1 Introduction
Reducing the energy consumption for computation and cooling in servers is a major challengeconsidering the data center energy costs today. Server power consumption depends on thecharacteristics of the running workload and the allocation policy [44]. And, as shown in theprevious chapter, the impact of leakage and fan power is not negligible, specially in data cen-ters where cooling power is optimized. Nowadays, apart from dynamic server power, bothstatic and fan power need to be taken into account when designing energy optimization strate-gies at the server level.
However, state-of-the-art techniques are either focused at the CPU level, or, if scaled to theserver level, they tackle fan control, leakage power reduction, and temperature-aware work-load allocation problems separately [71]. Yet, server temperature and energy depend on deci-sions in all these domains. In order to obtain the highest possible energy savings in the overallserver power consumption, the dependencies between these domains need to be considered,motivating the design of a comprehensive multivariate control strategy.
This chapter proposes a strategy to reduce server energy consumption, in a way that isaware of the interactions among power, temperature, leakage, and workload dynamics. Ourspecific contributions are as follows:
• Based on our previous modeling, we develop a control strategy that proactively sets theoptimum cooling on runtime for arbitrary workloads.
• We study the relationship among power, temperature, application characteristics andworkload allocation when designing cooling strategies, and show the importance of
33

3. Leakage and temperature aware workload and cooling management at the server level
modeling to tackle arbitrary workloads.
• We test our policy on a commercial server, obtaining reductions on leakage plus fan energyof up to 6% compared to existing policies, and more than 9% compared to the defaultserver control policy, without imposing any performance penalty.
• We analyze the impact of workload allocation, showing how choosing the best-EDP al-location for a given load along with our proactive policy yields savings up to 15%.
• We apply our policy to a broader data center scenario, and demonstrate that by apply-ing our policies we can reduce the CPU power consumption of the whole cluster by2.5% compared to other techniques. Moreover, we show how the impact of our policyincreases as data room temperature raises.
The rest of the chapter is organized as follows. Section 3.2 describes the related work inthe area. Section 3.3 shows the experimental framework used to develop and validate ourstrategies. Section 3.4 describes the proposed policies, whereas Section 3.5 shows the trade-offs in terms of allocation. Section 3.6 and 3.7 present the results and discussion respectively,whereas Section 3.8 concludes the chapter.
3.2 Related Work
This section describes the related work in the area of cooling management techniques to in-crease the energy efficiency of servers, focusing on fan control strategies and workload alloca-tion policies.
3.2.1 Fan control
In the area of server energy efficiency, several works tackle fan control to reduce cooling costs.Xuefei et al. [71] propose a runtime fan controller based on offline thermal modeling validatedvia simulation. Wang et.al [164] propose an optimal fan speed control for thermal manage-ment of servers and tackle the problem of over-cooling. However, they disregard the leakagecontributions and its effects on power consumption. Shin et al. [145] use Dynamic Voltage-Frequency Scaling (DVFS) together with fan control to minimize cooling and CPU power in adesktop computer by using RC-based thermal models. Chan et al. [38] approach the fan con-trol problem both from the energy minimization and fan-induced vibration perspective. Theirsolution jointly minimizes the disk access errors caused by vibrations and the cooling powerconsumption. Even though our work could be combined with DVFS, our goal is to minimizeoverall server energy without relying on this technique as it introduces penalties in execu-tion time, potentially increasing energy consumption. Moreover, the research described in thischapter minimizes leakage and cooling power by proactively setting the optimum fan speedbefore a thermal event occurs, and is validated on a presently-shipping enterprise server.
Other approaches that take into account the leakage-cooling tradeoffs do not include asetup that enables fan speed control. These approaches control the fan speed indirectly bysetting a critical threshold to CPU temperature. Because leakage plus cooling power describe aconvex curve, policies such as TAPO-server, proposed by Huang et al. [77], indirectly vary fanspeed by controlling the processor thermal threshold at runtime to reactively find the optimumfan speed. TAPO is effective only with constant workloads as it waits for the thermal steady-state to control the fan speed. Similarly, recent work by Pradelle et.al. [134] uses a hill-climbingoptimization technique that optimizes the leakage-cooling tradeoffs. This technique relies onutilization as a proxy variable for the estimation of heat dissipation which, as we show inthis work, is not sufficient to select the optimum cooling for an arbitrary workload. In thiswork, we have direct control over the cooling subsystem of the server. Moreover, to enableproactiveness, we develop power and thermal models of the server to predict the leakage andcooling power for arbitrary workloads.
34

3.3. Experimental methodology
1500 2000 2500 3000 3500 4000 45000
10
20
30
40
50
60
Fan speed (RPM)
Pow
er
(W)
Fan power
Fan + leakage, mcf 64 threads
Leakage, mcf 64 threads
Fan + leakage, calculix 256 threads
Leakage, calculix 256 threads
Figure 3.1: Fan and leakage power for various workloads.
3.2.2 Workload allocation
There are some recent techniques that consider fan control together with scheduling for multi-objective optimization [16], [38]. These approaches make use of a joint energy, thermal andcooling management technique to reduce the server cooling and memory energy costs. Theypropose a thermal model that uses electrical analogies to represent the thermal coupling be-tween the server components and the effect of fan speed on heat dissipation. Our work, on thecontrary, is able to split and separately quantify the contributions of cooling power from thoseof leakage and total system power.
To the best of our knowledge, our approach is the first to present a leakage-aware mul-tivariate cooling management strategy that is robust to arbitrary workloads and allocationpolicies running on a presently-shipping enterprise server.
3.3 Experimental methodology
In this section we describe the motivation and experimental methodology followed to developthe proactive fan control policies. The goal of this work is to reduce the energy consumptionin enterprise servers found in energy-hungry data centers.
The main purposes of the server fans are to remove the heat produced and to prevent theoverheating of the hottest components such as CPUs and memories. The fan speed should becarefully selected to avoid overcooling, which implies high cooling costs, and also overheating,which results in shorter component lifetimes and higher leakage power. To clarify this point,Figure 3.1 shows the cubic increase in fan power with fan speed as well as the exponentialincrease in leakage power when fan speed decreases for two particular workloads running onthe SPARC server described in Section 2.3: (i) a memory intensive workload utilizing 25% ofthe server (64 copies of mcf ) and (ii) a CPU intensive workload fully utilizing the server (256copies of calculix). We observe that different RPM settings minimize the total fan plus leakagepower for the two workload scenarios.
We propose a proactive fan speed policy that sets the optimum cooling in a way that isaware of the leakage-cooling tradeoffs at the server, and yet robust to different workload al-location policies. To build this proactive policy, we use the models developed in the previouschapter, using as experimental setup the SPARC server described.
3.4 Cooling management policies
In this Section we describe the two proposed cooling management policies: i) a first approachbased on Look-Up-Table (LUT) fan control policy, and ii) a proactive fan control policy thatworks for arbitrary workloads, and that constitutes the main contribution of this work.
As shown next, the LUT based policy is derived for a particular workload and, thus, isunaware of workload characteristics and allocation. As we show in the results Section 3.6, to
35
3. Leakage and temperature aware workload and cooling management at the server level
leverage energy efficiency, we need a policy that works for arbitrary workloads and allocationpolicies. To this end, we propose the proactive fan control policy in subsection 3.4.2.
3.4.1 Look-Up-Table based policy
Theoretical background
The LUT-based policy uses the observations on leakage power shown in the previous chap-ter 2.4 but, instead of using the proposed models, it simply generates a LUT based on thepower-utilization values provided by the workload of the training set LoadGen.
As LoadGen stresses the system at different levels of utilization (U ), we can describe activepower as a function of U . Leakage has an exponential dependence on temperature T as shownin Eqn.( 3.1), where C is a constant. Using all the measurements of power and temperatureat a set of utilization values, we apply model fitting techniques to derive the constant valuesk1, k2, k3.
Pleak = k1 · U and Pleak = C + k2 · ek3·T (3.1)
For the equations above, we obtain the following parameters from the fitting: k1 = 0.4452,k2 = 0.3231, k3 = 0.04749, with a fitting error 2.243W and an accuracy of 98%. This fittinggives an analytical model that is valid across all utilization values for the LoadGen workload.
Based on the model fitting results we generate a Lookup Table (LUT) that holds the op-timum fan speed values for each utilization level. This fan control policy aims at setting theoptimum fan speed at runtime based on workload utilization. The main benefit of this tech-nique is that it is based solely on utilization, making it simple and fast due to its low overhead.
If CPU power was accurately represented by utilization for arbitrary workloads, this policywould yield the maximum energy savings. However, in the previous chapter, we showed that,in general, utilization is not a good proxy for CPU power. Thus, even though this policy worksfor LoadGen, we expect a worse performance for arbitrary workloads.
Implementation
The LUT-based policy periodically monitors server load by polling utilization through thesar and mpstat Solaris utilities. Given utilization, and based on the LUT output, we set fanspeed to the appropriate value by increasing or decreasing the current of the power supplies.Utilization is polled every second to be able to respond to sudden utilization spikes. Pollingthe utilization does not introduce any noticeable overhead on the CPUs. The controller makesdecisions based on changes in the load utilization rather than reacting to temperature changes,which allows the system to proactively set the optimum fan speed before a thermal eventoccurs.
In order to ensure the stability of the controller and to prevent fan reliability issues in thecase of unstable workloads, we set a maximum frequency for the fan speed changes. Thiscondition is important for the case of very fast changing or unstable workloads. We allowthe controller to react fast (i.e., change fan speed as soon as a spike is detected); however,we do not allow RPM changes for 1 minute after each RPM update. This 1-minute value isa tradeoff between the maximum number of fan changes allowed during the execution of ahighly variable workload and the maximum temperature overshoot we want to tolerate in oursystem. Note that 1-minute is a safe choice for our system considering the large thermal timeconstants.
3.4.2 Proactive fan control policy
This fan control policy uses temperature and power measurements to proactively determinethe fan speed that minimizes the fan plus leakage power. This policy uses the models in Chap-ter 2.4 to isolate the different contributors to power and, thus, as opposed to the previouspolicy, does not assume any particular workload characterstics.
36

3.4. Cooling management policies
We first describe how our policy works when setting fan speed for workloads that haveachieved a steady-state. Then, we improve our algorithm to tackle transients. Finally, wediscuss the applicability and overhead of our policy.
Figure 3.2 shows the fan speed selection procedure for steady-state. As discussed in Chap-ter 2.4, the dynamic power of a constant workload can be estimated by subtracting temperature-dependent leakage and idle power from the CPU power. Using dynamic power, we predictthe steady-state processor temperature under each available fan speed setting using our tem-perature model given in Section 2.5.1. Then, we calculate the expected steady-state leakageand fan power for every fan speed. Finally, we set the fan speed to the value that provides theminimum leakage plus fan power.
The workloads we use exhibit small fluctuations in power consumption that do not af-fect temperature significantly. To avoid inaccuracies caused by these fluctuations, we averagedynamic power over a period significantly smaller than the thermal time constants. In ourcase, we choose an 8-second averaging that captures the large changes in power that governtemperature while smoothing out the power trace.
Figure 3.2: Fan speed selection procedure for steady-state.
The main shortcoming of a steady-state approach is that it ignores the thermal transients.As the thermal time constants are large, the processor temperature can differ from its steady-state value by several degrees, especially for highly variable workloads, and energy can besaved during transients. We consider the transient behavior by proposing the run-time policygiven in Algorithm 1, where f represents a function and f−1 its inverse.
The policy first calculates the expected steady-state temperature Tss for each CPU (lines 2-3). Then, it computes the average temperature Tpred over the next τwait period, using a closedform integration of the transient temperature prediction (line 4). As temperature changesslowly, we find a dynamic power corresponding to Tpred using our steady-state temperaturemodel inversely, obtaining dynamic power (line 5).
We use dynamic power Pdyn,pred to predict the expected temperature Texp under each fanspeed (line 7). Next, the expected leakage power PleakT,exp under various fan speeds are cal-culated using the leakage model. We prevent the selection of fan speeds that result in temper-atures above the critical value Tcritical, by setting the corresponding leakage power to a veryhigh value.
All predictions until this point are done separately for each CPU. Finally, total server leak-age plus fan power consumption PleakT+fan is computed for all available fan speeds. Thepolicy selects the fan speed that provides the minimum PleakT+fan and waits τwait secondswhile monitoring the system for a workload change. If dynamic CPU power changes signifi-cantly, this interval is interrupted and the optimum fan speed is re-calculated. For our scenariothe dynamic CPU power change threshold is heuristically selected as 5W . The waiting timeensures the stability of the controller and prevents the fan reliability issues that could arisewith very frequent fan speed changes (i.e. in the order of seconds). For our system, we choose
37

3. Leakage and temperature aware workload and cooling management at the server level
Grammar 1 Policy1: for each CPU p do2: P pdyn = P pmeas − P
pidle − fleakage model(T
pmeas)
3: T pss = ftemperature model(Ppdyn)
4: T ppred = ftransient model(Tpss, T
pmeas)
5: P pdyn,pred = f−1temperature model(Tppred)
6: for each fan speed s do7: T p,sexp = ftemperature model(P
pdyn,pred)
8: if T p,sexp ≥ Tcritical then9: P p,sleakT,exp =∞
10: else11: P p,sleakT,exp = fleakage model(T
p,sexp)
12: end if13: end for14: end for15: for each fan speed s do16: P sleakT+fan = P sfan +
∑p P
p,sleakT,exp
17: end for18: Set fan speed to argmin
s(P sleakT+fan)
19: Wait τwait while monitoring Pdyn
a τwait value of 1 minute, which is a safe choice considering the large thermal time constants.We use a 300RPM resolution for the fan speed selection in our policy, which is a heuris-
tically selected value. This resolution is selected such that the available fan speeds lead toa sufficient approximation to the optimal cooling conditions. Selecting an unnecessarily fineresolution will increase the computational overhead of the policy.
Applicability
Our models and the fan speed algorithm are based solely on power and temperature mea-surements. Thus, they are agnostic to workload characteristics, and can be derived using anyconstant stress workload with controllable utilization. Even if sensor data rate is limited bymeasurement delay, the performance of our policy is not significantly affected as the thermaltime constants are in the order of minutes, which is much slower than the policy responsetime. Even though our policy does not consider hot spots on the chip, the operating points arewell below the critical thresholds.
Overhead
The fan speed control policy is run by the DLC-PC in our implementation. On the DLC-PC,the policy measures and averages power every second, and decides on the fan speed every 60seconds using LUTs and polynomials. The leakage and temperature prediction is computedonly for 9 different fan speeds that cover the entire fan speed range (from 1800 to 4200RPM)with a resolution of 300RPM. As these are very simple operations with long periods, the policyhas negligible overhead and can be easily implemented in the service processor.
3.5 Impact of workload allocation
This section describes the impact of workload allocation on the leakage-cooling and energy-performance tradeoffs at the server level.
38

3.5. Impact of workload allocation
CPU0 CPU0
CPU1 CPU1
a) Clustered b) Distributed
Disabled coreAllocated core
Figure 3.3: Clustered vs distributed allocation schemes for 128 active threads.
3.5.1 Allocation schemes
We experiment with two different allocation schemes: clustered and distributed. Clustered allo-cation packs all the threads together into the first N cores of the server, maximally utilizing allthe available hardware threads in a core. Distributed allocation spreads the workload as muchas possible into all available cores. Figure 3.3 shows a diagram of the clustered and distributedallocation for an application with 128 threads, i.e., 50% utilization. Each box in the figure rep-resents a core, each with 8 hardware threads that can be individually enabled or disabled. Inthe case of single-threaded benchmarks, we launch multiple copies to get various utilizationvalues.
Distributing the workload activates more cores and increases the number of available FPunits and integer pipelines, as well as the amount of cache and memory bandwidth. On theother hand, clustering the workload reduces the amount of active cores in the server, decreas-ing the power consumption. Recent enterprise servers come with core-disabling capabilitiesthat allow setting idle cores in deep sleep mode when all their hardware threads are disabled,saving up to 60% power [146].
3.5.2 Leakage-cooling tradeoffs
From the leakage-cooling perspective, distributed allocation reduces the CPU temperature bybalancing the workload across all cores. This generates similar temperatures in both CPUs,and thus, similar leakage power. However, clustering the workload stresses CPU0 more thanCPU1, and generates temperature and leakage imbalance between the CPUs. Thus, the sameworkload can yield different optimum fan speed values depending on the allocation scheme.Table 3.1 shows the impact of allocation for four workloads with different characteristics fromour test set with 75% utilization, all running under the same fan speed. As can be seen, thetemperature imbalance between the CPUs depends on the workload, and leads to differentoptimum fan speeds. For example, the optimum fan speed for Bodytrack is 1800RPM when theclustered allocation is selected, but 2400RPM if we select the distributed scheme.
As workload allocation changes the leakage and cooling tradeoffs, fan speed policies thatdo not take into account temperature and power imbalances cannot fully exploit the advantageof energy efficient dynamic fan control. Our proactive policy, on the contrary, is robust toworkload imbalances across the CPUs as it predicts the leakage for both CPUs separately andcomputes the optimum fan speed. Therefore, the policy finds the optimum regardless of howthe workload is allocated.
39

3. Leakage and temperature aware workload and cooling management at the server level
Task Allocation PCPU,dyn Pmem TCPU0 TCPU1
(W) (W) (2400rpm,◦C)
sjeng Distributed 55.2 32 57.4 55.4192 threads Clustered 47.4 31 59.4 52.9
mcf Distributed 14.9 95 54.3 51.5192 Clustered 14.2 98 56.5 51.4
calculix Distributed 75.1 114 63.4 60.7192 Clustered 65.1 99 66.4 55.6
bodytrack Distributed 30.0 16 55.2 53.1192 Clustered 26.3 18 54.7 50.6
Table 3.1: Summary of dynamic power and CPU temperature at 2400RPM for selected PARSECand SPEC benchmarks running with 192 threads
3.5.3 Energy-performance tradeoffs
Interesting tradeoffs exist in terms of performance and energy when clustering/distributingworkloads. Distributed allocation leads to a flatter thermal profile and maximally utilizespipelines, whereas clustering reduces the communication distance between threads, poten-tially increasing the performance of parallel applications with data sharing.
We use the Energy-Delay Product (EDP) metric, which weighs power against the square ofexecution time, for the joint evaluation of performance and energy. EDP is calculated consid-ering the total CPU power (PCPU ) and memory power (Pmem,dyn), as those are the two mainfactors affected by the workload allocation. We assume that when all the hardware threads ina core are disabled, the core goes into deep sleep mode and its idle power PCPU,idle is reduced.
0
0.5
1
a) Clustered vs distributed EDP for 192 threads
mcf
libqu
antu
m
zeus
mp
calculix
body
track
ferre
t
sjen
g
cactus
ADM
lbm
fluidan
imat
e
stre
amclus
ter
face
sim
Clustered
Distributed
0
0.5
1
b) Clustered vs distributed EDP for 128 threads
mcf
milc w
rf
zeus
mp
calculix
body
track
ferre
t
sjen
g
libqu
antu
m
cactus
ADM
lbm
fluidan
imat
e
stre
amclus
ter
face
sim
0
0.5
1
c) Clustered vs distributed EDP for 64 threads
mcf
milc w
rf
zeus
mp
calculix
body
track
ferre
t
sjen
g
libqu
antu
m
cactus
ADM
lbm
fluidan
imat
e
stre
amclus
ter
face
sim
Figure 3.4: Normalized EDP in clustered and distributed allocation schemes for SPEC CPUand PARSEC benchmarks under various number of threads.
Figure 3.4 presents the EDP comparison between the two allocation schemes for the bench-marks in our test set under various utilization values. The plot is normalized to the highest
40

3.5. Impact of workload allocation
Type Workload Perf. counters for distributedIPC Mem Acc. FP Instr L1 acc
High IPC sjeng 1.0 0.01 0.0 0.3
Mem. mcf 0.1 0.9 0.0 0.8intensiveHigh FP calculix 0.7 0.1 0.6 0.7
Instr.Low L1 & L2 bodytrack 0.3 0.0 0.4 0.1
misses
Table 3.2: Summary of performance counters (normalized to the highest value across bench-marks) of selected PARSEC and SPEC benchmarks with 192 threads.
Metric Benchmark
High IPC sjeng, fluidanimate, calculix, ferretHigh FP Instr. lbm, zeusmp, cactusADM, calculix, wrf
Memory intensive lbm, mcf, libquantum, milcLow L1 & L2 misses bodytrack, fluidanimate, canneal
Table 3.3: Summary of relevant characteristics for SPEC and PARSEC benchmarks. For eachparameter, benchmarks are ordered from high-to-low.
EDP value across experiments. We see that distributing is better for most cases, as the work-loads benefit from a larger number of available computational units. As expected, results forclustering and distributing converge as the number of threads increase. Note that for the caseswhere EDP are similar (e.g., libquantum with 192 threads), leakage-cooling tradeoffs should beconsidered when determining the most efficient allocation.
Because the results are highly dependent on the workload characteristics, we gather rel-evant performance counters to explain the differences in EDP between the two allocationschemes. First, we perform a correlation test over the performance counters when running thedistributed allocation scheme. We obtain a cross-correlation matrix between all performancecounters and EDP values, finding the following metrics to have high correlation with EDP: ac-tive thread count, Instructions Per Cycle (IPC), L1 data cache misses, Floating Point (FP) instructions,store instructions and number of read-write memory accesses. All metrics except active thread countand IPC are computed per instruction, and normalized to the highest observed value. Ta-ble 3.2 summarizes the most relevant features for some workloads. Table 3.3 groups togetherthe benchmarks that exhibit similar characteristics in terms of their performance counters, andthus, exhibit similar tradeoffs in EDP.
Putting together the experimental results of Figure 3.4, Table 3.2, and Table 3.3, we see thathigh-IPC CPU-bounded workloads such as sjeng, fluidanimate or calculix always benefit morefrom distributing, regardless of utilization. zeusmp and cactusADM do not have the highestIPC values, but they are FP-intensive. Because each core shares one FP unit among all threads,as utilization decreases, these benchmarks benefit more from being distributed. Benchmarkssuch as streamcluster have a high amount of synchronization locks between threads, so they donot benefit from a higher number of available pipelines, and are better clustered for all utiliza-tion cases. The performance of memory-intensive applications, such as mcf, lbm, libquantum,milc depends on the tradeoff between available memory bandwidth (decreases with higherutilization) and contention (increases with higher utilization).
In a more general way, we can highlight the following results regarding task classificationaccording to EDP:
• High-IPC and high-FP non-memory-intensive workloads achieve lower EDP when theyare distributed for all utilization values. However, benefits are higher as utilization de-creases.
41
3. Leakage and temperature aware workload and cooling management at the server level
• Low-IPC non-memory-intensive tasks (i.e., tasks with many synchronization locks) havelower EDP when they are clustered for all utilization levels.
• Memory-intensive benchmarks benefit more from distributing, especially for mediumutilization values, because of the tradeoffs between available memory bandwidth andcontention.
3.6 Results
In this section, we present several state-of-the-art policies and compare their performanceagainst our proposed fan control strategies. First, we show the performance of the LUT policywhen we use a synthetic workload pattern that stresses the system to different utilization val-ues using LoadGen. Then, we extend our results to the usage of arbitrary workloads from SPECCPU 2006 and PARSEC, presenting the benefits of the proactive fan control strategy based onour previous modeling.
We also show the tradeoffs in terms of energy and performance when using different allo-cation schemes and how our proactive fan control policy is robust to power and temperatureimbalances.
3.6.1 Baseline policies
Best fixed fan speed
The default server fan policy sets a fixed fan speed that ensures the server reliability for aworst-case scenario for each ambient temperature. The default fan speed for our server is of3000RPM, which leads to significant overcooling when the ambient temperature is low.
To ensure a fair comparison, apart from 3000RPM, we use the fan speed that minimizesleakage plus fan power for the majority of the workloads as a baseline to evaluate the benefitsof dynamic fan speed selection. After running all workloads under all fan speeds, we find thatthe best fixed fan speed in our system is 2400RPM for 22◦C ambient temperature. Fan speedis increased to 4200RPM if the CPU temperature reaches 87◦C to ensure safe operation.
Note that this policy does not predict leakage or temperature of the server at runtime, itonly uses the results of an off-line profiling to decide the best fixed fan speed. This profil-ing consists of running all workloads under all fan speeds, and selecting the fan speed thatminimizes power for the majority of workloads at a particular ambient temperature.
TAPO
The TAPO server fan control policy introduced by Huang et al. [77] changes the thermal setpoint Tsp of the processor to indirectly control the fan speed. Assuming the workload is con-stant, once the thermal steady-state is reached, the policy changes Tsp. Then, it observes thechange in the processor temperature and power processor to decide whether to increase ordecrease the setpoint to achieve lower power. We implement the Tsp selection mechanism onour SPARC server.
TAPO assumes an underlying fan controller that keeps the maximum processor tempera-ture at Tsp. In our TAPO implementation, we write a bang-bang fan speed control script thatchecks CPU temperature every ∆tminutes and changes the fan speed if the temperature is outof the range Tsp ±∆T . ∆T and ∆t are heuristically chosen as 5◦C and 2 minutes, respectively,to avoid fan speed oscillations. The fan speed resolution is 300RPM as in our proactive policy.
Bang-bang controller
The bang-bang controller tracks CPU temperature and tries to maintain the temperature withina desirable range by means of a multi-threshold controller. Our implementation tries to keeptemperature within the 65◦C-75◦C, thus: (i) if maximum temperature Tmax goes below 60◦C,fan speed is set to 1800RPM (lowest); (ii) if Tmax is in between 60◦C to 65 ◦C, fan speed is
42

3.6. Results
λ, µ Workload sequence (benchmark and number of threads)1 2 3 4 5 6 7 8 9 10
1 25 , 20 ferret libquan. zeusmp wrf calculix fluid. sjeng cactus facesim zeusmp128 192 128 128 128 192 128 128 128 128
2 25 , 20 zeusmp milc wrf sjeng mcf cactus calculix lbm canneal zeusmp192 128 128 128 128 128 64 128 64 192
3 15 , 10 sjeng mcf sjeng sjeng calculix facesim facesim facesim ferret facesim192 128 128 128 192 192 128 128 128 128
4 15 , 10 fluid. canneal stream. stream. canneal calculix canneal canneal lbm bodytrack192 128 64 64 128 128 64 64 192 192
Table 3.4: Summary of main characteristics for workload profiles. The profiles 1 and 3 have ap(high) of 0.8, and the profiles 2 and 4 have a p(high) of 0.2. Arrival (λ) and service (µ) timesare given in minutes.
lowered by 600RPM; (iii) if Tmax is between 65 to 75 degrees, no action is taken; (iv) if Tmaxrises above 75◦C, fan speed is increased by 600RPM; and, (v) if Tmax is above 80◦C, fan speedis increased to 4200RPM.
Smaller target temperature ranges (e.g., 70◦C-75◦C) increase fan speed change frequencywhereas larger ranges (e.g., 60◦C-75◦C) create higher temperature overshoots and under-shoots, which lead to higher fan speeds and larger thermal cycles. The threshold values areheuristically chosen to optimize this tradeoff, ensuring the stability of the controller whilekeeping temperature in a range that ensures high reliability and low leakage.
3.6.2 Workloads used
Synthetic LoadGen tests
To test the benefits of the LUT-based controller we use LoagGen to generate different syntheticprofiles of 80 minutes of total duration: (i) Test-1 ramps up and down from 0% to 100% utiliza-tion to test how controller reacts to gradual changes in utilization; (ii) Test-2 generates differentperiods (5, 10 and 15 minutes) between high and low utilization values to test controller re-action against sudden changes; (iii) Test-3 changes utilization values every 5 minutes to testreaction against sudden and frequent changes in utilization; and (iv) in Test-4 utilization valuefollows a statistical distribution of Poisson arrival times and exponential service times thatemulates a shell workload as described in prior work [104].
Arbitrary workload profiles
We generate 4 different workload profiles that exhibit a wide range of behaviors from a sta-tistical perspective to evaluate our policies agains existing methods. Each workload profileconsists of 10 tasks of the test set used for modeling and described in Chapter 2.3 (i.e., theworkloads from SPEC or PARSEC launched with certain number of copies as described inSections 2.4 and 3.5), generated with a Poisson statistical distribution of arrival (λ) and ser-vice (µ) times. To generate profiles with variable stress in terms of power consumption, allbenchmarks from SPEC and PARSEC with 25%, 50% and 75% utilization are arranged intotwo classes: high power consumption and low power consumption. For each profile, we varythe probability of choosing benchmarks from the high power class (p(high)). Within each class,benchmarks are chosen randomly.
Table 3.4 summarizes the main parameters of each profile, and describes the sequence ofbenchmarks.
3.6.3 Cooling management under synthetic workloads
First, we compare the performance of the default server fan speed policy (i.e. 3000 rpm) withthat of the most common policy, i.e. the bang-bang controller, and our LUT-based approach,under the synthetic tests.
43
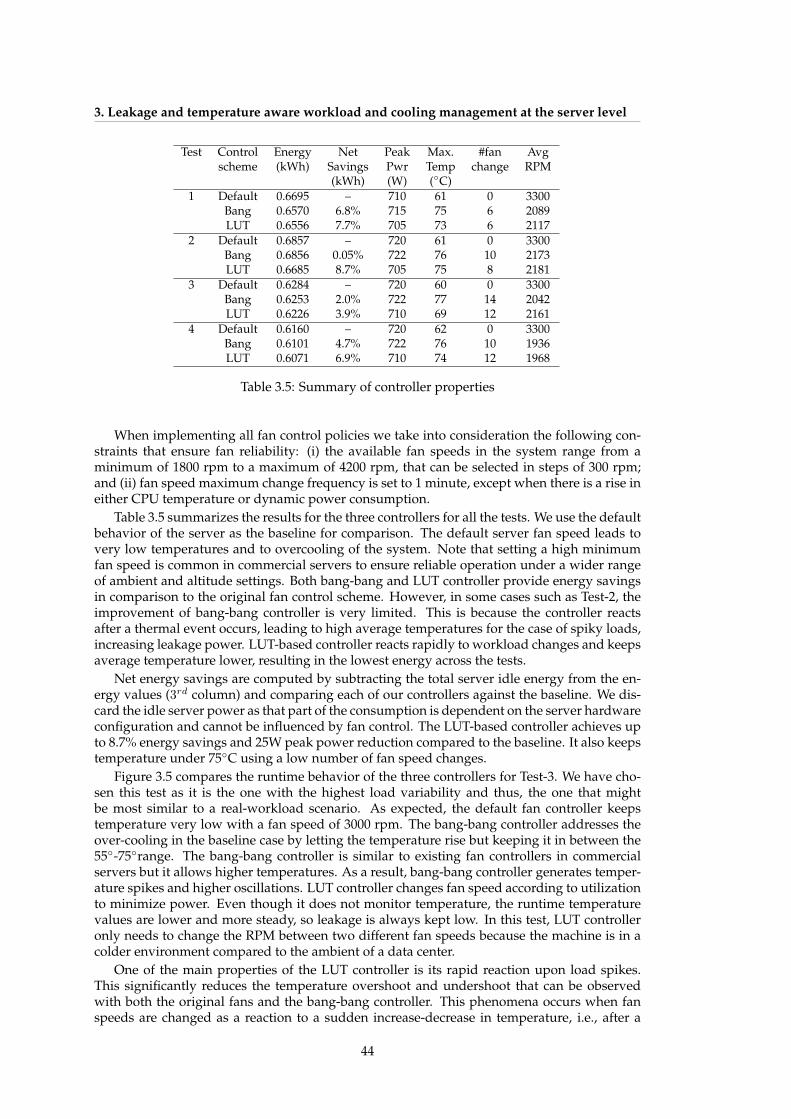
3. Leakage and temperature aware workload and cooling management at the server level
Test Control Energy Net Peak Max. #fan Avgscheme (kWh) Savings Pwr Temp change RPM
(kWh) (W) (◦C)1 Default 0.6695 – 710 61 0 3300
Bang 0.6570 6.8% 715 75 6 2089LUT 0.6556 7.7% 705 73 6 2117
2 Default 0.6857 – 720 61 0 3300Bang 0.6856 0.05% 722 76 10 2173LUT 0.6685 8.7% 705 75 8 2181
3 Default 0.6284 – 720 60 0 3300Bang 0.6253 2.0% 722 77 14 2042LUT 0.6226 3.9% 710 69 12 2161
4 Default 0.6160 – 720 62 0 3300Bang 0.6101 4.7% 722 76 10 1936LUT 0.6071 6.9% 710 74 12 1968
Table 3.5: Summary of controller properties
When implementing all fan control policies we take into consideration the following con-straints that ensure fan reliability: (i) the available fan speeds in the system range from aminimum of 1800 rpm to a maximum of 4200 rpm, that can be selected in steps of 300 rpm;and (ii) fan speed maximum change frequency is set to 1 minute, except when there is a rise ineither CPU temperature or dynamic power consumption.
Table 3.5 summarizes the results for the three controllers for all the tests. We use the defaultbehavior of the server as the baseline for comparison. The default server fan speed leads tovery low temperatures and to overcooling of the system. Note that setting a high minimumfan speed is common in commercial servers to ensure reliable operation under a wider rangeof ambient and altitude settings. Both bang-bang and LUT controller provide energy savingsin comparison to the original fan control scheme. However, in some cases such as Test-2, theimprovement of bang-bang controller is very limited. This is because the controller reactsafter a thermal event occurs, leading to high average temperatures for the case of spiky loads,increasing leakage power. LUT-based controller reacts rapidly to workload changes and keepsaverage temperature lower, resulting in the lowest energy across the tests.
Net energy savings are computed by subtracting the total server idle energy from the en-ergy values (3rd column) and comparing each of our controllers against the baseline. We dis-card the idle server power as that part of the consumption is dependent on the server hardwareconfiguration and cannot be influenced by fan control. The LUT-based controller achieves upto 8.7% energy savings and 25W peak power reduction compared to the baseline. It also keepstemperature under 75◦C using a low number of fan speed changes.
Figure 3.5 compares the runtime behavior of the three controllers for Test-3. We have cho-sen this test as it is the one with the highest load variability and thus, the one that mightbe most similar to a real-workload scenario. As expected, the default fan controller keepstemperature very low with a fan speed of 3000 rpm. The bang-bang controller addresses theover-cooling in the baseline case by letting the temperature rise but keeping it in between the55◦-75◦range. The bang-bang controller is similar to existing fan controllers in commercialservers but it allows higher temperatures. As a result, bang-bang controller generates temper-ature spikes and higher oscillations. LUT controller changes fan speed according to utilizationto minimize power. Even though it does not monitor temperature, the runtime temperaturevalues are lower and more steady, so leakage is always kept low. In this test, LUT controlleronly needs to change the RPM between two different fan speeds because the machine is in acolder environment compared to the ambient of a data center.
One of the main properties of the LUT controller is its rapid reaction upon load spikes.This significantly reduces the temperature overshoot and undershoot that can be observedwith both the original fans and the bang-bang controller. This phenomena occurs when fanspeeds are changed as a reaction to a sudden increase-decrease in temperature, i.e., after a
44
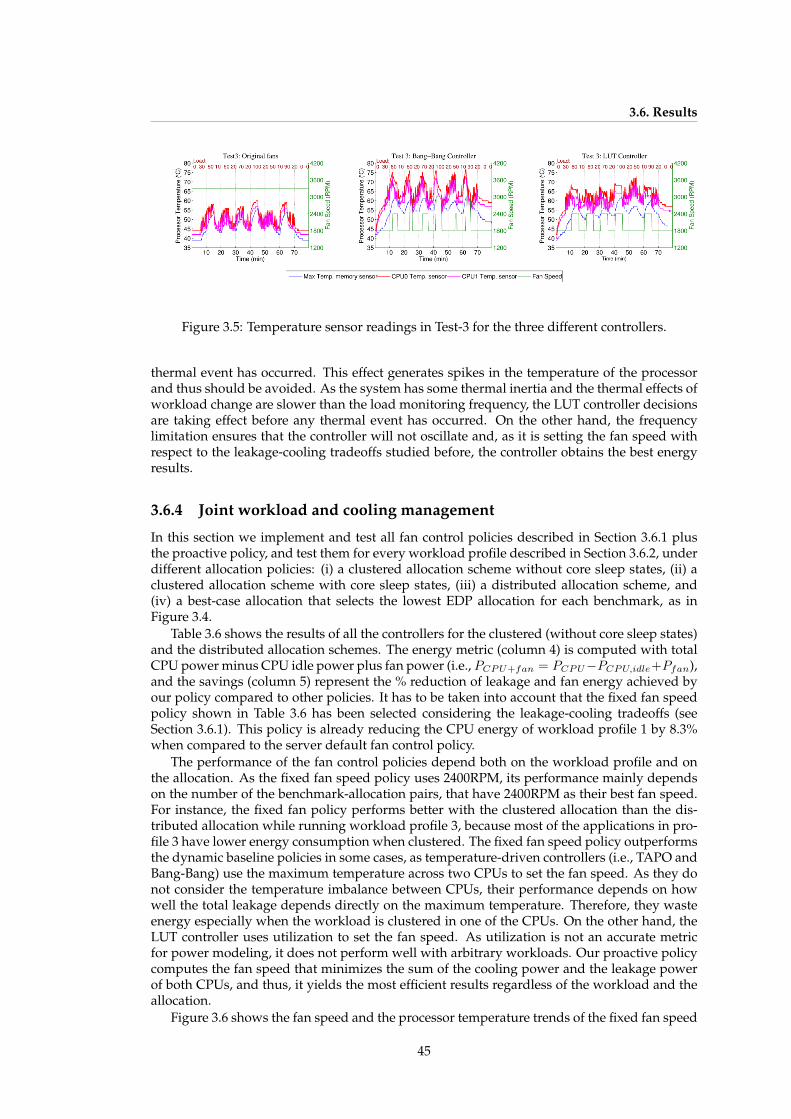
3.6. Results
Figure 3.5: Temperature sensor readings in Test-3 for the three different controllers.
thermal event has occurred. This effect generates spikes in the temperature of the processorand thus should be avoided. As the system has some thermal inertia and the thermal effects ofworkload change are slower than the load monitoring frequency, the LUT controller decisionsare taking effect before any thermal event has occurred. On the other hand, the frequencylimitation ensures that the controller will not oscillate and, as it is setting the fan speed withrespect to the leakage-cooling tradeoffs studied before, the controller obtains the best energyresults.
3.6.4 Joint workload and cooling management
In this section we implement and test all fan control policies described in Section 3.6.1 plusthe proactive policy, and test them for every workload profile described in Section 3.6.2, underdifferent allocation policies: (i) a clustered allocation scheme without core sleep states, (ii) aclustered allocation scheme with core sleep states, (iii) a distributed allocation scheme, and(iv) a best-case allocation that selects the lowest EDP allocation for each benchmark, as inFigure 3.4.
Table 3.6 shows the results of all the controllers for the clustered (without core sleep states)and the distributed allocation schemes. The energy metric (column 4) is computed with totalCPU power minus CPU idle power plus fan power (i.e., PCPU+fan = PCPU−PCPU,idle+Pfan),and the savings (column 5) represent the % reduction of leakage and fan energy achieved byour policy compared to other policies. It has to be taken into account that the fixed fan speedpolicy shown in Table 3.6 has been selected considering the leakage-cooling tradeoffs (seeSection 3.6.1). This policy is already reducing the CPU energy of workload profile 1 by 8.3%when compared to the server default fan control policy.
The performance of the fan control policies depend both on the workload profile and onthe allocation. As the fixed fan speed policy uses 2400RPM, its performance mainly dependson the number of the benchmark-allocation pairs, that have 2400RPM as their best fan speed.For instance, the fixed fan policy performs better with the clustered allocation than the dis-tributed allocation while running workload profile 3, because most of the applications in pro-file 3 have lower energy consumption when clustered. The fixed fan speed policy outperformsthe dynamic baseline policies in some cases, as temperature-driven controllers (i.e., TAPO andBang-Bang) use the maximum temperature across two CPUs to set the fan speed. As they donot consider the temperature imbalance between CPUs, their performance depends on howwell the total leakage depends directly on the maximum temperature. Therefore, they wasteenergy especially when the workload is clustered in one of the CPUs. On the other hand, theLUT controller uses utilization to set the fan speed. As utilization is not an accurate metricfor power modeling, it does not perform well with arbitrary workloads. Our proactive policycomputes the fan speed that minimizes the sum of the cooling power and the leakage powerof both CPUs, and thus, it yields the most efficient results regardless of the workload and theallocation.
Figure 3.6 shows the fan speed and the processor temperature trends of the fixed fan speed
45
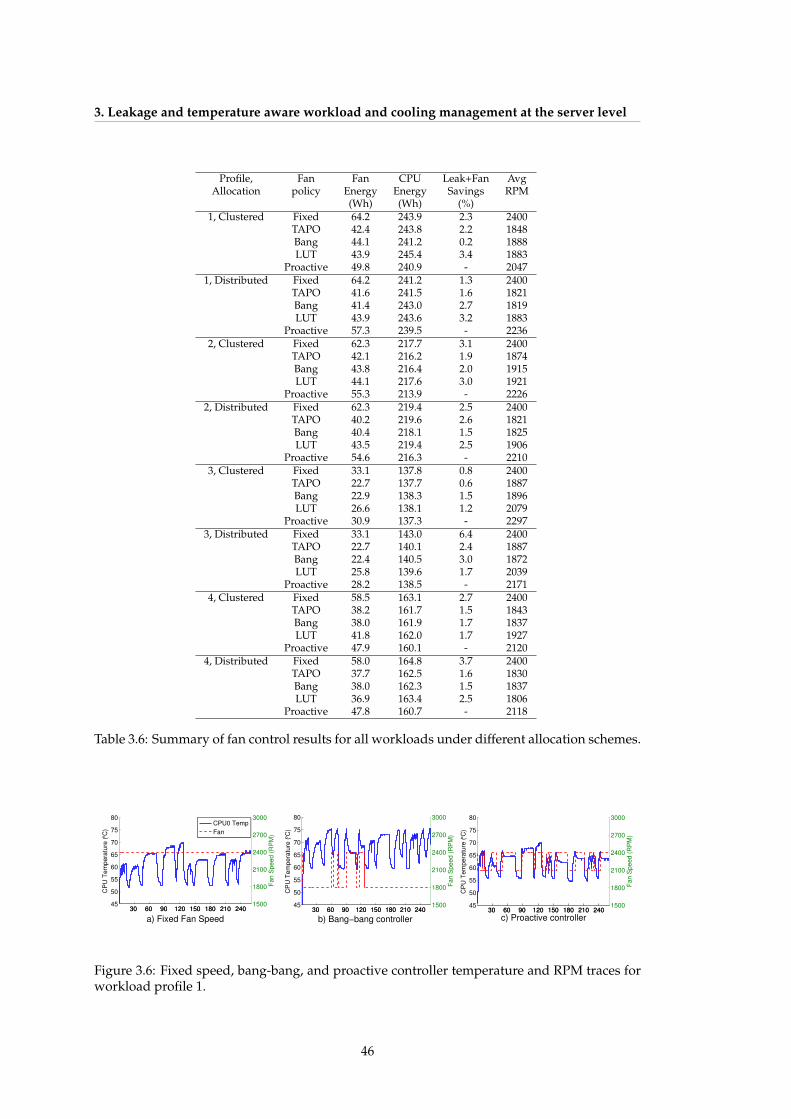
3. Leakage and temperature aware workload and cooling management at the server level
Profile, Fan Fan CPU Leak+Fan AvgAllocation policy Energy Energy Savings RPM
(Wh) (Wh) (%)1, Clustered Fixed 64.2 243.9 2.3 2400
TAPO 42.4 243.8 2.2 1848Bang 44.1 241.2 0.2 1888LUT 43.9 245.4 3.4 1883
Proactive 49.8 240.9 - 20471, Distributed Fixed 64.2 241.2 1.3 2400
TAPO 41.6 241.5 1.6 1821Bang 41.4 243.0 2.7 1819LUT 43.9 243.6 3.2 1883
Proactive 57.3 239.5 - 22362, Clustered Fixed 62.3 217.7 3.1 2400
TAPO 42.1 216.2 1.9 1874Bang 43.8 216.4 2.0 1915LUT 44.1 217.6 3.0 1921
Proactive 55.3 213.9 - 22262, Distributed Fixed 62.3 219.4 2.5 2400
TAPO 40.2 219.6 2.6 1821Bang 40.4 218.1 1.5 1825LUT 43.5 219.4 2.5 1906
Proactive 54.6 216.3 - 22103, Clustered Fixed 33.1 137.8 0.8 2400
TAPO 22.7 137.7 0.6 1887Bang 22.9 138.3 1.5 1896LUT 26.6 138.1 1.2 2079
Proactive 30.9 137.3 - 22973, Distributed Fixed 33.1 143.0 6.4 2400
TAPO 22.7 140.1 2.4 1887Bang 22.4 140.5 3.0 1872LUT 25.8 139.6 1.7 2039
Proactive 28.2 138.5 - 21714, Clustered Fixed 58.5 163.1 2.7 2400
TAPO 38.2 161.7 1.5 1843Bang 38.0 161.9 1.7 1837LUT 41.8 162.0 1.7 1927
Proactive 47.9 160.1 - 21204, Distributed Fixed 58.0 164.8 3.7 2400
TAPO 37.7 162.5 1.6 1830Bang 38.0 162.3 1.5 1837LUT 36.9 163.4 2.5 1806
Proactive 47.8 160.7 - 2118
Table 3.6: Summary of fan control results for all workloads under different allocation schemes.
30 60 90 120 150 180 210 24045
50
55
60
65
70
75
80
CP
U T
em
pera
ture
(°C
)
a) Fixed Fan Speed
30 60 90 120 150 180 210 2401500
1800
2100
2400
2700
3000
Fan S
peed (
RP
M)
30 60 90 120 150 180 210 24045
50
55
60
65
70
75
80
CP
U T
em
pera
ture
(°C
)
b) Bang−bang controller 30 60 90 120 150 180 210 240
1500
1800
2100
2400
2700
3000
Fan S
peed (
RP
M)
30 60 90 120 150 180 210 24045
50
55
60
65
70
75
80
CP
U T
em
pera
ture
(°C
)
c) Proactive controller
30 60 90 120 150 180 210 2401500
1800
2100
2400
2700
3000
Fan S
peed (
RP
M)
CPU0 Temp
Fan
Figure 3.6: Fixed speed, bang-bang, and proactive controller temperature and RPM traces forworkload profile 1.
46

3.7. Discussion on the impact at the data center
Profile, EDP Energy Exec.Time TCPUmax
Allocation (kWh2) (Wh) (min) (◦C)1, Clustered (w/o sleep) 2.63 823.8 192 71
Clustered (w/sleep) 2.33 731.6 192 71Distributed 1.83 712.4 154 67
Best-case 1.82 697.6 157 67.52, Clustered (w/o sleep) 2.87 818.0 210 68
Clustered (w/sleep) 2.48 707.9 210 68Distributed 1.84 697.6 158 66
Best-case 1.86 684.5 163 653, Clustered (w/o sleep) 0.74 428.1 104 71.5
Clustered (w/sleep) 0.67 383.7 104 71.5Distributed 0.55 384.4 85 68.5
Best-case 0.55 368.5 89 67.54, Clustered (w/o sleep) 2.1 634.3 196 71
Clustered (w/sleep) 1.7 525.7 196 71Distributed 1.9 617.5 182 64
Best-case 1.7 538.8 191 64.5
Table 3.7: EDP, Energy and performance for various allocation policies with proactive policy.
policy, the bang-bang policy, and the proactive policy running workload profile 1 under clus-tered allocation scheme. We observe that the proactive policy reduces oscillations in tempera-ture when compared to the bang-bang controller, as it maintains temperature within the rangethat minimizes the leakage plus fan power curve.
Finally, we compare the energy consumed by the workload profiles under different allo-cation schemes. Even though the SPARC T3 cores support core-level deep sleep modes, thecurrent software on our server does not support direct control over this feature. To overcomethis limitation, we use the reported sleep power values [146], and compute EDP for the sce-narios including sleep periods accordingly. We apply this computation adjustment to the realdata obtained in our system.
Table 3.7 shows a summary of EDP, energy, power and performance metrics for differentallocation policies under the proactive fan control policy. The energy results for columns 3and 4 are computed by summing up memory power and total CPU power. Column 5 reportsworkload execution time without considering the idle server time between workload arrivals.The best-case allocation shows the lowest energy consumption in most of the cases, resultingin up to 12.7% improvement when compared to a distributed allocation and up to 15% whencompared to a clustered allocation scheme. Even though the execution time of the best-caseallocation is longer than the distributed scheme in all cases, it results in better EDP by sav-ing more energy. Moreover, the best-case allocation reduces the maximum CPU temperaturewhen compared to the clustered allocation, and increases only by a maximum of 1◦C whencompared to the distributed allocation.
The tradeoffs in power, energy, temperature and performance need to be jointly handledin order to improve the energy efficiency at the server level. Our proactive cooling controlstrategy is aware of these tradeoffs, and thus, able to improve over the other state-of-the-art controllers on a wide range of workloads and different allocation schemes. Moreover,both the fan control strategy and the optimum workload allocation exhibit higher benefits forhighly-variable workloads (i.e. workload profiles 3 and 4) which are the ones more likely tobe observed in real data center environments.
3.7 Discussion on the impact at the data center
In this section, we present a case study to discuss and evaluate the impact of our server-levelpolicies with a data center scope. To this end, we gather server power traces of a high-performance computing cluster consisting of 260 computer nodes in 9 racks at the Madrid
47

3. Leakage and temperature aware workload and cooling management at the server level
22 27 320.5
0.6
0.7
0.8
0.9
1
Ambient temperature (deg)
No
rma
lize
d E
ne
rgy c
on
su
mp
tio
n
PUE=2.0 PUE=1.65 PUE=1.3 PUE=1.1
Figure 3.7: Normalized CeSViMa cooling plus IT power for the workload execution undervarious PUE scenarios
Supercomputing and Visualization Center (CeSViMa). By using the telemetry deployed inCeSViMa, we gather 3 hours of server power traces for 256 servers. We use these power tracesto simulate our proactive policy in a larger-scale scenario with a realistic workload profile.
We compute the energy savings that our policy would achieve when compared to the fixedfan speed policy (see Section 3.6.1). We calculate the savings for the whole cluster under dif-ferent room ambient temperatures that are within the allowable range published by ASHRAE(i.e., 15◦C to 32◦C for class A1 enterprise servers). We perform this analysis offline in sim-ulation space, applying our models and policy to the gathered power traces and computingthe energy savings. We analyze the effect of different ambient temperatures based on data byMiller et al., in which each degree of increase in room temperature yields 4% energy savingsin the cooling subsystem [109].
As room temperature raises, the fan speed needed to keep servers within safe environmen-tal conditions also increases. Hence, in our case study, we use a fixed fan speed of 2400RPM,2700RPM, and 3000RPM as a baseline for comparison under 22◦C, 27◦C, and 32◦C ambienttemperature, respectively. Our proactive policy outperforms both the fixed and the defaultserver fan policies for all power traces and under every ambient temperature scenario. Thesavings obtained are 1.9% at 22◦C ambient temperature, 5.5% at 27◦C, and 10.3% at 32◦C forthe whole cluster in leakage plus fan power. This is translated into a reduction of 2.5% in thetotal CPU energy consumption of the cluster at 27◦C ambient.
The impact of the leakage-temperature tradeoffs in the overall power consumption of thedata center increases as the data room cooling becomes more efficient, i.e., as PUE decreases.Figure 3.7 shows the total energy consumption in our simulations for different PUE scenarios.As we can see, for a PUE of 2.0, energy consumption significantly depends on the room tem-perature, whereas for PUE of 1.1, increasing temperature does not save energy. This is becauseleakage and fan power increase by 20% when room temperature raises from 22◦C to 32◦C.This observation is in accordance with prior work [129]. Note that the exact values are highlydependent on the cooling equipment as well as on the climate and altitude at which the datacenter is located.
Lower PUE values imply an increase in cooling efficiency; however, PUE does not accountfor the aggregate fan power, which climbs with the cubic power of fan RPMs, and CPU leakagepower (exponential with temperature). Hence, the reliability of PUE as an energy efficiencymetric decreases as the leakage and fan power continue to increase in next-generation servers.As the server-level leakage-cooling tradeoffs become more significant in modern data centers,the impact of our policy is expected to be even higher.
3.8 Conclusions
Using the models developed in the previous chapter, we have proposed a leakage-aware cool-ing control policy that minimizes the energy consumption. Our policy is able to work with
48
3.8. Conclusions
arbitrary workloads, and it is robust to variations in workload allocation. Our results on acommercial server show that our policy reduces the leakage plus fan energy by up to a 6% com-pared to existing policies and the CPU energy consumption by more than 9% compared tothe default server control policy, without imposing any performance penalty. We have alsoanalyzed the impact of workload allocation, and have shown that by choosing the best-EDPallocation for a given load along with using our proactive cooling control policy, we can obtainenergy savings by up to 15%.
The devised policy has also been applied in a broader distributed scenario with real datacenter traces, optimizing CPU power consumption by 2.5% for the whole cluster, and showinghow the impact of our policy raises as data room temperature increases.
In the next chapter...
we scale to a higher abstraction level, i.e. the data center, following our previous modeling-optimization methodology. The reader will find an unsupervised methodology for the devel-opment of overall server room modeling techniques to enable data center proactive optimiza-tion strategies.
49

4. Data center room-level modeling usinggramatical evolution techniques
A structure this beautiful just had to exist
— James Watson, talking about the DNA double helix
In this chapter we present an unsupervised methodology based on Gramatical Evolutiontechniques to model the inlet and CPU temperature of enteprise servers in a data room. Wetrain and test our models with real traces from enteprise servers, and show how our solutioncan be applied to the temperature prediction in a production data center. As a case study,we show how our methodology works for temperature prediction in CeSViMa data center, aresearch cluster that belongs to Universidad Politecnica de Madrid.
4.1 Introduction
The cooling needed to keep the servers within reliable thermal operating conditions is oneof the major contributors to data center power consumption, and accounts for over 30% ofthe electricity bill [33] in traditional air-cooled infrastructures. In the last years, both industryand academia have devoted significant effort to decrease the cooling power, increasing datacenter Power Usage Effectiveness (PUE), defined as the ratio between total facility power andIT power. According to a report by the Uptime Institute, average PUE improved from 2.5 in2007 to 1.89 in 2012, reaching 1.65 in 2013 [102]. Apart from using more efficient cooling sys-tems, raising data room ambient temperature is one of the most common strategies to increaseefficiency [102]. Some authors estimate that increasing the setpoint temperature by just one de-gree can reduce energy consumption by 2 to 5 percent [32]. Microsoft reports that raising thetemperature from two to four degrees in one of its Silicon Valley data centers saved $250,000in annual energy costs [107].
However, increased ambient temperatures reduce the safety margins to CPU thermal redlin-ing and may cause potential reliability problems. To avoid server shutdown, the maximumCPU temperature limits the minimum cooling. The key question of how to set the supplytemperature of the cooling system to ensure the worst-case scenario, is still to be clearly an-swered [54]. Most data centers typically operate with server inlet temperatures ranging be-tween 18◦C and 24◦C, but we can find some of them as cold as 13◦C degrees [32], [102], andothers as hot as 35◦C [108]. These values are often chosen based on conservative suggestionsprovided by the manufacturers of the equipment, and should always ensure inlet tempera-tures within the allowable range published by ASHRAE (i.e., 5◦C to 45◦C for class A4 volumeservers, and 15◦C to 32◦C for class A1 enterprise servers [13]).
Data center designers have collided with the lack of accurate models for the energy-efficientreal-time management of computing facilities. Nowadays, to simulate the inlet temperatureof servers under certain cooling conditions, designers rely on time costly and very expensiveComputational Fluid Dynamics (CFD) simulation. These techniques use numerical methodsto solve the differential equations that drive the thermal dynamics of the data room. They needto consider a comprehensive number of parameters both from the server and the data room(i.e. specific characteristics of servers such as airflow rates, model, data room dimensions and
51

4. Data center room-level modeling using gramatical evolution techniques
setup). Moreover, they are not robust to changes in the data center (i.e. rack placement andlayout changes, server turn-off, inclusion of new servers, etc.). If the simulation fails to prop-erly incorporate a relevant parameter, or if there is a deviation between the theoretical and thereal values, the simulation becomes inaccurate.
To minimize cooling costs, the development of models that accurately predict the CPU tem-perature of the servers under variable environmental conditions is a major challenge. Thesemodels need to work on runtime, adapting to the changing conditions of the data room, andenabling data center operators to increase room temperature safely.
The nature of the problem suggests the usage of meta-heuristics instead of analytical so-lutions. Meta-heuristics make few assumptions about the problem, providing good solutionseven when they have fragmented information. Some meta-heuristics such as Genetic Pro-gramming (GP) perform Feature Engineering (FE), a particularly useful technique to select theset of features and combination of variables that best describe a model. Grammatical Evolution(GE) is an evolutionary computation technique based on GP used to perform symbolic regres-sion [141]. This technique is particularly useful to provide solutions that include non-linearterms offering Feature Engineering capabilities and removing analytical modeling barriers.Also, designer’s expertise is not required to process a high volume of data as GE is an auto-matic method. However, GE provides a vast space of solutions that may need to be boundedto achieve algorithm efficiency.
This work develops a data center room thermal modeling methodology based on GE topredict on runtime and with sufficient anticipation the critical variables that drive reliabilityand cooling power consumption in data centers. Particularly, the main contributions of ourwork are the following:
• The development of multi-variable models that incorporate time dependence based onGrammatical Evolution to predict CPU and inlet temperature to the servers in a dataroom during runtime. Due to the feature engineering and symbolic regression per-formed by GE, our models incorporate the optimum selection of representative featuresthat best describe thermal behavior.
• The usa of a reduced experimental setup, consisting of real measurements taken from asingle server isolated in a fully sensorized data room to tune the models, selecting theoptimum parameters and fitness function. We prevent premature convergence by meansof Social Disaster Techniques and Random Off-Spring Generation, dramatically reducingthe number of generations needed to obtain accurate solutions.
• We offer a comparison with other techniques commonly used in literature to solve tem-perature modeling problems, such as autoregressive moving average (ARMA) modelsand linear model identification methods (N4SID).
• The proposal of an unsupervised automatic data room thermal modeling methodologythat scales our solution to a realistic Data Center scenario. As a case study, we modelCPU and inlet temperatures using real traces from a production data center.
Our work makes contributions in the area of data room thermal modeling, allowing the unsu-pervised generation of accurate temperature models able to work on runtime and adapt to theever changing conditions of these scenarios.
The remainder of this Chapter is organized as follows: Section 4.2 accurately describesthe modeling problem, whereas Section 4.3 provides an overview of current state-of-the-artsolutions. Section 4.4 describes our proposed solution. Section 4.6 shows the experimentalresults obtained, whereas Section 4.7 discusses these results. Finally, Section 4.8 concludes thechapter.
52
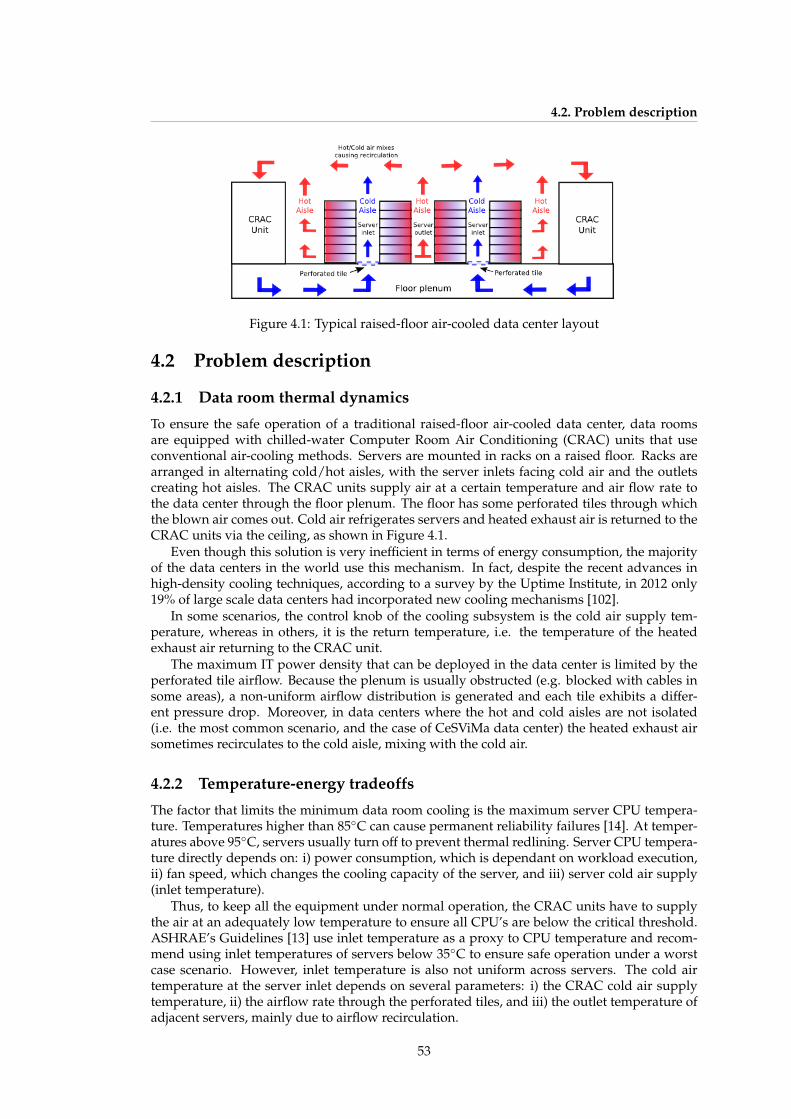
4.2. Problem description
Figure 4.1: Typical raised-floor air-cooled data center layout
4.2 Problem description
4.2.1 Data room thermal dynamics
To ensure the safe operation of a traditional raised-floor air-cooled data center, data roomsare equipped with chilled-water Computer Room Air Conditioning (CRAC) units that useconventional air-cooling methods. Servers are mounted in racks on a raised floor. Racks arearranged in alternating cold/hot aisles, with the server inlets facing cold air and the outletscreating hot aisles. The CRAC units supply air at a certain temperature and air flow rate tothe data center through the floor plenum. The floor has some perforated tiles through whichthe blown air comes out. Cold air refrigerates servers and heated exhaust air is returned to theCRAC units via the ceiling, as shown in Figure 4.1.
Even though this solution is very inefficient in terms of energy consumption, the majorityof the data centers in the world use this mechanism. In fact, despite the recent advances inhigh-density cooling techniques, according to a survey by the Uptime Institute, in 2012 only19% of large scale data centers had incorporated new cooling mechanisms [102].
In some scenarios, the control knob of the cooling subsystem is the cold air supply tem-perature, whereas in others, it is the return temperature, i.e. the temperature of the heatedexhaust air returning to the CRAC unit.
The maximum IT power density that can be deployed in the data center is limited by theperforated tile airflow. Because the plenum is usually obstructed (e.g. blocked with cables insome areas), a non-uniform airflow distribution is generated and each tile exhibits a differ-ent pressure drop. Moreover, in data centers where the hot and cold aisles are not isolated(i.e. the most common scenario, and the case of CeSViMa data center) the heated exhaust airsometimes recirculates to the cold aisle, mixing with the cold air.
4.2.2 Temperature-energy tradeoffs
The factor that limits the minimum data room cooling is the maximum server CPU tempera-ture. Temperatures higher than 85◦C can cause permanent reliability failures [14]. At temper-atures above 95◦C, servers usually turn off to prevent thermal redlining. Server CPU tempera-ture directly depends on: i) power consumption, which is dependant on workload execution,ii) fan speed, which changes the cooling capacity of the server, and iii) server cold air supply(inlet temperature).
Thus, to keep all the equipment under normal operation, the CRAC units have to supplythe air at an adequately low temperature to ensure all CPU’s are below the critical threshold.ASHRAE’s Guidelines [13] use inlet temperature as a proxy to CPU temperature and recom-mend using inlet temperatures of servers below 35◦C to ensure safe operation under a worstcase scenario. However, inlet temperature is also not uniform across servers. The cold airtemperature at the server inlet depends on several parameters: i) the CRAC cold air supplytemperature, ii) the airflow rate through the perforated tiles, and iii) the outlet temperature ofadjacent servers, mainly due to airflow recirculation.
53

4. Data center room-level modeling using gramatical evolution techniques
Setting the cooling air supply temperature to a low value (or, if not available, the hot airreturn), even though ensures safety operation, implies increased power consumption due to anlarger burden on the chiller system. The goal of energy-efficient cooling strategies is to reducethe cold air supply temperature without reaching thermal redlining. Due to the non-linearefficiency of cooling systems, lowering air supply temperature can yield important energysavings. A metric widely used is that each degree of increase in air supply temperature yields4% energy savings in the cooling subsystem [109].
To increase air supply temperature safely, however, we need to be able to predict not onlythe inlet temperature to the servers, but also the CPU temperature that each server attainsunder the current workload.
Due to the temperature gradients between hot and cold aisles, the air inside a data cen-ter performs like a turbulent fluid. Thus, obtaining an analytical relation between cool airsupply and server inlet temperature is not trivial, making inlet and CPU temperature predic-tion a challenging problem. Besides, data centers are composed of thousands of CPU cores,whose temperatures need to be modelled independently. This prevents the usage of classicalregression techniques that need human interaction to train and validate the models.
4.3 Related work
Data center room thermal modeling is a topic that arises much interest in literature as it en-ables both thermal emergency management and energy optimization and enhances reliability.Because of the non-linear behavior of the air and thermal dynamics in the data center room,Computational Fluid Dynamics (CFD) simulation has traditionally been the most commonlyused solution in both industry and research [96], [127], [147]. These works use CFD to modelthe inlet and outlet temperature of servers given the cooling air supply temperature and air-flow, a certain room layout, server configuration and data center utilization to either calculateand optimize cooling costs or to detect hot spots in servers [1], [112].
CFD solvers perform a three-dimensional numerical analysis of the physical thermody-namic equations that govern the data room. They use discretization techniques to transformdifferential equation into their algebraic non-linear form and iterate over them until they reacha suitable convergence, thus providing very accurate results. The main drawback of this so-lution is that CFD is computationally costly both in the modeling stage (i.e modeling a small-sized data room can take from hours to days) and in the evaluation phase, preventing theironline usage. Moreover, CFD simulation is not robust to changes in the layout of the data cen-ter, i.e. changes in the rack or server placement, open rack doors, open tiles, etc. Also, changeson the utilization of the data center, the number of servers running or intentional variation tothe cooling would require new simulations.
To solve these issues, recent research by Phan et.al. [131] proposes the usage of BuildingEnergy Simulation (BES) Programs and by means of a multi-zone modeling obtain a quickerinsight on the data room behavior with less accuracy and, thus, computational costs, thanCFD. Other approaches propose the usage of CFD together with sensor information to cal-ibrate the simulation and reduce computational complexity. The solution by Chen et.al. [40]achieves a prediction error below 2◦C when predicting temperature 10 minutes into the future.In fact, in the last years industry has started to agree upon the importance of environmentalroom monitoring [20] to improve energy efficiency. Several works [2], [152] present the datacenter as a distributed Cyber-Physical System (CPS) in which both computational and physicalparameters can be measured with the goal of minimizing energy consumption.
Our work leverages the concept of Cyber-Physical systems by using a monitoring systemdeveloped in our previous work [124] capable of collecting both environmental (i.e. cold airsupply temperature, inlet and outlet temperature, and airflow through tiles, etc.) and serverdata (i.e. CPU temperature, server power, fan speed, etc.) from a real data center scenario.
A common alternative to CFD modeling is the proposal of abstract heat flow models. Theselinear models characterize the steady state of hot air recirculation inside the data center, i.e.they assume that each inlet temperature rises above the supply temperature due to heat from
54

4.3. Related work
recirculation. Recirculation can be described by a cross-interference coefficient matrix whichdenotes how much of its outlet heat each node contributes to the inlet of every other node.This matrix is obtained in an offline profiling stage that usually simulates the inlet and outlettemperatures attained under certain cooling and workload conditions with CFD [157]. Eventhough the profiling is still costly, the evaluation stage can be performed online.
Machine learning techniques have also been used in data center modeling. The Weather-man [111] tool uses neural networks to predict the inlet temperature of servers given the datacenter utilization and cooling setup, obtaining prediction errors below 1◦C in over 90% of theirtraces. However, they use simulation traces obtained with CFD simulation for their trainingand test sets, instead of using data from a real data center. This approach disregards CPUtemperature and uses utilization to model power.
The main issues in all previous approaches are: i) they monitor and predict server inlettemperature instead of CPU temperature, ii) they do so for only certain data center cooling,server and workload configurations, iii) they use CPU utilization as a proxy for server powerconsumption, iv) they assume homogeneous data centers in which all servers are equal, v)assume that the fan speed of servers is always constant (something that is not true for cur-rent enterprise servers) and vi) they do not validate results with traces from real data centerscenarios.
Our work, on the contrary, first predicts inlet temperature and then uses this result to pre-dict CPU temperature, as this is the factor that limits cooling and drives server thermal shut-down. Both in our training and test sets, we use real traces obtained from enterprise serversin a data center. Moreover, as shown in previous work [177], in highly multi-threaded serverssuch as the ones found in data centers, utilization is not linear with power for arbitrary work-loads, and this can only be claimed for certain CPU-intensive workloads. Our solution can beapplied to heterogeneous data centers running arbitrary workloads, as it uses power insteadof utilization to predict temperature.
Enterprise servers come with automatic temperature-driven variable fan control policies.When fan speed changes, so does the airflow and the server cooling capacity. Moreover, fanpower has a cubic dependence with fan speed. Work by Patterson et.al. [129] presents someconservative numbers for fan current consumption on Intel platforms, showing how 1U serverfans can draw from 40 watts at peak load to 8 watts at the lowest speed. Our previous work inthis area also shows how server fans are an important contributor to server power consump-tion that should not be disregarded [176]. All previous policies assume that servers have aconstant airflow, disregarding the effects of automatic server fan control. Our work, on thecontrary, also considers the contribution of variable fan speed when modeling temperature.
At the server level, Heather et.al. [74] proposes a server temperature prediction modelbased on simplified thermodynamic equations, trading accuracy for execution time, obtainingresults within 1◦C of accuracy for CPU temperature. C-Oracle [137] is a software infrastruc-ture that uses the previous model to predict the temperature several minutes into the futurefor efficient thermal emergency management. Even though this approach predicts CPU tem-perature and takes into account inlet temperature, it does not predict the inlet and thus, isunaware of the thermal dynamics of the data room. Moreover, their solution needs specificknowledge about several server parameters, such as the mass and specific heat capacity of theserver hardware components, airflow and heat flow.
Our approach only uses information from the sensors deployed in the server and dataroom. Thus, it does not need any specific information on the server hardware dimensions,airflow or mass, making it suitable to model heterogeneous servers in all scenarios.
A very common approach to CPU temperature modeling is the usage of autoregressivemoving average (ARMA) modeling to estimate future temperature accurately based on previ-ous measurements [46]. Their main drawback is that, because they only use past temperaturesamples, the prediction horizon is usually below the second. Moreover, they do not provide aphysical model, disregarding the effect of power or airflow, and need to be retrained often.
Our work, on the contrary achieves prediction horizons of 1 minute for CPU temperatureand 10 minutes for inlet temperature with high accuracy. This enables data center operationsto take action before thermal events occur, by changing either workload or data room cooling.
55
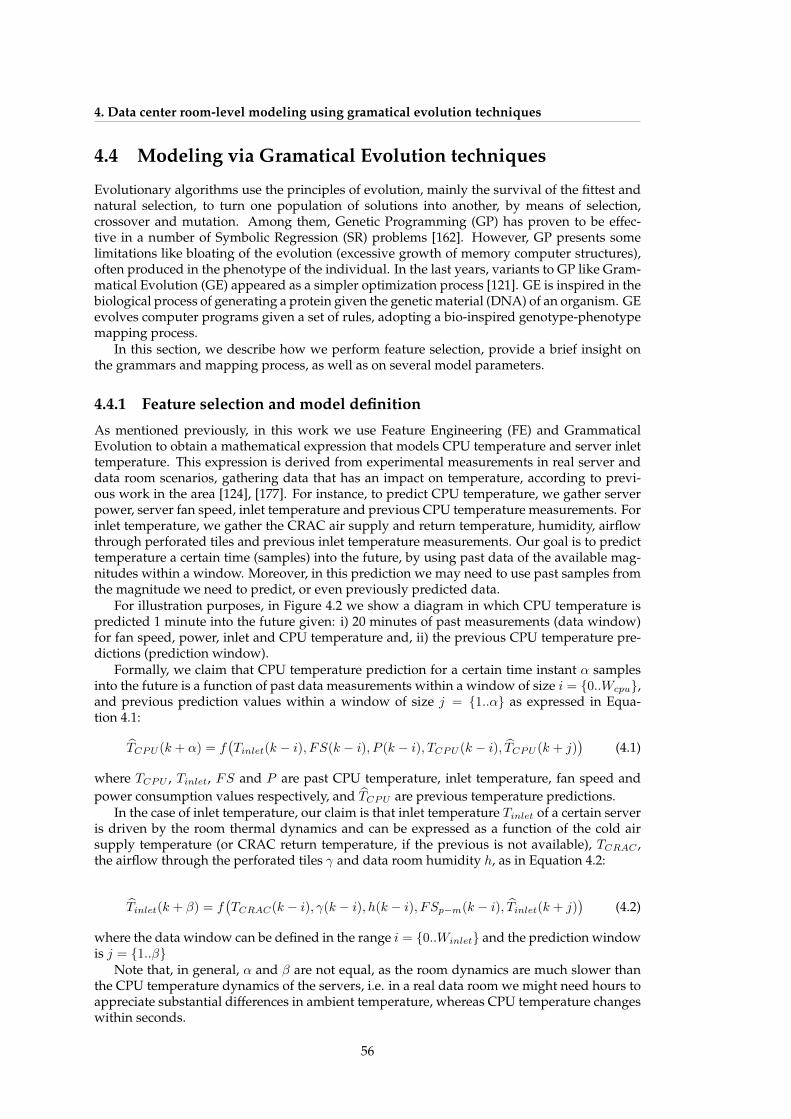
4. Data center room-level modeling using gramatical evolution techniques
4.4 Modeling via Gramatical Evolution techniques
Evolutionary algorithms use the principles of evolution, mainly the survival of the fittest andnatural selection, to turn one population of solutions into another, by means of selection,crossover and mutation. Among them, Genetic Programming (GP) has proven to be effec-tive in a number of Symbolic Regression (SR) problems [162]. However, GP presents somelimitations like bloating of the evolution (excessive growth of memory computer structures),often produced in the phenotype of the individual. In the last years, variants to GP like Gram-matical Evolution (GE) appeared as a simpler optimization process [121]. GE is inspired in thebiological process of generating a protein given the genetic material (DNA) of an organism. GEevolves computer programs given a set of rules, adopting a bio-inspired genotype-phenotypemapping process.
In this section, we describe how we perform feature selection, provide a brief insight onthe grammars and mapping process, as well as on several model parameters.
4.4.1 Feature selection and model definition
As mentioned previously, in this work we use Feature Engineering (FE) and GrammaticalEvolution to obtain a mathematical expression that models CPU temperature and server inlettemperature. This expression is derived from experimental measurements in real server anddata room scenarios, gathering data that has an impact on temperature, according to previ-ous work in the area [124], [177]. For instance, to predict CPU temperature, we gather serverpower, server fan speed, inlet temperature and previous CPU temperature measurements. Forinlet temperature, we gather the CRAC air supply and return temperature, humidity, airflowthrough perforated tiles and previous inlet temperature measurements. Our goal is to predicttemperature a certain time (samples) into the future, by using past data of the available mag-nitudes within a window. Moreover, in this prediction we may need to use past samples fromthe magnitude we need to predict, or even previously predicted data.
For illustration purposes, in Figure 4.2 we show a diagram in which CPU temperature ispredicted 1 minute into the future given: i) 20 minutes of past measurements (data window)for fan speed, power, inlet and CPU temperature and, ii) the previous CPU temperature pre-dictions (prediction window).
Formally, we claim that CPU temperature prediction for a certain time instant α samplesinto the future is a function of past data measurements within a window of size i = {0..Wcpu},and previous prediction values within a window of size j = {1..α} as expressed in Equa-tion 4.1:
TCPU (k + α) = f(Tinlet(k − i), FS(k − i), P (k − i), TCPU (k − i), TCPU (k + j)
)(4.1)
where TCPU , Tinlet, FS and P are past CPU temperature, inlet temperature, fan speed andpower consumption values respectively, and TCPU are previous temperature predictions.
In the case of inlet temperature, our claim is that inlet temperature Tinlet of a certain serveris driven by the room thermal dynamics and can be expressed as a function of the cold airsupply temperature (or CRAC return temperature, if the previous is not available), TCRAC ,the airflow through the perforated tiles γ and data room humidity h, as in Equation 4.2:
Tinlet(k + β) = f(TCRAC(k − i), γ(k − i), h(k − i), FSp−m(k − i), Tinlet(k + j)
)(4.2)
where the data window can be defined in the range i = {0..Winlet} and the prediction windowis j = {1..β}
Note that, in general, α and β are not equal, as the room dynamics are much slower thanthe CPU temperature dynamics of the servers, i.e. in a real data room we might need hours toappreciate substantial differences in ambient temperature, whereas CPU temperature changeswithin seconds.
56
4.4. Modeling via Gramatical Evolution techniques
Real data measurements
Grammatical Evolution
Predictionwindow
Data window
2 min
1 min
predicted samplecurrent measurement
Figure 4.2: CPU temperature prediction diagram. CPU temperature is predicted given pastdata measurements of various magnitudes (data window) and past CPU temperature predic-tions.
Among all data measurements within their window, to select the relevant features we dealwith a Symbolic Regression (SR) problem. SR tries to simultaneously obtain a mathematicalexpression while including the relevant features to reproduce a set of discrete data. In ourapproach, GE allows the generation of mathematical models applying SR.
Regarding both the structure and the internal operators, GE works like a classic GeneticAlgorithm [17]. GE evolves a population formed by a set of individuals, each one constitutedby a chromosome and a fitness value. In SR, the fitness value is usually a regression metriclike Root Mean Square Deviation (RMSD), Coefficient of Variation (CV), Mean Squared Error(MSE), etc. In GE, a chromosome is a string of integers. In the optimization process, GAoperators, (i.e. selection, crossover and mutation [65]) are iteratively applied to improve thefitness value of each individual. In order to compute the fitness function for every iteration andextract the mathematical expression given by an individual (phenotype), a mapping processis applied to the chromosome (genotype). This mapping process is achieved by defining aset of rules to obtain the mathematical expression, using grammars in Backus Naur Form(BNF) [121].
The process does not only perform parameter identification like in a classical regressionmethod. In conjunction with a well-defined fitness function, the evolutionary algorithm isalso computing mathematical expressions with the set of features that best fit the target system.Thus, GE is also defining the optimal set of features that derive into the most accurate powermodel.
Moreover, this methodology can be used to predict magnitudes with memory, such as tem-perature, where the current observation depends on past values. To incorporate time depen-dence, data used for model creation needs to be a timeseries. In addition, we need to tune ourgrammars so that they can produce models where past temperature values can be used to pre-dict temperature a certain number of samples into the future. Grammar 2 shows an examplewhere variable x may take values in the current time step k, i.e., x[k−0] or in previous sampleslike x[k−1] or x[k−2]. Moreover, a new variable xpred[k− idx] can be included, that accounts
57

4. Data center room-level modeling using gramatical evolution techniques
for previously predicted values of variable x.Including time dependence into a grammar has some drawbacks that need to be taken into
account when generating the models. First, we are substantially increasing the search spaceof our algorithms, as now the GE needs to search for the best solution among all variableswithin the specified window. As a consequence, the number of generations needed to obtain agood fitness increases. Second, as we show in the results section, depending on the predictionhorizon (i.e. the number of samples ahead we want to predict) the models tend to fall into alocal optimum, in which the best phenotype is the last available observation of the variable tobe predicted.
Grammar 2 Example of a grammar in BNF format that generates phenotypes with time de-pendence
(I)〈expr〉 ::= 〈expr〉〈op〉〈expr〉 | 〈preop〉(〈expr〉) | 〈var〉
(II)〈op〉 ::= +|-|*|/
(III)〈preop〉 ::= sin| cos | log
(IV)〈var〉 ::= x[k-〈idx〉] | xpred[k-〈idx〉] | y | z | 〈num〉
(V)〈num〉 ::= 〈dig〉.〈dig〉 | 〈dig〉
(VI)〈dig〉 ::= 0 | 1 | 2 | 3 | 4 | 5
(VII)〈idx〉 ::= 0 | 1 | 2
For a more detailed explanation on the principles of the mapping process, and how the BNFgrammars are used to incorporate time dependence, the reader is referred to Appendix A.3.1.
4.4.2 Preventing premature convergence
Premature convergence of a genetic algorithm arises when the chromosomes of some highrated individuals quickly dominate the population, constraining it to converge to a local opti-mum. The premature convergence is generally due to the loss of diversity within the popula-tion, and is one of the major shortcomings when trying to model low variability magnitudesby using GE techniques, as we show in Section 4.6.
To overcome the lack of variety in the population, work by Kureichick et.al. [105] proposesthe usage of Social Disaster Techniques (SDT). This technique is based on monitoring the pop-ulation to find local optima (i.e. a loss of diversity, usually diagnosed by a lack of improvementin the fitness function), and apply one of these two operators:
1. Packing, in which all individuals having the same fitness value except one are fully ran-domized.
2. Judgment day, in which only the fittest individual survives while the remaining are fullyrandomized.
Work by Rocha et.al. [140] proposes the usage of Random Off-spring Generation (ROG)to prevent the crossover of two individuals with equal genotype, as this would result in theoff-spring being equal to the parents. To this end, individuals are tested before crossover and,if equal, then one off-spring (1-RO) or both of them (2-RO) are randomly generated.
Both previous solutions have shown important benefits in classical Genetic Algorithmsproblems. In our work, we use these techniques to improve the convergence time of oursolutions, as we show in Section 4.6.
58
4.5. Experimental methodology
4.4.3 Fitness and problem constraints
The goal of using GE for data room thermal modeling is to obtain accurate models, able topredict future samples of a certain magnitude. Thus, our fitness function needs to expressthe error resulting in the estimation process. To measure the accuracy in our prediction, wewould preferably use the Mean Absolute Error (MAE). However, because temperature is amagnitude that varies slowly and might remain constant during large time intervals, we needto give higher weight to large errors. To this end, we select the Root Mean Square Error (RMSE)as a fitness function.
As we are modeling the behavior of physical magnitudes, (i.e., temperature), for optimiza-tion purposes, it is desirable to obtain a solution with physical meaning. To this end, we canconstrain the model generation in several ways that are next presented:
• Constraining the grammar to obtain a limited number of functions that match the phys-ical world. E.g. including the exponential function when modeling temperature.
• Biasing fitness to force the appearance of some parameters that we know drive the vari-ables being modelled. E.g. giving worse fitness to expressions that do not include powerconsumption when modeling temperature.
• Use of real vs. mixed models. Purely real cannot use future predictions of the vari-able, whereas purely predictive models do not used previous temperature data mea-surements, but may use previous predictions. Adding the predicted samples as a vari-able to our grammars increases the size of the search space and, thus, we expect longerconvergence time. However, it may deliver more accurate results.
In the results Section 4.6 we evaluate the impact of these constraints in the model gener-ation stage. Further explanation on the fitness and problem constraints is provided in Ap-pendix A.3.1.
4.5 Experimental methodology
In this section we describe the experimental methodology followed in this paper to modelserver and environmental parameters in Data Centers.
First, we describe the experimental setup of a reduced scenario consisting only in the tem-perature prediction of one server in a small air-cooled data room. We use this scenario to tunethe model parameters, testing those that generate better models and studying the convergenceof the solutions. Once we have tested that our solution works in the reduced scenario, we ap-ply the best algorithm configuration to a real data center. As a case study, we use the real tracesof CeSViMa data center, a High Performance Computing cluster at Universidad Politecnica deMadrid.
4.5.1 Reduced scenario
Our reduced scenario consists on an Intel Xeon RX-300 S6 server equipped with 1 quad-coreCPU and 16GB of RAM. The server is installed in a rack with another 4 servers, 2 switchesand 2 UPS units, in an air-cooled data room of approximately 30 square meters, with the rackinlet facing the cold air supply and the outlet facing the heat exhaust. The air conditioningunit mounted in the data room is a Daikin FTXS30 split, used to cool all the servers in the dataroom. In this reduced scenario, the split unit is mounted on the ceiling of the data room, andthere is no floor plenum. The cold air supply ranges from between 16◦C to 26◦C. Both theservers and the environment of the reduced scenario are fully monitored, and we have controlover both the environmental parameters (i.e. we can change the data room cooling at will) andthe server parameters (i.e. we control the workload being executed).
59

4. Data center room-level modeling using gramatical evolution techniques
Monitoring
Both the server and the data room are fully monitored using the internal server sensors anda wireless sensor network, as described in [124]. In particular, server CPU temperature andfan speed values are obtained via the server internal sensors, collected through the IntelligentPlatform Management Interface (IPMI) tool 1. IPMI allows to poll the internal sensors of theenterprise server with negligible overhead. Because the server is not shipped with powerconsumption sensors, we use non-intrusive current clamps connected to the power cord of theserver to gather total server power consumption. Wireless nodes monitor the inlet temperatureof the server, the cold air supply temperature of the split unit and data room humidity. All datais sent to the monitoring server where it is stored and measurements are aligned to ensure acommon timestamp.
Training and test set generation
We generate a training and a test set by assigning a wide variety of workloads that exhibitdifferent stress levels in both the CPU and memory subsystems of the server while we modifythe cold air supply temperature of the split in a range from 16◦C to 26◦C.
The workloads used are the following: i) Lookbusy2, a synthetic workload that stresses theCPU to a customizable utilization value, avoiding the stress of memory and disk; ii) a modi-fied version of the synthetic benchmark RandMem3, that allows us to stress random memoryregions of a given size with a given access pattern, and iii) HPC workloads belonging to theSPEC CPU 2006 benchmark suite [148].
During the training set, we launch Lookbusy and Randmem at different utilization values,plus a subset of the SPEC CPU 2006 benchmarks that exhibit a distinctive set of characteristicsaccording to Phansalkar et.al. [132]. Both the idle time between tasks and the duration ofeach task are randomly selected. During execution, the cold air supply temperature is alsorandomly changed.
For the test set, we randomly launch any SPEC CPU benchmark, with also random waitingintervals and randomly changing cold air supply temperature.
Our monitoring system collects all data with a 10 second sampling interval for a total timeof 5 hours for the training and 10 hours for the test set. Figure 4.3 shows part of the trainingset used for modeling.
4.5.2 Case study: CeSViMa data center
To show how our solution can be applied to a real data center scenario, this paper presents acase study for a real High-Performance Computing data center at the Madrid Supercomputingand Visualization Center (CeSViMa)4. CeSViMa hosts the Magerit Supercomputer, a clusterconsisting of 286 computer nodes in 11 racks, providing 4,160 processors and nearly 200 TB ofstorage. 245 of the 286 nodes are IBM PS702 2S with 2 Power7 CPU’s blade servers, each with8 cores running at 3.3GHz and 32GB of RAM. The other 41 nodes are HS22 2U servers with 2Intel Xeon processors of 8 cores each at 2.5GHz (10.2GFlops) and 64GB RAM. Magerit executesHigh-Performance jobs on demand with a maximum node reservation for high priority jobsof 1024 processors during 72 hours. The remaining infrastructure in CeSViMa hosts a PrivateCloud and storage units.
CeSViMa data room has a cold-hot aisle layout and is cooled by means of 6 CRAC unitsarranged in the walls that impulse air through the floor plenum. To control data room cooling,the air return temperature of each CRAC unit can be set independently. The room has a totalsize of 190 square meters. Figure 4.4a shows the layout of the data center. Rack 0 is a controlrack that runs no HPC computation. Racks 1-9 are filled with Power7 nodes, whereas rack10 contains Intel Xeon servers. Each Power 7 node (i.e. each blade server) is installed in a
1http://ipmitool.sourceforge.net/2http://www.devin.com/lookbusy/3http://www.roylongbottom.org.uk4http://www.cesvima.upm.es/
60

4.5. Experimental methodology
100 200 300 400 500 600 700 80020
25
30
Te
mp
(de
g)
a) Inlet temperature
100 200 300 400 500 600 700 800120140160180200220
Po
we
r(W
)
b) Server power consumption
100 200 300 400 500 600 700 8003000
4000
5000
6000
Fa
n s
pe
ed
(rp
m)
c) Server fan speed
100 200 300 400 500 600 700 800
40
60
Te
mp
(de
g)
d) Measured CPU temperature
Figure 4.3: Training samples used for CPU temperature modeling
blade center (i.e. a chassis). Each blade center contains up to 7 blades, and each rack contains4 chassis (C01 to C04), as shown in Figure 4.4b. To run our models, we have deployed thesame sensor network that in the reduced scenario. In particular, to model inlet temperaturewe gather inlet temperature, humidity, CRAC air return temperature and differential pressurethrough the floor plenum. Because we have placed pressure sensors in the tiles in front ofracks 1 and 4, we model the Power7 nodes in these racks. Moreover, data from all servers aregathered also via IPMI. To model CPU temperature, apart from the previous metrics we alsocollect temperature and fan speed. CeSViMa Power7 chassis do not have per-server currentsensors to measure the power consumption drawn and because each server is installed in achassis, we are not able to deploy current clamps. Thus, we use per-server utilization as aproxy for the power consumption of the node. As stated before, utilization is not an accuratemetric for arbitrary workloads. However, because of the nature of the workloads in CeSViMaand only for thermal modeling purposes, utilization can be used as a proxy variable to powerconsumption, as we show in Section 4.6.
In this work we show the results for the modeling of the servers highlighted in red inFigure 4.4, i.e. nodes 1,4,7 at chassis c02 of both rack 1 and 4. These nodes are the ones thatexhibit the most variable workload and the most extreme temperature conditions and, thus,the worst-case scenario for modeling purposes.
4.5.3 Modeling framework
Because of the large number of servers in CeSViMa, to enable cooling optimization we need aframework that allows us to automatically model and predict the CPU and inlet temperatureto all servers. Even though CeSViMa is a small-sized data room, it has a very high densityin terms of IT equipment. For instance, the amount of data gathered that needs to be pro-cessed to enable full environmental modeling and prediction, for a period of 1 year, is above100GB. Thus, modeling the whole data center with traditional approaches that require humaninteraction is not feasible.
Our work uses the proposed Grammatical Evolution techniques to automatically model allthe parameters involved in data center optimization in an unsupervised way, by automaticallyrunning the training of the algorithms and testing them during runtime.
61

4. Data center room-level modeling using gramatical evolution techniques
StorageRack
10
CRAC
CRAC
CRAC C
RAC
CRAC
CRAC
VPS
C02
C01
C03
C04
1 2 3 4 5 6 7
a) CeSViMa Data Center room layout b) Power7 rack front view
Figure 4.4: CeSViMa data room layout. Models are developed for Power7 nodes 1,4 and 7 athigh c02 in racks 1 and 4.
4.6 Results
In this section we present the experimental results obtained when applying Grammatical Evo-lution to model CPU and inlet temperature. First, we show the results for the reduced scenario,describing the best algorithm configuration, and compare our solution with other state-of-theart solutions. Then, we apply the best configuration to train and test the models in a real datacenter scenario, in which we predict both CPU and inlet temperature in an automatic way.
4.6.1 Algorithm setup and performance
First, we use GE to obtain a set of candidate solutions with low error when compared to thetemperature measurements in our reduced experimental setup, under different constraints.
After evaluating the performance of our model with several setups, we select the followingone for all models in this chapter:
• Population size: 200 individuals
• Chromosome length: 100 codons
• Mutation probability: inversely proportional to the number of rules.
• Crossover probability: 0.9
• Maximum wraps: 3
• Codon size: 8 bits (values from 0 to 255)
• Tournament size: 2 (binary)
For CPU temperature prediction, we use a data window of Wcpu = 20 samples, and a pre-diction window of α = 6. As we have a 10-second sampling rate, we are able to predict CPUtemperature 1 minute into the future. Both values are heuristically chosen based on experi-mental observations. On the one hand, the prediction window is chosen given the physicalconstraints of the problem: 1-minute prediction is long enough to change the workload as-signment of a server and, thus, change energy consumption or avoid thermal redlining. On
62

4.6. Results
the other hand, the window size Wcpu has been chosen with respect to the largest temperaturetransient observed.
For inlet temperature prediction, we also use a data window of Winlet = 20 samples but aprediction window of β = 5 samples. Inlet temperature dynamics are much slower than CPUtemperature. Because of this, a sampling rate of 2 minutes over inlet temperature is sufficientto get accurate results. Given the size of the prediction window, we are able to obtain inlettemperature samples 10 minutes into the future, which is sufficient time to act upon data roomcooling.
Next, we present the comparison among several configurations in terms of grammar ex-pressions and rules, premature convergence prevention and fitness biasing. We detail ourresults for CPU temperature modeling. The procedure to tune inlet temperature models iscompletely equivalent.
Data preprocessing and model simplification
Because the power measurements of the Intel Xeon server are taken with a current clamp,the power values obtained exhibit some noise. We preprocess the data to eliminate the high-frequency noise, smoothing the power consumption trace by means of a low pass filter. Theremaining traces did not exhibit noise, so no preprocessing was needed.
Moreover, we perform variable standardization for every feature (in the range [1, 2]) toassure the same probability of appearance for all the variables and to enhance the GE symbolicregression.
Grammars used
To model CPU temperature we have tested three different grammars:
• The first one is shown in Grammar 3 and contains a wide set of operands and pre-operands (rules II and III), that do not necessarily result into models with a physicalmeaning.
• The second grammar is a variation of Grammar 3 in which the number of preoperands(rule III) is reduced to exponentials only, i.e. 〈preop〉 ::= exp
• The last grammar is the one presented in Grammar 4 and also reduces the set of possibleexpressions (rule I).
Grammar 3 Grammar used for CPU temperature modeling in BNF format, that uses inlettemperature (TIN), fan speed (FS), power consumption (PS), past CPU temperature (TS) andpast predicted CPU temperature (TpS)
(I)〈expr〉 ::= 〈expr〉〈op〉〈expr〉|(〈expr〉〈op〉〈expr〉)| 〈preop〉(〈expr〉)|〈var〉|〈cte〉
(II)〈op〉 ::= +|-|*|/
(III)〈preop〉 ::= exp | sin | cos | tan
(IV)〈var〉 ::= TS[k-〈idx〉]|TIN[k-〈idx〉]|PS[k-〈idx〉]|FS[k-〈idx〉]
(V)〈idx〉 ::= 〈dgt2〉〈dgt〉
(VI)〈cte〉 ::= 〈dgt〉.〈dgt〉
(VII)〈dgt〉 ::= 0|1|2|3|4|5|6|7|8|9
(VIII)〈dgt2〉 ::= 0|1
From the previous three grammars the one that has faster convergence time to achieve alow error, is Grammar 4. Constraining the grammar increases convergence time and provides
63
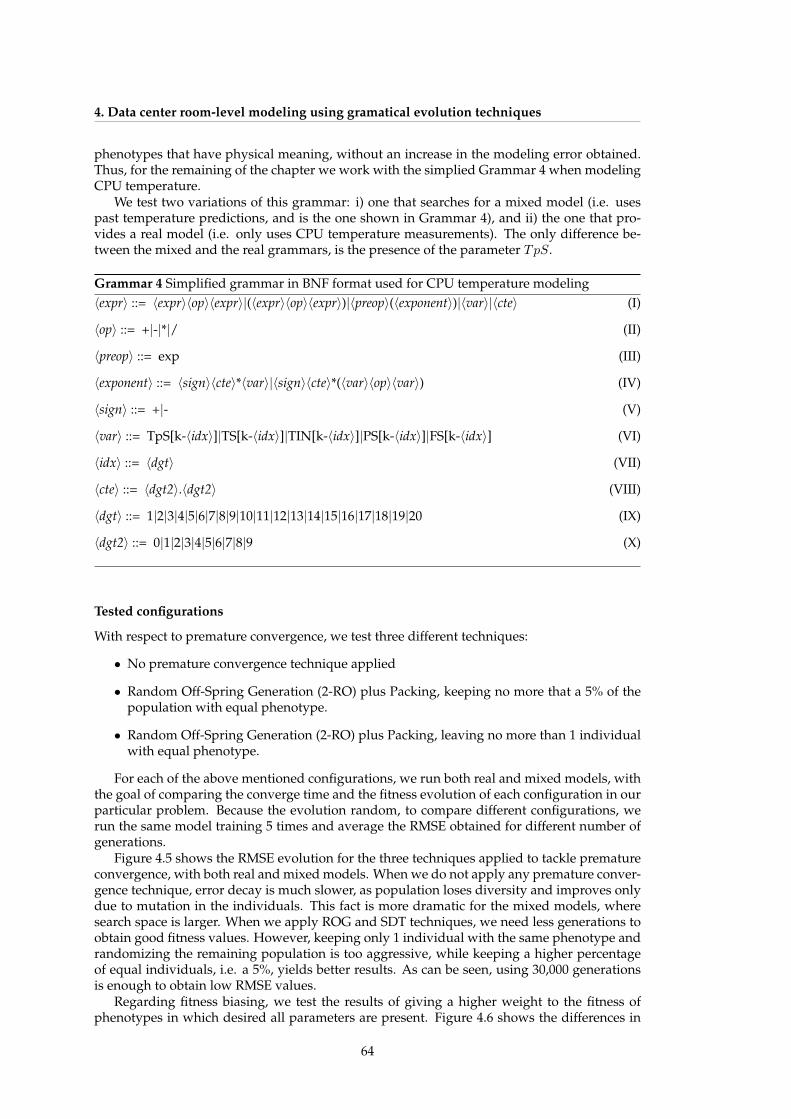
4. Data center room-level modeling using gramatical evolution techniques
phenotypes that have physical meaning, without an increase in the modeling error obtained.Thus, for the remaining of the chapter we work with the simplied Grammar 4 when modelingCPU temperature.
We test two variations of this grammar: i) one that searches for a mixed model (i.e. usespast temperature predictions, and is the one shown in Grammar 4), and ii) the one that pro-vides a real model (i.e. only uses CPU temperature measurements). The only difference be-tween the mixed and the real grammars, is the presence of the parameter TpS.
Grammar 4 Simplified grammar in BNF format used for CPU temperature modeling(I)〈expr〉 ::= 〈expr〉〈op〉〈expr〉|(〈expr〉〈op〉〈expr〉)|〈preop〉(〈exponent〉)|〈var〉|〈cte〉
(II)〈op〉 ::= +|-|*|/
(III)〈preop〉 ::= exp
(IV)〈exponent〉 ::= 〈sign〉〈cte〉*〈var〉|〈sign〉〈cte〉*(〈var〉〈op〉〈var〉)
(V)〈sign〉 ::= +|-
(VI)〈var〉 ::= TpS[k-〈idx〉]|TS[k-〈idx〉]|TIN[k-〈idx〉]|PS[k-〈idx〉]|FS[k-〈idx〉]
(VII)〈idx〉 ::= 〈dgt〉
(VIII)〈cte〉 ::= 〈dgt2〉.〈dgt2〉
(IX)〈dgt〉 ::= 1|2|3|4|5|6|7|8|9|10|11|12|13|14|15|16|17|18|19|20
(X)〈dgt2〉 ::= 0|1|2|3|4|5|6|7|8|9
Tested configurations
With respect to premature convergence, we test three different techniques:
• No premature convergence technique applied
• Random Off-Spring Generation (2-RO) plus Packing, keeping no more that a 5% of thepopulation with equal phenotype.
• Random Off-Spring Generation (2-RO) plus Packing, leaving no more than 1 individualwith equal phenotype.
For each of the above mentioned configurations, we run both real and mixed models, withthe goal of comparing the converge time and the fitness evolution of each configuration in ourparticular problem. Because the evolution random, to compare different configurations, werun the same model training 5 times and average the RMSE obtained for different number ofgenerations.
Figure 4.5 shows the RMSE evolution for the three techniques applied to tackle prematureconvergence, with both real and mixed models. When we do not apply any premature conver-gence technique, error decay is much slower, as population loses diversity and improves onlydue to mutation in the individuals. This fact is more dramatic for the mixed models, wheresearch space is larger. When we apply ROG and SDT techniques, we need less generations toobtain good fitness values. However, keeping only 1 individual with the same phenotype andrandomizing the remaining population is too aggressive, while keeping a higher percentageof equal individuals, i.e. a 5%, yields better results. As can be seen, using 30,000 generationsis enough to obtain low RMSE values.
Regarding fitness biasing, we test the results of giving a higher weight to the fitness ofphenotypes in which desired all parameters are present. Figure 4.6 shows the differences in
64

4.6. Results
1 2 3 4 5 6 7 8 9 10
x 104
2.5
3
3.5
4
4.5
5
RM
SE
err
or
(degre
e)
a) Error evolution with number of generations for real models
1 2 3 4 5 6 7 8 9 10
x 104
2.5
3
3.5
4
4.5
5
b) Error evolution with number of generations for mixed models
RM
SE
err
or
(degre
e)
No ROG/SDT
ROG and SDT 5%
ROG and SDT
Figure 4.5: CPU temperature error evolution for real and mixed models under different pre-mature convergence prevention techniques: i) no technique applied, ii) ROG + SDT keeping5% of equal individuals and iii) ROG + SDT randomizing all equal individuals.
0 1 2 3 4 5 6 7 8 9 10
x 104
2.5
3
3.5
4
4.5
5
RM
SE
err
or
(de
gre
e)
Number of generations
Real − No bias
Mixed − No bias
Real − Biased
Mixed − Biased
Figure 4.6: CPU temperature error evolution for real and mixed models under ROG + SDT 5%when fitness is biased vs. not biased.
terms of RMSE for different number of generations for real and mixed models when we biasthe fitness to force all parameters and when we do not bias the fitness. As can be seen, theconvergence is similar, being slightly better that of the non-biased models. In fact, all variablesin the grammar tend to appear in non-biased models, thus backing up the hypothesis that allthose magnitudes have an importance in the modeling of temperature.
Finally, we show results for both the training and test set when modeling CPU tempera-ture with the best configuration, i.e. a mixed model obtained with Grammar 4, using ROGand Packing techniques leaving 5% of equal individuals, and not biasing the fitness. Table 4.1shows the 5 better phenotypes obtained for this model and their corresponding RMSE andMAE values for the test set after simplification. In order to avoid overfitting, we use the fivebest models to compute the samples of the test set, i.e., we predict the next temperature sam-ple with all five equations, obtaining 5 different results, and we average them to obtain theprediction value. By applying this methodology we obtain a RMSE of 2.48◦C and a MAE of1.77◦C. Because CPU temperature sensors usually have a resolution of 1◦C we consider theseresults to be accurate enough for our purposes. Figure 4.7 shows the real CPU temperature
65

4. Data center room-level modeling using gramatical evolution techniques
Phenotype RMSE MAE
TS[k − 3] + PS[k − 1]− PS[k − 4] + 1.1 · TIN [k − 7]/(e(−0.1·(TpS[k−8]−TS[k−3]))
·(PS[k − 20]/9.9) + 9.9)− (e(−4.5·(TpS[k−5]/TS[k−19])) · TS[k − 7])− 9.6 2.8 2.08TS[k − 5] + PS[k − 1])− PS[k − 5] + (TS[k − 5]/5.7− e(−1.3·(TS[k−5]/TIN [k−12]))
·TS[k − 5]) + PS[k − 11]/(3.7− TS[k − 5] · (e(−0.3·(PS[k−18]+FS[k−7]))
−e(−4.9·(PS[k−12]/PS[k−16]))))− 9.8 2.59 1.86TS[k − 5] + PS[k − 1]− PS[k − 4] + e(+6.1·(TIN [k−10]/TS[k−5])) − 5.2)−TIN [k − 14] · (0.06 · (TIN [k − 7]/TS[k − 5])) + (PS[k − 1]/3.1 · TIN [k − 7])
·TS[k − 5]− (PS[k − 20]/TIN [k − 7]) · e(−6.4·(TIN [k−15]/TS[k−11])) − 8.0 2.77 2.01TS[k − 3] + PS[k − 1]− PS[k − 4]− e(−4.1·(TpS[k−5]/TIN [k−19]))/TS[k − 3]
+(TpS[k − 1]/(e(−0.1·(TpS[k−8]−TS[k−3])) · (PS[k − 20]/9.9) + 9.2))/1.6− 9.6 2.55 1.77TS[k − 1] + 0.73 · (PS[k − 1] · 4.4− PS[k − 2] · 4.4− TS[k − 1] + TpS[k − 8]
+e(−0.2·TIN [k−8]) + (e(−3.4·(PS[k−20]/PS[k−10]))−e(−4.0·(PS[k−6]/PS[k−19]))) · TpS[k − 12]/9.0− 0.9) 2.5 1.75
Table 4.1: Phenotype, RMSE and MAE for the test set in the CPU temperature modeling re-duced scenario
0 200 400 600 800 1000 1200 1400 160030
40
50
60
70
Tem
p(d
eg)
Real temperature Predicted temperature
(a) 1-minute training set prediction for mixed model
500 1000 1500 2000 2500 3000 350030
40
50
60
70
Te
mp
(de
g)
Real temperature Predicted temperature
(b) 1-minute test set prediction for mixed model
Figure 4.7: Training and test set CPU temperature prediction vs. real measurements
trace and its prediction, for both the training and the test set. As can be seen, the predictionaccurately matches the measured values in both the training and test sets.
4.6.2 Comparison to other approachesWe compare our results with two common techniques for CPU temperature modeling inthe state-of-the-art: autoregressive moving average models and linear subspace identificationtechniques. We first briefly describe both modeling techniques and then we show the resultsobtained and compare them with our proposed technique. For further information on theworking principles of ARMA and N4SID, the reader is referred to Appendix B.2.
ARMA and N4SID models
ARMA models are mathematical models of autocorrelation in a time series, that use past val-ues alone to forecast future values of a magnitude. The ARMA modeling methodology con-sists on two steps: i) identification and ii) estimation. During the identification phase, themodel order is computed, i.e, we find the optimum values for p and q of the ARMA(p, q) pro-cess, where p and q are the orders of the autoregressive (AR) and the moving average (MA)parts of the model, respectively. To perform model identification we use an automated strat-egy, that computes the goodness of fit for a range of p and q values, starting by the simplest
66

4.6. Results
Model Training set Test setRMSE MAE RMSE MAE
ARMA(1, 4)(p < 5, q < 5) 4.28 2.18ARMA(9, 8)(p < 10, q < 10) 4.18 2.5N4sid[6, 20, 20] 2.67 1.79 6.27 5.96GE 2.39 1.7 2.48 1.77
Table 4.2: RMSE and MAE in CPU temperature prediction for each model (Grammatical evo-lution - GE, ARMA and N4sid)
100 200 300 400 500 600 70030
40
50
60
70
80
Te
mp
(de
g)
Measurements GE prediction ARMA prediction N4sid prediction
Figure 4.8: Zoomed-in CPU temperature modeling comparison between Grammatical Evolu-tion (GE), ARMA(1,4) and N4sid models
model (i.e., an ARMA(1,0)). The goodness of fit is computed using the Final Prediction Error(FPE), and the best model is the one with lowest FPE value. For a fair comparison with ourproposed methodology, the model obtained needs to forecast α = 6 samples into the future.
N4SID is a subspace identification method that estimates an n order state-space modelusing measured input-output data. The approach consists on identifying a parametrization ofthe model, and then determine the parameters so that the measurements explain the model inthe most accurate possible way. To be constructed, certain parameters need to be fed into themodel, such as the number of forward predictions (r), the number of past inputs (su), and thenumber of past outputs(sy). Again, for a fair comparison with our proposed methodology, weneed a model in the form N4SID[r, su, sy] where r = 6, su = 20 and sy = 20.
Model comparison
Finally, we compare the results for CPU temperature modeling between our proposed ap-proach, ARMA and N4SID models, all of them with a prediction window of 6 samples (1minute) into the future.
Table 4.2 shows the RMSE and MAE errors obtained for our proposed modeling techniquebased on GE, ARMA and N4sid models.
Figure 4.8 shows a zoom-in into the CPU temperature curve for the real measurementsand the prediction with all three models for our test set. As can be seen, GE models are theones with both lower RMSE and MAE. Moreover, the CPU temperature trend is accuratelypredicted. This does not happen for ARMA models that, even though keep the maximumerror low, provide values that are always behind the real trend, yielding poor forecasting ca-pabilities. This issue cannot be solved by increasing the model order, as shown in Table 4.2.N4sid models, even though they are very accurate in the training test, perform poorly in thetest set and have an important bias error. Even if the bias error is corrected (which has beendone in Figure 4.8) the prediction is still behind the measurements and the system is unableto capture the system dynamics. The GE prediction, even though has more oscillations (dueto the smoothed noise of the power consumption signal) is the only one that captures thetemperature trend, advancing the real measurements.
4.6.3 Inlet temperature modeling
For inlet temperature modeling we perform the same study than for CPU temperature in termsof grammars, premature convergence and fitness biasing. As expected, the results in terms of
67
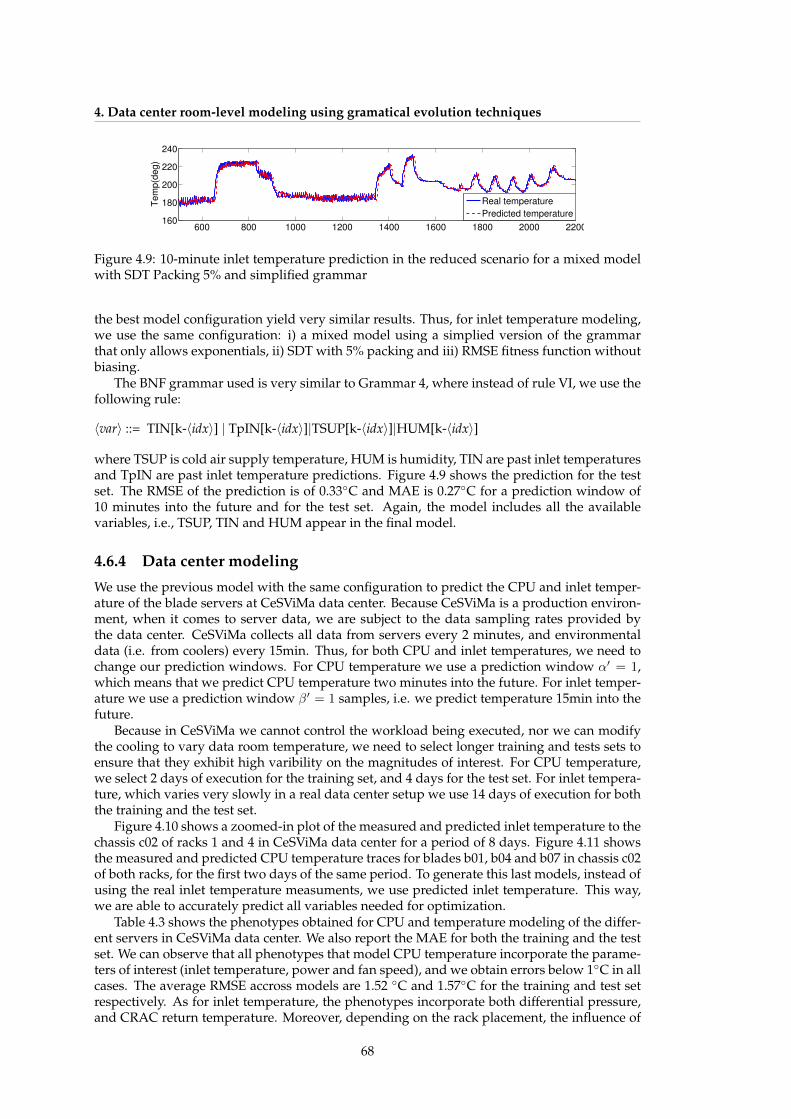
4. Data center room-level modeling using gramatical evolution techniques
600 800 1000 1200 1400 1600 1800 2000 2200160
180
200
220
240T
em
p(d
eg
)
Real temperature
Predicted temperature
Figure 4.9: 10-minute inlet temperature prediction in the reduced scenario for a mixed modelwith SDT Packing 5% and simplified grammar
the best model configuration yield very similar results. Thus, for inlet temperature modeling,we use the same configuration: i) a mixed model using a simplied version of the grammarthat only allows exponentials, ii) SDT with 5% packing and iii) RMSE fitness function withoutbiasing.
The BNF grammar used is very similar to Grammar 4, where instead of rule VI, we use thefollowing rule:
〈var〉 ::= TIN[k-〈idx〉] | TpIN[k-〈idx〉]|TSUP[k-〈idx〉]|HUM[k-〈idx〉]
where TSUP is cold air supply temperature, HUM is humidity, TIN are past inlet temperaturesand TpIN are past inlet temperature predictions. Figure 4.9 shows the prediction for the testset. The RMSE of the prediction is of 0.33◦C and MAE is 0.27◦C for a prediction window of10 minutes into the future and for the test set. Again, the model includes all the availablevariables, i.e., TSUP, TIN and HUM appear in the final model.
4.6.4 Data center modeling
We use the previous model with the same configuration to predict the CPU and inlet temper-ature of the blade servers at CeSViMa data center. Because CeSViMa is a production environ-ment, when it comes to server data, we are subject to the data sampling rates provided bythe data center. CeSViMa collects all data from servers every 2 minutes, and environmentaldata (i.e. from coolers) every 15min. Thus, for both CPU and inlet temperatures, we need tochange our prediction windows. For CPU temperature we use a prediction window α′ = 1,which means that we predict CPU temperature two minutes into the future. For inlet temper-ature we use a prediction window β′ = 1 samples, i.e. we predict temperature 15min into thefuture.
Because in CeSViMa we cannot control the workload being executed, nor we can modifythe cooling to vary data room temperature, we need to select longer training and tests sets toensure that they exhibit high varibility on the magnitudes of interest. For CPU temperature,we select 2 days of execution for the training set, and 4 days for the test set. For inlet tempera-ture, which varies very slowly in a real data center setup we use 14 days of execution for boththe training and the test set.
Figure 4.10 shows a zoomed-in plot of the measured and predicted inlet temperature to thechassis c02 of racks 1 and 4 in CeSViMa data center for a period of 8 days. Figure 4.11 showsthe measured and predicted CPU temperature traces for blades b01, b04 and b07 in chassis c02of both racks, for the first two days of the same period. To generate this last models, instead ofusing the real inlet temperature measuments, we use predicted inlet temperature. This way,we are able to accurately predict all variables needed for optimization.
Table 4.3 shows the phenotypes obtained for CPU and temperature modeling of the differ-ent servers in CeSViMa data center. We also report the MAE for both the training and the testset. We can observe that all phenotypes that model CPU temperature incorporate the parame-ters of interest (inlet temperature, power and fan speed), and we obtain errors below 1◦C in allcases. The average RMSE accross models are 1.52 ◦C and 1.57◦C for the training and test setrespectively. As for inlet temperature, the phenotypes incorporate both differential pressure,and CRAC return temperature. Moreover, depending on the rack placement, the influence of
68

4.7. Discussion
0 100 200 300 400 500 600 700 800220
240
260
280
300
a) Rack 1 Chassis 02 Inlet temperature prediction
Te
mp
(x1
0)
(de
g)
Real temperature Predicted temperature
0 100 200 300 400 500 600 700 800220
240
260
280
300
b) Rack 4 Chassis 02 Inlet temperature prediction
Te
mp
(x1
0)
(de
g)
Real temperature Predicted temperature
Figure 4.10: Data center inlet temperature modeling for various racks
0 500 1000 1500
400
500
600
a) Rack 1 Chassis 02 Blade 01 CPU temperature prediction
Tem
p (
x10)
(deg)
Real temperature Predicted temperature
0 500 1000 1500
400
500
600
b) Rack 1 Chassis 02 Blade 04 CPU temperature prediction
Real temperature Predicted temperature
0 500 1000 1500
400
500
600
c) Rack 1 Chassis 02 Blade 07 CPU temperature prediction
0 500 1000 1500
400
500
600
d) Rack 4 Chassis 02 Blade 01 CPU temperature prediction
Tem
p (
x10)
(deg)
Real temperature Predicted temperature
0 500 1000 1500
400
500
600
e) Rack 4 Chassis 02 Blade 04 CPU temperature prediction
Real temperature Predicted temperature
0 500 1000 1500
400
500
600
f) Rack 4 Chassis 02 Blade 07 CPU temperature prediction
Real temperature Predicted temperature
Figure 4.11: Data center CPU temperature modeling for various servers in different racks
the CRAC units vary. Here we can observe the benefits of the feature selection performed byGE. Rack1, which is the leftmost rack in the data center, is affected only by CRAC2; whereasRack4, situated in the middle of the row, is affected both by CRAC2 and CRAC3. The modelautomatically incorporates the most relevant features, discarding the irrelevant ones. For inlettemperature prediction, our error is below 0.5◦C, which is enough for our purposes and belowother state-of-the-art approaches.
4.7 Discussion
In this section we briefly discuss the applicability of our models, i.e. how they can be appliedto reduce energy consumption in data centers. We also show the computational effort neededto model a full data center scenario, and the feasibility of our approach.
4.7.1 Applicability
The main purpose of our modeling approach is the development of a methodology to predictserver CPU temperature under variable cooling setups, so that cooling-associated costs can bereduced without incurring on reliability issues. To this end, we first predict the inlet tempera-ture of servers given the data room conditions and cooling setup, and use this result to predictserver temperature.
69

4. Data center room-level modeling using gramatical evolution techniques
Model Phenotype Train. Test
Inlet TIN [k − 1] + e(−4.3·(TRET2[k−3]/TRET2[k−11]))/TIN [k − 1]·Rack1 (e(+1.5·TIN [k−5]) − e(−3.8·(PDIF [k−20]−TIN [k−1]))) 0.32 0.4Inlet TIN [k − 1] + 3.1/e(+5.0·TIN [k−1]) · e(+2.2·TIN [k−2])
Rack4 −e(−2.9·TpIN [k−3]) · TRET3[k − 12]·(TRET3[k − 5] + e(−4.9·(HUM [k−6]/TRET2[k−1]))/
TIN [k − 2]/e(+7.2·(PDIF [k−20]−TIN [k−1]))) 0.18 0.44
CPU TS[k − 1] + (PS[k − 20] · FS[k − 1]− 9.4 · (TpS[k − 5]·Rack1, C02, B01 TpS[k − 2]))/(e(+2.0·FS[k−7])/
e(−4.1·TpS[k−5])/(2.3 + e(+1.7·(TpS[k−10]·TpS[k−10]))
+e(+1.5·FS[k−1]) − e(+1.6·PS[k−7]))) 0.68 0.76CPU TS[k − 1] + e(−7.2·(TS[k−6]/PS[k−1]))/(e(−6.1·(TS[k−10]−PS[k−15]))
Rack1, C02, B04 /5.6/FS[k − 20]− 1.7 + TpS[k − 20]− e(−3.0·(TIN [k−4]/TS[k−15]))) 0.51 0.85CPU TS[k − 1] + e(−6.2·(TS[k−2]·TIN [k−11]))/((e(−9.8·TS[k−8])
Rack1, C02, B07 +e(−5.2∗(TS[k−9]∗PS[k−19]))) · e(+5.8∗FS[k−9])) 0.55 0.75CPU TS[k − 1] + e(−3.1·TS[k−2])/(((TS[k − 3]/PS[k − 3]) + (FS[k − 18]
Rack4, C02, B01 −FS[k − 8])/e(−9.4·(FS[k−1]−TpS[k−9])))− TpS[k − 4]+(TpS[k − 6] + TS[k − 3])− (TIN [k − 3]/TpS[k − 9])) 0.29 0.46
CPURack4, C02, B04 TS[k − 1] + e(−5.7·(TpS[k−6]∗TpS[k−10]))/e(+9.9·(TpS[k−9]−TIN [k−10])) 0.26 0.73CPU TS[k − 1] + TIN [k − 11] · e(−9.5·(TpS[k−10]/TIN [k−5]))/
Rack4, C02, B07 e(−9.9·(TIN [k−10]−TS[k−5])) 0.43 0.87
Table 4.3: Phenotype and average error (in Celsius) in training and test set for CPU and inlettemperature modeling in a production data center
For a data center with the dimensions of CeSViMa (i.e. two rows of racks), and havinganalyzed the variability of inlet temperature traces in the data center, we need to predict inlettemperature at 3 different heights (at the bottom, middle and top of the rack), in one out of tworacks. This results in having to generate 30 inlet temperature models. Because the maximumCPU temperature in the data center is the one limiting the cooling, we need to predict the CPUtemperature of each server in the data room, i.e. we need as many models as servers in thedata center.
These models allow us to predict the maximum server temperature attained in the datacenter and, thus, detect any potential thermal redlining and act before it occurs.
4.7.2 Computational effort
Our approach is computationally intensive in the model training stage. According to ourresults, our GE model needs to evolve a random initial population for 30,000 generations toobtain accurate results. In our experiments, running 30,000 generations of 4 different modelsin parallel takes 28h in a computer equipeed with a QuadCore Intel i7 CPU @3.4GHz and 8GBof RAM.
However, because the models obtained for several homogeneous servers are very similar,it is possible to reduce the training overhead by using already evolved populations to fine-tune the models instead of using the a new random population every time. This way, we canreduce the training time.
As for the model testing, in the worst case scenario, the model needs to be tested every 10seconds. The overhead to test one model is found to be negligible. In this sense, it is feasible tocompute all temperatures to find the maximum CPU temperature, i.e. the one that limits thecooling of the data room.
70

4.8. Conclusions
4.8 Conclusions
In this paper we have presented a methodology for the unsupervised generation of models topredict on runtime the thermal behaviour of production data centers running arbitrary work-loads and equipped with heterogeneous servers.
Our approach leverages the usage of Gramatical Evolution techniques to automaticallygenerate models of the data room by using real data center traces. Our solution allows us topredict the CPU temperature and the inlet temperature of servers, with an average error below2◦C and 0.5◦C respectively. This errors are within the margin obtained by other approaches inthe state-of-the art. Our solution, however, can be used on runtime, and does not require theusage of CFD software. Moreover, our models are trained and tested in two realistic scenario,a small-scale data room with one rack, and at a larger scale in the CeSViMa data center.
This work makes substantial contributions in the area of room temperature modeling, andadvances the state-of-the-art by proposing the full temperature forecasting of a data centerusing evolutionary techniques, allowing the model generation in an unsupervised way, andgenerating predictions on runtime. Full temperature forecasting enables the development ofroom-wide cooling management strategies, based on the reduction of cooling power withouthitting thermal redlining.
In the next chapter...
the reader will find the optimizations developed at the data center level, that allow us to saveenergy by taking into account the heterogeneity in terms of resources and applications in thedata center. Moreover, we show the benefits obtained when using joint workload and coolingmanagement strategies.
71


5. Data center heterogeneity and application-awareworkload and cooling management
Mientras la ciencia a descubrir no alcancelas fuentes de la vida,y en el mar o en el cielo haya un abismoque al calculo resista,mientras la humanidad siempre avanzandono sepa a do camina,mientras haya un misterio para el hombre,¡habra poesıa!
— Gustavo A. Becquer – Rima IV (Rimas y Leyendas)
In this chapter we propose a data center optimization strategy that takes advantage ofthe heterogeneity in terms of computational resources at the data center, to develop resourcemanagement techniques that minimize energy consumption.
In particular, we develop a MILP-based approach to first decide on the operating serverset, i.e. to select the number of servers of each type used for a particular workload. Then, weallocate incoming tasks to the heterogeneous servers to minimize energy in a runtime fash-ion. Our experiments first focus on the reduction of IT power among three different serverarchitectures (SPARC, Intel and AMD).
Then, we extend our results to a small air-cooled data center room where we have controlover the cooling setup, and show how important benefits can be achieved by jointly optimizingcooling and computational power.
5.1 Introduction
Resource management is a well known concept in the data center world and refers to the efficientand effective deployment of computational resources of the facility where they are needed. Re-source management techniques are used to allocate in a spatio-temporal way the workload tobe executed in the data center, optimizing a particular goal. Traditionally, these techniqueshave focused on maximizing performance by assigning tasks to computational resources inthe most efficient way. However, the increasing energy demand of data center facilities hasshifted the optimization goals towards maximizing energy efficiency. Our work leverages thisconcept by proposing energy-aware resource management techniques that take into accountthe heterogeneity in terms of computational resources and applications. Moreover, we con-sider the impact of cooling power in our setups, and show how overall power consumptioncan be reduced by taking into account leakage and temperature.
There are a number of different techniques in the state of the art to reduce the energy costand power density in data centers in different levels of granularity: chip-level, server level,rack level, data center level, etc. In the last years, several authors have addressed this prob-lem by the well-known technique of Dynamic Voltage and Frequency Scaling (DVFS), wherethe hardware components are switched from high-power states to low-power states wheneverperformance allows. DVFS techniques usually apply run-time measurement and control of
73
5. Data center heterogeneity and application-aware workload and cooling management
the desired application characteristics in terms of frequency and voltage power supply. Whilethese approaches can effectively reduce the dynamic power of the system, they fail on exploit-ing the heterogeneity of the data center and they cannot minimize the system leakage powerwith an appropriate assignment of workloads.
The authors of [152] introduce three heuristic approaches to minimize the total power of adata center. They perform task scheduling to have a uniform outlet temperature profile, min-imum server power dissipation, or a uniform workload distribution, respectively. Althoughthese approaches try to minimize the data center power consumption, they do not provide aprecise objective function and/or accurate mathematical formulation of the optimization prob-lem that can be used for the validation of the optimal solution. Moreover, the heterogeneity ofthe data center is not considered and this mechanism of thermal optimization is not exploitedby the authors. On the other hand, recent works like [182] do consider heterogeneous datacenters and formulate a detailed mathematical model to perform an efficient energy-awaretask scheduling. However, the authors do not propose a methodology to solve this optimiza-tion problem in an efficient way to drive the selection of processors in an heterogeneous datacenter under different workloads.
The work proposed in this chapter outperforms previous approaches in the field of energy-aware task assignment for green data centers by targeting the following goals:
• The usage of heterogeneity to minimize the energy consumption in data centers, by usinga mixed static/dynamic approach to the problem and by characterizing real workloadsin terms of energy.
• The static optimization aims to find which is the best configuration of the data centergiven a set of heterogeneous machines. We prove that the best combination is an hetero-geneous data center.
• The dynamic optimization shows that the energy can be reduced significantly by opti-mizing the task allocation and distribution algorithm of the resource manager.
• We show how, by using our previous temperature and leakage models, we can reducedata room cooling power while predicting CPU temperature and leakage. This way, wecan prevent server thermal redlining, and ensure that overall power does not increasedue to server leakage.
This chapter is organized as follows: Section 5.2 describes the related work in the area.Section 5.3 describes our proposed solution, whereas Section 5.4 describes the optimizationstrategy. Section 5.5 describes the results obtained. Finally, Section 5.6 draws the most impor-tant conclusions.
5.2 Related Work
During the last years, several approaches have targeted the problem of energy efficiency indata centers by proposing different techniques to optimize the energy-efficiency metrics. In [29],[92] the authors have tried to identify workload time series to dynamically regulate CPUpower and frequency to optimize power consumption. Other works that apply voltage scal-ing, like [133] and [55], also manage the concepts of (i) monitoring and estimating the load,(ii) switching incoming traffic to the selected server in a transparent way for the services and(iii) managing a pool of generic and interchangeable resources. Besides that, Heo et al. [76] de-veloped a power optimization algorithm using DVFS and shutting down unused servers forlarge-scale applications spanning several non-virtualized servers with a load balancer. Theseworks have proposed interesting approaches for the run-time management of the workloadin homogeneous data centers; however, our research presents how the heterogeneity in theselection of the processors that compose the data center leads to higher energy savings.
Other authors consider the distributed problem as opposed to the previous centralizedapproaches. For example, the work done by Khargharia et al. in [86] presents a theoretical
74
5.3. Heterogeneity-aware resource management
framework that optimizes both power and performance for data centers at runtime. Also,Bennani and Menasce [116] present a similar hierarchical approach addressing the problem ofdynamically redeploying servers in a continuously varying workload scenario.
Load balancing [34], [51] which is a data center level approach can be used to distributethe total workload of the data center among different servers in order to balance the per-server workload (and hence achieve uniform power density). In this topic, dynamic resourceprovisioning has also been accomplished driven by the thermal response of the server to therunning application, and some approaches have tried to predict the incoming workload interms of requests per second [125]. As opposed to our work, the previous run-time techniquesdo not consider an off-line analysis for the energy-efficient design of the data center.
Virtualization technology has provided a promising way to manage application perfor-mance by dynamically reallocating resources to VMs. Several management algorithms havebeen proposed to control the application performance for virtualized servers [90], [123]. Sev-eral recent studies propose to solve the VM-server mapping problem for power savings [136],[160].
The closest works to ours are [182] and [18]. While the first one is focused on cloud serversand the second one applies control theory, both of them lack of a serious and accurate energymodel that supports the proposed optimizations. Moreover, as opposed to us, they tend toconsider data centers with a low workload or the absence of any initial workload before themanagement takes place.
In this chapter, we present a mixed static/dynamic approach for the energy-efficient man-agement and configuration of an HPC data center. While previous techniques have not con-sidered the impact of the proper selection of processors in the design of the data center, ourresearch firstly proposes an heterogeneous design of the system based on an accurate energymodel. After that, our optimization problem solved in run-time, will also exploit this het-erogeneity to further reduce the energy consumption of the system, outperforming previousapproaches. Finally, we show how using cooling management in conjunction with workloadmanagement yields increased energy savings.
5.3 Heterogeneity-aware resource management
5.3.1 Computing power reduction
In this section we propose a workload assignment policy that distributes the computationat run-time inside the data center, taking advantage of (i) the knowledge about the energybehavior of the applications to execute, and (ii) the resource heterogeneity of the data center.
To do so, we first propose a static optimization that selects the most appropriate resourcesof the data center, i.e. the best machines, to execute the workload. Secondly, we perform arun-time allocation that minimizes the energy consumption of the data center facility. Finally,backed up by the server and room-level modeling methodology develop in previous chapters,we set the data room cooling that ensures no server reaches thermal redlining while reducingoverall energy consumption.
Our proposed approach mainly targets specific-purpose data centers. We assume a peri-odic utilization behavior, with periodic that can be easily characterized. This assumption isrealistic, as can be seen when examining the workloads published by several HPC data cen-ters in the Parallel Workloads Archive 1 Therefore, we can assume that the workload exhibitedduring a period of time (i.e: one day) is representative of the workload that the data centerwill have in any other period of time (i.e: the next day).
The traditional functional system found in today’s data centers comprises: i) a workload,which is a set of different tasks entering the system; ii) a task scheduler, which queues thetasks in time, deciding their priority of execution; and, iii) a resource allocator, which has theknowledge of the available resources of the system and decides where each task is going to be
1http://www.cs.huji.ac.il/labs/parallel/workload/
75

5. Data center heterogeneity and application-aware workload and cooling management
UID CPUs WCET Mem
105 128 2h 4GB
Job set Scheduler Allocator
SLURM
priority list(job execution order)
node (or list of nodes)where workload is executed
Execution
Workload
DC simulator
Characterization & Classification
Energy optimization
Figure 5.1: Diagram of data center resource management principles
executed (see Figure 5.1). In our work, to simulate workload allocation we use the resourcemanager SLURM [168].
By default, SLURM uses a round-robin policy to assign tasks to nodes. We use an opensource SLURM simulator [98] developed by the Barcelona Supercomputing Centre to simulatethe workload assignment with SLURM default allocation policy and our algorithm.
Our optimization assumes that the workload entering the system is scheduled by SLURMusing a FIFO policy without backfilling (i.e. tasks are executing according to arrival priority),and we have developed our own allocation plugin to modify workload allocation of tasks toservers as needed.
By workload we understand a collection of job sets randomly distributed in time. Each jobset has a random number of tasks; however, the number of different tasks is fixed for all work-loads. Each task will be characterized for every machine (resources) of the system in order toobtain its profiling information. This characterization phase obtains the energy consumed by aspecific machine or processor (in KWh) when a task is allocated and executed on it, by makingreal measures. The workload characterization phase obtains the energy consumption of everytask in a particular processor. This information is used to make an efficient optimization of thedata center in two different ways: static and dynamic.
The static optimization approach performs an off-line configuration of the data center toobtain the most suitable energy-efficient set-up. This approach will find the most appropriatecombination of resources (server architectures) from a set of available ones, that will be neededto provide the required energy efficiency and still satisfy the performance constraints. We willshow that the result of the optimization is a heterogeneous data center, which performs betterthan any of the homogeneous data centers.
The dynamic optimization works after the static one has been applied and performs a run-time optimization to allocate and distribute the tasks of the workload between the computingresources. This approach shows that different allocations of tasks lead to different energy con-sumption values. This means that we can create run-time optimizations in terms of energy thatfeed information back to the resource manager and exploit the availability of heterogeneousresources.
5.3.2 Cooling power reduction
Finally, we can use our previous server and room modeling methodology to reduce data roomcooling power without an increase in leakage power or hitting any CPU thermal threshold.
In a typical air-cooled data center room, the air conditioning units pump cold air into thedata room and extract the generated heat. The efficiency of this cycle is generally measured
76

5.4. Energy optimization algorithms
by the Coefficient of Performance (COP). The COP is a dimensionless value defined as the ratiobetween the cooling energy produced by the air-conditioning units (i.e. the amount of heatremoved) and the energy consumed by the cooling units (i.e. the amount of work to removethat heat), as shown in Equation 5.1.
COPMAX =output cooling energyinput electrical energy
(5.1)
Higher values of the COP indicate a higher efficiency. The maximum theoretical COP foran air conditioning system is described by Carnot’s theorem as in Equation 5.2:
COPMAX =TC
TH − TC(5.2)
where TC is the cold temperature, i.e. the temperature of the indoor space to be cooledand TH is the hot temperature, i.e. the outdoor temperature (both temperatures in Celsius).As the difference between hot and cold air increases, the COP decreases, meaning that theair-conditioning is more efficient (consumes less power), when the temperature difference be-tween the room and the outside is smaller.
According to this, one of the techniques to reduce the cooling power is to increase the COPby increasing the data room temperature. However, as we increase room temperature, CPUtemperature increases and so does leakage power. Therefore, there is a trade-off between thereduction in cooling power and the increament in server leakage power.
We use the previously developed models to decrease the power wasted on the cooling sys-tem to a minimum, while still satisfying the safety requirements of the data center operation,and keeping leakage temperature low so that it does not dominate total power.
5.4 Energy optimization algorithms
In the previous chapters, we focused our work on the development of models for servers anddata centers. Once the characterization of the power consumed by the tasks is performed,we use the obtained information to generate a set of optimizations that improve the energyefficiency of a data center. In this sense, we can think of three different scenarios:
• The definition of a data center which has the optimum number of machines, given alimited budget and a limited space, to run the workload. In this work we want to showthat the optimum data center, in terms of energy costs, is an heterogeneous data center.
• The upgrade of an existing data center with new machines. We want to show that theoptimum resulting data center is heterogeneous and the selected machines for upgradeare selected based on a criteria for energy-optimality.
• The execution of the workloads in an already-existing data center. This refers to applyingdifferent and new resource managing techniques that exploit the machine heterogeneity.
These three case studies can really be combined into two: (i) a static and off-line approach,which includes the creation and extension of a data center; and (ii) a dynamic run-time ap-proach, that tackles with the resource managing of the tasks to be executed.
The following subsections will explain further these approaches.
5.4.1 Static off-line data center server selectionThe static off-line approach tries to find the suitable number and combination of server ma-chines from a set of architectures, under a certain workload. The maximum number of dif-ferent architectures to be used is given by the user. Each task of the workload has a differentenergy profiling in every processor, as characterized in the profiling phase.
The optimization phase is defined as follows. Let us denote by M a set of machines, byP a set of processors and by T a set of tasks that must be executed. Each machine m has a
77

5. Data center heterogeneity and application-aware workload and cooling management
price of ψm, consumes power in idle state πm and occupies a certain space αm (understoodas the number of U’s in a rack). Each processor p belongs to one machine m, denoted as pm.Every task t has a duration and consumes a certain amount of energy depending on the targetprocessor, σtp and etp respectively. The problem consists on finding a subset of M that is ableto execute the required tasks T minimizing the energy consumption:
Minimize
∑t∈T,p∈P
ktp · etp +∑m∈M
πm · τmax (5.3)
where ktp is a binary variable that is set to 1 if the task t is executed in processor p and kmis a binary variable that is set to 1 if the machine m is used. τmax is the time instant at whichall the tasks have been executed. The set of constraints that the proposed model must fulfillare the following:
∑t∈T
ktpm · σtpm ≤ τmaxm ,
{m = 1, . . .M,pm= 1, . . . Pm
(5.4)
τmaxm ≤ τmax, m = 1, . . .M (5.5)τmaxm ≤ K · km, m = 1, . . .M (5.6)∑
p∈Pktp = 1, t = 1, . . . T (5.7)
∑m∈M
km · ψm ≤ Ψ,∑m∈M
km · αm ≤ A (5.8)
These constraints 5.4–5.8 ensure that all tasks are executed within a maximum time, thatall tasks will be executed once in a processor, and that both the price of the data center and thespace used by it will not exceed certain values.
As a result, we will have the suitable number of machines of each type needed to build ourdata center with energy-performance constraints.
5.4.2 Dynamic run-time allocation
In this case we suppose that we already have an heterogeneous data center with a fixed num-ber m = 1, . . . ,M of machines (i.e.: the heterogeneous data center found with the static opti-mization) that can be of different types. The dynamic run-time allocation of the tasks, whichwill be performed by the resource manager, aims at minimizing the energy consumption ofthe assignment by placing each task where it consumes the minimum energy.
The minimization function is the same than the previous one 5.3. However, a new con-straint is added in order to express the needs of the dynamic task allocation 5.9:
∑t∈T
ktpm · σtpm + γpm ≤ τmaxm
{m = 1, . . .Mpm = 1, . . . Pm
(5.9)
Let us denote byM a set of machines, by P a set of processors and by T a set of tasks that mustbe executed. Each machinem has a price of ψm, consumes power in idle state πm and occupiesa certain space αm (understood as the number of U’s in a rack). Each processor p belongs toone machine m, denoted as pm. Every task t has a duration and consumes a certain amount ofenergy depending on the target processor, σtp and etp respectively.
This time the problem consists on finding the most appropriate allocation of tasks t intoprocessors p, that is, finding the optimum ktp that minimizes the energy consumption. Thenew factor γpm indicates whether a processor p = 1, . . . , P is free or not when the optimizationbegins, so that the system can take into account the initial usage of processors.
78
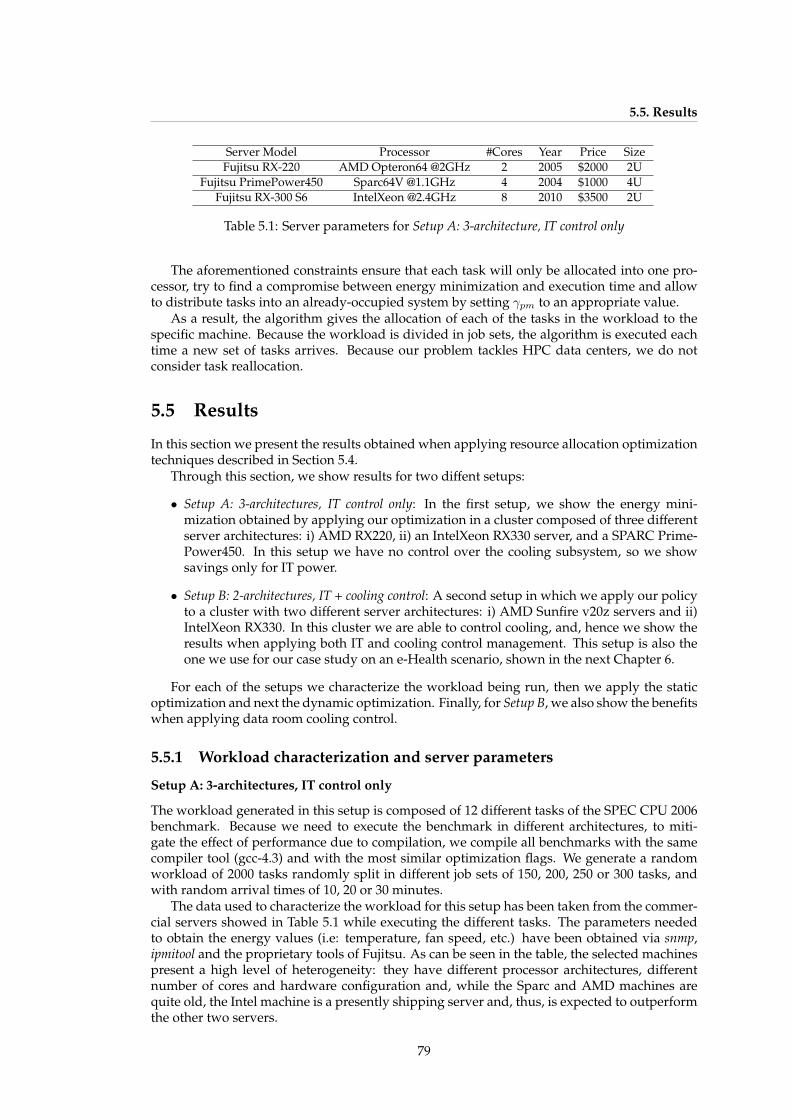
5.5. Results
Server Model Processor #Cores Year Price SizeFujitsu RX-220 AMD Opteron64 @2GHz 2 2005 $2000 2U
Fujitsu PrimePower450 Sparc64V @1.1GHz 4 2004 $1000 4UFujitsu RX-300 S6 IntelXeon @2.4GHz 8 2010 $3500 2U
Table 5.1: Server parameters for Setup A: 3-architecture, IT control only
The aforementioned constraints ensure that each task will only be allocated into one pro-cessor, try to find a compromise between energy minimization and execution time and allowto distribute tasks into an already-occupied system by setting γpm to an appropriate value.
As a result, the algorithm gives the allocation of each of the tasks in the workload to thespecific machine. Because the workload is divided in job sets, the algorithm is executed eachtime a new set of tasks arrives. Because our problem tackles HPC data centers, we do notconsider task reallocation.
5.5 Results
In this section we present the results obtained when applying resource allocation optimizationtechniques described in Section 5.4.
Through this section, we show results for two diffent setups:
• Setup A: 3-architectures, IT control only: In the first setup, we show the energy mini-mization obtained by applying our optimization in a cluster composed of three differentserver architectures: i) AMD RX220, ii) an IntelXeon RX330 server, and a SPARC Prime-Power450. In this setup we have no control over the cooling subsystem, so we showsavings only for IT power.
• Setup B: 2-architectures, IT + cooling control: A second setup in which we apply our policyto a cluster with two different server architectures: i) AMD Sunfire v20z servers and ii)IntelXeon RX330. In this cluster we are able to control cooling, and, hence we show theresults when applying both IT and cooling control management. This setup is also theone we use for our case study on an e-Health scenario, shown in the next Chapter 6.
For each of the setups we characterize the workload being run, then we apply the staticoptimization and next the dynamic optimization. Finally, for Setup B, we also show the benefitswhen applying data room cooling control.
5.5.1 Workload characterization and server parameters
Setup A: 3-architectures, IT control only
The workload generated in this setup is composed of 12 different tasks of the SPEC CPU 2006benchmark. Because we need to execute the benchmark in different architectures, to miti-gate the effect of performance due to compilation, we compile all benchmarks with the samecompiler tool (gcc-4.3) and with the most similar optimization flags. We generate a randomworkload of 2000 tasks randomly split in different job sets of 150, 200, 250 or 300 tasks, andwith random arrival times of 10, 20 or 30 minutes.
The data used to characterize the workload for this setup has been taken from the commer-cial servers showed in Table 5.1 while executing the different tasks. The parameters neededto obtain the energy values (i.e: temperature, fan speed, etc.) have been obtained via snmp,ipmitool and the proprietary tools of Fujitsu. As can be seen in the table, the selected machinespresent a high level of heterogeneity: they have different processor architectures, differentnumber of cores and hardware configuration and, while the Sparc and AMD machines arequite old, the Intel machine is a presently shipping server and, thus, is expected to outperformthe other two servers.
79
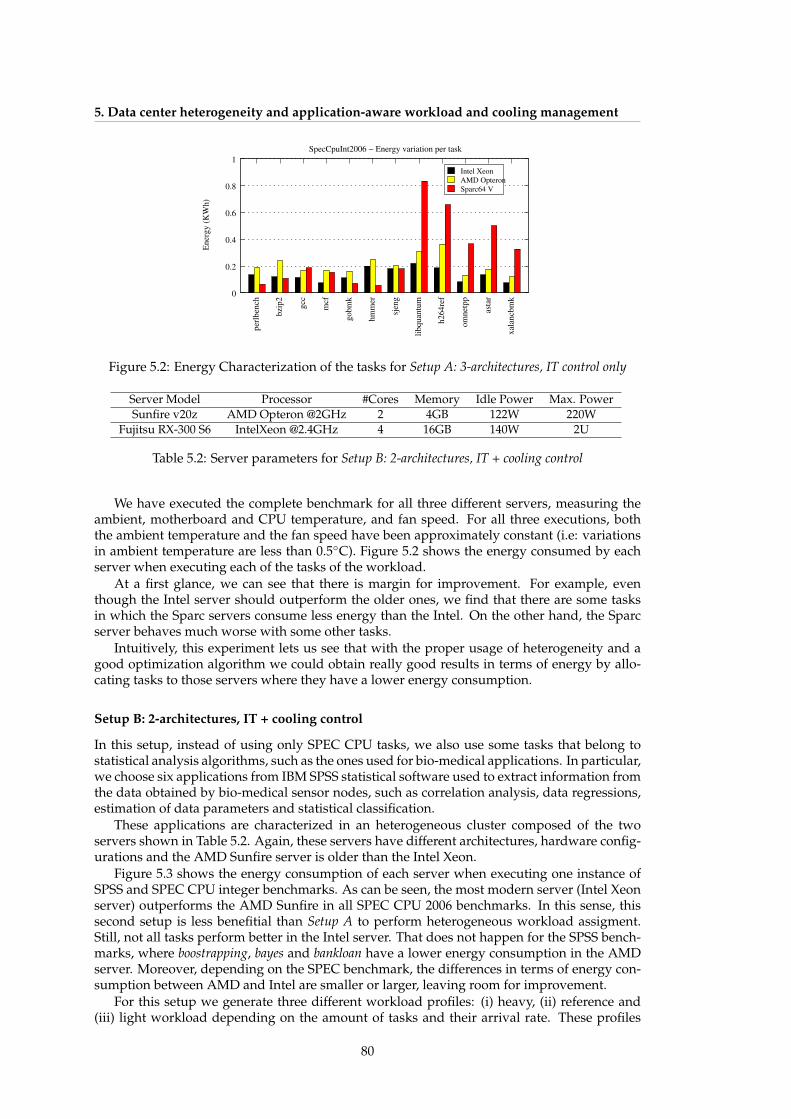
5. Data center heterogeneity and application-aware workload and cooling management
0
0.2
0.4
0.6
0.8
1
per
lben
ch
bzi
p2
gcc
mcf
gobm
k
hm
mer
sjen
g
libquan
tum
h264re
f
om
net
pp
asta
r
xal
ancb
mk
Ener
gy (
KW
h)
SpecCpuInt2006 − Energy variation per task
Intel Xeon
AMD Opteron
Sparc64 V
Figure 5.2: Energy Characterization of the tasks for Setup A: 3-architectures, IT control only
Server Model Processor #Cores Memory Idle Power Max. PowerSunfire v20z AMD Opteron @2GHz 2 4GB 122W 220W
Fujitsu RX-300 S6 IntelXeon @2.4GHz 4 16GB 140W 2U
Table 5.2: Server parameters for Setup B: 2-architectures, IT + cooling control
We have executed the complete benchmark for all three different servers, measuring theambient, motherboard and CPU temperature, and fan speed. For all three executions, boththe ambient temperature and the fan speed have been approximately constant (i.e: variationsin ambient temperature are less than 0.5◦C). Figure 5.2 shows the energy consumed by eachserver when executing each of the tasks of the workload.
At a first glance, we can see that there is margin for improvement. For example, eventhough the Intel server should outperform the older ones, we find that there are some tasksin which the Sparc servers consume less energy than the Intel. On the other hand, the Sparcserver behaves much worse with some other tasks.
Intuitively, this experiment lets us see that with the proper usage of heterogeneity and agood optimization algorithm we could obtain really good results in terms of energy by allo-cating tasks to those servers where they have a lower energy consumption.
Setup B: 2-architectures, IT + cooling control
In this setup, instead of using only SPEC CPU tasks, we also use some tasks that belong tostatistical analysis algorithms, such as the ones used for bio-medical applications. In particular,we choose six applications from IBM SPSS statistical software used to extract information fromthe data obtained by bio-medical sensor nodes, such as correlation analysis, data regressions,estimation of data parameters and statistical classification.
These applications are characterized in an heterogeneous cluster composed of the twoservers shown in Table 5.2. Again, these servers have different architectures, hardware config-urations and the AMD Sunfire server is older than the Intel Xeon.
Figure 5.3 shows the energy consumption of each server when executing one instance ofSPSS and SPEC CPU integer benchmarks. As can be seen, the most modern server (Intel Xeonserver) outperforms the AMD Sunfire in all SPEC CPU 2006 benchmarks. In this sense, thissecond setup is less benefitial than Setup A to perform heterogeneous workload assigment.Still, not all tasks perform better in the Intel server. That does not happen for the SPSS bench-marks, where boostrapping, bayes and bankloan have a lower energy consumption in the AMDserver. Moreover, depending on the SPEC benchmark, the differences in terms of energy con-sumption between AMD and Intel are smaller or larger, leaving room for improvement.
For this setup we generate three different workload profiles: (i) heavy, (ii) reference and(iii) light workload depending on the amount of tasks and their arrival rate. These profiles
80

5.5. Results
0
20
40
60
80
Energy consumed for 1 instance of SPSS and SPEC CPU
En
erg
y (
Wh
)
corre
latio
n
boot
stra
pping
conjoint
perlb
ench gc
c
gobm
k
sjen
g
h264
ref
asta
r
regr
ession
baye
s
bank
loan
bzip2
mcf
hmm
er
libqu
antu
m
omne
tpp
xalanc
bmk
Intel RX300
AMD Sunfire
Figure 5.3: Energy for SPEC CPU 2006 benchmarks and SPSS in the servers of Setup B: 2-architectures, IT + cooling control
5 10 15 20 25 30 35 400
500
1000
1500
Time (minutes)
Nu
mb
er
of
job
s
Distribution of arrivals for heavy, reference and light workload
Heavy
Reference
Light
Figure 5.4: Distribution of arrivals for high, medium and low loads for Setup B: 2-architectures,IT + cooling control
emulate the typical distributions for workloads that arrive to a computing facility [104], inwhich the workload might show different temporal patterns of utilization at concrete periodsor at certain hours of the day [24]. All three workloads are organized in 10 different job sets thatarrive following a Poisson distribution with an average of 30 minutes. Each job set consists ofa burst of tasks to be executed. The amount of tasks per job set follows a uniform distributionthat depends on the workload profile: 1,000 to 1,500 tasks for the heavy workload profile, 500to 1200 tasks for the reference workload and 300 to 700 tasks for the light workload profile.The arrival rate for the three workloads is the one presented in Figure 5.4.
5.5.2 Data center server selection resultsAs shown in Section 5.4.1, this experiment consists on the selection of the optimum heteroge-neous data center, i.e., finding the number of servers of each type that minimize energy whilekeeping appropriate parameters of execution time, space and budget. All the algorithms pre-sented for both this scenario and the next have been programmed using ILOG CPLEX opti-mization suite. The reason for choosing CPLEX is that provides optimization libraries to solveMixed Integer Linear Programming (MILP) problems together with a very complete API forJava, C++, Python and .NET that eases the integration with other tools. We feed the algo-rithms with one job set of the workloads to be executed, and the algorithm solves which is theoptimum number of servers to be used, and provides an optimum assignment for that job set.
Setup A, static optimization
In Setup A, as we are working with three machines that have completely different architecture,we show results for two scenarios. First we try to find the optimum data center configurationwith the selection of cores from the group of the two oldest machines (the Sparc and the AMDarchitecture). Next, select the best server setup among all three architectures. We comparethe results of the heterogeneous data center with the corresponding homogeneous data center,contraining either: (i) the total budget and space, or (ii) the total number cores (i.e. selectingclusters with the same computing capacity).
81

5. Data center heterogeneity and application-aware workload and cooling management
Configuration Budget($) #Cores Time (hours) Energy (kWh)Heterogeneous (AMD & Sparc) 94000 214 118 2761
AMD only (budget limit) 94000 188 276 3472Sparc only (budget limit) 94000 188 269 2913
AMD only (computation limit) 214000 214 249 3540Sparc only (computation limit) 54000 214 243 2942
Table 5.3: Data center server selection comparison for Setup A
Workload profile Server selection
Heavy 35 Intel + 5 AMDReference 35 Intel + 5 AMD
Light 35 Intel + 5 AMD
Table 5.4: Selected heterogeneous cluster configuration for each workload profile in Setup B,with a computation limit of 160 cores
AMD Opteron vs Sparc 64V: In this case, we give the optimizer a pull of 100 Sparc and100 AMD machines, and a job set of 200 tasks to be allocated. The optimizer tries to minimizespace, price and total execution time. Note that we do not feed the optimizer with the completeworkload, but with one of the worksets instead. This way, we can optimize the data centerconfiguration for an occupancy similar to the worksets of the workload. This will allow us tominimize the total computation time (and thus, the total idle power).
The optimum data center configuration found by the optimizer is composed of 27 AMDand 40 Sparc servers. The total time to compute the solution with the CPLEX library tools is20 minutes. The amount of time spent to find a candidate solution is not relevant as this isan off-line optimization carried out just once, when the data center is going to be designed orextended. If we simulate the task allocation of the whole workload using Slurm for both thisconfiguration and for the two equivalent homogeneous data centers, given the budget and thecomputational capacity limitation, we obtain the results shown in Table 5.3.
As can be seen, the heterogeneous data center outperforms the homogeneous ones bothwhen homogeneous distributions with the same budget limitation are chosen or when thesame computational capacity is selected. The savings in terms of energy range from a 5%in the worst case (homogeneous SPARC with budget limit) to 22% (homogeneous AMD withbudget limit). In terms of time, the heterogeneous solution is also faster than the homogeneousone, with speed-ups in the range of 27-35%.
IntelXeon vs AMD Opteron vs Sparc 64V: In this case, we repeat the experiment for apool of 70 Intel, 70 AMD and 70 Sparc, with the same job set of 200 tasks. It must be notedthat this scenario is different from the previous one in the sense that it is clear that the Intelmachines outperform the other two. The optimizer chooses as the best data center, however,an heterogeneous one comprised of 5 Sparc and 24 Intel machines. In this sense, the optimiza-tion system admits that there are some tasks that perform better in Sparc processors, and usesthem to minimize energy. The improvement margin is, however, smaller. The heterogeneoussolution obviously outperforms any Sparc homogeneous data center. When compared to thehomogeneous Intel setup, however, the heterogeneous data center does not outperform thehomogeneous Intel for the same budget limitation. However, for the same computation ca-pacity (number of cores), the heterogeneous solution decreases energy by 6% and executiontime by 7%.
Setup B, static optimization
Table 5.4 summarizes the results for static optimization in Setup B, for each of the three work-load profiles (heavy, reference and light workload) when we limit total computation to a max-imum of 160 cores for execution.
As can be seen, in this case the optimizer always chooses an heterogeneous data center
82

5.5. Results
Configuration Time (h) Energy variation (kWh)Heterogeneous AMD & Sparc 112 151
AMD only (budget limit) 248 218Sparc only (budget limit) 261 290
Heterogeneous Intel & Sparc 90 101Intel only (comp. limit) 100 134Sparc only (comp. limit) 103 301
Table 5.5: Energy savings and performance for dynamic workload allocation of Setup A
containing a small amount of AMD servers that are used to perform the tasks in which theyoutperform the Intel servers in terms of energy efficiency. Those tasks are the ones previouslyshown in Figure 5.3. All the combinations use 160 cores and the amount of required AMDservers is highly dependant on the workload to be executed, as well on the duration of theexecution, as the AMD servers present a lower static power than the Intel servers.
5.5.3 Runtime workload allocation results
The dynamic allocation of tasks aims at minimizing the energy consumption of the assignmentby placing each task where it wastes the minimum energy in a spatio-temporal way. The inputto our system is the same than in the previous scenario (i.e., an already scheduled workload).However, instead of allocating a particular job set, we allocate the whole workload.
This case is different from the previous one in the sense that the algorithms must be readyto work during run-time, in parallel with the execution of the workload. This can be accom-plished by implementing a new Slurm plug-in that uses the CPLEX library tools for the taskdistribution and allocation. The optimization runs each time that a new job set (defined asa pack of random tasks) arrives at the resource manager, for a limited period of time, in or-der to assign tasks to processors. Note that the optimizer assumes all servers selected in thestatic optimization are turned on (no sleep modes are assumed), and focuses on improvingtotal dynamic energy, i.e., the energy that the system uses for executing the workload. Thegoal of the optimization is not really to reduce drastically the total execution time (as this timeis inherently reduced by the static optimization), but just to ensure that performance is notdegraded.
Setup A, dynamic optimization
Table 5.5 shows the results of the dynamic optimization in Setup A, performed both for thehomogeneous data centers and the heterogeneous ones and after the execution of the opti-mization algorithms with the whole workload. As can be seen, energy savings are obtainedfor all the data center setups, but specially for the heterogeneous ones, that outperform thehomogeneous configurations in all cases. Even though the improvements are again higherfor the AMD and Sparc combination, there are also savings in the Intel and Sparc case. Thissavings range from 24% to 47% without degradation on execution time.
Finally, it must be noted that the execution of this run-time optimization is completelyfeasible. As the algorithm does only have to work with the current job set, the optimizationis fast: it only needs from 30s to 1min of time to find results with good error margins. As theexecution time of a task ranges from 10 minutes to hours, the time overhead introduced by theoptimization is negligible.
Setup B, dynamic optimization
For this setup, we provice an insight on the trade-offs of our solution when using differentworkload profiles, for the heterogeneous clusters selected in the previous section.
Figure 5.5 provides an insight on the workload coming into the data center for the threedifferent workload scenarios when jobs are scheduled by SLURM default round-robin policy
83
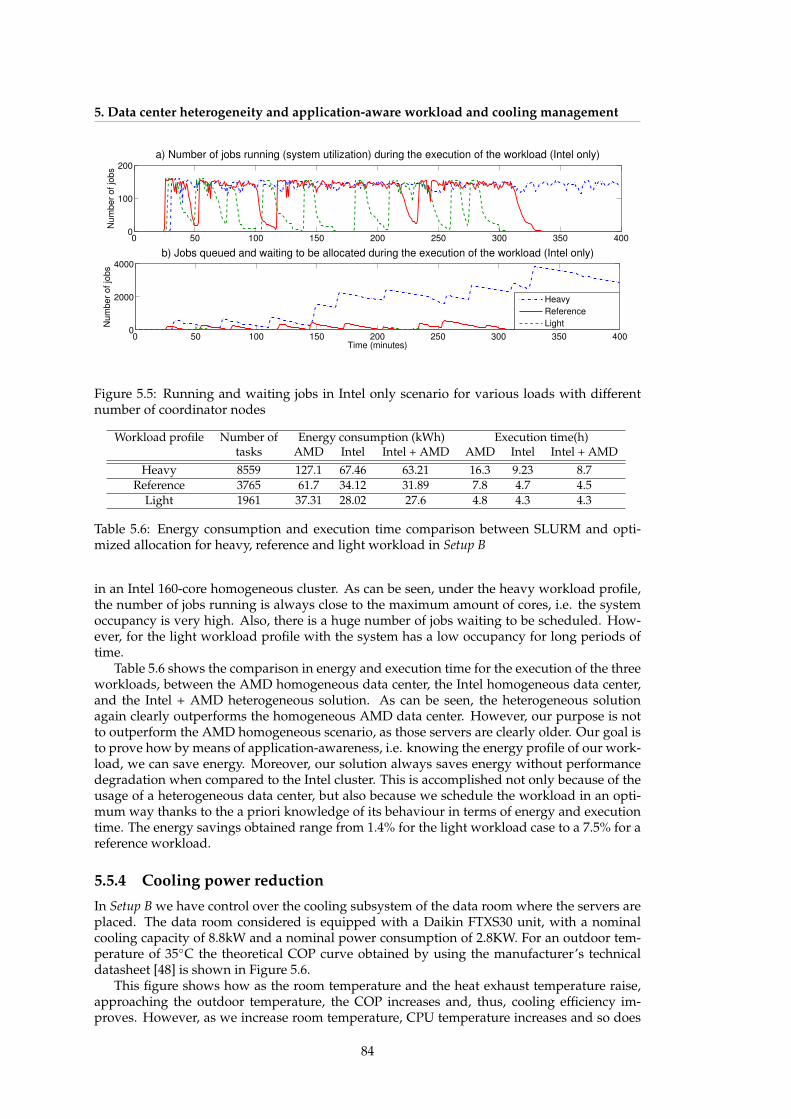
5. Data center heterogeneity and application-aware workload and cooling management
0 50 100 150 200 250 300 350 4000
100
200
Nu
mb
er
of
job
s
a) Number of jobs running (system utilization) during the execution of the workload (Intel only)
0 50 100 150 200 250 300 350 4000
2000
4000
Time (minutes)
Nu
mb
er
of
job
s
b) Jobs queued and waiting to be allocated during the execution of the workload (Intel only)
Heavy
Reference
Light
Figure 5.5: Running and waiting jobs in Intel only scenario for various loads with differentnumber of coordinator nodes
Workload profile Number of Energy consumption (kWh) Execution time(h)tasks AMD Intel Intel + AMD AMD Intel Intel + AMD
Heavy 8559 127.1 67.46 63.21 16.3 9.23 8.7Reference 3765 61.7 34.12 31.89 7.8 4.7 4.5
Light 1961 37.31 28.02 27.6 4.8 4.3 4.3
Table 5.6: Energy consumption and execution time comparison between SLURM and opti-mized allocation for heavy, reference and light workload in Setup B
in an Intel 160-core homogeneous cluster. As can be seen, under the heavy workload profile,the number of jobs running is always close to the maximum amount of cores, i.e. the systemoccupancy is very high. Also, there is a huge number of jobs waiting to be scheduled. How-ever, for the light workload profile with the system has a low occupancy for long periods oftime.
Table 5.6 shows the comparison in energy and execution time for the execution of the threeworkloads, between the AMD homogeneous data center, the Intel homogeneous data center,and the Intel + AMD heterogeneous solution. As can be seen, the heterogeneous solutionagain clearly outperforms the homogeneous AMD data center. However, our purpose is notto outperform the AMD homogeneous scenario, as those servers are clearly older. Our goal isto prove how by means of application-awareness, i.e. knowing the energy profile of our work-load, we can save energy. Moreover, our solution always saves energy without performancedegradation when compared to the Intel cluster. This is accomplished not only because of theusage of a heterogeneous data center, but also because we schedule the workload in an opti-mum way thanks to the a priori knowledge of its behaviour in terms of energy and executiontime. The energy savings obtained range from 1.4% for the light workload case to a 7.5% for areference workload.
5.5.4 Cooling power reduction
In Setup B we have control over the cooling subsystem of the data room where the servers areplaced. The data room considered is equipped with a Daikin FTXS30 unit, with a nominalcooling capacity of 8.8kW and a nominal power consumption of 2.8KW. For an outdoor tem-perature of 35◦C the theoretical COP curve obtained by using the manufacturer’s technicaldatasheet [48] is shown in Figure 5.6.
This figure shows how as the room temperature and the heat exhaust temperature raise,approaching the outdoor temperature, the COP increases and, thus, cooling efficiency im-proves. However, as we increase room temperature, CPU temperature increases and so does
84

5.5. Results
22 24 26 28 30 322.8
3
3.2
3.4
3.6
3.8
Entering Dry Bulb Temperature (C)
Coeffic
ient of P
erf
orm
ance (
CO
P)
Figure 5.6: Evolution of the air-conditioning COP with room temperature
6AM 8AM 10AM 12PM 2PM 4PM 6PM 8PM 10PM 12AM 2AM 4AM0
500
1000
1500
Time (sec)
Pow
er
(W)
Cooling power for various air supply temperatures
18deg
20deg
24deg
Figure 5.7: Cooling power for different air supply temperatures
leakage power. Therefore, there is a tradeoff between the reduction in cooling power and theincrement in server leakage power. In our setup, we deploy sensors to measure the coolingpower of the Daikin air conditioning unit, plus environmental sensors to measure the cold airsupply temperature.
Moreover, given our previously developed models and the server monitoring deployed inthe room, we are able to test the impact of server CPU leakage as room temperature raises.
Figure 5.7 shows the power consumption for different air supply temperatures. Data isgathered for a whole day, as the power consumption exhibits a periodic behavior dependanton the outdoor temperature. The power consumption decreases from 23.17kWh per day at18◦C to 19.65kWh when set to 24◦C, yielding a 15% in energy savings.
For the same period of time, we gather server power consumption and CPU tempera-ture when all servers in the data room are fully utilized running tasks of the SPEC CPU 2006benchmark. Figure 5.8a shows the IT power consumption for the Sunfire V20z server and theIntelXeon that exhibit the higher CPU temperatures in our data room. These servers are theones limiting the air-supply temperature, as we must ensure their safety operation and, weneed to keep leakage from dominating power. Figure 5.8b shows how the server power con-sumption is almost stable, meaning that for these CPU temperatures we are working in theregion where temperature-dependant leakage power is almost negligible.
For temperatures above 24◦C, however, the contribution of leakage power starts to be ofimportance, thus, we set cooling supply temperature to 24◦C. Table 5.7 shows the overall datacenter power consumption (IT and cooling power) when using the default SLURM allocationpolicy (first row), when only applying cooling control (second row) and when using joint ITand cooling control strategies (third row). As can be seen, we can obtain energy savings thatrange from 6.5% to 11% in total data center power, which is a very significant value. For thereference workload profile, if we analyze the impact of these savings in the electricity bill, andscale our results to the execution of 1 year of traces, for an energy cost of 0.1e/kWh, we obtainsavings of 1,200e per rack and year.
85
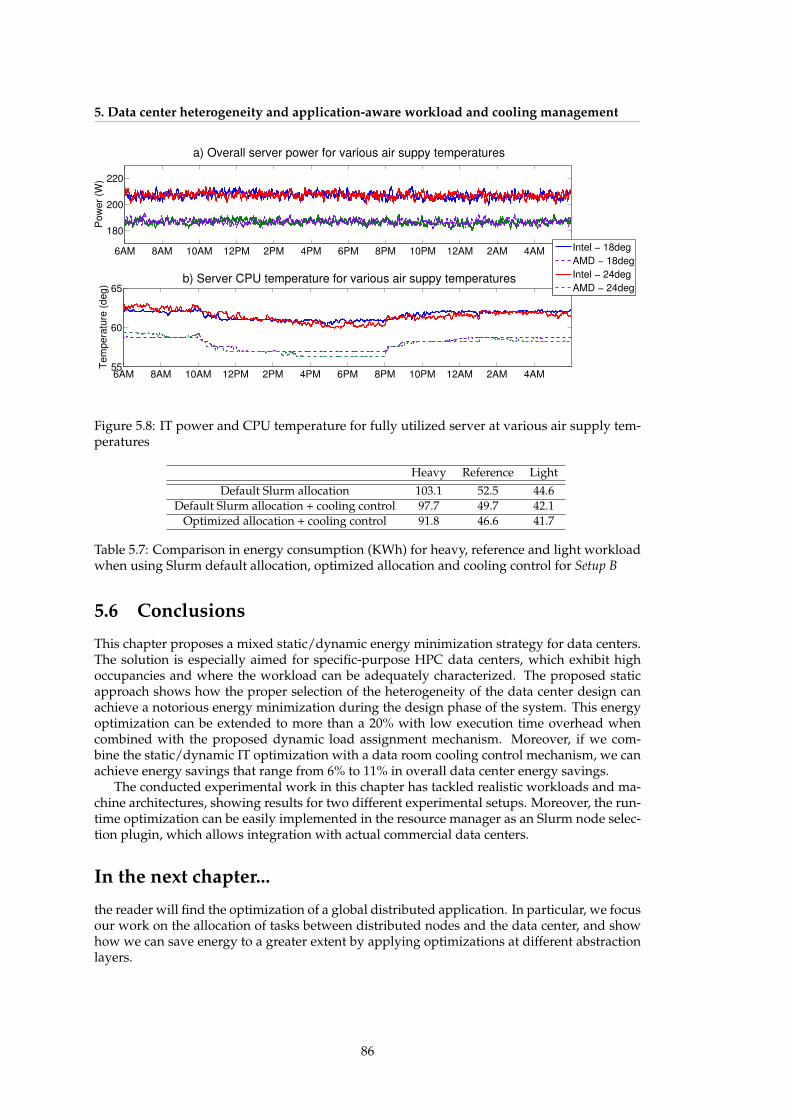
5. Data center heterogeneity and application-aware workload and cooling management
6AM 8AM 10AM 12PM 2PM 4PM 6PM 8PM 10PM 12AM 2AM 4AM
180
200
220
Pow
er
(W)
a) Overall server power for various air suppy temperatures
6AM 8AM 10AM 12PM 2PM 4PM 6PM 8PM 10PM 12AM 2AM 4AM55
60
65
Tem
pera
ture
(deg)
b) Server CPU temperature for various air suppy temperatures
Intel − 18deg
AMD − 18deg
Intel − 24deg
AMD − 24deg
Figure 5.8: IT power and CPU temperature for fully utilized server at various air supply tem-peratures
Heavy Reference Light
Default Slurm allocation 103.1 52.5 44.6Default Slurm allocation + cooling control 97.7 49.7 42.1
Optimized allocation + cooling control 91.8 46.6 41.7
Table 5.7: Comparison in energy consumption (KWh) for heavy, reference and light workloadwhen using Slurm default allocation, optimized allocation and cooling control for Setup B
5.6 Conclusions
This chapter proposes a mixed static/dynamic energy minimization strategy for data centers.The solution is especially aimed for specific-purpose HPC data centers, which exhibit highoccupancies and where the workload can be adequately characterized. The proposed staticapproach shows how the proper selection of the heterogeneity of the data center design canachieve a notorious energy minimization during the design phase of the system. This energyoptimization can be extended to more than a 20% with low execution time overhead whencombined with the proposed dynamic load assignment mechanism. Moreover, if we com-bine the static/dynamic IT optimization with a data room cooling control mechanism, we canachieve energy savings that range from 6% to 11% in overall data center energy savings.
The conducted experimental work in this chapter has tackled realistic workloads and ma-chine architectures, showing results for two different experimental setups. Moreover, the run-time optimization can be easily implemented in the resource manager as an Slurm node selec-tion plugin, which allows integration with actual commercial data centers.
In the next chapter...
the reader will find the optimization of a global distributed application. In particular, we focusour work on the allocation of tasks between distributed nodes and the data center, and showhow we can save energy to a greater extent by applying optimizations at different abstractionlayers.
86
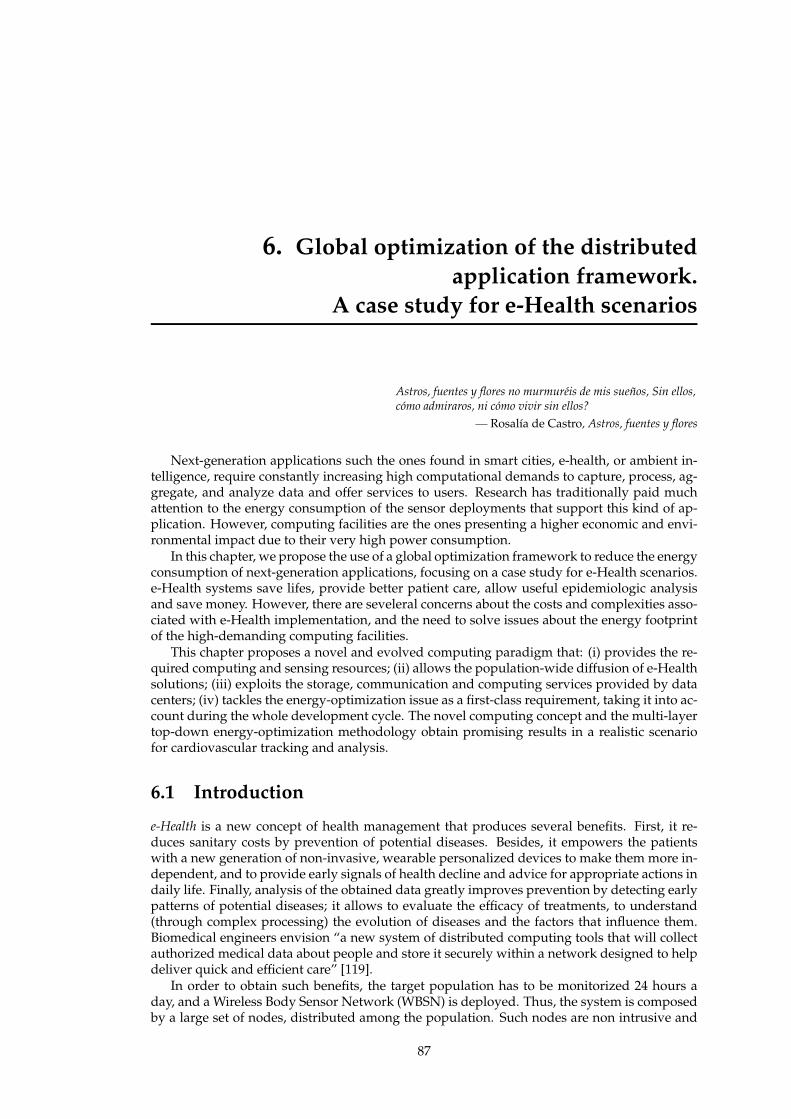
6. Global optimization of the distributedapplication framework.
A case study for e-Health scenarios
Astros, fuentes y flores no murmureis de mis suenos, Sin ellos,como admiraros, ni como vivir sin ellos?
— Rosalıa de Castro, Astros, fuentes y flores
Next-generation applications such the ones found in smart cities, e-health, or ambient in-telligence, require constantly increasing high computational demands to capture, process, ag-gregate, and analyze data and offer services to users. Research has traditionally paid muchattention to the energy consumption of the sensor deployments that support this kind of ap-plication. However, computing facilities are the ones presenting a higher economic and envi-ronmental impact due to their very high power consumption.
In this chapter, we propose the use of a global optimization framework to reduce the energyconsumption of next-generation applications, focusing on a case study for e-Health scenarios.e-Health systems save lifes, provide better patient care, allow useful epidemiologic analysisand save money. However, there are seveleral concerns about the costs and complexities asso-ciated with e-Health implementation, and the need to solve issues about the energy footprintof the high-demanding computing facilities.
This chapter proposes a novel and evolved computing paradigm that: (i) provides the re-quired computing and sensing resources; (ii) allows the population-wide diffusion of e-Healthsolutions; (iii) exploits the storage, communication and computing services provided by datacenters; (iv) tackles the energy-optimization issue as a first-class requirement, taking it into ac-count during the whole development cycle. The novel computing concept and the multi-layertop-down energy-optimization methodology obtain promising results in a realistic scenariofor cardiovascular tracking and analysis.
6.1 Introduction
e-Health is a new concept of health management that produces several benefits. First, it re-duces sanitary costs by prevention of potential diseases. Besides, it empowers the patientswith a new generation of non-invasive, wearable personalized devices to make them more in-dependent, and to provide early signals of health decline and advice for appropriate actions indaily life. Finally, analysis of the obtained data greatly improves prevention by detecting earlypatterns of potential diseases; it allows to evaluate the efficacy of treatments, to understand(through complex processing) the evolution of diseases and the factors that influence them.Biomedical engineers envision “a new system of distributed computing tools that will collectauthorized medical data about people and store it securely within a network designed to helpdeliver quick and efficient care” [119].
In order to obtain such benefits, the target population has to be monitorized 24 hours aday, and a Wireless Body Sensor Network (WBSN) is deployed. Thus, the system is composedby a large set of nodes, distributed among the population. Such nodes are non intrusive and
87

6. Global optimization of the distributed application framework.A case study for e-Health scenarios
portable, which imposes constraints on their energy consumption. Data obtained by the sen-sors are communicated to the embedded processing elements (PDAs, smartphones, etc.) bymeans of wireless connections.
Then, the huge set of data must be analyzed with the aim of performing the epidemiologicassessment. Also, diagnosis algorithms have to be implemented to allow early detection ofpathologies and to learn the evolution of patients.
Since the target population is large, so it is the number of sensing nodes, and the amountof data to be managed is huge. In order to deal efficiently with such computationally inten-sive tasks, the use of data centers is devised. Thus, the WBSNs will be connected not onlyat the node level, but also through the PDA, Smartphone, etc. to data centers. Part of thedata processing and storage will be local to the node, while another part will be communi-cated and processed in data centers, depending on the application, the state of the batteriesand on security or privacy requirements of the information. The availability of the aforemen-tioned technologies and the need of a continuous, portable, and non-invasive monitoring ofthe health information has led us to envision and design a real-time health monitoring andanalysis framework capable of aiding health-care professionals. According to [60], one of themain questions to be answered is how computation can be offloaded and distributed frommobile devices to the data center efficiently. The reasons for sharing/offloading work froma mobile device would be: limited computational capability, limited battery power, limitedconnectivity and to make use of idling processing power.
The focus of this work is proposing a novel multi-layered approach for the energy opti-mization of the overall application framework, and the validation with a case of study devotedto health monitoring and analysis applications.
This chapter makes the following contributions:
• we define a realistic and current application scenario where the computing and energysaving challenges are exposed;
• we propose a new highly-efficient computational paradigm;
• we demonstrate that the application characteristics must be considered in the computa-tional paradigm since the very beginning of the design process;
• we propose a global strategy for energy efficiency in the computational architecture.
The remainder of this chapter is organized as follows: Section 6.2 describes the relatedwork on the area. Section 6.3 shows the proposed energy optimization paradigm, whereasSection 6.4 describes the case study of this work. Section 6.5 briefly describes the models used,whereas Section 6.6 develops a global resource management optimization, which consitutesone of the main contributions of this chapter. In Section 6.7 we show how all the proposedoptimizations can be integrated from a multi-layer perspective. To end the Chapter, Section 6.8summarizes the main challenges and Section 6.9 draws the most important conclusions.
6.2 Related work
The use of MCC environments for the automation of personal health-care systems has beenrecently related in literature [4], [84], [126]; however, none of these works have approachedthe energy efficiency these kind of architectures.
Energy consumption is one of the major concerns for the adoption of population-widehealth monitoring systems, but energy efficiency cannot be added as an afterthought. Trulyenergy-efficient monitoring can only be achieved by considering energy as a first-class require-ment, taking it into account during the whole development cycle, from design to implemen-tation. Thus, we propose an architecture driven by energy concerns and aimed at optimizingenergy consumption globally.
In literature, we can find several energy optimization techniques that target the differentabstraction levels of the MCC architecture.
88

6.3. Devised computer paradigm
At the distributed computing level, the design of WBSN nodes is mainly focused on max-imizing the lifetime of the node by reducing the energy consumption, although other perfor-mance requirements such as the delay and quality of the delivered data must be kept intoaccount [23]. Energy efficiency in WBSNs has been tackled by proposing efficient MAC layeralternatives [122], providing stochastic approaches for traffic handling [58] or enabling com-pressed sensing signal acquisition/compression algorithms [100].
At the server level, throughout this Ph.D. thesis we have cited several sources that supportthe claim that one of the main problems to be solved in order to achieve the performance goalis the so called power-wall [18]. Thus, power consumption limits the advances in computertechnology and is becoming a relevant part on the budget of present data centers.
As shown in previous chapters, researchers have done a massive amount of work to pro-vide an energy-aware high performance computing environment. In these works, differentscheduling, resource allocation and work assignment mechanisms are studied to improve theenergy profile. Multi-layered approaches like ours, that targets both the node and server lev-els, are still missing. Some energy optimization policies have been detected but not success-fully proposed mainly due to the fact that they do not consider the global power consumption.In particular, they do not take into account the following:
1. that the agents involved in the problem (wireless nodes, embedded processors, networkinterfaces, high-performance servers, etc.) are very heterogeneous from the energy pointof view. Therefore, the energy cost of performing part of the processing in any of thedifferent abstraction layers, from the node to the data center, should be evaluated;
2. a local optimization in one of the abstraction layers can have a bigger negative impacton the others, so that the global energy of the system is increased. In this way, the rela-tionships between all the computational agents have to be taken into account.
Our proposal develops global energy optimization policies that start from the design of thearchitecture of the system and take into account the energy relationship between the differentabstraction layers.
In our work, we manage the whole set of abstraction levels in MCC to obtain the maximumbenefit of the energy-aware policies. Among others, we consider computation offloading fromthe data center to the wireless nodes (and viceversa) as an effective mechanism for energyoptimization. Computation offloading in MCC scenarios has been proposed by Kumar andLu [89] and has proved to provide high benefits. However, the authors have not consideredrealistic scenarios like e-Health and have not proposed a multi-layered optimization approachthat combines this technique with other optimization mechanisms.
Some authors have recently followed a similar approach to our multi-layered proposal. Forexample, Greene [68] described a research work on how to reduce GPS power consumptionby offloading certain calculations onto the data center. However, to the best of our knowl-edge, this is the first time that a work targets for energy optimization purposes the severalconstituent layers that enable MCC in e-Health scenarios. Our work provides horizontal andvertical approaches to extend the energy savings that these environments require.
6.3 Devised computer paradigm
As previously described, our envisioned MCC e-Health system is composed of a number ofbody sensors, wirelessly connected to the Internet through a mobile processing device (asillustrated in Figure 6.1). The distributed system spans a network comprised of individualhealth monitoring systems that connect through to data center facilities.
To provide adequate energy management, this heterogeneous distributed computing sys-tem for health monitoring is tightly coupled with an energy analysis and optimization system,which continuously adapts the amount of processing that is performed in the different layersof the distributed system, and the resources assigned to each task.
It is important to stress the need for a top-down approach, driven by the application contextand the energy constraints, in order to reach an optimum solution globally.
89

6. Global optimization of the distributed application framework.A case study for e-Health scenarios
WBSNPersonal servers
(smartphones) Data Centers
Energy Analysis and Optimization System
Figure 6.1: Overview of the proposed architecture for energy optimization in e-Health scenar-ios
6.3.1 Energy optimization systemThe energy optimization system proposed in this chapter follows the architecture proposed inthe introductory chapter of the Ph.D. Thesis (see Section 1.3, Figure 1.4), in which we proposeda global optimization paradigm based on monitoring to acquire data, modeling and optimiza-tion in several layers of abstraction. Figure 6.2 provides higher detail on the specific systemtargetting our case study.
Detailed functions of constituents in the system are summarized as follows:
• Application support network: Population analysis applications require an heterogeneousnetwork comprised of sensor nodes, data centers, and some kind of interconnection net-work. Each node has different computation capacity, functional requirements, commu-nication capacity, battery capacity, power consumption characteristics, etc.
• Sensing infrastructure: Global energy optimization requires a clear understanding ofthe current state of the network, the characteristics of the different resources and of theanalysis to be performed. Therefore, additional HW and/or SW sensors should be addedto the system to get an insight.
• Data analysis and sensor configuration: Not every sensor has the same importance tounderstand the power consumption characteristics of the different components. Aftera careful analysis, the sensing infrastructure is configured to provide only the relevantdata at the required rate for the power model to be useful, and also to minimize theenergy overhead of the energy optimization system.
• Storage and inference system: Data provided by the sensing infrastructure has to bestored and statistically analyzed in search of recurrent behaviors that could lead to sim-ple but accurate power models to be used for proactive optimizations. Although thedata provided by the sensors is very low-level, simple inference techniques can be usedto raise the level of abstraction, for example, to understand the characteristics of energydemand by the different applications.
• Power model: Complex power models are not adequate for online optimization, as dif-ferent alternatives should be quickly evaluated against the power model to proactivelyconfigure the whole system for minimum energy consumption. These power modelscan be trained with actual data from sensors in order to improve the quality and also toadapt to variations in the heterogeneous application support network.
• Optimization: Based on the current state of the system, the historic data, and the en-ergy characteristics of application and resources, many optimization algorithms can be
90
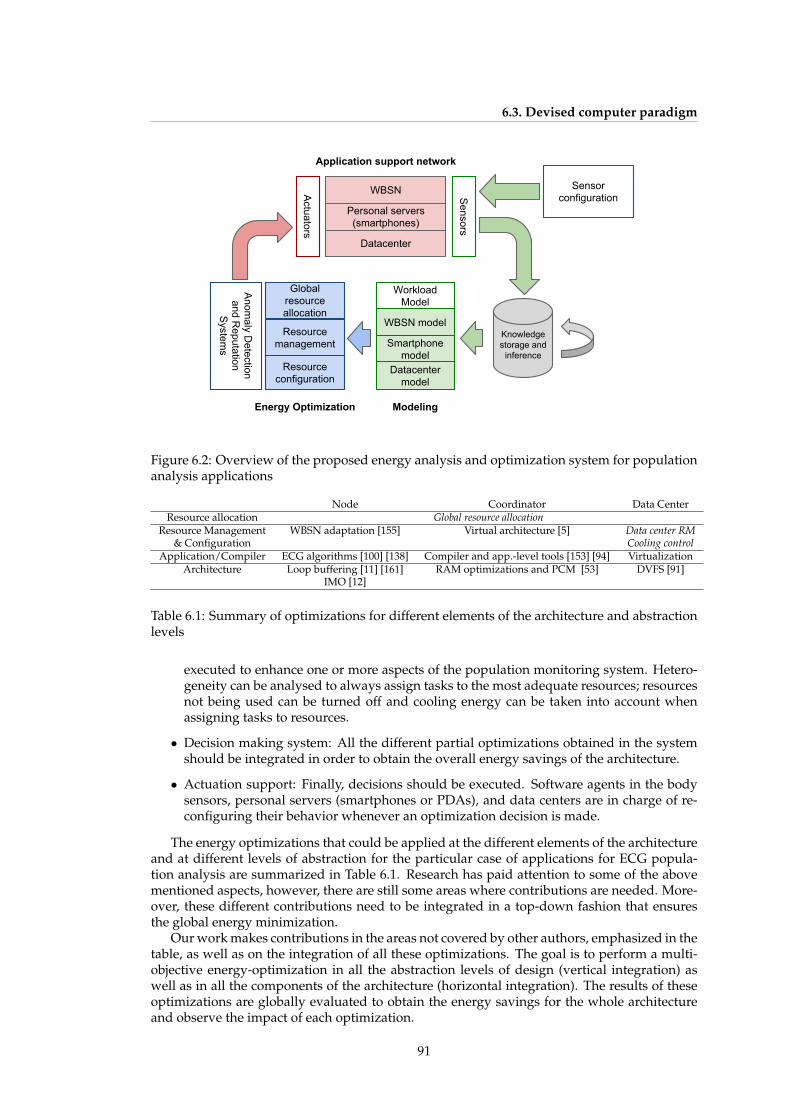
6.3. Devised computer paradigm
Datacenter
Workload Model
Sensors
Actuators
Knowledge storage and
inference
Sensor configuration
WBSN model
Smartphone model
Datacenter model
Global resource allocation
Resource management
Resource configuration
Anom
aly Detection
and Reputation
System
s
Personal servers(smartphones)
WBSN
Application support network
ModelingEnergy Optimization
Figure 6.2: Overview of the proposed energy analysis and optimization system for populationanalysis applications
Node Coordinator Data CenterResource allocation Global resource allocation
Resource Management WBSN adaptation [155] Virtual architecture [5] Data center RM& Configuration Cooling control
Application/Compiler ECG algorithms [100] [138] Compiler and app.-level tools [153] [94] VirtualizationArchitecture Loop buffering [11] [161] RAM optimizations and PCM [53] DVFS [91]
IMO [12]
Table 6.1: Summary of optimizations for different elements of the architecture and abstractionlevels
executed to enhance one or more aspects of the population monitoring system. Hetero-geneity can be analysed to always assign tasks to the most adequate resources; resourcesnot being used can be turned off and cooling energy can be taken into account whenassigning tasks to resources.
• Decision making system: All the different partial optimizations obtained in the systemshould be integrated in order to obtain the overall energy savings of the architecture.
• Actuation support: Finally, decisions should be executed. Software agents in the bodysensors, personal servers (smartphones or PDAs), and data centers are in charge of re-configuring their behavior whenever an optimization decision is made.
The energy optimizations that could be applied at the different elements of the architectureand at different levels of abstraction for the particular case of applications for ECG popula-tion analysis are summarized in Table 6.1. Research has paid attention to some of the abovementioned aspects, however, there are still some areas where contributions are needed. More-over, these different contributions need to be integrated in a top-down fashion that ensuresthe global energy minimization.
Our work makes contributions in the areas not covered by other authors, emphasized in thetable, as well as on the integration of all these optimizations. The goal is to perform a multi-objective energy-optimization in all the abstraction levels of design (vertical integration) aswell as in all the components of the architecture (horizontal integration). The results of theseoptimizations are globally evaluated to obtain the energy savings for the whole architectureand observe the impact of each optimization.
91

6. Global optimization of the distributed application framework.A case study for e-Health scenarios
Component Model Processor #Cores Memory Idle Power Max. Power
Node Shimmer MSP430 @8MHz 1 10KB 6.6mW 85mWCoordinator Samsung ARM Cortex-A9 2 1GB 0.5W 2.5W
Galaxy SII @1.2GHzRack SunFire v20z 2x AMD Opteron 2 4GB 122W 220W
Server @2GHzRack RX-300 Intel Xeon 8 16GB 140W 200W
Server S6 @2.4GHz
Table 6.2: Summary of properties for all architecture components in the e-Health application
6.4 Case study
In this section we describe a particular case study for ECG monitoring applications that weuse throughout the chapter to apply all energy models and optimizations, and that is eval-uated from a multi-layer perspective (Sections 6.5, 6.6 and 6.7). The architecture previouslymentioned for MCC technologies includes 4 types of elements: (i) sensors, (ii) nodes, (iii) co-ordinators and (iv) a data center facility. In our case study:
• Sensor: ECG sensors placed on the chest of the subject to record the signals of interest.
• Node: Shimmer platform. Composed of a Texas Instruments MSP430, a low power IEEE802.15.4-compliant radio (CC2420) and Bluetooth radio (not used due to high powerconsumption). HW characteristics: CPU 8MHz, 10KB RAM, 48KB Flash. The Shimmerplatform is placed near the sensors and connected to them with wires. This node canperform some conditioning on the signals received and sends them to the coordinatorvia radio. If more than one ECG sensor is used, they are connected to the coordinatordescribing a star topology.
• Coordinator: Android-based smartphone. HW characteristics: CPU 1GHz, 1GB of RAM,16GB of Flash Memory and a battery of 2000mAh. The coordinator is usually placed atthe waist of the subject and receives information from all the nodes that the person iswearing. It can perform some computations on the received signals (see Section 6.6) andit forwards data to the cloud computing facility via a 3G or WiFi network.
• Data center facility: Modern data centers are equipped with a large number of enterpriseservers. Because of budget limits when renewing the equipment, in these facilities weusually find different generations of machines, often from even different manufacturers.For this case study we assume a heterogeneous cloud computing facility with two dif-ferent servers (Intel and AMD) from different generations, exactly as in Setup B in theprevious Chapter 5.
Table 6.2 summarizes the properties of the different components of the architecture. Notethat maximum power for rack mounted servers indicates the maximum power measuredwhen fully utilizing the system, not the maximum power that can be drawn by the powersupply. Thus, this power is dependant on the particular hardware configuration of our servers
This case study considers a deployment consisting on 300 Shimmer nodes, 300 coordinators(smartphones) and a data center where a total amount of 160 cores, belonging to 40 Intel orAMD machines, are dedicated to our computational needs and placed in an air-cooled dataroom.
We define three different workload profiles: (i) heavy, (ii) reference and (iii) light work-load depending on the amount of tasks and their arrival rate, as in the previous chapter (Sec-tion 5.5.1, Setup B).
The different tasks of the workload are representative of the computation that has to beperformed for e-Health monitoring applications and information extraction in data centers.Particularly, we use the following benchmarks and algorithms:
92

6.5. Power models used
Tasks Execution Time Instructions per Cycle
Low demanding 6 (regression) <360sec <1.3Medium demanding 6 (gcc, mcf) 360-600sec <1.3
High demanding 6 (bzip2, hmmer) 460-800sec >1.3
Table 6.3: Classification and main parameters for the tasks of the workload
• Customized state-of-the-art ECG acquisition, compression and delineation algorithms,such as Compressed Sensing or Digital Wavelet Transform, as well as encryption anddecryption algorithms (e.g. AES) for secure data transmission.
• Statistical analysis algorithms, obtained from the IBM SPSS Statistics software. We choosesix applications commonly used to extract information from the data obtained by bio-medical sensor nodes, such as correlation analysis, data regressions, estimation of dataparameters and statistical classification.
• CPU-intensive tasks, obtained from the SPEC CPU 2006 benchmark suite [148], repre-senting algorithms of a higher abstraction level for the complex analysis and representa-tion performed over data that has already gone through a data analysis and conditioningstep. We choose the 12 tasks of the integer benchmark, among which we find data in-terpreters, decompression algorithms, combinatorial optimizations, database searchingalgorithms or event simulations.
This workload must be known and profiled in advance for our experimental study. Datacenters usually execute the same set of applications, what facilitates this knowledge extraction.Moreover, modern supercomputing infrastructures like CeSViMa provide a mechanism forfast application profiling before the actual execution.
For our purpose, we suppose that each job set is split in two different levels: (i) a Data-Dependant layer, in which most of the algorithms and computation are dependant on thedata generated by the Shimmer nodes; and (ii) an Application-dependant layer, in which al-gorithms operate over data generated in the previous layer, and computation depends on theparticular goal that has to be achieved. Because of the number of nodes deployed, we assumethat in our workload, a 60% of tasks belong to the Data-Dependant layer and the other 40% tothe Application-dependant layer.
Moreover, because of the different nature of the algorithms to be executed, we assumethat the tasks of the workload can be split into different classes according to the computingresources needed for execution. We define three different classes: (i) high-demanding appli-cations, (ii) medium-demanding applications and (iii) low-demanding applications. Tasks areclassified into a particular category attending to their computational demand by means of thek-means clustering technique presented in Section 6.6. Table 6.3 shows the amount of tasks percategory, example tasks for each category as well as two of the most important parameters forclassification criteria (execution time and instructions per cycle).
Finally, each of the two layers contains a different percentage of each of these tasks. TheData Dependant layer contains a 70% of low-demanding tasks, a 25% of medium-demandingand a 5% of high-demanding tasks. The Application-dependant layer contains a 70% of high-demanding tasks, a 25% of medium-demanding tasks and a 5% of low-demanding tasks. Fig-ure 6.3 summarizes the main parameters of the workload and its structure.
6.5 Power models used
In order to optimize energy consumption of the overal MCC environment, we first need to un-derstand which are the different main contributors to the overall power consumption. Then,we use several models both from literature and from our previous work to describe the behav-ior of the different elements of our architecture. Therefore, in this section we present the power
93

6. Global optimization of the distributed application framework.A case study for e-Health scenarios
Cloud Computing
Facility
Figure 6.3: Workload structure for the Data Dependant layer and the Application Dependantlayer
Figure 6.4: Power dissipated in Shimmer during sampling, processing and transmission [100]
modeling for the nodes, coordinators and the data center infrastructure that are managed bythe optimization algorithms presented in Sections 6.6 and 6.7.
6.5.1 Node model
The main contributors to the energy consumption at the node level are the sensors themselves(signal transducing and analog-to-digital conversion), the microcontroller (because of the cal-culations performed), the memory and the radio interface. The energy of the node (Enode) canthus be described as the sum of those terms:
Enode ≈ Esensor + EµC + Emem + Eradio (6.1)
Figure 6.4 shows the power consumption trace of the Shimmer node running a simple ECGstreaming application. The Shimmer platform implements a reduced version of the beacon-enabled mode of the IEEE 802.15.4 protocol that uses guaranteed time slots (GTS). The trans-mission consists of three phases: (i) the beacon reception, in which the radio is receiving andthe microcontroller is idle, (ii) Low-Power mode until the start of the assigned GTS, and (iii)transmission of the ECG signal to the coordinator during the GTS. During these phases, mi-crocontroller and radio go through different power states [100].
From the energy perspective, there is a trade-off between the amount of information sentthrough the radio link and the signal processing performed at the microcontroller. In ECG
94

6.5. Power models used
ECG CS Single 2-lead 2-leadStreaming lead Morph. spline
Packed ready every. . . (ms) 304 605.9 2250 2250 2250Energy Consumption (mJ) 7.70 7.29 7.42 8.68 10.12Lifetime (h) 134.6 142.1 139.6 119.3 102.4
Table 6.4: Node lifetime for the different algorithms
applications, there are several frequently used algorithms for signal compression and recon-struction that are performed at the node level. The most common are: (i) Compressed Sensing(CS), (ii) Digital Wavelet Transform (DWT) and (iii) Multi-lead DWT.
Works by Mamaghanian [100] and Rincon [138] show the energy differences when imple-menting these algorithms in the Shimmer platform. Table 6.4 summarizes the different nodebattery lifetime encountered depending on the algorithms and transmission strategies per-formed.
Results show that total energy consumption increases with the computational burden ofthe algorithms and, thus, battery life is reduced. However, the radio interface is not alwaysthe responsible for most of the energy consumption.
The previous energy results for different ECG algorithms are used in the optimizationsin Sections 6.6 and 6.7 to optimize the overall consumption by properly balancing the powerconsumption of the node elements and the coordinators.
6.5.2 Coordinator energy modeling
Our efforts in the energy modeling of the coordinator nodes (i.e. smartphones) focus on beingable to describe the impact of running the MCC algorithms on the smartphone battery life.
The main contributors to the power consumption in todays smartphones are the commu-nications (GSM, Wifi, etc.), graphics and the CPU when the system is suspended (i.e. most ofthe time) and also the display when the system is idle [36]:
Because the Shimmer nodes are responsible for the wireless transmissions, the Shimmerattached to the smartphone is responsible for the radio reception instead of the smartphoneitself, meaning that the ECG algorithms are a computational burden that has an impact mainlyon the microcontroller power consumption.
Because of that, we consider that the energy consumed by the coordinator (Ecoord) can bedescribed as in Equation 6.2:
Ecoord ≈ Ecomm,idle + Egraphics,idle + EµC (6.2)
where Ecomm,idle and Egraphics,idle are the idle power for communications and graphics andEµC is the power consumption for the microcontroller, which varies depending on the algo-rithm executed. In order to characterize the power consumption of the microcontroller we usethe Lookbusy synthetic workload to stress the system during monitored periods of time. Look-busy can stress all the hardware threads to a fixed CPU utilization percentage without memoryor disk usage. The usage of a synthetic workload to derive the CPU model has many advan-tages, the most important of which is that CPU power can be described as linearly dependentwith CPU utilization (uc) and Instructions Per Cycle (IPC), as seen in Equation 6.3:
EµC,coord = Ac · uc +Kc (6.3)
whereAc is a constant. Our coordinator nodes (Samsung Galaxy SII smartphones) are equippedwith an ARM Cortex-A9 processor at 1GHz. This processor is commonly found in many em-bedded system devices, such as the Panda board 1. To ease the profiling process, we character-ize the ARM Cortex-A9 processor in the Panda board by measuring the energy consumption
1http://pandaboard.org/content/resources/references
95
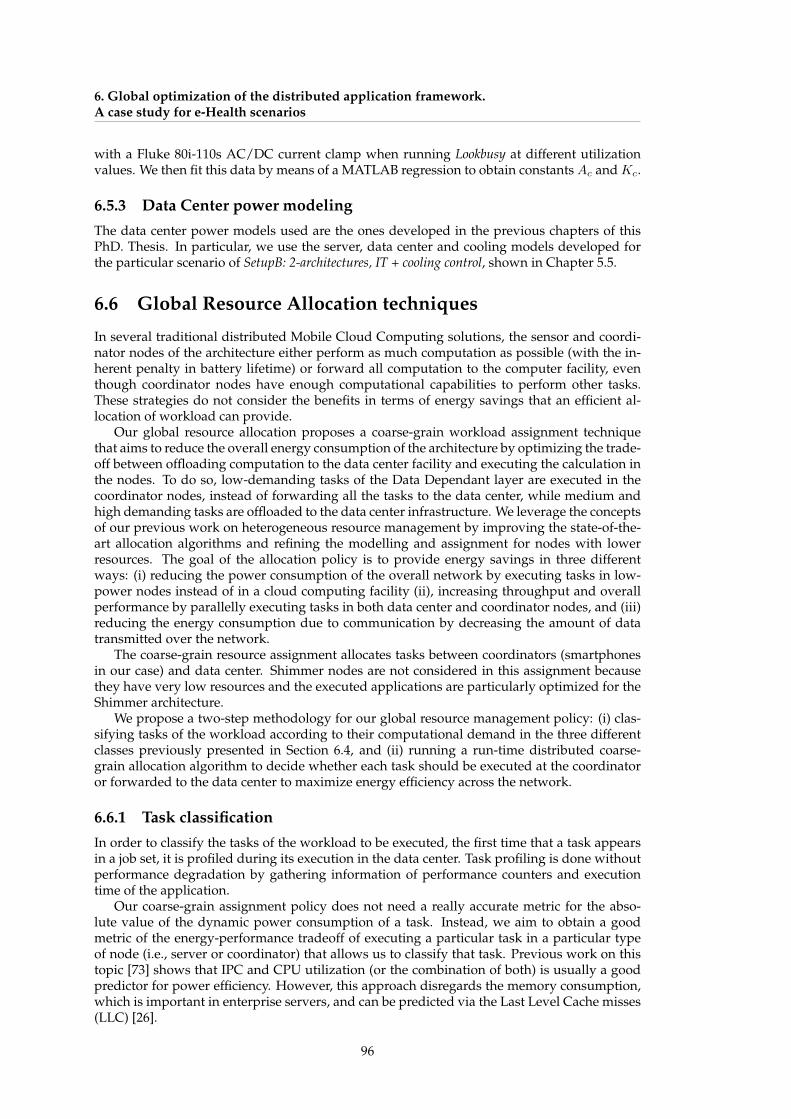
6. Global optimization of the distributed application framework.A case study for e-Health scenarios
with a Fluke 80i-110s AC/DC current clamp when running Lookbusy at different utilizationvalues. We then fit this data by means of a MATLAB regression to obtain constants Ac and Kc.
6.5.3 Data Center power modelingThe data center power models used are the ones developed in the previous chapters of thisPhD. Thesis. In particular, we use the server, data center and cooling models developed forthe particular scenario of SetupB: 2-architectures, IT + cooling control, shown in Chapter 5.5.
6.6 Global Resource Allocation techniques
In several traditional distributed Mobile Cloud Computing solutions, the sensor and coordi-nator nodes of the architecture either perform as much computation as possible (with the in-herent penalty in battery lifetime) or forward all computation to the computer facility, eventhough coordinator nodes have enough computational capabilities to perform other tasks.These strategies do not consider the benefits in terms of energy savings that an efficient al-location of workload can provide.
Our global resource allocation proposes a coarse-grain workload assignment techniquethat aims to reduce the overall energy consumption of the architecture by optimizing the trade-off between offloading computation to the data center facility and executing the calculation inthe nodes. To do so, low-demanding tasks of the Data Dependant layer are executed in thecoordinator nodes, instead of forwarding all the tasks to the data center, while medium andhigh demanding tasks are offloaded to the data center infrastructure. We leverage the conceptsof our previous work on heterogeneous resource management by improving the state-of-the-art allocation algorithms and refining the modelling and assignment for nodes with lowerresources. The goal of the allocation policy is to provide energy savings in three differentways: (i) reducing the power consumption of the overall network by executing tasks in low-power nodes instead of in a cloud computing facility (ii), increasing throughput and overallperformance by parallelly executing tasks in both data center and coordinator nodes, and (iii)reducing the energy consumption due to communication by decreasing the amount of datatransmitted over the network.
The coarse-grain resource assignment allocates tasks between coordinators (smartphonesin our case) and data center. Shimmer nodes are not considered in this assignment becausethey have very low resources and the executed applications are particularly optimized for theShimmer architecture.
We propose a two-step methodology for our global resource management policy: (i) clas-sifying tasks of the workload according to their computational demand in the three differentclasses previously presented in Section 6.4, and (ii) running a run-time distributed coarse-grain allocation algorithm to decide whether each task should be executed at the coordinatoror forwarded to the data center to maximize energy efficiency across the network.
6.6.1 Task classificationIn order to classify the tasks of the workload to be executed, the first time that a task appearsin a job set, it is profiled during its execution in the data center. Task profiling is done withoutperformance degradation by gathering information of performance counters and executiontime of the application.
Our coarse-grain assignment policy does not need a really accurate metric for the abso-lute value of the dynamic power consumption of a task. Instead, we aim to obtain a goodmetric of the energy-performance tradeoff of executing a particular task in a particular typeof node (i.e., server or coordinator) that allows us to classify that task. Previous work on thistopic [73] shows that IPC and CPU utilization (or the combination of both) is usually a goodpredictor for power efficiency. However, this approach disregards the memory consumption,which is important in enterprise servers, and can be predicted via the Last Level Cache misses(LLC) [26].
96
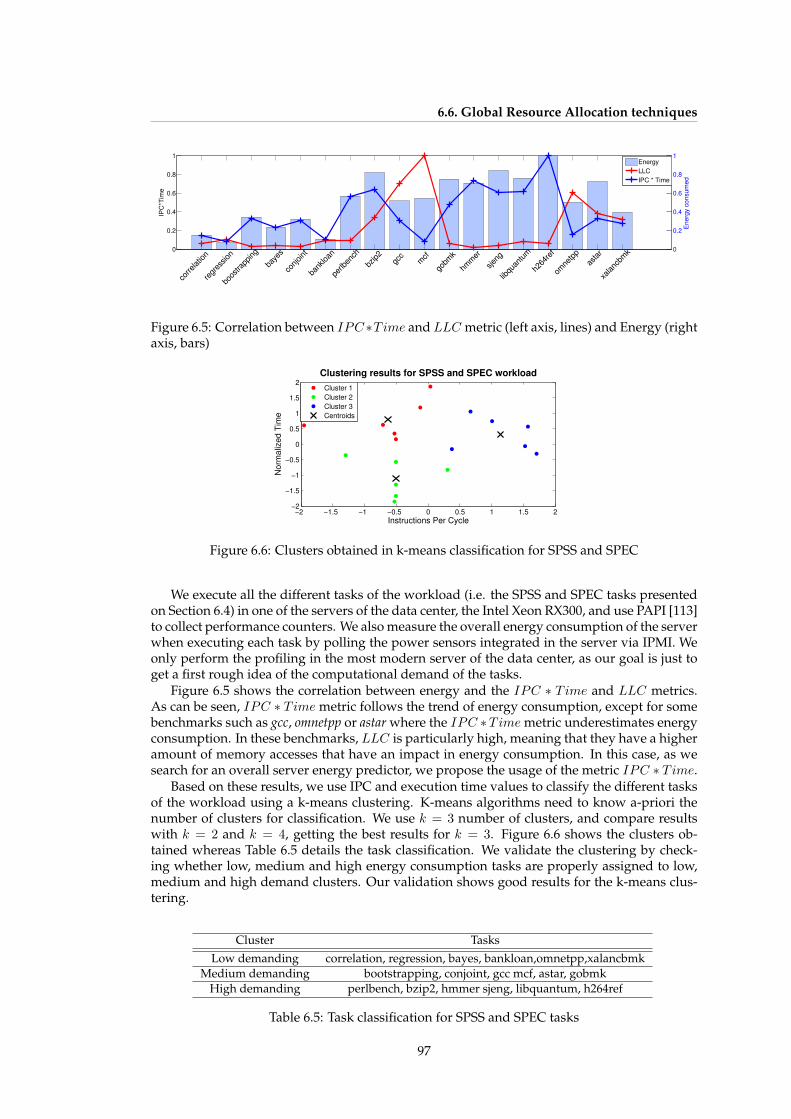
6.6. Global Resource Allocation techniques
0
0.2
0.4
0.6
0.8
1IP
C*T
ime
boos
trapp
ing
conjoint
perlb
ench
gcc
gobm
k
sjen
g
h264
ref
asta
r
baye
s
bank
loan
bzip2
mcf
hmm
er
libqu
antu
m
omne
tpp
xalanc
bmk
corre
latio
n
regr
ession
0
0.2
0.4
0.6
0.8
1
En
erg
y c
on
su
me
d
Energy
LLC
IPC * Time
Figure 6.5: Correlation between IPC∗Time and LLC metric (left axis, lines) and Energy (rightaxis, bars)
−2 −1.5 −1 −0.5 0 0.5 1 1.5 2−2
−1.5
−1
−0.5
0
0.5
1
1.5
2
Instructions Per Cycle
Norm
aliz
ed T
ime
Clustering results for SPSS and SPEC workload
Cluster 1
Cluster 2
Cluster 3
Centroids
Figure 6.6: Clusters obtained in k-means classification for SPSS and SPEC
We execute all the different tasks of the workload (i.e. the SPSS and SPEC tasks presentedon Section 6.4) in one of the servers of the data center, the Intel Xeon RX300, and use PAPI [113]to collect performance counters. We also measure the overall energy consumption of the serverwhen executing each task by polling the power sensors integrated in the server via IPMI. Weonly perform the profiling in the most modern server of the data center, as our goal is just toget a first rough idea of the computational demand of the tasks.
Figure 6.5 shows the correlation between energy and the IPC ∗ Time and LLC metrics.As can be seen, IPC ∗ Time metric follows the trend of energy consumption, except for somebenchmarks such as gcc, omnetpp or astar where the IPC ∗Time metric underestimates energyconsumption. In these benchmarks, LLC is particularly high, meaning that they have a higheramount of memory accesses that have an impact in energy consumption. In this case, as wesearch for an overall server energy predictor, we propose the usage of the metric IPC ∗ Time.
Based on these results, we use IPC and execution time values to classify the different tasksof the workload using a k-means clustering. K-means algorithms need to know a-priori thenumber of clusters for classification. We use k = 3 number of clusters, and compare resultswith k = 2 and k = 4, getting the best results for k = 3. Figure 6.6 shows the clusters ob-tained whereas Table 6.5 details the task classification. We validate the clustering by check-ing whether low, medium and high energy consumption tasks are properly assigned to low,medium and high demand clusters. Our validation shows good results for the k-means clus-tering.
Cluster Tasks
Low demanding correlation, regression, bayes, bankloan,omnetpp,xalancbmkMedium demanding bootstrapping, conjoint, gcc mcf, astar, gobmk
High demanding perlbench, bzip2, hmmer sjeng, libquantum, h264ref
Table 6.5: Task classification for SPSS and SPEC tasks
97

6. Global optimization of the distributed application framework.A case study for e-Health scenarios
With these results for the task characterization, we can move on to the proposal of therun-time allocation algorithm.
6.6.2 Run-time allocation algorithmThe run-time allocation algorithm proposes to execute some of the low and medium-demandingtasks of the workload presented in Section 6.4 in the coordinator nodes instead of forwardingall computation to the data center. Each coordinator acts as a concentrator of the informationsent by Shimmer nodes and thus, has all the data needed for the computation. If coordinatorsperform part of the tasks of the Data Dependent layer, the amount of computation in the datacenter is reduced and, thus, the facility consumes less energy. Moreover, if computations areperformed at the coordinators, the amount of data to transmit to the data center is reduced,saving energy in the communication process. Here, we do not aim to estimate the energy con-sumption of the coordinator to data center communication. Instead, we focus on the benefitson the overall network that come from the reduction in energy due to computation.
When a new job set arrives each coordinator needs to compute whether that task shouldbe executed or forwarded with its data dependencies to the data center. This means that therun-time allocation algorithm must run in a distributed way, i.e. each coordinator launchesthe algorithm for its particular task, but using the information provided by the data center.As these nodes are battery-operated, it would not be wise to waste their energy calculatingthe optimum assignment. Instead, we propose the usage of a fast and lightweight distributedallocation algorithm based on Satisfiability Modulo Theory (SMT) formulas.
SMT solvers are fast solvers that determine whether a certain formula is satisfied. In ourcase, when a certain amount of low- and medium-demanding tasks arrive to a coordinator,it uses an SMT solver to compute which tasks of the workload satisfy certain conditions andthe amount of tasks that can be executed. Let us denote by Tnodei,j the low and mediumdemanding Data Dependent tasks of a particular job set j that can be executed in a certainnode; by Tdata,j all the Data Dependent tasks in a job set j and by Ncores the overall amountof computational cores available at the data center.
Each task t has a duration and consumes a certain amount of energy depending on whetherit is executed at the data center or coordinator, noted by σtp and etp respectively. As thisoptimization does not manage the idle power consumption of the elements of the architecturewith turn off policies, we assume that both coordinators and servers are always turned on.Because of this, we aim to optimize the energy variation for executing a certain task. Forthis reason, etp does not consider the idle power for neither coordinators or servers, i.e., itconsiders only the amount of energy spent over idle state. The conditions that the workloadhave to satisfy in order to be executed are proposed next:
∑t∈Tnodei,j
etp · σtp
coord
≤ 0.1 ·
∑t∈Tdata,j
etp · σtp
datacenter
(6.4)
∑t∈Tnodei,j
σtp
coord
≤ α ·
(∑t∈Tdata,j
σtp
Ncores
)datacenter
(6.5)
∑t∈Tnodei,j
etp
coord
≤ βmax (6.6)
(6.7)
Equation 6.4 states that the Energy Delay Product (EDP) of the tasks executed in the coor-dinators must be at least an order of magnitude less than the EDP product for those same tasksif executed in the data center. EDP weights power against the square of execution time, and isa common metric to compare energy efficiency optimizations from both the data center leveland the architectural point of view [139]. Equation 6.5 constraints the maximum time taken
98

6.6. Global Resource Allocation techniques
Figure 6.7: Percentage of energy and time savings for each number of nodes and α ={0.8, 1.0, 1.2} under the reference workload
for the tasks to be executed to the overall time that it would take to execute data dependenttasks at the data center, i.e. it ensures a certain Quality of Service (QoS). This constraint can beadjusted through the parameter α = [0 . . . 1]. Finally, Equation 6.6 constraints the maximumamount of battery used per job set in each coordinator to a maximum energy βmax.
In order to perform the run-time allocation, our SMT solver algorithm needs to know anestimation of the energy etp and duration σtp of each task t to be executed for each processorp. For this purpose we use the energy profiling results for the Intel Xeon machine and theSamsung Galaxy S2 coordinator of Section 6.5.
Each job set in our workload contains a 60% of tasks belonging to the Data Dependent layerwhich, in its turn, has a 70% of low-demanding tasks and a 30% of medium demanding tasks.We assume that each coordinators in the architecture generates the same amount of data inaverage, so that tasks are uniformly split between nodes. We also assume that not all coordi-nators might be available at all times for computation purposes, so we might have a differentamount of coordinators (from 100 to 300). Depending on the workload profile (heavy, refer-ence or light workload) and the amount of coordinators available, each coordinator executes adifferent amount of tasks.
Our SMT algorithm is implemented using the Yices SMT solver 2 that runs with negligibleperformance and energy overhead in the coordinator node, obtaining a solution in less than 1second for each node. If the conditions to execute a task are satisfied, then the task is executedin the coordinator node. If not, it is off-loaded to the cloud infrastructure. For our case studywe use a fixed value of βmax = 300mWh, which represents a 30% of the energy resources ofthe coordinator node Samsung Galaxy SII. We execute the workload for different parametersof α = {0.8, 1, 1.2} and calculate the average amount of tasks executed by the coordinator, theenergy consumed by each coordinator in the system, and the energy saved at the data center.We use as a baseline for comparison the execution of all the workload in a data center with 160cores (40 servers) of the Intel Xeon machine of the case study, without using any coordinator.We run the algorithm for the three different workload profiles with three different number ofcoordinators (100, 200 and 300) to compare performance. Figure 6.7 shows the percentage ofdynamic energy and time savings compared to the execution of the reference workload in datacenter facility in 160 Intel cores.
The allocation of the whole workload at the data center facility (no coordinator nodes)consumes around 24kWh plus the idle energy of the servers, and the execution takes around13h to complete. These 24kWh are the energy variation due to the workload execution. Byusing coordinators to execute part of the workload, we can obtain up to a 10% savings inenergy variation and a 16% savings in execution time for the reference workload; while upto 24% energy savings for the heavy workload by using 300 coordinators can be achieved.The energy savings do not consider the savings obtained in idle power, which come from thereduction in execution time or occupancy that could lead to server turn-off policies specific tothe data centers. The absolute energy values for each workload profile and coordinator aresummarized in Table 6.7 in Section 6.7.
2http://yices.csl.sri.com
99

6. Global optimization of the distributed application framework.A case study for e-Health scenarios
Workload profile Coordinators Server selection
Heavy 100 35 Intel + 5 AMD200 36 Intel + 4 AMD300 37 Intel + 3 AMD
Reference 100 36 Intel + 4 AMD200 35 Intel + 5 AMD300 36 Intel + 4 AMD
Light 100 31 Intel + 9 AMD200 31 Intel + 9 AMD300 35 Intel + 5 AMD
Table 6.6: Selected heterogeneous cluster configuration for each workload
6.7 Multi-layer integration
In this section we show how the optimizations developed in the previous chapter can be inte-grated with the global resource management techniques shown in the previous section ( 6.6).Moreover, we show the overall energy savings that can be obtained by jointly applying theseoptimizations in various abstraction layers.
6.7.1 Integration with horizontal optimizations
In this Chapter, for the purpose of global resource management techniques, we had supposedthat all computations at the data center were performed in a homogeneous cluster with 160cores belonging to Intel Xeon machines. However, even though the Intel servers are the mostmodern ones, on Chapter 5.5 we showed that for some tasks, the AMD server outperformsthe Intel in terms of energy efficiency. Moreover, we showed how heterogeneous setups couldoutperform homogeneous setups when executing the workload.
We re-run the data center server selection static optimization in order to find the optimumnumber of servers that can be used depending on the number of coordinator nodes deployedin our system, and for each workload profile (light, reference and heavy). Table 6.6 summa-rizes the results for the static optimization. As can be seen, for all experimental scenarios, theoptimizer picks up an heterogeneous data center composed of a majority of Intel and a fewAMD nodes.
On top of the previous static optimization, we can run the dynamic run-time allocation oftasks, in order to minimize the energy consumption of the assignment. The dynamic run-timeallocation of the tasks, performed by the resource manager, aims at minimizing the energyconsumption of the assignment by placing each task where it wastes the minimum energy ina spatio-temporal way.
6.7.2 Overall energy savings
The goal of this section is to provide an insight on how the models and optimizations devel-oped can be vertically integrated and applied together from a multi-layer perspective.
To accomplish this objective we first present a summary of the energy savings obtained forthe global resource allocation technique developed in Section 6.6 and the data center resourcemanagement policies presented in the previous Chapter 5.5, for each of the workload profilesand for a different amount of coordinators. In Table 6.7 Global resource allocation savingsare referred to savings on the dynamic energy consumption only of the data center, whereasthe DC policies offer the amount of savings for the data center only. In order to obtain anestimation of the impact of each optimization on the overall energy savings, we must firstobtain the baseline energy consumption for each kind of workload without any optimization,and then apply the optimizations one after the other.
Table 6.8 shows the total energy consumption in kWh for the baseline case of not applyingany optimization (first row of the table, i.e. the “No optimization” row) and when applying
100
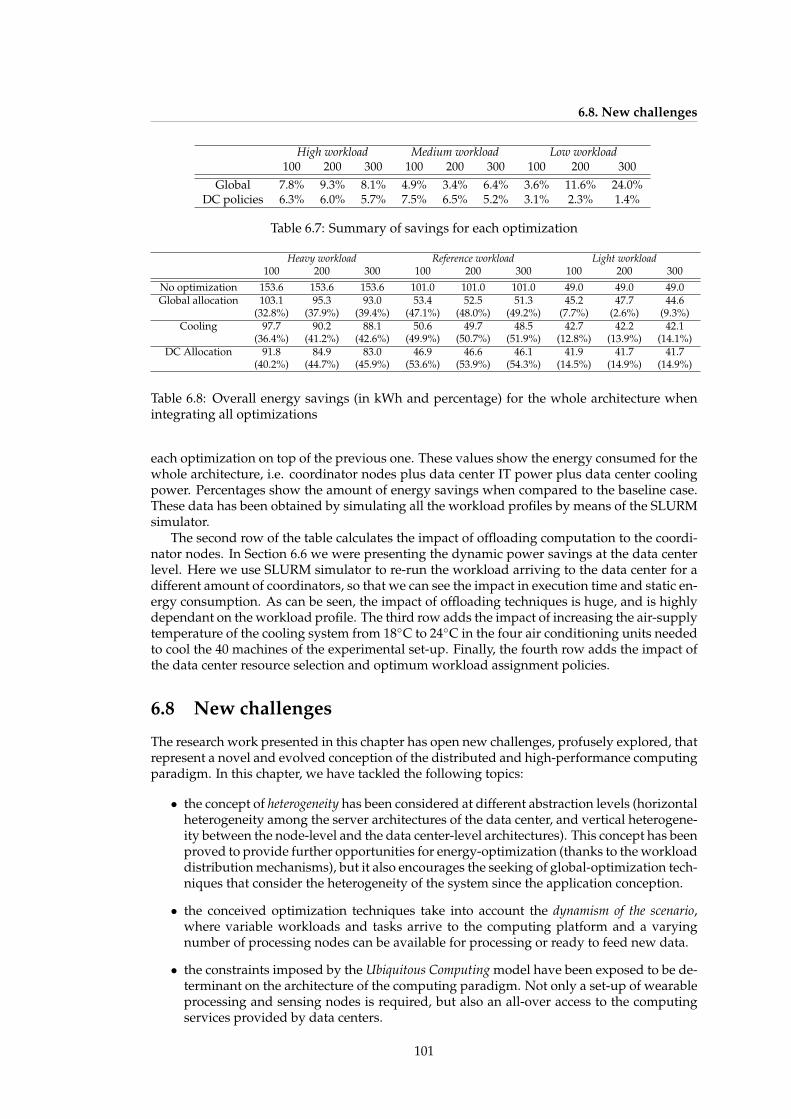
6.8. New challenges
High workload Medium workload Low workload100 200 300 100 200 300 100 200 300
Global 7.8% 9.3% 8.1% 4.9% 3.4% 6.4% 3.6% 11.6% 24.0%DC policies 6.3% 6.0% 5.7% 7.5% 6.5% 5.2% 3.1% 2.3% 1.4%
Table 6.7: Summary of savings for each optimization
Heavy workload Reference workload Light workload100 200 300 100 200 300 100 200 300
No optimization 153.6 153.6 153.6 101.0 101.0 101.0 49.0 49.0 49.0Global allocation 103.1 95.3 93.0 53.4 52.5 51.3 45.2 47.7 44.6
(32.8%) (37.9%) (39.4%) (47.1%) (48.0%) (49.2%) (7.7%) (2.6%) (9.3%)Cooling 97.7 90.2 88.1 50.6 49.7 48.5 42.7 42.2 42.1
(36.4%) (41.2%) (42.6%) (49.9%) (50.7%) (51.9%) (12.8%) (13.9%) (14.1%)DC Allocation 91.8 84.9 83.0 46.9 46.6 46.1 41.9 41.7 41.7
(40.2%) (44.7%) (45.9%) (53.6%) (53.9%) (54.3%) (14.5%) (14.9%) (14.9%)
Table 6.8: Overall energy savings (in kWh and percentage) for the whole architecture whenintegrating all optimizations
each optimization on top of the previous one. These values show the energy consumed for thewhole architecture, i.e. coordinator nodes plus data center IT power plus data center coolingpower. Percentages show the amount of energy savings when compared to the baseline case.These data has been obtained by simulating all the workload profiles by means of the SLURMsimulator.
The second row of the table calculates the impact of offloading computation to the coordi-nator nodes. In Section 6.6 we were presenting the dynamic power savings at the data centerlevel. Here we use SLURM simulator to re-run the workload arriving to the data center for adifferent amount of coordinators, so that we can see the impact in execution time and static en-ergy consumption. As can be seen, the impact of offloading techniques is huge, and is highlydependant on the workload profile. The third row adds the impact of increasing the air-supplytemperature of the cooling system from 18◦C to 24◦C in the four air conditioning units neededto cool the 40 machines of the experimental set-up. Finally, the fourth row adds the impact ofthe data center resource selection and optimum workload assignment policies.
6.8 New challenges
The research work presented in this chapter has open new challenges, profusely explored, thatrepresent a novel and evolved conception of the distributed and high-performance computingparadigm. In this chapter, we have tackled the following topics:
• the concept of heterogeneity has been considered at different abstraction levels (horizontalheterogeneity among the server architectures of the data center, and vertical heterogene-ity between the node-level and the data center-level architectures). This concept has beenproved to provide further opportunities for energy-optimization (thanks to the workloaddistribution mechanisms), but it also encourages the seeking of global-optimization tech-niques that consider the heterogeneity of the system since the application conception.
• the conceived optimization techniques take into account the dynamism of the scenario,where variable workloads and tasks arrive to the computing platform and a varyingnumber of processing nodes can be available for processing or ready to feed new data.
• the constraints imposed by the Ubiquitous Computing model have been exposed to be de-terminant on the architecture of the computing paradigm. Not only a set-up of wearableprocessing and sensing nodes is required, but also an all-over access to the computingservices provided by data centers.
101

6. Global optimization of the distributed application framework.A case study for e-Health scenarios
• the need of efficient energy-saving techniques in e-Health application scenarios has driventhe conception of a new computing paradigm where the design of the architecture ispushed by the energy consumption of such application. Only with such application-drivendesign style, the energy footprint of the whole computing scheme can be reduced, whilethe reliability and performance requirements are still satisfied.
6.9 Conclusions
Home assisted living reduces sanitary costs by prevention of potential diseases, provides earlysignals of health decline and advices for appropriate actions in daily life, and allows complexepidemiologic analysis that improve prevention and efficacy of treatments. However, energyconsumption is one of the major concerns for the adoption of population-wide health moni-toring systems, but energy efficiency cannot be added as an afterthought.
In this chapter, we have presented a novel concept of the computing paradigm that com-bines the deployment of population-wide Wireless Body Sensor Networks, wearable comput-ing devices and high-performance computing data-centers. Moreover, we propose an archi-tecture driven by energy concerns and aimed at optimizing energy consumption globally.
This work considers, for the first time, energy as a first-class requirement, taking it intoaccount during the whole development cycle, from design to implementation. The novelstrategies presented in the experimental work focus on every abstraction layer, and obtainpromising results for a realistic scenario that depicts the cardiovascular tracking and analysisof a broad population.
We believe that the computing paradigm presented in this work, as well as the evolvedmethodology for energy reduction, deals successfully with many and important challenges,often forgotten in the current related literature.
In the next chapter...
the reader will find a synthesis of the conclusions that are derived from the research that ispresented in this Ph.D. thesis, a summary of the major contributions and future research di-rections.
102

7. Conclusions and Future Work
The future belongs to those who believe in the beauty of theirdreams
— Eleanor Roosevelt
This Ph.D. Thesis has addressed the energy challenge by proposing proactive and reactivethermal and energy-aware optimization techniques that contribute to place High PerformanceComputing data centers on a more scalable curve. In this Chapter, a synthesis of the conclu-sions derived from the research undertaken in this Ph.D. thesis is presented, highlighting thecontributions of this dissertation to the state-of-the-art. Moreover, we also highlight the openresearch lines and future research directions derived from this work.
7.1 Summary
As described in the motivation of this Ph.D. thesis (Chapter 1.1), the energy costs and the en-vironmental impact of data centers today represent a huge challenge for both industry andacademia. The need to deal efficiently with the computational needs of next-generation ap-plications (such as e-Health or Smart Cities) together with the increasing demand for higherresources in traditional applications has facilitated the rapid proliferation and growth of datacenter facilities. Since 2010, when data center electricity represented 1.3% of all the electricityuse in the world and more than 2% of total carbon dioxide emissions, the energy consumptionof these facilities has kept on growing at an unsustained rate. In year 2012 alone, global datacenter power demand grep 63% to 38GW. A further rise of 17% to 43GW was estimated in2013.
Previous research, as shown in Chapter 1.2, lacks accurate server and data center powermodels that enable the development of proactive optimization policies. Moreover, previousapproaches tackle cooling and computation optimization separately, instead of jointly man-aging computation and cooling to minimize overall data center power consumption. Finally,current solutions do not tackle energy as a first-class requirement, and do not focus on reduc-ing the overall energy consumption of applications from a multi-layer integrated perspective.
As summarized in Figure 1.4 in Chapter 1.3, our work proposes a global solution based onthe energy analysis and optimization for next-generation applications from multiple abstrac-tion layers. We develop energy models and use the knowledge about the energy demand ofthe workload to be executed and the computational and cooling resources available at datacenter to optimize energy consumption. Moreover, data centers are considered as a crucialelement within their application framework, optimizing not only the energy consumption ofthe facility, but the global energy consumption of the application. This Ph.D. thesis proposessolutions to place data centers on a more scalable curve. This work makes contributions in acomplex and multidisciplinary area, of high economic and social impact.
Reviewing the objectives presented in Chapter 1.4, this Ph.D. thesis has achieved the fol-lowing results:
• We have developed empirical models at the server level that are able to isolate and accu-rately quantify the different contributors to power consumption, predicting power and
103

7. Conclusions and Future Work
temperature with high accuracy. These models are flexible, can work during runtimeand have been extensively validated in various presently shipping enterprise servers ofdifferent architectures. These contribution have been presented in Chapter 2.
• We propose leakage-aware cooling control and workload management strategies to min-imize server energy consumption. Experimental results on a presently shipping enter-prise server demonstrate energy savings of up to 9% and 30W reduction in peak powerwhen compared to the default cooling control scheme. By adding workload manage-ment along with cooling control, we obtain energy savings of up to 15%. This work hasbeen presented in Chapter 3.
• This Ph.D. thesis has developed an unsupervised data room modeling methodologybased on Grammatical Evolution techniques able to predict the inlet and CPU temper-ature of servers. Our models work during runtime and achieve average errors below0.5◦C and 2◦C in inlet and CPU temperature respectively. For the first time in literature,we present an accurate unsupervised modeling methodology that has been tuned in asmall scenario, and tested with real traces of a production data center. Chapter 4 presentsthese results.
• We propose a Mixed Integer Linear Programming (MILP) optimization to minimize theenergy needed to execute a certain workload in the data center. The proposed approachexploits the heterogeneity of the system from a mixed static/dynamic perspective, andcombines the proper selection of cores with the information retrieved during a workloadcharacterization phase. Validation has been performed in two different heterogeneoussetups, with real measurements in commercial enterprise servers, obtaining from 7.5%to 24% energy savings when compared to the default allocation of the production-readytool SLURM. The joint optimization of cooling and computing costs yield savings of upto 1,200e per rack per year. The previous contributions have been described in Chapter 5.
• Finally, we have shown a case study for e-Health scenarios where energy optimizationtechniques are applied at various abstraction layers, with the goal of reducing the overallenergy consumption of the application. In Chapter 6, we have shown how data centeroff-loading techniques based on SMT solvers allow to distribute computation betweennodes and data center in a distributed applications, reducing energy consumption from10% to 24% in the overall framework. This energy savings are translated into a reduc-tion of almost 70 tons of CO2 annually for the proposed e-Health scenario. Moreover,by applying our optimizations in several abstraction layers we obtain dramatic energysavings in the execution of the application, ranging from 15% to 50% depending on theworkload and the available resources.
The work developed in this Ph.D. Thesis has enabled a very close collaboration betweenthe ArTECS group at Universidad Complutense de Madrid and the LSI group at UniversidadPolitecnica de Madrid. Moreover, a stable collaboration has been established with the Per-formance and Energy Aware Computing Lab. at Boston University. So far, this collaborationhas resulted into two 3-month research stays of the author at Boston University, one confer-ence and one journal paper co-authored by Boston University and Oracle, Inc., and anotherconference paper that has been submitted and is currently under review.
The work developed in this Ph.D. thesis had developed realistic models and optimiza-tions that used in real data center scenarios, yielding significant savings. For instance, allmodels and optimizations proposed in this work have been developed and tested in real sce-narios. Server models and optimizations have been validated in presently-shipping enterpriseservers, belonging to Boston University, Universidad Politecnica de Madrid and UniversidadComplutense de Madrid. For data center room modeling this work has used real traces col-lected from a small scale data room at the Electronic Engineering Department at UniversidadPolitecnica de Madrid, as well as from CeSViMa data center. Finally, data center optimiza-tions have been tested and compared against a production-ready resource management tool,the SLURM resource manager. Thus, the work presented has a high applicability, is of high
104

7.2. Future Research Directions
interest to both industry and academic and can potentially obtain important savings in realenvironments.
7.2 Future Research Directions
The research developed in this Ph.D. thesis has addressed the development of models andoptimization techniques at different abstraction layers: from server and data center to theoverall application framework. The techniques proposed have tackled heterogeneous com-puting resources and are aware of the tradeoffs between temperature and cooling. However,some interesting points of future research have emerged during the evolution of this work.The following paragraphs propose future research directions and improvements of the workpresented in this dissertation:
• This work has focused on the optimization of traditional raised-floor air-cooled data cen-ters. These facilities are not very efficient in terms of cooling, i.e. their PUE is generallyhigh. The analysis of cooling-optimized highly-efficient data centers would yield differ-ent tradeoffs worth exploring. Moreover, the usage of free cooling techniques proposesan interesting field of study to further increase energy efficiency.
• Furthermore, next-generation cooling techniques, such as two-phase immersion coolingneed to be investigated. This technique is based on placing server in a container filledwith a fluid, e.g. Novec, that dissipates heat by changing phase. This changes completelythe thermal behavior of servers, where new trade-offs need to be investigated.
• Even though our work has considered the overall application framework, we have nottackled federated networks of data centers. This field opens a wide area of study fromthe workload allocation perspective, as data centers in a federated network can collab-orate to reduce overall power consumption by adequately migrating workload acrossfacilities. Due to the heterogeneous and distributed nature of the problem, resource man-agement across federated networks of data centers represents an interesting challenge.
• To drastically reduce energy-related costs in data center facilities, another major chal-lenge is the participation of data centers in the Smart Grid. Data centers are very impor-tant actors in the power market due to their high power consumption. The participationof data centers demand-response programs, opens a new opportunity to minimize en-ergy costs by dynamically adapting the power consumption of the facility to the powergrid needs.
• This work has focused on the development of models for the CPU and memory sub-systems of enterprise servers. However, there is still a need to create accurate modelsto predict data center workload. Therefore, we also need to forecast the performance ofapplications before they are scheduled and allocated. This can be done via static anddynamic analysis of applications in order to predict power and performance and, thus,data center workload.
• This dissertation has focused on the modeling and optimization of CPU and memoryintensive HPC applications. This work needs to be extended to other subsystems inorder to predict power and performance of disk and network. Moreover, highly paralleljobs need to be considered if targeting HPC applications, where disk and network canbe a bottleneck and have an impact on overall energy consumption.
105


Appendix AMapping process and relevant parameters in
Gramatical Evolution
We used to think our fate was in our stars. Now we know, inlarge measure, our fate is in our genes.
— James Watson
In this appendix we describe with further detail the mapping process in Gramatical Evo-lution, and how our models incorporate time dependence. Moreover, we provide informationon some parameters relevant to our models (such as fitness and problem constraints) and howwe have selected them for the purpose of the temperature modeling presented in Chapter 4.
For a more detailed explanation on the principles of Gramatical Evolution, the reader isreferred to [142].
A.1 Mapping process
In Gramatical Evolution (GE), in order to extract the mathematical expression given by an indi-vidual (phenotype), a mapping process is applied. The mapping process consists on defininga set of rules to obtain the mathematical expressions, by using grammars expressed in BackusNaur Form (BNF) [121]. Generally speaking, a BNF specification is a set of derivation rules,expressed in the form:
〈symbol〉 ::= 〈expression〉
The rules are composed of sequences of terminals, which are items that can appear in thelanguage, and non-terminals, which can be expanded into one or more terminals and non-terminals. Symbols that appear at the left are non-terminals while terminals never appear onthe left side.
A grammar is represented by the tuple N,T, P, S, being N the non-terminal set, T is theterminal set, P the production rules for the assignment of elements on N and T , and S is astart symbol that should appear in N . The options within a production rule are separated bya “|” symbol.
Grammar 5 represents an example grammar in BNF format. The final expression consistsof elements of the set of terminals T , which have been combined with the rules of the grammar.
The chromosome (or genotype) is used to map the start symbol onto terminals by readinggenes (or codons) of 8 bits to generate a corresponding integer value, from which a productionrule is selected by using the following mapping function (the modulus operator):
Rule = Codon Value % Number of Rule Choices (A.1)
Example: In the following example, we explain the mapping process performed in GE toobtain a phenotype (mathematical function) given a genotype (chromosome), as it shows howbetter features are automatically selected. Let us suppose we have the BNF grammar providedin Figure 5 and the following 7-gene chromosome:
107

A. Mapping process and relevant parameters in Gramatical Evolution
Grammar 5 Example of a grammar in BNF format designed for symbolic regressionN = {expr, op, preop, var, num, dig}T = {+, -, *, /, sin, cos, exp, x, y, z, 0, 1, 2, 3, 4, 5, (, ), .}S = {expr}P = {I, II, III, IV, V, VI}
(I)〈expr〉 ::= 〈expr〉〈op〉〈expr〉 | 〈preop〉(〈expr〉) | 〈var〉
(II)〈op〉 ::= +|-|*|/
(III)〈preop〉 ::= sin|cos|log
(IV)〈var〉 ::= x|y|z|〈num〉
(V)〈num〉 ::= 〈dig〉.〈dig〉 | 〈dig〉
(VI)〈dig〉 ::= 0 | 1 | 2 | 3 | 4 | 5
21-64-17-62-38-254-2
According to Figure 5, the start symbol is S = 〈expr〉, hence the decoded expression willbegin with the non-terminal:
Solution = 〈expr〉
Now, we use the first gene of the chromosome (equal to 21 in the example) in rule I of thegrammar. The number of choices in that rule is 3. Hence, the mapping function is applied:21 MOD 3 = 0 and the first option is selected 〈expr〉〈op〉〈expr〉. The selected option substi-tutes the decoded non-terminal. As a consequence, the current expression is the following:
Solution = 〈expr〉〈op〉〈expr〉
The process continues with the codon 64, used to decode the first non-terminal of the cur-rent expression, 〈expr〉. Again, the mapping function is applied to the rule: 64 MOD 3 = 1and the second option 〈preop〉(〈expr〉) is selected. So far, the current expression is:
Solution = 〈prep〉(〈expr〉)〈op〉〈expr〉
The next gene, 17, is now taken for decoding. At this point, the first non-terminal in thecurrent expression is 〈preop〉, we apply the mapping function and the third option is selected,obtaining expression:
Solution = exp(〈expr〉)〈op〉〈expr〉
The next codons (62, 38, 256 and 2) are decoded in the same way. After codon 2 has beendecoded, the expression is:
Solution = exp(x) ∗ 〈var〉
At this point, the decoding process has run out of codons. That is, we have not reached an ex-pression with terminals in all its components. In GE, the solution consists on reusing codonsstarting from the first one. In fact, it is possible to reuse the codons more than once. Thistechnique is known as wrapping and mimics the gene-overlapping phenomenon in many or-ganisms [75]. Thus, applying wrapping to our example, the process goes back to the first gene,21, which is used to decode 〈VAR〉with rule IV. This result selects the first option, non-terminaly, giving the final expression of the phenotype
Solution = exp(x) ∗ y
Adding time dependence: So far, previously shown grammars allowed us to obtain phe-notypes that were mathematical functions dependent on a certain number of variables (i.e.
108

A.2. Fitness
x, y, z in our previous example). In this sense, we could use the previous method to pre-dict variables that depend only on the current observation of other magnitudes. For instance,Grammatical Evolution has been used in literature in this way to predict power consumptionof servers as a function of utilization, fan speed and other variables [128].
The models created this way can be used to predict magnitudes that do not have memoryand the data used for model creation consists on samples. Temperature, however, is a magni-tude that has memory, i.e. the current temperature depends on past temperature values. Thus,the data used for model creation needs to be a timeseries. By properly tuning our grammars,we can add time dependence to the variables in the phenotype, so that past variable values(i.e. past temperatures) can be used to predict the variable a certain number of samples aheadinto the future.
A.2 Fitness
The selected fitness function needs to express the error resulting in the estimation process. Tomeasure the accuracy in our prediction, we would preferably use the Mean Absolute Error(MAE). However, because temperature is a magnitude that varies slowly and that might re-main constant during large time intervals, we need to give higher weight to large errors. Tothis end, the fitness function f presented in Equation A.2 tries to reduce the variance of themodel, leading the evolution to obtain solutions that minimize the the Root Mean Square Error(RMSE or RMSD):
f =
√1
N·∑n
en2 (A.2)
en = |T (n)− T (n)|, 1 ≤ n ≤ N (A.3)
where the estimation error en represents the deviation between the real temperature samples(both for CPU and inlet temperature modeling) obtained by the monitoring system T , and theestimation obtained by the model T . n represents each sample of the entire set of N samplesused to train the algorithms.
A.3 Problem constraints
A.3.1 Problem constraintsAs we are modeling the behavior of physical magnitudes, (i.e., temperature), for optimizationpurposes, it is desirable to obtain a solution with physical meaning. To this end, we can con-strain the model generation in several ways that are next presented. In the results Section 4.6we evaluate the impact of these constraints in the model generation stage.
Constraining the grammar
The mathematical expressions of the grammar can be constrained to obtain a limited numberof functions that match the physical world. For instance, because temperature exhibits expo-nential transients, we can include the exponential function in our grammar, whereas we do notfind physical fundamentals to include other mathematical functions such as sines or cosines.
Fitness biasing
Based on the laws of physics, we know that there are certain parameters that drive the vari-ables being modeled. For instance, power consumption drives CPU temperature and, thus,this magnitude should be present in the final model if it has physical meaning. We can forcethe appearance of some parameters by biasing the fitness values, giving higher weights (i.e.worse fitness) to expressions where certain parameters are not present. By biasing fitness wespeed-up convergence, however, we may obtain less accurate results.
109

A. Mapping process and relevant parameters in Gramatical Evolution
Real vs. mixed models
Purely real models only uses real temperature data measurements to predict future temper-ature samples. Purely predictive models do not used previous temperature data measure-ments, but may use previous predictions. Mixed models may used both real and predicteddata. Adding the predicted samples as a variable to our grammars increases the size of thesearch space and, thus, we expect longer convergence time. However, it may deliver moreaccurate results.
110

Appendix BClassical modeling techniques
Que es la vida? Un frenesı. Que es la vida? Una ilusion,una sombra, una ficcion; y el mayor bien es pequeno;que toda la vida es sueno, y los suenos, suenos son.
— Calderon de la Barca
In this appendix we describe with further detail two classical modeling techniques that weto compare against our proposed models in Chapter 4. These modeling techniques are ARMAand N4SID.
B.1 ARMA models
ARMA models are mathematical models of autocorrelation in a time series, that use past val-ues alone to forecast future values of a magnitude. ARMA models assume the underlyingmodel is stationary and that there is a serial correlation with the data, something that tem-perature modeling accomplishes. In a general way, an ARMA model can be described as inEquation B.1:
yt =
p∑i=1
(ai · yt−i) = et +
q∑j=1
(cj · et−j) (B.1)
where yt is the value of the time series (CPU temperature in our case) at time t, ai’s are the lag-iautoregressive coefficients, ci’s are the moving average coefficient and et is the error. The erroris assumed to be random and normally distributed. p and q are the orders of the autoregressive(AR) and the moving average (MA) parts of the model, respectively.
The ARMA modeling methodology consists on two different steps: i) identification and ii)estimation. In our work we use an automated methodology similar to the one proposed byCoskun et.al. [46]. During the identification phase, the model order is computed, i.e, we findthe optimum values for p and q of the ARMA(p, q) process. To perform model identificationwe use an automated strategy, that computes the goodness of fit for a range of p and q values,starting by the simplest model (i.e., an ARMA(1,0)). The goodness of fit is computed using theFinal Prediction Error (FPE), and the best model is the one with lowest FPE value, given byEquation B.2:
FPE =1 + n/N
1− n/N· V (B.2)
where n = p+q, N is the length of the time series and V is the variance of the model residuals.For a fair comparison with our proposed methodology, the model obtained needs to forecastα = 6 samples into the future.
111

B. Classical modeling techniques
B.2 N4SID
N4SID is a subspace identification method that estimates an n order state-space model usingmeasured input-output data, to obtain a model that represents the following system:
x(t) = Ax(t) +Bu(t) +Ke(t) (B.3)y(t) = Cx(t) +Du(t) + e(t) (B.4)
where A,B,C and D are state-space matrices, K is the disturbance matrix, u(t) is the input,y(t) is the output, x(t) is the vector of n states and e(t) is the disturbance.
State-space models are models that use state variable observations to describe a system bya set of first-order differential equations, using a black-box approach. The approach consistson identifying a parametrization of the model, and then determine the parameters so that themeasurements explain the model in the most accurate possible way. They have been verysuccessful for the identification of linear multivariable dynamic systems.
To be constructed, certain parameters need to be fed into the model, such as the number offorward predictions (r), the number of past inputs (su), and the number of past outputs(sy).Again, for a fair comparison with our proposed methodology, we need a model in the formN4sid[r, su, sy] where r = 6, su = 20 and sy = 20.
112
Bibliography
[1] Z. Abbasi, G. Varsamopoulos, and S. K. S. Gupta, “Thermal aware server provisioningand workload distribution for internet data centers”, in Proceedings of the 19th ACM In-ternational Symposium on High Performance Distributed Computing, ser. HPDC ’10, Chicago,Illinois: ACM, 2010, pp. 130–141, ISBN: 978-1-60558-942-8.
[2] Z. Abbasi, M. Jonas, A. Banerjee, S. Gupta, and G. Varsamopoulos, “Evolutionary greencomputing solutions for distributed cyber physical systems”, in Evolutionary Based So-lutions for Green Computing, Springer Berlin Heidelberg, 2013, pp. 1–28.
[3] M. Ahmed, Google search finds seafaring solution. [The Times], September 2008.
[4] A. Alamri, W. S. Ansari, M. M. Hassan, M. S. Hossain, A. Alelaiwi, and M. A. Hossain,“A survey on sensor-cloud: architecture, applications, and approaches”, InternationalJournal of Distributed Sensor Networks, p. 18, 2013.
[5] J. Andrus, C. Dall, A. V. Hof, O. Laadan, and J. Nieh, “Cells: a virtual mobile smart-phone architecture”, in Proceedings of the Twenty-Third ACM Symposium on OperatingSystems Principles, ser. SOSP ’11, Cascais, Portugal: ACM, 2011, pp. 173–187, ISBN: 978-1-4503-0977-6.
[6] M. Annavaram, “A case for guarded power gating for multi-core processors”, in HighPerformance Computer Architecture (HPCA), 2011 IEEE 17th International Symposium on,2011, pp. 291 –300. DOI: 10.1109/HPCA.2011.5749737.
[7] J. Arjona Aroca, A. Chatzipapas, A. Fernandez Anta, and V. Mancuso, “A measurement-based analysis of the energy consumption of data center servers”, in Proceedings ofthe 5th International Conference on Future Energy Systems, ser. e-Energy ’14, Cambridge,United Kingdom: ACM, 2014, pp. 63–74, ISBN: 978-1-4503-2819-7.
[11] A. Artes, J. L. Ayala, and F. Catthoor, “Power impact of loop buffer schemes for biomed-ical wireless sensor nodes”, Sensors, vol. 12, no. 11, pp. 15 088–15 118, 2012, ISSN: 1424-8220.
[12] A. Artes, J. L. Ayala, J. Huisken, and F. Catthoor, “Survey of low-energy techniquesfor instruction memory organisations in embedded systems”, Signal Processing Systems,vol. 70, no. 1, pp. 1–19, 2012.
[13] ASHRAE Technical Commitee (TC) 9.9, “2011 Thermal Guidelines for Data Process-ing Environments”, American Society of Heating, Refrigerating and Air-ConditioningEngineers, Inc., Tech. Rep., 2011.
[14] D. Atienza, G. De Micheli, L. Benini, J. Ayala, P. Valle, M. DeBole, and V. Narayanan,“Reliability-aware design for nanometer-scale devices”, in Proceedings of the 2008 Asiaand South Pacific Design Automation Conference, IEEE Computer Society Press, Jan. 2008,pp. 549–554, ISBN: 978-1-4244-1921-0.
[15] R. Ayoub, K. Indukuri, and T. Rosing, “Temperature aware dynamic workload schedul-ing in multisocket cpu servers”, TCAD, vol. 30, no. 9, pp. 1359–1372, 2011, ISSN: 0278-0070. DOI: 10.1109/TCAD.2011.2153852.
[16] R. Ayoub, R. Nath, and T. Rosing, “JETC: joint energy thermal and cooling manage-ment for memory and cpu subsystems in servers”, in International Symposium on HighPerformance Computer Architecture, ser. HPCA’12, 2012, pp. 1 –12.
113

BIBLIOGRAPHY
[17] T. Back, U. Hammel, and H.-P. Schwefel, “Evolutionary computation: comments on thehistory and current state”, IEEE Transactions on Evolutionary Computation, vol. 1, no. 1,pp. 3–17, 1997, ISSN: 1089-778X. DOI: 10.1109/4235.585888.
[18] D. Barbagallo, E. Di Nitto, D. J. Dubois, and R. Mirandola, “A bio-inspired algorithm forenergy optimization in a self-organizing data center”, in Proceedings of the First interna-tional conference on Self-organizing architectures, ser. SOAR’09, Cambridge, UK: Springer-Verlag, 2010, pp. 127–151, ISBN: 3-642-14411-X, 978-3-642-14411-0.
[19] C. Bash and G. Forman, “Cool job allocation: measuring the power savings of placingjobs at cooling-efficient locations in the data center”, in USENIX Annual Technical Con-ference on Proceedings of the USENIX Annual Technical Conference. USENIX Association,2007, pp. 1–6.
[20] G. C. Bell, Wireless sensors improve data center energy efficiency, 2010. [Online]. Available:http://www.eere.energy.gov/informationcenter.
[21] A. Beloglazov and R. Buyya, “Adaptive threshold-based approach for energy-efficientconsolidation of virtual machines in cloud data centers”, in Proceedings of the 8th Inter-national Workshop on Middleware for Grids, Clouds and e-Science, ser. MGC ’10, Bangalore,India, 2010, 4:1–4:6, ISBN: 978-1-4503-0453-5. DOI: 10.1145/1890799.1890803.
[22] L. Benini and G. De Micheli, “Logic synthesis and verification”, in, S. Hassoun and T.Sasao, Eds., Norwell, MA, USA: Kluwer Academic Publishers, 2002, ch. Logic synthesisfor low power, pp. 197–223, ISBN: 0-7923-7606-4.
[23] I. Beretta, F. Rincon, N. Khaled, P. R. Grassi, V. Rana, D. Atienza, and D. Sciuto, “Model-based design for wireless body sensor network nodes”, in Test Workshop (LATW), 201213th Latin American, 2012, pp. 1 –6.
[24] A. Berl, E. Gelenbe, M. D. Girolamo, G. Giuliani, H. D. Meer, M. Q. Dang, and K. Pen-tikousis, “Energy-efficient cloud computing”, The Computer Journal, vol. IncorporatingSpecial Issue: Architecture/OS Support for Embedded Multi-Core Systems, 2009, ISSN:1045-1051.
[25] C. Bienia, S. Kumar, J. P. Singh, and K. Li, “The parsec benchmark suite: characteriza-tion and architectural implications”, in PACT, 2008, pp. 72–81.
[26] W. Bircher and L. John, “Complete system power estimation using processor perfor-mance events”, Computers, IEEE Transactions on, vol. 61, no. 4, pp. 563–577, 2012, ISSN:0018-9340. DOI: 10.1109/TC.2011.47.
[27] C. Bodenstein, G. Schryen, and D. Neumann, “Reducing datacenter energy usage throughefficient job allocation”, in Energy Usage Through Efficient Job Allocation, ser. ECIS ’11,2011.
[28] A. Bohra and V. Chaudhary, “VMeter: Power modelling for virtualized clouds”, inIPDPSW, 2010, pp. 1–8.
[29] P. Bohrer, E. N. Elnozahy, T. Keller, M. Kistler, C. Lefurgy, C. McDowell, and R. Ra-jamony, “The case for power management in web servers”, in. Norwell, MA, USA:Kluwer Academic Publishers, 2002, pp. 261–289, ISBN: 0-306-46786-0.
[30] D. Bol, R. Ambroise, D. Flandre, and J.-D. Legat, “Impact of technology scaling on dig-ital subthreshold circuits”, in Proceedings of the 2008 IEEE Computer Society Annual Sym-posium on VLSI, ser. VLSI ’08, Washington, DC, USA: IEEE Computer Society, 2008,pp. 179–184, ISBN: 978-0-7695-3170-0.
[31] A. R. Brahmbhatt, J. Zhang, Q. Qiu, and Q. Wu, “Adaptive lowpower bus encodingbased on weighted code mapping”, in Proc. of IEEE International Symposium on Circuitsand Systems, 2006.
[32] J. Brandon, “Going green in the data center: practical steps for your SME to becomemore environmentally friendly”, Processor, no. 29, 2007.
114

BIBLIOGRAPHY
[33] T. Breen, E. Walsh, J. Punch, A. Shah, and C. Bash, “From chip to cooling tower data cen-ter modeling: part i influence of server inlet temperature and temperature rise acrosscabinet”, in Thermal and Thermomechanical Phenomena in Electronic Systems (ITherm), 201012th IEEE Intersociety Conference on, 2010, pp. 1–10.
[34] V. Cardellini, M. Colajanni, and P. S. Yu, “Dynamic load balancing on web-server sys-tems”, IEEE Internet Computing, vol. 3, pp. 28–39, 3 1999, ISSN: 1089-7801. DOI: 10.1109/4236.769420.
[35] E. V. Carrera, E. Pinheiro, and R. Bianchini, “Conserving disk energy in network servers”,in Proceedings of the 17th annual international conference on Supercomputing, ser. ICS’03,San Francisco, CA, USA, 2003, pp. 86–97, ISBN: 1-58113-733-8. DOI: 10.1145/782814.782829.
[36] A. Carroll and G. Heiser, “An analysis of power consumption in a smartphone”, ser.USENIX’10, Boston, MA: USENIX Association, 2010, pp. 21–21.
[37] A. Celesti, F. Tusa, A. Puliafito, and M. Villari, “Towards energy sustainability in fed-erated and interoperable clouds”, in Sustainable Practices: Concepts, Methodologies, Toolsand Applications, 2014, pp. 279–301, ISBN: 978-1-4666-4852-4.
[38] C. S. Chan, Y. Jin, Y.-K. Wu, K. Gross, K. Vaidyanathan, and T. Rosing, “Fan-speed-aware scheduling of data intensive jobs”, in Proceedings of the 2012 ACM/IEEE Interna-tional Symposium on Low power electronics and design, ser. ISLPED’12, 2012, pp. 409–414.
[39] G. Chen, W. He, J. Liu, S. Nath, L. Rigas, L. Xiao, and F. Zhao, “Energy-aware serverprovisioning and load dispatching for connection-intensive internet services”, in Pro-ceedings of the 5th USENIX Symposium on Networked Systems Design and Implementation,ser. NSDI’08, San Francisco, California: USENIX Association, 2008, pp. 337–350, ISBN:111-999-5555-22-1.
[40] J. Chen, R. Tan, Y. Wang, G. Xing, X. Wang, X. Wang, B. Punch, and D. Colbry, “A high-fidelity temperature distribution forecasting system for data centers”, in Proceedings ofthe 2012 IEEE 33rd Real-Time Systems Symposium, ser. RTSS ’12, Washington, DC, USA:IEEE Computer Society, 2012, pp. 215–224, ISBN: 978-0-7695-4869-2.
[41] M. Chen, H. Zhang, Y.-Y. Su, X. Wang, G. Jiang, and K. Yoshihira, “Coordinated energymanagement in virtualized data centers”, in Symposium on High-Performance ComputerArchitecture, Salt LakeCity, UT, 2008.
[42] J. Choi, C.-Y. Cher, H. Franke, H. Hamann, A. Weger, and P. Bose, “Thermal-aware taskscheduling at the system software level”, in Low Power Electronics and Design (ISLPED),2007 ACM/IEEE International Symposium on, 2007, pp. 213–218. DOI: 10.1145/1283780.1283826.
[43] R. Cochran, C. Hankendi, A. Coskun, and S. Reda, “Identifying the optimal energy-efficient operating points of parallel workloads”, in ICCAD, 2011, pp. 608–615.
[44] R. Cochran, C. Hankendi, A. K. Coskun, and S. Reda, “Pack & cap: adaptive DVFS andthread packing under power caps”, in MICRO, 2011, pp. 175–185.
[46] A. Coskun, T. Rosing, and K. Gross, “Utilizing predictors for efficient thermal manage-ment in multiprocessor SoCs”, Computer-Aided Design of Integrated Circuits and Systems,IEEE Transactions on, vol. 28, no. 10, pp. 1503 –1516, 2009.
[47] M. Curtis-Maury, A. Shah, F. Blagojevic, D. S. Nikolopoulos, B. R. de Supinski, and M.Schulz, “Prediction models for multi-dimensional power-performance optimization onmany cores”, in Proceedings of the 17th international conference on Parallel architectures andcompilation techniques, ser. PACT ’08, Toronto, Ontario, Canada: ACM, 2008, pp. 250–259, ISBN: 978-1-60558-282-5. DOI: 10.1145/1454115.1454151.
[48] Daikin AC (Americas), Inc., Engineering data SPLIT, FTXS-L series, 2010. [Online]. Avail-able: http://www.daikinac.com/content/resources/manuals/engineering-manuals/.
115

BIBLIOGRAPHY
[49] Q. Deng, D. Meisner, A. Bhattacharjee, T. F. Wenisch, and R. Bianchini, “MultiScale:memory system DVFS with multiple memory controllers”, in Proceedings of the 2012ACM/IEEE International Symposium on Low power electronics and design, ser. ISLPED’12,Redondo Beach, California, USA, 2012, pp. 297–302, ISBN: 978-1-4503-1249-3.
[50] G. Dhiman, K. Mihic, and T. Rosing, “A system for online power prediction in virtu-alized environments using gaussian mixture models”, in Proceedings of the 47th DesignAutomation Conference, ser. DAC ’10, Anaheim, California, 2010, pp. 807–812, ISBN: 978-1-4503-0002-5. DOI: 10.1145/1837274.1837478.
[51] D. M. Dias, W. Kish, R. Mukherjee, and R. Tewari, “A scalable and highly available webserver”, in Proceedings of the 41st IEEE International Computer Conference, ser. COMPCON’96, Washington, DC, USA: IEEE Computer Society, 1996, pp. 85–, ISBN: 0-8186-7414-8.
[52] R. G. Dreslinski, M Wieckowski, D Blaauw, D Sylvester, and T Mudge, “Near-thresholdcomputing: reclaiming moore’s law through energy efficient integrated circuits”, Pro-ceedings of the IEEE, vol. 98, no. 2, pp. 253–266, 2010.
[53] R. Duan, M. Bi, and C. Gniady, “Exploring memory energy optimizations in smart-phones”, 2012 International Green Computing Conference (IGCC), vol. 0, pp. 1–8, 2011.
[54] N. El-Sayed, I. A. Stefanovici, G. Amvrosiadis, A. A. Hwang, and B. Schroeder, “Tem-perature management in data centers: why some (might) like it hot”, SIGMETRICS Per-form. Eval. Rev., vol. 40, no. 1, pp. 163–174, Jun. 2012, ISSN: 0163-5999. DOI: 10.1145/2318857.2254778.
[55] E. N. Elnozahy, M. Kistler, and R. Rajamony, “Energy-efficient server clusters”, in Pro-ceedings of the 2nd international conference on Power-aware computer systems, ser. PACS’02,Cambridge, MA, USA: Springer-Verlag, 2003, pp. 179–197, ISBN: 3-540-01028-9.
[56] Emerson Network Power, “Energy logic: reducing data center energy consumption bycreating savings that cascade across systems”, Tech. Rep., 2009.
[57] X. Fan and et al., “Power provisioning for a warehouse-sized computer”, in ISCA, SanDiego, California, USA, 2007, pp. 13–23.
[58] A. Fapojuwo, C. Tse, and F. Lau, “Energy consumption in wireless sensor networks un-der varying sensor node traffic”, in Wireless Communications and Networking Conference(WCNC), 2010 IEEE, 2010, pp. 1–6.
[59] Y. Fei, S. Ravi, A. Raghunathan, and N. Jha, “Energy-optimizing source code trans-formations for os-driven embedded software”, in VLSI Design, 2004. Proceedings. 17thInternational Conference on, 2004, pp. 261–266. DOI: 10.1109/ICVD.2004.1260934.
[60] N. Fernando, S. W. Loke, and W. Rahayu, “Mobile cloud computing: a survey”, FutureGeneration Computer Systems, vol. 29, no. 1, pp. 84–106, Jan. 2013, ISSN: 0167-739X.
[61] Flomerics Ltd, Flovent version 2.1, [Online], England, 1999. [Online]. Available: http://www.flomerics.com/.
[62] S. K. Garg and R. Buyya, “Exploiting heterogeneity in grid computing for energy-efficient resource allocation”, in Proceedings of the 17th International Conference on Ad-vanced Computing and Communications, ser. ADCOM, Bengaluru, India, 2009.
[63] R. Ge, X. Feng, S. Song, H.-C. Chang, D. Li, and K. W. Cameron, “Powerpack: energyprofiling and analysis of high-performance systems and applications”, IEEE Trans. Par-allel Distrib. Syst., vol. 21, no. 5, pp. 658–671, May 2010, ISSN: 1045-9219. DOI: 10.1109/TPDS.2009.76.
[64] D. Gmach, J. Rolia, L. Cherkasova, and A. Kemper, “Resource pool management: reac-tive versus proactive or let’s be friends”, Computer Networks, vol. 53, no. 17, pp. 2905–2922, Dec. 2009, ISSN: 1389-1286. DOI: 10.1016/j.comnet.2009.08.011.
[65] D. E. Goldberg, Genetic Algorithms in Search, Optimization, and Machine Learning. Addi-son Wesley Professional, 1989.
116
BIBLIOGRAPHY
[66] Google Inc., Efficiency: how we do it. [Online]. Available: http://www.google.com/about/datacenters/efficiency/internal/.
[67] M. Gottscho, A. Kagalwalla, and P. Gupta, “Power variability in contemporary drams”,IEEE Embedded Systems Letters, vol. 4, no. 2, pp. 37–40, 2012, ISSN: 1943-0663. DOI: 10.1109/LES.2012.2192414.
[68] K. Greene, Cloud-Powered GPS chip slashes smartphone power consumption, 2012. [On-line]. Available: http://www.technologyreview.com/news/509176/cloud-poweredgps-chip-slashes-smartphone-powerconsumption.
[69] K. Gross, K. Whisnant, and A. Urmanov, “Electronic prognostics through continuoussystem telemetry”, in MFPT, 2006, pp. 53–62.
[70] J. Hamilton, “Cooperative expendable micro-slice servers (CEMS): low cost, low powerservers for internet-scale services”, in Proceedings of the 4th Biennial Conf. Innovative DataSystems Research, ser. CIDR ’09, Asilomar, CA, USA, 2009.
[71] X. Han and Y. Joshi, “Energy reduction in server cooling via real time thermal control”,in Semiconductor Thermal Measurement and Management Symposium (SEMI-THERM), 2012,pp. 20 –27.
[72] Y. Han and I. Koren, “Simulated annealing based temperature aware floorplanning”,Journal of Low Power Electronics, vol. 3, no. 2, pp. 141–155, 2007. DOI: http://dx.doi.org/10.1166/jolpe.2007.128.
[73] C. Hankendi and A. Coskun, “Adaptive energy-efficient resource sharing for multi-threaded workloads in virtualized systems”, in International Workshop on Computing inHeterogeneous, Autonomous ’N’ Goal-oriented Environments, CHANGE, 2012, 2012.
[74] T. Heath, A. P. Centeno, P. George, L. Ramos, Y. Jaluria, and R. Bianchini, “Mercury andFreon: temperature emulation and management for server systems”, in Proceedings ofthe International Conference on Architectural Support for Programming Languages and Op-erating Systems, ser. ASPLOS’06, San Jose, California, USA, 2006, pp. 106–116, ISBN:1-59593-451-0.
[75] E. Hemberg, L. Ho, M. O’Neill, and H. Claussen, “A comparison of grammatical geneticprogramming grammars for controlling femtocell network coverage”, English, GeneticProgramming and Evolvable Machines, vol. 14, no. 1, pp. 65–93, 2013, ISSN: 1389-2576. DOI:10.1007/s10710-012-9171-8.
[76] J. Heo, D. Henriksson, X. Liu, and T. Abdelzaher, “Integrating adaptive components: anemerging challenge in performance-adaptive systems and a server farm case-study”,in Proceedings of the 28th IEEE International Real-Time Systems Symposium, ser. RTSS ’07,Washington, DC, USA: IEEE Computer Society, 2007, pp. 227–238, ISBN: 0-7695-3062-1.
[77] W. Huang, M. Allen-Ware, J. Carter, E. Elnozahy, H. Hamann, T. Keller, C. Lefurgy, J.Li, K. Rajamani, and J. Rubio, “TAPO: thermal-aware power optimization techniquesfor servers and data centers”, in IGCC, 2011, pp. 1–8. DOI: 10.1109/IGCC.2011.6008610.
[78] W. L Hung, Y. Xie, N. Vijaykrishnan, C. Addo-Quaye, T. Theocharides, and M. Irwin,“Thermal-aware floorplanning using genetic algorithms”, in Quality of Electronic De-sign, 2005. ISQED 2005. Sixth International Symposium on, 2005, pp. 634–639. DOI: 10.1109/ISQED.2005.122.
[79] Intel, Server Board S2600GZ/GL. Technical Product Specification, 2014 (Revision 2.1).
[80] M. Iyengar and R. Schmidt, “Analytical modeling for thermodynamic characterizationof data center cooling systems”, Journal of Electronic Packaging, vol. 113, Feb. 2009, ISSN:1043-7398.
[81] D. Jeon, M. Seok, C. Chakrabarti, D. Blaauw, and D. Sylvester, “A super-pipelined en-ergy efficient subthreshold 240 MS/s FFT core in 65 nm CMOS”, Solid-State Circuits,IEEE Journal of, vol. 47, no. 1, pp. 23 –34, 2012, ISSN: 0018-9200. DOI: 10.1109/JSSC.2011.2169311.
117
BIBLIOGRAPHY
[82] P. Jobin, Cloud computing shifting to cooler climates, 2012. [Online]. Available: http://www.datacenterknowledge.com/archives/2012/10/16/where-will-the-next-silicon-valley-be/.
[83] T. M. Jones, S. Bartolini, B. De Bus, J. Cavazos, and M. O’Boyle, “Instruction cacheenergy saving through compiler way-placement”, in Proceedings of the conference on De-sign, automation and test in Europe, ser. DATE ’08, Munich, Germany, 2008, pp. 1196–1201, ISBN: 978-3-9810801-3-1. DOI: 10.1145/1403375.1403666.
[84] V. Jones, A. Halteren, I. Widya, N. Dokovsky, G. Koprinkov, R. Bults, D. Konstantas,and R. Herzog, “Mobihealth: mobile health services based on body area networks”, inM-Health, ser. Topics in Biomedical Engineering, R. Istepanian, S. Laxminarayan, andC. Pattichis, Eds., Springer US, 2006, pp. 219–236, ISBN: 978-0-387-26558-2.
[85] J Kaplan, W Forrest, and N Kindler, “Revolutionizing data center energy efficiency”,Tech. Rep. July, 2008, p. 15.
[86] B. Khargharia, S. Hariri, and M. S. Yousif, “Autonomic power and performance man-agement for computing systems”, Cluster Computing, vol. 11, pp. 167–181, 2 2008, ISSN:1386-7857.
[87] J. Koomey, “Growth in data center electricity use 2005 to 2010”, Analytics Press, Oak-land, CA, Tech. Rep., 2011.
[88] M. de Kruijf, S. Nomura, and K. Sankaralingam, “A unified model for timing specula-tion: evaluating the impact of technology scaling, CMOS design style, and fault recov-ery mechanism”, in Dependable Systems and Networks (DSN), 2010 IEEE/IFIP InternationalConference on, 2010, pp. 487 –496. DOI: 10.1109/DSN.2010.5544278.
[89] K. Kumar and Y.-H. Lu, “Cloud computing for mobile users: can offloading computa-tion save energy?”, IEEE Computer, vol. 43, no. 4, pp. 51–56, 2010.
[90] D. Kusic, J. O. Kephart, J. E. Hanson, N. Kandasamy, and G. Jiang, “Power and perfor-mance management of virtualized computing environments via lookahead control”,Cluster Computing, vol. 12, pp. 1–15, 1 2009, ISSN: 1386-7857.
[91] S. Lee and J. Kim, “Using dynamic voltage scaling for energy-efficient flash-based stor-age devices”, in SoC Design Conference (ISOCC), 2010 International, 2010, pp. 63 –66.
[92] C. Lefurgy, K. Rajamani, F. Rawson, W. Felter, M. Kistler, and T. W. Keller, “Energymanagement for commercial servers”, Computer, vol. 36, pp. 39–48, 12 2003, ISSN: 0018-9162. DOI: http://dx.doi.org/10.1109/MC.2003.1250880.
[93] A. Lewis, S. Ghosh, and N. F. Tzeng, “Run-time energy consumption estimation basedon workload in server systems”, in HotPower, San Diego, California, 2008, pp. 4–4.
[94] F. X. Lin, Z. Wang, R. LiKamWa, and L. Zhong, “Reflex: using low-power processorsin smartphones without knowing them”, in Proceedings of the seventeenth internationalconference on Architectural Support for Programing Languages and Operating Systems, ser.ASPLOS XVII, London, England, UK: ACM, 2012, pp. 13–24, ISBN: 978-1-4503-0759-8.
[95] Linpack HPL benchmark for HPC, 2011. [Online]. Available: http://www.netlib.org/benchmark/hpl/.
[96] P. B. Liz Marshall, “Using cfd for data center design and analysis”, Applied Math Mod-eling White Paper, Tech. Rep., 2011, p. 17.
[97] R. Longbottom, Randmem memory benchmark, http://www.roylongbottom.org.uk/, 2012.
[98] A. Lucero, Simulation of batch scheduling using real production-ready software tools, http://www.bsc.es/media/4856.pdf.
[99] J. M. M. Raskino and P. Meehan, Gartner Research Report ID Number G00164278, [CIONew Year’s Resolutions, 2009], 5 January 2009.
[100] H. Mamaghanian, N. Khaled, D. Atienza, and P. Vandergheynst, “Compressed sensingfor real-time energy-efficient ecg compression on wireless body sensor nodes”, IEEETransactions on Biomedical Engineering (TBME), vol. 58, pp. 2456–2466, 2011.
118

BIBLIOGRAPHY
[101] J. Markoff and S. Hansell, Hiding in plain sight, google seeks more power, [The New YorkTimes], 2006.
[102] J. K. Matt Stansberry, “Uptime institute 2013 data center industry survey”, UptimeInstitute, Tech. Rep., 2013.
[103] D. Meisner, B. T. Gold, and T. F. Wenisch, “Powernap: eliminating server idle power”,SIGPLAN Not., vol. 44, no. 3, pp. 205–216, Mar. 2009, ISSN: 0362-1340. DOI: 10.1145/1508284.1508269.
[104] D. Meisner and T. F. Wenisch, “Stochastic queuing simulation for data center work-loads”, in EXERT, 2010.
[105] K. Melikhov, V. M. Kureichick, A. N. Melikhov, V. V. Miagkikh, O. V. Savelev, and A.P. Topchy, “Some New Features In Genetic Solution Of The Traveling Salesman Prob-lem.”, in Adaptive Computing in Engineering Design and Control (ACEDC), 2nd Interna-tional Conference of the Integration of Genetic Algorithms and Neural Network Computingand Related Adaptive Techniques with Current Engineering Practice, 1996.
[106] M. F. Mergen, V. Uhlig, O. Krieger, and J. Xenidis, “Virtualization for high-performancecomputing”, SIGOPS Oper. Syst. Rev., vol. 40, no. 2, pp. 8–11, Apr. 2006, ISSN: 0163-5980.DOI: 10.1145/1131322.1131328.
[107] R. Miller, Google: raise your data center temperature, 2008. [Online]. Available: http://www.datacenterknowledge.com/archives/2008/10/14/google-raise-your-data-center-temperature/.
[108] R. Miller, Too hot for humans, but google servers keep humming, 2012. [Online]. Available:http://www.datacenterknowledge.com/archives/2012/03/23/too-hot-for-humans-but-google-servers-keep-humming/.
[109] R. Miller, Data center cooling set points debated, 2007. [Online]. Available: http : / /www.datacenterknowledge.com/archives/2007/09/24/data-center-cooling-set-points-debated/.
[110] L. Minas and B. Ellison, Energy Efficiency for Information Technology: How to Reduce PowerConsumption in Servers and Data Centers. Intel Press, 2009, ISBN: 9781934053201.
[111] J. Moore, J. Chase, and P. Ranganathan, “Weatherman: automated, online and predic-tive thermal mapping and management for data centers”, in IEEE International Confer-ence on Autonomic Computing, ser. ICAC’06, 2006, pp. 155–164. DOI: 10.1109/ICAC.2006.1662394.
[112] J. Moore, J. Chase, P. Ranganathan, and R. Sharma, “Making scheduling ”cool”: temperature-aware workload placement in data centers”, in Proceedings of the annual conference onUSENIX Annual Technical Conference, ser. ATEC ’05, Anaheim, CA: USENIX Associa-tion, 2005, pp. 5–5.
[113] P. J. Mucci, S. Browne, C. Deane, and G. Ho, “Papi: a portable interface to hardware per-formance counters”, in In Proceedings of the Department of Defense HPCMP Users GroupConference, 1999, pp. 7–10.
[114] T. Mukherjee, A. Banerjee, G. Varsamopoulos, S. K. S. Gupta, and S. Rungta, “Spatio-temporal thermal-aware job scheduling to minimize energy consumption in virtualizedheterogeneous data centers”, Comput. Netw., vol. 53, no. 17, pp. 2888–2904, Dec. 2009,ISSN: 1389-1286. DOI: 10.1016/j.comnet.2009.06.008.
[115] R. Mullins, HP service helps keep data centers cool, 2007. [Online]. Available: http://www.pcworld.com/article/135052/hp_service_helps_keep_data_centers_cool.html.
[116] M. N. Bennani and D. A. Menasce, “Resource allocation for autonomic data centersusing analytic performance models”, in Proceedings of the Second International Conferenceon Automatic Computing, Washington, DC, USA: IEEE Computer Society, 2005, pp. 229–240, ISBN: 0-7965-2276-9.
119
BIBLIOGRAPHY
[117] S. Narendra and A. Chandrakasan, Leakage in Nanometer CMOS Technologies, ser. Inte-grated Circuits and Systems. Springer, 2010, ISBN: 978-14-4193-8268.
[118] R. Nathuji, C. Isci, E. Gorbatov, and K. Schwan, “Providing platform heterogeneity-awareness for data center power management”, Cluster Computing, vol. 11, no. 3, pp. 259–271, 2008, ISSN: 1386-7857. DOI: 10.1007/s10586-008-0054-y.
[119] National Academy of Engineering, Grand challenges for engineering. [Online]. Available:http://www.engineeringchallenges.org.
[120] National Research Council (U.S.). Committee on Electric Power for the DismountedSoldier, Energy-Efficient Technologies for the Dismounted Soldier. National Academy Press,1997, ISBN: 9780309059343.
[121] M. O’Neill and C. Ryan, “Grammatical evolution”, IEEE Transactions on EvolutionaryComputation, vol. 5, no. 4, pp. 349–358, 2001, ISSN: 1089-778X.
[122] B. Otal, L. Alonso, and C. Verikoukis, “Highly reliable energy-saving mac for wirelessbody sensor networks in healthcare systems”, Selected Areas in Communications, IEEEJournal on, vol. 27, no. 4, pp. 553–565, 2009.
[123] P. Padala, K. G. Shin, X. Zhu, M. Uysal, Z. Wang, S. Singhal, A. Merchant, and K.Salem, “Adaptive control of virtualized resources in utility computing environments”,SIGOPS Oper. Syst. Rev., vol. 41, pp. 289–302, 3 2007, ISSN: 0163-5980.
[124] J. Pagan, M. Zapater, O. Cubo, P. Arroba, V. Martın, and J. M. Moya, “A Cyber-Physicalapproach to combined HW-SW monitoring for improving energy efficiency in datacenters”, in Conference on Design of Circuits and Integrated Systems, ser. DCIS’13, [Thispublication is a result of the MSc. Thesis developed by J. Pagan under the supervisionof the author.], 2013, pp. 140–145, ISBN: 978-84-8081-401-0.
[125] E. Pakbaznia, M. Ghasemazar, and M. Pedram, “Temperature-aware dynamic resourceprovisioning in a power-optimized datacenter”, in Proceedings of the Conference on De-sign, Automation and Test in Europe, ser. DATE’10, Dresden, Germany, 2010, pp. 124–129,ISBN: 978-3-9810801-6-2.
[126] S. Pandey, W. Voorsluys, S. Niu, A. Khandoker, and R. Buyya, “An autonomic cloud en-vironment for hosting ecg data analysis services”, Future Generation Computer Systems,vol. 28, no. 1, pp. 147 –154, 2012, ISSN: 0167-739X.
[127] C. D. Patel, C. E. Bash, and C. Belady, “Computational fluid dynamics modeling ofhigh compute density data centers to assure system inlet air specifications”, in Proceed-ings of The Pacific Rim/ASME International Electronic Packaging Technical Conference andExhibition, ser. IPACK’01, Hawaii, USA, 2001.
[128] Patricia Arroba, Jose L. Risco-Martin, Marina Zapater, Jose M. Moya and Jose L. Ayala,“Enhancing regression models for complex systems using evolutionary techniques forfeature engineering”, Journal of Grid Computing, 2014.
[129] M. Patterson, “The effect of data center temperature on energy efficiency”, in ITHERM,2008, pp. 1167 –1174.
[130] M. Pedram and S. Nazarian, “Thermal modeling, analysis, and management in VLSIcircuits: principles and methods”, Proceedings of the IEEE, vol. 94, no. 8, pp. 1487–1501,2006, ISSN: 0018-9219. DOI: 10.1109/JPROC.2006.879797.
[131] L. Phan and C.-X. Lin, “A multi-zone building energy simulation of a data center modelwith hot and cold aisles”, Energy and Buildings, vol. 77, pp. 364–376, 2014, ISSN: 0378-7788.
[132] A. Phansalkar, A. Joshi, and L. K. John, “Subsetting the spec cpu2006 benchmark suite.”,SIGARCH Computer Architecture News, vol. 35, no. 1, pp. 69–76, 2007.
[133] E. Pinheiro, R. Bianchini, E. V. Carrera, and T. Heath, “Load balancing and unbalanc-ing for power and performance in clusterbased systems”, in Workshop on Compilers andOperating Systems for Low Power, 2001.
120

BIBLIOGRAPHY
[134] B. Pradelle, N. Triquenaux, J. Beyler, and W. Jalby, “Energy-centric dynamic fan con-trol”, Computer Science - Research and Development, pp. 1–9, 2013, ISSN: 1865-2034. DOI:10.1007/s00450-013-0241-9.
[135] J. Rabaey, Low Power Design Essentials, ser. Engineering. Springer, 2009, ISBN: 978-03-8771-7128.
[136] R. Raghavendra, P. Ranganathan, V. Talwar, Z. Wang, and X. Zhu, “No “power” strug-gles: coordinated multi-level power management for the data center”, in Proceedings ofInternational Conference on Architectural support for programming languages and operatingsystems, ser. ASPLOS’08, Seattle, WA, USA: ACM, 2008, pp. 48–59, ISBN: 978-1-59593-958-6.
[137] L. Ramos and R. Bianchini, “C-oracle: predictive thermal management for data cen-ters”, in IEEE International Symposium on High Performance Computer Architecture, ser.HPCA’08, 2008, pp. 111–122.
[138] F. Rincon, J. Recas, N. Khaled, and D. Atienza, “Development and evaluation of mul-tilead wavelet-based ecg delineation algorithms for embedded wireless sensor nodes”,Information Technology in Biomedicine, IEEE Transactions on, vol. 15, no. 6, pp. 854 –863,2011, ISSN: 1089-7771.
[139] S. Rivoire, M. Shah, P. Ranganatban, C. Kozyrakis, and J. Meza, “Models and metricsto enable energy-efficiency optimizations”, Computer, vol. 40, no. 12, pp. 39 –48, 2007,ISSN: 0018-9162.
[140] M. Rocha and J. Neves, “Preventing premature convergence to local optima in ge-netic algorithms via random offspring generation”, in Proceedings of the 12th Interna-tional Conference on Industrial and Engineering Applications of Artificial Intelligence and Ex-pert Systems: Multiple Approaches to Intelligent Systems, ser. IEA/AIE’99, Cairo, Eygpt:Springer-Verlag New York, Inc., 1999, pp. 127–136, ISBN: 3-540-66076-3.
[141] C. Ryan, J. Collins, and M. Neill, “Grammatical evolution: evolving programs for anarbitrary language”, in Genetic Programming, ser. Lecture Notes in Computer Science,W. Banzhaf, R. Poli, M. Schoenauer, and T. Fogarty, Eds., vol. 1391, Springer BerlinHeidelberg, 1998, pp. 83–96, ISBN: 978-3-540-64360-9.
[142] C. Ryan and M. O’Neill, “Grammatical evolution: a steady state approach.”, in In LateBreaking Papers, Genetic Programming, 1998, pp. 180–185.
[143] J. C. Salinas-Hilburg, Analisis y caracterizacion del consumo de servidores de altas presta-ciones y de su impacto energetico en un centro de datos, 2014.
[144] M. Seok, D. Jeon, C. Chakrabarti, D. Blaauw, and D. Sylvester, “Pipeline strategy for im-proving optimal energy efficiency in ultra-low voltage design”, in Proceedings of the 48thDesign Automation Conference, ser. DAC’11, San Diego, California: ACM, 2011, pp. 990–995, ISBN: 978-1-4503-0636-2. DOI: 10.1145/2024724.2024943.
[145] D. Shin, J. Kim, N. Chang, J. Choi, S. W. Chung, and E.-Y. Chung, “Energy-optimaldynamic thermal management for green computing”, in ICCAD, San Jose, California,2009, pp. 652–657, ISBN: 978-1-60558-800-1.
[146] J. Shin et al., “A 40nm 16-core 128-thread cmt sparc soc processor”, in International Solid-State Circuits Conference Digest of Technical Papers (ISSCC), 2010, pp. 98 –99.
[147] U. Singh, A. K. Singh, S. Parvez, and A. Sivasubramaniam, “Cfd-based operationalthermal efficiency improvement of a production data center”, in Proceedings of the FirstUSENIX Conference on Sustainable Information Technology, ser. SustainIT’10, San Jose, CA:USENIX Association, 2010, pp. 6–6.
[148] SPEC CPU Subcommittee and John L. Henning, SPEC CPU 2006 benchmark descriptions,http://www.spec.org/cpu2006/.
[149] SPEC Power Committee, Spec power benchmark 2008, http://www.spec.org/power ssj2008/,2012.
121
BIBLIOGRAPHY
[150] R. Sullivan, Alternating cold and hot aisles provides more reliable cooling for server farms,2000.
[151] Q. Tang, S. Gupta, and G. Varsamopoulos, “Thermal-aware task scheduling for datacenters through minimizing heat recirculation”, in Cluster Computing, 2007 IEEE Inter-national Conference on, 2007, pp. 129–138. DOI: 10.1109/CLUSTR.2007.4629225.
[152] Q. Tang, S. Gutpa, and G. Varsamopoulos, “Energy-efficient thermal-aware task schedul-ing for homogeneous high-performance computing data centers: a cyber-physical ap-proach”, IEEE Trans. Parallel Distributed Systems, vol. 19, pp. 1458–1472, 11 2008, ISSN:1045-9219.
[153] C. Thompson, D. C. Schmidt, H. A. Turner, and J. White, “Analyzing mobile applicationsoftware power consumption via model-driven engineering.”, in PECCS, C. Benavente-Peces and J. Filipe, Eds., 2011, pp. 101–113, ISBN: 978-989-8425-48-5.
[154] J. Torres, “Middleware research for green data centers”, in Proceedings of e-InfraNetWorkshop on Green and Environmental Computing, ser. CSC-IT, Center for Science Espoo,Finland, 2010.
[155] M. Vallejo, J. Recas, and J. L. Ayala, “Channel analysis and dynamic adaptation forenergy-efficient WBSNs”, in Ubiquitous Computing and Ambient Intelligence, ser. LectureNotes in Computer Science, J. Bravo, D. Lopez-de Ipina, and F. Moya, Eds., vol. 7656,Springer Berlin Heidelberg, 2012, pp. 42–49, ISBN: 978-3-642-35376-5.
[156] A. Vance, Microsoft’s data center offensive sounds offensive, [The Register], June 2006.
[157] G. Varsamopoulos, A. Banerjee, and S. Gupta, “Energy efficiency of thermal-aware jobscheduling algorithms under various cooling models”, in Contemporary Computing, ser.Communications in Computer and Information Science, vol. 40, Springer Berlin Hei-delberg, 2009, pp. 568–580, ISBN: 978-3-642-03546-3. DOI: 10.1007/978- 3- 642-03547-0_54.
[158] A. Venkatraman, Global census shows datacentre power demand grew 63% in 2012, 2012.[Online]. Available: http://www.computerweekly.com/news/2240164589/Datacentre- power- demand- grew- 63- in- 2012- Global- datacentre-census.
[159] C. Verboom, https://commons.lbl.gov/display/itdivision/2012/04,”[Online]”, 2012.
[160] A. Verma, P. Ahuja, and A. Neogi, “Pmapper: power and migration cost aware appli-cation placement in virtualized systems”, in Proceedings of the 9th ACM/IFIP/USENIXInternational Conference on Middleware, ser. Middleware ’08, Leuven, Belgium: Springer-Verlag New York, Inc., 2008, pp. 243–264, ISBN: 3-540-89855-7.
[161] J. R. Villarreal, R. Lysecky, S. Cotterell, and F. Vahid, “A Study on the Loop Behavior ofEmbedded Programs”, University of California, Riverside, Riverside, CA, USA, Tech.Rep. UCR–CSE–01–03, 2001.
[162] E. Vladislavleva, G. Smits, and D. den Hertog, “Order of nonlinearity as a complex-ity measure for models generated by symbolic regression via pareto genetic program-ming”, IEEE Transactions on Evolutionary Computation, vol. 13, no. 2, pp. 333–349, 2009,ISSN: 1089-778X. DOI: 10.1109/TEVC.2008.926486.
[163] T. Simunic, L. Benini, G. De Micheli, and M. Hans, “Source code optimization and pro-filing of energy consumption in embedded systems”, in Proceedings of the 13th Inter-national Symposium on System Synthesis, ser. ISSS ’00, Madrid, Spain: IEEE ComputerSociety, 2000, pp. 193–198, ISBN: 1-58113-267-0. DOI: 10.1145/501790.501831.
[164] Z. Wang, C. Bash, N. Tolia, M. Marwah, X. Zhu, and P. Ranganathan, “Optimal fanspeed control for thermal management of servers”, in InterPACK, 2009.
122

BIBLIOGRAPHY
[165] G. Wu, Z. Xu, Q. Xia, J. Ren, and F. Xia, “Task allocation and migration algorithm fortemperature-constrained real-time multi-core systems”, in Green Computing and Com-munications (GreenCom), 2010 IEEE/ACM Int’l Conference on Int’l Conference on Cyber,Physical and Social Computing (CPSCom), 2010, pp. 189–196. DOI: 10.1109/GreenCom-CPSCom.2010.27.
[166] Y. Xie and W. Hung, “Temperature-aware task allocation and scheduling for embeddedmultiprocessor systems-on-chip (MPSoC) design”, The Journal of VLSI Signal Processing,vol. 45, no. 3, pp. 177–189, 2006, ISSN: 0922-5773. DOI: 10.1007/S11265-006-9760-y.
[167] P. Yang, C. Wong, P. Marchal, F. Catthoor, D. Desmet, D. Verkest, and R. Lauwereins,“Energy-aware runtime scheduling for embedded-multiprocessor socs”, IEEE Des. Test,vol. 18, no. 5, pp. 46–58, Sep. 2001, ISSN: 0740-7475. DOI: 10.1109/54.953271.
[168] Yoo, A. B. Jette, M. A. Grondona, M., “SLURM: Simple Linux Utility for Resource Man-agement”, Lecture Notes in Computer Science, 2003.
[182] L. M. Zhang, K. Li, and Y.-Q. Zhang, “Green task scheduling algorithms with energyreduction on heterogeneous computers”, in Progress in Informatics and Computing (PIC),2010 IEEE International Conference on, vol. 1, 2010, pp. 560–563. DOI: 10.1109/PIC.2010.5687471.
[183] X. Zheng and Y. Cai, “Markov model based power management in server clusters”,in Proceedings of the 2010 IEEE/ACM Int’L Conference on Green Computing and Commu-nications & Int’L Conference on Cyber, Physical and Social Computing, ser. GREENCOM-CPSCOM ’10, Washington, DC, USA: IEEE Computer Society, 2010, pp. 96–102, ISBN:978-0-7695-4331-4. DOI: 10.1109/GreenCom-CPSCom.2010.166.
123


Todo pasa y todo queda,pero lo nuestro es pasar,pasar haciendo caminos,caminos sobre el mar....Caminante son tus huellasel camino y nada mas;caminante no hay camino,se hace camino al andar.
— Antonio Machado, Caminante no hay camino
“So long, and thanks for all the fish.”
— Douglas Adams, The Hitchhiker’s Guide to the Galaxy