nfp governance and performance study - baxter lawley
TRANSCRIPT
NFP GOVERNANCE AND PERFORMANCE STUDYAustralia’s most comprehensive governance research
2015 NFP GOVERNANCE AND PERFORMANCE STUDY2
Commonwealth Bank – Supporting social impact
The Commonwealth Bank’s Social Impact Banking team is delighted to once again support
the Australian Institute of Company Directors’ 2015 NFP Governance and Performance Study.
The not-for-profit (NFP) sector is
an essential part of the Australian
economy and society and continues
to deliver benefits to our community
more efficiently and effectively
than ever before. Nevertheless,
financial sustainability remains the
key issue for directors of NFPs and
is the driving force behind issues
of efficiency, strategy, mergers and
collaboration.
A complex web of factors influence
the financial health of organisations
– it’s not simply a case of fundraising,
as is so often perceived by wider
Australia. Interestingly, this year’s
study demonstrates emphasis on
simple cost management as an
imperative has diminished and NFPs’
focus is evolving to encompass a richer
mix of diversifying income streams
and increasing own-source income.
In our own close work with those at
the helm of financial management
we have seen an increasing shift
towards the creation of social
enterprises within NFPs. Innovative
internal profit-making activities and
methodologies, designed to raise
both funds and awareness in support
of organisations’ overall missions,
form just one approach to improving
financial sustainability.
In last year’s study, we saw that
mergers were increasingly being
discussed. This year, that trend
continues and actual mergers are
becoming more common. However,
directors warn that mergers should
not be viewed as a panacea.
There are a range of alternative
approaches that financially
responsible directors can adopt
on behalf of their organisations.
Collaboration and joint ventures
are becoming more common for
NFPs and many are broadening
their range of revenue sources to
expand funding, eliminate the risk
of single-source revenue and
continue to grow. Transferral of
assets and services to other NFPs
with similarly oriented missions is
also a consideration for some.
Overall the quality of governance
continues to improve. An increasing
emphasis on clarification of an
organisation’s direction from a
strategic perspective and an increase
in financial management capabilities
are key factors.
Commonwealth Bank is absolutely
committed to the social impact sector
and building financial capability in
Australia’s NFPs.
Our support of this study forms part
of this commitment. We trust that
you find it thought provoking and
of benefit and we look forward to
working with many of you in the
year ahead.
Vanessa Nolan-Woods
General Manager, Social Impact
Banking, Commonwealth Bank
commbank.com.au/notforprofit
companydirectors.com.au 3
Contents
Foreword by John Brogden am faicd 4
Executive summary 5
Key sector events in 2014-15 6
Key findings 7
Financial sustainability 8
Mergers 13
More collaborative relationship with government 20
Governance continues to evolve and mature 22
NFP boards are leading diversity 26
Directors’ contribution 30
Culture and the arts 32
Federated organisations 35
The research method and sample 38
About us 40
2015 NFP GOVERNANCE AND PERFORMANCE STUDY4
Welcome to the 6th annual NFP Governance and
Performance Study.
The Australian Institute of Company Directors is committed
to supporting not-for-profit (NFP) directors and boards
to be their very best.
Over the past few years we have increased our range of
services and tools to support the NFP sector, including the
creation of this study, which is now the largest of its kind
in Australia.
We have also recently appointed an NFP Sector Leader
who will help drive even further focus on our offerings
in the NFP sector. The focus of the role is to work closely
with NFP organisations to achieve better outcomes
through enhanced governance. This includes advocating
on the issues important to the sector, ensuring our
education programs maintain their relevance and
developing practical tools and resources for use.
We see this study as a critical part of our ongoing
commitment to the sector. This year the online survey
had close to 3,000 respondents and we held discussion
forums in Sydney, Melbourne, Perth, Canberra, Hobart
and Launceston.
We understand the sector is incredibly diverse and,
as such, governance structures and practices will differ.
This year we examined new issues, including the
challenges for directors of arts organisations, as well as
governance in federated structures.
A key theme emerging from this year’s study is the need
for a more mature relationship between governments
and the sector. As governments continue to rely on the
sector for the delivery of critical services, a strategic
partnership is required to ensure long-term sustainability
of these services.
We hope you find the 2015 study valuable.
Foreword by John Brogden am faicd
John Brogden am faicd
Chief Executive Officer & Managing Director
companydirectors.com.au 5
The 2015 study again highlighted many of the challenges facing the NFP sector, and not surprisingly there
was consistency from previous studies.
Financial sustainability continues
to be a top priority for NFP
organisations. While government
funding is a key element of this,
there is also recognition that many
organisations will need to change
their business models to ensure their
long-term viability.
Mergers and collaboration continue
to be a hot topic for directors and
boards. Importantly, mergers are not
only being discussed by boards –
they are actually happening. Directors
provide a word of warning though:
”mergers are not the solution to
every problem”.
Directors are calling for a more
collaborative relationship with
government. This isn’t just in terms
of funding arrangements, but more
importantly, there is a desire to
work in “partnership” mode with
governments across Australia to help
solve the big issues facing our society.
This year for the first time we shine
a light on the governance practices
and challenges of arts and cultural
organisations.
What we discovered is that arts
organisations had a greater focus
on diversifying income sources,
particularly from corporate
philanthropy. This is largely due to
the recognition that government
funding will continue to decline.
And finally, there is no doubt that
governance in the NFP sector
continues to evolve and mature.
While this can be said of all sectors,
the NFP sector continues to shake
off the perception that its governance
is poor, and in many aspects could be
leading the way, particularly in the
area of board diversity.
Executive summary
2015 NFP GOVERNANCE AND PERFORMANCE STUDY6
The number of NFPs remains
constant, but their importance
in the economy has grown –
The number of ‘economically
significant’ NFPs in Australia (i.e. those
with annual revenue over $50,000)
has remained roughly constant at
approximately 57,000, but their
contribution to the economy (gross
value added) has increased by 42% in
real terms over five years to June 2013.
NFPs now employ over 1m Australians
– 8% of the total workforce.1
Ninety per cent of charity income
(approximately $90b) was earned
by approximately 2,600 (10%) of
charities.2
Three social services ministers
in a year – Under the new Turnbull
government, Christian Porter
became Minister for Social Services
in September 2015, replacing Scott
Morrison, who had been in the role
for only nine months. Morrison had
replaced Kevin Andrews, who held
the portfolio for just over a year.
The ACNC looks set to stay –
The Australian Government’s budget
papers made provision for funding
the Australian Charities and Not-
for-profits Commission (ACNC)
until 2019, providing evidence
that the charity regulator is here to
stay. Charities will continue to be
required to submit annual information
statements providing operational and
financial data to the ACNC.
NFP tax reform and competitive
neutrality back on the agenda –
The Treasury launched its tax white
paper entitled “Re: Think: Better tax,
better Australia”. It raised questions
about whether the current tax
arrangements are appropriate, impact
competitive neutrality with regard
to the for-profit sector, should be
simplified, or could be changed to
enable NFPs to deliver benefits to the
Australian community more efficiently
and effectively.
The Treasury released an exposure
draft regarding changes to Fringe
Benefits Tax concessions on salary
packaged entertainment benefits
to $5,000.
Reduction in Commonwealth
funding and procurement reform
is having a deep impact on human
services – The Commonwealth
Government announced it would
reduce funding to community
services by $1b over four years.
The Department of Social Services’
“open tender” process saw cuts
of $240m, and was criticised for
being disorganised and creating
significant uncertainty for NFPs.
Several services that were defunded
or received significant cuts later had
their funding restored.
The Budget also included the
diversion of $104 million from the
Australia Council for the Arts to a
new National Program for Excellence
in the Arts (NPEA) fund. This
decision was criticised across the
arts sector.
The impact of individualised
funding is being felt by a large
number of NFPs in human
services – The policy shift towards
individualised funding of human
services, most notably with the
National Disability Insurance
Scheme, but also in other areas,
continued to have a deep impact.
It is still well supported, but its
implementation began to create
challenges for both NFPs and
governments.
Key sector events in 2014-15
1 ABS Cat. No. 5256.0 - Australian National Accounts: Non-Profit Institutions Satellite Account, 2012-13
2 Knight P.A. and Gilchrist D.J. 2013 (2014) Australian Charities 2013: The First Report on Charities Registered with the ACNC, A Report for the Australian Charities and Not-for-profits Commission, Melbourne.
companydirectors.com.au 7
Key findings
1. Financial sustainability remains the key issue
2. Mergers are not just being discussed – they are happening
3. NFP directors want a more collaborative relationship with the government
4. NFP governance continues to evolve and mature
5. NFP boards are leading diversity
6. Directors’ contribution: donating money and time?
7. Culture and the arts – balancing on a tightrope
8. Federated organisations – full of complexities
2015 NFP GOVERNANCE AND PERFORMANCE STUDY8
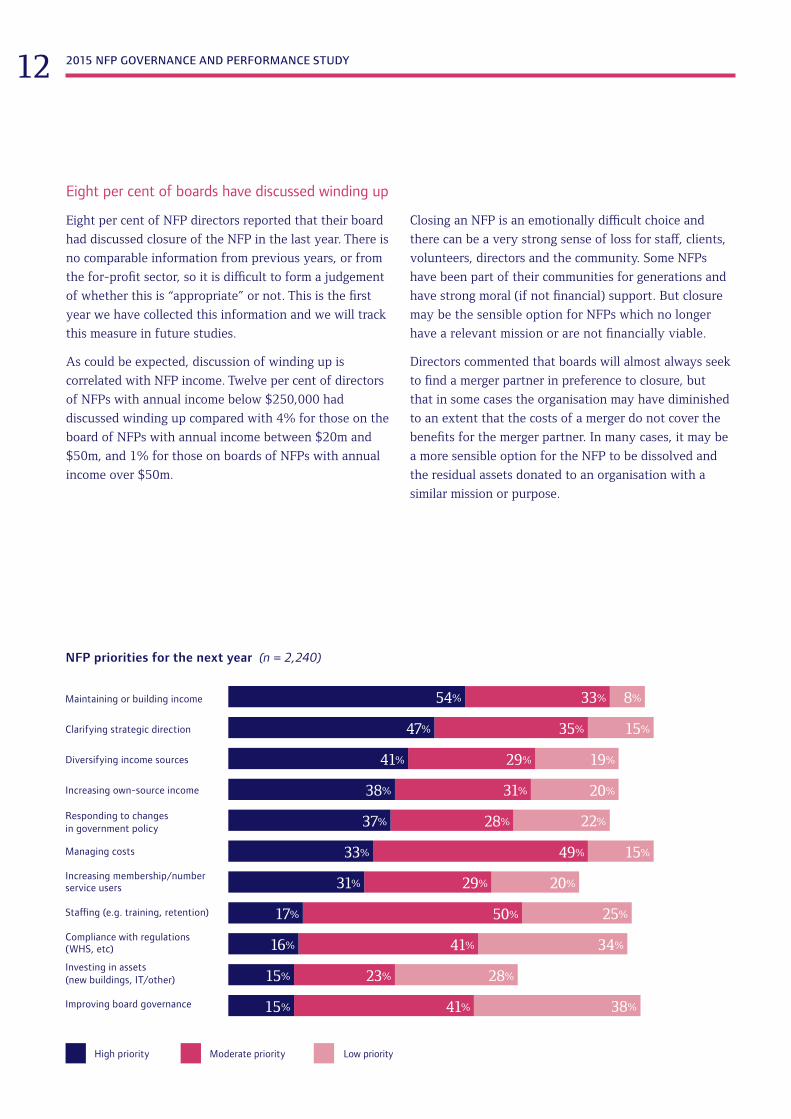
Financial worries continue
The 2015 study found that building
financial sustainability is still the
major concern for most directors.
The on-going pressures on financial
sustainability affected responses
to many questions raised by the
study, including the issues of NFP
efficiency, mergers, collaboration
and closure. Four of directors’ six
highest-rated priorities related
to the issue of the organisation’s
financial health. These included
maintaining or building their NFP’s
income, diversifying income sources,
increasing own-sourced income and
managing costs. Nearly half of all
directors also believe that clarifying
their organisations’ strategic
direction is a high priority and 37%
believe that their NFP needs to
focus on responding to changes in
government policy.
NFP efficiency – our results might challenge your assumptions
The question of NFP efficiency created some interesting debates in the focus
groups we held across Australia with NFP directors. It also elicited many
comments from our survey respondents.
There is a widely held view that NFPs are inefficient in comparison to for-
profits. In its 2010 report titled “Contribution of the Not-for-profit Sector”,
the Productivity Commission stated “the concept of productivity is alien to
many NFPs” and “some NFPs have a different conception of efficiency and
effectiveness, or may eschew such notions altogether”.3 This report repeated
public perceptions and has been influential in shaping opinions.
However, neither the Productivity Commission nor others since have provided
evidence that NFPs are less efficient than for-profits in delivering services.
To examine directors’ beliefs regarding NFP efficiency, this year we asked
respondents to rate the efficiency of their NFP and also their opinion of the
efficiency of the NFP sector in general.
1. Financial sustainability remains the key issue
3 Productivity Commission 2010, Contribution of the Not-for-Profit Sector, Research Report, Canberra.
companydirectors.com.au 9
This is the first time research of this kind has been
published and these results raise some important
questions for governments, the sector and boards.
It is evident that perceptions of low levels of NFP
efficiency underpin government policies across a
range of areas including taxation, contracting and
grant-making policy. In particular, recent comments
and questions raised regarding tax and the National
Disability Insurance Scheme presuppose that opening
markets to competition will improve service and reduce
costs. If this assumption is not correct, there could be
significant consequences for both service users and
government budgets.
It is therefore vitally important for governments to test
assumptions about NFP efficiency in detail and across
different sectors when making policy changes.
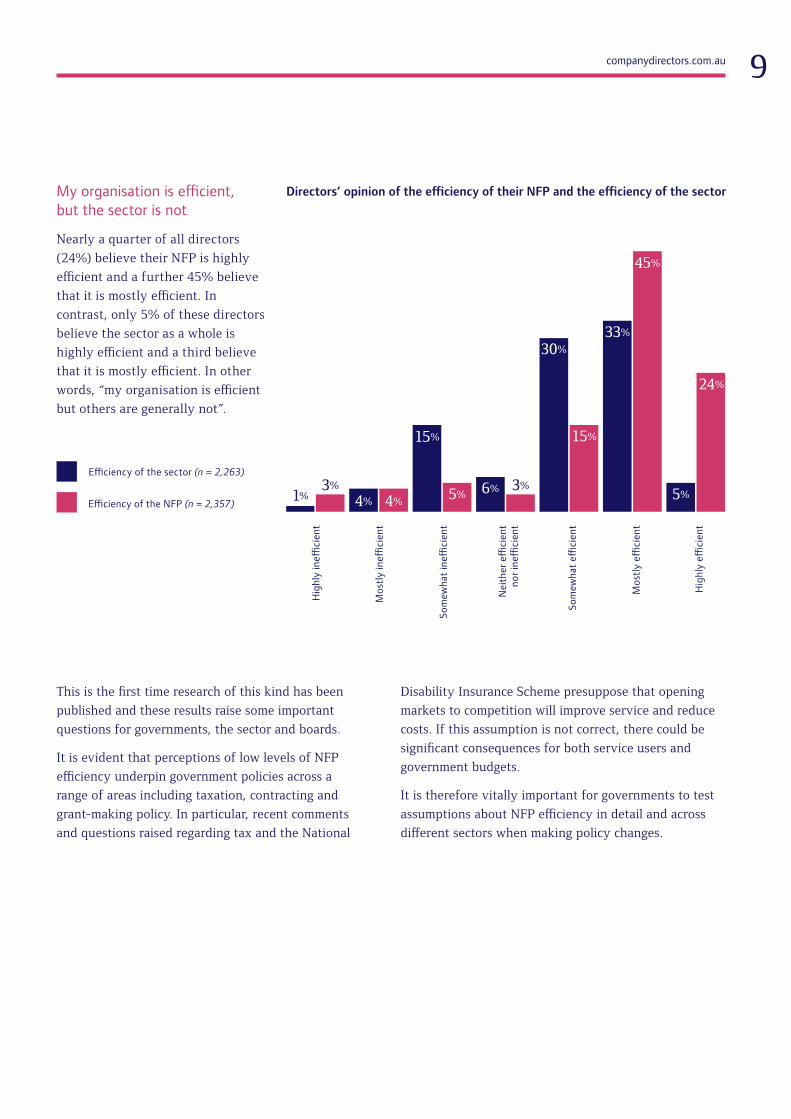
My organisation is efficient, but the sector is not
Nearly a quarter of all directors
(24%) believe their NFP is highly
efficient and a further 45% believe
that it is mostly efficient. In
contrast, only 5% of these directors
believe the sector as a whole is
highly efficient and a third believe
that it is mostly efficient. In other
words, “my organisation is efficient
but others are generally not”.
Efficiency of the NFP (n = 2,357)
Efficiency of the sector (n = 2,263)
15%
5%4%4%6% 3%3%
1% 5%
30%
33%
45%
24%
15%
Directors’ opinion of the efficiency of their NFP and the efficiency of the sector
Hig
hly
ineffi
cien
t
Hig
hly
effici
ent
Mos
tly
ineffi
cien
t
Mos
tly
effici
ent
Som
ewha
t in
effici
ent
Som
ewha
t effi
cien
t
Nei
ther
effi
cien
t no
r ine
ffici
ent

2015 NFP GOVERNANCE AND PERFORMANCE STUDY10
Views of efficiency ratings vary across industries but only slightly with NFP size
On average, 24% of directors rated
their NFP as highly efficient but
analysis by industry type shows
significant variance. Directors
involved in international activities
(34%) were far more likely to rate
their efficiency as high compared
to directors working in professional
associations (17%), religious
activities (15%) and in sport,
recreation and social clubs (11%).4
Directors’ rating of efficiency by industry (n = 2,357)
International activities
Culture and arts
Health
Education and research
Social services
Philanthropic
Development
Law, advocacy and politics
Environment
Business and professional
Religion
Sport, recreation and social clubs
34%
27%
27%
26%
25%
25%
24%
23%
22%
17%
15%
11%
38%
42%
45%
45%
45%
48%
47%
42%
52%
53%
38%
48%
44%Mostly efficientHighly efficient
4 ABS Cat. No. 5256.0 Australian National Accounts: Non-profit Institutions Satellite Account 2012/13. Appendix 1. These statistics have come from abs.com.au Note: In order to separately identify culture and arts organisations, Category 1 was divided separated into two groups: culture and arts, and sports and other recreations and social clubs.
companydirectors.com.au 11
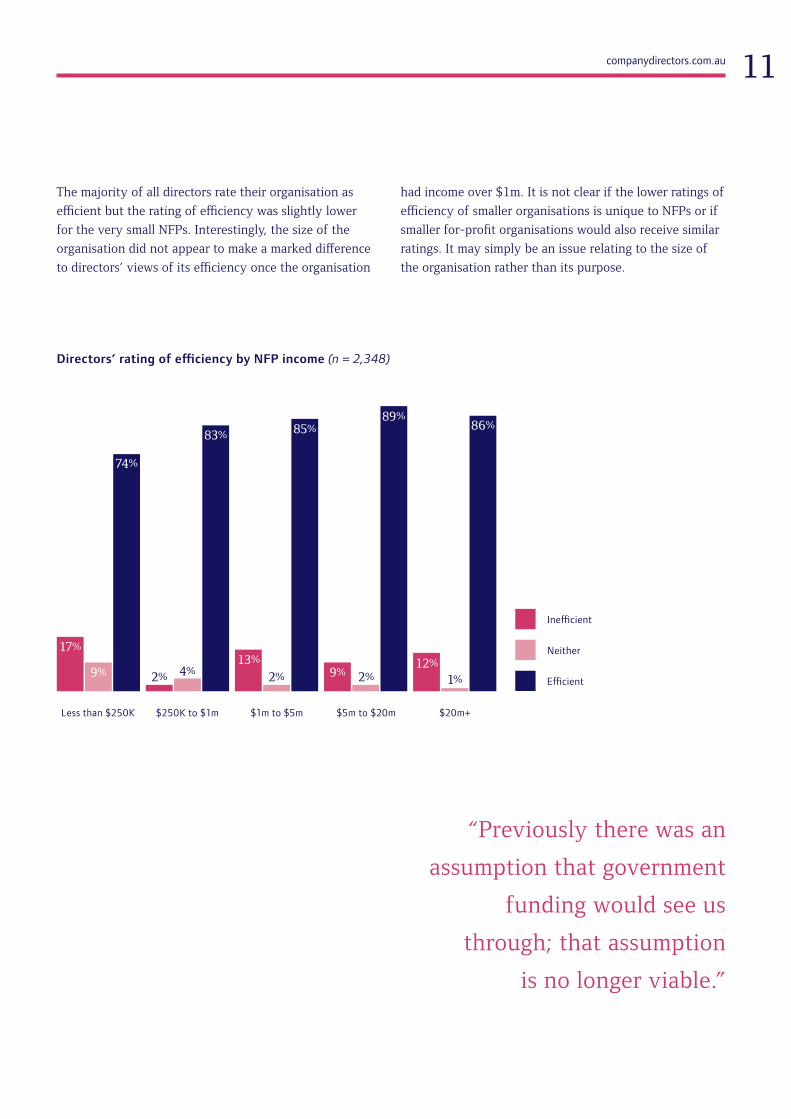
The majority of all directors rate their organisation as
efficient but the rating of efficiency was slightly lower
for the very small NFPs. Interestingly, the size of the
organisation did not appear to make a marked difference
to directors’ views of its efficiency once the organisation
had income over $1m. It is not clear if the lower ratings of
efficiency of smaller organisations is unique to NFPs or if
smaller for-profit organisations would also receive similar
ratings. It may simply be an issue relating to the size of
the organisation rather than its purpose.
86%85%89%
83%
74%
17%
9% 9%2% 2% 2%4%1%
13% 12%
Efficient
Neither
Inefficient
Directors’ rating of efficiency by NFP income (n = 2,348)
Less than $250K $250K to $1m $1m to $5m $5m to $20m $20m+
“Previously there was an
assumption that government
funding would see us
through; that assumption
is no longer viable.”
2015 NFP GOVERNANCE AND PERFORMANCE STUDY12
Eight per cent of boards have discussed winding up
Eight per cent of NFP directors reported that their board
had discussed closure of the NFP in the last year. There is
no comparable information from previous years, or from
the for-profit sector, so it is difficult to form a judgement
of whether this is “appropriate” or not. This is the first
year we have collected this information and we will track
this measure in future studies.
As could be expected, discussion of winding up is
correlated with NFP income. Twelve per cent of directors
of NFPs with annual income below $250,000 had
discussed winding up compared with 4% for those on the
board of NFPs with annual income between $20m and
$50m, and 1% for those on boards of NFPs with annual
income over $50m.
Closing an NFP is an emotionally difficult choice and
there can be a very strong sense of loss for staff, clients,
volunteers, directors and the community. Some NFPs
have been part of their communities for generations and
have strong moral (if not financial) support. But closure
may be the sensible option for NFPs which no longer
have a relevant mission or are not financially viable.
Directors commented that boards will almost always seek
to find a merger partner in preference to closure, but
that in some cases the organisation may have diminished
to an extent that the costs of a merger do not cover the
benefits for the merger partner. In many cases, it may be
a more sensible option for the NFP to be dissolved and
the residual assets donated to an organisation with a
similar mission or purpose.
54%
47%
41%
38%
33%
31%
17%
16%
15%
15%
33%
35%
29%
31%
49%
29%
50%
41%
23%
41%
8%
15%
19%
20%
15%
20%
25%
34%
28%
38%
Clarifying strategic direction
Diversifying income sources
Responding to changes in government policy
Increasing own-source income
Managing costs
Increasing membership/number service users
Staffing (e.g. training, retention)
Compliance with regulations (WHS, etc)
Investing in assets (new buildings, IT/other)
Improving board governance
Maintaining or building income
High priority Moderate priority Low priority
NFP priorities for the next year (n = 2,240)
37% 28% 22%
companydirectors.com.au 13
2. Mergers are not just being discussed – they are happening
This year’s study extended the
examination of collaboration and
merger activity in order to identify
what is actually happening for NFP
directors in our sample, and to provide
more robust information for boards
and NFPs thinking of a merger5.
A third (32%) of directors reported
that their board had discussed a
merger in the last 12 months, 7%
that they have completed a merger
in the last year and 7% that they are
currently undertaking a merger.
Despite their reputation, there is
no evidence that NFP organisations
are less responsive to market forces
than other sectors.
In any conversation about the sector,
it is common to hear people state that
there are too many NFPs. Several of
the directors in our groups expressed
a belief that we have many charities
providing the same services and
competing for the same donations and
that fewer, larger charities would be a
more efficient use of funds. Coupled
with this is the view that NFPs are less
likely to collaborate, close or merge
than for-profits. In other words, it is
generally believed that not only are
NFPs inefficient, but the NFP sector
as a whole does not respond well to
market forces.
Again, the Productivity Commission’s
2010 report stated this explicitly when
it said, “NFPs appear to be reluctant
to close, merge or collaborate” and
referred to vested interests, lack of
strategy and deficient infrastructure to
support aggregation as the key causes.
It also reported that NFPs are reluctant
to grow, especially through a merger,
as it will reduce their connection to
their community. This may turn out
to be true but to date, this and similar
sector commentary has not been
supported by evidence.
5 NFPs could have both merged in the last 12 months and have been likely to merge with another NFP in the next 12 months.
Our coverage of merger activity
was expanded this year to include
additional analysis of the why and
how of mergers. We held two focus
groups with directors with current
experience of mergers and included
additional questions in the survey.
2015 NFP GOVERNANCE AND PERFORMANCE STUDY14
2%3%
15%
22%
34%
40%
4%
10%
13%
39%
Merged in last 12 months (n = 153)
Discussed merger (n = 722)
NFP merger discussions and mergers in the last 12 months by income
Less than $250K $250K to $1m $1m to $5m $5m to $20m $20m+
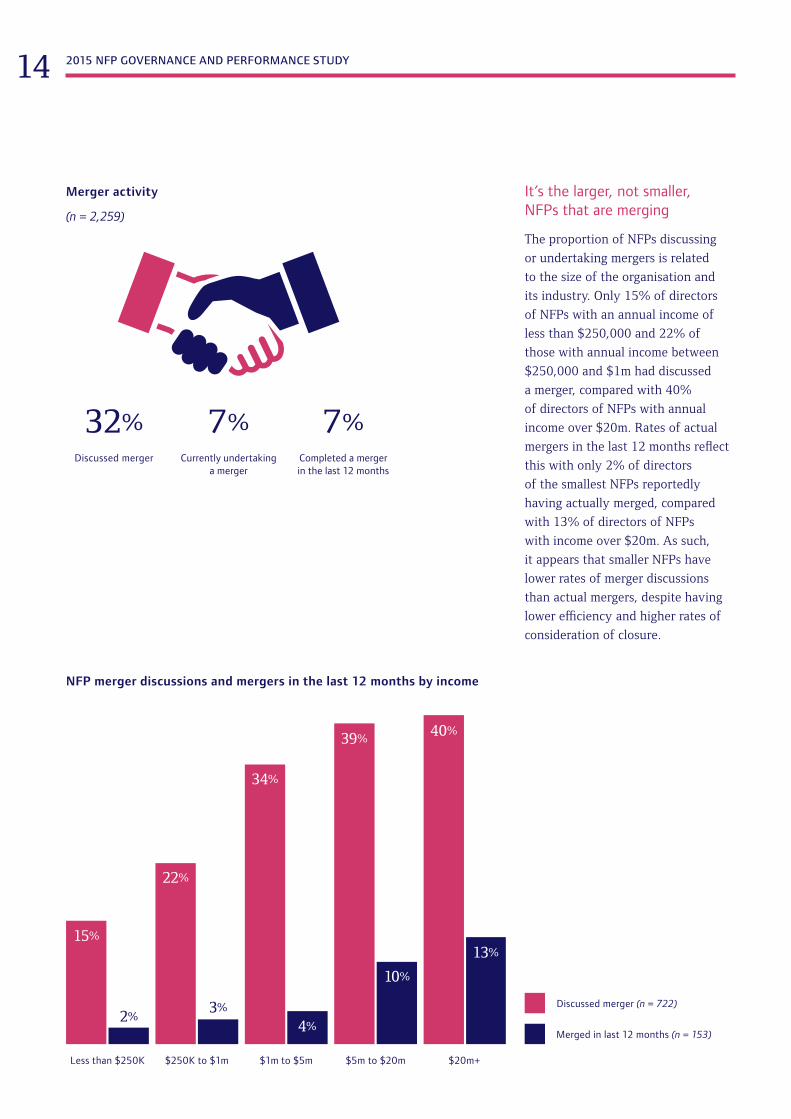
It’s the larger, not smaller, NFPs that are merging
The proportion of NFPs discussing
or undertaking mergers is related
to the size of the organisation and
its industry. Only 15% of directors
of NFPs with an annual income of
less than $250,000 and 22% of
those with annual income between
$250,000 and $1m had discussed
a merger, compared with 40%
of directors of NFPs with annual
income over $20m. Rates of actual
mergers in the last 12 months reflect
this with only 2% of directors
of the smallest NFPs reportedly
having actually merged, compared
with 13% of directors of NFPs
with income over $20m. As such,
it appears that smaller NFPs have
lower rates of merger discussions
than actual mergers, despite having
lower efficiency and higher rates of
consideration of closure.
Merger activity
(n = 2,259)
32%Discussed merger
7%Currently undertaking
a merger
7%Completed a merger in the last 12 months
companydirectors.com.au 15
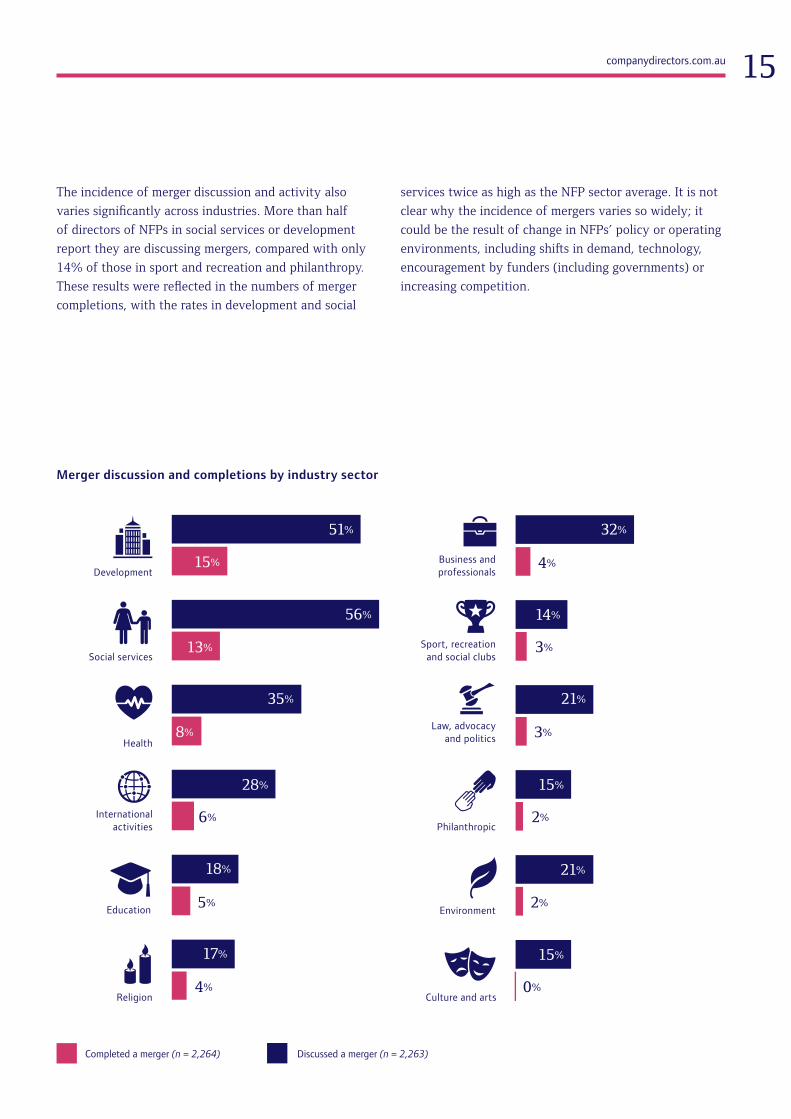
The incidence of merger discussion and activity also
varies significantly across industries. More than half
of directors of NFPs in social services or development
report they are discussing mergers, compared with only
14% of those in sport and recreation and philanthropy.
These results were reflected in the numbers of merger
completions, with the rates in development and social
services twice as high as the NFP sector average. It is not
clear why the incidence of mergers varies so widely; it
could be the result of change in NFPs’ policy or operating
environments, including shifts in demand, technology,
encouragement by funders (including governments) or
increasing competition.
Merger discussion and completions by industry sector
International activities
Culture and arts
Health
Education
Social services
Philanthropic
Development
Law, advocacy and politics
Environment
Business and professionals
Religion
Sport, recreation and social clubs
51% 32%
56% 14%
35% 21%
28% 15%
18% 21%
17% 15%
15%
13%
8%
4% 0%
2%
2%
3%
3%
4%
6%
5%
Discussed a merger (n = 2,263)Completed a merger (n = 2,264)
2015 NFP GOVERNANCE AND PERFORMANCE STUDY16Be
tter
mee
t ou
r mis
sion
Impr
ove
effici
ency
Incr
ease
in s
ize
Be m
ore
attr
activ
e to
fund
ers
We
are
not fi
nanc
ially
su
stai
nabl
e
Incr
ease
the
num
ber
of p
eopl
e se
rved
Enco
urag
ed b
y go
vern
men
t to
mer
ge
Broa
den
our r
ange
of
serv
ices
to e
xist
ing
serv
ice
user
s
Dev
elop
or m
aint
ain
our m
arke
t sha
re,
incl
udin
g re
duci
ng
com
petit
ion
Due
to c
hang
ing
com
plia
nce
requ
irem
ents
or c
osts
Reasons to merge (n = 723)
24%
29%
20%
34%
31%
17% 16%
25%
22%24%
14%
11% 11%
18%
9%7%
13% 13%
31%
19%
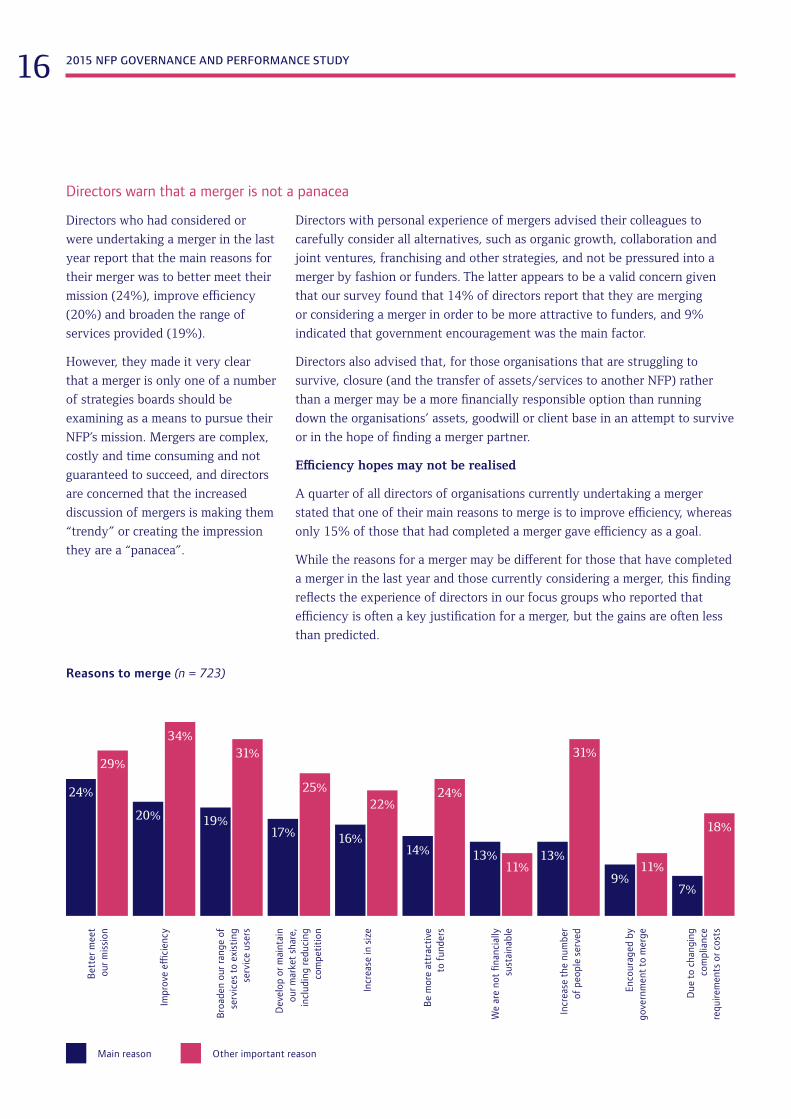
Directors warn that a merger is not a panacea
Directors who had considered or
were undertaking a merger in the last
year report that the main reasons for
their merger was to better meet their
mission (24%), improve efficiency
(20%) and broaden the range of
services provided (19%).
However, they made it very clear
that a merger is only one of a number
of strategies boards should be
examining as a means to pursue their
NFP’s mission. Mergers are complex,
costly and time consuming and not
guaranteed to succeed, and directors
are concerned that the increased
discussion of mergers is making them
“trendy” or creating the impression
they are a “panacea”.
Directors with personal experience of mergers advised their colleagues to
carefully consider all alternatives, such as organic growth, collaboration and
joint ventures, franchising and other strategies, and not be pressured into a
merger by fashion or funders. The latter appears to be a valid concern given
that our survey found that 14% of directors report that they are merging
or considering a merger in order to be more attractive to funders, and 9%
indicated that government encouragement was the main factor.
Directors also advised that, for those organisations that are struggling to
survive, closure (and the transfer of assets/services to another NFP) rather
than a merger may be a more financially responsible option than running
down the organisations’ assets, goodwill or client base in an attempt to survive
or in the hope of finding a merger partner.
Efficiency hopes may not be realised
A quarter of all directors of organisations currently undertaking a merger
stated that one of their main reasons to merge is to improve efficiency, whereas
only 15% of those that had completed a merger gave efficiency as a goal.
While the reasons for a merger may be different for those that have completed
a merger in the last year and those currently considering a merger, this finding
reflects the experience of directors in our focus groups who reported that
efficiency is often a key justification for a merger, but the gains are often less
than predicted.
Main reason Other important reason
companydirectors.com.au 17
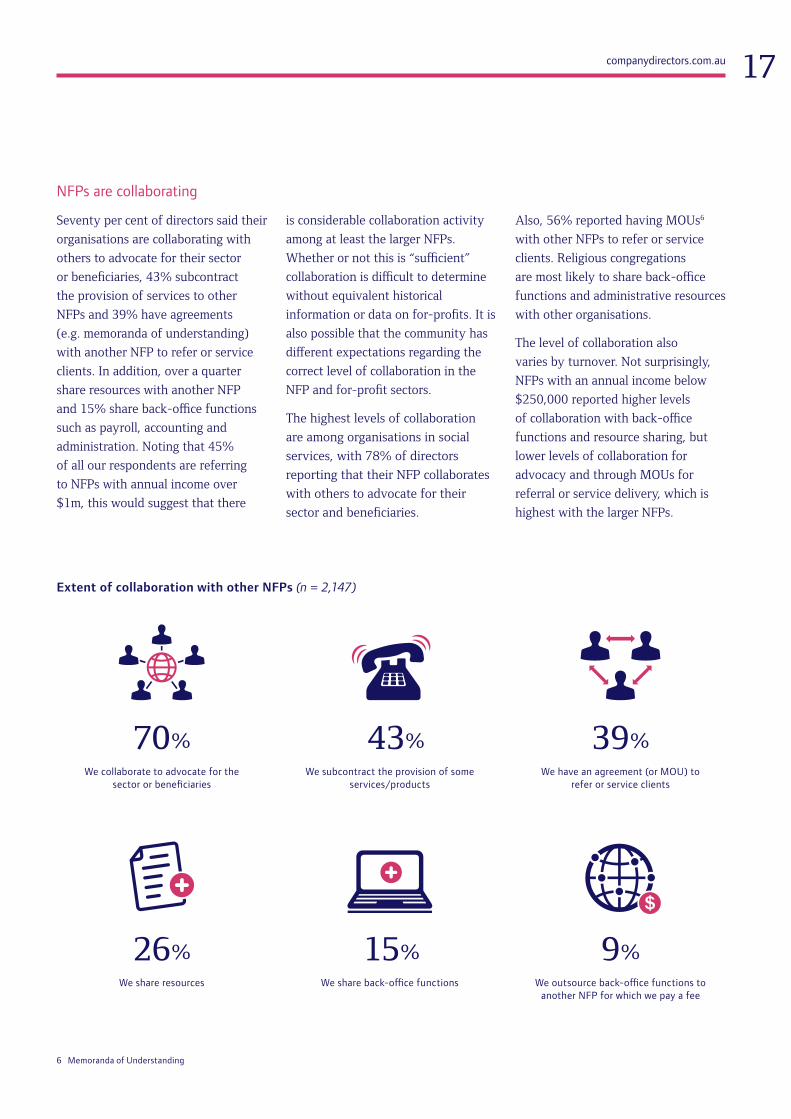
NFPs are collaborating
Seventy per cent of directors said their
organisations are collaborating with
others to advocate for their sector
or beneficiaries, 43% subcontract
the provision of services to other
NFPs and 39% have agreements
(e.g. memoranda of understanding)
with another NFP to refer or service
clients. In addition, over a quarter
share resources with another NFP
and 15% share back-office functions
such as payroll, accounting and
administration. Noting that 45%
of all our respondents are referring
to NFPs with annual income over
$1m, this would suggest that there
is considerable collaboration activity
among at least the larger NFPs.
Whether or not this is “sufficient”
collaboration is difficult to determine
without equivalent historical
information or data on for-profits. It is
also possible that the community has
different expectations regarding the
correct level of collaboration in the
NFP and for-profit sectors.
The highest levels of collaboration
are among organisations in social
services, with 78% of directors
reporting that their NFP collaborates
with others to advocate for their
sector and beneficiaries.
Also, 56% reported having MOUs6
with other NFPs to refer or service
clients. Religious congregations
are most likely to share back-office
functions and administrative resources
with other organisations.
The level of collaboration also
varies by turnover. Not surprisingly,
NFPs with an annual income below
$250,000 reported higher levels
of collaboration with back-office
functions and resource sharing, but
lower levels of collaboration for
advocacy and through MOUs for
referral or service delivery, which is
highest with the larger NFPs.
70%
26%
43%
15%
39%
9%
We collaborate to advocate for the sector or beneficiaries
We share resources
We subcontract the provision of some services/products
We share back-office functions
We have an agreement (or MOU) to refer or service clients
We outsource back-office functions to another NFP for which we pay a fee
Extent of collaboration with other NFPs (n = 2,147)
6 Memoranda of Understanding
2015 NFP GOVERNANCE AND PERFORMANCE STUDY18
Director tips on mergers
The secret to a successful merger
is in recognising that it is not about
ticking off a list of tasks, but in
understanding the purpose for
these tasks and how they apply
in NFP settings.
The following is a compilation of advice from directors responding to
the survey who have recent experience with NFP mergers. It goes beyond
the usual checklist and addresses some of the underlying issues that impact
most mergers.
1. Always recognise that the NFP exists to serve its beneficiaries and your
role and that of the board is to act on their behalf.
2. Ensure you have a very good understanding of the profile of your
beneficiaries and their needs before you start. A merger is not the time
to find out that the board doesn’t fully understand its service users and
broader stakeholders.
3. Recognise that an NFP merger is a multiparty negotiation, but unlike
mergers with for-profits, the beneficiaries are not at the table. To keep
priorities clear and egos in check, constantly remind yourself and others
that the NFP exists to get the best result for beneficiaries, not for itself,
its staff or the board.
4. Check that a merger is the best strategy to achieve your mission. Ensure
that other options have also been fully explored.
5. Develop a clear vision of the end state for the NFP post-merger. This
should focus on how the new entity will deliver better or more services.
“The efficiencies you think you gain, you often don’t.
People often do the numbers and see that they make big
savings by having half the number of CEOs and senior
executives. But unless those people were doing nothing,
that work has to go somewhere.”
Develop a clear vision of the end state for the
NFP post-merger. This should focus on how the
new entity will deliver better or more services.
companydirectors.com.au 19
6. Take stock of your negotiating
assets. What have you got to
“sell” and how skilled are you at
negotiating? Determine what is
your ideal outcome and what are
the deal breakers.
7. Identify several merger candidates
and assess their potential. Seek
to understand the other NFP’s
purpose in a merger and their
best and worst case outcomes.
8. When undertaking the cost-
benefit analysis, accept that even
quantitative assessments and
models are based on judgements
of expected future costs and
gains. Do some savage sensitivity
analysis and don’t proceed if the
gains are not compelling.
9. Conduct due diligence to confirm
the costs, benefits and risks, but
also to assess cultural alignment.
Directors attribute most failures
of mergers to poor cultural fit,
but failure to align is not just the
results of differences but from an
unwillingness to change.
10. Early in the process, define who
will fill each role in the post-
merger board and leadership
team. Despite telling the staff and
board that it is not about them,
uncertainty leads to dysfunction.
11. Change hurts and people often
get angry and resistant. Develop
your integration and change
management timetable and
keep it as short as possible
as the benefits will only be
fully realised when the merger
is complete.
12. Sell the benefits constantly
to all stakeholders. The greater
the genuine improvement for
beneficiaries, the easier this
will be.
13. Accept that a merger will involve
emotional labour. Even
“takeovers” can come with
feelings of guilt, regret, loss and
sadness. Unlike for-profits, NFPs
are rarely established with an
exit strategy in mind and “selling
out” the tangible and intangible
assets built through the hard
work of volunteers and donations
can feel like betrayal.
“A merger is harder
than expected.
Open, continuous
communication
with the other
organisation is key.”
Identify several merger
candidates and assess their
potential. Seek to understand
the other NFP’s purpose in
a merger and their best and
worst case outcomes.
2015 NFP GOVERNANCE AND PERFORMANCE STUDY20
3. NFP directors want a more collaborative relationship with government
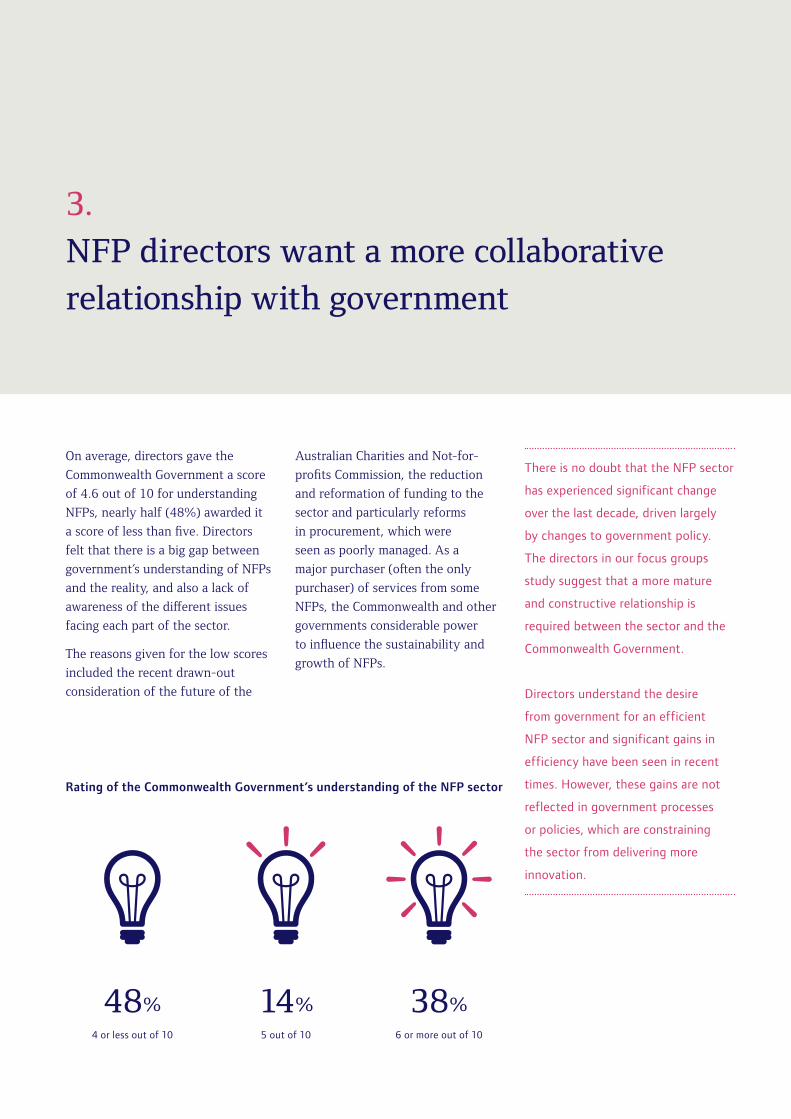
On average, directors gave the
Commonwealth Government a score
of 4.6 out of 10 for understanding
NFPs, nearly half (48%) awarded it
a score of less than five. Directors
felt that there is a big gap between
government’s understanding of NFPs
and the reality, and also a lack of
awareness of the different issues
facing each part of the sector.
The reasons given for the low scores
included the recent drawn-out
consideration of the future of the
Australian Charities and Not-for-
profits Commission, the reduction
and reformation of funding to the
sector and particularly reforms
in procurement, which were
seen as poorly managed. As a
major purchaser (often the only
purchaser) of services from some
NFPs, the Commonwealth and other
governments considerable power
to influence the sustainability and
growth of NFPs.
There is no doubt that the NFP sector
has experienced significant change
over the last decade, driven largely
by changes to government policy.
The directors in our focus groups
study suggest that a more mature
and constructive relationship is
required between the sector and the
Commonwealth Government.
Directors understand the desire
from government for an efficient
NFP sector and significant gains in
efficiency have been seen in recent
times. However, these gains are not
reflected in government processes
or policies, which are constraining
the sector from delivering more
innovation.
Rating of the Commonwealth Government’s understanding of the NFP sector
48% 14% 38%4 or less out of 10 5 out of 10 6 or more out of 10
companydirectors.com.au 21
Creating stability in government policy
Improving government funding and contracting policy with NFPs
Building sector capacity
Creating consistency in Commonwealth and state/territory government reporting requirements
Reducing the administrative burden
Reforming tax arrangements for NFP sector
Harmonising state/territory legislation in regard to fundraising
Reducing the number of NFPs
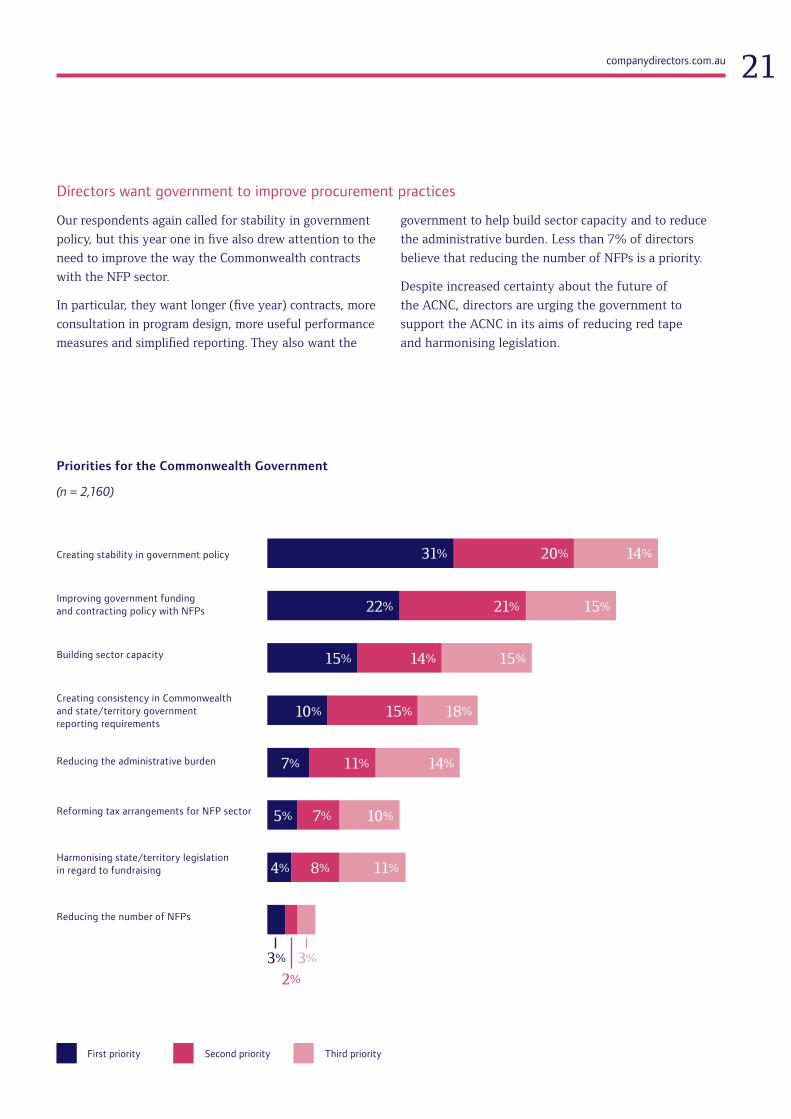
Priorities for the Commonwealth Government
(n = 2,160)
Second priority Third priorityFirst priority
15%
15%
18%
14%
10%
11%
7%
8%
5%
4%
3% 3%
2%
20% 14%
21%
14%
15%
11%7%
31%
22%
15%
10%
Directors want government to improve procurement practices
Our respondents again called for stability in government
policy, but this year one in five also drew attention to the
need to improve the way the Commonwealth contracts
with the NFP sector.
In particular, they want longer (five year) contracts, more
consultation in program design, more useful performance
measures and simplified reporting. They also want the
government to help build sector capacity and to reduce
the administrative burden. Less than 7% of directors
believe that reducing the number of NFPs is a priority.
Despite increased certainty about the future of
the ACNC, directors are urging the government to
support the ACNC in its aims of reducing red tape
and harmonising legislation.
2015 NFP GOVERNANCE AND PERFORMANCE STUDY22
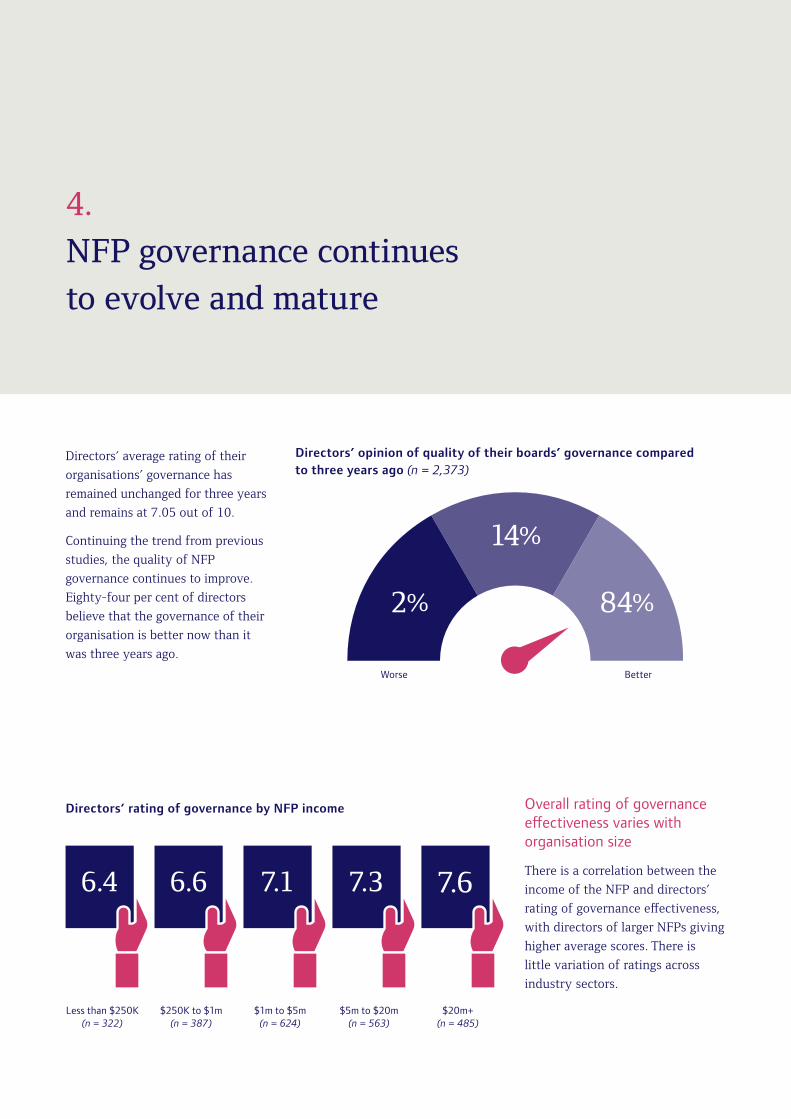
4. NFP governance continues to evolve and mature
Directors’ average rating of their
organisations’ governance has
remained unchanged for three years
and remains at 7.05 out of 10.
Continuing the trend from previous
studies, the quality of NFP
governance continues to improve.
Eighty-four per cent of directors
believe that the governance of their
organisation is better now than it
was three years ago.
Overall rating of governance effectiveness varies with organisation size
There is a correlation between the
income of the NFP and directors’
rating of governance effectiveness,
with directors of larger NFPs giving
higher average scores. There is
little variation of ratings across
industry sectors.
Directors’ opinion of quality of their boards’ governance compared to three years ago (n = 2,373)
Directors’ rating of governance by NFP income
6.4 6.6 7.1 7.3 7.6
Less than $250K (n = 322)
Worse Better
$250K to $1m (n = 387)
$1m to $5m (n = 624)
$5m to $20m (n = 563)
$20m+ (n = 485)
2%
14%
84%
companydirectors.com.au 23
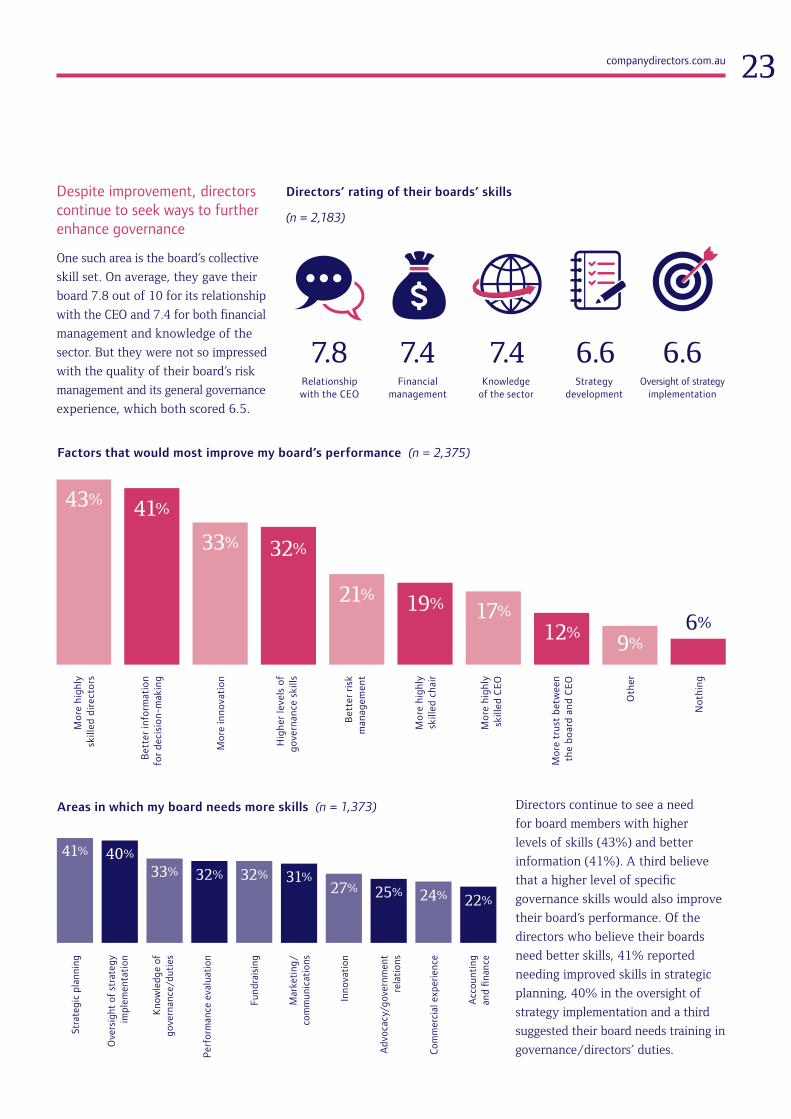
Despite improvement, directors continue to seek ways to further enhance governance
One such area is the board’s collective
skill set. On average, they gave their
board 7.8 out of 10 for its relationship
with the CEO and 7.4 for both financial
management and knowledge of the
sector. But they were not so impressed
with the quality of their board’s risk
management and its general governance
experience, which both scored 6.5.
Directors’ rating of their boards’ skills
(n = 2,183)
Areas in which my board needs more skills (n = 1,373)
Stra
tegi
c pl
anni
ng
Ove
rsig
ht o
f str
ateg
y im
plem
enta
tion
Kno
wle
dge
of
gove
rnan
ce/d
utie
s
Perf
orm
ance
eva
luat
ion
Fund
rais
ing
Mar
ketin
g/co
mm
unic
atio
ns
Inno
vatio
n
Adv
ocac
y/go
vern
men
t re
latio
ns
Com
mer
cial
exp
erie
nce
Acc
ount
ing
and
finan
ce
41% 40%
33% 32% 32% 31%27% 25% 24% 22%
Factors that would most improve my board’s performance (n = 2,375)
Directors continue to see a need
for board members with higher
levels of skills (43%) and better
information (41%). A third believe
that a higher level of specific
governance skills would also improve
their board’s performance. Of the
directors who believe their boards
need better skills, 41% reported
needing improved skills in strategic
planning, 40% in the oversight of
strategy implementation and a third
suggested their board needs training in
governance/directors’ duties.
Relationship with the CEO
Financial management
Knowledge of the sector
Strategy development
Oversight of strategy implementation
7.8 7.4 7.4 6.6 6.6
Mor
e hi
ghly
sk
illed
dire
ctor
s
Bet
ter i
nfor
mat
ion
for d
ecis
ion-
mak
ing
Mor
e in
nova
tion
Hig
her l
evel
s of
go
vern
ance
ski
lls
Bet
ter r
isk
man
agem
ent
Mor
e hi
ghly
sk
illed
cha
ir
Mor
e hi
ghly
sk
illed
CEO
Mor
e tr
ust
betw
een
the
boar
d an
d CE
O
Oth
er
Not
hing
43% 41%
33% 32%
21% 19% 17%
12%9%
6%
2015 NFP GOVERNANCE AND PERFORMANCE STUDY24
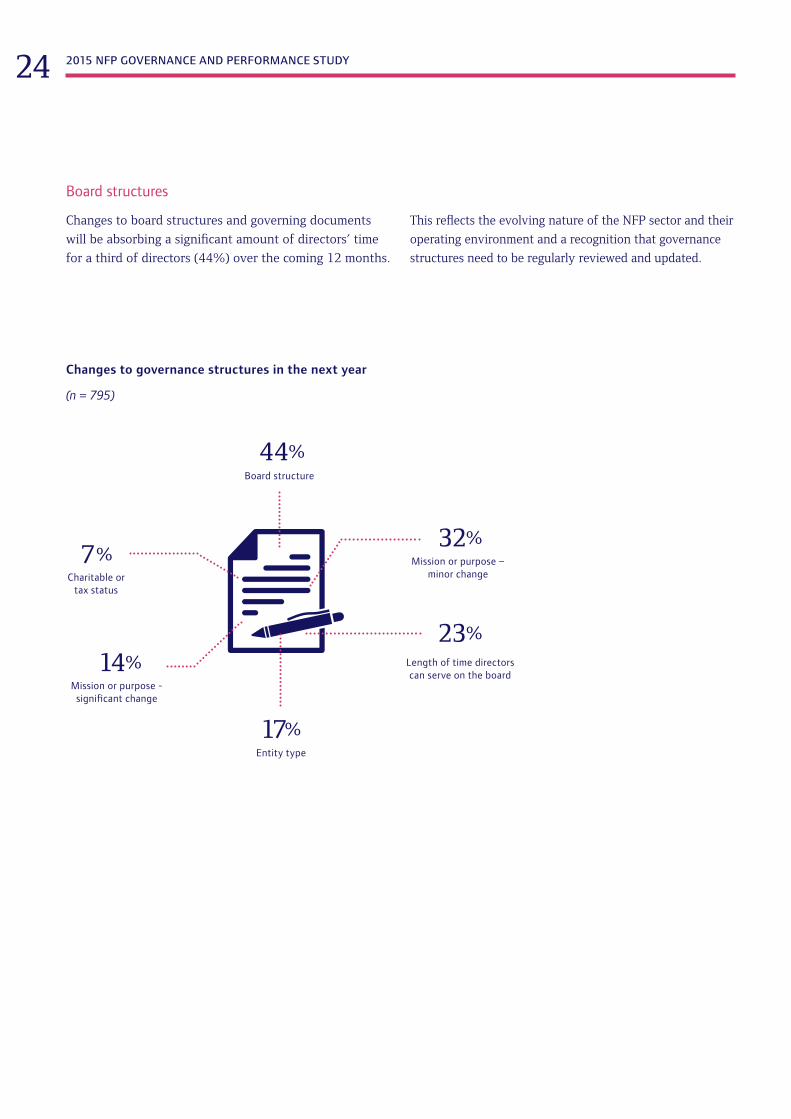
Board structures
Changes to board structures and governing documents
will be absorbing a significant amount of directors’ time
for a third of directors (44%) over the coming 12 months.
This reflects the evolving nature of the NFP sector and their
operating environment and a recognition that governance
structures need to be regularly reviewed and updated.
Changes to governance structures in the next year
(n = 795)
32%Mission or purpose –
minor change
14%Mission or purpose - significant change
23%
Length of time directors can serve on the board
Entity type
44%Board structure
17%
7%Charitable or
tax status
companydirectors.com.au 25
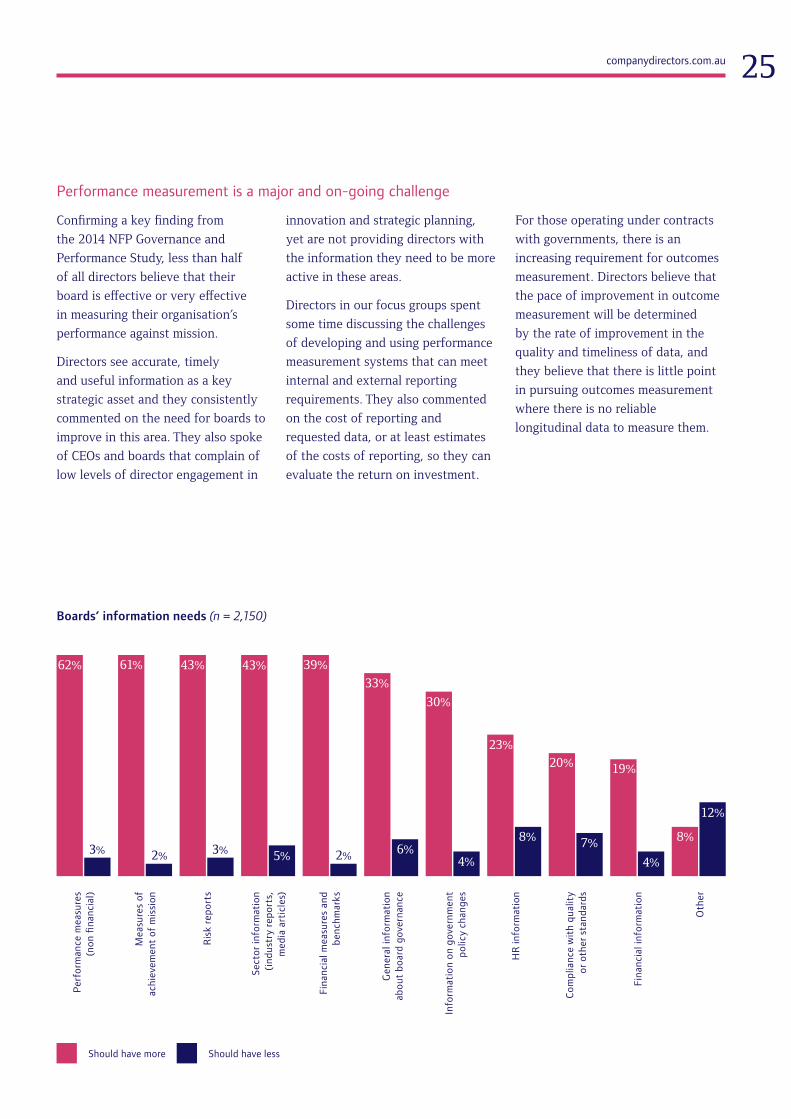
Performance measurement is a major and on-going challenge
Confirming a key finding from
the 2014 NFP Governance and
Performance Study, less than half
of all directors believe that their
board is effective or very effective
in measuring their organisation’s
performance against mission.
Directors see accurate, timely
and useful information as a key
strategic asset and they consistently
commented on the need for boards to
improve in this area. They also spoke
of CEOs and boards that complain of
low levels of director engagement in
innovation and strategic planning,
yet are not providing directors with
the information they need to be more
active in these areas.
Directors in our focus groups spent
some time discussing the challenges
of developing and using performance
measurement systems that can meet
internal and external reporting
requirements. They also commented
on the cost of reporting and
requested data, or at least estimates
of the costs of reporting, so they can
evaluate the return on investment.
For those operating under contracts
with governments, there is an
increasing requirement for outcomes
measurement. Directors believe that
the pace of improvement in outcome
measurement will be determined
by the rate of improvement in the
quality and timeliness of data, and
they believe that there is little point
in pursuing outcomes measurement
where there is no reliable
longitudinal data to measure them.
Perf
orm
ance
mea
sure
s (n
on fi
nanc
ial)
Mea
sure
s of
ac
hiev
emen
t of
mis
sion
Ris
k re
port
s
Sect
or in
form
atio
n (i
ndus
try
repo
rts,
m
edia
art
icle
s)
Fina
ncia
l mea
sure
s an
d be
nchm
arks
Gen
eral
info
rmat
ion
abou
t bo
ard
gove
rnan
ce
Info
rmat
ion
on g
over
nmen
t po
licy
chan
ges
HR
info
rmat
ion
Com
plia
nce
wit
h qu
alit
y or
oth
er s
tand
ards
Fina
ncia
l inf
orm
atio
n
Oth
er
62% 61% 43% 43% 39%
33%
30%
23%
20%
8%
2% 2%3%3% 5% 4%6%
4%
12%
7%
19%
8%
Boards’ information needs (n = 2,150)
Should have lessShould have more
2015 NFP GOVERNANCE AND PERFORMANCE STUDY26
5. NFP boards are leading diversity
Conversations about board diversity
generate hot debate. This year, we
deepened the discussion to separate
rhetoric from practice and extended it
to discuss age and cultural diversity.
Our findings show that NFP directors
are leading the conversation on the
role and benefit of diversity in the
boardroom. Thoughtful engagement
with the challenge of representation
and a continuing focus on gender
and cultural diversity emerged as
key themes.
Key findings
Overall, NFP boards
have better gender
diversity
38% of NFP directors responding to our survey are
women, and 60% of these are confident their board
composition broadly reflects the gender balance of
stakeholders.
But there is still work
to do…
Over a third of NFP directors believe that their boards
are under-representative of women – and our findings
on director fees show significant disparity between
fees earned by men and women.
More cultural
diversity is needed…
Over half of respondents feel that their board
is under or over-represented in particular cultural
groups, with more than 70% of these noting
a dominance of “white, Anglo-Saxon” directors.
Directors are
looking for the ‘next
generation’ of board
members for NFPs…
While the importance of balancing age diversity
with experience and skills was noted, over half felt
that their own boards were under-representative of
directors aged 30 to 40 years. The average age of
respondents to this survey was 56 years with less
than 5% aged below 40.
Diversity is seen
as a continuing
challenge…
NFP boards are engaged and considered in their
review of diversity issues and consideration of board
composition.
“We are
over-represented
in board members
with Anglo-Saxon
backgrounds.
We have no other
racial or cultural
background
on our board.”
companydirectors.com.au 27
Diversity compared to what?
In group discussions it was clear that
directors’ views on diversity reflect
their personal values, judgements
regarding societal values (i.e. what
we should be working toward as a
society), and the practical (i.e. what
will work for our board). In many
cases they found these aspects
difficult to align.
Importantly, there are also differences
of opinion on a key question –
“compared to what?” It is generally
agreed that the skills of the board
need to be diverse and should reflect
the needs of the organisation at
that point in time. However, when
it comes to board demography,
directors’ views of whether their
board has a suitable cross-section
of directors depends on whether
they compare their board with
other boards, to the potential pool
of directors, to a benchmark or
quota, to the Australian population,
or to specific populations, such
as stakeholders.
Diversity as a reflection of key stakeholders
This year, our survey asked directors to compare their board’s composition
with the last of these, the demography of their stakeholders, including service
users, staff and funders. Specifically, they were asked to state whether their
board profile is generally reflective of their NFP’s stakeholders, or under- or
over-represented in the areas of gender, age and cultural background. This is
not an easy question. For example, a single-sex school or club may have all
female students or members, mostly female staff, but parents and volunteers
of both genders.
Cultural backgrounds and age can also be similarly mixed across stakeholders,
so considering the demography of the board in regard to its stakeholders is
not an easy task. There are also boards that are dominated by a single gender,
cultural background or narrow age range, which is totally appropriate given
the organisation’s focus. Examples include men’s sheds, health services for
women, Indigenous organisations and faith-based NFPs.
Directors in our groups made it clear that they were not expecting boards
to be perfectly reflective of the demography of stakeholders, but rather that
boards should be concerned where or when the profile is drawn from
a narrow segment of the community.
“We need more
representation
of Indigenous
communities and
other cultural
groups.”
“I can’t see any
benefit in reflecting
stakeholders in
board composition,
especially when
you consider who
our stakeholders
are, where they
are located and
their skill sets.”
Not all directors believe boards should
be more diverse
2015 NFP GOVERNANCE AND PERFORMANCE STUDY28
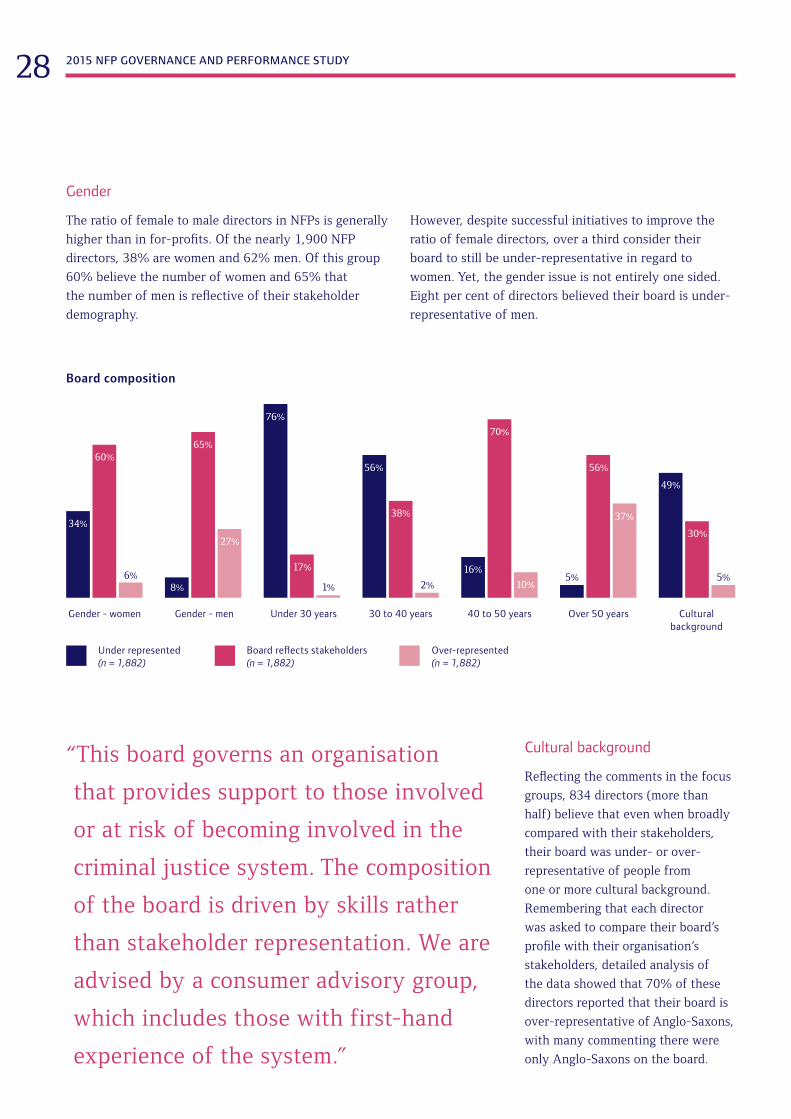
Gender - women Gender - men Under 30 years 30 to 40 years 40 to 50 years Over 50 years Cultural background
60%
8%
65%
27%
76%
17%
56%
38%
16%
10%
56%
37%
49%
30%
70%
34%
1% 2%5% 5%6%
Board composition
Board reflects stakeholders (n = 1,882)
Over-represented (n = 1,882)
Under represented (n = 1,882)
Gender
The ratio of female to male directors in NFPs is generally
higher than in for-profits. Of the nearly 1,900 NFP
directors, 38% are women and 62% men. Of this group
60% believe the number of women and 65% that
the number of men is reflective of their stakeholder
demography.
However, despite successful initiatives to improve the
ratio of female directors, over a third consider their
board to still be under-representative in regard to
women. Yet, the gender issue is not entirely one sided.
Eight per cent of directors believed their board is under-
representative of men.
“This board governs an organisation
that provides support to those involved
or at risk of becoming involved in the
criminal justice system. The composition
of the board is driven by skills rather
than stakeholder representation. We are
advised by a consumer advisory group,
which includes those with first-hand
experience of the system.”
Cultural background
Reflecting the comments in the focus
groups, 834 directors (more than
half) believe that even when broadly
compared with their stakeholders,
their board was under- or over-
representative of people from
one or more cultural background.
Remembering that each director
was asked to compare their board’s
profile with their organisation’s
stakeholders, detailed analysis of
the data showed that 70% of these
directors reported that their board is
over-representative of Anglo-Saxons,
with many commenting there were
only Anglo-Saxons on the board.
companydirectors.com.au 29
Thirty-six percent reported that their board was under-representative of (or
had no) Indigenous people and 12% that they had few or no people from
Asian backgrounds. Others specifically mentioned that their boards did
not include people with direct or indirect experience of their organisation’s
beneficiary groups, such as those with disabilities or ill health, or from
certain nationalities.
Age
The average age of directors in this year’s study is 56 years, and less than
5% were under the age of 40. Of these directors, three-quarters stated that
their board was under-represented in regard to people under 30 years, and
more than half said it was under-representative of those between 30 and 40
years. Correspondingly, over a third of directors said their board was over-
representative of those over 50 years.
However, directors said judgements about the right level of representation
are more difficult when it comes to age. Boards need people with significant
professional and business skills that can only be gained after many years
of work and life experience. They also commented, that, unlike gender and
cultural background, older board members did have experience of being
young. Nonetheless, the need to broaden the age range of directors was a
pressing issue for many as they saw a need to develop the next generation
of board members and to ensure that their board was in tune with the
requirements of its members or service recipients.
Challenges and alternatives
Directors reported that building
a board with a diverse profile is a
constant challenge. For boards with
six to eight members, the addition
or loss of one or two members can
quickly shift the profile from diverse
and reflective of stakeholders to
homogeneous. Similarly, it can be
difficult to find the right skills, let
alone the perfect combination of skills
in individuals from particular cultural
backgrounds, age groups and gender.
Directors said they would choose the
best person for the role, rather than
turn down a good candidate because
of his or her personal characteristics.
For those on representative boards,
including boards of federated
organisations, directors have little to
no influence on who is appointed to
the board. Directors mentioned that
one of the ways they address this is
to establish advisory groups, client
liaison groups or other committees
to ensure they have access to the
views of members and beneficiaries.
Several with a younger client base or
staff profile mentioned that they had
established youth advisory boards or
junior boards.
2015 NFP GOVERNANCE AND PERFORMANCE STUDY30
6. Directors’ contribution: donating money and time?
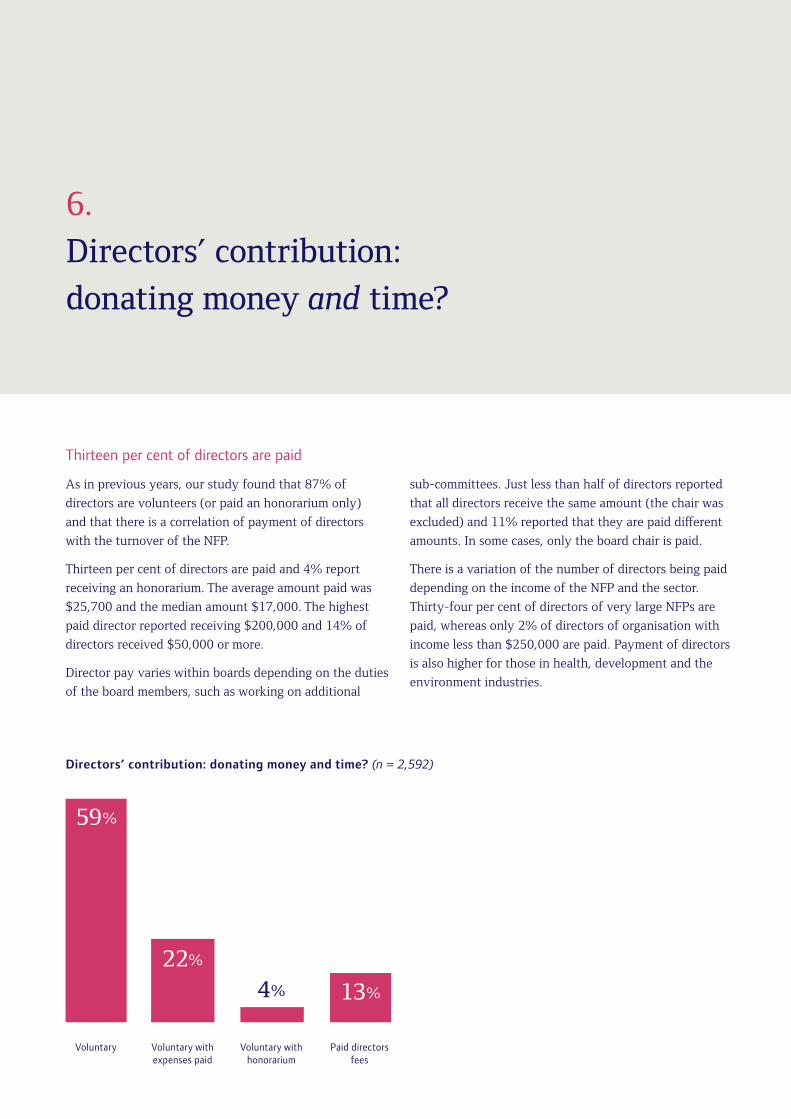
Thirteen per cent of directors are paid
As in previous years, our study found that 87% of
directors are volunteers (or paid an honorarium only)
and that there is a correlation of payment of directors
with the turnover of the NFP.
Thirteen per cent of directors are paid and 4% report
receiving an honorarium. The average amount paid was
$25,700 and the median amount $17,000. The highest
paid director reported receiving $200,000 and 14% of
directors received $50,000 or more.
Director pay varies within boards depending on the duties
of the board members, such as working on additional
sub-committees. Just less than half of directors reported
that all directors receive the same amount (the chair was
excluded) and 11% reported that they are paid different
amounts. In some cases, only the board chair is paid.
There is a variation of the number of directors being paid
depending on the income of the NFP and the sector.
Thirty-four per cent of directors of very large NFPs are
paid, whereas only 2% of directors of organisation with
income less than $250,000 are paid. Payment of directors
is also higher for those in health, development and the
environment industries.
Directors’ contribution: donating money and time? (n = 2,592)
Voluntary Voluntary with expenses paid
Voluntary with honorarium
Paid directors fees
59%
22%
4% 13%
companydirectors.com.au 31
Many directors are both volunteering and donating money
This year we asked the volunteer
directors if they also made donations
to the organisations for which
they were directors. In addition to
giving their time, 39% of directors
made donations and 19% made a
donation of $1,000 or more to the
organisation. The median amount
donated was $1,000 and the largest
reported donation was $110,000.
In total, in addition to their time,
889 directors donated $2.1m in
2014-15 financial year. There is some
correlation between rates of donation
and organisation income, with higher
rates of donation to organisations
with lower income.
The number of hours contributed remains high
Directors’ contributions to NFP
governance continues to be
significant. On average, directors
responding to the survey have 1.6
directorships and spend 24 hours per
month working in directorship roles.
There are differences between the director fees paid for male and female directors
When analysed by gender, the data shows differences
between the ratio of men and women who are paid
and the average amounts paid. Thirteen per cent of
male directors are paid compared with 10.8% of female
directors, and male directors receive an average of
$26,800 and female directors $22,000. This difference
is higher for the top-ten paid directors, with the top-ten
men being paid an average of $123,000 and the top-ten
women $69,550. This differentiation is difficult to explain
and is not accounted for by differences in the size or sector
of NFPs, so further research is required. It is unlikely that
men and women on the same board are paid differently,
so the results may suggest an aggregation effect or that
more men sit on additional sub-committees or are board
chairs. This is the second year the research has shown a
difference in average pay of male and female directors.
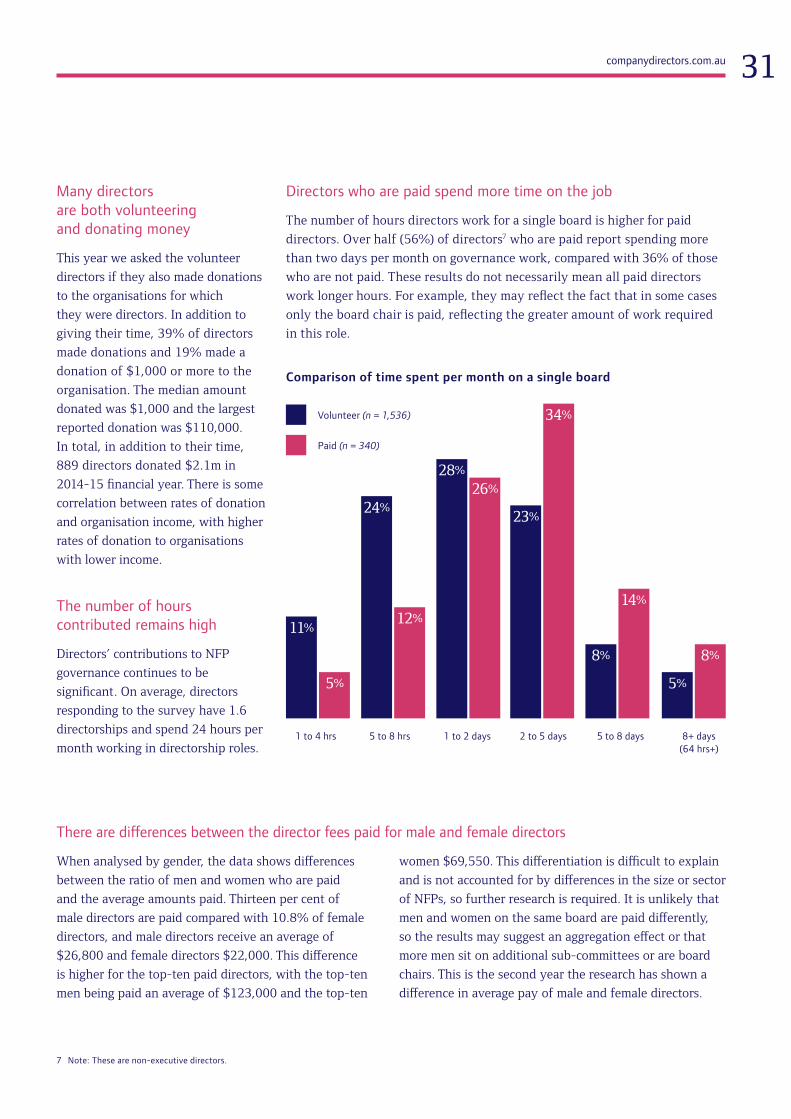
Directors who are paid spend more time on the job
The number of hours directors work for a single board is higher for paid
directors. Over half (56%) of directors7 who are paid report spending more
than two days per month on governance work, compared with 36% of those
who are not paid. These results do not necessarily mean all paid directors
work longer hours. For example, they may reflect the fact that in some cases
only the board chair is paid, reflecting the greater amount of work required
in this role.
Comparison of time spent per month on a single board
7 Note: These are non-executive directors.
1 to 4 hrs 5 to 8 hrs 1 to 2 days 2 to 5 days 5 to 8 days 8+ days (64 hrs+)
11%
5%
24%
12%
28%
26%
23%
34%
8%
14%
5%
8%
Paid (n = 340)
Volunteer (n = 1,536)
2015 NFP GOVERNANCE AND PERFORMANCE STUDY32
7. Culture and the arts – balancing on a tightrope
NFPs in the culture and the arts
sub-sector comprise a broad range of
organisations from neighbourhood
art galleries and ensembles, to some
of the largest cultural organisations
in Australia. Despite the size and
contribution of this sector, there
is very little accurate information
relating to these NFPs, their activities
or their funding.
There is also very little up-to-date
information on the source of income
for NFPs in this sector. For most,
the majority of their income is from
customers, but corporate and private
donations and Commonwealth,
state and local governments are also
significant contributors and, for some,
their dominant source of income8.
It’s all about income
Building and diversifying income is a key priority for all NFP directors, but
even more so with directors of culture and arts organisations. For this group,
it was by far the toughest issue they face.
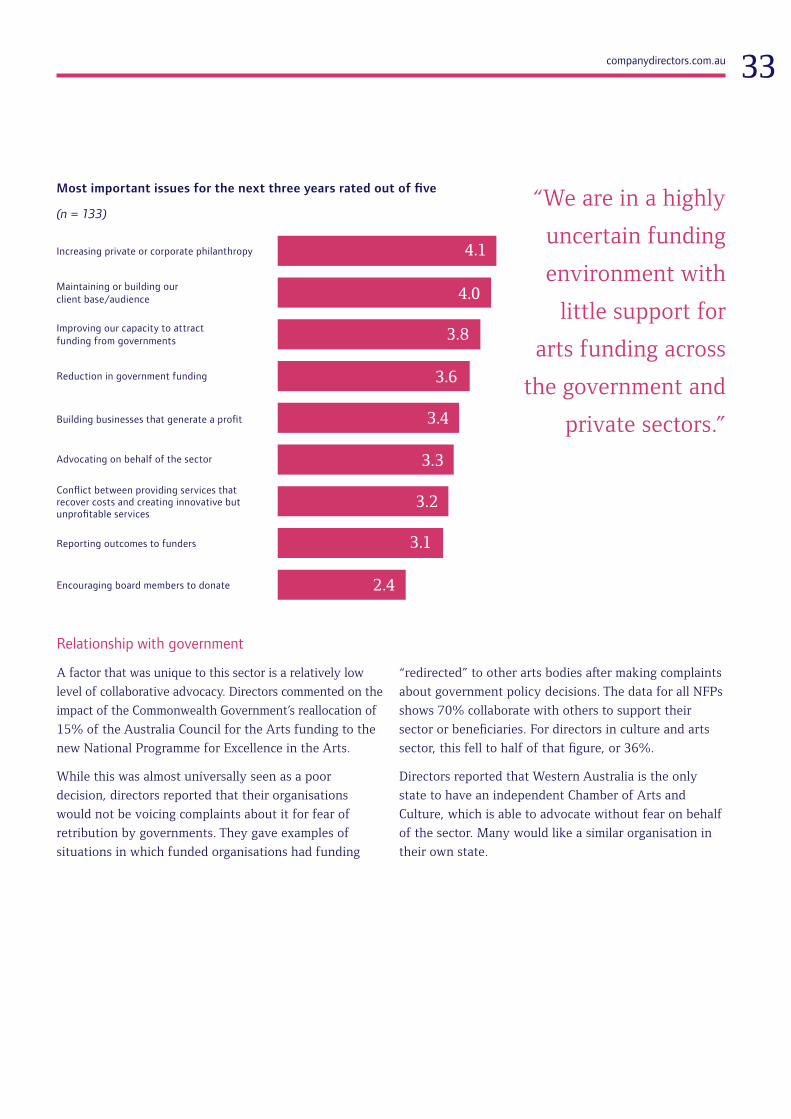
Directors in the sector were asked to rate the most important issues affecting
their organisation, and four out of the five top issues nominated were income
related. For several, the economic slowdown and a reduction in public sector
funding had prompted significant changes and innovative approaches to
income generation.
Sixty-three percent of directors from this group that said their board needed
more skills nominated “fund raising” as the most important skill for directors,
with strategic planning second at 40%. Although many are seeking alternative
funding sources, directors noted that funding providers or sources of income
each have unique requirements and changing funding sources creates new
obligations for organisations.
In some cases, the challenges for funding and governance varied depending
on how the entity came into being. Unlike most other NFPs, some arts
organisations arose from “one off” events run by a few volunteers to become
large-scale annual productions and they faced challenges that come with rapid
growth, particularly in governance and funding.
This year our study included in-depth
research into culture and arts NFPs.
We conducted two focus groups with
directors in this sector and included
additional questions to the survey.
8 Building Support: Report of the Review of Private Sector Support of the Arts in Australia, 2011
companydirectors.com.au 33
“We are in a highly
uncertain funding
environment with
little support for
arts funding across
the government and
private sectors.”
4.1
4.0
3.8
3.6
3.4
3.3
3.2
3.1
2.4Encouraging board members to donate
Reporting outcomes to funders
Conflict between providing services that recover costs and creating innovative but unprofitable services
Advocating on behalf of the sector
Building businesses that generate a profit
Reduction in government funding
Improving our capacity to attract funding from governments
Maintaining or building our client base/audience
Increasing private or corporate philanthropy
Most important issues for the next three years rated out of five
(n = 133)
Relationship with government
A factor that was unique to this sector is a relatively low
level of collaborative advocacy. Directors commented on the
impact of the Commonwealth Government’s reallocation of
15% of the Australia Council for the Arts funding to the
new National Programme for Excellence in the Arts.
While this was almost universally seen as a poor
decision, directors reported that their organisations
would not be voicing complaints about it for fear of
retribution by governments. They gave examples of
situations in which funded organisations had funding
“redirected” to other arts bodies after making complaints
about government policy decisions. The data for all NFPs
shows 70% collaborate with others to support their
sector or beneficiaries. For directors in culture and arts
sector, this fell to half of that figure, or 36%.
Directors reported that Western Australia is the only
state to have an independent Chamber of Arts and
Culture, which is able to advocate without fear on behalf
of the sector. Many would like a similar organisation in
their own state.
2015 NFP GOVERNANCE AND PERFORMANCE STUDY34
“Give, get or get off”
The expectations of directors’ contribution to culture
and arts organisations were also significantly different
to most other industries. There was a much greater
expectation that directors would volunteer their skills,
donate, and raise donations from their contacts.
Only 4% of directors for these organisations report being
paid, compared with the average of 13% for all directors.
Furthermore, 64% of directors in the culture and arts
sector made a donation to their organisation, compared
with 39% of all directors. The amount donated varied
from $100 to $50,000 and the median donation was
$1,000. In one of our focus groups there was an in-depth
conversation on the pros and cons of the “American
system” of governance in the arts, in which the boards
consist of 30 or more members who are generally
expected to donate and raise funds. Typically, these
boards have a sub-group of the board (6 - 8 members)
who make the decisions.
Those with experience of these structures were very keen
to see them introduced in Australia, but there was also
comments from directors who preferred to see fundraising
and governance separated. The culture and the arts sector
was seen as more vulnerable than others to influence
by funders, and they noted the potential for funders to
promote or insist on certain types of arts being pursued.
Other issues
Reports of mergers were lower for
this sector. Only 15% of boards
have discussed a merger and 2%
are currently undertaking a merger,
compared with 33% and 7% for the
NFP sector as a whole.
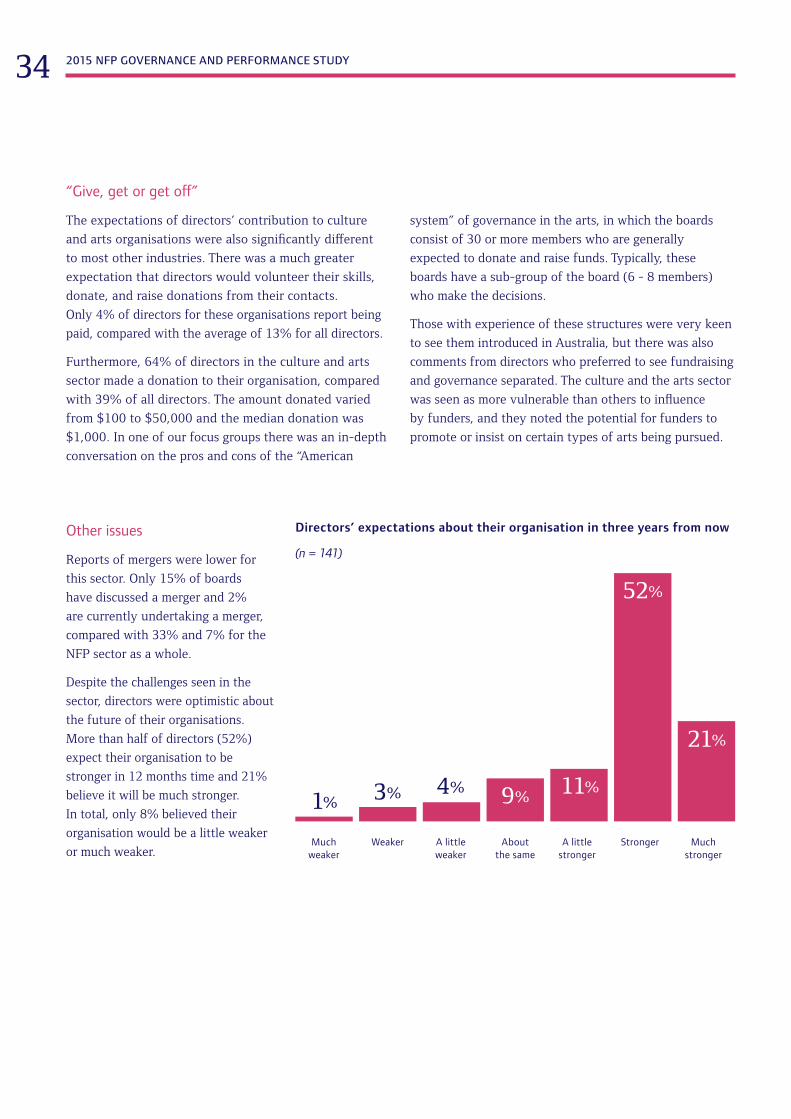
Despite the challenges seen in the
sector, directors were optimistic about
the future of their organisations.
More than half of directors (52%)
expect their organisation to be
stronger in 12 months time and 21%
believe it will be much stronger.
In total, only 8% believed their
organisation would be a little weaker
or much weaker.
Directors’ expectations about their organisation in three years from now
(n = 141)
Much weaker
Weaker A little weaker
About the same
A little stronger
Stronger Much stronger
52%
21%
11%9%4%3%1%
companydirectors.com.au 35
8. Federated organisations – full of complexities
The survey asked: “Does this NFP form part of a formal federated structure
of similar organisations – either as a peak body or member? A federated
structure is a formal network of organisations that can include a mixture
of national, state and local organisations that are individually incorporated
and autonomous but work together for a common purpose.”
In seeking to explore federated structures, we recognised that there may
be confusion as to what defined a federation. In Australia, federated structures
typically have state, territory and national organisations as part of the
federation, although the federation can be broader.
Many federations work very effectively, while others have found that the
structure inhibits their achievement of the overarching purpose and have
moved to unitary structures.
“State peak body
of federated
associations that
also has a national
peak body.”
“One of a number
of member
organisations
owned by
a religious
congregation.”
“This NFP is global,
it has 50 member
nations.”
Key issues
Federations are complex with
dynamic relationships and, directors
noted that one of the key challenges
is to deal with changes in these
relationships over time. The stability
and utility of the federation is
affected by changes in its operating
environment, such as a need to shift
from dealing with state governments
to advocating at a national level.
It is also influenced by internal
changes, including the balance of
resources or power of individual
members. Essentially, it is in balance
when all members need each other.
If one member believes it is stronger
on its own, or if the peak body feels
it takes too much control, then the
dynamics become unbalanced and the
federation fails to achieve its goals.
There are many different forms
of federation
2015 NFP GOVERNANCE AND PERFORMANCE STUDY36
Director tips on federated structures
Directors who were involved in federated structures gave a range of suggestions on how to make such structures work
effectively. These suggestions ranged from relatively simple to more complex issues, and many with a theme around
good collaboration and communication:
• Ensure that the missions of the member organisations
are aligned and be vigilant for those that may be
taking a new direction. If a member chooses a new
direction, the federation may use the opportunity to
update its own mission and follow, or it may be more
beneficial for the member to leave.
• Clearly define the roles of the member organisations
and the peak body. Federations are distributed
leadership models and all stakeholders need to be clear
about which decisions will be made by whom.
• Ensure the model of resource distribution is clear
and aligned with performance measures. Establish
well-defined and agreed timetables, and a process for
reviewing resource allocations.
• Take a formal approach to planning and implementing
conflict resolution.
• Identify the areas in which economies of scale can be
achieved and then encourage specialisation. Be aware
of the tendency for member organisations to take
back local operations and thereby reduce efficiencies.
Establish clear service agreements and accountability.
“I spend a lot of my
time just trying to keep
the organisation stable and
on track, and keep people
focused on what we
are there to achieve and
not on the politics.”
Take a formal approach to planning and
implementing conflict resolution.

companydirectors.com.au 37
“...the arms and the legs create the head, but then
the head feels like it doesn’t need the arms and legs and takes
off on its own, and then realises it doesn’t have the arms and
legs to do anything. Or sometimes the arms chop off the head
and then no one knows which way to go.”
• Ensure a culture of open
communication, respect and
collaboration is embodied in the
values of the federation and role
modelled by the boards and senior
leadership of all organisations.
• Actively build skills in collaboration
at all levels of the organisations.
• Focus on internal communications
so that all members and the
peak body see the work of each
participant and focus on building
skills in collaboration.
• Allow for local differences and have
realistic expectations of consistency
of implementation at the front line.
• Decentralise decisions, where
possible, to allow management
and staff in member organisations
to feel personally responsible for
outcomes achieved.
Despite the ambiguities surrounding
federated structures, they are a key
component of the NFP landscape,
with further research warranted.
Actively build skills in collaboration
at all levels of the organisations.
2015 NFP GOVERNANCE AND PERFORMANCE STUDY38
The research method and sample
Research method
The 2015 study involved:
• Ten focus groups conducted with
a total of over 60 directors in Perth,
Launceston, Hobart, Melbourne,
Canberra and Sydney. Three
discussed general governance issues,
three discussed governance in the
culture and the arts sector, two
discussed mergers, two discussed
governance of organisations forming
part of a federation.
• An online survey emailed to over
30,000 members during July 2015.
The survey sample
The profile of respondents to the
2015 study was very similar to that
of the 2014 and 2013 studies.
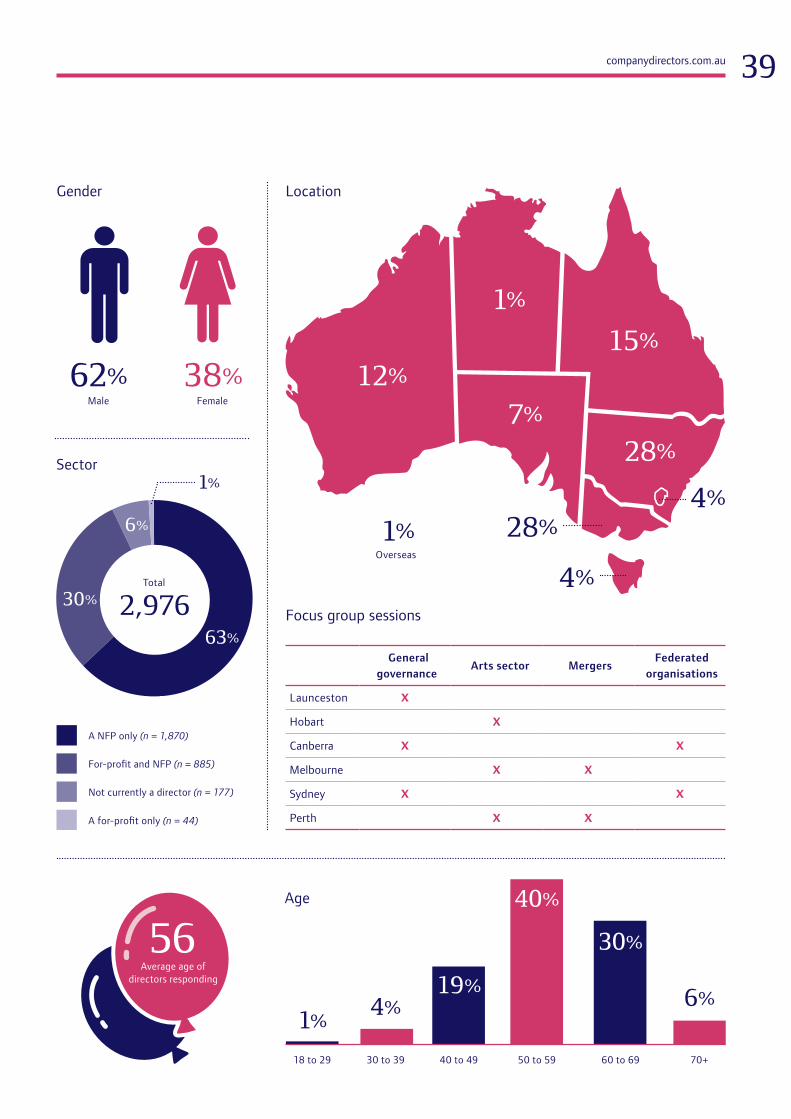
A total of 2,976 people responded
to the survey. Of these, 2,755
were current non-executive
directors of NFPs.
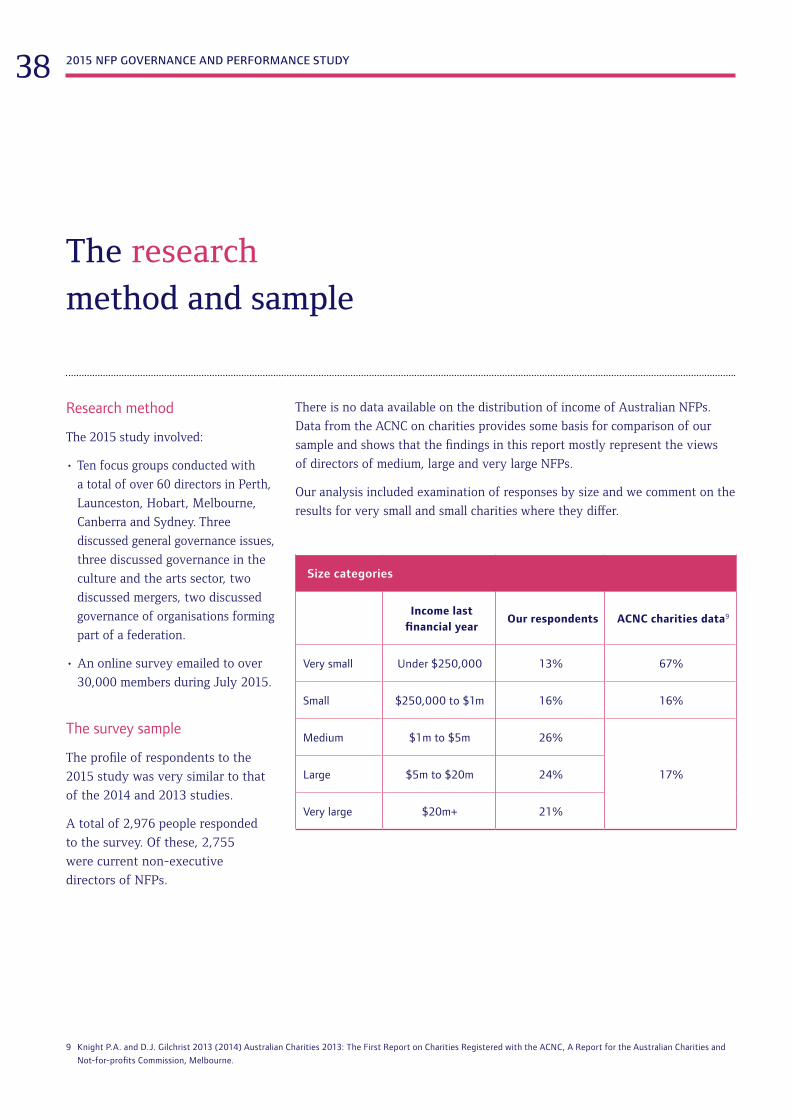
There is no data available on the distribution of income of Australian NFPs.
Data from the ACNC on charities provides some basis for comparison of our
sample and shows that the findings in this report mostly represent the views
of directors of medium, large and very large NFPs.
Our analysis included examination of responses by size and we comment on the
results for very small and small charities where they differ.
Size categories
Income last financial year
Our respondents ACNC charities data9
Very small Under $250,000 13% 67%
Small $250,000 to $1m 16% 16%
Medium $1m to $5m 26%
17%Large $5m to $20m 24%
Very large $20m+ 21%
9 Knight P.A. and D.J. Gilchrist 2013 (2014) Australian Charities 2013: The First Report on Charities Registered with the ACNC, A Report for the Australian Charities and Not-for-profits Commission, Melbourne.
companydirectors.com.au 39
For-profit and NFP (n = 885)
A for-profit only (n = 44)
A NFP only (n = 1,870)
18 to 29 30 to 39 40 to 49 50 to 59 60 to 69 70+
Male
Total
Average age of directors responding
Female
Overseas
38%62%
2,976
12%
1%
15%
7%
28%
4%
28%1%
4%
1%4%
19%
40%
30%
6%
30%
1%
63%
6%
General governance
Arts sector MergersFederated
organisations
Launceston X
Hobart X
Canberra X X
Melbourne X X
Sydney X X
Perth X X
56
Not currently a director (n = 177)
Gender Location
Focus group sessions
Age
Sector
2015 NFP GOVERNANCE AND PERFORMANCE STUDY40
About us
The Australian Institute of Company Directors is committed to excellence in
governance. We make a positive impact on society and the economy through
governance education, director development and advocacy. Our membership
of more than 37,000 includes directors and senior leaders from business,
government and the not-for-profit sectors.
We have more than 1,300 members based offshore, in countries including
China, Singapore, Hong Kong, Indonesia, the United States, the United
Kingdom and the United Arab Emirates.
Our principal activities include conducting professional development programs
and events that build the capability of organisations, boards, directors and
executives; producing publications on director and governance issues; and
developing and promoting policies on issues of interest to directors. Our
Governance Leadership Centre is a think tank for world-class governance,
committed to driving innovation across governance and leadership and
championing the latest thinking on issues affecting Australia’s businesses.
We are a founding member of the Global Network of Director Institutes (GNDI),
which is comprised of membership organisations for directors from Australia,
the UK, US, Canada, Malaysia, New Zealand, Brazil and South Africa.
General enquiriest: 1300 739 119 e: [email protected]
National OfficeLevel 30, 20 Bond Street Sydney NSW 2000t: 02 8248 6600 f: 02 8248 6633 e: [email protected]
BaxterLawley1/52 Victoria Avenue Claremont WA 6010
Penny Knight t: 08 9384 3366 e: [email protected]

companydirectors.com.au 41

Disclaimer © Copyright in this material (Material) is strictly reserved. Any disputes arising out of the Material are subject to the laws of the state of New
South Wales, Australia. No part of the Material covered by copyright should be copied or reproduced in any form or by any means without the written
permission of the Australian Institute of Company Directors. The Australian Institute of Company Directors endeavours to contact copyright holders and
request permission to reproduce all copyright Material. Where the Australian Institute of Company Directors has been unable to trace or contact copyright
holders, if notified, the Australian Institute of Company Directors will ensure full acknowledgment of the use of copyright Material.
The Material has been prepared for information purposes only and is not intended to embody any professional or legal standard. The Material does not
constitute legal, accounting or other professional advice. While all reasonable care has been taken in its preparation, neither the Australian Institute
of Company Directors nor any contributor makes any express or implied representations or warranties as to the completeness, currency, reliability or
accuracy of the Material. The Material should not be used or relied upon as a substitute for professional advice or as a basis for formulating business
decisions. To the extent permitted by law, both the Australian Institute of Company Directors and all contributors exclude all liability for any loss or
damage arising out of the Material.
© 2015 Australian Institute of Company Directors
0514
5-1_
15

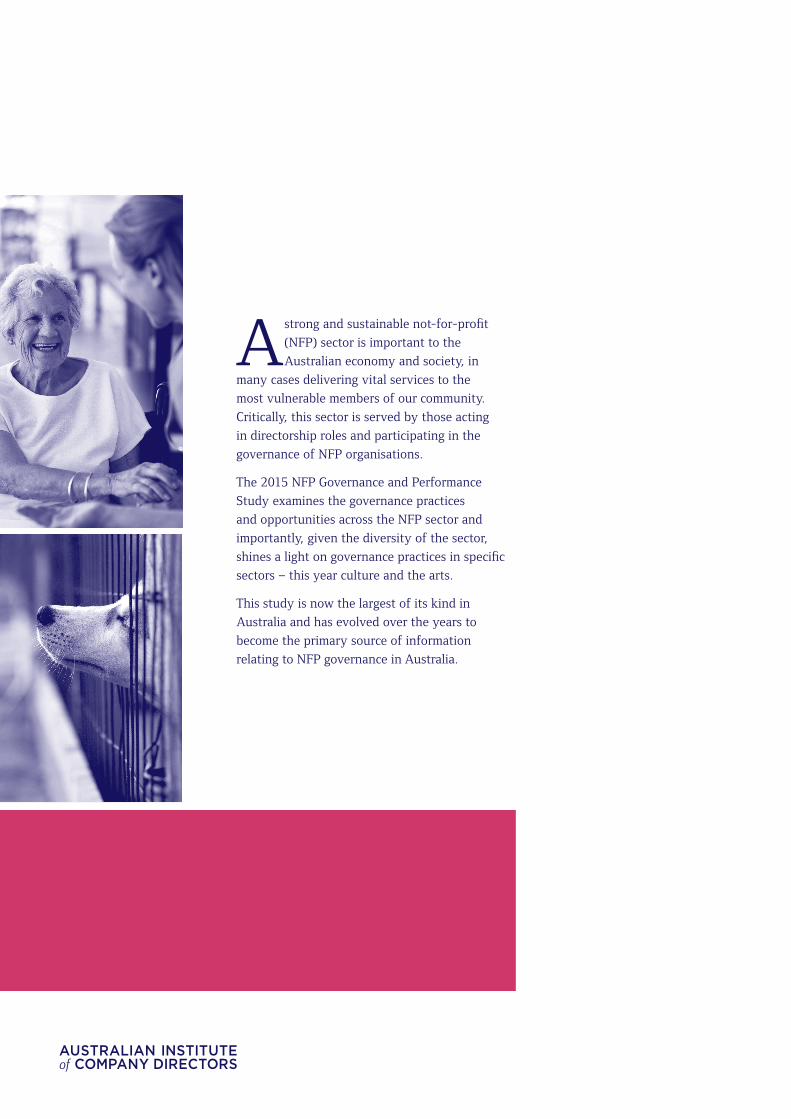
A strong and sustainable not-for-profit
(NFP) sector is important to the
Australian economy and society, in
many cases delivering vital services to the
most vulnerable members of our community.
Critically, this sector is served by those acting
in directorship roles and participating in the
governance of NFP organisations.
The 2015 NFP Governance and Performance
Study examines the governance practices
and opportunities across the NFP sector and
importantly, given the diversity of the sector,
shines a light on governance practices in specific
sectors – this year culture and the arts.
This study is now the largest of its kind in
Australia and has evolved over the years to
become the primary source of information
relating to NFP governance in Australia.