news & information formed company, sony bmg, is 50% owned by each parent company. under u.s....
TRANSCRIPT

News & Information
3:30
Consolidated Financial Results for the Fiscal Year Ended March 31, 2
Tokyo, April 27, 2005 -- Sony Corporation today announced its consolidated resulMarch 31, 2005 (April 1, 2004 to March 31, 2005).
(Billions of yen, millions of U.S. dollars, exce Year ended March 31 2004 2005
ChangYe
Sales and operating revenue ¥7,496.4 ¥7,159.6 -4Operating income 98.9 113.9 +15Income before income taxes 144.1 157.2 +9Equity in net income of affiliated
companies 1.7 29.0 +1,594
Net income 88.5 163.8 +85 Net income per share of common
stock — Basic ¥95.97 ¥175.90 +83 — Diluted 87.00 158.07 +81 * U.S. dollar amounts have been translated from yen, for convenience only, at the rate of ¥107=U.S.$1, the appromarket rate as of March 31, 2005. Unless otherwise specified, all amounts are on the basis of Generally Accepted AccountingGAAP”). Consolidated Results for the Fiscal Year Ended March 31, 20 Sales and operating revenue (“sales”) decreased 4.5% compared with the previocurrency basis sales decreased 3%. (For all references herein to results on a local con page 9.) This reflects both the establishment of Sony BMG Music Entertainmerefer to note on Page 2) and a change in revenue recognition method at Sony Life ILife”). Sales within the Electronics segment remained largely unchanged. Although salesdigital still cameras and LCD rear projection televisions increased, there was a decCRT televisions and portable audio products. In the Game segment, an increase inthan offset by a decline in hardware sales mainly due to strategic price reductions, overall segment sales. In the Music segment, although sales at Sony Music Entert(“SMEJ”) increased, overall sales decreased due to the fact that Sony BMG, a recoventure formed with Bertelsmann AG, has been accounted for by the equity metho(please refer to the note on page 2). In the Pictures segment, despite the strong conthere was a decrease in sales as a result of the appreciation of the yen. In the Finanrevenue decreased mainly due to a decrease in revenue from insurance premiums a
1
6-7-35 Kitashinagawa Shinagawa-ku Tokyo 141-0001 Japan
No: 05-025E P.M. JST, April 27, 2005
005
ts for the fiscal year ended
pt per share amounts) e in n 2005* .5% $66,912 .2 1,065 .1 1,469
.2 271
.1 1,531
.3% $1.64
.7 1.48
ximate Tokyo foreign exchange
Principles in the U.S. (“U.S.
05
us fiscal year; on a local urrency basis, see Note I
nt (“Sony BMG”) (please nsurance Co., Ltd. (“Sony
of flat panel televisions, rease in sales primarily of software sales was more resulting in a decrease to ainment (Japan) Inc. rded music business joint d since August 2004 tribution of Spider-Man 2, cial Services segment, t Sony Life.
2
Operating income increased 15.2% (a 26% increase on a local currency basis) compared with the previous fiscal year. In the Electronics segment, the operating loss increased mainly due to a continued deterioration in the cost of sales ratio associated with a decline in unit selling prices. In the Game segment, as a result of a decline in hardware sales, there was a decrease in operating income. The Pictures segment had record operating income primarily due to the substantial contribution from Spider-Man 2. Restructuring charges, which are recorded as operating expenses, amounted to ¥90.0 billion ($841.1 million) for the fiscal year compared to ¥168.1 billion in the previous fiscal year. In the Electronics segment, restructuring charges were ¥81.8 billion ($764.5 million) compared to ¥147.8 billion in the previous fiscal year. Income before income taxes increased 9.1% compared to the previous fiscal year. There was a deterioration in the net effect of other income and expenses compared to the previous fiscal year despite an improvement due to a smaller loss on the devaluation of securities investments compared to the previous year, and gains of ¥9.0 billion ($84 million) from a change in interest from Monex Inc., an equity affiliate of Sony, following its business integration by way of a share transfer with Nikko Beans, Inc., and total gains of ¥4.7 billion ($44 million) from the sale of stock and a change in interest in a subsidiary resulting from the initial public offering of So-net M3 Inc., a consolidated subsidiary of Sony Communication Network Corporation. This deterioration was mainly the result of the recording of a net foreign exchange loss in the current fiscal year, compared to the net foreign exchange gain recorded in the previous fiscal year. Income taxes: Compared to an effective tax rate of 36.6% in the previous fiscal year, the effective tax rate was 10.2% in the current fiscal year. As fully discussed in Sony’s Annual Report on Form 20-F for the fiscal year ended March 31, 2004, as a result of the recording of operating losses in the past, the U.S. subsidiaries of Sony have had valuation allowances against deferred tax assets for U.S. federal and certain state taxes. However, in the current fiscal year, based on both an improvement in recent years and a sound outlook for the operating performance at Sony’s U.S. subsidiaries, Sony reversed ¥67.9 billion ($635 million) of such valuation allowances, resulting in a reduction to income tax expense. This reversal was the major factor impacting the effective tax rate decline for the fiscal year. Equity in net income of affiliated companies increased ¥27.3 billion compared to the previous fiscal year. Sony Ericsson Mobile Communications AB (“Sony Ericsson”) contributed ¥17.4 billion ($163 million) to equity in net income, an increase of ¥11.0 billion compared to the previous fiscal year. Equity in net income of affiliated companies for the current fiscal year includes the recording of ¥12.6 billion ($118 million) as equity in net income from InterTrust Technologies Corporation (“InterTrust”). This amount reflects InterTrust’s proceeds from a license agreement with Microsoft Corporation arising from the settlement of a patent-related lawsuit. In addition, an equity loss of ¥3.4 billion ($32 million) was recorded at Sony BMG, established in August 2004. Furthermore, equity in net loss was recorded at affiliates such as Star Channel Inc., a Japan-based subscription television company specializing in the broadcast of movies, and S-LCD Corporation, a joint-venture with Samsung Electronics Co., Ltd. for the manufacture of amorphous TFT LCD panels. (For operating results of major affiliates accounted for by the equity method, please refer to page 6.) Net income, as a result, increased 85.1% compared to the previous fiscal year. Operating Performance Highlights by Business Segment Note: As of August 1, 2004, Sony and Bertelsmann AG combined their recorded music businesses in a joint venture. The newly formed company, Sony BMG, is 50% owned by each parent company. Under U.S. GAAP, Sony BMG is accounted for by Sony using the equity method and, since August 1, 2004, 50% of net profits or losses of this business have been included under “Equity in net income (loss) of affiliated companies.” In connection with the establishment of this joint venture, Sony’s non-Japan based disc manufacturing and physical distribution businesses, formerly included within the Music segment, have been reclassified to the Electronics segment to reflect the new management reporting structure whereby Sony’s Electronics segment has now assumed responsibility for

3
these businesses. Results for the previous fiscal year in the Electronics and Music segments have been restated to account for this reclassification. In the Music segment, results for this fiscal year only include the results of Sony Music Entertainment Inc.’s (“SMEI”) recorded music business for the months of April through July 2004, and the twelve months results of SMEI’s music publishing business and SMEJ. However, results for the previous fiscal year in the Music segment include the consolidated results for SMEI’s recorded music business for all twelve months, as well as the full year’s results for SMEI’s publishing business and SMEJ. Electronics (Billions of yen, millions of U.S. dollars)
Year ended March 31
2004 2005 Change in
Yen 2005 Sales and operating revenue ¥5,042.3 ¥5,021.6 -0.4% $46,931
Operating loss (6.8) (34.3) - (321) Unless otherwise specified, all amounts are on a U.S. GAAP basis. Sales remained largely unchanged (a 1% increase on a local currency basis). Sales to outside customers decreased 1.1% compared to the previous fiscal year. There was a decline in sales of CRT televisions, due to a continued shift in demand towards flat panel televisions, and portable audio, faced with a difficult competitive environment due to the shift towards hard disc- and flash-based memory players. However, there was an increase in sales of several products including flat panel televisions, which saw increased sales in all geographic areas, digital still cameras, where sales increased outside of Japan, and LCD rear projection televisions, which saw increased unit sales particularly in the U.S. Operating loss increased by ¥27.5 billion compared with the previous fiscal year. Although there was a decrease in restructuring charges compared with the previous fiscal year, operating loss increased due to a significant deterioration in the cost of sales ratio as a result of a decline in unit selling prices. With regard to products within the Electronics segment, the decrease in sales of CRT televisions and portable audio, as well as the decline of unit selling prices of camcorders, contributed to the increase in operating loss. Inventory, as of March 31, 2005, was ¥514.4 billion ($4,807 million), a ¥18.4 billion, or 3.7%, increase compared with the level as of March 31, 2004 and a ¥56.5 billion, or 9.9%, decrease compared with the level as of December 31, 2004. Note: In association with the completion of business integration of Sony Group’s semiconductor manufacturing businesses in July 2004, it was decided to account for semiconductor manufacturing operations inventory, which was previously recorded in the Game segment, within the Electronics segment as of the quarter beginning July 1, 2004. (Regarding the integration of Sony Group’s semiconductor manufacturing operations, please refer to note 6 on page F-10.) Game (Billions of yen, millions of U.S. dollars)
Year ended March 31
2004 2005 Change in
Yen 2005 Sales and operating revenue ¥780.2 ¥729.8 -6.5% $6,821 Operating income 67.6 43.2 -36.1 404 Unless otherwise specified, all amounts are on a U.S. GAAP basis. Sales decreased 6.5% compared with the previous fiscal year (a 6% decrease on a local currency basis).
4
Hardware: In addition to a decline of PlayStation 2 (“PS2”) unit sales in Japan, the U.S. and Europe, strategic price reductions on the PS2 undertaken in each of the abovementioned territories resulted in a decline in sales. Software: Overall software sales increased mainly as a result of an increase in unit sales of PS2 software, which recorded all-time record sales. Revenue increased in Japan, the U.S. and Europe. PlayStation Portable, on sale in Japan from December 2004 and in the U.S. from March 2005, has recorded strong hardware and software unit sales. Operating income decreased by ¥24.4 billion, or 36.1%, compared with the previous fiscal year as a result mainly of a decrease in hardware sales coupled with the start-up expenses for PlayStation Portable, despite being partially offset by an increase in software sales. Worldwide hardware production shipments:*
→ PS2: 16.17 million units (a decrease of 3.93 million units) → PS one: 2.77 million units (a decrease of 0.54 million units) → PlayStation Portable 2.97 million units
Worldwide software production shipments:* → PS2: 252 million units (an increase of 30 million units) → PlayStation: 10 million units (a decrease of 22 million units) → PlayStation Portable 5.7 million units *Production shipment units of hardware and software are counted upon shipment of the products from manufacturing bases. Sales of such products are recognized when the products are delivered to customers.
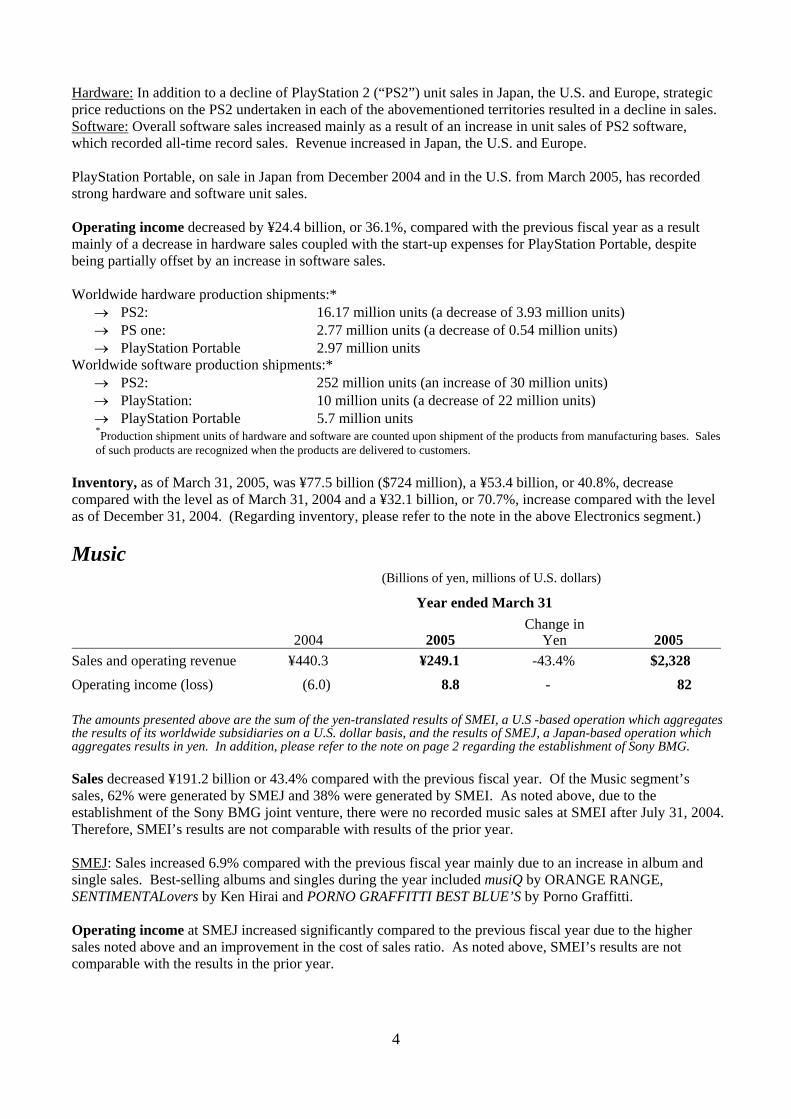
Inventory, as of March 31, 2005, was ¥77.5 billion ($724 million), a ¥53.4 billion, or 40.8%, decrease compared with the level as of March 31, 2004 and a ¥32.1 billion, or 70.7%, increase compared with the level as of December 31, 2004. (Regarding inventory, please refer to the note in the above Electronics segment.) Music
(Billions of yen, millions of U.S. dollars)
Year ended March 31
2004 2005 Change in
Yen 2005 Sales and operating revenue ¥440.3 ¥249.1 -43.4% $2,328 Operating income (loss) (6.0) 8.8 - 82 The amounts presented above are the sum of the yen-translated results of SMEI, a U.S -based operation which aggregates the results of its worldwide subsidiaries on a U.S. dollar basis, and the results of SMEJ, a Japan-based operation which aggregates results in yen. In addition, please refer to the note on page 2 regarding the establishment of Sony BMG. Sales decreased ¥191.2 billion or 43.4% compared with the previous fiscal year. Of the Music segment’s sales, 62% were generated by SMEJ and 38% were generated by SMEI. As noted above, due to the establishment of the Sony BMG joint venture, there were no recorded music sales at SMEI after July 31, 2004. Therefore, SMEI’s results are not comparable with results of the prior year. SMEJ: Sales increased 6.9% compared with the previous fiscal year mainly due to an increase in album and single sales. Best-selling albums and singles during the year included musiQ by ORANGE RANGE, SENTIMENTALovers by Ken Hirai and PORNO GRAFFITTI BEST BLUE’S by Porno Graffitti. Operating income at SMEJ increased significantly compared to the previous fiscal year due to the higher sales noted above and an improvement in the cost of sales ratio. As noted above, SMEI’s results are not comparable with the results in the prior year.
5
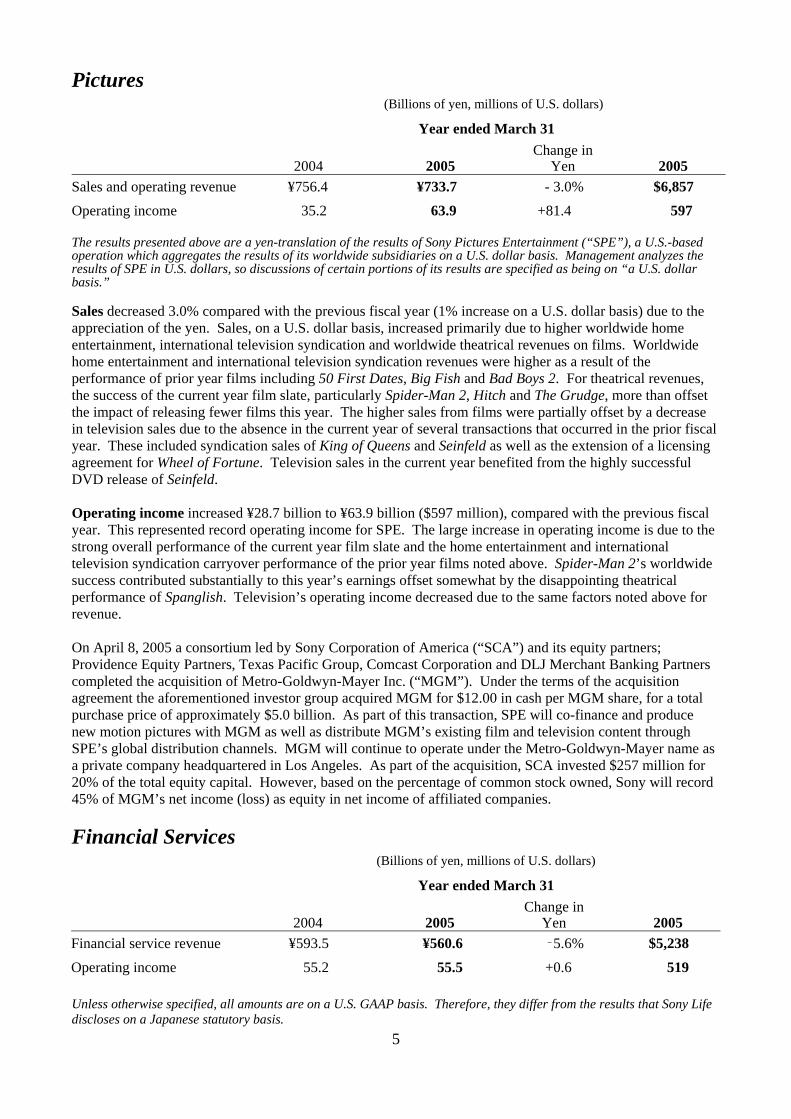
Pictures (Billions of yen, millions of U.S. dollars)
Year ended March 31
2004 2005 Change in
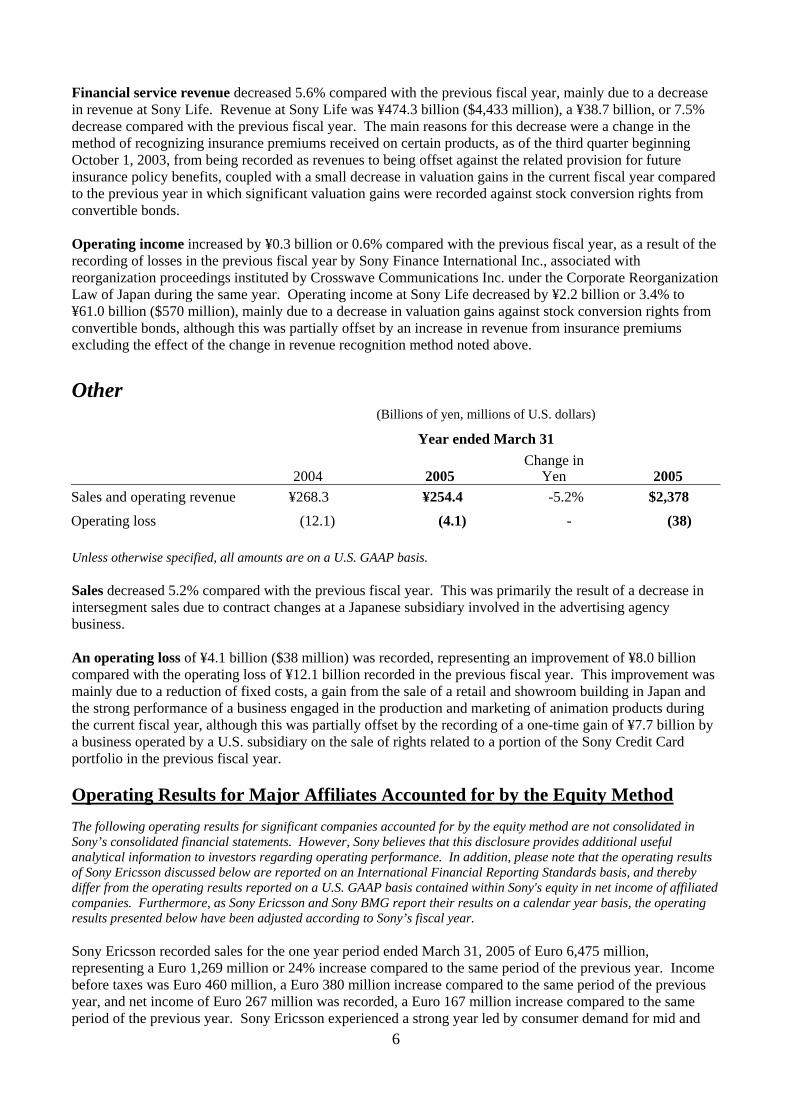
Yen 2005 Sales and operating revenue ¥756.4 ¥733.7 - 3.0% $6,857 Operating income 35.2 63.9 +81.4 597 The results presented above are a yen-translation of the results of Sony Pictures Entertainment (“SPE”), a U.S.-based operation which aggregates the results of its worldwide subsidiaries on a U.S. dollar basis. Management analyzes the results of SPE in U.S. dollars, so discussions of certain portions of its results are specified as being on “a U.S. dollar basis.” Sales decreased 3.0% compared with the previous fiscal year (1% increase on a U.S. dollar basis) due to the appreciation of the yen. Sales, on a U.S. dollar basis, increased primarily due to higher worldwide home entertainment, international television syndication and worldwide theatrical revenues on films. Worldwide home entertainment and international television syndication revenues were higher as a result of the performance of prior year films including 50 First Dates, Big Fish and Bad Boys 2. For theatrical revenues, the success of the current year film slate, particularly Spider-Man 2, Hitch and The Grudge, more than offset the impact of releasing fewer films this year. The higher sales from films were partially offset by a decrease in television sales due to the absence in the current year of several transactions that occurred in the prior fiscal year. These included syndication sales of King of Queens and Seinfeld as well as the extension of a licensing agreement for Wheel of Fortune. Television sales in the current year benefited from the highly successful DVD release of Seinfeld. Operating income increased ¥28.7 billion to ¥63.9 billion ($597 million), compared with the previous fiscal year. This represented record operating income for SPE. The large increase in operating income is due to the strong overall performance of the current year film slate and the home entertainment and international television syndication carryover performance of the prior year films noted above. Spider-Man 2’s worldwide success contributed substantially to this year’s earnings offset somewhat by the disappointing theatrical performance of Spanglish. Television’s operating income decreased due to the same factors noted above for revenue. On April 8, 2005 a consortium led by Sony Corporation of America (“SCA”) and its equity partners; Providence Equity Partners, Texas Pacific Group, Comcast Corporation and DLJ Merchant Banking Partners completed the acquisition of Metro-Goldwyn-Mayer Inc. (“MGM”). Under the terms of the acquisition agreement the aforementioned investor group acquired MGM for $12.00 in cash per MGM share, for a total purchase price of approximately $5.0 billion. As part of this transaction, SPE will co-finance and produce new motion pictures with MGM as well as distribute MGM’s existing film and television content through SPE’s global distribution channels. MGM will continue to operate under the Metro-Goldwyn-Mayer name as a private company headquartered in Los Angeles. As part of the acquisition, SCA invested $257 million for 20% of the total equity capital. However, based on the percentage of common stock owned, Sony will record 45% of MGM’s net income (loss) as equity in net income of affiliated companies. Financial Services (Billions of yen, millions of U.S. dollars)
Year ended March 31
2004 2005 Change in
Yen 2005 Financial service revenue ¥593.5 ¥560.6 ‐5.6% $5,238
Operating income 55.2 55.5 +0.6 519 Unless otherwise specified, all amounts are on a U.S. GAAP basis. Therefore, they differ from the results that Sony Life discloses on a Japanese statutory basis.
6
Financial service revenue decreased 5.6% compared with the previous fiscal year, mainly due to a decrease in revenue at Sony Life. Revenue at Sony Life was ¥474.3 billion ($4,433 million), a ¥38.7 billion, or 7.5% decrease compared with the previous fiscal year. The main reasons for this decrease were a change in the method of recognizing insurance premiums received on certain products, as of the third quarter beginning October 1, 2003, from being recorded as revenues to being offset against the related provision for future insurance policy benefits, coupled with a small decrease in valuation gains in the current fiscal year compared to the previous year in which significant valuation gains were recorded against stock conversion rights from convertible bonds. Operating income increased by ¥0.3 billion or 0.6% compared with the previous fiscal year, as a result of the recording of losses in the previous fiscal year by Sony Finance International Inc., associated with reorganization proceedings instituted by Crosswave Communications Inc. under the Corporate Reorganization Law of Japan during the same year. Operating income at Sony Life decreased by ¥2.2 billion or 3.4% to ¥61.0 billion ($570 million), mainly due to a decrease in valuation gains against stock conversion rights from convertible bonds, although this was partially offset by an increase in revenue from insurance premiums excluding the effect of the change in revenue recognition method noted above.
Other (Billions of yen, millions of U.S. dollars)
Year ended March 31
2004 2005 Change in
Yen 2005 Sales and operating revenue ¥268.3 ¥254.4 -5.2% $2,378 Operating loss (12.1) (4.1) - (38) Unless otherwise specified, all amounts are on a U.S. GAAP basis. Sales decreased 5.2% compared with the previous fiscal year. This was primarily the result of a decrease in intersegment sales due to contract changes at a Japanese subsidiary involved in the advertising agency business. An operating loss of ¥4.1 billion ($38 million) was recorded, representing an improvement of ¥8.0 billion compared with the operating loss of ¥12.1 billion recorded in the previous fiscal year. This improvement was mainly due to a reduction of fixed costs, a gain from the sale of a retail and showroom building in Japan and the strong performance of a business engaged in the production and marketing of animation products during the current fiscal year, although this was partially offset by the recording of a one-time gain of ¥7.7 billion by a business operated by a U.S. subsidiary on the sale of rights related to a portion of the Sony Credit Card portfolio in the previous fiscal year. Operating Results for Major Affiliates Accounted for by the Equity Method The following operating results for significant companies accounted for by the equity method are not consolidated in Sony’s consolidated financial statements. However, Sony believes that this disclosure provides additional useful analytical information to investors regarding operating performance. In addition, please note that the operating results of Sony Ericsson discussed below are reported on an International Financial Reporting Standards basis, and thereby differ from the operating results reported on a U.S. GAAP basis contained within Sony's equity in net income of affiliated companies. Furthermore, as Sony Ericsson and Sony BMG report their results on a calendar year basis, the operating results presented below have been adjusted according to Sony’s fiscal year. Sony Ericsson recorded sales for the one year period ended March 31, 2005 of Euro 6,475 million, representing a Euro 1,269 million or 24% increase compared to the same period of the previous year. Income before taxes was Euro 460 million, a Euro 380 million increase compared to the same period of the previous year, and net income of Euro 267 million was recorded, a Euro 167 million increase compared to the same period of the previous year. Sony Ericsson experienced a strong year led by consumer demand for mid and
high-end GSM models. As a result, equity in net income of ¥17.4 billion ($163 million) was recorded by Sony. Sony BMG recorded sales revenue of $3,258 million, loss before income taxes of $53 million, and a net loss of $66 million during the period that the venture began operations on August 1, 2004 through the end of Sony’s fiscal year. Loss before income taxes includes $290 million of restructuring charges. As a result, equity in net loss of ¥3.4 billion ($32 million) was recorded by Sony. Cash Flow
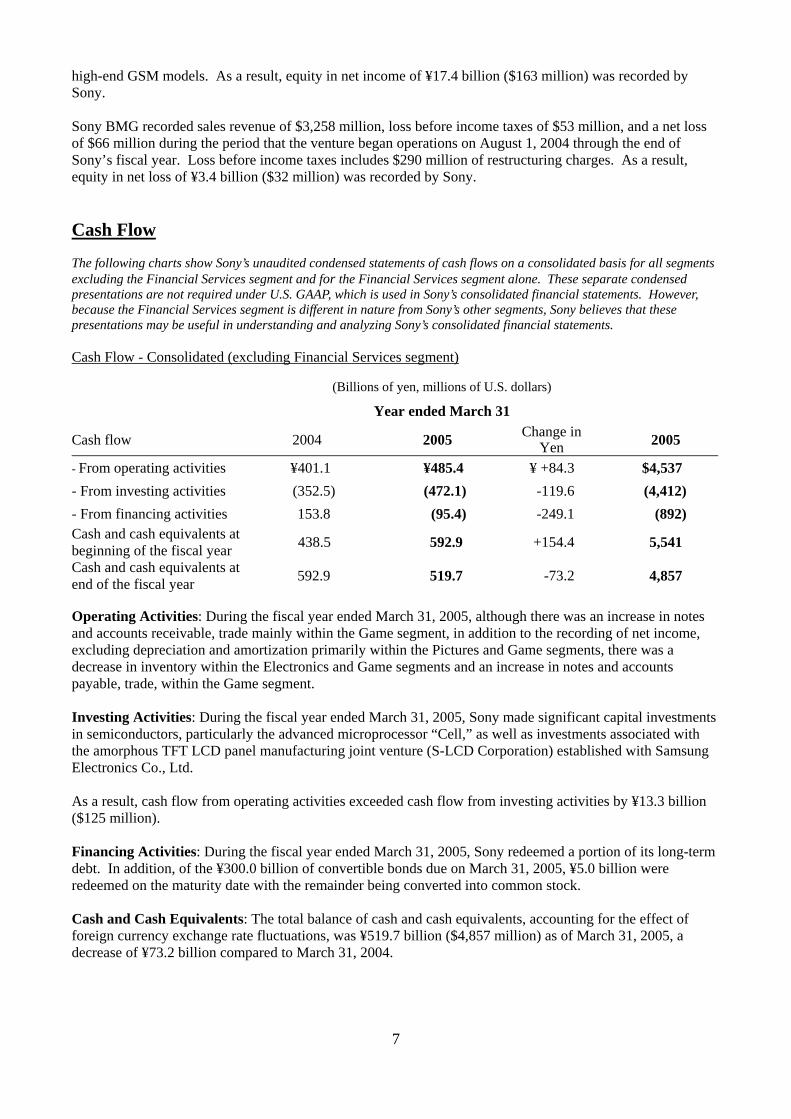
The following charts show Sony’s unaudited condensed statements of cash flows on a consolidated basis for all segments excluding the Financial Services segment and for the Financial Services segment alone. These separate condensed presentations are not required under U.S. GAAP, which is used in Sony’s consolidated financial statements. However, because the Financial Services segment is different in nature from Sony’s other segments, Sony believes that these presentations may be useful in understanding and analyzing Sony’s consolidated financial statements. Cash Flow - Consolidated (excluding Financial Services segment)
(Billions of yen, millions of U.S. dollars)
Year ended March 31
Cash flow 2004 2005 Change in Yen 2005
- From operating activities ¥401.1 ¥485.4 ¥ +84.3 $4,537 - From investing activities (352.5) (472.1) -119.6 (4,412) - From financing activities 153.8 (95.4) -249.1 (892) Cash and cash equivalents at beginning of the fiscal year 438.5 592.9 +154.4 5,541
Cash and cash equivalents at end of the fiscal year 592.9 519.7 -73.2 4,857
Operating Activities: During the fiscal year ended March 31, 2005, although there was an increase in notes and accounts receivable, trade mainly within the Game segment, in addition to the recording of net income, excluding depreciation and amortization primarily within the Pictures and Game segments, there was a decrease in inventory within the Electronics and Game segments and an increase in notes and accounts payable, trade, within the Game segment. Investing Activities: During the fiscal year ended March 31, 2005, Sony made significant capital investments in semiconductors, particularly the advanced microprocessor “Cell,” as well as investments associated with the amorphous TFT LCD panel manufacturing joint venture (S-LCD Corporation) established with Samsung Electronics Co., Ltd. As a result, cash flow from operating activities exceeded cash flow from investing activities by ¥13.3 billion ($125 million). Financing Activities: During the fiscal year ended March 31, 2005, Sony redeemed a portion of its long-term debt. In addition, of the ¥300.0 billion of convertible bonds due on March 31, 2005, ¥5.0 billion were redeemed on the maturity date with the remainder being converted into common stock. Cash and Cash Equivalents: The total balance of cash and cash equivalents, accounting for the effect of foreign currency exchange rate fluctuations, was ¥519.7 billion ($4,857 million) as of March 31, 2005, a decrease of ¥73.2 billion compared to March 31, 2004.
7

Cash Flow - Financial Services segment
(Billions of yen, millions of U.S. dollars)
Year ended March 31
Cash flow 2004 2005 Change in Yen 2005
- From operating activities ¥241.6 ¥168.1 ¥-73.5 $1,571
- From investing activities (401.6) (421.4) -19.8 (3,938)
- From financing activities 141.7 256.4 +114.7 2,396 Cash and cash equivalents at beginning of the fiscal year 274.5 256.3 -18.2 2,395 Cash and cash equivalents at end of fiscal year 256.3 259.4 +3.1 2,424
Operating Activities: The cash inflows from insurance premiums and other exceeded the related cash outflows, reflecting primarily an increase in insurance-in-force at Sony Life. Investing Activities: Payments for investments and advances exceeded proceeds from maturities of marketable securities, sales of securities investments and collections of advances primarily as a result of both investments in mainly Japanese fixed income securities resulting from an increase in insurance-in-force at Sony Life, and a housing loan campaign carried out at Sony Bank. Financing Activities: In addition to the increase in policyholders’ accounts at Sony Life, deposits from customers in the banking business increased primarily due to an increase in the number of accounts. Cash and Cash Equivalents: As a result of the above, the balance of cash and cash equivalents was ¥259.4 billion ($2,424 million) as of March 31, 2005, which was an increase of ¥3.1 billion compared to March 31, 2004. Consolidated Results for the Fourth Quarter ended March 31, 2005 Sales were ¥1,697 billion ($15,860 million), a decrease of 4.2% compared with the same quarter of the previous fiscal year; on a local currency basis sales decreased 4%. This reflects the establishment of Sony BMG (please refer to note on page 2). In the Electronics segment, an increase in intersegment sales to the Game segment resulted in an increase in sales although sales to outside customers declined 5.5%. Although sales primarily of flat panel televisions and LCD rear projection televisions increased, there was a decrease in sales of mobile phones (primarily to Sony Ericsson), portable audio products and CRT televisions. In the Game segment, there was a significant increase in sales as a result of an increase in both hardware and software sales, primarily associated with the launch of PlayStation Portable. In the Music segment, sales decreased due to the establishment of Sony BMG (please refer to the note on page 2). In the Pictures segment, sales decreased due to the absence in the fourth quarter of the current year of transactions that occurred in the same quarter of the previous year. These included syndication sales of Seinfeld and the extension of a licensing agreement for Wheel of Fortune. In the Financial Services segment, revenue increased mainly due to an increase in revenue from insurance premiums at Sony Life. An operating loss of ¥77.4 billion ($723 million) was recorded, an improvement of ¥32.3 billion from the same quarter of the previous year. In the Electronics segment, although there was a deterioration in the cost of sales ratio associated with a decline in unit selling prices, there was a reduction in operating loss due to lower restructuring charges compared to the same quarter of the previous year. The Game segment recorded operating income, compared to the operating loss in the same quarter of the previous year, as a result of an increase in software sales. In the Music segment, a lower operating loss was recorded primarily due to the establishment of Sony BMG mentioned above. In the Pictures segment, the absence in the fourth quarter of
8

9
the current year of transactions that occurred in the same quarter of the previous year led to a decrease in operating income. Restructuring charges, which are recorded as operating expenses, for the fourth quarter amounted to ¥48.6 billion ($454 million) compared to ¥98.3 billion in the same quarter of the previous fiscal year. In the Electronics segment, restructuring charges were ¥44.9 billion ($420 million) compared to ¥89.0 billion in the same quarter of the previous fiscal year. The loss before income taxes was ¥61.9 billion ($578 million), a ¥31.7 billion improvement compared to the same quarter of the previous fiscal year. The recording of valuation allowances against deferred tax assets mainly at European and Japanese subsidiaries of Sony resulted in smaller tax benefits for the quarter of ¥5.3 billion. Equity in net income of affiliated companies of ¥0.5 billion ($4 million) was recorded, a 91.6% decrease from the same quarter of the previous fiscal year. Sony Ericsson contributed ¥2.6 billion ($24 million) to equity in net income, a 52% decrease compared to the same quarter of the previous year. However, an equity in net loss was recorded of ¥3.1 billion ($29 million) at Sony BMG. Equity in net loss was also recorded at S-LCD Corporation. As a result, a net loss of ¥56.5 billion ($528 million) was recorded, a ¥18.3 billion deterioration compared to the same quarter of the previous fiscal year. Operating Results for the Fourth Quarter ending March 31, 2005 for Major Affiliates Accounted for by the Equity Method The following operating results for significant companies accounted for by the equity method are not consolidated in Sony’s consolidated financial statements. However, Sony believes that this disclosure provides additional useful analytical information to investors regarding operating performance. In addition, please note that the operating results of Sony Ericsson discussed below are reported on an International Financial Reporting Standards basis, and thereby differ from the operating results reported on a U.S. GAAP basis contained within Sony's equity in net income of affiliated companies. Sony Ericsson recorded sales for the quarter ended March 31, 2005 of Euro 1,289 million, representing a Euro 50 million or 4% decrease compared to the same quarter of the previous fiscal year. Income before taxes was Euro 70 million, a 27%, or Euro 26 million decrease compared to the same quarter of the previous fiscal year, and net income of Euro 32 million was recorded, a Euro 49 million, or 60% decrease year on year. Although there was an increase in units shipped, slower market growth during the quarter coupled with a decrease in Sony Ericsson’s average selling price led to a decline in sales. As a result, equity in net income of ¥2.6 billion ($24 million) was recorded by Sony. Sony BMG recorded sales revenue of $962 million, loss before income taxes of $61.5 million, and a net loss of $61.8 million during the quarter ended March 31, 2005. Loss before income taxes includes $92 million of restructuring charges. As a result, equity in net loss of ¥3.1 billion ($29 million) was recorded by Sony. Notes Note I: During the fiscal year ended March 31, 2005, the average value of the yen was ¥106.5 against the U.S. dollar and ¥133.7 against the Euro, which was 5.2% higher against the U.S. dollar and 1.9% lower against the Euro, compared with the average rates for the previous fiscal year. Operating results on a local currency basis described herein reflect sales and operating income obtained by applying the yen’s average exchange rate in the previous fiscal year to local currency-denominated monthly sales, cost of sales, and selling, general and administrative expenses in the fiscal year. Local currency basis results are not reflected in Sony’s financial statements and are not measures conforming with U.S. GAAP. In addition, Sony does not believe that these measures are a substitute for U.S. GAAP measures. However, Sony believes that local currency basis results provide additional useful analytical information to investors regarding operating performance. Note II: “Sales and operating revenue” in each business segment represents sales and operating revenue recorded before intersegment transactions are eliminated. “Operating income” in each business segment represents operating income recorded before intersegment transactions and unallocated corporate expenses are eliminated.

10
Note III: In the third quarter ended December 31, 2004, Sony adopted Emerging Issues Task Force (“EITF”) Issue No. 04-8, “The Effect of Contingently Convertible Instruments on Diluted Earnings per Share.” As a result of adopting EITF Issue No. 04-8, diluted earnings per share of net income for the fiscal year ended March 31, 2004 have been restated (see Note 9 on page F-10 regarding EITF Issue No. 04-8). Note IV: During the quarter ended March 31, 2005, the average value of the yen was ¥103.5 against the U.S. dollar and ¥135.4 against the Euro, which was 2.7% higher against the U.S. dollar and 2.1% lower against the Euro, compared with the average rates for the same quarter of the previous fiscal year. Rewarding Shareholders Sony believes that continuously increasing corporate value and providing dividends are essential to rewarding shareholders. It is Sony’s policy to utilize retained earnings, after ensuring the perpetuation of stable dividends, to carry out various investments that contribute to an increase in corporate value such as those that ensure future growth and strengthen competitiveness. A year-end cash dividend of ¥12.5 ($0.12) per share of Sony Corporation common stock will be presented for approval at the Board of Directors meeting to be held on May 16, 2005 and, if approved, will be payable as of June 1, 2005. Sony Corporation has already paid an interim dividend of ¥12.5 per share to each shareholder; accordingly, the total annual cash dividend per share would be ¥25.0. Regarding shares of subsidiary tracking stock issued in Japan by Sony Corporation, Sony Communication Network Corporation (“SCN”) has been working to manage its operations so as to expand cash flow, fully solidify its financial base, and increase its retained earnings to aggressively expand its business to strengthen its foundation and respond to the quickly expanding Internet market. For these reasons, SCN does not plan to distribute earnings to SCN shareholders for the time being. As such, Sony Corporation will continue its policy of not paying dividends to shareholders of the subsidiary tracking stock. Number of Employees The number of employees at the end of March 2005 was approximately 151,400, a decrease of approximately 10,600 employees from the end of March 2004. Although employees increased at manufacturing facilities in Asia, particularly in China, the total number of employees declined due to the reductions associated with the implementation of restructuring activities in Japan, the U.S., Europe and South-East Asia, and a decrease in the number of employees due to the establishment of Sony BMG. Outlook for the Fiscal Year ending March 31, 2006
Change from previous year Sales and operating revenue ¥7,450 billion +4% Operating income 160 billion +40 Income before income taxes 170 billion +8 Equity in net income of affiliated companies 5 billion -83 Net income 80 billion -51 Capital expenditures (additions to fixed assets) ¥410 billion +15% Depreciation and amortization* 390 billion +5 (Depreciation expenses for tangible assets) (320 billion) (+6) * Including amortization of intangible assets and amortization of deferred insurance acquisition costs. Research and development expenses 520 billion +4%
Assumed exchange rates: approximately ¥103 to the U.S. dollar, approximately ¥133 to the Euro. The forecast for the consolidated operating results stated above, has been prepared based on the current business environment and reflects the factors noted below.

11
During the fiscal year, primarily in the Electronics segment, restructuring charges of approximately ¥72 billion are expected to be incurred across the Sony Group (¥90 billion of restructuring expenses were recorded in the fiscal year ended March 31, 2005). The above forecast for operating income reflects these restructuring charges as operating expenses. As part of this forecast, the forecast for operating income and income before income taxes reflects an estimated gain of approximately ¥60 billion related to the transfer to the Japanese Government of the substitutional portion, the benefit obligation related to past employee service, of Sony’s Employee Pension Fund. Furthermore, ¥35 billion of this estimated gain is reflected in the forecast for net income after deductions for the effect of income taxes. The forecast for each business segment (excluding the anticipated gain from the transfer of the substitutional portion of Sony’s Employee Pension Fund) is as follows: Electronics Sales are expected to increase primarily due to an increase in the sales of products such as flat panel televisions and LCD rear projection televisions. With regard to operating performance, although an improvement is expected due to the increase in sales and a reduction in fixed costs relating to restructuring implemented during the previous fiscal year, a decline in unit prices, appreciation of the yen and increase in both depreciation and amortization and research and development costs are also anticipated. An improvement in operating performance is expected, as in addition to the abovementioned factors, a reduction in restructuring charges is also anticipated. Game Sales are expected to increase due to the contribution from both PlayStation Portable hardware and software. Although PS2 and PlayStation Portable are expected to contribute to operating income, increased research and development costs primarily for the next generation computer entertainment system are expected to leave operating income relatively unchanged. Music
Due to the establishment of Sony BMG (please refer to the note on page 2) sales are expected to decrease. A small increase in operating income is anticipated. Pictures Although sales are expected to increase due to the impact of the acquisition of MGM, operating income is expected to decrease compared to the previous fiscal year, in which Spider-Man 2 was a substantial contributor.
Financial Services Although revenue is expected to continue to grow mainly due to an increase in revenue from insurance premiums at Sony Life, a small decrease is expected in operating income due to conservative estimation of insurance claim payments. Semiconductor capital expenditures Capital expenditures within the semiconductor business during the fiscal year are expected to amount to approximately ¥160 billion (the actual amount in the fiscal year ended March 31, 2005 was approximately ¥150 billion). As of March 31, 2005, Sony had deferred tax assets on tax loss carry forwards in relation to Japanese local income taxes totaling ¥77.5 billion. However, there is a possibility that, depending on future operating performance, Sony may establish a valuation allowance against part or all of its deferred tax assets that would

be charged to income as an increase in tax expense. It should be noted, though, that the forecast above does not include this possibility. For your reference, further details about valuation allowances against deferred tax assets can be found under the “Deferred tax asset valuation” section of “Critical Accounting Policies” in Item 5. Operating and Financial Review and Prospects of Sony Corporation’s Form 20-F for the fiscal year ended March 31, 2004. URL: http://www.sec.gov/Archives/edgar/data/313838/000114554904000801/0001145549-04-000801-index.htm Cautionary StatementStatements made in this release with respect to Sony’s current plans, estimates, strategies and beliefs and other statements that are not historical facts are forward-looking statements about the future performance of Sony. Forward-looking statements include, but are not limited to, those statements using words such as “believe,” “expect,” “plans,” “strategy,” “prospects,” “forecast,” “estimate,” “project,” “anticipate,” “may” or “might” and words of similar meaning in connection with a discussion of future operations, financial performance, events or conditions. From time to time, oral or written forward-looking statements may also be included in other materials released to the public. These statements are based on management’s assumptions and beliefs in light of the information currently available to it. Sony cautions you that a number of important risks and uncertainties could cause actual results to differ materially from those discussed in the forward-looking statements, and therefore you should not place undue reliance on them. You also should not rely on any obligation of Sony to update or revise any forward-looking statements, whether as a result of new information, future events or otherwise. Sony disclaims any such obligation. Risks and uncertainties that might affect Sony include, but are not limited to (i) the global economic environment in which Sony operates, as well as the economic conditions in Sony's markets, particularly levels of consumer spending; (ii) exchange rates, particularly between the yen and the U.S. dollar, the Euro and other currencies in which Sony makes significant sales or in which Sony's assets and liabilities are denominated; (iii) Sony's ability to continue to design and develop and win acceptance of its products and services, which are offered in highly competitive markets characterized by continual new product introductions, rapid development in technology and subjective and changing consumer preferences (particularly in the Electronics, Game, Music and Pictures segments); (iv) Sony's ability to implement successfully personnel reduction and other business reorganization activities in its Electronics, Music and Pictures segments; (v) Sony's ability to implement successfully its network strategy for its Electronics, Music, Pictures and Other segments and to develop and implement successful sales and distribution strategies in its Music and Pictures segments in light of the Internet and other technological developments; (vi) Sony's continued ability to devote sufficient resources to research and development and, with respect to capital expenditures, to correctly prioritize investments (particularly in the Electronics segment); and (vii) the success of Sony's joint ventures and alliances. Risks and uncertainties also include the impact of any future events with material unforeseen impacts. Investor Relations Contacts: Tokyo New York London Yukio Ozawa Takeshi Sudo/ Justin Hill Chris Hohman/Shinji Tomita +81-(0)3-5448-2180 +1-212-833-6722 +44-(0)20-7444-9713 Home Page: http://www.sony.net/IR/
12

F-1
Business Segment Information (Millions of yen, millions of U.S. dollars) Year ended March 31 Sales and operating revenue 2004 2005 Change 2005 Electronics Customers ¥ 4,838,268 ¥ 4,786,236 -1.1% $ 44,731 Intersegment 204,051 235,411 2,200 Total 5,042,319 5,021,647 -0.4 46,931 Game Customers 753,732 702,524 -6.8 6,566 Intersegment 26,488 27,230 255 Total 780,220 729,754 -6.5 6,821 Music Customers 409,487 216,779 -47.1 2,026 Intersegment 30,819 32,326 302 Total 440,306 249,105 -43.4 2,328 Pictures Customers 756,370 733,677 -3.0 6,857 Intersegment 0 0 0 Total 756,370 733,677 -3.0 6,857 Financial Services Customers 565,752 537,715 -5.0 5,025 Intersegment 27,792 22,842 213 Total 593,544 560,557 -5.6 5,238 Other Customers 172,782 182,685 +5.7 1,707 Intersegment 95,535 71,742 671 Total 268,317 254,427 -5.2 2,378 Elimination (384,685) (389,551) — (3,641) Consolidated total ¥ 7,496,391 ¥ 7,159,616 -4.5% $ 66,912
Electronics intersegment amounts primarily consist of transactions with the Game business. Music intersegment amounts primarily consist of transactions with the Game and Pictures businesses. Other intersegment amounts primarily consist of transactions with the Electronics business.
Operating income (loss) 2004 2005 Change 2005 Electronics ¥ (6,824) ¥ (34,305) — $ (321) Game 67,578 43,170 -36.1% 404 Music (5,997) 8,783 — 82 Pictures 35,230 63,899 +81.4 597 Financial Services 55,161 55,490 +0.6 519 Other (12,054) (4,077) — (38) Total 133,094 132,960 -0.1 1,243 Unallocated corporate expenses and elimination (34,192) (19,041) — (178) Consolidated total ¥ 98,902 ¥ 113,919 +15.2% $ 1,065
Commencing April 1, 2004, Sony has partly realigned its business segment configuration. Results of the previous year have been reclassified to conform to the presentations for the current year (See Notes 5 and 6, page F-10).
F-2
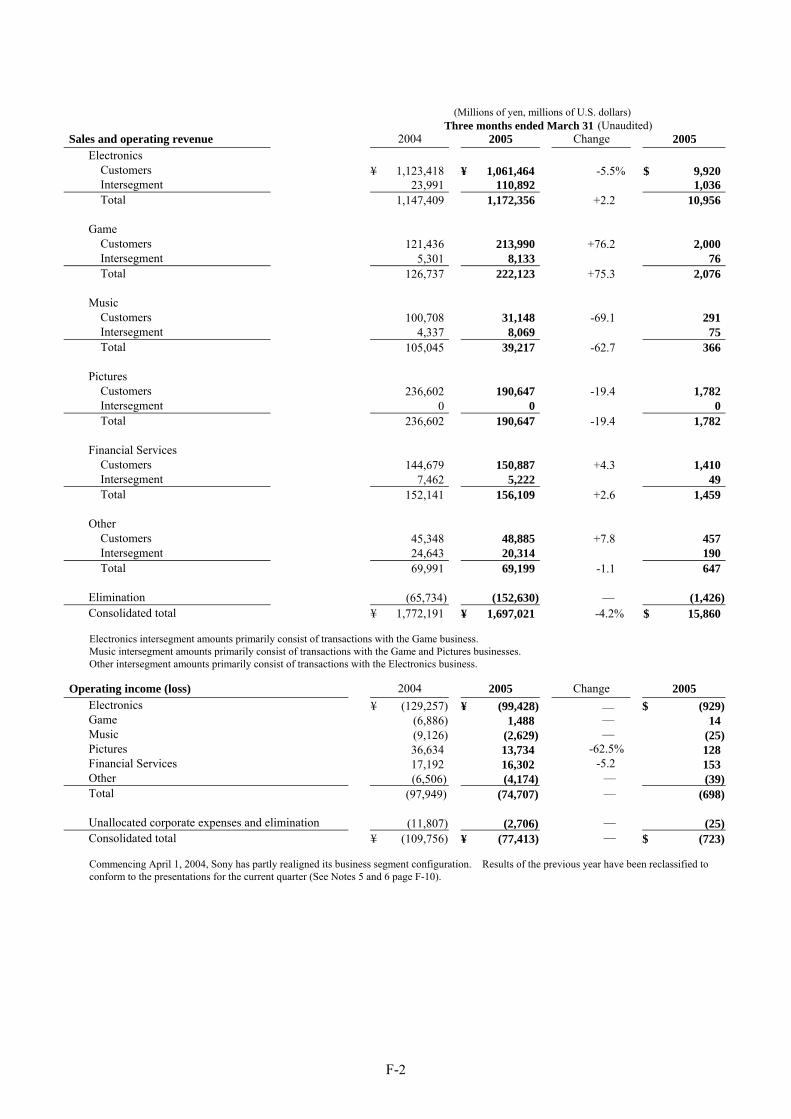
(Millions of yen, millions of U.S. dollars) Three months ended March 31 (Unaudited) Sales and operating revenue 2004 2005 Change 2005 Electronics Customers ¥ 1,123,418 ¥ 1,061,464 -5.5% $ 9,920 Intersegment 23,991 110,892 1,036 Total 1,147,409 1,172,356 +2.2 10,956 Game Customers 121,436 213,990 +76.2 2,000 Intersegment 5,301 8,133 76 Total 126,737 222,123 +75.3 2,076 Music Customers 100,708 31,148 -69.1 291 Intersegment 4,337 8,069 75 Total 105,045 39,217 -62.7 366 Pictures Customers 236,602 190,647 -19.4 1,782 Intersegment 0 0 0 Total 236,602 190,647 -19.4 1,782 Financial Services Customers 144,679 150,887 +4.3 1,410 Intersegment 7,462 5,222 49 Total 152,141 156,109 +2.6 1,459 Other Customers 45,348 48,885 +7.8 457 Intersegment 24,643 20,314 190 Total 69,991 69,199 -1.1 647 Elimination (65,734) (152,630) — (1,426) Consolidated total ¥ 1,772,191 ¥ 1,697,021 -4.2% $ 15,860
Electronics intersegment amounts primarily consist of transactions with the Game business. Music intersegment amounts primarily consist of transactions with the Game and Pictures businesses. Other intersegment amounts primarily consist of transactions with the Electronics business.
Operating income (loss) 2004 2005 Change 2005 Electronics ¥ (129,257) ¥ (99,428) — $ (929) Game (6,886) 1,488 — 14 Music (9,126) (2,629) — (25) Pictures 36,634 13,734 -62.5% 128 Financial Services 17,192 16,302 -5.2 153 Other (6,506) (4,174) — (39) Total (97,949) (74,707) — (698) Unallocated corporate expenses and elimination (11,807) (2,706) — (25) Consolidated total ¥ (109,756) ¥ (77,413) — $ (723)
Commencing April 1, 2004, Sony has partly realigned its business segment configuration. Results of the previous year have been reclassified to conform to the presentations for the current quarter (See Notes 5 and 6 page F-10).

F-3
Electronics Sales and Operating Revenue to Customers by Product Category (Millions of yen, millions of U.S. dollars) Year ended March 31 Sales and operating revenue 2004 2005 Change 2005 Audio ¥ 675,496 ¥ 571,864 -15.3% $ 5,345Video 949,261 1,034,736 +9.0 9,670Televisions 925,501 957,122 +3.4 8,945Information and Communications 834,757 778,374 -6.8 7,275Semiconductors 253,237 246,314 -2.7 2,302Components 623,799 619,477 -0.7 5,789Other 576,217 578,349 +0.4 5,405Total ¥ 4,838,268 ¥ 4,786,236 -1.1% $ 44,731
Three months ended March 31 (Unaudited) Sales and operating revenue 2004 2005 Change 2005 Audio ¥ 132,115 ¥ 106,476 -19.4% $ 995Video 197,515 207,912 +5.3 1,943Televisions 215,257 222,639 +3.4 2,081Information and Communications 208,816 204,563 -2.0 1,912Semiconductors 66,163 50,657 -23.4 473Components 159,464 142,640 -10.6 1,333Other 144,088 126,577 -12.2 1,183Total ¥ 1,123,418 ¥ 1,061,464 -5.5% $ 9,920
The above table is a breakdown of Electronics sales and operating revenue to customers in the Business Segment Information on pages F-1 and F-2. The Electronics segment is managed as a single operating segment by Sony’s management. However, Sony believes that the information in this table is useful to investors in understanding the product categories in this business segment. In addition, commencing April 1, 2004, Sony has partly realigned its product category configuration in the Electronics segment. Accordingly, results of the previous year have been restated. (See Note 7, page F-10)
Geographic Segment Information (Millions of yen, millions of U.S. dollars) Year ended March 31 Sales and operating revenue 2004 2005 Change 2005 Japan ¥ 2,220,747 ¥ 2,100,793 -5.4% $ 19,634 United States 2,121,110 1,977,310 -6.8 18,479 Europe 1,765,053 1,612,536 -8.6 15,070 Other Areas 1,389,481 1,468,977 +5.7 13,729 Total ¥ 7,496,391 ¥ 7,159,616 -4.5% $ 66,912 Three months ended March 31 (Unaudited) Sales and operating revenue 2004 2005 Change 2005 Japan ¥ 549,960 ¥ 527,811 -4.0% $ 4,933 United States 492,729 455,513 -7.6 4,257 Europe 406,956 367,949 -9.6 3,439 Other Areas 322,546 345,748 +7.2 3,231 Total ¥ 1,772,191 ¥ 1,697,021 -4.2% $ 15,860 Classification of Geographic Segment Information shows sales and operating revenue recognized by location of customers.
F-4
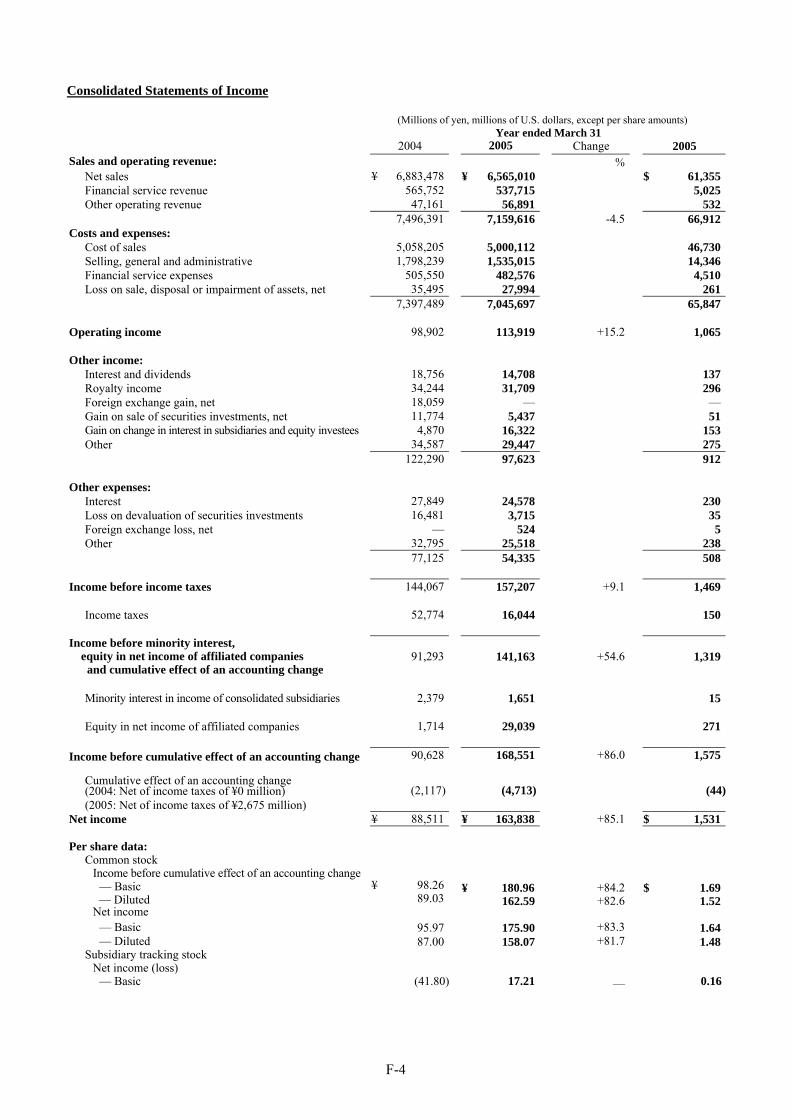
Consolidated Statements of Income (Millions of yen, millions of U.S. dollars, except per share amounts) Year ended March 31 2004 2005 Change 2005 Sales and operating revenue: % Net sales ¥ 6,883,478 ¥ 6,565,010 $ 61,355 Financial service revenue 565,752 537,715 5,025 Other operating revenue 47,161 56,891 532 7,496,391 7,159,616 -4.5 66,912Costs and expenses: Cost of sales 5,058,205 5,000,112 46,730 Selling, general and administrative 1,798,239 1,535,015 14,346 Financial service expenses 505,550 482,576 4,510 Loss on sale, disposal or impairment of assets, net 35,495 27,994 261 7,397,489 7,045,697 65,847 Operating income 98,902 113,919 +15.2 1,065 Other income: Interest and dividends 18,756 14,708 137 Royalty income 34,244 31,709 296 Foreign exchange gain, net 18,059 — — Gain on sale of securities investments, net 11,774 5,437 51 Gain on change in interest in subsidiaries and equity investees 4,870 16,322 153 Other 34,587 29,447 275 122,290 97,623 912 Other expenses: Interest 27,849 24,578 230 Loss on devaluation of securities investments 16,481 3,715 35 Foreign exchange loss, net — 524 5 Other 32,795 25,518 238 77,125 54,335 508 Income before income taxes 144,067 157,207 +9.1 1,469 Income taxes 52,774 16,044 150 Income before minority interest,
equity in net income of affiliated companies and cumulative effect of an accounting change
91,293 141,163 +54.6 1,319
Minority interest in income of consolidated subsidiaries 2,379 1,651 15 Equity in net income of affiliated companies 1,714 29,039 271 Income before cumulative effect of an accounting change 90,628 168,551 +86.0 1,575
Cumulative effect of an accounting change (2004: Net of income taxes of ¥0 million) (2,117) (4,713) (44)
(2005: Net of income taxes of ¥2,675 million) Net income ¥ 88,511 ¥ 163,838 +85.1 $ 1,531 Per share data: Common stock Income before cumulative effect of an accounting change — Basic ¥ 98.26 ¥ 180.96 +84.2 $ 1.69 — Diluted 89.03 162.59 +82.6 1.52 Net income — Basic 95.97 175.90 +83.3 1.64 — Diluted 87.00 158.07 +81.7 1.48 Subsidiary tracking stock Net income (loss) — Basic (41.80) 17.21 — 0.16

F-5
Additional Paid-in Capital and Retained Earnings
The following information shows change in additional paid-in capital and change in retained earnings for the years ended March 31, 2004 and 2005. Sony discloses this supplemental information in accordance with disclosure requirements of the Japanese Securities and Exchange Law, to which Sony, as a Japanese public company, is subject.
(Millions of yen, millions of U.S. dollars) Year ended March 31 2004 2005 2005 Additional Paid-in Capital: Balance, beginning of year ¥ 984,196 ¥ 992,817 $ 9,279 Conversion of convertible bonds 3,988 141,407 1,321 Exchange offerings 5,409 — — Stock based compensation — 340 3 Reissuance of treasury stock (776) (342) (3) Balance, end of year ¥ 992,817 ¥ 1,134,222 $ 10,600 (Millions of yen, millions of U.S. dollars) Year ended March 31 2004 2005 2005 Retained Earnings: Balance, beginning of year ¥ 1,301,740 ¥ 1,367,060 $ 12,776 Net income 88,511 163,838 1,531 Cash dividends (23,138) (24,030) (224) Reissuance of treasury stock — (245) (2) Common stock issue costs, net of tax (53) (541) (5) Balance, end of year ¥ 1,367,060 ¥ 1,506,082 $ 14,076
F-6
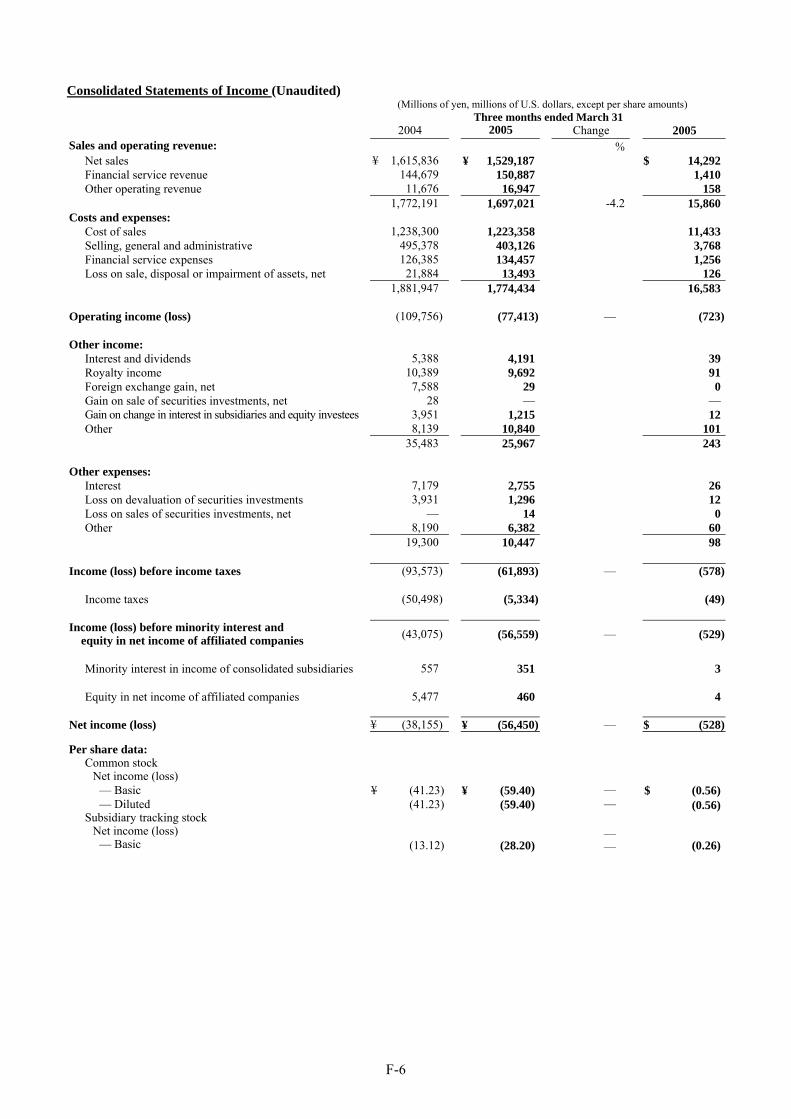
Consolidated Statements of Income (Unaudited) (Millions of yen, millions of U.S. dollars, except per share amounts) Three months ended March 31 2004 2005 Change 2005 Sales and operating revenue: % Net sales ¥ 1,615,836 ¥ 1,529,187 $ 14,292 Financial service revenue 144,679 150,887 1,410 Other operating revenue 11,676 16,947 158 1,772,191 1,697,021 -4.2 15,860Costs and expenses: Cost of sales 1,238,300 1,223,358 11,433 Selling, general and administrative 495,378 403,126 3,768 Financial service expenses 126,385 134,457 1,256 Loss on sale, disposal or impairment of assets, net 21,884 13,493 126 1,881,947 1,774,434 16,583 Operating income (loss) (109,756) (77,413) — (723) Other income: Interest and dividends 5,388 4,191 39 Royalty income 10,389 9,692 91 Foreign exchange gain, net 7,588 29 0 Gain on sale of securities investments, net 28 — — Gain on change in interest in subsidiaries and equity investees 3,951 1,215 12 Other 8,139 10,840 101 35,483 25,967 243 Other expenses: Interest 7,179 2,755 26 Loss on devaluation of securities investments 3,931 1,296 12 Loss on sales of securities investments, net — 14 0 Other 8,190 6,382 60 19,300 10,447 98 Income (loss) before income taxes (93,573) (61,893) — (578) Income taxes (50,498) (5,334) (49) Income (loss) before minority interest and
equity in net income of affiliated companies (43,075) (56,559) — (529)
Minority interest in income of consolidated subsidiaries 557 351 3 Equity in net income of affiliated companies 5,477 460 4 Net income (loss) ¥ (38,155) ¥ (56,450) — $ (528) Per share data: Common stock Net income (loss) — Basic ¥ (41.23) ¥ (59.40) — $ (0.56) — Diluted (41.23) (59.40) — (0.56) Subsidiary tracking stock Net income (loss) — — Basic (13.12) (28.20) — (0.26)

F-7
Consolidated Balance Sheets (Millions of yen, millions of U.S. dollars) March 31
ASSETS 2004 2005 2005 Current assets: Cash and cash equivalents ¥ 849,211 ¥ 779,103 $ 7,281 Time deposits 4,662 1,492 14 Marketable securities 274,748 460,202 4,301 Notes and accounts receivable, trade 1,123,863 1,113,071 10,403 Allowance for doubtful accounts and sales returns (112,674) (87,709) (820) Inventories 666,507 631,349 5,900 Deferred income taxes 125,532 141,154 1,319 Prepaid expenses and other current assets 431,506 517,509 4,837 3,363,355 3,556,171 33,235 Film costs 256,740 278,961 2,607 Investments and advances: Affiliated companies 86,253 252,905 2,364 Securities investments and other 2,426,697 2,492,784 23,297 2,512,950 2,745,689 25,661 Property, plant and equipment: Land 189,785 182,900 1,709 Buildings 930,983 925,796 8,652 Machinery and equipment 2,053,085 2,192,038 20,486 Construction in progress 98,480 92,611 866 Less–Accumulated depreciation (1,907,289) (2,020,946) (18,887) 1,365,044 1,372,399 12,826 Other assets: Intangibles, net 248,010 187,024 1,748 Goodwill 277,870 283,923 2,653 Deferred insurance acquisition costs 349,194 374,805 3,503 Deferred income taxes 203,203 240,396 2,247 Other 514,296 459,732 4,297 1,592,573 1,545,880 14,448 ¥ 9,090,662 ¥ 9,499,100 $ 88,777 LIABILITIES AND STOCKHOLDERS’ EQUITY Current liabilities: Short-term borrowings ¥ 91,260 ¥ 63,396 $ 592 Current portion of long-term debt 383,757 166,870 1,560 Notes and accounts payable, trade 778,773 806,044 7,533 Accounts payable, other and accrued expenses 812,175 746,466 6,976 Accrued income and other taxes 57,913 55,651 520 Deposits from customers in the banking business 378,851 546,718 5,110 Other 479,486 424,223 3,965 2,982,215 2,809,368 26,256 Long-term liabilities: Long-term debt 777,649 678,992 6,346 Accrued pension and severance costs 368,382 352,402 3,293 Deferred income taxes 96,193 72,227 675 Future insurance policy benefits and other 2,178,626 2,464,295 23,031 Other 286,737 227,631 2,127 3,707,587 3,795,547 35,472 Minority interest in consolidated subsidiaries 22,858 23,847 223 Stockholders’ equity: Capital stock 480,267 621,709 5,810 Additional paid-in capital 992,817 1,134,222 10,600 Retained earnings 1,367,060 1,506,082 14,076 Accumulated other comprehensive income (449,959) (385,675) (3,604) Treasury stock, at cost (12,183) (6,000) (56) 2,378,002 2,870,338 26,826 ¥ 9,090,662 ¥ 9,499,100 $ 88,777
F-8
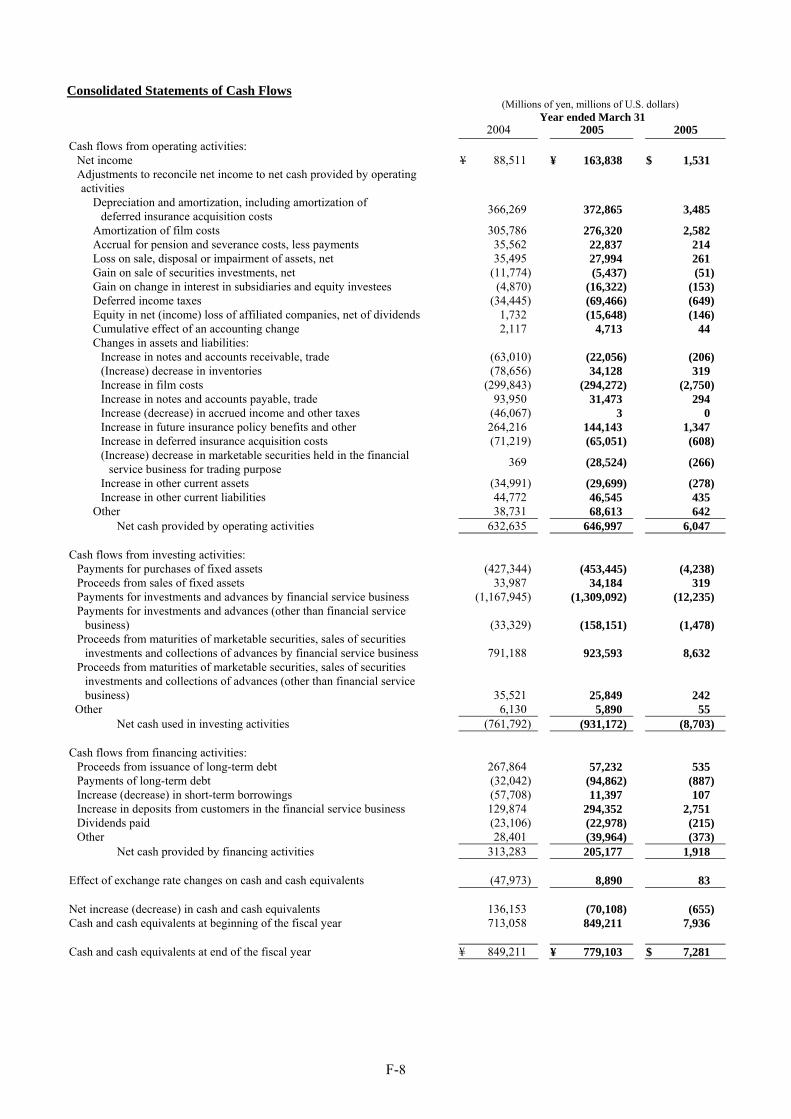
Consolidated Statements of Cash Flows (Millions of yen, millions of U.S. dollars) Year ended March 31 2004 2005 2005 Cash flows from operating activities: Net income ¥ 88,511 ¥ 163,838 $ 1,531 Adjustments to reconcile net income to net cash provided by operating
activities
Depreciation and amortization, including amortization of deferred insurance acquisition costs 366,269 372,865 3,485
Amortization of film costs 305,786 276,320 2,582 Accrual for pension and severance costs, less payments 35,562 22,837 214 Loss on sale, disposal or impairment of assets, net 35,495 27,994 261 Gain on sale of securities investments, net (11,774) (5,437) (51) Gain on change in interest in subsidiaries and equity investees (4,870) (16,322) (153) Deferred income taxes (34,445) (69,466) (649) Equity in net (income) loss of affiliated companies, net of dividends 1,732 (15,648) (146) Cumulative effect of an accounting change 2,117 4,713 44 Changes in assets and liabilities: Increase in notes and accounts receivable, trade (63,010) (22,056) (206) (Increase) decrease in inventories (78,656) 34,128 319 Increase in film costs (299,843) (294,272) (2,750) Increase in notes and accounts payable, trade 93,950 31,473 294 Increase (decrease) in accrued income and other taxes (46,067) 3 0 Increase in future insurance policy benefits and other 264,216 144,143 1,347 Increase in deferred insurance acquisition costs (71,219) (65,051) (608) (Increase) decrease in marketable securities held in the financial service business for trading purpose 369 (28,524) (266)
Increase in other current assets (34,991) (29,699) (278) Increase in other current liabilities 44,772 46,545 435
Other 38,731 68,613 642 Net cash provided by operating activities 632,635 646,997 6,047 Cash flows from investing activities: Payments for purchases of fixed assets (427,344) (453,445) (4,238) Proceeds from sales of fixed assets 33,987 34,184 319 Payments for investments and advances by financial service business (1,167,945) (1,309,092) (12,235) Payments for investments and advances (other than financial service business) (33,329) (158,151) (1,478) Proceeds from maturities of marketable securities, sales of securities investments and collections of advances by financial service business 791,188 923,593 8,632 Proceeds from maturities of marketable securities, sales of securities investments and collections of advances (other than financial service business) 35,521 25,849 242 Other 6,130 5,890 55 Net cash used in investing activities (761,792) (931,172) (8,703) Cash flows from financing activities: Proceeds from issuance of long-term debt 267,864 57,232 535 Payments of long-term debt (32,042) (94,862) (887) Increase (decrease) in short-term borrowings (57,708) 11,397 107 Increase in deposits from customers in the financial service business 129,874 294,352 2,751 Dividends paid (23,106) (22,978) (215) Other 28,401 (39,964) (373) Net cash provided by financing activities 313,283 205,177 1,918 Effect of exchange rate changes on cash and cash equivalents (47,973) 8,890 83 Net increase (decrease) in cash and cash equivalents 136,153 (70,108) (655)Cash and cash equivalents at beginning of the fiscal year 713,058 849,211 7,936 Cash and cash equivalents at end of the fiscal year ¥ 849,211 ¥ 779,103 $ 7,281

F-9
(Notes) 1. U.S. dollar amounts have been translated from yen, for convenience only, at the rate of ¥107 = U.S. $1, the approximate Tokyo
foreign exchange market rate as of March 31, 2005.
2. As of March 31, 2005, Sony had 913 consolidated subsidiaries (including variable interest entities). It has applied the equity accounting method in respect to 56 affiliated companies.
3. Sony calculates and presents per share data separately for Sony’s common stock and for the subsidiary tracking stock which is
linked to the economic value of Sony Communication Network Corporation, based on Statement of Financial Accounting Standards (“FAS”) No.128, “Earnings per Share”. The holders of the tracking stock have the right to participate in earnings, together with common stock holders. Accordingly, Sony calculates per share data by the “two-class” method based on FAS No.128. Under this method, basic net income per share for each class of stock is calculated based on the earnings allocated to each class of stock for the applicable period, divided by the weighted-average number of outstanding shares in each class during the applicable period. The earnings allocated to the subsidiary tracking stock are determined based on the subsidiary tracking stockholders’ economic interest in the targeted subsidiary’s earnings available for dividends or change in accumulated losses that do not include those of the targeted subsidiary’s subsidiaries. The earnings allocated to common stock are calculated by subtracting the earnings allocated to the subsidiary tracking stock from Sony’s net income for the period.
Weighted-average shares used for computation of earnings per share of common stock are as follows. The dilutive effect in the weighted-average shares for the three months and the year ended March 31, 2004 and 2005 mainly resulted from convertible bonds.
Weighted-average shares (Thousands of shares) Year ended March 31 2004 2005Income before cumulative effect of an accounting change and net income
— Basic 923,650 931,125 — Diluted 1,044,818 1,043,775 Weighted-average shares (Thousands of shares) Three months ended March 31 2004 2005Net income — Basic 924,439 948,950 — Diluted 924,439 948,950
By adopting the Emerging Issues Task Force (“EITF”) Issue No. 04-8, "The Effect of Contingently Convertible Instruments on Diluted Earnings per Share", issued in July 2004, diluted earnings per share of income before cumulative effect of an accounting change and net income for the year ended March 31, 2004 were restated respectively (see Note 9. Adoption of New Accounting Standards). Weighted-average shares used for computation of earnings per share of the subsidiary tracking stock for the three months and the year ended March 31, 2004 and 2005 are 3,072 thousand shares. There were no potentially dilutive securities or options granted for earnings per share of the subsidiary tracking stock.
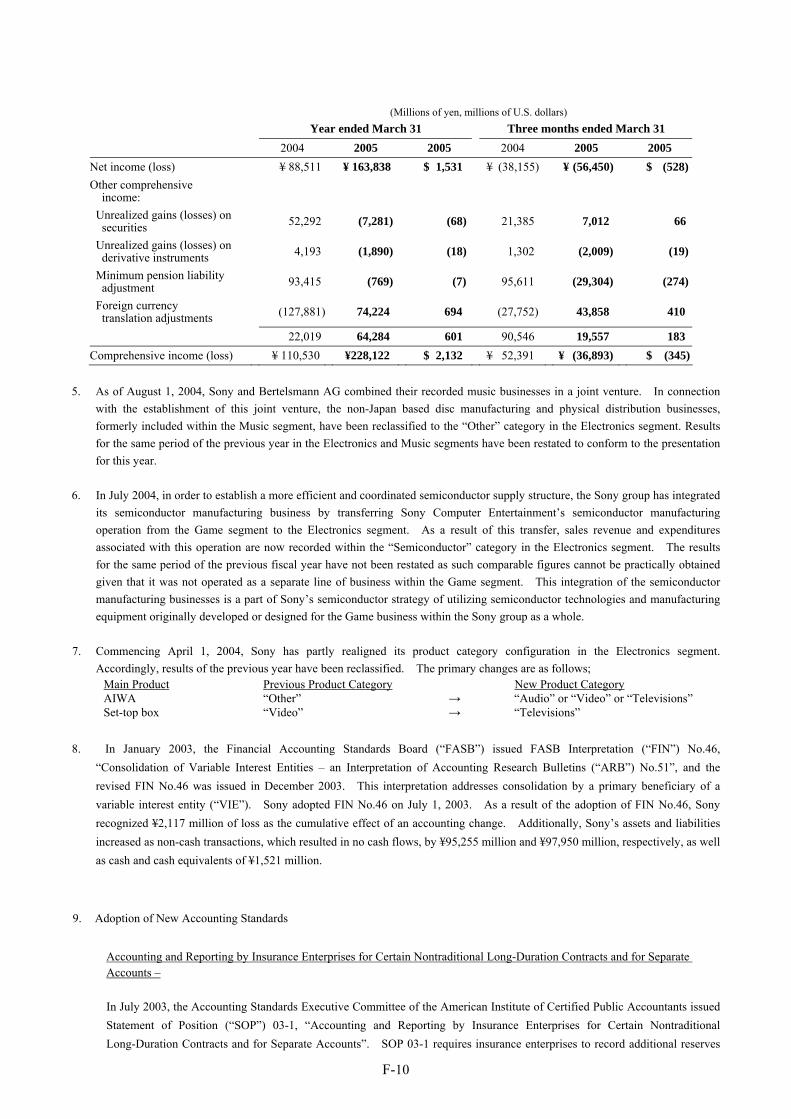
4. Sony’s comprehensive income is comprised of net income and other comprehensive income. Other comprehensive income
includes changes in unrealized gains or losses on securities, unrealized gains or losses on derivative instruments, minimum pension liability adjustment and foreign currency translation adjustments. Net income (loss), other comprehensive income and comprehensive income (loss) for the three months and the year ended March 31, 2004 and 2005 were as follows:
F-10
(Millions of yen, millions of U.S. dollars)
Year ended March 31 Three months ended March 31 2004 2005 2005 2004 2005 2005 Net income (loss) ¥ 88,511 ¥ 163,838 $ 1,531 ¥ (38,155) ¥ (56,450) $ (528)Other comprehensive
income:
Unrealized gains (losses) on securities 52,292 (7,281) (68) 21,385 7,012 66
Unrealized gains (losses) on derivative instruments 4,193 (1,890) (18) 1,302 (2,009) (19)
Minimum pension liability adjustment 93,415 (769) (7) 95,611 (29,304) (274)
Foreign currency translation adjustments (127,881) 74,224 694 (27,752) 43,858 410
22,019 64,284 601 90,546 19,557 183Comprehensive income (loss) ¥ 110,530 ¥228,122 $ 2,132 ¥ 52,391 ¥ (36,893) $ (345)
5. As of August 1, 2004, Sony and Bertelsmann AG combined their recorded music businesses in a joint venture. In connection
with the establishment of this joint venture, the non-Japan based disc manufacturing and physical distribution businesses, formerly included within the Music segment, have been reclassified to the “Other” category in the Electronics segment. Results for the same period of the previous year in the Electronics and Music segments have been restated to conform to the presentation for this year.
6. In July 2004, in order to establish a more efficient and coordinated semiconductor supply structure, the Sony group has integrated
its semiconductor manufacturing business by transferring Sony Computer Entertainment’s semiconductor manufacturing operation from the Game segment to the Electronics segment. As a result of this transfer, sales revenue and expenditures associated with this operation are now recorded within the “Semiconductor” category in the Electronics segment. The results for the same period of the previous fiscal year have not been restated as such comparable figures cannot be practically obtained given that it was not operated as a separate line of business within the Game segment. This integration of the semiconductor manufacturing businesses is a part of Sony’s semiconductor strategy of utilizing semiconductor technologies and manufacturing equipment originally developed or designed for the Game business within the Sony group as a whole.
7. Commencing April 1, 2004, Sony has partly realigned its product category configuration in the Electronics segment.
Accordingly, results of the previous year have been reclassified. The primary changes are as follows; Main Product Previous Product Category New Product Category AIWA “Other” → “Audio” or “Video” or “Televisions” Set-top box “Video” → “Televisions”
8. In January 2003, the Financial Accounting Standards Board (“FASB”) issued FASB Interpretation (“FIN”) No.46,
“Consolidation of Variable Interest Entities – an Interpretation of Accounting Research Bulletins (“ARB”) No.51”, and the revised FIN No.46 was issued in December 2003. This interpretation addresses consolidation by a primary beneficiary of a variable interest entity (“VIE”). Sony adopted FIN No.46 on July 1, 2003. As a result of the adoption of FIN No.46, Sony recognized ¥2,117 million of loss as the cumulative effect of an accounting change. Additionally, Sony’s assets and liabilities increased as non-cash transactions, which resulted in no cash flows, by ¥95,255 million and ¥97,950 million, respectively, as well as cash and cash equivalents of ¥1,521 million.
9. Adoption of New Accounting Standards
Accounting and Reporting by Insurance Enterprises for Certain Nontraditional Long-Duration Contracts and for Separate Accounts – In July 2003, the Accounting Standards Executive Committee of the American Institute of Certified Public Accountants issued Statement of Position (“SOP”) 03-1, “Accounting and Reporting by Insurance Enterprises for Certain Nontraditional Long-Duration Contracts and for Separate Accounts”. SOP 03-1 requires insurance enterprises to record additional reserves

F-11
for long-duration life insurance contracts with minimum guarantee or annuity receivable options. Additionally, SOP 03-1 provides guidance for the presentation of separate accounts. This statement is effective for fiscal years beginning after December 15, 2003. Sony adopted SOP 03-1 on April 1, 2004. As a result of the adoption of SOP 03-1, Sony’s operating income decreased by ¥1,595 million ($15 million) and ¥5,156 million ($48 million) for the three months and the year ended March 31, 2005, respectively. Additionally, on April 1, 2004, Sony recognized ¥4,713 million ($44 million) of loss (net of income taxes of ¥2,675 million) as a cumulative effect of an accounting change. In addition, the separate account assets, which are defined by insurance business law in Japan and were previously included in “Security investments and other” on the consolidated balance sheet, were excluded from the category of separate accounts under the provision of SOP 03-1. Accordingly, the separate account assets are now treated as general accounts and included in “Marketable securities” on the consolidated balance sheet. The Effect of Contingently Convertible Instruments on Diluted Earnings per Share – In July 2004, the EITF issued EITF Issue No. 04-8, "The Effect of Contingently Convertible Instruments on Diluted Earnings per Share". In accordance with FAS No.128, Sony had not included in the computation of diluted earnings per share (“EPS”) the number of potential common stock upon the conversion of contingently convertible debt instruments (“Co-Cos”) that have not met the conditions to exercise the stock acquisition rights. EITF Issue No. 04-8 requires that the maximum number of common stock that could be issued upon the conversion of Co-Cos be included in diluted EPS computations from the date of issuance regardless of whether the conditions to exercise the rights have been met. EITF Issue No. 04-8 is effective for reporting periods ending after December 15, 2004. Sony adopted EITF Issue No. 04-8 during the quarter ended December 31, 2004. As a result of the adoption of EITF Issue No. 04-8, Sony’s diluted EPS of income before cumulative effect of an accounting change and net income for the year ended March 31, 2004 were restated respectively. Sony’s diluted EPS of income before cumulative effect of an accounting change and net income for the year ended March 31, 2005 were decreased by ¥7.26 ($0.07) and ¥7.06 ($0.07), respectively, compared to those before adopting EITF Issue No. 04-8.
Other Consolidated Financial Data (Millions of yen, millions of U.S. dollars) Year ended March 31 2004 2005 Change 2005 Capital expenditures (additions to property, plant and equipment) ¥ 378,264 ¥ 356,818 -5.7% $ 3,335 Depreciation and amortization expenses* 366,269 372,865 +1.8 3,485 (Depreciation expenses for tangible assets) (286,911) (300,752) (+4.8) (2,811)Research and development expenses 514,483 502,008 -2.4 4,692 Three months ended March 31 2004 2005 Change 2005 Capital expenditures (additions to property, plant and equipment) ¥ 109,582 ¥ 99,996 -8.7% $ 935 Depreciation and amortization expenses* 99,339 104,125 +4.8 973 (Depreciation expenses for tangible assets) (76,485) (83,672) (+9.4) (782)Research and development expenses 140,368 131,978 -6.0 1,233 * Including amortization expenses for intangible assets and for deferred insurance acquisition costs
F-12
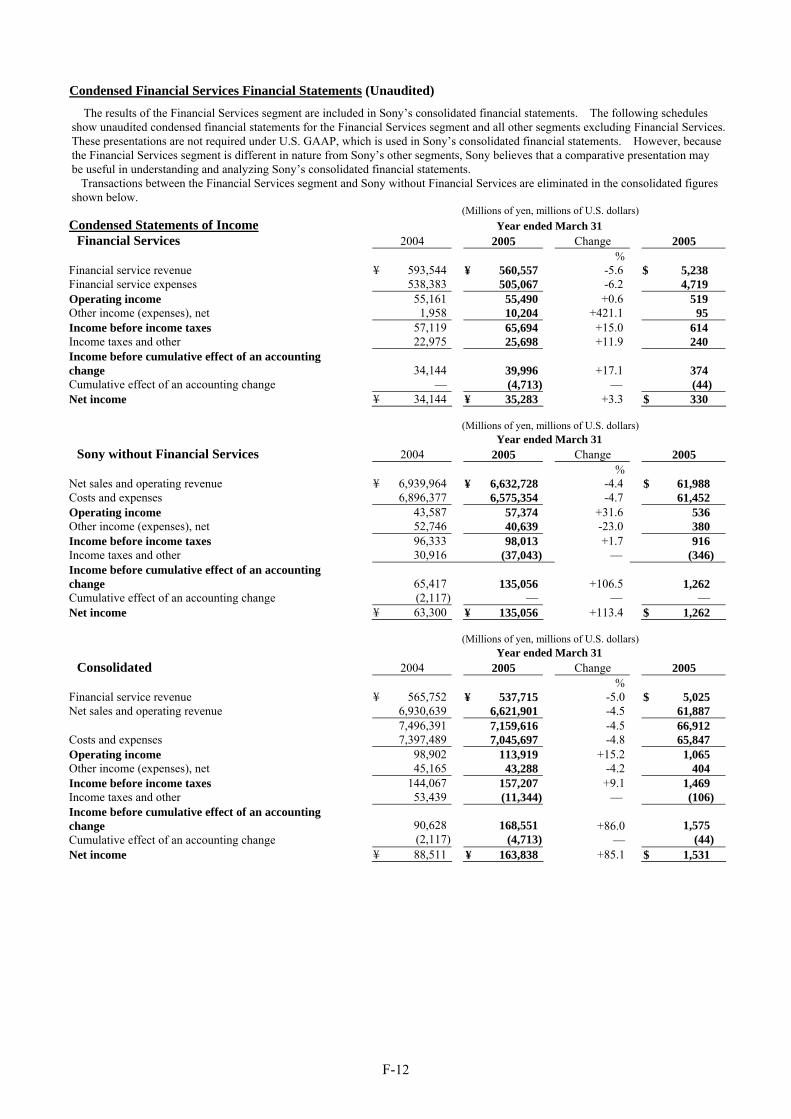
Condensed Financial Services Financial Statements (Unaudited)
The results of the Financial Services segment are included in Sony’s consolidated financial statements. The following schedules show unaudited condensed financial statements for the Financial Services segment and all other segments excluding Financial Services. These presentations are not required under U.S. GAAP, which is used in Sony’s consolidated financial statements. However, because the Financial Services segment is different in nature from Sony’s other segments, Sony believes that a comparative presentation may be useful in understanding and analyzing Sony’s consolidated financial statements. Transactions between the Financial Services segment and Sony without Financial Services are eliminated in the consolidated figures shown below. (Millions of yen, millions of U.S. dollars) Condensed Statements of Income Year ended March 31
Financial Services 2004 2005 Change 2005 % Financial service revenue ¥ 593,544 ¥ 560,557 -5.6 $ 5,238 Financial service expenses 538,383 505,067 -6.2 4,719 Operating income 55,161 55,490 +0.6 519 Other income (expenses), net 1,958 10,204 +421.1 95 Income before income taxes 57,119 65,694 +15.0 614 Income taxes and other 22,975 25,698 +11.9 240 Income before cumulative effect of an accounting change 34,144 39,996 +17.1 374 Cumulative effect of an accounting change — (4,713) — (44) Net income ¥ 34,144 ¥ 35,283 +3.3 $ 330 (Millions of yen, millions of U.S. dollars) Year ended March 31 Sony without Financial Services 2004 2005 Change 2005
% Net sales and operating revenue ¥ 6,939,964 ¥ 6,632,728 -4.4 $ 61,988 Costs and expenses 6,896,377 6,575,354 -4.7 61,452 Operating income 43,587 57,374 +31.6 536 Other income (expenses), net 52,746 40,639 -23.0 380 Income before income taxes 96,333 98,013 +1.7 916 Income taxes and other 30,916 (37,043) — (346) Income before cumulative effect of an accounting change 65,417 135,056 +106.5 1,262 Cumulative effect of an accounting change (2,117) — — — Net income ¥ 63,300 ¥ 135,056 +113.4 $ 1,262 (Millions of yen, millions of U.S. dollars) Year ended March 31 Consolidated 2004 2005 Change 2005
% Financial service revenue ¥ 565,752 ¥ 537,715 -5.0 $ 5,025 Net sales and operating revenue 6,930,639 6,621,901 -4.5 61,887 7,496,391 7,159,616 -4.5 66,912 Costs and expenses 7,397,489 7,045,697 -4.8 65,847 Operating income 98,902 113,919 +15.2 1,065 Other income (expenses), net 45,165 43,288 -4.2 404 Income before income taxes 144,067 157,207 +9.1 1,469 Income taxes and other 53,439 (11,344) — (106) Income before cumulative effect of an accounting change +86.0 Cumulative effect of an accounting change
90,628 (2,117)
168,551 (4,713) —
1,575 (44)
Net income ¥ 88,511 ¥ 163,838 +85.1 $ 1,531

F-13
(Millions of yen, millions of U.S. dollars) Condensed Statements of Income Three months ended March 31
Financial Services 2004 2005 Change 2005 % Financial service revenue ¥ 152,141 ¥ 156,109 +2.6 $ 1,459 Financial service expenses 134,949 139,807 +3.6 1,306 Operating income 17,192 16,302 -5.2 153 Other income (expenses), net (92) 450 — 4 Income before income taxes 17,100 16,752 -2.0 157 Income taxes and other 7,103 6,841 -3.7 64 Net income ¥ 9,997 ¥ 9,911 -0.9 $ 93 (Millions of yen, millions of U.S. dollars) Three months ended March 31 Sony without Financial Services 2004 2005 Change 2005
% Net sales and operating revenue ¥ 1,630,452 ¥ 1,549,209 -5.0 $ 14,479 Costs and expenses 1,757,683 1,643,498 -6.5 15,360 Operating income (loss) (127,231) (94,289) — (881) Other income (expenses), net 16,551 15,644 -5.5 146 Income (loss) before income taxes (110,680) (78,645) — (735) Income taxes and other (62,419) (12,285) — (115) Net income (loss) ¥ (48,261) ¥ (66,360) — $ (620) (Millions of yen, millions of U.S. dollars) Three months ended March 31 Consolidated 2004 2005 Change 2005
% Financial service revenue ¥ 144,679 ¥ 150,887 +4.3 $ 1,410 Net sales and operating revenue 1,627,512 1,546,134 -5.0 14,450 1,772,191 1,697,021 -4.2 15,860 Costs and expenses 1,881,947 1,774,434 -5.7 16,583 Operating income (loss) (109,756) (77,413) — (723) Other income (expenses), net 16,183 15,520 -4.1 145 Income (loss) before income taxes (93,573) (61,893) — (578) Income taxes and other (55,418) (5,443) — (50) Net income (loss) ¥ (38,155) ¥ (56,450) — $ (528)

F-14
Condensed Balance Sheets (Millions of yen, millions of U.S. dollars) Financial Services March 31
ASSETS 2004 2005 2005 Current assets: Cash and cash equivalents ¥ 256,316 ¥ 259,371 $ 2,424 Marketable securities 270,676 456,130 4,263 Notes and accounts receivable, trade 72,273 77,023 720 Other 100,433 197,667 1,847 699,698 990,191 9,254 Investments and advances 2,274,510 2,378,966 22,233 Property, plant and equipment 40,833 38,551 360 Other assets: Deferred insurance acquisition costs 349,194 374,805 3,503 Other 110,804 103,004 963 459,998 477,809 4,466 ¥ 3,475,039 ¥ 3,885,517 $ 36,313 LIABILITIES AND STOCKHOLDERS’ EQUITY Current liabilities: Short-term borrowings ¥ 86,748 ¥ 45,358 $ 424 Notes and accounts payable, trade 7,847 7,099 66 Deposits from customers in the banking business 378,851 546,718 5,110 Other 175,357 109,438 1,023 648,803 708,613 6,623 Long-term liabilities: Long-term debt 135,811 135,750 1,269 Accrued pension and severance costs 10,183 14,362 134 Future insurance policy benefits and other 2,178,626 2,464,295 23,031 Other 126,349 142,272 1,329 2,450,969 2,756,679 25,763 Minority interest in consolidated subsidiaries — 5,476 51 Stockholders’ equity 375,267 414,749 3,876 ¥ 3,475,039 ¥ 3,885,517 $ 36,313 (Millions of yen, millions of U.S. dollars) Sony without Financial Services March 31
ASSETS 2004 2005 2005 Current assets: Cash and cash equivalents ¥ 592,895 ¥ 519,732 $ 4,857 Marketable securities 4,072 4,072 38 Notes and accounts receivable, trade 943,590 952,692 8,904 Other 1,151,879 1,116,353 10,433 2,692,436 2,592,849 24,232 Film costs 256,740 278,961 2,607 Investments and advances 358,629 445,446 4,163 Investments in Financial Services, at cost 176,905 187,400 1,751 Property, plant and equipment 1,324,211 1,333,848 12,466 Other assets 1,251,901 1,189,398 11,117 ¥ 6,060,822 ¥ 6,027,902 $ 56,336 LIABILITIES AND STOCKHOLDERS’ EQUITY Current liabilities: Short-term borrowings ¥ 409,766 ¥ 204,027 $ 1,907 Notes and accounts payable, trade 773,221 801,252 7,488 Other 1,190,563 1,132,201 10,581 2,373,550 2,137,480 19,976 Long-term liabilities: Long-term debt 775,233 627,367 5,863 Accrued pension and severance costs 358,199 338,040 3,159 Other 348,946 263,520 2,464 1,482,378 1,228,927 11,486 Minority interest in consolidated subsidiaries 17,554 18,471 173 Stockholders’ equity 2,187,340 2,643,024 24,701 ¥ 6,060,822 ¥ 6,027,902 $ 56,336
F-15
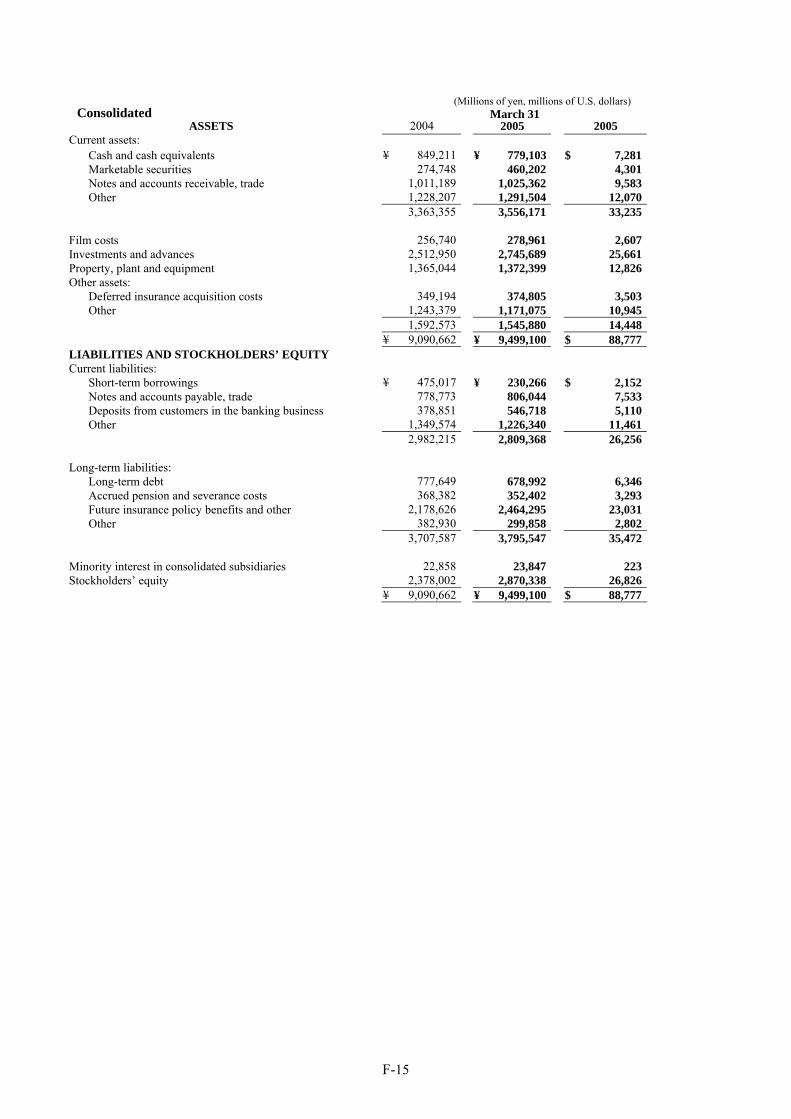
(Millions of yen, millions of U.S. dollars) Consolidated March 31
ASSETS 2004 2005 2005 Current assets: Cash and cash equivalents ¥ 849,211 ¥ 779,103 $ 7,281 Marketable securities 274,748 460,202 4,301 Notes and accounts receivable, trade 1,011,189 1,025,362 9,583 Other 1,228,207 1,291,504 12,070 3,363,355 3,556,171 33,235 Film costs 256,740 278,961 2,607 Investments and advances 2,512,950 2,745,689 25,661 Property, plant and equipment 1,365,044 1,372,399 12,826 Other assets: Deferred insurance acquisition costs 349,194 374,805 3,503 Other 1,243,379 1,171,075 10,945 1,592,573 1,545,880 14,448 ¥ 9,090,662 ¥ 9,499,100 $ 88,777 LIABILITIES AND STOCKHOLDERS’ EQUITY Current liabilities: Short-term borrowings ¥ 475,017 ¥ 230,266 $ 2,152 Notes and accounts payable, trade 778,773 806,044 7,533 Deposits from customers in the banking business 378,851 546,718 5,110 Other 1,349,574 1,226,340 11,461 2,982,215 2,809,368 26,256 Long-term liabilities: Long-term debt 777,649 678,992 6,346 Accrued pension and severance costs 368,382 352,402 3,293 Future insurance policy benefits and other 2,178,626 2,464,295 23,031 Other 382,930 299,858 2,802 3,707,587 3,795,547 35,472 Minority interest in consolidated subsidiaries 22,858 23,847 223 Stockholders’ equity 2,378,002 2,870,338 26,826 ¥ 9,090,662 ¥ 9,499,100 $ 88,777

F-16
(Millions of yen, millions of U.S. dollars) Condensed Statements of Cash Flows Year ended March 31
Financial Services 2004 2005 2005 Net cash provided by operating activities ¥ 241,627 ¥ 168,078 $ 1,571Net cash used in investing activities (401,550) (421,384) (3,938)Net cash provided by financing activities 141,696 256,361 2,396Net increase (decrease) in cash and cash equivalents (18,227) 3,055 29Cash and cash equivalents at beginning of the fiscal year 274,543 256,316 2,395Cash and cash equivalents at end of the fiscal year ¥ 256,316 ¥ 259,371 $ 2,424 (Millions of yen, millions of U.S. dollars) Year ended March 31 Sony without Financial Services 2004 2005 2005
Net cash provided by operating activities ¥ 401,090 ¥ 485,439 $ 4,537Net cash used in investing activities (352,496) (472,119) (4,412)Net cash provided by (used in) financing activities 153,759 (95,373) (892)Effect of exchange rate changes on cash and cash equivalents (47,973) 8,890 83Net increase (decrease) in cash and cash equivalents 154,380 (73,163) (684)Cash and cash equivalents at beginning of the fiscal year 438,515 592,895 5,541Cash and cash equivalents at end of the fiscal year ¥ 592,895 ¥ 519,732 $ 4,857 (Millions of yen, millions of U.S. dollars) Year ended March 31 Consolidated 2004 2005 2005
Net cash provided by operating activities ¥ 632,635 ¥ 646,997 $ 6,047Net cash used in investing activities (761,792) (931,172) (8,703)Net cash provided by financing activities 313,283 205,177 1,918Effect of exchange rate changes on cash and cash equivalents (47,973) 8,890 83Net increase (decrease) in cash and cash equivalents 136,153 (70,108) (655)Cash and cash equivalents at beginning of the fiscal year 713,058 849,211 7,936Cash and cash equivalents at end of the fiscal year ¥ 849,211 ¥ 779,103 $ 7,281