new trends in application of photo and electro...
TRANSCRIPT

1
New trends in application of
photo and electro catalysis
Proceedings of the 7th
Czech-Austrian workshop
Josef Krýsa
EDITOR
25th – 27
th May 2015
Hnanice, Czech Republic

2
© Josef Krýsa, 2015
Typo Design © Pavel Krýsa, 2015
Cover Design © Jan Žalud, 2015
Published by the University of Chemistry and Technology, Prague, Technická 5, 166 28
Praha 6, Czech Republic
Printed by KANAG – TISK, s.r.o., Technická 1905/5, 160 00 Praha 6
ISBN 978-80-7080-931-0

3
PREFACE
Czech - Austrian workshops „New trends in application of photo and electro catalysis“
represent a successful series of the conferences organized jointly by the University of
Chemistry and Technology, Prague and Vienna University of Technology. The first Czech –
Austrian workshop was held in November 2006 in Hnanice, Czech Republic. The 2nd
workshop was held in December 2008 in Telč, the 3rd
, 4th
, 5th
and 6th
workshops were held in
in Hnanice in 2009, 2011, 2012 and 2013, respectively.
The 7th
Czech - Austrian workshop „New trends in application of photo and electro
catalysis“ was held in Hnanice, Czech Republic from 25th
to 27th
May 2015. Participants were
from six Czech institutions: University of Chemistry and Technology, Prague; Jaroslav
Heyrovsky Institute of Physical Chemistry, Academy of Sciences of the Czech Republic;
Institute of Chemical Process Fundamentals, Academy of Sciences of the Czech Republic;
Faculty of Chemical Technology, Technical University Brno, Institute of Physics, Academy
of Sciences of the Czech Republic and University of South Bohemia in České Budějovice,
two Austrian institutions: Vienna University of Technology and University of Salzburg and
one French institution: CNRS/Université de Versailles.
The objective of the workshop was to further intensify the exchange of experience and new
ideas in the field of semiconductor photocatalysis and photoelectrochemistry, dye sensitised
solar cells, electrochemically prepared self organised structures, fuel cells, electrochemical
engineering and modelling of electrochemical processes. Workshop was especially useful for
PhD students who could present their results at the international forum.
The positive aspect of the workshop was the participation of colleagues from University of
Salzburg. This time there were no participants from other European countries (Slovakia,
Germany and Slovenia) as was the case of previous workshops. But it is believed that this
situation will change and the next bilateral Czech – Austrian workshop will have more
attendees from other European countries. Especially due to the fact that next (8th
) workshop is
planned to be organised in autumn 2016 where we will celebrate the 10 years anniversary in
the history of Czech – Austrian workshops „New trends in application of photo and electro
catalysis“.
Josef Krýsa and Guenter Fafilek
Acknowledgement The workshop and proceedings were financially supported by the Ministry of Education,
Youth and Sports of the Czech Republic and OEAD Austria (project number Aktion 72p6).
Financováno z prostředků programu AKTION Česká republika - Rakousko, spolupráce ve
vědě a vzdělávání.
The event is co-funded by AKTION CR – Austria programme.

4
5
Content
List of authors ............................................................................................................................. 6
List of participants ...................................................................................................................... 7
Programme of the Workshop ..................................................................................................... 8
Diamond Electrode for Dye-Sensitized Solar Cell ................................................................... 11
Porphyrin Adsorption Studies on MgO Nanocubes ................................................................. 13
Experimental Results of La0.8Sr0.2CrO3 / SrTiO3(100) Heterostructure Used for a
Hightemperature Photovoltaic Cell .......................................................................................... 14
Photocathodes for Dye-Sensitized Solar Cells ......................................................................... 17
Electrocoagulation: Electrochemistry in Wastewater Treatment ............................................. 19
Removal of Toxic Metals by Electrocoagulation Using Mild Steel and Aluminum Electrodes
.................................................................................................................................................. 20
Titanium Dioxide Photocatalyst Prepared by Lyophilization From Titanyl Sulphate: Activity
in UV and Visible Light ........................................................................................................... 22
Inks Containing Resazurin and Acid Violet 7 as a Testing Method for Self-Cleaning Paints . 24
Photoelectrochemical Hydrogen Production on TiO2 And Fe2O3 Thin Films ......................... 26
1-D Nanostructures of TiO2 and Fe2O3 for Electrochemical Water Splitting – Review .......... 28
Hydrogen Permeability of Selected Proton Exchange Membranes in Water Electrolyis Process
.................................................................................................................................................. 30
Effect of Operating Conditions and Anode Composition on Kinetic Parameters of Oxygen
Evolution Reaction in SOEC .................................................................................................... 32
Enhanced PEC Water Splitting Efficiency of Hematite Thin Photoanodes – the Role of
Texture ...................................................................................................................................... 34
WO3 Films for Photo-Electrochemical Water Splitting ........................................................... 36
Defects in Wet-Chemically Synthesized WO3 Nanostructures: Impact on
Photoelectrocatalytic Properties ............................................................................................... 38
Origin of Electrocatalytic Activity of the RGO Towards Hydrogen Evolution Reaction in an
Alkaline Water Electrolysis ...................................................................................................... 39
Sol-Gel TiO2 Blocking Layers: Electrochemical Properties and Electrochemical Doping ..... 41
Printed Titania Photoanodes with Organosilica Binder ........................................................... 43
Inkjet Printed Interdigitated Conductivity Sensors .................................................................. 45
Influence of pH on the Photocatalytic Treatment of Cyanide .................................................. 48
Mechanism of H3PO3 Electrochemical Oxidation on Platinum in Context of High
Temperature PEM Fuel Cell Operation .................................................................................... 50
Analysis of Mass and Charge Distribution in HT PEM Fuel Cell Stack by 3D Mathematical
Model ........................................................................................................................................ 52
Electrochemical Preparation of Nanostructured Photocatalytic TiO2 Layers .......................... 54
The Synthesis of One-Dimensional TiO2 Nanostructures and Study on their Electrochemical
Behaviors .................................................................................................................................. 56

6
List of authors
Anta J. A. ................................................38
Bastl Z. ....................................................41
Baudys M. ..............................................24
Berger T. ...........................................13, 38
Boubínová R. ..........................................20
Bousa M. .................................................41
Bouzek K. .......................30, 32, 39, 50, 52
Brüger A. ................................................48
Brunauer G. ............................................14
Bystroň T. ...............................................50
Chanda D. ...............................................39
Čada M. ..................................................34
Diwald O. ................................................13
Dobrota A. ..............................................39
Drakselová M. ........................................52
Drbohlavová J. ........................................54
Dzik P. ..............................................43, 45
Fafilek G. ..........................................14, 48
Gao F. .....................................................17
Haenen K. ...............................................17
Han H. .....................................................56
Havlíček D. .............................................41
Hnát J. .....................................................39
Hubička Z. ........................................26, 34
Karas F. ...................................................32
Kavan L. .....................................11, 17, 41
Klusáčková M. ........................................46
Klusoň P. ..........................................19, 20
Kment Š. ....................................26, 28, 34
Kodým R. .........................................32, 52
Krýsa J. ....................22, 24, 26, 28, 34, 36
Krýsová H. .............................................17
Krystynik P. ......................................20, 21
Krystynik P. .....................................19, 20
Maes W. ..................................................17
Mališ J. ....................................................30
Márquez A. .............................................38
Morozová M. ..........................................26
Nebel C. E. ..............................................17
Neumann-Spallart M. .................43, 45, 48
Olejníček J. .............................................34
Oskam G. ................................................38
Ponweiser K. ...........................................14
Paidar M. ....................................30, 32, 39
Pasti I. .....................................................39
Paušová Š. ...............................................28
Petrák V. .................................................17
Pližingrová E. .........................................22
Prokop M. ...............................................50
Přikrylová K. .........................................54
Rodríguez M. ..........................................38
Rotter B. ..................................................14
Schneider J. .............................................13
Šnita D. ...................................................52
Šubrt J. ....................................................22
Tarábková H. ..........................................46
Tito D. ..............................................19, 20
Verstappen P. ..........................................17
Veselý M. .........................................43, 45
Walch G. .................................................14
Yeap W. S. ..............................................17
Zbořil R. ..................................................34
Zlámal M. .........................................26, 36
Zukalová M. ............................................41

7
List of participants
Austria Vienna University of Technology,
Institute of Chemical Technologies
and Analytics
Assoc. Prof. Dr. Guenter Fafilek
Dr. Andreas Brueger
Georg Brunauer, M.Sc
University of Salzburg, Dept. of
Materials Science and Physics
Prof. Oliver Diwald
Dr. Thomas Berger
Augusto Márquez, M.Sc.
Johannes Schneider, M.Sc.
Czech Republic University of Chemistry and Technology,
Prague, Dept. of Inorganic Technology
Prof. Dr. Ing. Karel Bouzek
Prof. Dr. Ing. Josef Krýsa
Doc. Ing. Martin Paidar
Ing. Hana Bartková, Ph.D.
Ing. Šárka Paušová, Ph.D.
Ing. Martin Zlámal, Ph.D.
Ing. Michal Baudys
Ing. Michaela Brunclíková
Ing. Monika Drakselová
Ing. Debabrata Chanda
Ing. Filip Karas
Ing. Jakub Mališ
Ing. Eva Pližingrová
Ing. Martin Prokop
J. Heyrovský Institute of Physical
Chemistry AS CR
Prof. Ladislav Kavan, DSc.
Ing. Hana Krýsová, Ph.D.
RNDr. Markéta Zukalová, PhD.
Institute of Chemical Process
Fundamentals AS CR
Ing. Pavel Krystyník, Ph.D.
Duarte N. Tito, M.Sc., Ph.D.
Institute of Physics AS CR
RNDr. Zdeněk Hubička, PhD.
Ing. Štěpán Kment, PhD.
Hyungkyu Han, M.Sc.
Brno University of Technology
Faculty of Chemistry
Doc. Ing. Michal Veselý, Ph.D.
Ing. Petr Dzik, Ph.D.
Faculty of Electrical Engineering and
Communication
Ing. Jana Drbohlavová, Ph.D.
Ing. Kateřina Přikrylová
University of South Bohemia in
České Budějovice
Mgr. Pavel Černý
Other countries CNRS/Université de Versailles, France
Dr. Michael Neumann-Spallart

8
Programme of the Workshop
Monday, 25th
May
12.30-13.00 – arrival
13.00-13.30 – registration of participants
13.30 – welcome talk
Chair: Josef Krýsa
13.40 Ladislav Kavan
Diamond Electrode for Dye-Sensitized Solar Cell
14.10 Johannes Schneider, Thomas Berger, Oliver Diwald
Porphyrin Adsorption Studies on MgO Nanocubes
14.30 Zdeněk Hubička, Štepán Kment, Martin Čada
Effect of the Substrate Ion Bombardment During Reactive Pulsed Sputtering Deposition of
Thin Films
14.50 Georg Brunauer, G. Walch, B. Rotter, E. Esmaeili, A. K. Opitz, G. Fafilek, K.
Ponweiser, J. Fleig
Experimental Investigation of La1-xSrxCrO3/SrTiO3(100) Heterostructure Used for a High-
Temperature Photovoltaic Cell
15.10-15.40 – coffee break
Chair: Michael Neumann-Spallart
15.40 Hana Krýsová, V. Petrák, W.S.Yeap, Ch.E. Nebel, K. Haenen, L. Kavan
Photocathodes for Dye-Sensitized Solar Cells
16.00 Duarte N. Tito
Electrocoagulation – Electrochemistry in Wastewater Treatment
16.20 Pavel Krystyník, Petr Klusoň, Duarte N. Tito, R. Boubínová
Removal of Toxic Metals by Electrocoagulation Using Stainless Steel and Aluminum
Electrodes
16.40 Eva Pližingrová, Jan Šubrt, Josef Krýsa
Titanium Dioxide Photocatalyst Prepared by Lyophilization from Titanyl Sulphate: Activity
in UV and Visible Light
17.00 Michal Baudys, Josef Krýsa
Inks Containing Resazurin and Acid Violet 7 as a Testing Method for Self-Cleaning Paints
19.30 – common dinner

9
Tuesday, 26th
May
Chair: Oliver Diwald
9.00 Josef Krýsa, Magda Morozová, Martin Zlámal, Štěpán Kment, Zdeněk Hubička
Photoelectrochemical Hydrogen Evolution witn n-Type Semiconductor Photoanode
9.20 Šárka Paušová, Štěpán Kment, Josef Krýsa
1-D Nanostructures of TiO2 and Fe2O3 for Photoelectrochemical Water Splitting – Review
9.40 Jakub Mališ, Martin Paidar, Karel Bouzek
Hydrogen Permeability of Selected Proton Exchange Membranes in Water Electrolysis
Process
10.00 Filip Karas, Roman Kodým, Martin Paidar, Karel Bouzek
Effect of Operating Conditions on Kinetic Parameters of Oxygen Evolution Reaction in
SOEC
10.20-10.50 – coffee break
Chair: Ladislav Kavan
10.50 Štěpán Kment, Zdeněk Hubička, Josef Krýsa, Z. Remeš, J. Tuček, J. Olejníček, Radek
Zbořil
Enhanced PEC Water Splitting Efficiency of Hematite Thin Photoanodes – the Role of
Substrate Type
11.10 Martin Zlámal, Josef Krýsa
Tungsten Oxide Layers for Photoelectrochemical Water Splitting
11.30 Augusto Márquez, Manuel Rodríguez, Juan A. Anta, Gerko Oskam, Thomas Berger
Defects in Wet-Chemically Synthesized WO3 Nanostructures: Impact on Photoelectro-
catalytic Properties
11.50 Debabrata Chanda, A. Dobrota, Jaromír Hnát, Martin Paidar, Igor Pasti, Karel
Bouzek
Origin of Electrocatalytic Activity of the RGO towards Hydrogen Evolution Reaction in
an Alkaline Water Electrolysis
12.10 – lunch
14.00-18.00 – individual discussions
19.30 – common dinner
21.00 – Informal discussions of teachers, young researchers and PhD students about the
aspects and experiences from Czech-Austrian exchange programme

10
Wednesday, 27th
May
Chair: Karel Bouzek
9.00 Markéta Zukalová
Sol-Gel TiO2 Blocking Layers: Electrochemical Properties and Electrochemical Doping
9.20 Petr Dzik, Michael Neumann Spallart, Michal Veselý, Mária Veselá
Ink Jet Printing of Nanoparticulate Titania Consolidated by Organosilica Binder and
Application Examples - Part I
9.40 Petr Dzik, Michael Neumann Spallart, Michal Veselý, Mária Veselá
Ink Jet Printing of Nanoparticulate Titania Consolidated by Organosilica Binder and
Application Examples – Part II
10.00 Andreas Brüger, Guenter Fafilek, Michael Neumann-Spallart
Influence of pH on the Photocatalytic Treatment of Cyanide
10.20-11.00 – coffee break, check out from the hotel
Chair: Guenter Fafilek
11.00 Martin Prokop, Tomáš Bystroň, Karel Bouzek
Mechanism of H3PO3 Electrochemical Oxidation on Pt in Context of High Temperature PEM
Fuel Cell Operation.
11.20 Monika Drakselová, Roman Kodým, Dalimil Šnita, Karel Bouzek
Analysis of Mass and Charge Distribution in HT PEM Fuel Cell Stack by 3D Mathematical
Model
11.40 Kateřina Přikrylová, Jana Drbohlavová
Electrochemical Preparation of Nanostructured Photocatalytic TiO2 Layers
12.00 Hyungkyu Han
The Synthesis of One-Dimensional TiO2 Nanostructures and Study on Their
Electrochemical Behaviors
12.30 – final remarks
13.00 – lunch
14.00 – departures

11
DIAMOND ELECTRODE FOR DYE-SENSITIZED SOLAR CELL
L. Kavan
J. Heyrovský Institute of Physical Chemistry, v.v.i., Academy of Sciences of the Czech
Republic, Dolejškova 3, CZ-18223 Prague 8, Czech Republic ([email protected])
Dye-sensitized solar cell (DSC) is based on spectral sensitization of wide-band gap
semiconductor electrodes to visible light. The most successful device employing n-TiO2
photoanode achieved 13 % solar conversion efficiency [1]. A mirror alternative of this solar
cell uses dye-sensitized photocathode, such as p-NiO. However, the efficiency of p-DSC is
still by a factor of 10 smaller [2,3].
B-doped nanocrystalline diamond (BDD) is outperforming p-NiO in chemical and
electrochemically stability [4], optical transparency [5,6] and high hole diffusion coefficient
(2-30 cm2/s) [7] (cf. the value for p-NiO, 4∙10
-8 cm
2/s). [8] Under 1 sun illumination
(AM1.5G; 100 mW/cm2) the sensitized p-NiO can deliver short-circuit photocurrents of ca. 5
mA/cm2, but the BDD electrode provided photocurrents by 3 orders of magnitude smaller. [6]
Hence, the improvement of p-DSC with diamond photocathode is currently attracting
dynamic research activities. [6,9-14]
Nanocrystalline boron doped diamond films are grown by a microwave plasma enhanced
chemical vapor deposition. [15,16] Electrochemical impedance spectroscopy can provide the
flatband potentials and concentrations of acceptors, which relate to the B-concentrations from
the neutron depth profiling. Electrochemical cleaning of the surface from sp2 carbon
impurities was demonstrated by Raman spectroscopy. [15]
Spectral sensitization of diamond surface by organic dyes has been pioneered in 2008 by
Zhong et al.[10] who anchored covalently dicyanovinyl-bithiophene and C60-bithophene
through Suzuki coupling to H-terminated BDD. They observed photocurrents of ca. 120
nA/cm2 under white light illumination (150 W halogen lamp) in aqueous electrolyte solution
with dimethylviologen acting as the electron carrier. Later on, photocurrents of ca. 4-6
µA/cm2 were observed in similar systems under 1 sun illumination. [6]
Sensitization of BDD by manganese phtalocyanine [11,12] and Ru(SCN)2(pbca)2 (pbca =
2,2’-bipyridine, 4,4’-dicarboxylate) (commonly coded N3 dye) [13] provided rather low
photocurrents, typically of the order of 1-10 nA/cm2 under ca. 1 sun illumination. Yeap et al.
[9] modified the diamond surface with thiophene derivatives through a combination of
diazonium electrografting and Suzuki cross-coupling and observed photocurrents of ca. 150
nA/cm2 under white light illumination (15 mW/cm
2 intensity).
Krysova et al. [14] reported on non-covalent anchoring of 4-(bis-{4-[5-(2,2-dicyano-
vinyl)-thiophene-2-yl]-phenyl}-amino)-benzoic acid (coded P1) dye. In a two-step procedure,
polyethyleneimine (PEI) was adsorbed on H-terminated BDD, and subsequently modified
with P1. This dye is known to be successful for the sensitization of p-NiO [17,18].
Interestingly, the same P1 dye is applicable also for the sensitization of n-TiO2 [18] which is
reminiscent of the activity of N3 dye in both systems. [13]
The P1-sensitized diamond electrode exhibited stable cathodic photocurrents under visible
light illumination in aqueous electrolyte solution with dimethylviologen electron mediator.
[14] The found photocurrents were about 100-150 nA/cm2 at the white light intensity of 18
mW/cm2. In spite of the simplicity of the surface sensitization protocol, the
photoelectrochemical performance is similar or better compared to that of other sensitized
diamond electrodes which were reported in previous studies. [6,9-14]
Acknowledgment
This work was supported by the Grant Agency of the Czech Republic (contract No. 13-
31783S).

12
References
[1] S.Mathew, A.Yella, P.Gao, R.Humphry-Baker, B.F.E.Curdoch, N.A.Astani, I.Tavernelli,
U.Rothlisberher, M.K.Nazeeruddin and M.Grätzel, Nat.Chem., 6 (2014) 242.
[2] H.Tian, J.Oscarsson, E.Gabrielsson, S.K.Eriksson, R.Lindblad, B.Xu, Y.Hao, G.Boschloo,
E.M.J.Johansson, J.M.Gardner, A.Hagfeldt, H.Rensmo and L.Sun, Sci.Rep., 4 (2014) 4282.
[3] S.Powar, T.Daeneke, M.T.Ma, D.Fu, N.W.Duffy, G.Goetz, M.Weidelener, A.Mishra,
P.Baeuerle, L.Spiccia and U.Bach, Angew.Chem.Int.Ed., 52 (2013) 602.
[4] L.Kavan, Z.Vlckova-Zivcova, V.Petrak, O.Frank, P.Janda, H.Tarabkova, M.Nesladek and
V.Mortet, Electrochim.Acta, doi:org/10.1016/j.electacta.2015.04.124 (2015)
[5] C.H.Y.X.Lim, Y.L.Zhong, S.Janssens, M.Nesladek and K.P.Loh, Adv.Funct.Mater., 20
(2010) 1313.
[6] Y.L.Zhong, A.Midya, Z.Ng, Z.K.Chen, M.Daenen, M.Nesladek and K.P.Loh,
J.Am.Chem.Soc., 130 (2008) 17218.
[7] S.D.Janssens, P.Pobedinskas, J.Vacik, V.Petrikova, B.Ruttens, J.D'Haen, M.Nesladek,
K.Haenen and P.Wagner, New.J.Phys., 13 (2011) 083008.
[8] S.Mori, S.Fukuda, S.Sumikura, Y.Takeda, Y.Tamaki, E.Suzuki and T.Abe, J.Phys.Chem.C.,
112 (2008) 16134.
[9] S.W.Yeap, D.Bevk, X.Liu, H.Krysova, A.Pasquarelli, D.Vanderzande, L.Lutsen, L.Kavan,
M.Fahlman, W.Maes and K.Haenen, RCS Adv., 4 (2014) 42044.
[10] Y.L.Zhong, K.P.Loh, A.Midya and Z.K.Chen, Chem.Mater., 20 (2008) 3137.
[11] C.Petkov, U.Glebe, E.Petkov, A.Pasquarelli, C.Pietzka, M.Veres, L.Himics, R.Merz,
W.Kulisch, U.Siemeling, J.P.Reithmaier and C.Popov, Phys.Stat.Sol.A, 210 (2013) 2048.
[12] J.Bechter, C.Pietzka, C.Petkov, P.Reintanz, U.Siemeling, C.Popov and A.Pasquarelli,
Phys.Stat.Sol.(a), 211 (2014) 2333.
[13] W.S.Yeap, X.Liu, D.Bevk, A.Pasquarelli, L.Lutsen, M.Fahlman, W.Maes and K.Haenen,
ACS Appl.Mat.Interfaces, 6 (2014) 10322.
[14] H.Krysova, Z.Vlckova-Zivcova, J.Barton, V.Petrak, M.Nesladek, M.Cigler and L.Kavan,
Phys.Chem.Chem.Phys., 17 (2015) 1165.
[15] Z.Vlckova-Zivcova, O.Frank, V.Petrak, H.Tarabkova, J.Vacik, M.Nesladek and L.Kavan,
Electrochim.Acta, 18 (2013) 518.
[16] P.Ashcheulov, J.Sebera, A.Kovalenko, V.Petrak, F.Fendrych, M.Nesladek, A.Taylor,
Z.Vlckova-Zivcova, O.Frank, L.Kavan, M.Dracinsky, P.Hubik, J.Vacik, I.Kraus and
I.Kratochvilová, Eur.Phys.J.B, 86 (2013) 443.
[17] P.Qin, H.Zhu, T.Edvinsson, G.Boschloo, A.Hagfeldt and L.Sun, J.Am.Chem.Soc., 130
(2008) 8570.
[18] P.Qin, J.Wiberg, E.A.Gibson, M.Linder, L.Li, T.Brinck, A.Hagfeldt, B.Albinsson and L.Sun,
J.Phys.Chem.C, 114 (2010) 4738.

13
PORPHYRIN ADSORPTION STUDIES ON MgO NANOCUBES
Johannes Schneider, Thomas Berger, Oliver Diwald
University of Salzburg, Dept. of Materials Science & Physics, Austria
Porphyrin molecules play an important role both in nature and technology. Their tunable
and versatile functional properties result from the manifold possibilities to functionalize the
tetrapyrrole unit and to introduce different metal ions at the porphyrin core thereby forming
stable organometallic complexes. A technological exploitation of related phenomena as well
as the successful implementation of functionalized particles in macroscopic, functional
devices still requires a better understanding of the microscopic interaction between porphyrins
and inorganic components in optical [1], optoelectronic [2] or photochemical applications [3].
We have studied on particle powders of morphologically well-defined MgO cubes the
adsorption of 2H-Tetraphenylporphyrin (2H-TPP) both from toluene solution and via the
gasphase. Using DR-UV/Vis and photoluminescence spectroscopy we observed on MgO
nancubes porphyrin metalation and the persistent adsorption of Mg-TPP at the oxide surface.
Interestingly, no significant surface metalation was observed on the larger MgO cubes. As
evidenced by detailed transmission electron microscopy and X-ray diffraction studies the
morphology and crystal structure of the particle powders does not change significantly upon
porphyrin adsorption. Whereas porphyrin metalation at metal surfaces [4] and at metal
clusters pre-deposited on oxide surfaces [5] have previously been reported, here first evidence
for porphyrin metalation on a pure metal oxide surface is presented.
References
[1] Roales, J.; Pedrosa, J.M.; Cano, M.; Guillén, M.G.; Lopes-Costa, T.; Castillero, P.;
Barranco, A.; González-Elipe, A.R. RSC Advances 2014, 4, 1974.
[2] Urbani, M., Grätzel, M., Nazeeruddin, M.K., Torres, T. Chemical Reviews 2014, 114,
12330.
[3] Ardo, S., Meyer, G.J. Chemical Society Reviews, 2009, 38, 115.
[4] Marbach, H., Steinrück, H.-P. Chemical Communications 2014, 50, 9034.
[5] Wang, C., Fan, Q., Hu, S., Ju, H., Feng, X., Han, Y., Pan, H., Zhu, J., Gottfried,
J.M.Chemical Communications 2014, 50, 8291.

14
EXPERIMENTAL RESULTS OF LA0.8SR0.2CRO3 / SRTIO3(100) HETEROSTRUCTURE
USED FOR A HIGHTEMPERATURE PHOTOVOLTAIC CELL
G.C. Brunauer1,3
, G. Walch2, B. Rotter
1, E. Esmaeili
1, A. K. Opitz
2, G. Fafilek
2, K.
Ponweiser1 J. Fleig
2
1TU Wien, Institute for Energy Systems und Thermodynamics,
2TU Wien, Institute of Chemical Technologies and Analytics, Getreidemarkt 9, 1060 Vienna,
Austria 3NOVAPECC GmbH, Hildebrandgasse 28, 1180 Vienna, Austria
Abstract
The absorption of light by semiconducting materials results in a partial conversion of the
radiative energy into electrical energy, a process of great importance and interest in energy
technology. The solar spectrum can be classified into a high energetic part (short wave length)
and a lower energetic part (long wave length). Both can be used by the special type of high
temperature photovoltaic cell (HT‐PV) under consideration, which consists of solid oxide
materials, especially perovskite oxides with the general formula ABO3. In fact, strontium
doped lanthanum chromium oxide (La1‐xSrxCrO3) and strontium titanate (SrTiO3) are not only
attractive candidates as semiconducting oxide materials for a HT‐PV cell, but also for driving
an electrochemical reaction used in a Solid Oxide Photo-Electrochemical Cell (SOPEC).
Material Characterisation
This paper shows the results of investigating the heterostructure
La0.8Sr0.2CrO3/SrTiO3(100) under ultra‐violet (UV) radiation at temperatures from 400°C up
to 500°C. The HT‐PV cell consists
of a SrTiO3 (STO) single crystal in
the orientation 100 with a
La0.8Sr0.2CrO3 thin‐film deposited
by pulsed laser deposition (PLD).
Both perovskites are large band
gap (Eg) semiconducting metal
oxides. It is well known that the
Eg of STO is about 3.2 eV.
Furthermore, optical
measurements of 20% doped
strontium LaCrO3 (La0.8Sr0.2CrO3)
have shown that its Eg should be
around 2.8 – 3.1 eV. For the
excitation of electron‐hole charge
carriers (e‐, h+) photons in wave‐length ν equal to or larger than around 385 nm are
necessary. Any photon’s energy that is higher or lower than Eg is converted into heat. Given
the high Eg of the La0.8Sr0.2CrO3/ SrTiO3(100)‐system, electrons (e‐) can be excited from the
valence band (VB) to the conduction band (CB) at temperatures up to 600°C. In contrast,
ebecome thermally excited at relatively low temperatures when using low‐band gap materials
such as Si-based semiconductors (~1.1eV).
Research Process and Results
In a first step, the HT-PV cells were characterized by measuring current-voltage (I-V)
curves. The I-V measurement was performed depending on a) temperature, b) light intensity
and c) wave-length. For this test series, HT-PV cells with the dimension of 10x10x0.5 mm
Fig. 1: Scheme of the heterostructure La0.8Sr0.2CrO3/ SrTiO3(100)
single crystal used as HT-PV cell

15
(1)
(2)
were used. The results of open-circuit voltage and (UOC) short-circuit (ISC) current are shown
in Fig. 2a and 2b.
Fig. 2a: DC measurement of photo voltage on HT-PV
and PEC cell at 400, 425, 450, 475 and 500°C under
illumination with LED 10W/365 nm
Fig. 2b: DC measurement of photo current on HT-PV and
PEC cell at 400, 425, 450, 475 and 500°C under
illumination with LED 10W/365 nm
The measurements have shown that UPV,OC is decreasing with rising temperature, whereas
IPV,SC is increasing. In that context, it is interesting that the voltage at
the HT-PV cell ηPV remains more or less stable over temperature. In
the next step, the HT-PV cell was packed on top of an electrolyte
supported cell (ESC) consisting of a polycrystalline 3 mol% yttria-
stabilised zirconia (YSZ) substrate (Ø20x0.3 mm) coated on both
sides with porous strontium doped lanthanum cobaltite (LSC) as
electrode material for oxygen reaction. Voltage and current in the
operation point (UPEC, IPEC) of the cell shown in Fig. 3 were measured
at different temperatures. The measurements have shown that UPEC
decreases dramatically with rising temperature (Fig. 2a), whereas IPEC increases (Fig. 2b).
Further on, the cell in Fig. 3 has been implemented in an experimental setup with gas-tight
chambers and light-coupling by a quartz bar. When the light (LED 10W/365 nm) is switched
on, oxygen is incorporated (Eq.1) at the cathode (1) due to the applied current and voltage
from the HT-PV cell. Oxygen ions going through the YSZ following Kröger–Vink
nomenclature (Eq. 2) and leaves the cell at the anode (2), Eq. 3.
In a sequence of light off-and-on, voltage, current, and oxygen concentration have been
measured at a temperature of 450°C, as shown in Fig. 4.
400 425 450 475 5000.0
0.1
0.2
0.3
0.4
0.5
0.6
0.7
0.8
0.9
1.0
UPV,OC
UPEC
Vo
lta
ge
/ V
T / °C
400 425 450 475 5000.0
200.0µ
400.0µ
600.0µ
800.0µ
1.0m
1.2m
1.4m
1.6m
1.8m
2.0m
2.2m
2.4mIPV,SC
IPEC
Cu
rre
nt
/ A
T / °C
Fig. 3: Sketch of HT-
PV on top of an ESC

16
Fig. 4: Diagrams of a) voltage curve b) current curve and c) oxygen profile at 400°C
The voltage in the operation point under illumination has reached its maximum at nearly
0.5 V (Fig. 4.a). That has led to an electrical current of more than 0.8 mA (Fig. 4.b). Finally,
the oxygen concentration has been shifted from 640 to 400 ppm O2 (Fig. 4.c). ). Overall, it
could be shown that the La0.8Sr0.2CrO3 / SrTiO3(100) heterostructure is a promising material
system for photo-electrochemical energy conversion.
Acknowledgement This work was financed by the Austrian Research Promotion Agency (FFG) under the project no. 838562.
0 2000 4000 6000 8000 10000 12000-0.70
-0.65
-0.60
-0.55
-0.50
-0.45
-0.40
-0.35
-0.30
-0.25
-0.20
-0.15
-0.10
-0.05
UP
EC / V
Time / s
UV offUV on UV on UV off UV on UV off
1
0 2000 4000 6000 8000 10000 12000
-50µ
0
50µ
100µ
150µ
200µ
250µ
300µ
350µ
400µ
450µ
500µ
I PE
C / A
Time / s
UV offUV onUV offUV onUV offUV on
0 2000 4000 6000 8000 10000 12000460
470
480
490
500
510
520
530
540
550
560
570
580
590
600
610
f O
2 / p
pm
Time / s
(a) (b) (c)

17
PHOTOCATHODES FOR DYE-SENSITIZED SOLAR CELLS
Hana Krýsová1, Václav Petrák
2, Weng Siang Yeap
3, Pieter Verstappen
3, Wouter Maes
3,
Ken Haenen3, Fang Gao
4, Christoph E. Nebel
4, Ladislav Kavan
1
1 J. Heyrovský Institute of Physical Chemistry, v.v.i., Academy of Sciences of the Czech
Republic, Dolejškova 3, CZ-18223 Prague 8, Czech Republic ([email protected]) 2
Institute of Physics,v.v.i., ASCR, Na Slovance 2, 182 21 Prague 8, Czech Republic 3Hasselt University, Institute for Materials Research, B-3590 Diepenbeek, Belgium
4 Department of Micro and Nano Sensors, Fraunhofer IAF, Freiburg 79108, Germany
The sensitization of wide band-gap semiconductors to visible light is intensively studied in
the area of n-doped electrode materials, such as TiO2, which forms a basis for the dye-
sensitized solar cell (DSC). The most successful material for an active photocathode is p-
doped NiO, but the highest efficiency obtained so far for the p-DSC is only 1.3%.[1,2] The
final goal of these efforts is obviously a tandem device (p,n-DSC) in which both electrodes
are the photoactive semiconductors. The tandem cells are attractive due to their enhanced
voltage, which is not controlled by the redox potential of the mediator anymore,[3] but these
cells cannot rival the efficiencies of the optimized n-DSCs at the moment.
Among the alternative photocathode materials, the B-doped nanocrystalline diamond
(BDD) can be considered a promising replacement of p-NiO. Diamond films made by CVD
are attractive due to their excellent chemical and electrochemical stability, optical
transparency and favorable electrical properties. BDD is better optically transparent than p-
NiO, approaching the optical quality of indium-tin oxide (ITO) at certain levels of
doping.[4,5]
A light-harvesting efficiency of a monolayer of dye molecules on a flat surface of B-doped
nanocrystalline diamond is inherently small. The growth of nano-textured mesoporous
diamond films was attempted by templating with SiO2 fibers and SiO2 spheres. So called
nanodiamond foam was grown by using SiO2 spheres (500 nm in diameter) as templates, on
which a thin BDD layer was deposited by standard chemical vapour deposition growth. The
template was subsequently etched away by HF solution, leaving hollow spheres of diamond
which replicated the SiO2 template.
Fig.1A,B: SEM images of B-doped diamond foam sensitized with BT-Rho.
To directly compare flat diamond films and diamond foams, we have functionalized the
diamond foams with the same dyes ((E)-2-{4-[2-(6-bromo-4,4-diethyl-4Hcyclopenta[1,2-
b:5,4-b’]dithiophen-2-yl)vinyl]-3-cyano-5,5-dimethylfuran-2(5H)-ylidene}malononitrile
(coded CPDT-Fur) and (Z)-2-{5-[(5’-bromo-[2,2’-bithiophen]-5-yl)methylene]-4-oxo-2-
A B

18
thioxothiazolidin-3-yl} acetic acid (coded BT-Rho)) as applied in our previous work on flat
BDD films.[6] These molecules were anchored by the Suzuki coupling protocol through a
phenyl linker, which was attached to the originally H-terminated diamond surface by
diazonium electrografting.
The prepared materials were tested as electrodes in the dark and upon illumination in an
aqueous electrolyte solution with methyl viologen acting as a reversible electron acceptor.
Reference experiments were carried out with standard flat BDD films, too.
Cathodic photocurrent densities for a fresh foam electrode sensitized with both CPDT-Fur
and BT-Rho illuminated by white light (20 mW/cm2; simulated AM 1.5G solar spectrum) are
approximately 3-times larger than those on flat diamond, which is attributed to the enhanced
surface area of the foam electrodes.
Acknowledgment
This work was supported by the Grant Agency of the Czech Republic (contract No. 13-
31783S).
References
[1] H. Tian, J. Oscarsson, E. Gabrielsson, S. K. Eriksson, R. Lindblad, B. Xu, Y. Hao, G.
Boschloo, E. M. J. Johansson, J. M. Gardner, A. Hagfeldt, H. Rensmo and L. Sun, Sci. Rep.,
2014, 4, 4282.
[2] S. Powar, T. Daeneke, M. T. Ma, D. Fu, N. W. Duffy, G. Goetz, M. Weidelener, A.
Mishra, P. Baeuerle, L. Spiccia and U. Bach, Angew. Chem., Int. Ed., 2013, 52, 602.
[3] A. Nattestad, A. J. Mozer, M. K. R. Fischer, Y. B. Cheng, A. Mishra, P. Bäuerle and U.
Bach, Nat. Mater., 2010, 9, 31.
[4] C. H. Y. X. Lim, Y. L. Zhong, S. Janssens, M. Nesladek and K. P. Loh, Adv. Funct.
Mater., 2010, 20, 1313.
[5] Y. L. Zhong, A. Midya, Z. Ng, Z. K. Chen, M. Daenen, M. Nesladek and K. P. Loh, J.
Am. Chem. Soc., 2008, 130, 17218
[6] S.W. Yeap, D. Bevk, X. Liu, H. Krysova, A. Pasquarelli, D. Vanderzande, L. Lutsen, L.
Kavan, M. Fahlman, W. Maes and K. Haenen, RCS Adv. 2014, 4, 42044.
19
ELECTROCOAGULATION: ELECTROCHEMISTRY IN WASTEWATER TREATMENT
D. N.Tito, P. Krystynik, P. Kluson
Institute of Chemical Process Fundamentals of the CAS, v.v.i., Rozvojova 2/135, CZ-165 02
Prague 6, Czech Republic
Today's world faces a strategic and global challenge that extends beyond political borders,
beliefs or origins - the sustainable management of Water Resources. In a reality where
population growth is expected to reach (at least) 9 billion by 2050, how to manage this finite
and fundamental resource whilst meeting the needs of Industry, Agriculture and individuals
across the globe?
The solution lies in improving public attitude towards water consumption through
education and raised awareness. Coupled with that, improved technology is needed to make
more efficient use of the existing resources. Undoubtedly, no particular technology will solve
all issues but rather a multitude a solutions will be required to meet a broad range of specific
scenarios.
Wastewater treatment is one area where great potential for water reuse exists but where
improved public perception and technology are needed. Crisis such as the ongoing California
drought (2015) have helped change public perception and highlighted the value of wastewater
as a reusable resource.
The fundamental objectives of the water treatment process are: the provision of safe
drinking water, protection of human health and protection of the environment. Although the
process details can change significantly from site to site, the process is broadly divided in
three stages: Primary (removal of large objects and heavy solids), Secondary (removal of
dissolved and suspended contaminants) and Tertiary (removal of trace contaminants and
disinfection).
A wide range of contaminants (e.g. nutrients, suspended solids, heavy metals) is removed
during Secondary stage in a process called Coagulation. Chemically this involves the addition
of a precipitation agent (typically Fe or Al) that promotes particle aggregation and
precipitation, leading to accumulation of the contaminants into a sludge that can be separated
from the aqueous phase by physical techniques (e.g. sedimentation, flotation). Typically,
coagulation is done by chemical addition of Fe or Al salts (e.g. FeCl3 or Al2(SO4)3) that (at
the appropriate pH) readily form insoluble hydroxides which ad(ab)sorb contaminants in
solution thus inducing their removal.
Although a well-established process, Chemical Coagulation requires the transport,
handling and storage of large volumes of aqueous solutions which are corrosive and pose an
environment risk if accidentally spilled. Electro-coagulation is the electrochemical alternative
where the use of salt solutions is replaced by metallic electrodes (Fe or Al). The
electrochemical process employs controlled anodic corrosion to produce the relevant metal
hydroxides (Fe(OH)3 or Al(OH)3) at a rate determined by current intensity. From Faraday's
law, metal concentration can be estimated which correlates well with experimental values.
The implementation of electrochemistry not only avoids the issues listed above but also
significantly reduces the volume required to store the precipitating agent as aqueous solutions
are replaced by metallic plate (reduction of 40x by volume). This enables the development of
compact systems that can be employed in a wide range of scenarios from portable handheld
systems, large-scale moveable plants to full industrial scale systems.

20
REMOVAL OF TOXIC METALS BY ELECTROCOAGULATION USING MILD STEEL
AND ALUMINUM ELECTRODES
P.Krystynik1, P. Kluson
1, D.N. Tito
1, R. Boubinova
2
1 Institute of Chemical Process Fundamentals of the CAS, v.v.i., Rozvojova 135, 165 02
Prague 6, Czech Republic ([email protected]) 2
University of Chemistry and Technology, Prague, Technická 5, 166 28 Prague 6, Czech
Republic
Given its fundamental role in supporting life and ecosystems, water should be regarded as
the major and most valuable resource that can be found on Earth. However, despite its
importance, there are several threats causing water pollution that compromise its fundamental
role. One of major threats results from poorly managed industry directly disposing various
wastes into environment and consequently endangering sources of water. Presented
contribution is focused on testing of innovative method for toxic metals removal from
contaminated water by method of electrochemical coagulation.
Electrocoagulation (EC) is a method of coagulation that does not require the use of other
chemicals. It is a technique that utilizes electrochemical dissolution of electrode and
formation of small hydroxide particles (coagulants) in solutions. These small particles
aggregate to larger particles (floc) that tend to create ferric ions with iron dissolved from
electrode as well as with the iron dissolved as pollutant. It is a phenomenon during which
charged particles in colloidal suspension are neutralized by mutual collision with counter ions
and they are agglomerated, followed by sedimentation Electrodes are usually made of Al or
various types of steel. The rate of sacrificial electrode is driven by current input.
To determine the current input efficiency, the amount of iron generated was calculated by
using Faraday’s Law:
Fz
MtIw
(1)
where w is the amount of dosed iron at specific current density with relevant current input
(A), t is a residence time in the EC cell (s), M is molecular weight of Fe (55,485 g/mol), z is
number of electrons transferred per Fe atom and F is Faraday’s constant. When operated the
EC at steady state, the Fe (dosed) concentration was a function of the current input and
contact time of treated water with anodic surface. By adjusting the operating current input and
flow rate of treated water, a desired Fe (dosed) concentration was obtained. The results have
that calculated data correspond with theoretical assumptions well.
First of all, various operational parameters of electro-coagulation (EC) were optimized,
namely inputting concentration of toxic metal, the amount of in-situ electrochemically dosed
coagulant by electrochemical dissolution of anode, pH of treated effluent, current density.
Optimization experiments were performed with model effluents contaminated by lead and
cadmium.
The optimal experimental conditions were evaluated – it was determined that increasing
inputting contamination increases the efficiency of EC; increasing amount of dosed coagulant
also increases the process efficiency – this was particularly evident in case of cadmium
removal; pH is also very influencing parameter – principles of both adsorption and chemical
coagulation occurred. All the experiments were performed with two types of electrodes – iron
and aluminum. Comparison of both electrode performances has shown that aluminum
electrode revealed higher efficiencies in toxic metals removal.

21
Fig. 1: Removal efficiency of lead and cadmium as a function of inputting concentration and
contamination concentration/dosed coagulant ratio
Optimal experimental conditions, based on results obtained with model effluents, were
applied on industrially polluted effluents (RW1 to RW3). Those effluents originally came
from various industrial sites. It is evident that most of the contaminating ions revealed high
removal efficiency up to 99,9 % depending on the type of contaminant. It has been shown that
electrocoagulation is very promising technology in removal of toxic metals from model and
industrial effluents.
Tab. 1: Removal efficiency of industrial pollutants in real effluents
Parameter RW1 RW2 RW3
Removal efficiency
[%]
Dissolved
metal
concentration
[mg/l]
As 0,29 - - 97,7
Sb
0,21
8 - - 59,1
Pb
6,04
6 - - 99,8
Ni - 34,6 1,67 97,8
Zn - 47,8 - 99,9
Fe
0,64
7 1,8 1,4 89,2
Cd - - 0,86 74,4
Acknowledgement
This work was supported by the Technology Agency of the Czech Republic
(TA04020130).
0
20
40
60
80
100
0 5 10 15 20 25
Pb
re
mo
val e
ffic
ien
cy [
%]
ρPb [mg/l]
Fe:Pb 1:1Al:Pb 1:1Fe:Pb 1:2Al:Pb 1:2
0
10
20
30
40
50
60
0 5 10 15 20 25
Cd
re
mo
val e
ffic
ice
ncy
[%
]
ρCd [mg/l]
Fe:Cd 1:1Al:Cd 1:1Fe:Cd 1:2Al:Cd 1:2

22
TITANIUM DIOXIDE PHOTOCATALYST PREPARED BY LYOPHILIZATION FROM
TITANYL SULPHATE: ACTIVITY IN UV AND VISIBLE LIGHT
Eva Pližingrová1,2
, Jan Šubrt2, Josef Krýsa
1
1 University of Chemistry and Technology, Prague, Dept. of Inorganic Technology, Technická
5, 166 28 Prague 6, Czech Republic ([email protected]) 2 Institute of Inorganic Chemistry AS CR, v.v.i., Husinec-Řež č.p. 1001, 250 68, Řež, CR
Nanoparticles of titanium dioxide (TiO2) are considered as the most effective material with
respect to its nontoxicity, high photoactivity and low price. Titania-based photocatalysts are
still the most widely used material for photocatalytic water cleaning, air purification, and the
photocatalytic production of hydrogen from water.
There are several different methods for the preparation of TiO2 photocatalyst. Our group
deals with the preparation of TiO2 foam from an aqueous solution of titanyl sulphate [1,2,3].
The advantage of the preparation of TiO2 foam in comparison with the sol-gel method is that
it does not require organic compounds for the synthesis of TiO2. In addition, the preparation is
simple and uses cheap raw materials.
In the first step of the preparation of non-doped material, titanyl sulphate (TiOSO4∙xH2O)
was dissolved in distilled water at 35 °C. The colourless solution was precipitated by
ammonia solution until it reaches pH 8. The white precipitate was filtered and washed to
remove sulphate anions formed in the reaction. Then the pH value was reduced by H2O2. The
resulting yellow transparent colloidal solution of peroxo-polytitanic acid was lyophilized, and
subsequently annealed at 500, 650, 800 and 950 °C [2,3].
In the case of doped samples, dopant was added in the first step of synthesis, rest of the
preparation was the same as described above. The samples were doped with Ag, Au and Nd.
Amount of dopant was 1 at. % towards Ti.
The synthesized samples were studied by X-ray diffraction, electron microscopy, and the
specific surface area was determined by the B.E.T. method. The photocatalytic activity was
characterized using 4-chlorophenol (4-CP) in an aqueous solution as a model compound.
The lyophilized samples are amorphous. Annealing at 500 °C results in the formation of
anatase crystalline structure. In non-doped samples, further increase in annealing temperature
to 950 °C means an increase of size of anatase crystallites from 35 to 140 nm and decrease in
the value of specific surface area from 35 to 11 m2∙g
-1. In comparison with non-doped
samples, doping with Nd causes a decrease of the size of anatase crystallites for all
temperatures of annealing. Doping with Ag, Au does not influence growing anatase
crystallites except temperature 950 °C where the size of anatase crystallite was almost
twofold. The presence of dopant was confirmed from EDS. Fig. 1 shows HRTEM
micrographs of doped samples annealed at 650 °C.
For temperatures 500, 650 and 800 °C neodymium was not observed as a separated phase
in HRTEM. The diffraction pattern of sample annealed at 950 °C showed three different
phases - anatase, rutile and neodymium titanium oxide. At lower temperatures only anatase
phase was observed. Nd seems to be predominantly built in the structure of TiO2.
In HRTEM, silver and gold nanoparticles were observed already in lyophilized sample as a
visibly separated phase. Ag and Au seems to be both, built in the structure as well as
separated nanoparticles. Silver and gold nanoparticles had around 20 nm.
None of the doped samples resulted in an increase of the photocatalytic activity in UV
region in comparison with non-doped sample and P25 (Evonik-Degussa) often considered as
so far the most active commercial photocatalyst (Fig. 2). The photocatalytic activity in visible
region was almost negligible, about 2 orders lower than in UV. The rate constants for all
samples are summarized in the Tab. I.

23
(a) (b) (c)
Fig. 1. HRTEM study: (a) sample doped with Nd (b) sample doped with Ag (c) sample doped with Au
Fig. 2. Results of photodegradation of 4-CP in UV light for the samples annealed at 800 °C, initial
4-CP concentration = 5∙10-5
mol∙l-1
Tab. I. Rate constants
Sample Rate constant (min
-1)
UV light Visible light
TIG-Au-800 0.014 0.00013
TIG-Ag-800 0.025 0.00006
TIG-Nd-800 0.024 0.00019
TIG-800 0.051 -
P25 0.030 0.00009
Acknowledgement
This work was partly supported from specific university research (MSMT No 20/2015),
partly from project ENVIMOD (CZ.1.07/2.2.00/28.0205) and partly from the Grant Agency
of the Czech Republic (project number P108/12/2104).
References
[1] Pulisova P., Bohacek J., Subrt J., Szatmary L., Bezdicka P., Vecernikova E., Balek V., Journal of
Thermal Analysis Calorimetry 101 (2010) 607-613.
[2] Subrt J., Pulisova P., Bohacek J., Bezdicka P., Plizingrova E., Volfova L., Kupcik J., Materials
Research Bulletin 49 (2014) 405-412.
[3] Plizingrova E., Volfova L., Svora P., Labhsetwar N.K., Klementova M., Szatmary L., Subrt J.,
Catalysis Today 240 (2015) 107-113.

24
INKS CONTAINING RESAZURIN AND ACID VIOLET7 AS A TESTING METHOD
FOR SELF-CLEANING PAINTS
Michal Baudys, Josef Krýsa
University of Chemistry and Technology, Prague, Dept. of Inorganic Technology, Technická
5, 166 28 Prague 6, Czech Republic ([email protected])
This paper deals with application of new rapid method of photocatalytic activity
assessment which can be used on various photocatalytic paints. The method is based on
irreversible reductive color change of Resazurin (Rz) or Acid Violet 7 (AV7) dyes (Fig. 1a
and Fig1b) in ink containing glycerol as a sacrificial electron donor. The principle of the
method is schematically shown in Fig.2. Water based acrylic paint with TiO2 photocatalyst
(8% TiO2 P25, Evonik) and two commercial paint, namely exterior (CP1) and interior (CP2),
were applied as an example of self- cleaning paints.
The aim of this work was to investigate influence of weathering test in QUV on
photocatalytic activity.
Using a recently published procedure [1], photocatalytic activity of these paints was
determined as a time in which 90% of overall color change of Resazurin or Acid Violet 7 ink
occurs.
Fig1a: Structure of Resazurin Fig1b: Structure of Acid Violet 7
Fig. 2: Principle of smart inks function on photocatalytically active surface
Ttb90 values are summarized in Table 1. Commercial paints CP1 and CP2 exhibit different
photocatalytic activities. Whereas CP2 shows very low photocatalytic activity with Ttb90 of
Rz ink about 4000 s, CP1 shows very high photocatalytic activity so the reduction of Rz ink is

25
very quick. Thus to determine photocatalytic activity we have to use Acid Violet 7 ink, which
has Ttb90 about 340 s.
paint Resazurin ink(Rz)
Ttb90 (s)
Acid Violet 7 (AV7)
Ttb90 (s)
TiO2 paint 90±15 3000±75
Interior paint (CP2) Too fast 340±25
Exterior paint (CP1) 4000±60 Too slow
Table 1: Results of photocatalytic activity expressed as Ttb90
In case of TiO2 paint two different Ttb90 values for each paint were calculated. In the case
of Resazurin Ttb90 was calculated as 90 s. Using Acid Violet 7 the Ttb90 was(33x times
higher) about 3000 s.
It can be assumed that to develope full photo catalytic activity a certain time of weathering
is needed [2,3]. From this reason samples were exposed to accelerated weathering test in
QUV panel using the following cycle: i) UV irradiation (maximum 340 nm), intensity 1
W/m2/nm, 8 h, (ii) spraying with water, 7 dm3/min, 4 min, (iii) condensation of steam,
temperature 70 °C, 4 h and (iv) spraying with water, 7 dm3/min, 4 min. Exposition in QUV
panel simulates accelerated weathering effects such as rain dew and UV light The scheme of
QUV is illustrated on Fig. 3
During weathering polymer binder partially degrades resulting in an increase of surface
exposed concentration of TiO2 particles [4]. The photocatalytic activity was expressed as a
time of exposition in QUV. TiO2 paint seems to be stable and no significant destruction of
binder was observed. Paradoxically the CP2 paint in which no significant resistance against
weather conditions can be assumed seems to be stable and only small chalking was observed.
On the contrary CP1 paint shows very low stability against weathering. Already after 350
hours of exposition the whole paint almost disappeared.
In the case of TiO2 paint, during exposition in QUV photocatalytic activity gradually
increases and after 600 hours of weathering the reciprocal Ttb90 was 3,5 higher compared to
unexposed paint. In the case of CP2 paint a dramatic increase of photocatalytic activity was
observed after 500 hours of exposition and reciprocal value of Ttb 90 was 12x higher
compared to unexposed paint. The reason for high activity of CP2 (which is one order of
magnitude higher compared to TiO2 paint) is probably in higher amount of the photocatalyst
(higher than 8% as in the case of TiO2 paint).
Acknowledgement
Financial support of INTEC project (FP7-NMP-2012-CSA-6, GA No. 319210 and specific
university research (MSMT No 20/2015) is acknowledged.
References
[1] A. Mills, J. Hepburn, D. Hazafy, C. O'Rourke, N. Wells, J. Krysa, M. Baudys, M. Zlamal,
H. Bartkova, C.E. Hill, K.R. Winn, M.E. Simonsen, E.G. Sogaard, S. Banerjee, R. Fagan,
S.C. Pillai, Journal of Photochemi and Photobiol A-Chemistry 290 (2014) 63-71.
[2]A. Mills, C. Hill, P.K.J. Robertson Journal of Photochem and Photobiol A-Chemistry 237
(2012) 7-23
[3] T.Marolt, A.S. Škapin, J. Bernard, P. Živec, M. Gaberšček, Surface and Coatings
Technology 206 (2011) 1355-1361.
[4] M. Baudys, J. Krýsa ,M. Zlámal, A. Mills Chemical Engineering Jounral (261) 2015 83-
87

26
Fig. 1 Chopped light polarization curves
for thin films of TiO2 and Fe2O3, solar
simulator AM1.5, 100 mW cm−2
.
PHOTOELECTROCHEMICAL HYDROGEN PRODUCTION ON TiO2 AND Fe2O3 THIN
FILMS
Josef Krýsa1, Martin Zlámal
1, Magda Morozova
1, Stepan Kment
2, Zdenek Hubicka
2
1 University of Chemistry and Technology, Prague, Dept. of Inorganic Technology,
Technická 5, 166 28 Prague 6, Czech Republic ([email protected]) 2
Institute of Physics AS CR, v.v.i, Na Slovance 1999/2, 182 21 Prague 8, Czech Republic
Titania (TiO2) and iron oxide (α-Fe2O3) hematite thin films have the potential applications
as photoanodes for hydrogen production via photoelectrochemical water splitting. Great
advantages of TiO2 are its low price, high stability and nontoxicity. However, for practical
applications, there is a huge disadvantage consisting in utilization of very small part of
sunlight (4%). Iron oxide (α-Fe2O3) has favourable band gap (2.0–2.2 eV), which allows
absorbing a substantial fraction of solar spectrum, resulting in the theoretical maximal solar-to-
hydrogen (STH) conversion efficiency 15% [1]. But there are also limitations, e. g. the
nonideal position of hematite’s conduction band, which is too low for spontaneous water
reduction. Therefore the aim of the present work was the comparison of TiO2 -Fe2O3
photoanodes and the efficiency evaluation for hydrogen evolution via water splitting.
TiO2 -Fe2O3 films were prepared on FTO glass by sol–gel [2] and advanced pulsed
plasma deposition method of High Power Impulse Magnetron Sputtering (HiPIMS) [3]. For
both techniques, subsequent calcination was found necessary. The films were judged on the
basis of physical properties such as crystalline structure, optical absorption and surface
topography. The functional properties (photocurrent, open circuit potential) were investigated
under simulated photoelectrochemical (PEC) water splitting conditions in a three electrode
arrangement. Standard solar illumination conditions (AM 1.5 G) was used as excitation light,
solution of Na2SO4 for TiO2 and NaOH -Fe2O3 thin films were used as the electrolytic
media. For the straightforward comparison of the films the measured potentials vs Ag/AgCl
were converted to the reversible hydrogen electrode (RHE) scale. Optimised semiconductor
films were applied as photoanodes in a two compartment single band gap PEC cell and
hydrogen evolution rate evaluated.
Polarization curves for thin films of
TiO2 and Fe2O3 are compared in Fig. 1.
TiO2 films exhibit an photocurrent onset at
0.2 V (RHE) and then plateau from about
0.8 V to 2.0 V (RHE). Fe2O3 films
exhibits an photocurrent onset at more
positive potential (1.1 V (RHE) then there
is almost linear increase of photocurrent
with applied potential.
Regarding the PEC activity of the
TiO2 films, a higher photoresponse (about
20%) was evident for sol-gel films in
comparison to HIPIMS films. A different
situation was observed for the hematite
films. In this case the plasmatic films
showed a tenfold enhancement of the
stable photocurrent density over the sol-gel hematite films. A very high concentration of the
surface states acting as the recombination centres might be the reason for the poor activity of
the hematite sol-gel films. As far as the plasmatic hematite films are concerned, some of the
abovementioned drawbacks for its application for the PEC water splitting were addressed in

27
this study by deposition of very thin films of hematite (25 nm) and by doping the hematite
with Sn.
Fig. 2 shows the time
dependence of photocurrent and
evolved hydrogen for applied
potential 1 V (vs. Ag/AgCl). Both
anodic and cathodic compartments
were bubbled with argon and the
outlet gas from cathodic
compartment was injected to gas
chromatograph with TCD detector.
In agreement with polarization
curve photocurrents for applied
potential 1 and 0.5 V are very
similar (60-50 A). The
concentration of evolved hydrogen
in outlet gas from cathodic
compartment increases with
irradiation time and after about 2-3
hours reaches the fairly constant
value. The fact that the concentration of hydrogen increases with time can be explained by the
fact that even the solution was bubbled by Ar before and during water splitting experiments
there was significant amount of dissolved oxygen which could be reduced instead of water.
Furthermore produced hydrogen is at first dissolved in electrolyte and then enter the gas phase
which is analysed. Similarly as photocurrents for both applied potentials steady state
concentrations of evolved hydrogen in outlet gas are almost the same (about 350 ppm). This
suggests that the current efficiency of produced hydrogen is for both applied potentials almost
the same.
It can be concluded that photocurrent and corresponding hydrogen evolution rate is
significantly higher for hematite films than for the other two materials. For hematite
photoanode in 1 M NaOH, and applied potential 0.55 V (Ag/AgCl) the observed photocurrent
density was 0.9 mW/cm2, hydrogen production rate was 125 mol/h/cm
2 and faradaic
effficiency for hydrogen production was around 95 %. For TiO2 photoanode the hydrogen
production rate was only 25 mmol/h/cm2 but the applied bias was significantly lower (0.5 V).
Acknowledgement
This work was supported by the Grant Agency of the Czech Republic (project number
P108/12/2104).
References
[1] K. Sivula, F. Le Formal, M. Gratzel, Chemsuschem, 4 (2011) 432-449.
[2] J. Krýsa, M. Baudys, M. Zlamal, H. Krysova, M. Morozova, P. Kluson, Catalysis Today,
230 ( 2014) 2-7
[3] J. Krýsa, M. Zlamal, S. Kment, M. Brunclikova, Zdenek Hubicka, Molecules, 20 (2015
1046-1058.
Fig. 2 Time dependence of photocurrent and
evolved hydrogen for applied potential 1 V (vs.
Ag/AgCl), electrolyte 0.1 M Na2SO4

28
1-D NANOSTRUCTURES OF TiO2 AND Fe2O3 FOR ELECTROCHEMICAL WATER
SPLITTING – REVIEW
Šárka Paušová1, Štěpán Kment
2, Josef Krýsa
1
1 University of Chemistry and Technology, Prague, Dept. of Inorganic Technology,
Technická 5, 166 28 Prague 6, Czech Republic ([email protected]) 2 Institute of Physics AS CR, v.v.i, Na Slovance 1999/2, 182 21 Prague 8, Czech Republic
With increasing demands on energy supply, necessity of usage of an efficient renewable
source of energy is growing. One of the possibilities is conversion of solar light to electricity
or fuel. Since the photocatalytic water splitting on titanium dioxide was discovered by
Fujishima and Honda [1], the great effort has been devoted to application of TiO2 in energy
conversion. Although TiO2 is a suitable candidate for water splitting some main drawbacks
have to be overcome, such as high electron-hole recombination or short excited state life time.
Using 1-D nanostructures (nanotubes, nanorods, nanowires or nanofibers) seems to be one of
the possible ways how to increase the TiO2 effectivity. However, even usage of TiO2
nanostructures is limited by usage of UV light irradiation (TiO2 band gap energy is 3.2 eV),
so the modification of the TiO2 with metal and/or non-metal ion doping to narrow the
bandgap or sensitization by quantum dots or plasmon enhancement is necessary or application
of another semiconducting material active under visible light irradiation. Hematite and its
pure or modified nanostructures show even better characteristics (band gap energy 2.0 eV,
very good stability and abundance) which make Fe2O3 one of the best choices for solar water
splitting.
1-D nanostructures of TiO2 and Fe2O3 can be prepared by many different methods.
Nanotubes are commonly prepared by anodization of Ti or Fe substrates or Ti or Fe thin
layers [2, 3], by template synthesis [4, 5] or hydrothermal synthesis (in the case of TiO2) [6];
nanorods can be prepared by oblique-angle deposition [7] or metal-organic chemical vapour
deposition [8] for TiO2, hydrothermal synthesis used for both TiO2 and Fe2O3 [9], template
synthesis [10, 11] or anodization of Fe substrates or Fe thin layers [12]; nanowires or
nanofibers of TiO2 can be prepared by template synthesis [13], electrospinning synthesis [14],
hydrothermal synthesis [15] or hydrothermal corrosion of Ti metal substrate [16], and
nanowires or nanofibers of Fe2O3 by plasma oxidation of Fe sheets [17], thermal oxidation of
Fe sheets [18], hydrothermal synthesis [19] or thermal decomposition of Fe compounds [20].
To compare the results of prepared nanostructures is not a simple thing. A lot of authors
have used different conditions for the measurement of photoelectrochemical properties, such
as different light intensity or wavelengths, different electrolyte or different applied potential
and referent electrode. Differences in referent electrodes and electrolyte pH can be overcome
by recalculation of applied potential to RHE. However, due to differences in light intensity,
light wavelengths and electrolytes are the results incomparable.
So far for pristine TiO2, nanorods seems to be the nanostructure exhibiting the highest
usability for water splitting showing photocurrent density of 1.0 mA/cm2 at 0.62 V vs RHE
[11]. Among the modified structures, CdTe quantum dots modified TiO2 nanotubes exhibit
photocurrent density six times higher than pristine TiO2 ~ 6 mA/cm2 at 0.6 V vs RHE [3]. In
the case of Fe2O3, pristine nanostructures exhibiting the best results are nanotubes with
photocurrent density 2.2 mA/cm2 at 1.43 V vs RHE [5] and for modified structures nanorods
doped by Pt showed photocurrent density 10 mA/cm2 at 1.5 V vs RHE [10].
Acknowledgements
Authors acknowledge the financial support from Grant Agency of the Czech Republic
(project number 15-19705S).

29
References
[1] A. Fujishima and K. Honda, Nature, 238 (1972) 37.
[2] Z. Zhang, M.F. Hossain and T. Takahashi, Applied Catalysis B: Environmental, 95 (2010) 423.
[3] X.-F. Gao, H.-B. Li, W.-T. Sun, Q. Chen, F.-Q. Tang and L.-M. Peng, The Journal of Physical
Chemistry C, 113 (2009) 7531.
[4] P. Hoyer, Langmuir, 12 (1996) 1411.
[5] A. Mao, K. Shin, J.K. Kim, D.H. Wang, G.Y. Han and J.H. Park, ACS Applied Materials &
Interfaces, 3 (2011) 1852.
[6] T. Kasuga, M. Hiramatsu, A. Hoson, T. Sekino and K. Niihara, Langmuir, 14 (1998) 3160.
[7] A. Wolcott, W.A. Smith, T.R. Kuykendall, Y. Zhao and J.Z. Zhang, Small, 5 (2009) 104.
[8] R.S. Chen, C.A. Chen, W.C. Wang, H.Y. Tsai and Y.S. Huang, Applied Physics Letters, 99 (2011)
222107.
[9] V.A.N. de Carvalho, R.A.d.S. Luz, B.H. Lima, F.N. Crespilho, E.R. Leite and F.L. Souza, Journal
of Power Sources, 205 (2012) 525.
[10] C.-Y. Chang, C.-H. Wang, C.-J. Tseng, K.-W. Cheng, L.-W. Hourng and B.-T. Tsai, International
Journal of Hydrogen Energy, 37 (2012) 13616.
[11] B. Sun, T. Shi, Z. Peng, W. Sheng, T. Jiang and G. Liao, Nanoscale Res Lett, 8 (2013) 1.
[12] A. Mao, N.-G. Park, G.Y. Han and J.H. Park, Nanotechnology, 22 (2011) 175703.
[13] S.U.M. Khan and T. Sultana, Solar Energy Materials and Solar Cells, 76 (2003) 211.
[14] N.M. Deyab, P. Steegstra, A. Hubin, M.-P. Delplancke, H. Rahier and N.K. Allam, Journal of
Power Sources, 280 (2015) 339.
[15] S. Hoang, S. Guo, N.T. Hahn, A.J. Bard and C.B. Mullins, Nano Letters, 12 (2011) 26.
[16] S. Chaguetmi, F. Mammeri, M. Pasut, S. Nowak, H. Lecoq, P. Decorse, C. Costentin, S. Achour
and S. Ammar, J Nanopart Res, 15 (2013) 1.
[17] B.D. Chernomordik, H.B. Russell, U. Cvelbar, J.B. Jasinski, V. Kumar, T. Deutsch and M.K.
Sunkara, Nanotechnology, 23 (2012) 194009.
[18] M. Frites, Y.A. Shaban and S.U.M. Khan, International Journal of Hydrogen Energy, 35 (2010)
4944.
[19] Y. Ling, G. Wang, D.A. Wheeler, J.Z. Zhang and Y. Li, Nano Letters, 11 (2011) 2119.
[20] X. Qi, G. She, X. Huang, T. Zhang, H. Wang, L. Mu and W. Shi, Nanoscale, 6 (2014) 3182.

30
HYDROGEN PERMEABILITY OF SELECTED PROTON EXCHANGE MEMBRANES
IN WATER ELECTROLYIS PROCESS
J.Mališ, M. Paidar, K. Bouzek
University of Chemistry and Technology, Prague, Dept. of Inorganic Technology, Technická
5, 166 28 Prague 6, Czech Republic ([email protected])
Increasing installed capacity of renewable electric energy sources make new demands on
electric grid. Main problem of renewable sources is unpredictable production of energy,
which is difficult to store. One possibilities is using pump hydro-plants for energy storage, but
this solution is limited by geographical conditions. On the other hand hydrogen economy
represents viable solution of energy storage, because capacity of such system is limited only
by storage capacity of hydrogen. Overproduction of electric energy is converted to chemical
energy of hydrogen, which can be stored and can be converted back to electric energy in time
of elevated consumption of electric energy. Hydrogen can be produced by water electrolysis
process, which can be realized by three ways [1,2]. One way is alkaline process, which
represents mature technology, typical of large scale installations. Second way is PEM water
electrolysis which is more effective and more flexible than alkaline process. Third way is high
temperature electrolysis, which is still available only in laboratory scale. PEM electrolyzer
consists of three main parts, like any electrochemical reactors: cathode, anode and electrolyte.
Electrolyte is here represented by proton exchange membrane (PEM), which also separates
both electrodes chambers of electrolyzer. While hydrogen is produced on the cathode, oxygen
is evolved on the anode. Water is decomposed on catalyst particles fixed in the gas diffusion
electrodes. Membrane have to be ionic conductive to ensure contact between anode and
cathode.
Main disadvantage of PEM electrolysis is high investment costs, which is given
by necessity of using catalysts based on platinum metals and expensive membrane. Most
promising method for catalysts loading reduction is to operate at elevated temperature above
100°C [2]. The electrode kinetics will be enhanced and therefore the overpotential at both
electrodes is reduced. It also enables decrease of catalysts loading.
Elevated operation temperature requires thermaly stable materials. Membrane, which is
typicaly based on perfluorinated sulfonated polymer [1,2], have to be hydrated for ensure
ionic conductivity. Water is necessary in liquid form for hydration of membrane and
preservation high intensity of process. Presence of the swelling water in the bulk of the
membrane forms pathways in the membrane allowing the transport of the gas molecules.
Operation at elevated pressure is favourable, because generated hydrogen is already
compressed. By this way it is possible to save some energy necessary for compression
of gases for gasholders store.
The aim of this work was to determine permeation of the produced gases through the
separator represented by the polymer electrolyte membrane under PEM water electrolysis
conditions. It is because permeation of oxygen and hydrogen in this cell represents significant
problem from two points of view. At first, mixture containing 4,0 vol.% of hydrogen in
oxygen is explosive. At the same time, permeation of gasses across the membrane represents
loss of the process faradaic efficiency. As separator it was used membrane made from
perfluorinated sulphonated polymer. Those types of membranes were originally developed for
chlor-alkali electrolysis [2], where permeation of generated gases is not a main problem. Also
operation temperature of chlor-alkali electrolysis is typicaly under 90°C. Application of
perfluorinated sulfonated membranes in process with operation temperature over 100°C is not
well described. Even the membrane material is formally considered as dense and more or less
impermeable, its swelling (induced by the presence of the functional groups in the polymer

31
molecule structure) has to be considered. It thus means that beside thickness also the chemical
composition and structure of the polymer has an impact on its permeability.
In the present study it was tested most used type of perfluorinated sulphonated
membrane Nafion® 117. Cathode was presented by commercial electrodes E-TEK with
catalyst loading 0,5 mg of Pt per cm2. Anode was presented by homemade electrode, which
consists from IrO2 catalyst deposited on titanium felt. The catalyst loading was 1 mg of IrO2
per cm2. Active area of electrolyser was 4 cm
2. Asymmetric pressure operation mode was
used in this work. Oxygen was generated at atmospheric pressure while hydrogen pressure
was set to overpressure 200 kPa. Generated oxygen was analysed by gas chromatography.
Diffusion of hydrogen through membrane was studied in temperature range 40-120°C.
Data from these measurements are presented on the figure 1. According to the expectations,
permeability increases with increasing temperature. It is connected to increased expansion of
the membrane and decreasing viscosity of the pore fluid. Data measured for other pressure
differences were qualitative same. Concentration of hydrogen in oxygen decreases with
increasing current densities. Explanation this effect is, that with increasing current densities
increase volume of generated gases faster than volume of hydrogen, which penetrated through
membrane into anode chamber.
Fig. 1: volume concentration of hydrogen in generated oxygen at pressure difference 200 kPa
Measured data presents safety area of operation parameters of PEM water electrolyzer,
because all concentrations are under critical concentration 4,0 vol.%. Elevated permeation of
hydrogen can form explosive mixture at higher pressure differences.
Acknowledgement
This work was supported by the specific university research (MSMT No 20/2015).
References
[1] A. Ursúa, L. M. Gandía, P. Sanchis, Proceedings of the IEEE (2012), 100(2), 410-426.
[2] P. Häussinger, R. Lohmüller, A. M. Watson, Hydrogen, 2 . Production, Ullmann's encyclopedia
of industrial chemistry, Wiley, ISBN: 9783527306732, 251-304
40°C50°C
60°C70°C80°C90°C100°C110°C120°C
0
0.5
1
1.5
2
2.5
3
3.5
12
34
tem
pe
ratu
re [°C
]
c H
2 [
% v
ol.]
I [A]

32
EFFECT OF OPERATING CONDITIONS AND ANODE COMPOSITION ON KINETIC
PARAMETERS OF OXYGEN EVOLUTION REACTION IN SOEC
F. Karas, R. Kodým, M.Paidar, K. Bouzek
University of Chemistry and Technology, Prague, Dept. of Inorganic Technology, Technická
5, 166 28 Prague 6, Czech Republic ([email protected])
Hydrogen production by steam electrolysis in the solid oxide electrolysis cell (SOEC)
attracted a great interest of researchers especially within last decade. This is due to the
promising properties of hydrogen with respect to its potential utilization in the field of energy
storage. In this concept, the SOEC system can be connected either with solar concentrators,
where it could serve as a technology for the efficient large scale hydrogen production, or with
nuclear reactors of fourth generation for effective leveling of the electric power generation.
Such hydrogen can be subsequently used either in various processes as a valuable raw
material or it can serve for other purposes such as fuel for hydrogen powered vehicles, or for
electricity generation.
Through the fact, that SOEC has many advantages in comparison with the low temperature
water electrolysis processes, such as high process efficiency, no need of platinum metals
based catalysts or possibility of reversible operation, i.e. in electrolysis (SOEC) or fuel cell
(SOFC) regime, there are still some issues to be overcome. One of the significant problems
represents anode (oxygen electrode) performance and stability. Therefore, it was a subject of
this work to optimize composition of the oxygen electrode and to determine kinetic
parameters of oxygen evolution reaction in dependence of operating conditions.
So far, the most frequently used SOEC anodes material is strontium doped lanthanum
manganate (LSM). LSM is characterized by its perovskite structure and mixed ionic and
electronic conductivity. However, its ionic conductivity is rather poor when compared to the
electronic one. Anodes prepared from pure LSM also suffer from delamination from the
electrolyte during operation in water electrolysis regime. Therefore, the yttria stabilized
zirconia (YSZ), i.e. the electrolyte phase, is usually added to the anode structure to form the
composite electrode. Resulting microstructure of anode and the ratio between LSM and YSZ
is crucial to obtain good anode performance.
Within the framework of this work, the oxygen evolution reaction was studied on five
composites with different LSM/YSZ ratio. These anode composites were prepared using
commercial powder precursors and deposited on the YSZ electrolyte pellet by screen printing
method. They were subsequently tested in a form of symmetrical cells (i.e. electrochemical
cell with both electrodes of same composition) in the three electrode set-up. The
pseudostationary voltammetric curves were recorded upon working electrode polarization
within the electrode potential range of ±1 V vs. electrode reversible potential. Since the
reference electrode has the same composition as the working electrode and it was subjected to
the same environment (gas composition), the reversible cell voltage has a value of 0 V. Thus,
study of oxygen electrode was accomplished both in electrolysis and fuel cell regime, i.e.
anodic and cathodic polarization of the working electrode.
Besides the electrode composition (YSZ/LSM ratio), the effect of operating temperature
and oxygen concentration on the oxygen electrode performance was studied. Finally, the
kinetic parameters 𝑗0𝑉 [A m
–3] (exchange volumetric current) and 𝛼 (charge transfer
coefficient) of oxygen evolution reaction were evaluated from the global polarisation data by
means of 2-dimensional mathematical model of porous electrode. The model was solved by
the finite element method implemented in COMSOL MultiphysicsTM
. A two-parameters (𝑗0𝑉,
𝛼) optimization routine fminsearch incorporated in MATLAB code was employed to search

33
for the minimum of the sum of the squares of the errors between the modeled and
experimentally determined voltammetric curves.
Experimentally measured voltammetric curves for all electrode compositions and two
operational temperatures (600 °C and 800 °C) are shown in Fig. 1. Measured data show the
optimal composition of oxygen electrode to change with increasing operational temperature
from 60 wt. % LSM at 600 °C to 50 wt. % LSM at 800 °C. This is caused by increase in ionic
conductivity of YSZ and electronic conductivity of LSM with increasing temperature. Thus,
the composition of anode mixture was successfully optimized and well performing stable
anode was prepared.
Fig. 1: Voltammetric curves recorded at 600 °C and 800 °C; working and reference electrode
gas – 20 vol. % O2 in N2, counter electrode gas – pure O2
Fig. 2 shows example of kinetic parameters evaluated as a function of oxygen
concentration at 800 °C. These results confirm that even small addition of YSZ phase to the
oxygen electrode significantly improve its performance, presumably predominantly by
extension of electrochemically active surface area of the electrode. Moreover, as the
parameter 𝛼 decreases with increasing amount of YSZ present in the electrode, it might be
assumed that either rate determining step of the process or even whole reaction mechanism is
changing upon YSZ addition. Fig. 2 also shows that oxygen concentration has almost no
effect on the electrode performance i.e. only minor changes of 𝑗0𝑉 parameter were identified
for increasing concentration of O2.
Fig. 2: Kinetic parameters (𝑗0𝑉 and 𝛼) evaluated for operational temperature of 800 °C as a
function of oxygen concentration
Acknowledgement
This work was supported by the Technology Agency of the CR under project no:
TA01020930 and from specific university research (MSMT No 20/2015).

34
ENHANCED PEC WATER SPLITTING EFFICIENCY OF HEMATITE THIN
PHOTOANODES – THE ROLE OF TEXTURE
S. Kment1
, Z. Hubicka 1
, M. Čada 1
, J. Olejníček 1
, R. Zbořil 2
, J. Krýsa 3
1 Institute of Physics AS CR, v.v.i., Na Slovance 2, Prague, Czech Republic ([email protected])
2 Palacky University, 17. listopadu 1192/12, 771 46 Olomouc, Czech Republic
3 University of Chemistry and Technology, Prague, Dept. of Inorganic Technology,
Technická 5, 166 28 Prague 6, Czech Republic
Hydrogen production from photoelectrochemical (PEC) water splitting driven by solar
power is one of the clean technologies that can be used for environmentally friendly fuel
production that is hydrogen. Iron oxide (α-Fe2O3) with hematite crystalline structure possesses
many advantageous propertie. The material’s substantial light absorption, offering potential
conversion of up to 17% of the sun’s energy into hydrogen (band gap energy between 2.0–2.2
eV),1 nontoxicity, high stability in aqueous environments, ample abundance and low cost are
generally superior compared to other photoanodes. [1]
In the present work, we attempted to tune the crystal orientation and texture of hematite
photoanodes by carefully controlling the energy of particles bombarding the substrate during
a plasma assisted deposition procedure, i.e., a magnetron sputtering process.
The highly oriented hematite films examined in this study were fabricated by DC pulse
reactive magnetron sputtering of a pure iron target working as a cathode in an Ar/O2 gas
mixture. Three different pulsing regimes of deposition magnetron discharge were used: (i)
high impulse power magnetron sputtering mode (HiPIMS, 0.1 kHz), (ii) pulsing sputtering
mode (PS, 1 kHz), and (iii) medium frequency sputtering mode (MFS, 50 kHz). As a result of
different pulsing frequencies, fP, and duty factors of a pulsing cycle, du, used, various cathode
pulse current densities were reached.
Fig. 1: (a) X-ray diffraction patterns of hematite films deposited on the amorphous fused
silica substrates; (b) models of the hematite crystal lattice with (104) and (110) preferentially
oriented planes displayed; (c) simulated PEC water splitting activity of hematite photoanodes
deposited under different energy of substrate ion bombardment. The PEC characteristics were
recorded under solar light AM 1.5 simulated conditions with an intensity of 100 mW cm–2
,
using 1 M KOH solution as the electrolyte, and with a scan rate of 1 mV s–1
.
XRD patterns of films are presented in Figure 1a. It can be seen that the main variation was
in the two most intense diffraction peaks corresponding to (110) and (104) reflections (in
hexagonal coordinates) due to hematite, α-Fe2O3. Only in the case of the MFS films, both
these diffraction peaks occurred, suggesting the common polycrystalline hematite form. The
main reflection observed in the spectrum for the PS film was from the (104) plane, whereas
the desired preferential phase orientation along the (110) plane was unambiguously identified
in the XRD pattern of the HiPIMS film. The (110) reflection peak broadening suggested that

35
the HiPIMS films were composed of nanocrystalline grains when compared to the remaining
types of tested photoanodes (MFS, PS). Generally, the short duty cycles and low repetition
frequency of the HiPIMS discharge resulted in a high power density (4 kW/cm2) and high
plasma density (∼1018
–1019
m−3
) in the pulse, however, the values averaged over the whole
period were much smaller (comparable or even lower than in the DC mode). Owing to the
high power of the HiPIMS pulse, a large fraction of the sputtered metal (here Fe) particles
were ionized in the target region. Thus, the high energy ion flux, bombarding the substrate,
was considerably enhanced, potentially hugely affecting the film crystallinity, texture, grain
size, microstructure, density, adhesion, etc., by influencing surface diffusion. Energetic
bombardment in the HiPIMS mode removes adsorbed impurities and facilitates surface
diffusion and migration, allowing adatoms to be accommodated in certain preferential plane
orientation, in this study, orientation along the (110) plane. In comparison with the HiPIMS
approach, the energy of particles impinging the substrate is negligible in the case of the MFS
mode. Thus, this mode resulted in formation of polycrystalline grains without any preferential
plane orientations, which was consistent with XRD data of natural isotropic hematite powder
(JCPDS 33-0664). On the other hand, the reflection peak at 2Θ = 33.3°, presented in the PS
photoanode XRD spectrum, was attributed to (104) reflection. The pulse discharge current
during the PS deposition was tenfold smaller than that for the HiPIMS mode. Thus, the
energy of particles bombarding the substrate surface was lower in the former case but still
much higher than expected in the MFS method. As a result, hematite adatoms tended to
assemble in a different way, ultimately leading to the (104) texture.
Large differences in the PEC simulated water splitting performance were observed
between the tested films (Figure 1c). In these experiments, J-V polarization curves were
measured under standard AM 1.5 G (intensity 100 mW cm–2
) chopped light illumination. The
highest photocurrent values (0.28 mA cm–2
at 1.23 V and 0.65 mA cm–2
at 1.55 V vs. RHE)
were obtained with the HiPIMS fabricated hematite photoanodes. Since all experimental
conditions were kept identical and the examined photoanodes differed principally in the
preferential alignment of the crystallites, the excellent photoactivity of the HiPIMS
photoanode was most likely due to the favorable conductivity of the majority carriers
(electrons) along the [110] axis (c-axis) perpendicularly connected to the FTO substrate. The
second highly textured hematite photoanode deposited using the PS mode exhibited an almost
negligible plateau photocurrent of 0.02 mA cm–2
at 1.23 V vs. RHE, which remained almost
constant until the water oxidation dark current onset. This drastic decrease can be explained
by the synergetic effect of low electron and hole mobilities within the (104) plane oriented
parallel to the c-axis and its non-ideal oxygen dominated surface termination, which is
believed to cause much higher surface recombination due to the high density of surface states
acting as traps. The most cathodically shifted dark current onset corresponding to the PS
photoanode can also be attributed to the surface or defect states. In between the two extremes
(HiPIMS and PS films), the photoactivity of the untextured MFS films showed a photocurrent
maxima of 0.14 mA cm–2
at 1.23 V and 0.38 mA cm–2
at 1.55 V vs. RHE. This result is
consistent with the XRD patterns, which showed that both discussed planes were present
almost equally.
Acknowledgement
This work was supported by the Grant Agency of the Czech Republic – projects
P108/12/2104 and 15-00863S; and by the Academy of Sciences of the Czech Republic –
project M100101215.
References
[1] Sivula, K.; Le Formal, F.; Grätzel, M. Chemsuschem 2011, 4, 432-449.
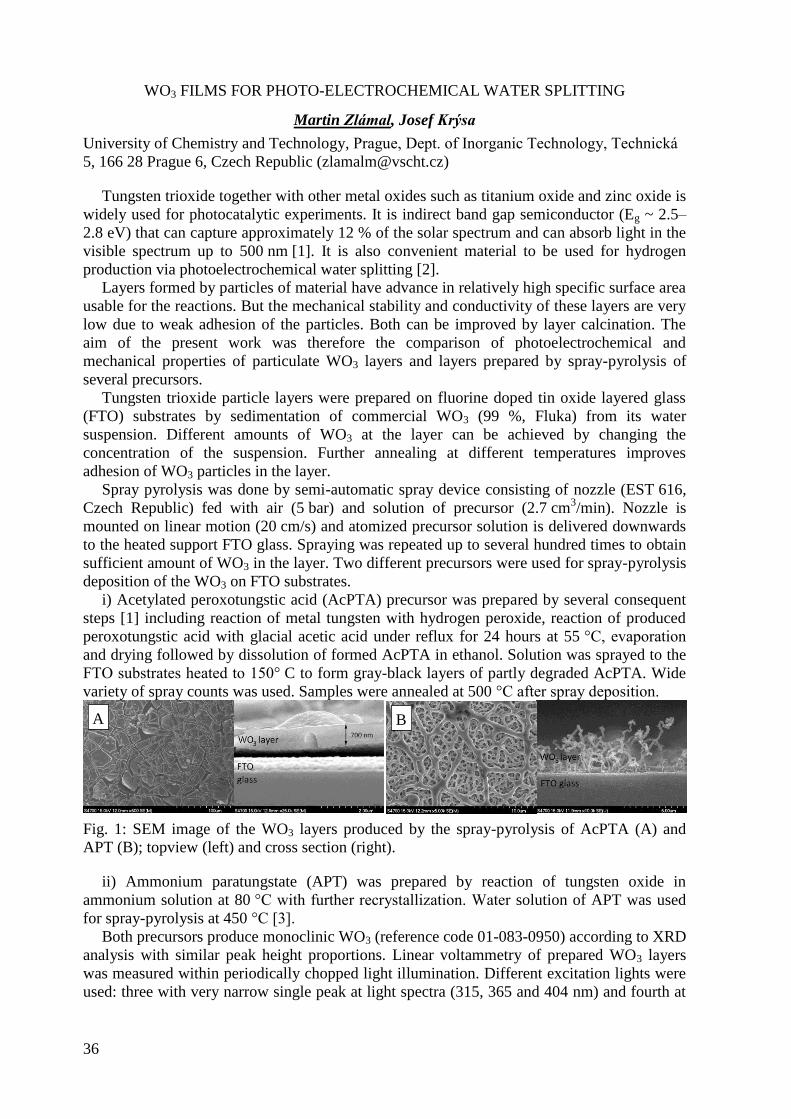
36
WO3 FILMS FOR PHOTO-ELECTROCHEMICAL WATER SPLITTING
Martin Zlámal, Josef Krýsa
University of Chemistry and Technology, Prague, Dept. of Inorganic Technology, Technická
5, 166 28 Prague 6, Czech Republic ([email protected])
Tungsten trioxide together with other metal oxides such as titanium oxide and zinc oxide is
widely used for photocatalytic experiments. It is indirect band gap semiconductor (Eg ~ 2.5–
2.8 eV) that can capture approximately 12 % of the solar spectrum and can absorb light in the
visible spectrum up to 500 nm [1]. It is also convenient material to be used for hydrogen
production via photoelectrochemical water splitting [2].
Layers formed by particles of material have advance in relatively high specific surface area
usable for the reactions. But the mechanical stability and conductivity of these layers are very
low due to weak adhesion of the particles. Both can be improved by layer calcination. The
aim of the present work was therefore the comparison of photoelectrochemical and
mechanical properties of particulate WO3 layers and layers prepared by spray-pyrolysis of
several precursors.
Tungsten trioxide particle layers were prepared on fluorine doped tin oxide layered glass
(FTO) substrates by sedimentation of commercial WO3 (99 %, Fluka) from its water
suspension. Different amounts of WO3 at the layer can be achieved by changing the
concentration of the suspension. Further annealing at different temperatures improves
adhesion of WO3 particles in the layer.
Spray pyrolysis was done by semi-automatic spray device consisting of nozzle (EST 616,
Czech Republic) fed with air (5 bar) and solution of precursor (2.7 cm3/min). Nozzle is
mounted on linear motion (20 cm/s) and atomized precursor solution is delivered downwards
to the heated support FTO glass. Spraying was repeated up to several hundred times to obtain
sufficient amount of WO3 in the layer. Two different precursors were used for spray-pyrolysis
deposition of the WO3 on FTO substrates.
i) Acetylated peroxotungstic acid (AcPTA) precursor was prepared by several consequent
steps [1] including reaction of metal tungsten with hydrogen peroxide, reaction of produced
peroxotungstic acid with glacial acetic acid under reflux for 24 hours at 55 °C, evaporation
and drying followed by dissolution of formed AcPTA in ethanol. Solution was sprayed to the
FTO substrates heated to 150° C to form gray-black layers of partly degraded AcPTA. Wide
variety of spray counts was used. Samples were annealed at 500 °C after spray deposition.
Fig. 1: SEM image of the WO3 layers produced by the spray-pyrolysis of AcPTA (A) and
APT (B); topview (left) and cross section (right).
ii) Ammonium paratungstate (APT) was prepared by reaction of tungsten oxide in
ammonium solution at 80 °C with further recrystallization. Water solution of APT was used
for spray-pyrolysis at 450 °C [3].
Both precursors produce monoclinic WO3 (reference code 01-083-0950) according to XRD
analysis with similar peak height proportions. Linear voltammetry of prepared WO3 layers
was measured within periodically chopped light illumination. Different excitation lights were
used: three with very narrow single peak at light spectra (315, 365 and 404 nm) and fourth at
A B

37
the standard solar illumination conditions (AM 1.5 G). Better adhesion at higher annealing
temperatures results in more stable layers with higher photocurrent. Increasing of the
annealing temperature to 600 °C caused the formation of undesirable crystal phases (produced
by the reaction of WO3 and FTO layer) and significant decrease in photocurrent/IPCE
(incident photon to current efficiency).
Key parameters of semiconductor layers for photoelectrochemical water splitting
application are maximum photocurrent and the layer stability. It was experimentally proved
that both parameters can be significantly improved by thermal annealing at 450-500 ºC for
particulate layers of WO3 [4].
Fig. 2: Photocurrents of prepared WO3 layers under AM1.5G light.
Spray-pyrolysis of AcPTA produces homogeneous WO3 layers with photocurrents
comparable to the particular layers. However with increasing amount of formed WO3
adhesion is decreasing resulting to the pealing of the thick layers as can be seen at Fig. 1A.
Deposition of APT by spray pyrolysis (Fig. 1B) produce layers with lower photocurrents, but
with very good mechanical properties (Fig. 2). Subsequent temperature annealing at 500 °C of
the layers formed by APT spray-pyrolysis has no positive effect to their photocurrents.
Acknowledgement
Authors acknowledge Grant Agency of the Czech Republic (P108/12/2104) for the financial
support.
References
[1] Y. Sun, C.J. Murphy, K.R. Reyes-Gil, E.A. Reyes-Garcia, J.M. Tornton, N.A. Morris,
D. Raftery, International Journal of Hydrogen Energy 34 (2009) 8476-8484.
[2] X. Liu, F. Wang, Q, Wang, Physical Chemistry Chemical Physics 14 (2012) 7894-7911.
[3] V.V. Ganbavle, G.L.Agawane, A.V. Moholkar, J.H. Kim, K.Y. Rajpure, Journal of
Materials Engineering and Performance 23 (2014) 1204-1213.
[4] M. Zlámal, J. Krýsa, Catalysis Today 252 (2015) 162-167.

38
DEFECTS IN WET-CHEMICALLY SYNTHESIZED WO3 NANOSTRUCTURES:
IMPACT ON PHOTOELECTROCATALYTIC PROPERTIES
Augusto Márquez 1,3
, Manuel Rodríguez 2
, Juan A. Anta a
, Gerko Oskamb, Thomas
Berger 3
1 Universidad Pablo de Olavide, Dept. of Physical, Chemical and Natural Systems, Spain
2 CINVESTAV-IPN, Dept. of Applied Physics, México
3 University of Salzburg, Dept. of Material Science & Physics, Austria
Mesoporous WO3 films have gained considerable interest in the past due to their use in
electrochromic devices [1]. In addition, WO3 is a promising candidate for
photoelectrochemical water oxidation due to its high photocorrosion resistance in acidic
media [2].
Monoclinic WO3 was synthesized by alcoholysis and partial hydrolysis of WCl6 in ethanol
assisted by solvothermal conditions.[3] Mesoporous electrodes were then prepared by casting
the particle suspension on a conductive substrate (fluorine-doped tin oxide, tungsten or
titanium foil) followed by a sintering step at 450 °C or 550 °C, respectively. Whereas WO3
shows a high stability in acidic media it is well known that electrochemical proton insertion
leads to the formation of colored tungsten bronze. This process, which is exploited in
electrochromic applications, is related to significant structural changes in the oxide.[4] On the
other hand it is know from TiO2 that a charge transfer reductive doping procedure, which
consists of the concerted electron and proton accumulation in the oxide, may significantly
improve the photocatalytic properties of the semiconductor.[5]
In this presentation we will discuss the influence of a concerted electron and proton uptake
on the photoelectrocatalytic properties of WO3 electrodes in water photooxidation. The
electrochemical study will be complemented by UV-Vis and IR spectroelectrochemical
measurements. Our results show that an electrochemical doping can enhance the
photoelectrocatalytic activity only in the case of thin films sintered at low temperatures (450
°C). For these electrodes high defect concentrations at the nanocrystal surface are expected.
These defects possibly result from the wet-chemical origin of the oxide and cannot be healed
at the low sintering temperature. Excessive doping leads to an activity loss on all the studied
electrodes (sinter temperatures: 450 °C and 550 °C) due to the irreversible electrochemical
introduction of recombination sites.
Refereces
[1] Nah, Y.-C., Ghicov, A., Kim, D., Schmuki, P. Electrochem. Commun. 2008, 10 1777-
1780.
[2] Solarska, R., Jurczakowski, R., Augustynski, J. Nanoscale 2012, 4, 1553-1556.
[3] Rodríguez-Pérez, M., Chacón, C., Palacios-González, E., Rodríguez-Gattorno, G., Oskam,
G. Electrochim. Acta 2014, 140, 320-331.
[4] Królikowska, A., Barczuk, P., Jurczakowski, R., Augustynski, J. J. Electroanal. Chem.
2011, 662, 229-239.
[5] Idígoras, J., Berger, T., Anta, J.A. J. Phys. Chem. C 2013, 117, 1561-1570.

39
ORIGIN OF ELECTROCATALYTIC ACTIVITY OF THE RGO TOWARDS HYDROGEN
EVOLUTION REACTION IN AN ALKALINE WATER ELECTROLYSIS
D. Chanda1, J. Hnát
1, A. Dobrota
2, I. Pasti
2, M. Paidar
1, K. Bouzek
1
1 University of Chemistry and Technology, Prague, Dept. of Inorganic Technology,
Technická 5, 166 28 Prague 6, Czech Republic ([email protected]) 2 University of Belgrade, Faculty of Physical Chemistry, Serbia.
The growing energy demands of developed societies occurring in parallel with increasing
pressure on environmental protection and reduction of pollutions has inspired active research
in the field of environmentally friendly energy production and storage methods. In this
domain hydrogen represents one of the most promising energy carriers of the future. Water
electrolysis as an inseparable part of the hydrogen cycle represents a technology capable of
efficiently converting electrical energy from renewable power sources, such as solar or wind,
into the chemical energy of hydrogen. The latest trend in electrochemical water splitting
research represents anion selective membrane water electrolysis (ASMWE) attracting
currently a lot of interest. Main advantages of this process consist in the higher system
compactness, low rate of hydrogen cross-over and higher flexibility.
However, many ASMWE devices rely on use of noble metals like Pt for hydrogen
evolution reaction (HER), although their low abundancy and high cost. To develop a highly
efficient ASMWE system for practical application, finding a stable, low cost catalyst for HER
represents one of the key points. Mostly, transition metal based electrodes serve as a HER
catalyst in alkaline medium, but, their activity is far lower when comparing to Pt. Carbon-
containing compounds, like graphene, graphene oxide (GO), i.e. graphene containing a
significant amount of oxygen atoms in different functional groups, and reduced graphene
oxide (RGO) are also of interest showing promising properties in this direction. Following
examples may be mentioned at this place. MoS2 nanoparticles grown on RGO have shown
good photocatalytic activity towards the HER in photo-electrochemical water splitting
process. Yang et al. reported WS2 deposited on RGO as an efficient HER catalyst for acidic
water electrolysis. Porous NiO/RGO hybrid can extensively catalyse the OER in alkaline
medium. However, to the best of our knowledge, no information has been published to date
on the RGO comparable regarding its electrocatalytic activity towards HER in alkaline water
electrolysis to Pt.
Graphene (Geim and Novoselov 2010 Nobel Prize) has attracted a lot of attention in recent
years due to its potential application in many energy-related technological fields. Graphene is
defined as a planar hexagonal ring containing sp2 hybridized carbon atom with a two-
dimensional (2D) honeycomb lattice. Over the years, graphene-supported metal nanoparticles
attracted a lot of attention and it was found that in these systems graphene acts as an active
support. For example, when it comes to hydrogen storage graphene enhances the performance
of the composite material through H spillover, with a possibility to further tune its properties
by introduction defects and/or dopants to its structure. In HER catalysis, the same process is
of immense importance, as it enables cleaning of the catalyst surface due to the transfer of
discharged H to the active support where it recombines to H2, allowing on this way the
electrode reaction to proceed. In this work, a RGO/Ni foam catalyst is described that, even
when compared with a commercial Pt catalyst, exhibits high HER activity in alkaline
solution.
The objective of the present study is to verify suitability of RGO for application as a
catalyst for the HER in ASMWE. In order to prepare desired RGO, an improved and mild
method was proposed for preparation of graphite oxide. Resulting graphite oxide was
exfoliated to GO by ultrasonication. Subsequently, GO was reduced to RGO
electrochemically on nickel foam electrode. Produced RGO was characterized by a broad

40
range of spectroscopic techniques. In the next step its stability and activity towards HER in
alkaline water electrolysis was investigated by means of linear sweep voltammetry and in
single alkaline water electrolysis cell. As shown in Figure 1, current density obtained using
bare Ni foam cathode during the water electrolysis test was 54 mA cm-2
at a cell voltage of
1.85 V. In the case of the cathode modified with RGO current density under identical
conditions attained 223 mA cm-2
.
Based on the thermodynamic considerations which relied on the Density Functional
Theory (DFT) calculations, an atomic-level justification is put forward for the superb catalytic
activity of a RGO/Ni foam electrode. It led to a conclusion that H atoms, formed upon H2O
discharge on Ni, spill onto RGO serving as an H ad-atom acceptor (Figure 2). It continuously
clears active Ni sites. This mode of action is rendered by unique reactivity of RGO, which
arises due to the presence of O surface groups within the graphene structure and which is not
expected for pristine graphene.
Figure. 1. V–i characteristics of a single-cell
electrolyzer. Experimental conditions: 50 °C; 10 wt
% KOH solution; anode: bare Ni foam; cathode: bare
Ni foam, 0.15 mg cm-2
RGO coated Ni foam & 0.15
mg cm-2
Pt + qPPO binder (85:15); electrode area 3.8
cm2; electrolyte flow rate 350 ml min
-1. Assignment
of electrodes is indicated for all experiments in the
figure.
Figure. 2. Comparison of hydrogen binding
energies on the considered RGO model surfaces with
hydrogen adsorption/absorption energetics on the
Ni(001) surface. Shaded areas represent the range of
hydrogen binding energies on a particular surface.
Hydrogen binding energy on pristine graphene is
indicated by a thick horizontal line. Even at very low
H coverage, H binding presents an energetically
favourable alternative to the formation of subsurface H
atoms in the Ni phase.
Acknowledgement
The financial support from Technology Agency of the Czech Republic under project No.
TA03010594 is gratefully acknowledged.

41
SOL-GEL TIO2 BLOCKING LAYERS: ELECTROCHEMICAL PROPERTIES AND
ELECTROCHEMICAL DOPING
M. Zukalova1, L. Kavan
1, M. Bousa
1,2, Z. Bastl
1, D. Havlicek
2
1 J. Heyrovský Institute of Physical Chemistry, v.v.i., AS CR, Dolejškova 3, CZ-182 23
Prague 8, Czech Republic ([email protected]) 2 Charles University, Faculty of Science, Dept. of Inorg. Chem, Albertov 2030, Prague 2,
Czech Republic
Compact TiO2 thin films are used as blocking layers in solid state dye sensitized solar cells
(DSCs), and in the perovskite solar cells. Here, the TiO2 film serves as an electron collector
and simultaneously as a buffer layer, preventing recombination of photoexcited electrons
from the substrate, typically F-doped SnO2 conducting glass (FTO) with the hole conductor[1,
2].The compact TiO2 film is grown on top of FTO, usually by spray pyrolysis, DC-magnetron
sputtering, electrochemical deposition, atomic layer deposition and spin coating. Recently, we
developed a facile sol-gel dip coating technique producing dense and extremely mechanically
stable TiO2 thin films on various substrates from precursor solutions containing
poly(hexafluorobutylmethacrylate), PHFM or hexafluorobutyl methacrylate, HFM as the
structure-directing agents[3]. Compact TiO2 films were characterized by scanning electron
microscopy, X-ray diffraction, adsorption measurements, UV-vis spectroscopy, Raman
spectroscopy, atomic force microscopy and cyclic voltammetry of Li insertion[3]. The films
are quasi-amorphous, but crystallize to TiO2 (anatase) upon heat treatment at 500oC.
An electrochemical study shows that the films grown with the aid of PHFM or HFM
provide excellent rectifying interface for charge-transfer reactions of model redox probes.
Blocking properties of the films were tested by cyclic voltammetry using [Fe(CN)6]3-/4-
in
aqueous electrolyte solution[4]. The redox potential of [Fe(CN)6]3-/4-
(0.24 V vs. Ag/AgCl) is
sufficiently positive to the flat-band potential of TiO2 (anatase) at all pH values in aqueous
electrolyte solutions. The flat- FB of anatase single-crystal electrode shows
the Nernstian pH-dependence:
φFB = -0.36 – 0.059∙pH (in V vs. Ag/AgCl) (1)
Good-quality anatase blocking layers make a rectifying interface, at which no anodic
currents of ferrocyanide oxidation flows, because titania is in the depletion regime at these
potentials. The onset of cathodic current (ferricyanide reduction) appears at the potentials
FB, when the titania electrode is in the accumulation regime. The defects in
the blocking layer are thus sensitively monitored by the occurrence of anodic current, which is
assigned to the ferrocyanide oxidation at the naked FTO areas in pinholes. The as-grown films
was found to produce an excellent rectifying interface with almost no pinholes[4]. However,
anatase crystallization induced by heat treatment at 500oC in air partially decreases blocking
quality of dense sol-gel TiO2 layers. The overall area of thermally induced pinholes is
comparable to that in spray-pyrolyzed titania films. The flat- FB of the as-
grown films are upshifted by about 0.2–0.4 V against the values predicted for a perfect
anatase single-crystal surface (eq. 1), but they still follow the Nernstian pH dependence[4].
The same test was repeated by spiro-OMeTAD in dichloromethane electrolyte solution[4]. In
this case blocking is excellent, obviously due to the fact that large spiro-OMeTAD molecule
cannot penetrate the very narrow pores in the blocking layer, which are still accessible for
[Fe(CN)6]3-/4-
.
Proton insertion into titania takes place during electrochemical n-doping in aqueous acidic
electrolyte solution at sufficiently negative potential[5]. The n-doping of TiO2 can be

42
conveniently carried out by electrochemical reduction. In the absence of any other redox
couple in an aqueous electrolyte solution, the proton insertion, described by equation 2, is the
only faradaic process occurring on the titania electrode at sufficiently negative potentials in
acidic electrolyte solutions:
TiO2 + e- + H
+ → TiOOH (2)
Electrochemical doping was carried out simply by keeping the potential for a selected time
FB (eq 1). The proton insertion occurs with the
accumulation of electrons (eq 2). Doping manifests itself by permanent color changes and by
characteristic morphological differences on the surface[5]. The good-quality films are ideally
compact, mimicking the properties of a macroscopic single crystal electrode. In contrast to
porous polycrystalline electrodes, the doping of our dense films persists for at least weeks, if
the electrode is stored in air at room temperature. Stirring at 250 rpm causes stronger
electrochemical doping, as compared to doping in unstirred solution: the currents are
expectedly larger, and we observe massive hydrogen evolution with the concomitant H2
oxidation as on pure FTO[5]. Similarly to the previous case, the doping persists upon storage
in air. The doped films still accommodate Li+ by electrochemical insertion, but competition
between Li+ and H
+ ions in the lattice is detected by cyclic voltammograms.
Acknowledgement
This research was supported by the Grant Agency of the Czech Republic (contracts No. 13-
07724S and 15-06511S) and COST Action CM1104.
References
[1] M.M. Lee, J. Teuscher, T. Miyasaka, T.N. Murakami, H.J. Snaith, Science, 338 (2012)
643-647.
[2] M. Gratzel, Nature materials, 13 (2014) 838-842.
[3] J. Prochazka, L. Kavan, M. Zukalova, P. Janda, J. Jirkovsky, Z.V. Zivcova, A. Poruba, M.
Bedu, M. Döbbelin, R. Tena-Zaera, Journal of Materials Research, 28 (2012) 385-393.
[4] L. Kavan, M. Zukalova, O. Vik, D. Havlicek, Chemphyschem, 15 (2014) 1056-1061.
[5] M. Zukalova, M. Bousa, Z. Bastl, I. Jirka, L. Kavan, The Journal of Physical Chemistry C,
118 (2014) 25970-25977.

43
PRINTED TITANIA PHOTOANODES WITH ORGANOSILICA BINDER
P. Dzik 1
, M. Veselý1, M. Neumann - Spallart
2
1 Brno University of Technology, Faculty of Chemistry, Purkyňova 118, 612 00 Brno, Czech
Republic ([email protected]) 2 Groupe d'Étude de la Matière Condensée (GEMaC), CNRS/Université de Versailles, 45,
avenue des États-Unis, 78035 Versailles CEDEX, France
The mixture of titania-silica represents a perspective group of materials that have
recently been used as catalysts and supporting materials1-2
. Titania-silica mixtures were found
that improve the photocatalytic properties of pure titanium dioxide3, increase the specific
surface area4 and improve the adsorption properties
5. In this paper, we report on the
fabrication of titanium dioxide layers by direct inkjet pattering of nanocrystalline suspensions.
A recently reported organo-silica binder6 was mixed with commercial titania nanoparticles in
order to improve printed layer mechanical properties. Inkjet printable formulations with
various ratios of titania to binder were formulated and patterns of different thickness were
printed onto soda-lime, Pyrex and FTO glass substrates. Printed green body patterns were
further processed by thermal treatment or UV curing. The physical, chemical, electrical and
photocatalytic properties of printed, sintered and UV-cured patterns were investigated in
detail and the influence of post-deposition processing on printed layer properties was
elucidated.
For the sake of convenient testing of various silica-titania ratios, stock dispersions of
titanium dioxide in anhydrous ethanol were mixed first, having the same dry mass content as
the silica binder solution. The printing formulation was then prepared by mixing varying
volumes of silica binder solution, titania dispersion and viscosity-controlling solvent (butanol)
in 20 mL glass vials. Approximately 3 g of 1 mm diameter glass balls were added to each vial
and they were kept shaking for minimum 2 days on an oscillating plate shaker set to 900 rpm.
Printing of prepared inks was performed with an experimental inkjet printer Fujifilm Dimatix
2831 following a standard procedure described previously7. The deposition process was
finalized by curing. One copy of each sample set let to dry at ambient temperature and is
further referred to as “printed” (P) sample set. The second one was calcined at 450 °C in air
and is further referred to as “sintered” (S) sample set. The third one was immersed into
demineralized water and placed 30 cm under an industrial processing UV lamp (model 80
BQL7, 248 W, Ultralight AG, Liechtenstein) for 10 hours and was called “UV cured” sample
set (UV).
Photoelectrochemical characterization was performed by linear sweep voltammetry at
room temperature using a two-electrode setup with the 1 cm2 titania patches. The printed FTO
slide was scratched with a diamond knife and thus two isolated FTO strips were created. One
strip with the printed titania patch served as the working electrode and the opposite naked
FTO strip as the counter electrode. This setup was fitted into a custom build quartz cuvette.
The cuvette was filled with 0.1 M phosphate buffer (pH = 7) and fitted onto an optical bench
equipped with a fluorescent UV-A lamp emitting a broad peak centered at 365 (Sylvania
Lynx-L 11 W). A magnetic stirrer was placed beneath the cuvette and a magnetic flea inside
the cuvette provided efficient electrolyte mixing. The lamp emission was monitored by
Gigahertz Optic X97 Irradiance Meter with a UV-3701 probe and the irradiance was set to 3
mW/cm2 by adjusting the lamp-to-cuvette distance. Measurements of generated photocurrents
were performed with an electrometer build on the basis of National Instruments Labview
platform and supplying a linear voltage gradient of 10 mV/s from -0.5 to 2 V.
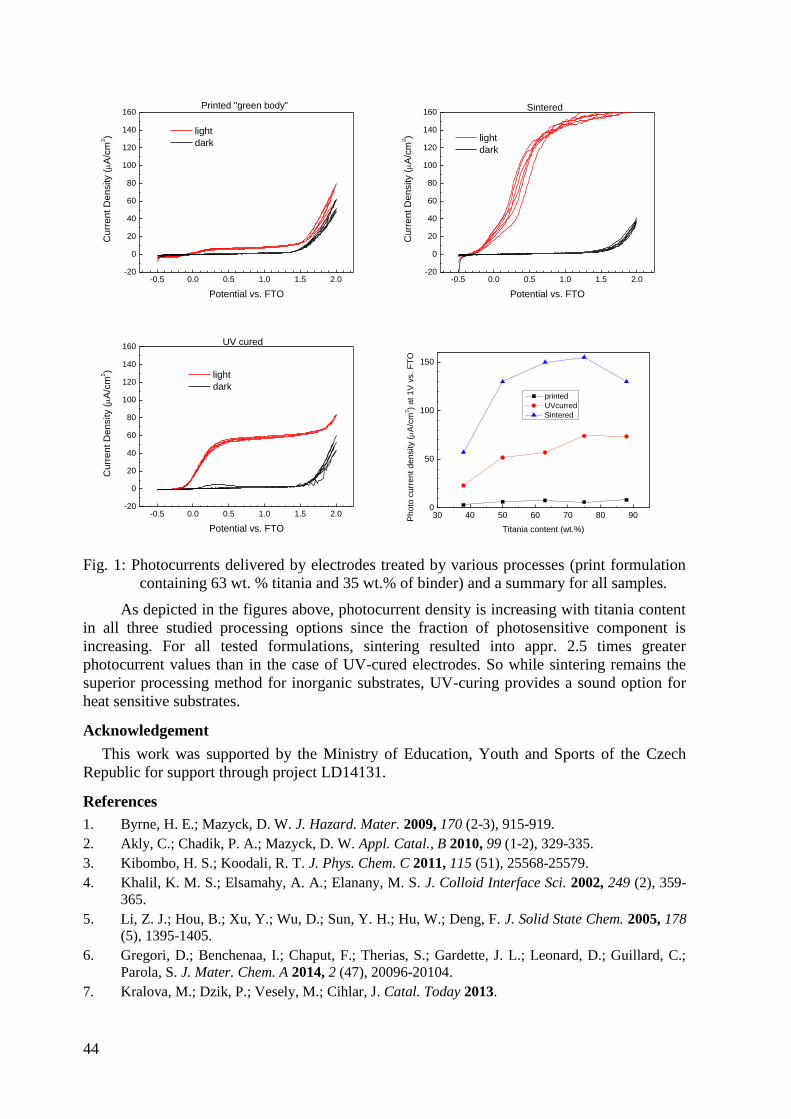
44
-0.5 0.0 0.5 1.0 1.5 2.0-20
0
20
40
60
80
100
120
140
160
light
dark
C
urr
en
t D
en
sity (A
/cm
2)
Potential vs. FTO
Printed "green body"
-0.5 0.0 0.5 1.0 1.5 2.0-20
0
20
40
60
80
100
120
140
160
light
dark
Cu
rre
nt
De
nsity (A
/cm
2)
Potential vs. FTO
Sintered
-0.5 0.0 0.5 1.0 1.5 2.0-20
0
20
40
60
80
100
120
140
160
light
dark
Cu
rre
nt
De
nsity (A
/cm
2)
Potential vs. FTO
UV cured
30 40 50 60 70 80 900
50
100
150
Ph
oto
cu
rre
nt
den
sity (A
/cm
2)
at
1V
vs.
FT
O
Titania content (wt.%)
printed
UVcurred
Sintered
Fig. 1: Photocurrents delivered by electrodes treated by various processes (print formulation
containing 63 wt. % titania and 35 wt.% of binder) and a summary for all samples.
As depicted in the figures above, photocurrent density is increasing with titania content
in all three studied processing options since the fraction of photosensitive component is
increasing. For all tested formulations, sintering resulted into appr. 2.5 times greater
photocurrent values than in the case of UV-cured electrodes. So while sintering remains the
superior processing method for inorganic substrates, UV-curing provides a sound option for
heat sensitive substrates.
Acknowledgement
This work was supported by the Ministry of Education, Youth and Sports of the Czech
Republic for support through project LD14131.
References
1. Byrne, H. E.; Mazyck, D. W. J. Hazard. Mater. 2009, 170 (2-3), 915-919.
2. Akly, C.; Chadik, P. A.; Mazyck, D. W. Appl. Catal., B 2010, 99 (1-2), 329-335.
3. Kibombo, H. S.; Koodali, R. T. J. Phys. Chem. C 2011, 115 (51), 25568-25579.
4. Khalil, K. M. S.; Elsamahy, A. A.; Elanany, M. S. J. Colloid Interface Sci. 2002, 249 (2), 359-
365.
5. Li, Z. J.; Hou, B.; Xu, Y.; Wu, D.; Sun, Y. H.; Hu, W.; Deng, F. J. Solid State Chem. 2005, 178
(5), 1395-1405.
6. Gregori, D.; Benchenaa, I.; Chaput, F.; Therias, S.; Gardette, J. L.; Leonard, D.; Guillard, C.;
Parola, S. J. Mater. Chem. A 2014, 2 (47), 20096-20104.
7. Kralova, M.; Dzik, P.; Vesely, M.; Cihlar, J. Catal. Today 2013.

45
INKJET PRINTED INTERDIGITATED CONDUCTIVITY SENSORS
M. Neumann-Spallart1, P. Dzik
2, M. Veselý
2
1 Groupe d'Étude de la Matière Condensée (GEMaC), CNRS/Université de Versailles,
45, avenue des États-Unis, 78035 Versailles CEDEX, France, 2 Brno University of Technology, Faculty of Chemistry, Purkyňova 118, 612 00 Brno, Czech
Republic
In this paper we report on the fabrication process and physical properties of cells for
measuring electrolyte conductance. We utilized the benefits of inkjet printing and prepared
gold conductive tracks on alumina with interdigitated design and variable finger density. Such
cells are of use in measuring the conductance of electrolytes of low ionic strength1. Further
applications may involve various capacitive sensors 2-3
and photoelectrochemical cells4. Due
to the materials used in this study, the printed electrodes are curable at high temperature if
contaminating deposits are to be removed, e.g. when biological samples had been measured5.
Pattern printing was performed with an experimental inkjet printer Fujifilm Dimatix
2831 whose features and benefits have been described previously6. Gold resinate solution RL
Au 01913 (art. no. 89960429, a product under development in 2014) was purchased from
Heraeus. Alumina sheets 26 x 76 mm, 0.635 mm thickness (Elceram Inc., Czech Republic)
were used as substrates. The interdigitated electrode patterns with finger widths between 200
and 2000 µm were drawn as vector graphics using Corel Draw. Three layers were overprinted
in a wet-to-wet manner using optimized printing settings and substrate treatment. The layers
were dried on a hot-plate at 120 °C and then fired at 800 °C for 30 min.
The studied sample series yielded a sheet resistance down to 0.27 Ω, corresponding to a
specific resistivity of only three times higher than bulk Au. The design of the devices, which
is based on an interdigitated photoelectrochemical cell fabricated by conventional
lithography4 is outlined in Fig. 1, with w, the finger width and s, the distance between fingers.
Fig. 1: Interdigitated finger device cross section
The conductivity cell constant, κ, of a sensor is defined by:
R = ρκ (1)
where R is the measured resistance and ρ is the specific resistivity of the electrolyte,
with σ, the specific conductivity equaling 1/ρ.
Using the measured values of s, w, and L (the finger length), and the resulting number
of fingers, N, in the mask-delimited zone, the conductivity cell constants were calculated
using an analytical solution derived by Olthuis 7:
κ = (2)
where
(3)
and

46
(4)
The incomplete elliptic integrals of the first kind (eq. 4) were evaluated numerically. In
Fig. 2, theoretical values of κ as a function of the number of fingers are plotted together with
experimentally determined values in aqueous electrolytes of different specific conductivity,
using a commercial, calibrated conductivity cell with κ = 0.125 cm-1
as standard.
Cell constants between 0.008 and 0.09 cm-1
were obtained. It can be seen that measured
and theoretically predicted values are very close for all electrolytes. The cell with the lowest
cell constant found in this series (0.008 cm-1
) is the most appropriate for measuring the
specific conductivity, σ, of very dilute electrolytes. For cells with an overall active area of the
size used in this work (16 mm × 52 mm), increasing the number of finger pairs further would
not lead to a significant decrease of κ as the curve κ vs. N flattens at high number of finger
pairs, N. As σ = R/κ, the measured resistance, R, is low for cells with low κ and can therefore
be obtained conveniently with instruments of limited high resistance input range. In this way,
the specific conductivity of distilled, ion-exchange and reverse osmosis purified water
samples was measured successfully.
0 10 20 30 40 50 60 70 80 90 100 110 120
0.00
0.01
0.02
0.03
0.04
0.05
0.06
0.07
0.08
0.09
1500µ
1250µ
750µ
theor
calc
860 µS/cm Na2SO
4
calc
117 µS/cm KNO3
calc
19.125 µS/cm KNO3
calc
5.025 µS/cm KNO3
(
cm
-1)
N
1000µ
500µ
250µ
Fig. 2: Cell constants of interdigitated devices. The labels refer to the finger widths. Open
spheres indicate theoretical values according to eq. 2.

47
0 1000 2000 3000 4000 5000 6000 7000 8000
0
200
400
600
800
1000
1200
10
13.21621
17.46681
23.0845
30.50896
40.32127
57.2894370.42841
93.07965123.016162.5805214.8698283.9763375.309492.0161655.5452866.38211145.0291513.2932000
IDE
1000µ
m
IDE
750µ
m
IDE
500µ
m
-Im
(Z/O
hm
)
Re(Z/Ohm)
IDE 250µm
= 0.125 /cm
Hz
Fig. 3. Impedance spectroscopy of interdigitated devices in 0.1 mM KNO3. IDE 250, IDE
500, IDE 750 and IDE 1000 stand for devices with the corresponding finger with and
gap (in µm) which are compared to a conventional parallel plate cell with κ = 0.125
cm-1
. The amplitude of the perturbing signal was 0.01 V rms.
Cells with w = s = 1000, 750, 500, and 250 µm in contact with 0.1 mM aqueous KNO3
solution were subjected to impedance spectroscopy. Fig. 2 shows that the amplitude, r (=
│Z│), of the impedance of the solution, can be conveniently obtained down to low
frequencies of 200 Hz (above which frequency the influence of diffusion layer capacitance
ceases to influence the response) up to and above 2 kHz.
References
1. Sheppard, N. F.; Tucker, R. C.; Wu, C. Anal. Chem. 1993, 65 (9), 1199-1202.
2. Jung, H.-W.; Chang, Y. W.; Lee, G.-Y.; Cho, S.; Kang, M.-J.; Pyun, J.-C. Anal. Chim. Acta
2014, 844, 27-34.
3. Guadarrama-Santana, A.; Garcia-Valenzuela, A.; Perez-Jimenez, F.; Polo-Parada, L. Revista
Mexicana De Fisica 2014, 60 (6), 451-459.
4. Neumann-Spallart, M. Electrochim. Acta 2011, 56 (24), 8752-8757.
5. Fu, Y.; Callaway, Z.; Lum, J.; Wang, R.; Lin, J.; Li, Y. Anal. Chem. 2014, 86 (4), 1965-1971.
6. Dzik, P.; Veselý, M.; Králová, M.; Neumann-Spallart, M. Appl. Catal., B 2015, 178, 186-191.
7. Olthuis, W.; Streekstra, W.; Bergveld, P. Sens. Actuators, B 1995, 24 (1-3), 252-256.

48
INFLUENCE OF pH ON THE PHOTOCATALYTIC TREATMENT OF CYANIDE
A. Brüger 1, G. Fafilek
1, M. Neumann-Spallart
2
1 Institute of Chemical Technologies and Analytics, Vienna University of Technology,
Getreidemarkt 9/164 A-1060 Vienna, Austria ([email protected])
2 Groupe d’Étude de la Matière Condensée, C.N.R.S., Université de Versailles, France
The toxicity of cyanide in water, air and soil is an excepted fact. However to find serious
exposure limits is a difficult task. Data for the evaluation is often old and difficult to use in
contemporary requirements, on the other hand, studies about the toxicity of cyanide are
getting more complicated due to the growing knowledge of its hazardousness.
One of the basic arguments for the definition of exposure limits in air is the detoxification
rate of cyanide in the human body. Two values are still in discussion in recent literature. The
rate of 17 µg/kg body weight/min is based on studies from Loevenhart (1918) [1], who tested
the impact of NaCN seriously ill patients, ignoring the fact that free cyanide is not stable in
solutions at high pH. The rate of 1 mg/kg body weight/min is found in a more recent
publication from Schulz (1982) [2], although no explanation was found for citations of
fatalities after consumption of similar cyanide concentrations in the same paper. Hence, an
amount of cyanide being metabolised in the body must be below this value.
The volatilisation rate of HCN in different pH values is a crucial point in the estimation of
the hazardousness of cyanide in the environment and further treatment opportunities. The
photoelectrocatalytic treatment, using TiO2 on conducting glass (FTO) was investigated by
the authors in previous studies. Treatment of solutions with a pH value of 10.5 resulted in a
low degradation rate, compared to experiments with other substances [3]. In plotting the
degradation rate against the distance of the redox potential to the energy of the valence band,
a correlation is found (Fig. 1)
𝑝 =𝑘 𝑉 𝐹
𝑖𝑝ℎ𝑜𝑡𝑜
p: ratio between the
rate constant of the
oxidation of the
oxidisable additive
(k) and the rate of
water oxidation in a
batch reactor with
the total volume V of
the solution.
F: Faradaic constant.
iphoto: photocurrent
produced with
irradiation of UV-
light.
Fig. 1: Linear free energy relationship - constant p against the difference of the energy of the
valence band to the redox potential of different species

49
The assumption of a relationship between the reaction rate and the difference of the energy
of the valence band to the redox potential can be confirmed if the reaction rate changes with
(EVB-Eredox). If the oxidation of cyanide proceeds via the direct route
𝐂𝐍𝐬
− + 𝐡𝐬+ ⇋ 𝐂𝐍∗
it should be pH independent and the difference to the pH dependent valence band level
increases. Experiments for the investigation of this relationship were done with TiO2 layers on
FTO glass and a steel counter electrode in a photoelectrocatalytic setup, using UVA light
(Fig. 2).
Fig. 2: Total and detailed Cyanide loss in a degradation experiment, using 400 mg/l Cyanide
solutions in buffered solutions of different pH values.
Besides the strong increase of volatilisation, the increase of cyanide oxidation with
decreasing pH is confirmed. Experiments were done in a closed setup with cyanide-
contaminated air suction through an absorption flask (1M NaOH). Experiments with other
materials will follow to investigate the acidic region and to prove the relationship on other
species.
Additional investigations of the processes in photoelectrocatalysis at different pH will help
to improve the detoxification capability of TiO2 in gold mining. Furthermore, the cyanide
management in gold processing has to be improved to minimise the intake of NaCN. With a
new discussion of cyanide-limits in gold mining based on recent investigations of the toxicity,
the further reduction of cyanide contaminations will require advanced technologies for the
degradation and the analysis as well.
References [1] Loevenhart A. S., Lorenz W. F., Martin H. G., Malone J. Y., Arch. Intern. Med. 21 (1918) 109-
129.
[2] Schulz V., Gross R., Pasch T., Busse J., Loeschcke G., Klinische Wochenschrift 60 (1982) 1393-
1400.
[3] Shinde P.S., Patil P.S., Bhosale P.N., Brüger A., Nauer G., Neumann-Spallart M., Bhosale C.H.,
Journal of Applied Catalysis B: Environmental, 89, (2009), 288–294

50
MECHANISM OF H3PO3 ELECTROCHEMICAL OXIDATION ON PLATINUM IN
CONTEXT OF HIGH TEMPERATURE PEM FUEL CELL OPERATION
M. Prokop, T. Bystroň, K. Bouzek
University of Chemistry and Technology, Prague, Dept. of Inorganic Technology, Technická
5, 166 28 Prague 6, Czech Republic ([email protected])
High temperature fuel cells with proton exchange membrane (HT PEM FC) represent a
compromise between low temperature PEM FCs and high temperature systems in context of
catalyst poisoning resistance and construction material demands. Due to the operating
temperature above 130 °C HT PEM FCs utilize membrane based on polybenzimidazole doped
with H3PO4.
Phosphoric acid could be reduced both electrochemically at potentials of H-adsorption and
chemically by H2 at temperatures over 70 °C to phosphorus compounds with lower oxidation
state than P(V). These impurities that are specifically adsorbed on Pt significantly decrease
electrochemically active surface area of the electrode. Lately H3PO3 was identified as one of
the main products of H3PO4 reduction [1]. During HT PEM FC operation H3PO3 is produced
in the anode compartment and could be possibly transported to cathode where undergoes
anodic oxidation.
Basic information about H3PO3 electrochemical behaviour on Pt was included in our
previously published work [2]. Goal of the present work is to determine mechanism and
kinetics of electrochemical oxidation of H3PO3 on Pt electrode. With complex information on
H3PO3 oxidation it could be potentially possible to modify HT PEM FC operation regime to
partly avoid production of H3PO3 or remove it from the electrolyte.
All measurements were performed in three-electrode arrangement on a working bulk Pt
electrode (1.11 cm2), Pt foil counter electrode and using Hg|HgSO4|K2SO4 (saturated)
reference electrode (MSE) separated from electrolyte by double liquid junction (1st stage
filled with corresponding electrolyte and 2nd
with saturated K2SO4 solution). All potential
values in this paper are related to this electrode. Tempering was realized in glass jacketed cell,
temperature was controlled by cryostat Julabo B12. In case of measurements performed at
160 °C a PTFE cell was placed in aluminium block heated to required temperature. HEKA
PG310 potentiostat was used for cyclic voltammetry measurements and potentiostatic
sampling voltammetry measurements inside faraday cage were performed on AUTOLAB
PGSTAT302N potentiostat. Electrolytes were prepared using demineralized water and extra
pure chemicals; 98% H2SO4 (Sigma), 98% H3PO3 and 85% H3PO4 (both from Acros
Organics). Before use H3PO4 was treated with 30% H2O2 (Penta) at 160 °C for 24 h, volume
ratio H3PO4:H2O2 1:1. Na2H4P2O6.6H2O was prepared according to procedure described by
Remy and Falius [3]. Its purity was 99 % as determined by TGA and XRD analysis.
Main oxidation peak maximum of H3PO3 on a bulk Pt electrode was located around
0.15 V. At concentrations of H3PO3 below 10-4
mol dm-3
its oxidation proceeded mainly on
bare Pt surface while at higher concentrations peak maximum was located well in potential
area of Pt surface oxide formation. On the reverse scan the second H3PO3 oxidation peak was
observed around 0 V especially at high H3PO3 concentrations and elevated temperatures. This
peak probably corresponds to H3PO3 oxidation on renewed Pt surface. Examined H3PO3
electrochemical behaviour was similar in 0.5 mol dm-3
H2SO4 and H3PO4. Main difference is
that oxidation peaks in H2SO4 are more pronounced. This is caused by stronger supporting
electrolyte anion adsorption on Pt surface in H3PO4 in comparison to H2SO4 solution.
Determined adsorption isotherms show interesting property of H3PO3; while surface
coverage of Pt by H3PO4 increases exponentially with concentration and decreases with
temperature, in case of H3PO3 adsorption isotherm follows S-shape and surface coverage

51
increases with raising temperature. Reason consists in presence of tautomeric equilibria
between thermodynamically stable passive form and more adsorbing active form of H3PO3.
Electrochemical kinetics of H3PO3 oxidation was examined by Tafel analysis. Tafel slope
was surprisingly concentration-dependent varying from 300 to 100 mV dec-1
. Charge transfer
coefficient varied with surface coverage from 0.2 to 0.5. For H3PO3 concentrations over 4∙10-
4 mol dm
-3 Tafel slope was 100 mV dec
-1 and charge transfer coefficient raised to value 0.5.
According to experimental kinetic data two mechanisms of H3PO3 oxidation were proposed,
both including multiple electrochemical and chemical steps with P(IV) compound as possible
intermediate. Following measurements of Na2H2P2O7.6H2O electrochemical behaviour
showed that its oxidation proceeds in the area of PtOx formation, thus supporting P(IV)
compound status as possible intermediate during H3PO3 oxidation. However intensity of
Na2H2P2O7.6H2O oxidation peaks was not proportional with intermediate peaks on H3PO3
voltammograms.
Electrochemical behaviour of 95 % H3PO3 at 160 °C is comparable to its behaviour in
diluted H3PO4 at 25 °C. Because of high temperature H3PO3 oxidation peaks are shifted to
more negative potential values with maximum around 0.05 V. Maximum of the peak in this
case lies in double-layer area of Pt voltammogram so H3PO3 oxidation proceeds only on bare
Pt surface. Preliminary results didn’t show any significant dependence of Tafel slope
(85 mV dec-1
) and charge transfer coefficient (1) on concentration of H3PO3. In comparison
with H3PO3 oxidation at 25 and 70 °C change in reaction mechanism is expected according to
values of charge transfer coefficients.
H3PO3 is specifically adsorbed on Pt surface blocking significant part of active surface.
From adsorption isotherms of H3PO3 was confirmed that surface coverage by H3PO3 increases
with raising temperature due to the tautomeric equilibria. Tafel kinetics of H3PO3
electrochemical oxidation on a bulk Pt was determined and consequently two mechanism of
H3PO3 oxidation were proposed. Both mechanisms include multiple steps including both the
electrochemical and the chemical ones. P(IV) compound is probably one of the intermediates.
Oxidation of H3PO3 in H3PO4 at temperature 160 °C probably undergoes different mechanism
than at 25 and 70 °C.
Acknowledgement Financial support of this project by FCH JU within the framework of project No: 325368
and by MSMT CR within the framework of project No: 7HX13002 is gratefully
acknowledged.
References [1] Doh, W.H., et al., Scanning photoelectron microscopy study of the Pt/phosphoric-acid-imbibed
membrane interface under polarization. ChemElectroChem, 2014. 1(1): p. 180-186.
[2] Prokop, M., T. Bystron, and K. Bouzek, Electrochemistry of Phosphorous and
Hypophosphorous Acid on a Pt electrode. Electrochimica Acta, 2015. 160: p. 214-218.
[3] Remy, H. and H. Falius, Uber das Verhalten der Unterphosphorsaure. Naturwiss, 1956. 43: p. 1.

52
ANALYSIS OF MASS AND CHARGE DISTRIBUTION IN HIGH TEMPERATURE
PEM FUEL CELL STACK BY 3D MATHEMATICAL MODEL
M. Drakselová, R. Kodým, D. Šnita, K. Bouzek
University of Chemistry and Technology Prague, Dept. of Inorganic Technology, Technická
5, 166 28 Prague 6, Czech Republic ([email protected])
The fuel cells (FCs) with polymer electrolyte membrane (PEM) are promising candidates
for transportation, stationary and portable electric power generations due to their simplicity,
high energy density and zero emission of pollutants. Nowadays, research is focused on high
temperature (HT) PEM FCs operating at temperatures above 120 °C. Increasing of the
temperature enhances electrochemical reactions kinetics, facilitates water management,
enables more effective utilization of a waste heat and also improves the tolerance of PtC
based catalyst to CO contained in the hydrogen originating from hydrocarbons reforming. In
this kind of FC a polybenzimidazole (PBI) membrane doped by phosphoric acid is used as a
solid polymer electrolyte. A certain number of single cells has to be used in a form of a stack
to reach sufficient unit performance. The stacks represents typical device with
plateandframe setup. This configuration brings advantages such as a simple assembly
geometry and scaleup ability. Generally, the scaleup can lead to local inhomogeneity in flow
of mass, heat or charge which might cause the loss of performance and/or reduction of
lifetime. Experimental study and development of such large devices is very time demanding
and costly. The mathematical modelling offers an option to visualise local distributions of
various physical quantities, which significantly helps to study and optimize the system.
Description of a whole stack by means of detailed mathematical model is very
computational demanding. Industrial scale unit consists of high number of layers and phase
interphases. It makes the system to be “stiff” and extremely difficult to numerical
discretization. Therefore, a sufficiently effective mathematical modelling approach has to be
developed to describe such a system. Within this work, a novel modelling concept based on
macrohomogeneous approach is presented. This approach assumes that system appears
continuous (macrohomogeneous) in the throughplane direction. The individual continuous
phases are characterized by effective transport parameters and volumetric fractions, and they
are interconnected via source/sink terms in corresponding balance equations. The anisotropic
structure of the real system is expressed by means of anisotropic transport parameters, i.e. the
parameters are dependent on the position in space.
Fig. 1: (left) Model system geometry, (right) crosssection through the stack in xy plane, light
and dark arrows indicate main flow direction in anode and cathode gas stream
respectively.

53
Aim of this work was to apply this modelling approach to describe behaviour of the FC
stack consisting of 100 cells. The three dimensional (3D) stationary model was proposed. The
operating temperature was 160 °C. Flow field with parallel channels was considered. The
system geometry and xy crosssection through the stack is shown in Figure 1.
Oxygen reduction reaction (ORR) and hydrogen oxidation reaction (HOR) were
considered in the system. The kinetics of HOR was assumed to be significantly faster in
contrast with ORR. Due to this fact, the contribution of HOR to total overvoltage was
neglected at this stage. The kinetics of ORR was described by ButlerVolmer type equation.
The reactants crossover was not considered. The anode gas stream contained pure hydrogen in
stoichiometric excess of H2 = 1.2. The cathode gas stream contained mixture of oxygen,
nitrogen, and water vapour. Stoichiometric excess of O2 = 2 was considered. The model
consisted of 7 dependent variables and included mass balance of both gas streams, material
balances of individual gaseous components and charge balance.
The proposed model enabled visualisation of local distribution of various physical
variables. For instance, Figure 2 shows local distribution of current density for current
0.4 A cm−2
. The local current density decreases from inlet to outlet (in xcoordinate) with
decreasing concentration of oxygen. We can also see that the value of local current density
notably varies in ycoordinate due to nonuniform flow of gas in the flow field channels. This
nonuniformity can lead to the locally different behaviour. The conditions favourable for
degradation can occur in some places.
Fig. 2: Local distribution of current density in absolute values for current load 0.4 A cm−2
.
The macrohomogeneous model of the HT PEM FC was successfully realized in 3D
representation. For the proposed geometry the model calculations revealed a uniform
behaviour of the individual stack cells, but nonuniform distribution of properties in the
inplane direction (xy plane). This is caused by high gas flow resistance of the flow field
horizontal channels. It is evident that the presented stack configuration is far from optimal.
Acknowledgement
Financial support of this research by FCH JU within the framework of Grant Agreement
No. 325262 and by the MSMT CR within the project No. 7HX13001 is gratefully
acknowledged.
References
[1] R. Kodým, M. Drakselová, P. Pánek, M. Němeček, D. Šnita, K. Bouzek: Novel
approach to mathematical modeling of the complex electrochemical systems with
multiple phase interfaces, Electrochimica Acta, (2015), In press

54
ELECTROCHEMICAL PREPARATION OF NANOSTRUCTURED PHOTOCATALYTIC
TiO2 LAYERS
K. Přikrylová, J. Drbohlavová
Department of Microelectronics, Faculty of Electrical Engineering and Communication, Brno
University of Technology Technická 3058/10, 616 00 Brno, ([email protected])
Central European Institute of Technology, Brno University of Technology, Technická
3058/10, 616 00 Brno, Czech Republic
The titanium dioxide is an important wide bandgap semiconductor in the field of
photocatalysis due to its strong oxidizing ability [1], superhydrophilicity, chemical stability,
long durability, nontoxicity, low cost and transparency in visible light. Self-ordered TiO2
nanostructured and nanoporous surfaces have great potential as a superior photocatalyst due
to their valuable high surface area. Also it is not necessary to remove photocatalyst
nanoparticles as in the case of TiO2 suspensions. [2]
The TiO2 nanostructured and nanoporous surfaces can be fabricated by many different
approaches, for example using template [3], sol-gel [4] , hydrothermal [5] or anodic oxidation
(AO) methods [6]. AO has become one of the most popular method because it is relatively
fast, low cost, highly tunable, and reproducible. Morphological structure of anodized TiO2 can
be modified by changing the preparation conditions such as AO time, applied voltage,
temperature, Ti layer thickness and electrolyte composition (e.g. content of fluoride, water or
organic additives) viscosity, conductivity, and pH. [5,7]
The present research demonstrates a method for the fabrication of TiO2 surfaces via either
one-step or two-step AO of thin Ti layer in organic electrolyte containing ethylene glycol,
ammonium fluoride and water. [8] One-step anodization was performed at 60 V and room
temperature. In the case of two-step AO, we applied an ultrasonic treatment between the steps
and the potential was kept at 60 V in the first step, while it varied from 40 V to 100 V in the
second step. [9]
Fig. 1: SEM images of anodic TiO2 nanoporous/nanotubular structure prepared via two-step
AO.
The prepared TiO2 surfaces were characterized by scanning electron microscopy (SEM).
SEM images revealed the one-step anodized titania surfaces have nanoporous character while
two-step ones have unique nanotubular character with upper nanoporous layer (Fig. 1). This

55
upper layer is formed by dissolution of upper Al oxide layer caused by aggression of fluoride
ions. Such a nanoporous layer can serve as a protective layer for nanotubes below or as a
stable matrix for supporting various nanoparticles. This TiO2 nanoporous layer can be further
doped with noble metals (e. g. silver or gold) in order to improve the photocatalytical
efficiency in VIS region. To conclude, these TiO2 nanostructured surfaces have higher
uniform configuration and higher surface area. Thus they have better potential for future
photocatalytic application in comparison to nanoporous structures prepared by one step AO.
Acknowledgement
The research was supported by project no. FEKT-S-14-2300 A new types of electronic
circuits and sensors for specific applications.
References [1] TSUJI, E. et al. Morphological control of anodic crystalline TiO2 nanochannel films for use in
size-selective photocatalytic decomposition of organic molecules. Applied Surface Science,
2014, vol. 301, pp. 500-507. ISSN 0169-4332.
[2] WANG, W. Y. a CHEN, B. R. Characterization and Photocatalytic Activity of TiO2 Nanotube
Films Prepared by Anodization. International Journal of Photoenergy, 2013, pp. 12. ISSN
1110-662X.
[3] TSUI, L.-K. et al. Hierarchical decoration of anodic TiO2 nanorods for enhanced
photocatalytic degradation properties. Electrochimica Acta, 2015, vol. 155, no. 0, pp. 244-250.
ISSN 0013-4686.
[4] PINJARI, D. V. et al. Synthesis of titanium dioxide by ultrasound assisted sol–gel technique:
Effect of calcination and sonication time. Ultrasonics Sonochemistry, 2015, vol. 23, no. 0, pp.
185-191. ISSN 1350-4177.
[5] ERJAVEC, B. et al. Effects of heat and peroxide treatment on photocatalytic activity of
titanate nanotubes. Catalysis Today, 2015, vol. 241, Part A, no. 0, pp. 15-24. ISSN 0920-5861.
[6] ZHANG, Q. et al. Anodic Oxidation Synthesis of One-Dimensional TiO2 Nanostructures for
Photocatalytic and Field Emission Properties. Journal of Nanomaterials, 2014, pp. 14. ISSN
1687-4110.
[7] NISCHK, M. et al. Ordered TiO2 nanotubes: The effect of preparation parameters on the
photocatalytic activity in air purification process. Applied Catalysis B-Environmental, 2014,
vol. 144, pp. 674-685. ISSN 0926-3373.
[8] CHEN, B. et al. Fabrication of black hierarchical TiO2 nanostructures with enhanced
photocatalytic activity. Rsc Advances, 2014, vol. 4, no. 56, pp. 29443-29449. ISSN 2046-
2069.
[9] ZHANG, Z. a WU, H. Multiple band light trapping in ultraviolet, visible and near infrared
regions with TiO2 based photonic materials. Chemical Communications, 2014, vol. 50, no. 91,
pp. 14179-14182. ISSN 1359-7345.

56
THE SYNTHESIS OF ONE-DIMENSIONAL TIO2 NANOSTRUCTURES AND STUDY
ON THEIR ELECTROCHEMICAL BEHAVIORS
H. Han 1,2
1 Institute of Physics AS CR, v.v.i., Na Slovance 2, Prague, Czech Republic
Palacky University, 17. listopadu 1192/12, 771 46 Olomouc, Czech Republic
TiO2 has received attention as an alternative anode for high power lithium rechargeable
batteries due to abundance, low cost, structural stability during lithium insertion/extraction,
and high working voltage enables high rate operation. However, the poor rate capability of
TiO2 electrodes, which results from their intrinsic physicochemical properties, limits their
practical use. Considerable efforts have been made to investigate a variety of titanium dioxide
based nanostructures and composites to solve the problem of poor rate capability. In this
thesis, we synthesized nitridated TiO2 hollow nanofibers, directly grown TiO2 nanotubes array
on current collector, and TiO2 nanotubes branched tree on carbon nanofiber to consider the
improvement of electrochemical characteristic by the experimental results and theoretical
analysis. Nitridated TiO2 hollow nanofibers showed more improved cyclability and rate
capability due to hollow morphology and highly conducting TiN layers compared to TiO2
nanofibers.1 However there is still problem of the high resistance between active material and
current collector. To improve this problem, directly grown TiO2 unsealed nanotubes on
current collector without insulating binder were proposed. The structure shows 6.2 times
higher rate capability at 10C compared to typical composite film of TiO2 hollow nanofibers
active material/conducting agent/binder (80:10:10,weight ratio) result from high electronic
resistance at the interface acting as a huge barrier for electron injection from the current
collector to the electrode. Especially, the use of electrically insulating binder and the physical
contact between active material and current collector leads to significant degradation of the
electronic conductivity of the overall electrode system by theoretical analysis.2 But low areal
capacity of the anode still prohibits its practical use. The energy density per unit area (areal
capacity ; mAhcm-2
) is a critical for practical application. The increase in the areal capacity
can be achieved by increasing the TiO2 thickness. However, there exists a trade-off between
the electrode thickness and the electronic resistivity, which leads to significant degradation of
the rate capability.
Fig. 1: Cross section SEM images of the TiO2 NTs arrays with a length of 0.5 µm (a), 4
µm (b), 8 µm (c) and the TiO2 NT – CNF nanostructure (d) on the metal current collector.
Top-view SEM images of the TiO2 NT – CNF nanostructure ((e)-(f)).3

57
Fig. 2: TEM images of the TiO2 NTs array with a length of µm and the TiO2 NT – CNF
nanostructure. Low magnification ((a) and (d)), high magnification ((b) and (e)) and high
resolution TEM images ((c) and (f)) for the TiO2 NTs array with a length of 4 µm and the
TiO2 NT – CNF nanostructure, respectively.3
Fig. 3: Electrochemical characteristics of the TiO2 NTs arrays with a different length and
the TiO2 NT – CNF nanostructure electrodes. (a) Voltage profiles for the first cycle (b) cyclic
performance at a current density (40 mA g-1
). (Closed circle – capacity retention; Open circle
– coulombic efficiency)(c) Rate capability at different current densities.3
Finally we suggest an architecture based on TiO2 nanotubes branched on carbon nanofibers
(CNF). The CNF backbone, with direct electric contact of the TiO2 nanotube branched on
carbon nanofibers nanostructure electrode to the current collector, provides both an efficient
electron transport pathway and a large space for dense TiO2 active material loading, which
enable significant improvement in rate capability as well as the achievement of high area
energy density. The strategy presented here offers a design guideline to prepare TiO2 based
anode materials for next generation LIBs.
Acknowledgement
Author wish to thank to the Grant Agency of the Czech Republic – project 13-29241P and
to the Academy of Sciences of the Czech Republic – project M100101215.
References
1 Han, H. et al. Nitridated TiO2 hollow nanofibers as an anode material for high power lithium
ion batteries. Energ Environ Sci 4, 4532-4536, (2011).
2 Han, H. et al. Dominant Factors Governing the Rate Capability of a TiO2 Nanotube Anode for
High Power Lithium Ion Batteries. Acs Nano 6, 8308-8315, (2012).
3 Song, T. et al. TiO2 nanotube branched tree on a carbon nanofiber nanostructure as an anode
for high energy and power lithium ion batteries. Nano Res 7, 491-501, (2014).