new optical filamentary structures in pegasus - arxiv.org · p. boumis et al.: new optical...
TRANSCRIPT

arX
iv:a
stro
-ph/
0209
258v
1 1
3 Se
p 20
02Astronomy & Astrophysics manuscript no. October 29, 2018(DOI: will be inserted by hand later)
New optical filamentary structures in Pegasus
P. Boumis1, F. Mavromatakis1, E. V. Paleologou1, and W. Becker2
1 University of Crete, Physics Department, P.O. Box 2208, 710 03 Heraklion, Crete, Greece2 Max-Planck Institut fur extraterrestrische Physik, Giessenbachstrasse, 85740 Garching, Germany
Received 01 July 2002 / Accepted 11 September 2002
Abstract. Deep Hα+[N ii] CCD images have been obtained in the area of the Pegasus Constellation. The resultingmosaic covers an extent of ∼ 7◦.5× 8◦.5 and filamentary and diffuse emission is discovered. Several long filaments(up to ∼1◦) are found within the field, while diffuse emission is present mainly in the central and northern areas.The filaments show variations in the intensity along their extent suggesting inhomogeneous interstellar clouds.Faint soft X–ray emission is also detected in the ROSAT All–Sky Survey. It is mainly concentrated in the centralareas of our field and overlaps the optical emission. The low ionization images of [S ii] of selected areas mainly showfaint diffuse emission, while in the medium ionization images of [O iii] diffuse and faint filamentary structures arepresent. Spectrophotometric observations have been performed on the brightest filaments and indicate emissionfrom photoionized or shock–heated gas. The sulfur line ratios indicate electron densities below ∼600 cm−3, whilethe absolute Hα emission lies in the range of 1.1 – 8.8 × 10⁻¹⁷ erg s−1 cm−2 arcsec−2. The detected optical lineemission could be part of a single or multiple supernova explosions.
Key words. ISM: general – ISM: supernova remnants – ISM: individual objects: Pegasus
1. Introduction
Several surveys have been made in the last decade con-cerning galactic supernova remnants (SNRs – Arendt1989; Seward 1990; Koo & Heiles 1991; Saken et al. 1992;).Green (2001) published a revised catalogue containing 231Galactic SNRs and details for a number of possible andprobable SNRs. In an effort to deepen our knowledge onthe properties of the optically detected remnants, manyimaging and spectral observations have been performed(Fesen & Hurford 1995, Fesen et al. 1995, 1997; Boumis etal. 2001; Mavromatakis et al. 2001, 2002a, 2002c) while,new optical SNRs have also been discovered (Boumis etal. 2002; Mavromatakis & Strom 2002; Mavromatakis etal. 2002b).
The Pegasus constellation is a region without any his-torical record of SN events. The Palomar Observatory SkySurvey (POSS) plates do not provide clear evidence of op-tical emission however, careful examination of the POSSplates reveals very weak extended optical emission. In par-ticular, two of the filaments were detected on the POSSplates and we considered that such structures in highgalactic latitudes would be interesting to study. The im-aged area was expanded as more emission line structureswere discovered. However, the final field size was restrictedby the available telescope time. The published radio maps
Send offprint requests to: P. Boumis, e-mail:[email protected]
do not provide evidence for excess non–thermal emissionwhich could be attributed to a supernova remnant.
In this paper, we report the discovery of faint opticalfilamentary and diffuse X–ray emission from the Pegasusconstellation. We present an Hα+[N ii] mosaic which cov-ers an area of ∼7◦.5× 8◦.5, and [S ii] and [O iii] imagesof selected regions showing filamentary and diffuse struc-tures. Spectrophotometric observations of the brightest fil-aments were also performed and the emission lines weremeasured. In Sect. 2, we present information concerningthe observations and data reduction, while the results ofthe imaging and spectral observations are given in Sect.3 and 4, respectively. Information about the X–ray dataare given in Sect. 5, while in the last section (Sect. 6)we discuss the physical properties of the newly detectedstructures.
2. Observations
2.1. Imaging
The image of the filamentary and diffuse nebulositiesshown in Fig. 1 is a mosaic of 27 images taken through anHα+[N ii] filter with the 0.3 m Schmidt–Cassegrain (f/3.2)telescope at Skinakas Observatory in Crete, Greece fromAugust 25 to September 04, 2000. The 1024×1024 (with19×19 µm2 pixels) Thomson CCD was used resulting ina scale of 4′′.12 pixel−1 and a field of view of 70′ × 70′.
2 P. Boumis et al.: New optical filamentary structures in Pegasus
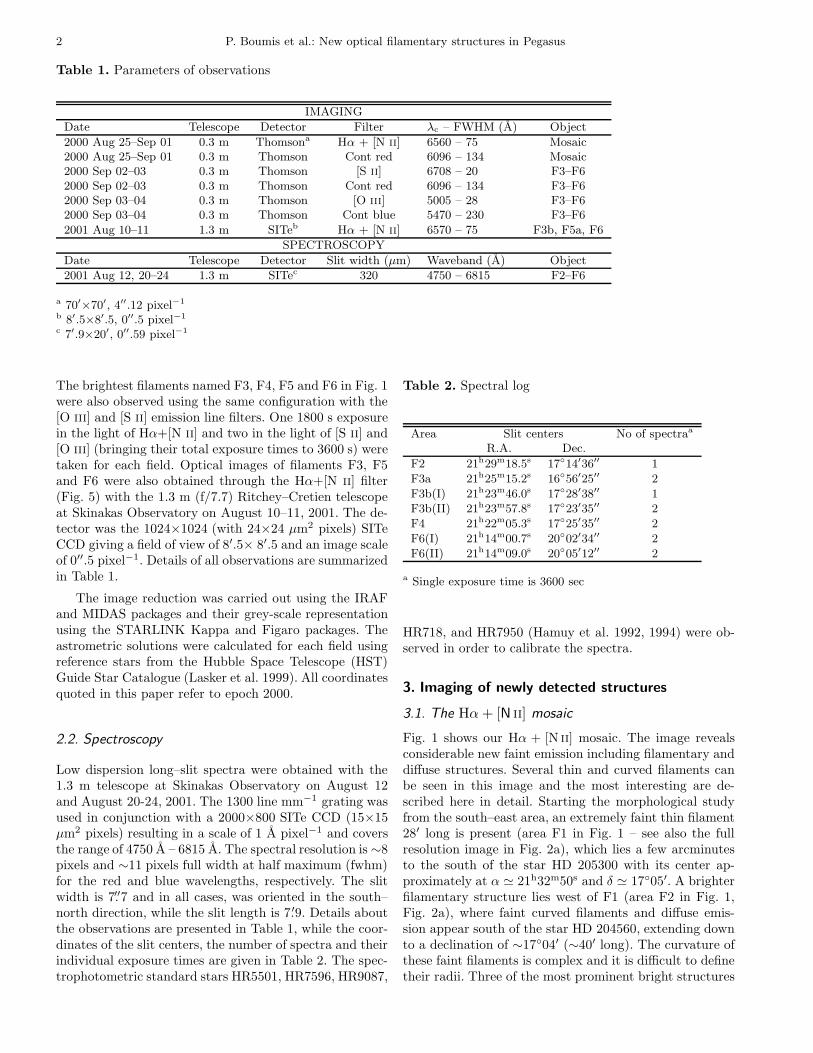
Table 1. Parameters of observations
IMAGING
Date Telescope Detector Filter λc – FWHM (A) Object
2000 Aug 25–Sep 01 0.3 m Thomsona Hα + [N ii] 6560 – 75 Mosaic2000 Aug 25–Sep 01 0.3 m Thomson Cont red 6096 – 134 Mosaic2000 Sep 02–03 0.3 m Thomson [S ii] 6708 – 20 F3–F62000 Sep 02–03 0.3 m Thomson Cont red 6096 – 134 F3–F62000 Sep 03–04 0.3 m Thomson [O iii] 5005 – 28 F3–F62000 Sep 03–04 0.3 m Thomson Cont blue 5470 – 230 F3–F6
2001 Aug 10–11 1.3 m SITeb Hα + [N ii] 6570 – 75 F3b, F5a, F6
SPECTROSCOPY
Date Telescope Detector Slit width (µm) Waveband (A) Object
2001 Aug 12, 20–24 1.3 m SITec 320 4750 – 6815 F2–F6
a 70′×70′, 4′′.12 pixel−1
b 8′.5×8′.5, 0′′.5 pixel−1
c 7′.9×20′, 0′′.59 pixel−1
The brightest filaments named F3, F4, F5 and F6 in Fig. 1were also observed using the same configuration with the[O iii] and [S ii] emission line filters. One 1800 s exposurein the light of Hα+[N ii] and two in the light of [S ii] and[O iii] (bringing their total exposure times to 3600 s) weretaken for each field. Optical images of filaments F3, F5and F6 were also obtained through the Hα+[N ii] filter(Fig. 5) with the 1.3 m (f/7.7) Ritchey–Cretien telescopeat Skinakas Observatory on August 10–11, 2001. The de-tector was the 1024×1024 (with 24×24 µm2 pixels) SITeCCD giving a field of view of 8′.5× 8′.5 and an image scaleof 0′′.5 pixel−1. Details of all observations are summarizedin Table 1.
The image reduction was carried out using the IRAFand MIDAS packages and their grey-scale representationusing the STARLINK Kappa and Figaro packages. Theastrometric solutions were calculated for each field usingreference stars from the Hubble Space Telescope (HST)Guide Star Catalogue (Lasker et al. 1999). All coordinatesquoted in this paper refer to epoch 2000.
2.2. Spectroscopy
Low dispersion long–slit spectra were obtained with the1.3 m telescope at Skinakas Observatory on August 12and August 20-24, 2001. The 1300 line mm−1 grating wasused in conjunction with a 2000×800 SITe CCD (15×15µm2 pixels) resulting in a scale of 1 A pixel−1 and coversthe range of 4750 A – 6815 A. The spectral resolution is ∼8pixels and ∼11 pixels full width at half maximum (fwhm)for the red and blue wavelengths, respectively. The slitwidth is 7.′′7 and in all cases, was oriented in the south–north direction, while the slit length is 7.′9. Details aboutthe observations are presented in Table 1, while the coor-dinates of the slit centers, the number of spectra and theirindividual exposure times are given in Table 2. The spec-trophotometric standard stars HR5501, HR7596, HR9087,
Table 2. Spectral log
Area Slit centers No of spectraa
R.A. Dec.
F2 21h29m18.5s 17◦14′36′′ 1
F3a 21h25m15.2s 16◦56′25′′ 2
F3b(I) 21h23m46.0s 17◦28′38′′ 1F3b(II) 21h23m57.8s 17◦23′35′′ 2
F4 21h22m05.3s 17◦25′35′′ 2
F6(I) 21h14m00.7s 20◦02′34′′ 2
F6(II) 21h14m09.0s 20◦05′12′′ 2
a Single exposure time is 3600 sec
HR718, and HR7950 (Hamuy et al. 1992, 1994) were ob-served in order to calibrate the spectra.
3. Imaging of newly detected structures
3.1. The Hα+ [N ii] mosaic
Fig. 1 shows our Hα + [N ii] mosaic. The image revealsconsiderable new faint emission including filamentary anddiffuse structures. Several thin and curved filaments canbe seen in this image and the most interesting are de-scribed here in detail. Starting the morphological studyfrom the south–east area, an extremely faint thin filament28′ long is present (area F1 in Fig. 1 – see also the fullresolution image in Fig. 2a), which lies a few arcminutesto the south of the star HD 205300 with its center ap-proximately at α ≃ 21h32m50s and δ ≃ 17◦05′. A brighterfilamentary structure lies west of F1 (area F2 in Fig. 1,Fig. 2a), where faint curved filaments and diffuse emis-sion appear south of the star HD 204560, extending downto a declination of ∼17◦04′ (∼40′ long). The curvature ofthese faint filaments is complex and it is difficult to definetheir radii. Three of the most prominent bright structures
P. Boumis et al.: New optical filamentary structures in Pegasus 3
appear to the south of the center of our mosaic betweenα ≃ 21h25m50s, δ ≃ 16◦50′ and α ≃ 21h21m40s, δ ≃
17◦26′ (areas F3a, b and F4 in Fig. 1, Fig. 3a). Arcs F3a,b are separated by a ∼5′ gap but their morphology sug-gests that they belong to same filament. Diffuse emissionis also present along the ∼25′ long arc F3a, which becomesbrighter along arcs F3b and F4. A large diffuse area coversa region of ∼1◦ north of these filaments and exactly in thecenter of the Hα+[N ii] mosaic. Two more new structuresare present further to the west of this diffuse emission.The first appears as a ∼1◦ long filament (F5a, b in Fig.1, Fig. 4a) separated by faint diffuse emission. The sec-ond structure (F6 in Fig. 1, Fig. 5a) is located further tothe north at α ≃ 21h13m50s and δ ≃ 20◦00′ and seems tobe correlated with a ∼1◦ long faint structure. The latter,is north–west of F6 where faint filamentary and diffuseemission is present. Finally, there are two more structures(areas F7, F8 in Fig. 1, Figs. 2b,c) which are located atα ≃ 21h20m40s, δ ≃ 20◦07′very close to the multiple brightstar HD 203504 (Tokovinin 1997) and α ≃ 21h19m50s, δ ≃
21◦40′, respectively. Both are dominated by diffuse emis-sion, while faint small scale filamentary structures are alsopresent. Emission also detected further to the north–westand north–east of F8 seems to extend outside our field.
3.2. An intercomparison of the brightest filaments
The Hα + [N ii] images best describe the newly detectedstructures. However, [S ii] and [O iii] emission from struc-tures F3–F6 is also detected and generally appears lessfilamentary and more diffuse than in the Hα + [N ii] im-age. Significant differences between the Hα+ [N ii], [O iii]and [S ii] images are found for most of the filaments. Infilament F3 (Fig. 3), the arc–like structure F3b appears in-tense and filamentary in the first two emission lines, whileat the same location the [S ii] emission is weaker and dif-fuse. Furthermore, the filamentary structure F3a whichis present in the Hα + [N ii] image does not have [O iii]or [S ii] counterparts and only very faint diffuse emissionis found. On the other hand, small scale filamentary anddiffuse structures appear in all the emission line imagesof filament F4 (Fig. 3), but still much better defined inHα+ [N ii] than in [O iii] or [S ii]. A similar situation ap-pears in filament F5 (Fig. 4), where the long filamentaryarc in Hα + [N ii] is separated by a ∼5′ gap of faint dif-fuse emission. The north part of this filament (F5b) ap-pears both in [O iii] and [S ii], while only diffuse emissionis present at the location of filament F5a. In the case offilament F6, the lower ionization lines of Hα+ [N ii] (Fig.5a) display a different morphology than the medium ion-ization line of [O iii] (Fig. 5b). The small scale filamentarystructures which are present in the former do not appearin the latter, where only diffuse emission is detected. Weakand diffuse emission is also found in the low ionization im-age of [S ii] (Fig. 5c).
3.3. The Hα+ [N ii] higher resolution images
Portions of selected filamentary structures (F3b, F5a andF6) have been imaged in higher angular resolution (0′′.5pixel−1) with the 1.3 m telescope through the Hα+ [N ii]interference filter (Fig. 6). All images show very thin fil-amentary structures as well as diffuse emission. Startingfrom filament F3b (Fig. 6a) the image shows a thin fila-ment along the north–south direction separated by a ∼1′
gap in the center and extends outside the borders of theimage. This filament seems to separate the diffuse emis-sion on the left and the interstellar medium on the right. Athin and much fainter complex of filamentary structuresappears in the area of filament F5a (Fig. 6b) which arealmost parallel to the north–south direction. In this areadiffuse emission seems to be present only close to thesestructures and mostly to the south. However, the possi-bility that part of this diffuse emission may be stray lightfrom a bright star, just outside the south border of theimage, cannot be ruled out. Finally, in the area of fila-ment F6 (Fig. 6c) a number of new filamentary structureshave been discovered to the east and west, which coverthe north–south direction across the image and extendingoutside the borders of the 8′.5 × 8′.5 square area. Thefilament F6 located in the right side of the image consistsof two bright and two faint thin filaments. In addition,we detected one bright filament in the lower left side ofthe image and three faint filaments in the north. Diffuseemission is again present to the east part of this area. Notethat the exact position and the area covered by the higherresolution images are marked in Figs. 3a, 4a and 5a withsolid rectangles.
4. The long–slit spectra
The deep low resolution spectra were taken on the rela-tively bright optical filaments at seven different locations(their exact positions are given in Table 2). In Table 3,we present the relative line fluxes taken from differentapertures along the slit, that are free of field stars andinclude sufficient line emission to allow an accurate de-termination of the observed lines. The background ex-traction apertures were selected towards the north andsouth ends of each slit depending on the filament’s posi-tion within the slit. The signal to noise ratios presented inTable 3 do not include calibration errors which are typi-cally less than 10%. The absolute Hα flux covers a range ofvalues from 1.1 to 8.8 × 10⁻¹⁷ erg s−1 cm−2 arcsec−2. Theextracted apertures do not show the same nature of emis-sion. There are areas (e.g. filament F3b(IIb), F6(Ia) etc.)which show that the observed optical emission must origi-nate from shock heated gas, since [S ii]/Hα >0.4 (Smith etal. 1993), while other areas (e.g. F3a(Ia), F3b(I) etc.) dis-play [S ii]/Hα <0.3 and therefore suggest photoionizationprocesses.
The [S ii]λ 6716/6731 ratio of >1.1 indicates low elec-tron densities (less than 440 cm−3; Osterbrock 1989).However, taking into account the statistical errors on the

4 P. Boumis et al.: New optical filamentary structures in Pegasus
sulfur lines, we calculate with the nebular package (Shaw& Dufour 1995), that electron densities up to 600 cm−3
are allowed. The logarithmic extinction c towards a sourceof line emission was calculated by using the Hα/Hβ ob-served ratios and an intrinsic ratio of 2.85 (see Sect. 5 fordetails). Furthermore, [O iii] emission was only detectedin filaments F3b and F6(II), while in the rest of the fil-aments only upper limits are given. The [O iii]/Hβ ratiowas measured and in almost all cases was found to be lessthan 4. The theoretical models of Cox & Raymond (1985)and Hartigan et al. (1987) suggest that shocks with com-plete recombination zones must be present, while shockvelocities ≤100 km s−1 are estimated.
5. The ROSAT All–Sky Survey data
The area in the Pegasus Constellation was observed byROSAT during the All–Sky Survey for ∼500 s. Very weakand diffuse emission is present in the area where opticalline emission is detected (Fig. 7). The typical level of X–ray emission in the central areas of our field is ∼ 1.5 ×
10−3 cts s−1 arcmin−2. Note that a lane of very low X–ray emission to the east has a much more lower exposuretime (∼120 s). Unfortunately, the faintness of the soft X–ray emission did not allow us to obtain reliable resultsfrom the spectral analysis.
6. Discussion
The newly discovered filamentary structures towards thePegasus constellation show up as incomplete circularstructures in the optical, as diffuse emission in the soft X–ray wavelengths and without any radio emission detectedso far. The low ionization Hα + [N ii] mosaic shows sev-eral filaments across the observed field, while the selected[S ii] and [O iii] images generally display diffuse emission.The weak soft X–ray emission seems to overlap the op-tical emission. The long–slit spectra suggest that part ofthe detected emission results from shock heated gas, whilein other locations the emission seems to result from pho-toionization processes. Low [S ii]/Hα ratios are indicativeof H ii regions, while higher values support the interpre-tation of an expanding SNR shell.
The interstellar reddening was derived from theHα/Hβ ratio (Osterbrock 1989), using the interstellar ex-tinction law by Fitzpatrick (1999) and Rv = 3.1 for allobjects. Therefore, the interstellar extinction c(Hβ) canbe derived from the relationship
c(Hβ) =1
0.348log
F(Hα)/F(Hβ)
2.85, (1)
where 0.348 is the relative logarithmic extinction co-efficient for Hβ/Hα and 2.85 the theoretical value ofF(Hα)/F(Hβ). Consequently, the interstellar extinction cat the positions of different filaments (see Table 3) wasfound between ∼0.3 and 1.0 or an AV of ∼0.6 to 2.1. InTable 3, we have also calculated the estimated signal to
noise for each extinction value. We propose that an inter-stellar extinction c of ∼0.7–0.8 or an AV of ∼1.4–1.6 isrepresentative of the extinction towards this area.
An estimated value of the hydrogen column densityNH of ∼ 1 × 1021 cm−2 is given by Dickey & Lockman(1990) in the direction of the optical filaments. Using thestatistical relation of Predehl & Schmitt (1995)
NH = 5.4 (±0.1)× 1021 EB−V cm−2, (2)
where AV = 3.1 × EB−V (Kaler 1976), we obtain anNH of 1.0 × 1021 cm−2 and 3.8 × 1021 cm−2 for the min-imum and maximum c values calculated from our spec-tra, respectively. These values are consistent with the esti-mated galactic NH considering the uncertainties involved.
The electron densities have been determined by mea-suring the ratio of [S ii]λ 6716/6731 and found densi-ties below ∼440 cm−3. In case of complete recombinationzones, it is possible to estimate the preshock cloud densitync by using the relationship (Dopita 1979)
n[SII] ≃ 45 ncV2s cm−3, (3)
where n[SII] is the electron density derived from thesulfur line ratio and Vs is the shock velocity into the cloudsin units of 100 km s−1. Thus, we obtain ncV
2s < 10 from
Eq. (3). Shock velocities below 100 km s−1 are consistentwith our data suggesting that the preshock cloud densitiesare typically around or below 10 cm−3.
Both optical and X–ray observations do not uniquelyidentify the nature of the detected emission. The opti-cal observations suggest the existence of H ii regions inthe area as well as shock–heated filamentary structures.However, the presence of soft X–ray emission which seemsto overlap the optical emission may not be a chance coinci-dence and would provide support to the scenario where theoptical filaments may be part of an extended supernovaremnant. Shock–heated emission was found in almost allthe filamentary structures and taking into account theirmorphology it may be possible that they belong to a singleextended SNR with its east part lying outside our field.The overall orientation of the filaments suggests an esti-mated center of the possible supernova event at aroundα ≃ 21h24m and δ ≃ 19◦30′ (equivalent to galactic longi-tude l ≃ 70o.1 and latitude b ≃ −21o.5) with a angulardiameter of ∼4◦.5×6◦. Large–scale Hα surveys also showevidence of optical emission in the area and its morphol-ogy gives support to the SNR scenario. In particular, theWisconsin Hα Mapper (WHAM – Haffner et al. 2002)shows a very faint elliptical distribution of emission al-most at the same location with its center at l ≃ 69o.8,b ≃ −20o.8 and an angular size of ∼4◦×6◦, while severalmaps of the Virginia Tech Spectral-Line Survey (VTSS –Dennison et al. 1998) suggest a roughly spherical distri-bution in the area of the brighter emission. Duncan et al.(1997) presented a number of large (> 2◦) SNR candidateswhere almost all appear as edge–brightened and filamen-tary arcs, detected towards high latitudes away from theGalactic plane. They concluded that these structures must

P. Boumis et al.: New optical filamentary structures in Pegasus 5
Table 3. Relative line fluxes.
Line (A) F2(Ia) F2(Ib) F3a(Ia)a F3a(Ib)a F3b(I) F3b(IIa)a F3b(IIb)a F4a
4861 Hβ < 12 < 16 19 (9) 15 (3) 23 (5) 28 (20) < 17 16 (4)5007 [O iii] < 9 < 15 < 10 < 15 33 (8) < 6 55 (25) < 156548 [N ii] 6 (4) − − − 6 (3) − 28 (22) 9 (5)6563 Hα 100 (62) 100 (52) 100 (89) 100 (66) 100 (41) 100 (142) 100 (74) 100 (53)6584 [N ii] 27 (19) 25 (14) − − 18 (8) 21 (34) 93 (71) 23 (13)6716 [S ii] 18 (16) 21 (11) 8 (9) 19 (17) 12 (6) 12 (22) 63 (54) 24 (16)6731 [S ii] 13 (12) 20 (10) 4 (5) 17 (16) 7 (4) 6 (11) 45 (40) 21 (15)
Absolute Hα fluxb 3.7 3.0 6.7 3.1 3.1 8.8 3.1 4.1Hα/Hβ − − 5.2 (9) 6.7 (3) 4.4 (5) 3.6 (20) − 6.1 (4)[S ii]/Hα 0.3 (19) 0.4 (14) 0.1 (10) 0.4 (22) 0.2 (7) 0.2 (23) 1.1 (50) 0.5 (20)F(6716)/F(6731) 1.4 (9) 1.1 (7) 1.9 (4) 1.1 (12) 1.6 (3) 2.1 (10) 1.4 (32) 1.1 (11)[O iii]/Hβ − − < 1.5 < 1.0 1.4 < 0.2 > 3.2 < 0.9c − − 0.77 (6) 1.06 (3) 0.53 (3) 0.28 (4) − 0.98 (3)
Line (A) F6(Ia)a F6(Ib)a F6(II)a
4861 Hβ 25 (3) 18 (8) < 65007 [O iii] < 27 < 7 10 (11)6548 [N ii] 10 (2) 5 (3) −
6563 Hα 100 (26) 100 (70) 100 (142)6584 [N ii] 48 (13) 11 (9) 11 (7)6716 [S ii] 32 (10) 7 (6) 14 (26)6731 [S ii] 24 (8) 4 (3) 4 (8)
Absolute Hα flux 1.1 6.9 6.7Hα/Hβ 4.0 (3) 5.7 (7) −
[S ii]/Hα 0.6 (11) 0.1 (7) 0.2 (24)F(6716)/F(6731) 1.3 (6) 1.9 (3) 3.1 (8)[O iii]/Hβ < 1.1 < 0.4 > 1.7c 0.42 (3) 0.83 (5) −
a Listed fluxes are a signal to noise weighted average of two fluxesb In units of 10−17 erg s−1 cm−2 arcsec−2
All fluxes normalized to F(Hα)=100 and are uncorrected for interstellar extinction. Numbers in parentheses represent thesignal to noise ratio of the quoted fluxes.
be large and old, within the radiative phase and almost atthe point of merging with the interstellar medium (ISM).If our newly detected structures form indeed a SNR, thenit is probably in the late stages of evolution where it be-gins to merge to the ISM. This may explain why no radioemission has been detected from radio surveys since asit becomes older it is difficult to distinguish its emissionfrom the radio emission of the galactic plane (Duncan etal. 1997). Assuming a distance to the SNR of 1 kpc andan angular diameter of ∼5◦ then its radius would be ∼44pc. If this is the case then this SNR would be one of thelargest known SNRs. However, it must be pointed out thatthe possibility of the existence of more than one supernovaexplosions cannot be excluded since the unclear nature ofboth optical and X–rays does not help to clarify whichscenario is more probable.
The observed variation in the absolute line fluxes couldbe due to variations of the interstellar clouds density,shock velocities, intrinsic absorption, while the absenceof the X–ray emission in the north–west area suggestseven lower interstellar medium densities in that region.According to Chu (1997), when a supernova event occursin a hot, low–density medium, the classical SNR signa-
tures may not be observable and mostly X–ray diffuseemission is present. Massive stars are usually formed ingroups, such as OB associations, thus the possibility thatthe optical emission is associated to a supernova remnantwithin an OB association must be examined further in thefuture. If the optical emission belongs to a supernova rem-nant, then it would be one of the largest remnants and thismay explain why, unlike other known SNR, it is not ob-served as a source of non–thermal emission. The origin ofthese large scale structure is not yet understood especiallyat this high galactic latitude and deeper observation in ra-dio and X–ray wavelengths would be required to identifyits nature.
Three pulsars (PSRs 2113+2754, 2116+1414 and2124+1407) have been found within a few degrees awayfrom the brightest filaments (Taylor et al. 1995). Thesepulsars rotate at a period of 601, 440 and 694 ms, at es-timated distances of 1.37, 2.11 and 2.08 kpc, respectively.An estimate of the proper motion of PSRs 2113+2754 and2116+1414 was determined by Harrison et al. (1993) whomeasured µα = −23 mas yr−1, µδ = −54 mas yr−1 andµα = 8 mas yr−1, µδ = −11 mas yr−1, respectively. It isnot clear at the moment if any of these pulsars is related to

6 P. Boumis et al.: New optical filamentary structures in Pegasus
the supernova event(s) associated to the optical filamentsbut a correlation can not be ruled out.
7. Conclusions
Unknown filamentary and diffuse structures have beendiscovered in Pegasus constellation through deep imagingand spectral observations. These structures appear morefilamentary in Hα + [N ii] emission lines images than the[O iii] and [S ii] images. Diffuse X–ray emission is detectedin the area and may be associated with the optical lineemission. The flux calibrated long–slit spectra indicatethat the emission arises from both photoionized and shockheated gas. The [S ii]λ 6716/6731 ratio indicates low elec-tron densities while shock velocities around 100 km s−1
were found. The equivalent hydrogen column density wasestimated from the extinction derived from Hα/Hβ ratioto be between 1.0 to 3.8 ×1021 cm−2. It may be possiblethat most of the optical emission is part of one or moresupernova remnants.
Acknowledgements. We would like to thank the referee R.G. Arendt for his comments which helped to clarify thescope of this paper. Skinakas Observatory is a collabora-tive project of the University of Crete, the Foundation forResearch and Technology-Hellas and the Max-Planck-Institutfur Extraterrestrische Physik. This research has made use ofdata obtained through the High Energy Astrophysics ScienceArchive Research Center Online Service, provided by theNASA/Goddard Space Flight Center. The Wisconsin H-AlphaMapper (WHAM) and the Virginia Tech Spectral-Line Survey(VTSS) are funded by the National Science Foundation.
References
Arendt R. G., 1989, ApJS, 70, 181
Boumis P., Dickinson C., Meaburn J., Goudis C.D.,Christopoulou P. E., Lopez J. A., Bryce M., Redman M.P., 2001, MNRAS, 320, 61
Boumis P., Mavromatakis F. and Paleologou, E. V., 2002,A&A, 385, 1042
Chu Y-H., 1997, AJ, 113, 1815
Cox D. P. and Raymond J. C., 1985, ApJ, 298, 651
Dennison B., Simonetti J. H. & Topasna G., 1998,PASA, 15, 147 (The Virginia Tech Spectral–Line Survey,http://www.phys.vt.edu/∼halpha/)
Dickey J. M. and Lockman F. J., 1990, ARAA, 28, 215
Dopita M. A., 1979, ApJS, 40, 455
Duncan A. R., Stewart R. T., Haynes R. F. and Jones K. L.,1997, MNRAS, 287, 722
Fesen R. A. and Hurford A. P., 1995, AJ, 110, 747
Fesen R. A., Downes R. A., Wallace D. and Normandeau M.,1995, AJ, 110, 2876
Fesen R. A., Winkler P. F., Rathore Y., Downes R. A., WallaceD. and Tweedy R. W., 1997, AJ, 113, 767
Fitzpatrick E. L., 1999, PASP, 111, 63
Green D. A., 2001, A Catalog of Galactic SupernovaRemnants (2001 version), Mullard Radio AstronomyObservatory, Cavendish Laboratory, Cambridge, UK(http://www.mrao.cam.ac.uk/surveys/snrs/)
Haffner, L. M., Reynolds, R. J., Tufte, S. L., etal., 2002, The Wisconsin Hα Mapper, in prep(http://www.astro.wisc.edu/wham/)
Hamuy M., Walker A. R., Suntzeff N. B., Gigoux P., HeathcoteS. R. & Phillips M. M., 1992, PASP, 104, 533
Hamuy M., Suntzeff N. B., Heathcote S. R., Walker A. R.,Gigoux P. & Phillips M. M., 1994, PASP, 106, 566
Harrison P. A., Lyne A. G. & Anderson B., 1993, MNRAS,261, 113
Hartigan P., Raymond J. and Hartmann L., 1987, ApJ, 316,323
Kaler J. B., 1976, ApJS, 31, 517Koo B.-C. and Heiles C., 1991, ApJ, 382, 204Lasker B. M., Russel J. N. & Jenkner H., 1999, in the HST
Guide Star Catalog, version 1.1-ACT, The Association ofUniversities for Research in Astronomy, Inc
Mavromatakis, F., Papamastorakis, J., Ventura, J., Becker,W., Paleologou, E. V. and Schaudel, 2001, A&A 370, 265
Mavromatakis, F., and Strom R. G., 2002, A&A, 382, 291Mavromatakis, F., Boumis P. and Paleologou, E. V., 2002a,
A&A, 383, 1011Mavromatakis, F., Boumis P. and Paleologou, E. V., 2002b,
A&A, 387, 635Mavromatakis, F., Boumis P., Papamastorakis J. and Ventura
J., 2002c, A&A, 388, 355Osterbrock D. E., 1989, Astrophysics of gaseous nebulae, W.
H. Freeman & CompanyPredehl P. and Schmitt J. H. M. M., 1995, A&A, 293, 889Saken J. M., Fesen R. A. and Shull J. M., 1992, ApJS, 81, 715Seward F. D., 1990, ApJS, 73, 781Shaw R. A. and Dufour R. J., 1995, PASP, 107, 896Smith R. C., Kirshner R. P., Blair W. P., Long K. S. and
Winkler P. F., 1993, ApJ, 407, 564Taylor J. H., Manchester R. N., Lyne A. G., and Camilo F.,
1995, A Catalog of 706 Pulsars, Princeton Pulsar Group,Princeton University
Tokovinin A. A., 1997, A&AS, 124, 75

P. Boumis et al.: New optical filamentary structures in Pegasus 7
Fig. 1. The 7◦.5 × 8◦.5 mosaic showing the filamentary structures discovered in the low ionization lines of Hα+[N ii].Labels F1–F8 define the areas discussed in the text in more detail. The original 7500 × 8500 pixels2 image was rebinnedby a factor of 4 to produce this plot.

8 P. Boumis et al.: New optical filamentary structures in Pegasus
Fig. 2. Optical images in Hα+ [N ii] of filaments (a) F1, F2, (b) F7 and (c) F8.

P. Boumis et al.: New optical filamentary structures in Pegasus 9
Fig. 3. Optical images of filaments F3 and F4 in (a) Hα + [N ii], (b) [O iii] and (c) [S ii]. Note that the field in the[O iii] and [S ii] images is shifted by ∼20′ to the west because it was centered on filament F3. The rectangle in (a)represents the area which was imaged with the 1.3 m telescope and shown in Fig. 5a.

10 P. Boumis et al.: New optical filamentary structures in Pegasus
Fig. 4. Optical images of filament F5 in (a) Hα+[N ii], (b) [O iii] and (c) [S ii]. The field in the [O iii] and [S ii] imagesis shifted by ∼15′ east and ∼8′ south because it was centered on filament F5. The rectangle in (a) represents the areaimaged with the 1.3 m telescope and shown in Fig. 5b.

P. Boumis et al.: New optical filamentary structures in Pegasus 11
Fig. 5. Optical images of filament F6 in (a) Hα + [N ii], (b) [O iii] and (c) [S ii]. The field in the [O iii] and [S ii]images is shifted by ∼11′ west and ∼7′ south because it was centered on filament F6. The rectangle in (a) representsthe area observed with the 1.3 m telescope and shown in Fig. 5c.

12 P. Boumis et al.: New optical filamentary structures in Pegasus
Fig. 6. Higher resolution greyscale representations (0′′.5 pixel−1) of filaments (a) F3, (b) F5 and (c) F6, observed withthe 1.3 m telescope in Hα+ [N ii].

P. Boumis et al.: New optical filamentary structures in Pegasus 13
Fig. 7. The correlation between the soft X–ray emission (contours) and the Hα+[N ii] emission of the field. The X–raycontours scale linearly from 9.6×10⁻⁴ cts s−1 pixel−1 to 3.6×10⁻³ cts s−1 pixel−1, while each pixel is 1′.0×1′.0.