new methodologies for the development and...
TRANSCRIPT
New Methodologies for theDevelopment and Validationof ElectrophysiologicalModels
Author: Jesús Carro Fernández
Supervisors:
Esther Pueyo PaulesJosé Félix Rodríguez Matas
PhD Thesis inBiomedical Engineering
Zaragoza, September, 2018


To Débora.To Nacho, Samuel, and Lucía.


Acknowledgment
This thesis has been a long journey and, therefore, many people have put a bit toget here. My thanks to all of you.
To Esther and José Félix. It is very difficult to summarize everything receivedfrom you in these years. How much we have done, how much remains to be done,how much to know and to understand. You have generated me more questionsthan answers. Thank you.
To Pablo Laguna. For your support and help, especially in the first phases ofthis thesis: the beginning, the search of founds, etc. Thank you.
To Juan, Pablo Vicente, David Sampedro, Carlos, Jesús Fernández and all themembers of BSICoS. Every time I met with you, it did not matter how much timehad passed since the last time, I was once again one more in the group. You spreadyour enthusiasm for research. Thank you.
To Pamela, Ana, and Arantxa. The least visible part of the group, but thosethat have made all the procedures easy. Thank you.
To Jorge, David, África, Jesús, Carlos, Paqui, Gabriel, Violeta, Jaime, Lorena,and all those who have been encouraging and supporting me these years at theUSJ. Thank you.
To my parents-in-law. For all the help received during these years: to have timeto write, to travel, etc. For everything. Thank you.
To my parents, and my brothers and sisters; especially to my father. For allthe values that you have transmitted to me, for all your support, for helping me tobe who I am. Thank you.
To Nacho, Samuel and Lucia. I do not know who have taken me away moresleep hours in these years: the thesis or you; but you have the ability to make meforget both things with a smile and a hug. I hope I did not steal too much of yourtime. Thank you.
To Débora. For your patience all these years. For getting me up in the hardestmoments, and putting my feet on the ground in the best ones. For being by myside on this road. Thank you.
Thank you very much to all.
v


Agradecimientos
Esta tesis ha sido un viaje largo y, por ello, son muchas las personas que han puestoun granito de arena para llegar hasta aquí. Mi agradecimiento a todos vosotros.
A Esther y José Félix. Es muy difícil resumir todo lo recibido de vosotros enestos años. Cuánto hemos hecho y cuánto queda por hacer, cuánto por conocer yentender. Me habéis generado más preguntas que respuestas. Gracias.
A Pablo Laguna. Por el apoyo y la ayuda recibida, especialmente en las primerasfases de esta tesis: el arranque, la búsqueda de financiación, etc. Gracias.
A Juan, Pablo Vicente, David Sampedro, Carlos, Jesús Fernández y a todos losmiembros de BSICoS. Cada vez que me juntaba con vosotros, daba igual el tiempoque hubiera pasado desde la última vez, volvía a ser uno más. Contagiáis vuestroentusiasmo por investigar. Gracias.
A Pamela, Ana, y Arantxa. La parte menos visible del grupo, pero las que hanhecho que todos los trámites fueran fáciles. Gracias.
A Jorge, David, África, Jesús, Carlos, Paqui, Gabriel, Violeta, Jaime, Lorena,y todos aquellos que me habéis estado animando y apoyando estos años en la USJ.Gracias.
A mis suegros. Por toda la ayuda recibida en estos años, para escribir, para loscongresos, para todo. Gracias .
A mis padres y a mis hermanos; especialmente a mi padre. Por todos losvalores transmitidos, por todo el apoyo dado, por haberme ayudado a ser quiensoy. Gracias.
A Nacho, Samuel y Lucía. No sé quién me habrá quitado más horas de sueño enestos años: la tesis o vosotros; pero tenéis la capacidad de hacerme olvidar ambascosas con una sonrisa y un abrazo. Espero no haberos robado yo demasiado tiempoa vosotros. Gracias.
A Débora. Por tu paciencia todos estos años. Por levantarme en los momentosmás duros, y ponerme los pies en la tierra en los mejores. Por estar a mi lado eneste camino. Gracias.
Muchas gracias a todos.
vii


Abstract
According to data from the World Health Organization (WHO), 17.7 million peo-ple were estimated to have died of cardiovascular diseases (CVDs) in 2015. Thisrepresents 31% of all global deaths, making CVDs the leading cause of death world-wide. The heart is a complex system that works due to the interaction of a largenumber of elements at different temporal and spatial scales. The main functionof the heart is to pump blood throughout the body, with this mechanical actionbeing triggered by electrical impulses. Issues arising in the electrical or mechanicalactions of the heart at any of the involved temporal and spatial scales can leadto cardiac malfunctioning. Mathematical modeling and simulation of the heart’selectrical activity (so-called cardiac electrophysiology) combined with signal pro-cessing of bioelectrical signals provide an ideal framework to join the informationfrom clinical and experimental studies with the understanding of the mechanismsunderlying them. Due to the high number of factors involved in the developmentand validation of cardiac computational electrophysiological models and the intri-cate interrelationships between them, novel methodologies that help to control thedesign, update and validation of new models become of great advantage. Thesemethodologies can target from the definition of ionic gating in the simulated cellsto the propagation of the electrical impulse in multi-scale models. This thesis aimsto improve the existing knowledge on heart’s electrophysiology by proposing noveltechniques to develop and validate cardiac computational models while account-ing for the interactions between model components and including simulations of arange of spatio-temporal scales.
In chapter 2, a new paradigm was introduced to develop a novel human ven-tricular cell model, the CRLP model, by departing from a previously publishedmodel, the Grandi-Pasqualini-Bers model. Novel experimental measurements ofpotassium currents were incorporated and the L-type calcium current was refor-mulated. The introduced paradigm was based on the analysis of the model’s abilityto replicate a set of well-established electrophysiological markers and on a sensitiv-ity analysis of those markers to variations in model parameters. A major advantageof the proposed paradigm was the possibility to identify model parameter valuesthat do not directly depend on individual current measurements or concentrations,
ix

x New Methodologies for the Developmentand Validation of Electrophysiological Models
which are commonly set in an ad hoc manner. The developed CRLP model wasvalidated and its improved capacity to investigate arrhythmia-related properties,as compared to the cell model it was based on, was corroborated.
In chapter 3, the CRLP model developed in chapter 2 was updated to in-troduce the formulation of intracellular potassium ([K+]i) dynamics. This is animportant characteristic for investigation of ventricular arrhythmias arising underconditions of hyperkalemia, one of the components of myocardial ischemia. Di-rect introduction of [K+]i dynamics into the model generated an imbalance in thepotassium currents leading to a drift in [K+]i. To correct for such an imbalance,an optimization framework was proposed that allowed estimating the ionic currentconductances of the CRLP model while guaranteeing physiologically plausible val-ues of selected electrophysiological properties, many of them highly relevant forinvestigation of ventricular arrhythmias.
As mentioned above, when proposing a new model, or when updating an exist-ing model, consistency between simulated and experimental data should be verifiedby considering all involved effects and scales. The closer the experimental condi-tions are reproduced in the computer simulations, the more robust the process ofmodel development and validation can be. In chapter 4, in silico simulation ofexperimental protocols was proposed to analyze: how interactions between modelcomponents affect the development and validation of mathematical ion channelmodels; and how propagation affects action potential (AP)-based markers simu-lated in isolated cells and in tissue preparations, with identification of the ioniccontributors in each case.
The CRLP model, developed in chapter 2 and updated in chapter 3, presenteda rather atypical shape at the end of the depolarization phase of the AP (phase1). In chapter 5, the in silico simulations of experimental protocols described inchapter 4 and the optimization methodology introduced in chapter 3 were used toimprove the AP shape, while validating the adjusted model at ionic, cell and tissuescales.
In chapter 6 all the initial formulations and subsequent updates of the CRLPmodel proposed in previous chapters were integrated and the ionic conductancesof the integrated model were readjusted to improve replication of experimentalelectrophysiological measures. All the methodologies introduced throughout thethesis were thus used to build a novel human ventricular AP model. For modelvalidation, a range of available experimental data at different scales targetting dif-ferent electrophysiological properties was considered. Conditions underlying eachof the experimental studies were replicated as faithfully as possible. Results simu-lated with the final version of the CRLP model were in all cases compared with allavailable experimental evidences and with the most recent human ventricular cellmodels published in the literature.
Chapter 7 summarizes the main conclusions of the thesis and presents new linesof research that could be undertaken in future studies.
UniversidadZaragoza

Resumen y conclusiones
De acuerdo a los datos de la Organización Mundial de la Salud, se estima que 17,7millones de personas murieron de enfermedades cardiacas en 2015, lo que supone el31% de las muertes, haciendo de estas patologías la primera causa de muerte en elmundo. El corazón es un sistema complejo que trabaja gracias a la interacción deun gran número de elementos en diferentes escalas espaciales y temporales. La fun-ción principal del corazón es bombear sangre en todo el cuerpo, siendo esta acciónmecánica activada por la estimulación eléctrica. La aparición de problemas en elfuncionamiento eléctrico o mecánico del corazón en cualquiera de las escalas involu-cradas, temporal o espacial, puede dar lugar a un mal funcionamiento cardiaco. Elmodelado matemático y la simulación de la actividad eléctrica del corazón (denomi-nada electrofisiología cardiaca) y el procesado de señales bioeléctricas proporcionanun marco ideal para unir la información clínica y los estudios experimentales conla comprensión de los mecanismos que subyacen a estos problemas. Debido al grannúmero de factores que se deben tener en cuenta a la hora de desarrollar y validarun modelo computacional de electrofisiología cardiaca, así como las complejas in-teracciones que existen entre ellos, hacen que nuevas metodologías que faciliten eldesarrollo, la actualización y la validación de nuevos modelos sean de gran valor.Estas metodologías pueden enfocarse tanto en la definición de las compuertas ióni-cas de los modelos, como en la propagación del impulso eléctrico en modelos multi-escala. Esta tesis pretende mejorar el conocimiento existente sobre electrofisiologíacardiaca proponiendo nuevas técnicas para desarrollar y validar modelos computa-cionales cardiacos, teniendo en cuenta la interacción entre los componentes delmodelo e incluyendo simulaciones de un rango de escalas espacio-temporales.
En el capítulo 2, se introdujo un nuevo paradigma para desarrollar un nuevomodelo de potencial de acción de cardiomiocito humano, el modelo CRLP, par-tiendo de un modelo previamente publicado, el modelo Grandi-Pasqualini-Bers.Se incorporaron nuevas mediciones experimentales de corrientes de potasio y sereformuló la corriente de calcio tipo L. El paradigma introducido se basó en elanálisis de la capacidad del modelo para replicar un conjunto de marcadores elec-trofisiológicos bien establecidos y en un análisis de sensibilidad de esos marcadoresa las variaciones en los parámetros del modelo. Una de las ventajas del paradigma
xi

xii New Methodologies for the Developmentand Validation of Electrophysiological Models
propuesto fue la posibilidad de identificar parámetros del modelo que no depen-den directamente de las mediciones individuales de corrientes o concentraciones yque comúnmente se establecen ad hoc. El modelo CRLP se validó y se corroborósu capacidad para predecir marcadores relacionados con la arritmia ventricular encomparación con el modelo cellular en el que se había basado.
En el capítulo 3, se actualizó el modelo CRLP desarrollado en el capítulo 2 paraintroducir la formulación de la dinámica de potasio intracelular ([K+]i). Esta esuna característica importante para la investigación de arritmias ventriculares quesurgen en condiciones de hiperpotasemia, uno de los componentes de la isquemiade miocardio. La introducción directa de la dinámica de [K+]i en el modelo gen-eró un desequilibrio en las corrientes de potasio que condugeron a una deriva en[K+]i. Para corregir tal desequilibrio, se propuso un algoritmo de optimizaciónque permitía estimar las conductancias de las corrientes iónicas del modelo CRLPal tiempo que garantizaba valores fisiológicamente plausibles de una selección depropiedades electrofisiológicas, la mayoría de las cuales eran muy relevantes en elestudio de arritmias ventriculares.
Como se mencionó anteriormente, al proponer un nuevo modelo o al actualizarun modelo existente, la coherencia entre los datos simulados y experimentales debeverificarse considerando todos los efectos y escalas involucradas. Cuanto mejor sereproduzcan las condiciones experimentales en las simulaciones, más robusto seráel proceso de desarrollo y validación del modelo. En el capítulo 4, se propuso lasimulación de protocolos experimentales in silico para analizar cómo las interac-ciones entre los componentes del modelo afectan el desarrollo y la validación delos modelos matemáticos de canales iónicos; y cómo la propagación afecta los mar-cadores basados en el potencial de acción cuando son simulados en células aisladaso en preparaciones tisulares, identificando cómo contribuye cada corriente iónicaen cada caso.
El modelo CRLP, desarrollado en el capítulo 2 y actualizado en el capítulo 3,presentaba una forma más bien atípica al final de la fase de despolarización delpotencial de acción (fase 1). En el capítulo 5, la simulación in silico de los pro-tocolos experimentales descritos en el capítulo 4 y la metodología de optimizaciónpresentada en el capítulo 3 se utilizaron para mejorar la forma del potencial deacción al tiempo que validaba el modelo ajustado a escalas iónicas, celulares y detejido.
En el capítulo 6 se integraron todas las formulaciones iniciales y actualiza-ciones subsiguientes del modelo CRLP propuestas en los capítulos anteriores y sereajustaron las conductancias iónicas del modelo para mejorar el comportamientodel modelo con respecto a medidas electrofisiológicas experimentales. Todas lasmetodologías introducidas a lo largo de la tesis se utilizaron para obtener un nuevomodelo de potencial de acción ventricular humano. Para la validación del mod-elo, se consideró un rango de datos experimentales disponibles a diferentes escalasy destinados a evaluar diferentes propiedades electrofisiológicas. Las condicionessubyacentes a cada uno de los estudios experimentales se replicaron tan fielmentecomo fue posible. Los resultados simulados con la versión final del modelo CRLP secompararon en todos los casos con todas las evidencias experimentales disponibles
UniversidadZaragoza

xiii
y con los modelos de células ventriculares humanas más recientes publicados en laliteratura.
El capítulo 7 resume las principales conclusiones de la tesis y presenta nuevaslíneas de investigación que podrían emprenderse en futuros estudios. En conclusión,diferentes técnicas para mejorar el desarrollo y la validación de modelos electrofi-siológicos cardíacos han sido propuestos y analizados en esta tesis. Basándose enel aumento de potencia computacional, se han considerado nuevas estrategias parareducir el número de hipótesis y/o supuestos al construir un modelo de potencial deacción de cardiomiocito ventricular. La aplicación de un algoritmo de optimizaciónjunto con la simulación in silico de los protocolos experimentales han ayudado aencontrar un modelo que represente mejor los resultados experimentales de losmarcadores electrofisiológicos de riesgo arrítmico.
JesúsCarro


Index

Contents
Acknowledgment v
Agradecimientos vii
Abstract ix
Resumen y Conclusiones xi
Index xv
Contents xvii
List of Figures xxiii
List of Tables xxvii
Dissertation 1
1 Introduction 31.1 Motivation . . . . . . . . . . . . . . . . . . . . . . . . . . . . . . . . 31.2 Electrical and Mechanical Activity of the Heart . . . . . . . . . . . . 4
1.2.1 Excitability of cardiac cells . . . . . . . . . . . . . . . . . . . 51.2.2 Electromechanical coupling . . . . . . . . . . . . . . . . . . . 61.2.3 Propagation of the electrical signal throughout the heart . . . 61.2.4 The electrocardiogram . . . . . . . . . . . . . . . . . . . . . . 71.2.5 Acute myocardial ischemia . . . . . . . . . . . . . . . . . . . 9
1.3 Modeling the electrical activity of the heart . . . . . . . . . . . . . . 101.3.1 First electrophysiological model of an excitable cell . . . . . . 101.3.2 Evolution of electrophysiological models for cardiac cells . . . 13
xvii

xviii New Methodologies for the Developmentand Validation of Electrophysiological Models
1.3.3 Human ventricular electrophysiological models: main ioniccurrents . . . . . . . . . . . . . . . . . . . . . . . . . . . . . . 14
1.3.4 Human ventricular electrophysiological models: recent devel-opments . . . . . . . . . . . . . . . . . . . . . . . . . . . . . . 17
1.3.5 The Grandi-Pasqualini-Bers model . . . . . . . . . . . . . . . 181.3.6 Acute ischemia models . . . . . . . . . . . . . . . . . . . . . . 21
1.4 Objectives and Outline of the Thesis . . . . . . . . . . . . . . . . . . 221.4.1 Aim of the thesis . . . . . . . . . . . . . . . . . . . . . . . . . 221.4.2 Specific objectives . . . . . . . . . . . . . . . . . . . . . . . . 221.4.3 Outline of the thesis . . . . . . . . . . . . . . . . . . . . . . . 23
2 A New Paradigm for Electrophysiological Model Development 272.1 Introduction . . . . . . . . . . . . . . . . . . . . . . . . . . . . . . . . 272.2 Methods . . . . . . . . . . . . . . . . . . . . . . . . . . . . . . . . . . 28
2.2.1 Selected markers . . . . . . . . . . . . . . . . . . . . . . . . . 282.2.2 Stimulation Protocols . . . . . . . . . . . . . . . . . . . . . . 292.2.3 The CRLP Model . . . . . . . . . . . . . . . . . . . . . . . . 312.2.4 Conducted Simulations . . . . . . . . . . . . . . . . . . . . . 37
2.3 Results . . . . . . . . . . . . . . . . . . . . . . . . . . . . . . . . . . . 382.3.1 Results for Control Conditions . . . . . . . . . . . . . . . . . 382.3.2 Results for Hyperkalemic Conditions . . . . . . . . . . . . . . 45
2.4 Discussion and conclusions . . . . . . . . . . . . . . . . . . . . . . . . 482.4.1 New model characteristics . . . . . . . . . . . . . . . . . . . . 492.4.2 Simulation of hyperkalemic conditions . . . . . . . . . . . . . 492.4.3 Data sources . . . . . . . . . . . . . . . . . . . . . . . . . . . 502.4.4 Model limitations . . . . . . . . . . . . . . . . . . . . . . . . . 50
3 Improvement of Existing Electrophysiological Models 533.1 Introduction . . . . . . . . . . . . . . . . . . . . . . . . . . . . . . . . 533.2 Materials and Methods . . . . . . . . . . . . . . . . . . . . . . . . . . 55
3.2.1 Optimization problem . . . . . . . . . . . . . . . . . . . . . . 553.2.2 Upgrade of the CRLP model . . . . . . . . . . . . . . . . . . 603.2.3 Frequency-dependence behavior . . . . . . . . . . . . . . . . . 653.2.4 Simulation of changes in potassium concentration . . . . . . . 653.2.5 Implementation . . . . . . . . . . . . . . . . . . . . . . . . . . 66
3.3 Results . . . . . . . . . . . . . . . . . . . . . . . . . . . . . . . . . . . 663.3.1 Sensitivity Analysis . . . . . . . . . . . . . . . . . . . . . . . 663.3.2 Non-linear optimization . . . . . . . . . . . . . . . . . . . . . 683.3.3 Model Comparison . . . . . . . . . . . . . . . . . . . . . . . . 683.3.4 Frequency response . . . . . . . . . . . . . . . . . . . . . . . . 713.3.5 Response to changes in extracellular potassium . . . . . . . . 713.3.6 Computational Cost . . . . . . . . . . . . . . . . . . . . . . . 72
3.4 Discussion . . . . . . . . . . . . . . . . . . . . . . . . . . . . . . . . . 733.4.1 Response surface optimization . . . . . . . . . . . . . . . . . 733.4.2 Database generation . . . . . . . . . . . . . . . . . . . . . . . 74
UniversidadZaragoza

Contents xix
3.4.3 Computational cost . . . . . . . . . . . . . . . . . . . . . . . 753.4.4 Definition of the optimization problem . . . . . . . . . . . . . 753.4.5 Model comparison . . . . . . . . . . . . . . . . . . . . . . . . 763.4.6 Response to potassium concentration changes . . . . . . . . . 76
3.5 Conclusions . . . . . . . . . . . . . . . . . . . . . . . . . . . . . . . . 77
4 Limitations in Electrophysiological Model Development and Validation 794.1 Introduction . . . . . . . . . . . . . . . . . . . . . . . . . . . . . . . . 794.2 Materials and Methods . . . . . . . . . . . . . . . . . . . . . . . . . . 82
4.2.1 L-type calcium channel gating . . . . . . . . . . . . . . . . . 824.2.2 Characterization of L-type calcium voltage-dependent inac-
tivation . . . . . . . . . . . . . . . . . . . . . . . . . . . . . . 834.2.3 Steady-state AP markers . . . . . . . . . . . . . . . . . . . . 854.2.4 Ionic contributors to AP markers . . . . . . . . . . . . . . . . 854.2.5 Computational simulations . . . . . . . . . . . . . . . . . . . 86
4.3 Results . . . . . . . . . . . . . . . . . . . . . . . . . . . . . . . . . . . 874.3.1 Characterization of L-type calcium voltage-dependent inac-
tivation . . . . . . . . . . . . . . . . . . . . . . . . . . . . . . 874.3.2 Ionic contributors to AP markers . . . . . . . . . . . . . . . . 90
4.4 Discussion . . . . . . . . . . . . . . . . . . . . . . . . . . . . . . . . . 944.4.1 Effect of submodel variable interactions in the evaluation of
voltage-dependent L-Type Calcium Current inactivation . . . 944.4.2 Effect of cell-to-cell interactions in the evaluation of ionic
contributors to AP markers . . . . . . . . . . . . . . . . . . . 974.5 Conclusions . . . . . . . . . . . . . . . . . . . . . . . . . . . . . . . . 97
5 Reformulation of Ionic Current Expression 995.1 Introduction . . . . . . . . . . . . . . . . . . . . . . . . . . . . . . . . 995.2 Methods . . . . . . . . . . . . . . . . . . . . . . . . . . . . . . . . . . 100
5.2.1 Modification of ICaL voltage-dependent inactivation time con-stants . . . . . . . . . . . . . . . . . . . . . . . . . . . . . . . 100
5.2.2 Adjustment of ICaL voltage-dependent inactivation steady-state1005.2.3 Numerical methods and implementation . . . . . . . . . . . . 103
5.3 Results . . . . . . . . . . . . . . . . . . . . . . . . . . . . . . . . . . . 1045.3.1 Solution to the minimization problem . . . . . . . . . . . . . 1045.3.2 New definition of ICaL current . . . . . . . . . . . . . . . . . . 104
5.4 Discussion . . . . . . . . . . . . . . . . . . . . . . . . . . . . . . . . . 1065.4.1 Development and validation of a new ionic current formulation1075.4.2 Reproducing experimental data from different laboratories . . 107
5.5 Conclusions . . . . . . . . . . . . . . . . . . . . . . . . . . . . . . . . 108
6 A Human Ventricular Electrophysiological Model with Improved De-scription of Experimental Behavior 1096.1 Introduction . . . . . . . . . . . . . . . . . . . . . . . . . . . . . . . . 1096.2 Methods . . . . . . . . . . . . . . . . . . . . . . . . . . . . . . . . . . 111
JesúsCarro
xx New Methodologies for the Developmentand Validation of Electrophysiological Models
6.2.1 Adjustment of ionic conductances . . . . . . . . . . . . . . . . 1116.2.2 Model comparison . . . . . . . . . . . . . . . . . . . . . . . . 1206.2.3 Model validation . . . . . . . . . . . . . . . . . . . . . . . . . 120
6.3 Results . . . . . . . . . . . . . . . . . . . . . . . . . . . . . . . . . . . 1216.3.1 Model optimization . . . . . . . . . . . . . . . . . . . . . . . . 1216.3.2 Model validation . . . . . . . . . . . . . . . . . . . . . . . . . 129
6.4 Discussion . . . . . . . . . . . . . . . . . . . . . . . . . . . . . . . . . 1296.4.1 Model performance . . . . . . . . . . . . . . . . . . . . . . . . 1296.4.2 Optimization algorithm . . . . . . . . . . . . . . . . . . . . . 1336.4.3 Validation . . . . . . . . . . . . . . . . . . . . . . . . . . . . . 134
6.5 Conclusions . . . . . . . . . . . . . . . . . . . . . . . . . . . . . . . . 135
7 Conclusions and Future Work 1377.1 Conclusions . . . . . . . . . . . . . . . . . . . . . . . . . . . . . . . . 137
7.1.1 Identification of major issues in electrophysiological modeldevelopment and validation . . . . . . . . . . . . . . . . . . . 137
7.1.2 New techniques for improved model development and validation1387.2 Future work . . . . . . . . . . . . . . . . . . . . . . . . . . . . . . . . 139
Appendix 143
A Publications 145A.1 Publications in Journal Articles . . . . . . . . . . . . . . . . . . . . . 145A.2 Publications in Conference Proceedings . . . . . . . . . . . . . . . . 145A.3 Other Conferences . . . . . . . . . . . . . . . . . . . . . . . . . . . . 146
B Description of the First Model 147B.1 Model Parameters . . . . . . . . . . . . . . . . . . . . . . . . . . . . 147
B.1.1 Physical Constants . . . . . . . . . . . . . . . . . . . . . . . . 147B.1.2 Enviromental Parameters . . . . . . . . . . . . . . . . . . . . 147B.1.3 Fractional Currents . . . . . . . . . . . . . . . . . . . . . . . . 148B.1.4 Ion Concentrations . . . . . . . . . . . . . . . . . . . . . . . . 148B.1.5 Sodium Transport . . . . . . . . . . . . . . . . . . . . . . . . 148B.1.6 Potassium Currents . . . . . . . . . . . . . . . . . . . . . . . 148B.1.7 Chlorine currents . . . . . . . . . . . . . . . . . . . . . . . . . 149B.1.8 Calcium Transport . . . . . . . . . . . . . . . . . . . . . . . . 149B.1.9 SR Calcium Fluxes . . . . . . . . . . . . . . . . . . . . . . . . 149B.1.10 Buffering . . . . . . . . . . . . . . . . . . . . . . . . . . . . . 150
B.2 Model Equations . . . . . . . . . . . . . . . . . . . . . . . . . . . . . 151B.2.1 Nerst Potentials . . . . . . . . . . . . . . . . . . . . . . . . . 151B.2.2 INa:Fast Sodium Current . . . . . . . . . . . . . . . . . . . . . 151B.2.3 INa,bk: Background Sodium Current . . . . . . . . . . . . . . . 152B.2.4 INaK : Na-K Pump Current . . . . . . . . . . . . . . . . . . . . 153B.2.5 IKr: Rapidly Activating Potassium Current . . . . . . . . . . 153
UniversidadZaragoza
Contents xxi
B.2.6 IKs: Slowly Activating Potassium Current . . . . . . . . . . . 153B.2.7 IKp: Plateau Potassium Current . . . . . . . . . . . . . . . . . 154B.2.8 Ito: Transient Outward Potassium Current . . . . . . . . . . 154B.2.9 IK1:Inward Rectifier Potassium Current . . . . . . . . . . . . 155B.2.10 IClCa: Calcium-Activated Chlorine Current . . . . . . . . . . . 155B.2.11 ICl,bk: Background Chlorine Current . . . . . . . . . . . . . . . 155B.2.12 ICaL: L-type Calcium Current . . . . . . . . . . . . . . . . . . 155B.2.13 Incx: Na-Ca Exchanger Current . . . . . . . . . . . . . . . . . 158B.2.14 IpCa: Sarcolemmal Calcium Pump Current . . . . . . . . . . . 158B.2.15 ICa,bk: Background Calcium Current . . . . . . . . . . . . . . 159B.2.16 SR Fluxes: Calcium Release, SR Calcium Pump, SR Calcium
Leak . . . . . . . . . . . . . . . . . . . . . . . . . . . . . . . . 159B.2.17 Ion Homeostasis . . . . . . . . . . . . . . . . . . . . . . . . . 159B.2.18 Membrane Potential . . . . . . . . . . . . . . . . . . . . . . . 161
C Description of the Final Model 163C.1 Model Parameters . . . . . . . . . . . . . . . . . . . . . . . . . . . . 163
C.1.1 Enviromental Parameters . . . . . . . . . . . . . . . . . . . . 163C.1.2 Fractional Currents . . . . . . . . . . . . . . . . . . . . . . . . 163C.1.3 Sodium Transport . . . . . . . . . . . . . . . . . . . . . . . . 163C.1.4 Potassium Currents . . . . . . . . . . . . . . . . . . . . . . . 164C.1.5 Chlorine currents . . . . . . . . . . . . . . . . . . . . . . . . . 164C.1.6 Calcium Transport . . . . . . . . . . . . . . . . . . . . . . . . 164C.1.7 SR Calcium Fluxes . . . . . . . . . . . . . . . . . . . . . . . . 164
C.2 Model Equations . . . . . . . . . . . . . . . . . . . . . . . . . . . . . 164C.2.1 Ito: Transient Outward Potassium Current . . . . . . . . . . 164C.2.2 ICaL: L-type Calcium Current . . . . . . . . . . . . . . . . . . 164C.2.3 SR Fluxes: Calcium Release, SR Calcium Pump, SR Calcium
Leak . . . . . . . . . . . . . . . . . . . . . . . . . . . . . . . . 166C.2.4 Ion Homeostasis . . . . . . . . . . . . . . . . . . . . . . . . . 166C.2.5 Membrane Potential . . . . . . . . . . . . . . . . . . . . . . . 166
D Acronyms 167
References 169
JesúsCarro


List of Figures
1.1 The anatomy of the heart and associated vessels . . . . . . . . . . . 51.2 Isochronic surfaces of ventricular activation . . . . . . . . . . . . . . 71.3 Different waveforms for each of the specialized cells found in the heart 81.4 Electrode positions in the standard 12-lead ECG . . . . . . . . . . . 81.5 The equivalent circuit of the Hodgkin-Huxley model. . . . . . . . . . 111.6 Voltage dependence of particles in the potassium channels of the HH
model . . . . . . . . . . . . . . . . . . . . . . . . . . . . . . . . . . . 131.7 Voltage dependence of the particles in the sodium channels of the
HH model . . . . . . . . . . . . . . . . . . . . . . . . . . . . . . . . . 14
2.1 Graphical description (using simulation results) of the markers ofarrhythmic risk . . . . . . . . . . . . . . . . . . . . . . . . . . . . . . 30
2.2 Characteristics of ICaL and IK1 in simulations and experiments . . . . 352.3 APs computed with the TP06, GPB and CRLP models for isolated
cells and 1D tissue at CL = 1000 ms . . . . . . . . . . . . . . . . . . 392.4 markers of arrhythmic risk from TP06, GPB and CRLP models . . . 432.5 Effect of blocking potassium currents for the GPB and CRLP models 442.6 CV and APD90 restitution curves for the TP06, GPB and CRLP
models in a simulated 1D fiber. . . . . . . . . . . . . . . . . . . . . . 452.7 Simulated hyperkalemia in cell and tissue using the CRLP model . . 462.8 Behavior of the CRLP model under hyperkalemic conditions in a 1D
fiber . . . . . . . . . . . . . . . . . . . . . . . . . . . . . . . . . . . . 47
3.1 Flow chart of the proposed algorithm. . . . . . . . . . . . . . . . . . 583.2 Temporal evolution of [K+]i in CRLP and GPB models after intro-
ducing [K+]i dynamics . . . . . . . . . . . . . . . . . . . . . . . . . . 61
xxiii
xxiv New Methodologies for the Developmentand Validation of Electrophysiological Models
3.3 Results of the sensitivity analysis applied to the original CRLPmodel. The blue scale indicates relative sensitivity for each marker.White color indicates maximum relative sensitivity and dark bluecolor indicates that property and parameter are independent. Per-centages in the white boxes indicate the absolute sensitivity of theproperty. A minus sign in a box indicates that marker and model pa-rameter vary inversely. ‘Trian’ stands for Triangulation, ‘Sys’ standsfor systolic and ‘Dia’ stands for diastolic. . . . . . . . . . . . . . . . 67
3.4 Model Comparison Results . . . . . . . . . . . . . . . . . . . . . . . 693.5 Model Comparison Results . . . . . . . . . . . . . . . . . . . . . . . 703.6 Steady-state APD90 values as a function of pacing CL. . . . . . . . . 713.7 Results for an unstimulated cell simulated with the modified CRLP
model following changes in [K+]o. a) Temporal evolution of mem-brane potential; b) Time to achieve 90% of the steady-state mem-brane potential (t90%). . . . . . . . . . . . . . . . . . . . . . . . . . . 71
3.8 [K+]i evolution following [K+]o changes simulated with the modi-fied CRLP model. a) [K+]i dependence on [K+]o at different timeinstants; b) time course of [K+]i for different [K+]o values. . . . . . 72
4.1 Paired-pulse voltage clamp protocol and measurement of the steady-state value fss of voltage-dependent inactivation. . . . . . . . . . . . 84
4.2 Comparison between model definition (continuous and discontinuouslines), in silico simulations (yellow crosses) and experimental results(red circles) for fss. a) TP06 model and data from [1]. b) GPBmodel and data from [2]. c) ORd model and data from [3]. d)CRLP model and data from [1]. . . . . . . . . . . . . . . . . . . . . . 88
4.3 Temporal evolution of the ICaL gates during simulation of the paired-pulse protocol (see text for specific values of tpre, tsep and tpulse usedin the simulations): a) TP06 model. b) GPB model. c) ORd model.d) CRLP model . . . . . . . . . . . . . . . . . . . . . . . . . . . . . . 89
4.4 Contribution of ionic conductances to electrophysiological markerssimulated in tissue and cell with the TP06 model. Dark colors (blueor brown) indicate maximum correlation between changes in a con-ductance and changes in a marker; white color indicates no correla-tion. Percentages in boxes indicate the contribution of changes ina conductance to changes in a marker. Minus signs indicate thatconductances and markers vary inversely; plus signs indicate thatconductances and markers vary in the same direction. . . . . . . . . 92
4.5 Contribution of ionic conductances to AP markers simulated in celland tissue with the GPB model. The legend of the figure is the sameas in see Figure 4.4. . . . . . . . . . . . . . . . . . . . . . . . . . . . 92
4.6 Contribution of ionic conductances to AP markers simulated in celland tissue with the ORd model. The legend of the figure is the sameas in see Figure 4.4. . . . . . . . . . . . . . . . . . . . . . . . . . . . 93
UniversidadZaragoza

List of Figures xxv
4.7 Contribution of ionic conductances to AP markers simulated in celland tissue with the ORdNa model. The legend of the figure is thesame as in see Figure 4.4. . . . . . . . . . . . . . . . . . . . . . . . . 93
4.8 Contribution of ionic conductances to AP markers simulated in celland tissue with the CRLP model. The legend of the figure is thesame as in see Figure 4.4. . . . . . . . . . . . . . . . . . . . . . . . . 94
5.1 Time constants of ICaL voltage-dependent inactivation in the CRLPmodel and following the readjustment proposed in this chapter.Comparison with experimental data [2, 4–7] is provided as well. . . . 100
5.2 Effect of varying βf2 in the AP shape. Red line represents controlconditions. Dark grey lines correspond to reductions in βf2, whilelight grey lines correspond to increases in βf2. . . . . . . . . . . . . . 101
5.3 Effect of varying βf in the AP shape after having modified βf2 inthe CRLP model. Red line represents control conditions. Dark greylines correspond to reductions in βf , while light grey lines correspondto increases in βf . . . . . . . . . . . . . . . . . . . . . . . . . . . . . 101
5.4 Comparison between the results of the in silico simulations for theCRLP model and the adjusted model of this chapter and the exper-imental results of [1–3]. . . . . . . . . . . . . . . . . . . . . . . . . . 106
5.5 Results of tissue simulations computed with the readjusted CRLPmodel proposed in this chapter. a) AP at a cycle length of 1000ms. b) [Ca2+]i at a cycle length of 1000 ms. c) APD adaptation toabrupt cycle length changes. . . . . . . . . . . . . . . . . . . . . . . . 106
6.1 Action Potential of the different models under control conditions insingle epicardial cells: a) optimized CRLP model; b) initial CRLPmodel; c) GPB model; d) ORd model; e) TP06 model. . . . . . . . . 123
6.2 APD90 variation with CL under the same conditions of the CLVPETdataset. . . . . . . . . . . . . . . . . . . . . . . . . . . . . . . . . . . 124
6.3 APD90 variation with CL under the same conditions of the CLVPETdataset following ionic current inhibitions: A) 15% IKr block; B) 70%IKr block; C) 95% IKs block; D) Zoomed graphic for 15% IKs block;E) 75% IK1 block. . . . . . . . . . . . . . . . . . . . . . . . . . . . . . 125
6.4 Simulations of the experiments by Drouin et al. [8]: A) APD90
variation with CL for epicardial cells. B) Zoomed version of thefigure shown in A. C) APD90 variation with CL for endocardialcells. D) Zoomed version of the figure shown in C. . . . . . . . . . . 127
6.5 Variation in [Na+]i under the same conditions of the experimentsby Piekse et al. [9] for endocardial cells. . . . . . . . . . . . . . . . . 128
6.6 Variation in [Ca2+]i under the same conditions of the experimentsby Schmidt et al. [10]: A) Diastolic [Ca2+]i normalized by the valuewhen the frequency is 1Hz; B) Systolic [Ca2+]i normalized by thevalue when the the frequency is 1Hz. . . . . . . . . . . . . . . . . . . 128
JesúsCarro

xxvi New Methodologies for the Developmentand Validation of Electrophysiological Models
6.7 Variation in [Ca2+]i characteristics under the same conditions of theexperiments by Coppini et al. [11]: A) Difference between systolicand diastolic [Ca2+]i levels as a function of CL; B) Systolic [Ca2+]ifor different CLs normalized by the value when CL is 1000 ms; C)Time from [Ca2+]i peak to 50% as a function of CL; D) Time from[Ca2+]i peak to 90% as a function of CL. . . . . . . . . . . . . . . . 130
UniversidadZaragoza

List of Tables
1.1 Differences between human ventricular cell models . . . . . . . . . . 19
2.1 Results of the sensitivity analysis applied to the GPB model . . . . . 412.2 Markers of arrhythmic risk for the TP06, GPB and CRLP human
models . . . . . . . . . . . . . . . . . . . . . . . . . . . . . . . . . . . 422.3 Percentages of variation in APD90 caused by blocking different potas-
sium currents . . . . . . . . . . . . . . . . . . . . . . . . . . . . . . . 42
3.1 Electrophysiological markers evaluated in the proposed response sur-face approximation-based optimization. . . . . . . . . . . . . . . . . 64
3.2 Steady-state values of [K+]i for different [K+]o values as calculatedwith the optimized CRLP model. . . . . . . . . . . . . . . . . . . . . 73
3.3 Computational cost of the different protocols used for the optimization. 73
4.1 Paired-pulse test parameters in experimental protocols. . . . . . . . 854.2 Comparison of electrophysiological markers simulated in single cell
and 1D tissue under control conditions. . . . . . . . . . . . . . . . . 904.3 Absolute (Ea) and relative (Er) differences between electrophysio-
logical markers in single cell and 1D tissue simulations. . . . . . . . . 91
5.1 Results of the minimization problem and subsequent validation. Im-provement represents the error for each combination of constraintsnormalized by the error before the optimization. . . . . . . . . . . . 105
5.2 Evaluation of electrophysiological markers in tissue for the initialand adjusted CRLP models (third and fourth columns). Availablephysiological ranges are provided in the second column [12]. . . . . . 105
6.1 Evaluation of APD90 and Vrest in the TESZT dataset. . . . . . . . . 1136.2 Evaluation of variations in APD90 in the CLVPET dataset. . . . . . 1146.3 Evaluation of APD90 in the study by Drouin et al. [8]. . . . . . . . . 115
xxvii

xxviii New Methodologies for the Developmentand Validation of Electrophysiological Models
6.4 Evaluation of [Na+]i and its variations in the study by Pieske et al.[9]. . . . . . . . . . . . . . . . . . . . . . . . . . . . . . . . . . . . . . 115
6.5 Evaluation of [Ca2+]i and its variations in the study by Schmidtet al. [10]. . . . . . . . . . . . . . . . . . . . . . . . . . . . . . . . . . 116
6.6 Evaluation of [Ca2+]i characteristics in the study by Coppini et al.[11]. . . . . . . . . . . . . . . . . . . . . . . . . . . . . . . . . . . . . 117
6.7 Evaluation of time for APD rate adaptation in the study by Pueyoet al. [13]. . . . . . . . . . . . . . . . . . . . . . . . . . . . . . . . . . 117
6.8 Results of steady-state AP markers for a CL of 1000 ms computedwith the optimized CRLP model and other published human ven-tricular cell models. . . . . . . . . . . . . . . . . . . . . . . . . . . . 122
6.9 Results of steady-state [Na+]i and [Ca2+]i for a CL of 1000 ms com-puted with the optimized CRLP model and other published humanventricular cell models. . . . . . . . . . . . . . . . . . . . . . . . . . . 126
6.10 Results of APD adaptation to abrupt CL changes computed with alltested human ventricular models under the same conditions as in [13].129
6.11 Validation results. Steady-state AP markers for a CL of 1000 mscalculated in tissue fibers simulated with the optimized and initialCRLP models. . . . . . . . . . . . . . . . . . . . . . . . . . . . . . . 131
UniversidadZaragoza

Dissertation


Chapter 1
Introduction
1.1 Motivation
According to data from the World Health Organization (WHO), 17.7 million peo-ple were estimated to have died of cardiovascular diseases (CVDs) in 2015. Thisrepresents 31% of all global deaths, making CVDs the leading cause of death world-wide. CVDs are caused by different disorders of the heart and blood vessels, whichinclude coronary heart disease (heart attacks), cerebrovascular disease (stroke),raised blood pressure (hypertension) or peripheral artery disease. Of note, CVDsare the leading noncommunicable diseases (NCDs). In 2011, 36 million people diedfrom NCDs, with half of them caused by CVDs [14]. Improvement of the currenttechniques to detect, diagnose and prevent CVDs is, thus, necessary.
Among CVDs, an important percentage of deaths are related to cardiac ar-rhythmias, some of which may lead to sudden cardiac death. Arrhythmias aredefined as irregularities in the heartbeating. The abnormal rhythm of the heartmay be associated with the heart beating too quickly, too slowly or erratically.Different types of cardiac arrhythmias include atrial fibrillation, conduction dis-orders, premature contractions, ventricular tachycardia or ventricular fibrillation,to name a few. Cardiac arrhythmias can be caused by an abnormal behavior ofthe heart’s natural pacemaker, a problem in the conduction system of the heart orbecause another part of the heart starts working as the pacemaker, among others.In those situations the heart may be precluded from carrying out its main function:to pump deoxygenated blood to the lungs and oxygenated blood to the rest of thebody.
The heart is a complex system that works through the interaction of a largenumber of elements acting at different scales. The main function of the heart ismechanical, with this action being electrically controlled. Mathematical modelingand simulation of the heart’s electrical activity (so-called cardiac electrophysiology)combined with signal processing of bioelectrical signals provide an ideal framework
3

4 New Methodologies for the Developmentand Validation of Electrophysiological Models
to join the information from clinical and experimental studies with the understand-ing of the mechanisms underlying them. Tools allowing to test different hypothesesand predict potential abnormalities in the heart’s behavior can be developed withinsuch a combined modeling and processing framework. In a relatively near future,those tools might be used in the clinical practice as complementary instruments tohelp in the prevention of cardiac diseases and in the improvement of their diagnosisand therapy. In particular, cardiac in silico modeling and simulation could improveour understanding of the heart’s function, the generation of different pathologiesand their associated manifestations. To that end, it is essential to have actionpotential (AP) models able to reproduce experimentally and clinically observedbehaviors at the cell and tissue levels. This would allow simulation of the electricalactivity of the heart from the cell to the body surface and in silico reconstructthe most commonly used bioelectrical signal in the clinics, the electrocardiogram(ECG). The developed models could subsequently be used to investigate, for in-stance, the mechanisms and manifestations of ventricular arrhythmias at differentscales, which is a major focus of the present thesis.
Due to the number of factors to be considered during the development of amodel, the interrelationships between them and the need to preserve the improve-ments obtained by previously proposed models, it is necessary to propose novelmethodologies that help to control the design, update and validation of new mod-els. These new methodologies should target all the elements of the model, from thedefinition of ionic current gates to the electrical propagation in multiscale models,while considering the implications of any new definition or update in the simulatedresults at all the involved scales.
In the following sections, a general introduction is presented on: how the heartworks (mainly from an electrical point of view); how the behavior of the heartis affected by different conditions or diseases; and how mathematical models canbe used to study the heart under physiological and pathological conditions. Adescription is provided on the range of involved spatio-temporal scales and oncardiac electrical propagation. Next, the evolution of cardiac electrophysiologicalmodels and the main components of a human ventricular cell model are analyzed.Finally, the Grandi-Pasqualini-Bers (GPB) model of human ventricular cells [15],used as a starting point for this thesis, is studied. The chapter ends by presentingthe main objectives and a short outline of the different studies covered in this thesis.
1.2 Electrical and Mechanical Activity of the Heart
The heart is a pump that beats around 70 times and moves more than five litersof blood per minute. It consists of four chambers: the left and right ventricles;and the left and right atria (see Figure 1.1). Deoxygenated blood enters the heartthrough the right atrium, and, from there, flows through the tricuspid valve to theright ventricle and is pumped to the lungs. Oxygenated blood returns from thelungs through the left atrium and then flows to the left ventricle through the mitralvalve. The blood in the left ventricle is pumped through the aortic valve to thesystemic circulation. Under normal conditions, all of these phases are timed and
UniversidadZaragoza

1. Introduction 5
Figure 1.1: The anatomy of the heart and associated vessels. Figure from [16].
synchronized, which allows the blood to circulate and to transport oxygen and othernutrients throughout the body. This mechanism works due to the electromechanicalcoupling of the cardiac cells and to a complex system that propagates the electricalsignals in such a way that facilitates a coordinated contraction of the heart.
1.2.1 Excitability of cardiac cells
Atrial and ventricular muscle cells (or cardiomyocytes) are excitable cells. As such,when a stimulus current pulse depolarizes the resting membrane of a cardiomyocytebeyond the threshold voltage, an AP is generated. During an AP, the membranepotential (the potential at the inner surface relative to that at the outer surfaceof the membrane) rises rapidly at the beginning (depolarization). This first depo-larization phase is followed by a small decrease in the AP (dome) to subsequentlyenter the third phase (plateau) where the membrane potential is held at a high volt-age for some milliseconds. During the fourth phase (repolarization), the membranepotential recovers its resting value, corresponding to the fifth and last phase.
The AP is generated by concentration differences between the ions in the in-tracellular and extracellular compartments. In the case of atrial and ventricularmyocytes, the three main ions are sodium (Na+), potassium (K+) and calcium(Ca2+). When an external stimulus is applied to an atrial or ventricular myocyte,an initial upstroke is generated by the inward flux of sodium ions through thesodium channels. After the first phase, sodium channels close and the transientoutward potassium current is activated and attempts to return the cell to its restingstate. This action is counteracted by an inward calcium ion flux, which in com-bination with the action of potassium currents contribute to keep the potentialapproximately constant during the plateau phase. Calcium channels start to closewhile slow potassium currents remain active until the cell recovers its initial restingstate. In cardiac muscles, excitation of one cell can propagate to the neighboringcells, and, as a result, the concurrent activation generates complex wavefronts that
JesúsCarro

6 New Methodologies for the Developmentand Validation of Electrophysiological Models
propagate through the cardiac tissue.
1.2.2 Electromechanical coupling
Upon depolarization of an atrial or ventricular cardiomyocyte’s membrane, thechannels allowing the passage of calcium ions become open. Most of these ions en-ter through L-type calcium channels to a subspace called the dyadic space, whichis formed by the T-tubule (an extension of the cell membrane) and the close prox-imity of the sarcoplasmic reticulum (the internal store for calcium). When calciumenters, the concentration in the dyadic space rises and it triggers the opening of theryanodine receptors in the sarcoplasmic reticulum. This launches a process knownas calcium-induced calcium-release, during which the calcium input into the cellis amplified with the calcium released from the sarcoplasmic reticulum (SR). Partof the calcium in the cytosol is buffered to troponin and calmodulin. Binding ofcalcium to troponin favors myofilament contraction. The joint action of many car-diac cells contracting in an orderly way in a small period of time allows blood tobe pumped by the heart.
1.2.3 Propagation of the electrical signal throughout the heart
As described in previous sections, cardiac tissue is electrically excitable and exci-tation propagates throughout the heart. Excitation of cardiac tissue triggers con-traction in association with the electromechanical coupling referred above. Bothelectrical and mechanical phenomena are fundamental for heart’s functioning, to-gether with proper synchronization of the activity corresponding to different cardiacregions.
The pacemaker of the heart is the sinoatrial (SA) node, which is located in theright atrium, specifically lying at the junction of the right atrium and the supe-rior vena cava. It consists of specialized self-excitatory muscle cells that are self-activated at a rate of about 70 beats per minute. From the SA node, activationpropagates throughout the atria. Before proceeding to the ventricles, activationpropagates through the atrioventricular (AV) node, located at the boundary be-tween the atria and the ventricles. Since conduction velocity (CV) in the AV nodeis very low (2-5 cm/s, while CV in the atria is between 50 and 100 cm/s) [16], exci-tation of the ventricular tissue is delayed. Specifically, the activation wavefront isestimated to take approximately 75 ms to cross the AV node. Because of this, theatria contract and pump the blood to the ventricles when these are still relaxed.
Once the activation traverses the AV node, it travels through a common bundle,called the bundle of His, which is later divided into two bundle branches: the rightand left bundle branches. Finally, these branches ramify into the Purkinje fibers,which are connected to the ventricles and allow activation to be spread throughoutthe ventricles from many different locations. Following electrical activation, theventricles contract and pump out the blood to the lungs and the rest of the body.
Figure 1.2 illustrates isochronic surfaces of ventricular electrical activation. Theimage is from [16], with data from [17].
UniversidadZaragoza

1. Introduction 7
Figure 1.2: Isochronic surfaces of ventricular activation. Image from [16], withdata from [17].
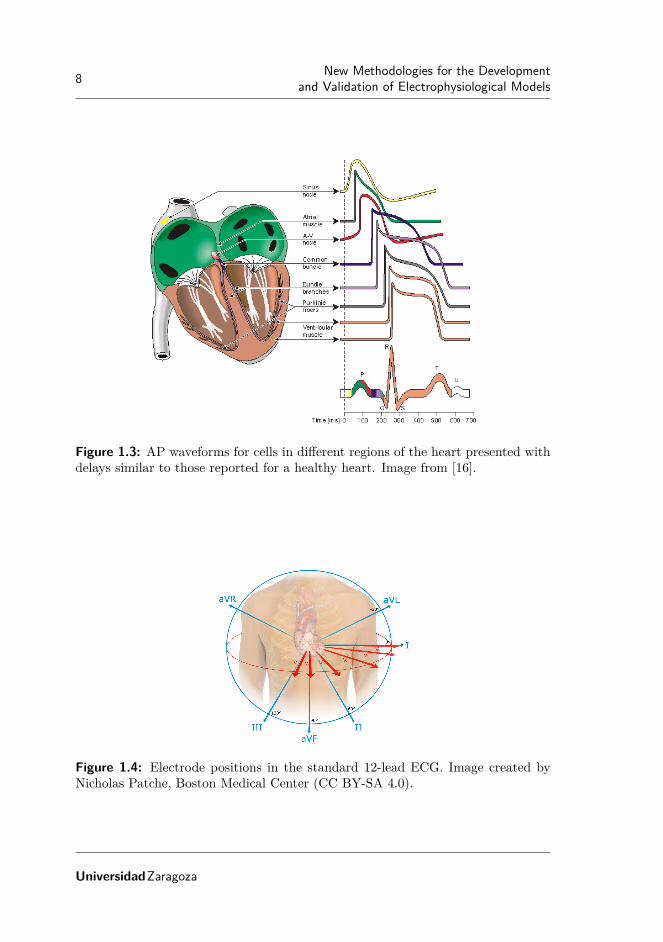
Electrical signals, APs, corresponding to various regions in the heart are shownin Figure 1.3. As can be observed from the figure, these present different shapes.Figure 1.3 illustrates these APs with delays similar to those reported for a healthyheart.
1.2.4 The electrocardiogram
The ECG is a tool commonly used to assess the electrical and muscular activitiesof the heart. It records the electric potential on the surface of the thorax generatedby the electrical activity of cardiac cells. To acquire an ECG, electrodes are placedon the thorax to record various electric signals at different positions. In figure 1.4the standard 12-lead ECG is presented.
As depicted in Figure 1.3, depolarization and repolarization of cardiac cells isrepresented in the following waveforms of the ECG:
• Atrial depolarization corresponds to the P-wave.
• Ventricular depolarization corresponds to the QRS-complex, which also con-tains atrial repolarization.
• Ventricular repolarization corresponds to the T-wave.
The use of the ECG is widespread in clinical practice, as it is a non-invasive testthat provides significant information about cardiac electrical events. It should benoted that the ECG offers simultaneous information at different spatio-temporalscales. In many instances, some information of interest could thus be masked by
JesúsCarro
8 New Methodologies for the Developmentand Validation of Electrophysiological Models
Figure 1.3: AP waveforms for cells in different regions of the heart presented withdelays similar to those reported for a healthy heart. Image from [16].
Figure 1.4: Electrode positions in the standard 12-lead ECG. Image created byNicholas Patche, Boston Medical Center (CC BY-SA 4.0).
UniversidadZaragoza

1. Introduction 9
other events in the heart or by the effect of propagation. ECG processing combinedwith in-silico modeling and simulation of cardiac electrical activity represent apowerful tool to improve our current understanding of heart’s functioning and itsmanifestations at the surface of the thorax, as it is possible to simultaneouslyanalyze the ECG and the underlying electrical signals at different scales.
1.2.5 Acute myocardial ischemia
In previous sections, cardiac electrical activity under physiological conditions andthe heart’s primary function of pumping blood out to the body have been described.Many diseases and conditions are associated with cardiac malfunctioning. Electri-cal irregularities in the beating of the heart, so called arrhythmias, may lead toalterations in cardiac contraction, not allowing the heart to efficiently pump bloodout to the rest of body. Some types of arrhythmias are among the most importantcauses of sudden cardiac death. They can be generated by abnormal automaticity,abnormal conduction of the electrical impulse or a combination of both.
Injured or damaged tissue can conduct slowly or act as an obstacle (non-conducting tissue) causing abnormal conduction. Certain channelopathies or drugeffects can generate abnormal automaticity and in some cases beats may be gen-erated in a region different from the SA node (ectopic beats). According to itsorigin, arrhythmias are commonly grouped into two large families: supraventricu-lar arrhythmias and ventricular arrhythmias. Supraventricular arrhythmias occurin the upper part of the heart (above the ventricles, including the atria). Onthe other hand, ventricular arrhythmias occur in the lower part of the heart (theventricles), like in the case of ventricular tachycardia or ventricular fibrillation–[18, 19]. Diverse pathological conditions can result in ventricular tachycardia orfibrillation, being acute myocardial ischemia the leading cause of ventricular fib-rillation. Myocardial ischemia occurs when there is a reduction in the blood flowto the heart, usually as a result of the partial or total obstruction of one or vari-ous coronary arteries. In association with the reduction in blood flow, the flow ofoxygen and glucose to cardiac muscle cells is interrupted within the affected region[20]. This situation generates three major effects: reduction in oxygen (hypoxia),increase in the extracellular potassium (hyperkalemia) and acidification of the tis-sue (acidosis). Under these effects, cardiac electrical activity experiences significantalterations: cell excitability and conduction velocity in tissue are reduced and theeffective refractive period (ERP) is increased [20, 21]. Importantly, there is a highdegree of spatial heterogeneity in these alterations, which generates a substrate forarrhythmogenesis.
Although pro-arrhythmic consequences in the setting of acute myocardial is-chemia have been extensively investigated, the mechanisms underlying them arenot yet fully understood. Many studies have attempted to shed light on this phe-nomenon by performing investigations in animal species, like pigs Janse et al. [22]and dogs [21]. Experimental studies have demonstrated that the above describedspatial heterogeneity, particularly in the border between ischemic and healthyzones, leads to the establishment of reentries around the ischemic zone [21, 23].
JesúsCarro

10 New Methodologies for the Developmentand Validation of Electrophysiological Models
At the level of the surface ECG, myocardial ischemia is clinically recognizedwhen there is a change in the level of the ST segment [24, 25]. The mechanismsbehind the ST segment change have been widely explored and there are still ongoinginvestigations into them. Also, other techniques have been and are being exploredto increase the ability to recognize myocardial ischemia manifestations at the ECGlevel. Due to the complexity of the problem and the different scales involved,modeling and simulation of human ventricular electrical activity has been used tostudy myocardial ischemia and gain knowledge on the mechanisms underlying theinitiation and maintenance of reentrant arrhythmias under myocardial ischemia.
1.3 Modeling the electrical activity of the heart
Cardiac electrophysiological models can be used to simulate the electrical activityof a cardiomyocyte, a fiber of cells, a piece of tissue or the entire heart. Thiswide range of possibilities makes them very useful for research in many differentsituations and for many purposes. Some of the benefits of using cardiac modelingand simulation are described in the following, together with potential associatedshortcomings one should be aware of:
• Increase knowledge on cardiac electrophysiology: In certain in vivo or in vitroexperiments only a few variables of interest can be concomitantly measuredduring the experiment. In silico modeling and simulation of cardiac electricalactivity allows simultaneous exploration of all variables of interest, thus lead-ing to improved understanding of the mechanisms underlying healthy andpathological behaviors. Nevertheless, given that models may be limited inaccurately representing biological behavior, either because of lack of knowl-edge or impossibility to account for all the complexity in model descriptions,their use should always be accompanied by awareness of their limitations andconsideration of the research objective they could contribute to.
• Assist in decision making: Cardiac computational models of specific patholo-gies, accounting for well-known high inter-patient variability, can be built.These models can be used in a wide range of applications, like drug testing orassessment of ablation effects, to name a few. As a result, both beneficial anddetrimental consequences of evaluated treatments could be identified, whichcould, in turn, guide novel experimental and clinical evaluations.
• Reduce animal experimentation: Development of novel drug compounds re-quires different levels of testing to assess potential cardio-toxic effects. Mod-eling and simulation of cardiac electrical activity represents an alternative tocurrent animal experiments.
1.3.1 First electrophysiological model of an excitable cell
The first computational model of the AP was proposed by Alan L. Hodgkin andAndrew F. Huxley [26]. This model was introduced to explain experimental mea-surements of the electrical activity of the squid giant axon obtained using the volt-
UniversidadZaragoza

1. Introduction 11
Figure 1.5: The equivalent circuit of the Hodgkin-Huxley model. The voltagesources show the polarity of the positive value. The calculated Nernst voltagesof sodium, potassium and chloride designate the value of corresponding voltagesources. Image from [16].
age clamp technique. In the proposed model, the cell was described as an electricalcircuit in which ionic currents pass through ion channels that act as resistances,with the cell membrane acting as a capacitor. The electrical activity of the squidgiant axon was described by four currents: a sodium current (INa), a potassiumcurrent (IK), a small leakage current (Il), which represents the current carried byother ions (mainly chloride ions), and the capacitive current. Each of these currentsuses its own path or channel in the cell and, for this reason, this model is calledthe parallel conductance model or the chord conductance model [27]. In the originalformulation of the Hodgkin-Huxley (HH) model, a current from the outside to theinside was represented as a positive current. In this thesis the most conventionalnotation currently in use, which represents a current from the inside to the outsideas a positive current, is employed [16] (see Figure 1.5).
Two forces move the ions into or out of the cell, namely diffusion force and elec-trical force. For a given type of ion, when these two forces are equal in magnitudebut opposite in sign, the ion is in equilibrium. The equilibrium potential of an ionis called the Nernst potential and is defined as follows [28]:
VK = − R · Tzk · F
log([k]i[k]o
)(1.1)
where VK is the Nernst potential for ion k, R is the gas constant, T is the absolutetemperature, zk is the valence of ion k, F is the Faraday’s constant, [k]i is theintracellular concentration of ion k, and [k]o is the extracellular concentration ofion k. For the diffusion force in the HH model, a voltage source is considered
JesúsCarro

12 New Methodologies for the Developmentand Validation of Electrophysiological Models
and the Nernst potential is used. The ion permeability of the membrane for thedifferent ions is taken into account by defining a conductance per unit area (basedon Ohm’s law) as follows:
GK =Ik
Vm − VK(1.2)
where GK is the membrane conductance per unit area for ion k, Ik is the electriccurrent carried by ion k per unit area, VK is the Nernst potential for ion k and Vm
is the membrane voltage.In the HH model, formulations are correspondent with the fact that each type
of ion passes only through channels that are specific for it. Hodgkin and Huxleyassumed that the opening and closing of the channels are controlled by electricallycharged particles. The probability that one of these particles is in an open statedepends on the membrane voltage. Thus, the ionic conductance for each channelwas defined as the product between the maximal conductance of the channel (aconstant value) and the fraction of particles in the open state. No assumptionon the chemical or anatomical nature of these particles was made [16]. The frac-tion of particles in the open state was mathematically modeled by using ordinarydifferential equations as follows:
dg
dt= αg · (1− g)− βg · g (1.3)
where αg is the transfer rate coefficient for particles from closed to open state, βg isthe transfer rate coefficient for particles from open to closed state, g is the fractionof particles in the open state and (1 − g) is the fraction of particles in the closedstate. By using the previous equation, the steady-state values of the fraction ofparticles in the open state and the constant time needed to reach steady-state canbe obtained:
gss =αg
αg + βg(1.4)
τg =1
αg + βg(1.5)
For a voltage-clamp experiment, the fraction of particles in the open state willfollow the expression:
g(t) = gss + (gss − g0) · e− t
τg (1.6)
where g0 is the fraction of particles in the open state at the beginning of theexperiment.
According to the definition proposed by Hodgkin and Huxley, each channelcan have more than one type of particles and can need more than one particle inthe open state to allow ions to pass through it. For example, in the HH model,potassium channels are formed by four particles of type n, while sodium channelsare formed by three particles of type m and one of type h. The potassium andsodium conductances in the HH model are defined as follows:
GK = GK,max · n4 (1.7)
UniversidadZaragoza

1. Introduction 13
Figure 1.6: Voltage dependence of particles in the potassium channels of the HHmodel. (A) Variation of transfer rate coefficients αn and βn, (B) variation of n andn4 as functions of membrane voltage. Image from [16].
GNa = GNa,max ·m3 · h (1.8)
where GK,max and GNa,max are the maximal conductances of the potassium andsodium channels, respectively.
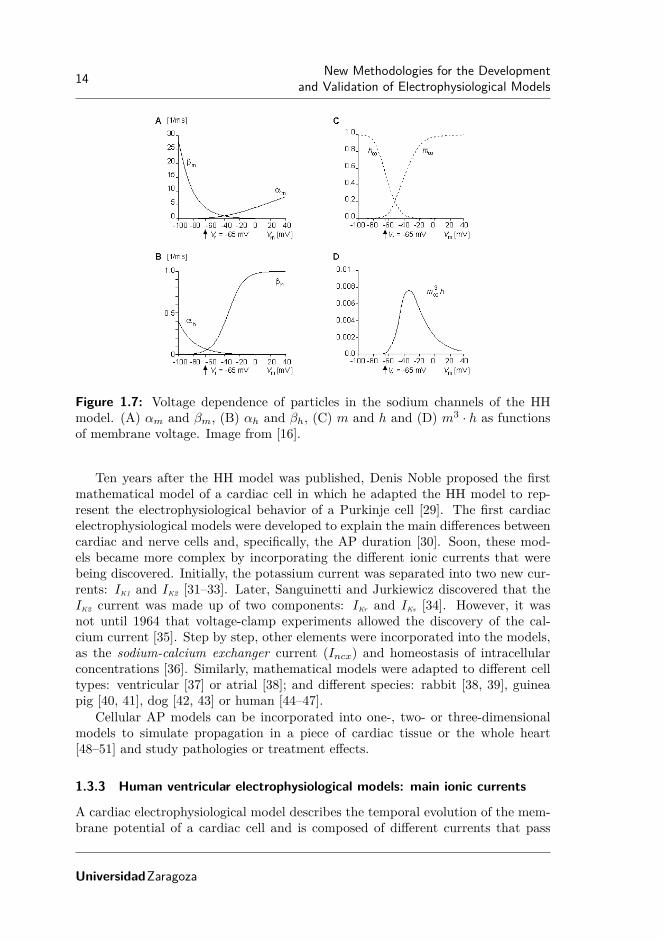
The particles of type n and m are particles of activation. At the resting mem-brane potential they are not in the open state and when voltage increases, thefraction of particles in the open state increases (see Figure 1.6 and Figure 1.7). Onthe other hand, the particles of type h are particles of deactivation. When voltagetends to minus infinity, all the particles are in the open state but when voltageincreases, the fraction of particles in the open state is reduced (see Figure 1.7).
The total transmembrane current density in the HH model is the sum of thecapacitive and ionic currents as follows:
Im = Cm · dVm
dt+ (Vm − VNa) ·GNa + (Vm − VK) ·GK + (Vm − VL) ·GL (1.9)
where Im is the membrane current per unit area; Cm is the membrane capacitanceper unit area; Vm is membrane voltage; VNa, VK and VL are the Nernst potential forsodium, potassium and other ions (leakage voltage), respectively; and GNa, GK andGL are the sodium, potassium and leakage conductances per unit area, respectively.
When the cell is in an open circuit, there cannot be axial current since thereis no potential gradient in the axial direction. Under this situation, the previousequation can be expressed as follows:
dVm
dt= − 1
Cm· ((Vm − VNa) ·GNa + (Vm − VK) ·GK + (Vm − VL) ·GL) (1.10)
1.3.2 Evolution of electrophysiological models for cardiac cells
The formalism introduced by Hodgkin and Huxley continues to be used today andmost electrophysiological models developed after Hodgkin and Huxley, includingcardiac models, follow this formalism.
JesúsCarro
14 New Methodologies for the Developmentand Validation of Electrophysiological Models
Figure 1.7: Voltage dependence of particles in the sodium channels of the HHmodel. (A) αm and βm, (B) αh and βh, (C) m and h and (D) m3 · h as functionsof membrane voltage. Image from [16].
Ten years after the HH model was published, Denis Noble proposed the firstmathematical model of a cardiac cell in which he adapted the HH model to rep-resent the electrophysiological behavior of a Purkinje cell [29]. The first cardiacelectrophysiological models were developed to explain the main differences betweencardiac and nerve cells and, specifically, the AP duration [30]. Soon, these mod-els became more complex by incorporating the different ionic currents that werebeing discovered. Initially, the potassium current was separated into two new cur-rents: IK1 and IK2 [31–33]. Later, Sanguinetti and Jurkiewicz discovered that theIK2 current was made up of two components: IKr and IKs [34]. However, it wasnot until 1964 that voltage-clamp experiments allowed the discovery of the cal-cium current [35]. Step by step, other elements were incorporated into the models,as the sodium-calcium exchanger current (Incx) and homeostasis of intracellularconcentrations [36]. Similarly, mathematical models were adapted to different celltypes: ventricular [37] or atrial [38]; and different species: rabbit [38, 39], guineapig [40, 41], dog [42, 43] or human [44–47].
Cellular AP models can be incorporated into one-, two- or three-dimensionalmodels to simulate propagation in a piece of cardiac tissue or the whole heart[48–51] and study pathologies or treatment effects.
1.3.3 Human ventricular electrophysiological models: main ionic currents
A cardiac electrophysiological model describes the temporal evolution of the mem-brane potential of a cardiac cell and is composed of different currents that pass
UniversidadZaragoza

1. Introduction 15
through the cell membrane. As described for the HH model, these currents aregenerated by the passage of ions through different channels, exchangers and pumpsthat connect the intracellular and the extracellular media. Each current is formu-lated mathematically to represent the various events that occur in relation to thechannels (for example, activation and inactivation of ion channels). These modelsalso include the balance between the intracellular and extracellular ionic concen-trations and between the different compartments of the myocyte. In the case ofhuman ventricular AP models, the most relevant ions are: sodium (Na+), potas-sium (K+) and calcium (Ca2+). While there are many differences between theexisting human ventricular cell models, the main ionic currents are present in allof them. In the following subsections, these currents are described.
Sodium current
The fast sodium current (INa) is the main sodium current in human ventricularcells. There exists also the late sodium current (INaL). Although some studies havesuggested that this late sodium current plays a relevant role only under pathologicalconditions, like LQT3 or HF [52], this is still a matter of debate. In most humanventricular AP models, INa is modeled following the formalism proposed by Hodgkinand Huxley, with three activation gates of type m and two inactivation gates (jand h).
Potassium currents
Four potassium currents are mostly present in human ventricular cell models. Threeof them correspond to voltage-gated ion channels (Kv), whereas the fourth one isan inward rectifying current. Kv channels are the most diverse super-family of ionchannels and have a significant impact on AP shape and duration. Differences inKv channels have been related to the cell type and function, but also to differencesamong various species [52]. These differences highlight the importance of usingdata from human cardiomyocytes for characterization of these currents.
Transient outward potassium current (Ito): This voltage-gated current activatesand inactivates rapidly during the depolarization phase of the action potential. Itcan be divided into two components (Ito,f and Ito,s). Both components activaterapidly following membrane depolarization. On the other hand, Ito,f inactivatesrapidly, whereas Ito,s inactivates slowly. While not all published human ventricularAP models divide the current into two components, all define it with two voltage-dependent gates (one for activation and another one for inactivation). The majordifference between models lies in how they model variability between ventricularcell types: by varying the conductance, by modifying the proportion of the fastand the slow component or by a combination of both.
Rapidly activating delayed rectifier potassium current (IKr): This current ac-tivates upon depolarization and is rapidly inactivated. Its activation is notably
JesúsCarro

16 New Methodologies for the Developmentand Validation of Electrophysiological Models
slower than its inactivation (τact > 100ms, τinact < 20ms) [52]. In recent humanventricular cell models, this current is modeled by using two voltage-dependentgates (one for activation and another one for inactivation) following the HH for-malism.
Slowly activating delayed rectifier potassium current (IKs): This slow compo-nent of the total potassium current is much smaller than IKr and plays a lesssignificant role in modulating the AP duration (APD) [53]. When this current isblocked, and in the absence of sympathetic stimulation, the role played by IKs isrelatively small. However, when ventricular repolarization reserve is attenuated,the role of this current in limiting AP prolongation becomes significant [54]. Thiscurrent is generally modeled using the HH formalism with two voltage-dependentactivation gates. In most models, the two voltage-dependent gates are equal.
Inward rectifier potassium current (IK1): This current is present in all ventricularand atrial myocytes and plays a major role in AP repolarization [55]. It is usuallymodeled using the HH formalism with one voltage-dependent and time-independentgate.
Calcium current
The L-type calcium current (ICaL) is the principal current for the entry of calciumin cardiac cells. It is typically modeled using the Goldman-Hodgkin-Katz equation.This current plays an important role during the plateau phase of the AP and inmodulating the APD and the repolarization shape. The L-type calcium channelsare commonly modeled by a voltage-dependent activation gate (d), one or morevoltage-dependent inactivation gates (f , f2) and calcium-dependent inactivationgates.
Pumps and exchangers
The above described currents correspond to currents associated with the ions pass-ing through ion channels without requiring energy expenditure. However, thereare also currents in the cell caused by the movement of ions against gradient thatrequire ATP consumption (pumps) or by using the force of ions that pass in thedirection of the gradient (exchangers). Two of these types of currents, namely thesodium-potassium pump current and the sodium-calcium exchanger current, arepresent in most human ventricular cell models.
Sodium-potassium pump current (INaK): The sodium-potassium pump current isthe principal mechanism for active ion transport across the membrane of excitablecells [56]. In addition, it plays an important role in regulating cardiac electrophys-iology under physiological and pathological conditions. Two schemes have becomepredominant for modeling this current: the first one proposed by Di Francescoand Noble in their seminal work [36] and the second one described in the work by
UniversidadZaragoza

1. Introduction 17
Luo and Rudy [57]. The DiFrancesco–Noble formulation is used in the majorityof models of the specialized conduction system (sinoatrial node and Purkinje fibermodels), whereas the Luo–Rudy formulation is common in mathematical modelsof atrial and ventricular cardiac myocytes.
Sodium-calcium exchanger current (Incx): The sodium-calcium exchanger playsan important role in the regulation of intracellular calcium concentration ([Ca2+]i).This exchanger current regulates muscle relaxation in cardiac myocytes [58]. It isusually modeled following the formulation proposed by Mullins [59] and simplifiedby DiFrancesco and Noble [36]. In this formulation, the Incx current is modeledas a time-independent current, with the value of the current being dependent onthe intracellular and the extracellular concentrations of Na+ and Ca2+ ions andon the membrane potential.
1.3.4 Human ventricular electrophysiological models: recent developments
In recent years a number of mathematical models of electrical and ionic homeostasisin human ventricular myocytes have been proposed. One of the most extensivelyused models is that proposed by ten Tusscher-Panfilov (TP06) [51], which is animproved version of the ten Tusscher-Nobel-Nobel-Panfilov (TNNP04) model [46],in which the calcium dynamics, the slow delayed rectifier potassium current (IKs)and the L-type calcium current (ICaL) were reformulated. Both the TNNP04 andthe TP06 models are based on experimental human data for most of the main ioniccurrents. One of the major advantages of the TP06 model over previous humanventricular models is that it accurately reproduces restitution of the APD. On theother hand, the TP06 model presents the major shortcomings of being insensitiveto changes in certain ionic current densities [60] and of inadequately representingrate dependence of intracellular calcium levels [12].
Another relevant model of human ventricular cells was proposed by Iyer et al.(IMW04) [45]. This model provides a detailed description of calcium homeostasisand reproduces diverse aspects of the excitation-contraction coupling (ECC). How-ever, important limitations have been reported for this model, including the factthat it is extremely sensitive to variations in INaK and IK1 current densities [60]. Italso produces quite long APs and relatively flat restitution curves in tissue [61]. Inaddition, the most relevant ionic currents in the IMW04 model are described usingMarkovian chains, with the consequent increase in complexity (more than 60 statevariables). Serious restrictions on the size of the time step required for stabilityand increments in the overall computational time when using this model in tissuesimulations have been reported [61].
When the work of this thesis was started, a new model of human ventricularAP had just been proposed by Grandi et al. (GPB) [15]. The development of thismodel departs from the rabbit ECC model proposed by Shannon et al. [62], whichincludes the subsarcolemmal and junctional compartments in the formulation ofthe currents and provides a detailed description of calcium handling. The GPBmodel includes new definitions of ionic current densities and kinetics according to
JesúsCarro

18 New Methodologies for the Developmentand Validation of Electrophysiological Models
experimental data on human myocytes that had been recently collected. This modelis defined for two types of cells, namely endocardial and epicardial. These two celltypes differ only by the maximal conductivity of the fast and slow components ofthe transient outward potassium current (Ito). The GPB model improves the APresponse to frequency changes and offers a better performance against blockadesof potassium currents (IK1, IKs and IKr) with respect to the TP06 model. Themajor drawback of the GPB model is that it does not adequately reproduce S1S2restitution properties nor APD rate adaptation dynamics. These drawbacks can beattributed to the fact that the GPB model was developed from a rabbit ventricularmodel and the characteristics of S1S2 restitution and APD rate adaptation arenotably different in the two species.
Parallel to the development of this thesis, O’Hara et al. proposed the O’Hara-Virág-Varró-Rudy dynamic (ORd) model [63]. This new ventricular cell model isbased on the most extensive dataset of undiseased human cells. Data from morethan 100 undiseased human hearts were used to characterize the steady-state ratedependence and restitution of the ventricular AP. The model was also evaluatedunder the effect of drugs that selectively block different channels, like mexiletine,ryanodine, nisoldipine and E-4031. As it will be discussed later, the complexityof this model is greater than that of previous models. The major drawback ofthe ORd model regards the rate dependence of the intracellular calcium ([Ca2+]i):While under physiological conditions [Ca2+]i has been experimentally reported toincrease by around 30% with frequency, in the ORd model it increases by around300%.
In 2015, Himeno et al. proposed a new human ventricular membrane excitation-contraction model [64]. The Himeno et al. model included a more detailed descrip-tion of the excitation-contraction coupling than previously described models andwas proved to reproduce membrane excitation and calcium-induced calcium-releasecharacteristics.
The model comparison presented in this thesis is restricted to the electrophys-iological models TP06, IMW04, GPB and ORd. Table 1.1 presents a summary ofthe main differences between those four electrophysiological models.
1.3.5 The Grandi-Pasqualini-Bers model
When the work of this thesis was started, the most detailed and recent humanventricular cell model published in the literature was the GPB model. Since theobjective of the thesis was to use computational modeling and simulation for theinvestigation of ventricular arrhythmias under ischemic conditions, the GPB modelwas taken as a starting point. After performing an in-depth evaluation on theability of this model to represent experimental behavior in relation to a numberof electrophysiological properties, the necessity to update the GPB model for thestudy of arrhythmias was identified. In this thesis different methodologies for thedevelopment and validation of a cardiac electrophysiological model are introducedand applied to update the GPB model. In this section a detailed description of theGPB model is presented.
UniversidadZaragoza

1. Introduction 19
TP06 IMW04 GPB ORd♯ State
variables20 67 38 41
Computationtime
Short Very long Long Long
Cell types Endo, mid,epi
Epi Endo, epi Endo, mid,epi
Steady-stateAP properties
PhysiologicalAPD values,very low trian-gulation
PhysiologicalAPD valuesand triangula-tion
PhysiologicalAPD valuesand triangula-tion
Short APDvalues, butphysiologicaltriangulation
Steady-statecalcium levels
Low diastolicand systolicvalues
Low diastolicand systolicvalues
Very low di-astolic andsystolic values
Low diastolicand systolicvalues
APD90 adap-tation to
abrupt heartrate changes
Very fast Very slow Rabbit char-acteristics
Physiologicalbehavior
Sodium andcalcium ratedependence
Very sensitiveto increasingstimulationfrequency
Physiologicalbehavior
Physiologicalbehavior
Very sensitiveto increasingstimulationfrequency
APD sen-sitivity tovariations
in ionic cur-rent densities
Lowly sensi-tive to INaK ,INa,Ca, IKs, IK1,ICaL, IKr andINa
Highly sen-sitive to INaK
and IK1
Lowly sensi-tive to IKr andhighly sensi-tive to IK1
Lowly sensi-tive to IK1,ICaL and INa,Ca,and highlysensitive to IKr
Table 1.1: Differences between human ventricular cell models. Data are obtainedfrom [12, 60, 61, 63] and from simulations performed in this thesis.
JesúsCarro

20 New Methodologies for the Developmentand Validation of Electrophysiological Models
The GPB model describes the AP of endocardial and epicardial human my-ocytes. For both cell types, the total transmembrane ionic current, Iion, is givenby:
Iion = INatot + ICltot + ICatot + IKtot ,
where each of the individual currents denotes the current generated by the passageof sodium, chlorine, calcium and potassium ions, respectively, through the cellmembrane.
Sodium current. Following the approach of Shannon et al. [62], the sodiumcurrent was divided into two components: i) a subsarcolemmal component; andii) a junctional component. These correspond to the cell compartments where thecurrent is generated. Both components are formed by the same subcurrents:
INatotjunc= INajunc + INa,bkjunc + 3 · Incxjunc
+ 3 · INaKjunc + ICaNajunc
INatotsl= INasl + INa,bksl + 3 · Incxsl
+ 3 · INaKsl + ICaNasl
INatot = INatotjunc+ INatotsl
where INa is the fast sodium current, INa,bk is the background sodium current, Incxis the current of the sodium-calcium exchanger, INaK is the current of the sodium-potassium pump and ICaNa is the sodium current through the L-type calcium chan-nels.
Chlorine current. The chlorine current is not present in other previously pub-lished models like TP06 or TP04. In the GPB model this current is describedby:
ICltot = IClCa + ICl,bk
where IClCa is the calcium-activated chlorine current and ICl,bk is the backgroundchlorine current.
Calcium current. The calcium current, as in the case of the sodium current,has two components, junctional and subsarcolemmal:
ICatotjunc= ICajunc + ICa,bkjunc + IpCajunc − 2 · Incxjunc
ICatotsl= ICasl + ICa,bksl + IpCasl − 2 · Incxsl
ICatot = ICatotjunc+ ICatotsl
where ICa is the calcium current through the L-type calcium channels, ICa,bk is thebackground calcium current, IpCa is the sarcolemmal calcium pump current andIncx is the current of the sodium-calcium exchanger.
Potassium current. The potassium current is defined as follows:
IKtot = Ito + IKr + IKs + IK1 − 2 · INaK + ICaK + IKp
where Ito is the transient outward potassium current (decomposed into a fastand a slow component), IKr is the rapidly activating potassium current, IKs isthe slowly activating potassium current (decomposed into junctional and subsar-colemmal components), IK1 is the inward rectifier potassium current, INaK is the
UniversidadZaragoza

1. Introduction 21
current of the sodium-potassium pump (decomposed into junctional and subsar-colemmal components), ICaK is the potassium current through the L-type calciumchannels (decomposed into junctional and subsarcolemmal components) and IKp isthe plateau potassium current. In the GPB model, differentiation between endo-cardial and epicardial cells is set by assigning different contributions to the fastand slow Ito components.
1.3.6 Acute ischemia models
Over the past 20 years, a large number of investigations have been devoted tothe study of cardiac ischemia using mathematical modeling and simulation. Thesecomputational techniques have become a useful tool in analyzing electrophysiologychanges associated with myocardial ischemia and the predisposition to ventriculararrhythmias [65]. In one of the first works by Ferrero et al. [66], the authors studiedhow ischemia-induced metabolic changes altered the electrophysiological behaviorof cardiac tissue. This study used two-dimensional tissues, as other subsequentstudies [67]. The presented research was later extended to account for heterogeneitycaused by ischemia [68], realistic fiber orientation and transmural heterogeneity[69, 70]. The effect of reduced repolarization reserve in increasing arrhythmic riskin the highly heterogeneous substrate caused by acute myocardial ischemia wasinvestigated in a recent study [71].
At the cellular level, AP is modeled under acute myocardial ischemia by addingthree main effects to the ventricular electrophysiological models: hyperkalemia,hypoxia and acidosis. Hyperkalemia is simulated by increasing extracellular potas-sium to levels around 10 mM, in line with experimental reports [72]. Hypoxia issimulated by adding the ATP-sensitive potassium current (IKATP ), a current dis-covered by Noma [73]. When distribution of oxygen is reduced, the cell is not ableto generate ATP from ADP. In association with this, the ATP concentration inthe cell is reduced and IKATP channels open. Finally, acidosis is usually modeledby a reduction in the ionic conductances of INa and ICaL currents according to theexperimental results of [66, 74]. While all three effects are present during acutemyocardial ischemia, hyperkalemia has been suggested to play the most relevantrole.
For simulation of acute myocardial ischemia, a range of spatial scales may needto be considered. To investigate the increase in the effective refractory period orthe decrease in the conduction velocity under ischemic conditions, one-, two- orthree-dimensional tissues should be simulated. The study of reentrant patternsand vulnerable windows in acutely ischemic ventricles would benefit from analysisperformed in a three-dimensional space. In this case, an ischemic region could beplaced in a bi-ventricular model, which would include fiber orientation. Accordingto the experimental findings from Coronel et al. [72], the ischemic region would becomposed of a normal zone (NZ), transitional border zones (BZ) and the centralischemic zone (CZ). BZ could be simulated by considering a linear variation in theelectrophysiological properties between NZ and CZ, in line with experiments [72].For these simulations, an important consideration regards the washed zone in the
JesúsCarro

22 New Methodologies for the Developmentand Validation of Electrophysiological Models
endocardium (not affected by ischemia) as a result of the interaction between theblood inside the ventricle and the endocardial tissue [23]. In this complex scenario,the selection of the AP model is crucial. An AP model that is able to reproducecardiac electrophysiological behavior under acute myocardial ischemia will be ofutmost importance to investigate the vulnerability to ventricular arrhythmias andto elucidate the underlying mechanisms.
1.4 Objectives and Outline of the Thesis
1.4.1 Aim of the thesis
The main objective of this thesis is the proposal of novel methodologies to improvethe development and validation of cardiac computational models. In particular,this thesis focused on building a human ventricular cell model able to representexperimental evidences regarding a range of electrophysiological properties, whichincluded well-established markers of arrhythmic risk. The developed model couldthus be used to investigate ventricular arrhythmias and, in particular, those arisingunder conditions of hyperkalemia, a component of myocardial ischemia.
As described at the beginning of this general introduction, mathematical model-ing and simulation of cardiac electrical activity provides an ideal framework whereto join clinical data and experimental observations to gain understanding of car-diac electrophysiology and underlying mechanisms. The use of cardiac modelingand simulation in combination with other techniques, such as signal processing ofcardiac electrical signals, can be a powerful tool to aid in the prevention of cardiacarrhythmias as well as in the improvement of their diagnosis and therapy.
To this end, it is of major relevance to have cardiac computational models ableto reproduce available clinical and experimental evidences. Cardiac AP modelsare a key element in the development of whole-heart in silico models. The morefaithfully the AP model replicates experimental behavior, the more useful it willbe for investigation of whole-heart cardiac electrical activity and the generation ofarrhythmias.
1.4.2 Specific objectives
The general objectives of this thesis are:
• To propose new methodologies for the development and validation of elec-trophysiological models: During the development of a cardiac computationalmodel, many simplifications have to be commonly made. Different parts ofthe model are usually isolated and the parameters of each of those partsare adjusted to experimentally measured values. The increase in computa-tional capacity now allows consideration of a higher number of elements inthe development process, which could help in the reduction of the referredsimplifications. In particular, the following scenarios have been considered inthis thesis:
UniversidadZaragoza

1. Introduction 23
– Considering the entire model of an ionic current when adjusting modelparameters describing that current: When modeling the behavior of anionic current in an electrophysiological model, different elements of theionic current model are considered independently of each other and eachof them is adjusted to fit specific experimental data. While in manycases this approach can provide acceptable results, in the case of highlycomplex models, the interactions between different elements of the ioniccurrent model may become very relevant. One of the objectives of thisthesis is to investigate and propose methods that allow considering possi-ble interactions of the different model components when adjusting ionicmodel parameters to replicate available experimental measurements.
– Considering simultaneously all of the ionic current conductances whenidentifying conductance values of a cellular model: One of the most im-portant parts in the development of a cardiac computational model isthe determination of ionic conductance values. Since many ionic conduc-tances cannot be directly measured, their values are usually identifiedindependently to fit experimental measures of a number of electrophys-iological properties. One of the limitations of adjusting conductancevalues one-at-a-time is that potential cross-effects are neglected. Forthis reason, one of the objectives of this thesis is to develop techniquesthat allow selecting cardiac ionic conductance values by concurrentlyconsidering all of them and accounting for cross-effects.
– Considering differences between simulations in isolated cells and in tis-sue to fit available experimental data as closely as possible: Due to thesensitivity of some ionic currents to the process of cell isolation, it iscommon practice to perform some electrophysiology experiments usingsmall pieces of tissue. Due to computational reasons, most of the adjust-ments in cardiac AP models are performed using simulations at singlecell level. One of the objectives of this thesis is to compare electrophys-iological properties measured in isolated cells and tissues and proposemethods to account for the evaluated differences when developing andvalidating a cardiac computational model.
• To apply the proposed methodologies for development and validation of ahuman ventricular AP model: In recent years, several human ventricular APmodels have been proposed in association with the increase in the availabilityof experimental data. However, while available data increases, the models arelimited in representing certain physiological properties. An objective of thisthesis is to incorporate the new proposed techniques described above to theupdate of a human ventricular AP model able to replicate the experimentallyreported electrophysiological characteristics as faithfully as possible.
1.4.3 Outline of the thesis
This thesis is organized as follows:
JesúsCarro

24 New Methodologies for the Developmentand Validation of Electrophysiological Models
• Chapter 2 describes an initial analysis of the GPB model and a first pro-posal to update it so as to obtain a human ventricular AP model that bet-ter replicates experimental measures of a set of relevant electrophysiologicalproperties. The GPB model was analyzed for the purpose of investigatingelectrophysiological markers related to risk for ventricular arrhythmias, inparticular occurring under the setting of severe hyperkalemia, a componentof myocardial ischemia. After evaluating the model, the necessity to update itto solve issues related to electrophysiological phenomena like APD rate adap-tation to abrupt frequency changes was identified. The update of the GPBmodel, denoted as the CRLP model, was first presented at the CinC Confer-ence and published in the conference proceedings, while a full analysis of theupdated model, including evaluation of its performance under hyperkalaemicconditions, was published in a scientific journal:
– J. Carro, J. F. Rodríguez Matas, P. Laguna, E. Pueyo. Analysis andImprovement of a Human Ventricular Cell Model for Investigation ofCardiac Arrhythmias. XXXVII International Conference on Computersin Cardiology, Belfast (UK), pp. 817 - 820 (Sep, 2010).
– J. Carro, J. F. Rodríguez, P. Laguna, E. Pueyo. A Human Ventric-ular Cell Model for Investigation of Cardiac Arrhythmias under Hy-perkalaemic Conditions. Phil Trans A, n. 639, pp. 4205 - 4232 (Nov,2011).
• Chapter 3 presents a methodology to adjust the ionic conductances of a car-diac computational model by considering electrophysiological markers as con-straints. The need for such an algorithm came from the fact that, after eval-uation of the CRLP model developed in chapter 2, additional characteristicswere determined to be necessary for investigation of cardiac arrhythmias.Specifically, in chapter 3, intracellular potassium dynamics were introducedinto the CRLP model developed in chapter 2 to further investigate arrhyth-mias arising in the context of hyperkalemic conditions. To avoid the im-balance in the total potassium current arising after introducing intracellularpotassium dynamics, a new algorithm was proposed to adjust ionic currentconductances of the updated computational model in such a way that repre-sentation of experimentally measured electrophysiological markers was eitherimproved or at least maintained with respect to the model before the update.The initial results of this chapter were presented at a scientific conference.The final algorithm with illustration of its application to the study of condi-tions involving large changes in potassium concentration was published in aninternational journal:
– J. Carro, J. F. Rodríguez Matas, E. Pueyo, A Response Surface Opti-mization approach to adjust ionic current conductances of cardiac elec-trophysiological models, in Gordon Research Conference in Cardiac Ar-rhythmia Mechanisms, Lucca, Italy, 2015.
UniversidadZaragoza

1. Introduction 25
– J. Carro, E. Pueyo, J. F. Rodríguez. A response surface optimizationapproach to adjust ionic current conductances of cardiac electrophysi-ological models. Application to the study of potassium level changes.PLoS One, 13 (10), pp. e0204411, 2018.
• In Chapter 4, limitations in the development and validation of electrophysio-logical models caused by differences between the experimental protocols andthe performed simulations are analyzed. In the development and validationof new AP models, available experimental data is readily used for model pa-rameter fitting or for comparison between simulated and experimental mea-surements. In this chapter, experimental protocols were simulated in silico intwo scenarios involving scales ranging from ion channels to tissue. This studyallowed us to assess the effects of the interactions between model variableswhile avoiding modeling inconsistencies. Partial results of this chapter, inparticular those related to the first analyzed scenario, were presented at aninternational conference and published in the conference proceeedings, whilethe complete study evaluating both scenarios was published in a scientificjournal:
– J. Carro, J. F. Rodríguez-Matas, V. Monasterio, E. Pueyo. Limita-tions in electrophysiological model development and validation caused bydifferences between simulations and experimental protocols. Progress inBiophysics and Molecular Biology, vol 129, pp. 53 - 64, (Oct, 2017).
– J. Carro, J. F. Rodríguez Matas, E. Pueyo. In Silico Simulations ofExperimental Protocols for Cardiac Modeling. XXXVI Annual Inter-national Conference of the IEEE Engineering in Medicine and BiologySociety, Chicago (USA), pp. 5695 - 5698 (Aug, 2014).
• In Chapter 5, a modification of the calcium current formulation in the CRLPmodel is proposed to render an AP morphology closer to experimental evi-dences, particularly regarding the typical peak-and-dome shape just beforethe plateau phase of the AP. Based on the results obtained in Chapter 4,rather than directly comparing experimental and model characterizations, insilico simulations of the experimental protocols were used to adjust the newversion of the model. To do that, the algorithm proposed in Chapter 3 wasadapted to update model expressions at the ionic level. In addition, a newvalidation process considering the entire cell was described. The obtainedresults were presented at two international conferences:
– J. Carro, J. F. Rodríguez Matas, and E. Pueyo, A Methodology toImprove Human Ventricular Models for the Investigation of CardiacArrhythmias, in 61st Annual Meeting of the Biophysical Society, NewOrleans, USA, 2017.
– J. Carro, J. F. Rodríguez Matas, and E. Pueyo, Multiscale Methodsfor Definition of Ionic Variables in Electrophysiological Models, in Eu-ropean Medical and Biological Engineering Conference (EMBEC) Tam-pere, Finland, 2017.
JesúsCarro

26 New Methodologies for the Developmentand Validation of Electrophysiological Models
• Chapter 6 presents the final update of the model. All the modifications ap-plied to the CRLP model proposed in chapter 2, which were described inChapters 3 and 5, were considered and the optimization algorithm proposedin Chapter 3 was used to adjust ionic current conductances and calcium han-dling characteristics after incorporation of all the updates. In this chapterthe optimization function was redefined and a large number of experimentaldatasets recorded from undiseased human ventricular cells or tissues wereused. Based on the results obtained in Chapter 4, only those electrophysio-logical markers whose values were comparable when evaluated in simulatedsingle cells and tissues were considered, as some of the experimental data hadbeen recorded in tissue and simulations were run in isolated cells. Additionalelectrophysiological markers were used for validation purposes by comparingexperimental data with tissue simulation results. The results of this chap-ter are part of a paper that is in preparation and will be submitted to aninternational journal.
• Finally, Chapter 7 presents the most important conclusions of the thesis anddiscusses possible future research lines.
UniversidadZaragoza
Chapter 2
A New Paradigm forElectrophysiologicalModel Development
2.1 Introduction
Despite the fact that the human ventricular AP models currently available in theliterature are able to reproduce certain electrophysiological properties observed ex-perimentally, they fail in representing other relevant aspects, as pointed out inChapter1. To obtain a model suitable for the study of human ventricular electro-physiology, with a focus on the investigation of ventricular arrhythmias, in thischapter a human ventricular AP model was developed departing from the GPBmodel. The methodology proposed for model development was based on the compu-tation of well-established electrophysiological markers and the results of a sensitiv-ity analysis of the modulation of those markers by variations in the characteristicsof major ionic currents. Using that methodology key limitations of the GPB modelwere unraveled and inadequacies in the definitions of specific ionic current charac-teristics were identified. Based on those findings, gating kinetics of the ICaL currentwere reformulated by introducing both fast and slow voltage-dependent inactivationgates [51], maximal INaK was reduced to best match experimental APD90 rate adap-tation data, and the IK1 current was redefined by accounting for recent experimentaldata published in the literature [75]. The new developed model, herein denoted byCRLP, was tested and compared with the original GPB model and with the widelyused TP06 model. Model comparison was based on twelve cellular electrophysi-ological markers computed using five different stimulation protocols, as in [12].Our results show that the introduced modifications brought most markers into thephysiological range, and considerably improved others with respect to the GPB and
27

28 New Methodologies for the Developmentand Validation of Electrophysiological Models
TP06 models. In addition, the CRLP model was tested by simulating hyperkalemicconditions in tissue. Under those conditions, potassium starts to pour out of is-chemic myocardial cells causing depolarization of the myocardium at rest, slowingconduction and decreasing excitability. Recovery of excitability is known to out-last repolarization, a phenomenon termed post-repolarization refractoriness. Ourresults show that under hyperkalemia APD90 progressively decreased with the levelof extracellular potassium, [K+]o, whereas the effective refractory period (ERP)increased after a threshold in the level of [K+]o was surpassed. Conduction veloc-ity (CV) decreased with [K+]o and conduction was blocked above [K+]o = 10.4mM. Additionally, APD90 alternans appeared for [K+]o > 9.8 mM. These resultssuggest that the model is suitable to represent areas of inhomogeneities of restingpotential and dispersion in recovery of excitability corresponding to different hy-perkalemic levels within the tissue. Those areas of inhomogeneities could providea setting for unidirectional block that could become the substrate for arrhythmiasin ischemic hearts.
2.2 Methods
Electrophysiological markers were used in this study to guide the modificationsapplied onto the GPB model to generate the proposed CRLP model. Specifically,markers related to S1S2 restitution and APD90 rate adaptation dynamics wereidentified as not being adequately reproduced by the GPB model and appropriatemodifications were performed. Those and other markers were also used to evaluatethe performance of the CRLP model and to compare it with that of the TP06 andGPB models.
In the following subsections, the cellular electrophysiological markers used inthis study are presented, and the protocols used to compute them are described.
2.2.1 Selected markers
• APD90: APD was traditionally considered as the main preclinical marker ofdrug cardiotoxicity. APD prolongation was linked to long QT syndrome andincreased risk of developing Torsades de Pointes [76, 77]. APD90 was used inthis study to denote AP duration at 90% repolarization (Figure 2.1.a)).
• Triangulation: This marker quantifies the shape of the final part of the APand was calculated as the difference between APD at 50% and 90% repolar-ization (Figure 2.1.a)). Low triangulation values indicate square APs, whilehigh values indicate triangular APs. Triangulation was proposed as a markerof pro-arrhythmia [76], with long APD90 values without triangular APs con-sidered as anti-arrhythmic, and triangular APs considered as pro-arrhythmicin general.
• Systolic and diastolic intracellular calcium ([Ca2+]i) levels: Calcium transientproperties evaluated at different frequencies was reported as risk markers
UniversidadZaragoza

2. A New Paradigm for Electrophysiological Model Development 29
[78, 79]. In this study, diastolic (level at rest) and systolic (level at peak)calcium transient levels were evaluated at 0.5 Hz and 1 Hz (Figure 2.1.b)).
• Time constants of APD90 adaptation to abrupt changes in CL: Adaptationof ventricular repolarization duration to abrupt changes in cycle length (CL)was proposed as an arrhythmic risk marker [80]. In this study, the dynamicsof APD90 adaptation to abrupt changes in CL were fitted by two exponentialswith associated time constants τfast and τslow (Figure 2.1.c)), following themethodology proposed in [13].
• Maximum slope of APD90 restitution curves: The maximum slope of theAPD90 restitution (APDR) curve was suggested as an arrhythmic risk marker[81, 82]. The APDR curve describes the relationship between APD90 and thediastolic interval (DI) (Figures 2.1.d)-e)). In this study APDR was evaluatedusing the S1S2 and the dynamic protocols (see Section 2.2.2).
• Rate dependence of Na+ and Ca2+ concentrations: The importance of in-tracellular sodium, [Na+]i, and intracellular calcium, [Ca2+]i, dynamics inarrhythmogenesis was extensively reported [83, 84]. In this study, systolic[Na+]i and [Ca2+]i levels were evaluated for increasing stimulation frequen-cies (Figure 2.1.f)).
2.2.2 Stimulation Protocols
Five stimulation protocols were applied to evaluate the electrophysiological markerspresented in section 2.2.
• Steady-state protocol: A train of 3,000 stimulation pulses was delivered andsteady-state was guaranteed to be reached. Simulations were carried outusing two different CL values (1,000 and 2,000 ms). The evaluated markerswere: APD90 at 1 Hz, Triangulation at 1 Hz, Systolic [Ca2+]i at 0.5 and 1Hz, and Diastolic [Ca2+]i at 0.5 and 1 Hz (Figures 2.1.a) and 2.1.b)).
• Abrupt changes in CL protocol: The cell was stimulated with a CL of 1,000ms for 8 minutes, then with a CL of 600 ms for additional 8 minutes andfinally with a CL of 1,000 ms for 8 minutes (Figure 2.1.c)). The APD90
dynamics after the first abrupt CL change were fitted by two exponentialswith time constants τfast and τslow. APD90 adaptation dynamics after thesecond abrupt CL change provided very similar results to those obtained forthe first CL change, in accordance with [12, 13], and were not reported.
• S1S2 protocol: A train of 10 basic stimulations (S1) was applied to the cellor tissue at a CL of 1,000 ms followed by an extra stimulus (S2) delivered atcoupling intervals (CI) ranging from 1,000 to 250 ms in variable steps (100 msfor DI>300 ms, 5 ms for 150<DI<300 ms, and 1 ms for 5<DI<150 ms). TheS1S2 restitution curve was obtained by plotting the APD90 corresponding tothe extra stimulus versus the previous DI for each of the tested CI values(Figure 2.1.d)).
JesúsCarro

30 New Methodologies for the Developmentand Validation of Electrophysiological Models
a)
0 100 200 300 400 500
−50
0
50
Time (ms)
Vm
(mV
)
Steady-State AP Shape
APD90
APD50
Triangulation
b)
0 200 400 6000
0.2
0.4
0.6
Time (ms)
[Ca
2+] i
(µM
)
Steady-State [Ca2+] i Properti es
dia
[Ca
2+] i
sys
[Ca
2+] i
c)
0 5 10 15 20260
280
300
APD Rate Adaptation
Time (min)
AP
D90
(ms)
τslow
τfast
d)
0 200 400 600 800240
260
280
300
S1S2
DI (ms)
AP
D90
(ms)
e)
0 200 400 600 800
200
250
300
Dynamic
DI (ms)
AP
D90
(ms)
f)
0.5 1 1.5 2 2.5 3
100
120
140
Rate Dependence
Frequency (Hz)
Syst
oli
c[C
a2+] i
(%)
maxim
um
Figure 2.1: Graphical description (using simulation results) of the markers ofarrhythmic risk used in this study: a) Steady-state AP properties (APD90, APtriangulation); b) Steady-state [Ca2+]i properties (systolic ‘sys’ and diastolic ‘dia’values); c) APD90 daptation to abrupt changes in CL (from 1,000 ms to 600 msand again to 1,000 ms), characterized by time constants τfast and τslow; d) APDRcurve computed using the S1S2 protocol; e) APDR curve computed using thedynamic protocol; f) Normalized rate dependence of systolic concentrations, withnormalization performed with respect to the lowest tested frequency, i.e. 0.25 Hz.For a better understanding of the protocols used to compute the markers shown inpanels a)-f), see the description provided in section 2.2.2.
UniversidadZaragoza
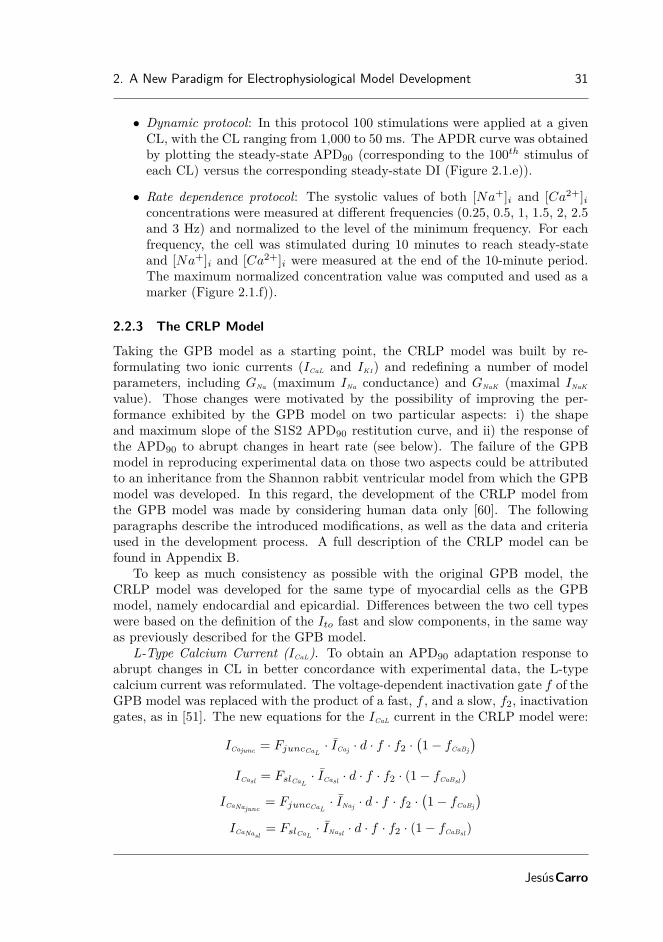
2. A New Paradigm for Electrophysiological Model Development 31
• Dynamic protocol: In this protocol 100 stimulations were applied at a givenCL, with the CL ranging from 1,000 to 50 ms. The APDR curve was obtainedby plotting the steady-state APD90 (corresponding to the 100th stimulus ofeach CL) versus the corresponding steady-state DI (Figure 2.1.e)).
• Rate dependence protocol: The systolic values of both [Na+]i and [Ca2+]iconcentrations were measured at different frequencies (0.25, 0.5, 1, 1.5, 2, 2.5and 3 Hz) and normalized to the level of the minimum frequency. For eachfrequency, the cell was stimulated during 10 minutes to reach steady-stateand [Na+]i and [Ca2+]i were measured at the end of the 10-minute period.The maximum normalized concentration value was computed and used as amarker (Figure 2.1.f)).
2.2.3 The CRLP Model
Taking the GPB model as a starting point, the CRLP model was built by re-formulating two ionic currents (ICaL and IK1) and redefining a number of modelparameters, including GNa (maximum INa conductance) and GNaK (maximal INaK
value). Those changes were motivated by the possibility of improving the per-formance exhibited by the GPB model on two particular aspects: i) the shapeand maximum slope of the S1S2 APD90 restitution curve, and ii) the response ofthe APD90 to abrupt changes in heart rate (see below). The failure of the GPBmodel in reproducing experimental data on those two aspects could be attributedto an inheritance from the Shannon rabbit ventricular model from which the GPBmodel was developed. In this regard, the development of the CRLP model fromthe GPB model was made by considering human data only [60]. The followingparagraphs describe the introduced modifications, as well as the data and criteriaused in the development process. A full description of the CRLP model can befound in Appendix B.
To keep as much consistency as possible with the original GPB model, theCRLP model was developed for the same type of myocardial cells as the GPBmodel, namely endocardial and epicardial. Differences between the two cell typeswere based on the definition of the Ito fast and slow components, in the same wayas previously described for the GPB model.
L-Type Calcium Current (ICaL). To obtain an APD90 adaptation response toabrupt changes in CL in better concordance with experimental data, the L-typecalcium current was reformulated. The voltage-dependent inactivation gate f of theGPB model was replaced with the product of a fast, f , and a slow, f2, inactivationgates, as in [51]. The new equations for the ICaL current in the CRLP model were:
ICajunc = FjuncCaL· ICaj · d · f · f2 ·
(1− fCaBj
)ICasl = FslCaL
· ICasl · d · f · f2 · (1− fCaBsl)
ICaNajunc= FjuncCaL
· INaj · d · f · f2 ·(1− fCaBj
)ICaNasl
= FslCaL· INasl · d · f · f2 · (1− fCaBsl)
JesúsCarro

32 New Methodologies for the Developmentand Validation of Electrophysiological Models
ICaK = IK · d · f · f2 ·(FjuncCaL
·(1− fCaBj
)+ FslCaL
· (1− fCaBsl))
ICa = ICajunc + ICasl
ICaNa = ICaNajunc+ ICaNasl
ICaL = ICa + ICaK + ICaNa
As indicated in [60], the replacement of one current component by anotherone is not a simple task. Splitting the f gate in the GPB model into two newgates required the readjustment of the time constants τf2 associated with the slowvoltage-dependent inactivation gate f2 and the time constant τd associated withthe activation gate d in order to obtain a meaningful ICaL current-voltage curve(splitting the f gate without readjusting the time constants would have led to acurrent-voltage curve having two relative minima).
Readjustment of τf2 was based on available experimental data [2, 4–7]. Fig-ure 2.2.a) depicts τf and τf2 along with experimental data [2, 4–7]. Since theexperimental data does not cover the entire voltage range, the readjustment wasperformed by best fitting the tail of the τf2 curve while obtaining a current-voltagecurve within the range of experimental data. The other voltage-dependent inacti-vation time constant, τf , was kept as in [51]. The equations describing f and f2were:
fss =1
1 + eVm+20
7
αf = 1102.5 · e−(Vm+27
15 )2
βf =200
1 + e13−Vm
10
γf =180
1 + eVm+30
10
+ 20
τf = αf + βf + γf
dfdt =
fss − f
τf
f2ss =0.67
1 + eVm+35
7
+ 0.33
αf2 = 300 · e−(Vm+25)2
170
βf2 =31
1 + e25−Vm
10
γf2 =16
1 + eVm+30
10
UniversidadZaragoza

2. A New Paradigm for Electrophysiological Model Development 33
τf2 = αf2 + βf2 + γf2
df2dt =
f2ss − f2τf2
where Vm denotes transmembrane voltage.Readjustment of τd was based on the description provided in [51]:
dss =1
1 + e−(Vm+5)
6
αd =1.4
1 + e−35−Vm
13
+ 0.25
βd =1.4
1 + eVm+5
5
γd =1
1 + e50−Vm
20
τd = αd · βd + γd
dddt =
dss − d
τd
The definitions of the calcium-dependent inactivation gates, fCaBj and fCaBsl ,were taken as in the GPB model:
dfCaBj
dt = 1.7 · Caj ·(1− fCaBj
)− 11.9 · 10−3 · fCaBj
dfCaBsl
dt = 1.7 · Casl · (1− fCaBsl)− 11.9 · 10−3 · fCaBsl
Additionally, based on the results of the sensitivity of APD90 to variations inthe maximal ICaL conductivity and the actual APD90 value in the GPB model(see below, Tables 2.1 and 2.2), the relative permeabilities of the L-type calciumchannels were set to:
pCa = 1.9887 · 10−4 cm/s
pK = 5.4675 · 10−8 cm/s
pNa = 3.0375 · 10−9 cm/s
ICaj =pCa · Vm · Frdy · FoRT ·
(Caj · e2·Vm·FoRT − Cao
)e2·Vm·FoRT − 1
ICasl =pCa · Vm · Frdy · FoRT ·
(Casl · e2·Vm·FoRT − Cao
)e2·Vm·FoRT − 1
INaj =pNa · Vm · Frdy · FoRT ·
(Naj · eVm·FoRT −Nao
)eVm·FoRT − 1
JesúsCarro
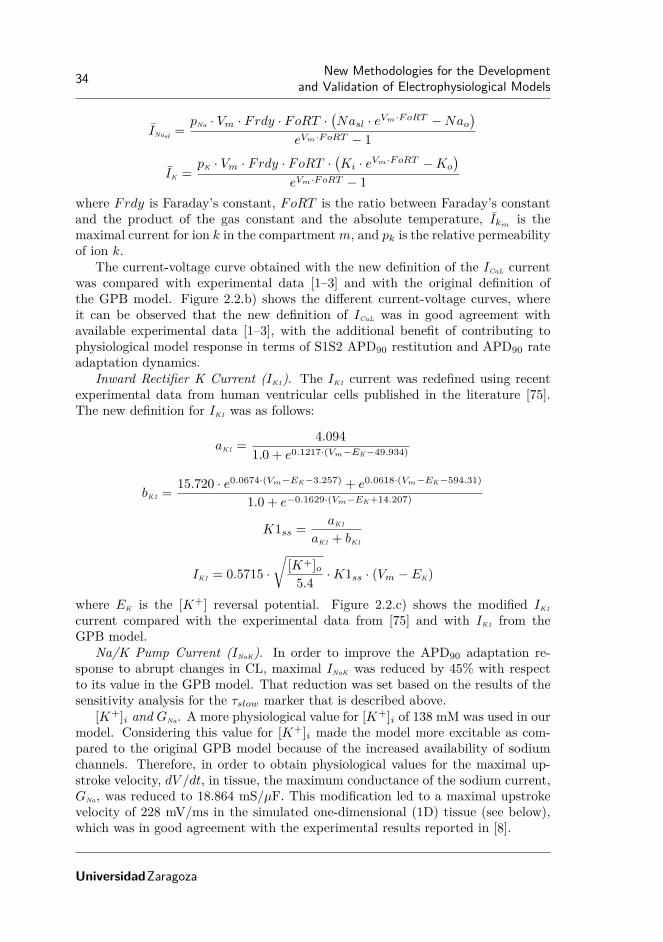
34 New Methodologies for the Developmentand Validation of Electrophysiological Models
INasl =pNa · Vm · Frdy · FoRT ·
(Nasl · eVm·FoRT −Nao
)eVm·FoRT − 1
IK =pK · Vm · Frdy · FoRT ·
(Ki · eVm·FoRT −Ko
)eVm·FoRT − 1
where Frdy is Faraday’s constant, FoRT is the ratio between Faraday’s constantand the product of the gas constant and the absolute temperature, Ikm
is themaximal current for ion k in the compartment m, and pk is the relative permeabilityof ion k.
The current-voltage curve obtained with the new definition of the ICaL currentwas compared with experimental data [1–3] and with the original definition ofthe GPB model. Figure 2.2.b) shows the different current-voltage curves, whereit can be observed that the new definition of ICaL was in good agreement withavailable experimental data [1–3], with the additional benefit of contributing tophysiological model response in terms of S1S2 APD90 restitution and APD90 rateadaptation dynamics.
Inward Rectifier K Current (IK1). The IK1 current was redefined using recentexperimental data from human ventricular cells published in the literature [75].The new definition for IK1 was as follows:
aK1 =4.094
1.0 + e0.1217·(Vm−EK−49.934)
bK1 =15.720 · e0.0674·(Vm−EK−3.257) + e0.0618·(Vm−EK−594.31)
1.0 + e−0.1629·(Vm−EK+14.207)
K1ss =aK1
aK1 + bK1
IK1 = 0.5715 ·√
[K+]o5.4
·K1ss · (Vm − EK)
where EK is the [K+] reversal potential. Figure 2.2.c) shows the modified IK1
current compared with the experimental data from [75] and with IK1 from theGPB model.
Na/K Pump Current (INaK). In order to improve the APD90 adaptation re-sponse to abrupt changes in CL, maximal INaK was reduced by 45% with respectto its value in the GPB model. That reduction was set based on the results of thesensitivity analysis for the τslow marker that is described above.
[K+]i and GNa. A more physiological value for [K+]i of 138 mM was used in ourmodel. Considering this value for [K+]i made the model more excitable as com-pared to the original GPB model because of the increased availability of sodiumchannels. Therefore, in order to obtain physiological values for the maximal up-stroke velocity, dV /dt, in tissue, the maximum conductance of the sodium current,GNa, was reduced to 18.864 mS/µF. This modification led to a maximal upstrokevelocity of 228 mV/ms in the simulated one-dimensional (1D) tissue (see below),which was in good agreement with the experimental results reported in [8].
UniversidadZaragoza

2. A New Paradigm for Electrophysiological Model Development 35
a)
−100 −50 0 500
500
1000
V (mV)
τi
(ms)
τ f CRLPτ f2
CRLPτ f GPBInact.Slow Inact.Fast Inact.
b)
−40 −20 0 20 40 60
−10
−5
0
V (mV)
IC
aL
(pA
/pF
)
GPBCRLP[Pelzmann1998][Li1999][Magyar2000]
c)
−140 −120 −100 −80 −60 −40
−20
−10
0
V (mV)
IK
1(p
A/pF
)
GPBCRLP[Fink2008]
−100 −80 −60 −40
−1
0
1
(((((
XXXXXaaaaaaaaaaa
Figure 2.2: Characteristics of ICaL and IK1 in simulations and experiments: a)Simulated ICaL voltage-dependent inactivation time constants τi as a function ofvoltage, where i ∈ f, f2. Experimental data, represented by markers, were takenfrom [2, 4–7]; b) ICaL current density versus voltage, with experimental data takenfrom [1–3]; c) IK1 current density versus voltage with experimental data taken from[75]. To compare simulated and experimental data under the same conditions,[K+]i = 138 mM and [K+]o = 4 mM were used for the curves shown in panel c),with [K+]i denoting the intracellular potassium concentration.
JesúsCarro

36 New Methodologies for the Developmentand Validation of Electrophysiological Models
Numerical methods and implementation
The cell membrane was modeled as an electrical circuit [26]. Mathematically, thetransmembrane voltage Vm was described by the following ordinary differentialequation:
CmdVm
dt = − (Iion − Istim) , (2.1)
where t is time, Iion is the sum of all transmembrane ionic currents, Istim is theexternally applied stimulation current and Cm is the cell capacitance per unitsurface area.
Propagation of the electrical activity in a 1D fiber was described by the followingparabolic reaction-diffusion equation [85]:
Cm∂Vm
∂t= − (Iion − Istim) +
∂
∂x
(σ∂V
∂x
), (2.2)
where σ is the diffusion coefficient of the tissue and x denotes the coordinate alongthe fiber.
Physical units in the model were as follows: time t was given in milliseconds,transmembrane potential Vm in millivolts, current densities in picoamperes perpicofarad and ionic concentrations in millimoles per liter.
The GPB and CRLP models were implemented in Fortran based on the originalcodes provided by Eleonora Grandi. The TP06 model was also implemented inFortran from the original C codes available at Kirsten ten Tusscher’s web page:www-binf.bio.uu.nl/khwjtuss.
Cells and tissue were stimulated with square transmembrane current pulsestwice the diastolic threshold in amplitude and 1-ms duration. For single cell sim-ulations, forward Euler with a time step ∆t = 0.002 ms was used to integrate thesystem of ordinary differential equations governing the cellular electrical behavior.For the 1D simulations, a homogeneous 4-cm long fiber composed of epicardialcells was considered. A semi-implicit operator-splitting scheme [86] was used tosolve equation 2.2 with a space discretization of ∆x = 0.1 mm and a time stepof ∆t = 0.002 ms. A value of σ = 0.0013 cm2/ms was used, corresponding toa maximum CV of 74 cm/s, which is in agreement with experimentally reportedCV values [87]. The cell capacitance was set to Cm = 1 µF/cm2. Five positionswithin the fiber were selected for further analysis in each simulation. Those posi-tions were located at 1.5, 1.75, 2, 2.25 and 2.5 cm from the stimulation end of thecable. Reported APD90 and CV values were computed as mean values over thosepositions. In all cases, the Rush and Larsen integration scheme [88] was used tointegrate the Hodgkin-Huxley type equations for the gating variables of the varioustime-dependent currents (m, h, and j for INa; xtof , xtos , ytof and ytos for Ito; xkr
for IKr; xks for IKs and d, f and f2 for ICaL).To test the sensitivity of the numerical solution to the time and space dis-
cretization indicated above, simulations were performed using a time increment of0.5 µs and a spatial discretization of 0.05 mm. Differences of less than 0.2% for
UniversidadZaragoza

2. A New Paradigm for Electrophysiological Model Development 37
the steady-state markers computed in isolated cells were obtained when comparedwith the default time and space steps used in this study. In tissue, CV and APD90
varied by less than 1.5% and 0.02%, respectively. Also, other stimulus durations(from 1 to 3 ms) and amplitudes (from 1.5 to 2 times the diastolic threshold) weretested and were confirmed to provide very similar results (differences in terms ofAPD90, maximal upstroke velocity as well as CV in tissue were in all cases below0.2%, 1.6% and 0.8%, respectively).
2.2.4 Conducted Simulations
Sensitivity Analysis
A sensitivity analysis was performed to the original GPB model following themethodology described in [12]. The aim was to elucidate how different ionic currentproperties modulate the investigated electrophysiological markers. In the sensitiv-ity analysis, each parameter was varied at a time by ±30%. Also, variations of±15% were considered to assess markers’ response to different degrees of variation.These percentages are in agreement with variability levels reported in experimentsperformed in human ventricular tissue [2, 75, 89–93].
The parameters considered in the sensitivity analysis were:
• GCaL: Maximal conductance of the L-Type Calcium Current (ICaL).
• τf : Time constant of the fast voltage-dependent inactivation gate (f) of theICaL current.
• τf2 : Time constant of the slow voltage-dependent inactivation gate (f2) ofthe ICaL current.
• GKr : Maximal conductance of the rapidly activating potassium current (IKr).
• GKs : Maximal conductance of the slowly activating potassium current (IKs).
• τxs : Time constant of the activation gate (xKs) of the IKs current.
• GK1 : Maximal conductance of the inward rectifier potassium current (IK1).
• GNaK : Maximal value of the sodium-potassium pump current (INaK).
• Gncx : Maximal value of the sodium-calcium exchanger current (Incx).
• Gto : Maximal conductance of the transient outward potassium current (Ito).
For each marker c and parameter p, the percentage of change (Dc,p,a) andsensitivity (Sc,p,a) were calculated as follows [12]:
Dc,p,a =Cp,a − Ccontrol
Ccontrol· 100
Sc,p,a =Dc,p,a −Dc,p,−a
2a· 100
JesúsCarro

38 New Methodologies for the Developmentand Validation of Electrophysiological Models
where Cp,a is the value of marker c when the parameter p is varied by the percent-age a, and Ccontrol is the value of marker c under control conditions. As shownabove, sensitivity (Sc,p,a) was calculated as the ratio of the difference between thepercentage of change (Dc,p,a − Dc,p,−a) and the interval of change (2a). In thisstudy we used this definition particularized for a = 30%:
Sc,p,30 =Dc,p,+30 −Dc,p,−30
0.6
Larger percentages of variation (±60% and ±90%) in model parameters wereadditionally investigated to confirm the validity of the sensitivity analysis resultsunder more severe ionic alterations.
Potassium Current Blocks
The following cases of total and partial potassium current blocks were simulated:
• IKs: To simulate the effect of 1 µM of HMR-1556, IKs was completely blocked.
• IKr: To simulate the effect of 50 nM of dofetilide, IKr was completely blocked.
• IK1: To simulate the effect of 10 µM of BaCl2, IK1 was reduced by 50%.
Restitution in Tissue
CV and APD90 restitution were additionally investigated in tissue by applying theS1S2 protocol described in 2.2.2, with the only difference that the extra stimulus(S2) was in this case decreased in steps of 5 ms.
Hyperkalemic Conditions
Hyperkalemic conditions were simulated by increasing [K+]o from 4 mM to 15mM. For each [K+]o value, the diastolic threshold used to compute the stimulusamplitude was determined as follows: the model was first stabilized until the prod-uct of the gates h · j reached 99% of the steady-state value hss · jss. Stimulationcurrent pulses of variable amplitude were applied at one end of the cable and thediastolic threshold was defined as the minimum amplitude required for an AP topropagate along the fiber. With the model initialized at 1 Hz steady-state, ERPwas determined by stimulating the tissue with a train of 10 basic stimulations (S1)delivered at a CL of 1,000 ms, followed by an extra stimulus (S2) delivered atdifferent times taken in 1 ms steps. Steady-state CV and APD90 were measuredafter the last S1 stimulus.
2.3 Results
2.3.1 Results for Control Conditions
UniversidadZaragoza
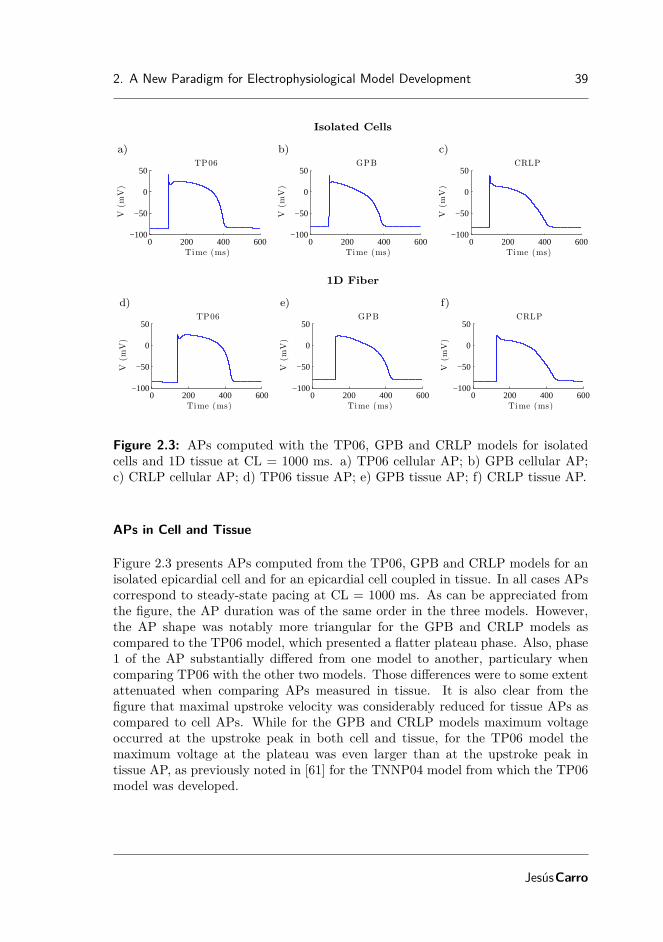
2. A New Paradigm for Electrophysiological Model Development 39
Isolated Cells
a)
0 200 400 600−100
−50
0
50
Time (ms)
V(m
V)
TP06
b)
0 200 400 600−100
−50
0
50
Time (ms)
V(m
V)
GPB
c)
0 200 400 600−100
−50
0
50
Time (ms)
V(m
V)
CRLP
1D Fiber
d)
0 200 400 600−100
−50
0
50
Time (ms)
V(m
V)
TP06
e)
0 200 400 600−100
−50
0
50
Time (ms)
V(m
V)
GPB
f)
0 200 400 600−100
−50
0
50
Time (ms)
V(m
V)
CRLP
Figure 2.3: APs computed with the TP06, GPB and CRLP models for isolatedcells and 1D tissue at CL = 1000 ms. a) TP06 cellular AP; b) GPB cellular AP;c) CRLP cellular AP; d) TP06 tissue AP; e) GPB tissue AP; f) CRLP tissue AP.
APs in Cell and Tissue
Figure 2.3 presents APs computed from the TP06, GPB and CRLP models for anisolated epicardial cell and for an epicardial cell coupled in tissue. In all cases APscorrespond to steady-state pacing at CL = 1000 ms. As can be appreciated fromthe figure, the AP duration was of the same order in the three models. However,the AP shape was notably more triangular for the GPB and CRLP models ascompared to the TP06 model, which presented a flatter plateau phase. Also, phase1 of the AP substantially differed from one model to another, particulary whencomparing TP06 with the other two models. Those differences were to some extentattenuated when comparing APs measured in tissue. It is also clear from thefigure that maximal upstroke velocity was considerably reduced for tissue APs ascompared to cell APs. While for the GPB and CRLP models maximum voltageoccurred at the upstroke peak in both cell and tissue, for the TP06 model themaximum voltage at the plateau was even larger than at the upstroke peak intissue AP, as previously noted in [61] for the TNNP04 model from which the TP06model was developed.
JesúsCarro

40 New Methodologies for the Developmentand Validation of Electrophysiological Models
Sensitivity Analysis
The results of the sensitivity analysis applied to the epicardial version of the GPBmodel are presented in Table 2.1. This table shows the dependence of a large num-ber of electrophysiological markers on the ICaL current. Not only markers relatedto systolic and diastolic [Ca2+]i levels, but also APD90 and S1S2 restitution slopewere mostly sensitive to variations in ICaL. Also, Table 2.1 shows the importance ofthe IK1 current for AP triangulation. INaK was determinant for [Na+]i rate depen-dence as well as for the time constant of the slow phase of APD90 rate adaptation.Note that APD90 rate adaptation dynamics computed from the GPB model didnot present a characteristic biphasic behavior as reported in experimental studies[94], but adaptation was completed in only one slow phase. For that reason themarker τfast described in subsection 2.2 is not shown in Table 2.1. Finally, Incxwas relevant for [Ca2+]i rate dependence. Table 2.1 together with the analysispresented in the following subsection were the road map to carry out the variousmodel improvements proposed in this work, which were described in subsection 2.2.
To confirm that the results of the sensitivity analysis presented in Table 2.1 werenot dependent on the limit (30%) considered for parameter variations, simulationswere performed considering larger percentages of variations of up to 90%. Despitethe fact that in some cases a highly nonlinear modulation of specific electrophys-iological markers by certain ionic mechanisms was observed (e.g. triangulationmodulation by GK1, systolic [Ca2+]i modulation by GCaL or τslow modulation byGNaK), results corroborated the mechanisms identified as determinant for the in-vestigated markers in the sensitivity analysis.
Electrophysiological markers
Table 2.2 shows the values of the computed markers for the epicardial versionsof the three models analyzed in this study (TP06, GPB and CRLP). Simulationresults were compared against a variety of experimental data taken from [2, 8–10, 78, 94–97].
Results indicated that the GPB model performed better than the TP06 modelwith respect to the following markers: AP triangulation, steady-state systolic anddiastolic [Ca2+]i levels at 0.5 Hz and rate dependence of [Na+]i and [Ca2+]i. Thosemarkers are illustrated for the three analyzed models in Figure 2.4.a), 2.4.b),2.4.f) and 2.4.g). However, according to other analyzed markers, the GPB modelrendered worse performance than the TP06 model, as was the case for the S1S2restitution curve and the APD90 adaptation to abrupt changes in CL. Regardingthe APD90 adaptation, two phases of APD90 rate adaptation were experimentallyreported in [94]: a first phase with a short time constant and a second phasewith a longer time constant. As described above, the APD90 rate response inthe GPB model did not present the first fast phase (Figure 2.4.c)). For the S1S2restitution curves (Figure 2.4.d)), the TP06 model was in better agreement withthe experimental data of [94, 97] than the GPB model.
For the CRLP model, seven out of the twelve analyzed markers were withinphysiological range and other three markers were closer to the physiological range
UniversidadZaragoza

2. A New Paradigm for Electrophysiological Model Development 41
60.88%
-62.78%
205.40%
239.61%
28.09%
29.41%
-62.50%
134.46%
-81.45%
67.71%
-10.52%
GCaLτ f GKr GKs
τxs GK1 GN aK Gnc x Gto
Max sys[N a+] i
Max sys[Ca2+] i
τs low
Slope max Dyn
Slope max S1S2
Dia[Ca2+] i 0.5 Hz
Dia[Ca2+] i 1 Hz
Sys[Ca2+] i 0.5 Hz
Sys[Ca2+] i 1 Hz
Triangulation
APD90
0
0.1
0.2
0.3
0.4
0.5
0.6
0.7
0.8
0.9
1
Table 2.1: Results of the sensitivity analysis applied to the GPB model. The bluescale indicates relative sensitivity for each marker. White color indicates maximumrelative sensitivity and dark blue color indicates that property and parameter areindependent. Percentages in the white boxes indicate the absolute sensitivity ofthe property. A minus sign in a box indicates that marker and model parametervary inversely. ‘Sys’ stands for systolic and ‘Dia’ stands for diastolic.
as compared to the GPB and TP06 models. As for systolic and diastolic [Ca2+]ilevels at 1 Hz, TP06 outperforms CRLP. A significant change in the shape of theS1S2 restitution curve was observed for the CRLP model as compared to the GPBmodel (Figure 2.4.d)). The behavior shown by the CRLP model was in agreementwith experimental data [94].
Potassium Current Blocks
Table 2.3 summarizes the effect of potassium current blocks on epicardial APs com-puted using the three tested models. Results are given as percentage of variationof the APD90 value with respect to control conditions. In those cases where morethan one current was blocked, the variation refers to the APD90 value obtainedwhen only the first current was blocked. Experimental values are taken from [53].It is clear from Table 2.3 that the GPB model performs better than the TP06model regarding current blocks. The CRLP model performs similar to the GPBmodel. Figure 2.5 illustrates the effect of current blocks on the AP shape for theGPB and CRLP models.
Restitution in Fiber
Figure 2.6 shows CV and APD90 restitution curves computed by applying theS1S2 protocol to the simulated 1D fiber. Regarding CV restitution, the threemodels present similar behaviors, with only notable differences (>5 cm/s) observedbetween the TP06 model and the other two models (GPB and CRLP) in the final
JesúsCarro

42 New Methodologies for the Developmentand Validation of Electrophysiological Models
marker TP06 GPB CRLP Physiol.APD90 (ms) 301.2 285.0 305.6 271-366
Triangulation (ms) 28.4 51.5 78 44-112Sys [Ca2+]i 1 Hz (µM) 0.886 0.383 0.602 1.59-2.01
Sys [Ca2+]i 0.5 Hz (µM) 0.199 0.345 0.523 0.71-1.68Dia [Ca2+]i 1 HZ (µM) 0.104 0.089 0.097 0.20-0.33
Dia [Ca2+]i 0.5 Hz (µM) 0.068 0.085 0.091 0.14-0.32SmaxS1S2 (—) 1.3 0.2 1.0 0.79-4.25SmaxDYN (—) 1.0 1.1 0.9 —
τfast (s) 13.3 — 10.2 —τslow (s) 124.8 56.3 105.6 70-110
Max. sys. [Ca2+]i (%) 1157 178 147 130-170Max. sys. [Na+]i (%) 217 132 134 145
Table 2.2: markers of arrhythmic risk for the TP06, GPB and CRLP humanmodels. Black color indicates within physiological range. Italic indicates out ofphysiological range but better than previous models. Red color indicates out ofphysiological range. Experimental data are from [2, 8–10, 78, 94–97].
Current Ref. TP06 GPB CRLP Exper.IKs 0% Control 74.9 0.7 0.6 < 2.8IKr 0% Control 15.9 18.6 14.1 44±4IKr 0%
IKr block — 1.4 0.8 9IKs 0%IK1 50% Control 3.6 11.5 14.6 4.8±1.5IKr 0%
IKr block 8.9 15.6 21.1 33IK1 50%
Table 2.3: Percentages of variation in APD90 caused by blocking different potas-sium currents. Black color indicates within physiological range. Italic indicates outof physiological range but better than previous models. Red color indicates out ofphysiological range.
UniversidadZaragoza

2. A New Paradigm for Electrophysiological Model Development 43
a)
0 200 400 600−80−60−40−20
02040
Time (ms)
Vm
(mV
)
Steady-State AP Shape
b)
0 500 10000
0.5
1
Time (ms)
[Ca
2+] i
(µM
)
Steady State [Ca2+] i Shape
c)
0 5 10 15 20
260
280
300
APD Rate Adaptation
Time (min)
AP
D90
(ms)
d)
0 200 400 600 800
200
250
300
S1S2
DI (ms)
AP
D90
(ms)
e)
0 200 400 600 800
200
250
300
Dynamic
DI (ms)
AP
D90
(ms)
GPB
CRLP
TP06
f)
0.5 1 1.5 2 2.5 3
200400600800
10001200
[Ca2+]i Rate Dependence
Frequency (Hz)
Syst
olic
[Ca2+
] i(%
)
g)
0.5 1 1.5 2 2.5 3
100
150
200
[Na+]i Rate Dependence
Frequency (Hz)
Syst
olic
[Na+] i
(%)
Figure 2.4: markers of arrhythmic risk from TP06, GPB and CRLP models: a)Steady-state AP for CL = 1000 ms; b) Steady-state Ca transient for CL = 1000ms. c) APD90 rate adaptation to abrupt changes in CL (from 1000 ms to 600 ms);d) S1S2 restitution curve; e) Dynamic restitution curve; f) Normalized [Ca2+]irate dependence; g) Normalized [Na+]i rate dependence. For panels f) and g)normalization is performed with respect to the lowest tested frequency, i.e. 0.25Hz.
JesúsCarro

44 New Methodologies for the Developmentand Validation of Electrophysiological Models
GPB Model
a)
0 200 400 600−80−60−40−20
02040
Time (ms)
Vm
(mV
)
ControlIKr BlockIKs BlockIKr & IKs Block
b)
0 200 400 600−80−60−40−20
02040
Time (ms)
Vm
(mV
)
ControlIKr BlockIK1 BlockIKr & IK1 Block
CRLP Model
c)
0 200 400 600−80−60−40−20
02040
Time (ms)
Vm
(mV
)
ControlIKr BlockIKs BlockIKr & IKs Block
d)
0 200 400 600−80−60−40−20
02040
Time (ms)
Vm
(mV
)
ControlIKr BlockIK1 BlockIKr & IK1 Block
Figure 2.5: Effect of blocking potassium currents for the GPB and CRLP models:a) Effect of completely blocking IKr and IKs currents in the GPB model; b) Effect ofcompletely blocking IKr and partially blocking IK1 in the GPB model; c) Effect ofcompletely blocking IKr and IKs currents in the CRLP model; d) Effect of completelyblocking IKr and partially blocking IK1 in the CRLP model.
UniversidadZaragoza

2. A New Paradigm for Electrophysiological Model Development 45
a)
0 200 400 600 80050
60
70
80
DI (ms)
CV
(cm
/s)
b)
0 200 400 600 800
200
250
300
DI (ms)
AP
D90
(ms)
TP06CRLPGPB
Figure 2.6: CV and APD90 restitution curves for the TP06, GPB and CRLPmodels in a simulated 1D fiber.
part of the curve, i.e. for DI values above 200 ms. Regarding APD90 restitution,both the TP06 and CRLP model present steep restitution curves, with high slope(close to 1) only for a narrow DI interval in the case of the CRLP model and for amuch wider DI range in the case of the TP06 model (with slope values above 1).The GPB model shows a relatively flat APD90 restitution curve. Those results arein good correspondence with the observations from restitution curves measured inisolated cells (Figure 2.4.d)).
2.3.2 Results for Hyperkalemic Conditions
AP properties
Figures 2.7.a) and 2.7.c) show a comparison of the AP shape computed in singlecell and tissue for different levels of [K+]o using the CRLP model. Figures 2.7.b)and 2.7.d) show the effect of varying [K+]o on the resting potential in single celland tissue. As expected, hyperkalemia shortens the APD90 and leads to elevatedresting potential, in both cells and tissue.
From Figure 2.7.c) it is also clear that for high [K+]o levels, the AP shapevaries between even and odd beats, thus leading to the occurrence of AP alternans.Further analysis on the alternating AP behavior and the [K+]o threshold for itsoccurrence can be found below.
Conduction Velocity
Figure 2.8.a) shows CV as a function of [K+]o computed from the simulated 1Dfiber using the CRLP model. As expected, hyperkalemia leads to a decrease inCV. However, “supernormal conduction” is not observed for [K+]o levels belowphysiological values (5.4 mM) as has been observed in other studies [98, 99]. Ourresults also show that conduction block occurs for [K+]o > 10.4.
JesúsCarro

46 New Methodologies for the Developmentand Validation of Electrophysiological Models
Isolated Cells
a)
0 200 400 600−100
−50
0
50
Time (ms)
V(m
V)
[K +] o = 4
[K +] o = 6
[K +] o = 8
[K +] o = 10
b)
4 6 8 10−100
−80
−60
[K +] o (mM)Rest
ing
Pote
nti
al(
mV
)
1D Fiber
c)
0 500 1000 1500 2000−100
−50
0
50
Time (ms)
V(m
v)
[K +] o = 4
[K +] o = 6
[K +] o = 8
[K +] o = 10
d)
4 6 8 10−100
−80
−60
[K +] o (mM)Rest
ing
Pote
nti
al(
mV
)
Figure 2.7: Simulated hyperkalemia in cell and tissue using the CRLP model. a)AP shape for varying [K+]o in isolated cells; b) Resting potential for varying [K+]oin isolated cells; c) AP shape for varying [K+]o in 1D fiber; d) Resting potentialfor varying [K+]o in 1D fiber.
UniversidadZaragoza
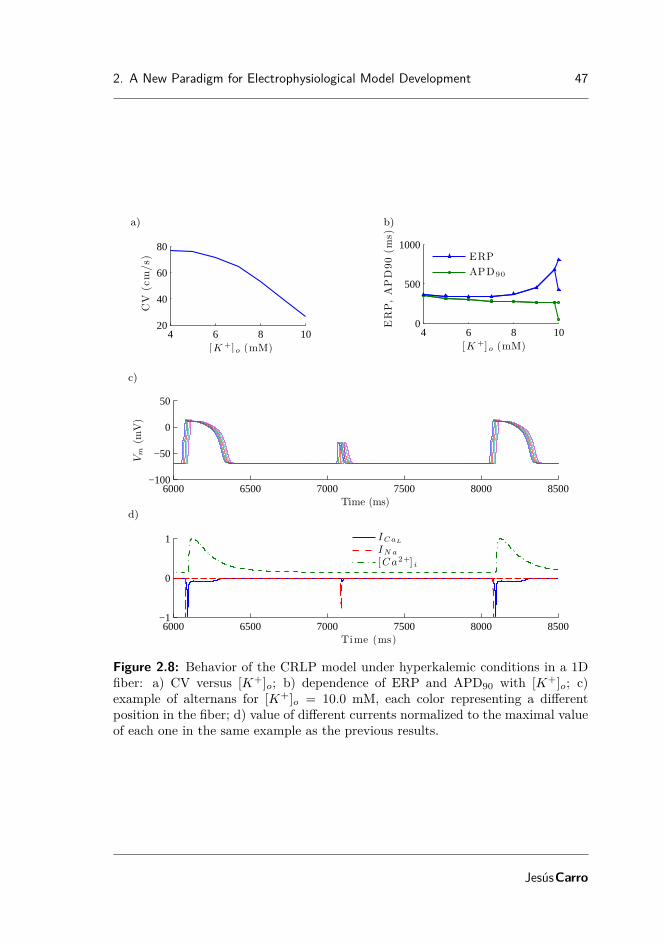
2. A New Paradigm for Electrophysiological Model Development 47
a)
4 6 8 1020
40
60
80
[K +] o (mM)
CV
(cm
/s)
b)
4 6 8 100
500
1000
[K +] o (mM)
ER
P,
AP
D90
(ms)
ERP
APD90
c)
6000 6500 7000 7500 8000 8500−100
−50
0
50
Time (ms)
Vm
(mV
)
d)
6000 6500 7000 7500 8000 8500−1
0
1
Time (ms)
ICaL
IN a
[Ca2+] i
Figure 2.8: Behavior of the CRLP model under hyperkalemic conditions in a 1Dfiber: a) CV versus [K+]o; b) dependence of ERP and APD90 with [K+]o; c)example of alternans for [K+]o = 10.0 mM, each color representing a differentposition in the fiber; d) value of different currents normalized to the maximal valueof each one in the same example as the previous results.
JesúsCarro

48 New Methodologies for the Developmentand Validation of Electrophysiological Models
Action Potential Duration and Effective Refractory Period
Figure 2.8.b) shows ERP and APD90 of the last basic (S1) beat for different [K+]ovalues computed in the simulated 1D fiber using the CRLP model. Results showthat hyperkalemia causes postrepolarization refractoriness. The difference betweenERP and APD90 remains almost constant for [K+]o ≤ 6 mM, with this differenceincreasing rapidly for [K+]o > 6 mM. For [K+]o > 9.8 mM, alternans appearin the tissue, causing the ERP and APD90 curves to branch out (Figure 2.8.b)).This characteristic of the ERP and APD90 curves has not been reported in otherhuman ventricular simulation studies of the literature, but is in agreement withexperimental results in other species and with clinical data [100–102]. We testedthe same hyperkalemic conditions in simulated TP06 and GPB 1D fibers and wecould not observe branching out of the ERP or APD90 curves after increasing [K+]oup to 15 mM.
Figure 2.8.c) depicts AP propagation in the simulated CRLP 1D fiber for[K+]o = 10 mM. Alternans were observed for all computed positions within thefiber. Figure 2.8.d) shows ICaL, INa and [Ca2+]i, each normalized to its maxi-mum value, for the same time period shown in Figure 2.8.c). Results indicate thatconduction relies on INa even for the highly depressed APs. For the long APs,the AP upstroke is divided into two components, the first one characterized by asteep upstroke and supported by INa, and the second one supported by ICaL, inagreement with the results reported in [66].
2.4 Discussion and conclusions
In this chapter a new human ventricular cell model, the CRLP model, was de-veloped based on the recently proposed GPB model. The CRLP model combinesrecent experimental measurements of potassium currents and reformulates the L-type calcium current by introducing fast and slow voltage-dependent inactivationgates, similar to the formulation proposed in the TP06 model. That new formula-tion led to ICaL dynamics that were in good agreement with experimental data and,more notably, allowed the CRLP model to accurately reproduce S1S2 restitutionand APD90 rate adaptation characteristics. All the modifications were made withthe aim of retaining the advantages that the GPB model has over previous models,such as the TP06 model, while improving the performance on other electrophysio-logical aspects.
The novelty of this study was that model development was not based only onthe incorporation of new data from experiments on individual ionic currents orconcentrations. More importantly, the development was driven by a new paradigmconsisting in analyzing the ability of the model to replicate a set of well-establishedelectrophysiological markers and on a sensitivity analysis of those markers to vari-ations in model parameters. The proposed model development framework allowsassessing model performance under a variety of conditions, either physiologicalor pathological. This provides useful information for the adjustment of differentmodel parameters that do not directly depend on individual current measurements
UniversidadZaragoza

2. A New Paradigm for Electrophysiological Model Development 49
or concentrations, and which would be otherwise set in an ad hoc manner.
2.4.1 New model characteristics
The introduction of fast and slow ICaL inactivation gates in the CRLP model ledto a more physiological APD90 rate adaptation response to abrupt changes in CLas compared to the GPB model. However, by doing so, a larger ICaL current wasobtained for the CRLP model, which led to the reformulation of IK1 and read-justments of other parameters to keep APD90 within physiological values. Theresulting APD90 value for the CRLP model was closer to the APD90 value of theTP06 model, without significantly altering the AP triangulation of the GPB model,which was well within the reported physiological range. The other modificationsintroduced into the CRLP model rendered most of the investigated markers to bewithin the physiological range or otherwise closer to the physiological range as com-pared to the GPB and TP06 models. In this regard, only for systolic and diastolic[Ca2+]i levels at 1 Hz the TP06 model outperformed CRLP. In addition, the CRLPmodel showed improved performance with respect to the GPB model regarding theS1S2 restitution, not only by bringing the maximum S1S2 restitution slope withinthe physiological range, but also by providing a shape for the restitution curve ingood agreement with experimental measurements [94].
Even though the model modifications introduced in this work significantly im-proved the performance of the CRLP model over the GPB model in reproducingexperimental data related to a number of electrophysiological markers, they haveminimally affected the behavior of the model against potassium current blocks. Inthis regard, the CRLP model still provides results in very good agreement withavailable experimental data regarding AP response to IKr, IKs and IK1 blocks [53].
2.4.2 Simulation of hyperkalemic conditions
Simulations under hyperkalemic conditions showed that APD90 progressively de-creased with the level of [K+]o, whereas ERP increased after a threshold in [K+]owas reached ([K+]o ≈ 6 mM). CV decreased with hyperkalemia and conductionwas blocked above [K+]o = 10.4 mM. These results suggest that the longer ERPvalues and the occurrence of conduction block above [K+]o = 10.4 mM in thecentral zone of acutely ischemic tissue could cause areas of conduction block thatcould set a substrate for reentrant arrhythmias. Additionally, alternans were ob-served in ERP and APD90 for [K+]o > 9.8 mM. These results are in agreementwith experimental studies where alternans were observed in the cells of the heart’sischemic zone [100, 101]. To the authors’ knowledge, this is the first time thatthose observations are reported using a human ventricular AP model. That typeof behavior was not observed in either the TP06 or the GPB models. For the TP06model, conduction block occurred for [K+]o ≈ 15 mM without the occurrence ofalternans [103]. For the GPB model, conduction block occurred for [K+]o ≈ 9 mMand alternans were not observed either.
JesúsCarro

50 New Methodologies for the Developmentand Validation of Electrophysiological Models
2.4.3 Data sources
As described in [60], one of the problems on reutilization of model components inelectrophysiology is the inclusion of components adjusted with data from differentspecies. For that reason, in this work all model developments were made by usingmodel components formulated based on human data only [51] or by fitting equa-tions to additional human data available from the literature [75]. We did not trymodifying other ionic currents or concentrations for which human data was notavailable. Regarding the types of human data used in the study, they all corre-sponded to adult humans, except for the data taken from the study by Pelzmannet al. [1], in which ICaL was measured in children. Those data were used because thestudy clearly showed that there were not significant differences in the ICaL currentcharacteristics measured in children as compared to adults.
2.4.4 Model limitations
The developed CRLP model has a number of limitations, some of them inheritedfrom the GPB model on which it was based, and others independent of it. In-herited from the GPB model is the absence of intracellular potassium dynamics([K+]i is kept constant in the GPB and CRLP models). [K+]i dynamics play animportant role in modeling hyperkalemic conditions, and is, therefore, a pivotalelement for the accurate computational investigation of ventricular arrhythmiasunder such conditions. In addition, phase 1 of the AP shows an atypical behav-ior for the CRLP model. This may be caused by the Ito current. However, noattempt to modify this current has been made mainly because new human datawas not available for that purpose. This current happens to be the only one whosedefinition differentiates endocardial and epicardial cells in the GPB model and inthe CRLP model as well. In this regard, both models lack a description for theelectrophysiology of midmyocardial cells. Another limitation of the CRLP modelhas to do with calcium handling. The results of the analysis conducted in thisstudy point out the importance that the ICaL current as well as [Ca2+]i dynamicshave over different electrophysiological markers. Many studies have attempted toprovide accurate definitions of [Ca2+]i dynamics in human ventricular cells, butthis is still an area of intensive research. The present study suggests the need forcontinuing with the development of more reliable calcium dynamics models thatallow improving the performance of whole cell AP models.
On top of the above described limitations, a comment is in order regardingthe comparison of human ventricular AP models. It is clear that each model hasbeen developed to reproduce certain electrophysiological behaviors observed fromexperimental recordings. Also, considering the huge variability in the experimen-tal data, model comparison becomes a challenging task for which a model shouldnever be qualified as being an improvement over another one just because it is ableto reproduce specific experimental observations that the other model is not ableto reproduce. In this study we used the term improvement exclusively to refer tothe fact that, considering the set of investigated electrophysiological markers, theCRLP model provides a response that is more in line with the averaged experimen-
UniversidadZaragoza

2. A New Paradigm for Electrophysiological Model Development 51
tal data used for evaluation purposes. The following chapters attempt to resolvesome of the limitations enumerated above. For this purpose, novel methodologieshave been developed and will be presented accordingly.
JesúsCarro


Chapter 3
Improvement of ExistingElectrophysiologicalModels
3.1 Introduction
Departing from the CRLP model developed in Chapter 2, this chapter aims atimproving its performance by including a relevant characteristic for investigationof ventricular arrhythmias arising under conditions of hyperkalemia, one of thecomponents of myocardial ischemia. Such a characteristic refers to formulation ofintracellular potassium dynamics, which were lacking both in the CRLP model aswell as in the GPB model from which it was built. When potassium dynamicsare incorporated into a model, an imbalance in the potassium currents may beoriginated, which may in turn lead to a drift in the intracellular potassium concen-tration. A way to overcome this is by readjusting model parameters to maintainpotassium homeostasis.
As mentioned in Chapter 1, an AP model is described by a system of cou-pled differential equations that involve the transmembrane current flow as wellas dynamic changes in intracellular ionic concentrations. For each ionic currenta mathematical formulation is employed to represent characteristics like gatingor permeability of the corresponding ion channels. Those formulations rely on anumber of model parameters whose values are commonly estimated based on exper-imental data obtained from specific protocols for each ionic current. In this contextparameter estimation presents various shortcomings intrinsic to the voltage-clampexperimental protocols [104]: i) insufficient separation of ionic current activationand inactivation processes; ii) use of non-selective pharmacological ion channelblockers; and iii) measurement of non-physiological solutions.
53

54 New Methodologies for the Developmentand Validation of Electrophysiological Models
Despite these limitations, most parameter values of individual ionic currentshave been identified in the past using independent sets of experiments. However,parameters describing ionic current conductances have not always been success-fully characterized from experimental datasets, in large part due to the sensitivityof some ion channels to the cell isolation procedure performed before application ofthe voltage-clamp protocols [105]. Also, experimental studies may have purposelyselected cells with large ionic currents, which interfere with model developmentbased on such data [47]. For those reasons, a common procedure to identify in-dividual ionic current conductances is based on model parameter fitting aimed atreproducing plausible values of electrophysiological AP properties like APD, tri-angulation or upstroke velocity [15, 46]. Other models include also constraintsbased on experimental data measured after blocking certain ionic currents [106],imposed to obtain a correct input resistance [47] or based on additional propertieslike APD rate adaptation and rate dependence of ionic concentrations as proposedin Chapter 2.
Cardiac electrophysiological computational models are commonly used to ana-lyze the effect of drugs or to study the mechanisms underlying pathological con-ditions. Under those circumstances, the correct characterization of ionic currentconductances is crucial. Overestimation or underestimation of current conduc-tance values could lead to completely erroneous predictions. For this reason, whilefor many years the adjustment of current conductances in cardiac computationalmodels has been frequently performed manually [107], a number of techniques havebeen developed in recent years to help in the process of parameter identification.Gradient descent methods [108, 109] and genetic algorithms [110–113] have beenused for this purpose in several studies. Gradient descent methods rely on com-puting local gradients of the error function to determine a search direction towardsa minimum. On the other hand, genetic algorithms use ideas from evolutionarybiology and test different combinations (populations) of parameters to optimizethe error function. In each iteration they create a new population based on thebest results from previous iterations.
Gradient descent methods and genetic algorithms have a small degree of par-allelization and, thus, other techniques with higher parallelization capability couldbetter exploit the possibilities of current computing infrastructures. In this chap-ter, a novel methodology is proposed for identification of parameters describingionic current conductances of cardiac electrophysiological models by using an opti-mization algorithm with trust region management [114]. The algorithm minimizesan objective function subject to non-linear constraints associated with a numberof electrophysiological properties. The objective function and constraints are ap-proximated by polynomial response surfaces that allow the optimization algorithmsearching for a solution to the problem without performing a direct evaluation ofthe model. The use of a response surface helps to reduce the number of iterationsof the algorithm and, thus, reduce the time cost of optimizing the model. To guar-antee the ability of the model to represent physiological behavior, the region wherethe solution is searched for is limited based on experimentally reported values ofelectrophysiological properties like APD, AP triangulation, diastolic and systolic
UniversidadZaragoza
3. Improvement of Existing Electrophysiological Models 55
intracellular calcium concentrations and time constants of APD rate adaptationto abrupt changes in cycle length (CL). The proposed methodology is applied toadjust the ionic conductances of the human ventricular CRLP model proposed inChapter 2 after incorporation of intracellular potassium, [K+]i, dynamics. Themodified CRLP model is compared against the most commonly used human ven-tricular AP models, namely the TP06 [51], GPB [15], ORd [63] models as well aswith the CRLP model.
The relevance of accounting for [K+]i dynamics is demonstrated by simulating anumber of transitions in the extracellular potassium concentration, as in hemodial-ysis studies [115], and comparing the behavior of the original and modified CRLPmodels.
3.2 Materials and Methods
3.2.1 Optimization problem
General formulation
A minimization problem with constraints can be written as:
min f(x) (3.1)subject to
h(x) = 0, (3.2)g(x) ≥ 0, (3.3)xL ≤ x ≤ xU , (3.4)
where x is the vector of decision variables, xL and xU their respective lower andupper bounds, f(x) is the objective function, and h(x) and g(x) are vector functionsof equality and inequality constraints, respectively.
Particularization to ionic conductances estimation
The general minimization problem described in previous section was particularizedin this study for estimation of ionic current conductances. Since different ioniccurrent conductances Gi may differ by orders of magnitude, the following scalingwas adopted for each of the elements of vector x:
xi = 20 · log10Gi
G0i
,
where Gi is the unscaled ionic current conductance and G0i is its initial value in
the model.The objective function is defined for each particular problem. In this study,
it was represented by the integral of the total potassium current during a cardiaccycle at 1 Hz steady-state pacing, as fully described in 3.2.2. No equality con-straint function was defined in this case. The inequality constrain function was
JesúsCarro

56 New Methodologies for the Developmentand Validation of Electrophysiological Models
defined by imposing a number of electrophysiological properties to remain withinexperimentally observed ranges:
mLL ≤ m(x) ≤ mUU (3.5)
where mLL and mUU are the lower and upper bounds delimiting physiologicalranges, respectively, and m(x) is the vector of electrophysiological properties cal-culated for x.
Eq. 3.5 was reformulated to be consistent with the general formulation of theinequality constraints described in eq. 3.3:
gj(x) =∣∣∣∣mj(x)−mj,CR
mj,RR
∣∣∣∣− 1 ≤ 0,
where mj,CR = (mj,UL + mj,LL)/2 is the central point of the experimental range forthe electrophysiological property j and mj,RR = (mj,UL − mj,LL)/2 is the distancebetween mj,CR and each of the limits of the experimental range.
Optimization using response surfaces
The optimization algorithm used in this study seeks for a solution of the mini-mization problem, Eqs. 3.1-3.4, by solving a sequence of approximate constrainedoptimization problems within a region of trust. For the iteration k of the algorithm,the approximate problem reads as:
min f(x) (3.6)subject to
h(x) = 0, (3.7)g(x) ≥ 0, (3.8)∥x∥ ≤ ∆k, (3.9)
where f(x), h(x) and g(x) are response surface approximations (RSA) of f(x),h(x), and g(x) around xk, respectively, and ∆k is the corresponding trust regionradius. The trust region radius defines a region of trust in which the RSA isassumed to be reliable. The validity of the RSA can be evaluated through thetrust region ratio test. For the objective function f(x), the trust region ratio foriteration k was defined as:
ρk0 =f(xk)− f(xk,∗)
f(xk)− f(xk,∗), (3.10)
where xk,∗ is a solution of the minimization problem given by Eqs. 3.6-3.9. Thisdefinition of the trust region ratio is based on the consideration that ρk0 → 1 asthe trust region radius ∆k → 0. If ρk0 ≤ 0, the approximation is deemed asunacceptable and, consequently, the trust region radius is reduced. If ρk0 ≈ 1 and∥xk,∗ − xk∥ = ∆k, the RSA is evaluated as acceptable and ∆k is increased. If
UniversidadZaragoza

3. Improvement of Existing Electrophysiological Models 57
0 < ρk0 < 1, ∆k is kept unchanged, but the RSA is rebuilt around xk,∗. Note thatρk0 >> 1 is also indicative of poor RSA and ∆k is reduced, but the optimizer isconsidered to be moving in the right direction. The update of the trust regionradius offers significant flexibility depending on the implementation. A particularupdating rule will be presented in the following section.
The algorithm proposed in this work is based on the one described in [114] butit simplifies some aspects on how to manage and use the response surfaces andit reduces the number of times the database needs to be generated. Instead ofconsidering the augmented Lagrangian of the problem, the proposal of this studyis based on generating the response surface of the model and looking for the min-imum in this surface. Subsequently, this solution is validated by using the trustregion test in both the minimization function and the constraints of the model.This notably reduces the computational cost, as the database is generated onceper iteration rather than every time there is a change in the parameters of theaugmented Lagrangian.
Database generation and response surface approximation
One of the key elements of the minimization algorithm is building the RSA ofthe objective and constraint functions that will be used to solve the approximateminimization problem. To construct a response surface for a function of n variables,a large number of sample points are required. Also, to construct a reliable RSA,the sample points must be adequately distributed. Sampling techniques based ondesign of experiments are commonly used for this purpose [116]. In this study,full factorial designs, which require 3n sampling points, were considered. A fullfactorial design consists of a three-level factorial: the corner points of a hypercube,plus the center of the hypercube and of each facet, plus the midpoints of the linesconnecting the corners of the hypercube. In the next sections, the set of results ofthe sampling technique in an iteration of the algorithm for both the minimizationand constraint functions will be referred to as database. Second order polynomialresponse surfaces were used in all cases.
Minimization algorithm
The minimization algorithm implemented in this work is shown in Fig. 3.1. Thedatabase was computed only once per iteration of the algorithm or whenever thesolution was rejected and the trust region radius was reduced. The trust regionratio was used to validate the RSA for the objective function and constraints inde-pendently.
The basic steps of the algorithm shown in Fig. 3.1 are briefly described in thefollowing. The index k indicates the iteration of the algorithm, i indicates thevariable index and j represents the constraint index.
JesúsCarro

58 New Methodologies for the Developmentand Validation of Electrophysiological Models
Figure 3.1: Flow chart of the proposed algorithm.
UniversidadZaragoza

3. Improvement of Existing Electrophysiological Models 59
Step 0: Initialization
Define values for the tolerances δ1 (solution tolerance), δ2 (gradient tolerance) andδ3 (improvement tolerance), the minimum acceptable value ρL for the trust regionratio to consider a trust region as acceptable and an upper limit ∆max for thetrust region radius. Define an initial value ∆0 for the size of the trust region anda starting point x0 for the variables of the problem. Set the iteration counter atk = 0.
Step 1: Database generation
Compute the database as described in section 3.2.1.
Step 2: Response surfaces
Build the RSA of the objective function and constraints of the problem around thecurrent iterate xk.
Step 3: Find the minimum of the approximate problem
Find the minimum xk,∗ of the constrained minimization problem defined by Eqs. 3.4-3.9 in the trust region limited by ∆k.
Step 4: Trust region test
Evaluate f and each of the properties mi in xk,∗ and calculate the trust regionratio for the objective and constraint functions as in Eq. 3.10.
ρk0 =f(xk,∗)− f(xk)
f(xk,∗)− f(xk)
ρkj =mj(xk,∗)−mj(xk)
mj(xk,∗)− mj(xk), 1 ≤ j ≤ M.
The solution fxk,∗ was accepted when ρk0 > 0 and one of the following two criteriawas met: i) the constraints in g(x) were feasible or; ii) |ρkj − 1| ≤ ρL,∀j. For thiswork, ρL = 0.25 was used. If the solution was accepted, the flag flgkTR = true wasset and xk+1 := xk,∗, otherwise flgkTR = false and xk+1 := xk.
Step 5: Trust region radius update
The trust region radius was updated as follows:
∆k+1 =
0.25∆k if flgkTR = false,∆k if flgkTR = true and ∥xk,∗ − xk∥ < ∆k,2∆k if flgkTR = true and ∥xk,∗ − xk∥ = ∆k.
JesúsCarro

60 New Methodologies for the Developmentand Validation of Electrophysiological Models
Step 6: Algorithm termination
The algorithm ended if one of the following conditions was satisfied:
1. ∥xk+1 − xk∥ < δ1 and flgkTR = true: The distance between the last twoaccepted iterates was too small to be significant.
2. ∥∇ϕ(xk+1)| < δ2 and flgkTR = true: The gradient of the Lagrangian functionwas too small. The Lagrangian function was defined as:
ϕ(x) = f(x) +M∑j=1
λkj ·mj(x)
where λkj are the Lagrange multipliers obtained in the constrained minimiza-
tion problem defined by Eqs. 3.4-3.9 in the trust region (limited by ∆k) inStep 3.
3. ∆k+1 < δ3: The trust region radius became too small.
If none of these criteria was satisfied, then set k := k + 1 and go to step 1.
3.2.2 Upgrade of the CRLP model
[K+]i dynamics in the CRLP model
One of the differences between the CRLP model and the ORd and TP06 modelslies in the representation of [K+]i dynamics. As mentioned above, in the CRLPmodel, as well as in the GPB model, [K+]i was assumed to be constant. Understeady-state conditions, [K+]i variations during an AP can be neglected. Never-theless, when there is a change in the investigated conditions or if the model issomewhat altered, [K+]i may reach a new steady-state value. This is the case,for instance, when the stimulation frequency is varied, as [K+]i becomes reducedin response to increased stimulation frequency [63, 117]. Another scenario where[K+]i dynamics are relevant is in the simulation of acute ischemia. Dutta et al.showed the limitations of using the GPB model with constant [K+]i [118]. In thepresent chapter, the methodology described in section 3.2.1 was used to incorpo-rate [K+]i dynamics into the CRLP model while retaining its capacity to reproduceexperimentally observed values of arrhythmic risk-related markers.
[K+]i dynamics were introduced through the following equation:
d
dt[K+]i = −IKtot ·
Cmem
Vmyo · Frdy(3.11)
where IKtot is the total potassium current, Cmem is the membrane specific capaci-tance, Vmyo is the bulk cytosol volume and Frdy is Faraday’s constant.
IKtot was calculated as the sum of all potassium currents and the stimulus cur-rent:
IKtot = Ito + IKr + IKs + IK1 − 2 · INaK + ICaK + IKp + Istim (3.12)
UniversidadZaragoza
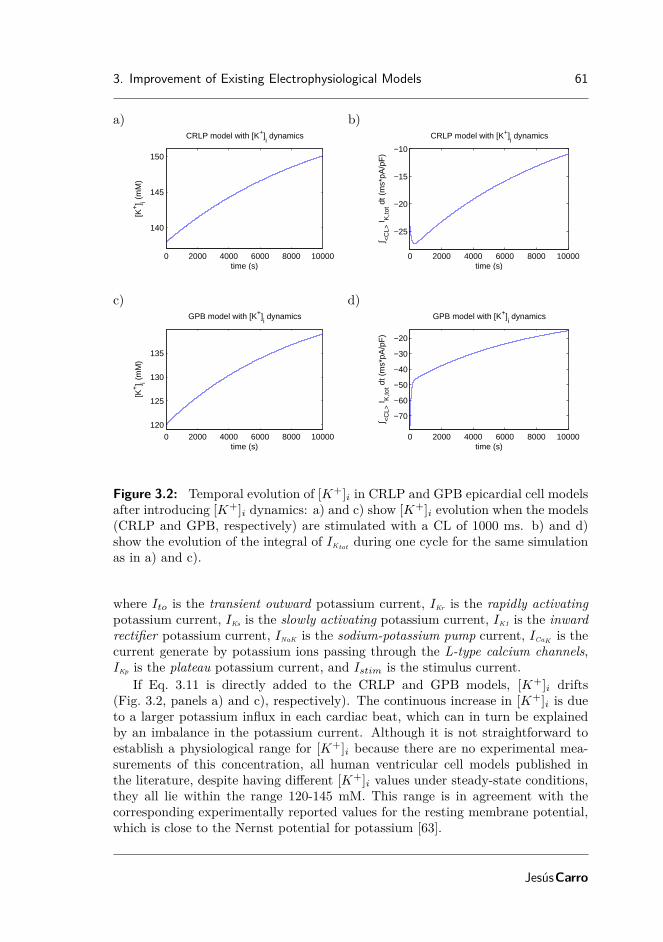
3. Improvement of Existing Electrophysiological Models 61
a) b)
0 2000 4000 6000 8000 10000
140
145
150
CRLP model with [K+]i dynamics
time (s)
[K+] i (
mM
)
0 2000 4000 6000 8000 10000
−25
−20
−15
−10
CRLP model with [K+]i dynamics
time (s)
∫ <C
L> I K
,tot d
t (m
s*pA
/pF
)
c) d)
0 2000 4000 6000 8000 10000120
125
130
135
GPB model with [K+]i dynamics
time (s)
[K+] i (
mM
)
0 2000 4000 6000 8000 10000
−70
−60
−50
−40
−30
−20
GPB model with [K+]i dynamics
time (s)
∫ <C
L> I K
,tot d
t (m
s*pA
/pF
)
Figure 3.2: Temporal evolution of [K+]i in CRLP and GPB epicardial cell modelsafter introducing [K+]i dynamics: a) and c) show [K+]i evolution when the models(CRLP and GPB, respectively) are stimulated with a CL of 1000 ms. b) and d)show the evolution of the integral of IKtot during one cycle for the same simulationas in a) and c).
where Ito is the transient outward potassium current, IKr is the rapidly activatingpotassium current, IKs is the slowly activating potassium current, IK1 is the inwardrectifier potassium current, INaK is the sodium-potassium pump current, ICaK is thecurrent generate by potassium ions passing through the L-type calcium channels,IKp is the plateau potassium current, and Istim is the stimulus current.
If Eq. 3.11 is directly added to the CRLP and GPB models, [K+]i drifts(Fig. 3.2, panels a) and c), respectively). The continuous increase in [K+]i is dueto a larger potassium influx in each cardiac beat, which can in turn be explainedby an imbalance in the potassium current. Although it is not straightforward toestablish a physiological range for [K+]i because there are no experimental mea-surements of this concentration, all human ventricular cell models published inthe literature, despite having different [K+]i values under steady-state conditions,they all lie within the range 120-145 mM. This range is in agreement with thecorresponding experimentally reported values for the resting membrane potential,which is close to the Nernst potential for potassium [63].
JesúsCarro

62 New Methodologies for the Developmentand Validation of Electrophysiological Models
In Fig. 3.2, panels b) and d), the integral of the total potassium current duringone cardiac cycle is shown, which gives an idea of how far the models are from equi-librium. The above noted issue associated with the introduction of [K+]i dynamicsinto the CRLP model can be sorted out by readjusting the current conductances tomaintain [K+]i homeostasis. Since, at the same time, the performance of the modelin terms of representation of electrophysiological behavior wants to be retained, aconstrained optimization problem was formulated in this study. This problem wastackled by applying the response surface-based optimization methods presented in3.2.1.
For further model assessment, optimization was performed as described in thenext paragraph while considering different initial [K+]i values in the range 120-145mM.
Optimization-driven model parameter update
A new set of current conductances for the modified CRLP model was sought suchthat potassium homeostasis was preserved while a number of electrophysiologicalproperties were guaranteed to remain within experimental limits. This was statedas a constrained optimization problem of the form:
min(∫
<CL>
IKtot(x))2
(3.13)
subject tomLL ≤ m(x) ≤ mUU , (3.14)xL ≤ x ≤ xU , (3.15)
where x is the vector of scaled current conductances (see 3.2.1), with lower anupper bounds xL and xU , respectively,
∫<CL>
represents the integral during acardiac cycle and m is a vector function of selected electrophysiological propertieswith lower and upper physiological bounds defined by vectors mLL and mUU .Initialization was defined based on the epicardial CRLP model (where [K+]i takesa constant value of 138 mM). Other initializations were additionally tested, asdescribed in 3.2.2.
Constraint functions
Seven ventricular electrophysiological properties of epicardial cells were consideredfor definition of inequality constraints in 3.2.2:
• APD90: APD is considered the main preclinical marker of drug cardiotoxi-city. APD prolongation has been linked to long QT syndrome and increasedrisk of developing Torsades de Pointes [76, 77]. In this study, APD90 wasused to denote AP duration at 90% repolarization.
• Triangulation: This marker quantifies the shape of the final part of theAP and is defined as the difference between APD at 90% and 50% of repo-larization. Low triangulation values indicate square APs, while high values
UniversidadZaragoza

3. Improvement of Existing Electrophysiological Models 63
indicate triangular APs. Triangulation has been proposed as a marker of pro-arrhythmia [76], with long APD90 values without triangular APs consideredas anti-arrhythmic and with triangular APs considered as pro-arrhythmic ingeneral.
• Systolic and diastolic intracellular calcium ([Ca2+]i) levels: Calciumtransient properties evaluated at different pacing frequencies have been re-ported as arrhythmic risk markers [78, 79]. In this study, diastolic (restinglevel) and systolic (peak value) calcium transient levels were evaluated at 0.5Hz and 1 Hz steady-state pacing.
• Time constants of APD90 adaptation to abrupt changes in CL: Adap-tation of ventricular repolarization duration to abrupt changes in CL has beenproposed as an arrhythmic risk marker [80]. In this study, the dynamics ofAPD90 adaptation to abrupt changes in CL were fitted by two exponentialswith associated time constants τfast and τslow, following the methodologyproposed in Pueyo et al. [13]. Only τslow has been considered since there isno available quantitative experimental data on τfast values.
Two stimulation protocols were used to calculate the above described markers:
• Steady-state protocol: A train of 3,000 stimulation pulses was deliveredat a given CL. Simulations were carried out using two different CL values:1,000 and 2,000 ms. The evaluated markers were: APD90 and triangulationat 1,000 ms; and diastolic and systolic [Ca2+]i at 1,000 and 2,000 ms.
• Abrupt changes in CL protocol: The cell was stimulated with a CLof 1,000 ms for 8 minutes and then with a CL of 600 ms for additional 8minutes. APD90 dynamics after the abrupt CL change were best fitted bytwo exponentials, the second of which was characterized by τslow.
Physiological bounds for constraint functions
Lower and upper bounds mLL and mUU were defined according to physiologicalexperimental values reported in the literature for the analyzed properties. Theselected range for APD90 was 280-310 ms. Even though some studies have reportedwider ranges, up to 271-366 ms [2, 8, 95], a restricted interval was used to keepthe model within the same range of existing human ventricular cell models [15, 46,51, 63, 119]. The range for triangulation was 44-112 ms [2, 95]. For the diastolicand systolic [Ca2+]i levels at 1 Hz and 0.5 Hz stimulation, the CRLP model, asoccurs with other recent human ventricular AP models (GPB, ORd, TP06, TP04)[12, 15, 46, 51, 63, 119, 120], is out of the physiological range reported in theliterature [10, 96]. For that reason, the physiological range was extended to ensurea feasible solution of the optimization problem. Nevertheless, the optimal solutionwas evaluated to confirm that either it let the model lie within physiological rangeor at least improved the results of the CRLP model. The physiological range forτslow was set to 70-110 s [94]. Table 3.1 summarizes the evaluated markers and
JesúsCarro

64 New Methodologies for the Developmentand Validation of Electrophysiological Models
Physiol.Range
SelectedRange
CRLPModel
Thiswork
APD90 (ms) 271-366 280-310 305.6 280.9Triangulation (ms) 44-112 44-112 78 84.6Sys. [Ca2+]i 1Hz (µM) 1.59-2.01 0.602-2.01 0.602 0.701Sys. [Ca2+]i 0.5Hz (µM) 0.71-1.68 0.523-1.68 0.523 0.664Dia. [Ca2+]i 1Hz (µM) 0.20-0.33 0.097-0.33 0.097 0.100Dia. [Ca2+]i 0.5Hz (µM) 0.14-0.32 0.091-0.32 0.091 0.096τslow (s) 70-110 70-110 105.6 106.0∫CL
IKtot · dt (ms·pA/pF) -28.52 -3.9·10−9
Table 3.1: Electrophysiological markers evaluated in the proposed response sur-face approximation-based optimization.
their physiological ranges in the second column, whereas the third column indicatesthe lower and upper bounds used for the optimization.
Sensitivity Analysis
Prior to solving the minimization problem, a sensitivity analysis was performed onthe CRLP model following the methodology described by Romero et al.[12]. Theaim was to identify the conductances that most notably influenced the objectivefunction (the integral of the total potassium current) and the constraints (elec-trophysiological properties) in order to define the set of decision variables for theoptimization.
For the sensitivity analysis, the conductances were varied by ±30% one at atime. Fourteen conductances were considered in the sensitivity analysis, namely:Gto, the maximal conductance of the transient outward potassium current; GKs,the maximal conductance of the slowly activating potassium current; GpCa, themaximal conductance of the sarcolemmal calcium pump; GKr, the maximal conduc-tance of the rapidly activating potassium current; GKp, the maximal conductanceof the plateau potassium current; GNaK , the maximal activity of the Na-K pump;Gncx, the maximal activity of the Na-Ca exchanger; GCaL, the maximal conduc-tance of the L-Type calcium current; GK1, the maximal conductance of the inwardrectifier potassium current; GNa, the maximal conductance of the fast sodium cur-rent; GClCa, the maximal conductance of the calcium-activated chloride current;GNa,Bk, the maximal conductance of the background sodium current; GCl,bk, themaximal conductance of the background chloride current; and GCa,bk, the maximalconductance of the background calcium current.
For each property m and conductance p, the percentage of change (Dm;p;a) andsensitivity (Sm;p;a) were calculated as follows [12]:
Dm;p;a =Mp;a −Mcontrol
Mcontrol· 100,
UniversidadZaragoza
3. Improvement of Existing Electrophysiological Models 65
Sm;p;a =Dm;p;a −Dm;p;−a
2 · a· 100,
where Mp;a is the value of property m when the conductance p is varied by thepercentage a and Mcontrol is the value of property m under control conditions. Asshown above, sensitivity (Sm;p;a) is calculated as the ratio of the difference betweenthe percentage of change (Dm;p;a −Dm;p;−a) and the interval of change (2 · a). Inparticular, for this study a = 30%:
Sm;p;0.3 =Dm;p;0.3 −Dm;p;−0.3
2 · 0.3· 100 =
Mp;0.3 −Mp;−0.3
Mcontrol· 10
5
6
Sensitivity was calculated for each of the electrophysiological markers describedin section 3.2.2 and for the integral of the total potassium current (IKtot ) duringone cardiac cycle at 1 Hz steady-state pacing.
Model Comparison
Considering the difficulty of directly comparing the absolute value of each con-ductance for different computational models, due to the dependence on the wholecurrent formulation, ionic current traces calculated during a cardiac cycle at 1 Hzsteady-state pacing were compared for the CRLP, TP06, GPB and ORd models.The comparisons aimed at verifying that the modified CRLP model had currentdensities of similar magnitude and ionic currents of similar shapes as calculatedwith other published models.
3.2.3 Frequency-dependence behavior
Pacing at different frequencies was simulated to assess whether the modified CRLPmodel retained the frequency-dependence behavior of the original CRLP model. Tothis end, APD90 was calculated at steady-state for CLs ranging from 250 to 5000ms (in each case computed after pacing for 3,000 cycles).
3.2.4 Simulation of changes in potassium concentration
Hypokalemic and hyperkalemic conditions were simulated with the original andthe modified CRLP models. Two types of simulations were performed to comparethe models with the experimental results.
First, the effect of changing [K+]o was assessed when the cell was not stimu-lated to compare with the experimental results described in [121]. Subsquently,and following the experiments performed in [115], the extracellular potassium con-centration, [K+]o, was increased from 2 mM to 7 mM in 0.5 mM steps usinga homogeneous 4-cm long fiber composed of epicardial cells. The physiological[K+]o value of 5.4 mM replaced the value of 5.5 mM in the simulations [115]. Theconductivity σ, defining the velocity of the stimulus propagation, was set to rendera Conduction Velocity (CV) close to 65 cm/s under control conditions [87]. Thecell capacitance was set to Cm = 1 µF/cm2. For each [K+]o value, the model wasfirst stabilized (without stimulation) until the product of the gates h·j reached 99%
JesúsCarro

66 New Methodologies for the Developmentand Validation of Electrophysiological Models
of the steady-state value hss · jss, which was subsequently followed by 1 Hz pacingsimulation. Stimulus current pulses twice the diastolic threshold were applied atone end of the cable. The diastolic threshold was defined as the minimum ampli-tude required for propagating five pulses along the fiber. The model was studiedby stimulating the tissue with a train of 100 basic stimulations (S1) delivered at aCL of 1,000 ms. [K+]i was measured at the end of each stimulus at five differentpositions along the cable situated at distances from the origin of 1.5, 1.75, 2, 2.25and 2.5 cm. The average value over the five locations was calculated.
3.2.5 Implementation
The CRLP model was implemented in Matlab based on the original CellML file[119]. The code used to compute the simulations and to calculate the differentmarkers is freely available at https://github.com/ChusCarro/MatCardiacMLab/releases/tag/0.1.0.
The minimization algorithm was implemented in Matlab. For 1D tissue simu-lations, a semi-implicit operator-splitting scheme implemented in Fortran was usedto solve the propagation [86] with a space discretization of ∆x = 0.1 mm and atime discretization of ∆t = 0.002 ms, as in [119].
All computations were performed by using the high performance computingcluster (ICTS) “NANBIOSIS”. Details about the cluster can be found at: http://www.nanbiosis.es/u27-e1-hermes-cluster
3.3 Results
3.3.1 Sensitivity Analysis
Results of the sensitivity analysis applied to the epicardial version of the CRLPmodel are shown in Figure 3.3. The value of the integral of the total potassiumcurrent, IKtot , in one cardiac cycle was highly dependent on the conductance ofthe background chloride current, GCl,bk, and the L-type calcium current, GCaL (S30
values of -412.62% and 396.83%, respectively). Other currents were also found toplay an important role in regulating potassium homeostasis: GNaK , 199.46%; GK1,-152.06%; Gto, -110.57%; GKr, -81.16%; and Gncx 62.72%. The currents with thelargest effect on the APD were found to be the same as for the objective function,although the sensitivities were notably reduced: GCl,bk, -48.56%; and GCaL, 33.41%.Triangulation was mainly modulated by: GK1, -57.7664%; and GKr, -20.1113%.Diastolic and systolic [Ca2+]i values were mostly influenced by GCaL (27.65% and171.71%, respectively). These markers were also influenced by changes in thefollowing conductances: GNaK (-16.08%, -78.62%), Gncx (-15.74%, -74.48%), GCl,bk
(-14.53%, -80.66%) and GCa,bk (11.51%, 47.46%). Regarding τslow, GNaK was theconductance with the largest effect on this marker (-128.37%), with the remainingconductances not playing a significant role.
Based on these results, five conductances were selected as decision variables forthe minimization problem described in 3.2.2, namely: GCl,bk, GCaL, Gncx, GK1, andGto. Of note, GNaK was discarded because any modification on this conductance
UniversidadZaragoza

3. Improvement of Existing Electrophysiological Models 67
Figure 3.3: Results of the sensitivity analysis applied to the original CRLP model.The blue scale indicates relative sensitivity for each marker. White color indicatesmaximum relative sensitivity and dark blue color indicates that property and pa-rameter are independent. Percentages in the white boxes indicate the absolutesensitivity of the property. A minus sign in a box indicates that marker and modelparameter vary inversely. ‘Trian’ stands for Triangulation, ‘Sys’ stands for systolicand ‘Dia’ stands for diastolic.
JesúsCarro
68 New Methodologies for the Developmentand Validation of Electrophysiological Models
significantly influenced τslow, with this effect not being counterbalanced by changesin any other conductance (see Figure 3.3).
3.3.2 Non-linear optimization
The optimization algorithm found a minimum after four iterations. Variations inthe updated current conductances with respect to their initial values were: GCl,bk,+19.34%; GCaL, +3.93%; Gncx, -33.25%; GK1, -14.08%; and Gto, +22.35%.
With this new set of conductance values, and after introducing [K+]i dynamicsin the model, [K+]i stabilized at 138 mM. The value of the electrophysiologicalmarkers are described in table 3.1. All markers were within physiological ranges orcloser than with the original CRLP model (last column in table 3.1).
When the model was optimized while considering different initial [K+]i valuesin the range 120-145 mM, results were practically coincident with those reportedabove for [K+]i initialized at 138 mM. At steady-state, [K+]i reached a value of138 mM as well, differences in the values of the markers where below 1% and themaximum difference between optimal conductances was lower than 2.5%. In thiscase, the algorithm required six iterations rather than four to reach the optimalsolution.
3.3.3 Model Comparison
To evaluate the impact of the new values for the estimated ionic conductances inthe modified CRLP model, the AP and the associated ionic currents (ICaL, IK1,Incx, ICl,bk and Ito) were compared with the equivalent properties in the originalCRLP model and in other human ventricular cell models. The results are shownin Fig. 3.4. Other currents that were not considered for the optimization but thatcould be altered as well, like IKr, IKs and IKp, are shown in Fig. 3.5.
The main differences in the AP between the original and modified CRLP modelswere a decrease in the membrane potential during the plateau phase as well asshortening of the APD. There were small differences in the peak value of somecurrents, but in all cases the modified CRLP model was within the range of theother models or within experimentally reported bounds. ICaL peak was larger in themodified model with respect to the GPB model and the original CRLP model, butsmaller than in the TP06 model. IK1 peak was slightly smaller in the modified modelwith respect to the original CRLP model, which had the smallest peak value amongall ventricular models, but in any case within the range reported experimentally(0.4-1.8 pA/pF[75, 95]).
An important finding was that, while Gncx and GCl,bk in the modified CRLPmodel were significantly different from those in the original CRLP model (-33.25%and +19.34% respectively), the effects in terms of ionic current traces led to bothIncx and ICl,bk not being notably different from those in the original CRLP model.The IKp current remained as in the original model, while IKs was different but tookreally small values in both cases. IKr was diminished in amplitude by 32.6% andits integral during a cycle was reduced by 30% with respect to the CRLP model.The extent of APD prolongation following blockade of this current was 10% for the
UniversidadZaragoza

3. Improvement of Existing Electrophysiological Models 69
a)
0 100 200 300 400 500−100
−50
0
50
V (
mV
)
time (ms)
Action Potentialb)
0 100 200 300 400 500120
130
140
150
[K+] i (
mM
)
time (ms)
Intracellular Potassium Concentration
c)
0 100 200 300 400 500−1
−0.5
0
0.5
I ncx (
pA/p
F)
time (ms)
Sodium−Calcium Exchanger currentd)
0 100 200 300 400 500−10
−5
0
I Ca,
L (pA
/pF
)
time (ms)
L−Type Calcium current
e)
0 100 200 300 400 500−1
0
1
2
I K1 (
pA/p
F)
time (ms)
Inward Rectifier Potassium currentf)
0 100 200 300 400 500−10
0
10
20
I to (
pA/p
F)
time (ms)
Transient Outward current
g)
0 100 200 300 400 500−1
0
1
2
I Cl,B
k (pA
/pF
)
time (ms)
Background Chloride current
0 100 200 300 400 500−100
−50
0
50
V (
mV
)
time (ms)
Action Potential
This workCRLPGPBTP06ORd
Figure 3.4: Model comparison. Blue lines represent the results of this workwith inclusion of [K+]i dynamics, green lines represent the CRLP model, red linesrepresent the GPB model, cyan lines represent the TP06 model and purple linesrepresent the ORd model. All the figures show results at steady-state (after pacingfor 3,000 cycles at a CL of 1000 ms). a) Action potential; b) Intracellular potassiumconcentration; c) Sodium-calcium exchanger Current; d) L-type calcium current; e)Inward potassium current; f) Transient outward potassium current; and g) Back-ground chloride Current.
JesúsCarro

70 New Methodologies for the Developmentand Validation of Electrophysiological Models
a)
0 100 200 300 400 5000
0.5
1
I Kr (
pA/p
F)
time (ms)
Rapid Delayed Rectifier Potassium current
0 100 200 300 400 5000
0.1
0.2
I Kr (
pA/p
F)
time (ms)
Rapid Delayed Rectifier Potassium current
b)
0 100 200 300 400 500−0.5
0
0.5
1
I Ks (
pA/p
F)
time (ms)
Slow Delayed Rectifier Potassium current
0 100 200 300 400 500−0.01
0
0.01
I Ks (
pA/p
F)
time (ms)
Slow Delayed Rectifier Potassium current
c)
0 100 200 300 400 5000
1
2
I Kp (
pA/p
F)
time (ms)
Plateau Potassium current
0 100 200 300 400 5000
0.05
0.1
I Kp (
pA/p
F)
time (ms)
Plateau Potassium current
0 100 200 300 400 500−100
−50
0
50
V (
mV
)
time (ms)
Action Potential
This workCRLPGPBTP06ORd
Figure 3.5: Model comparison. The colors in this figure are the same as thoseused in Fig.3.4. Results are shown at steady-state (after pacing for 3,000 cycles ata CL of 1000 ms). The graphics on the right are zoomed versions of the graphicson the left. a) Rapid delayed rectifier potassium current; b) Slow delayed rectifierpotassium current; and c) Plateau potassium current.
UniversidadZaragoza

3. Improvement of Existing Electrophysiological Models 71
1000 2000 3000 4000 50000
50
100
150
APD
90 (
%)
CL (ms)1000 2000 3000 4000 5000
0
50
100
150
APD
90 (
%)
CL (ms)
This workCRLP
Figure 3.6: Steady-state APD90 values as a function of pacing CL.
a) b)
0 100 200 300
time (ms)
-95
-90
-85
-80
-75
V (
mV
)
0 100 200 300
time (ms)
-95
-90
-85
-80
-75
V (
mV
)
Ko = 2.5 mM
Ko = 3.0 mM
Ko = 3.5 mM
Ko = 4.0 mM
Ko = 4.5 mM
Ko = 5.0 mM
Ko = 5.4 mM
Ko = 6.0 mM
Ko = 6.5 mM
Ko = 7.0 mM
3 4 5 6 7
[K+]o (mM)
0
50
100
150
200
t 90%
(m
s)
Figure 3.7: Results for an unstimulated cell simulated with the modified CRLPmodel following changes in [K+]o. a) Temporal evolution of membrane potential;b) Time to achieve 90% of the steady-state membrane potential (t90%).
modified CRLP model, as compared to 14% for the original CRLP model, beingboth values within experimentally defined limits [53].
3.3.4 Frequency response
Fig. 3.6 shows steady-state normalized APD90 values calculated with the originaland modified CRLP models. Normalization was performed with respect to theAPD90 value for CL=1000 ms. Both models presented very similar behaviors,with the only relevant difference being observed for CL=250 ms. For this CL, themodified CRLP model showed alternans, while the original CRLP model did not.
3.3.5 Response to changes in extracellular potassium
Fig. 3.7a shows the temporal evolution of membrane potential following changes in[K+]o for an unstimulated cell simulated with the modified CRLP model. Duringthe first 100 ms, membrane potential varied following the corresponding changein [K+]o, in line with the results reported in [121]. Figure 3.7b shows the time
JesúsCarro

72 New Methodologies for the Developmentand Validation of Electrophysiological Models
a) b)
3 4 5 6 7
[K+]o (mM)
137
137.2
137.4
137.6
137.8
138
138.2
138.4
138.6
[K+] i (
mM
)
CRLPThis work (t = 20 s)This work (t = 40 s)This work (t = 60 s)This work (t = 80 s)This work (t = 100 s)
0 20 40 60 80 100Time (s)
137
137.2
137.4
137.6
137.8
138
138.2
138.4
138.6
[K+] i (
mM
)
K = 2.5 mMK = 3.5 mMK = 4.5 mMK = 5.4 mMK = 6.5 mMK = 7.0 mM
Figure 3.8: [K+]i evolution following [K+]o changes simulated with the modifiedCRLP model. a) [K+]i dependence on [K+]o at different time instants; b) timecourse of [K+]i for different [K+]o values.
needed to reach 90% of the steady-state membrane potential (t90%). The value fort90% in the simulation for the same change in [K+]o than in [121] (from 4.4 mM to6.6 mM) was 16.2 ms, which is somewhat faster than the experimentally reportedresults in [121] for rabbit (80 ms) and rat (147 ms) ventricular myocytes.
Fig. 3.8a shows a snapshot of [K+]i values calculated with the modified CRLPmodel at different times following changes in [K+]o as described in 3.2.4. Fig. 3.8bshows the temporal evolution of [K+]i in response to changes in [K+]o. Under con-trol conditions, [K+]i remained constant in time. As expected, following simulatedhyperkalemia ([K+]o > 5.4 mM), [K+]i increased as [K+]o increased, whereasfor simulated hypokalemia ([K+]o < 5.4 mM), [K+]i decreased in response to[K+]o decreases. For [K+]o ≤ 2.0 mM , tissue became inexcitable. In table 3.2,the steady-state value of [K+]i in the optimized CRLP model is shown for eachsimulated [K+]o value.
3.3.6 Computational Cost
Each iteration of the optimization algorithm involved computations associated witha number of stimulation protocols. In Table 3.3, a summary of the computationalcost is shown for each of the protocols. In each iteration, the protocols were runtwice: one for the generation of the database (243 simulations in parallel) andanother one for the evaluation of the solution (6 simulations in parallel). Thevariance in the computation times is due to the fact that computations were run indifferent nodes of a high performance computing cluster, namely the one describedin section 3.2.5. The four iterations of the optimization algorithm were computedin 23 hours and 16 minutes.
UniversidadZaragoza
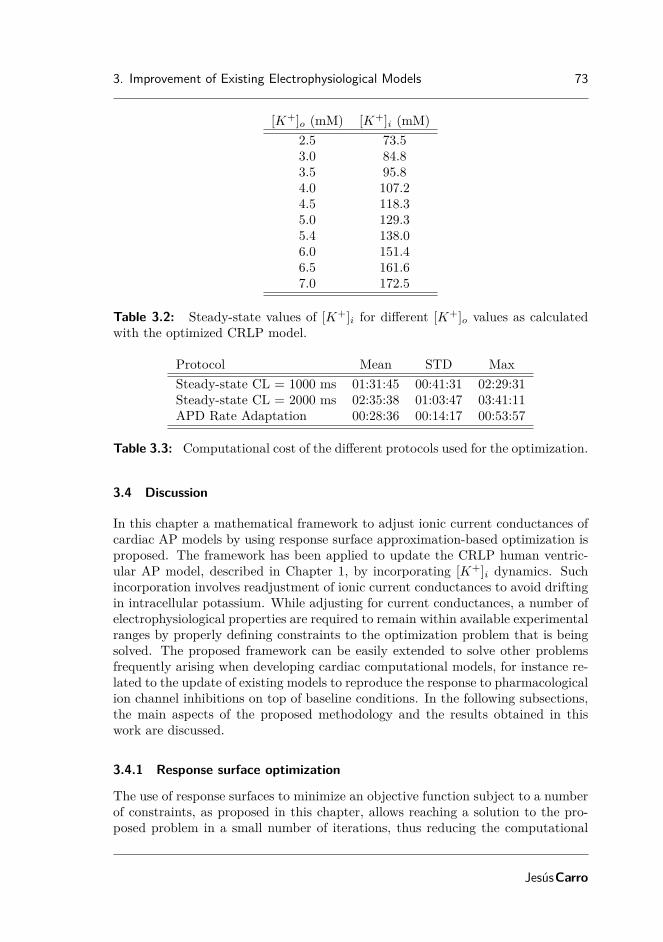
3. Improvement of Existing Electrophysiological Models 73
[K+]o (mM) [K+]i (mM)2.5 73.53.0 84.83.5 95.84.0 107.24.5 118.35.0 129.35.4 138.06.0 151.46.5 161.67.0 172.5
Table 3.2: Steady-state values of [K+]i for different [K+]o values as calculatedwith the optimized CRLP model.
Protocol Mean STD MaxSteady-state CL = 1000 ms 01:31:45 00:41:31 02:29:31Steady-state CL = 2000 ms 02:35:38 01:03:47 03:41:11APD Rate Adaptation 00:28:36 00:14:17 00:53:57
Table 3.3: Computational cost of the different protocols used for the optimization.
3.4 Discussion
In this chapter a mathematical framework to adjust ionic current conductances ofcardiac AP models by using response surface approximation-based optimization isproposed. The framework has been applied to update the CRLP human ventric-ular AP model, described in Chapter 1, by incorporating [K+]i dynamics. Suchincorporation involves readjustment of ionic current conductances to avoid driftingin intracellular potassium. While adjusting for current conductances, a number ofelectrophysiological properties are required to remain within available experimentalranges by properly defining constraints to the optimization problem that is beingsolved. The proposed framework can be easily extended to solve other problemsfrequently arising when developing cardiac computational models, for instance re-lated to the update of existing models to reproduce the response to pharmacologicalion channel inhibitions on top of baseline conditions. In the following subsections,the main aspects of the proposed methodology and the results obtained in thiswork are discussed.
3.4.1 Response surface optimization
The use of response surfaces to minimize an objective function subject to a numberof constraints, as proposed in this chapter, allows reaching a solution to the pro-posed problem in a small number of iterations, thus reducing the computational
JesúsCarro
74 New Methodologies for the Developmentand Validation of Electrophysiological Models
cost with respect to other previously published approaches. In [114], Rodriguezet al. proposed an algorithm that uses augmented Lagrangian techniques andrelies on successively building RSA of the augmented Lagrangian to solve a mini-mization problem like that defined by Eqs. 3.1-3.4. In this chapter, the trust regionratio was used to independently validate the RSA for the objective function and theconstraints instead of considering the augmented Lagrangian of the problem. Ourproposal led to a reduction in the number of times the database was generated and,thus, simplified the implementation. The model that is optimized in the presentwork is much more complex than those used in [114], but the number of times thedatabase was generated was smaller than in all the cases described in [114].
Also, differently to other optimization algorithms based on e.g. Genetic Algo-rithms [111, 113], the response surface approach proposed in this chapter guaran-tees the convergence to a local minimum of the problem when the response surfacesare built such that they match the objective function up to the first order aroundthe point where the approximation is built. In addition, our response surface ap-proach allows identifying a potential minimum anywhere within the trust region,not necessarily contained in the database.
Finally, in this chapter the proposed optimization algorithm was used to solve aproblem where a new characteristic was added to a human ventricular cell model,the CRLP model, while a number of electrophysiological markers were guaranteedto remain within physiological range or closer to it than with the original CRLPmodel. In other studies, like [122], the aim of the analysis is similar, but, as opposedto the present study, the objective function is defined to include multiple electro-physiological properties, for some of which a physiological range may be availablewhile for others it may not, rather than considering the electrophsyiological proper-ties as elements to define the constraints imposed in the optimization. In any case,the same response surface approximation-based optimization algorithm employedin the present study could be applied to the problem defined in [122].
3.4.2 Database generation
The size of the database depends on the selected sampling technique. In thischapter a three-level full factorial design was used for sampling, which involved3N sample points, with N the number of variables to be adjusted (five in thisstudy). However, the proposed optimization framework is independent of the sam-pling strategy or the size of the database as long as the database provides enoughinformation to fit the response surface. For instance, increasing the factorial num-ber from 3 to 5 (the database size increased from 35 = 243 to 55 = 3125 samplepoints) only reduced the total number of iterations from 4 to 3, without changingthe identified optimum. However, the computational cost increased tenfold.
The advantage of using factorial designs is that they provide unbiased informa-tion for parameter identification with polynomial RSAs since they provide optimalspace filling [116]. However, other sampling strategies are also possible. MonteCarlo simulations represent a very flexible sampling strategy where the optimalnumber of sampling points can be defined in terms of the type of RSA to be used.
UniversidadZaragoza

3. Improvement of Existing Electrophysiological Models 75
In this regard, Monte Carlo simulations were used in [123] to perform sensitivityanalysis in electrophysiological models by means of linear multivariate regression.In addition to generating the required data for model fitting, Monte Carlo simula-tions were also used to perform population-based simulation studies, as in Wamsleyet al. [124].
In this chapter, the full factorial technique was implemented in order to guar-antee that the algorithm was not limited by the sampling technique since thegenerated database is sufficient to build a second order response surface. However,as mentioned above, other techniques could be tested to reduce the computationalcost when a larger number of current conductances are involved or when largeparallel computing capacity is not available.
3.4.3 Computational cost
The major benefit of the methodology proposed in this chapter in terms of com-putational cost is the high degree of parallelization. It should be noted that theglobal computation time depends mainly on two factors: the employed cell modeland the stimulation protocols that are performed. As compared to the CRLP orGPB models, which take long computation times, the computational time for amodel like TP06 could be reduced to just a few hours. For the computations ofthis study a high performance computing cluster was used. The number of simula-tions involved per iteration makes it possible to use other types of infrastructuressuch as GPUs.
Nevertheless, the computation times associated with the presented methodologybased on response surface approximations are short if compared with those for thesame optimization solved by using a genetic algorithm, which could require around100 generations and would cost more than 350 hours, even if all individuals in thepopulation were simulated in parallel. In [111], 500 generations were needed to fitthe model, which would still involve longer computation times.
3.4.4 Definition of the optimization problem
In this chapter, the integral of the total potassium current (IKtot ) during one cardiaccycle was selected as the objective function for minimization. This selection wasmade to maintain [K+]i homeostasis after incorporation of [K+]i dynamics intothe CRLP human ventricular model. Optimal current conductances were identi-fied, with additional constraints imposed to guarantee that fundamental electro-physiological properties took values within experimental limits. For some of thoseproperties the physiological range reported in experimental studies of the literatureis extremely large. To avoid a solution for the modified CRLP model that, althoughin physiological range, was very far from the average experimental behavior, therange of allowed APD values was somewhat restricted, as described in 3.2.2.
JesúsCarro

76 New Methodologies for the Developmentand Validation of Electrophysiological Models
3.4.5 Model comparison
The adjusted CRLP model developed in this study was compared with previoushuman ventricular AP models published in the literature, namely the CRLP, GPB,TP06 and ORd models. This comparison was made in terms of AP traces, [K+]iconcentrations and ICaL, IK1, Incx, ICl,bk and Ito currents. In practically all cases,the results obtained for the adjusted CRLP model were along the lines of thoseobtained with the other models. The only current that was found to be smaller forthe modified CRLP model as compared to the other models, including the originalCRLP model, was IKr. This reduced current led to shorter APD prolongationfollowing IKr blockade, but still within experimentally reported limits. Specifically,in [53] an average APD prolongation of 56.3% with a standard deviation of 34.6%was reported. The difference between the mean experimental prolongation andthat obtained for the modified CRLP model was within twice the experimentalstandard deviation.
One of the differences between the GPB / CRLP models and the other humanventricular models is the inclusion of the ICl,bk current. This current was expected tohave a minor role in modulating electrophysiological properties, but, as reported in[120], APD showed the highest sensitivity (-86%) to changes in the maximal ionicconductance of the ICl,bk current. In the CRLP model, this sensitivity was reduced(-46%) but it was still large. As there is similarity between the sensitivities ofthe APD and the integral of the total potassium current to variations in ionicconductances (see Figure 3.3), the ICl,bk current ended up having a very importantindirect role in modulating potassium balance.
As shown in the presented results, major differences between the modified andthe original CRLP models include APD shortening and decrease in the membranepotential during the plateau phase. Regarding the latter, experimental results [125]show that the plateau voltage takes values around 18 mV, while in the modifiedCRLP model the plateau voltage is 8 mV. Differences in Incx and ICl,bk, even if notlarge, could still underlie those major deviations of the modified CRLP model withrespect to the original one. Future studies could include the membrane potentialduring the plateau phase as an electrophysiological marker to be included in theoptimization algorithm for model refinement. This could definitely have an impacton balancing the currents involved in this phase of the AP.
Our results demonstrate that with the proposed methodology it was possibleto successfully update the CRLP model by incorporating [K+]i dynamics whilekeeping the model’s ability to reproduce risk-related markers for investigation ofcardiac arrhythmias. As described in Table 3.1, the evaluated risk markers remainwithin experimental limits or are closer to their physiological values than with theoriginal CRLP model.
3.4.6 Response to potassium concentration changes
While for some investigations the assumption of constant [K+]i may be valid,there are many situations where [K+]i varies, for instance following changes in thefrequency of stimulation or in [K+]o values. As shown in 3.2.2, the assumption of
UniversidadZaragoza

3. Improvement of Existing Electrophysiological Models 77
constant [K+]i may also hide an imbalance between potassium currents and [K+]i,as the latter is not allowed to change.
Simulation results obtained when varying the level of [K+]o allowed confirmingthat both the incorporation of [K+]i dynamics and the use of the optimization algo-rithm to readjust the ionic conductances improved the CRLP model for simulationof abnormal conditions (see section 3.3.5). Although there are no experimentalmeasurements of [K+]i, the model can be assessed by using measurements thatindirectly validate its behavior. On the one hand, the model is able to reproducebehaviors similar to those of the experimental results presented in [121]. On theother hand, the inclusion of [K+]i dynamics make it possible to evaluate variationsin [K+]i in response to [K+]o changes like those reported in hemodialysis scenarios[115]. In this latter case, simulated [K+]i variations were in the expected directionas to compensate for the effects of changing [K+]o.
When [K+]o increases, there is an increase in the Nernst potential for potas-sium and, thus, a reduction in the driving force of potassium, which diminishesthe amount of potassium leaving the cell. Additionally, an increase in [K+]o al-ters the current through the sodium-potassium pump. Both effects contribute toincrease [K+]i, which leads to a reduction in the Nernst potential for potassium,thus returning the cell to an equilibrium state.
3.5 Conclusions
The optimization framework proposed in this chapter allows estimating ionic cur-rent conductances of AP models at an affordable computational cost while guar-anteeing physiologically plausible values of selected electrophysiological properties.This framework has been applied to introduce [K+]i dynamics into the CRLPhuman ventricular AP model developed in Chapter 1. Solving the formulatedoptimization problem avoids the imbalance generated in the CRLP model afterintroducing [K+]i dynamics, without deteriorating the performance of the modelin terms of representation of electrophysiological behavior and arrhythmic risk-related properties. The updated CRLP model built in this chapter is thus suitablefor investigation of cardiac arrhythmias, particularly under conditions involvinglarge changes in [K+]i.
JesúsCarro


Chapter 4
Limitations inElectrophysiologicalModel Developmentand Validation
4.1 Introduction
Chapter 2 and chapter 3 deal with methodologies for the development and updateof electrophysiological models. Importantly, methodologies are also required forvalidation of new or updated model formulations based on available experimentaldata. Any methodology proposed for such purpose should consider all variablesand spatio-temporal scales involved in the corresponding modeling and simulation.This becomes a challenging task, particularly for complex biophysically detailedmodels. From the earliest mathematical model of an electrical cell’s action poten-tial (AP) developed by Hodgkin and Huxley in the fifties, the complexity of currentAP models has grown considerably. The advent of new experimental techniqueshas made large sets of experimental data readily available, which has motivatedthe development of more complex models to accurately describe cellular electri-cal activity. Whereas growing in model complexity is a natural consequence ofthe increased knowledge [126], the more complex the model, the more difficult theidentification of model parameters tends to be. An AP model involves the sum ofdifferent transmembrane ionic currents and the balance between intra- and extra-cellular ionic concentrations. Each ionic current follows a mathematical formulationin which several effects are modeled, e.g., ion channel activation and inactivationgating or current conductance. For each effect, a number of model parameters are
79
80 New Methodologies for the Developmentand Validation of Electrophysiological Models
identified based on data from experimental protocols specific for each particularionic current.
The experimental protocols used to obtain most of the parameters of each ioniccurrent are performed in isolated cells. But, due to the sensitivity of some ionicchannels to the cell isolation procedure applied prior to voltage-clamp experiments[105], the conductances of the ionic currents in cardiac models are often not esti-mated from direct measurements of the current density. Instead, individual chan-nel conductances are adjusted so that measures from model-generated APs closelymatch experimental AP measurements in tissue such as AP duration (APD) orothers. In the Courtemanche-Ramirez-Nattel (CRN) model [47], the ionic conduc-tances GNa, GK1, Gto, GKr and GKs were fitted to obtain a correct input resistance,AP morphology, AP amplitude (APA) and upstroke velocity (dV /dtmax). In a lateversion of the Luo-Rudy (LR) model [106], GKs was fitted to get the right APDprolongation when the IKs current was blocked. Taking those models as an exam-ple, in the tenTusscher-Noble-Noble-Panfilov (TNNP04) model [46], GKs was setto obtain physiologically plausible APD values for each cell type (epicardial, mid-myocardial and endocardial). In the Grandi-Pasqualini-Bers (GPB) model [15],GNa was set so as to reproduce experimental measurements of APA and maxi-mum value of the transmembrane potential (Vmax). In the O’Hara-Rudy dynamic(ORd) model [63], the potassium current conductances were fitted to reproduce theexperimental effect on the APD when they were blocked. In the Carro-Rodríguez-Laguna-Pueyo (CRLP) model [119], using the sensitivity analysis proposed in [12],GK1, GNaK , GCaL, and GNa were fitted to obtain not only APD values within physio-logical ranges, but also other markers of arrhythmic risk, including time constantsof APD rate adaptation or rate dependence of ionic concentrations.
On the contrary, the parameters that model current kinetics (gating parame-ters) are usually identified from single-cell experiments. The calibration processis usually performed using a nonlinear least square fitting of voltage clamp databy assuming that each parameter’s effect is independent from the rest (e.g., thesteady-state of an inactivation gate is calibrated against experimental results whileconsidering that the time constant of the gate does not affect such results, whichmight not be correct). However, when the complexity of the model increases, theinteraction between effects becomes increasingly important. Therefore, assumingindependence of the effects when identifying model parameters may be misleading.While other techniques have been proposed in recent years to improve the fitting ofthe gating parameters [108, 127–129], none of the models analyzed in the presentthesis have used such techniques.
Once model parameters have been identified, the resulting AP models are val-idated against experimental measurements commonly obtained also from tissuepreparations. Characteristics such as resting membrane potential (Vmin) and up-stroke velocity (dV /dtmax) are usually compared between model-generated andexperimental APs. In the CRN model, the role of different ionic conductances,the morphology of the AP and the behavior of the model for different pacing cyclelengths (CLs) were compared with experimental observations. In the updated ver-sion of the LR model [106], the theoretical APD restitution curve was compared
UniversidadZaragoza

4. Limitations in Electrophysiological Model Development andValidation 81
with experimental restitution curves obtained from optical recordings of cardiacAPs. In the TNNP04 model, simulated APD restitution curves (at 90% repo-larization, APD90) were evaluated in single cells to validate the model againstexperimental results measured in tissue preparations. Also in this model, prop-agation in a homogeneous one-dimensional (1D) tissue was simulated to validatethe model in terms of Conduction Velocity (CV). In a subsequent version of themodel, the ten Tusscher-Panfilov (TP06) model [51], simulated APD restitutioncurves (at 90% and 50% repolarization) in single cells were compared with experi-mental results. The GPB model was validated by comparing the predicted APD90
prolongation caused by blockade of different potassium currents with experimentalresults. The CRLP model, as the GPB model, was validated by comparing APD90
prolongation caused by potassium current blockades with experimental results, butalso by comparing a number of computed markers not used in the fitting process.
For the aforementioned reasons, issues may appear in the calibration and/orvalidation of electrophysiological models caused by two related aspects: submodelvariable relationships and cell-to-cell interactions during AP propagation. Regard-ing the first of such aspects, model parameters related to ion channel gating kinet-ics are commonly obtained by considering each gate of the channel independently.Regarding the second one, ionic conductances are adjusted or validated againstexperimental data obtained from tissue preparations while considering single cellcomputer simulations. In both circumstances, differences caused by not consid-ering the corresponding interactions introduce non-negligible cross-effects betweenmodel parameters that are not considered in the fitting process.
Other studies have analyzed issues related to the two aspects mentioned above.In [130] differences between models of the same species to represent electrophysi-ological properties and how these differences propagate to tissue simulations wereanalyzed. In [131] how the uncertainty in the definition of gating variables prop-agates in multi-scale models was studied and the need to use observations acrossmultiple scales was highlighted. In [132] problems caused by the use of obser-vations across multiple scales and how to characterize the relationships betweenmodel parameters and the effect they have in the multi-scale model outputs wasexplored.
In this chapter, experimental protocols are simulated in silico to analyze theconsequences of the corresponding interactions in two scenarios involving scalesranging from ion channels to tissue: 1) characterization of L-type calcium voltage-dependent inactivation; 2) identification of ionic current conductances with thelargest contribution to steady-state AP markers. In the first case, differences be-tween the mathematical model, simulation results and experimental measurementsare analyzed to evaluate how interactions between model components affect thedevelopment and validation of mathematical ion channel models. In the secondcase, differences between AP-based markers simulated in isolated cells and in ho-mogeneous 1D tissue are analyzed to evaluate how propagation affects their valuesas well as to assess the contribution of each ionic current to each marker.
JesúsCarro

82 New Methodologies for the Developmentand Validation of Electrophysiological Models
4.2 Materials and Methods
4.2.1 L-type calcium channel gating
In AP models, ionic currents are controlled by activation and inactivation gates.Gates are modeled by functions varying between 0 and 1. Below a threshold poten-tial, the activation gates are closed (the function value is 0) and the inactivationgates are open (value 1). When transmembrane potential increases, the activa-tion gates open (their values increase towards 1) and the inactivation gates close(their values decrease towards 0). In particular for the ICaL current, all human ven-tricular cell models analyzed in this thesis have one voltage-dependent activationgate d. This activation gate d multiplies the expression for the inactivation gat-ing, whose formulation largely differs between models. In this chapter four of themost recently developed human ventricular cell models were considered: the GPBmodel, the TP06 model, the ORd model and the CRLP model. Voltage-dependentinactivation of the L-type calcium current was studied in all of them.
The TP06 model is one of the most extensively used human ventricular APmodels. It represents an improved version of the model published in 2004 [46]in which the calcium dynamics, the slow delayed rectifier potassium current (IKs)and ICaL were reformulated. The TP06 model is based on experimental data fromhuman cardiomyocytes for most ionic currents and is defined for three types ofcells: epicardial, midmyocardial and endocardial. In the TP06 model, voltage-dependent ICaL inactivation is modeled as the product of a fast, f2, and a slow, f ,voltage-dependent inactivation gates as well as a calcium-dependent inactivationgate, fCa:
InactTP06Ca,L = f · f2 · fCa
These gates have different time constants (τf2 , τf and τfCa) and steady-state values
(f2,∞, f∞ and fCa,∞). This formulation is based on experiments that indicate thepresence of both fast and slow voltage-dependent ICaL recovery processes [1, 133,134].
The GPB model is based on the rabbit AP model proposed in [62], whichincludes subsarcolemmal and junctional compartments in the formulation of thecurrents and provides a detailed description of calcium handling. The GPB modelincludes new definitions of ionic current densities and kinetics and is defined forendocardial and epicardial cells. In the GPB model, voltage-dependent ICaL inacti-vation is modeled by a single voltage-dependent gate f and two calcium-dependentgates, one for the subsarcolemmal compartment, fCa,sl, and another one for thejunctional compartment, fCa,j . The formulation of ICaL inactivation in the GPBmodel is as follows:
InactGPBCa,L = f · (Aj · fCa,j +Asl · fCa,sl)
where Aj and Asl are the ratios of calcium-dependent inactivation channels in thejunctional and the subsarcolemmal compartment, respectively (Aj +Asl = 1).
The CRLP model is a modification of the GPB model. As in the original model,the modified CRLP model describes the AP of endocardial and epicardial human
UniversidadZaragoza

4. Limitations in Electrophysiological Model Development andValidation 83
ventricular myocytes. As described in previous chapters, the CRLP model includesreformulation of ICaL, readjustment of the parameters describing IK1 and redefinitionof a number of other model parameters, including GNa (maximum INa conductance)and GNaK (maximal INaK value). In the CRLP model, the formulation of voltage-dependent ICaL inactivation is similar to that of the TP06 model. However, theassociated voltage-dependent inactivation time constants were adjusted to bettermatch experimental evidences on APD adaptation to CL changes. The calcium-dependent inactivation gates were maintained as in the original GPB model. Theformulation of ICaL inactivation in the CRLP model is as follows:
InactCRLPCa,L = f · f2 · (Aj · fCa,j +Asl · fCa,sl)
The ORd model is the most recent human ventricular AP model out of thefour analyzed models and it has the most complex ICaL definition. ICaL inactivationis modeled as a weighted average involving voltage-dependent gates. The gatesff and fs represent the behavior of the voltage-dependent gates when there isno calcium. The gates fCa,f , fCa,s and jCa represent the behavior of the voltage-dependent gates when calcium is present. The calcium-dependent gate n modulatesthe relative weight of both families of gates. The n gate is modeled via a Markovchain. The gates ff , fs, fCa,f , fCa,s and jCa have different time constants, τf,f ,τf,s, τf,Ca,f , τf,Ca,s and τj , but the same steady-state value fss. As discussed byThomas O’Hara in the online version of the article presenting the model [63], thereare some issues related to the INa current formulation in the model. The authorspropose to replace the INa current formulation of the original ORd model with theformulation proposed in the TP06 model. In this work we analyze the originalORd model and the ORd model with the INa current of the TP06 model (ORdNa).The formulation of ICaL inactivation in the ORd and ORdNa models is as follows:
InactORdCa,L = (Af,f · ff +Af,s · fs) · (1− n)+
jCa · (Af,Ca,f · fCa,f +Af,Ca,s · fCa,s) · n
where Af,f and Af,Ca,f are the ratios of the fast voltage-dependent inactivationgates ff and fCa,f , respectively, and Af,s and Af,Ca,s are the ratios of the slowvoltage-dependent inactivation gates fs and fCa,s, respectively.
4.2.2 Characterization of L-type calcium voltage-dependent inactivation
Voltage-dependent ICaL inactivation is experimentally characterized using the paired-pulse protocol, which is illustrated in Figure 4.1. This protocol consists of clampingthe membrane potential from a holding potential Vhold to different pre-pulse po-tentials Vpre during a specified time interval tpre. After this time, the potential isclamped to a pulse potential Vpulse during an interval tpulse. Following this, themembrane potential is clamped back to Vhold. Variations of this protocol introducea separation between the pre-pulse and the pulse potential, during which the poten-tial is set to Vhold for a short period of time, tsep, before clamping the membrane
JesúsCarro

84 New Methodologies for the Developmentand Validation of Electrophysiological Models
Figure 4.1: Paired-pulse voltage clamp protocol and measurement of the steady-state value fss of voltage-dependent inactivation.
potential to Vpulse. Steady-state voltage-dependent ICaL inactivation is obtainedduring the tpulse interval. In this part of the test, peak ICaL current is measuredfor each potential used as pre-pulse and results are normalized by the peak valueof the current measured for the minimum pre-pulse potential. The resulting curveis used in the models as the steady-state value of voltage-dependent inactivation(fss).
Human ventricular cell models use different experimental datasets to definetheir voltage-dependent ICaL inactivation functions. With the aim of comparingthe simulation results of steady-state ICaL inactivation with experimental results,the same experimental dataset that was used to adjust each model in the originalarticles was considered. For the TP06 model no indication was provided on theexperimental dataset used to fit steady-state voltage-dependent ICaL inactivation,whereas in the previous version of the model [46] data from [1] was used. For theTP06 model the authors redefined the ICaL expression by adding a second voltage-dependent inactivation gate. Only the I/V curve for ICaL was compared withexperimental results from [3]. The GPB model used experimental results from [2]and the ORd model from [3].
Each set of experimental results was based on a different configuration of thepaired-pulse protocol to characterize steady-state voltage-dependent ICaL inactiva-tion (Table 4.1). Also, different calcium concentrations in the extracellular solutionand in the patch pipette solution, varying from 1.8 to 5.4 mM and from 0 to 2.0mM, respectively, were used for each experimental dataset.
UniversidadZaragoza

4. Limitations in Electrophysiological Model Development andValidation 85
Pelzmann [1] Li [2] Magyar [3]Vhold (mV ) -45 -80 -80Vpulse (mV ) 10 10 5Vpre,ini (mV ) -40 -100 -55Vpre,fin (mV ) 40 60 15∆Vpre (mV ) 5 10 5tpre (ms) 400 400 500tsep (ms) 10 5 0tpulse (ms) 400 300 390
Table 4.1: Paired-pulse test parameters in experimental protocols.
In this chapter, in silico simulations were performed in which the experimentalpaired-pulse tests were implemented for ICaL characterization. Intracellular andextracellular concentrations were set at the values used in the experimental proto-cols against which simulated data were compared. In particular, free intracellularcalcium ([Ca2+]i) was set as the value of the pipette solutions of the experiments,with the time derivative being set to zero (i.e. d[Ca2+]i/dt = 0). All the cal-cium buffers and the diffusion and transportation of calcium inside the cell weremaintained as in the original models. This allowed calcium concentrations in allremaining intracellular compartments to follow the dynamics described in the cor-responding model equations. The same values for Vhold, Vpre, and Vpulse as in thecorresponding experiments (see Table 4.1) were used. All currents except for ICaL
were blocked.
4.2.3 Steady-state AP markers
To study the effect of considering data measured at tissue level for characterizationof single cell models, AP markers calculated at single cell and tissue levels withthe four ventricular models were compared. The following markers were analyzed:i) Action potential duration at different percentages of repolarization (90%, 75%,50%, 25%); ii) Triangulation; and iii) Minimum and Maximum TransmembranePotential and Transmembrane Potential Velocity. The maximum value of the APis used in many models to adjust the cardiac conductances [15, 47] whereas theminimum potential is used for model validation [63]. These values are, however,very sensitive to cellular electrophysiological changes like, for instance, those asso-ciated with hyperkalemia, where the resting membrane potential can be increasedfrom -85 mV to up to -60 mV and the maximum potential falls, in combinationwith a potential splitting of the AP upstroke into more than one component [20].
4.2.4 Ionic contributors to AP markers
To evaluate the role played by each ionic current in contributing to each electro-physiological marker, the results of the simulations carried out by varying individual
JesúsCarro

86 New Methodologies for the Developmentand Validation of Electrophysiological Models
ionic conductances were adjusted by a first order response surface model:
Mj ≈ Cj +
N∑i=1
∆i ·mj,i
where Mj is the value of the electrophysiological marker j under the analyzedcondition, Cj is the value of the marker j under control conditions, mi,j is theweight of the current i in contributing to the marker j and ∆i is the variation ofthe ionic conductance:
∆i =Gi −Gi,0
Gi,0
where Gi,0 and Gi are the values of the ionic conductance under control and underthe analyzed condition, respectively.
For each individual marker, if the results for the different evaluated conditionsk = 1, . . . ,K are concatenated, the above system can be expressed in matrix formas:
Mj,1
Mj,2
...Mj,K
≈
∆1,1 · · · ∆N,1
∆1,2 · · · ∆N,2
... . . . ...∆1,K · · · ∆N,K
·
mj,1
mj,2
...mj,K
+ Cj ·
11...1
↓
M j ≈ ∆ ·mj + Cj · JK,1
where Mj,k is the value of the marker j and ∆i,k is the variation of the ionic conduc-tance i at condition k. Using this notation, the weights of the ionic conductancescan be calculated as follows:
mj =
(∆
T·∆)−1
·∆T·(M j − Cj · JK,1
)4.2.5 Computational simulations
The models were stimulated with square current pulses with an amplitude twice thediastolic threshold and a duration of 1 ms. Depending on the simulation scale, thediastolic threshold was defined as the minimum amplitude required to (a) generatefive APs (single cell simulations) or (b) propagate five APs (1D tissue simulations).
To simulate steady-state conditions, models were stabilized with a train of 100stimulations at a CL of 1000 ms. Electrophysiological markers were calculated fromthe last simulated beat. Every model was first simulated under control conditionsand subsequentyly after varying each ionic conductance by ±15 and ±30%.
For 1D tissue simulations, a homogeneous 3-cm fiber composed of epicardial cellswas used. The value of the conductivity, σ, was set to obtain a Conduction Velocity(CV) close to 65 cm/s [87]. The cell capacitance was set to Cm = 1 µF/cm2. The
UniversidadZaragoza

4. Limitations in Electrophysiological Model Development andValidation 87
AP markers were computed as the mean value of the markers measured at fivedifferent positions within the fiber located at: 1, 1.25, 1.5, 1.75 and 2 cm.
For single cell simulations, a forward Euler scheme was used to solve the modelswith a time step of ∆t = 0.002 ms for GPB, ORd and CRLP, and ∆t = 0.02 msfor TP06. For 1D tissue simulations, a semi-implicit operator-splitting scheme wasused to solve the propagation [86] with a space discretization of ∆x = 0.1 mm andthe same ∆t used in single cell simulations.
The results from single cell and in 1D tissue simulations were compared usingthe absolute (Ea) and relative (Er) differences:
Ea = M cellj −M tissue
j
Er(%) =M cell
j −M tissuej
M tissuej
· 100
where M cellj and M tissue
j are the values of the electrophysiological marker j in celland tissue for the condition under analysis.
4.3 Results
4.3.1 Characterization of L-type calcium voltage-dependent inactivation
Results of the paired-pulse protocol for steady-state voltage-dependent ICaL inacti-vation are shown in Figure 4.2. Each model was compared with the set of exper-imental data that was used to characterize voltage-dependent ICaL inactivation inthe original article were the model was presented.
The TP06 model was able to adequately reproduce the experiments from [1](see Figure 4.2.a)). In this case, the modeled steady-state voltage-dependent ICaL
inactivation is the product of the steady-states values (f2,ss, fss) of the two inac-tivation gates (f2, f). The results from the in silico simulations, which accountfor additional interactive effects, were closer to the experimental data than thoseobtained by evaluation of the corresponding ICaL mathematical equations. Fig-ure 4.3.a) shows that, for the TP06 model, the slow inactivation gate f did notreach steady-state for high Vpre potential values (Vpre = -5 mV and Vpre = 40 mV).Figure 4.3.a) also shows that the calcium-dependent inactivation gate has a lesssignificant effect than the other gates, being this effect slightly more pronounced atlower Vpre potentials. Finally, one of the most significant differences between themodel outcome (multiplication of the steady-state values of the gates, black dashedline in Figure 4.2.a) and the result of the in silico simulations (yellow crosses) wasthat the curves were shifted.
Simulation results obtained with the GPB model fit quite well the model defi-nition (see Figure 4.2.b)). Differences between model outcome and in silico simu-lation increased as fss decreased. As shown in Figure 4.3.b), the separation pulseproduced different effects depending on the pre-pulse potential. For Vpre = -100mV, the effect was minimal, but in the other two cases shown in the figure (Vpre =-20 mV and Vpre = 60 mV), the value of f increased during the separation pulse.
JesúsCarro

88 New Methodologies for the Developmentand Validation of Electrophysiological Models
Figure 4.2: Comparison between model definition (continuous and discontinuouslines), in silico simulations (yellow crosses) and experimental results (red circles)for fss. a) TP06 model and data from [1]. b) GPB model and data from [2]. c)ORd model and data from [3]. d) CRLP model and data from [1].
Calcium-dependent inactivation gates had minimal effects, as these gates remainedopen during most of the protocol duration. Finally, differences between experi-ments [2] and in silico simulations increased for positive potentials (Figure 4.2.b).
Simulation results with the ORd model showed a significant discrepancy withexperimental data for potentials between -20 mV and -10 mV (see Figure 4.2.c)).The largest difference was observed for a pre-pulse potential of -15 mV. The sim-ulated probability at this potential was 18% larger than the one obtained in theexperiments. The evolution of the voltage-dependent ICaL gate variables during thepre-pulse potential is shown in Figure 4.3.c). For potentials below -15 mV, the ngate was nearly closed and the effects of fs and ff gates dominated. On the con-trary, for positive potentials, the effects of the gates fCa,f , fCa,s and jCa prevailed.This figure also shows that for potentials above -15 mV, the fast inactivation gates,but not the slow ones, reached a steady-state value during the pre-pulse. For highpre-pulse potentials, the gate fCa was not able to reach steady-state (close to 0),but the gate j was. However, the multiplication of both gates almost achieved asteady-state value.
The results obtained with the CRLP model were very similar to those foundfor the TP06 model. This was expected, since both models have a very similarformulation for ICaL inactivation. However, the difference between the results ofthe CRLP model and the experiments from [1] was smaller than for the TP06model (see Figure 4.2.d)).
UniversidadZaragoza

4. Limitations in Electrophysiological Model Development andValidation 89
Figure 4.3: Temporal evolution of the ICaL gates during simulation of the paired-pulse protocol (see text for specific values of tpre, tsep and tpulse used in the simu-lations): a) TP06 model. b) GPB model. c) ORd model. d) CRLP model
JesúsCarro
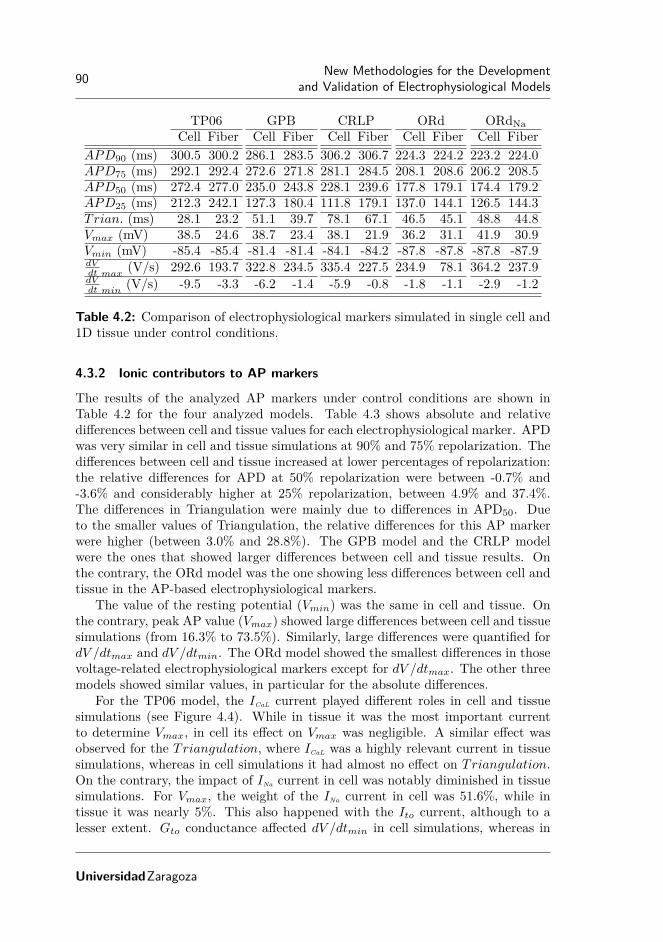
90 New Methodologies for the Developmentand Validation of Electrophysiological Models
TP06 GPB CRLP ORd ORdNaCell Fiber Cell Fiber Cell Fiber Cell Fiber Cell Fiber
APD90 (ms) 300.5 300.2 286.1 283.5 306.2 306.7 224.3 224.2 223.2 224.0APD75 (ms) 292.1 292.4 272.6 271.8 281.1 284.5 208.1 208.6 206.2 208.5APD50 (ms) 272.4 277.0 235.0 243.8 228.1 239.6 177.8 179.1 174.4 179.2APD25 (ms) 212.3 242.1 127.3 180.4 111.8 179.1 137.0 144.1 126.5 144.3Trian. (ms) 28.1 23.2 51.1 39.7 78.1 67.1 46.5 45.1 48.8 44.8Vmax (mV) 38.5 24.6 38.7 23.4 38.1 21.9 36.2 31.1 41.9 30.9Vmin (mV) -85.4 -85.4 -81.4 -81.4 -84.1 -84.2 -87.8 -87.8 -87.8 -87.9dVdt max
(V/s) 292.6 193.7 322.8 234.5 335.4 227.5 234.9 78.1 364.2 237.9dVdt min
(V/s) -9.5 -3.3 -6.2 -1.4 -5.9 -0.8 -1.8 -1.1 -2.9 -1.2
Table 4.2: Comparison of electrophysiological markers simulated in single cell and1D tissue under control conditions.
4.3.2 Ionic contributors to AP markers
The results of the analyzed AP markers under control conditions are shown inTable 4.2 for the four analyzed models. Table 4.3 shows absolute and relativedifferences between cell and tissue values for each electrophysiological marker. APDwas very similar in cell and tissue simulations at 90% and 75% repolarization. Thedifferences between cell and tissue increased at lower percentages of repolarization:the relative differences for APD at 50% repolarization were between -0.7% and-3.6% and considerably higher at 25% repolarization, between 4.9% and 37.4%.The differences in Triangulation were mainly due to differences in APD50. Dueto the smaller values of Triangulation, the relative differences for this AP markerwere higher (between 3.0% and 28.8%). The GPB model and the CRLP modelwere the ones that showed larger differences between cell and tissue results. Onthe contrary, the ORd model was the one showing less differences between cell andtissue in the AP-based electrophysiological markers.
The value of the resting potential (Vmin) was the same in cell and tissue. Onthe contrary, peak AP value (Vmax) showed large differences between cell and tissuesimulations (from 16.3% to 73.5%). Similarly, large differences were quantified fordV /dtmax and dV /dtmin. The ORd model showed the smallest differences in thosevoltage-related electrophysiological markers except for dV /dtmax. The other threemodels showed similar values, in particular for the absolute differences.
For the TP06 model, the ICaL current played different roles in cell and tissuesimulations (see Figure 4.4). While in tissue it was the most important currentto determine Vmax, in cell its effect on Vmax was negligible. A similar effect wasobserved for the Triangulation, where ICaL was a highly relevant current in tissuesimulations, whereas in cell simulations it had almost no effect on Triangulation.On the contrary, the impact of INa current in cell was notably diminished in tissuesimulations. For Vmax, the weight of the INa current in cell was 51.6%, while intissue it was nearly 5%. This also happened with the Ito current, although to alesser extent. Gto conductance affected dV /dtmin in cell simulations, whereas in
UniversidadZaragoza

4. Limitations in Electrophysiological Model Development andValidation 91
Ea Er(%)TP06 GPB CRLP ORd ORdNa TP06 GPB CRLP ORd ORdNa
APD90 (ms) 0.3 2.6 -0.5 0.1 -0.8 0.1 0.9 -0.2 0.0 -0.3APD75 (ms) -0.3 0.8 -3.4 -0.5 -2.3 -0.1 0.3 -1.2 -0.2 -1.1APD50 (ms) -4.6 -8.8 -11.5 -1.3 -4.8 -1.7 -3.6 -4.8 -0.7 -2.7APD25 (ms) -29.8 -53.9 -67.3 -7.1 -17.8 -12.3 -29.4 -37.6 -4.9 -12.3Trian. (ms) 4.9 11.4 11.0 1.4 4.0 20.7 28.8 16.4 3.0 9.0Vmax (mV) 13.9 15.3 16.2 5.1 11.0 56.4 65.7 73.5 16.6 35.5Vmin (mV) 0.0 0.0 0.1 0.0 0.1 0.0 0.0 0.0 0.0 0.0dVdt max
(V/s) 98.9 88.3 107.9 156.8 126.3 51.1 37.7 47.5 200.7 53.1dVdt min
(V/s) -6.2 -4.8 -5.1 -0.7 -1.7 187.8 343.2 616.3 52.5 143.1
Table 4.3: Absolute (Ea) and relative (Er) differences between electrophysiologicalmarkers in single cell and 1D tissue simulations.
tissue simulations this marker was mainly controlled by ICaL.The more influential currents in the GPB model differed from the TP06 model
(Figure 4.5). In this model, the ICl,bk current, which is not present in the TP06model, was the most relevant contributor to APD in both cell and tissue simula-tions. Other effects were similar in both models. As an example, the INa currentcontribution was reduced in the GPB model when the electrophysiological mark-ers were calculated in tissue as compared to cell. This reduction was found forall markers except for dV /dtmax. Similarly to the TP06 model, one current hada larger contribution to Vmax in tissue than in cell, but in the GPB model thatcurrent was Ito. The same behavior was found for Triangulation and IK1.
The APD of the ORd model was mainly controlled by IKr in cell, whereasin tissue the INa current also played an important role. The original ORd modelshowed large differences in the role played by the INa current in tissue compared withthe one in cell (Figure 4.6). In cell simulations, when INa conductance was increased,the APD at different percentages of repolarization was slightly decreased. On thecontrary, in tissue, when INa conductance was increased, the APD was considerablyprolonged. These differences in the ORd model disappeared when the INa currentformulation was replaced with the one described in the TP06 model. For Vmax,when INa was replaced with the one defined in the TP06 model (Figure 4.7), thedifferent behavior between cell and tissue simulations was interchanged.
The APD of the CRLP model highly depended on the conductance of the ICl,bk
current (see Figure 4.8). This behavior is inherited from the GPB model but itsweight in the CRLP model was found to be slightly smaller than in the GPB model.Likewise, the role of the ICaL current was very similar to the one in the GPB model.The only difference was the role in dV /dtmin: in the CRLP model it was larger thanin the GPB model due to the particular AP shape at the beginning of the plateauphase for the CRLP model, which is related to the definition of ICaL formulation.Also, the contribution of IK1 to Triangulation was 16% larger in tissue than in cellsimulations.
JesúsCarro

92 New Methodologies for the Developmentand Validation of Electrophysiological Models
Figure 4.4: Contribution of ionic conductances to electrophysiological markerssimulated in tissue and cell with the TP06 model. Dark colors (blue or brown)indicate maximum correlation between changes in a conductance and changes ina marker; white color indicates no correlation. Percentages in boxes indicate thecontribution of changes in a conductance to changes in a marker. Minus signsindicate that conductances and markers vary inversely; plus signs indicate thatconductances and markers vary in the same direction.
Figure 4.5: Contribution of ionic conductances to AP markers simulated in celland tissue with the GPB model. The legend of the figure is the same as in seeFigure 4.4.
UniversidadZaragoza

4. Limitations in Electrophysiological Model Development andValidation 93
Figure 4.6: Contribution of ionic conductances to AP markers simulated in celland tissue with the ORd model. The legend of the figure is the same as in seeFigure 4.4.
Figure 4.7: Contribution of ionic conductances to AP markers simulated in celland tissue with the ORdNa model. The legend of the figure is the same as in seeFigure 4.4.
JesúsCarro

94 New Methodologies for the Developmentand Validation of Electrophysiological Models
Figure 4.8: Contribution of ionic conductances to AP markers simulated in celland tissue with the CRLP model. The legend of the figure is the same as in seeFigure 4.4.
4.4 Discussion
This chapter has been focused on analyzing issues arising during model develop-ment and validation, namely: i) the effect of submodel variable interactions in thecharacterization of ion channel gating, and ii) the effect of cell-to-cell interactions inthe evaluation of ionic contributors to AP markers. A methodology for validatingcomputational model formulations has been introduced. The proposed methodol-ogy consists in performing in silico simulations using the same protocol as in theexperiments used to characterize a given current or AP marker. The methodologyaccounts for all variables and scales involved in modeling and simulation as well astheir interactions. It has been applied to evaluate voltage-dependent ICaL inactiva-tion and contributors to electrophysiological AP markers in four human ventricularmodels presenting different ionic formulations.
4.4.1 Effect of submodel variable interactions in the evaluation of voltage-de-pendent L-Type Calcium Current inactivation
In the case of voltage-dependent ICaL inactivation, our results show large differencesbetween ICaL inactivation as calculated from the model equation and ICaL inactiva-tion from the in silico simulations. Such differences were due to the interactionbetween voltage-dependent ICaL inactivation gating and other effects such as ICaL
activation gating, protocol definition or duration of the voltage pulses used to cal-culate inactivation properties. This suggests that, when proposing any new modelformulation, consistency between such formulation and the corresponding experi-mental data that is aimed at being reproduced needs to be first verified consideringall involved factors.
In the TP06 model, the product of the steady-state values of the two voltage-dependent ICaL inactivation gates was very different from the experimental behav-
UniversidadZaragoza

4. Limitations in Electrophysiological Model Development andValidation 95
ior. However, the results of the in silico simulations obtained with this model werein good agreement with the experiments. There are two effects that explain theseresults: i) normalization by ICaL current peak at the minimum pre-pulse potential,as performed in the experimental protocol [1], is done for a transmembrane poten-tial value where the product of the two voltage-dependent inactivation gates is lessthan 1; ii) voltage-dependent inactivation gates do not reach a steady-state valueat the end of the pre-pulse interval for some potentials. One of the most significantdifferences between the model outcome (multiplication of the steady-state values ofthe gates) and the result of the in silico simulations is that the curves representingsteady-state voltage-dependent inactivation (Figure 4.2.a)) were shifted. This shiftmade the in silico simulations approximate the experimental behavior due to theperformed current peak normalization at a potential where inactivation probabilityis less than one.
The GPB model and the associated in silico simulations provided similar re-sults to the experiments used to fit the steady-state value of voltage-dependentinactivation gating. Differences were mainly caused by the protocol used to mea-sured fss, as explained in the following: the separation pulse had a different effectdepending on the pre-pulse potential. For pre-pulse potentials similar to Vhold thevalue of fss obtained at Vpulse is minimally affected since the steady-state valuesof f for Vhold and Vpre are very similar. However, for larger values of Vpre, andtherefore larger differences between Vhold and Vpre, the steady-state value of fcorresponding to Vpre is very different to the steady-state value corresponding toVhold, which corresponds to one. This causes that during the separation pulse thevalue of f increases (see Figure 4.2.b)) and the difference in fss between the modeldefinition and the simulation increases with Vpre. In addition, the interaction withvoltage-dependent activation, represented by gate d, always reduced the measuredvalue, but the normalization, using the result of the minimum pre-pulse potential,nearly corrected this behavior. Finally, differences between experiments [2] and insilico simulations get larger where differences between the model definition for fssand experimental data are larger (see Figure 4.2.b) for positive potentials). Theseresults suggest that a simple ICaL inactivation formulation like that in the GPBmodel, with only one voltage-dependent inactivation gate, suffices to reproducethe experimental behavior of steady-state voltage-dependent ICaL inactivation [2].
In the ORd model, the definition of voltage-dependent ICaL inactivation as aweighted sum of fast and slow inactivation gates is consistent with how experimen-talists calculate inactivation time constants [1, 63]. Time constants are calculatedby fitting a biexponential function to the inactivation phase of the experimentalcurrent traces. However, important discrepancies between in silico ORd simula-tions and the experiments used to develop the model [3] were found for pre-pulsepotentials between -20 mV and -10 mV. There are two possible causes behind suchdiscrepancies: i) the time constant of the slow voltage-dependent inactivation gate;ii) the definition of voltage-dependent ICaL inactivation as the sum of two gates.The first cause has to do with the fact that ORd model time constants are iden-tified based on a simple-pulse test protocol of 75 ms duration, whereas the slowtime constant of voltage-dependent ICaL inactivation in the ORd model is of the
JesúsCarro

96 New Methodologies for the Developmentand Validation of Electrophysiological Models
order of 10 seconds. The slowness of the inactivation gate prevents reaching thesteady-state value by the end of the pre-pulse, which overestimates the value of fssat Vpulse. This is reinforced by the fact that voltage-dependent ICaL inactivation isformulated as a sum of two gates. If inactivation is expressed as a product, as in thecase of the TP06 model, when one of the gates reaches zero, the product reacheszero. However, for the ORd model the situation is more complex. Due to theinteraction between the inactivation gates and the n and jCa gates in this model,as shown in section 4.3.1, the result for potentials above -10 mV is equivalent tothe product of two gates since the jCa gate is almost zero, and therefore the resultfrom the simulation is similar to the model formulation of fss and experiments.On the contrary, for potentials between -20 mV and -10 mV, where by the end ofthe pre-pulse the jCa gate is far from zero and the slow inactivation gates, in par-ticular fCa,s, are far from reaching their steady-state value, the fss value obtainedfrom the simulation is considerably larger than the fss value defined in the modelformulation and the experiments.
For the CRLP model, similarly to the TP06 model, the largest differences be-tween model equations, in silico simulations and experiments are due to the timeconstants of the activation and inactivation gates. Nevertheless, the results ofthe in silico simulations with this model reproduced the experimental observationsslightly better than the TP06 model. In the CRLP model, the voltage-dependentICaL inactivation gate f2 is faster than in the TP06 model (as defined by the timeconstant τf2). Due to this gate being faster, the effect of the separation pulse waslarger than in the TP06 model, as during this interval the f2 gate opened morethan in the TP06 model (see Figure 4.3.d)). As a consequence, the CRLP modelyielded a larger fss value in the in silico measurements, which was closer to theexperimental values. This effect was not very pronounced but it could be betterobserved for voltages where f2 is larger (around -20 mV).
This chapter has focused on the difficulties of fitting model parameters asso-ciated with the steady-state value of ICaL inactivation using data obtained fromvoltage-clamp experiments. Such difficulties arise from submodel variable interac-tions in the ICaL formulation. This situation is a common problem to many gatingvariables in cardiac electrophysiological models. In this regard, most experimentalprotocols cannot measure the behavior of one gate at a time, but instead measurethe behavior of all gates of the same nature (activation, inactivation, etc.) together(e.g. for ICaL inactivation the experimental protocol measures fast and slow inacti-vation together). Therefore model development needs to consider the coexistenceof all gates during parameter identification to accurately reproduce experimentalresults. This issue is also present in the estimation of the time constants asso-ciated with the different gates. In this regard, the gating interactions associatedwith an experiment implies that the identified time constants associated with theexperimental data cannot, in general, be associated with an individual gate of themodel.
Some studies have explored the effect of gating interactions on voltage-clampdata [128, 129]. The voltage-clamp protocol is not designed to measure this di-rectly, but the corresponding effects are included in the experimental results. Nev-
UniversidadZaragoza

4. Limitations in Electrophysiological Model Development andValidation 97
ertheless, most of these techniques have been developed for currents with only oneinactivation and one activation gate. Approaches to extend those methods to bettercalibrate complex gate combinations remain to be investigated.
4.4.2 Effect of cell-to-cell interactions in the evaluation of ionic contributorsto AP markers
While the ionic currents identified as having the largest contribution to each ana-lyzed AP-based marker varied from one model to another, the differences betweensingle cell and tissue simulations were comparable for all the analyzed markers inthe four considered human ventricular models.
As expected, measurement of depolarization-related AP markers in single cellsimulations was significantly affected by the externally applied stimulation current.In particular, dV /dtmax in single cell simulations was quite different from thatobtained in tissue for all considered models. Although some models use dV /dtmax
or Vmax measured in single cell simulations to adjust INa [15, 47, 63], our resultssuggest that INa should be adjusted with the results obtained from, at least, a 1Dtissue simulation as in [119], particularly considering that many experiments areperformed in tissue.
For repolarization-related AP markers, the largest differences between cell andtissue were observed for Triangulation and APD25. The results for APD90 andAPD75 were very consistent between cell and tissue, while small discrepancies werefound for APD50. Although differences for APD90 and APD50 were small, theiradded contribution together with the small value of Triangulation caused a rela-tively large accumulated difference for this marker. For this reason, Triangulationshould be used with caution as a marker in single cell simulations when used tocalibrate an AP model.
Importantly, the differences between markers computed from single cell and 1Dtissue simulations were not only the reflect of a constant bias, as shown in Table 4.2and in Table 4.3. For repolarization markers, those differences reflected the differentcontribution of ionic currents to the markers. Computational studies using singlecell simulations to analyze the sensitivity of different ionic current conductanceson the repolarization behavior of the model should only consider markers witha validated correspondence between cell and tissue simulations or, otherwise, usemarkers computed from tissue rather than from single cell simulations.
4.5 Conclusions
When proposing a new model, or when evaluating an existing model, consistencybetween simulated and experimental data should be verified considering all in-volved effects and scales. The closer the experimental conditions are reproduced inthe computer simulations, the more robust the process of model development andvalidation will be.
As discussed in this paper, proper characterization and validation of a givenmodel should be performed with the in silico simulation of the experimental proto-
JesúsCarro

98 New Methodologies for the Developmentand Validation of Electrophysiological Models
col. In this way, the effects of the interaction between model variables are accountedfor and modeling inconsistencies are avoided.
While the information provided by electrophysiological markers is very valu-able for model development and validation, markers should be computed usingsimulations that resemble as closely as possible the conditions associated with theexperimental measurements, or, at least, the consistency of the marker at differentscales should be previously validated.
As a final remark, complex models represent a real challenge for parameteridentification and validation. This does not mean that models should be necessarilysimple, but that complex models require additional testing to fully verify adequateperformance.
UniversidadZaragoza

Chapter 5
Reformulation of IonicCurrent Expression
5.1 Introduction
The human ventricular AP model proposed in Chapter 2 and subsequently up-dated in chapter 3, despite reproducing experimental observations in relation toa range of electrophysiological characteristics (see also Chapter 4), renders anAP lacking the peak-and-dome morphology characteristic of ventricular epicardialcells. Specifically, the end of phase 1 is followed by an atypical low-magnitudebump that precedes the AP plateau phase. In this chapter a readjustment of ICaL
voltage-dependent inactivation gates is proposed to provide a more physiologicalAP shape while guaranteeing an improved fitting of the model to experimental datain relation to all the electrophysiological properties the model had been validatedagainst in previous chapters.
The proposed readjustment lies on the methodologies described in chapters 3and 4. As a first step, the time constants of ICaL voltage-dependent inactivationgates were modified to render a more realistic AP shape. Due to the implica-tions that a partial modification of an ionic model may have on the performanceof the model, as highlighted in chapter 4, the steady-state value of ICaL voltage-dependent inactivation gates was adjusted to better reproduce experimental currentdata available from three different studies [1–3] by using the algorithm proposed inthe chapter 3 and the in silico simulation of these experimental protocols describedin chapter 4. Finally, the model was evaluated at cell and tissue levels to confirmthat its performance was maintained or improved with respect to the model ofchapter 2 for all evaluated electrophysiological properties.
99

100 New Methodologies for the Developmentand Validation of Electrophysiological Models
-80 -60 -40 -20 0 20 40V (mV )
0
500
1000
1500= f
;=f2
(ms)
CRLP =fCRLP =f2
New =fNew =f2
Exp. inact.
Exp. rec. fast
Exp. rec. slow
Figure 5.1: Time constants of ICaL voltage-dependent inactivation in the CRLPmodel and following the readjustment proposed in this chapter. Comparison withexperimental data [2, 4–7] is provided as well.
5.2 Methods
5.2.1 Modification of ICaL voltage-dependent inactivation time constants
To improve the AP shape of the CRLP model, the time constants of the slow(τf ) and fast (τf2) ICaL voltage-dependent inactivation gates were modified. Afterevaluating all model parameters defining the currents with a major contributionto the AP part immediately following phase one, namely ICaL and Ito, those twotime constants were identified as the ones with the largest influence on the APshape in that specific part. In particular, exploration of the parameter space ledto redefinition of the β components of both time constants τf and τf2, as follows:
βf =200
1 + e20.6−V
10
(5.1)
βf2 = 0 (5.2)where V is membrane potential.
The effect of varying βf and βf2 is shown in Figure 5.2 and Figure 5.3. InFigure 5.1, the new ICaL inactivation time constants are compared with the originalones and with the experimental data from [2, 4–7].
5.2.2 Adjustment of ICaL voltage-dependent inactivation steady-state
To best fit ICaL voltage-dependent inactivation steady-state after readjustment ofthe time constants described in previous section, the expression of the steady-statevalue for inactivation gates f and f2 was parameterized as follows:
gss =1− gss,∞
1 + eV −Vg,1/2
qg
+ gss,∞ (5.3)
UniversidadZaragoza

5. Reformulation of Ionic Current Expression 101
0 50 100 150
−50
0
50
time (ms)
V (
mV
)
C32
Figure 5.2: Effect of varying βf2 in the AP shape. Red line represents controlconditions. Dark grey lines correspond to reductions in βf2, while light grey linescorrespond to increases in βf2.
0 100 200 300 400 500
−50
0
50
time (ms)
V (
mV
)
C19
0 50 100 150 200
−50
0
50
time (ms)
V (
mV
)
C19
Figure 5.3: Effect of varying βf in the AP shape after having modified βf2 in theCRLP model. Red line represents control conditions. Dark grey lines correspondto reductions in βf , while light grey lines correspond to increases in βf .
JesúsCarro

102 New Methodologies for the Developmentand Validation of Electrophysiological Models
where g represents f or f2 (depending on the gate under consideration), V ismembrane potential, gss,∞ is the steady-state value of gate g when V tends toinfinity, qg is a parameter controlling the maximum slope of gss and Vg,1/2 is half-inactivation voltage for gate g.
Optimization problem
A minimization problem was defined in which the value of the parameters fss,∞,f2,ss,∞, qf , qf2, Vf,1/2, Vf2,1/2 are searched for to best fit experimental steady-state ICaL voltage dependent inactivation data. The response surface optimizationapproach described in chapter 3 was used to solve the minimization problem. Theobjective function of the minimization problem was defined in terms of the meansquare error between a set of experimental data [1–3] and the corresponding resultsof the in silico simulations (see chapter 4) as follows:
msei =1
ni
ni∑j=1
(fss,expi(Vj)− fss,simi
(Vj))2 (5.4)
where ni is the number of prepulse voltages used in experiment i, fss,exp(Vj) is theexperimental result for voltage Vj in experiment i and fss,sim(Vj) is the in silicoresult for voltage Vj in the simulation of the experiment i.
Since several experimental measurements of ICaL inactivation were available,the objective function was defined as the addition of the mean square errors forthe different experiments weighted by the number of cells used in each experi-ment to reduce the mean square error of the simulations in comparison with theexperimental results:
minfss,∞,f2,ss,∞,qf ,qf2,Vf,1/2,Vf2,1/2
Nexp∑i=1
Ni ·msei (5.5)
where Nexp is the number of experimental studies used in the minimization problemand Ni is the number of cells used in experiment i.
Constraints
For the above minimization problem, the following constraints were imposed onthe aforementioned gating parameters:
• C1: Both gates must have the same slope (qf = qf2).
• C2: Vf,1/2 must be smaller or equal to Vf2,1/2.
• C3: When V tends to infinity, the values of fss and f2,ss must be the sameas in the original model (0 and 0.33, respectively).
• C4: f2,ss must tend to 0 when V tends to infinity.
UniversidadZaragoza

5. Reformulation of Ionic Current Expression 103
Each constraint was approximated using a second order response surface builtwith a full factorial experimental design (see chapter 3). The second order responsesurface was enough to find a solution within a reasonable time.
An additional step was included to validate that the solution to the minimiza-tion problem led to physiological results at current, cell and tissue levels. At theionic level, the in silico simulation of ICaL voltage-dependent inactivation steady-state was required to decrease monotonically and have only one inflection point atnegative voltages. At cell and tissue levels, a set of electrophysiological markerswere computed, including: systolic and diastolic intracellular calcium concentration([Ca2+]i), AP duration (APD) at 90% of repolarization (APD90), AP triangulationat 1Hz and 0.5 Hz and APD adaptation to abrupt cycle length changes (from acycle length of 1000 ms to a cycle length of 600 ms). A complete description ofthese markers and the protocols used to compute them can be found in section 2.2.Each marker was computed for varying ICaL conductance ranging from -30% to+30% of the original value in the CRLP model. A solution of the minimizationproblem was accepted at the cell level when, for some value of GCaL, all markerswere within physiological range or, in the case of markers that were originally outof physiological range, when they were at an equal or closer distance to the physi-ological range than for the CRLP model. For the definition of physiological range,the same values described in chapter 2 (see Table 2.2) were used, as proposed in[12].
Solution for ICaL voltage-dependent inactivation
After selecting the minimum set of requirements as constraints, the minimizationproblem was solved once more using a fourth order response surface for the objec-tive function and constraints to increase the sampling of the searching space. Basedon the conclusions of chapter 4, the solution was additionally evaluated in tissue.A homogeneous 3-cm long fiber composed of epicardial cells was considered. Cellcapacitance was set to Cm = 1 µF/cm2. Values for evaluated electrophsyiologicalmarkers were computed as the mean of the values measured at five different posi-tions within the cable located at: 1, 1.25, 1.5, 1.75 and 2 cm. Numerical simulationswere solved using ELVIRA software [86].
5.2.3 Numerical methods and implementation
Cells and tissues were stimulated with square transmembrane current pulses twicethe diastolic threshold in amplitude and 1-ms duration. The diastolic threshold infiber simulations was calculated as the minimum value that generated ten pulsesthat propagated through the fiber with a CL of 1000ms as described in [135]. Forcell simulations, the diastolic threshold was calculated as the minimum value thatgenerated ten pulses.
When comparing with experimental data, extracellular concentrations in themodel were defined to have the same values as those described for the bath solutionof each experimental study.
JesúsCarro

104 New Methodologies for the Developmentand Validation of Electrophysiological Models
Computations at cell and ionic levels were performed using MatCardiacMLabSimulator (http://github.com/ChusCarro/MatCardiacMLab). This MatLab-basedsoftware uses the ode15s solver with a maximum step of 0.1 ms to solve theODEs of the model. The original CellML file of the CRLP model was consid-ered. Fiber simulations were implemented in FORTRAN and simulated using thesoftware ELVIRA. The value of the conductivity, σ, was calculated to obtain a CVvalue close to 65 cm/s [87]. The fiber was stimulated at one end. A semi-implicitoperator-splitting scheme [86] was used to solve the model with a space discretiza-tion of ∆x = 0.1 mm and a time step of ∆t = 0.002 ms. Cell capacitance was setto Cm = 1 µF/cm2.
5.3 Results
5.3.1 Solution to the minimization problem
Table 5.1 summarizes the results of the optimization algorithm for each combinationof constraints. In each of the tested cases, which are identified by letters A to L,one, two, three or four constraints in the set C1, C2, C3, C4 were imposed. Ascan be observed from Table 5.1, all the solutions that allowed qf and qf2 to bedifferent (C1 not satisfied) rendered non-valid results at the ionic level. Only onesolution where Vf,1/2 was larger than Vf2,1/2 (C2 not satisfied) rendered a validsolution at the ionic level. In that case, the distance between Vf,1/2 and Vf2,1/2
was smaller than in simulations G, H, and I, which were associated with non-validsolutions (either at ionic or cell levels). When constraint C2 was active, Vf,1/2 wasalways equal to Vf2,1/2.
Simulation results accepted as valid after evaluation at the ionic level (G, J,K, L) were subsequently evaluated at cell and tissue levels by computation of aset of electrophysiological markers. The three solutions that increased the value off2,ss,∞ (H, J, K) greatly reduced the value of APD90 and, of note, varying GCaL
within the percentages indicated in section 5.2.2 did not lead to APD90 valueswithin physiological range. Only the solution obtained after having imposed thefour constraints rendered a valid solution at both cell and tissue scales.
5.3.2 New definition of ICaL current
The solution obtained from the minimization problem with all constraints led tothe following definition of ICaL voltage-dependent inactivation steady-state:
fss =1
1 + eV +24.63
5.87
(5.6)
f2,ss =0.67
1 + eV +24.63
5.87
+ 0.33 (5.7)
The mean square error between data simulated with the modified CRLP modeland experimental data, calculated according to the expression in equation 5.5, was
UniversidadZaragoza

5. Reformulation of Ionic Current Expression 105
C1 C2 C3 C4 Id Improvement ValidationIonic Cell
No
No No No A 62.74% No —Yes B 54.93% No —
Yes Yes C 41.59% No —
Yes No No D 53.44% No —Yes E 54.27% No —
Yes Yes F 35.28% No —
Yes
No No No G 43.06% No —Yes H 20.60% Yes No
Yes Yes I 19.79% No —
Yes No No J 38.57% Yes NoYes K 18.66% Yes No
Yes Yes L 17.14% Yes Yes
Table 5.1: Results of the minimization problem and subsequent validation. Im-provement represents the error for each combination of constraints normalized bythe error before the optimization.
20% lower than the corresponding error for the initial CRLP model. Fig. 5.4 showshow the proposed solution satisfactorily reproduced available experimental data.
In tissue, the obtained solution rendered values of APD, triangulation and APDadaptation to abrupt cycle length changes within physiological range, althoughsystolic and diastolic [Ca2+]i values were somewhat further away from physiologicalrange than for the initial CRLP model (see Table 5.2).
Marker PhysiologicalRange CRLP This
WorkAPD90 (ms) 271-366 305.7 279.2Triangulation (ms) 44-112 67.1 67.8Sys. [Ca2+]i @ 1Hz (mM) 1.59-2.01 0.605 0.335Sys. [Ca2+]i @ 0.5Hz (mM) 0.71-1.68 0.538 0.305Dia. [Ca2+]i @ 1Hz (mM) 0.20-0.33 0.097 0.090Dia. [Ca2+]i @ 0.5Hz (mM) 0.14-0.32 0.092 0.087τslow (s) 70-110 101.9 99.5
Table 5.2: Evaluation of electrophysiological markers in tissue for the initial andadjusted CRLP models (third and fourth columns). Available physiological rangesare provided in the second column [12].
In Figure 5.5, simulated electrophysiological markers in tissue are shown. Fol-lowing the readjustment proposed in this chapter, the AP presents a physiologicalshape at the end of phase 1.
JesúsCarro

106 New Methodologies for the Developmentand Validation of Electrophysiological Models
a) b) c)
−40 −20 0 20 400
0.2
0.4
0.6
0.8
1
V (mV)
f ss
Pelzmann et al. (1998)
ExperimentOriginalNew
−100 −50 0 500
0.2
0.4
0.6
0.8
1
V (mV)
f ss
Li et al. (1999)
ExperimentOriginalNew
−50 −40 −30 −20 −10 0 100
0.2
0.4
0.6
0.8
1
V (mV)
f ss
Magyar et al. (2000)
ExperimentOriginalNew
Figure 5.4: Comparison between the results of the in silico simulations for theCRLP model and the adjusted model of this chapter and the experimental resultsof [1–3].
a) b) c)
0 200 400 600
−80−60−40−20
020
time (ms)
V (m
V)
Action Potential
0 200 400 6000
0.1
0.2
0.3
time (ms)
[Ca2+
] i (µM
)
Intracellular Calcium
0 5 10 15250
260
270
280
time (min)
APD
90 (
ms)
APD Rate Adaptation
Figure 5.5: Results of tissue simulations computed with the readjusted CRLPmodel proposed in this chapter. a) AP at a cycle length of 1000 ms. b) [Ca2+]i ata cycle length of 1000 ms. c) APD adaptation to abrupt cycle length changes.
5.4 Discussion
In cardiac electrophysiological modeling and simulation, there are ionic currentswhose definition is particularly challenging. Many ionic parameters can not bedirectly measured due to the interaction with other model components or due totechnical limitations. As an example, some gating dynamics are so fast that its ac-tivity overlaps with the capacitive current, thus preventing its direct measurement.In other cases, experimental protocols have been designed to specifically isolatethe effects of one parameter of interest in a given model, but, when the complexityof the model increases, it is not possible to isolate it completely. For those rea-sons: i) when an ionic current is aimed at being formulated, its definition, or atleast its validation, should be performed considering the whole model of the ioniccurrent; ii) when an element of an ionic current is modified, the other elementsshould be readjusted to guarantee that model ionic behavior is in agreement withexperimental evidences.
This chapter focused on adjusting the formulation of the time constants of ICaL
voltage-dependent inactivation to improve the AP shape of the CRLP model at theend of phase 1. As shown in chapter 4, due to the interactions between differentelements of the ICaL current, simulation of in silico protocols should be run toadjust parameters defining ICaL voltage-dependent inactivation steady-state, thusaccounting for the effects on the whole ionic current.
UniversidadZaragoza

5. Reformulation of Ionic Current Expression 107
5.4.1 Development and validation of a new ionic current formulation
A minimization problem was mathematically defined to adjust the formulation ofthe ICaL current in the CRLP model. Different sets of experimental data providingsteady-state measurements of ICaL voltage-dependent inactivation were consideredto fit the ionic gating parameters. If no constraints were imposed on the mini-mization problem, the obtained result was associated with a very small error, butrendered unphysiological results due to the fact the two inactivation gates (fastand slow) did not act in a coordinated way as in the experiments. For that reason,constraints were imposed when fitting the parameters describing voltage-dependentinactivation steady-state. These constraints were selected based on the formula-tion of ICaL gating proposed in [51]. Our results showed that to all constraints werenecessary to reproduce experimental results on ICaL inactivation and at the sametime guarantee that electrophysiological markers (APD90, AP triangulation, APDadaptation to abrupt cycle length changes and systolic and diastolic [Ca2+]i levels)were within physiological ranges.
This chapter considered evaluations at ionic, cell and tissue scales that wereperformed as a model validation step once the solution to the above describedconstrained minimization problem had been obtained. Future studies could developthe methods to integrate at least part of the validation rules as constraints in theformulation of the minimization problem.
5.4.2 Reproducing experimental data from different laboratories
One of the difficulties in using different experimental datasets to adjust the pa-rameters of an ionic current is that each dataset is commonly measured underspecific experimental conditions. For this reason, the results of different experi-mental studies can not be directly compared and, consequently, they cannot beused concomitantly when for parameter estimation without considering such dif-ferences. On the other hand, the benefit of having experimental datasets recordedunder different conditions provides a wider range of data that can be taken intoaccount for model adjustment. Thus, if used correctly, the fact of having highlyheterogeneous experimental sets of data can be seen as an advantage rather thana limitation.
Specifically, in this chapter the use of the described experimental datasets madeit possible to improve the overall behavior of ICaL voltage-dependent inactivationsteady-state without modifying the theoretical expression of the involved gates butrather by modifying the values of the associated parameters. Replication of theexperimental data in [1] and [3] with the optimized ICaL model led to differencesbetween in silico and experimental results were remarkably smaller than for theinitial CRLP model. Only when comparing with the experimental data in [2],the observed differences were small. In overall terms, the optimization problemproposed and solved in this chapter led to relevant improvements in almost allperformed evaluations.
JesúsCarro

108 New Methodologies for the Developmentand Validation of Electrophysiological Models
5.5 Conclusions
In this chapter the expression of the ICaL current in the CRLP model has beenadjusted to correct for the unphysiological shape of the AP following phase 1.Although the CRLP model, developed in chapter 2 and updated in chapter 3,had been tested against various sets of experimental data, considering differentscales and interactions between model components as reported in chapter 4, itpresented a rather uncommon bump following AP transient repolarization in phase1. In silico simulations of experimental protocols described in chapter 4 were ranand the corresponding results were included as part of an optimization problemwith a number of carefully defined constraints, which was solved to adjust modelvariables in such a way that experimental outcomes were more closely represented.The methodology described in chapter 3 was used for optimization solving. Toguarantee that model overfitting was avoided, validation was performed at ionic,cell and tissue scales.
UniversidadZaragoza
Chapter 6
A Human VentricularElectrophysiologicalModel with ImprovedDescription ofExperimental Behavior
6.1 Introduction
In chapter 3 and chapter 5, updates to the model described in chapter 2 were ad-dressed. The update in chapter 3 allowed the inclusion of intracellular potassiumdynamics, while the update in chapter 5 involved refining the expression of theL-type calcium current, ICaL, to render an AP shape closer to experimental shapes,particularly regarding AP phase 1. When developing the CRLP model in chapter 2,departing from the GPB model, a paradigm based on reproducing a set of experi-mentally measured electrophysiological markers was used to guide the developmentprocess. Within that paradigm, model variables or parameters were updated oneat a time along the iterations of the proposed methodology. When [K+]i dynamicswere included in the CRLP model (chapter 3), an optimization algorithm was usedto update several ionic conductances concomitantly, while guaranteeing that the setof electrophysiological markers remained within physiological ranges or, otherwise,their values were closer to the physiological range than with the original CRLPmodel. When updating the expression of the ICaL current (chapter 5), the method-ologies described in chapter 4 were used and parameters related to the steady-state
109

110 New Methodologies for the Developmentand Validation of Electrophysiological Models
value of voltage-dependent inactivation gates were modified while considering theeffect on global gating behavior and the improvement in in silico simulations ofexperimental results.
As discussed in chapter 4, when comparing simulations of electrophysiologicalmodels against experimental results, in silico simulations should replicate the cor-responding experimental protocols as closely as possible. For that purpose, theconditions in which the experiments were performed should be carefully taken intoaccount. In addition, the spatial scales involved in the experiments should beconsidered when comparing, for instance, simulated and experimental electrophys-iological properties. Regarding the latter, experiments performed to characterizethe AP usually employ small pieces of tissue to avoid the problem of sensitivity ofsome ion channels to the cell isolation procedure [105]. However, for computationalreasons, simulations are commonly carried out using single cell models. As shownin chapter 4, this may represent a limitation, particularly for a number of markerswhose values highly differ when evaluated in single cells or tissues. Importantly,not only do results differ from cell to tissue but the underlying ionic contributionscan be different as well. This makes identification of ionic current conductanceseven more challenging.
Another important point to consider when comparing in silico results with ex-perimental measurements is the definition of experimentally-based physiologicalranges. In chapter 2, physiological ranges were defined following the criteria usedin [12]. Specifically, the upper and lower limits of the physiological range of a givenelectrophysiological property were determined by the maximum and the minimumvalue of that property found in the literature. This definition has two main limita-tions. The first limitation refers to the fact that in many experimental studies onlyan average value of a set of experiments is provided. Consequently, if the maximumor the minimum value is selected based on such average values, the physiologicalrange will surely be smaller than the experimental range. The second limitation isin regards of the fact that, in each experimental study, electrophysiological prop-erties are measured by using different bath solutions. This means that part of thedifferences found between experimental studies could be due to differences in theextracellular ionic concentrations.
The main objective of this chapter is to integrate all the initial formulationsand subsequent updates of the CRLP model proposed in previous chapters andto readjust the ionic conductances of the integrated model to improve replicationof experimental electrophysiological measures. All the methodologies introducedthroughout the thesis are used to build this human ventricular AP model. In par-ticular, to compare the simulation and experimental results, each experiment wasinitially considered individually, making sure that the conditions underlying theexperiment were replicated as faithfully as possible. In line with the conclusionsreported in chapter 4, a physiological range was established for each individual ex-periment by using the mean value and the standard deviation reported in the corre-sponding study (see section 6.2 for details). Additionally, based on the mentioneddifferences found between cell and tissue in many electrophysiological properties,only those that remain essentially the same in one and another scale were consid-
UniversidadZaragoza

6. A Human Ventricular Electrophysiological Model with ImprovedDescription of Experimental Behavior 111
ered for model development, while other properties were included in the validationprocess, in which tissue simulation results were contrasted with experimental tissuedata.
The final version of the CRLP model built in this chapter is compared withthat of the most recent human ventricular cell models: ten Tusscher-Panfilov(TP06) [51], Grandi-Pasqualini-Bers (GPB) model [15], O’Hara-Rudy-dynamic(ORd) model [63], and the original Carro-Rodríguez-Laguna-Pueyo (CRLP) model[119]. Results are in all cases compared against experimental results and conditionswhere one or another model best represents experimental outcomes are highlighted.
6.2 Methods
6.2.1 Adjustment of ionic conductances
The CRLP model with the updates of chapter 3 and chapter 5 was considered as astarting point. The ionic conductances of that model were redefined following theprocedure introduced in chapter 3 with the following modifications:
• All the ionic conductances and the calcium diffusion coefficients between theintracellular spaces were considered as variables to be adjusted.
• A large number of markers obtained from different experimental datasetswere considered. In the simulation of each dataset, the stimulation protocolwas reproduced and the specific experimental conditions were considered bysetting the values of the extracellular ionic concentrations as those in theexperiments.
• A new optimization function was proposed to make as many markers aspossible lie within established physiological ranges.
Details on each of the above aspects are provided in the following paragraphs.
Minimization function
With the aim of developing a model that closely reproduces the average behav-ior of human ventricular epicardial cells, a minimization function was introducedthat accounts for the sum of errors associated with the different evaluated electro-physiological markers. For each marker, mi, the error was defined in terms of theexperimental mean and standard error of the mean (SEM) as follows:
errmi(x) = µi −mi(x)
SEMi(6.1)
where µi is the experimental mean value of marker mi; mi(x) is the simulatedvalue of marker mi obtained for model parameter values in vector x; and SEMi isthe experimental standard error of the mean of marker mi.
JesúsCarro

112 New Methodologies for the Developmentand Validation of Electrophysiological Models
The objective function was defined as the sum of the square of the errors asso-ciated with all evaluated electrophysiological markers as follows:
f(x) =M∑i=1
(errmi(x))2 =
M∑i=1
(µi −mi(x)SEMi
)2
(6.2)
where M is the total number of electrophysiological markers evaluated in the op-timization problem.
Of note, SEM represents the confidence in the experimental average value ofa marker and depends on the number of experiments and on the sample standarddeviation. If the sample standard deviation is high but there are a larger number ofexperiments, the mean experimental value could be trusted more than another onefor which the sample standard deviation was lower but was obtained from a fewernumber of experiments. When the difference between the simulated and meanexperimental values of the marker is within the SEM, the error for that marker isbetween -1 and 1. Consequently, The defined objective function reduces the errorfor markers within that range and increases it for markers out of that range.
Experimental data sets
The following experimental datasets were included in the optimization problemdefined to fit ionic current conductances:
• TESZT: AP traces from healthy human ventricular endocardial tissues atsteady-state were acquired at the University of Szeged. After reaching steady-state following pacing at a CL of 1000 ms, 10 pulses were recorded. Followingthis, different drugs were added to inhibit potassium currents: 1 µM of HMR-1556 and 100 nM of L735,821 corresponding to approximately 95% IKs block[136, 137]; 50 nM of dofetilide corresponding to 15% IKr block [138]; 1 µM ofdofetilide and 1 µM of E-4031 corresponding to 70% IKr block [34, 138]; 100µM of BaCl2 corresponding to 75% IK1 block [139]. After reaching steady-state following each of the above drug actions, 10 pulses were recorded at apacing CL of 1000 ms.For each AP recording, two markers were measured: APD90 and restingmembrane potential (Vrest). According to the results presented in chapter 4,these two markers show similar values and underlying mechanisms when eval-uated at cell or tissue levels. In Table 6.1, evaluation of these two markersin the TESZT dataset, both at baseline and following each of the describedpharmacological potassium inhibitions, are summarized. For potassium in-hibition experiments, results are expressed as percentage of variation withrespect to control conditions.The bath solution in the experiments of the TESZT dataset is describedin [63]. Values of ion concentrations in the bath solution were as follows:[Ca2+]o = 1.8 mM , [K+]o = 4.0 mM , [Na+]o = 135.0 mM , [Cl−]o =124.6 mM .
UniversidadZaragoza

6. A Human Ventricular Electrophysiological Model with ImprovedDescription of Experimental Behavior 113
Experiment Marker Mean SEM n
Control APD90 (ms) 293.85 10.41 23Vrest -86.75 0.92
IK1 block 75% Variation in APD90 (%) +19.25 3.09 6Variation of Vrest (%) -4.56 1.95
IKr block 15% Variation in APD90 (%) +51.17 8.57 11Variation of Vrest (%) +0.67 1.11
IKr block 70% Variation in APD90 (%) +51.17 8.57 11Variation of Vrest (%) +0.67 1.11
IKs block 95% Variation in APD90 (%) +1.53 1.42 6Variation of Vrest (%) -0.19 1.59
Table 6.1: Evaluation of APD90 and Vrest in the TESZT dataset.
• CLVPET: AP traces from healthy human ventricular endocardial tissuesunder variable CL stimulation were acquired at the University of Szeged.After reaching steady-state following pacing at a CL of 1000 ms, stimulati atCLs varying from 300 ms to 5000 ms were applied. For each CL, 25 pulseswere delivered and the AP corresponding to the last pulse was recorded. Asin the TESZT dataset, drugs were subsequently added to inhibit potassiumcurrents. The same drugs, and at the same concentrations, were supplied tothe tissues in this case.For AP recordings under control conditions, the variation in the APD withrespect to steady-state APD at CL = 1000 ms was quantified. For AP record-ings under potassium inhibitions, the variation in the APD with respect to theAPD at the same CL under control conditions was quantified. In Table 6.2,evaluation of variations in APD90 are summarized.The bath solution in the experiments of the CLVPET dataset is describedin [63]. Values of ion concentrations in the bath solution were as follows:[Ca2+]o = 1.8 mM , [K+]o = 4.0 mM , [Na+]o = 135.0 mM , [Cl−]o =124.6 mM .
• Drouin et al. (1995) [8]: APD90 values from epicardial and endocardialcells of human ventricular tissues were measured. APD90 was quantified atdifferent CLs spanning from 1000 ms to 10000 ms. In Table 6.3, evaluationof APD90 is summarized.The bath solution used in this experiments is described in [8]. Values ofion concentrations in the bath solution were as follows: [Ca2+]o = 2.7 mM ,[K+]o = 4.0 mM , [Na+]o = 150.8 mM , [Cl−]o = 141.4 mM .
• Pieske et al. (2002) [9]: Intracellular sodium ([Na+]i) concentrations weremeasured at the following CLs: 333, 500, 1000 and 4000 ms. In this study,the absolute value of [Na+]i at CL = 1000 ms and the variations in [Na+]i
JesúsCarro

114 New Methodologies for the Developmentand Validation of Electrophysiological Models
Experiment Marker CL Mean SEM n
Control ∆APD90 (%)
300 ms -24.98 1.38
21
400 ms -20.35 1.48500 ms -14.57 1.05700 ms -8.61 1.00
1000 ms -3.12 0.601500 ms +4.28 1.022000 ms +8.75 1.163000 ms +13.86 2.225000 ms +16.32 1.55
IK1 Blocked ∆APD90 (%)
400 ms -9.68 5.35
6
500 ms -0.37 4.74700 ms +10.93 3.75
1000 ms +20.55 3.661500 ms +29.32 4.332000 ms +32.56 4.963000 ms +37.49 6.095000 ms +41.93 7.17
IKr Blocked ∆APD90 (%)
500 ms +19.51 5.45
9
700 ms +41.52 8.431000 ms +53.68 9.051500 ms +68.72 10.412000 ms +82.65 11.103000 ms +100.00 12.805000 ms +127.33 15.73
IKs Blocked ∆APD90 (%)
300 ms -23.80 2.68
5
400 ms -17.94 2.52500 ms -14.22 2.37700 ms -8.22 1.81
1000 ms -2.62 1.591500 ms +2.82 1.522000 ms +6.59 2.023000 ms +9.13 2.715000 ms +11.96 3.79
Table 6.2: Evaluation of variations in APD90 in the CLVPET dataset.
UniversidadZaragoza

6. A Human Ventricular Electrophysiological Model with ImprovedDescription of Experimental Behavior 115
Experiment Marker CL Mean SEM n
ENDO APD90 (ms)
1000 ms 329.5 15.6
14
2000 ms 345.3 17.23000 ms 362.2 20.54000 ms 369.5 21.25000 ms 378.1 20.86000 ms 393.0 22.8
10000 ms 406.5 25.5
EPI APD90 (ms)
1000 ms 350.6 14.6
14
2000 ms 382.1 19.53000 ms 392.0 19.94000 ms 406.5 18.95000 ms 418.8 17.26000 ms 424.4 17.2
10000 ms 463.1 14.6
Table 6.3: Evaluation of APD90 in the study by Drouin et al. [8].
Experiment Marker Mean SEM nCL = 1000 ms [Na+]i (mM) 18.58 3.91 7CL = 4000 ms Variation in [Na+]i (%) -15.34 17.5 7CL = 500 ms Variation in [Na+]i (%) +10.66 22.8 7CL = 333 ms Variation in [Na+]i (%) +21.74 25.3 7
Table 6.4: Evaluation of [Na+]i and its variations in the study by Pieske et al.[9].
for other CLs expressed as a percentage with respect to CL = 1000 ms werequantified. In Table 6.4, evaluation of these markers is summarized.Values of ion concentrations in the bath solution were as follows: [Ca2+]o =1.0 mM , [K+]o = 5.4 mM , [Na+]o = 152.0 mM , [Cl−]o = 157.8 mM .
• Schmidt et al. (1998) [10]: Intracellular calcium ([Ca2+]i) concentrationswere measured at the following CLs: 333, 400, 500, 575, 666, 750, 1000, 1400,2000, 3000 and 8000 ms. In this study, the absolute systolic and diastolicvalues of [Ca2+]i for CL = 1000 ms and the variations in those values forother CLs expressed as a percentage with respect to CL = 1000 ms werequantified. In Table 6.5, evaluation of these markers is summarized.The concentration of the main ions in the bath solution was: [Ca2+]o =2.5 mM , [K+]o = 5.9 mM , [Na+]o = 126.2 mM , [Cl−]o = 133.3 mM .
• Coppini et al. (2013) [11]: Intracellular calcium ([Ca2+]i) concentrationswere measured at the following CLs: 1000, 2000, and 5000 ms. The followingmarkers were evaluated:
JesúsCarro

116 New Methodologies for the Developmentand Validation of Electrophysiological Models
Experiment Marker Mean SEM n
CL = 1000 msDiastolic [Ca2+]i (µM) 1.798 0.0887 6Systolic [Ca2+]i (µM) 0.256 0.0295
CL = 333 msVar. in Diastolic [Ca2+]i (%) +48.26 17.83 6Var. of Systolic [Ca2+]i (%) -2.22 5.22
CL = 400 msVar. in Diastolic [Ca2+]i (%) +34.45 13.23 6Var. of Systolic [Ca2+]i (%) +8.89 5.51
CL = 500 msVar. in Diastolic [Ca2+]i (%) +25.83 13.23 6Var. of Systolic [Ca2+]i (%) +14.11 5.61
CL = 575 msVar. in Diastolic [Ca2+]i (%) +18.96 12.06 6Var. of Systolic [Ca2+]i (%) +10.92 5.71
CL = 666 msVar. in Diastolic [Ca2+]i (%) +6.87 9.75 6Var. of Systolic [Ca2+]i (%) +8.41 5.22
CL = 750 msVar. in Diastolic [Ca2+]i (%) +6.32 9.21 6Var. of Systolic [Ca2+]i (%) +5.61 5.028
CL = 1400 msVar. in Diastolic [Ca2+]i (%) -4.60 10.93 6Var. of Systolic [Ca2+]i (%) -5.71 4.74
CL = 2000 msVar. of Diastolic [Ca2+]i (%) +2.85 11.51 6Var. of Systolic [Ca2+]i (%) -16.63 3.97
CL = 3000 msVar. in Diastolic [Ca2+]i (%) +1.09 9.21 6Var. of Systolic [Ca2+]i (%) -21.95 3.48
CL = 8000 msVar. in Diastolic [Ca2+]i (%) +3.43 12.06 6Var. of Systolic [Ca2+]i (%) -27.56 3.29
Table 6.5: Evaluation of [Ca2+]i and its variations in the study by Schmidt et al.[10].
UniversidadZaragoza

6. A Human Ventricular Electrophysiological Model with ImprovedDescription of Experimental Behavior 117
Experiment Marker Mean SEM n
CL = 1000 ms
Diastolic [Ca2+]i (µM) 0.139 0.00994
6∆[Ca2+]i (µM) 0.3528 0.0176tCai,50% (ms) 170.27 26.37tCai,90% (ms) 356.21 46.15
CL = 2000 ms Var. of Diastolic [Ca2+]i (%) -3.66 6.70 6
CL = 5000 ms
Var. of Diastolic [Ca2+]i (%) -7.82 5.83
6∆[Ca2+]i (µM) 0.343 0.0163tCai,50% (ms) 239.33 35.16tCai,90% (ms) 517.57 52.73
Table 6.6: Evaluation of [Ca2+]i characteristics in the study by Coppini et al. [11].
Marker Mean SEM nt90%,1000→600 (ms) 119.5 21.57 2t90%,600→1000 (ms) 243.0 59.40
Table 6.7: Evaluation of time for APD rate adaptation in the study by Pueyoet al. [13].
– Diastolic [Ca2+]i: Absolute value for CL = 1000 ms and percentage ofvariation at CL = 2000 and 5000 ms with respect to CL = 1000 ms.
– Difference between systolic and diastolic [Ca2+]i levels, denoted by ∆[Ca2+]i:Absolute values for CL 1000 and 5000 ms.
– Time constants: Time from the peak to 50% and 90% recovery of the[Ca2+]i transient, denoted by tCai,50% and tCai,90%, respectively: Ab-solute values for CL = 1000 and 5000 ms.
In Table 6.6, evaluation of these markers is summarized.Values of ion concentrations in the bath solution were as follows: [Ca2+]o =1.8 mM , [K+]o = 4.0 mM , [Na+]o = 132.0 mM , [Cl−]o = 142.0 mM .
• Pueyo et al. (2010) [13]: APD rate adaptation to abrupt CL changes whenvarying CL from 1000 to 600 ms and from 600 to 1000 ms were measured.In this study, following a period of steady-state pacing at a CL of 1000 ms,stimuli were delivered at a CL of 600 ms for 10 minutes and, subsequently,at a CL of 1000 ms for additional 10 minutes. In each transition, the timeto reach 90% of the final APD value was measured, denoted by t90%,1000→600
and t90%,600→1000, respectively. In Table 6.7, evaluation of this marker issummarized.Values of ion concentrations in the bath solution were as follows: [Ca2+]o =1.0 mM , [K+]o = 4.0 mM , [Na+]o = 144.0 mM , [Cl−]o = 128.0 mM .
JesúsCarro

118 New Methodologies for the Developmentand Validation of Electrophysiological Models
Simulation of experimental protocols
The experimental protocols were simulated in isolated cells using a biphasic stim-ulation current as described in [117]. While biphasic stimulation does not removedifferences between cell and tissue simulation results as discussed in chapter 4, itprovides a better approximation for the variations in [Na+]i and [K+]i with thefrequency of stimulation, owing the fact that the ionic load during each cycle is 0.The amplitude of the biphasic stimulation current was set to twice the diastolicthreshold of the model. The duration of the positive square pulse of the biphasicstimulation was set to 1 ms.
The model was first stabilized until steady-state conditions were reached. Inparticular, the following stimulation protocols were applied when comparing withthe different experimental datasets:
• For the TESZT and CLVPET datasets, the model was first stimulated during50 minutes at a CL of 1000 ms. The TESZT protocol involved evaluationduring the last cycle. The CLVPET protocol involved replication at differentCLs after this pre-stimulation.
• For the experiments of Drouin et al., Pieske et al., Schmidt et al. and Cop-pini et al., the model was stimulated during 50 minutes at different CLs.Electrophyisiological markers were evaluated during the last cycle.
• For the experiments published by Pueyo et al., the model was first stimulatedduring 50 minutes at a CL of 1000 ms, CL was subsequently reduced to 600ms and stimulation applied for 10 minutes and, finally, CL was increased to1000 ms and stimulation applied for other 10 minutes.
Optimization algorithm
The optimization algorithm was as described in chapter 3. Design variables in-cluded all the ionic conductances of the model as well as parameters related todiffusion of intracellular calcium, namely:
• GNa: conductance of the fast sodium current (INa).
• GNa,bk: conductance of the background sodium current (INa,bk).
• GKr: conductance of the rapidly activating potassium current (IKr).
• GKs: conductance of the slowly activating potassium current (IKs).
• GKp: conductance of the plateau potassium current (IKp).
• Gto: conductance of the transient outward potassium current (Ito).
• GK1: conductance of the inward rectifier potassium current (IK1).
• GClCa: conductance of the calcium-activated chloride current (IClCa).
UniversidadZaragoza

6. A Human Ventricular Electrophysiological Model with ImprovedDescription of Experimental Behavior 119
• GCl,bk: conductance of the background chloride current (ICl,bk).
• GCaL: conductance of the L-type calcium current (ICaL).
• GCa,bk: conductance of the background calcium current (ICa,bk).
• INaK : maximum current carried through the sodium-potassium pump.
• Incx: maximum current carried through the sodium-calcium exchanger.
• IPMCA: maximum current carried through the sarcolemmal calcium pump.
• JCajunc,sl : diffusion of calcium from the junctional to the subsarcolemmal com-partment.
• JCasl,myo : diffusion of calcium from the subsarcolemmal compartment to themyoplasm.
• JSRleak : diffusion of calcium from the sarcoplasmatic reticulum to the my-oplasm.
• JSRCarel: calcium release from the sarcoplasmatic reticulum to the junctional
compartment.
• JserCa : calcium release from the sarcoplasmatic reticulum to the myoplasm.
As in chapter 3, all these variables were scaled to deal with their different ordersof magnitude:
xi = 20 · log10(yiy0i
), (6.3)
where y0i and yi are the initial and current values of the ith variable and xi is itsscaled value.
The initial radius for the trust region was selected as 2.5 for all the variables.The minimum tolerance for the scaled variables, δ1, was set to 0.01. The minimumtolerance for the optimization function, δ2, was set to 0.01. The minimum gradient,δ3, was taken as 0.01. To create the database of markers in each iteration, 500randomly-selected combinations of the design variables in the trust region weresimulated in each iteration of the optimization algorithm. For each marker, afirst-order response surface was calculated. To guarantee positivity of the responsesurface of the objective function, a response surface of first order was created forthe error and later, it was squared.
Valid ranges for electrophysiological markers were defined based on experimen-tal observations and simulated values of the electrophysiological markers undercontrol conditions. Specifically, the upper and lower limits were defined as follows:
mj,UL = maxµmj ,exp + 2 · σmj ,exp; mj,control
mj,LL = min
µmj ,exp − 2 · σmj ,exp; mj,control
JesúsCarro

120 New Methodologies for the Developmentand Validation of Electrophysiological Models
where mj,UL is the upper limit for marker mj , mj,LL is the lower limit for markermj , µmj ,exp is the mean of the experimental observations for marker mj , σmj ,exp
is the standard deviation of the experimental observations for marker mj andmj,control is the simulated value of the marker under control conditions.
All markers were considered as constraints for the optimization algorithm. Asin chapter 3, these constraints were defined to be consistent with the general for-mulation of the inequality constraints:
gj(x) =∣∣∣∣mj(x)−mj,CR
mj,RR
∣∣∣∣− 1 ≤ 0,
where mj,CR = (mj,UL + mj,LL)/2 is the central point of the valid range for theelectrophysiological marker j and mj,RR = (mj,UL − mj,LL)/2 is the distance betweenmj,CR and each of the limits of the valid range.
Implementation
The model was implemented in CellML using the original CellML model pub-lished in [119]. For the simulations, the model was exported to C++ and in-cluded in the application of the DENIS project (http://denis.usj.es). The toolto export the model can be found here: https://bitbucket.org/usj_bsicos/denis-cellml2c/src/v0.1/. The original code of the DENIS application can befound here: https://bitbucket.org/usj_bsicos/denis-myocyte/src/beta_v1.0/. The equations of the model were solved using Fordward-Euler integrator witha time step of 0.002 ms. Post-processing of simulation results and implementationof the optimization algorithm were developed in MatLab® 2017a (The MathworksInc.).
6.2.2 Model comparison
The behavior of the optimized model was compared against the original CRLPmodel and other commonly employed human ventricular cell models (TP06, GPB,ORd). Electrophysiological markers were computed in single cells for each of thosemodels.
6.2.3 Model validation
The optimized model was validated against experimental results by using a set ofelectrophysiological markers different from the ones used for model development.
In chapter 4, markers like triangulation and upstroke or maximal potential wereshown to be highly different when evaluated in cells or tissues. These markers, nothaving been used for model optimization, were used for validation. Evaluation wasperformed by using a 3 cm-long homogeneous fiber model of endocardial ventricularcells. The conditions of the experiments against which simulation results werecompared were reproduced by adjusting the external ionic concentrations. Thevalue of σ was calculated to obtain a CV close to 65 cm/s [87] under control
UniversidadZaragoza

6. A Human Ventricular Electrophysiological Model with ImprovedDescription of Experimental Behavior 121
conditions. The cell capacitance was set to Cm = 1 µF/cm2. Each marker wasevaluated at five positions within the fiber. Those positions were located at 1.00,1.25, 1.50, 1.75 and 2.00 cm from the stimulation end of the cable. The mean valueof each marker over the five positions was calculated.
The same evaluation described for the optimized CRLP model was performedfor the initial CRLP model to assess the effect of the model optimization introducedin this chapter.
Experimental dataset
The TESZT dataset described above provided experimental results on the followingAP markers:
• Triangulation: Difference between the APD90 and the APD50.
• Upstroke: Maximum of the temporal derivative of the membrane potential.
• Maximum potential: Maximum of the membrane potential.
On top of evaluating these markers under control conditions, the percentages ofvariation in each marker following ionic current inhibitions (IK1, IKr or IKs blockades)with respect to control conditions were measured. The bath solution in theseexperiments is described in [63]: [Ca2+]o = 1.8 mM , [K+]o = 4.0 mM , [Na+]o =135.0 mM , [Cl−]o = 124.6 mM .
For the steady-state simulations in fiber, we simulate 5 minutes of activity. Wereduced the simulation time for the fiber simulations in order to be able to obtainthe results in a reasonable time.
Implementation
Simulations were performed in a homogeneous 3-cm long fiber composed of endo-cardial cells. A semi-implicit operator-splitting scheme [86] was used to solve themodel with a space discretization of ∆x = 0.1 mm and a time step of ∆t = 0.002ms. The value of σ was selected to get a maximum CV of 65 cm/s, which is inagreement with experimentally reported CV values [87]. The cell capacitance wasset to Cm=1µF/cm2. Fiber simulations were implemented in FORTRAN.
6.3 Results
6.3.1 Model optimization
Following model optimization, the variation in the ionic conductances of the op-timized model with respect to the initial CRLP model varied between -23% and30%. The original model had an error of 1783.4 (according to the formula definedin section 6.2). After 13 iterations of the optimization algorithm, the error was1360.5, thus representing a reduction in the error of 23.7%.
While in the initial CRLP model 77.2% of the markers were in physiologicalrange, this value increased to 81.2% after the optimization. Figure 6.1 shows the
JesúsCarro

122 New Methodologies for the Developmentand Validation of Electrophysiological Models
Blockage Marker Physiol. This CRLP ORd GPB TP06min mean max work
Control APD90 (ms) 194.0 293.8 393.6 328.6 334.2 279.6 283.0 285.4Vmin (mV) -95.6 -86.8 -77.9 -87.4 -90.7 -96.2 -81.6 -93.8
75% IK1∆APD90 (%) 4.1 19.3 34.4 13.3 34.1 10.1 26.1 6.3∆Vmin (%) -14.1 -4.6 5.0 -32.4 -25.0 1.0 -4.6 -3.9
15% IKr∆APD90 (%) 9.3 39.1 68.8 2.7 2.9 9.6 2.4 2.4∆Vmin (%) -5.1 -1.2 2.8 0.2 0.0 0.0 0.0 0.0
70% IKr∆APD90 (%) -5.5 58.1 121.7 15.2 15.9 71.6 13.1 13.0∆Vmin (%) -6.4 1.7 9.8 0.8 -0.1 0.0 0.0 0.0
95% IKs∆APD90 (%) -5.4 1.5 8.5 0.5 0.6 6.3 0.7 55.9∆Vmin (%) -8.0 -0.2 7.6 0.0 0.0 0.0 0.0 0.2
Table 6.8: Results of steady-state AP markers for a CL of 1000 ms computed withthe optimized CRLP model and other published human ventricular cell models.
AP of a single epicardial cell simulated under control conditions with the optimizedCRLP model and with other published human ventricular cell models. As can benoted, the peak and dome features improved in chapter 5 for the CRLP model werenot modified following the model optimization introduced in this chapter.
The values of the optimized ionic conductances and the final description of themodel can be found in Appendix C.
Steady-state AP markers
Table 6.8 summarizes the results of steady-state AP markers for a CL of 1000 msunder control conditions and following ionic current inhibitions. These results werecompared with experimental measurements from the University of Szeged and theresults of other recent human ventricular cell models, as described in 6.2. Thefirst version of the CRLP model, proposed in chapter 2, had only two steady-stateAP markers out of physiological range following inhibition of IK1 or IKr currents.These two markers were still out of physiological range for the new CRLP model.For IK1 inhibition, the variation in the resting membrane potential was slightlylarger for the optimized CRLP model than for the initial model version. The lackof improvement for the new CRLP model can be explained by the modificationsintroduced into the model prior to the optimization, namely the introduction of[K+]i dynamics and the modification of the ICaL current, whereas subsequent opti-mization tried to compensate the effect of such variations on the resting membranepotential. Similar conclusions to those described above for IK1 block apply to thecase of IKr block.
APD dependence on CL
Figure 6.2 shows the variation in APD90 for different CLs under control conditionsas computed with the optimized CRLP model, the original CRLP model and other
UniversidadZaragoza

6. A Human Ventricular Electrophysiological Model with ImprovedDescription of Experimental Behavior 123
a) b)
0 100 200 300 400 500t (ms)
-100
-50
0
50
V (
mV
)
0 100 200 300 400 500t (ms)
-100
-50
0
50
V (
mV
)c) d)
0 100 200 300 400 500t (ms)
-100
-50
0
50
V (
mV
)
0 100 200 300 400 500t (ms)
-100
-50
0
50
V (
mV
)
e)
0 100 200 300 400 500t (ms)
-100
-50
0
50
V (
mV
)
Figure 6.1: Action Potential of the different models under control conditions insingle epicardial cells: a) optimized CRLP model; b) initial CRLP model; c) GPBmodel; d) ORd model; e) TP06 model.
JesúsCarro

124 New Methodologies for the Developmentand Validation of Electrophysiological Models
0 500 1000 1500 2000 2500 3000 3500 4000 4500 5000CL (ms)
60
70
80
90
100
110
120
130
140
APD
90/A
PD90
,CL
=10
00,S
S (
%)
CRLPTP06GPBORdNew modelCLVPET (Physiological Range)CLVPET (mean SE)
Figure 6.2: APD90 variation with CL under the same conditions of the CLVPETdataset.
published human ventricular cell models. Experimental results evaluated for theCLVPET dataset are presented for comparison. The APD90 value in cycle 25of the CLVPET protocol expressed as a percentage of the APD90 value understeady-state conditions for a CL of 1000 ms is presented. While the initial CRLPmodel and the GPB model showed APD increases for decreasing CLs below 500 ms,the optimized CRLP model already corrected this type of behavior, showing APDdecrases for decreasing CLs no matter the value of the CL. In fact, for long CLs,the optimized CRLP model shows results very close to the experimental outcomes.
Figure 6.3 shows results of APD variations with CL changes, in this case fol-lowing ionic current inhibitions. APD values are normalized with respect to thosecorresponding to the same CL under control conditions. As can be observed, thereis very good agreement between the new version of the CRLP model and mostexperimental results. Out of all the evaluated current inhibitions, the optimizedCRLP model renders results that are within experimental limits in all cases exceptfor the one corresponding to IKr inhibition.
Simulation results for APD90 variations with CL changes were also comparedwith the experimental results published in [8]. Figure 6.4 illustrates the results forendocardial and epicardial cells. The optimized CRLP model was within physi-ological ranges for all CLs. Endocardial cells showed longer APs than epicardialcells for the new CRLP model as well as for all other published human ventricular
UniversidadZaragoza

6. A Human Ventricular Electrophysiological Model with ImprovedDescription of Experimental Behavior 125
A 85% of IKr B 25% of IKr
0 1000 2000 3000 4000 5000CL (ms)
100
120
140
160
180
200
APD
90/A
PD90
,Con
trol
(%
)
0 1000 2000 3000 4000 5000CL (ms)
100
150
200
250
300
APD
90/A
PD90
,Con
trol
(%
)C 5% of IKs D 5% of IKs
0 1000 2000 3000 4000 5000CL (ms)
0
50
100
150
200
250
APD
90/A
PD90
,Con
trol
(%
)
0 1000 2000 3000 4000 5000CL (ms)
95
100
105
110
115
APD
90/A
PD90
,Con
trol
(%
)
E 25% of IK1
0 1000 2000 3000 4000 5000CL (ms)
80
100
120
140
160
APD
90/A
PD90
,Con
trol
(%
)
80
100
120
140
160
CRLPTP06GPBORdNew modelCLVPET (Physiological Range)CLVPET (mean SE)
Figure 6.3: APD90 variation with CL under the same conditions of the CLVPETdataset following ionic current inhibitions: A) 15% IKr block; B) 70% IKr block; C)95% IKs block; D) Zoomed graphic for 15% IKs block; E) 75% IK1 block.
JesúsCarro

126 New Methodologies for the Developmentand Validation of Electrophysiological Models
Marker Physiol. This CRLP ORd GPB TP06min mean max work[Na+]i (mM) [9] 0.00 18.58 39.27 9.04 10.06 6.92 8.10 8.06Sys. [Ca2+]i (µM) [10] 1.36 1.80 2.23 0.98 1.45 0.63 0.77 1.77Dia. [Ca2+]i (µM) [10] 0.11 0.26 0.40 0.11 0.12 0.09 0.10 0.13Dia. [Ca2+]i (µM) [11] 0.07 0.14 0.21 0.10 0.10 0.09 0.09 0.10
Table 6.9: Results of steady-state [Na+]i and [Ca2+]i for a CL of 1000 ms com-puted with the optimized CRLP model and other published human ventricular cellmodels.
cell models, including the initial CRLP model.
Intracellular sodium concentrations
In Table 6.9, steady-state [Na+]i for a CL of 1000 ms is presented as calculatedfor different human ventricular cell models, including the optimized CRLP modelintroduced in this chapter. Figure 6.9 shows the variation in [Na+]i for differentCLs, compared with the physiological ranges measured in the experiments of [9].All the tested AP models are within experimental ranges.
Intracellular calcium concentrations
In Table 6.9, steady-state diastolic and systolic [Ca2+]i values for a CL of 1000 msare presented as calculated for different human ventricular cell models, includingthe optimized CRLP model introduced in this chapter, while reproducing the con-ditions of the experiments described in [10, 11]. Whereas the diastolic [Ca2+]i levelin the optimized model was within the physiological ranges of both experimentalstudies, the systolic [Ca2+]i level was somewhat below experimentally reportedlimits. Even if the optimization algorithm moved systolic [Ca2+]i towards thephysiological range, previous modifications introduced into the model had sepa-rated the simulated systolic level to such an extent that it was not possible for theoptimization algorithm to completely move it into the expected range. Neverthe-less, other commonly used human ventricular AP models present systolic [Ca2+]ilevels similar to those of the optimized CRLP model.
Figure 6.6 shows the variation in diastolic and systolic [Ca2+]i levels for differentCLs under the conditions of the experiments of [10]. Results are expressed aspercentages with respect to the case when the pacing frequency was 1 Hz. For thecomparison with the experimental data of [10], the optimized CRLP model is theonly one with all simulated values lying within the experimentally reported limits.
Figure 6.7 shows variations in [Ca2+]i characteristics for different CLs under theconditions of the experiments of Coppini et al. [11]. The difference between systolicand diastolic [Ca2+]i levels was within experimental limits when computed for theoptimized CRLP model (Figure 6.7.A), while all the other human ventricular cellmodels rendered results out of those limits. Variations in systolic [Ca2+]i, as well
UniversidadZaragoza

6. A Human Ventricular Electrophysiological Model with ImprovedDescription of Experimental Behavior 127
A B
0 2000 4000 6000 8000 10000CL (ms)
0
500
1000
1500
2000
2500
APD
90 (
ms)
0 2000 4000 6000 8000 10000CL (ms)
200
300
400
500
APD
90 (
ms)
C D
0 2000 4000 6000 8000 10000CL (ms)
0
500
1000
1500
2000
2500
APD
90 (
ms)
0 2000 4000 6000 8000 10000CL (ms)
200
300
400
500
APD
90 (
ms)
CRLPTP06GPBORdNew modelDrouin et al. (Physiological Range)Drouin et al. (mean SE)
Figure 6.4: Simulations of the experiments by Drouin et al. [8]: A) APD90
variation with CL for epicardial cells. B) Zoomed version of the figure shownin A. C) APD90 variation with CL for endocardial cells. D) Zoomed version of thefigure shown in C.
JesúsCarro

128 New Methodologies for the Developmentand Validation of Electrophysiological Models
0.5 1 1.5 2 2.5 3f (Hz)
50
100
150[N
a+] i/[
Na+
] i(f=
1Hz)
(%
)
50
100
150
[Na+
] i/[N
a+] i(f
=1H
z) (
%)
CRLPTP06GPBORdNew modelPieske (Physiological Range)Pieske (mean SE)
Figure 6.5: Variation in [Na+]i under the same conditions of the experiments byPiekse et al. [9] for endocardial cells.
A
0.5 1 1.5 2 2.5 3f (Hz)
0
100
200
300
Dia
. [C
a2+] i/[
Ca2+
] i,1H
z (%
)
0
100
200
300
Dia
. [C
a2+] i/[
Ca2+
] i,1H
z (%
)
CRLPTP06GPBORdNew modelSchmidt (Physiological range)Schmidt (mean SE)
B
0.5 1 1.5 2 2.5 3f (Hz)
0
100
200
300
400
Sys.
[C
a2+] i/[
Ca2+
] i,1H
z (%
)
0.5 1 1.5 2 2.5 3f (Hz)
0
50
100
150
Sys.
[C
a2+] i/[
Ca2+
] i,1H
z (%
)
Figure 6.6: Variation in [Ca2+]i under the same conditions of the experiments bySchmidt et al. [10]: A) Diastolic [Ca2+]i normalized by the value when the fre-quency is 1Hz; B) Systolic [Ca2+]i normalized by the value when the the frequencyis 1Hz.
UniversidadZaragoza

6. A Human Ventricular Electrophysiological Model with ImprovedDescription of Experimental Behavior 129
Marker Physiol. This CRLP ORd GPB TP06min mean max workt90%,1000→600 (s) 58.5 119.5 180.5 260.5 314.5 254.2 157.9 299.9t90%,600→1000 (s) 75.0 243.0 411.0 265.3 346.4 352.2 184.4 350.1
Table 6.10: Results of APD adaptation to abrupt CL changes computed with alltested human ventricular models under the same conditions as in [13].
as time from [Ca2+]i peak to 50% and 90% recovery, for different CLs was in verygood agreement with experimental behavior (Figure 6.7.B, C and D).
APD adaptation to abrupt changes in the CL
Table 6.10 presents the results corresponding to APD adaptation to abrupt CLchanges as calculated for all tested human ventricular cell models and the exper-iments of [13]. Only the GPB model rendered values of time for 90% adaptationlying within physiological ranges. The optimized CRLP model, despite being closerto the experimental limits than the initial CRLP model, only provided physiolog-ical results for CL increases, but not decreases, as happened with all other modelexcept for the GPB model.
6.3.2 Model validation
Table 6.11 summarizes validation results for the optimized and the initial CRLPmodels. Under control conditions, both models rendered triangulation values out ofphysiological range, but upstroke velocity and Vmax values within range. The effectsof ionic current inhibitions over triangulation were practically within physiologicalrange for both the new and the initial CRLP models. Only IK1 inhibition renderedresults out of physiological range, particularly for the upstroke velocity and Vmax.Of note, when IK1 was blocked in the optimized model, the ERP increased over1000 ms and only out of two consecutive stimulations was able to propagate anAP.
6.4 Discussion
6.4.1 Model performance
The optimized CRLP model has been shown to produce a remarkably improvedbehavior with respect to the initial CRLP model when comparing simulated datawith experimental evidences for a set of evaluated electrophysiological properties.A detailed discussion on this is presented in the following paragraphs, togetherwith a comparison with other human ventricular cell models already published inthe literature.
JesúsCarro

130 New Methodologies for the Developmentand Validation of Electrophysiological Models
A B
1000 2000 3000 4000 5000
CL (ms)
0
0.2
0.4
0.6
0.8
[Ca2+
] i (M
)
1000 2000 3000 4000 5000
CL (ms)
0
50
100
150
Sys
[Ca
2+] i/[
Ca2+
] i,100
0ms (
%)
C D
1000 2000 3000 4000 5000
CL (ms)
0
50
100
150
200
250
300
350
t 50%
(m
s)
1000 2000 3000 4000 5000
CL (ms)
0
200
400
600
800
1000
t 90%
(m
s)
0
50
100
150
Sys
[Ca
2+] i/[
Ca2+
] i,100
0ms (
%)
CRLPTP06GPBORdNew modelCoppini (Physiological range)Coppini (mean SE)
Figure 6.7: Variation in [Ca2+]i characteristics under the same conditions of theexperiments by Coppini et al. [11]: A) Difference between systolic and diastolic[Ca2+]i levels as a function of CL; B) Systolic [Ca2+]i for different CLs normalizedby the value when CL is 1000 ms; C) Time from [Ca2+]i peak to 50% as a functionof CL; D) Time from [Ca2+]i peak to 90% as a function of CL.
UniversidadZaragoza

6. A Human Ventricular Electrophysiological Model with ImprovedDescription of Experimental Behavior 131
Blockage Marker Physiol. This CRLPmin mean max work
ControlTriangulation (ms) 44.6 65.2 85.8 137.9 111.1Upstroke (mV/ms) 132.6 283.5 434.4 275.9 278.6
Vmax (mV) 15.7 28.0 40.3 25.1 27.4
75% IK1
∆Triangulation (%) 21.3 58.2 95.2 20.2 27.7∆Upstroke (%) -21.6 -5.6 10.4 -98.6 0.8∆Vmax (%) -7.3 6.4 20.0 -69.3 -0.1
15% IKr
∆Triangulation (%) -3.5 66.6 136.8 4.5 0.8∆Upstroke (%) -37.0 -1.7 33.6 0.1 -0.7∆Vmax (%) -44.8 -3.1 38.7 0.0 0.4
70% IKr
∆Triangulation (%) 3.1 138.7 274.4 24.7 8.3∆Upstroke (%) -23.8 2.6 28.9 -1.5 1.9∆Vmax (%) -25.7 -5.1 15.5 0.2 1.0
95% IKs
∆Triangulation (%) -9.6 2.4 14.4 0.2 2.3∆Upstroke (%) -13.3 -5.2 2.8 -0.1 -0.6∆Vmax (%) -31.1 12.1 55.2 0.0 -7.1
Table 6.11: Validation results. Steady-state AP markers for a CL of 1000 mscalculated in tissue fibers simulated with the optimized and initial CRLP models.
Response to potassium current inhibitions
One of the limitations of the initial CRLP model was related to APD prolongationfollowing potassium current inhibitions. Specifically, when the initial CRLP modelwas paced at low frequencies, IK1 inhibition prolonged the APD to a larger extentthan experimentally observed. The optimization algorithm reduced the amount ofAPD prolongation induced by such inhibition and rendered percentages of APDchange well within physiological ranges. On the other hand, the optimized CRLPmodel did not completely reproduce experimental evidences related to the effectsof IK1 inhibition on resting membrane potential. This is due to the fact thatthe modifications introduced into the model before the optimization procedure(i.e. incorporation of [K+]i dynamics and ICaL current refinement) led to restingpotentials further away from experimental data. While the optimization somewhatimproved that behavior, this was not enough to provide resting membrane potentialvalues lying within experimental limits. As a consequence, the ERP was extremelylarge and not all stimulations were able to propagate an AP in a simulated tissuefiber.
Following IKr inhibition, the optimized CRLP model led to APD prolongationvalues of lower magnitude than experimentally reported. To reach an APD pro-longation of the same extent as in the experiments, the optimization algorithmemployed to develop the new CRLP model was required to change some modelparameters to a remarkably large extent as compared with the trust region of thealgorithm. In the end, this effect was neglected by the algorithm. This can be
JesúsCarro

132 New Methodologies for the Developmentand Validation of Electrophysiological Models
considered as a limitation of how the algorithm was applied by using initially thesame trust region for all model conductances. More details on this limitation arediscussed below (section 6.4.2).
APD dependence on CL
One limitation of the initial CRLP model, inherited from the GPB model, was theAPD response to increasingly shorter CLs. Specifically, for increasingly shorter CLsbelow 500 ms, the APD increased rather than decreasing. For the optimized CRLPmodel, the APD decreased monotonically for increasingly shorter CLs, even if theslope of such a relationship was slightly lower than experimentally observed. APDdependence on CL was additionally investigated following ionic current inhbitions.The behavior of the optimized model was generally consistent with experimentaldata (see Figure 6.3). Nevertheless, there is still some room for improvement,particularly in regards of the relationship between APD and CL following IK1 in-hibition.
Also, differences in the APD between endocardial and epicardial cells for differ-ent CLs were analyzed. The initial CRLP model proposed in this thesis was ableto adequately replicate the experimental APD results reported by Drouin et al. [8]for epicardial cells, but it presented a significant error for endocardial cells. For theoptimized model, epicardial cells presented APD values shorter than the originalCRLP model while endocardial cells had APD values closer to the mean value ofthe experiments. While for all tested human ventricular cell models, APD valuesfor endocardial cells were longer than for epicardial cells, Drouin et al. showed nostatistically differences in the APD values for both celly types, even being slightlylarger for epicardial cells. The optimized CRLP model rendered APD differencesbetween both cell types lower than the initial CRLP model and therefore closer toexperimental observations.
Intracellular sodium and calcium concentrations
[Na+]i values present a large variation when measured in different experiments [9].This results in a very wide physiological range for [Na+]i, with any concentrationbelow 39.3 mM being considered as physiologically plausible. In the optimizationalgorithm applied to develop the new CRLP model, when a given electrophysi-ological marker presents large experimental variance, its weight in the objectivefunction is reduced. It is thus not surprising that [Na+]i values in the optimizedCRLP model are further away from mean experimentally reported value than theinitial CRLP model, but in any case of very similar magnitude than the valuesreported for other human ventricular cell models of the literature.
Regarding [Ca2+]i values, calculated under the same conditions as in [10], theoptimized CRLP model presented systolic values lower than the first version of themodel and slightly out of physiological range. This can be attributed to the ICaL
current refinement proposed in chapter 5, which the optimization algorithm wasnot completely able to compensate for. Nevertheless, similar results were obtainedwith other common models, like the ORd and GPB models. On the other hand, the
UniversidadZaragoza

6. A Human Ventricular Electrophysiological Model with ImprovedDescription of Experimental Behavior 133
optimized CRLP model was the only model able to replicate experimental behav-ior regarding changes in [Ca2+]i characteristics with the frequency of stimulation.Specifically, when compared with the experimental data by Coppini et al. [11],the new CRLP model showed physiological values for systolic and diastolic [Ca2+]imarkers as well as for time from [Ca2+]i peak to 90% recovery, with only timefrom [Ca2+]i peak to 90% recovery presenting a less marked changed with pacingfrequency than the mean experimental value.
APD adaptation to abrupt CL changes
The adaptation of ventricular repolarization duration to abrupt changes in CLhas been proposed as an arrhythmic risk marker [80]. The adaptation time wasconsidered in the development of the new CRLP model. The main limitation ofincluding this marker in the optimization algorithm is that there are not systematicstudies analyzing it. In [94], ten different combinations of CLs were studied butnone of these combinations was used more than once in the experiments. Onlyin [13], two experiments conducted under the same experimental conditions werereported that served to define a physiological range for the adaptation time inthe process of model development. Large differences were found between resultssimulated with the initial CRLP model and the experimental range. Although theoptimized CRLP model rendered results still out of the experimental limits, theoptimization algorithm allowed reducing the difference between the model and themean experimental value by more than 27%. The difference between simulatedand maximal experimental value of the adapation time was reduced by as much as40.3% with respect to the initial CRLP model.
6.4.2 Optimization algorithm
The following paragraphs contain a discussion on a number of aspects of the opti-mization algorithm used in the development of the CRLP model.
Initialization
In this work, we used an initial trust region with the same radius for each ionic con-ductance aimed to be updated by the optimization algorithm. After optimization,some currents were shown to contribute to AP changes to a lower extent than ex-pected based on experimental evidences. In particular, the effect of IKr block on theAPD was remarkably lower than in available experimental data, and, while suchan effect was within physiological range, the dependence with pacing frequencyshown in the experiments was not reproduced by the model. Also, the increase inIKs conductance required for this conductance to have notable effects on the APwas far away from the range the algorithm considered. This could be explained by:i) all the radius are reduced when one electrophysiological marker is out of range;ii) the effect of variations in IKs conductance over the tested electrophysiologicalmarkers was very small, so the algorithm did not consider updating this variable.
JesúsCarro
134 New Methodologies for the Developmentand Validation of Electrophysiological Models
A different strategy could be used to initialize the trust region. One possibilitycould be to initialize the trust region with a different radius for each variable tobe updated by the optimization algorithm. The radius for each variable could, forinstance, be made inversely proportional to the greatest sensitivity of the evaluatedelectrophysiological markers and directly proportional to the experimental varianceof the marker with the largest sensitivity. Based on this or other ideas, futurestudies should address how to specifically define radius for each variable.
Objective function
In the optimization algorithm used in chapter 3 for incorporation of [K+]i dynam-ics into the original CRLP model, the objective function was just defined by theintegral of the total potassium current during a cardiac cycle. In this chapter,the objective function is defined as a sum of mulitple error functions reflectingdifferences between simulated and experimental data in relation to a number ofelectrophysiological properties. The weight assigned to each of the errors corre-sponding to different properties is challenging and has a large impact in the resultsobtained from the optimization procedure. In this chapter all errors were weightedby the same amount. As a consequence, if a specific AP phase is representedby several evaluated electrophysiological properties, the algorithm could be biasedto fit that phase. Future studies could address how to weight the different errorfunctions composing the objective function in such a way that the model rendersimproved results according to the criteria of interest.
The use of electrophysiological markers as part of an objective function to beoptimized for cardiac AP model development has been explored in [122]. In thatstudy the authors defined the objective function to be zero when the distancebetween the marker and the mean value is lower than the experimental standarderror of the mean and to increase linearly out of this region. Limitations of thisapproach include the fact that several combinations of parameters could result inthe same value of the objective function or that improvements in one marker thatis close to physiological range could lead to a major deterioration in the value ofother markers completely out of physiological range, as the error increases linearly.For this reason, in this chapter a minimization function was defined that assigns anerror value different from zero when the marker is within physiological range andpenalizes much more the fact of being out of range by using a quadratic function.
6.4.3 Validation
The main goal of the validation performed in this chapter was to evaluate thatthe model did not show abnormal behavior for electrophysiological properties notconsidered during the optimization phase. Future studies could extend validationto incorporate other properties or to standardize a benchmark for the evaluationof human ventricular models. This could help to improve our current understand-ing on the benefits and limitations of any proposed model and to improve modelselection according to the specific problem to be investigated.
UniversidadZaragoza

6. A Human Ventricular Electrophysiological Model with ImprovedDescription of Experimental Behavior 135
6.5 Conclusions
In this chapter, an optimization algorithm was proposed to update the CRLP modeldeveloped in previous chapters. The optimized CRLP model improved replicationof electrophysiological properties measured experimentally. Simulated results ofthose properties were either within physiologically plausible ranges or at least closerto them than before the optimization. A comparison with other published humanventricular cell models was established.
JesúsCarro


Chapter 7
Conclusions and FutureWork
7.1 Conclusions
In this thesis different techniques to improve the development and validation ofcardiac electrophysiological models have been proposed and analyzed. Based on theincrease in computational power, new strategies to reduce the number of hypothesisand/or assumptions when building an electrophysiological model were considered.The major conclusions of the thesis are summarized in the following.
7.1.1 Identification of major issues in electrophysiological model developmentand validation
The development and validation of a computational electrophysiological model is acomplex process associated with a number of difficulties. Two main issues are: i) thelimited amount of experimental data the model can be based; ii) the way in whichinformation is extracted from experiments and used to build the models. Regardingthe former, a reduced number of experimental samples and the possibly limitedinformation available from those experimental samples may hamper the evaluationof cell and tissue electrical activities for some range of parameters or under specificconditions. In the case of human samples, this limitation is even more accentuated,as there are really few available sets of data, and even more so from healthy humanhearts. Importantly, the experimental protocols applied over those data may notalways provide the information necessary for model development or validation.Regarding the second limitation, the difficulty in obtaining valuable insights fromexperimental studies may be due to the interaction between different elementsunderlying cell or tissue electrical responses. For instance, it may be challenging toinvestigate specific characteristics of a particular ionic current, as in some cases it
137
138 New Methodologies for the Developmentand Validation of Electrophysiological Models
may not be possible to completely isolate the effects of other currents. Or it mayhappen that interactions between activation and/or inactivation gating processesfor a given ionic current hinders the evaluation of specific gating characteristicsnecessary to theoretically formulate ionic current expressions in the models.
The above described issues make it complex to develop and validate a com-putational electrophysiological model that can be used to reproduce experimentalevidences at different scales. In this thesis, a number of techniques were proposedto minimize the impact of the above described issues and, when possible, to inte-grate them in the process of development and validation of the model. Of note,throughout the thesis the importance of considering the interactions between modelcomponents and spatio-temporal scales has been pointed out when evaluating sim-ulated data. This involves the possibility of considering processes covering from ionchannel characteristics and diffusion of ions in the cell up to the propagation of theelectric wave in excitable cardiac tissue. Since sometimes it may not be possible toconsider all model components at the same time due to computational restrictions,in this thesis the focus has been on showing when specific elements should neces-sarily be considered, when it is possible to simplify the model and when it may beconvenient to consider only part of the available information. In particular, thisthesis has highlighted the benefits of using in silico simulations of experimentalprotocols to evaluate all those possibilities, as long as in silico simulations replicateas closely as possible the conditions of the experiments against which the simulateddata is compared. This is further discussed in the next section.
7.1.2 New techniques for improved model development and validation
Throughout this thesis, the uncertainty associated with experimental data usedto build computational models has been analyzed and, when possible, integratedinto the process of model development. Such an uncertainty is in relation to thelarge variance commonly observed over different experiments, the relatively lownumber of conducted experiments or the limited amount of cells/tissues used forcharacterization of the electrical properties of interest.
In some cases there is an additional intrinsic difficulty in obtaining experimentalmeasures of specific model parameters or in extracting such measures from therecorded data. This would, for instance, apply to the evaluation of some gatingcharacteristics of ionic currents. In this thesis, in silico simulation of experimentalprotocols is proposed to get indirect estimates of such characteristics. By usingin silico simulation of experimental protocols, together with the application ofother techniques, a model providing an improved representation of experimentalobservations was built. Even if this technique turns out to be very useful foridentification of model ionic gating parameters, it becomes necessary to validatethe model with the new ionic expression as a whole so as to assess possible effectsat higher scales.
Another important challenge in computational model development and valida-tion regards the identification of ionic current conductances. When investigatingcardiac diseases or assessing the effects of drugs, accurate evaluation of the contri-
UniversidadZaragoza
7. Conclusions and Future Work 139
bution of each ionic current to the AP is very relevant. If a model with a highlyunbalanced representation of ionic currents is used, the simulation of the effects ofa drug or a disease that block one or several currents may provide totally mean-ingless results. As discussed throughout this thesis, it is possible to accuratelyestimate ionic current conductances by using techniques such as those proposed inthis study. In particular, formulation of an optimization problem that integrates anumber of relevant electrophysiological properties together with available experi-mental data can to a great extent serve to the purpose of identifying physiologicallyplausible conductance values that render the model suitable for investigation of car-diac diseases or drug effects. Since optimization solving is highly computationallydemanding, approaches based on response surface approximations were proposedin this thesis, which allowed model optimization in a reasonable computationaltime. Also, such developed approaches are amenable to parallel computing, whichmeans the time required to solve the optimization problem can be reduced by us-ing computational architectures specifically designed to parallel programs, such asGPUs or high-throughput computer clusters.
Based on the above, one of the main conclusions of this thesis is the needfor considering as many model elements as possible in both the development andvalidation processes. In some cases, the experimental data measured to study thebehavior of a given ionic current are affected by other ionic currents, intracellularcalcium handling or others factors, which may preclude investigation of certain cellcharacteristics without accounting for those other influences. A good practice canthus consist in developing/adjusting the model, or a part of it, by considering asmany involved elements as possible, while trying to replicate as faithfully as possiblethe conditions underlying the experiments that are aimed to be reproduced.
In some cases the conditions or protocols of those experiments highly differ fromone to another study, yet more in the case of data recorded at different laboratories.Although this might be seen as a limitation for model development and validation,the techniques proposed in this thesis have shown the capacity to integrate allthose data no matter how different the experimental protocols underlying themare. An important aspect in the description of an experimental protocol is thevalue of the ion concentrations in the bath solution. Sometimes this aspect hasbeen overlooked, but it can be relevant when accounting for data recorded undervarious conditions and a single in silico AP model is expected to reproduce differentavailable evidences.
7.2 Future work
Some future research lines identified during the development of this thesis are:
• Extend the proposed methodologies to populations of models representingelectrophysiological variability: In this thesis, an average computational APmodel was considered. This average model is representative of the mean ex-perimentally observed behavior in human ventricular cells, but, by definition,it does not aim to represent the well known cell-to-cell variability present inbiological data, in general, and electrophysiological data, in particiular. All
JesúsCarro
140 New Methodologies for the Developmentand Validation of Electrophysiological Models
the approaches proposed in this thesis for the development and validation ofa computational electrophysiological model could be extended to consider apopulation of models aimed at covering the variability reported for differentcells in experiemntal studies.
• Application of the proposed methodologies to other human ventricular electro-physiological models: Published human ventricular AP models present widelyvaried formulations of ionic currents, calcium handling and others. Whereasthose models faithfully reproduce experimental observations regarding someelectrophysiological properties, they fail to represent other properties, as high-lighted in this thesis. The optimization methodologies presented in this thesis,and in particular those described in chapter 6, could be applied onto thoseother human ventricular AP models to improve their overall performance.Also, if the definition of a specific model component wants to be adjusted forone of those models, the optimization methodology could be as well appliedto guarantee accurate representation of the corresponding experimental datafollowing model adjustment.
• Definition of a benchmark for validation of electrophysiological models: Basedon the developments presented in this thesis, a benchmark could be estab-lished to evaluate human ventricular AP models and identify those satisfyingthe criteria of interest. This benchmark could incorporate tests from the ionicto the tissue level, involving different stimulation protocols and consideringdifferent measurement conditions. This could be applied not only to averageAP models, like the TP06, GPB, ORd or CRLP models, but also to modelsbeing part of populations generated based on those other AP models. Foreach research question to be investigated, the use of a set of selected modelsdefined based on such a developed benchmark could be of major help.
• Improved optimization solving by adapting the trust region radius to each esti-mated variable: As indicated in chapter 6, the radius of the trust region wouldbenefit from a definition adapted to the individual characteristics of each vari-able. Without such an adapted definition, some model variables end up beingbarely modified during the optimization solving due to the way the impact onthe considered electrophysiological markers is accounted for. Future strate-gies could be investigated that allowed including variable normalization inthe optimization to improve overall efficiency of the optimization algorithm.
• Further update of model components: In this thesis a response-surface-basedalgorithm was used for optimization of ionic current conductances. Also, im-proved definition of ICaL voltage-dependent inactivation gates was addressed.The methodologies presented in this thesis could be extended to update othermodel components.
• Development of new stimulation pulse: In chapter 4, a comparison of a num-ber of electrophysiological properties measured in simulated cells and tissueswas provided. As described in that chapter, some properties presented highly
UniversidadZaragoza

7. Conclusions and Future Work 141
different values depending on the evaluated spatial scales. Since in some stud-ies the computational cost of conducting tissue simulations may be a limitingfactor, definition of stimulation protocols that rendered simulated resultssimilar to those measured in tissue while in fact simulating single cells wouldbe of major advantage. Those stimulation protocols could, for instance, bebased on the stimulation that one cell receives from its neighbors in the tissue(electrotonic coupling). In addition, the influence of different ionic currentson the propagation of the electric wave should could be accounted for in thedefinition of those stimulation protocols.
JesúsCarro


Appendix


Appendix A
Publications derivedfrom this Thesis
A.1 Publications in Journal Articles
• J. Carro, J. F. Rodríguez, P. Laguna, E. Pueyo. A Human VentricularCell Model for Investigation of Cardiac Arrhythmias under HyperkalaemicConditions. Phil Trans A, n. 639, pp. 4205 - 4232 (Nov, 2011).doi:10.1098/rsta.2011.0127
• J. Carro, J. F. Rodríguez-Matas, V. Monasterio, and E. Pueyo. Limitationsin electrophysiological model development and validation caused by differencesbetween simulations and experimental protocols. Progress in Biophysics andMolecular Biology, v. 129, pp. 53-64, 2017.doi: 10.1016/j.pbiomolbio.2016.11.006
• J. Carro, J. F. Rodríguez, E. Pueyo. A response surface optimization ap-proach to adjust ionic current conductances of cardiac electrophysiologicalmodels. Application to the study of potassium level changes. PLoS One, 13(10), pp. e0204411, 2018.doi: 10.1371/journal.pone.0204411
• J. Carro, J. F. Rodríguez, E. Pueyo. A Human Ventricular Electrophys-iological Model with Improved Description of Experimental Behavior. (Inpreparation).
A.2 Publications in Conference Proceedings
• J. Carro, J. F. Rodríguez Matas, P. Laguna, E. Pueyo. Analysis and Im-provement of a Human Ventricular Cell Model for Investigation of Cardiac
145
146 New Methodologies for the Developmentand Validation of Electrophysiological Models
Arrhythmias. XXXVII International Conference on Computers in Cardiol-ogy, Belfast (UK), pp. 817 - 820 (Sep, 2010).
• J. F. Rodríguez Matas, J. Carro, E. Pueyo, K. Burrage, B. Rodríguez.Impact of Multiple Ionic Changes in Arrhythmic Risk Biomarkers in HumanVentricular Electrophysiology. Biophysical Society 56th Annual Meeting, SanDiego (USA), v. 102, p. 543a (Ene, 2012).doi:10.1016/j.bpj.2011.11.2965
• J. Carro, J. F. Rodríguez Matas, E. Pueyo. In Silico Simulations of Exper-imental Protocols for Cardiac Modeling. XXXVI Annual International Con-ference of the IEEE Engineering in Medicine and Biology Society, Chicago(USA), pp. 5695 - 5698 (Aug, 2014).
• J. Carro, J. F. Rodríguez Matas, and E. Pueyo, A Methodology to ImproveHuman Ventricular Models for the Investigation of Cardiac Arrhythmias, in61st Annual Meeting of the Biophysical Society, New Orleans, USA, 2017.
A.3 Other Conferences
• J. Carro, J. F. Rodríguez Matas, and E. Pueyo, A Response Surface Op-timization approach to adjust ionic current conductances of cardiac electro-physiological models, in Gordon Research Conference in Cardiac ArrhythmiaMechanisms, Lucca, Italy, 2015.
• J. Carro, J. F. Rodríguez Matas, and E. Pueyo, Multiscale Methods for Defi-nition of Ionic Variables in Electrophysiological Models, in European Medicaland Biological Engineering Conference (EMBEC) Tampere, Finland, 2017.
UniversidadZaragoza

Appendix B
Description of the FirstModel
B.1 Model Parameters
B.1.1 Physical Constants
Name Value UnitsR 8314 J/(mol ·K)Frdy 96485 C/molT 310 KFoRT Frdy/(R · T ) mV −1
Cmem 1.381 · 10−10 F
B.1.2 Enviromental ParametersName Value UnitsLengthcell 100 · 10−5 dmRadiuscell 10.25 · 10−5 dmVcell π ·Radius2cell · Lengthcell LVmyo 0.65 · Vcell LVsr 0.035 · Vcell LVsl 0.02 · Vcell LVjunc 5.39 · 10−4 · Vcell LJCajunc,sl 8.2413 · 10−13 L/msJCasl,myo 3.7243 · 10−12 L/msJNajunc,sl 1.8313 · 10−14 L/msJNasl,myo 1.6386 · 10−12 L/ms
147

148 New Methodologies for the Developmentand Validation of Electrophysiological Models
B.1.3 Fractional Currents
Name Value UnitsFjunc 0.11 [−]Fsl 1− Fjunc [−]FjuncCaL
0.9 [−]
FslCaL1− FjuncCaL
[−]
B.1.4 Ion Concentrations
Name Value UnitsKi 138 mMKo 5.4 mMCli 15 mMClo 150 mMCao 1.8 mMMgi 1 mMNao 140 mM
B.1.5 Sodium Transport
Name Value UnitsGNa 18.86 mS/µFGNa,bk 0.597 · 10−3 mS/µFINaK 0.99 pA/pFKmKo 1.5 mMKmNaip 11 mM
B.1.6 Potassium Currents
Name Value UnitspNaK 1.833 · 10−2 [−]GK1 5.7153 · 10−1 mS/µFGKp 2 · 10−3 mS/µFGKr 3.5 · 10−2 mS/µFGKsjunc 3.5 · 10−3 mS/µFGKssl 3.5 · 10−3 mS/µFGtof ,EPI 1.144 · 10−1 mS/µFGtos,EPI 1.56 · 10−2 mS/µFGtof ,ENDO 1.404 · 10−3 mS/µFGtos,ENDO 3.7596 · 10−2 mS/µF
UniversidadZaragoza

B. Description of the First Model 149
B.1.7 Chlorine currents
Name Value UnitsGClCa 0.054813 mS/µFGCl,bk 9 · 10−3 mS/µFKdClCa 100 · 10−3 mM
B.1.8 Calcium Transport
Name Value UnitspCa 1.9887 · 10−4 L/(F ·ms)pK 5.4675 · 10−8 L/(F ·ms)pNa 3.0375 · 10−9 L/(F ·ms)Incx 4.5 pA/pFKmCai 3.59 · 10−3 mMKmCao 1.3 mMKmNai 12.29 mMKmNao 87.5 mMksat 0.32 [−]nu 0.27 [−]Kdact 0.15 · 10−3 mMIPMCA 0.0673 pA/pFKmpCa 0.5 · 10−3 mMGCa,bk 5.513 · 10−4 mS/µF
B.1.9 SR Calcium Fluxes
Name Value UnitsVmaxSRCaP
5.3114 · 10−3 mM/ms
ec50SR 0.45 mMhillSRCaP 1.787 [−]kiCa 0.5 mM−1 ·mS−1
kim 0.005 mS−1
koCa 10 mM−2 ·ms−1
kom 0.06 mS−1
ks 25 mS−1
Kmf 0.246 · 10−3 mMKmr 1.7 mMMaxSR 15 [−]MinSR 1 [−]
JesúsCarro
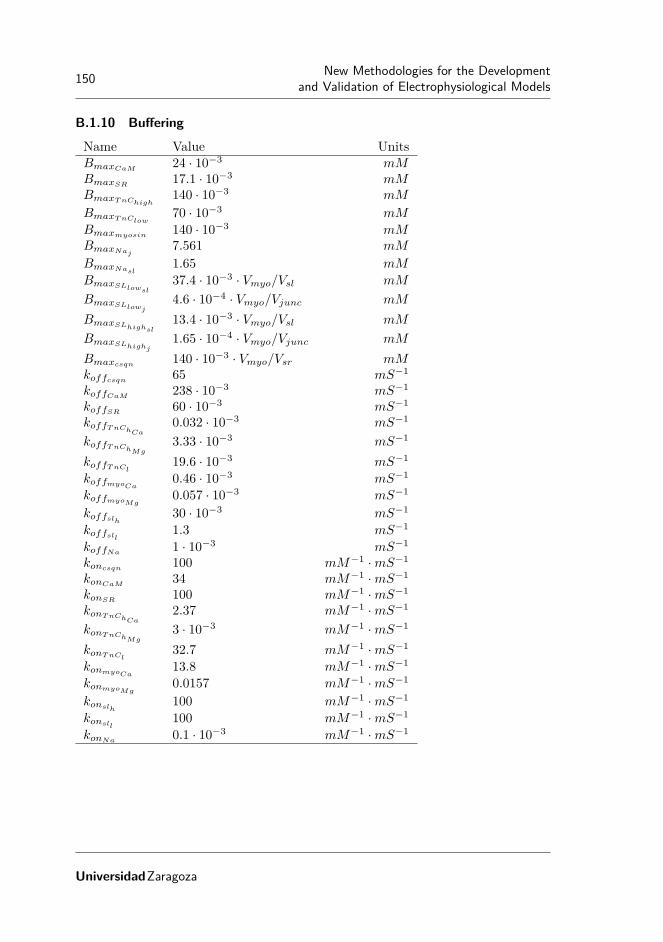
150 New Methodologies for the Developmentand Validation of Electrophysiological Models
B.1.10 Buffering
Name Value UnitsBmaxCaM
24 · 10−3 mMBmaxSR
17.1 · 10−3 mMBmaxTnChigh
140 · 10−3 mM
BmaxTnClow70 · 10−3 mM
Bmaxmyosin 140 · 10−3 mMBmaxNaj
7.561 mM
BmaxNasl1.65 mM
BmaxSLlowsl37.4 · 10−3 · Vmyo/Vsl mM
BmaxSLlowj4.6 · 10−4 · Vmyo/Vjunc mM
BmaxSLhighsl13.4 · 10−3 · Vmyo/Vsl mM
BmaxSLhighj1.65 · 10−4 · Vmyo/Vjunc mM
Bmaxcsqn 140 · 10−3 · Vmyo/Vsr mMkoffcsqn 65 mS−1
koffCaM238 · 10−3 mS−1
koffSR60 · 10−3 mS−1
koffTnChCa0.032 · 10−3 mS−1
koffTnChMg3.33 · 10−3 mS−1
koffTnCl19.6 · 10−3 mS−1
koffmyoCa0.46 · 10−3 mS−1
koffmyoMg0.057 · 10−3 mS−1
koffslh 30 · 10−3 mS−1
koffsll 1.3 mS−1
koffNa1 · 10−3 mS−1
koncsqn 100 mM−1 ·mS−1
konCaM34 mM−1 ·mS−1
konSR100 mM−1 ·mS−1
konTnChCa2.37 mM−1 ·mS−1
konTnChMg3 · 10−3 mM−1 ·mS−1
konTnCl32.7 mM−1 ·mS−1
konmyoCa13.8 mM−1 ·mS−1
konmyoMg0.0157 mM−1 ·mS−1
konslh100 mM−1 ·mS−1
konsll100 mM−1 ·mS−1
konNa0.1 · 10−3 mM−1 ·mS−1
UniversidadZaragoza

B. Description of the First Model 151
B.2 Model Equations
B.2.1 Nerst Potentials
ENajunc =1
FoRT· ln Nao
Naj
ENasl =1
FoRT· ln Nao
Nasl
EKs =1
FoRT· ln Ko + pNaK ·Nao
Ki + pNaK ·Nai
EK =1
FoRT· ln Ko
Ki
ECajunc =1
2 · FoRT· ln Cao
Caj
ECasl =1
2 · FoRT· ln Cao
Casl
ECl =1
FoRT· ln Cli
Clo
B.2.2 INa:Fast Sodium Current
mss =1(
1 + e−(56.86+V )
9.03
)2τm =0.1292 · e−(
V +45.7915.54 )
2
+ 0.06487 · e−(V −4.823
51.12 )2
dmdt =
mss −m
τm
JesúsCarro

152 New Methodologies for the Developmentand Validation of Electrophysiological Models
ah =
0 if V ≥ −40
0.057 · e−(V +80)
6.8 otherwise
bh =
5.9231
1+e−(V +10.66)
11.1
if V ≥ −40
2.7 · e0.079·V + 3.1 · 105 · e0.3485·V otherwise
τh =1
ah + bh
hss =1(
1 + eV +71.55
7.43
)2dhdt =
hss − h
τh
aj =
0 if V ≥ −40(−2.5428·104·e0.2444·V −6.948·10−6·e−0.04391·V )·(V+37.78)
1+e0.311·(V +79.23) otherwise
bj =
0.6·e0.057·V
1+e−0.1·(V +32) if V ≥ −400.02424·e−0.01052·V
1+e−0.1378·(V +40.14) otherwise
τj =1
aj + bj
jss =1(
1 + eV +71.55
7.43
)2djdt =
jss − j
τj
INajunc =Fjunc ·GNa ·m3 · h · j ·(V − ENajunc
)INasl =Fsl ·GNa ·m3 · h · j · (V − ENasl)
INa =INajunc + INasl
B.2.3 INa,bk: Background Sodium Current
INa,bkjunc =Fjunc ·GNa,bk ·(V − ENajunc
)INa,bksl =Fsl ·GNa,bk · (V − ENasl)
INa,bk =INa,bkjunc + INa,bksl
UniversidadZaragoza

B. Description of the First Model 153
B.2.4 INaK: Na-K Pump Current
σ =e
Nao67.3 − 1
7
fNaK =1
1 + 0.1245 · e−0.1·V ·FoRT + 0.0365 · σ · e−V ·FoRT
INaKjunc =Fjunc · INaK · fNaK ·Ko(
1 +(
KmNaipNaj
)4)· (Ko +KmKo)
INaKsl =Fsl · INaK · fNaK ·Ko(
1 +(
KmNaipNasl
)4)· (Ko +KmKo)
INaK =INaKjunc + INaKsl
B.2.5 IKr: Rapidly Activating Potassium Current
xrss =1
1 + e−(V +10)
5
τxr =3300(
1 + e−22−V
9
)·(1 + e
V +119
) +230
1 + eV +40
20
dxKr
dt =xrss − xKr
τxr
rKr =1
1 + eV +74
24
IKr =GKr ·√
Ko
5.4· xKr · rKr · (V − EK)
B.2.6 IKs: Slowly Activating Potassium Current
xsss =1
1 + e−(V +3.8)
14.25
τxs =990.1
1 + e−(V +2.436)
14.12
dxKs
dt =xsss − xKs
τxs
IKsjunc = Fjunc ·GKsjunc · x2Ks · (V − EKs)
IKssl =Fsl ·GKssl · x2Ks · (V − EKs)
IKs =IKsjunc + IKssl
JesúsCarro

154 New Methodologies for the Developmentand Validation of Electrophysiological Models
B.2.7 IKp: Plateau Potassium Current
kpKp =1
1 + e7.488−V
5.98
IKp =GKp · kpKp · (V − EK)
B.2.8 Ito: Transient Outward Potassium Current
xtoss =1
1 + e−(V −19)
13
τxtos=
9
1 + eV +315
+ 0.5
dxtos
dt =xtoss − xtos
τxtos
ytoss =1
1 + eV +19.5
5
τytos =800
1 + eV +60
10
+ 30
dytosdt =
ytoss − ytosτytos
τxtof=8.5 · e−(
V +4550 )
2
+ 0.5
dxtof
dt =xtoss − xtof
τxtof
τytof=85 · e
−(V +40)2
220 + 7
dytofdt =
ytoss − ytofτytof
Itos =Gtos · xtos · ytos · (V − EK)
Itof =Gtof · xtof · ytof · (V − EK)
Ito =Itos + Itof
UniversidadZaragoza

B. Description of the First Model 155
B.2.9 IK1:Inward Rectifier Potassium Current
aK1 =4.0938
1 + e0.12165·(V−EK−49.9344)
bK1 =15.7197 · e0.06739·(V−EK−3.2571) + e0.06175·(V−EK−594.31)
1 + e−0.16285·(V−EK+14.2067)
K1ss =aK1
aK1 + bK1
IK1 =GK1 ·√
Ko
5.4·K1ss · (V − EK)
B.2.10 IClCa: Calcium-Activated Chlorine Current
IClCajunc =Fjunc ·GClCa
1 + KdClCaCaj
· (V − ECl)
IClCasl =Fsl ·GClCa
1 + KdClCaCasl
· (V − ECl)
IClCa =IClCajunc + IClCasl
B.2.11 ICl,bk: Background Chlorine Current
ICl,bk =GCl,bk · (V − ECl)
B.2.12 ICaL: L-type Calcium Current
Voltage-Dependent Activation Gate
dss =1
1 + e−(V +5)
6
αd =1.4
1 + e−35−V
13
+ 0.25
βd =1.4
1 + eV +5
5
γd =1
1 + e50−V
20
τd =αd · βd + γd
dddt =
dss − d
τd
JesúsCarro
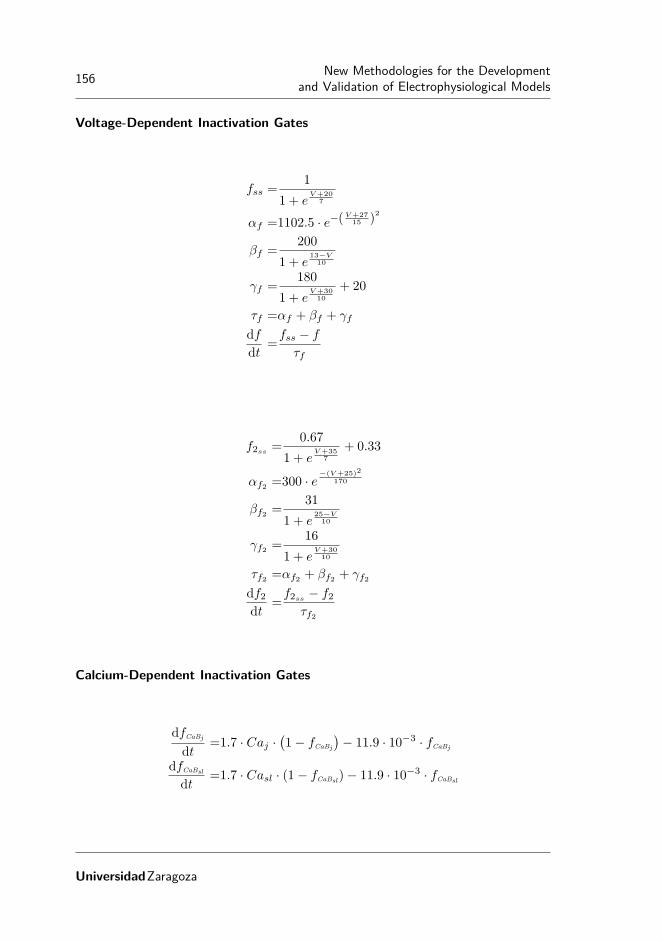
156 New Methodologies for the Developmentand Validation of Electrophysiological Models
Voltage-Dependent Inactivation Gates
fss =1
1 + eV +20
7
αf =1102.5 · e−(V +27
15 )2
βf =200
1 + e13−V
10
γf =180
1 + eV +30
10
+ 20
τf =αf + βf + γf
dfdt =
fss − f
τf
f2ss =0.67
1 + eV +35
7
+ 0.33
αf2 =300 · e−(V +25)2
170
βf2 =31
1 + e25−V
10
γf2 =16
1 + eV +30
10
τf2 =αf2 + βf2 + γf2df2dt =
f2ss − f2τf2
Calcium-Dependent Inactivation Gates
dfCaBj
dt =1.7 · Caj ·(1− fCaBj
)− 11.9 · 10−3 · fCaBj
dfCaBsl
dt =1.7 · Casl · (1− fCaBsl)− 11.9 · 10−3 · fCaBsl
UniversidadZaragoza

B. Description of the First Model 157
Currents
ICaj =pCa · V · Frdy · FoRT ·
(Caj · e2·V ·FoRT − Cao
)e2·V ·FoRT − 1
ICasl =pCa · V · Frdy · FoRT ·
(Casl · e2·V ·FoRT − Cao
)e2·V ·FoRT − 1
INaj =pNa · V · Frdy · FoRT ·
(Naj · eV ·FoRT −Nao
)eV ·FoRT − 1
INasl =pNa · V · Frdy · FoRT ·
(Nasl · eV ·FoRT −Nao
)eV ·FoRT − 1
IK =pK · V · Frdy · FoRT ·
(Ki · eV ·FoRT −Ko
)eV ·FoRT − 1
ICajunc =FjuncCaL· ICaj · d · f · f2 ·
(1− fCaBj
)ICasl =FslCaL
· ICasl · d · f · f2 · (1− fCaBsl)
ICaNajunc=FjuncCaL
· INaj · d · f · f2 ·(1− fCaBj
)ICaNasl
=FslCaL· INasl · d · f · f2 · (1− fCaBsl)
ICaK =IK · d · f · f2 ·(FjuncCaL
·(1− fCaBj
)+ FslCaL
· (1− fCaBsl))
ICa =ICajunc + ICasl
ICaNa =ICaNajunc+ ICaNasl
ICaL =ICa + ICaK + ICaNa
JesúsCarro

158 New Methodologies for the Developmentand Validation of Electrophysiological Models
B.2.13 Incx: Na-Ca Exchanger Current
Kajunc =1
1 +(
Kdact
Caj
)2Kasl =
1
1 +(
Kdact
Casl
)2s1junc =enu·V ·FoRT ·Na3j · Cao
s1sl =enu·V ·FoRT ·Na3sl · Cao
s2junc =e(nu−1)·V ·FoRT ·Na3o · Caj
s2sl =e(nu−1)·V ·FoRT ·Na3o · Casl
s3junc =KmCai ·Na3o ·
(1 +
(NajKmNai
)3)
+Km3Nao · Caj ·
(1 +
CajKmCai
)+KmCao ·Na3j +Na3j · Cao +Na3o · Caj
s3sl =KmCai ·Na3o ·
(1 +
(NaslKmNai
)3)
+Km3Nao · Casl ·
(1 +
CaslKmCai
)+KmCao ·Na3sl +Na3sl · Cao +Na3o · Casl
Incxjunc=Fjunc · Incx ·Kajunc · (s1junc − s2junc)
s3junc ·(1 + ksat · e(nu−1)·V ·FoRT
)Incxsl
=Fsl · Incx ·Kasl · (s1sl − s2sl)
s3sl ·(1 + ksat · e(nu−1)·V ·FoRT
)Incx =Incxjunc + Incxsl
B.2.14 IpCa: Sarcolemmal Calcium Pump Current
IpCajunc =Fjunc · IPMCA · Ca1.6j
Km1.6pCa + Ca1.6j
IpCasl =Fsl · IPMCA · Ca1.6sl
Km1.6pCa + Ca1.6sl
IpCa =IpCajunc + IpCasl
UniversidadZaragoza

B. Description of the First Model 159
B.2.15 ICa,bk: Background Calcium Current
ICa,bkjunc =Fjunc ·GCa,bk ·(V − ECajunc
)ICa,bksl =Fsl ·GCa,bk · (V − ECasl)
ICa,bk =ICa,bkjunc + ICa,bksl
B.2.16 SR Fluxes: Calcium Release, SR Calcium Pump, SR Calcium Leak
kCaSR =MaxSR − MaxSR −MinSR
1 +(
ec50SRCaSR
)2.5koSRCa =
koCa
kCaSR
kiSRCa =kiCa · kCaSR
RI =1−RyRr −RyRo −RyRi
dRyRr
dt =kim ·RI − kiSRCa · Caj ·RyRr −(koSRCa · Ca2j ·RyRr − kom ·RyRo
)dRyRo
dt =koSRCa · Ca2j ·RyRr − kom ·RyRo − (kiSRCa · Caj ·RyRo − kim ·RyRi)
dRyRi
dt =kiSRCa · Caj ·RyRo − kim ·RyRi −(kom ·RyRi − koSRCa · Ca2j ·RI
)JSRCarel
=ks ·RyRo · (CaSR − Caj)
JserCa =
VmaxSRCaP·((
Cai
Kmf
)hillSRCaP −(
CaSRKmr
)hillSRCaP)
1 +(
Cai
Kmf
)hillSRCaP+(
CaSRKmr
)hillSRCaP
JSRleak =5.348 · 10−6 · (CaSR − Caj)
B.2.17 Ion Homeostasis
Sodium Buffers
dNaBj
dt =konNa·Naj ·
(BmaxNaj
−NaBj
)− koffNa
·NaBj
dNaBsl
dt =konNa·Nasl ·
(BmaxNasl
−NaBsl
)− koffNa
·NaBsl
JesúsCarro

160 New Methodologies for the Developmentand Validation of Electrophysiological Models
Cytosolic Calcium Buffers
dTnCl
dt =konTnCl· Cai ·
(BmaxTnClow
− TnCl
)− koffTnCl
· TnCl
dTnChc
dt =konTnChCa· Cai ·
(BmaxTnChigh
− TnChc− TnChm
)− koffTnChCa
· TnChc
dTnChm
dt =konTnChMg·Mgi ·
(BmaxTnChigh
− TnChc − TnChm
)− koffTnChMg
· TnChm
dCaM
dt =konCaM· Cai · (BmaxCaM
− CaM)− koffCaM· CaM
dMyocdt =konmyoCa
· Cai ·(Bmaxmyosin −Myoc −Myom
)− koffmyoCa
·Myoc
dMyomdt =konmyoMg
·Mgi ·(Bmaxmyosin
−Myoc −Myom)
− koffmyoMg·Myom
dSRB
dt =konSR· Cai · (BmaxSR
− SRB)− koffSR· SRB
JCaBcytosol=
dTnCl
dt +dTnChc
dt +dTnChm
dt +dCaM
dt
+dMyoc
dt +dMyom
dt +dSRB
dt
Junctional and SL Calcium Buffers
dSLLj
dt =konsll· Caj ·
(BmaxSLlowj
− SLLj
)− koffsll · SLLj
dSLLsl
dt =konsll· Casl ·
(BmaxSLlowsl
− SLLsl
)− koffsll · SLLsl
dSLHj
dt =konslh· Caj ·
(BmaxSLhighj
− SLHj
)− koffslh · SLHj
dSLHsl
dt =konslh· Casl ·
(BmaxSLhighsl
− SLHsl
)− koffslh · SLHsl
JCaBjunction=
dSLLj
dt +dSLHj
dt
JCaBsk=
dSLLsl
dt +dSLHsl
dt
UniversidadZaragoza

B. Description of the First Model 161
Sodium Concentrations
dNajdt =
−INatotjunc· Cmem
Vjunc · Frdy+
JNajunc,sl
Vjunc· (Nasl −Naj)−
dNaBj
dtdNasl
dt =−INatotsl
· Cmem
Vsl · Frdy+
JNajunc,sl
Vsl· (Naj −Nasl)
+JNasl,myo
Vsl· (Nai −Nasl)−
dNaBsl
dtdNai
dt =JNasl,myo
Vmyo· (Nasl −Nai)
Calcium Concentrations
dCsqnb
dt =koncsqn· CaSR ·
(Bmaxcsqn
− Csqnb
)− koffcsqn · Csqnb
dCajdt =
−ICatotjunc· Cmem
Vjunc · 2 · Frdy+
JCajunc,sl
Vjunc· (Casl − Caj)− JCaBjunction
+JSRCarel
· Vsr
Vjunc+
JSRleak · Vmyo
Vjunc
dCasldt =
−ICatotsl· Cmem
Vsl · 2 · Frdy+
JCajunc,sl
Vsl· (Caj − Casl)
+JCasl,myo
Vsl· (Cai − Casl)− JCaBsk
dCaidt =
−JserCa · Vsr
Vmyo− JCaBcytosol
+JCasl,myo
Vmyo· (Casl − Cai)
dCaSR
dt =JserCa −(JSRleak · Vmyo
Vsr+ JSRCarel
)− dCsqnb
dt
B.2.18 Membrane Potential
ICatotjunc=ICajunc + ICa,bkjunc + IpCajunc − 2 · Incxjunc
ICatotsl=ICasl + ICa,bksl + IpCasl − 2 · Incxsl
ICatot =ICatotjunc+ ICatotsl
IKtot =Ito + IKr + IKs + IK1 − 2 · INaK + ICaK + IKp
JesúsCarro

162 New Methodologies for the Developmentand Validation of Electrophysiological Models
INatotjunc= INajunc + INa,bkjunc + 3 · Incxjunc + 3 · INaKjunc + ICaNajunc
INatotsl=INasl + INa,bksl + 3 · Incxsl
+ 3 · INaKsl + ICaNasl
INatot =INatotjunc+ INatotsl
ICltot =IClCa + ICl,bk
Itot =INatot + ICltot + ICatot + IKtot
dVdt =− (Itot − Istim)
UniversidadZaragoza

Appendix C
Description of the FinalModel
This appendix includes only the parameters or equations that were modified withrespect to the version described in Appendix B.
C.1 Model Parameters
C.1.1 Enviromental ParametersName Value UnitsJCajunc,sl 7.861586 · 10−13 L/msJCasl,myo 3.734497 · 10−12 L/ms
C.1.2 Fractional CurrentsName Value UnitsFjunc 0.11 [−]Fsl 1− Fjunc [−]FjuncCaL
0.9 [−]
FslCaL1− FjuncCaL
[−]
Fto,s 0.12 [−]Fto,f 1− Fto,f [−]
C.1.3 Sodium TransportName Value UnitsGNa 18.9024 mS/µFGNa,bk 0.5181448 · 10−3 mS/µFINaK 1.140666 pA/pF
163

164 New Methodologies for the Developmentand Validation of Electrophysiological Models
C.1.4 Potassium CurrentsName Value UnitsGK1 4.253697 · 10−1 mS/µFGKp 2.173516 · 10−3 mS/µFGKr 3.507879 · 10−2 mS/µFGKs 0.0034 mS/µFGtoEPI 1.558487 · 10−1 mS/µFGtoENDO 4.674482 · 10−2 mS/µF
C.1.5 Chlorine currentsName Value UnitsGClCa 4.757296 · 10−2 mS/µFGCl,bk 9.417983 · 10−3 mS/µF
C.1.6 Calcium Transport
Name Value UnitsGCaL 4.7628 · 10−4 mS/µFpCa 1 L · Ω/spK 1.3746417 · 10−4 L · Ω/spNa 7.63689 · 10−6 L · Ω/sIncx 2.747111 pA/pFIPMCA 5.84106 · 10−2 pA/pFGCa,bk 4.820643 · 10−4 mS/µF
C.1.7 SR Calcium FluxesName Value UnitsVmaxSRCaP
4.609837 · 10−3 mM/ms
ks 24.7507 mS−1
kSR,leak 5.483405 · 10−6 mS−1
C.2 Model Equations
C.2.1 Ito: Transient Outward Potassium Current
Itos =Gto · Fto,s · xtos · ytos · (V − EK)
Itof =Gto · Fto,f · xtof · ytof · (V − EK)
Ito =Itos + Itof
C.2.2 ICaL: L-type Calcium Current
Voltage-Dependent Activation Gate
UniversidadZaragoza
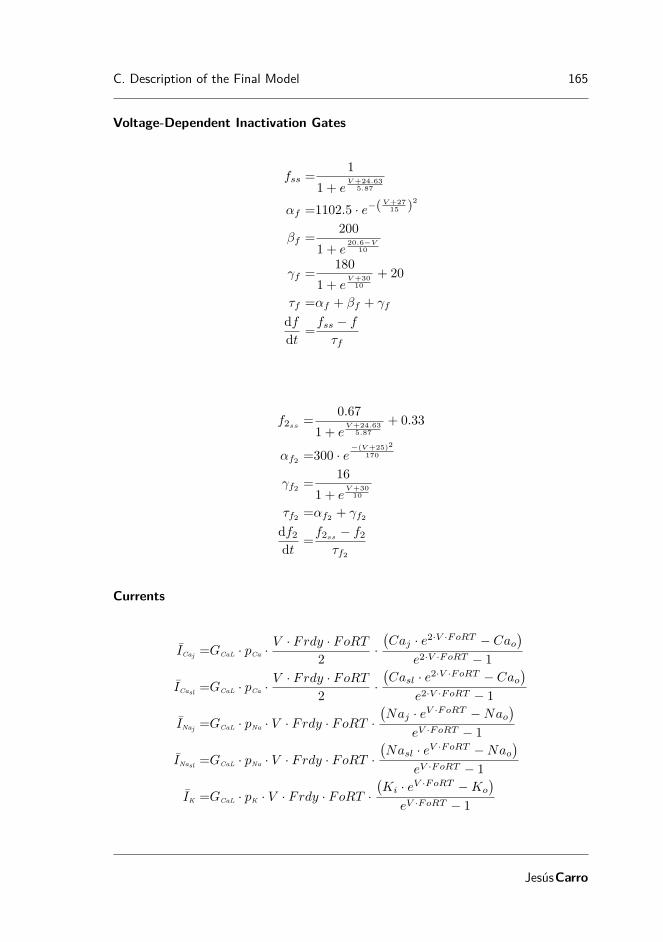
C. Description of the Final Model 165
Voltage-Dependent Inactivation Gates
fss =1
1 + eV +24.63
5.87
αf =1102.5 · e−(V +27
15 )2
βf =200
1 + e20.6−V
10
γf =180
1 + eV +30
10
+ 20
τf =αf + βf + γf
dfdt =
fss − f
τf
f2ss =0.67
1 + eV +24.63
5.87
+ 0.33
αf2 =300 · e−(V +25)2
170
γf2 =16
1 + eV +30
10
τf2 =αf2 + γf2df2dt =
f2ss − f2τf2
Currents
ICaj =GCaL · pCa ·V · Frdy · FoRT
2·(Caj · e2·V ·FoRT − Cao
)e2·V ·FoRT − 1
ICasl =GCaL · pCa ·V · Frdy · FoRT
2·(Casl · e2·V ·FoRT − Cao
)e2·V ·FoRT − 1
INaj =GCaL · pNa · V · Frdy · FoRT ·(Naj · eV ·FoRT −Nao
)eV ·FoRT − 1
INasl =GCaL · pNa · V · Frdy · FoRT ·(Nasl · eV ·FoRT −Nao
)eV ·FoRT − 1
IK =GCaL · pK · V · Frdy · FoRT ·(Ki · eV ·FoRT −Ko
)eV ·FoRT − 1
JesúsCarro

166 New Methodologies for the Developmentand Validation of Electrophysiological Models
ICajunc =FjuncCaL· ICaj · d · f · f2 ·
(1− fCaBj
)ICasl =FslCaL
· ICasl · d · f · f2 · (1− fCaBsl)
ICaNajunc=FjuncCaL
· INaj · d · f · f2 ·(1− fCaBj
)ICaNasl
=FslCaL· INasl · d · f · f2 · (1− fCaBsl)
ICaK =IK · d · f · f2 ·(FjuncCaL
·(1− fCaBj
)+ FslCaL
· (1− fCaBsl))
ICa =ICajunc + ICasl
ICaNa =ICaNajunc+ ICaNasl
ICaL =ICa + ICaK + ICaNa
C.2.3 SR Fluxes: Calcium Release, SR Calcium Pump, SR Calcium Leak
JSRleak =kSRleak· 10−6 · (CaSR − Caj)
C.2.4 Ion Homeostasis
Potassium Concentrations
dKi
dt =− IKtot ·Cmem
Vmyo · Frdy
C.2.5 Membrane Potential
IKtot =Ito + IKr + IKs + IK1 − 2 · INaK + ICaK + IKp − Istim
Itot =INatot + ICltot + ICatot + IKtot
dVdt =− Itot
UniversidadZaragoza
Appendix D
Acronyms
• 1D: one-dimensional.
• AP: action potential.
• APA: action potential amplitude.
• APD: action potential duration.
• APDR: action potential duration restitution.
• AV : atrioventricular.
• BZ : border zone.
• CI : coupling interval.
• CL: cycle length.
• CRLP: Carro-Rodríguez-Laguna-Pueyo human ventricular cell model [119].
• CRN : Courtemanche-Ramirez-Nattel model [47].
• CV : conduction velocity.
• CVDs: cardiovascular diseases.
• CZ : central zone.
• DI : diastolic interval.
• ECC : excitation-contraction coupling.
• ECG: electrocardiogram.
167

168 New Methodologies for the Developmentand Validation of Electrophysiological Models
• ECC : excitation-contraction coupling.
• ERP: effective refractive period.
• GPB: Grandi-Pascualini-Bers human ventricular model [15].
• HH : Hodgkin-Huxley model [26].
• IMW04: Iyer et al. human ventricular cell model [45].
• LR: Luo-Rudy model [106].
• NCDs: noncommunicable diseases.
• NZ : normal zone.
• ORd:O’Hara-Rudy-dynamic human ventricular cell model [63].
• RSA: response surface approximations.
• S1: basic stimulus.
• S2: extra stimulus.
• SA: sinoatrial.
• SEM : standard error of the mean.
• SR: sarcoplasmic reticulum.
• TNNP04: tenTusscher-Noble-Noble-Panfilov human ventricular cell model[46].
• TP06: tenTusscher-Panfilov human ventricular cell model [51].
UniversidadZaragoza
References
[1] Pelzmann B, Schaffer P, Bernhart E, Lang P, Machler H, Rigler B, and KoidlB. L-type calcium current in human ventricular myocytes at a physiologicaltemperature from children with tetralogy of Fallot. Cardiovasc Res, 38:424–432, 1998. doi: 10.1016/S0008-6363(98)00002-9. http://doi.org/10.1016/S0008-6363(98)00002-9.
[2] Li G.-R, Yang B, Feng J, Bosch R. F, Carrier M, and Nattel S. Trans-membrane ICa contributes to rate-dependent changes of action potentials inhuman ventricular myocytes. Am J Physiol Heart Circ Physiol, 276:H98–106,1999. http://ajpheart.physiology.org/content/276/1/H98.
[3] Magyar J, Iost N, Körtvély Á, Bányász T, Virág L, Szigligeti P, Varró A,Opincariu M, Szécsi J, Papp J. G, and Nánási P. P. Effects of endothelin-1 oncalcium and potassium currents in undiseased human ventricular myocytes.Pflügers Arch, 441:144–149, 2000. doi: 10.1007/s004240000400. http://doi.org/10.1007/s004240000400.
[4] Beuckelmann D. J, Näbauer M, and Erdmann E. Characteristics of calcium-current in isolated human ventricular myocytes from patients with terminalheart failure. J Clin Invest, 23:929–937, 1991. doi: 10.1016/0022-2828(91)90135-9. http://doi.org/10.1016/0022-2828(91)90135-9.
[5] Benitah J, Bailly P, D’Agrosa M, Da Ponte J, Delgado C, and Lorente P. Slowinward current in single cells isolated from adult human ventricles. PflügersArch, 421:176–187, 1992. doi: 10.1016/0022-2828(92)93321-A. http://doi.org/10.1016/0022-2828(92)93321-A.
[6] Mewes T and Ravens U. L-type calcium currents of human myocytes fromventricle of non-failing hearts and atrium. J Mol Cell Cardiol, 26:1307–1320,1994. doi: 10.1006/jmcc.1994.1149. http://doi.org/10.1006/jmcc.1994.1149.
[7] Sun H, Leblanc N, and Nattel S. Mechanisms of inactivation of L-type calciumchannels in human atrial myocytes. Am J Physiol Heart Circ Physiol, 33:
169

170 New Methodologies for the Developmentand Validation of Electrophysiological Models
H1625–H1635, 1997. http://ajpheart.physiology.org/content/272/4/H1625.long.
[8] Drouin E, Charpentier F, Gauthier C, Laurent K, and Marec H. L. Elec-trophysiologic characteristics of cells spanning the left ventricular wall ofhuman heart: Evidence for presence of M cells. J Am Coll Cardiol, 26:185–192, 1995. doi: 10.1016/0735-1097(95)00167-X. https://doi.org/10.1016/0735-1097(95)00167-X.
[9] Pieske B, Maier L, Piacentino V. r, Weisser J, Hasenfuss G, andHouser S. Rate dependence of [Na+]i and contractility in nonfailingand failing human myocardium. Circulation, 106:447–453, 2002. doi:10.1161/01.CIR.0000023042.50192.F4. http://doi.org/10.1161/01.CIR.0000023042.50192.F4.
[10] Schmidt U, Hajjar R. J, Helm P. A, Kim C. S, Doye A. A, and Gwath-mey J. K. Contribution of abnormal sarcoplasmic reticulum ATPase ac-tivity to systolic and diastolic dysfunction in human heart failure. J MolCell Cardiol, 30:1929–1937, 1998. doi: 10.1006/jmcc.1998.0748. http://doi.org/10.1006/jmcc.1998.0748.
[11] Coppini R, Ferrantini C, Yao L, Fan P, Del Lungo M, Stillitano F, Sartiani L,Tosi B, Suffredini S, Tesi C, Yacoub M, Olivotto I, Belardinelli L, Poggesi C,Cerbai E, and Mugelli A. Late sodium current inhibition reverses electrome-chanical dysfunction in human hypertrophic cardiomyopathyclinical perspec-tive. Circ, 127(5):575–584, 2013. doi: 10.1161/CIRCULATIONAHA.112.134932. http://circ.ahajournals.org/content/127/5/575.
[12] Romero L, Pueyo E, Fink M, and Rodríguez B. Impact of ionic currentvariability on human ventricular cellular electrophysiology. Am J PhysiolHeart Circ Physiol, 297:H1436–1445, 2009. doi: 10.1152/ajpheart.00263.2009.http://ajpheart.physiology.org/content/297/4/H1436.
[13] Pueyo E, Husti Z, Hornyik T, Baczkó I, Laguna P, Varró A, and Rodríguez B.Mechanisms of ventricular rate adaptation as a predictor of arrhythmic risk.Am J Physiol Heart Circ Physiol, 298:H1577–H1587, 2010. doi: 10.1152/ajpheart.00936.2009. http://doi.org/10.1152/ajpheart.00936.2009.
[14] Mendis S, Puska P, and Norrving B, editors. Global Atlas on cardiovas-cular disease prevention and control. World Health Organization in collab-oration with the World Heart Federation and the World Stroke Organiza-tion, 2011. ISBN 9789241564373. http://apps.who.int/iris/bitstream/10665/44701/1/9789241564373_eng.pdf.
[15] Grandi E, Pasqualini F. S, and Bers D. M. A novel computational model ofthe human ventricular action potential and Ca transient. J Mol Cell Cardiol,48:112–121, 2010. doi: 10.1016/j.yjmcc.2009.09.019. http://doi.org/10.1016/j.yjmcc.2009.09.019.
UniversidadZaragoza

References 171
[16] Malmivuo J and Plonsey R. Bioelectromagnetism - Principles and applica-tions of bioelectric and biomagnetic fields. Oxford University Press, 1995.ISBN 978-0195058239. doi: 10.1093/acprof:oso/9780195058239.001.0001.
[17] Durrer D, van Dam R. T, Freud G. E, Janse M. J, Meijler F. L, andArzbaecher R. C. Total excitation of the isolated human heart. Circ, 41(6):899–912, 1970. doi: 10.1161/01.CIR.41.6.899. http://circ.ahajournals.org/content/41/6/899.
[18] Zipes D. P and Wellens H. J. J. Sudden cardiac death. Circ Res, 98:2334–2351, 1998. doi: 10.1161/01.CIR.98.21.2334. http://doi.org/10.1161/01.CIR.98.21.2334.
[19] Rubart M and Zipes D. P. Mechanisms of sudden cardiac death. J ClinInvest, 115(9):2305–2315, 9 2005. doi: 10.1172/JCI26381. https://www.jci.org/articles/view/26381.
[20] Carmeliet E. Cardiac ionic currents and acute ischemia: from channelsto arrhythmias. Physiol Rev, 79(3):917–1017, 1999. http://physrev.physiology.org/content/79/3/917.
[21] Janse M. J and Kleber A. G. Electrophysiological changes and ventriculararrhythmias in the early phase of regional myocardial ischemia. Circ Res, 49(5):1069–1081, 1981.
[22] Janse M. J, van Capelle F. J, Morsink H, Kleber A. G, Wilms-Schopman F,Cardinal R, D’Alnoncourt C. N, and Durrer D. Flow of “injury” current andpatterns of excitation during early ventricular arrhythmias in acute regionalmyocardial ischemia in isolated porcine and canine hearts. Evidence for twodifferent arrhythmogenic mechanisms. Circ Res, 47(2):151–165, 1980.
[23] Wilensky R. L, Tranum-Jensen J, Coronel R, Wilde A. A, Fiolet J. W, andJanse M. J. The subendocardial border zone during acute ischemia of therabbit heart: an electrophysiologic, metabolic, and morphologic correlativestudy. Circ, 74(5):1137–1146, 1986. doi: 10.1161/01.CIR.74.5.1137. http://circ.ahajournals.org/content/74/5/1137.
[24] Wolferth C. C, Bellet S, Livezey M. M, and Murphy F. D. Negative displace-ment of the rs-t segment in the electrocardiogram and its relationships to pos-itive displacement; an experimental study. Am Heart J, 29(2):220–245, 1945.ISSN 0002-8703. doi: https://doi.org/10.1016/0002-8703(45)90519-9. http://www.sciencedirect.com/science/article/pii/0002870345905199.
[25] Holland R. P and Brooks H. Precordial and epicardial surface potentials dur-ing Myocardial ischemia in the pig. A theoretical and experimental analysisof the TQ and ST segments. Circ Res, 37(4):471–480, 1975. doi: 10.1161/01.RES.37.4.471. http://circres.ahajournals.org/content/37/4/471.
JesúsCarro
172 New Methodologies for the Developmentand Validation of Electrophysiological Models
[26] Hodgkin A. L and Huxley A. F. A quantitative description of membranecurrent and its applications to conduction and excitation in nerve. J Physiol,117(1-2):500–544, 1952. doi: 10.1016/S0092-8240(05)80004-7. https://www.ncbi.nlm.nih.gov/pmc/articles/PMC1392413/.
[27] Junge D. Nerve and muscle excitation. Sinauer Associates Inc., third edition,1992.
[28] Nernst W. Zur kinetik der lösung befindlichen körper: Theorie der diffusion.Z Phys Chem, 3:613–637, 1888.
[29] Noble D. A modification of the Hodgkin-Huxley equations applicable toPurkinje fibre action and pace-maker potentials. J Physiol, 160(21):317–352, 1962. doi: 10.1113/jphysiol.1962.sp006849. http://doi.org/10.1113/jphysiol.1962.sp006849.
[30] Noble D. Successes and failures in modeling heart cell electrophysiology.Heart Rhythm, 8(11):1798–1803, 2011. doi: 10.1016/j.hrthm.2011.06.014.http://doi.org/10.1016/j.hrthm.2011.06.014.
[31] Carmeliet E. E. Chloride ions and the membrane potential of Purkinje fi-bres. J Physiol, 156(2):375–388, 1961. http://www.ncbi.nlm.nih.gov/pmc/articles/PMC1359892/.
[32] Hall A. E, Hutter O. F, and Noble D. Current—voltage relations of Purkinjefibres in sodium-deficient solutions. J Physiol, 166(1):225–240, 1963. http://www.ncbi.nlm.nih.gov/pmc/articles/PMC1359373/.
[33] Hutter O. F and Noble D. Rectifying properties of heart muscle. Nature,188(4749):495, nov 1960. doi: 10.1038/188495a0. http://dx.doi.org/10.1038/188495a0.
[34] Sanguinetti M. C and Jurkiewicz N. K. Two components of cardiac delayedrectifier K+ current. Differential sensitivity to block by class III antiarrhyth-mic agents. J Gen Physiol, 96(1):195–215, 1990. doi: 10.1085/jgp.96.1.195.http://jgp.rupress.org/content/96/1/195.
[35] Reuter H. The dependence of slow inward current in Purkinje fibres onthe extracellular calcium-concentration. J Physiol, 192(2):479–92, 1967.doi: 10.1113/jphysiol.1967.sp008310. http://doi.org/10.1113/jphysiol.1967.sp008310.
[36] DiFrancesco D and Noble D. A model of cardiac electrical activity incorporat-ing ionic pumps and concentration changes. Phil Trans B, 307(1133):353–398,1985. doi: 10.1098/rstb.1985.0001. http://doi.org/10.1098/rstb.1985.0001.
[37] Beeler G. W and Reuter H. Reconstruction of the action potential of ventric-ular myocardial fibers. J Physiol, 268:177–210, 1977. doi: 10.1113/jphysiol.1977.sp011853. http://doi.org/10.1113/jphysiol.1977.sp011853.
UniversidadZaragoza
References 173
[38] Hilgemann D and Noble D. Excitation-contraction coupling and extra-cellular calcium transients in rabbit atrium: reconstruction of basic cel-lular mechanisms. Proc R Soc Lond B Biol Sci, 230:163–205, 1987.doi: 10.1098/rspb.1987.0015. http://rspb.royalsocietypublishing.org/content/230/1259/163.long.
[39] Lindblad D. S, Murphey C. R, Clark J. W, and Giles W. R. A model of theaction potential and underlying membrane currents in a rabbit atrial cell. AmPhysiol Soc, 271(4):H1666–H1696, 1996. http://ajpheart.physiology.org/content/271/4/H1666.
[40] Luo C and Rudy Y. A model of the ventricular cardiac action potential:Depolarization, repolarization and their interaction. Circ Res, 68:1501–1526,1991. doi: 10.1161/01.RES.68.6.1501. http://doi.org/10.1161/01.RES.68.6.1501.
[41] Noble D, Noble S. J, Bett G. C. L, Earm Y. E, Ho W. K, and So I. K. Therole of sodium - calcium exchange during the cardiac action potential. AnnNew York Acad Sci, 639(1):334–353, 1991. doi: 10.1111/j.1749-6632.1991.tb17323.x. http://dx.doi.org/10.1111/j.1749-6632.1991.tb17323.x.
[42] Winslow R. L, Kimball A. L, Varghese A, and Noble D. Simulating cardiacsinus and atrial network dynamics on the connection machine. Physica D, 64(1–3):281–298, 1993. doi: 10.1016/0167-2789(93)90260-8. http://doi.org/10.1016/0167-2789(93)90260-8.
[43] Ramirez R. J, Nattel S, and Courtemanche M. Mathematical analysis ofcanine atrial action potentials: rate, regional factors, and electrical remodel-ing. Am J Physiol-Heart C, 279(4):H1767–H1785, 2000. http://ajpheart.physiology.org/content/279/4/H1767.long.
[44] Priebe L and Beuckelmann D. J. Simulation study of cellular electric prop-erties in heart failure. Circ Res, 82(11):1206–1223, 1998. doi: 10.1161/01.RES.82.11.1206. http://doi.org/10.1161/01.RES.82.11.1206.
[45] Iyer V, Mazhari R, and Winslow R. L. A. Computational model of the hu-man left ventricular epicardial myocyte. Biophys J, 87(3):1507–1525, 2004.doi: 10.1529/biophysj.104.043299. http://doi.org/10.1529/biophysj.104.043299.
[46] ten Tusscher K, Noble D, Noble P. J, and Panfilov A. A model for humanventricular tissue. Am J Physiol Heart Circ Physiol, 286(4):H1573–1589,2004. doi: 10.1152/ajpheart.00794.2003. http://ajpheart.physiology.org/content/286/4/H1573.
[47] Courtemanche M, Ramirez R. J, and Nattel S. Ionic mechanisms under-lying human atrial action potential properties: Insights from a mathemati-cal model. Am J of Physiol, 275(1):H301–H321, 1998. http://ajpheart.physiology.org/content/275/1/H301.
JesúsCarro

174 New Methodologies for the Developmentand Validation of Electrophysiological Models
[48] van Capelle F. J and Durrer D. Computer simulation of arrhythmias ina network of coupled excitable elements. Circ Res, 47(3):454–466, 1980.doi: 10.1161/01.RES.47.3.454. http://circres.ahajournals.org/cgi/doi/10.1161/01.RES.47.3.454.
[49] Leon L. J and Horácek B. M. Computer model of excitation and recoveryin the anisotropic myocardium. I. Rectangular and cubic arrays of excitableelements. J Electrocardiol, 24(1):1–15, 1991. doi: 10.1016/0022-0736(91)90077-Y.
[50] Trayanova N. Discrete versus syncytial tissue behavior in a model of car-diac stimulation: I. Mathematical formulation. IEEE T Bio-Med Eng, 43(12):1129–1140, 1996. http://ieeexplore.ieee.org/xpls/abs_all.jsp?arnumber=544337.
[51] ten Tusscher K and Panfilov A. Alternans and spiral breakup in a humanventricular tissue model. Am J Physiol Heart Circ Physiol, 291:H1088–H1100,2006. doi: 10.1152/ajpheart.00109.2006. http://ajpheart.physiology.org/content/291/3/H1088.
[52] Bartos D. C, Grandi E, and Ripplinger C. M. Ion channels in the heart.Compr Physiol, 5(3):1423–1464, 2015. doi: 10.1002/cphy.c140069. http://doi.org/10.1002/cphy.c140069.
[53] Jost N, Virág L, Comtois P, Ördög B, Szuts V, Seprényi G, Bitay M, KohajdaZ, Koncz I, Nagy N, Szél T, Magyar J, Kovács M, Puskás L. G, LengyelC, Wettwer E, Ravens U, Nánási P. P, Papp J. G, Varró A, and NattelS. Molecular basis of repolarization reserve differences between dogs andman. J Physiol, 591:4189–4206, 2013. doi: 10.1113/jphysiol.2013.261198.http://doi.org/10.1113/jphysiol.2013.261198.
[54] Jost N, Virág L, Bitay M, Takács J, Lengyel C, Biliczki P, Nagy Z,Bogáts G, Lathrop D. A, Papp J. G, and Varró A. Restricting exces-sive cardiac action potential and qt prolongation. Circ, 112(10):1392–1399, 2005. doi: 10.1161/CIRCULATIONAHA.105.550111. http://circ.ahajournals.org/content/112/10/1392.
[55] Lopatin A and Nichols C. Inward rectifiers in the heart: An update onIK1. J Mol Cell Cardiol, 33:625–638, 2001. doi: 10.1006/jmcc.2001.1344.http://dx.doi.org/10.1006/jmcc.2001.1344.
[56] Bueno-Orovio A, Sánchez C, Pueyo E, and Rodriguez B. Na/K pumpregulation of cardiac repolarization: insights from a systems biology ap-proach. Pflüg Archiv, 466(2):183–193, 2014. doi: 10.1007/s00424-013-1293-1.http://dx.doi.org/10.1007/s00424-013-1293-1.
[57] Luo C and Rudy Y. A dynamic model of the cardiac ventricular ac-tion potential: I. Simulations of ionic currents and concentration changes.
UniversidadZaragoza

References 175
Circ Res, 74:1071–1096, 1994. doi: 10.1161/res.74.6.7514509. https://www.ahajournals.org/doi/abs/10.1161/res.74.6.7514509.
[58] Philipson K. D and Nicoll D. A. Sodium-calcium exchange. Curr OpinCell Biol, 4(4):678–683, 1992. doi: 10.1016/0955-0674(92)90089-U. http://www.sciencedirect.com/science/article/pii/095506749290089U.
[59] J M. L. A mechanism for Na/Ca transport. J Gen Physiol, 70:681–695, 1977.doi: 10.1085/jgp.70.6.681. http://doi.org/10.1085/jgp.70.6.681.
[60] Niederer S. A, Fink M, Noble D, and Smith N. P. A meta-analysis ofcardiac electrophysiology computational models. Exp Physiol, 94:486–495,2009. doi: 10.1113/expphysiol.2008.044610. http://doi.org/10.1113/expphysiol.2008.044610.
[61] Bueno-Orovio A, Cherry E. M, and Fenton F. H. Minimal model for hu-man ventricular action potentials in tissue. J Theor Biol, 253:544–560,2008. doi: 10.1016/j.jtbi.2008.03.029. http://doi.org/10.1016/j.jtbi.2008.03.029.
[62] Shannon T. R, Wang F, Puglisi J, Weber C, and Bers D. M. A mathematicaltreatment of integrated Ca dynamics within the ventricular myocyte. BiophysJ, 87(5):3351–3371, 2004. doi: 10.1529/biophysj.104.047449. http://doi.org/10.1529/biophysj.104.047449.
[63] O’Hara T, Virág L, Varró A, and Rudy Y. Simulation of the undiseasedhuman cardiac ventricular action potential: Model formulation and experi-mental validation. PLOS Comput Bio, 7(5), 2011. doi: 10.1371/journal.pcbi.1002061. http://doi.org/10.1371/journal.pcbi.1002061.
[64] Himeno Y, Asakura K, Cha C, Memida H, Powell T, Amano A, and NomaA. A human ventricular myocyte model with a refined representation ofexcitation-contraction coupling. Biophys J, 109:415 – 427, 7 2015. doi: doi:10.1016/j.bpj.2015.06.017. http://dx.doi.org/10.1016/j.bpj.2015.06.017.
[65] Rodríguez B, Trayanova N, and Noble D. Modeling cardiac ischemia. AnnNY Acad Sci, 1080(1):395–414, 2006. doi: 10.1196/annals.1380.029. http://dx.doi.org/10.1196/annals.1380.029.
[66] Ferrero J. M, Trenor B, Rodríguez B, and Saiz J. Electrical acticvity and reen-try during acute regional myocardial ischemia: Insights from simulations. IntJ Bifurcat Chaos, 13(12):3703–3715, 2003. doi: 10.1142/S0218127403008806.http://doi.org/10.1142/S0218127403008806.
[67] Tice B. M, Rodriguez B, and Trayanova N. A. Arrthythmogenicity of trans-mural heterogeneities in a realistic model of regional ischemia. Heart Rhythm,2:1547–5271, 2005. doi: 10.1016/j.hrthm.2005.02.820. http://dx.doi.org/10.1016/j.hrthm.2005.02.820.
JesúsCarro

176 New Methodologies for the Developmentand Validation of Electrophysiological Models
[68] Weiss D. L, Ifland M, Sachse F. B, Seemann G, and Dössel O. Modelingof cardiac ischemia in human myocytes and tissue including spatiotemporalelectrophysiological variations. Biomed Eng, 54, 2009. doi: 10.1515/BMT.2009.016. http://doi.org/10.1515/BMT.2009.016.
[69] Heidenreich E. A, Ferrero J. M, and Rodríguez J. F. Modeling the HumanHeart Under Acute Ischemia, pages 81–103. Springer Netherlands, Dordrecht,2012. ISBN 978-94-007-4552-0. doi: 10.1007/978-94-007-4552-0_4. https://doi.org/10.1007/978-94-007-4552-0_4.
[70] Mena A, Migliavacca F, M F. J, and Rodriguez Matas J. F. Vulnerabilityin regionally ischemic human heart. Effect of the extracellular potassiumconcentration. J Comput Sci, 24:160–168, 2018. doi: 10.1016/j.jocs.2017.11.009. https://doi.org/10.1016/j.jocs.2017.11.009.
[71] Dutta S, Mincholé A, Zacur E, Quinn T. A, Taggart P, and Ro-driguez B. Early afterdepolarizations promote transmural reentry inischemic human ventricles with reduced repolarization reserve. ProgBiophys Mol Bio, 120(1):236–248, 2016. doi: https://doi.org/10.1016/j.pbiomolbio.2016.01.008. http://www.sciencedirect.com/science/article/pii/S0079610716000109.
[72] Coronel R, Fiolet J. W, Wilms-Schopman F. J, Schaapherder A. F, JohnsonT. A, Gettes L. S, and Janse M. J. Distribution of extracellular potassium andits relation to electrophysiologic changes during acute myocardial ischemiain the isolated perfused porcine heart. Circ, 77(5):1125–1138, 1988. doi:10.1161/01.CIR.77.5.1125. http://circ.ahajournals.org/content/77/5/1125.
[73] A. N. ATP-regulated K+ channels in cardiac muscle. Nature, 305(5930):147–148, 1983. doi: 10.1038/305147a0. http://doi.org/10.1038/305147a0.
[74] Yatani A, Brown A. M, and Akaike N. Effect of extracellular ph on sodiumcurrent in isolated, single rat ventricular cells. J Membrane Biol, 78(2):163–168, Jun 1984. doi: 10.1007/BF01869203. https://doi.org/10.1007/BF01869203.
[75] Fink M, Noble D, Virag L, Varro A, and Giles W. R. Contributions of HERGK+ current to repolarization of the human ventricular action potential. ProgBiophys Mol Bio, 96:357–376, 2008. doi: 10.1016/j.pbiomolbio.2007.07.011.http://doi.org/10.1016/j.pbiomolbio.2007.07.011.
[76] Hondeghem L. M, Carlsson L, and Duker G. Instability and triangulationof the action potential predict serious proarrhythmia, but action potentialduration prolongation is antiarrhythmic. Circ, 103:2004–2013, 2001. doi: 10.1161/01.CIR.103.15.2004. http://doi.org/10.1161/01.CIR.103.15.2004.
UniversidadZaragoza
References 177
[77] Volders P. G, Vos M. A, Szabo B, Sipido K. R, de Groot S. H, GorgelsA. P, Wellens H. J, and Lazzara R. Progress in the understanding of cardiacearly afterdepolarizations and torsades de pointes: time to revise currentconcepts. Cardiovasc Res, 46:376–392, 2000. doi: 10.1016/S0008-6363(00)00022-5. http://doi.org/10.1016/S0008-6363(00)00022-5.
[78] Pieske B, Maier L. S, Bers D. M, and Hasenfuss G. Ca2+ handling andsarcoplasmic reticulum Ca2+ content in isolated failing and nonfailing humanmyocardium. Circ Res, 85:38–46, 1999. doi: 10.1161/01.RES.85.1.38. https://doi.org/10.1161/01.RES.85.1.38.
[79] Bers D. M and Despa S. Cardiac myocytes Ca2+ and Na+ regulation innormal and failing hearts. J Pharm Sci, 100:315–322, 2006. doi: 10.1254/jphs.CPJ06001X. http://doi.org/10.1254/jphs.CPJ06001X.
[80] Pueyo E, Smetana P, Caminal P, de Luna A. B, Malik M, and Laguna P.Characterization of QT interval adaptation to RR interval changes and its useas a risk-stratifier of arrhythmic mortality in amiodarone-treated survivors ofacute myocardial infarction. IEEE Trans Biomed Eng, 51:1511–1520, 2004.doi: 10.1109/TBME.2004.828050. http://doi.org/10.1109/TBME.2004.828050.
[81] Nolasco J. B and Dahlen R. W. A graphic method for the study of alternationin cardiac action potentials. J Appl Physiol, 25:191–196, 1968. http://jap.physiology.org/content/25/2/191.long.
[82] Weiss J. N, Karma A, Shiferaw U. Y, Chen P. S, Garfinkel A, and Qu Z.From pulses to pulseless: the saga of cardiac alternans. Circ Res, 98:1244–1253, 2006. doi: 10.1161/01.RES.0000224540.97431.f0. http://doi.org/10.1161/01.RES.0000224540.97431.f0.
[83] Levi A. J, Dalton G. R, Hancox J. C, Mitcheson J. S, Issberner J, BatesJ. A, Evans S. J, Howarth F. C, Hobai I. A, and Jones J. V. Role of intra-cellular sodium overload in the genesis of cardiac arrhythmias. J CardiovascElectrophysiol, 8:700–721, 1997. doi: 10.1111/j.1540-8167.1997.tb01834.x.http://doi.org/10.1111/j.1540-8167.1997.tb01834.x.
[84] Murphy E and Eisner D. A. Regulation of intracellular and mitochondiralsodium in health and disease. Circ Res, 104:292–303, 2009. doi: 10.1161/CIRCRESAHA.108.189050. http://circres.ahajournals.org/content/104/3/292.
[85] Keener J and Sneyd J. Mahematical physiology. Springer-Verlag, 1998. ISBN978-0-387-98381-3. doi: 10.1007/b98841. http://doi.org/10.1007/b98841.
[86] Heidenreich E, Ferrero J. M, Doblaré M, and Rodríguez J. F. Adaptive macrofinite elements for the numerical solution of monodomain equations in cardiacelectrophysiology. Ann Biomed Eng, 38(7):2331–2345, 2010. doi: 10.1007/s10439-010-9997-2. http://doi.org/10.1007/s10439-010-9997-2.
JesúsCarro
178 New Methodologies for the Developmentand Validation of Electrophysiological Models
[87] Taggart P, Sutton P, T O, Coronel R, Trimlett R, and Pugsley W. In-homogeneous transmural conduction during early ischemia in patients withcoronary artery disease. J Mol Cell Cardiol, 32:621–639, 2000. doi:10.1006/jmcc.2000.1105. http://doi.org/10.1006/jmcc.2000.1105.
[88] Rush S and Larsen H. A practical algorithm for solving dynamic membraneequations. IEEE Trans Biomed Eng, 25(4):389–392, 1978. doi: 10.1109/TBME.1978.326270. http://doi.org/10.1109/TBME.1978.326270.
[89] Fülöp L, Bányász T, Magyar J, Szentandrássy N, Varró A, and Nánási P. P.Reopening of L-type calcium channels in human ventricular myocytes dur-ing applied epicardial action potentials. Acta Physiol Scand, 180:37–94,2004. doi: 10.1046/j.0001-6772.2003.01223.x. http://doi.org/10.1046/j.0001-6772.2003.01223.x.
[90] Iost N, Virág L, Opincariu M, Szécsi J, Varró A, and Papp J. G. De-layed rectifier potassium current in undiseased human ventricular myocytes.Cardiovasc Res, 40(3):508–515, 1998. doi: 10.1016/S0008-6363(98)00204-1.https://doi.org/10.1016/S0008-6363(98)00204-1.
[91] Szentadrassy N, Banyasz T, Biro T, Szabo G, Toth B. I, Magyar J, LazarJ, Varro A, Kovacs L, and Nanasi P. P. Apico-basal inhomogeneity indistribution of ion channels in canine and human ventricular myocardium.Cardiovasc Res, 65(4):851–860, 2005. doi: 10.1016/j.cardiores.2004.11.022.https://doi.org/10.1016/j.cardiores.2004.11.022.
[92] Verkerk A. O, Wilders R, Veldkamp M. W, de Geringel W, Kirkels J. H,and Tan1 H. L. Gender Disparities in Cardiac Cellular Electrophysiologyand Arrhythmia Susceptibility in Human Failing Ventricular Myocytes. IntHeart J, 46(6):1105–1118, 2005. doi: 10.1536/ihj.46.1105. http://doi.org/10.1536/ihj.46.1105.
[93] Virág L, Iost N, Opincariu M, Szolnoky J, Szécsi J, Bogáts G, SzenohradszkyP, Varró A, and Papp J. G. The slow component of the delayed rectifierpotassium current in undiseased human ventricular myocytes. CardiovascRes, 49:790–797, 2001. doi: 10.1016/S0008-6363(00)00306-0. http://doi.org/10.1016/S0008-6363(00)00306-0.
[94] Franz M. R, Swerdlow C. D, Liem L. B, and Schaefer J. Cycle length de-pendence of human actionpPotential duration in vivo. Am Clin Inves, 82:972–979, 1988. doi: 10.1016/S0735-1097(10)80281-5. https://doi.org/10.1016/S0735-1097(10)80281-5.
[95] Li G.-R, Feng J, Yue L, and Carrier M. Transmural heterogeneity of ac-tion potentials and Ito1 in myocytes isolated from the human right ven-tricle. Am J Physiol Heart Circ Physiol, 275:H369–377, 1998. http://ajpheart.physiology.org/content/275/2/H369.
UniversidadZaragoza

References 179
[96] Beuckelmann D. J, Nabauer M, and Erdmann E. Intracellular calcium han-dling in isolated ventricular myocytes from patients with terminal heartfailure. Am Heart J, 85:1046–1055, 1992. doi: 10.1161/01.CIR.85.3.1046.https://doi.org/10.1161/01.CIR.85.3.1046.
[97] Nash M. P, Gradley C. P, Sutto P. M, Clayton R. H, Kallis P, HaywardM. P, Paterson D. J, and Taggart P. Whole heart action potential durationrestitution properties in cardiac patients: a combined clinical and modelingstudy. Exp Physiol, 91:339–354, 2006. doi: 10.1113/expphysiol.2005.031070.http://doi.org/10.1113/expphysiol.2005.031070.
[98] Shaw R. M and Rudy Y. Electrophysiologic effects of acute myocardial is-chemia: A mechanistic investigation of action potential conduction and con-duction failure. Circ Res, 80:124–138, 1997. doi: 10.1016/S0008-6363(97)00093-X. http://doi.org/10.1016/S0008-6363(97)00093-X.
[99] Kagiyama Y, Hill J. L, and Gettes L. S. Interaction of acidosis and increasedextracellular potassium on action potential characteristics and conduction inguinea-pig ventricular muscle. Circ Res, 51:614–623, 1982. doi: 10.1161/01.RES.51.5.614. http://doi.org/10.1161/01.RES.51.5.614.
[100] Dilly S. G and Lab M. J. Electrophysiological alternans and restitution duringacute regional ischaemia in myocardium of anaesthetized pig. J Physiol, 402(1):315–333, 1988. doi: 10.1113/jphysiol.1988.sp017206. http://doi.org/10.1113/jphysiol.1988.sp017206.
[101] Kurz R. W, Mohabir R, Ren X.-L, and Franz M. R. Ischaemia inducedalternans of action potential duration in the intact-heart: dependence oncoronary flow, preload and cycle length. Eur Heart J, 14(10):1410–1420, 1993.doi: 10.1093/eurheartj/14.10.1410. http://doi.org/10.1093/eurheartj/14.10.1410.
[102] Martínez J. P, Olmos S, Wagner G, and Laguna P. Characterization ofrepolarization alternans during ischemia: time-course and spatial analysis.IEEE Trans Biomed Eng, 53(4):701–711, 2006. doi: 10.1109/TBME.2006.870233. http://doi.org/10.1109/TBME.2006.870233.
[103] Rodríguez J. F, Heidenreich E. A, Romero L, Ferrero J. M, and DoblareM. Post-repolarization refractoriness in human ventricular cardiac cells. InComputers in Cardiology, volume 35, pages 581–584, 2008. doi: 10.1109/CIC.2008.4749108. http://doi.org/10.1109/CIC.2008.4749108.
[104] Krogh-Madsen T, Sobie E. A, and Christini D. J. Improving cardiomyocytemodel fidelity and utility via dynamic electrophysiology protocols and opti-mization algorithms. J Physiol, 594(9):2525–2536, 2016. ISSN 1469-7793.doi: 10.1113/JP270618. http://dx.doi.org/10.1113/JP270618.
JesúsCarro

180 New Methodologies for the Developmentand Validation of Electrophysiological Models
[105] Yue L, Feng J, Li G. R, and Nattel S. Transient outward and delayed rectifiercurrents in canine atrium: properties and role of isolation methods. Am JPhysiol, 270(6 Pt 2):H2157–68, 1996. http://ajpheart.physiology.org/content/270/6/H2157.long.
[106] Zeng J, Laurita K. R, Rosenbaum D. S, and Rudy Y. Two components of thedelayed rectifier K+ current in ventricular myocytes of the guinea pig type.Theoretical formulation and their role in repolarization. Circ Res, 77(1):140–152, 1995. doi: 10.1161/01.RES.77.1.140. http://doi.org/10.1161/01.RES.77.1.140.
[107] Nygren A, Leon L. J, and Giles W. R. Simulations of the human atrial actionpotential. Phil Trans A, 359(1783):1111–1125, 2001. doi: 10.1098/rsta.2001.0819. http://doi.org/10.1098/rsta.2001.0819.
[108] Dokos S and Lovell N. H. Parameter estimation in cardiac ionic models.Prog Biophys Mol Bio, 85(2–3):407–431, 2004. doi: http://dx.doi.org/10.1016/j.pbiomolbio.2004.02.002. http://www.sciencedirect.com/science/article/pii/S0079610704000306.
[109] Guo T, Abed A. A, Lovell N. H, and Dokos S. Optimisation of a generic ionicmodel of cardiac myocyte electrical activity. Computational and MathematicalMethods in Medicine, 2013:1–20, 2013. doi: 10.1155/2013/706195. http://doi.org/10.1155/2013/706195.
[110] Bot C. T, Kherlopian A. R, Ortega F. A, Christini D. J, and Krogh-MadsenT. Rapid genetic algorithm optimization of a mouse computational model:Benefits for anthropomorphization of neonatal mouse cardiomyocytes. FrontPhysiol, 421(3), 2012. doi: 10.3389/fphys.2012.00421. http://doi.org/10.3389/fphys.2012.00421.
[111] Groenendaal W, Ortega F. A, Kherlopian A. R, Zygmunt A. C, Krogh-Madsen T, and Christini D. J. Cell-specific cardiac electrophysiology mod-els. PLOS Comput Bio, 11(4), 2015. doi: 10.1371/journal.pcbi.1004242.http://doi.org/10.1371/journal.pcbi.1004242.
[112] Kaur J, Nygren A, and Vigmond E. J. Fitting membrane resistance alongwith action potential shape in cardiac myocytes improves convergence: Ap-plication of a multi-objective parallel genetic algorithm. PLOS ONE, 9(9):1–10, 09 2014. doi: 10.1371/journal.pone.0107984. http://dx.doi.org/10.1371/journal.pone.0107984.
[113] Syed Z, Vigmond E, Nattel S, and Leon L. Atrial cell action potentialparameter fitting using genetic algorithms. Med Biol Eng Comput, 43(5):561–571, 2005. doi: 10.1007/BF02351029. http://dx.doi.org/10.1007/BF02351029.
UniversidadZaragoza
References 181
[114] Rodríguez J. F, Renaud J. E, and Watson L. T. Trust region augmentedlagrangian methods for sequential response surface approximation and op-timization. J Mech Design, 120(1):58–66, 1998. doi: 10.1115/1.2826677.http://dx.doi.org/10.1115/1.2826677.
[115] Corsi C, Cortesi M, Callisesi G, De Bie J, Napolitano C, Santoro A, MortaraD, and Severi S. Noninvasive quantification of blood potassium concentrationfrom ECG in hemodialysis patients. Sci Rep, 7:42492, 2017. doi: 10.1038/srep42492. http://www.ncbi.nlm.nih.gov/pmc/articles/PMC5309791/.
[116] Box G. E. P, Hunter J. S, and G H. W. Statistics for Experimenters: Design,Innovation, and Discovery. Wiley Interscience, 2nd edition, 2005.
[117] Livshitz L and Rudy Y. Uniqueness and stability of action potential modelsduring rest, pacing, and conduction using problem-solving environment. BioJ, 97:1265–1276, 2009. doi: 10.1016/j.bpj.2009.05.062. http://dx.doi.org/10.1016/j.bpj.2009.05.062.
[118] Dutta S, Mincholé A, Quinn T. A, and Rodríguez B. Electrophysiologicalproperties of computational human ventricular cell action potential modelsunder acute ischemic conditions. Prog Biophys Mol Bio, 2017. doi: 10.1016/j.pbiomolbio.2017.02.007. http://www.sciencedirect.com/science/article/pii/S0079610716300918.
[119] Carro J, Rodríguez J, Laguna P, and Pueyo E. A human ventricular cellmodel for investigation of cardiac arrhythmias under hyperkalaemic condi-tions. Philos T Roy Soc A, 369(1954):4205–4232, 2011. doi: 10.1098/rsta.2011.0127. http://doi.org/10.1098/rsta.2011.0127.
[120] Carro J, Rodríguez-Matas J. F, Monasterio V, and Pueyo E. Limitations inelectrophysiological model development and validation caused by differencesbetween simulations and experimental protocols. Prog Biophys Mol Bio,2016. doi: 10.1016/j.pbiomolbio.2016.11.006. http://www.sciencedirect.com/science/article/pii/S007961071630013X.
[121] Yao A, Spitzer K. W, Ito N, Zaniboni M, Lorell B. H, and Barry W. H. Therestriction of diffusion of cations at the external surface of cardiac myocytesvaries between species. Cell Calcium, 22(6):431–438, 1997. doi: https://doi.org/10.1016/S0143-4160(97)90070-1. http://www.sciencedirect.com/science/article/pii/S0143416097900701.
[122] Alan F, Matteo F, Ronald W, and Stefano S. Computational analysis of thehuman sinus node action potential: model development and effects of muta-tions. J Physiol, 595(7):2365–2396, 2017. doi: 10.1113/JP273259. https://physoc.onlinelibrary.wiley.com/doi/abs/10.1113/JP273259.
[123] Sobie E. A. Parameter sensitivity analysis in electrophysiological modelsusing multivariable regression. Buophys J, 96(4):1264–1274, 2009. doi: 10.1016/j.bpj.2008.10.056. http://doi.org/10.1016/j.bpj.2008.10.056.
JesúsCarro

182 New Methodologies for the Developmentand Validation of Electrophysiological Models
[124] Wamsley J, Rodriguez J. F, Mirams G. R, Burrage K, Efimov I. R, andRodriguez B. mRNA Expression Levels in Failing Human Hearts PredictCellular Electrophysiological Remodeling: A Population-Based SimulationStudy. PLOS ONE, 8(2):e56359, 2013. doi: 10.1371/journal.pone.0056359.http://doi.org/10.1371/journal.pone.0056359.
[125] Drouin E, Lande G, and Charpentier F. Amiodarone reducestransmural heterogeneity of repolarization in the human heart. JAm Coll Cardiol, 32(4):1063–1067, 1998. doi: https://doi.org/10.1016/S0735-1097(98)00330-1. http://www.sciencedirect.com/science/article/pii/S0735109798003301.
[126] Noble D, Garny A, and Noble P. J. How the Hodgkin-Huxley equationsinspired the Cardiac Physiome Project. J Physiol, 590(Pt 11):2613–2628,2012. doi: 10.1113/jphysiol.2011.224238.
[127] Csercsik D, Hangos K. M, and Szederkényi G. Identifiability analysis andparameter estimation of a single Hodgkin-Huxley type voltage dependent ionchannel under voltage step measurement conditions. Neurocomputing, 77(1):178–188, 2012. doi: 10.1016/j.neucom.2011.09.006. http://doi.org/10.1016/j.neucom.2011.09.006.
[128] Lee J, Smaill B, and Smith N. Hodgkin-Huxley type ion channel character-ization: An improved method of voltage clamp experiment parameter esti-mation. J Theor Biol, 242(1):123–134, 2006. doi: 10.1016/j.jtbi.2006.02.006.http://doi.org/10.1016/j.jtbi.2006.02.006.
[129] Wang G. J and Beaumont J. Parameter estimation of the Hodgkin–Huxleygating model: An inversion procedure. Siam J Appl Math, 64(4):1249–1267, 2004. doi: 10.1137/S0036139902419826. http://doi.org/10.1137/S0036139902419826.
[130] Cherry E. M and Fenton F. H. A tale of two dogs: analyzing two models ofcanine ventricular electrophysiology. Am J Physiol Heart Circ Physiol, 292(1):H43–H55, 2007. doi: 10.1152/ajpheart.00955.2006. http://doi.org/10.1152/ajpheart.00955.2006.
[131] Pathmanathan P, Shotwell M. S, Gavaghan D. J, Cordeiro J. M, and GrayR. A. Uncertainty quantification of fast sodium current steady-state in-activation for multi-scale models of cardiac electrophysiology. Prog Bio-phys Mol Bio, 117(1):4–18, 2015. doi: 10.1016/j.pbiomolbio.2015.01.008.http://dx.doi.org/10.1016/j.pbiomolbio.2015.01.008.
[132] Shotwell M. S and Gray R. A. Estimability analysis and optimal design indynamic multi-scale models of cardiac electrophysiology. J Agr Biol EnvirSt, 21(2):261–276, 2016. doi: 10.1007/s13253-016-0244-7. http://doi.org/10.1007/s13253-016-0244-7.
UniversidadZaragoza

References 183
[133] Li G. R and Nattel S. Properties of human atrial ICa at physiological tem-peratures and relevance to action potential. Am J Physiol Heart Circ Phys-iol, 272(1):H227–H235, 1997. http://ajpheart.physiology.org/content/272/1/H227.
[134] Magyar J, Szentandrássy N, Bányász T, Fülöp L, Varró A, and Nánási P. P.Effects of thymol on calcium and potassium currents in canine and humanventricular cardiomyocytes. Brit J Pharmacol, 136(2):330–338, 2002. doi:10.1038/sj.bjp.0704718. http://doi.org/10.1038/sj.bjp.0704718.
[135] Monasterio V, Carro J, and Pueyo E. Repolarization alternans in human ven-tricular hyperkalaemic tissue: dependence on current stimulation. In XXXIICongreso Anual de la Sociedad Española de Ingeniería Biomédica, Barcelona,pages 1–4, 2014. ISBN 9788461724468.
[136] Gögelein H, Brüggemann A, Gerlach U, Brendel J, and Busch A. E. Inhibitionof IKs channels by HMR 1556. N-S Arc Pharmacol, 362(6):480–488, 2000.doi: 10.1007/s002100000284. https://doi.org/10.1007/s002100000284.
[137] Cordeiro J. M, Spitzer K. W, and Giles W. R. Repolarizing K+ currents inrabbit heart Purkinje cells. J Physiol, 508(3):811–823, 1998. ISSN 1469-7793.doi: 10.1111/j.1469-7793.1998.811bp.x. http://dx.doi.org/10.1111/j.1469-7793.1998.811bp.x.
[138] Thomsen M. B, Volders P. G. A, Stengl M, Späatjens R. L. H. M. G, BeekmanJ. D. M, Bischoff U, Kall M. A, Frederiksen K, Matz J, and Vos M. A.Electrophysiological safety of sertindole in dogs with normal and remodeledhearts. J Pharm Exp Th, 307(2):776–784, 2003. doi: 10.1124/jpet.103.052753.http://jpet.aspetjournals.org/content/307/2/776.
[139] Warren M, Guha P. K, Berenfeld O, Zaitsev A, Anumonwo J. M, DhamoonA. S, Bagwe S, Taffet S. M, and Jalife J. Blockade of the inward rec-tifying potassium current terminates ventricular fibrillation in the guineapig heart. J Cardiovasc Electr, 14(6):621–631, 2003. ISSN 1540-8167.doi: 10.1046/j.1540-8167.2003.03006.x. http://dx.doi.org/10.1046/j.1540-8167.2003.03006.x.
JesúsCarro
