drowsiness detection using heart rate variability -...
TRANSCRIPT
1 3
Med Biol Eng Comput (2016) 54:927–937DOI 10.1007/s11517-015-1448-7
ORIGINAL ARTICLE
Drowsiness detection using heart rate variability
José Vicente1,4 · Pablo Laguna1,2 · Ariadna Bartra3 · Raquel Bailón1,2
Received: 17 May 2014 / Accepted: 19 December 2015 / Published online: 16 January 2016 © International Federation for Medical and Biological Engineering 2016
of his sleep-deprivation state. Sleep-deprivation state was estimated from the first three minutes of driving using only one HRV feature (positive predictive value 0.80, sensitivity 0.62, specificity 0.88 on 30 drivers). Incorporating drowsi-ness assessment based on HRV signal may add significant improvements to existing car safety systems.
Keywords Sleep debt · Impaired driving · Heart rate variability · Autonomic nervous system · Linear discriminant analysis · Classification · Smoothed pseudo Wigner–Ville distribution
1 Introduction
The number of road fatalities in Spain in 2011 was 2060 and summed 108,858 in the 37 countries members of the International Road Traffic and Accident Database world-wide [30]. Previous research estimates that 10–30 % of these crashes are related to drowsy driving or driver fatigue [7, 20, 30], and that sleep debt [24], drugs, toxic substances or alcohol and heat excess are the main causes of drowsi-ness [32]. Recent studies showed that 2 hours of continuous nocturnal driving were sufficient to produce driving impair-ment comparable to blood alcohol concentration of 0.05 % [28], and that drivers with excessive drowsiness and other sleep disorders have greater crash rate when compared with awake individuals [6, 8]. Thus, detection of drowsiness and sleep-deprivation state, though challenging, is essential for road safety.
Electroencephalogram (EEG) is the most often used sig-nal to analyze the relaxation level of a subject. However, the need for uncomfortable contact electrodes on the head of the subject makes this technique not appropriate as part of a safety system for driving in daily real life scenarios.
Abstract It is estimated that 10–30 % of road fatalities are related to drowsy driving. Driver’s drowsiness detection based on biological and vehicle signals is being studied in preventive car safety. Autonomous nervous system activity, which can be measured noninvasively from the heart rate variability (HRV) signal obtained from surface electrocar-diogram, presents alterations during stress, extreme fatigue and drowsiness episodes. We hypothesized that these alter-ations manifest on HRV and thus could be used to detect driver’s drowsiness. We analyzed three driving databases in which drivers presented different sleep-deprivation levels, and in which each driving minute was annotated as drowsy or awake. We developed two different drowsiness detec-tors based on HRV. While the drowsiness episodes detector assessed each minute of driving as “awake” or “drowsy” with seven HRV derived features (positive predictive value 0.96, sensitivity 0.59, specificity 0.98 on 3475 min of driv-ing), the sleep-deprivation detector discerned if a driver was suitable for driving or not, at driving onset, as function
Electronic supplementary material The online version of this article (doi:10.1007/s11517-015-1448-7) contains supplementary material, which is available to authorized users.
* José Vicente [email protected]
1 BSICoS Group, Aragon Institute of Engineering Research (I3A), IIS Aragón, University of Zaragoza, Zaragoza, Aragón, Spain
2 Center of Bioengineering, Biomaterials and Nanomedicine (CIBER-BBN), Zaragoza, Spain
3 Ficomirrors, Ficosa International, Barcelona, Spain4 Office of Science and Engineering Laboratories, Center
for Devices and Radiological Health, US Food and Drug Administration, Silver Spring, MD, USA

928 Med Biol Eng Comput (2016) 54:927–937
1 3
Moreover, driving may affect the relaxation level signature on the EEG, so other biological or vehicle signals are being studied and assessed in different systems [9, 10, 14, 17, 19, 22, 23, 33].
Autonomic nervous system (ANS) activity presents alterations during stress, extreme fatigue and drowsiness episodes [17]. Wakefulness states are characterized by an increase in sympathetic activity and/or a decrease of para-sympathetic activity, while extreme relaxation states are characterized by an increase in parasympathetic activity and/or a decrease in sympathetic activity [2, 9, 17]. The ANS activity can be estimated noninvasively from the heart rate variability (HRV) signal obtained from surface ECG. Low-frequency (LF) band (0.04–0.15 Hz) power is influ-enced by sympathetic and parasympathetic activity as well as other mechanisms. However, when it is expressed in nor-malized units, it is usually accepted as a measure of sym-pathetic activity dominance. High-frequency (HF) band (0.15–0.4 Hz) power is considered of parasympathetic ori-gin in classical HRV analysis, when respiratory frequency is assumed to be in the range from 0.15 to 0.4 Hz [25]. Bal-ance between sympathetic and parasympathetic systems is measured by the LF/HF ratio. Sympathovagal balance has been shown to decrease sometime after the sleep onset [23].
We hypothesized that drowsy states correspond with higher levels of HF resulting from parasympathetic activa-tion. Fatigued states correspond with sleep demand (para-sympathetic activation) counteracted by subject’s trying to stay awake which results in an increase in LF due to sym-pathetic activation. A relaxed and awake subject would pre-sent lower levels of HF and LF. Finally, stress states corre-spond with higher LF levels caused mainly by sympathetic activation while the subject is awake (Fig. 1).
To test our hypothesis, we developed and assessed two different drowsiness detectors based on HRV analysis. First, we developed a drowsiness episodes detector, which periodically evaluates the state of the driver as awake or drowsy. Its output could be used to trigger an alarm to alert the driver when becoming drowsy. Next, we developed a sleep-deprivation detector, which identifies as not suitable
for driving those drivers that present sleep-deprivation. The sleep-deprivation detector assesses the global state of the driver using the first three minutes of driving, and it could be used as a safety test in a similar fashion as alcohol or drug tests.
2 Methods
2.1 Materials
Fico Mirrors S.A. provided three databases: two from a simulated driving environment and a third from a real driv-ing situation (databases summary in Table 1). Thirty (17 men, 13 women) healthy volunteers in the age range from 25 to 60 years were included in the study if they reported not to suffer from known chronic, cardiac and mental dis-eases. All subjects signed an informed consent form, were informed of the purpose of the experiment, and were paid for their participation.
In all trials, a two-lead ECG signal at a sampling fre-quency of 256 Hz together with other signals which are not used in this study was recorded using a biomedical monitor (Bitmed eXim Pro, BitMed). Each minute was annotated with the state of the driver as awake, fatigued or drowsy by an external observer as described in [22]. The drowsiness episodes detector used the external observer annotations as reference, and the labels from the sleep-deprivation proto-col were used as reference in the sleep-deprivation detector.
Drivers participating in the simulation trials followed a sleep-deprivation protocol before the test and were labeled as not-sleep-deprived if they had regular sleep (7–9 h), par-tially sleep-deprived if they slept less than 4 h in the night previous to the test, and fully sleep-deprived if they were awake for at least 20 h preceding the test. The simulator was built in partnership with a provider specialized in tri-als, following well-defined protocols that assure control and
Fig. 1 Hypothetical subject states distribution as function of high-frequency (HF) and low-frequency (LF) power of heart rate variabil-ity signal
Table 1 Databases summary. Number of minutes labeled as awake, drowsy or fatigued and number of drivers with or without sleep depri-vation in each database and the expected system outputs
RDB real driving database, SDB simulated driving database, ADB alarm test driving database
Database Minutes Sleep-deprived
Awake Drowsy or fatigued Not Partial or full
SDB 44 877 6 3
RDB 2010 544 9 1
ADB – – 2 9
Total 2054 1421 17 13
Alarm Off On – –
Suitable – – Yes No

929Med Biol Eng Comput (2016) 54:927–937
1 3
repeatability. The simulation scenario was a two-way high-way with two lanes in each direction, low density of traf-fic, night environment, path with no sharp curves and rural environment with far apart trees. To recreate an atmosphere as similar as possible to a car, the room climate control was setup to 24 ◦C, low lighting and with highway sounds. These conditions were the same for all subjects. The first simula-tion trial [(Simulated Driving Database (SDB)] consists of the recordings of nine (five women) subjects driving for 120 minutes, while 11 (six women) subjects driving during 100 minutes participated in the second simulation trial (Alarm Test Driving Database [ADB]). ADB was only used in the sleep-deprivation detector since no information of external observer of drowsy or awake minutes was available.
Drivers participating in the real driving trial were not-sleep-deprived. Real Driving Database (RDB) consists of the recordings of ten (two women) professional driv-ers while driving a vehicle on highway or road during a working day (8 h). Drivers had to stop at least 10 minutes every 2 h. All subjects but one were labeled as not-sleep-deprived. Annotations of one of the drivers, which stopped to sleep after the first driving hour, are mainly drowsy and fatigue. Thus, the initial state of this driver was considered as sleep-deprived.
2.2 System overview
Figure 2 shows the components of the system, which is based on the one described in [29], with minor changes to include the sleep-deprivation detector classifier. It works analyzing running windows of one-lead (lead II) 2-min-utes ECG. Once the system starts, it provides an output indicating whether or not the driver is sleep-deprived, thus whether or not he is suitable for driving, after the first 3 minutes. Then, the drowsiness episodes detector evaluates
the state of the driver every minute, maintaining the alarm OFF if the driver is identified as awake and triggering the alarm to ON if the driver is identified as drowsy or fatigued. Last two rows of Table 1 show the system’s output corre-sponding to each proposed classifier. Signal processing and online system algorithms were implemented in MATLAB (The MathWorks Inc., MA).
2.3 Signal qualification block
During real driving trial, the drivers stopped at least every 2 h to take a break. Drivers were instructed to keep the sys-tem on and just unplugged the leads connectors from the ECG recorder without switching off the data acquisition system during their resting breaks, so they did not have to manipulate the electrodes or other sensitive parts of the system. This procedure improved the user experience, minimized risks of wrong manipulation of the system, but also introduced peaks of noise when plugging and unplug-ging the cables, and segments without signal in the records. We developed the signal qualification block to detect these ECG segments without signal but also those that are too noisy to perform QRS detection.
The signal qualification block assigns a quality index to each minute of the recording making possible to reject those minutes without signal or too noisy. Other situations like electrodes that lose contact with the skin can also cor-respond with no signal intervals. Too noisy minutes cor-respond with connecting and disconnecting, but also with movement artifacts. Signal qualification block provides sev-eral levels of quality so a threshold can be used to determine when noise artifacts are too high to continue with analysis. Briefly, disconnected segments are characterized by a big spike that corresponds with the disconnection of the lead, which is followed by a signal of 0 µV that is followed by
Fig. 2 Components of the system

930 Med Biol Eng Comput (2016) 54:927–937
1 3
another big spike caused by the driver plugging the leads connector into the system back. The minutes containing the spikes have a maximum signal value much larger than the average value of the signal, while the minutes correspond-ing with the disconnected period have an average and stand-ard deviation values of 0 µV. On the other hand, standard deviation of the amplitude of the ECG minutes contain-ing movement artifacts is larger than the standard devia-tion of those minutes from ECG without noise. In addition, we observed that there could be a drift on the average and standard deviation of the ECG amplitude over time. There-fore, we designed the signal qualification block in two steps. The first step characterizes a minute of ECG with either the standard deviation of the ECG amplitude or 0 if the ECG contains big spikes (Eq. 1). The second step computes the quality of an ECG minute as function of the value obtained in step one vs. the average step one values of the preceding minutes (Eq. 2).
More specifically, the first step characterizes the i-th minute of ECG signal, xi(n) that enters into the system computing the value defined by function fi
where R is an experimentally defined threshold for the ratio between maximum and mean values, and xi is the mean of xi(n) and L is the number of samples of xi(n). In this work, R = 30 and allows to discard segments of signal with amplitude variations higher than expected.
The second step qualifies the new minute assigning one of the following values to it: excellent, good, poor or bad. We determined two thresholds C1 (low-amplitude ECG or no signal) and C2 (high noise) empirically by assessing the ECG signals present in the SDB and RDB databases in a minute by minute basis. Briefly, we defined C1 = 40 µV and C2= 5000 µV such that if fi < C1 (no signal) or fi ≥ C2 (large noise) then new minute is qualified as bad; other-wise, it is qualified using the qualifying function defined in
Eq. 2, where gi = fi −1
i − 1
∑i−1
k=1fk, and Ej are experi-
mentally adjusted thresholds with values E1 = 60 µV, E2 = 125 µV, E3 = 300 µV. Function gi measures the difference in variance between the current signal segment and the accumulated mean of the previous segments.
(1)fi(xi) =
�
1L
L−1�
n=0
|xi(n)− xi|2 ifmax (|xi(n)|)
|xi|≤ R
0 ifmax (|xi(n)|)
|xi|> R
Minutes of signal qualified as bad by the signal qualifica-tion block were discarded, and segments of two or more consecutive minutes of signal qualified as poor, good or excellent were used in the subsequent blocks.
2.4 HRV features estimation
HRV parameters are estimated from each of the ECG signal segments accepted by the signal qualification block. First, QRS complexes are detected by the algorithm described in [15], and artifacts (ectopic beats, false detections and false negatives) are identified using the algorithm described in [16], tunned to our driving databases. Then, HRV signal is estimated based on the integral pulse frequency modulation model with time-varying threshold (TVIPFM model), and the smoothed pseudo Wigner-Ville distribution (SPWVD) is applied to the estimated signal. Finally, HRV features are extracted applying the algorithm in [3].
2.4.1 HRV signal estimation
HRV signal is computed using the TVIPFM model described in [3]. It is based on the hypothesis that the ANS influence on the sinus atrial node can be represented by the modulating signal M(t), and a beat trigger impulse is gener-ated when the integral of 1+M(t) reaches a threshold T, which represents the mean heart period, resetting the inte-grator. The modulating signal M(t) is assumed to be causal, band limited and M(t) < 1. Following [3], the instantane-ous HR
is estimated from the beat occurrence times tk. Then time-varying mean HR dHRM(t) = 1
T(t) is estimated low-
pass filtering dHR(t) with a cutoff frequency of 0.03 Hz. Finally, the modulating signal carrying information from the ANS is estimated as M̂(t) = dHRV(t)/dHRM(t), where dHRV(t) = dHR(t)− dHRM(t).
(2)qi(gi) =
Excellent if gi < E1
Good if E1 ≤ gi < E2
Poor if E2 ≤ gi < E3
Bad if gi ≥ E3
(3)dHR(t) =1+M(t)
T(t)
2.4.2 SPWVD computing
(4)Pm(n,m) = 2
K−1�
k=−K+1
|h(k)|2
N−1�
n′=−N+1
g(n′)am(n+ n′ + k)a∗m(n+ n′ − k)
e−j2π mMk
m = −M + 1, . . . ,M
931Med Biol Eng Comput (2016) 54:927–937
1 3
SPWVD was computed as previously described in [3]. Briefly, Eq. (4) defines the discrete SPWVD of the am(n) signal, which represents the analytic signal of the modulat-ing signal M(t) previously estimated and discretized with a sampling frequency Fs = 4 Hz, where n, m and k are the corresponding discrete indexes in time, frequency and tem-poral delay. The term g(n′) is a temporal smoothing sym-metric window of length 2N − 1 and the term |h(k)|2 is a frequencial smoothing window of length 2K − 1 and sat-isfying (2K − 1 < 2M). Different K, N, and γ values were assessed (see supplementary section S1), and those that better suppressed the cross-terms while maintaining a good time-frequency resolution were selected (2K − 1 = 1023, γ = 1
256 and 2N − 1 = 240) for the HRV analysis [4].
2.4.3 Respiratory frequency estimation
Respiratory frequency (RF) was estimated as the frequency at which it is located the maximum peak of the SPWVD in the HF band using the method described in [5] but just for one lead. Briefly, the percentage of total power (ζ) around the selected peak was computed as a measure of spectral “peakness” and can be considered as a descriptor of respi-ration stability. Only peaky spectra, with ζ over a threshold, were considered for respiratory frequency estimation. In this study, a value of ζ = 8 % was used instead of the 35 % used in [5] due to the higher frequency resolution of the SPWVD with respect to Lomb’s periodogram in [5]. A dif-ferent damping factor (γ = 1
64) was used in the SPWVD to
estimate respiratory information. Supplementary section S1 describes how the ζ and γ values were selected.
2.4.4 Feature extraction
For each ECG segment analyzed, HRV parameters were extracted either from the estimated time-varying mean HR signal, sampled at 4 Hz, dHRM(n) or from the SPWVD of the modulating signal Pm(n,m). Instantaneous power in the LF and HF bands was computed integrating, for each time instant, Pm(n,m) in the corresponding bands. LF and HF powers were normalized by the sum of the LF and HF power, and the instantaneous LF/HF ratio was also com-puted. Parameter ζ from respiratory frequency estimation is used as a feature in the classifiers in addition to classical HRV parameters.
The former parameters are estimated instantaneously. Since driver’s state was assessed in multiples of one min-ute, median, median absolute deviation, minimum and maximum values of the instantaneous time-varying mean HR, absolute and normalized LF and HF powers, LF/HF ratio, RF and ζ are computed within each minute and con-stitute the feature set for each minute. Moreover, to alle-viate the high inter-subject variability of HRV, the feature
median value of the first three minutes is considered as baseline and it is subtracted from the subsequent minutes feature values, adding new features (denoted baseline-cor-rected features) to the feature set. Finally, the difference of each feature value with respect to the previous minute value, which measures the derivative or rate change of the feature, was also computed and added to the feature set as derivative features. In summary, we computed a set of 96 features describing each minute.
2.5 Classification
All described classifiers are based on linear discriminant analysis (LDA) [21]. We used a stepwise method using Wilks’ lambda (Λ) minimization criterion for ranking and selecting the features in the discriminant function. Briefly, we first computed Λ for each feature, and the one with low-est Λ and statistical significance (Pin < 0.05) entered into the discriminant function. Next, we estimated the param-eters of the resulting discriminant function. Of the variables not included in the discriminant function, we selected the feature with lowest Λ (and Pin < 0.05) and entered it into the model. We then determined whether the addition of the feature significantly (Pout < 0.10) contributed to the model. Finally, we repeated the last two steps until all features were included in the discriminant function or none of the features not included in the discriminant function have significant Λ.
Once the features were selected, we reduced the number of selected features as follows. We built different classifiers in an incremental fashion (i.e., each classifier included the next most significant feature). The performance of each clas-sifier was assessed as the F1 score function, which is defined as function of positive predictive value (P+) and sensitivity (Se) as F1 = 2(P+Se)/(P+ + Se). The classifier with the highest F1 score was selected for subsequent analysis.
The classification problem for two classes is known as detection problem. The two possible states (awake vs. drowsy in the drowsiness episodes detector; not-sleep-deprived vs. sleep-deprived in the sleep-deprivation detec-tor) of the driver are the classes, and the features consti-tute the discriminant variables. Performance measurements positive predictive value (P+), sensitivity (Se) and speci-ficity (Sp) were computed from the resulting confusion matrix after leave-one-out cross-validation for each classi-fier. While leave-one-out cross-validation is usually done in an episode by episode basis, we performed leave-one-out cross-validation on the subject to avoid bias.
Statistical analysis and feature selection were carried out using SPSS for Windows, version 15.0, Chicago, SPSS Inc. Classifier performance evaluation and plots were carried out in R [26]. P values < 0.05 were considered statistically significant without adjustment for multiplicity, unless oth-erwise stated.
932 Med Biol Eng Comput (2016) 54:927–937
1 3
2.5.1 Drowsiness episodes detector
The goal of the drowsiness episodes detector is to identify episodes in which driver’s state is becoming non-suitable for driving because of drowsiness and rise an alarm. The two classes in the drowsiness episodes detector are: OFF (driver is awake) and ON (driver is drowsy or fatigued). Table 1 shows the total number of annotated episodes at each database and their corresponding alarm output.
2.5.2 Suitable for driving detector
Results obtained with the drowsiness episodes detector sug-gested that the global drowsiness or sleep-deprivation state of the drivers could be detected from the feature set of the first minutes of the recordings. This could allow to identify whether or not a driver is suitable for driving before or dur-ing the first minutes of driving.
In the sleep-deprivation detector, the two classes were: driver sleep-deprived (either partial or full sleep-deprived and, thus not suitable for driving) and not-sleep-deprived (suitable for driving). Table 1 shows the total number of drivers in each state at each database.
We considered a test time interval of three minutes, which corresponds with the beginning of the driving activ-ity. As we have one feature value per minute, we computed the median of the feature values in the considered test time interval as a surrogate of the driver’s global state.
3 Results
The number of excellent, good, low and bad quality seg-ments (minutes) as classified by the signal qualification block is reported in supplementary Table S1. In addition, ECG traces with color-coded quality segments as assigned by the signal quality block for some subjects are included in the supplement.
3.1 Drowsiness episodes detector
Merging the two databases SDB and RDB presented a well-balanced number of drowsy and awake minutes. Wilks’ lambda (Λ) minimization criterion ranked and selected 34 of the 96 features. Maximum performance (F1 score = 0.73) was achieved with the seven most statistically significant features (Table 2): minimum ζ corrected by baseline value (ζ n3min
), minimum ζ (ζmin), median absolute deviation (MAD) of LF power corrected by baseline value (LFn3
mad), MAD of
LF power (LFmad), minimum LF power corrected by base-line value (LFn3
min), minimum LF power (LFmin) and mini-
mum instantaneous heart rate (HRimin). Further analysis was carried out with the classifier that uses these seven features.
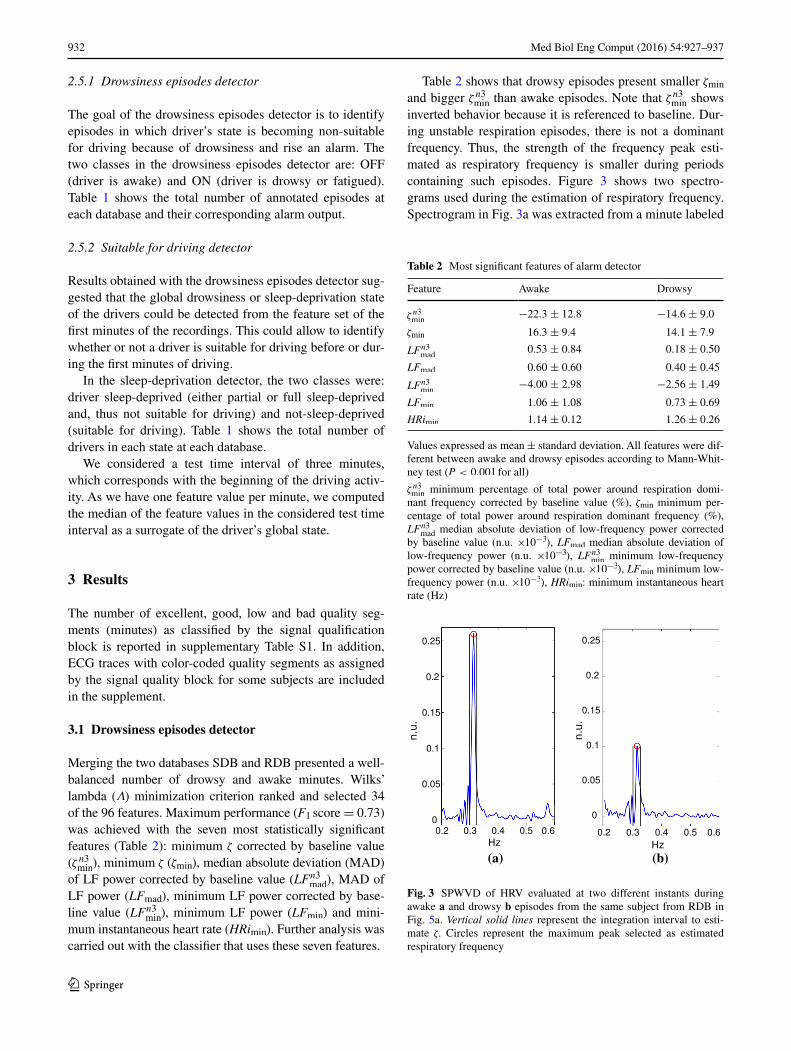
Table 2 shows that drowsy episodes present smaller ζmin and bigger ζ n3
min than awake episodes. Note that ζ n3
min shows
inverted behavior because it is referenced to baseline. Dur-ing unstable respiration episodes, there is not a dominant frequency. Thus, the strength of the frequency peak esti-mated as respiratory frequency is smaller during periods containing such episodes. Figure 3 shows two spectro-grams used during the estimation of respiratory frequency. Spectrogram in Fig. 3a was extracted from a minute labeled
Table 2 Most significant features of alarm detector
Values expressed as mean ± standard deviation. All features were dif-ferent between awake and drowsy episodes according to Mann-Whit-ney test (P < 0.001 for all)
ζ n3min
minimum percentage of total power around respiration domi-nant frequency corrected by baseline value (%), ζmin minimum per-centage of total power around respiration dominant frequency (%), LF
n3mad
median absolute deviation of low-frequency power corrected by baseline value (n.u. ×10−3), LFmad median absolute deviation of low-frequency power (n.u. ×10−3), LFn3
min minimum low-frequency
power corrected by baseline value (n.u. ×10−3), LFmin minimum low-frequency power (n.u. ×10−3), HRimin: minimum instantaneous heart rate (Hz)
Feature Awake Drowsy
ζ n3min
−22.3 ± 12.8 −14.6 ± 9.0
ζmin 16.3 ± 9.4 14.1 ± 7.9
LFn3mad
0.53 ± 0.84 0.18 ± 0.50
LFmad 0.60 ± 0.60 0.40 ± 0.45
LFn3min
−4.00 ± 2.98 −2.56 ± 1.49
LFmin 1.06 ± 1.08 0.73 ± 0.69
HRimin 1.14 ± 0.12 1.26 ± 0.26
(a) (b)
Fig. 3 SPWVD of HRV evaluated at two different instants during awake a and drowsy b episodes from the same subject from RDB in Fig. 5a. Vertical solid lines represent the integration interval to esti-mate ζ. Circles represent the maximum peak selected as estimated respiratory frequency

933Med Biol Eng Comput (2016) 54:927–937
1 3
as awake and shows a higher peak than the one in Fig. 3b, which corresponds with the next drowsy minute. The per-formance obtained with this feature set is 0.96 P+, 0.59 Se and 0.98 Sp.
To quantify the potential contribution of HRV signals to systems using respiration signals, we compared the cross-validated probabilities calculated using leave-one-out method between the classifier using only the two res-piration related features (ζ n3
min and ζmin) and those of the
classifier using seven features. HRV features increased P+ from 0.69 to 0.96 and specificity of the classifier from 0.86 to 0.98. Figure 4 shows the improvement in specific-ity in the episodes of drowsiness detector when adding the HRV features to the stability of respiration features.
Figure 5 shows signal quality and classification details of one subject from SDB and another subject from RDB. Circles correspond with the reference annotations and black crosses with the predicted states. Figure 5a shows that the classifier overestimates drowsy states in subjects with sleep deprivation. Figure 5b presents drowsy states underestima-tion by the classifier in subjects with no sleep deprivation. These results suggest that episodes of drowsiness detec-tor identify the global state of the subject. In other words,
Fig. 4 ROC curves of drowsiness episodes detector using only res-piration features (black dotted line) and respiration plus five HRV features (blue solid line). Arrows indicate specificity and sensitivity achieved by LOO-XV
Fig. 5 Detail of signal quality and classification of: a subject from SDB and b subject from RDB. Reference annotation (O), prediction (X). Quality: bad (red), low (yellow), good (blue) or excellent (green). Gaps in the classification panels correspond to poor and low-quality ECG segments in which the system does not produce an output

934 Med Biol Eng Comput (2016) 54:927–937
1 3
whether the driver presents sleep deprivation and whether or not he is suitable for driving.
3.2 Sleep‑deprivation detector
The most statistically significant feature obtained for sleep-deprivation detector using the first three minutes as the test time interval was the regressive difference of the minimum normalized HF power (HF%′
min, P = 0.018), where normal-
ized HF power is defined as HF% = 100 · HF/(LF + HF). Performance achieved using only HF%′
min was 0.80 P+, 0.62
Se and 0.88 Sp. Confusion matrix is shown in Fig. 6. The mean HF%′
min was higher in sleep-deprived (non-suitable for
driving) subjects than in not-sleep-deprived (suitable for
driving) subjects (3.5 ± 5.7 % vs. 2.0 ± 6.0 %). No other features resulted discriminant from the Wilk’s lambda minimization criterion, although the regressive difference of the maximum normalized LF power, which is related to HF%′
min, can be used instead. Figure 6, where each symbol
corresponds with one subject, shows classification results.
4 Discussion
The study showed that drowsiness episodes can be detected with high P+ assessing changes in the HRV signal. This can improve road safety by alerting the driver before he falls asleep. In addition, the study also showed that sleep-deprived subjects have higher minimum values of the regressive difference of the minimum normalized HF power (HF%′
min) than not-sleep-deprived subjects. This can
be used to assess the state of the driver during the first min-utes of driving and trigger an alert to notify those that pre-sent sleep-deprivation. The study shows that HRV signal can enhance car safety systems.
Both drowsiness episodes detector and sleep-deprivation detector are based on LDA despite the fact that none of the features were normally distributed, as revealed by a Kol-mogorov-Smirnov test. To avoid the normality assumption, other classification methods were tested, but performance did not improve with respect to LDA. Logistic regression, k-nearest neighbors and support vector machine obtained similar results to those obtained with LDA. This is not sur-prising because the robustness of LDA under violations of its assumptions is well known [13]. While we did not assess artificial neural networks (ANN), it has been shown that LDA can perform comparably to linear ANN in some cases [18]. Thus, we selected LDA because its robustness and because it allows identifying the biomarkers and their corresponding values associated with awake, drowsy, not-sleep-deprived and sleep-deprived states.
Performance could be improved by increasing the num-ber of features used in the classifier. However, it increases the risk of over-fitting due to the reduced number of subjects included in the analysis. Note that although the number of drowsy and awake cases in the drowsiness episodes detector is high (1421 and 2054, respectively), they all belong to a reduced number of subjects (n = 19). It is also important to note that, although the number of drowsy and awake cases is almost balanced, most drowsy cases belong to subjects from the simulated driving databases and most awake cases belong to subjects form the real driving database.
Different methods for HRV analysis have been proposed in the literature, including time domain, frequency domain and nonlinear methods [1, 25, 27, 31]. Nonlinear methods have recently demonstrated superiority over time and fre-quency domain indices in certain applications, although
HFmin (%)
Subjects status per protocol
%'-10 0 10
(a)
HFmin (%)
Subjects status predicted by the system
%'-10 0 10
(b)
Sleep-deprived ReferenceSystem output YES NO Total
YESNO
8 2 105 15 20
13 17 30TotalDriver status
full or partial sleep-deprived not sleep-deprived(c)
Fig. 6 a Distribution of subjects as function of HF%′
min and their
sleep-deprivation state, where circles show full or partial sleep-deprived subjects and triangles show not-sleep-deprived subjects. Each symbol represents one subject. b Sleep-deprivation detec-tor predictions for each subject. Open symbols correspond with the subjects that the detector classified appropriately either as not-sleep-deprived (suitable for driving, open triangles) or as full or partial sleep-deprived (not suitable for driving, open circles). Solid triangles show when the detector failed to identify subjects that were full or partial sleep-deprived (not suitable for driving, false negatives). Solid circles show when the detector failed to identify subjects that were not-sleep-deprived (suitable for driving, false positives). c Confusion matrix of the sleep-deprivation detector from leave-one-out cross-val-idation on the subject
935Med Biol Eng Comput (2016) 54:927–937
1 3
their physiological interpretation in terms of sympathetic and parasympathetic systems is not fully elucidated yet. Further studies should consider the performance of these nonlinear indices in drowsiness detection.
4.1 Drowsiness episodes detector
Before implementing the drowsiness episodes detector, fea-tures from all subjects were analyzed searching patterns like those described in previous works as [9, 17], but they were not found consistently. For example, in some cases HF power increased and LF decreased before a drowsy episode, but this behavior also occurred during awake episodes. The speed and duration of the change in LF and HF powers may be also related to the threshold needed to cause a change in the state of the subject. We also looked for other significant patterns prior to or during state changes, but we did not find any. This lack of changes before the sleep onset has been observed in healthy subjects lying down and with lights off while participating in whole night sleep studies [23].
Although the beginning and end of isolated drowsy epi-sodes within a not-sleep-deprived subject are not identified precisely, in general the detector is able to identify some min-utes of the isolated (drowsy or awake) episodes. This inac-curacy can also be due to the inclusion of fatigue episodes together with drowsy episodes when training and evaluating the classifier. Note that fatigue episodes can be considered as transient states, and their boundaries are not well defined.
We compared the results of drowsiness episodes detector with those previously published in [22]. While developing the episodes of drowsiness detector, the feature selection analysis showed that unstable respiratory patterns are asso-ciated with drowsy episodes, which is in agreement with the findings in [22] using thoracic effort signal. We grouped drowsy and fatigued episodes within the same class, which made a quantitative comparison with [22] not feasible.
Awake states presented higher LF/HF as expected [19, 23]. However, we observed around threefold higher LF/HF mean values than those observed by Patel et al [19] in both awake (3.89 ± 3.88 vs. 1.18 ± 1.15) and drowsy (3.61 ± 2.93 vs.1.2 ± 0.87) states, potentially because differences in the methods assessing the states of the drivers.
4.2 Sleep‑deprivation detector
HF%′
min was the most significant feature for detecting sleep
deprivation, showing higher values in sleep-deprived than in not-sleep-deprived subjects. The increase in the minimum HF value during the first minutes in the sleep-deprived subjects reflects a higher parasympathetic activity, while the decrease in not-sleep-deprived subjects reflects the sympathetic activation. This pattern is in agreement with our initial hypothesis.
Impairment in driving and increase in crash risk, includ-ing traffic fatalities, is one of the outcomes of excessive drowsiness [6, 8, 24]. The overall degree of drowsiness of a driver is assessed by the sleep-deprivation detector, which quantifies the level of parasympathetic system activity from the driver’s HRV signal. Although further investigation in larger population is needed, this type of assessment could help mitigating not only drowsy driving related accidents, but also other risks in activities that require high levels of concentration and short reaction times (e.g., airplane pilots, train drivers or ship captains).
4.3 Limitations
One of the limitations of the study is the reference signal used for the drowsiness episodes detector. Beginning and ending of drowsy episodes are difficult to identify precisely. A more robust and reliable reference is needed, but a gold standard does not currently exist. For example, drowsy epochs defined in EEG are defined with eyes closed, and our requirement is with eyes opened. The output of the classifiers could be part of a more complex system that uses other signals such as PERCLOS, lateral and longitudinal control or wheel pitch evolution, to detect if the current state of the subject is suit-able for driving or not. More efforts are required to increase the database size so new features can be added in the training stage without the risk of over-fitting. It is also important to include information about subjects sleep habits and quality, like, for example, those in protocol described in [33], or even using subjective questionnaires like the Epworth Sleepiness Scale [12] or the Stanford Sleep Scale [11].
The number of awake vs. drowsy episodes was unbal-anced between RDB and SDB databases (Table 1). RDB subjects were not-sleep-deprived, and most of their min-utes were labeled as awake. On the other hand, some of the SDB subjects were sleep-deprived, and they had most of their minutes labeled as drowsy. To overcome this unbal-ance between subjects, we conducted the analysis of the data by event type (i.e., awake vs. drowsy) pooling all minutes from all subjects in both databases. Future studies should consider using larger sample size (more subjects) and/or use a cross-over study design to be able to account for within subject features variability.
Performance of the classifiers was assessed using leave-one-out cross-validation. However, all subjects were pooled in the feature selection stepwise process. This may have resulted in a set of features over-fitted to each database. Future work should assess how using of leave-one-out cross-validation in feature selection affects feature reduc-tion and classifiers performance.
The Se of the proposed alarm detector is only of 0.59. However, from a driving safety point of view, the high P+
(0.96) shows that the number of false alarms is very low.

936 Med Biol Eng Comput (2016) 54:927–937
1 3
This is important because it has been shown that false alarms may result in the so-called alarm fatigue (i.e., users ignoring alarms because a high false alarm rate). Therefore, while only 59 % of drowsiness episodes are detected, 96 % of these are detected appropriately. This suggests that the system could help to reduce drowsiness related accidents, especially if com-bined with existing preventing car safety systems. However, whether or not larger sample size or cross-over study design would increase sensitivity deserves further investigation.
5 Conclusions
Two different driver’s drowsiness detectors based on HRV analysis have been developed in this work. The drowsiness episodes detector is an online detector that identifies the current state of the subject, triggering an alarm when the drivers become drowsy or fatigued while driving. Its per-formance is P+ of 0.96, Se of 0.59 and Sp of 0.98 using seven features in the database containing simulated driving and real driving recordings. The sleep-deprivation detector identifies the global state of the driver indicating whether the driver is sleep-deprived, thus in a suitable for driving state or not before starting to drive. A subject is considered to be in a non-suitable for driving state if he is partially or full sleep-deprived. The classifier uses a time interval of 3 min to determine if a subject presents sleep deprivation with a P+ of 0.80, Se of 0.62 and Sp of 0.88.
Despite limitations such as the lack of a gold standard to identify drowsy epochs, the small-sized population and the cross-sectional design of this study, obtained results are promising and may add significant improvements when incorporated to existing preventing car safety systems.
Acknowledgments This work was supported in part by the Ministe-rio de Ciencia e Innovación, Spain, under Projects TIN2014-53567-R; TEC2013-42140-R, TRA2009-0127 and UZ2014-TEC-01, in part by Grupo Consolidado BSICoS from DGA (Aragón), European Social Fund (EU) and CIBER de Bioingeniería, Biomateriales y Nano-medicina, in part by an appointment to the Research Participation Program at the Center for Devices and Radiological Health and the Center for Drug Evaluation and Research administered by the Oak Ridge Institute for Science and Education through an interagency agreement between the U.S. Department of Energy and the U.S. Food and Drug Administration. The computation was performed by the ICTS 0707NANBIOSIS, by the High Performance Computing Unit of the CIBER in Bioengineering, Biomaterials and Nanomedicine (CIBER-BBN) at the University of Zaragoza.
References
1. Acharya UR, Joseph KP, Kannathal N, Lim CM, Suri JS (2006) Heart rate variability: a review. Med Biol Eng Comput 44(12):1031–1051
2. Baharav A, Kotagal S, Gibbons V, Rubin BK, Pratt G, Karin J, Akselrod S (1995) Fluctuations in autonomic nervous activity
during sleep displayed by power spectrum analysis of heart rate variability. Neurology 45(6):1183–1187
3. Bailón R, Laouini G, Grao C, Orini M, Laguna P, Meste O (2011) The integral pulse frequency modulation model with time-varying threshold: Application to heart rate variability analysis during exercise stress testing. IEEE Trans Biomed Eng 58(3):642–652
4. Bailón R, Mainardi L, Orini M, Sörnmo L, Laguna P (2010) Anal-ysis of heart rate variability during exercise stress testing using res-piratory information. Biomed Signal Process Control 5(4):299–310
5. Bailón R, Sörnmo L, Laguna P (2006) ECG-derived respiratory frequency estimation, pp 215–244. Artech House Inc
6. Catarino R, Spratley J, Catarino I, Lunet N, Pais-Clemente M (2013) Sleepiness and sleep-disordered breathing in truck driv-ers. Sleep Breath pp 1–10
7. Dirección General de Tráfico: La fatiga causa el 30% de los acci-dentes de tráfico en españa (2008)
8. Drake C, Roehrs T, Breslau N, Johnson E, Jefferson C, Scof-ield H, Roth T (2010) The 10-year risk of verified motor vehicle crashes in relation to physiologic sleepiness. Sleep 33(6):745
9. Furman G, Baharav A, Cahan C, Akselrod S (2008) Early detection of falling asleep at the wheel: a heart rate variability approach. Comput Cardiol, pp 1109–112
10. Gunzelmann G, Gross JB, Gluck KA, Dinges DF (2009) Sleep deprivation and sustained attention performance: integrating mathematical and cognitive modeling. Cogn Sci 33(5):880–910
11. Hodes and Associates (1972) The stanford sleepiness scale. In: Eleventh annual meeting of the association for the psychophysi-ological study of sleep, 1972
12. Johns M (1991) A new method for measuring daytime sleepi-ness: the epworth sleepiness scale. Sleep 6:540–545
13. Lachenbruch PA, Goldstein M (1979) Discriminant analysis. Biometrics 35(1): 69–85. http://www.jstor.org/stable/2529937
14. Li G, Chung WY (2013) Detection of driver drowsiness using wavelet analysis of heart rate variability and a support vector machine classifier. Sensors 13(12):16494–16511
15. Martínez JP, Almeida R, Olmos S, Rocha AP, Laguna P (2004) A wavelet-based ecg delineator: evaluation on standard databases. IEEE Trans Biomed Eng 51(4):570–581
16. Mateo J, Laguna P (2003) Analysis of heart rate variability in the presence of ectopic beats using the heart timing signal. IEEE Trans Biomed Eng 50(3):334–343
17. Michail E, Kokonozi A, Chouvarda I, Maglaveras N (2008) Eeg and hrv markers of sleepiness and loss of control during car driv-ing. In: Conf Proc IEEE Eng Med Biol Soc, pp 2566 –2569
18. Paik H (2000) Comments on neural networks. Sociol Methods Res 28(4):425–453. doi:10.1177/0049124100028004002. http://smr.sagepub.com/content/28/4/425.abstract
19. Patel M, Lal S, Kavanagh D, Rossiter P (2011) Applying neu-ral network analysis on heart rate variability data to assess driver fatigue. Expert Syst Appl 38(6):7235–7242
20. Philip P, Akerstedt T (2006) Transport and industrial safety, how are they affected by sleepiness and sleep restriction? Sleep Med Rev 10(5):347–356
21. Ripley BD (2007) Linear discriminant analysis. Pattern recog-nition and neural networks. Cambridge University Press, Cam-bridge, pp 91–120
22. Rodríguez-Ibáñez N, García-González M, Fernández-Chimeno M, Ramos-Castro J (2011) Drowsiness detection by thoracic effort signal analysis in real driving environments. In: Conf Proc IEEE Eng Med Biol Soc
23. Shinar Z, Akselrod S, Dagan Y, Baharav A (2006) Autonomic changes during wake-sleep transition: a heart rate variability based approach. Auton Neurosci 130:17–27
24. Strohl K (2012) Assessments of driving risk in sleep apnea., Res-piratory medicineHumana Press, USA
937Med Biol Eng Comput (2016) 54:927–937
1 3
25. Task Force of ESC and NASPE (1996) Heart rate variability : standards of measurement, physiological interpretation, and clin-ical use. Circulation 93(5):1043–1065
26. R Development Core Team (2011) R: a language and environ-ment for statistical computing. R Foundation for Statistical Com-puting, Vienna, Austria
27. Valenza G, Citi L, Barbieri R (2014) Estimation of instantane-ous complex dynamics through lyapunov exponents: A study on heartbeat dynamics. PLoS One 9(8):e105,622. doi:10.1371/jour-nal.pone.0105622
28. Verster JC, Taillard J, Sagaspe P, Olivier B, Philip P (2011) Pro-longed nocturnal driving can be as dangerous as severe alcohol-impaired driving. J Sleep Res 20(4):585–588
29. Vicente J, Laguna P, Bartra A, Bailón R (2011) Detection of driver’s drowsiness by means of hrv analysis. Comput Cardiol
30. Wegman F (2013) Road Safety Annual Report. Tech. rep, Inter-national Traffic Safety Data and Analysis Group
31. Wessel N, Voss A, Malberg H, Ziehmann C, Voss HU, Schird-ewan A, Meyerfeldt U, Kurths J (2000) Nonlinear analysis of complex phenomena in cardiological data. Herzschrittmacher-therapie und Elektrophysiologie 11(3):159–173
32. Willis D, Waller P, Stutts J, Roth T (1998) Drowsy driving and automobile crashes. Tech Rep DOT HS 808 707, National High-way Traffic Safety Administration
33. Yang G, Lin Y, Bhattacharya P (2010) A driver fatigue recogni-tion model based on information fusion and dynamic bayesian network. Inf Sci (Ny) 180(10):1942–1954
José Vicente is an ORISE Research Fellow at the U.S. FDA. His research focuses on the relationship between cardiac electrophysiology and ECG bio-markers to improve proarrhyth-mic assessment of drugs.
Pablo Laguna is Professor of Signal Processing and Commu-nications in Zaragoza Univer-sity and member of the Spanish Research Center CIBER-BBN. His research interests are in Sig-nal Processing applied to bio-medical applications.
Ariadna Bartra is a research and development engineer in the automotive industry. Her research interest is in drowsi-ness detection techniques using biological signals and behavio-ral vehicle data.
Raquel Bailón is Professor of Signal Processing and Commu-nications in Zaragoza Univer-sity and member of the Spanish Research Center CIBER-BBN. Her research focuses on heart rate variability analysis for bio-medical applications.