new approach for in-line production testing for mature...
TRANSCRIPT
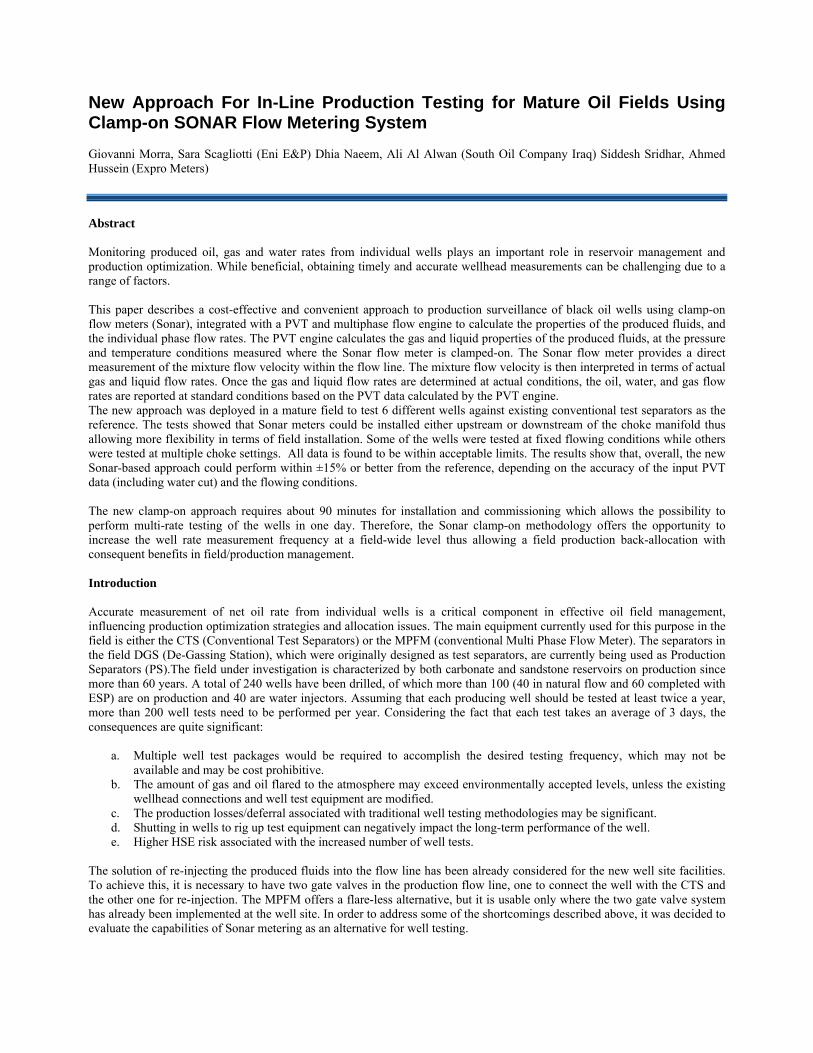
New Approach For In-Line Production Testing for Mature Oil Fields Using Clamp-on SONAR Flow Metering System Giovanni Morra, Sara Scagliotti (Eni E&P) Dhia Naeem, Ali Al Alwan (South Oil Company Iraq) Siddesh Sridhar, Ahmed Hussein (Expro Meters)
Abstract Monitoring produced oil, gas and water rates from individual wells plays an important role in reservoir management and production optimization. While beneficial, obtaining timely and accurate wellhead measurements can be challenging due to a range of factors. This paper describes a cost-effective and convenient approach to production surveillance of black oil wells using clamp-on flow meters (Sonar), integrated with a PVT and multiphase flow engine to calculate the properties of the produced fluids, and the individual phase flow rates. The PVT engine calculates the gas and liquid properties of the produced fluids, at the pressure and temperature conditions measured where the Sonar flow meter is clamped-on. The Sonar flow meter provides a direct measurement of the mixture flow velocity within the flow line. The mixture flow velocity is then interpreted in terms of actual gas and liquid flow rates. Once the gas and liquid flow rates are determined at actual conditions, the oil, water, and gas flow rates are reported at standard conditions based on the PVT data calculated by the PVT engine. The new approach was deployed in a mature field to test 6 different wells against existing conventional test separators as the reference. The tests showed that Sonar meters could be installed either upstream or downstream of the choke manifold thus allowing more flexibility in terms of field installation. Some of the wells were tested at fixed flowing conditions while others were tested at multiple choke settings. All data is found to be within acceptable limits. The results show that, overall, the new Sonar-based approach could perform within ±15% or better from the reference, depending on the accuracy of the input PVT data (including water cut) and the flowing conditions. The new clamp-on approach requires about 90 minutes for installation and commissioning which allows the possibility to perform multi-rate testing of the wells in one day. Therefore, the Sonar clamp-on methodology offers the opportunity to increase the well rate measurement frequency at a field-wide level thus allowing a field production back-allocation with consequent benefits in field/production management. Introduction Accurate measurement of net oil rate from individual wells is a critical component in effective oil field management, influencing production optimization strategies and allocation issues. The main equipment currently used for this purpose in the field is either the CTS (Conventional Test Separators) or the MPFM (conventional Multi Phase Flow Meter). The separators in the field DGS (De-Gassing Station), which were originally designed as test separators, are currently being used as Production Separators (PS).The field under investigation is characterized by both carbonate and sandstone reservoirs on production since more than 60 years. A total of 240 wells have been drilled, of which more than 100 (40 in natural flow and 60 completed with ESP) are on production and 40 are water injectors. Assuming that each producing well should be tested at least twice a year, more than 200 well tests need to be performed per year. Considering the fact that each test takes an average of 3 days, the consequences are quite significant:
a. Multiple well test packages would be required to accomplish the desired testing frequency, which may not be available and may be cost prohibitive.
b. The amount of gas and oil flared to the atmosphere may exceed environmentally accepted levels, unless the existing wellhead connections and well test equipment are modified.
c. The production losses/deferral associated with traditional well testing methodologies may be significant. d. Shutting in wells to rig up test equipment can negatively impact the long-term performance of the well. e. Higher HSE risk associated with the increased number of well tests.
The solution of re-injecting the produced fluids into the flow line has been already considered for the new well site facilities. To achieve this, it is necessary to have two gate valves in the production flow line, one to connect the well with the CTS and the other one for re-injection. The MPFM offers a flare-less alternative, but it is usable only where the two gate valve system has already been implemented at the well site. In order to address some of the shortcomings described above, it was decided to evaluate the capabilities of Sonar metering as an alternative for well testing.
2
To evaluate the feasibility of using the clamp-on Sonar as an alternative for well testing, it was initially decied to do a preliminary trial on two wells. The tests were carried out on wells A-01 and A-02 in conjunction with ongoing production testing activities. The CTS was used as a reference to check the Sonar meter accuracy. At the conclusion of the preliminary trial, it was deemed that the technology was suitable for the field, providing sufficient accuracy and easy handling in terms of field deployment and installation. It was consequentially decided to deploy Sonar metering on a larger scale in a field-wide well test campaign.The field-wide campaign comprised the testing of 94 wells (including 3 water injection wells) over a period of 108 days. The Sonar results from the individual producing wells were aggregated and compared to the total production rates as measured at the Degassing Stations. The aggregate Sonar production data was in reasonable agreement with the actual production rates as measured at the DGS and to hydraulic well models expectations. In order to address some differences seen between the Sonar test results and the expected flow rates, 4 wells were retested against the CTS at the conclusion of the Sonar field-wide campaign. Again, the results showed that the Sonar meters performed within expectations. This paper presents the results of the Sonar testing, including detailed comparisons between the Sonar and CTS oil, gas and water rates for the six wells where reference data is available.
a. Production Allocation / Well Testing Worldwide, the majority of oil & gas production allocation is achieved using separator-based measurements. Test and production separators are generally used to allocate production from individual wells and fields. Most separator-based measurement methodologies rely on the assumption of complete separation of the gas and liquid phases prior to measurement. In practice, however, complete separation is often difficult, if not impractical, to achieve, the accuracy of separator-based measurements could be limited by flow instrumentation-related issues. On the flow measurement side, the test separator functionality may be limited by the quality of the incoming fluid stream, which many times requires further processing, such as de-sanding (or solids removal), in order to protect both the separator and the ancillary instrumentation. In addition, sanding and/or solids may cause the separator to be by-passed for certain periods of time, with no flow measurements available during the by-pass period. Another potential issue is incorrect selection and sizing of flow meters on the liquid and gas legs of the CTS (for example, wrong orifice plate size) which may yield inaccurate measurement results. The size and the cost associated with mobilizing and operating CTS packages in the field may also limit the number of wells to be tested. Therefore, for field management purposes, various schemes and models are often developed to infer the production rates for each well. These models are used to predict individual well performances and in turn to make selection of intervention and work-over methods based on incomplete data with regard to actual well performances. To reduce the uncertainties of the models and the consequent risk associated to the selection of the interventions, it is mandatory to strengthen them with measured data. This data has been provided efficiently by Sonar Clamp-on meter within the required timeframe.
b. Overview of Technology Clamp-on Sonar-based flow meters utilize Sonar processing techniques to determine the speed at which naturally occurring, coherent flow structures convect past an array of sensors clamped-on to the outside of the pipe. Figure 1 illustrates the naturally occurring, self-generated, coherent structures present within turbulent pipe flows. Naturally occurring, self-generating, turbulent eddies are superimposed over the time-averaged velocity profiles. These coherent structures contain fluctuations with magnitudes on the order of 10 percent of the mean flow velocity and are carried along with the mean flow. These eddies remain coherent for many pipe diameters and convect at, or near, the volumetrically-averaged flow rate in the pipe.

3
Figure 1 : Sonar-based Flow Meters with Coherent Structures within Pipe Flows
In Sonar array processing, the spatial/temporal frequency content of sound fields are often displayed using “K-ω" plots. K-ω plots are presented as surface plots in which the power of a sound field is allocated to bins corresponding to specific spatial wave numbers and temporal frequencies. On a k-ω plot, the power associated with coherent structures convecting along with the flow is distributed along “the convective ridge”. The slope of this ridge indicates the speed of the turbulent eddies. Thus, identifying the slope of the convective ridge determines volumetric flow rate.
Figure 2: K-w plot from a Clamp-on Sonar meter on a Gas Well
Figure 2 shows an example of a k-ω plot generated from the diagnostic output of a Sonar flow meter clamped on to a 4-inch, schedule 80 pipe with black oil flowing at 30 barg. As shown, the k-ω plot exhibits a well-defined convective ridge. The slope of the convective ridge was determined by the SONAR flow meter to be 34 ft/sec.
Slope – 34 ft/sec
K

4
Figure 3: Flow regime operating range – Sonar Technology Sonar technology capabilities include:
Bulk flow velocity (mixture flow) measurement over (almost) the entire GVF range Multiphase flow interpretation from velocity measurements and PVT data Specific algorithm/model developed for each particular range (as outlined above – the depicted values are
to be used only as guidelines)
c. New Approach to Field-Wide Well Testing The approach utilizes a Sonar flow meter to clamp-on to well head piping to measure the mixture volumetric flow rate at actual conditions. The flow measurement is then combined with measurements of the process pressure and temperature and user-supplied compositional information to determine individual phase flow rates. Several samples are taken of the fluids at line conditions and a base sediment and water (BS&W) test is made to determine water cut (WC). This process is shown schematically in Figure 4.
Figure 4: Schematic of Sonar based Production Surveillance Methodology
Compositional analysis and equation of state PVT modeling of black oils can be quite complex. Unlike gas and gas condensate wells for which the hydrocarbon composition is made up primarily of short length hydrocarbons (C7+ >~10%), black oils typically contain a large fraction of very long hydrocarbon chains rendering detailed compositional characterization and subsequent EoS PVT modeling quite challenging. Historically, the oil and gas industry has modeled the PVT properties of produced oils using “black oil” models. These models utilize readily measurable physical characteristics of produced hydrocarbons (such as Gas to Oil Ratio (GOR), WC, and bubble point pressure) as input to empirical correlations to predict the PVT properties of the black oil over a range of pressure and temperatures. The Sonar approach to oil well production surveillance utilizes “black oil” models for oil wells to interpret the output of the Sonar meter using flow line pressure, temperature and well bore composition in terms of flow rates of gas, oil and water at standard conditions. The Sonar meter measures mixture velocity at line pressure and temperature. The flow computer then calculates the liquid volume fraction at actual conditions within the process flow line using a Black oil model and using input WC. This provides a measure of the oil rate at actual conditions. A shrinkage factor calculated by the black oil model is applied to report oil rate at standard conditions. The gas and water rates associated with the produced oil are then inferred from the measured oil rate. The Sonar meter is typically clamped on the pipe in about one hour, allowing for a relatively quick installation & commissioning. Within meter installation guidelines, the Sonar meter can be installed on the pipe anywhere at the wellhead, either upstream or downstream of the choke. The clamp-on non-intrusive nature of the meter approach eliminates any pressure drop and production loss, and minimizes the HSE risks associated with invasive well testing methods. The duration of the test may vary depending on the stability of the flow conditions, but in general
Multiphase Flow & Black Oil Model
Pressure&Temperature
Qoil
Qgas
Qwater
Watercut (WC)sampling
SONAR Velocity

5
an assumption of one test per day is reasonable. Multi-rate tests are also possible on an intra-day basis, provided the flow is stabilized at each rate. This enables to test the wells at various choke settings and/or ESP frequencies with the goal of determining the settings resulting in optimum production.
d. Initial Sonar trial – 2 wells During the initial trial, the clamp-on Sonar meter was installed on the pipe connecting the CTS to the X-Mas tree. For the first well, the Sonar was installed upstream of the choke manifold (Figure 5).
Figure 5: Well A-01 Sonar Setup
The flow was monitored for 2 hours when the well was flowing at a choke setting of 48/64th. The test measurements are displayed in Figure 6, while the results are plotted in Figure 7.
Figure 6: Well A-01 Sonar Measurements
0
50
100
150
200
250
300
0
5
10
15
20
25
30
Pre
ssu
re (
psi
g) a
nd
Te
mp
era
ture
(d
egF
)
Son
ar V
elo
city
(V
son
ar)
(ft/
sec)
Well A‐01 Sonar Measurements
VSonar
Well Head Pressure
Well Head Temperature

6
Figure 7: Well A-01 Sonar vs. Test Separator
The test revealed certain limitations associated with the CTS methodology. First, the flow stream could not be diverted through the test separator at the beginning of the well test due to the high amount of solids entrained in the flow stream, which is a typical condition for new or re-worked wells. Therefore, the CTS flow instrumentation could not be used to measure the flow rates for that period of time. The second issue is related to the separator inertia, which means that the separator takes time to reach the designed level at which both the liquid and the gas measurements are deemed valid. The third issue is related to the separator gas measurement. Since the typical flow measurement of the gas leg is performed using the orifice meter, the proper sizing/selection of the orifice plate and/or dP sensor becomes very important. Choosing a plate with a smaller beta ratio may limit the flow measurement since the dP generated across the plate may exceed the dP sensor capacity. The Sonar meter, due to its clamp-on design and relatively wide flow range, overcomes some of the limitations described above and offers the possibility of monitoring the flow over a wide range of conditions. For convenience, the averages associated with the above measurements and results are summarized in Table 1.
Well Duration
(min) Choke (64ths)
Sonar meter Test Separator Difference (%)
Qgas (MMscfd)
Qoil (stb/d)
Qgas (MMscfd)
Qoil (stb/d)
Qgas Qoil
A-01 142 48 0.71 2152 0.67 2106 7 -2
Table 1: Well A-01 Sonar vs. Test Separator
0.0
0.2
0.4
0.6
0.8
1.0
1.2
1.4
1.6
1.8
2.0
0
500
1000
1500
2000
2500
Gas
Rat
e (
mm
scfd
)
Oil
Rat
e (S
TB/d
)
Well A‐01 Sonar vs Test Separator
Test Sep Oil Rate
Sonar Oil Rate
Test Sep Gas Rate
Sonar Gas RateNo Test Sep
Gas Flow Measurement
Inaccurate Test Sep Gas Flow Measurement
7
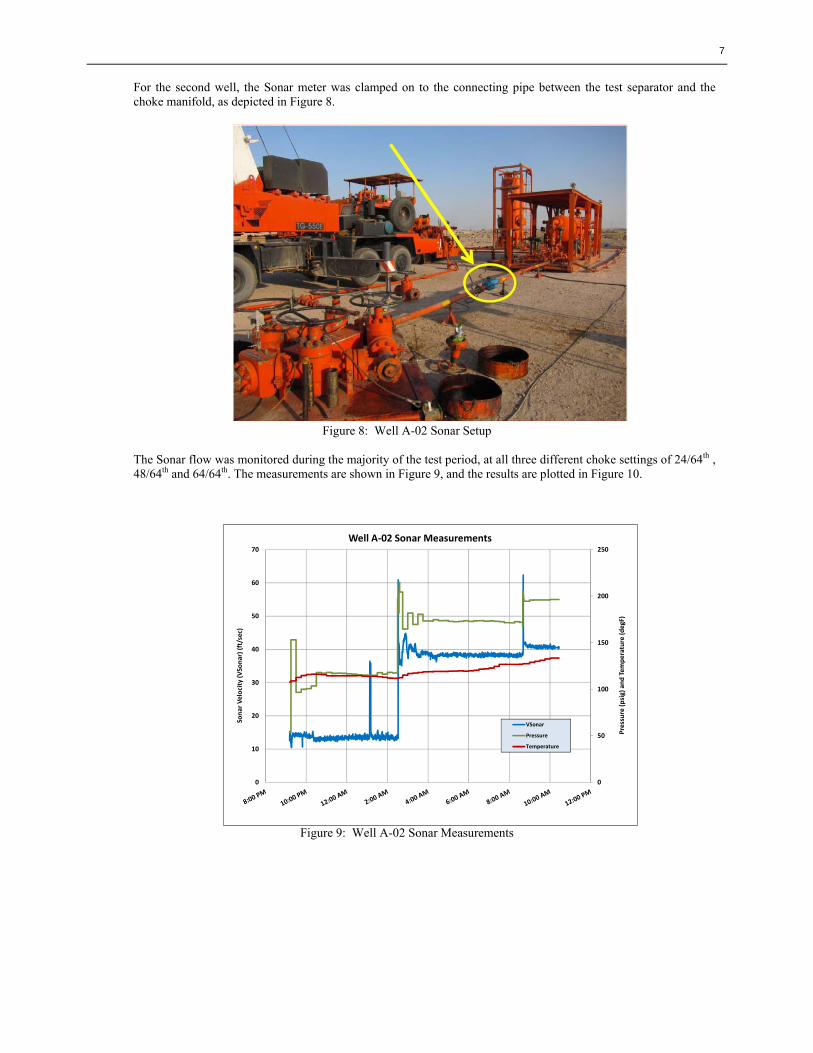
For the second well, the Sonar meter was clamped on to the connecting pipe between the test separator and the choke manifold, as depicted in Figure 8.
Figure 8: Well A-02 Sonar Setup
The Sonar flow was monitored during the majority of the test period, at all three different choke settings of 24/64th , 48/64th and 64/64th. The measurements are shown in Figure 9, and the results are plotted in Figure 10.
Figure 9: Well A-02 Sonar Measurements
0
50
100
150
200
250
0
10
20
30
40
50
60
70
Pre
ssu
re (
psi
g) a
nd
Te
mp
era
ture
(d
egF
)
Son
ar V
elo
city
(V
Son
ar)
(ft/
sec)
Well A‐02 Sonar Measurements
VSonar
Pressure
Temperature

8
Figure 10: Well A-02 Sonar Oil and Gas Flow Rates
For convenience, the averages associated with the above measurements and results are summarized in Table 2.
Well Duration
(min) Choke (64ths)
Clamp–on Sonar CTS Difference (%)
Qgas (MMscfd)
Qoil (stb/d)
Qgas (MMscfd)
Qoil (stb/d)
Qgas Qoil
A-02 120 24 0.347 527 0.57 885 39 40 120 48 1.366 2127 1.29 2201 -6 3 75 64 1.585 2486 1.48 2533 -7 2
Table 2: Well A-02 Sonar vs. Test Separator Both the gas and oil rates are well within a 10% error band for the higher choke settings. The low choke setting (24/64”) test point showed a 40% difference for both oil and gas rates between the Sonar and the test separator. Possible explanations for this deviation include incorrect separator settings (the records showed unstable parameters throughout the flow duration) or the low flow limit of clamp-on Sonar at the low pressure/velocity conditions this well. The Sonar results from both well tests were consistent and considered satisfactory and sufficient to move forward with field-wide implementation.
e. Implementation of field-wide Sonar well testing Field-wide production testing using the Sonar meter commenced after the trial tests. There were 94 wells tested in the first testing campaign. These included 91 oil wells (naturally flowing and ESP lifted) and 3 water injection wells. Sonar testing was also performed at the gas outlet of the 1st Stage Separator in the de-gassing stations to obtain volumetric gas flow rates. Reservoir PVT data was provided and used as an input for the black-oil models to interpret multiphase flow rates. The simplicity and the flexibility of the clamp-on Sonar system allowed for a relatively quick turnaround in terms of training. The individual wells flow rate measurement gave the opportunity to promptly take necessary actions in order to optimize the whole process stream for the field and to identify eventual problems in the wells. As a consequence the production downtime was reduced and the production optimization workflow is strengthened. All the well optimization models were tuned using the Sonar well test data, and particular benefit were identified on ESP completed wells, due to the presence of real time down-hole pressure and temperature sensors. Sonar testing resulted in updating of the hydraulic well models and real-time ESP frequency optimization at the well site.
0
0.5
1
1.5
2
2.5
3
3.5
4
4.5
5
0
500
1000
1500
2000
2500
3000
3500
4000
4500
5000
Gas
Rat
e (m
msc
fd)
OIL
Rat
e (
bp
d)
Well A‐02 Sonar Rates
Sonar Oil rate
Sonar Gas Rate

9
A very small percentage of tests where discarded, due to the flow at or below Sonar measurement capabilities. For these wells, a change in piping layout was recommended to allow for installation of a smaller Sonar meter size.
f. Validation – Comparisons with the test separator – 4 wells
At the end of the first field-wide testing campaign, 4 wells were tested in conjunction with test separators for validation purposes. Three wells were tested at single choke settings and stable flow conditions, while a fourth well was tested at multiple choke settings. The Sonar meter was clamped upstream of the temporary choke manifold (part of the test separator package) for all tests. The multiple-choke setting well test was chosen for illustration purposes (See Figure 11).
Figure 11: Well A-03 Sonar Setup
The test measurements are displayed in Figure 12, while the results are plotted in Figure 13.
Figure 12: Well A-03 Sonar Measurements
0
50
100
150
200
250
300
350
400
0
5
10
15
20
25
30
35
40Pr
essu
re (p
sig)
and
Tem
pera
ture
(deg
F)
Sona
r Vel
ocity
(VSo
nar)
(ft/
sec)
Well A‐03 Sonar Measurements
VSonar
Pressure
Temperature
Choke-32/64"
Choke-48/64"
Choke-64/64"

10
Figure 13: Well A-03 Sonar vs. Test Separator
As observed during the initial evaluation trial against the CTS, the clamp-on Sonar system tracked the separator measurements relatively closely. Also, the Sonar proved once again to be a more responsive system compared to the CTS at the beginning of a well test after the well shut down. The data from all 4 tests is summarized in Table 3.
Well Duration
(hrs) Choke (64ths)
Clamp–on Sonar CTS Difference (%)
Qgas (MMscfd)
Qoil (stb/d)
Qgas (MMscfd)
Qoil (stb/d)
Qgas Qoil
A-03 10.5 24 0.486 994 0.467 1152 4 -14 12 48 0.998 2041 0.929 2106 7 -3 2.7 64 1.351 2762 1.229 2805 10 -2
A-04 6 64 1.900 2752 1.686 2621 13 5 A-05 5 64 2.491 3194 2.280 3105 9 3 A-06 2.7 48 6.794 4249 5.291 3417 28 24
Table 3: Validation Results - Sonar vs. Test Separator The validation tests again proved that the new clamp-on Sonar approach for well testing is reliable and yields a reasonable measurement uncertainty over a wide range of choke settings and flow conditions. The validation testing results were consistent with the measurements recorded during the initial evaluation tests, giving the confidence to proceed with subsequent field-wide well testing campaigns using the clamp-on Sonar flow meter.
0
500
1000
1500
2000
2500
3000
0.00
0.50
1.00
1.50
2.00
2.50
3.00
Qoi
l (ST
B/d)
Qga
s (m
msc
fd)
Well A‐03 Sonar vs. Test Separator
Sonar Gas Rate
Test Sep. Gas Rate
Sonar Oil Rate
Test Sep. Oil Rate
Choke-32/64"
Choke-48/64"
Choke-64/64"

11
Conclusions Both the individual and the field-wide well test evaluations of the clamp-on Sonar system were successfully completed without any safety incidents. The results were overall considered to be within the accepted uncertainty range.The following conclusions were derived from the Sonar well testing campaign:
a. The clamp-on Sonar system measured three phase well production with accuracy comparable to conventional well testing methods such as CTS and MPFM. For the wells where the flow was at or below Sonar measurement capabilities, a change in piping layout was recommended to allow for installation of a smaller Sonar meter size.
b. The Sonar deployment provided more individual well production data than could have been collected by conventional means over the same time period, thereby contributing significantly to the improvement in production allocation and facilities management. Periodic individual well testing resulted in better production allocation and optimum use of production separators and other equipment further downstream and contributed to decision making for work-over prioritization.
c. Due to its portability and ease of installation, the Sonar system allowed a large number of wells to be tested in a short period of time without any production interruption/loss, proving to be a very cost effective way to do field-wide well testing. The simplicity of the Sonar system allowed and timely and effective training
d. The new approach, due to the amount of data provided over such a short period of time, helped to improve field management, i.e.:
1. On a Natural Flow multilayer production well Sonar meter allowed to diagnose a leaking in the annulus packer
2. On ESP lifted wells, the Sonar meter allowed for real-time ESP optimization at the well site, tests at multiple ESP drive frequencies helped optimize ESP frequency for target production.
3. On ESP lifted wells, the Sonar meter allowed to diagnose blocked circulation valve in the annulus flow line.
Acronyms
CTS = Conventional Test Separator DGS = De-Gassing Station dP = Differential Pressure ESP = Electric Submersible Pump GOR = Gas to Oil Ratio HSE = Health Safety and Environmental MPFM = Multi-Phase Flow Meter PS = Production Separator PVT = Pressure, Volume, Temperature WT = Well Test WH = Well Head WC = Watercut
Acknowledgements The authors gratefully acknowledge the management of South Oil Company of Iraq (SOC), ENI S.p.a. and Expro Group for permission to publish this work and acknowledge the efforts of numerous colleagues who have contributed to the development and evaluation of this technology. References
1. Kragas, T. K., et al., “Downhole, Fiber Optic Multiphase Flow Meter: Field Installation” Presented at the Society of Petroleum Engineers Annual Conference, SPE Paper #77654, September 2002.
2. Gysling, D.L., Loose, D.H, "SONAR-Based Volumetric Flow And Entrained Air Measurement For Pulp And Paper Applications", TAPPI Spring Technical Conference, Paper 58-1, Chicago, IL, May 2003.
3. Gysling, D.L., Lu, M., Wen, T., “Clamp-on Two Phase Measurement of Gas Condensate Wells Using Integrated Equation of State Compositional Models”, 28th International North Sea Flow Measurement Workshop, 26th – 29th October 2010, St. Andrews, Scotland, UK