nevada agricultural statistics 2008 · table of contents general cattle nevada facts and figures 6...
TRANSCRIPT


Nevada Agricultural Statistics 2008
Nevada Department of Agriculture Tony Lesperance, Director
University of Nevada College of Agriculture, Biotechnology, & Natural Resources
David Thawley, Dean & Director
Cooperating with
U.S. Department of Agriculture National Agricultural Statistics Service
Dr. Cynthia Clark, Administrator
Compiled by
Nevada Agricultural Statistics P.O. Box 8880
Reno, NV 89507 Phone (775) 972-6001
Fax (775) 972-6002 Toll-Free (888) 456-7211
Internet Homepage: http://www.nass.usda.gov/nv/
Martin Owens, Director
Erik Gerlach, Agricultural Statistician
Mark Deonier , Agricultural Statistician
Candace Lucero, Statistical Assistant
September 2008

United States Department of Agriculture National Agricultural Statistics Service
Nevada Field Office
P.O. Box 8880 ▪ Reno, NV 89507 ▪ Voice: (775) 972-6001 ▪ Fax: (775) 972-6002 Email:[email protected] ▪ Web: http://www.nass.usda.gov/nv
To Our Readers: It is my pleasure to present Nevada Agricultural Statistics, our annual comprehensive collection of statistics on Nevada agriculture. This publication is prepared and released in cooperation with Nevada Department of Agriculture and University of Nevada College of Agriculture, Biotechnology, and Natural Resources. It presents data compiled by the Nevada field office of USDA’s National Agricultural Statistics Service. The mission of this agency is to provide meaningful, accurate, and objective statistical information in service to agriculture. I hope you find it useful in your endeavors. Higher prices for Nevada’s foremost agricultural commodities, cattle and hay, drove farm receipts and incomes for 2007 up sharply from 2006. Unfortunately, input costs for such items as feed, fuel, electricity, and fertilizer were also on the rise. Lower precipitation across the state reduced range forage supplies which, coupled with economic stresses, resulted in reduced livestock inventories. Most of these same factors are influencing Nevada agricultural operations in 2008 as well. Statistics like those we have included in this bulletin can be useful in describing and quantifying such industry changes. The preparation of Nevada Agricultural Statistics is made possible through the cooperation and support of Nevada’s farmers, ranchers, agribusinesses, tribal governments, and State and Federal agencies. Thank you all for your invaluable help. We conduct many surveys through the year to monitor agricultural activity and Nevada’s agriculturalists have consistently supported our efforts. I hope the resulting products in turn benefit producers by providing statistics for advocacy, research, education, and policy making. Reports issued by our office and the National Agricultural Statistics Service are available on the web at www.nass.usda.gov/. I welcome any questions regarding these statistics and await the opportunity to assist you with any additional data needs.
Sincerely,
Martin J. Owens
Director
USDA’S National Agricultural Statistics Service, Nevada Field Office; cooperating with the Nevada Department of Agriculture and University of Nevada
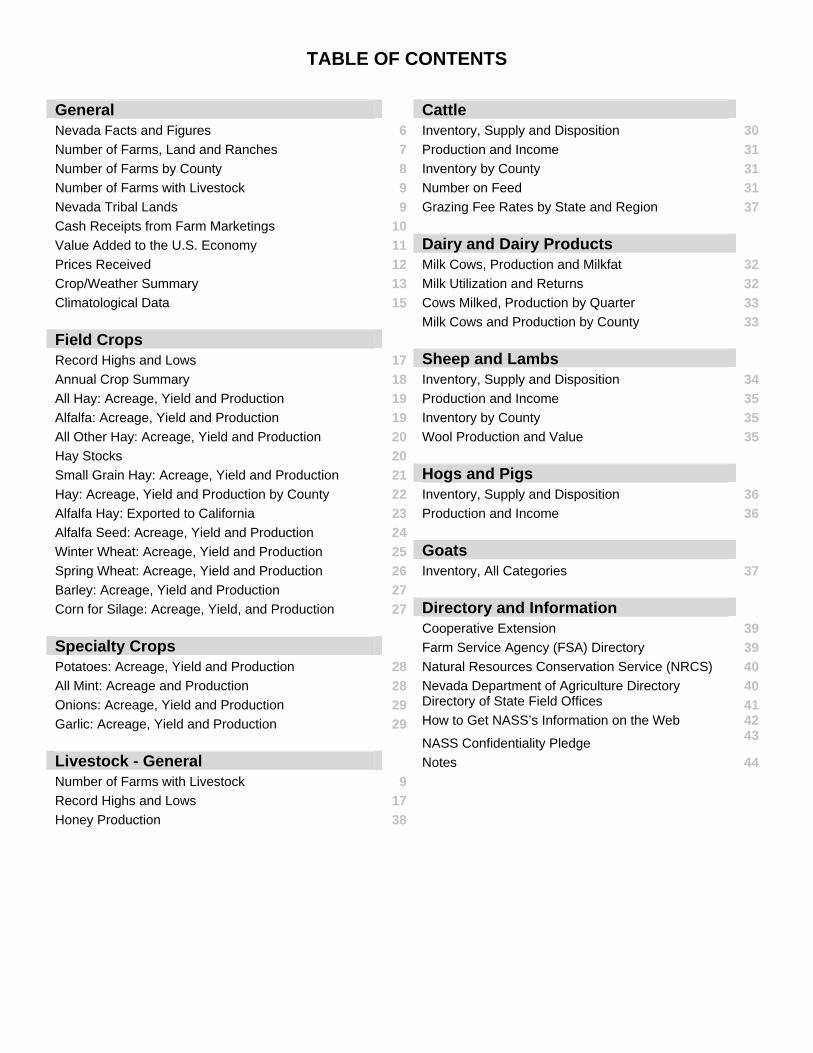
TABLE OF CONTENTS
General Cattle Nevada Facts and Figures 6 Inventory, Supply and Disposition 30 Number of Farms, Land and Ranches 7 Production and Income 31 Number of Farms by County 8 Inventory by County 31 Number of Farms with Livestock 9 Number on Feed 31 Nevada Tribal Lands 9 Grazing Fee Rates by State and Region 37 Cash Receipts from Farm Marketings 10 Value Added to the U.S. Economy 11 Dairy and Dairy Products Prices Received 12 Milk Cows, Production and Milkfat 32 Crop/Weather Summary 13 Milk Utilization and Returns 32 Climatological Data 15 Cows Milked, Production by Quarter 33 Milk Cows and Production by County 33 Field Crops Record Highs and Lows 17 Sheep and Lambs Annual Crop Summary 18 Inventory, Supply and Disposition 34 All Hay: Acreage, Yield and Production 19 Production and Income 35 Alfalfa: Acreage, Yield and Production 19 Inventory by County 35 All Other Hay: Acreage, Yield and Production 20 Wool Production and Value 35 Hay Stocks 20 Small Grain Hay: Acreage, Yield and Production 21 Hogs and Pigs Hay: Acreage, Yield and Production by County 22 Inventory, Supply and Disposition 36 Alfalfa Hay: Exported to California 23 Production and Income 36 Alfalfa Seed: Acreage, Yield and Production 24 Winter Wheat: Acreage, Yield and Production 25 Goats Spring Wheat: Acreage, Yield and Production 26 Inventory, All Categories 37 Barley: Acreage, Yield and Production 27 Corn for Silage: Acreage, Yield, and Production 27 Directory and Information Cooperative Extension 39 Specialty Crops Farm Service Agency (FSA) Directory 39 Potatoes: Acreage, Yield and Production 28 Natural Resources Conservation Service (NRCS) 40 All Mint: Acreage and Production 28 Nevada Department of Agriculture Directory 40 Onions: Acreage, Yield and Production 29 Directory of State Field Offices 41 Garlic: Acreage, Yield and Production 29 How to Get NASS’s Information on the Web
NASS Confidentiality Pledge
4243
Livestock - General Notes 44 Number of Farms with Livestock 9 Record Highs and Lows 17 Honey Production 38
NEVADA FACTS AND FIGURES
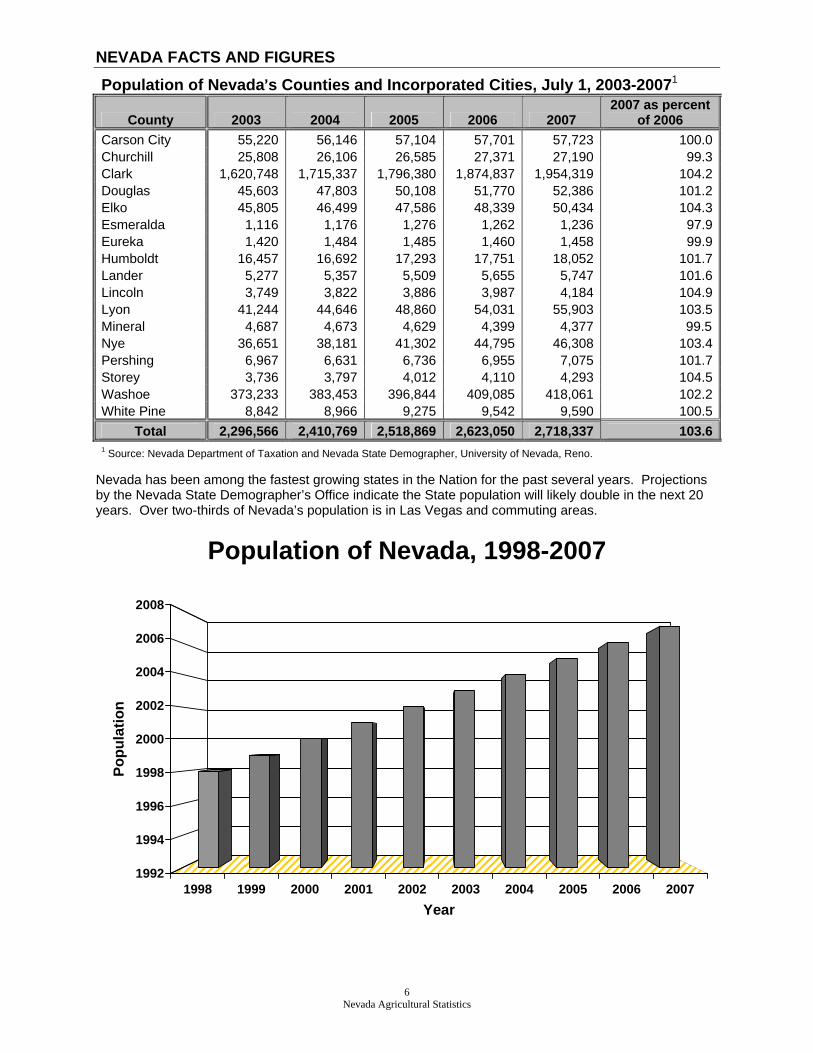
Population of Nevada=s Counties and Incorporated Cities, July 1, 2003-20071
County 2003 2004 2005 2006 2007 2007 as percent
of 2006 Carson City 55,220 56,146 57,104 57,701 57,723 100.0Churchill 25,808 26,106 26,585 27,371 27,190 99.3Clark 1,620,748 1,715,337 1,796,380 1,874,837 1,954,319 104.2Douglas 45,603 47,803 50,108 51,770 52,386 101.2Elko 45,805 46,499 47,586 48,339 50,434 104.3Esmeralda 1,116 1,176 1,276 1,262 1,236 97.9Eureka 1,420 1,484 1,485 1,460 1,458 99.9Humboldt 16,457 16,692 17,293 17,751 18,052 101.7Lander 5,277 5,357 5,509 5,655 5,747 101.6Lincoln 3,749 3,822 3,886 3,987 4,184 104.9Lyon 41,244 44,646 48,860 54,031 55,903 103.5Mineral 4,687 4,673 4,629 4,399 4,377 99.5Nye 36,651 38,181 41,302 44,795 46,308 103.4Pershing 6,967 6,631 6,736 6,955 7,075 101.7Storey 3,736 3,797 4,012 4,110 4,293 104.5Washoe 373,233 383,453 396,844 409,085 418,061 102.2White Pine 8,842 8,966 9,275 9,542 9,590 100.5
Total 2,296,566 2,410,769 2,518,869 2,623,050 2,718,337 103.61 Source: Nevada Department of Taxation and Nevada State Demographer, University of Nevada, Reno.
Nevada has been among the fastest growing states in the Nation for the past several years. Projections by the Nevada State Demographer’s Office indicate the State population will likely double in the next 20 years. Over two-thirds of Nevada’s population is in Las Vegas and commuting areas.
1998 1999 2000 2001 2002 2003 2004 2005 2006 20071992
1994
1996
1998
2000
2002
2004
2006
2008
Popu
latio
n
Year
Population of Nevada, 1998-2007
6
Nevada Agricultural Statistics
7 Nevada Agricultural Statistics
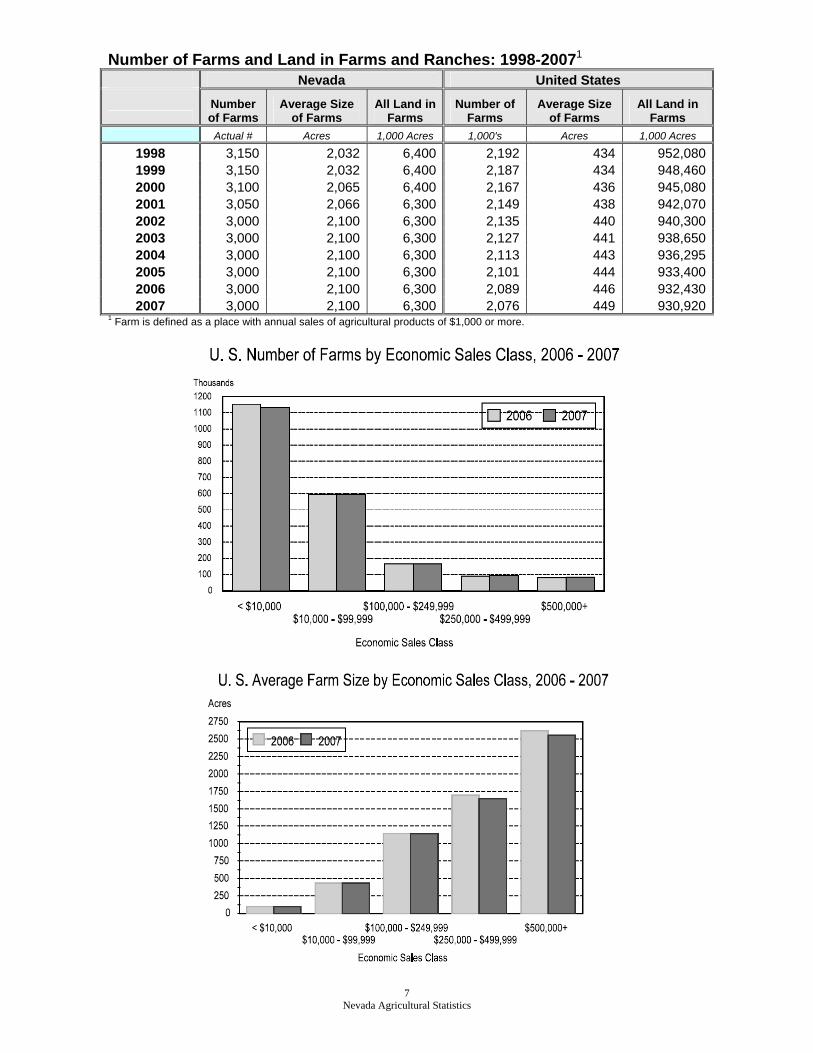
Number of Farms and Land in Farms and Ranches: 1998-20071 Nevada United States
Number of Farms
Average Size of Farms
All Land in Farms
Number of Farms
Average Size of Farms
All Land in Farms
Actual # Acres 1,000 Acres 1,000's Acres 1,000 Acres
1998 3,150 2,032 6,400 2,192 434 952,0801999 3,150 2,032 6,400 2,187 434 948,4602000 3,100 2,065 6,400 2,167 436 945,0802001 3,050 2,066 6,300 2,149 438 942,0702002 3,000 2,100 6,300 2,135 440 940,3002003 3,000 2,100 6,300 2,127 441 938,6502004 3,000 2,100 6,300 2,113 443 936,2952005 3,000 2,100 6,300 2,101 444 933,4002006 3,000 2,100 6,300 2,089 446 932,4302007 3,000 2,100 6,300 2,076 449 930,920
1 Farm is defined as a place with annual sales of agricultural products of $1,000 or more.
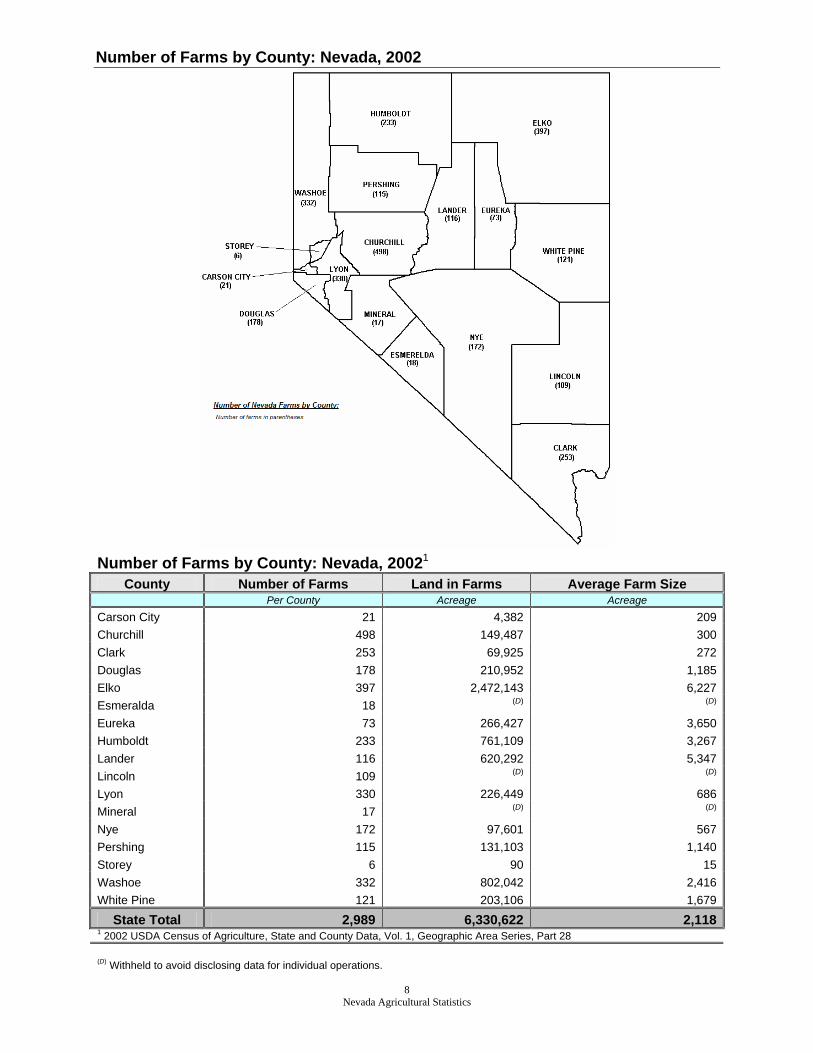
Number of Farms by County: Nevada, 2002
Number of Farms by County: Nevada, 20021
County Number of Farms Land in Farms Average Farm Size Per County Acreage Acreage
Carson City 21 4,382 209Churchill 498 149,487 300Clark 253 69,925 272Douglas 178 210,952 1,185Elko 397 2,472,143 6,227Esmeralda 18 (D) (D)
Eureka 73 266,427 3,650Humboldt 233 761,109 3,267Lander 116 620,292 5,347Lincoln 109 (D) (D)
Lyon 330 226,449 686Mineral 17 (D) (D)
Nye 172 97,601 567Pershing 115 131,103 1,140Storey 6 90 15Washoe 332 802,042 2,416White Pine 121 203,106 1,679
State Total 2,989 6,330,622 2,1181 2002 USDA Census of Agriculture, State and County Data, Vol. 1, Geographic Area Series, Part 28
(D) Withheld to avoid disclosing data for individual operations.
8 Nevada Agricultural Statistics
Nevada Agricultural Statistics
9
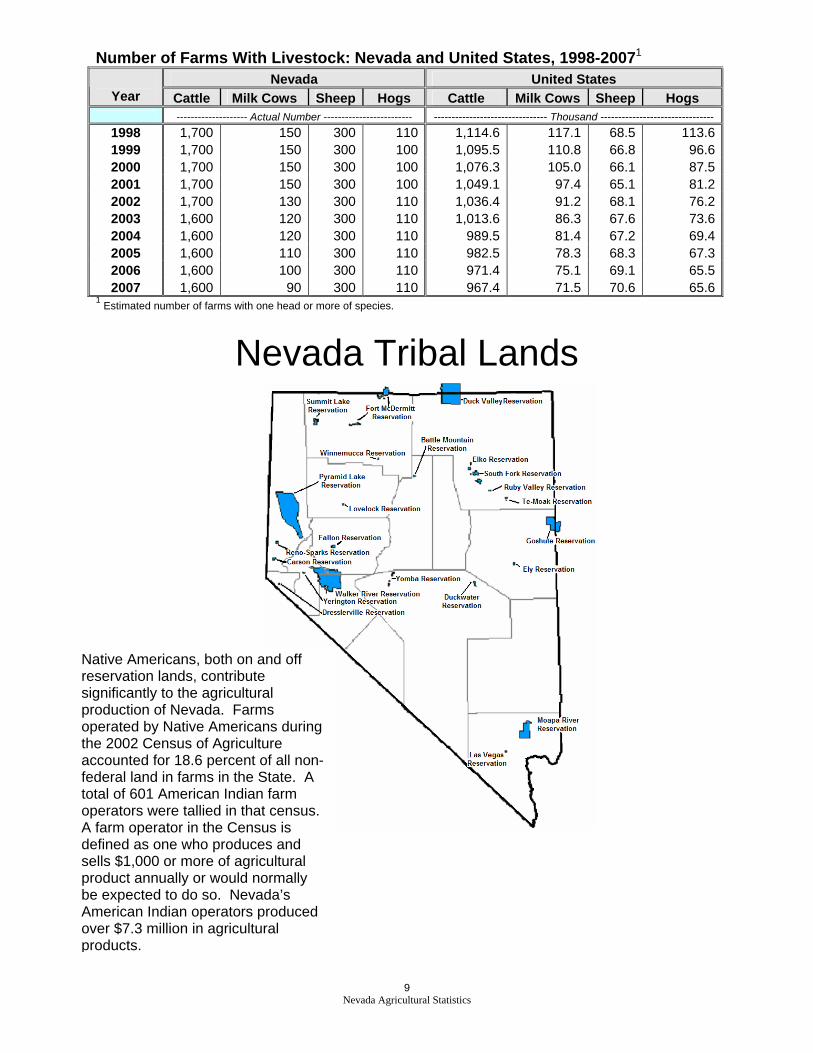
Number of Farms With Livestock: Nevada and United States, 1998-20071 Nevada United States
Year Cattle Milk Cows Sheep Hogs Cattle Milk Cows Sheep Hogs -------------------- Actual Number ------------------------- -------------------------------- Thousand --------------------------------
1998 1,700 150 300 110 1,114.6 117.1 68.5 113.61999 1,700 150 300 100 1,095.5 110.8 66.8 96.62000 1,700 150 300 100 1,076.3 105.0 66.1 87.52001 1,700 150 300 100 1,049.1 97.4 65.1 81.22002 1,700 130 300 110 1,036.4 91.2 68.1 76.22003 1,600 120 300 110 1,013.6 86.3 67.6 73.62004 1,600 120 300 110 989.5 81.4 67.2 69.42005 1,600 110 300 110 982.5 78.3 68.3 67.32006 1,600 100 300 110 971.4 75.1 69.1 65.52007 1,600 90 300 110 967.4 71.5 70.6 65.6
1 Estimated number of farms with one head or more of species.
Nevada Tribal Lands
Native Americans, both on and off reservation lands, contribute significantly to the agricultural production of Nevada. Farms operated by Native Americans during the 2002 Census of Agriculture accounted for 18.6 percent of all non-federal land in farms in the State. A total of 601 American Indian farm operators were tallied in that census. A farm operator in the Census is defined as one who produces and sells $1,000 or more of agricultural product annually or would normally be expected to do so. Nevada’s American Indian operators produced over $7.3 million in agricultural products.

10 Nevada Agricultural Statistics
Cash Receipts From Farm Marketings: By Commodity, Nevada 2005-20071 Item 2005 2006 2007
Million $ Percent Million $ Percent Million $ Percent
Cattle & Calves 209.6 45.0 191.8 41.4 212.9 38.5Dairy Products 77.7 16.7 67.2 14.5 103.9 18.8Sheep & Lambs 3.7 0.8 3.3 0.7 3.3 0.6All other Livestock & Products 17.2 3.7 16.7 3.6 17.2 3.1Total Livestock & Products 308.2 66.2 279.0 60.2 337.3 61.0Wheat 2.8 0.6 3.8 0.8 7.1 1.3All Hay 95.1 20.4 117.5 25.4 141.9 25.7Vegetables 34.2 7.3 35.8 7.7 34.6 6.3Potatoes 10.8 2.3 12.8 2.8 15.3 2.8All Other Crops 14.4 3.1 14.7 3.2 16.7 3.0Total Crops 157.4 33.8 184.5 37.2 215.6 39.0Total All Commodities 465.6 100.0 463.6 100.0 552.9 100.01 Totals may not add due to rounding
Cattle & Calves38.5%
Dairy Products18.8%
Sheep & Lambs0.6%
Other Livestock3.1%
Wheat1.3%
All Hay25.7%
Vegetables6.3%
Potatoes2.8%
Other Crops3.0%
Cash Receipts from Farm Marketings, Nevada 2007

Value Added to the U.S. Economy by the Agricultural Sector: The value-added format is now used to present the income accounts, replacing the traditional net farm income format. Changes in commodity production is the cause of most of the volatility in the income accounts, and the presence of more disaggregated components under the value-added format makes it much easier to discern what forces are driving the changes and trends in farm income. In addition, the value-added approach to the sector accounting has the advantage of being the format accepted and utilized internationally, thereby enabling comparison across countries.
Economic Contribution by Type, Nevada, 2003-2007 Item 2003 2004 2005 2006 2007
--------------------------------- Thousands of Dollars --------------------------------- Value of Agricultural Sector Production1 460,551 520,301 564,155 577,497 624,220Value of Crop Production 143,093 153,534 158,663 187,014 211,974Value of Livestock Production 254,247 297,209 309,144 279,814 287,535Revenues from Services and Forestry 63,212 69,558 96,348 110,669 124,711Total Purchased Inputs 246,856 251,068 284,901 309,240 321,238Farm Origin Inputs 89,428 107,434 113,574 116,379 126,929Feed Purchased 46,895 50,644 54,560 61,521 74,895Livestock and Poultry Purchased 33,272 48,511 48,350 44,194 42,352Seed Purchased 9,261 8,279 10,664 10,664 9,682Manufactured Inputs 58,932 59,780 72,454 74,843 82,220Fertilizers and Lime 11,926 12,740 16,274 16,654 18,639Pesticides 7,649 8,059 8,605 8,879 8,742Petroleum Fuel and Oils, Electricity 17,677 20,578 25,452 27,973 31,462Electricity 21,680 18,403 22,123 21,337 23,377Other Purchased Inputs 98,496 83,854 98,873 118,114 112,089Repair and Maintenance of Capital Items 21,912 22,881 23,694 29,525 29,901Machine Hire and Custom Work 7,081 6,030 4,475 6,230 6,931Marketing, Storage and Transportation Expense 14,915 13,165 18,266 21,805 17,474Contract Labor 3,195 4,923 4,440 5,546 6,983Miscellaneous Expenses 51,393 36,852 47,998 55,008 50,800Net Government Transactions 1,241 (4,468) (1,474) (6,966) (7,667)Direct Government Payments 11,931 6,531 11,725 8,620 10,298Motor Vehicle Registration and Licensing Fees 1,216 1,161 1,175 1,011 1,204Property Taxes 9,474 9,838 12,024 14,575 16,761Gross Value Added 214,936 264,768 277,780 261,195 295,315Capital Consumption 47,398 51,087 59,034 65,590 68,796Net Value Added 167,538 213,681 218,746 195,605 226,519Payments to Stakeholders 75,045 80,539 92,074 96,639 98,821Employee Compensation (total hired labor) 52,919 58,856 68,340 70,605 71,517Net Rent Received by Non-Operator Landlords 4,167 3,728 3,548 4,715 4,582Real Estate and Non-Real Estate Interest 17,959 17,955 20,186 21,319 22,722
Net Farm Income1 92,493 133,142 126,672 98,966 127,698 Source: Economic Indicators of the Farm Sector, State Financial Summary, USDA-ERS. 1Final sector output is the gross value of the commodities and services produced within a year. Net value-added is the sector’s contribution to the National economy and is the sum of the income from production earned by all factors of production. Net farm income is the farm operator’s share of income from the sector’s production activities. The concept presented is consistent with that employed by the Organization for Economic Cooperation and Development.
11 Nevada Agricultural Statistics

Nevada Agricultural Statistics
12
Prices Received for Specified Products: By Month, Nevada, 2003-2007 Jan. Feb. Mar. Apr. May Jun. Jul. Aug. Sept. Oct. Nov. Dec. Year
---------------------------------------------------------------------- Dollars per Ton ----------------------------------------------------------------------
All Hay 2003 95.00 96.00 91.00 92.00 95.00 100.00 97.00 92.00 90.80 95.00 90.00 93.00 2004 93.00 94.00 90.00 93.00 90.00 100.00 104.00 102.00 97.00 100.00 105.00 102.00 2005 105.00 107.00 114.00 105.00 105.00 115.00 122.00 128.00 115.00 118.00 123.00 128.00 2006 119.00 125.00 120.00 127.00 123.00 121.00 118.00 108.00 108.00 112.00 118.00 116.00 2007 119.00 118.00 119.00 119.00 126.00 126.00 137.00 142.00 144.00 149.00 149.00 155.00
Alfalfa Hay 2003 94.00 95.00 90.00 93.00 96.00 100.00 95.00 89.00 88.00 93.50 87.00 91.00 2004 91.00 90.00 88.00 90.00 90.00 99.00 103.00 101.00 97.00 98.00 103.00 102.00 2005 102.00 106.00 112.00 100.00 102.00 113.00 122.00 127.00 114.00 118.00 122.00 128.00 2006 119.00 125.00 120.00 128.00 123.00 121.00 119.00 109.00 108.00 112.00 118.00 117.00 2007 120.00 118.00 119.00 119.00 127.00 127.00 138.00 141.00 144.00 148.00 150.00 156.00
Other Hay 2003 100.00 100.00 95.00 90.00 90.00 95.00 120.00 128.00 111.00 105.00 118.00 103.00 2004 103.00 130.00 107.00 109.00 90.00 110.00 116.00 123.00 103.00 120.00 122.00 104.00 2005 126.00 118.00 127.00 130.00 130.00 129.00 129.00 138.00 120.00 120.00 130.00 128.00 2006 115.00 112.00 127.00 122.00 114.00 108.00 99.00 90.00 110.00 118.00 116.00 105.00 2007 112.00 118.00 127.00 122.00 114.00 118.00 129.00 155.00 144.00 160.00 145.00 150.00
Season Average Prices, Cattle & Calves, Sheep & Lambs, and Hogs & Pigs, 2005-2007 Year 2005 2006 2007 2005 2006 2007
Commodity Nevada United States ----------------------------------------------- Average Price per Cwt. ($) -----------------------------------------------
Cattle 93.80 90.20 87.10 89.70 87.20 89.90Calves 137.00 121.00 121.00 135.00 133.00 119.00Hogs & Pigs 46.60 42.30 44.30 50.20 46.00 46.60Sheep 40.00 29.00 29.00 45.10 35.20 31.00Lambs 115.00 96.00 101.00 110.00 95.50 98.50
13 Nevada Agricultural Statistics
2007 Crop/ Weather Summary
January: Two storm systems passed through the State early in the month bringing snow to northern Nevada and the mountains and rains to the lower elevations. High pressure then moved over the State making for cold, dry weather. Mountain snow accumulations were about half of normal at the end of the month. Both temperatures and precipitation averaged well below normal statewide. Winter livestock feeding was ongoing and calving was getting underway. Hay shipments continued to move to out-of-state markets and local horse accounts February: Early and late February storm systems brought rain and/or snow to most northern Nevada locations bolstering mountain snow pack and providing much needed moisture for grazing lands across the state. In the east, feed supplies were impacted as producers increased rations to maintain the livestock throughout the relatively cool, wet month. Native grasses on winter grazing lands were short due to severe drought conditions in 2007, which also necessitated supplemental feeding; however, livestock rated in generally fair to good condition. In the central, valley locations received rain in addition to mountain snows and supplemental cattle feeding was also ongoing. Alfalfa and small grain growing regions did not report any greening in February, with the crops rated in fair to good condition. Other farm and ranch activities included: equipment maintenance, early calving, fence repairs, crop and livestock marketing, industry meetings. March: High pressure asserted itself over Nevada and most of the month was dry. Temperatures were warmer than normal in the central and southern regions and colder than normal in the northern regions. A storm system passed through near the middle of the month, bringing some precipitation, only to again be replaced by high pressure. Monthly and seasonal precipitation totals were well below normal. The warming temperatures had forages greening in central and southern regions. Dry weather promoted fieldwork and crop development. Onions were being seeded and fields were being prepared for grain planting. Sod cutting was underway. Calving was ongoing and lambing got underway. Main farm and ranch activities: field preparation, equipment maintenance, calving, lambing, ditch burning, weed control. April: Several cold fronts moved across the state during the month bringing windy conditions. Temperatures remained cool for most of the month except for a few warm days midmonth. Precipitation was below normal for the month. Winnemucca recorded the most precipitation, 0.31 inches, which was 0.54 inches below normal. Snow packs continue to hold near 100 percent of normal, with melting slowed by the cool weather. Field preparations and spring grain planting was in full swing as the wet weather finally ended. Range and pasture growth accelerated as temperatures rose. Livestock were beginning to move to public grazing lands. Calving and lambing advanced and were nearing completion. Fence repair was common. Main farm and ranch activities: calving, lambing, branding, grain planting, weed spraying, fertilizing fields, and dragging meadows. May: Cool, stormy weather entering the month was soon displaced by dominate high pressure. Most of the month was unseasonably warm and dry. The warm weather accelerated snow melt. Crop conditions were generally good and the warm weather fostered growth. Irrigation season was underway. Alfalfa harvest got underway in southern areas. Spring planted grains emerged and Fall seeded fields showed good growth. Potato planting was completed. Many ranges showed signs of the dry spring. Most range livestock were turned out to high ranges. Calving and lambing were virtually complete. Main farm and ranch activities: haying, irrigating, weed and insect control. June: Above normal temperatures and below normal precipitation dominated the state=s weather for the month. Producers moving livestock to summer ranges faced declining range and pasture conditions and tightening feed supplies. Hay producers completed the first cutting of alfalfa and made progress on other alfalfa and grass mixtures. Small grains matured rapidly and in generally good condition under the warm weather; however, irrigation water was short in some areas. Garlic, onions, and potatoes were in good to excellent condition in well irrigated areas.

2007 Crop/ Weather Summary (continued) July: Record heat and minimal precipitation contributed to deteriorating range and pasture conditions and increased fire activity throughout July. Reno (108<F), Fallon (108<F), and Lovelock (112<F) set record highs on July 5 as temperatures soared into the triple-digits across the state during the first week of July. Dry lightning associated with heat induced thunderstorms sparked several wildfires particularly in the central and east. Wildfires burning in Nevada were fully contained by month=s end after scorching a significant amount of rangeland prompting early movement of livestock in affected areas. A southerly flow developed over the state late in the month bringing generally light, scattered rain showers to the south and east. Las Vegas recorded its first measurable precipitation since April 16 with .26 inches of rain on July 23. Hay producers wrapped up the second cutting of alfalfa and continued swathing and baling of grain and wild hay. Other farm and ranch activities included: weed and insect control, irrigation, and equipment maintenance. August: Dominating high pressure across the state made for a mostly quiet month of above normal temperatures and below normal precipitation. The 0.16 inches of rainfall officially recorded in Reno this month snapped the seventh longest dry streak in Reno history at 85 days. Las Vegas was an exception with total precipitation in August measuring 0.76 inches, 0.31 inches above normal. The warm, dry conditions promoted fieldwork, but increased irrigation demands on an already diminishing water supply. Small grain harvest was complete by month=s end with onion and garlic harvest ongoing. Most hay producers finished harvesting the third cutting of alfalfa and completed harvest of alfalfa for seed. Livestock producers continued to relocate cattle in an effort to maintain adequate feed and water. The poor range and pasture conditions necessitated the early marketing of calves in some locations. Additionally, farmers and ranchers were active controlling weeds and insects, maintaining equipment, and preparing for fall-seeded crops as August drew to a close September: Summer like weather the first half of the month gave way to a cooler, wetter pattern by month=s end as strong high pressure relented allowing cold fronts to push across the state. Daytime highs climbed into the 80s and 90s as a late season heat wave highlighted the state=s weather in early September. Temperatures cooled and precipitation increased as generally chilly weather settled over the state toward month=s end. Daytime highs fell into the 60s and 70s for many locations while nighttime lows dipped into the low 30s and upper 20s. Precipitation amounts were generally below normal; however, Las Vegas set consecutive daily rainfall records with 0.34 inches on September 22 and 0.32 inches on September 23 bringing the area=s monthly total to 0.67 inches, 0.36 inches above normal. The warm, dry weather early in the month promoted harvest of potatoes, garlic, onions, and the fourth cutting of alfalfa in certain areas. Range and pastureland remained in below average condition as livestock producers brought cattle in from summer ranges throughout the month. Other farm and ranch activities included fall tillage, winter wheat seeding and weed control. October: Several weather patterns passed through the state early in the month bringing cool temperatures and varying amounts of precipitation; however, conditions turned warmer by month=s end as Nevada producers predominately completed the fall harvest of potatoes and the final cuttings of hay. Northern Nevada locations reported traces of snow in early October as clouds, wind, and rain hampered harvests of late hay cuttings. However, warmer temperatures and a few spring-like thunderstorms the latter half of the month brought average temperatures to near normal and above normal precipitation totals to Winnemucca and Elko. The much needed precipitation, however, was not substantial enough to markedly improve range and pasture conditions. Livestock producers worked throughout the month gathering livestock to market calves and move herds onto hay meadows and alfalfa regrowth. Reports of supplemental feeding increased throughout the month. November: Nevada experienced a relatively quiet weather pattern in November with near normal temperatures and below normal precipitation for most locations. Clouds and rain moved across northern Nevada in mid-November bringing the bulk of the monthly total precipitation received in Reno, Winnemucca and Elko. Las Vegas benefitted from a major winter storm moving from the Southwest to the Great Lakes, receiving 0.60 inches of precipitation on November 30. Nevada farmers and ranchers generally completed most field work by month=s end as late season hay harvests in some southern locations wrapped up and onion sacks were pulled from the fields to storage. Cattle movement slowed throughout the month as ranchers moved livestock to market and winter grazing. A strong, regional demand for hay kept shipments of alfalfa and other hay mixes moving throughout the month. December: Several storm systems passed through the state during December but the events were genrally not extreme. Precipitation totals and temperatures averages were near normal. Snow began to accumulate in the mountains. Supplemental feeding of range livestock was common. Potato processing was ongoing. Onion sorting and shipping continued.
14 Nevada Agricultural Statistics
Nevada Agricultural Statistics
15
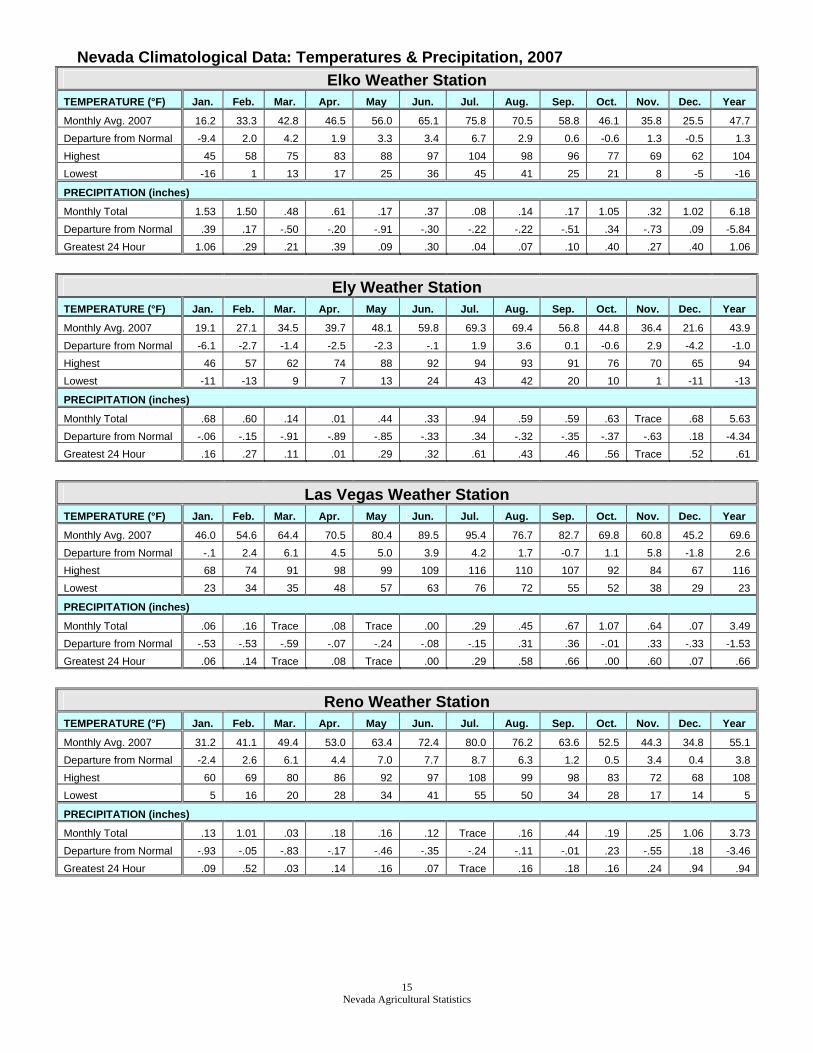
Nevada Climatological Data: Temperatures & Precipitation, 2007 Elko Weather Station
TEMPERATURE (°F) Jan. Feb. Mar. Apr. May Jun. Jul. Aug. Sep. Oct. Nov. Dec. Year
Monthly Avg. 2007 16.2 33.3 42.8 46.5 56.0 65.1 75.8 70.5 58.8 46.1 35.8 25.5 47.7 Departure from Normal -9.4 2.0 4.2 1.9 3.3 3.4 6.7 2.9 0.6 -0.6 1.3 -0.5 1.3 Highest 45 58 75 83 88 97 104 98 96 77 69 62 104 Lowest -16 1 13 17 25 36 45 41 25 21 8 -5 -16
PRECIPITATION (inches)
Monthly Total 1.53 1.50 .48 .61 .17 .37 .08 .14 .17 1.05 .32 1.02 6.18
Departure from Normal .39 .17 -.50 -.20 -.91 -.30 -.22 -.22 -.51 .34 -.73 .09 -5.84 Greatest 24 Hour 1.06 .29 .21 .39 .09 .30 .04 .07 .10 .40 .27 .40 1.06
Ely Weather Station
TEMPERATURE (°F) Jan. Feb. Mar. Apr. May Jun. Jul. Aug. Sep. Oct. Nov. Dec. Year
Monthly Avg. 2007 19.1 27.1 34.5 39.7 48.1 59.8 69.3 69.4 56.8 44.8 36.4 21.6 43.9
Departure from Normal -6.1 -2.7 -1.4 -2.5 -2.3 -.1 1.9 3.6 0.1 -0.6 2.9 -4.2 -1.0 Highest 46 57 62 74 88 92 94 93 91 76 70 65 94 Lowest -11 -13 9 7 13 24 43 42 20 10 1 -11 -13
PRECIPITATION (inches)
Monthly Total .68 .60 .14 .01 .44 .33 .94 .59 .59 .63 Trace .68 5.63 Departure from Normal -.06 -.15 -.91 -.89 -.85 -.33 .34 -.32 -.35 -.37 -.63 .18 -4.34 Greatest 24 Hour .16 .27 .11 .01 .29 .32 .61 .43 .46 .56 Trace .52 .61
Las Vegas Weather Station
TEMPERATURE (°F) Jan. Feb. Mar. Apr. May Jun. Jul. Aug. Sep. Oct. Nov. Dec. Year
Monthly Avg. 2007 46.0 54.6 64.4 70.5 80.4 89.5 95.4 76.7 82.7 69.8 60.8 45.2 69.6
Departure from Normal -.1 2.4 6.1 4.5 5.0 3.9 4.2 1.7 -0.7 1.1 5.8 -1.8 2.6 Highest 68 74 91 98 99 109 116 110 107 92 84 67 116 Lowest 23 34 35 48 57 63 76 72 55 52 38 29 23
PRECIPITATION (inches)
Monthly Total .06 .16 Trace .08 Trace .00 .29 .45 .67 1.07 .64 .07 3.49 Departure from Normal -.53 -.53 -.59 -.07 -.24 -.08 -.15 .31 .36 -.01 .33 -.33 -1.53 Greatest 24 Hour .06 .14 Trace .08 Trace .00 .29 .58 .66 .00 .60 .07 .66
Reno Weather Station
TEMPERATURE (°F) Jan. Feb. Mar. Apr. May Jun. Jul. Aug. Sep. Oct. Nov. Dec. Year
Monthly Avg. 2007 31.2 41.1 49.4 53.0 63.4 72.4 80.0 76.2 63.6 52.5 44.3 34.8 55.1 Departure from Normal -2.4 2.6 6.1 4.4 7.0 7.7 8.7 6.3 1.2 0.5 3.4 0.4 3.8 Highest 60 69 80 86 92 97 108 99 98 83 72 68 108 Lowest 5 16 20 28 34 41 55 50 34 28 17 14 5
PRECIPITATION (inches)
Monthly Total .13 1.01 .03 .18 .16 .12 Trace .16 .44 .19 .25 1.06 3.73
Departure from Normal -.93 -.05 -.83 -.17 -.46 -.35 -.24 -.11 -.01 .23 -.55 .18 -3.46 Greatest 24 Hour .09 .52 .03 .14 .16 .07 Trace .16 .18 .16 .24 .94 .94
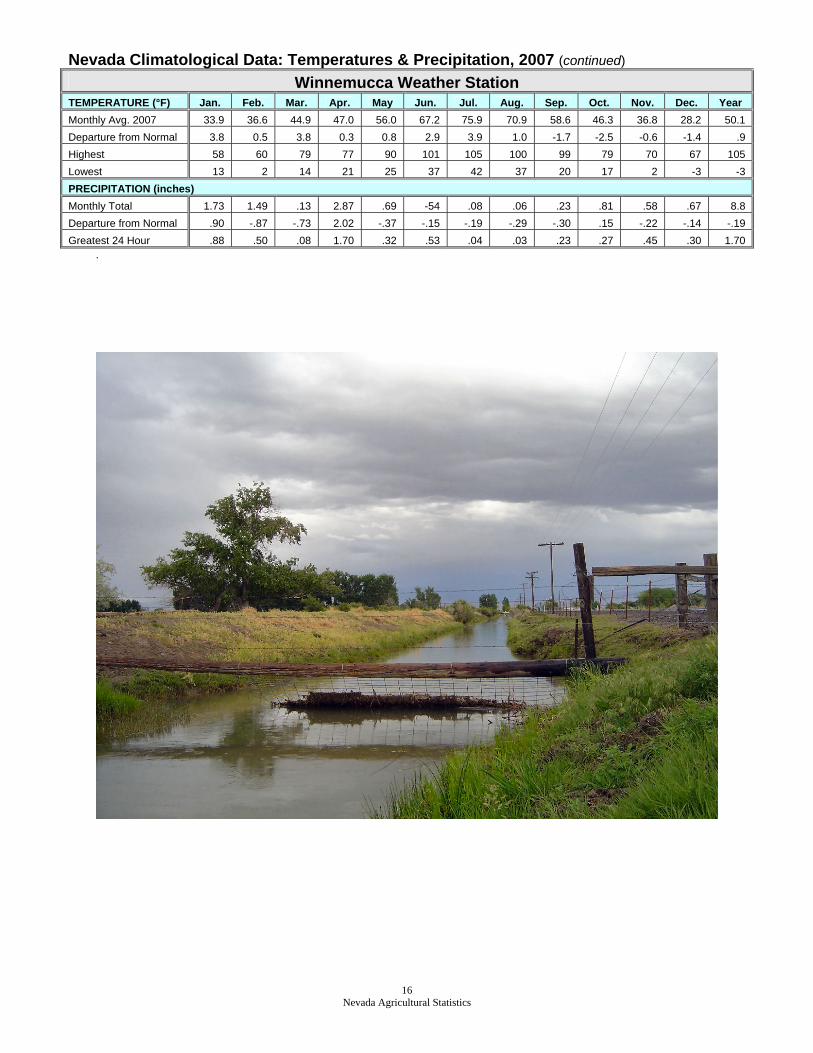
Nevada Climatological Data: Temperatures & Precipitation, 2007 (continued) Winnemucca Weather Station
TEMPERATURE (°F) Jan. Feb. Mar. Apr. May Jun. Jul. Aug. Sep. Oct. Nov. Dec. Year Monthly Avg. 2007 33.9 36.6 44.9 47.0 56.0 67.2 75.9 70.9 58.6 46.3 36.8 28.2 50.1 Departure from Normal 3.8 0.5 3.8 0.3 0.8 2.9 3.9 1.0 -1.7 -2.5 -0.6 -1.4 .9 Highest 58 60 79 77 90 101 105 100 99 79 70 67 105 Lowest 13 2 14 21 25 37 42 37 20 17 2 -3 -3 PRECIPITATION (inches) Monthly Total 1.73 1.49 .13 2.87 .69 -54 .08 .06 .23 .81 .58 .67 8.8 Departure from Normal .90 -.87 -.73 2.02 -.37 -.15 -.19 -.29 -.30 .15 -.22 -.14 -.19 Greatest 24 Hour .88 .50 .08 1.70 .32 .53 .04 .03 .23 .27 .45 .30 1.70
.
16 Nevada Agricultural Statistics

17 Nevada Agricultural Statistics
Record Highs and Lows In Nevada Agricultural Production Record High Record Low Year Estimate
Item Unit Quantity Year Quantity Year Series Began Winter Wheat: Harvested Acres 19,000 1974 1,000 1932 1909 Yield Bushels 110.00 2004, 05, 06 19.70 1919, 1936 1909 Production Bushels 1,400,000 1997 23,000 1932 1909 Spring Wheat: Harvested Acres 19,000 1919 1,000 2001, 2007 1909 Yield Bushels 105.00 2004 20.00 1921, 1936 1909 Production Bushels 1,200,000 1984 80,000 2001 1909 All Wheat: Harvested Acres 31,000 1976, 1981 3,000 1881, 2001 1870 Yield Bushels 106.70 2004 18.00 1875 1870 Production Bushels 1,890,000 1982 68,000 1881 1859 Barley: Harvested Acres 32,000 1982 1,000 2001, 2007 1870 Yield Bushels 110.00 1982 23.00 1877 1870 Production Bushels 256,000 1982 85,000 2005 1870 Alfalfa Hay: Harvested Acres 275,000 2002 98,000 1947 1909 Yield Tons 5.10 2006 1.80 1931 1909 Production Tons 1,377,000 2006 234,000 1931 1909 All Other Hay: Harvested Acres 310,000 1970 150,000 1992 1969 Yield Tons 1.90 2005, 06, 07 1.05 1975 1969 Production Tons 428,000 1982 188,000 1992 1969 All Hay: Harvested Acres 530,000 1983 206,000 1931 1909 Yield Tons 3.74 2006 1.33 1943 1909 Production Tons 1,757,000 2006 302,000 1931 1909 Alfalfa Seed: Harvested Acres 23,500 1970 1,000 1960 1959 Yield Pounds 900.00 1990 200.00 1962 1959 Production Pounds 14,400,000 1990 300,000 1960 1959 Potatoes: Harvested Acres 17,000 1978 500 1968 1879 Yield Cwt. 450.00 2000 60.00 1931 1979 Production Cwt. 5,440,000 1978 88,000 1889 1879 All Cattle: January 1st Head 700,000 1982 36,000 1867 1867 All Sheep: January 1st Head 1,330,000 1920 24,000 1867 1867 All Hogs:
December 1st Head 34,000 1916 3,000 1867, 1868 1867
Nevada Agricultural Statistics
18
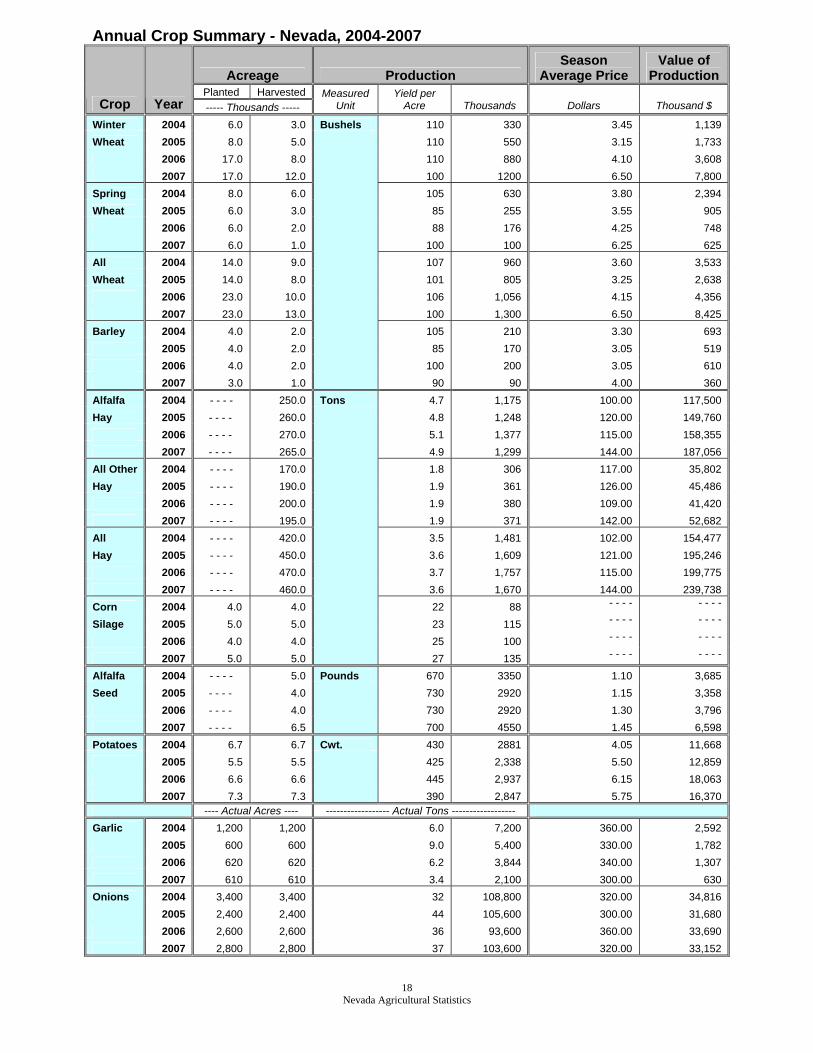
Annual Crop Summary - Nevada, 2004-2007
Acreage Production Season
Average Price Value of
Production Planted Harvested
Crop Year ----- Thousands ----- Measured
Unit Yield per
Acre Thousands Dollars Thousand $
Winter 2004 6.0 3.0 Bushels 110 330 3.45 1,139 Wheat 2005 8.0 5.0 110 550 3.15 1,733 2006 17.0 8.0 110 880 4.10 3,608 2007 17.0 12.0 100 1200 6.50 7,800 Spring 2004 8.0 6.0 105 630 3.80 2,394 Wheat 2005 6.0 3.0 85 255 3.55 905 2006 6.0 2.0 88 176 4.25 748 2007 6.0 1.0 100 100 6.25 625 All 2004 14.0 9.0 107 960 3.60 3,533 Wheat 2005 14.0 8.0 101 805 3.25 2,638 2006 23.0 10.0 106 1,056 4.15 4,356 2007 23.0 13.0 100 1,300 6.50 8,425 Barley 2004 4.0 2.0 105 210 3.30 693 2005 4.0 2.0 85 170 3.05 519 2006 4.0 2.0 100 200 3.05 610 2007 3.0 1.0
90 90 4.00 360 Alfalfa 2004 - - - - 250.0 Tons 4.7 1,175 100.00 117,500 Hay 2005 - - - - 260.0 4.8 1,248 120.00 149,760 2006 - - - - 270.0 5.1 1,377 115.00 158,355 2007 - - - - 265.0 4.9 1,299 144.00 187,056 All Other 2004 - - - - 170.0 1.8 306 117.00 35,802 Hay 2005 - - - - 190.0 1.9 361 126.00 45,486 2006 - - - - 200.0 1.9 380 109.00 41,420 2007 - - - - 195.0 1.9 371 142.00 52,682 All 2004 - - - - 420.0 3.5 1,481 102.00 154,477 Hay 2005 - - - - 450.0 3.6 1,609 121.00 195,246 2006 - - - - 470.0 3.7 1,757 115.00 199,775 2007 - - - - 460.0 3.6 1,670 144.00 239,738 Corn 2004 4.0 4.0 22 88 - - - - - - - -
Silage 2005 5.0 5.0 23 115 - - - - - - - -
2006 4.0 4.0 25 100 - - - - - - - -
2007 5.0 5.0
27 135 - - - - - - - -
Alfalfa 2004 - - - - 5.0 Pounds 670 3350 1.10 3,685 Seed 2005 - - - - 4.0 730 2920 1.15 3,358 2006 - - - - 4.0 730 2920 1.30 3,796 2007 - - - - 6.5
700 4550 1.45 6,598 Potatoes 2004 6.7 6.7 Cwt. 430 2881 4.05 11,668 2005 5.5 5.5 425 2,338 5.50 12,859 2006 6.6 6.6 445 2,937 6.15 18,063 2007 7.3 7.3 390 2,847 5.75 16,370 ---- Actual Acres ---- ------------------ Actual Tons ------------------ Garlic 2004 1,200 1,200 6.0 7,200 360.00 2,592 2005 600 600 9.0 5,400 330.00 1,782 2006 620 620 6.2 3,844 340.00 1,307 2007 610 610 3.4 2,100 300.00 630 Onions 2004 3,400 3,400 32 108,800 320.00 34,816 2005 2,400 2,400 44 105,600 300.00 31,680 2006 2,600 2,600 36 93,600 360.00 33,690 2007 2,800 2,800 37 103,600 320.00 33,152
Nevada Agricultural Statistics
19
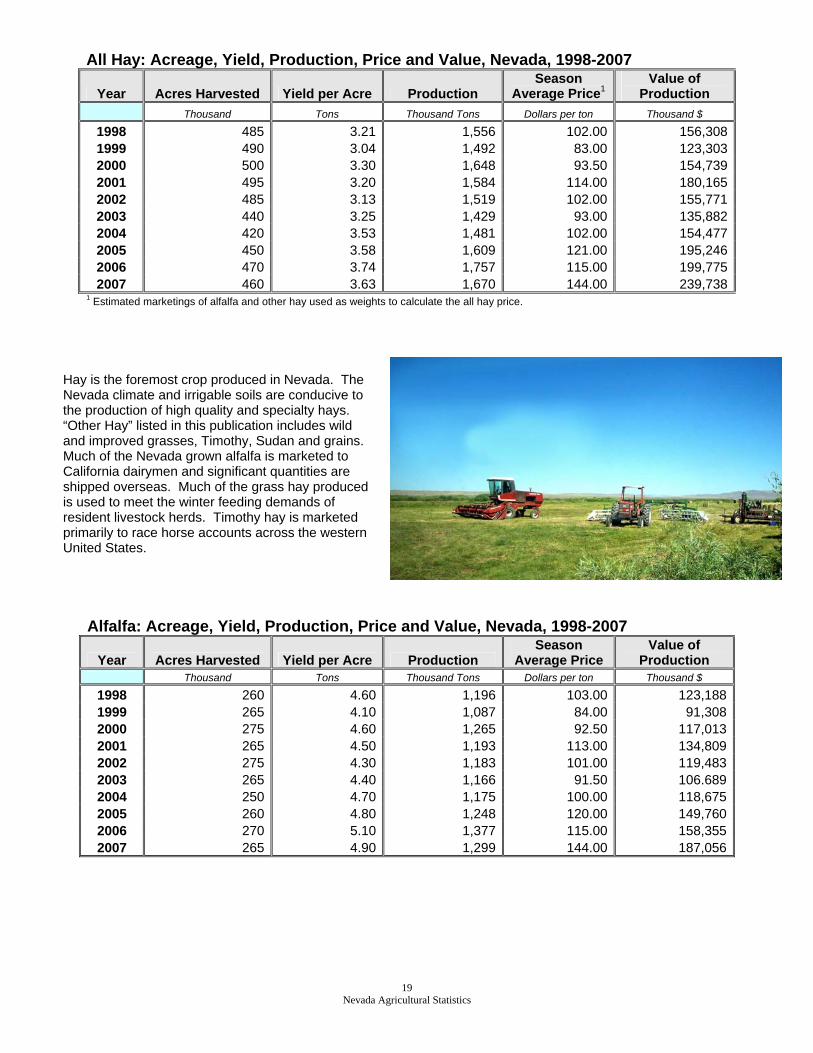
All Hay: Acreage, Yield, Production, Price and Value, Nevada, 1998-2007
Year Acres Harvested Yield per Acre Production Season
Average Price1 Value of
Production Thousand Tons Thousand Tons Dollars per ton Thousand $
1998 485 3.21 1,556 102.00 156,3081999 490 3.04 1,492 83.00 123,3032000 500 3.30 1,648 93.50 154,7392001 495 3.20 1,584 114.00 180,1652002 485 3.13 1,519 102.00 155,7712003 440 3.25 1,429 93.00 135,8822004 420 3.53 1,481 102.00 154,4772005 450 3.58 1,609 121.00 195,2462006 470 3.74 1,757 115.00 199,7752007 460 3.63 1,670 144.00 239,738
1 Estimated marketings of alfalfa and other hay used as weights to calculate the all hay price.
Hay is the foremost crop produced in Nevada. The Nevada climate and irrigable soils are conducive to the production of high quality and specialty hays. “Other Hay” listed in this publication includes wild and improved grasses, Timothy, Sudan and grains. Much of the Nevada grown alfalfa is marketed to California dairymen and significant quantities are shipped overseas. Much of the grass hay produced is used to meet the winter feeding demands of resident livestock herds. Timothy hay is marketed primarily to race horse accounts across the western United States.
Alfalfa: Acreage, Yield, Production, Price and Value, Nevada, 1998-2007
Year Acres Harvested Yield per Acre Production Season
Average Price Value of
Production Thousand Tons Thousand Tons Dollars per ton Thousand $
1998 260 4.60 1,196 103.00 123,1881999 265 4.10 1,087 84.00 91,3082000 275 4.60 1,265 92.50 117,0132001 265 4.50 1,193 113.00 134,8092002 275 4.30 1,183 101.00 119,4832003 265 4.40 1,166 91.50 106.6892004 250 4.70 1,175 100.00 118,6752005 260 4.80 1,248 120.00 149,7602006 270 5.10 1,377 115.00 158,3552007 265 4.90 1,299 144.00 187,056

Nevada Agricultural Statistics
20
All Other Hay: Acreage, Yield, Production, Price and Value, Nevada 1998-2007
Year Acres Harvested Yield per Acre Production Season
Average Price Value of
Production Thousand Tons Thousand Dollars per ton Thousand $
1998 225 1.60 360 92.00 33,1201999 225 1.80 405 79.00 31,9952000 225 1.70 383 98.50 37,7262001 230 1.70 391 116.00 45,3562002 210 1.60 336 108.00 36,2882003 175 1.50 263 111.00 29,1932004 170 1.80 306 117.00 35,8022005 190 1.90 361 126.00 45,4862006 200 1.90 380 109.00 41,4202007 195 1.90 371 142.00 52,682
0
100
200
300
400
500
600
700
800
900
1000
1999 2000 2001 2002 2003 2004 2005 2006 2007 2008
Thou
sand
tons
May 1 Dec 1
All Hay Stocks on Farms, Nevada,May 1 and December 1, 1999-2008
Hay: Stocks on Farms, Nevada, May 1 and December 1, 1999-2008
Year 1999 2000 2001 2002 2003 2004 2005 2006 2007 2008 ------------------------------------------------ Thousand Tons ------------------------------------------------ May 1 233 298 115 111 167 121 80 209 202 90December 1 970 824 776 882 857 741 788 879 767 n/a

Small Grain Hay: Acreage, Yield, Production, Price and Value, Nevada, 1998-2007 Year Acres Harvested Yield Production Season Average Price1 Value of Production
Tons/Acre Tons Dollars per ton Thousand $
1998 20,500 2.4 49,200 86.00 4,2311999 17,000 2.1 35,700 66.00 2,3562000 17,500 2.6 45,500 77.00 3,5042001 20,000 3.5 77,000 88.00 6,7762002 15,500 2.9 43,500 64.00 2,7842003 16,000 2.1 33,600 73.00 2,4562004 15,500 3.0 46,500 80.00 3,7202005 24,000 3.5 84,000 96.00 8,0642006 18,000 3.1 55,800 81.00 4,5202007 20,000 2.9 58,000 125.00 7,250
1 Based on limited sales as most small grain hay is fed where produced. Data were revised in 2005 to align crop year.
The majority of Nevada’s grain acreage is harvested for hay rather than grain. Wheat, barley, oats, rye and triticale are commonly cut and baled for cattle feed.
Small Grain Hay, 1998-2007
0
5,000
10,000
15,000
20,000
25,000
30,000
1998 1999 2000 2001 2002 2003 2004 2005 2006 2007
Year
Acr
eage
0
10,000
20,000
30,000
40,000
50,000
60,000
70,000
80,000
90,000Pr
oduc
tion
Acres Harvested Production
21 Nevada Agricultural Statistics

Nevada Agricultural Statistics
22
Hay: Acreage Harvested, Yield & Production, by Type and County, Nevada, 2006-2007
2006 Alfalfa Hay All Other Hay All Hay Acres Yield Production Acres Yield Production Production
County Tons/Acre Tons Tons/Acre Tons Tons
Carson City 1,000 6.0 6,000 400 2.5 1,000 7,000Churchill 28,000 5.2 146,000 4,000 4.0 16,000 162,000Douglas 6,000 4.5 27,000 7,000 2.9 20,000 47,000Humboldt 59,000 5.3 310,000 31,000 2.0 63,000 373,000Lyon 34,000 5.5 187,000 4,000 3.3 13,000 200,000Pershing 26,000 5.3 139,000 4,000 3.5 14,000 153,000Storey --------- --- ---------- ------- ---- -------- ---------Washoe 10,000 4.7 47,000 2,600 2.3 6,000 53,000
Northwest 164,000 5.3 862,000 53,000 2.5 133,000 995,000Elko 18,000 4.2 76,000 118,000 1.4 165,000 241,000Eureka 16,000 4.5 72,000 10,000 4.0 40,000 112,000Lander 21,000 5.0 105,000 8,000 1.9 15,000 120,000White Pine 15,000 4.3 64,000 5,000 1.8 9,000 73,000
Northeast 70,000 4.5 317,000 141,000 1.6 229,000 546,000Clark 3,000 7.0 21,000 500 4.0 2,000 23,000Esmeralda 8,000 4.8 38,000 1,000 5.0 5,000 43,000Lincoln 10,000 5.6 56,000 2,000 2.5 5,000 61,000Mineral 2,000 5.0 10,000 ------- ------- ------- 10,000Nye 13,000 5.6 73,000 2,500 2.4 6,000 79,000
South 36,000 5.5 198,000 6,000 3.0 18,000 216,000State 270,000 5.1 1,377,000 200,000 1.9 380,000 1,757,000
2007 Alfalfa Hay All Other Hay All Hay Acres Yield Production Acres Yield Production Production
County Tons/Acre Tons Tons/Acre Tons Tons
Carson City 1,000 6.0 5,000 500 2.0 1,000 6,000Churchill 25,000 5.4 134,000 2,500 3.2 8,000 142,000Douglas 10,000 4.3 43,000 4,500 2.0 9,000 52,000Humboldt 55,000 4.9 270,000 25,500 2.0 50,000 320,000Lyon 37,000 5.3 195,000 5,000 3.6 18,000 213,000Pershing 28,000 5.2 145,000 5,500 3.3 18,000 163,000Storey --------- ---- -------- ------- ---- -------- ---------Washoe 5,000 4.2 21,000 8,000 2.0 8,000 29,000
Northwest 161,000 5.0 813,000 47,000 2.4 112,000 925,000Elko 13,000 3.5 45,000 125,000 1.5 190,000 235,000Eureka 16,000 4.6 74,000 9,500 3.5 33,000 107,000Lander 28,000 4.8 135,000 5,000 2.6 13,000 148,000White Pine 11,000 3.6 40,000 2,500 2.0 5,000 45,000
Northeast 68,000 4.3 294,000 142,000 1.7 241,000 535,000Clark 2,000 7.0 14,000 500 6.0 3,000 17,000Esmeralda 12,000 4.8 58,000 500 4.0 2,000 60,000Lincoln 12,000 5.4 65,000 3,000 2.7 8,000 73,000Mineral -------- ---- --------- ------- ------- -------- -------Nye 10,000 5.5 55,000 1,500 3.3 5,000 60,000
South 36,000 5.3 192,000 5,500 3.3 18,000 210,000State 265,000 4.9 1,299,000 195,000 1.9 371,000 1,670,000

Nevada Agricultural Statistics
23
Alfalfa Hay: Volume Trucked from Nevada to California, 1998-2007 Year Bales Cubes Total
--------------------------------------------- Tons ---------------------------------------------
1998 311,357 70,693 382,0501999 302,255 44,620 346,8752000 291,305 33,135 324,4402001 277,511 78,178 355,6892002 261,937 18,879 280,8162003 226,411 21,948 248,3592004 290,089 16,103 306,1922005 283,323 8,047 291,3702006 291,040 6,449 297,4892007 313,560 7,913 321,473
0
50,000
100,000
150,000
200,000
250,000
300,000
350,000
400,000
450,000
1998 1999 2000 2001 2002 2003 2004 2005 2006 2007Year
Tons
Bales Cubes
Alfalfa Trucked from Nevada to California, Bales & Cubes, 1998-2007

Nevada Agricultural Statistics
24
Alfalfa Seed: Acreage, Yield, Production, Price and Value, Nevada, 1998-2007 Production Value
Year Acres
Harvested Yield per Acre Total Season Average Price Value of Production Actual Acres Lbs. 1,000 Lbs. $ Per Lb. Thousand $'s
1998 13,000 620.0 8,370 1.37 11,4671999 13,000 690.0 8,970 1.35 12,1092000 14,000 765.0 11,093 1.25 13,8662001 9,500 660.0 6,270 1.25 7,8382002 6,000 550.0 3,300 1.20 3,9602003 4,500 680.0 3,060 1.12 3,4272004 5,000 670.0 3,350 1.10 3,6852005 4,000 730.0 2,920 1.15 3,3582006 4,000 730.0 2,920 1.30 3,7952007 6,500 700.0 4,550 1.45 6,598
Alfalfa Seed, Production & Value 1998-2007
0
2,000
4,000
6,000
8,000
10,000
12,000
1998 1999 2000 2001 2002 2003 2004 2005 2006 2007
Year
Thou
sand
s of
Pou
nds
0
2,000
4,000
6,000
8,000
10,000
12,000
14,000
16,000
Dol
lars
in T
hous
ands
Production Value of Production
New Seedings of Alfalfa & Alfalfa Mixtures, 1998-2007 Nevada United States
Year --------------------------------- Thousands of Acres -------------------------------
1998 28 3,549 1999 24 3,436 2000 33 3,065 2001 23 3,260 2002 22 3,282 2003 26 3,119 2004 17 2,793 2005 32 3,290 2006 24 3,184 2007 24 2,828

25 Nevada Agricultural Statistics
Winter Wheat: Acreage, Yield, Production, Price and Value, Nevada, 1998-2007 Acres Acres Yield Per Total Season Value of
Year Planted Harvested Acre Production Price Avg. Production ------------ Acres ------------ Bushels Thousand Bu. $ per Bu. Thousand $
1998 7,000 6,000 100 600 2.25 1,3501999 11,000 10,000 95 950 2.55 2,4232000 10,000 9,000 100 900 2.45 2,2052001 9,000 2,000 95 190 3.05 5802002 6,000 3,000 86 258 3.45 8902003 7,000 3,000 83 249 3.35 8342004 6,000 3,000 110 330 3.45 1,1392005 8,000 5,000 110 550 3.15 1,7332006 17,000 8,000 110 880 4.10 3,6082007 17,000 12,000 100 1,200 6.50 7,800
Winter Wheat: Acreage, Yield and Production, by County, Nevada, 2006-2007
County 2006 2007 Planted Harvested Yield Production Planted Harvested Yield Production
------------ Acres ------------ --------- Bushels ---------- ------------ Acres ------------ --------- Bushels ---------- Humboldt 5,100 4,600 116 535,000 6,300 6,200 102 630,000Pershing` 4,000 2,000 110 220,000 6,500 4,300 101 436,000Other Counties 5,100 1,200 85 17,000 3,300 1,500 89 134,000Northwest 14,200 7,800 111 863,000 16,100 12,000 100 1,200,000 Other Districts1 2,800 200 85 17,000 900 0 0 0
State 17,000 8,000 110 880,000 17,000 12,000 100 1,200,0001 Data Included in "Other Districts" to avoid disclosing individual information.
Winter Wheat, 1997-2007
0
2,000
4,000
6,000
8,000
10,000
12,000
14,000
16,000
18,000
1998 1999 2000 2001 2002 2003 2004 2005 2006 2007
Year
Acr
eage
0
20
40
60
80
100
120
Yiel
d (b
u/ac
re)
Acres Planted Acres Harvested Yield
Nevada Agricultural Statistics
26
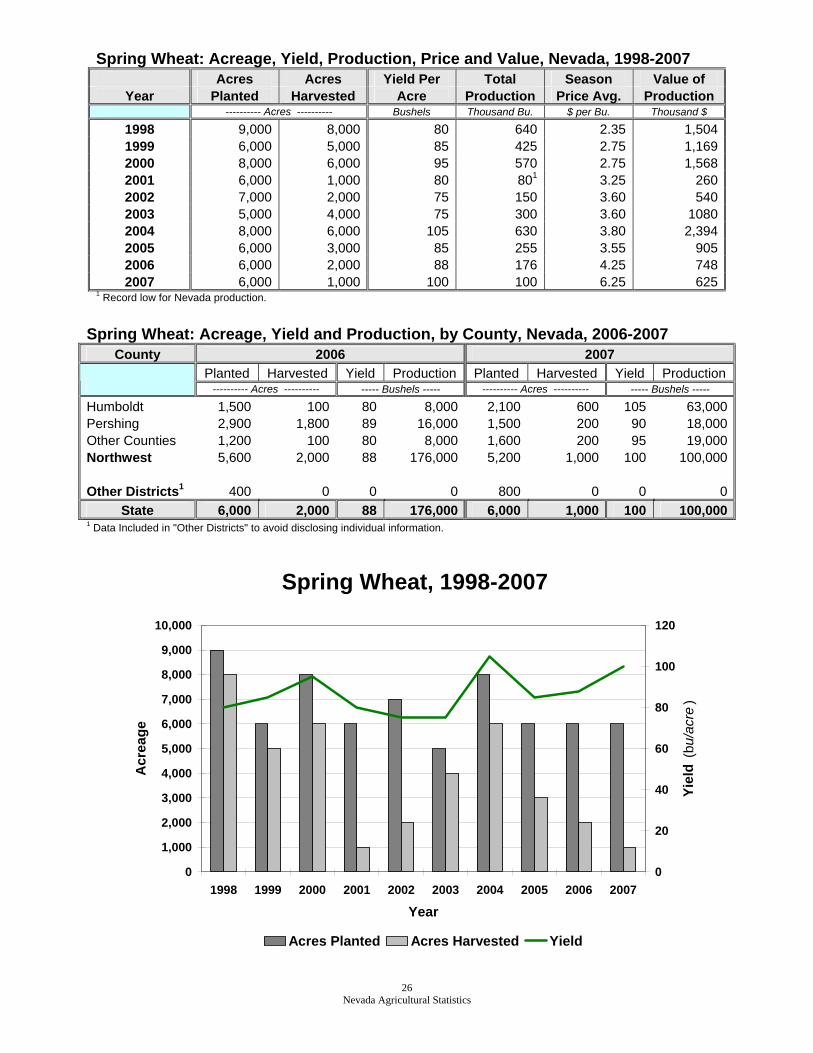
Spring Wheat: Acreage, Yield, Production, Price and Value, Nevada, 1998-2007 Acres Acres Yield Per Total Season Value of
Year Planted Harvested Acre Production Price Avg. Production ---------- Acres ---------- Bushels Thousand Bu. $ per Bu. Thousand $
1998 9,000 8,000 80 640 2.35 1,5041999 6,000 5,000 85 425 2.75 1,1692000 8,000 6,000 95 570 2.75 1,5682001 6,000 1,000 80 801 3.25 2602002 7,000 2,000 75 150 3.60 5402003 5,000 4,000 75 300 3.60 10802004 8,000 6,000 105 630 3.80 2,3942005 6,000 3,000 85 255 3.55 9052006 6,000 2,000 88 176 4.25 7482007 6,000 1,000 100 100 6.25 625
1 Record low for Nevada production.
Spring Wheat: Acreage, Yield and Production, by County, Nevada, 2006-2007 County 2006 2007
Planted Harvested Yield Production Planted Harvested Yield Production ---------- Acres ---------- ----- Bushels ----- ---------- Acres ---------- ----- Bushels -----
Humboldt 1,500 100 80 8,000 2,100 600 105 63,000Pershing 2,900 1,800 89 16,000 1,500 200 90 18,000Other Counties 1,200 100 80 8,000 1,600 200 95 19,000Northwest 5,600 2,000 88 176,000 5,200 1,000 100 100,000 Other Districts1 400 0 0 0 800 0 0 0
State 6,000 2,000 88 176,000 6,000 1,000 100 100,0001 Data Included in "Other Districts" to avoid disclosing individual information.
Spring Wheat, 1998-2007
0
1,000
2,000
3,000
4,000
5,000
6,000
7,000
8,000
9,000
10,000
1998 1999 2000 2001 2002 2003 2004 2005 2006 2007
Year
Acr
eage
0
20
40
60
80
100
120
Yiel
d (b
u/ac
re)
Acres Planted Acres Harvested Yield
Nevada Agricultural Statistics
27
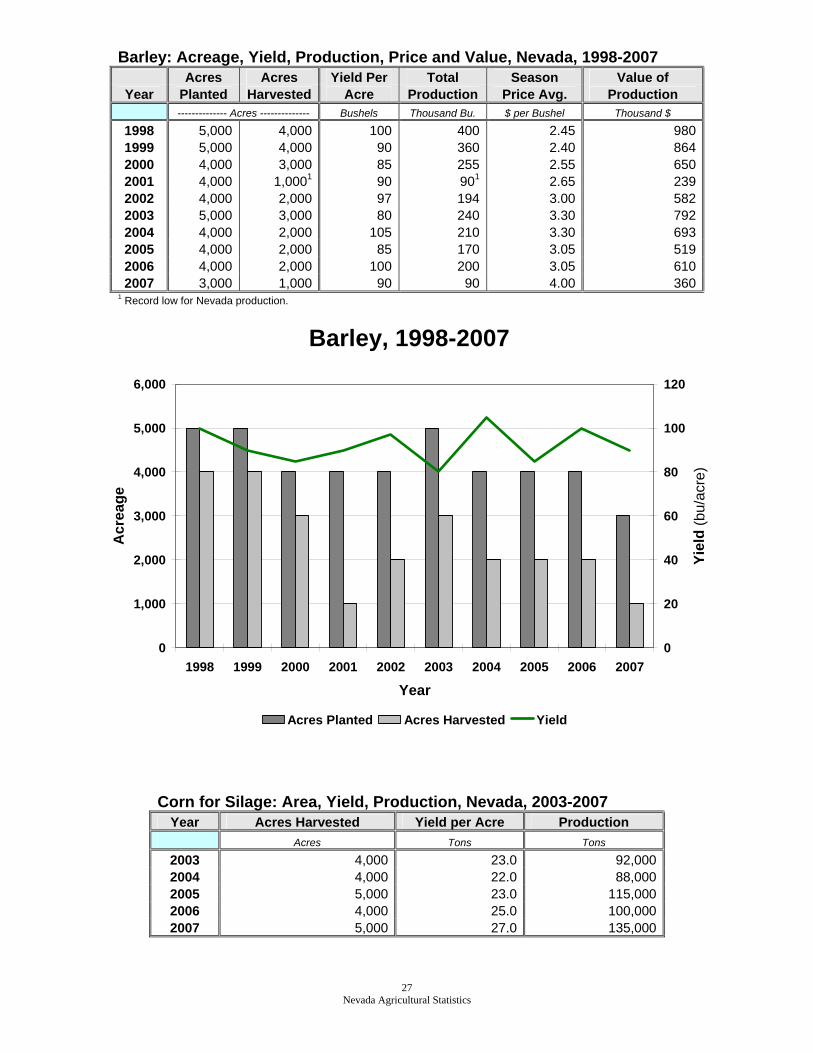
Barley: Acreage, Yield, Production, Price and Value, Nevada, 1998-2007 Acres Acres Yield Per Total Season Value of
Year Planted Harvested Acre Production Price Avg. Production -------------- Acres -------------- Bushels Thousand Bu. $ per Bushel Thousand $
1998 5,000 4,000 100 400 2.45 9801999 5,000 4,000 90 360 2.40 8642000 4,000 3,000 85 255 2.55 6502001 4,000 1,0001 90 901 2.65 2392002 4,000 2,000 97 194 3.00 5822003 5,000 3,000 80 240 3.30 7922004 4,000 2,000 105 210 3.30 6932005 4,000 2,000 85 170 3.05 5192006 4,000 2,000 100 200 3.05 6102007 3,000 1,000 90 90 4.00 360
1 Record low for Nevada production.
Barley, 1998-2007
0
1,000
2,000
3,000
4,000
5,000
6,000
1998 1999 2000 2001 2002 2003 2004 2005 2006 2007
Year
Acr
eage
0
20
40
60
80
100
120
Yiel
d (b
u/ac
re)
Acres Planted Acres Harvested Yield
Corn for Silage: Area, Yield, Production, Nevada, 2003-2007 Year Acres Harvested Yield per Acre Production
Acres Tons Tons
2003 4,000 23.0 92,0002004 4,000 22.0 88,0002005 5,000 23.0 115,0002006 4,000 25.0 100,0002007 5,000 27.0 135,000

28 Nevada Agricultural Statistics
Potatoes: Acreage, Yield, Production, Price and Value, Nevada, 1998-2007
Year Acres
Planted Acres
Harvested Yield per
Acre Production Season
Average Price Value of
Production ------------ Actual Acres ------------ Cwt. Thousand Cwt. $ Per Cwt. Thousand $
1998 7,000 7,000 400 2,800 4.25 11,9001999 6,500 6,500 440 2,860 4.80 13,7282000 7,000 7,000 450 3,150 3.70 11,6552001 6,500 6,500 360 2,340 6.55 15,3272002 7,600 7,600 350 2,660 4.55 12,1032003 8,300 8,000 415 3,320 4.25 14,1102004 6,700 6,700 430 2,881 4.05 11,6682005 5,500 5,500 425 2,338 5.50 12,8592006 6,600 6,600 445 2,937 6.15 18,0632007 7,300 7,300 390 2,847 5.75 16,370
Potatoes: Production & Value, 1998-2007
0
500
1,000
1,500
2,000
2,500
3,000
3,500
1998 1999 2000 2001 2002 2003 2004 2005 2006 2007
Year
Thou
sand
Cw
t.
0
2,000
4,000
6,000
8,000
10,000
12,000
14,000
16,000
18,000
20,000
Dol
lars
in T
hous
ands
Production Value
All Mint: Acreage, Production, Price, And Value, Nevada 2001-2007
Year Acres
Harvested Yield per
Acre Production Season Average
Value of Production
Actual Acres --------------- Pounds --------------- $ per Pound Thousand $
2001 1,800 80 144,200 11.00 1,5842002 2,000 78 156,000 11.00 1,7162003 2,000 98 201,000 12.00 2,4702004 2,300 90 207,000 13.00 2,6912005 2,800 84 235,200 12.40 2,9162006 2,600 95 247,000 12.90 3,1862007 1,500 87 130,500 13.40 1,749

Nevada Agricultural Statistics
29
Onions: Acreage, Yield, Production, Price and Value, Nevada, 1998-2007
Year Acres
Planted Acres
Harvested Yield per
Acre Production Season
Average Price Value of
Production Acres Acres Tons Tons $ Per Ton Thousand $
1998 2,100 2,100 22 46,200 280.00 12,9361999 3,200 2,800 28 78,400 170.00 13,3282000 3,300 3,300 23 75,900 310.00 23,5292001 2,900 2,900 23 66,700 240.00 16,0082002 3,300 3,300 28 92,400 260.00 24,0242003 3,100 3,100 30 93,000 320.00 29,7602004 3,400 3,400 32 108,800 320.00 34,8162005 2,400 2,400 44 105,600 300.00 31,6802006 2,600 2,600 36 93,600 360.00 33,6962007 2,800 2,800 37 103,600 320.00 33,152
Nevada onions are produced primarily for fresh market use. Nevada grown garlic is used primarily for seed, although some is also dehydrated. Most of the acreage planted to these crops is located in Lyon county.
Garlic: Acreage, Yield, Production, Price and Value, Nevada, 1998-2007
Year Acres
Planted Acres
Harvested Yield per
Acre Production Season
Average Price Value of
Production Acres Acres Tons Tons $ Per Ton Thousand $
1998 2,300 2,300 7.2 16,560 320.00 5,1341999 2,600 2,600 7.5 16,900 300.00 5,0702000 2,300 2,200 7.5 16,500 340.00 5,6102001 1,400 1,400 6.2 8,680 340.00 2,9582002 1,100 1,100 8.5 9,350 400.00 3,7402003 1,200 1,200 7.6 9,120 420.00 3,8302004 1,200 1,200 6.0 7,200 360.00 2,5922005 600 600 9.0 5,400 330.00 1,7822006 620 620 6.2 3,844 340.00 1,3072007 610 610 3.4 2,100 300.00 630

Nevada Agricultural Statistics
30
Livestock in Nevada Over 80 percent of the land area in Nevada is federally controlled public land. Much of this area is arid rangeland with limited potential for use. The grazing of range livestock has historically been and continues to be the most efficient means of harvesting rangeland grasses, a renewable resource. Cattle are the most common agricultural enterprise in Nevada and can be found on over half of the farms and ranches in the state. Sheep numbers have trended downward for several decades, but they remain a viable alternative on many ranges.
Cattle and Calves: Inventory, January 1, 2007-20081 Nevada United States
Class of Livestock 2007 2008 ‘08 as % of ‘07 2007 2008 ‘08 as % of ‘07 1,000 Head 1,000 Head Percent 1,000 Head 1,000 Head Percent
All Cattle and Calves 500 450 90 97,003 96,669 100All Cows that have calved 260 245 94 42,023 41,777 99 Beef Cows 233 218 94 32,891 32,553 99 Milk Cows 27 27 100 9,132 9,224 101Heifers 500 Lbs. + 83 72 87 20,086 20,003 100 Beef Replacement 41 37 90 5,877 5,670 96 Milk Replacement 13 12 92 4,310 4,457 103 Other Heifers 29 23 79 9,899 9,876 100Steers 500 Lbs. + 54 37 69 17,222 17,305 100Bulls 500 Lbs. + 15 14 93 2,215 2,207 100Calves Under 500 Lbs. 88 82 97 15,456 15,378 99Inventory Value (1,000$) 490,000 454,500 93 89,446,602 95,401,289 107Value Per Head ($’s) 980 1010 1033 922 987 1071 Sum of classes may not add to total due to rounding.
Cattle and Calves: Inventory, Supply and Disposition, Nevada, 1998-2007 Cattle Marketings Deaths
Year Jan.1 All Calves Born Inshipments Cattle Calves Farm
Slaughter Cattle Calves ---------------------------------------------------------------------------1,000 Head---------------------------------------------------------------------------
1998 510 220 50 148 101 2 6 131999 510 230 55 153 101 2 6 132000 520 230 55 163 101 2 6 132001 520 225 67 200 91 2 6 132002 500 220 57 170 76 2 6 132003 510 235 58 172 100 2 6 132004 510 210 78 187 90 2 6 132005 500 210 73 173 89 2 6 132006 500 205 70 168 87 2 6 132007 500 195 61 196 90 2 6 12

Nevada Agricultural Statistics
31
Cattle and Calves: Production and Income, Nevada, 1998-2007
Year Production Marketings Value of
Production Cash
Receipts1 Value of Home Consumption
Gross Income
---------- Thousand Lbs. ---------- ---------------------------------------- Thousand $ ----------------------------------------
1998 153,700 187,000 94,333 114,870 1,762 116,6321999 168,600 192,000 117,250 134,456 2,010 136,4662000 170,550 202,000 141,061 167,758 2,414 170,1722001 176,140 235,000 146,911 192,470 2,412 194,8822002 171,090 119,000 123,866 142,471 2,097 144,5682003 171,335 210,600 151,734 182,691 2,514 185,2052004 163,310 221,600 159,252 211,140 2,796 213,9362005 160,885 207,200 166,197 209,560 2,972 212,5322006 152,950 200,900 149,609 191,807 2,772 194,5792007 149,910 230,600 136,821 212,921 2,710 215,631
1 Receipts from marketings and sale of farm slaughter.
Cattle & Calves: January 1 Inventory by County, Nevada, 2004-2008 County & District 2004 2005 2006 2007 2008
------------------------------------------- Number of head ---------------------------------------------
Carson City 800 900 400 900 900Churchill 47,000 46,000 47,000 44,000 45,000Douglas 15,000 16,000 18,000 16,000 14,000Humboldt 63,000 64,000 65,000 64,000 56,000Lyon 38,000 39,000 39,500 39,000 40,000Pershing 23,000 21,000 23,000 21,000 18,000Storey 200 100 100 100 100Washoe 26,000 24,000 22,000 24,000 19,000
Northwest 214,000 211,000 215,000 209,000 193,000Elko 155,000 150,000 152,000 150,000 133,000Eureka 19,000 18,000 16,000 18,000 15,000Lander 31,000 33,000 34,000 32,000 32,000White Pine 27,000 27,000 26,000 27,000 23,000
Northeast 232,000 228,000 228,000 227,000 203,000Clark 9,000 8,000 4,000 8,000 5,000Esmeralda 7,000 6,000 4,000 6,000 3,000Lincoln 15,000 14,000 12,000 14,000 15,000Mineral 2,000 1,000 1,000 1,000 1,000Nye 31,000 32,000 36,000 35,000 30,000
South 64,000 61,000 57,000 64,000 54,000State 510,000 500,000 500,000 500,000 450,000
Cattle & Calves: Number on Feed for Slaughter Market, 2004-2008
Item 2004 2005 2006 2007 2008 `08 as % of `07 ----------------------- Thousand Head ----------------------- Percent Number on Feed for Slaughter Market 13 10 8 8 7 88
32 Nevada Agricultural Statistics
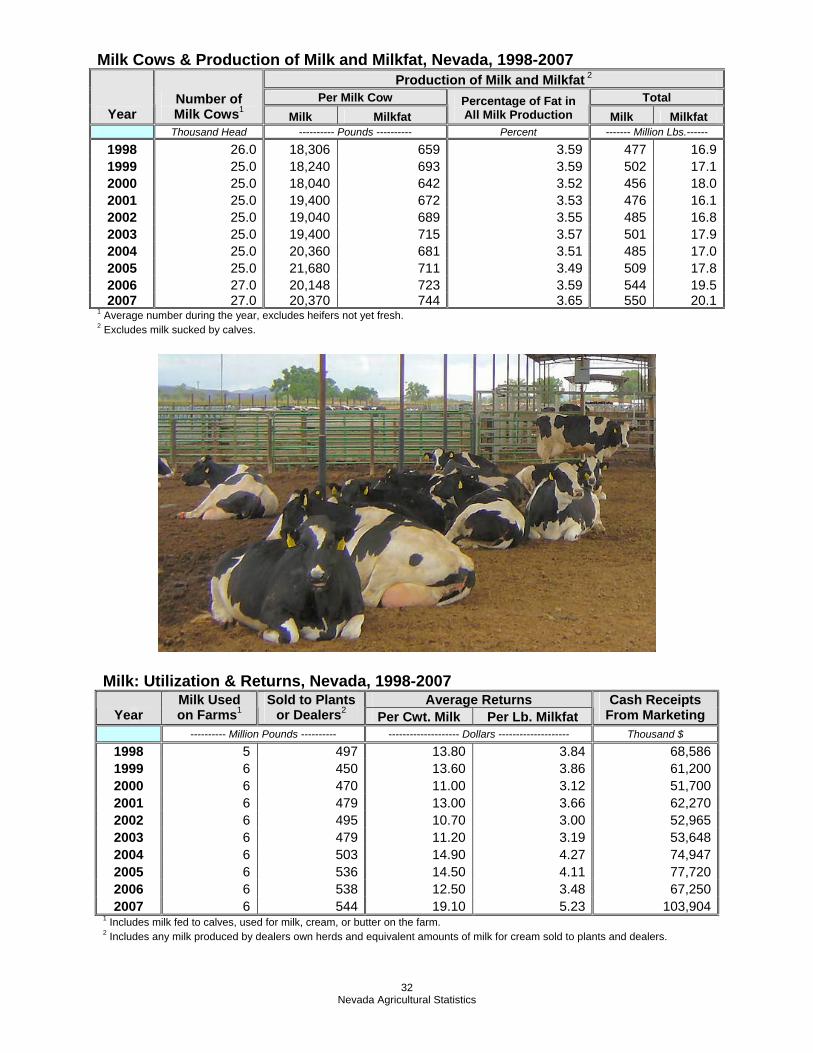
Milk Cows & Production of Milk and Milkfat, Nevada, 1998-2007 Production of Milk and Milkfat 2
Per Milk Cow Total Year
Number of Milk Cows1 Milk Milkfat
Percentage of Fat in All Milk Production Milk Milkfat
Thousand Head ---------- Pounds ---------- Percent ------- Million Lbs.------
1998 26.0 18,306 659 3.59 477 16.91999 25.0 18,240 693 3.59 502 17.12000 25.0 18,040 642 3.52 456 18.02001 25.0 19,400 672 3.53 476 16.12002 25.0 19,040 689 3.55 485 16.82003 25.0 19,400 715 3.57 501 17.92004 25.0 20,360 681 3.51 485 17.02005 25.0 21,680 711 3.49 509 17.82006 27.0 20,148 723 3.59 544 19.52007 27.0 20,370 744 3.65 550 20.1
1 Average number during the year, excludes heifers not yet fresh. 2 Excludes milk sucked by calves.
Milk: Utilization & Returns, Nevada, 1998-2007 Average Returns
Year Milk Used on Farms1
Sold to Plants or Dealers2 Per Cwt. Milk Per Lb. Milkfat
Cash Receipts From Marketing
---------- Million Pounds ---------- -------------------- Dollars -------------------- Thousand $
1998 5 497 13.80 3.84 68,5861999 6 450 13.60 3.86 61,2002000 6 470 11.00 3.12 51,7002001 6 479 13.00 3.66 62,2702002 6 495 10.70 3.00 52,9652003 6 479 11.20 3.19 53,6482004 6 503 14.90 4.27 74,9472005 6 536 14.50 4.11 77,7202006 6 538 12.50 3.48 67,2502007 6 544 19.10 5.23 103,904
1 Includes milk fed to calves, used for milk, cream, or butter on the farm. 2 Includes any milk produced by dealers own herds and equivalent amounts of milk for cream sold to plants and dealers.

Nevada Agricultural Statistics
33
Milk: Cows Milked, Production per Cow, Total Production, by Quarter, Nevada, 2005-2007 Cows Milked1 Milk Per Cow2 Milk Production2
Quarter 2005 2006 2007 2005 2006 2007 2005 2006 2007 --------------- Thousand head --------------- -------------------- Lbs. -------------------- --------------- Millions Lbs. ---------------
Jan. - Mar. 25.0 27.0 27.0 5,120 5,000 5,190 128.0 135.0 139.0Apr. - Jun. 25.0 27.0 27.0 5,480 5,000 5,190 137.0 135.0 135.0Jul. - Sept. 25.0 27.0 27.0 5,480 5,040 5,150 137.0 136.0 138.0Oct. - Dec. 25.0 27.0 27.0 5,380 5,100 5,150 140.0 138.0 138.0
Annual 25.3 27.0 27.0 21,680 20,148 20,370 542.0 544.0 550.01 Excludes heifers not yet fresh. 2 Excludes milk sucked by calves.
Milk Cows and Production: By County, Nevada, 2006-20071
2006 2007 County Milk Cows Milk per Cow Milk Production Milk Cows Milk per Cow Milk Production
Head Lbs. Million Lbs. Head Lbs. Million Lbs.
Churchill 11,900 20,400 243.0 12,300 20,600 253.0Nye 12,700 20,100 255.0 12,700 20,400 259.0All Other 2,400 19,200 46.0 1,000 19,000 38.0
State 27,000 20,148 544.0 27,000 20,370 550.01 Totals may not add due to rounding.

Nevada Agricultural Statistics
34
Sheep and Lambs: Inventory, January 1, 2007-20081 Nevada United States
Class of Livestock 2007 2008 `08 as % of `07 2007 2008
`08 as % of `07
Thousand head Percent Thousand head Percent
All Sheep and Lambs 75 70 93 6,165 6,055 98 All Market Sheep & Lambs 10 12 120 1,555 1,550 97 Market Sheep 1 1 100 89 80 90 Market Lambs 9 11 122 1,466 1,470 100 All Breeding Sheep & Lambs 65 58 89 4,610 4,505 98 Breeding Ewes 1 year & older 53 47 89 3,696 3,617 98 Breeding Rams 1 year & older 2 2 100 195 193 99 Breeding Replacement Lambs 10 9 90 719 695 97Inventory Value (Thousand $) 10,125 9,800 97 823,846 836,092 101Value Per Head ($) 135 140 104 134 138 1031 Sum of classes may not add to total due to rounding.
Sheep and Lambs: Inventory, Supply and Disposition, Nevada, 1998-2007
Marketings Deaths Year
Sheep & Lambs on Jan.1
Lamb Crop Inshipments Sheep Lambs
Farm Slaughter Sheep Lambs
----------------------------------------------------------------------Thousand Head-------------------------------------------------------------
1998 88 57 21.0 16.0 45.0 1.0 7 121999 85 58 32.0 11.0 53.0 1.0 7 132000 90 65 32.0 3.0 65.0 1.0 8 152001 95 63 18.0 7.0 45.0 1.0 8 152002 90 54 18.0 13.5 44.0 1.5 8 152003 80 60 18.0 10.5 50.0 1.5 7 142004 75 56 15.5 5.5 51.5 1.5 6 122005 70 52 16.9 9.4 36.0 1.5 6 122006 74 52 15.6 4.2 41.9 1.5 6 132007 75 47 11.5 11.5 32.0 1.0 6 13

Nevada Agricultural Statistics
35
Sheep and Lambs: Production and Income, Nevada, 1998-2007
Year Production Marketings Value of
Production Cash
Receipts1 Value of Home Consumption
Gross Income
---------- Thousand Lbs. ---------- ------------------------------------------ Thousand $ ------------------------------------------
1998 2,600 4,860 1,583 2,861 117 2,9781999 3,080 5,190 2,022 3,271 119 3,3902000 3,860 5,650 2,189 3,997 123 4,1202001 3,130 4,230 2,045 2,681 115 2,7962002 1,738 4,600 1,444 2,889 155 3,0442003 2,975 5,180 2,512 4,021 182 4,2032004 3,058 4,700 2,822 4,210 257 4,4672005 2,673 3,928 2,971 3,671 288 3,9592006 2,760 3,776 2,225 3,287 240 3,5272007 2,515 4,285 2,304 3,251 222 3,473
1 Receipts from marketings and sale of farm slaughter.
Sheep and Lambs: Inventory, January 1, by County, Nevada, 2004-2008 County & District 2004 2005 2006 2007 2008
----------------------------------------------------------- Actual Numbers ----------------------------------------------------------
Douglas 600 500 400 500 1,500Humboldt 8,600 8,300 4,500 5,000 3,000Lyon 12,700 12,200 12,500 13,000 12,000Pershing 5,500 5,000 5,100 6,000 7,000Washoe 4,900 4,500 6,000 6,500 7,000Other Counties 700 500 2,300 2,000 100 Northwest 33,000 31,000 30,800 33,000 33,600Elko 18,700 18,000 19,700 20,000 13,000Eureka 400 400 500 300 600Lander 2,300 2,200 2,500 2,200 2,900White Pine 18,600 17,400 18,700 18,500 18,500 Northeast 40,000 38,000 41,400 41,000 35,000 South 2,000 1,000 1,800 1,000 1,400
State 75,000 70,000 74,000 75,000 70,000 Wool Production and Value: Nevada, 1998-2007 Year Sheep Shorn Weight per Fleece Wool Production Price per Pound Value
Thousand Head Lbs. Thousand Lbs. Dollars Thousand $
1998 67 9.1 607 0.58 3521999 74 9.1 670 0.33 2212000 72 9.1 655 0.28 1832001 71 8.7 620 0.44 2732002 65 9.1 590 0.85 5022003 55 8.4 460 0.95 4372004 55 9.3 510 0.94 4792005 54 9.3 500 0.87 4352006 56 9.3 520 0.81 4212007 51 9.7 495 1.10 545

Nevada Agricultural Statistics
36
Hogs and Pigs: Inventory, December 1, 2006-20071 Class of Livestock Nevada United States
2006 2007 `07 as a % of `06 2006 2007
`07 as a % of `06
------ Thousand Head ------ Pct. -------- Thousand Head -------- Pct.
All Hogs and Pigs 3.5 3.0 86 62,490 65,110 104 Breeding 0.4 0.4 100 6,087 6,157 101 Market 3.1 2.6 84 56,402 58,953 105Inventory Value (1,000 $) 420 297 71 5,585,812 4,916,591 88Value Per Head ($) 120 99 83 89 73 821 Sum of classes may not add to total due to rounding.
Hogs and Pigs: Inventory, Supply and Disposition, Nevada, 1998-2007 Hogs & Pigs Pig Crop
Year Dec.11 Dec-Nov1 Inshipments Farm
Marketings Farm
Slaughter Deaths ------------------------------------------------------------ Actual Number ------------------------------------------------------------
1998 7,500 20,000 3,000 12,200 300 1,0001999 7,500 1,000 4,000 12,000 300 5002000 7,500 9,800 8,500 17,500 300 4002001 7,500 6,600 3,000 9,300 300 5002002 6,500 6,600 3,500 10,300 300 5002003 5,500 5,200 4,000 8,500 300 4002004 5,500 6,000 5,000 10,300 300 4002005 5,500 4,920 6,600 12,300 300 4002006 4,000 4,620 5,000 9,400 300 4002007 3,500 4,230 9,500 13,900 300 400
1 Inventory as of December 1st of the preceding year.
Hogs and Pigs: Production and Income, Nevada, 1998-2007
Year Production Marketings Value of
Production Cash
Receipts1 Value Home
Consumption Gross
Income ---------- Thousand Lbs. ---------- ------------------------------------- Thousand $ -------------------------------------
1998 2,698 2,755 800 821 21 8421999 2,709 2,876 945 982 23 1,0052000 3,440 3,888 1,359 1,524 26 1,5552001 1,885 2,043 791 849 28 8772002 2,002 2,365 665 752 22 7742003 1,773 1,895 631 677 26 703 2004 2,105 2,283 958 1,046 33 1,0792005 2,229 2,714 1,029 1,265 34 1,2992006 2,007 2,196 834 910 51 9612007 2,833 3,228 1,217 1,431 53 1,484
1 Receipts from marketings and sale of farm slaughter.
Goats: Inventory, All Categories, January 1, 2007-2008 Nevada United States Class of Livestock
2007 2008 `08 as % of `07 2007 2008 `08 as % of `07 Angora Goats (D) (D) - - - 238,000 210,000 88Milk Goats 2,700 3,300 122 246,000 305,000 104Meat and Other goats 3,900 3,350 86 2,402,000 2,500,000 104(D) Withheld to avoid disclosing data for individual operations.
Grazing Fee Rates for Cattle by State and Region, 2005-2007
Survey Average Rates1 (dollars) Animal Unit2 Cow-Calf Per Head
State/Region 2005 2006 2007 2005 2006 2007 2005 2006 2007 Arizona 8.00 8.00 8.00 3 3 3 9.50 10.00 10.00 California 15.40 16.50 16.50 20.50 21.00 21.5 17.00 17.00 17.3 Colorado 14.50 14.50 15.00 16.00 16.00 16.70 14.30 15.00 15.10Idaho 12.50 12.80 13.80 14.60 15.00 16.50 13.00 13.50 14.60 Montana 16.20 16.20 17.80 18.70 18.70 20.10 17.30 18.30 19.20
Nevada 12.20 13.00 13.00 12.50 13.50 14.00 12.50 13.00 13.50 New Mexico 9.50 10.00 11.00 11.50 12.00 13.00 10.80 11.50 12.00 Oregon 13.00 12.50 14.20 15.70 15.00 17.00 12.80 12.80 13.00 Utah 11.60 11.70 12.90 13.60 14.60 14.60 13.00 13.50 14.20 Washington 10.80 9.70 12.10 12.50 12.00 13.70 12.20 12.20 12.20 Wyoming 14.80 15.10 15.40 17.00 17.30 17.90 15.50 15.80 16.10
Western States Avg. 13.70 13.90 14.90 16.20 16.40 17.40 14.60 15.10 15.60 1 The average rates are estimates based on survey indications of monthly lease rates for private, non-irrigated grazing land from the January Cattle Survey. 2 Includes animal unit plus Cow-Calf rate converted to animal unit (AUM) using (1 AUM=Cow-Calf*.833). 3 Insufficient data.
37 Nevada Agricultural Statistics

Nevada Agricultural Statistics
38
Honey: Production and Value, Nevada, 1998-2007
Year Colonies of Bees
Yield per Colony
Total Production
Average Price per Pound
Value of Production
Honey Stocks Dec.
Thousand Lbs. Thousand Lbs. Cents Thousand $ Thousand Lbs. 1998 10 46 460 165 759 1751999 9 45 405 154 624 2712000 10 35 350 145 508 952001 9 50 450 214 963 362002 9 62 558 227 1,267 612003 6 64 384 241 927 462004 14 55 770 247 1,902 3162005 12 46 552 311 1,717 4422006 9 37 333 362 1,205 502007 10 28 280 360 1,008 67
Honey Bee Colonies and Yield, 1998-2007
0
5
10
15
20
25
1998 1999 2000 2001 2002 2003 2004 2005 2006 2007
Year
Col
onie
s (th
ousa
nds
)
0
10
20
30
40
50
60
70
80
90
100
Yiel
d (P
ound
s)
Number of Colonies Yield per Colony
Honey Production and Prices, 1998-2007
0
100
200
300
400
500
600
700
800
900
1000
1998 1999 2000 2001 2002 2003 2004 2005 2006 2007Year
Prod
uctio
n (1
,000
's o
f Lb
s.)
0
50
100
150
200
250
300
350
400
450
500
Pric
e pe
r Pou
nd
(Cen
ts)
Total Production Price per Pound
39 Nevada Agricultural Statistics
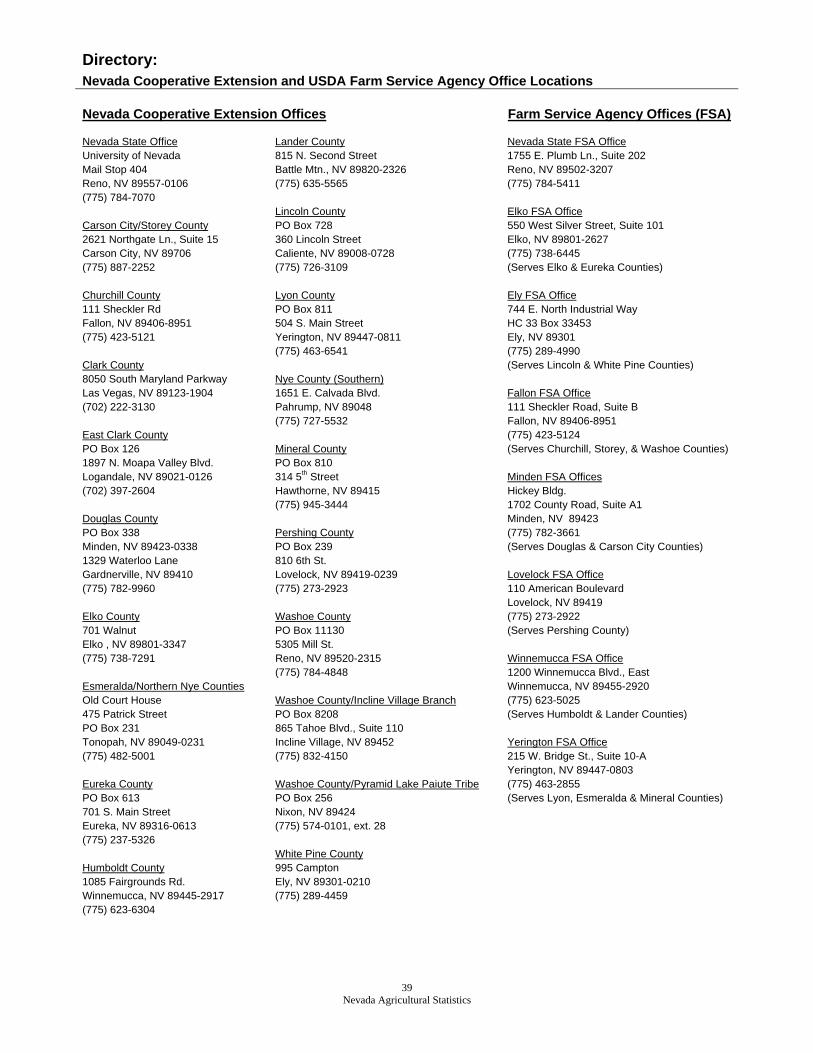
Directory: Nevada Cooperative Extension and USDA Farm Service Agency Office Locations Nevada Cooperative Extension Offices Farm Service Agency Offices (FSA) Nevada State Office Lander County Nevada State FSA Office University of Nevada 815 N. Second Street 1755 E. Plumb Ln., Suite 202 Mail Stop 404 Battle Mtn., NV 89820-2326 Reno, NV 89502-3207 Reno, NV 89557-0106 (775) 635-5565 (775) 784-5411 (775) 784-7070 Lincoln County Elko FSA Office Carson City/Storey County PO Box 728 550 West Silver Street, Suite 101 2621 Northgate Ln., Suite 15 360 Lincoln Street Elko, NV 89801-2627 Carson City, NV 89706 Caliente, NV 89008-0728 (775) 738-6445 (775) 887-2252 (775) 726-3109 (Serves Elko & Eureka Counties) Churchill County Lyon County Ely FSA Office 111 Sheckler Rd PO Box 811 744 E. North Industrial Way Fallon, NV 89406-8951 504 S. Main Street HC 33 Box 33453 (775) 423-5121 Yerington, NV 89447-0811 Ely, NV 89301 (775) 463-6541 (775) 289-4990 Clark County (Serves Lincoln & White Pine Counties) 8050 South Maryland Parkway Nye County (Southern) Las Vegas, NV 89123-1904 1651 E. Calvada Blvd. Fallon FSA Office (702) 222-3130 Pahrump, NV 89048 111 Sheckler Road, Suite B (775) 727-5532 Fallon, NV 89406-8951 East Clark County (775) 423-5124 PO Box 126 Mineral County (Serves Churchill, Storey, & Washoe Counties) 1897 N. Moapa Valley Blvd. PO Box 810 Logandale, NV 89021-0126 314 5th Street Minden FSA Offices (702) 397-2604 Hawthorne, NV 89415 Hickey Bldg. (775) 945-3444 1702 County Road, Suite A1 Douglas County Minden, NV 89423 PO Box 338 Pershing County (775) 782-3661 Minden, NV 89423-0338 PO Box 239 (Serves Douglas & Carson City Counties) 1329 Waterloo Lane 810 6th St. Gardnerville, NV 89410 Lovelock, NV 89419-0239 Lovelock FSA Office (775) 782-9960 (775) 273-2923 110 American Boulevard Lovelock, NV 89419 Elko County Washoe County (775) 273-2922 701 Walnut PO Box 11130 (Serves Pershing County) Elko , NV 89801-3347 5305 Mill St. (775) 738-7291 Reno, NV 89520-2315 Winnemucca FSA Office (775) 784-4848 1200 Winnemucca Blvd., East Esmeralda/Northern Nye Counties Winnemucca, NV 89455-2920 Old Court House Washoe County/Incline Village Branch (775) 623-5025 475 Patrick Street PO Box 8208 (Serves Humboldt & Lander Counties) PO Box 231 865 Tahoe Blvd., Suite 110 Tonopah, NV 89049-0231 Incline Village, NV 89452 Yerington FSA Office (775) 482-5001 (775) 832-4150 215 W. Bridge St., Suite 10-A Yerington, NV 89447-0803 Eureka County Washoe County/Pyramid Lake Paiute Tribe (775) 463-2855 PO Box 613 PO Box 256 (Serves Lyon, Esmeralda & Mineral Counties) 701 S. Main Street Nixon, NV 89424 Eureka, NV 89316-0613 (775) 574-0101, ext. 28 (775) 237-5326 White Pine County Humboldt County 995 Campton 1085 Fairgrounds Rd. Ely, NV 89301-0210 Winnemucca, NV 89445-2917 (775) 289-4459 (775) 623-6304

40 Nevada Agricultural Statistics
Directory: USDA Natural Resources Conservation Service & Nevada Dept. Of Agriculture Office Locations Natural Resources Conservation Service (NRCS) Nevada Dept. of Agriculture State Office Las Vegas Reno Main Office 1365 Corporate Blvd. Parc Place Professional Complex 350 Capitol Hill Ave. Reno, NV 89502-7102 5820 South Pecos Rd. Reno, NV 89502 (775) 857-8500 Building A, Suite 400 (775) 688-1180 Las Vegas, NV 89120-3418 Western Nevada RC&D Office (702) 262-9047 Las Vegas District Office 705 North Plaza, Rm. 203 2300 McLeod PO Box 3543 Caliente Las Vegas, NV 89104 Carson City, NV 89702-4061 360 Lincoln Street (702) 486-4690 (775) 883-2292 PO Box 8 Caliente, NV 89008-0008 Winnemucca District Office High Desert RC&D Office (775) 726-3101 1200 E. Winnemucca Blvd. Parc Place Professional Complex Winnemucca, NV 89445 5820 South Pecos Rd. Fallon Service Center (775) 623-6502/6501 Building A, Suite 400 111 Sheckler Rd. Las Vegas, NV 89120-3418 Fallon , NV 89406-8951 Elko District Office (702) 262-9047 (775) 423-5124 4780 E. Idaho St. Elko, NV 89801 Daka Doyabe RC&D Office Minden Field Office (775) 738-8076 555 West Silver St. Hickey Building Elko, NV 89801-2627 1702 County Rd., Suite A1 (775) 738-8431 Minden, NV 89423-4460 (775) 782-3661 Nevada Conservation Districts 901 South Stewart St Suite 5004 Yerington Field Office Carson City, NV 89701 215 West Bridge St., Suite 11-A (775) 684-2760 Yerington, NV 89447-2554 (775) 463-2265 Elko Field Office 555 W. Silver St. Elko, NV 89801-7714 (775) 738-8431 Ely Field Office 744 E. North Industrial Way Ely, NV 89315 (775) 289-4065 Eureka Conservation District Office PO Box 323 701 S. Main St. Eureka, NV 89316 (775) 237-5251 Lovelock Field Office 1155 Lovelock Ave. Lovelock, NV 89419-8860 (775) 273-2134 Winnemucca Field Office 1200 Winnemucca Blvd., East Winnemucca, NV 89445-3027 (775) 623-5025

Nevada Agricultural Statistics
41
United States Department of Agriculture National Agricultural Statistics Service State Field Offices
Alabama 334-279-3555 Bill Weaver PO Box 240578, Montgomery, AL 36124-0578 Alaska 907-745-4272 Suzan Benz PO Box 799, Palmer, AK 99645 Arizona 602-280-8850 Steve Manheimer 230 N. First Ave, Suite 303 Phoenix, AZ 85003 Arkansas 501-228-9926 Becky Cross 10800 Financial Centre Parkway, Little Rock, AR 72211 California 916-498-5161 Vic Tolomeo PO Box 1258, Sacramento, CA 95812 Colorado 303-236-2300 Renee Picanso PO Box 150969, Lakewood, CO 80215-0969 Delaware 302-698-4537 Chris Cadwallader 2320 S. Dupont Hwy., Dover, DE 19901 Florida 407-648-6013 Ben Klugh PO Box 530105, Orlando, FL 32853 Georgia 706-546-2236 Doug Kleweno 355 East Hancock Ave, Athens, GA 30601 Hawaii 808-973-2907 Mark Hudson 1428 South King Street, Honolulu, HI 96814-2512 Idaho 208-334-1507 Bill Meyer PO Box 1699, Boise, ID 83701 Illinois 217-492-4295 Brad Schwab PO Box 19283, Springfield, IL 62794-9283 Indiana 765-494-8371 Greg Preston 1435 Win Hentschel Blvd, Ste 110 W. Lafayette, IN 47906 Iowa 515-284-4340 Greg Thessen 210 Walnut St., Rm 833, Des Moines, IA 50309 Kansas 785-233-2230 Eldon Thiessen 632 SW Van Buren St, Topeka, KS 66603-3534 Kentucky 502-582-5293 Lee Brown PO Box 1120, Louisville, KY 40201 Louisiana 225-922-1362 Nathan Crisp 5825 Florida Blvd, Baton Rouge, LA 70896-5038 Maryland 410-841-5740 Barbara Rater 50 Harry S. Truman Pkwy, Ste 202, Annapolis, MD 21401 Michigan 517-324-5300 Dave Kleweno 3001 Coolidge Rd, Ste 400, Lansing, MI 48909 Minnesota 651-296-2230 Douglas Hartwig 8 East 4th St, Ste 500, St. Paul, MN 55107 Mississippi 601-965-4575 Tommy Gregory 121 North Jefferson St, Jackson, MS 39201 Missouri 573-876-0950 Gene Danekas 601 Bus Loop 70 W, Ste 24, Columbia, MO 65203 Montana 406-441-1240 Peggy Stringer 10 West 15th, Ste 3100, Helena, MT 59626 Nebraska 402-437-5541 Joe Parsons PO Box 81069, Lincoln, NE 68501 Nevada 775-972-6001 Martin Owens PO Box 8880, Reno, NV 89507 New England 603-224-9639 Gary Keough 53 Pleasant St, 2nd Floor, Concord, NH 03302-1444 New Jersey 609-292-6385 Troy Joshua PO Box 330, Trenton, NJ 08625 New Mexico 505-761-4970 Jim Brueggen PO Box 1809, Las Cruces, NM 88004 New York 518-457-5570 Steve Ropel 10B Airline Drive, Albany, NY 12235 North Carolina 919-856-4394 Herb Vanderberry PO Box 27767, Raleigh, NC 27611 North Dakota 701-239-5306 Darin Jantzi PO Box 3166, Fargo, ND 58108 Ohio 614-728-2100 Jim Ramey 8995 E. Main St, Reynoldsburg, OH 43068-0686 Oklahoma 405-522-6190 Wil Hundl 2800 North Lincoln Blvd, Oklahoma City, OK 73152 Oregon 503-326-2131 Chris Mertz 1220 S.W. Third Ave, Rm 1735, Portland, OR 97204 Pennsylvania 717-787-3904 Marc Tosiano Rm G-19, 2301 N. Cameron St., Harrisburg, PA 17110 Puerto Rico 787-723-3773 Anne Cruz 1309 Fernandez Juncos, Santurce, Puerto Rico 00908 South Carolina 803-765-5333 Rhonda Brandt 1835 Assembly St, Rm 1008, Columbia, SC 29202 South Dakota 605-323-6500 Carter Anderson PO Box 5068, Sioux Falls, SD 57117 Tennessee 615-781-5300 Debra Kenerson PO Box 41505, Nashville, TN 37204-1505 Texas 512-916-5581 Dave Abbe PO Box 70, Austin, TX 78767 Utah 801-524-5003 Rick Kestle 176 N. 2200 West, Ste 260, Salt Lake City, UT 84116 Virginia 804-771-2493 Herman Ellison 102 Governor St, Rm LL20, Richmond, VA 23219 Washington 360-902-1940 Dave Knopf PO Box 609, Olympia, WA 98507 West Virginia 304-345-5958 Dale King 1900 Kanawha Blvd.E, Charleston, WV 25305 Wisconsin 608-224-4848 Bob Battaglia PO Box 8934, Madison, WI 53708 Wyoming 307-432-5600 Glenda Shepler PO Box 1148, Cheyenne, WY 82003
How to Get NASS’s Statistical Information on the Web The USDA-NASS web site is http://www.nass.usda.gov/
USDA data and estimates of production, supply, prices, and associated information are available from the web site. The NASS Agricultural Statistics Board releases approximately 400 national reports each year covering at least 120 crops and 45 livestock items. The NASS web site provides easy access to national and state reports, data, graphics, and agency information. On-line database: Quick Stats offers the ability to query by commodity, state(s) and year(s), providing the most up-to-date statistics including all revisions. The query dataset can be downloaded for easy use in your database or spreadsheet. Quick Stats is accessible directly from the homepage or the Data and Statistics tab. Statistics by state: State specific releases are available through this link to NASS’s 46 field offices. They are accessible on the left side of the homepage or through the Publications tab. Publications: NASS national reports can be browsed from the homepage or the Publications tab. Electronic access is provided free of charge. Fees are charged for printed publications which are accessible though the Publications tab. Subscriptions by E-mail: All of NASS’s national reports are available free of charge via e-mail within 3 hours of official release. To subscribe to reports electronically, click on the Publications tab at the NASS Homepage then select either national or state releases under “Receive reports by e-mail” on the right side of the screen. For additional assistance please contact the NASS Agricultural Statistics Hotline 1-800-727-9540 or any of the field offices listed on page 41 of this publication. We are here to provide you with the statistical information you need.
42 Nevada Agricultural Statistics

NASS CONFIDENTIALITY PLEDGE
1. Names, addresses, and personal identifiers are never revealed or kept with data. After data collection, National Agricultural Statistic Service (NASS) transfers the data from the questionnaires into a computer system. The only identifier left with the data is an identification number used by our State office got quality control purposes. The actual questionnaires are kept in a secure area, then destroyed as prescribed by law. Names, addresses, phone numbers, social security numbers, and employee identification numbers are used only by NASS State offices. This information is never revealed to anyone outside the agency. 2. NASS survey and census data never leave NASS facilities. Reported data collected for the NASS annual statistics program and the 5-year census of agriculture never leave NASS. They are not shared with any organizations or individuals – not even other USDA or government agencies. Employees are not allowed to take questionnaires or data listings off-site. Data security is our top priority. 3. Only authorized persons working for NASS as employees or sworn partners, who are subject to fines and imprisonment for unauthorized disclosure, can access NASS data and only for approved statistical purpose.
Every person working for NASS signs a confidentiality form which states that no survey information will be compromised. There has never been a breach of trust in NASS history. Any offender would receive severe punishment of up to a $10,000 fine and/or 10 years in prison. 4. NASS does not conduct surveys or provide data for private, proprietary purposes.
NASS will never conduct a survey for the sole use of any organization. No organization is given ownership of data or an advantage over anyone else. Summarizes results are released to everyone free of charge. 5. When NASS collects data for others in a NSS-approved statistical study, farmers and ranchers will always be informed about the cooperating sponsor and participation will always be voluntary.
When NASS agrees to collect data for selected organizations, such as a university or other government agency, NASS will clearly communicate the name of the sponsoring organization and the purpose of the survey. If we feel the reporting burden is too great or the needs of the agricultural community will not be served by the survey, we will not conduct the survey. Although the data are collected by NASS on behalf of the sponsoring organization, all personal identifiers such as name, address, phone number, etc., are removed. Results of the study are published. 6. Summary data from all NASS surveys and censuses are available to everyone, but will never disclose individual reported information.
NASS releases published data to everyone at the same time. Most reports are available on the Internet within minutes o the scheduled release. Participants in the survey can rest assured that no individual data will be disclosed. For instance, if only one farm produced rice in Pulaski County, Arkansas, then NASS will protect the privacy of that individual farm by not publishing ride data for Pulaski County. Instead, the data would be combined with reports from other counties in the State and published at the aggregate level. No reported data are ever published in a way that would identify an operation.
43 Nevada Agricultural Statistics

NOTES
44 Nevada Agricultural Statistics


FACT FINDERS FOR AGRICULTUREUNITED STATES DEPARTMENT OF AGRICULTURE