natural ventilation of large multi-span greenhouses
TRANSCRIPT

MKJ 8iOl, 13^
Natural ventilation of large multi-span greenhouses
BIBLIOTHEEK LANDBOUV/'.JMi. ' -R3i VciT
POSTliDS j l ' . O
6 7 0 0 HA WAGi£i\i lNGEN
NEDERLAND
CENTRALE LANDBOU WC ATALOG US
0000 0609 1199

Promotor: Prof. dr. ir. J. Schenk, emeritus hoogleraar in de technische natuurkunde
Co-promotor: Dr. ir. G. P. A. Bot, hoofd van de hoofdafdeling procestechniek (IMAG, DLO)

Taeke de Jong
Natural ventilation of large multi-span greenhouses
Proefschrift ter verkrijging van de graad van
doctor in de landbouw- en milieuwetenschappen,
op gezag van de rector magnificus,
dr. H. C. van der Plas,
in het openbaar te verdedigen
op woensdag 26 september 1990
des namiddags te vier uur in de aula
van de Landbouwuniversiteit te Wageningen.
i<n:Z$2.^^

Foar heit en mem

,OfO oB2o\ I ' S »
STELLINGEN
1. De invloed van het raamtype op de door de wind aangedreven ventilatie van grote tuinbouwkassen kan niet verklaard worden door de stromingsweerstanden van de betreffende ramen alleen.
(dit proefschrift)
2. Voor Venlo-kassen kan de gecombineerde lij- en loefzijde ventilatie, voor relatief kleine raamopeningen aan de loefzijde, betrouwbaar gekwantificeerd worden door de sommatie van de afzonderlijke lij- en loefzijde ventilatie.
(dit proefschrift)
3. De door de wind aangedreven ventilatie van vrijstaande Venlo-kassen, per eenheid van raamoppervlak, kan worden beschreven als de som van de desbetreffende ventilatie door een oneindig kasdek en een bijdrage veroorzaakt door de aanwezigheid van de gevels (het geveleffect) .
(dit proefschrift)
4. Het geveleffect neemt toe met toenemend kasoppervlak.
(dit proefschrift)
5. Bij de bepaling van de ventilatie in kleine, vrijstaande gebouw» wordt veelal alleen uitgegaan van een statische drukverdeling om het gebouw. Het verdient echter aanbeveling ook de ventilatie tengevolge van de drukfluctuaties in de beschouwing te betrekken.
6. Het veronachtzamen van de drukafhankelijkheid van de microfoonkarakteristiek leidt tot een verkeerde interpretatie van fotoakoestisch gemeten gasconcentraties.
Michael J. Kavaya, Jack S. Margolis and Michael S. Shumate, 1979. Applied Optics, vol 18, No. 15, 2602-2606.
7. Het is onjuist de berekening van oppervlakte-ruwheidsparameters louter op geometrische factoren te baseren.
Adrie F. G. Jacobs and John H. van Boxel, 1988. Boundary-Layer Meteorology, 42, 265-279.
8. Het gebruik van het gemodificeerde Jaegermodel voor de uitwerking van warmtegeleidingsmetingen in bevriezende grond is principieel onjuist indien dit model niet wordt gemodificeerd.
W.K.P. van Loon, I.A. van Haneghem and H.P.A. Boshoven. Proceedings of the 5th International Symposium on Ground Freezing, Nottingham, 26-28 July 1988.

9. De omslagfiguur van het boek "Transport Phenomena" van Beek en Muttzall geeft voet aan een ernstige misvatting.
W.J. Beek & K.M.K. Muttzall, 1977. Transport Phenomena.
10. Teneinde de onderzoeksresultaten op het gebied van luchtverontreiniging goed te kunnen vergelijken is op zijn minst standaardisatie van de bemonsterings- en ijkprocedure een absolute noodzaak.
11. De naam en het werkterrein van het oude ministerie van Onderwijs, Kunsten en Wetenschappen gaven terecht gestalte aan de artistieke beleving binnen de wetenschap.
12. Het verdient aanbeveling om in de onmiddellijke nabijheid van sierfonteinen openbare toiletten te plaatsen.
13. De introductie van 'high definition television' (HDTV) brengt ons vooral een scherper beeld van de vervlakking.
Stellingen behorende bij het proefschrift "Natural ventilation of large multi-span greenhouses" door Taeke de Jong.
Wageningen, 26 september 1990.

ABSTRACT
De Jong, T. (1990), Natural ventilation of large multi-span greenhouses. Ph.D. Thesis Agricultural University Wageningen, The Netherlands. 116 pp.; 46 eqs.; 44 fig.; 4 tables; 54 refs.; English and Dutch summaries.
In this thesis the ventilation of large multi-span greenhouses caused by wind and temperature effects is studied. Quantification of the ventilation is important to improve the control of the greenhouse climate.
Knowledge of the flow characteristics of the one-side-mounted windows of the greenhouses is essential to understand the ventilation process. An approach is presented which a priori describes the flow characteristics of the windows. This description is complemented with in situ measurements of the flow characteristics which definitely confirmed the given approach.
The air exchange caused by wind effects and the air exchange caused by temperature effects were considered separately. As a starting point for the description of the greenhouse ventilation due to wind effects, the ventilation through a 'quasi-infinite' greenhouse cover was considered. The 'quasi-infinite' cover is defined as a greenhouse cover where the wind field near the surface is not influenced by any boundary effect. A description of the wind-driven ventilation through these greenhouse covers is presented and validated by full scale measurements. The leeside ventilation, the windward side ventilation and the combined leeside and windward side ventilation were studied. The effects of wind direction, wind speed, number of windows, window dimensions and opening angle were investigated. Parametrization of the theoretical model of the ventilation led to a reliable quantitative description of the air exchange of the 'quasi-infinite' greenhouses.
Results of ventilation measurements performed in differently sized freestanding greenhouses indicate that the ventilation characteristic of the 'quasi-infinite' greenhouse can well serve as a reference with respect to the ventilation of real (finite) greenhouses.
Though in practice the wind effects amply dominate the temperature effects, the effect of the thermal buoyancy is of fundamental interest. An approach was presented to describe the natural convection through the one-side-mounted windows. Ventilation experiments lend support to the given approach. Next an expression for the combined effect of temperature and wind on the ventilation was suggested. Full scale measurements showed that this expression provides a good representation for practical purposes.
free descriptors: greenhouses, natural ventilation, greenhouse climate, one-side-mounted windows, flow characteristics, Venlo type greenhouses, tracer gas techniques

CONTENTS
EEN WOORD VOORAF
1 INTRODUCTION 1
1.1 Previous greenhouse ventilation research 2
1.2 The present research and the organization of the thesis 5
1.3 References 7
2 FLOW CHARACTERISTICS OF ONE-SIDE-MOUNTED WINDOWS 9
2.1 Introduction 9
2.2 Principal considerations 11
2.3 Experimental set up 15
2.4 Results and discussion 18
2.5 Conclusions 22
2.6 References 22
3 AIR EXCHANGE CAUSED BY WIND EFFECTS THROUGH (WINDOW) OPENINGS
DISTRIBUTED EVENLY ON A QUASI-INFINITE SURFACE 25
3.1 Introduction 25
3.2 General approach 27
3.3 Ventilation through a fixed number of openings 31
3.3.1 Experimental set up 31
3.3.2 Results and discussion 34
3.4 Ventilation through different numbers of openings 38
3.4.1 Experimental set up 38
3.4.2 Results and discussion 39
3.5 The effect of the window geometry on the ventilation 41
3.5.1 Considerations 41
3.5.2 Experimental set up 42
3.5.3 Results and discussion 43
3.6 Conclusions 47
3.7 References 48
4 THE WINDWARD SIDE VENTILATION AND THE COMBINED LEESIDE AND 51
WINDWARD SIDE VENTILATION
4.1 Introduction 51
4.2 The combined leeside and windward side ventilation 52
4.2.1 Experimental set up 52
4.2.2 Results and discussion 53

4.3 The windward side ventilation through different window 57
types on a quasi-infinite greenhouse cover
4.3.1 Experimental set up 57
4.3.2 Results and discussion 58
4.4 Concluding remarks 61
5 FIELD MEASUREMENTS OF GREENHOUSE VENTILATION 63
5.1 Introduction 63
5.2 Experimental procedure 65
5.3 Results and discussion 67
5.4 Concluding remarks 76
5.5 References 78
6 VENTILATION DUE TO THE TEMPERATURE EFFECT AND THE COMBINED 79
WIND AND TEMPERATURE EFFECT
6.1 Introduction 79
6.2 Natural convection through rectangular openings 80
6.2.1 Considerations 80
6.2.2 Experimental procedure 85
6.2.3 Results and discussion 87
6.3 Natural convection through the greenhouse windows 91
6.3.1 Considerations 91
6.3.2 Experimental set up 93
6.3.3 Results and discussion 94
6.4 Air exchange due to a combined wind and temperature effect 95
6.4.1 Considerations 95
6.4.2 Experiments 96
6.4.3 Results and discussion 96
6.5 Concluding remarks 97
6.6 References 98
7 FINAL DISCUSSION AND CONCLUSIONS 99
SUMMARY 103
SAMENVATTING 109
LIST OF SYMBOLS 115

EEN W O O R D VOORAF
Het onderzoek waarvan de belangrijkste resultaten zijn neergelegd in dit
proefschrift kwam tot stand door nauwe samenwerking van drie onder
zoeksinstellingen, te weten: de toenmalige vakgroep Natuur- en Weerkunde
(sectie Natuurkunde, thans deel uitmakende van de vakgroep Agrotechniek en
-fysica) van de Landbouwuniversiteit Wageningen, het Proefstation voor
Tuinbouw onder Glas (PTG) in Naaldwijk en het Instituut voor Mechanisatie,
Arbeid en Gebouwen (IMAG) in Wageningen. Mede door deze constructie is een
relatief groot aantal mensen betrokken geweest bij dit onderzoek. Deze
plaats in het proefschrift biedt mij een goede gelegenheid om hen te
bedanken voor hun bijdragen.
Mijn promotor Jaap Schenk wil ik bedanken voor de prettige samenwerking
en de zorg die hij besteedde aan het doornemen van de verschillende
manuscripten. Zijn inzicht en commentaar waren van bijzonder grote waarde
voor de totstandkoming van dit proefschrift.
Met genoegen denk ik ook terug aan de samenwerking met mijn co-promotor
Gerard Bot. Veel plezierige discussies en 'brainstorm-middagen' liggen ten
grondslag aan het hier gepresenteerde werk. Zijn enthousiasme en kennis
van de materie boden vaak de noodzakelijke stimulans.
Op wat grotere afstand werd het onderzoek begeleid door een begeleidings
commissie. Op de leden van deze commissie kon altijd een beroep gedaan
worden voor de nodige faciliteiten en steun. Ik wil Nico van de Braak,
Georgus Germing, Wim van Meurs, Elly Nederhoff en Chris van Winden daar
voor hartelijk danken.
Van 1986 tot 1988 ben ik als medewerker van de vakgroep gedetacheerd
geweest aan het PTG (afdeling teelt en kasklimaat) . Dit hield verband met
de metingen binnen het proefstation en in de praktijk. Ik ben de directie
van het proefstation dankbaar voor de mij geboden faciliteiten.
Het onderzoek werd mogelijk gemaakt door de financiële bijdrage van het
z.g. "Energiefonds". Een onderzoek met zo'n experimenteel karakter kan
niet uitgevoerd worden zonder een goede technische begeleiding. De

medewerkers van de electronische en mechanische werkplaatsen van de
vakgroep, IMAG en PTG ben ik zeer erkentelijk voor hun steun. Met name
Willy Hillen, Anton Jansen, Peter Jansen en Teun Jansen stonden altijd
paraat voor het opzetten en afbreken van de 'mobiele meetopstelling.
Dimitri van den Akker ben ik dankbaar voor de hulp die hij gaf bij de
automatisering en voor zijn betrokkenheid bij het gevecht tegen de soms
wel erg onwillige apparatuur.
Dank zij de medewerking van de families Bevelander, de Jonge, van Noord en
van Vught zijn de praktijkmetingen mogelijk geweest. In het kader van hun
studie hebben de inmiddels ex-studenten Yunus Aliskan, Egon Coolen en
Adriaan van Strien met veel inzet en enthousiasme belangrijke deelprojec
ten van het onderzoek uitgevoerd.
Het proefschrift had er nooit zo verzorgd uitgezien zonder de medewerking
van de afdeling Tekstverwerking van de Landbouwuniversiteit. Dory
Neijenhuis en Josie Zeevat hebben hier veel werk verzet. Josie heeft
bovendien het Engels op een hoger niveau gebracht. De mooie figuren en de
omslag van het proefschrift zijn het werk van Paul van Espelo en hebben
bijgedragen tot de fraaie vormgeving. Onder dikwijls moeilijke omstan
digheden heeft Paul met veel vakmanschap de klus geklaard. Ik ben hem daar
zeer erkentelijk voor.
Sjaak Bakker, Jan Bontsema, Rein de Graaf, Gerard van Holsteijn, Ad de
Koning en Hans Sauren dank ik voor de waardevolle gesprekken over
verschillende aspecten van het werk. Ook de inspirerende discussies met
Adrie Jacobs, Ruurd de Jong en Cecilia Stangheilini heb ik zeer
gewaardeerd. Verder wil ik alle collega's en medewerkers bedanken voor de
plezierige werksfeer tijdens het onderzoek.

1 INTRODUCTION
Protected cultivation, i.e. the cultivation of crops in transparant
shelters or glasshouses, is probably one of the most striking examples of
men's interference with the physical environment of a crop, in order to
ensure or step up production. Due to practical experience and, more
recently, the introduction of new materials and computer technology, the
initially more or less simple modification of the environmental conditions
of the plant could evolve in the course of time into the present climate
control systems for modern greenhouses used for commercial agricultural
production.
In particular, the introduction of the computer in greenhouse climate
control facilitated climate management. Control functions can now be
programmed and easily altered in accordance with the prevailing views or
wishes. Modifications of the control functions are usually directed
towards an increase of the final yield. The optimal climate control would
eventually lead to the economical optimization of the greenhouse produc
tion system. To gain insight into this complex production system and its
related optimality problem, targeted research was performed on the econom
ical, biological and physical processes involved (among others: Udink ten
Gate [1], Bot [2], Takakura et al. [3], Stanghellini [4], Challa et al.
[5]). Nowadays, computers for climate control are mostly used with regard
to the control of the air temperature and the avoidance of extreme
situations in the greenhouse. As soon as insight into crop behaviour
increases and control has to be imposed over more than one output variable
(like humidity and carbon dioxide concentration), the dynamical behaviour
of the greenhouse has to be known to attain optimal control.
An important process in the greenhouse is the air exchange between the
inside of the greenhouse and the environment. It directly affects the
transport of sensible heat, water vapour and other gases to or from the
inside air. The needs for ventilation during greenhouse operation are
obvious. These are, to control the temperature, to lower an excessive
level of humidity caused by transpiration of moisture from the plant

foliage and to replenish or, since the importance of C02 enrichment is
recognized (Schapendonk and Gaastra [6]), to control the concentration of
C02 in the greenhouse. Therefore, more insight into this exchange mecha
nism is crucial to optimize the crop growth and to reduce the energy con
sumption during the cultivation of the crop.
The present research concentrates on the mechanisms behind ventilation in
general and the ventilation of the Venlo type greenhouse in particular. It
is intended to contribute basic elements to a quantitative description of
the ventilation of Venlo type greenhouses, which would truly be an object
of value with regard to horticultural climate control in The Netherlands,
since this type of greenhouse covers about 80 percent of the total
glasshouse area of about 9000 ha in this country. In addition to this, a
better understanding of the mechanisms behind the ventilation process can
be used to improve the greenhouse design. Moreover, the present work,
though directed towards ventilation of Venlo type greenhouses, certainly
also contains significant information with respect to ventilation of other
types of greenhouses or even very different buildings, such as schools,
hospitals, offices etc.
1.1 Previous greenhouse ventilation research
A great deal of research has been performed into all areas of ventilation
phenomena. The following summary concerns itself with ventilation research
related to greenhouses. The importance of the ventilation in greenhouses
has been recognized for many years and can be considered as one of the
most important climate control actions available for the grower. However,
the quantification of the air exchange was a rather difficult matter for
a long time.
In the middle of the fifties, a start was made to quantify the ventilation
in greenhouses. Businger [7] investigated the air circulation inside a
small glasshouse and estimated the corresponding magnitude of ventilation
for different ways of ventilating by means of a simple heat balance over
the glasshouse. Aiming for an equable distribution of fresh air, such that
the crop is not directly contacted by cold draughts from the inflow of

fresh air, ventilation strategies, i.e. certain combinations of opened
windows, were recommended. A more direct way to determine the ventilation
air flux in greenhouses was introduced by Morris and Neale [8] . They
published some data of measured ventilation rates of two relatively small
greenhouses with both side and roof windows. The measurments were obtained
by a tracer gas method. Their experimental data, however, were restricted
and no relationship between the measured ventilation rates and relevant
weather conditions was given.
The same tracer technique was also applied by Whittle and Lawrence [9],
when they measured the ventilation in small greenhouses equipped with side
and roof windows. A formula was established for leakage ventilation, pre
suming a linear relation between the ventilation and the outside wind-
speed. The air temperature difference between the greenhouse air and the
outside air was not found to be significant in case of leakage ven
tilation. For ventilated greenhouses, no relationship between the ven
tilation and other relevant factors was obtained.
Much later research was aimed at the determination of the leakage and its
relationship with greenhouse construction or environmental factors like
wind speed, wind direction and difference in temperature between the
greenhouse air and outside air. Roer [10] compared the tightness of dif
ferent types of glasshouse constructions by measuring the overpressure
when a (known) quantity of air is blown into the glasshouse. Gudehus [11]
investigated the air exchange through leaks in a similar way. This method
was proposed to serve as a standard technique to determine leakage of dif
ferent greenhouses. Heissner [12], using a radioactive tracer gas, found a
linear relationship between the measured leakage and the outside wind
velocity for different closed greenhouses.
Okada and Takakura [13] derived, through theoretical considerations, an
equation for the air exchange in greenhouses. They expressed the rate of
air infiltration as a sum of two terms, proportional to the outside wind
speed and the square root of the temperature difference respectively.
Experimental data of measured leakage ventilation were fitted to this
equation. To be able to compare different greenhouses, they suggested ex
pressing the leakage in m3 per unit wall area. The effect of wind direc
tion was not considered. Van Berkel [14] investigated the distribution and

exchange rate of C02 from gas-fired heating boilers. He calculated the air
exchange rates from measurements of C02 concentration performed during the
night period. For the glasshouse with closed ventilators, a relation was
found between the exchange rate and the wind speed (in Beaufort figures)
raised to the square. By opening the ventilators, an increase of the air
exchange was measured but no quantification was given.
The first (theoretical) model approach for greenhouse ventilation was pre
sented by Kozai and Sase [15]. They developed a computer program for esti
mating the natural ventilation in multi-span greenhouses, starting from
basic relationships between the flow rate and existing pressures due to
temperature or wind effects for one opening. The coefficients in these
relationships were based on wind tunnel experiments. The ventilation was
calculated for greenhouses with a different number of spans, varying from
one to four, all equipped with both side and roof ventilators. Afterwards,
this model was extended by Kozai, Sase and Nara [16] who incorporated a
heat balance and some coefficients based on greenhouse model studies in a
wind tunnel. The ventilation model was used to simulate ventilation rates
and the greenhouse air temperature. Though their work was not based on
full scale measurements, insight was gained on the relationship between
the air exchange and some relevant factors like window opening, wind speed
and temperature difference.
Bot [2] was the first to introduce a general approach to describe the ven
tilation through the windows of large Venlo type greenhouses. Ventilation
characteristics of the greenhouse were related to window type, opening
angle and environmental factors like wind speed, wind direction and tem
perature difference. However, many empirical relations were based on model
studios and full scale measurements were only carried out in a small com
partment by means of a static tracer technique. Ventilation in the same
compartments were also measured by Nederhoff et al. [17] by means of a
dynamic tracer technique for small window openings. Their experimental
results were in agreement with the findings of Bot. Rüther [18] determined
natural ventilation rates of closed greenhouses with C02 and N20 as tracer
gases. Results of measurements before and after tightening one greenhouse
were compared. Generally, a linear dependency on wind velocity and tem
perature difference was found. No effect of wind direction on the leakage

seemed to be present. Baytorun [19] extensively measured ventilation rates
of a small greenhouse for several different positions of side and roof
ventilators. Again a linear relationship between the ventilation flux and
wind speed was found, independent from the wind direction. Temperature
differences appeared to be of interest in some cases only, but their
effect was soon dominated by the effect of the wind.
1.2 The present research and the organization of the thesis
From the preceding review, it appears that most research on greenhouse
ventilation confines itself to the establishment of data and relation
ships, only applicable to the special greenhouse examined. In many cases,
theoretical considerations were not given. Among the few exceptions we
have found, the works of Kozai, Sase and Nara [15,16] and Bot [2] seem to
be the most important. A research like the present one, which aimed at the
development of a general description of ventilation of every Venlo type
greenhouse, has to adopt a more fundamental approach and should not be
suitable for only one particular greenhouse. Basic principles of the ven
tilation process have to be recognized and a description has to be made in
terms of relevant factors.
Generally, the ventilation through an opening is determined by the pres
sure difference over the opening and the flow characteristics of the
opening. Therefore, knowledge of the flow characteristics of the opening,
i.e. the relation between the existing pressure difference across the
opening and the volume flux through the opening, is essential to under
stand and describe the air exchange. Venlo type greenhouses are built as
large multi-span blocks with their walls fairly well sealed and their
windows mounted on the cover. All greenhouses are equipped with one-side-
mounted windows hinged from the ridge which are positioned on the cover in
a regular pattern. The air exchange of the greenhouses is regulated by
opening and closing the windows to a certain extent. Obviously the flow
characteristics of the greenhouse windows are essential for the descrip
tion of the ventilation flux through the greenhouse cover. In chapter 2 of

this thesis, an approach is presented to describe the flow characteristics
of one-side-mounted windows as a function of their dimension and window
opening. The description is complemented with full scale measurements of
the flow through various one-side-mounted windows at different opening
angles.
In case of naturally ventilated greenhouses, the driving force for the
flow through the windows, i.e. the pressure difference across the window
opening, is generated by wind effects or by the temperature difference
between the inside and outside air.
In chapter 3, a description is given of the ventilation caused by wind
effects through the greenhouse windows, evenly distributed on a 'quasi-
infinite cover. Effects of the wind speed, wind direction and window
dimensions on the air exchange through the windows on the cover were
investigated. In this chapter, the emphasis was laid on leeside ven
tilation. In chapter 4, the windward side ventilation and the combined
leeside and windward side ventilation are examined. When ventilation is
required, usually the leeside ventilators on the cover are first opened to
a certain point, depending on the difference between the desired (set
point) temperature and the actual temperature. When the leeside ven
tilators are widely opened and the air exchange is still inadequate to
achieve the desired temperature (for instance on a summery day), windward
side ventilators are opened too. The moment that the windward side windows
join in with the leeside windows is to be preset. One chooses starting
with leeside ventilation because of the more equable air infiltration in
the greenhouse as compared to the windward side ventilation. In the latter
type of ventilation, wind blasts directly into the window (especially in
the first span on the windward side) which may cause unwanted local air
movement. Given the importance of leeside ventilation as a tool to control
the greenhouse climate, the emphasis of the thesis is laid on this type of
ventilation.
In chapters 3 and 4, the research on greenhouse ventilation caused by the
wind effects was focussed primarily on the air exchange of unbounded
greenhouse covers. In chapter 5, results of field measurements of
greenhouse ventilation arc presented and discussed. The measurements were
performed to investigate how the ventilation features of the unbounded

greenhouses and those of the greenhouses in actual practise lie in rela
tion to each other. During the measurements reported in chapters 3, 4 and
5, the wind effects strongly dominated the temperature effects. Chapter 6
is concerned with the ventilation due to the temperature effect only and
the combined effect of wind and temperature. Experiments are presented on
air exchange due to natural convection through rectangular openings and
through the opening of a one-side-mounted window. Results of ventilation
measurements, during which the buoyancy forces strongly act together with
the wind, are evaluated. Final conclusions are drawn in chapter 7.
1.3 References
1 A.J. Udink ten Cate. Modelling and (adaptive control of greenhouse cli
mates. Ph.D. Dissertation Agricultural University Wageningen. 159 pp.
(1983).
2 G.P.A. Bot. Greenhouse climate: from physical processes to a dynamic
model. Ph.D. Dissertation, Agricultural University, Wageningen.
240 pp. (1983).
3 T. Takakura, K. Kurata and T. Honjo. Physical Models and the Green
house Climate. Acta Horticulturae 174: 97-104 (1985).
4 C. Stanghellini. Transpiration of greenhouse crops - an aid to climate
management. Ph.D. Dissertation Agricultural University Wageningen.
150 pp. (1987).
5 H. Challa, G.P.A. Bot, E.M. Nederhoff and N.J. van de Braak. Green
house climate control in the nineties. Acta Horticulturae, 230:
459-470 (1988).
6 A.H.C.M. Schapendonk and P. Gaastra. Physiological aspects of optimal
C02 control in protected cultivation. Acta Horticulturae, 148: 477-484
(1984).
7 J.A. Businger. De invloed van raamstanden op de ventilatie van kassen.
Meded. Dir. Tuinb. 17, p. 897-903 [in Dutch] (1954).
8 L.G. Morris and F.E. Neale. The infra-red carbon dioxide gas analyser
and its use in glasshouse research. NIAE rep. Wrestpark, Silsoe,
England. (1954).

9 R.M. Whittle and W.J.C. Lawrence. The Climatology of Glasshouses. II.
Ventilation. J. Agric. Engng. Res. 5: 36-41 (1960).
10 P. Roer. Vergelijkende dichtheidsbepalingen van kassen. Meded. Dir.
Tuinb. 24, 2, pp. 133-136. (1961).
11 H.Chr. Gudehus. Determination of air exchange figures with regard to
closed greenhouses. Acta Horticulturae 76: 301-304 (1977).
12 A. Heissner. Experimentelle Untersuchung des Luftaustausches von nicht
gelüfteten Gewächshäusern. Archiv für Gartenbau 15, 153-157 (1967).
13 M. Okada and T. Takakura. Guide and Data for Greenhouse Air Conditio
ning. 3: Heat loss due to air infiltration of heated greenhouse. J.
Agric. Meteorol. (Tokyo) 28 (4): 223-230 (1973).
14 N. Van Berkel. C02 from gas-fired heating boilers - its distribution
and exchange rate. Neth. J. Agric. Sei. 23: 202-210 (1975).
15 T. Kozai and S. Sase. A simulation of natural ventilation for a multi-
span greenhouse. Acta Horticulturae 87: 339-349 (1978).
16 T. Kozai, S. Sasa and M. Nara. A modelling approach to greenhouse ven
tilation control. Acta Horticulturae 106: 125-136 (1980).
17 E.M. Nederhoff, J. Van de Vooren and A.J. Udink ten Cate. A Practical
Tracer Gas Method to Determine Ventilation in Greenhouses. J. Agric.
Engn. Res., 31, 309-319 (1985).
18 M. Rüther. Natural ventilation rates of closed greenhouses. Acta
Horticulturae 170: 185-191 (1985).
19 A.N. Baytorun. Bestimmung des Luftwechsels bei gelüfteten Gewächs
häusern. Dissertation Universität Hannover. (1986).

2 FLOW CHARACTERISTICS OF ONE-SIDE-MOUNTED WINDOWS
2.1 Introduction
For residences, schools, greenhouses, livestock buildings etc, natural
ventilation is an important tool to control the indoor climate. It direct
ly affects factors such as temperature, humidity and composition of the
air. These items are of interest with respect to the comfort and well
being of the occupants and the energy consumption of the building. To
design a building, or to improve the control strategy of the indoor
climate, a good understanding of the ventilation features is essential. In
view of their importance, ventilation characteristics of buildings and the
mechanisms of ventilation were subject of extensive research: e.g. Shaw
[1], Dick [2], Foster and Down [3].
In general, when air infiltrates an enclosure through an opening, the
pressure difference between the enclosure and the environment can be con
sidered as the driving force for the flow. The volume flux of the air
depends not only on the existing pressure difference and the area of the
opening, but also on the flow resistance of the opening through which the
air has to pass. Though this basic principle is well established, a uni
versally applicable "law of ventilation" is not available. The pressure
distributions and the corresponding types of flow near the windows are not
only caused by uncorrelated physical aspects such as temperature differen
ces, wind speed and wind direction, but they also depend on a variety of
parameters like window type, the location of the windows, shape and size
of the building.
By separating the driving force and the flow characteristics of the ven
tilation opening, the effect of the various parameters can be better
understood. When studying the origin of the generated pressure difference,
one can distinguish two types of natural ventilation: (a) caused by wind
effects or (b) caused by a difference in air temperature between the in
side and outside air. Both effects are mutually independent and can be
described separately. This will be treated in the next chapters.
The flow characteristic of an opening, relating the volume flux through
the opening to the existing pressure difference, is given by the geometry
and dimensions of the opening. To be able to calculate the natural ven
tilation rate of a building, accurate information concerning the flow
characteristics of the windows is required. Research on the effect of the
inlet configuration on the ventilation is usually directed towards model
studies (Smith and Hazen [4], Dybwatt et al. [5], Hopkins and Hansford
[6], Egan and Hillickson [7], Timmons and Baugham [8], Timmons [9]). In
all these studies fixed opening structures were considered. For many win
dows however, the window opening areas can be varied by means of some
opening component, characterized by the angle with the plane of the wall.
A type of window frequently used for natural ventilation, is the one-side-
mounted casement window. Warren [10], investigated ventilation rates of
enclosures fitted with this type of window in a windtunnel and in a field
experiment. The measurements were performed at different window angles,
wind speeds and wind directions. Total effects were studied and no separa
tion between the driving force and the flow characteristics of the window
opening was made.
An approach to consider the driving force for ventilation and the flow
characteristics of one-side-mounted windows separately, was outlined in
the thesis of Bot [11], in which the ventilation of greenhouses was
studied. In his approach, the flow generated by a specific pressure dif
ference over the window was related to the dimensions of the window and
the window opening angle. His numerical results on the flow characteris
tics are based on flow experiments in scale models only.
Full scale measurements of the flow through the opening under one-side-
mounted windows are an essential supplement of this research to definitely
confirm the above mentioned approach. The present chapter resumes, in
short, some relevant aspects of Bots thesis and presents full scale mea
surements of the flow characteristics of windows on a cover of a Venlo
type greenhouse. Just for this type of building, with its identical win
dows distributed evenly on the cover, a knowledge of the flow charac
teristics of the windows can be applied immediately. With the known flow
characteristics of the windows, the effect of environmental conditions
such as wind speed and temperature difference between interior and
exterior on the ventilation process can be studied.
10

2.2 Principal considerations
The flow characteristic of an opening relates the volume flux ($v) through
the opening to the driving force for the flow, i.e. the existing pressure
difference (AP) .
In the case of air exchange through the opening under a one-side-mounted
window, it is obvious that at a given pressure difference the volume flux
will vary with the size of the window and with its opening angle. Conse
quently, this should be incorporated in the general expression for the
flow through this type of window opening.
First of all, the flow through a rectangular opening without a flap
(fig. 2.1) can be considered. If a pressure difference is maintained over
this opening, a stationary volume flux $v will be generated. A relation-
sin' p between AP and the corresponding flux was established by Bot [11] in
experiments with scale models. In these experiments, scale model windows
(i.e. rectangular openings with different dimensions of length and height)
were mounted on a model greenhouse with the same scale factor. Through the
windows, an air flow could be generated, from the inside of the greenhouse
to the outside, or reverse. For various flow velocities through the window
opening, the corresponding air volume flux and pressure drop across the
opening were recorded. The Reynolds numbers in the opening were chosen
within the same range as those occuring in full scale ventilation
(200 < Re < 21000). From the experiment, it appeared that for the flow
F^>P 2
l i q u r e 2 .1 Rec tangu la r o p e n i n g .
11

region chosen, the viscosity is of minor importance. Consequently, the
flow is mainly affected by the density p0 of the air and the shape of the
opening. This can be expressed in an Euler-like relation:
I—**—? = v w (2a)
- • po • V
with:
p0 = density of the air in the opening
v = average velocity of the air in the opening
L0,H0 = length and height of the opening respectively.
The aspect ratio L0/H0 of the opening is defined as the geometric ratio of
length over height. The function F0(L0/H0) is called the friction factor
of the opening. In the model experiment, this factor indeed turned out to
be dependent on the dimensions of the opening only and could be described
by:
F = 1.75 + 0.7 • exp [- (L /H )/32.5] (2.2a) o o o
for L /H > 1 o o
F = 1.75 + 0.7 • exp [- (H /L )/32.5] (2.2b)
for L /H < 1 o o
In both cases Re must satisfy 200 < Re < 21000.
When the same opening is considered, but now with a flap mounted on one
side of the frame of the opening (fig. 2.2, one-side-mounted window), the
friction factor Fw of the opening under the window and the effective
opening area Aw depend on the opening angle. Bot now supposed, that this
dependency can be represented by two new functions fi(a) and f2(<x), which
F = F • f,(a) (2.3a) w o
A = A • fa(a) (2.3b) w o
12

Figure 2.2 One-side-mounted window.
Calling v = $V/AW, we can now reformulate eqn. 2.1 as:
1 AP
v (2.4a)
or AP = [F /f (a)] . o w
where
f («0 = [f2(a)]2/fi(a)
A I oj
(2.4b)
(2.5)
The definition of the window function fw(a) in this way is preferable to
its reciprocal form, since it now approximates zero for a = 0 (closed
windows) .
The function f ^ a ) , defining the ratio Fw/F0, can be found when we can
establish a value for the friction factor Fw of the opening under the
window. For this purpose, for the time being, it is stated that the effec
tive opening area of the opened window equals the smallest area under the
flap i.e. area AEFB in fig. 2.2. We notice that in this effective opening
area the length and height are L = L 0 and H = H0-sin<x.
With this length and height, the aspect ratio of the effective opening
adopted is known and can be substituted in eqn. 2.2. So the function fi(a)
can be written according to eqn. 2.3 as:
13

fi(a) = 1.75 + 0.7 • exp [-(L /H -sina)/32.5]
1.75 + 0.7 • exp [-(L /H )/32.5] (2.6)
Equation 2.6 holds for L0/H0 > 1 or L0/H0-sina > 1. For L0/H0 < 1 or
L0/H0-slna < 1, the corresponding relation can be found in a completely
analoguous way.
In fig. 2.3 a graph of fi(ot) is given for some aspect ratios according to
eqn. 2.6. The figure shows that for small aspect ratios the increase of
the function fx(a) to the value 1 is faster than for larger aspect ratios.
For aspect ratios approximating zero and infinity, fi(a) equals 1 for all
opening angles. For a very small split the influence of a flap is clearly
negligible, even for very small opening angles!
We want to stress that in general the friction factor is not strongly
dependent on the aspect ratio. So an eventual error in the value of the
friction factor Fw, resulting from our ad hoc supposition about the effec
tive opening area under the window flap (area AEFB in fig. 2.2, i.e.
L0-H0-sina) will not give rise to serious miscalculations in fi(a) follow
ing eqn. 2.6.
0.8
0.7.
0.00
3.25
--'32.5
_ j i
0 10 20 30 40 50 60 70 80 90
— a
Figure 2.3 The function fifa) as ratios.
a function of the window opening for various aspect
14

To establish the function f2(<x), defining the ratio Aw/A0, the effective
exchange area Aw of the opening under the window has to be known or es
timated.
Again, we can suppose that the effective opening area is represented by
the smallest area under the window i.e. area AEFB in fig. 2.2. In this way
the simple function f2(a) = sina could be estimated, relating the exchange
area under the window (fig. 2.2) to that without a window (fig. 2.1). It
is obvious however, that some contraction will appear in the opening and
that the side areas DAE and CBF of the opening (fig. 2.2) will also
contribute to the effective exchange opening under the window flap. It
seems likely that the side area effect will increase for decreasing aspect
ratios. However, a summation of the three areas as the representation of
the effective opening area is too simple since it can be expected that
f2(a) will not exceed the value 1. To determine f2(a) as a function of the
aspect ratio, equations 2.5 and 2.4b can be combined to:
1 * K f2(°0 = [£ • P„ • (F M * ) • fi(<x)]2 ' —Z-T (2.7)
1 ° ° ° (AP)2
This formula implies, that when air volume fluxes and pressure differences
are measured for a range of opening angles of windows with different
aspect ratios, and therefore different friction factors, values of f2 (a)
can be determined experimentally for each specific combination of window
and window angle as the quotient of $v over (AP)z with the 'correction'
factor [è-p0.(F0/A02)-fi(a)]2. In this factor, the above mentioned func
tion fi(oc) given by eqn. 2.6 can be incorporated.
2.3 Experimental set up
A compartment (floor area = 6.50 x 6.70 m2, fig. 2.4) was built in the
centre of a Venlo type greenhouse with dimensions 26.6 x 22.2 m2. The side
walls of that compartment were made of blisterpadding mounted on a wooden
frame. The compartment was built as air tight as possible. Each of the
four windows in the cover of the compartment were constructed in such a
way that two different window types, with aspect ratio 1.00 (L0 = H0 =
0.71 m) and 0.47 (L0 = 0.73 m and H0 = 1.55 m) were available (fig. 2.5).
15

s tv \ i iVfelCwer
Figure 2.4 Compartment in the centre of the greenhouse.
Figure 2.5 Window types on the cover of the compartment. A: L0 = 0.73 a, H0 = 1.55 a; B: L0 = 0.71 m, H0 0.71 m
In this experiment, the air flow through the window was generated by a
high capacity airblower (Nordisk ventilator, type CNA 400) mounted in an
opening in one side wall of the compartment. The direction of the air flow
could be altered.
To measure the air volume flux, a large tube, with a propeller inside
serving as volume flux meter, was mounted at the outlet of the blower. The
diameter of the propeller almost equalled the internal diameter of the
outlet tube. The volume flux meter, in combination with the blower, was
16

calibrated first in a windtunnel at the IMAG (Institute of Agricultural
Engineering, Wageningen). According to Berckmans [12], measured values
with this device are dependent on the pressure head over the propeller.
Therefore series of $v (air volume flux generated by the blower) and n
(rotation velocity of the propeller) were measured at static pressures
across the inlet and the outlet of the blower (APi_0) varying from 0 to
40 Pa (fig. 2.6). It is to be noticed that, especially in the case of
small air flows, the rotation number of the propeller is influenced by the
pressure head AP^.0. In our work, as a rule, $v and n were large enough to
neglect the influence of this effect.
^ 56 u o S 48 <fl
•2 40
8 32
t 2 4
16
8:
; . : : : z ; ;
-
è
/ 6»*
*tf*
D O « *
o ° V * .APi-o-OPa oc».» A » -10 Pa
M%i* • •• -20pa
oj.» 0 „ -30 Pa
. ' u •• -40Pa I I i I i I i
2000 4000 6000 8000 — 4>v(m3/h)
Figure 2.6 Rotation velocity of the propeller as a function of the air flow rate at various pressure heads (AP,-_0).
During the experiments only one window was opened in the compartment. In
this way, it is exactly known how much air is blown or sucked through this
window. Moreover, larger pressure differences could be established.
The pressure in the compartment and outside the compartment near the win
dow was sampled by a pressure sensor following Elliott [13]. It consists
of a thin circular disk with a diameter of 40 mm and mean thickness of
2 mm, positioned on a long thin stem (fig. 2.7). The sampling ports are
located at the upper and lower centre of the disk, sampling static and
dynamical pressures local to the disk.
Special attention has been paid to the dimensions of the instrument to
eliminate dynamical pressure changes (i.e. dynamic pressure noise gene
rated by the interference between the flow field and the sensor body) at
the sampling points. For a detailed description we refer to Elliott [13].
During the experiments, two parallel linked sensors were positioned out-
17

10.37, r10.37
1.27QD. 3.18 OD. 6.35O.D. ,0.81 I.D. 11.75 I.D. I1 -7 5 {-D-
connect ion to press ure L P f i l t e r J
Figure 2.7 Pressure sensor (dimensions are in mm).
side the window out of the main flow generated by the blower. Another
pair of parallel linked sensors, the reference sensors, were positioned in
the compartment. The sensed pressures were led to a differential micro
barometer (Datametrics type 590D) with an operation range of -100 Pa to
+ 100 Pa and an accuracy of 0.05% of the reading. To eliminate high fre
quency noise in the pressure signal during the measurements, a pneumatic
low pass filter with a first order time constant of 70 seconds was placed
between all sensors and the barometer. Calibration of the pressure probes
and testing of the sensors in combination with the filters and the micro
barometer was performed according to Jacobs [14,15].
Moreover, to minimize the low frequency pressure noise due to blast of the
wind outside, measurements were performed during periods with low wind-
speeds, not exceeding 1 m/s.
2.4 Results and discussion
For the window with aspect ratio 0.47, measurements were performed at win
dow openings ranging from 0-14 degrees. For the window with aspect ratio
1.00, the measurements were carried out at opening angles varying from
0-77 degrees. For both window types, the function f2(a) was determined
experimentally from the measured <I>V and AP, according to eqn. 2.7. The
results are presented in fig. 2.8, together with some theoretical results
(the dotted curves) which will be discussed later.

1.0
0.8
0.6
0.4-
0.2
- L0/Ho-0.26.-
/ 0.47 ^
A /' m /
/ 0.74/'/' , / A
/ / /.i.o.ö
• • ' * • » / /
; ' ° / / / /Lo/Ho-00
" fi// / - fil: /
l 1 i l i i
""A
A
1 1
20 40 60 80
Figure 2.8 Full scale measured values of the function f2((x) together with a theoretical
model (dotted curves) related to the opening angle.
L /H n o
f l ow d i r e c t i o n inward
f l ow d i r e c t i o n ou tward
1.00
A
A
0.17
•
O
Wo notice that for windows with lower aspect ratio, at small opening
•ingles, the increase of f2(«) with increasing opening angle is stronger
than for windows with larger aspect ratio. This tendency suggests that
somehow the effect of the side areas under the window has to be taken into
consideration. The side areas will be relatively more important for win
dows with lower aspect ratio than for windows with larger aspect ratio.
To interpret these results, we start with our first simple statement,
neglecting any side area effect, that f2(a) = since. To determine the addi
tional effect of the side area to the total ventilation, we adopt the con
siderations of Bot [11]. Looking at the model of fig. 2.9, Bot estimated
the part of the side area which remains free to contribute to the total
oxh.inge area. Some elementary geometries then reveals that the effective
opening of one side area amounts:
II' (II -sinn)' 90-q 360
19

Figure 2.9 Model to describe the effect of the side area.
In order to amount to some possible deviation from this model, Bot still
introduced two arbitrary constants a and b, so that his final results for
f2(a) reads:
IT
f2(a) = sina 1 + ^'f~ (cosa - b-2-îf • (--- ) • sina) (2.8) o
Scale model measurements reported by Bot gave fair agreement with eqn. 2.8
when a = 0.6 and b = 1.00. The a and b value indicate that the complete
circular sections shield off the side areas (b = 1) and that the front
areas are more effective for the exchange of air than the shielded side
areas (a = 0.6).
Figure 2.8 shows that our experimental results are in full agreement with
the geometrical model (represented by the dotted curves) describing the
effective exchange area under the window. In the study on the scale
20

models, the flow direction was from the inside to the outside of the model
greenhouse. The full scale measurements show that no clear effect on the
measured values of f2(a) can be observed from the flow direction through
the window. This implies that the developed expression for f2(<x) holds for
both flow directions.
In addition to the obtained values of f2(a) from the full size experiment,
another measured quantity in this experiment supports the similarity of
the flow properties in both full size and model windows. In the case of
the window with aspect ratio 1.00, which could be opened almost up to 90
degrees, recorded pressure differences over the kinetic energy per unit
volume in the opening (according to eqn. 2 . 1 ) , give relevant information
concerning the friction factor F 0 of the rectangular opening only.
AP 4 2
30
26
22
18
14
10
6
2
_ -
-
--
-
-
-
A
A
I
A
I
A ou tward
A inward
o F0 va lue ( eqn . 2.2)
20 40 60 80°
Figure 2.10 Recorded pressure differences over the kinetic energy per unit volume in the
opening as a function of the opening angle for the window with aspect ratio
1 .00.
Since both functions fi(cc) and f2(ot) approach 1.00 at full opening, the
window function fw(a) will do the same according to eqn. 2.5. Measured _ 2
values of AP/[5-p0-v ] at increasing opening angle will, according to
eqn. 2.4b, approximate the F Q value for the rectangular opening with
aspect ratio 1.00 at full scale. From fig. 2.10, it appears that the F 0
21

value, based on eqn. 2.2 and derived from the experiments with scale
models, matches well with the full size measurements.
2.5 Conclusions
The performed full size measurements of window parameters of the flow
through openings under one-side-mounted windows fit in with previous
measurements carried out on similar scale model windows (1:30 and 1:10).
The results imply the validity of the developed approach to describe the
flow characteristics of these types of window openings for both inflow and
outflow. In this approach the ratio between the length and height of the
opening, i.e. the aspect ratio, plays an important role. A simple model of
the exchange area under the window shows the effect of the side areas for
various aspect ratios. The presented description of the flow characteris
tics can be a useful instrument for predicting the ventilation rate of
buildings containing this type of window.
2.6 References
1 W.N. Shaw, Air currents and the law of ventilation. C.U.P. (1907).
2 J.B. Dick, The fundamentals of natural ventilation of houses. J. Inst.
Heat. Vent. Engrs. 18: 123-134 (1950).
3 M.P. Foster and M.J. Down, Ventilation of Livestock Buildings by
Natural Convection [review paper]. J. agric. Engng Res. 37, 1-13
(1987).
4 M.R. Smith and T.E. Hazen, Similitude Study of Ventilation-Inlet
Configuration. Trans ASAE 11: 218-225 (1968).
5 I.R. Dybwad, M.A. Hellickson, C.E. Johnson and D.E. Moe, Ridge Vent
Effects on Model Building Ventilation Characteristics. Trans ASAE. 17:
366-370 (1974).
6 L.P. Hopkins and B. Hansford, Air flow through cracks. B.S.E. 42:
123-131 (1974).
22

7 K.K. F.gan and M.A. Hellickson, Kidge Vent and Wind Direction Effects
on Ventilation Characteristics of a Model Open Front Livestock
Building. Trans ASAE. 21: 146-152 (1978).
8 M.B. Timmons and G.R. Baugham, Similitude Analysis of Ventilation by
the Stack Effect from an Open Ridge Livestock Structure. Trans AESA
10 81: 1030-1034 (1981) .
9 N.B. Timmons, Use of Physical Models to Predict the Fluid Motion in
Slot Ventilated Livestock Structures. Trans ASAE 1984: 502-506 (1984).
10 l'.R. Warren, Ventilation through openings in one wall only. Proc. 1977
IC1IMT seminar on "Heat Transfer in Buildings". Hemisphere N.Y. (1977).
11 G.P.A. Bot, Greenhouse climate: from physical processes to a dynamic
model. Diss. Agric. University, Wageningen., 240 pp. (1983).
12 B. Borckm.ins, Analyse van de klimaatbeheersing in dierlijke productie
eenheden ter optimalisering van de regeling. Doctoraatproefschrift Nr.
146 aan de Faculteit der Landbouwwetenschappen van de K.U. Leuven [in
Dutch] (1986).
13 J.A. Elliott, Instrumentation for measuring static pressure fluc
tuations within the atmospheric boundary layer. Bound.- Layer Meteor.
2, 476-495 (1972) .
14 A.F.G. Jacobs, A mechanical low pass filter. Intern Rapport Vakgroep
Natuur- en Weerkundc, Agric. Univ. Wageningen (1983).
15 A.F.C. Jacobs. Static Pressures Around a Thin Barrier. Arch. Met.
Geoph. Biocl., Ser. B 35, 127-135 (1984).
23

3 AIR EXCHANGE CAUSED BY WIND EFFECTS THROUGH (WINDOW)
OPENINGS DISTRIBUTED EVENLY ON A QUASI-INFINITE SURFACE
3.1 Introduction
In the energy budget of an enclosure, the energy transfer due to the air
exchange between the interior and the outside air plays an important role.
Physical properties of the inside air such as temperature, relative
humidity and composition are directly affected by the ventilation.
Though mechanical ventilation systems are frequently installed for air
conditioning, for economical reasons natural ventilation is still an
important (or in many cases the only) tool of ventilation used for the
control of the indoor climate. Consequently, the proces of natural ven
tilation is a topic of engineering interest for the thermal design and
climate control of buildings such as glasshouses, schools, offices,
storage depots et cetera.
The driving force for natural ventilation is the pressure difference
across the ventilation openings caused by wind effects or by thermal
effects. When the air exchange of the building or structure only depends
on natural ventilation, the ventilation due to both the wind and the ther
mal effects should provide a sufficient air exchange. The mechanisms
behind both types of ventilation are mutually independent and can be
investigated separately. A study on air exchange due to temperature
effects through different openings is presented in chapter 6. The chapters
3, 4 and 5 of this thesis are concerned with air exchange due to wind
effects.
When the wind blows over and around a building, the wind field generates
different pressures at different locations, which results in a pressure
distribution over the building (Dick [1]). In order to simplify the
approach, in many procedures it is assumed that a static time averaged
pressure Pu (with respect to barometric pressure as a reference) is
generated at the different locations, related to the volumetric kinetic _ 2
energy of the averaged wind field at a reference level, i-pa-u , according
to:
25

. -p I • "a • »2 t3-1)
with:
u = average wind speed at reference level
pa = density of the air
K„ = dimensionless pressure coefficient, from which the spatial distri
bution has to be determined empirically.
When the ventilation openings are located at positions with different
pressures (i.e. at zones with different pressure coefficients), the
averaged static pressure difference between the openings can often be con
sidered as the main driving force for a flow through the enclosure from
one opening to another. Then this approach seems suitable and can be used
to describe the air exchange.
When, however, only one opening is present in a completely sealed enclos
ure the above mentioned approach results in a zero-driving force for ven
tilation, thus resulting in no ventilation at all. The same holds true for
the situation in which more openings are located at positions in a surface
with the same external pressures Pu. This can be the case when the enclo
sure, for instance a classroom or an office, only contains the openings in
one large wall at which the pressure coefficient Kp is identical at any
place. In these cases the fluctuating character of the wind speed and, as
a result of this, the fluctuating pressures exerted on the building should
be taken into consideration (Hill and Kusuda [2], Cockroft and Robertson
[3], Warren [4,5], Narasaki et al. [6]).
The mechanism by which ventilation takes place through one or more openings
due to fluctuating external air velocity, is obviously extremely complex
and consists of a combination of effects (Malinowski [7]). Dependent on
the frequency of the pressure difference oscillations, either pulsating
flow or turbulent diffusion will contribute to the air exchange. In the
case of two or more openings, the correlation beween the pressures
generated at each opening, may result in momentary pressure differences
and thus also have an effect on the air flow and air exchange. Most
experiments investigating the dynamical character of air exchange, are
restricted to ventilation through one or two openings only. To the

knowledge of the author, no direct (full scale) measurements have been
made in which the air exchange of enclosures due to wind effects through
different series of openings in the same plane was studied. In the present
chapter, several aspects of the air exchange through openings at com
parable positions in a 'quasi-infinite' surface are considered. The term
'quasi-infinite' expresses that, in our set up, the surface edge effects
were left aside and that all openings operated under the same geometri
cal conditions.
In the second section of this chapter, a general description of the acting
ventilation mechanisms is presented. The measured ventilation charac
teristics through the openings are compared with this description. The
effects of wind speed, wind direction and number of openings on the air
exchange through the surface are studied in sections 3.3 and 3.4. In the
ventilation experiments, the cover of a multi-span greenhouse served as
the 'quasi-infinite' surface. Usually this type of cover is equipped with
one-side-mounted windows positioned in a regular pattern.
In section 3.5, we investigate how the ventilation through these windows
on the greenhouse cover is affected by their geometry. Apart from a cor
rect representation of the acting ventilation mechanism, this investig
ation also requires knowledge of the flow characteristics of the window
type involved. An empirical model, describing the flow characteristics of
one-side-mounted windows, presented in chapter 2, was employed to evaluate
the results of the experiments.
3.2 General approach
The Dutch Venlo type greenhouses represent perfect objects for our in
vestigation. The greenhouses are built as large multi-span units with
their walls almost completely sealed and all ventilation windows distri
buted in a regular pattern on the (saw-tooth shaped) cover. Venlo type
greenhouses are usually found to have one-side-mounted windows hinged from
the ridge. In most cases, the ventilation windows are opened on the
leeside only.
Let us consider an infinite Venlo type greenhouse cover with its windows
opened on one side only. Since all openings are located at the same posi-
27

tion in the span and the pressure field is identical around each span, the
mean pressure due to the wind will be the same at the different window
openings. Even so, as the wind has a turbulent character, the momentary
pressures over the windows will fluctuate. Bot [8] demonstrated that in
this case the ventilation was mainly due to the pulsating indoor-outdoor
pressure difference caused by the variations in the wind velocity.
The amplitude of the pressure fluctuations Pu over the windows can be con
sidered as the driving force for the ventilation process. Bot postulated a
relationship for this driving force analogous to eqn. 3.1:
Pu = Kf • \ • pa • Ü2 (3.2)
defining the pressure fluctuation coefficient Kf, which relates the am
plitude of the fluctuating pressure over a window opening in the cover
surface to the volumetric kinetic energy of the averaged wind field at
reference level. The fluctuating pressures near the opening are determined
by the local wind field (near the opening) , which is affected by the
geometry of the cover surface. Therefore Kf also embodies the translation
of the wind field at reference level to the wind field near the opening.
Since the window opening angle a and also the dimensions of the window
determine the geometry of the cover surface, it is expected that Kf is a
function of the window type and opening angle a. By the way we remark that
both window type and opening angle play a double role in the air exchange
through the windows, since they also determine the flow characteristics of
the window opening, as will be discussed later.
We ascertain that the amplitude of the fluctuating pressure difference
over the window opening acts as the driving force for the ventilation. To
determine the corresponding volume flux through the openings we also need
the flow characteristics of the openings. Therefore, when studying the
ventilation of an enclosure, knowledge of the flow characteristics of the
openings is essential.
An expression for the stationary flow characteristics for one-side-mounted
windows, such as the windows of the greenhouse compartments considered,
was presented in chapter 2. Basically, a translation was developed between
the flow through a rectangular opening (fig. 3.1) and a flow through the
same opening but now with a flap mounted on the upper edge (fig- 3.2). The

flow resistance of the rectangular opening could be formulated in an
Euler-like relationship (200 < Re < 21000):
AP = F (L /H )
o o o
with:
v = the averaged velocity in the opening
p0 = the density of the air in the opening
(3.3)
Figure 3.1 Rectangular opening. Figure 3.2 One-si de-mounted window.
The function F0(L0/H0) is called the friction factor of the opening.
Eqn. 3.3 shows that for the given region 200 < Re < 21000 the air flux
through the opening was found to be a function of the ratio of the length
and height (i.e. the aspect ratio) of the aperture only, independent of
the specific Re number. A relation between the existing pressure dif
ference (AP) and the corresponding volume flux ($v) through the rec
tangular opening can be found when eqn. 3.3 is rewritten as:
, 2
AP = F $
(3.4)
with A 0 = L0-H0, the opening area (and thus v = $ V /A 0 ).
For the same opening, but now with a flap (i.e. the window in fig. 3.2),
the opening area of the window Aw and the friction factor of the win-
29

dow opening Fw will depend on the opening angle. They can be related to
the original opening area A 0 and friclion factor F 0 by means of the
functions f^a) and f2(<x) as follows:
F f,(cx) (3.5a)
A f2(«) (3.5b)
Eqn. 3.4 can be transformed, using eqn. 3.5a and 3.5b, into a relationship
between the pressure difference over the window opening and the corres
ponding volume flux under the window flap:
2
AP = [F /f (a) o w
1 * (3.6)
with the window function fw(a) as a combination of the functions fi(a) and
f2(a):
f (a) = [f2(a)]J/fi(a) (3.7)
When, during a specific period, the air exchange through all the openings
together is considered, it can bo assumed that no net flow occurs through
the cover. Moreover, it can be assumed that the ventilation features of
all windows are equal since they all operate under the same conditions.
Furthermore, when we accept as a working hypothesis that the momentary
flow direction through a particular window is either inward or outward and
that the fluctuating pressure difference over the opening effectively
generates a constant ventilation flux, then eqn. 3.2 and 3.6 can be com
bined taking AP = Pu. Realizing that half of the total number of windows
is used for inflow and the other half for outflow, this leads to an
expression for the inward (and outward) flux through any window:
*
A
K,(<x) • f (a) E W
F (3.8a)
which can be written as:
A
C(a) (3.8b)
30

Eqn. 3.8b states that a linear proportionality exists between the air flux
$v and windspeed u at reference height for any window opening angle a. The
function G(a) combines the flow resistance of the window opening, defined
in the window parameters F0 and fw(<x) , and the pressure fluctuation coef
ficient Kf(oc) near the windows. Obviously, the ratio (pa/p0) plays a minor
role. The function G(a) describes the relation between the ventilation
flux per unit window area of the cover surface and the average windspeed
at reference level, in dependence of the opening angle a.
The concept of existing fluctuating pressures near the openings not only
implies the existence of varying pressure differences over one window
opening, but also the possibility of instantaneous pressure differences
between different window openings. As the result of these instantaneous
pressure differences between the various openings, air flows may be
generated between different openings on the cover. This might affect both
the ventilation features of the individual opening and the air flux per
unit opening area of the whole surface. In this respect, it can be
expected that the number of openings, as well as the position of the open
ings in relation to each other, are of importance.
In our experiments we first investigated whether the air exchange through
the cover surface corresponds with the predicted behaviour according to
eqn. 3.8. Next, the ventilation characteristics of different compartments
with different surface areas (and consequently a different number of open
ings) were compared. Finally, the effect of the window geometry on the
ventilation characteristics was examined.
3.3 Ventilation through a fixed number of openings
3.3.1 Experimental set up
The objective of this study was to investigate the air exchange through
a surface with some openings located at positions with the same pressure
coefficients Kp.
A situation in which the pressure field is identical around the openings
can be assumed when the openings are distributed evenly throughout an
31

infinite surface. In our experiments, the Venlo type greenhouse cover is
used as the surface containing the openings. However, greenhouses, though
built in large multi-span units, are not infinite structures. An identical
pressure distribution around the window openings can be expected for win
dows located in the centre of the greenhouse block. Near the side walls of
the structure however, additional static pressures will occur and static
pressure differences between the window openings in opposite side walls
can be expected. These static pressure differences may result in the addi
tion of a continuous ventilation flux superimposed on the effective flux
due to fluctuations and can substantially affect the ventilation features
of the greenhouse cover.
To avoid this 'side wall effect' in our experiments, the ventilation
measurements were performed in fully enclosed greenhouse compartments with
their walls relatively far from the outside walls of the whole greenhouse
structure. Since the side walls of the compartments were carefully sealed
off, the effect of the static pressure differences between the outside
walls of the structure on the ventilation features of the compartment were
eliminated.
In the present experiment, the ventilation measurements were carried out
in some of the 24 identical standard compartments, located in a large
glasshouse block (70 x 33 m2, fig. 3.3), neighboured by identical glass
houses and situated at the Glasshouse Crops Research Station, Naaldwijk,
The Netherlands, (Van de Vooren and Koppe [9]). These compartments are
equipped with windows with dimensions L 0 = 1.46 and H 0 = 0.80 m hinged
from the ridge on both sides of the span.
The air exchange between any observed enclosure and its environment is
often expressed as a so-called ventilation rate. This quantity is defined
as the volume flux of air entering (and thus leaving) the enclosure per
unit volume of the enclosure, i.e. the total number of complete air
changes per unit time. It is usually expressed in air changes per hour.
The air exchange rate or ventilation rate R (and so the volumetric air
flux through the openings) of an enclosure, can be measured by means
of a tracer gas (Hitchin and Wilson [10]).
In our experiments, we apply the decay rate method. In this method a quan
tity of tracer is released and distributed in the closed enclosure until a
32

70 m
Figure 3.3 Large greenhouse block with 24 standard compartments.
uniform, or nearly uniform, concentration in the enclosure is achieved.
After opening the enclosure, the concentration of tracer in the enclosure
will decrease due to air infiltration. When we assume the air to be per
fectly mixed, this decay will be exponential according to the mass balance
of tracer in the enclosure:
dc/dt (c Ca>
thus, for constant $v,
In [(c - ca)/(c. - ca)] v
/V
(3.9)
(3.10)
with:
c = concentration of tracer in the enclosure
c-£ = initial concentration of trac
ca = ambient tracer concentration
V = volume of the enclosure
$ v = ventilation flux
t = time.
33

By sampling the air on a minute base (relatively fast compared to the
decrease), the ventilation rate can be determined from the slope of the
graph obtained by plotting ln(c-ca) versus time. In all our experiments,
the used tracer (N20) was blown into the closed compartments and distrib
uted through perforated tubes on the ground surface. The air was sampled
at different spatial positions and led to an IR gas analyser.
For a full range of window openings the concentration of the tracer in the
greenhouse, the air temperature inside and outside the greenhouse and the
mean wind speed and wind direction at reference level of 10 m were meas
ured on a minute base. During the experiments no crops were grown in the
compartments.
3.3.2 Results and discussion
In fig. 3.4, a record of the measured tracer gas concentration during one
experiment is presented together with its natural logarithm. The linear
decrease of ln(c-ca) versus time, according to eqn. 3.10, suggests that a
continuous effective ventilation flux is found. This despite the fluc
tuating character of the wind. In fig. 3.5a-d a representative selection
from measured leeside ventilation results for some window openings of the
standard compartment is shown. The wind direction during the measurements
was distinguished into two angles with respect to the window on the cover
according to the figure.
9̂.20
~8.40 (0
Ë t 7.60
6.80
6.00
5.20
^ 2 0 0 5.60'
500 600 700 -M.60
800 900 1000 -•time (s)
Figure 3.1 Recorded windspeed (ms ') and tracer gas concentration (ppm) together with its
natural logarithm (In ppm) during one measuring period.
34

Ci_scws_oû (D
— e — i
\ •[ o\J ° / l / *l
\ •
•
°o
\ o •
\
\
Ci-Sewz_ODA<l> — Q - V z - O D N D -
35

From fig. 3.5a-d a linear relationship between the flux through the open
ings and wind speed can be observed for various window openings, as was
predicted in eqn. 3.8. No unambiguous effect of the wind direction on the
ventilation can be noticed. During these ventilation measurements, the
compartment was unheated and the temperature difference between the inside
and outside air averaged 5 K. The recorded wind speed during all measure
ments was higher than 2 m/s. Given the results of the study on ventilation
due to thermal effects as presented in chapter 6, it can be concluded that
in the following experiments the measured air exchange is mainly a result
of wind effects.
When the slopes of the ventilation flux - wind speed graphs are plotted
against the window opening angle a for all the realized openings we arrive
at fig. 3.6. It shows that the compartments are well-sealed since the
measured leakage (a = 0°) is close to zero. When the windows are opened up
to 15 degrees, the ventilation rises with some approximation in linear
proportion to the opening angle. For larger window openings the efficiency
decreases. The windows can be opened to a maximum angle of 44°. When we
assume that the ventilation flux tends to a maximum value in an approx
imately exponential fashion, the following function for G(cc) can be fitted
through the measuring points :
G(a) = 2.29 • IQ"2 • [1 - exp(-a/21.1)] (3.11)
Figure 3.6 Measurements and fit of ventilation flux over wind speed (normalized per unit area of ventilation windows (A0)) as a function of the window opening.
36

The results are in agreement with Bot [8] and Nederhoff et al. [11], who
measured ventilation rates in the same standard compartments. Nederhoff
measured the ventilation for small openings (0-15% = 7°), also using the
decay rate method, with C02 as a tracer gas. Bot used a static tracer gas
method and also measured at window openings up to 44°. In Bot's experi
ments, the tracer gas was injected continuously with a constant flow into
the compartment. Measurements were performed in the equilibrium situation.
The static continuity equation then leads to the ventilation flux $ v
according to:
$ = $ /(c - c ) (3.12) v m a
with $ m = mass flux of injected tracer gas and c-ca the concentration
difference of tracer gas between the inside and outside.
Both eqn. 3.10 and 3.12 are based on a perfect mixing of the inside air.
However, the physical volume of the greenhouse compartment may not be the
volume participating in the air exchange. The effective volume of the
space may be smaller than the physical volume if there are regions of
stagnant air (e.g. in the corners). The major advantage of the constant
flow method is that the problem of the unknown effective volume does not
figure according to eqn. 3.12. On the contrary however, the rather long
time needed before equilibrium is reached is a major disadvantage causing
difficulties in the application of this method in field experiments. In
addition to this, more tracer gas and more sophisticated equipment is
required for the experiments.
For the whole range of window apertures (0° < a < 44°) , the experimental
data of Bot are in full agreement with the present data. Bot's data were
fitted in a slightly different function, formulated as:
G(<x) = 1.07 • 10"3 • a • exp(-ct/50) (3.13)
For increasing opening angles, this latter relation expresses the devia
tion from a linear relationship between the ventilation flux and the open
ing angle a. This reveals that the efficiency of larger window openings
decreases. When our measuring points are fitted to this function, we find
the coefficients 1.03-10"3 and 54.6 respectively. The similarity of the
results implies that the effective volume equals the physical volume of
the compartment. In these compartments, the decay rate method can be con-
37

sidered to be an appropriate method for inferring the ventilation
features.
3.4 Ventilation through different numbers of openings
3A.1 Experimental set up
To be able to study and compare the ventilation flux through different
cover surfaces with different numbers of openings, the corridors of the
multifactoral climate greenhouse (fig. 3.3) were converted into five fully
enclosed compartments of different size, each with sealed side walls and
containing ventilation windows similar to the ones mentioned in section
3.3.
The cover area of these compartments was varied lengthwise (number of
spans) and widthwiso (width of the span), so that all windows of the com
partment were located either at different (successive) spans or at the
same span. In this way, three compartments (T, II and III) with a length
of 6, 13 and 20 spans and two compartments (IV and V) with one span with
widths of 12 m and 27 m (and containing 4 and 8 windows) respectively, were
available in addition to the standard compartment (fig. 3.7). The ventila
tion fluxes through the window openings of the compartments were measured
in the same way as described in section 3.3.
V t> > > > > > > > > > > > > > > > > > > >
Hrjuri: 3./ Cons true led compartments in the corridors of thu greenhouse block.
38

3A.2 Results and discussion
For a comparison of the ventilation characteristics of the different
covers, the measured leeside ventilation of the different compartments is
represented as values of the function G(a) according to eqn. 3.8b. These
values (i.e. the slope of a ventilation flux - wind speed graph) are
mostly based on data of three or four decay rate measurements. Again, for
all the measurements, no effect of the wind direction on the air exchange
could be observed.
Here, analysis of the recorded temperatures and wind speeds in the ven
tilation experiments also showed that the measured ventilation rates were
mainly determined by wind effects. Figure 3.8a shows the measured ventil
ation fluxes expressed as G(a) for the compartments I, II and III, dif
fering in the number of spans as a function of the window opening angle.
For compartments IV and V, differing in width, G(ct) is presented in
fig. 3.8b. A comparison of the measurements in all compartments, including
the standard compartment (VI), is made in fig. 3.8c.
Figure 3.8a shows that the measured leakage ventilation and the ventila
tion at small window openings of compartments I-III are of the same order
of magnitude. For large window opening angles the measured ventilation is
more divergent, in addition to which it seems that the ventilation flux of
the longest compartment with the highest number of windows is higher. In
O
Ö W O o t
15
10
5
.-
I
0
g 8
0
0
ê
o
©
o
0 O •
10 20 30 40 50
Figure 3.8a Measured values of the ventilation function G(oc) for the compartments I-III. D= compartment I .£>= compartment II 0= compartment III.
39

Figure 3.8b Measured values of the ven t i l a t i on funct ion C(a) f o r the compartments IV and V. •*= compartment IV ^ .= compartment V
Figure 3.8c Measured values of the ven t i l a t i on funct ion G(a) for the compartments I -V I . • = compartment V I , other symbols as indicated in f i g . 3.8a and 3.8b.
f i g . 3.8b the measured leakage and the v e n t i l a t i o n through the opened
windows of compartments IV and V do not d i f f e r s i g n i f i c a n t l y . I t can be
seen from the f igures t h a t the values of the measured leakage in the
cons t ruc ted compartments a re higher than the leakage in the s tandard com
partment VI. This i s due t o the fact t h a t in the s tandard compartment not
only the leaks in the s ide wal ls but a l so the leaks in the cover were
sea led c a re fu l ly and i t i s t h i s s ea l ing of the cover t h a t was not per
formed for the compartments I-V in the c o r r i do r s .
40

The higher air leakage rate of the compartments I-V may have resulted in
an increase of the measured ventilation for all window openings. Indeed,
from fig. 3.8c it can be observed that for small window openings the
measured air exchange of compartments I-V seems to be slightly higher
than the va Ivies of the standard compartment.
For larger window openings however, the effect of the leakage on the ven
tilation is less perceptible, since then the scattering of the measuring
points appears to increase. This is the result of the higher measuring of
ventilation fluxes at large window openings. The fitting of the exponen
tial decay curve of the tracer in the compartment is then based on a
shorter time interval, i.e. less data points during one measuring period.
The overall picture of the results shows that no consistent differences in
the air exchange characteristics of the compartments of various size can
be noticed. Apparently, in this set up, the presence of other window
openings in the immediate viscinity does not affect the averaged ven
tilation flux through the individual window openings. This applies when
the neighbouring windows are located on the successive spans or on the
same span. These results indicate that there is no correlation between the
air exchange through the individual windows and that air exchange through
one particular window is mainly driven by the pressure fluctuations over
the window in question. The given description of the inflow and outflow
through the individual windows, seems to be a correct representation.
3.5 The effect of the window geometry on the ventilation
3.5.1 Considerations
The effect of the window geometry of the one-side-mounted window on the
ventilation characteristics through the window opening (eqn. 3.8) is ex
pressed in the window variables F0, fi(a) and f2(oc). In eqn. 3.3 and 3.5,
which define F0, f,(a) and f2(a), the ratio of the length and height of
the window opening appears to be of cardinal importance (chapter 2) . To
check the effect of the window geometry on the air exchange, experiments
are performed for the ventilation through window openings with varying
aspect ratios. The function G(a) (eqn. 3.8) for leeside ventilation
41

through windows with aspect ratio 1.825 (L0 = 1.46 m and H 0 = 0.80 m) was
already experimentally determined in sections 3.3 and 3.4. This data will
be discussed in this section in connection with the leeside ventilation
measurements through windows with aspect ratio 1.00 (L0 = H 0 = 0.71 m) and
0.47 (L0 = 0.73 m and H 0 = 1.55 m ) .
The window variables F0, ft(a) and f2(oc) are affected by the aspect ratio.
In section 3.2, it was suggested that this also holds for the pressure
fluctuation coefficient Kf (a). It is difficult to a priori determine or
estimate this effect. However, it can be evaluated afterwards from the
measured ventilation functions.
For the window with aspect ratio 1.825 for instance, the function Kf(a)
can be calculated with the known flow characteristics (determined from
the flow experiments in chapter 2) and the ventilation function G(a)
(determined from the ventilation experiments in sections 3.3 and 3.4)
according to eqn. 3.8. For that purpose eqn. 3.8 can be rearranged to:
4 • p • F • [G(a)]2
K f ^ = p . f (a) <3-14> a w
Also doing this for the other window geometries, the effect of the window
geometry on Kf(a) can be evaluated with the opening angle ce as a para
meter. The measured ventilation function G(a) for the different window
geometries was used to compare the ventilation properties of the different
windows, since it expresses the average ventilation flux of the algebraic
sum of the individual windows at any windspeed.
3.5.2 Experimental set up
The new measurements were performed in an airtight compartment construct
ed in the centre of a greenhouse block which was mentioned in chapter 2.
In this way, disturbances due to the additional static pressures that
occur near the outside walls of the greenhouse structure were ruled out as
much as possible and the ventilation can be considered to be solely due to
the pressure fluctuations over the windows. The cover of the compartment
was equipped with one-side-mounted top hinged ventilation windows with
either aspect ratio 1.00 or 0.47.
42

The ventilation flux through these windows was measured by means of the
decay rate method, as already described in section 3.3. During the meas
urements, no crop was present and the compartment was unheated.
3.5.3 Results and discussion
Analysis of the measurements shows that the effect of the temperature dif
ference between the in- and outside air on the total ventilation can be
regarded as small, as compared to the wind effect.
According to eqn. 3.8, a linear relationship was to be expected between
the recorded wind speed at reference level and the air flux for any window
opening and window geometry. This linear proportionality was already con
firmed in the ventilation measurements through windows with aspect ratio
1.825 (sections 3.3 and 3.4 of this chapter). In the ventilation experi
ments, using windows with aspect ratio 1.00 and 0.47, the relation between
the wind speed and ventilation flux was again determined for a range of
openings .
The results of these latter measurements corroborate the previous find
ings. For a few opening angles this is illustrated in a ventilation flux-
wind speed graph in fig. 3.9. In the calculations, the wind direction in
relation to the windows, was classified according to the figure. Despite
the scattering of the measuring points, the measurements for the lower
aspect ratios seem to show some consistent effect of the wind direction
on the ventilation. This effect should be stronger when the windows are
opened further. This might be seen when the calculated points of the ven
tilation function G(a) are plotted against the opening angle for dif
ferent classes of wind direction (fig. 3.10a,b). The effect of the wind
direction was not found for the ventilation through windows with aspect
ratio 1.825. It is hard to explain why it should appear for the ven
tilation with the smaller aspect ratio 1.00 and 0.47. Possibly the eddy
size of the turbulent wind in relation to the length of the window (L0)
could be a significant factor in this matter. It could explain that the
effect of the wind direction for the windows with aspect ratios 0.47 and
1.00 is of equal magnitude since both windows have almost the same length.
43

^ 50
C "O
opening angle 17.7°
e t
30
2 0 -
* / /
I I
• / o
•/ I
I I
I I
I /
-i I I L_
m
0 1 2 3 4 5 6 7 8 —*~ ü (ms"1 )
40
o 30
> e t
20
10
opening angle 6.6°
/ /
/
/ o o
_i l i_
m
0 1 2 3 4 5 6 _7 8 — u Cms-')
^ 10 (/) E 9
CM
O c; 8 > « t 7
6
b
4
3
2
1
- \° * \ • ^
• / f i
o .
/ * {/*
opening angle 2.4°
m /
/ /
/o / /
/ /
/ /
/ /
/ / /
/ / /
i i i i i i . 0
F i g u r e
6 7 8 - • üCma-1 )
cp 40
1
i 3 0
20
10
opening ang le33.2°
/ / / o
/o
- I I I I I L_ 6 7 - • ü Cms 1?
3.9a-d Ventilation flux in the compartment as a function of the average wind speed.
Fig. 9a-b: window type t_0 = 0.73 m, H0 = 1.46 m. Fig. 9c-d: window type L0 =
H 0 = 0.71 m. The wind direction is specified according to the figure.
44

Figure 3.10a Values of the ven t i l a t i on funct ion G(ci) fo r the window with aspect rat io 0.17. The wind d i rec t ion is c l ass i f i ed according to the f i gu re .
Figure 3.10b Values of the ven t i l a t i on funct ion G(<x) for the window with aspect ratio 1.00. The wind d i rec t ion is c l ass i f i ed according to the f i gu re .
Anyway, more ex tens ive experimental evidence i s necessary t o obtain defin
i t e c onc lus ions .
To compare the v e n t i l a t i o n c h a r a c t e r i s t i c s of the windows, the f i t t e d cur
ves of the v e n t i l a t i o n function G(a) of the windows with aspect ra t io
1.825, 1.00 and 0.47 are c o l l e c t ed in f i g . 3 .11 . For the windows with
aspect r a t i o 1.00 and 0.47 these functions were c a l cu l a t ed analogous to
eqn. 3 . 11 . However, they were only based on measuring points with the wind
45

direction almost at right angles to the window. The functions for the
observed types of windows are found to be :
G(a) = 2.62 • 10"2 • [1 - exp(-a/14.6)] (3.15)
for the window with aspect ratio 1.00, and:
G(a) = 1.91 • 10-2 • [1 - exp(-a/5.1)] (3.16)
for the window with aspect ratio 0.47.
,-,30
50
Figure 3.11 Ventilation functions G(cc) of the windows with aspect ratio 1.825, 1.00 and 0.17.
Figure 3.11 shows that for the windows with the smaller aspect ratios, the
initial increase of the ventilation function G(o) is faster than for win
dows with higher aspect ratios. This effect can, at least partly, be ex
plained by the flow characteristics of the windows (chapter 2 ) . In par
ticular, the greater effect of the side areas of the windows with smaller
aspect ratios should be mentioned.
However, the window parameters F 0 and f w (a) alone, do not fully explain
the measured ventilation characteristics of the various windows. From
the experimentally obtained ventilation function G ( a ) , the pressure fluc
tuation coefficient Kf(a) can be calculated according to eqn. 3.14 for
the various window types. These pressure fluctuation coefficients Kf(<x)
are presented in fig. 3.12 for the window geometries under study. When
this coefficient was defined in eqn. 3.2, it was already suggested that
its value could be affected by the geometry of the surface and (therefore)
46

« 7
Se ^Lo'Ho-0.47 \
10
LQ/HO-1.825
20 30 40 50
Figure 3.12 The pressure fluctuation coefficients Kf(a) for the windows under study.
also by the window type and opening angle. This seems to be confirmed by
our experimental results.
It appears that both the pressure fluctuation coefficent Kf(oc) and the
flow characteristics of the windows (determined by the window parameters
fw(a) and F0) play their own role in the air exchange through the windows.
The flow characteristics of the window openings are known and are deter
mined by the dimensions of the window and the window opening angle. From
the ventilation experiments presented in this section, the pressure fluc
tuation coefficient Kf(a) is derived for different one-side-mounted win
dows on a saw-tooth shaped surface. The results indicate that the pressure
fluctuation coefficient Kf(a) is affected by the window type. Apparantly,
the local obstacles on the cover geometry (i.e. the windows) are important
contributing factors which determine the local flow field and, consequent
ly, the pressure fluctuation coefficient. Future research is necessary to
reveal how the pressure fluctuation coefficient is related to the local
flow field and, so, to the geometry of the surface and the dimensions of
the window.
3.6 Conclusions
An approach was presented to predict the air exchange through a surface
with openings which are located at places with the same mean pressure
distribution.
47

In this approach the amplitude of the fluctuating pressure difference
over the openings acted as the driving force for the ventilation. It was
postulated that this driving force was proportional to the volumetric
kinetic energy of the averaged wind field at reference level. The measured
ventilation characteristics, through openings located at comparable places
in a 'quasi-infinite' surface, were in full agreement with these predic
tions . In the experiments, the cover of a Venlo type greenhouse was used
as a 'quasi-infinite' surface containing window openings of one-side-
mounted windows in a regular pattern. The performed ventilation measure
ments indicated that the ventilation flux through a number of window open
ings in such a configuration can be considered as the sum of the ven
tilation fluxes through the separate openings.
The ventilation features through the openings of the one-side-mounted
windows were affected by the geometry of the windows. The experimental
results could be partly explained by the flow characteristics of this type
of window. However, the measurements also indicated that the pressure
fluctuation coeffients, relating the volumetric kinetic energy of the
averaged wind field at reference level to the amplitude of the pressure
fluctuations near the openings, were not the same for the various windows
observed. This difference is caused by the different locations of the win
dows on the cover surface and their different geometry.
3.7 References
1 J.B. Dick, The fundamentals of natural ventilation of houses. J. inst.
Heat. Vent. Engrs. 18: 123-134 (1950).
2 J.E. Hill and T. Kusuda, Dynamical character of air infiltration.
ASHRAE trans. 81: 168-185 (1975).
3 J.P. Cockroft and P. Robertson, Ventilation of an Enclosure through a
Single Opening. Building and Environment 11: 29-35 (1976).
4 P.R. Warren, Ventilation through openings in one wall only. Proc. 1977
ICHMT seminar on "Heat Transfer in Buildings". Hemisphere N.Y. (1977).
5 P.R. Warren, The analysis of single-sided ventilation measurements.
Air Infiltration Review, Volume 7, No. 2 (1986).
48

6 M. Narasaki, T. Yamanaka and M. Higuchi, Influence of turbulent wind
on ventilation. Preprint for Indoor Air 87 Conference, Berlin. 17-21
August (1987).
7 H.K. Malinowski, Wind effect on air movement inside buildings. Paper
presented at Tokyo Conference of Wind Loads, Tokyo, Japan, September
6, (1971).
8 G.P.A. Bot, Greenhouse climate: from physical processes to a dynamical
model. Diss. Agric. University, Wageningen., 240 pp. (1983).
9 J. van de Vooren and R. Koppe, R., 1975. The climate glasshouse at
Naaldwijk. Neth. J. Agric. Sei. 23: 238-247 (1975).
10 E.R. Hitchin and C.B. Wilson, A review of experimental techniques for
the investigation of natural ventilation in buildings. Building
Science 2: 59-82 (1967).
11 E.M. Nederhoff, J. van de Vooren and A.J. Udink ten Cate, A practical
tracer gas method to determine ventilation in greenhouses. J. Agric.
Eng. Res., 31 (4): 309-319 (1985).
49

4 THE WINDWARD SIDE VENTILATION AND THE COMBINED LEESIDE AND
WINDWARD SIDE VENTILATION
4.1 Introduction
In actual practice equal growing conditions in the greenhouse are impor
tant to achieve a uniform development of the crop. This is the main reason
that, when ventilation in the greenhouse is required, the leeside windows
should be opened first, since this type of ventilation provides a more
equable air infiltration as compared to the windward side ventilation. In
the latter type of ventilation the wind blows directly into the opened
windows, which may cause undesired local draughts. As a result, the
leeside ventilation can be regarded as the most important application of
ventilation as a tool in the climate management and therefore has the
greatest attention in the present thesis.
However, when the leeside ventilation is inadequate to achieve a desired
air exchange, the windward side windows are also opened so as to increase
the ventilation flux. To gain insight into the effect of combined leeside
and windward side ventilation, quantitative knowledge of this combined
mechanism has to be available. To the author's knowledge no ventilation
measurements were performed up till now in Venlo type greenhouses, both
when the windows were opened on the windward side or when they were opened
in combination of the windward side and leeside of the spans. Therefore,
an exploratory investigation was performed which will be discussed in the
present chapter. At the end of this chapter no pertinent references can be
given.
When the windows on the cover are opened on the leeside of the spans only,
the pressure fluctuations over the window openings act as the driving
force for ventilation. The experiments in chapter 3 indicate that the air
exchange through the individual window is determined by the pressure fluc
tuations over the window opening in question and that it is not affected
by the presence of other leeside window openings. However, when the win
dows are opened on both sides of the spans, an averaged static pressure
51

difference may occur between the windows on the leeside and windward side,
which could generate a cross flow between the windows on the opposite
sides of the spans. As a result the original leeside (or windward side)
ventilation flux through the individual window may now be affected by the
presence of window openings located on the opposite side of the span. The
arrangement of the windows on the greenhouse cover, in particular the
distance between the leeside and windward side window openings on the
spans, may be an important factor in this respect. Usually, the windows of
Venlo type greenhouses are mounted alternately lengthwise on both sides of
the ridge, so that when a window is open on one side of the ridge the
glass immediately opposite is fixed. The number of glass panes mounted in
between the succesive windows on the ridge varies for different green
houses .
In the experiments presented in the next section, it was investigated how
the combined ventilation is related to the separate leeside and windward
side ventilation. It was chosen to perform the measurements in a compart
ment with the succesive windows on the ridge positioned alternately
according to figure 4.1. For such a window arrangement, with a relatively
short distance between the window openings on the opposite sides of the
spans, a cross flow, if present, may occur more easily.
Looking at the results in section 4.2, it was considered to be of interest
to measure the windward side ventilation characteristics of the windows
mentioned in the previous chapter, which were mounted on a 'quasi-infinite
cover. The results of these measurements are given in section 4.3.
4.2 The combined leeside and windward side ventilation
4.2.7 Experimental set up
To study the combined action of leeside and windward side ventilation,
ventilation measurements were performed in a greenhouse compartment at the
IMAG (Institute of Agricultural Engineering, Wageningen, The Netherlands).
In fig. 4.1 the geometry and situation of the compartment is given,
together with the position of the leeside and windward side ventilators
(L0 = 2.00 and H 0 = 0.80 m ) . The figure shows that the compartment is
52

Figure '1.1 Greenhouse compartment (IMAG).
located along a side wall of a greenhouse block. Therefore the cover of the
compartment can not be considered as 'quasi-infinite'. The present experi
ment, however, aims at a comparison of the effect of combined ventilation
with that of separate leeside or windward side ventilation. Qualitatively
this comparison will not be affected too much by the occurrance of a small
side wall instead of a complete 'quasi-infinite' cover.
In the compartment first the leeside and windward side ventilation
characteristics were determined separately. Then measurements were per
formed for a range of simultaneously opened leeside and windward side
windows. The ventilation rates were measured in the way described in
chapter 3. During the experiments no crop was grown in the compartment and
the compartment was unheated.
t.2.2 Results and discussion
The measured ventilation fluxes are represented as the ventilation func
tion G(a) as defined in eqn. 3.8b in chapter 3:
53

G(a) = * v / [u (4.1)
with:
average wind speed at reference level
area of ventilating windows
In fig. 4.2, measured fluxes for both the separate leeside ventilation
and windward side ventilation are given. All the measurements were per
formed at the same wind direction, transverse to the line of the ridge.
For this wind direction, the wind approached the compartment after having
passed at least 13 spans. During the measurements the temperature dif
ference between the inside and outside air was small and the wind speed
varied from 3-6 m/s, so the air exchange can be considered to be mainly
caused by wind effects.
52,
;48
!
;44
40
36
32
28
24
20
16
12
8
4
0'
, windward side
P
/ leeside
I
° /
j I i i i i i i i i i i i i i _ 12 16 20 24 28
— a
Figure 1.2 The measured leeside and windward side ventilation characteristic of the compartment.
54

For the leeside ventilation an exponential course is found, comparable to
that of the measured leeside ventilation characteristics for a 'quasi-
infinite' cover, which have been reported in the previous chapter. The
windward side ventilation, however, seems to be almost directly propor
tional to the window opening angle.
It was already mentioned that the ventilation measurements in this section
were not performed in a fully enclosed compartment. Therefore a com
parison of the ventilation characteristic of the window type with aspect
ratio 2.5 with that of the window types mentioned in chapter 3 is not
significant since some effects on the ventilation of additional static
pressures near the side wall may occur. The effects of the side walls of
the structure on the air exchange will be discussed in chapter 5.
The ventilation function G(a) relates the ventilation flux per unit ven
tilation window area of the cover surface to the average windspeed at
reference level. In case of the combined ventilation, the total window
area is doubled. To be able to compare the different types of ventilation,
the values of the function G(a) of the combined ventilation will be based
on the same window area corresponding to either windward or leeside ven
tila tion.
Measured values of the combined leeside and windward side ventilation are
presented in fig. 4.3. In this figure the measuring points are values of
the measured ventilation function G(a) for a range of window openings at
the leeside (horizontal axis) with, at the same time, a fixed window
opening at the windward side. During the experiments, the chosen window
openings on the windward side were relatively small. When the windows are
widely opened on both sides, very large ventilation fluxes will occur.
This generally results in an increase of the scattering of the measuring
points, which hampers the interpretation of the results.
In fig. 4.3, the determined leeside ventilation characteristic of the com
partment (fig. 4.2) is given as a reference (curve 5 ) . All the measuring
points in fig- 4.3 with small windward side window openings of 0.7°, 1.5°
and 3° are based on a set of at least two coherent measuring periods. For
these window openings, despite the usual scattering of the measuring
points, a general trend is noticeable in the figure: the combined ven
tilation flux seems to be approximately equal to the sum of the separate
55

Figure 1.3 The combined leeside and windward side v e n t i l a t i o n .
measuring point
• • D •
fixed opening angle at windward side
a = 12°
a = 3°
a = 1.5° a = 0.7°
The curves 1-5 indicate the sum of the separate leeside and windward side f luxes fo r f i xed windward side openings of 12°, 3 ° , 1.5°, 0.7° and 0° respect ive ly .
l ees ide and windward s ide v e n t i l a t i o n f l uxes . This i s shown in the f igure
by the dashed curves which r epresen t the c a l cu l a t ed sum of the s epara te
l e e s ide and windward s ide v e n t i l a t i o n for the r e levan t window opening
angles a t l e e s ide and windward s i d e , according to f i g . 4 . 2 . In f i g . 4 . 3 ,
for the l a r ge s t opening of the windward s ide v e n t i l a t o r s (12°) , only two
measuring p o i n t s , each based on one measuring per iod only , a re a v a i l a b l e .
56

Despite the smaller reliability of these points, due to the expected large
scattering at large window openings, they certainly sooner confirm than
contradict the observed trend.
It can be expected that static pressure differences will occur between the
leeside and windward side of a span, so between the windows at both sides.
However, no clear effect of a possible internally connected flow path be
tween the windows on the ventilation can be observed. For very large window
openings on the windward side, however, this could not be reliably in
vestigated due to the very high ventilation fluxes and therefore the
short respons times.
The results in this section indicate that both the leeside and windward
side ventilation characteristics contain valuable information to under
stand the combined ventilation as the sum of the individual components.
Therefore it was considered to be of interest to measure and present the
windward side ventilation characteristics of the fully enclosed compart
ments equipped with windows with the various aspect ratio of 1.825, 1.00
and 0.47; in addition to the previous chapter, where the separate leeside
ventilation was studied for the same aspect ratios. These characteristics
describe the windward side ventilation through the windows on a 'quasi-
infinite' greenhouse cover. This allows the determination of the combined
leeside and windward side ventilation through the various windows on a
'quasi-infinite' cover.
4.3 The windward side ventilation through different window types on a
quasi-infinite greenhouse cover
4.3.1 Experimental set up
Windward side ventilation measurements were performed in fully enclosed
compartments equipped with different window types with aspect ratio 0.47,
1.00 and 1.825. A description of compartments and windows used in this
experiment is to be found in chapter 3. Also for the measuring procedure
and the processing of the obtained data, the reader is referred to the pre
vious chapter.
57

H.3.2 Results and discussion
The results of the measurements of the windward side ventilation through
windows with various geometries are presented as values of the ventilation
function G(a) in fig. 4.4a-c. In the figures the corresponding leeside
ventilation functions G(a) for the transverse wind direction are also
given as a reference.
The figures show an increase of the windward side ventilation almost in
linear proportion to the window opening angles, except for the very large
openings. For small window openings (< 2°), the air exchange through the
leeside and windward side windows seems to be almost of equal magnitude.
This indicates that the pressure fluctuations near the cover surface are,
in that case, similar for both the leeward side and windward side.
For the windows with aspect ratio 0.47 and 1.00, an effect of the wind
direction on the ventilation can again be noticed. This is in line with
the findings in chapter 3, where the leeside ventilation was discussed.
Windward side ventilation measurements for the window with aspect ratio
1.825 were performed at one wind direction only. Consequently no effects
of the wind direction could be observed for this aspect ratio.
The measurements for the windows with aspect ratio 0.47 and 1.00 (fig. 4a
and 4b) show a relatively small difference between the presented leeside
ventilation function G(a) and the windward side ventilation for a cor
nering wind, indicated by the filled symbol •. In fact, a comparison of
the leeside (fig. 3.10a,b, chapter 3) and windward side (fig. 4.4a,b) ven
tilation at this particular wind direction (almost parallel to the line of
the ridge) shows that the air exchange through the windows are almost of
equal magnitude, especially for small opening angles.
When the measuring points for the transverse wind direction in the figures
4.4a-c are fitted to the function that expresses the deviation from a
linear relationship for increasing opening angles, we obtain the following
values for the windward side ventilation functions:
G(ct) = c, • a • exp(a/c2) (4.2)
aspect ratio c, c2
0.47 0.0039 22.3 1.00 0.0024 71.8 1.825 0.0012 211.1

7 o 56 Ö 52
44
40
36
32
28
24
20
16
12
8
4
-
-
--
t-
* •
o
i
o
o
o
*
I
* •
o
•
0
*
o
•
o
*
•
Lo'Ho-1.00
i i i i i i i
c
•
Hëeside
i i i i i
0 4 8 12 16 20 24 28 32 36 40 44 48 —•a
8 12 16 20 24 28 32 36 40 44 48
-—a Figure M.la-c Values of the windward side ventilation function G(a) for the window with
aspect ratio 0.17, 1.00 and 1.825 respectively. The wind direction is spe
cified according to the figures.
59

~eo
•550
o
\ 40-
30
20-
-
-
-
-
-
lo/Ho-0.4?. /
1 1 1 1
L 0 'H 0 -1 :0p^^
^ ^ C o / H o - 1 . 8 2 5
1 1 1 1 1
10
10 15 20 25 30 35 40 45 50
Figure 1.5 Windward side ventilation functions for the windows with aspect ratio 0.17, 1.00 and 1.825.
These functions are given in fig. 4.5. They represent the windward side
ventilation functions for the windows mounted on a 'quasi-infinite' green
house cover. In common with the already determined leeside ventilation
characteristics, the increase of the windward ventilation function G(a) ,
for windows with the lower aspect ratio, is faster than for windows with a
higher aspect ratio. This is partly due to the flow characteristics of the
different windows. The various pressure fluctuation coefficients Kf(a) for
the observed window geometries, are calulated according to eqn. 3.14 in
chapter 3 and are presented in fig. 4.6. The figure shows that the
'\L0/Ho-0.47
Ln/Ho-1.00
Lo/Ho-1.825
10 20 30 40 50
Figure 1.6 The pressure fluctuation coefficient for the windows with aspect ratio 0.17, 1.00 and 1.825 (windward side ventilation).
60

pressure fluctuation coefficients are very different for the three window
types. Like in the case for leeside ventilation, the windward side ven
tilation characteristic of different window types can therefore not be
predicted a priori, even when the flow characteristics of the windows are
known. For this purpose a better understanding and more quantitative
information on the pressure fluctuation coefficient is needed.
4.4 Concluding remarks
The combined leeside and windward side ventilation was determined in a
Venlo type greenhouse compartment and related to the separate leeside and
windward side ventilation characteristics of the compartment. The findings
of the ventilation measurements indicate that for the transverse wind
direction (and for small window opening angles at the windward side up
to about 12°) the total flux can be regarded as the sum of the separate
leeside and windward side ventilation. No effect of a possible cross flow
between the windows on the ventilation flux was noticeable. This obser
vation also indicates that, for the combined window openings, the pressure
fluctuations near each opening drive the effective ventilation flux and
that the ventilation through a particular window is only dependent on the
turbulent effect of the wind at the window opening in question.
In the compartment used for the experiments, the succesive windows on the
ridge are positioned alternatively at a short distance from each other. In
many greenhouses the distance between the successive windows on the span
is larger and an effect of a possibly internally connected flow path be
tween the window openings on the ventilation might be more improbable. An
effect of a cross flow between the leeside and windward side windows may
occur at largo opening angles (i.e. larger than 12° at windward side) of
the windows on both sides of the spans or at different wind directions.
This could not be investigated.
The separate leeside and windward side ventilation characteristics provide
valuable information with respect to the combined ventilation. Therefore
windward side ventilation characteristics for various window types on a
'quasi-infinite' cover were determined. For very small window openings
61

(< 2 ) the leeside and windward side ventilation is almost of the same
magnitude. The measurements indicate that this also holds for the leeside
and windward side ventilation through the windows with aspect ratio 0.47
and 1.00 for the wind direction almost parallel to the line of the ridge.
For the windward side ventilation, different pressure fluctuation coef
ficients were found for the window types observed. A better knowledge of
the pressure fluctuation coefficients for various window types for both
leeside and windward side ventilation is needed to predict, a priori, the
combined ventilation.
62

5 FIELD MEASUREMENTS OF GREENHOUSE VENTILATION
5.1 Introduction
Up to now, the research on ventilation caused by wind effects was focussed
primarily on the 'quasi-infinite' greenhouses. For these greenhouses it
was assumed that an identical pressure distribution occurs around each
span and at any individual window and that there are no effects on the
ventilation of static pressure differences between the outside gable ends
of the greenhouse structure. For this situation an approach was formulated
for the air exchange through the one-side-mounted windows. Indeed due to
the concerning experiments, valuable insight into the wind induced ven
tilation was gained. This is relevant for all large multi-span green
houses. Numerical parameters were collected for Venlo type greenhouses.
However, the step from the fully enclosed compartments in the previous
chapters (representing the 'quasi-infinite' cover) to a greenhouse in
actual practice is rather drastic. It includes not only the presence of
the side walls (and absence of the partition walls of the compartment) but
generally also an increase of the cover surface area.
It was already noticed in chapter 3, that an effect on the wind flow and
wind-generated pressure distribution around the greenhouse is to be
expected, due to the presence of the outside wall of the structure (Phaff
[1], Stathopoulos [2]). This effect induces local differences between the
pressure distribution around the spans on the cover. It is expected that
these differences are most striking around the spans near to the outside
walls of the building.
Similar effects on the wind flow and pressures (and consequently on the
induced ventilation) can be caused by factors such as the terrain rough
ness and the density and geometry of buildings surrounding the greenhouse
(Wiren [4], Borges and Saraiva [5]).
To investigate these effects, wind tunnel experiments and the use of
numerical calculation studies of the wind flow and resulting pressure
63

distribution are widely recognized as powerful tools (e.g. Mathews [5]).
However, a faithful simulation of the air exchange of differently sized
greenhouses under various site conditions requires a special and extensive
study. This does not fit into the scope of the present study which is
primarily confined to the properties of full scale Venlo type greenhouses
as such.
The additional wind loads on the structure are determined by the interac
tion of the wind flow with the building. This interaction depends on the
building size and shape and its flow characteristics. Though several
investigations have been carried out to study wind loads on low-rise
buildings, the great number of possible geometries under all kinds of cir
cumstances precludes any precise and general definition of the occuring
static pressure distribution in actual practice.
As far as the author is aware, only two reports on full-scale pressure
distribution measurements on Venlo type multi-span greenhouses are
available (NNI [6], Wells and Hoxey [7]). In both studies, a consistent
load distribution on the third and subsequent spans, including the leeward
roof slope of the last span, was found for transverse wind. For the longi
tudinal wind direction, an identical roof load is found for all spans.
According to Wells and Hoxley, this load pattern is already established at
a short distance from the windward gable ends. These authors also found a
non-uniform distribution of pressure coefficients on the side walls and
windward roof slope of the considered greenhouse. In the work of the NNI,
only one pressure coefficient is given for each side wall.
Those findings support our basic idea that for the quasi-infinite
covers, examined in the previous chapters, the static pressures around the
spans are the same and therefore that in this case the pressure fluc
tuations over the windows act as the driving force for the ventilation. It
should be stressed here, however, that the term 'quasi-infinite mainly
expresses that possible surface edge effects on the ventilation through
the cover were left aside and that the windows on the 'quasi-infinite
covers were operating under the same conditions. This in contrast with the
literal sense of the word: (physically) unlimited. Obviously, the surface
area of a relatively large multi-span greenhouse in actual practise is
64

much larger than the surface areas of the quasi-infinite greenhouse
covers studied in chapters 3 and 4.
In this chapter it is investigated whether the ventilation properties of
relatively large freestanding greenhouses can be understood on the basis
of the ventilation characteristics of the 'quasi-infinite' cover. For a
greenhouse with a particular geometrical configuration, we expect the
effect of the additional static pressures near the side walls to be
superimposed over the effect of the pressure fluctuations which is assumed
to be characterized by the ventilation function of a 'quasi-infinite'
cover.
When the concept of superposition of both effects is correct, the dif
ference between the ventilation of the observed large greenhouses and the
'quasi-infinite' cover can be translated into a 'side wall effect which
is dependent on the surface area and geometrical configuration of the
greenhouse. Since the wind direction affects the pressure distribution
around the greenhouse structure, the ventilation of the non-infinite
greenhouse may also be dependent on the wind direction. To investigate
both aspects, greenhouse dimensions and wind direction, measurements of
leeside ventilation were performed in Venlo type greenhouses with dif
ferent geometrical configurations and surface areas. Such data, obtained
from ventilation measurements in relatively large greenhouses have not
been available up to the present.
5.2 Experimental procedure
Ventilation characteristics of different large greenhouse blocks were
determined to study the effect of the cover surface area and building
geometry on the ventilation features of the greenhouses. The greenhouses
in which the measurements are performed and for which the results are pre
sented in the next section are shown in fig. 5.1. A comparison between the
dimensions of the houses shows that in greenhouse II the greenhouse width,
in greenhouse III the greenhouse length and in greenhouse IV both green
house length and width approximately doubles with respect to greenhouse I.
All greenhouses used in the field experiments were undivided, thus having
65

M
Figure 5.1 Greenhouses for which results are presented in this chapter.
Greenhouse I: length = 14.8 m, width = 32 m, eaves height = 2.73 m, window di
mension: L = 2.00 m, H = 0.80 m, number of windows on each side of the span:1. o o
Greenhouse II: length = 38.'I ro, width = 88.3 m, eaves height = 3.35 nt, window dimension: L = 2.00 m, H = 0.80 m, number of windows on each side of the span: 11.
o o Greenhouse III: length = 76.8 m, width = 39 m, eaves height = 3.31 m, window dimension: L = 1.16 m, H = 0.80 m, number of windows on each side of the span:
o o
6 or 7.
Greenhouse IV: length = 98.1 m, width = 69.25 m, eaves height = 2.75 m, window
dimension: L = 1.16 m, H = 0.80 m, number of windows on each side of the span: o o
11 or 12. 66

four outside walls and no partition walls. Only (as is usual for larger
greenhouses in the Netherlands) the greenhouse with a surface area of
6790 m2 (greenhouse IV) has a farm depository built on one side wall.
The houses in this section wore also selected for their exposure to the
wind. They were located in the open country with almost no obstructions
within 50 m, well exposed to prevailing winds.
The ventilation rates of the greenhouses were determined basically in the
same way as described in the chapters 3 and 4. The tracer was distributed
in the greenhouses by means of a blower and a system of perforated tubes
at soil level. The sampling points (varying from 6 to 9) were equally
spaced in the greenhouse and connected by tubing to a manifold and then to
the gas analyser. After the release of tracer was stopped, the blower (and
in greenhouse II and IV also the fans of the installed hot-air heaters)
were left on to provide adequate mixing of the tracer gas with the green
house air.
When a constant (averaged in time) concentration of tracer was measured,
the blower (and fans) were switched off and the windows were opened. When
the windows were opened to the desired position, the recording of the data
was started on a minute base. All ventilation measurements were performed
in unheated greenhouses without crop.
5.3 Results and discussion
The measured leeside ventilation in the greenhouses is expressed by the
ventilation function G(oc) according to eqn. 3.8b in chapter 3. This func
tion relates the ventilation flux per unit window area at any wind speed
to the opening angle of the windows. The normalization of the ventilation
per unit window area enables us to compare the ventilation of the dif
ferent houses. Also the effect of an unequal number of windows on each
side of the spans (greenhouse III and IV) has been taken into account.
The wind direction during the measurements is classified according to the
diagram in the figures. All the measurements in the large greenhouse IV
were recorded at a particular wind direction by which the farm depository
was situated under the lee of the greenhouse. For this wind direction,
67

52
48
44
40
36
32-
28
24-
20
16
12
8
4
52
48
44
40
36
32
28
24
20
16
12
8
4 (
n
-
-
-
\° *\
• c
L 8 - o— -(H) /
\-/ ' l I
o
•
0
* •
• o—
I I
o
0 —
o
I I I
•
0 —
I I
•
o 0—
I 1 1 1 1
III
•
• 0 0—
1 1 1
8 12 16 20 24 28 32 36 40 44 -•a
<? 52 O
* 48
O 44
t 40
36
32
28
24
20
16
12
8
4
-
-
-
-
-
IL
* •
«
oio
•
I
* •
•
\
X
m
l l
•
•
•
i i i
• •
i i . i
IV
i
8 12 16 20 24 28 32 36 40 44
— a Figure 5.2 Measured values of leeside ventilation for greenhouse I-IV respectively. The
wind direction is specified according to the figures. The measurements in
greenhouse III (fig. 5.2c), carried out when 7 windows are opened on each span,
are marked with an arrow. The full curve represents the 'quasi-infinite' cover.
68
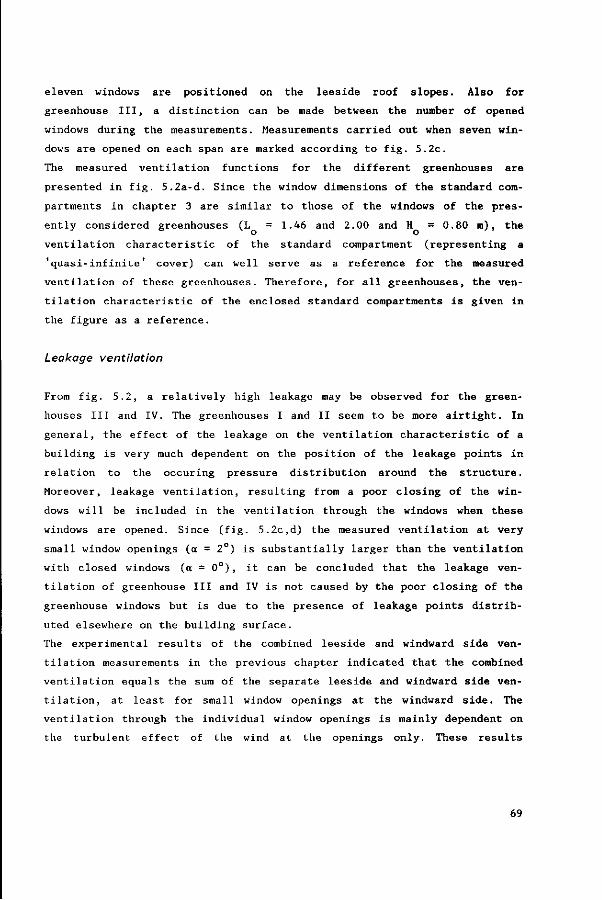
eleven windows are positioned on the leeside roof slopes. Also for
greenhouse III, a distinction can be made between the number of opened
windows during the measurements. Measurements carried out when seven win
dows are opened on each span are marked according to fig. 5.2c.
The measured ventilation functions for the different greenhouses are
presented in fig. 5.2a-d. Since the window dimensions of the standard com
partments in chapter 3 are similar to those of the windows of the pres
ently considered greenhouses (L = 1.46 and 2.00 and H = 0.80 ra), the
° o o
ventilation characteristic of the standard compartment (representing a
'quasi-infinite' cover) can well serve as a reference for the measured
ventilation of these greenhouses. Therefore, for all greenhouses, the ven
tilation characteristic of the enclosed standard compartments is given in
the figure as a reference.
Leakage ventilation
From fig. 5.2, a relatively high leakage may be observed for the green
houses III and IV. The greenhouses I and II seem to be more airtight. In
general, the effect of the leakage on the ventilation characteristic of a
building is very much dependent on the position of the leakage points in
relation to the occuring pressure distribution around the structure.
Moreover, leakage ventilation, resulting from a poor closing of the win
dows will be included in the ventilation through the windows when these
windows are opened. Since (fig. 5.2c,d) the measured ventilation at very
small window openings (a = 2°) is substantially larger than the ventilation
with closed windows (a = 0°) , it can be concluded that the leakage ven
tilation of greenhouse III and IV is not caused by the poor closing of the
greenhouse windows but is due to the presence of leakage points distrib
uted elsewhere on the building surface.
The experimental results of the combined leeside and windward side ven
tilation measurements in the previous chapter indicated that the combined
ventilation equals the sum of the separate leeside and windward side ven
tilation, at least for small window openings at the windward side. The
ventilation through the individual window openings is mainly dependent on
the turbulent effect of the wind at the openings only. These results
69

suggest (also for the reason that the leakage is relatively small compared
to the ventilation through the window openings), that the measured total
ventilation of the greenhouses is also the sum of the background leakage
component and the ventilation component through the windows. Consequently,
the ventilation characteristic of the windows only (i.e. the ventilation
characteristic of a greenhouse without leakage) can be obtained by
substracting the leakage ventilation from the measured total ventilation.
Wind direction
For greenhouse II and III, leeside ventilation measurements were performed
at different wind directions. Though the magnitude and distribution of the
wind pressures will be affected by the direction of the wind relative to
the structure, the results of the ventilation measurements do not show an
unambiguous effect of the wind azimuth on the leeside ventilation. For
greenhouse III, a small effect of the wind direction on the air exchange
seems to be perceptible. It may be concluded, nevertheless, that the
measurements in both greenhouses indicate that there is no important
effect of the wind direction on the ventilation.
Greenhouse geometry
Figure 5.2 shows that the leeside ventilation of the houses has increased
compared to the measured leeside ventilation of a 'quasi-infinite
greenhouse cover. To interpret the numerical results, we adopt the con
siderations in section 5.1 and assume that the total ventilation is mainly
the resultant of the combined effect of the extra pressure components near
the side walls and the pressure fluctuations. When both effects are
superimposed we can formulate:
i _ = * _ + $ + $ T (5.1) v,G v,C v,S v,L
where
'1> _ = total ventilation of the greenhouse V ,b
70

v,C
v,S
»v.L
ventilation through the greenhouse cover caused by pressure fluc
tuations only. It is assumed that this flux through the cover can
be characterized by the ventilation function of the 'quasi-
infinite' cover.
supplementary ventilation due to 'side wall effect'
leakage ventilation
In fig. 5.2 the terms in eqn. 5.1 are all expressed as values of the ven
tilation function G(a) (and thus normalized per unit windspeed and window
area). According to the definition in eqn. 5.1 the supplementary ven
tilation (also expressed as value of G(a)) can be obtained from fig. 5.2.
For the houses I-IV the supplementary ventilation is given in fig. 5.3. It
represents the 'side wall effect' on the ventilation of the whole green
house. For larger window openings, the values for the magnitude of this
effect will become less reliable due to the increased scatter of the
measuring points.
I I I I L 0 2 4 6 8 10 12 14 16 18 20 22 24 26 28 30 32 34 36 38 40
— a Figure 5.3 The supplementary ventilation for the greenhouses under study.
It is striking that for greenhouse I, with a relatively small surface
area, the 'side wall effect' is not very marked while for the other
greenhouses the effect on the total greenhouse ventilation is more pro-
71

nounced. This contradicts the expectation that a surface edge effect (here
'side wall effect') is large for small greenhouses.
From the curves in fig. 5.3 the supplementary ventilation flux $ „ (per v,fc>
unit wind speed) can be calculated. For the various greenhouses, calcul
ated values of $ /u for opening angles up to 10 degrees are presented in
fig. 5.4a,b as a function of the building scale. In fig. 5.4a the peri
meter is chosen to characterise the building scale; in fig. 5.4b the sur
face. The calculations are restricted to relatively small opening angles
to minimize errors due to the scatter of the measuring points. Moreover,
for small opening angles the possible influence of wind direction on the
leeside ventilation is expected to be small (fig. 5.2b,c).
Figure 5.4 shows that the supplementary flux is strongly related to the
dimensions of the greenhouse and decreases when the greenhouse becomes
smaller. Extrapolation of the trend in fig. 5.4a,b suggests that for very
small greenhouses the ventilation characteristic approximates the ven
tilation characteristic of the 'quasi-infinite' cover. In other words: the
effect of the additional pressures near the outside walls can be con
sidered to be small for small greenhouses. Why the relative effect of the
supplementary flux on the total ventilation should increase for the larger
greenhouses is not yet evident.
When the wind meets the greenhouse, a stagnation zone is created on the
upwind wall. The cushion of pressure diverts the flow ahead of the
building so that it passes around the sides and over the building. The
flow escapes and separates with increased speed, thus reducing the static
pressures. Consequently recirculating flow zones are created that cover
the downwind surfaces (cover, sides and leeward wall) of the building
(ASHRAE [8]). Obviously, the streamline pattern and surface pressures are
strongly influenced by the turbulence of the approaching wind and by the
building shape. The upwind wall hàs a finite dimension perpendicularly to
the stream direction; this finite dimension is the more manifest when the
cover becomes more extended in the stream direction.
Though the geometries of the greenhouses II and III are very different,
the measured supplementary flux is almost of equal magnitude. This indica
tes that the supplementary flux is the result of an effect which is
72

ST3'5
E
Ç 3.0
> e ' 2 . 5
2.0
1.5-
1.0-
0 .5 -
III D
0
•
•
D II
• *! •
D
O
•
•
IV
1
50 100 150 2 0 0 250 300 350 400 - • • perimeter Cm)
Figure 5 .1a The supplementary f l u x per u n i t windspeed as a f u n c t i o n of the per imeter of the
greenhouse , B a = 2 ° , -jura = 1 ° , » a = 6 ° , Q a = 8 ° , G « = 1 0 ° .
1000 2000 3000 4000 5000 6000 7000 —•surface area Cm2)
F igure 5 .4b The supplementary f l u x per u n i t windspeed as a f u n c t i o n of the sur face area of
the greenhouse, B a = 2 ° , - f ra = i | ° , « a = 6 ° , O » = 8 ° , D a = 1 0 ° .
r e l a t e d t o the dimensions of both the upwind wall and downwind su r f aces .
Those dimensions seem t o be important parameters with r e spec t t o the
magnitude of the supplementary f lux . This might a l so expla in the f ac t t h a t
no c l e a r e f fec t of the wind d i r e c t i on on the v e n t i l a t i o n was p e r c ep t i b l e .
73

In eqn. 5.1 the supplementary flux $ „ was defined as the difference be-v,S
tween the measured flux through the cover of an airtight greenhouse and
the flux through the same greenhouse cover assuming that the ventilation
characteristic was similar to that of a 'quasi-infinite' cover.
A graphic way to account for this supplementary flux (per unit wind speed)
for various greenhouses is to represent the actual greenhouse as a quasi-
infinite-cover-greenhouse with the same ventilation. Clearly, the quasi-
infinite-cover-greenhouse is larger than the actual one. Of course the
extension of the surface area has the same window to cover ratio A0/A as
the original greenhouse. This graphic way enables us to compare the
supplementary flux of various greenhouses with different window types.
While the ventilation through the quasi-infinite-greenhouse-cover is
characterized by the ventilation function G(<x), we can formulate an
expression for the additional surface area Aa:
« ' /u) / [(A /A) • G(a)] V j O O
(5.2)
In table 1, the additional surface area Aa for window opening angles up to
10 degrees is calculated for the greenhouses T-IV.
Table 1. Additional surface area Aa (m^) for the greenhouses I-IV.
opening angle
greenhouse I greenhouse II greenhouse III greenhouse IV
2°
800 2560 2372 5100
4°
738 2379 2214 5816
6°
714 2286 2350 5872
8°
698 2118 2338 6139
10°
686 1905 2437 6182
average
727 2250 2342 5822
It appears that the calculated values of Aa are not too much affected by
the window opening. This allows us to calculate an average value for the
surface area Aa for opening angles up to 10 degrees. While greenhouse II
and III have a comparable Aa> the additional area can be translated into a
74

stroke along the greenhouse with width w (fig. 5.5). This width can be
calculated according to:
A = (p • w) + 4w2 (5.3)
where p is the perimeter of the greenhouse.
f
Figure 5.5 The extension of the original surface area along the sides of the structure.
"0 50 100 150 200 250 300 350 400 —«• perimeter Cm)
figure 5.6 Values of w for the different greenhouses (0° < a < 10°).
The obtained values of w for the houses in fig. 5.1 are given in fig. 5.6
as a function of their perimeter. In the same figure, also the supplement
ary flux is inserted for the small greenhouse V (26.6 x 22.2 m 2 ) mentioned
75

o 24
* 22
*_/ O 20
t 18
16
14
12
10
8
6
4
2
n
^greenhouse
s s
y y compartment
/ / ^"^ / ^^ / s'
/ y ^
/ yS / /
/ / 1 / / / - 1 /
_l / / /
f i t i i i i i i i i
0 1 2 3 4 5 6 7 9 10 11 12 13 14 15 16 17 18 — a
Figure 5.7 The measured ventilation functions of the 'quasi-infinite' cover (constructed compartment) and the whole greenhouse (V). Window dimension: L = 0.73 m, H =1.55 •. ° o
in chapter 2 (section 2.3) and chapter 3 (section 3.5). The calculation of
the value w for this latter greenhouse (also for window openings up to 10
degrees) is based on the measured ventilation characteristic of the whole
greenhouse (with window dimensions L 0 = 0.73 m and H 0 = 1.55 m) and the
measured ventilation characteristic of the constructed compartment in the
centre of the same greenhouse with a similar window type (eqn. 3.16, fig.
5.7). The result perfectly fits in the previously observed trend. It
demonstrates once more that the effect of the additional pressures (the
'side wall effect') is relatively small for a small greenhouse.
5.4 Concluding remarks
In this chapter a pilot full scale study is presented on the ventilation
properties of variously sized Venlo type greenhouses. It was for the first
time that ventilation features of relatively large Venlo type greenhouse
structures were determined. The measurements were performed in freestand
ing greenhouses with four outside walls and no partition walls. The ex-
76

pcrimcnts were designed to study the effect of building scale and geometry
on the ventilation.
To interpret the ventilation of the greenhouses, the ventilation of the
'quasi-infinite ' cover was used as a reference. It was assumed that the
difference between the actual ventilation and the ventilation of the
'quasi-infinite ' cover was attributed to an effect which is due to the
presence of the side walls (the 'side wall effect').
The measurements show that the air exchange of the greenhouses has in
creased compared to that of the 'quasi-infinite' cover. The difference,
the supplementary flux, is relatively small for small greenhouses while
for larger greenhouses the difference is relatively large. This contra
dicts the expected behaviour when the 'side wall effect' is considered
simply as a plain surface edge effect. It can be understood however from a
qualitative consideration of the flow field over large low rise buildings,
as they are described in the literature.
It appears that the ventilation characteristic of the 'quasi-infinite'
cover can well serve as a reference with respect to the ventilation of
large greenhouse structures. With some exploratory ventilation measure
ments the supplementary flux due to the 'side wall effect' can be deter
mined. The presented graphic way to account for the supplementary flux
clearly shows the relationship between this flux and the greenhouse scale.
This graphic representation may be useful to indicate the side wall
effect' for freestanding greenhouses with different surface areas.
However, a full understanding of the mechanisms that are responsible for
the 'side wall effect' is not yet apparant. In this respect, a detailed
full scale study of the pressure distribution and ventilation features of
greenhouse A and the compartments within an identical greenhouse B (fig.
5.8) may provide valuable information. It should be remembered, however,
that suitable constructions for a study adressed to the greenhouse scale
and geometry on the air exchange are scarce. Variation in eaves height,
leakage ventilation, window configuration and site conditions may always
account for some interference and affect the results.
77

J A A A J A / ^ . A J A A A A A A ^ A / N .
rigure 5.8 Greenhouse A (without compartments) and greenhouse B (with compartments).
5.5 References
1 J.C. Phaff. Luchtbeweging om gebouwen. Rapport C403 TNO [in Dutch]
(1977).
2 T. Stathopoulos. Wind loads on low-rise buildings: a review of the
state of the art. Eng Struct., Vol. 6 (1984).
3 B.G. Wiren. Effects of surrounding buildings on wind pressure distribu
tions and ventilative heat losses for a single family house. Jnl. Wind.
Eng. Ind. Aerod. 15, 15-26 (1983).
4 A.R.J. Borges and J.A.G. Saraiva. Ventilation rates of two communicat
ing low rise buildings as affected by terrain roughness. Jnl. Wind.
Eng. Ind. Aerod. 15, 39-46 (1983).
5 E.H. Mathews. Prediction of the wind-generated pressure distribution
around buildings. Jnl. Wind. Eng. Ind. Aerod. 25, 219-228 (1987).
6 NNI (Nederlands Normalisatie instituut). Constructieve eisen tuin
bouwkassen. Greenhouse structural requirements [in Dutch] (1978).
7 D.A. Wells and R.P. Koxey. Measurments of wind loads on full scale
glasshouses. Jnl. Wind. Eng. Ind. Aerod. 6, 139-167 (1980).
8 ASHRAE Handbook of Fundamentals. (1989).
78

6 VENTILATION DUE TO THE TEMPERATURE EFFECT AND THE COMBINED
WIND AND TEMPERATURE EFFECT
6.1 Introduction
Generally, when the natural ventilation in buildings is studied, a dis
tinction is made between the air exchange caused by wind effects and the
air exchange due to thermal buoyancy forces resulting from the temperature
difference between the inside and outside air of the enclosure. The wind
induced air exchange of Venlo type greenhouses was studied in the previous
chapters. Though in practice as a rule the wind effect strongly dominates
the temperature effect, the effect of thermal buoyancy on the air exchange
is of fundamental interest and its importance increases when the wind is
almost absent. Therefore the present chapter is devoted to the air ex
change of the greenhouses due to the temperature difference between the
inside and outside air, and to the air exchange due to the combined effect
of wind and temperature. To really understand the temperature induced air
exchange through the greenhouse window openings with its rather complex
and varying geometrical configuration, basic insight is required of the
natural convection through plain openings in the envelope of an enclosure.
For this purpose, the natural convection was measured through rectangular
openings in a horizontal and a vertical plane (section 6.2). The next sec
tion (6.3) presents an approach to estimate the temperature induced ven
tilation through one-side-mounted windows on a greenhouse cover together
with some exploratory measurements. The results of the measurements were
compared with the estimates presented earlier in this section. The aim of
the work presented in section 6.2 and 6.3 is not to perform a complete
study on the natural convection through the various openings, but only to
offer an approach and some approximate measurements. The results are to be
employed to estimate the natural convection in real situations.
In fact, the air exchange is usually due to combined wind and temperature
effects. Ventilation measurements in a greenhouse, in a period with a
relatively low wind speed and a high temperature difference, are discussed
in section 6.4.
79

6.2 Natural convection through rectangular openings
Though the engineering importance of heat transfer by natural convection
is widely recognized, relatively little attention is given to natural con
vection across openings in partitions. From extensive literature re
search, the present author has found only a few experimental studies in
this field. Brown and Solvason [1] presented theoretical considerations
for natural convection through rectangular openings in vertical parti
tions. Brown [2] presented a theory for openings in horizontal partitions.
In both studies, the same test unit was used to measure the natural con
vection through mainly square openings, with varying ratios of the par
tition thickness to the dimension of the opening. Fritzsche and Lilienblum
[3], Shaw [4] and Shaw and Whyte [5] measured the natural convection
through doorways in a more practical situation.
There are a number of variables such as the area of the opening, geometry
of opening and temperature difference that may be considered in any par
ticular analysis. The shape of the opening under a one-side-mounted window
varies with the opening angle. For very small opening angles, the opening
area is shaped like a crack with a high aspect ratio (i.e. the geometric
ratio of length (L0) over height (H0) of the opening). For a fully opened
window, on the contrary, the aspect ratio of the opening area equals the
aspect ratio of the rectangular window. The partition thickness (d) of the
window opening is always very small in the case of greenhouse windows. To
gain insight into the temperature induced air exchange through the win
dows, the natural convection through openings with varying aspect ratios
and with a thickness which is small relative to the height or length, is
investigated. The measurements were performed for openings in either a
horizontal or vertical partition.
6.2.7 Considerations
Our study deals with natural convection in a system in which two uniform
volumes of still air (for instance the inside and outside air of an enclo
sure) are separated by a wall with one rectangular opening. The uniform
temperatures, densities and concentrations of the air are different on
80

both sides of the wall and each of these quantities is maintained at a
constant value. In our considerations we assume that the partitioning wall
does not participate in any form in the transfer processes between the two
volumes of air: it is impermeable to heat and mass transfer and it cannot
take up or dissipate mass or energy. The occurring heat flow through the
opening is then only due to the differences in air conditions and is not
influenced by any temperature effect of the wall. The opening area A in
the wall is considered to be small compared to the dimensions of the
wall.
The conditions formulated in the foregoing paragraph seem somewhat un
realistic, but they are inevitable when we want to study the pure effect
of natural convection by temperature difference between two portions of
air only.
Vertical openings '
In fig. 6.1 the system under consideration is shown. For this situation,
according to the theory presented by Brown and Solvason [1], the air
interchange across the opening is driven by the variation of the hydrosta
tic pressure on both sides of the opening. A neutral pressure plane was
defined as the height (h0) at which the thermally induced pressure dif
ference is zero:
Pi(ho) = P 2(ho) = p o (6.1)
H0'2
P2
V2
T2
Fig. 6.1 Schematic representation of natural convection through an opening in a vertical
partition.
81

The hydrostatic pressures on each side of the opening at height h are
given by:
P l(h) = p o - P l • g • (hQ-h) (6.2)
p2(h) = p o - P 2 • g • (hQ-h) (6.3)
with g the gravitational acceleration and px and p2 the densities of the
air in the two compartments. It is to be noticed that g is negative when h
is positive in upward vertical direction. The pressure difference between
the two sides at the same height h is thus:
P l(h) - p2(h) = (p2-Pl) • g • (ho-h) = Ap • g • (hQ-h) (6.4)
We notice that for p, > p2 the flow direction below the reference level
(h < h0) is from volume 1 to volume 2. Above reference level the flow
direction is reversed. Since both volumes are sealed, we may assume that
there is no net volume flow across the opening. According to symmetry con
siderations the position of the neutral plane is in the centre of the
opening. When more openings are vertically separated in the building en
velope, the level at which the transition between inflow and outflow occurs,
the neutral pressure plane, is determined such that a flow balance is
maintained (i.e. the total flow across the openings above the neutral
plane is equal but opposite in direction to that below that plane).
If only a temperature difference accounts for the difference in density
between the air in both volumes, we can write:
- (P1-P2) = P • » • (T,-T2) (6.5)
with Ti and T2 the temperatures in volume 1 and 2 respectively and ß the
thermal expansion coefficient. For frictionless flow through the opening,
the Bernoulli equation holds. We can therefore write, using eqn. 6.4:
Ap • g • (hQ-h) = I • p • v2 (6.6)
Thus, combining eqn. 6.6 and 6.5:
v = [|2 • g • 3 • AT|]* • [|ho-h|]* (6.7)
where v is the air velocity and |h0-h| and |2•g•ß•AT| are the absolute

value of (h0-h) and (2-g'ß'AT) respectively. The direction of the velocity
at height h is determined by the sign of the term (h0-h).
The air exchange rate $v through the upper part of the opening can sub-
sequenly be found by integration of eqn. 6.7 from the reference height
h = h0 to h = h0 + H0/2.
h + H /2 o o
K = ƒ [|2 • g • ß • ATI]* • Lo • [h-hj* dh (6.8)
h o
so that
*v = V 3 • [lg • ß ' A Tl]* ' K l 3 7 ' (6"9)
In many procedures, a discharge coefficient C is introduced into eqn. 6.9
to account for the energy losses in the opening:
*v = C • Lo/3 - [|g • 3 • AT|]* • [ H J 3 / 2 (6.10)
The energy dissipation of the flow through rectangular openings in casa of
forced convection was expressed as a friction factor F0> which was mainly
determined by the aspect ratio of the opening (chapter 2 of the present
thesis). This was represented in an Euler-like relationship:
AP / [l • "o ' V 1 = Fo<VV (6-U)
with v the average velocity in the opening. Though the flow conditions for
the forced and natural convection are not identical, application of the
friction factor F0 in the considerations of natural convection may be
relevant since F0 represents a total discharge and takes into account the
effect of the geometry of the rectangular openings. Equation 6.9 then
becomes :
*v = Lo/3 • [|g • ß • AT|/Fo]* • [ H J 3 / 2 (6.12)
or, looking at eqn. 6.10
C = F"5 (6.13)
83

T i ! !
i : ; \ \ 1 1 \
v2 : T 2 :
Fig. 6.2 Schematic representation of natural convection through an opening in a horizontal
partition.
Horizontal openings
Figure 6.2 gives a schematic representation of the situation where natural
convection takes place through an opening in a horizontal partition. Two
sealed volumes, containing fluid at densities p! and p2 respectively are
separated by a horizontal partition of thickness d and having one opening.
In principle, the two layers of air at rest are in equilibrium, even when
the heavier air overlies the lighter. However, when the cold air moves
downwards and the hot air upwards, there is a release of potential energy,
which can provide kinetic energy for the motion. Thus the equilibrium will
be unstable and exchange will take place of the lighter against the heav
ier air. However, a general description of the flow in this situation is
rather complicated due to the unstable flow conditions at the opening. In
contrast to the natural convection through vertical openings, no steady
pressures and flow distribution can be assumed. Brown presented a theory
applying the Bernoulli equation for the fluid flowing through the opening.
In his considerations, the thickness d of the partition was essential to
define the pressure gradient p-g-d in the Bernoulli equation. In our case,
this theoretical approach does not seem workable since the partition
thickness of the openings in the experiments is too small to define a
significant pressure difference. A detailed theory, dealing with this
84

unstable and complicated system, is not available. Looking at comparable
situations where natural convection takes place between compartments with
different temperatures, we expect an interchanging flow of rising and
falling eddies through the horizontal opening (or part of that opening).
The exchanged volumetric flux is expected to be dependent on the tem
perature difference of the air across the opening and the geometric
characteristics of the opening. This will be examined in the measurements
reported in the next sections of the present chapter.
6.2.2 Experimental procedure
In reality, when natural convection through an opening in a wall of a
building is considered, the temperature effect arises as a result of dif
ference in temperature and hence air density between the inside and out
side of the building. Though in this case we are, strictly speaking, not
dealing with two sealed volumes at different air conditions, we may assume
that in principle the same theoretical considerations can be applied and
that the air exchange is caused by the imbalance in the pressure gradients
of the air on both sides of the opening.
In our experiments, a temperature difference was created between the
inside and outside of a cubical enclosure (1 = b = h = 2.5 m) with an
opening in either the horizontal or vertical wall of the enclosure
(fig. 6.3). Two types of openings were applied in the experiments, both
with the same surface area but with different length/height ratio
(17 x 17 cm; L0/H0 = 1, and 120 x 2.4 cm; L0/H0 = 50). The thickness (d)
of the openings equaled 3 mm. The inside of the cube was sealed up in a
gastight way with aluminium foil. Tests were carried out with temperature
differences across the opening ranging from about 1 to 25 degrees cen
tigrade, as this is the region occuring in actual practice. To generate
the temperature difference between the interior and the exterior air, the
enclosure contained a convector with a large heat exchange area. Clearly
the presence of the convector contradicts the supposition of still air in
the cube. However, our experiments will clarify that the influence of
this effect can be eliminated. The heating system was controlled to main
tain a constant (adjustable) air temperature in the cube. The effective
85

Fig. 6.3 Cubical enclosure with opening in horizontal or vertical wall (not on scale).
ventilation flux through the opening, due to the temperature difference,
was measured by means of the tracer gas decay rate method.
When equilibrium conditions were readied, the tracer (N20) was carefully
distributed in the cube by means of a perforated tube on ground level.
After release of the tracer, the perforated tube in the enclosure con
taining the N20, was flushed out cautiously by N2 gas to stimulate the
initial mixing of the tracer gas and the inside air and to prevent a
disturbance of the measurements due to diffusion of tracer from the tube.
To measure the N20 concentration during the experiments, the air was
sampled at different points in the enclosure and led to an IR analyser
through a small pump. Inside the enclosure, four very thin thermocouples
were arranged to measure the air temperature at various locations. The
temperature sensor outside consisted of a psychrometer (platinum
resistance thermometer) located a few meters from the opening. During the
measurements, the concentration of tracer gas and the temperatures inside
and outside the enclosure were monitored at certain intervals.
The test area was situated in a large ha 11 of the Institute of Agricul
tural Engineering (IMAG) in Wageningen. To eliminate effects of local air
movements, the set up was completely shielded by a screen of blister-
86

padding with dimensions 10 x 10 x 6 m (1 x w x h ) . Moreover, the measure
ments were performed during the evening and night, when all the doors in
the hall were kept closed.
6.2.3 Results and discussion
The results of the measurements are given in fig. 6.4 and 6.5 for vertical
and horizontal openings respectively. In these figures, the measured
effective air transfer to the environment, $v, is ordinate and the square
root of the temperature difference is abscissa.
For the vertical openings (fig. 6.4), the measured linear relationship
between $ v and (AT)2 is in agreement with the theory (eqn. 6.10). The
slope of the lines through the experimental results increases for the
openings with smaller aspect ratio as was indicated by eqn. 6.9. When the
experimental results for the vertical openings are evaluated, applying
eqn. 6.10, the discharge coefficient C for the different apertures can be
found (see table 6.1).
Table 6.1 The measured discharge coefficients for the vertical openings vinder study.
aspect ratio
L/H
1 1/50
50
measured discharge
coefficient C
Ct = 0.60 C2 = 0.60 C3 = 0.74
calculated l
F~2
o
0.64 0.69 0.75
The values in table 6.1 are in line with findings in previous research.
Brown and Solvason found discharge coefficients between 0.6 and 1.00 for
the different openings in the range 107 < Gr < 108 and 0.19 < d/H0 < 0.38.
Our experiments encompass a range of the Grashof number from 103 to 10'
and a range of the ratio of partition thickness to opening height of
0.125-0.0025. Shaw found for large rectangular door openings discharge
87

T 60
Figure 6.1 Measured natural convection through the vertical openings.
c* V)
E • *
o
> e t
28
24
?o
1R
12
8
4
-- G L0 /H0 -50 or 1/50
- ° L 0 /H 0 -1
n ^ - - - ^ '
^^^"^ _ , - - " a
i i i i i i i i i i i
o-"~
i i i
o -
i i i
^^^
_--—• °—"""
i i i i i 4 5 6
— CZ\T)°-5(K0-6)
Figure 6.5 Measured natural convection through the horizontal openings.
88

coefficients C ~ 0.8 for temperature differences between 4°C and 10°C, the
door geometry not being significant.
The present experimental results indicate that the discharge coefficients
vary for the rectangular openings under study. A similar effect was
observed in chapter 2 of the present thesis, when the flow through the
same kind of openings, generated by a uniform pressure difference across
the opening, was discussed. For the forced convection, the friction factor
F0 of the opening was a function of the aspect ratio of the opening, being
symmetrical with respect to L0/H0 = 1 (eqn. 2.2a and 2.2b). For natural
convection, however, it appears that the discharge coefficient for the
opening with aspect ratio 1/50 and 50 are different. Evidently, the dis
charge in the opening is also determined by the pressure and flow field
in the opening.
Fig. 6.6 shows the velocity profile of the flows across the different rec
tangular openings for the same volume flow rates. For the opening with
aspect ratio 1, it is possible that the air streamline converges at both
sides within the opening. The different velocity distribution in the ope
nings for the aspect ratios 1/50 and 50 indicate that a one-dimensional
contraction of the air may occur within the opening with aspect ratio 50,
while a two dimensional contraction of the air flow is more likely within
the opening with aspect ratio 1/50.
In this connection it is interesting to compare the measured values of Cl f
i C2 and C3 and the calculated values of F z according to eqh. 6.13 in table
6.1 (realizing that the aspect ratios used for the inflow and outflow are
2, 1/25 and 100 for the openings with aspect ratio 1, 1/50 and 50
respectively).
For the openings with aspect ratio 1 and 50 the agreement between the _ i
theoretical value F 2 and the measured discharge coefficient is good,
while for the opening with aspect ratio 1/50 a greater uncertainty exists.
It appears that the difference between the calculated discharge values,
based on a uniform pressure and flow field, and the measured discharge
values for natural convection is more pronounced for the openings with
small aspect ratios. The fact that the flow regime for natural convection
is strongly associated with the height H 0 might be an explanation for this
trend. Though indications for a dependency on the aspect ratio are found,
a quantitative relationship between the discharge coefficients for natural
89

Figure 6.6 Velocity profile of the flow
through the vertical openings
1: L /H = 1; o o
2: L /H = 1/50;
3: L /H o o 50.
m
•t—>>
m
convection and the dimensions of the openings is not, at present,
apparant. More accurate figures can be generated when the air transfer is
measured through a larger number of openings with varying aspect ratios.
As yet, for practical purposes, a value of C = 0.6 seems to be a reliable
estimate of the discharge coefficients for a vertical sharp edged opening
in case of natural convection.
The test results for natural convection across the horizontal openings l
(fig. 6.5), also show a linear relationship between $ and (AT)2, for tem-
90

perature differences ranging from about 1-25 degrees centigrade. From the
experiments on the natural convection through horizontal openings, no
conclusions can be drawn about the structure of the convection, in par
ticular regarding the sequence of rising and falling cells. The flow may
be steady in a fairly regular pattern, or convection cells may occur with
great variability in size and shape. It was expected that the combined
action of the rising and falling fluid was sensitive to the geometric
characteristics of the opening. This seems to be corroborated by the
experimental results where the slope of the $ v versus (AT)2 relation
depends on the geometry. For the square opening, the fluid may fall and
rise in different quadrants of the opening. In this case, the shape and
size of the convection cells are not necessarily determined by the length
or width of the opening. For an opening with a large aspect ratio and
shaped like a split, the bouyant plume width may be mainly determined by
the length of the shortest side.
The figures 6.4 and 6.5 show an extrapolated transfer volume at zero tem
perature difference. This transfer is probably caused by the fact that the
air inside and outside the cube is not completely at rest, even when
AT = 0. This turbulence of the adjoining spaces makes it impossible to
completely prevent transfer. From the ventilation fluxes at AT = 0 (by
extrapolation) , it appears that the turbulence inside and outside the cube
lias only small influence on the transfer through the openings.
6.3 Natural convection through the greenhouse windows
6.3.1 Considerations
In fig. 6.7, two different greenhouse windows at different opening angles
are pictured. From the experiments in the previous section, it can be
concluded that the main driving force for the ventilation due to natural
convection is related to the height of the opening (i.e. the vertical
pressure gradients of the inside and outside air masses).
Analogous to the theoretical considerations in section 6.2.1, we may
assume that a difference in pressure between the inside and outside of the
91

Figure 6.7 Greenhouse windows at different opening angles.
greenhouse window occurs at all points above and below the neutral pres
sure plane as a result of differences in air density between the interior
and exterior. The pressure difference varies directly with the distance
from the neutral pressure plane. Natural convection will occur through
the side areas and front area of the window opening. From fig. 6.7 it
can be seen that the height of the side area is relatively large at a
small window opening angle. Consequently it can be expected that the side
areas have their effect, especially for small opening angles. For a
thorough discussion on the ventilation through the different areas, the
reader is referred to the thesis of Bot [6]. According to his con
siderations for a window with aspect ratio equal to 1, the importance of
the flux through the side areas decreases very quickly for larger openings.
Therefore it should only be considered for opening angles smaller than
10 degrees. For windows with a higher aspect ratio, the effect of the side
areas becomes even smaller.
In practice, the influence of temperature induced ventilation in the
greenhouse is more important during summer conditions when the windows are
widely opened. Then the natural convection mainly occurs through the front
area of the window opening. For the roof window opening, the height H
(fig. 6.7) equals:
H = H • [sint - sin(T - a) o
(6.14)
An expression for the temperature induced ventilation through the front
area of the window with height H and length L 0 can be found according to
e qn. 6.10:
K = cf • v
3 • [ig •ß • A T i ] * • M 3/2
(6.15)

with:
Cf = discharge coefficient for the flux through the front area
To investigate whether this expression gives a reliable estimation of the
temperature induced air exchange through the windows, some ventilation
measurements were carried out on a model greenhouse.
6.3.2 Experimental set up
Basically the ventilation through a one-side-mounted window was measured
with a similar experiment as described in section 6.2.2. The ventilation
measurements were carried out with a model greenhouse (fig. 6.8), which was
located in a room with dimensions 7 x 5 x 4 m (1 x w x h ) . The model
greenhouse was well sealed to prevent any leakage. Both the room and the
greenhouse were heated by a convector. The temperatures inside the room
and in the greenhouse were measured by means of a platinum resistance
thermometer and were controlled to maintain a desired temperature dif
ference between the inside and outside of the greenhouse. Measurements
were performed at various temperature differences and at relatively large
window opening angles of a = 16.7°, 32° and 50°. The relatively small
volume of the greenhouse may increase the sensitivity of the system to
disturbances of the environmental conditions. To extend the measuring time
and so to increase the reliability of the measurements, the temperature
differences were chosen to be relatively small. During the measurements
0.90
Figure 6.8 Model greenhouse. Dimensions in m.
93

the doors and the windows of the room were kept closed to prevent unde-
sired air circulation.
6.3.3 Results and discussion
In table 6.2, the measured ventilation and estimated ventilation according
to eqn. 6.15 (with Cf = 0.60, see section 6.2.3) are given for various
temperature differences between the inside and outside of the model green
house. In the table, for sake of comparison, the ventilation is expressed
as ventilation rate R, i.e. the number of complete air changes per hour.
Table 6.2 The measured and calculated ventilation due to temperature effects for different window opening angles and temperature differences.
a
16.7
32.0
50.0
AT
3.6 9.1 3.8
16.4 3.8
R calculated (h"')
2.9 4.6 8.3
17.3 9.2
R measured (h"')
3.2 5.0 9.0
15.2 10.9
Though the number of experiments is limited and the experimental accuracy
is restricted, the figures in table 6.2 clearly indicate that agreement
between the experimental results and the predicted ventilation is fairly
good. The derived expression in eqn. 6.15 therefore allows a calculation
of the magnitude of the temperature induced ventilation, which can be used
for practical purposes.
6.4 Air exchange due to a combined wind and temperature effect
6.4.1 Considerations
In reality pure natural convection will seldom be met. As a rule the ef
fects of wind and temperature driven ventilation will occur simultaneous-
94

ly. The respective pressure components (i.e. the fluctuating pressures
due to the wind and the static pressures due to the temperature differen
ce) can be superimposed to obtain the total pressure at each window open
ing:
AP . . . = AP . . + AP,. (6.16) combined wind temp
Here we also apply a vector summation of wind and temperature driven ven
tilation, in the same way as succesfully applied in the literature for
simultaneous free and forced convection on solid bodies (Borner [7]). In our
case this vector summation of the respective volume fluxes leads to:
v combined v wind v temp
The measured total greenhouse ventilation caused by thermal buoyancy and
wind forces can be evaluated when the magnitude of the air exchange com
ponents due to the wind and temperature effects can be estimated separa
tely. The wind induced ventilation can be calculated when the ventilation
characteristic of the greenhouse cover, expressed by the ventilation func
tion G(a), is known.
Since all windows on the greenhouse cover are located at the same height,
we may assume that there is no temperature induced vertical pressure dif
ference between the different window openings. As a result, each window
opening should be considered individually. Equation 6.15 with (Cf = 0.6)
can be used to estimate the air exchange through the window openings due
to temperature effects.
In the next sections ventilation measurements are discussed, which were
carried out in a compartment during periods with relatively low wind
speeds and large temperature differences. In this situation both the tem
perature and wind effects substantially contribute to the total ven
tilation .
6.4.2 Experiments
In the constructed compartments IV and V mentioned in chapter 3, the
heating system was switched on during a period with calm wind. During this
period, with a relatively low wind speed and large temperature difference
95

between the interior and exterior of the compartment, ventilation measure
ments were performed for some large window opening angles.
The measured total ventilation in the compartments was compared with the
combined ventilation flux (<!>v combined)> calculated from the separately
estimated ventilation components according to eqn. 6.17. The term $ v w£ncj
in eqn. 6.17 was calculated from the ventilation function G(a) according
to eqn. 3.11 in chapter 3. This function characterizes the wind induced
air exchange through windows with dimensions L 0 = 1.46 m and H 0 = 0.80 m,
equipped on a 'quasi-infinite' cover. The term $ v temp w a s estimated accord
ing to eqn. 6.15 with Cf = 0.6. The temperature difference which was used
in the analysis of the results was that of the recorded average tempera
ture difference between the inside and outside air during the measuring
run.
6.4.3 Results and discussion
In table 6.3, the measured total ventilation at various window opening
angles, the estimated terms <S>V win cj, *v temp a n d *v combined a n d t h e
recorded environmental conditions are collected.
From the values in table 6.3 it can be noted that agreement between the
estimated and measured total ventilation is fairly good. The measurements
presented here show a maximum error between the predicted and measured
ventilation of around 20%. Obviously, a full understanding of what factors
Table 6.3 The measured and predicted ventilation due to the combined action of wind and temperature.
opening angle a
42.0 42.0 25.1 25.1 11.2 11.2
average wind-speed u
2.15 3.35 2.98 2.93 3.31 2.30
temperature difference AT
15.7 16.2 15.2 14.8 14.9 16.8
*v wind
(io-3)
49.58 77.49 55.44 54.57 36.53 25.45
'v temp
(IO"3)
43.43 44.11 40.58 40.04 11.47 12.18
*v comb
(IO"3)
65.91 89.16 68.70 67.68 38.31 28.21
*v measured
(IO"3)
82.29 94.88 75.96 81.54 45.91 33.00
96

may be responsible for the apparent differences, requires a more extended
test program. The results, however, indicate that the measuring procedure
and considerations presented in this section can be useful in estimating
the combined effect of wind and temperature on the ventilation.
6.5 Concluding remarks
Measurements on the natural convection through horizontal and vertical
rectangular openings showed that the discharge for the flow is affected by
the geometrical characteristics of the opening. For vertical openings the
measurements indicate that the actual discharge is also determined by the
pressure and velocity distribution in the opening. The difference between
the vertical outside and inside pressure gradients across the openings can
be considered as the main driving force for the ventilation.
On the basis of the experimental results, an approach was presented to
describe the natural convection through the one-side-mounted windows on
the greenhouse cover (section 6.3). Ventilation experiments conducted on a
model greenhouse lend support to the given approach.
So far, the effects of wind and temperature on the ventilation have been
considered separately. In section 6.4 ventilation measurements were pre
sented in a compartment during periods in which both the temperature and
wind effects contributed simultaneously to the total ventilation. Though
the separate effects on the ventilation are fairly well understood, the
estimation of the combined effect was somewhat too low. The results how
ever, indicated that the relationships presented can be used as a rule of
thumb to estimate the combined effect of wind and temperature. To under
stand the combined action of wind and temperature in detail, more research
has to be done. The considerations presented in this chapter provide a good
starting point for future research.
6.6 References
1 W.G. Brown and K.R. Solvason. Natural convection through rectangular
openings in partitions -1. Int. J. Heat Mass Transfer. Vol. 5,
pp. 859-868. (1962).
97

W.G. Brown. Natural convection through rectangular openings in par
titions -2. Int. J. Heat and Mass Transfer. Vol. 5, pp. 869-878.
(1962).
C. Fritzsche and W. Lilienblum. Neue Messungen zur Bestimmung der
Kalteverluste an Kuhlraumturen. Kältetechnik-Klimatisierung. Heft 9
(1968).
B.H. Shaw. Heat and mass transfer by natural convection and combined
natural convection and forced air flow through large rectangular ope
nings in a vertical partition. Inst. Mech. Engrs. Proc. of 1971 Conf.
C117/71: 31-39. (1971).
B.H. Shaw and W. Whyte. Air movement through doorways - the influence
of temperature and its control by forced airflow. B.S.E. vol.42 (1974).
G.P.A. Bot. Greenhouse climate; from physical processes to a dynamic
model. PhD Dissertation, Agricultural University Wageningen. 240 pp
(1983).
H. Borner. Über den Wärme- und Stoffaustausch an unspülten Einzel
körpern bei Überlagerung von freier und erzwungener Strömung.
Dissertation Technischen Hochschule Darmstadt (1964).
98

7 FINAL DISCUSSION AND CONCLUSIONS
The ventilation of greenhouses can bo provided mechanically by fans or by
natural ventilation. In most cases, the air exchange of greenhouses takes
place by natural ventilation systems. In the present thesis, the natural
ventilation of multi-span greenhouses is investigated. A thorough
knowledge of the ventilation is important with respect to the climate
management of the greenhouses (chapter 1).
Two natural origins can be held responsible for the natural ventilation,
namely the wind around the greenhouse and the buoyancy of the warmer air
in the greenhouse. It can be concluded that the temperature-driven ven
tilation appears mainly of importance under still conditions. However, the
temperature effect could be quantified in a satisfactory way (chapter 6).
In chapter 6 thereupon the combined effect of wind and temperature on the
air exchange were studied. The findings of the measurements show that the
combined effect of wind and temperature on the ventilation can be calcul
ated as a linear superposition of the separate effects. As mentioned
before, in most circumstances the wind effects amply dominate the tem
perature effects. The present thesis is therefore mainly adressed to the
wind induced air exchange of the multi-span greenhouses.
As a starting point for the description of the greenhouse ventilation due
to wind effects, the ventilation through a 'quasi-infinite' cover was con
sidered. The 'quasi-infinite' cover is defined in this thesis as a
greenhouse cover where the wind field near the surface is not influenced
by any boundary effect. Starting from this model the effects of the wind
and various greenhouse parameters on the ventilation can be studied. The
concept of the 'quasi-infinite ' cover was also introduced to serve as a
reference for the ventilation of the real greenhouses. For the quasi-
infinite' covers it was assumed that all windows were operating under the
same conditions and that there was no effect of the side walls (the
finiteness) of the cover on the air exchange. An approach to describe the
ventilation through these windows in this 'quasi-infinite cover was
already outlined in a prior study by Bot (1983). Measurements, however,
99

were carried out in a small compartment only. A major goal in the present
investigation was to thoroughly evaluate the existing description of the
ventilation process through window openings in a more general 'quasi-
infinite' greenhouse cover. The full scale determination of the flow
characteristics of the windows (chapter 2) formed a substantial part of
this evaluation.
In the given description, the ventilation through the windows on a 'quasi-
infinite' cover is characterized by the ventilation function G(a). This
function relates the ventilation flux through the windows (per unit window
area) to the average wind speed at reference level, in dependence of the
opening angle. From a physicists point of view the function G(a) can be
considered as a transform coefficient: it translates the average
windspeed at reference level to the time-averaged superficial windspeed in
one half of the window openings (through one half the flux is in, through
the other half the flux is out).
On the basis of our performed experiments (chapters 2,3 and 4) it was
concluded that the given description provides a good representation of the
air exchange. The results of our experiments confirm our presumption that
the window dimensions play a double role in the ventilation process: they
determine the resistance for the flow through the windows (chapter 2) and
they affect the effectivity of the pressure fluctuations in relation to
the wind speed at reference level (chapters 3 and A ) . The assumption that,
for a ' quasi-infinite' cover, a similar averaged ventilation behaviour
exists for each window was firmly established by our experiments. The
total flux through the cover can be calculated on the basis of the empiri
cally determined ventilation function G(a) and the number of windows on
the cover (calculated from the surface area of the cover and the window to
cover ratio A 0 /A). The effect of the whole cover is found as a super
position of the effects of the single windows.
Ventilation measurements in freestanding greenhouses with different
geometries and surface areas showed an increase of the ventilation com
pared to that of the 'quasi-infinite ' cover (chapter 5 ) . In our approach
to interpret the ventilation of the greenhouses, we assumed the effect of
100

the finiteness (the 'side wall effect') to be superimposed on the ven
tilation flux due to the pressure fluctuations only (i.e. the ventilation
through the greenhouse cover as if it were a 'quasi-infinite' cover).
Surprisingly, this 'side wall effect' appeared to be larger for the
greenhouses with a large surface area. Superposition of the 'side wall
effect' to the general 'infinite cover' approach may lead, however, to an
acceptable description of the ventilation in these freestanding
greenhouses.
Looking at the complete results of our research we may conclude that the
concept of the 'quasi-infinite' cover is a sound basis for the description
of the greenhouse ventilation. The investigations in chapters 2, 3 and 4
therefore certainly provide valuable support. A quantitatively reliable
description of the air exchange of all multi-span greenhouses can be
derived, starting from this concept.
Another conclusion from our research is that the linear superposition of
separate effects leads to an acceptable picture of the combined ven
tilation. This holds true for the combined effects of several windows, for
the combined effects of leeside and windward side ventilation and for the
combined effect of wind-driven and temperature-driven ventilation. This
superposition principle is probably also applicable for freestanding
greenhouses where the 'side wall effect' is to be added to the 'infinite
cover effect'. The 'side wall effect' of any greenhouse, which is depen
dent on both the greenhouse dimensions and site conditions and therefore
different for each greenhouse, can now easily be determined by some
investigatory measurements.
The tracer gas method, used in our experiments to infer the ventilation
rates, assumes a perfect mixing of the air in the greenhouse. A comparison
of the results from a equilibrium concentration method (Bot) and the rate
of decay method (chapter 3) indicates that the whole physical volume of
the greenhouse participates in the air exchange. The same conclusion can
be drawn from an additional experiment which we performed in the compart
ment , determining the decay rates at several points during the same
measuring run. It was found that the different parts in the compartment
loose tracer at the same rates. Apparantly there are no significant
101

stagnant pockets of air in the compartment. Since the greenhouse can be
considered as a chain of similar compartments, it is plausible to assume
that the mixing of the air in the greenhouse is comparable to that of the
air in the compartments and that the decay method is also appropriate to
estimate the ventilation rates in large greenhouse structures.
However, since the mixing of the air is never perfect, measurements made
at one point in the greenhouse may not be reliable. To offset this, the
air was sampled at several locations and mixed before the concentration of
tracer in the air was measured.
In our investigation, empty (single enclosed) greenhouse structures were
considered in which the mixing of air can be assumed to be rather effec
tive. The mixing process of the air in a greenhouse in operation, however,
may be considerably influenced by the presence of a crop or by the appli
cation of thermal screens. It is suggested to direct further investiga
tions primarily on the effect of the crop and the screens on the intra-
space mixing and consequently on the effective ventilation in the
greenhouses at crop level.
102

SUMMARY
The objective and frame work of the present thesis is explained in chapter
1. It was stated that more insight into the air exchange mechanism of
naturally ventilated buildings is important to improve the climate control
of the buildings. This research was directed towards the ventilation of
large multi-span greenhouses. Numerical parameters were collected for the
Venlo type greenhouses. The prior study by Bot (1983) on the ventilation
of the Venlo type greenhouse served as a starting point for our research.
In Bot's work, a general description of the greenhouse ventilation was
outlined. Many parameters, however, were determined in model studies.
Ventilation measurements were performed in one small greenhouse compart
ment only. The aim of the present work was to contribute to a quantitative
description of the air exchange of any large Venlo type greenhouse. This
requires the full scale determination and evaluation of the relevant para
meters which play a role in the ventilation process.
In general, the ventilation of a building is determined by the pressure
distribution around the building and the geometry and location of the
(window-) openings. The pressure differences across the openings act as
the driving force for the air exchange. These pressure differences are
caused by wind as well as by temperature effects. The air flux through the
window openings is also determined by the flow characteristics of the ope
nings, which relate the volume flux through the opening to the existing
pressure difference across the opening. The flow characteristics of the
greenhouse windows vary with the geometry and opening angle. Obviously,
the flow characteristic of the window is a vital element in the descrip
tion and understanding of the air exchange.
The windows of the modern multi-span greenhouses are all located on the
cover in a regular pattern. The window dimensions may vary for the dif
ferent greenhouses. For one particular greenhouse, however, the dimensions
of all windows are usually the same. The first object of our research was
to perform in situ measurements for the validation of an approach which a
103

priori describes the flow characteristics of the greenhouse windows
(chapter 2 ) . The results of the performed full scale measurements were in
agreement with the previously performed measurements by Bot on scale
models. Measurements were carried out for different window types and
opening angles for both flow directions (inflow and outflow). The results
definitely confirmed the presented approach which now can be recommended
for a sound description of the air exchange of greenhouses in practice.
Though in practical circumstances the wind effects are dominant, the ven
tilation due to the temperature difference between the inside and outside
air is of fundamental interest. The temperature effect on the ventilation
through the greenhouse windows is studied in chapter 6. This temperature-
driven ventilation was measured through openings with very different
aspect ratios in a horizontal as well as in a vertical plane. On the basis
of the results, an expression was derived to estimate the ventilation flux
through the window openings caused by temperature effects. The results of
experiments on a model greenhouse supported the presented approach. Next,
an expression for the combined effect of temperature and wind on the air
exchange was given. Full scale measurements showed that this expression
provides a good representation for practical purposes.
In chapters 3, 4 and 5 the effect of the wind on the ventilation through
the windows was studied. The research focussed mainly on the leeside ven
tilation because this type of ventilation can be regarded as the most
important type of ventilation in horticultural practice.
As a point of departure in our description of the ventilation through the
whole cover, the ventilation features of the so-called 'quasi-infinite'
greenhouse covers (i.e. covers of fully enclosed greenhouse compartments,
located relatively far from the outside walls) were considered. For this
type of cover, it is assumed that the time averaged pressure distribution
around each window on the cover is identical and that there is no effect
on the ventilation of the additional pressures near the outside walls. It
behaves as it were a greenhouse cover without side walls.
A description of the ventilation process in this situation, which makes
allowances for turbulent fluctuations is presented in chapter 3. In this
description the ventilation through the windows on the cover is expressed
104

by a ventilation function G(a) which describes the relation between the
ventilation flux per unit window area of the cover surface and the average
wind speed, in dependence of the opening angle of the windows. The
measurements on the ventilation through the greenhouse windows operating
under comparable circumstances (i.e. mounted on a 'quasi-infinite' cover)
provided valuable insight in the ventilation process. The effects of wind
speed, wind direction and window dimensions were investigated.
The description outlined above was well confirmed by the results of the
measurements. A linear relationship has been demonstrated between the air
flux and the average windspeed at reference level for leeside and windward
side ventilation (chapters 3 and 4 ) . Leeside and windward side ventilation
functions G(a) are measured for windows with different dimensions mounted
on a 'quasi-infinite' cover (chapters 3 and 4 ) . The ventilation features
vary for the windows under study. For a window with a small aspect ratio
the initial increase of the ventilation is faster than that for a window
with a large aspect ratio. The differences can partly be explained by the
flow characteristics of the windows. From the measurements, however, it is
also concluded that the pressure fluctuation coefficient Kf(a) is affected
by the window type and the opening angle. This suggests that the window
dimensions and opening angle play a double role in the ventilation pro
cess : they determine the flow characateristics of the opening and affect
the translation of the kinetic energy of the wind field to the pressure
fluctuations near the window opening. This also implies that the ven
tilation functions of various windows can not be predicted a priori even
when the flow characteristics of the windows are known. For this, more
insight into how the pressure fluctuation coefficient is related to the
window dimensions and opening angle is necessary. For three window types
this is already determined.
For leeside ventilation, the wind direction proved to be a parameter of
minor importance. Only a small effect was noticed for the windows with a
relatively small length L0. For the windward side ventilation, however,
the effect of wind direction seems to be more pronounced.
The number of windows on the cover depends on the cover surface area and
on the window to cover ratio A0/A. An essential step in the research was
105

to investigate whether the ventilation function G(a) of the cover is
dependent on the number of windows (i.e. the surface area) of the cover
surface (chapter 3) . Series of leeside ventilation measurements showed
that the ventilation function G(oc) is independent of the surface area (and
so the number of windows). This indicates that the air exchange through a
particular window is mainly driven by the pressure fluctuations across the
window opening in question. So it can be concluded that there is no noti
ceable effect of ventilation from window to window. The absence of bypass-
effects leads to the conclusion that every window that is opened contribu
tes equally to the ventilation of the greenhouse.
A similar conclusion can be drawn from the study on the combined leeside
and windward side ventilation (chapter 4 ) . Apparantly there is no through-
flow between the leeside and windward side windows in such a way that the
fresh air by-passes the old. It appears that in case of the combined ven
tilation the total flux through the cover is the sum of the separate
fluxes through the individual leeside and windward side window openings.
This suggests that also for the combined ventilation the fluxes through
the windows are caused by mainly the pressure fluctuations over the win
dows in question. The separate windward side and leeside ventilation
characteristics therefore contain sufficient information to calculate the
combined ventilation.
The above mentioned results are important for the development of a quan
titative description of the ventilation of the 'quasi-infinite' covers: it
appears that the total ventilation through the cover can be calculated
from the measured ventilation function of the window type and the number
of windows present on the cover.
Up to this point, much knowledge is amassed on the ventilation process of
the windows equipped on a 'quasi-infinite ' greenhouse cover. A clear
understanding is gained how various greenhouse parameters and environmen
tal factors act together and determine the ventilation flux. Parametriza-
tion of the theoretical model of the ventilation leads to a reliable quan
titative description of the air exchange. For three window types the para-
metrization has been performed.
A next step in the research was to investigate whether the ventilation of
greenhouses in actual practice can be understood on the basis of the ven-
106

tilation features of the 'quasi-infinite' greenhouse covers. The ven
tilation measurements in thé enclosed compartments (chapter 3) show that,
even though the locations of the compartments within the whole greenhouse
complex were different, their ventilation features are very much the same.
This suggests that the pressure fluctuations, established in the pressure
fluctuation coefficient, are the same for the whole greenhouse cover. An
additional effect on the ventilation, superimposed on the effect of the
pressure fluctuations, is to be , expected due to the finiteness of the
cover.
The ventilation of several freestanding greenhouses with a different
geometry and surface area was investigated (chapter 5 ) . The results of the
measurements show that the ventilation has increased compared to that of
the enclosed greenhouse compartments, representing the 'quasi-infinite'
cover. The increase of the ventilation is due to an effect, unknown up to
now, which must be attributed to differences of the flow regime over the
limited greenhouse cover and that over the 'quasi-infinite cover.
Surprisingly, it was found that the relative difference between the ven
tilation of the greenhouse and that of the 'quasi-inf inite ' cover
increases for the larger greenhouses. In this respect, both the upwind
wall and the downwind surfaces of the greenhouse seem to be important. The
measurements indicate that the ventilation model of the 'quasi-infinite'
cover can well serve as a starting point for the description of the air
exchange of the whole greenhouse. It seems that on the basis of the ven
tilation characteristics of the 'quasi-infinite' cover together with the
given surface area of the greenhouse, an estimation can be made of the
supplementary flux. In chapter 7 the general approach of our research and
the main results are summarized and discussed.
107

S A M E N V A T T I N G
In dit proefschrift wordt de natuurlijke ventilatie van grote tuin
bouwkassen bestudeerd. Het onderzoek richt zich met name op de ventilatie
van Venlo-warenhuizen. Het kader en de doelstelling van het huidige onder
zoek worden in hoofdstuk 1 toegelicht. Daarin wordt gesteld dat het kwan
tificeren van de luchtuitwisseling van de kassen van belang is voor de
optimalisatie van de klimaatregeling in termen van de gewasproduktie en
de energiebehoefte. Een eerdere studie van Bot (1983) over de ventilatie
van Venlo-warenhuizen diende als uitgangspunt voor dit werk. In Bots
dissertatie wordt een algemene beschrijving van de kasventilatie gepresen
teerd. Veel parameters werden echter bepaald met behulp van schaalmodellen
en ventilatiemetingen werden alleen uitgevoerd in een relatief klein
kascompartiment.
Het onderzoek in dit proefschrift beoogt bouwstenen aan te dragen die een
betrouwbare kwantitatieve beschrijving van de luchtuitwisseling van een
willekeurig Venlo-warenhuis mogelijk maken. Dit vereist de in-situ bepa
ling en evaluatie van relevante parameters die een rol spelen in het ven-
tilatieproces van de kassen.
De natuurlijke ventilatie van een gebouw wordt bepaald door de drukver-
deling om het gebouw en de plaats en afmetingen van de (raam-) openingen.
Het drukverschil over de openingen is de drijvende kracht voor de lucht
uitwisseling. Dit drukverschil wordt veroorzaakt door wind- en tempera-
tuureffecten. Het ventilatiedebiet wordt, behalve door het drukverschil,
ook bepaald door de stromingsweerstand van de openingen. De stromings
weerstand van de raamopening in de kas is afhankelijk van de raamafmetin-
gen en de openingshoek van het betrokken raam en vormt vanzelfsprekend een
belangrijk onderdeel van de beschrijving van het ventilatieproces.
De ramen van de moderne ('multi-span') tuinbouwkassen liggen in een
regelmatig patroon op het kasdek. De raamafmetingen variëren van kas tot
kas, maar zijn over het algemeen voor één bepaalde kas hetzelfde. Een
methode om de stromingsweerstand van de raamopeningen in de kas te
109
beschrijven wordt besproken in hoofdstuk 2. Het eerste doel van ons onder
zoek was deze beschrijving te toetsen aan in-situ metingen. De stromings
weerstand werd bepaald voor verschillende raamtypen en openingshoeken voor
twee stromingsrichtingen (instroming en uitstroming). De resultaten van
onze metingen waren in overeenstemming met de resultaten van eerder uitge
voerde metingen met schaalmodellen (Bot). Deze uitkomst staaft de gegeven
beschrijving van de stromingsweerstand van de ramen die nu dus kan worden
aanbevolen voor de beschrijving van de ventilatie door het kasdek.
Hoewel onder de meeste omstandigheden de windeffecten domineren, zijn de
temperatuureffecten op de ventilatie van fundamenteel belang. De tem-
peratuureffecten op de ventilatie door de raamopeningen zijn bestudeerd in
hoofdstuk 6. De natuurlijke convectie is eerst gemeten voor rechthoekige
openingen met verschillende lengte/breedte-verhoudingen in een horizontale
en in een verticale wand. Op basis van deze resultaten werd een relatie
geformuleerd voor de ventilatie door de raamopeningen tengevolge van tem
peratuureffecten. Uit ventilatieproeven bleek dat deze relatie de
natuurlijke convectie door het raam goed weergaf. Vervolgens is een
methode ontwikkeld om de ventilatie tengevolge van zowel wind- als tem
peratuureffecten te berekenen. In-situ metingen tonen aan dat deze methode
in de praktijk goed te gebruiken is.
In de hoofdstukken 3, 4 en 5 wordt de invloed van de wind op de ventilatie
bestudeerd. Omdat in de praktijk de lijzijde-luchting het meest wordt
toegepast, krijgt deze vorm van ventilatie de meeste aandacht. Als uit
gangspunt voor de beschrijving van de ventilatie door het gehele kasdek
wordt de ventilatie van kascompartimenten beschouwd die relatief ver van
de zijgevels verwijderd zijn. Het dek van zo'n compartiment wordt quasi-
oneindig genoemd. Er wordt verondersteld dat het stromingsveld rond elke
kap (en raamopening) gelijk is en dat er geen statische drukverschillen
optreden tussen de ramen onderling. Er wordt als het ware van uitgegaan
dat het dek zich gedraagt als een dek zonder randeffecten.
Een beschrijving van de luchtuitwisseling door zo'n quasi-oneindig dek
wordt gepresenteerd in hoofdstuk 3. In deze beschrijving wordt de ven
tilatie door de ramen uitgedrukt in een ventilatiefunctie G(a). Deze func
tie relateert het ventilatiedebiet per eenheid raamoppervlakte aan de
110

gemiddelde windsnelheid (op referentiehoogte) en de raamopening. Vervol
gens zijn ventilatiemetingen uitgevoerd in compartimenten waarvan het dek
als quasi-oneindig kan worden beschouwd. Deze metingen gaven veel inzicht
in het ventilatieproces. De invloed van de windrichting, windsnelheid en
de raamafmeting werd bestudeerd.
De resultaten van de ventilatiemetingen kwamen goed overeen met de in
hoofdstuk 3 gegeven beschrijving van de ventilatie. Een lineair verband
werd aangetoond tussen het ventilatiedebiet en de gemiddelde windsnelheid
op referentiehoogte bij lijzijde- en loefzijde-luchting (hoofdstuk 3 en
4) . De ventilatiefunctie G(a) is experimenteel bepaald voor ramen met
verschillende afmetingen op een quasi-oneindig dek. Deze ventilatiefunctie
verschilt per raamtype. Deze verschillen kunnen slechts gedeeltelijk
verklaard worden door de verschillen in de stromingsweerstanden van de
gebruikte raamtypen. Uit de metingen blijkt echter dat ook de druk-
fluctuatiecoëfficiënt Kf(a) voor elk raamtype verschillend is. Dit wijst
erop dat de raamafmetingen en de raamopeningshoek een dubbele rol spelen
in het ventilatieproces: ze bepalen de stromingsweerstand van de raam
opening èn ze beïnvloeden de relatie tussen de kinetische energie van het
windveld op referentiehoogte en de optredende drukfluctuaties bij het
raam. Dit betekent dat de ventilatiefunctie voor een willekeurig raamtype
'niet a priori voorspeld kan worden, zelfs al is de stromingsweerstand van
dat raam bekend. Daarvoor is meer inzicht nodig in het gedrag van de
drukfluctuatiecoëfficiënt Kf als functie van de raamafmetingen en de ope-
ningshoek. Voor drie raamtypen is dit in het proefschrift bepaald.
De windrichting heeft bij lijzijde-luchting weinig invloed op de ventila
tie. Slechts voor ramen met een relatief kleine lengte L 0 lijkt er een
effect te bestaan van de windrichting op de ventilatie. Bij loefzijde-
luchting is het effect van de windrichting op de ventilatie groter.
Het aantal ramen op het kasdek wordt vastgelegd door de oppervlakte van
het dek en de verhouding tussen de totale oppervlakte van de ramen en die
van het totale dek (A0/A). Een belangrijke stap in de beschrijving van de
luchtuitwisseling door het quasi-oneindige dek was te onderzoeken of de
ventilatiefunctie G(a) afhangt van het aantal ramen en dus van de opper
vlakte van het dek (hoofdstuk 3). Een serie metingen bij lijzijde-luchting
111

laat zien dat de ventilatiefunctie G(a) niet beïnvloed wordt door het aan
tal ramen en de oppervlakte van het (quasi-oneindige) dek. Dit beduidt
dat de luchtuitwisseling door elk raam bepaald wordt door de drukfluc-
tuaties over het raam zelf en dat elk geopend raam in gelijke mate
bijdraagt tot de totale ventilatie.
Een dergelijke conclusie kan ook getrokken worden uit een onderzoek van de
ventilatie bij gecombineerde lijzijde- en loefzijde-luchting (hoofdstuk
4 ) . De resultaten van dit onderzoek tonen aan dat de totale ventilatie
beschouwd kan worden als de som van de afzonderlijke lijzijde- en
loefzijde-luchting. Er is geen effect waargenomen dat wijst op doorstro
ming van de lucht tussen de ramen aan de verschillende zijden van de kap
pen. Deze resultaten wijzen erop dat ook in het geval van de gecombineerde
lijzijde- en loefzijde-luchting de ventilatie door elk raam veroorzaakt
wordt door de drukfluctuaties over het raam in kwestie. De afzonderlijke
lijzijde- en loefzijde-ventilatiefuncties geven derhalve voldoende infor
matie voor de berekening van de gecombineerde ventilatie.
De bovengenoemde resultaten zijn belangrijk om tot een goede kwantitatieve
beschrijving van de luchtuitwisseling van een quasi-oneindig dek te komen:
het blijkt dat de totale ventilatie door het dek berekend kan worden uit
de gemeten ventilatiefuncties van het betreffende raamtype en het aantal
ramen op het dek.
Tot dusver is het onderzoek beperkt gebleven tot het ventilatieproces door
de ramen op een quasi-oneindig kasdek, waarover veel kennis is verworven.
Het is duidelijk geworden hoe de verschillende kas-parameters en de omge
vingsfactoren een rol spelen in het ventilatieproces en hoe zij het venti-
latiedebiet bepalen. Voor drie raamtypen is de theoretische beschrijving
van de ventilatie geparametriseerd. Dit leidde tot een betrouwbare
weergave van de luchtuitwisseling door de betrokken ramen.
De volgende stap was te onderzoeken of de ventilatie van de kassen in de
praktijk begrepen en beschreven kan worden op basis van de ventilatie door
het quasi-oneindige dek. De ventilatiemetingen in de verschillende compar
timenten (met een quasi-oneindig dek) in hoofdstuk 3 lieten een gelijk
ventilatiegedrag zien, ofschoon hun plaats binnen het kascomplex erg
verschillend was. Dit wijst erop dat de drukfluctuaties, vastgelegd in de
112

drukfluctuatiecoëfficiënt, gelijk zijn over het hele dek. Het mag echter
worden verwacht dat de aanwezigheid van de zijgevels (m.a.w. de eindigheid
van de kas) een effect zal hebben op de ventilatie door het dek. Veronder
steld wordt dat dit additionele effect gesuperponeerd kan worden over het
effect van de drukfluctuaties. Om dit te onderzoeken zijn ventilatie-
metingen uitgevoerd in verschillende vrijstaande kassen met verschillende
oppervlakten en lengte/breedte-verhoudingen (hoofdstuk 5 ) . De metingen
tonen aan dat de ventilatie van het kasdek relatief groter is dan de ven
tilatie door het dek van een compartiment met een quasi-oneindig dek. Deze
toename van de ventilatie is het gevolg van een (tot nu toe nergens
beschreven) effect dat toegeschreven moet worden aan de verschillen in
stromingspatronen over het quasi-oneindige dek en het eindige kasdek.
Opmerkelijk was het feit dat het relatieve verschil tussen de ventilatie
van de kas en de ventilatie van het quasi-oneindige dek toenam voor gro
tere kassen. Dit is gemeten in kassen met een sterk verschillende lengte/
breedte-verhouding. Dit beduidt dat niet alleen de afmeting van de gevel
aan de windzijde, maar ook de afmeting van de andere gevels en van het
dekoppervlakte van belang zijn voor de toename van de ventilatie.
De metingen tonen aan dat de ventilatiebeschrijving voor het quasi-
oneindige dek goed kan dienen als uitgangspunt voor de beschrijving van de
ventilatie van de gehele kas. Het lijkt erop dat op basis van het venti-
latiegedrag van een quasi-oneindig dek en de oppervlakte van de kas een
schatting gemaakt kan worden van het additionele effect van de gevels en
zo van de totale ventilatie van de kas. In hoofdstuk 7 worden de belang
rijkste conclusies en de onderzoeksmethode geresumeerd en besproken.
113

LIST OF SYMBOLS
A = surface area (mz)
A = additional surface area (m2) a
A = area of ventilating windows (m2)
A = effective opening area of the one-side-mounted window (m2) w
b = breadth (ra)
c = concentration of tracer in enclosure (kg-m~3)
c. = initial concentration of tracer in enclosure (kg-nT3)
c = ambient tracer concentration (kg-m~3)
C = discharge coefficient (-)
C = discharge coefficient for the flux through the front area
of the one side-mounted window (-)
d = thickness (m)
fi(a) = function defined by eqn. 2.3a (-)
fz(a) = function defined by eqn. 2.3b (-)
f (a) = window function defined by eqn. 2.5 (-)
F = friction factor of the rectangular opening (eqn. 2.1) (-)
F = friction factor of the window opening (-)
g = gravitational acceleration (m-s"2)
G(<x) = ventilation function defined by eqn. 3.8 (-)
H or h = height (m)
H = height of the rectangular opening (m)
K = pressure coefficient defined by eqn. 3.1 (-)
K (a) = pressure fluctuation coefficient defined by eqn. 3.2 (-)
L or 1 = length (m)
L = length of rectangular opening (m)
n = rotation velocity of propeller (rad-s"1)
p = perimeter (m)
P = pressure (N-m~2)
P = static time averaged pressure (N-m"2) AP. = pressure difference across inlet and outlet blower (N-m~2)
l-o
R = ventilation rate (s~l) or (h"1)
Re = Reynolds number (-)
t = time (s)
115

T = temperature (K)
u = outside windspoed (nvs-1)
v = velocity of air (m-s~')
V = volume (m3)
w = width (m)
a = window opening angle (deg)
ß = thermal expansion coefficient (K~')
A = difference (-)
p = density (kg-nT3)
p = density of air in the opening (kg-m-3)
p = density of ambient air (kg-m-3)
$ = air volume flux or ventilation flux (m3-s"1)
<I> = ventilation through the greenhouse cover caused by
pressure fluctuations only (eqn. 5.1) (m3-s~')
i' „ = total ventilation of the greenhouse (eqn. 5.1) (m3-s_1) v, G
$ = leakage ventilation (eqn. 5.1) (m3-s_1)
v,S supplementär flux due to 'side wall effect' (eqn. 5.1)
(m3-s-')
<1> = mass flux (kg-s M m
T = roof slope angle (deg)
superscript
~ amplitude
average value
116

CURRICULUM VITAE
Taeke de Jong werd op 3 juni 1958 geboren in Leeuwarden. Na voltooiing van
de Atheneum B opleiding aan de Scholengemeenschap Zuid te Enschede begon
hij in 1976 de studie Landbouwtechniek aan de Landbouwuniversiteit
Wageningen. Het propaedeutisch examen werd gehaald in 1977. De studie werd
in 1979 vervolgd en in 1985 afgerond. Tijdens de doctoraalfase heeft de
nadruk gelegen op de natuurkunde (technische natuurkunde, meet-, regel- en
systeemtechniek en een praktijk verbonden aan de vakgroep Natuurkunde van
de Universiteit van Evora, Portugal). Daarnaast kwamen teelttechnische
aspecten aan de orde (landbouwplantenteelt en grondbewerking).
In 1985 volgde in het kader van een promotieonderzoek de aanstelling als
wetenschappelijk medewerker in tijdelijke dienst binnen de sectie
Natuurkunde van de toenmalige vakgroep Natuur- en Weerkunde (thans deel
uitmakende van de vakgroep Agrotechniek en -fysica). Van 1986 tot 1988 was
hij gedetacheerd aan het Proefstation voor Tuinbouw onder Glas (PTG) te
Naaldwijk (afdeling teelt en kasklimaat).