natural migration barriers for fish by hydropower plants · natural migration barriers for fish by...
TRANSCRIPT

Faculty of Natural Resources and
Agricultural Sciences
Natural migration barriers for fish by
hydropower plants Methods to assess historic passability. Case studies of
migration barriers
Naturliga vandringshinder för fiskar innan
kraftverksutbyggnaden
Anders Johansson
Department of Aquatic Resources
Master´s thesis • 30 hec
Stockholm 2016

Natural migration barriers for fish by hydropower plants Methods to assess historic passability. Case studies of migration barriers Naturliga vandringshinder för fiskar innan kraftverksutbyggnaden
Anders Johansson
Supervisor: Johan Östergren, Swedish University of Agricultural
Sciences,
Department of Aquatic Resources
Examiner: Erik Petersson, Swedish University of Agricultural Sciences,
Department of Aquatic Resources
Credits: 30
Level: Second cycle, A2E
Course title: Independent Project/Degree Project in Biology - Master's thesis
Course code: EX0565
Place of publication: Epsilon
Year of publication: 2016
Cover picture: Er. Larsson, around 1900
Number of part of
Online publication: http://stud.epsilon.slu.se
Keywords: Natural migration barriers, Historic passability, Reference connectivity,
Connectivity, Fish, Brown trout, Eel, Hydropower
Sveriges lantbruksuniversitet
Swedish University of Agricultural Sciences
Faculty of Natural Resources and Agricultural Sciences
Department of Aquatic Resources

1
Abstract Is it necessary to build fishways at all artificial migration barriers to restore and sustain bio-
diversity? Hydropower plants have often been built at places where a difference in height
has been used to gain more power, leading to the hypothesis that many hydropower dams
have been built at natural migration barriers. How are Swedish running waters (not large
rivers) assessed with respect to historical passability for fish at natural migration barriers
and dams? How does one study a specific location with respect to the historical passability
for different fish species?
The methodologies that are evaluated in this thesis are relevant and specific information
from a habitat mapping from Värmland County, where 2 903 km waterways already have
been surveyed. The evaluation in this thesis has been made on various types of artificial
migration barriers, to find out whether natural migration barriers have been replaced by ar-
tificial migration barriers. A detailed study was made on a hydropower plant in a tributary
to the Västerdalälven River, Horrmundsvalla. Several different methods were used to inves-
tigate the historical passability for different fish species. The methods consisted mainly of
historical information and DNA analysis of brown trout (Salmo trutta L.) upstream and
downstream of the waterfall, Horrmundsvallafallet.
Field surveys of Swedish waters are often done with the use of “habitat mapping” (or Jön-
köpingsmodellen). My conclusion after evaluating this habitat mapping, is that the current
mapping methodology gives an unclear result with respect to historical passability for dif-
ferent fish species. The most likely reason to this unclarity is the design of the protocol
template used in the habitat mapping. In the protocol template, one can choose whether it is
a natural or artificial barrier to migration. There is however, no question in the template that
can be used to indicate the historical passability for different fish species. I therefore propose
to change the protocol template, with the aim that historical passability for different fish
species also can be commented.
Historical information indicates that brown trout have not been able to pass Horrmunds-
vallafallet, though some sources refer that eels (Anguilla Anguilla) have been able to pass.
However, this must be very unlikely when one reflects the biological conditions and life
cycle of eels. Bream (Abramis brama) are the fish species that dominate the lake upstream
Horrmundsvallafallet. However, it is not likely that bream have been able to colonize Lake
Horrmunden through Horrmundsvallen on their own, given the breams physiological capac-
ity and watercourse morphology.
The DNA analysis of trout populations upstream and downstream of Horrmundsvallafallet
showed that the difference in the FST (genetic difference between the two populations) was
0.023. The difference in FST could be interpreted as that both populations initially (prior to

2
1960 when the hydropower plant was built) belonged to the same population, but after that
have been isolated. The explanation for why the FST value was so low could however be due
to the stocking history of trout in the lake upstream of the two populations. If one should
conduct an investigation of historical passability based on DNA analysis it is important to
check and examine the historical stocking or transfers of fish in the water systems of interest.
In summary, I conclude that Horrmundsvallafallet was a total natural migration barrier to all
existing fish species prior to human impact of the watercourse. Historical information is
important for assessing historical passability for fish species. However, one should be care-
ful and judge the credibility or plausibility degree of historical sources that are used. The
habitat mapping done by the County Administration Board of Värmland indicates that nat-
ural migration barriers occur at hydropower dams. The share is difficult to determine today
given that Habitat Mapping methodology does not reflect historical passability. Despite the
shortcomings of the methodology, over 5 % of hydropower dams could have been built by
a historically definitive natural migration barrier for trout.

3
1 Table of Contents
2 Foreword 5
3 Dictionary 6
4 Introduction 7
4.1 Aim 12
4.2 Goals 13
5 Methods 13
5.1 Habitat mapping 13
5.2 Toponymy of water stretches 13
5.3 Case study Horrmundsvalla 14
5.3.1 Study area 14
5.3.2 Names in the catchment area 15
5.3.3 DNA of brown trout 15
5.3.4 Traditional methods 17
5.3.5 Field visit to Horrmundsvalla 18
6 Results 18
6.1 Habitat mapping 18
6.1.1 Result Habitat Mapping in Värmland 20
6.2 Toponymy of water stretches 23
6.3 Case study Horrmundsvalla 24
6.3.1 Names in the Horrmundsvalla catchment area 24
6.3.2 DNA of brown trout 25
6.3.3 Traditional methods 32
7 Discussion 40
7.1 Habitat Mapping 40
7.2 Toponymy of water stretches 42
7.3 Case study Horrmundsvalla 42
7.3.1 Names in the catchment area 42
7.3.2 DNA of brown trout 43
7.3.3 Traditional methods 45

4
7.4 Horrmundsvalla 47
7.5 Proposed measures at Horrmundsvalla 49
8 Applications 50
9 Own reflections 51
10 Conclusions 52
11 Suggestions for further studies 53
12 Acknowledgments 54
13 Reference 54
14 Appendix 59

5
2 Foreword
This report is a Master’s Thesis (30 credits) in Biology at the Swedish University of
Agricultural Sciences (Sveriges Lantbruksuniversitet, SLU), Department of Aquatic
Resources. I had three supervisors who all have advanced knowledge of fish migra-
tion, migration barriers and hydropower during this thesis work: Johan Östergren,
SLU, researcher focused on diadromous fish species; Marco Blixt, fish manager at
Fortum Sverige AB; Dag Cederborg, consultant at SWECO Environment AB with
a focus on water environmental issues. This report is addressed to people working
for authorities e.g. county administration boards, water authorities etc., those who
work with these issues in the hydropower industry, researchers and students who
wish to pick up where this report ends and wants to answer the supplementary ques-
tions, as well as an interested public who want more information about the migration
of fish species.
The focus of the thesis was originally "natural migration barriers at hydropower
dams," but has during the run of the work also included scrutiny of how inventory
of migration barriers are today, based on the habitat mapping (Jönköpingsmodel-
len).

6
3 Dictionary
“Obstructions are many and varied. It would be useless to attempt to classify them
beyond distinguishing between the comparatively mild, the definitely difficult, and
the completely impossible.”- Pryce-Tannatt (1938).
Migration barrier: A dispersal barrier that exist within a catchment area. Can be
artificial or natural. Can be partial, definitive or total.
Total migration barrier: A migration barrier that most likely prevent dispersal or
migration for all fish species in the system.
Definitive migration barrier: A migration barrier that most likely prevent dispersal
or migration of one specific fish species.
Partial migration barrier: A migration barrier that most likely prevent some fish
individuals within a species to pass the barrier.
Passable migration barrier: A migration barrier that most likely does not prevent
dispersal or migration for a majority of fish individuals within a species.
Temporal migration barrier: A migration barrier that most likely prevent migra-
tion some of the time, usually at low flows and at disadvantageous temperature con-
ditions.
Passability: Often refers to how big proportion of the measured individuals within
a species that can pass a barrier, ranging from 0 to 100 %.
Natural migration barrier: A migration barrier that is not made by humans; rapid,
waterfall, beaver dam etc.
Artificial migration barrier: A migration barrier that is made by humans; dam,
culvert, wire etc.
Connectivity in streams: “The ability to disperse and free passages for animals,
plants, sediments and organic material in upstream and downstream directions, and
from the river to the surrounding land areas, in relation to the reference condition"
(HaV, 2013).
Status classification connectivity: “In upstream and downstream directions, should
be assessed on fish species with migration needs that occur in the water surface,
according to the reference condition” (HaV, 2013).

7
4 Introduction
Is it necessary to build fishways at all artificial migration barriers to restore and
sustain biodiversity? One of the most common artificial migration barriers to fish in
Swedish rivers and streams are dams. There are approximately 11000 of them in
Sweden. When the expansion of hydropower plants intensified in the 1940s and
1950s, the authorities, power plant owners and expertise in the area assumed that
the damage to fish and other aquatic fauna, as a result of the expansion, could be
solved through various forms of compensation measures (fish ladders, trap- and
transportation, narrow trash racks, fish stocking, restocking animal nutrition (Mysis
relicta), etc.). Among other things, Alm (1927) claimed that “any destroyer; power
plants, industry, log driving and others", would compensate the loss of fishing in the
waters "by fish farming in one way or another”. Focus of the compensatory
measures was primarily to the loss of fish catches of mainly salmon and other highly
migratory species as a result of hydropower dams. Hydropower plants have often
been built at places where a difference in fall height have been used to gain electric-
ity, leading to the hypothesis that many hydropower dams have been built by natural
migration barriers. One can also imagine that the expansion of hydropower dams
occurred at falls and rapids that were partial migration barriers to fish migration.
Biogeographical barriers (dispersal barriers) determine which species that can col-
onize a local habitat (Rahel, 2007). Biogeographical barriers in freshwater systems
can be visualized in three spatial levels: continental, interbasin and within basin.
The largest spatial scale, continental; freshwater fauna are isolated by oceans, moun-
tain ranges and deserts. The next biogeographical barriers are between major river
basins; these areas are isolated from fish species that are unable to spread through
salt water or drainage basin watershed. Within the catchment; waterfalls and rapids
function as biogeographical barriers to freshwater organisms. Waterfalls and rapids
are named natural migration barriers in this study. Historically biogeographical bar-
riers have been one of the main factors that determine which fish fauna that can be
found in an ecosystem (Rahel, 2007).
Swimming speed and jumping ability are the two main parameters that determine
which fish species that can pass a natural migration barrier and colonize a habitat
upstream. All fish species have different “styles” of swimming (Videler & Wardle,
1991). How fast a fish can swim and for how long depends on many factors. Videler
and Wardle (1991) showed how cod (Gadus morruha) length and the water temper-
ature affect their swimming speed. Those two factors are probably the most im-
portant, regardless of fish species. Fish are usually said to have three different swim-
ming speeds (Calles et al. 2013). The first is “sustained speed”, the fish will be able
to maintain the same speed for at least 200 minutes. The second speed is "prolonged
speed" and can be held between 200 minutes and 15-20 seconds. The fastest speed

8
is called “burst speed”, it can be held at maximum 15-20 seconds. Burst speed is
primarily used for predation or avoid being predated on, but can also be used for
passage of some migration barriers. When passing a difficult obstacles, the burst
speed will result in an increase of lactic acid production in the muscles and also in
a long recovery time (Calles et al. 2013). The same goes with a fish specie's ability
to jump. Some fish species such as trout and salmon are shaped to be able to jump
high. These have been documented to be able to jump between 1 and 2 m, in extreme
cases up to 3,7 m (Calles et al. 2013). Other species, such as bream, have a more
limited jumping ability (Calles et al. 2013).
Human activity has created many ways for freshwater fauna to spread between dif-
ferent biogeographical barriers (Rahel, 2007). Between continental barriers, many
fish species have been restocked, and these releases are often well documented. The
first Asian fish species (carp, Cyprinus carpio) came to Sweden in 1560 and two
North American fish species (brook trout (Salvelinus fontinalis) and rainbow trout
(Oncorhynchus mykiss)) were introduced to Sweden in 1892 (Pakkasmaa & Peters-
son, 2005). However, it has been more common that fish species have been moved
between and within river basins in Sweden. In Sweden, native fish species have
been restocked since the Viking age. It is estimated that every third lake in Sweden
over four hectares have at least one introduced fish species (Schindler et al. 2001).
According to Alm (1920) fish have been restocked in over 800 lakes in Sweden
between 1850 and 1916. Between 1917 and 1935 over 2800 fish restocking events
have been recorded in Sweden (Brundin, 1939). Whitefish is probably the fish spe-
cies that have formed most new populations in the country (Pakkasmaa & Petersson,
2005). An alien species is a species that did not originally appear in the country but
was moved there after 1800. However, also native species should be considered as
alien species if they have been moved into areas they have not been able to establish
themselves in a natural way (Pakkasmaa & Petersson, 2005).
Between and within river basins, channels have enabled fish species to spread to
new habitats (Rahel, 2007). In the United States, the Chicago Sanitary and Shipping
Canal was opened in 1900. The canal allowed fish to pass from one basin to another
which enabled several species to pass between catchment areas (Rahel, 2007). In
Sweden, e.g. Göta canal is the equivalent to the Chicago Sanitary and Shipping Ca-
nal, which makes such a passage between basins possible. In 1829 the Welland Ca-
nal was built and allowed fish species to pass the 49 m high Niagara Falls (Rahel,
2007). Sweden's equivalent would be the Trollhättan canal (1800) that enabled in-
creased dispersion of freshwater organisms over Trollhättefallen (Degerman et al.
2001).
There are many effects of fish species and freshwater organisms that are introduced
to new freshwater systems (Pakkasmaa & Petersson, 2005). Even stocking of fish
species that already exist in a freshwater system can have adverse ecological effects

9
(Pakkasmaa & Petersson, 2005). The effects can vary from predation, competition
for food to genetic effects on fish populations (Pakkasmaa & Petersson, 2005). The
above example of Göta canal now allows the invasive species zebra mussel to spread
throughout the canal system (Smith & Lundberg, 2013). The example of Trollhät-
tefallen enabled the increased spread of eels upstream in the system, which elimi-
nated or greatly reduced the crayfish in and upstream Lake Vänern (Pakkasmaa &
Petersson, 2005). However, introduced species do not always need to have a great
effect on the ecosystem. If the introduced species disappear almost immediately af-
ter the introduction, the impact on the ecosystem often is moderate and transient.
Recolonization of historical habitats through restoration of migration routes is most
often seen as positive for biodiversity. In Sweden, most artificial migration barriers
have proposed actions linked to increased connectivity i.e. building fish ladders or
bypass channels. Today there are 7499 pieces of actions linked to connectivity im-
provement, fish way or removal of migration barriers (VISS, 2015; VISS, Water
Information Systems in Sweden, and both suggested and already completed actions
are included). Of these actions about 1200 have already been completed (VISS,
2015). Of the around 2100 hydropower stations in Sweden, about 10 % have some
form of passage (Kling, 2015).
One interesting question then is: which methods have been used to determine the
target species in the systems? In other words; which fish species have occurred nat-
urally in the system, which fish species have been able to pass a historic natural
migration barrier and how many passed the location before human influence (Calles
et al. 2013).
Today there are only a few public reports which investigate the historical passability
for fish by artificial migratory barriers in waterways. One of them is Andersson
(2005) in which he investigated if it was historically possible for salmon to pass the
rapids at Hedefors in Säveån. Andersson used historical maps and images to get an
idea of how the location appeared prior to the dam. In addition, testimonies of vari-
ous people was also used to determine whether salmon had occurred upstream of
the Hedefors rapids or not. The result of the testimonies can be interpreted that there
had never been salmon upstream of the rapid or that salmon actually passed the
rapid. Hedefors has since, been investigated by genetic methods, if trout has been
able to pass the rapids (Dannewitz et al. 2012). In both cases of salmon and trout,
there have been different preconditions to assess historic passability for these spe-
cies. In general there is very little available literature on how to investigate historical
passability (based Google Scholar search for keywords: “historical passability”,
“natural migration barriers” etc.).
However, there are several different methods one can use to assess the current pass-
ability for fish species for barriers that are not influenced by humans. M. Schröder

10
(2016) used telemetry on brown trout to investigate how many individuals that
passed a steep waterfall in Norway. Power & Orsborn (1985) used hydrological
methods to simulate water velocity at waterfalls and compared the speed of the wa-
ter against various fish species swimming and jumping ability. Spens et al. (2007)
used geographic information system (GIS) to predict pike populations in lakes in
Northern Sweden. Spens predicted pike populations at 95.4 % of the lakes based on
the slope of the watercourse. Meixler et al. (2009) used a passability model for dams
and waterfalls for migratory fish species in the United States. Meixler et al. (2009)
simulated swimming speed, jumping ability and depth immediately downstream of
dams and waterfalls to investigate if the physical parameters corresponded to what
the different fish species are able to pass. All of the above methods can be difficult
to apply to examine historical passability by artificial migration barriers for different
fish species. The above methods are generally directed at assessing current passa-
bility, not passability prior to human impact.
Molecular technology (e.g. DNA genetic markers) can be used to investigate the
genetic differences between two populations of fish and thereby can be an important
tool to determine if there has been a natural migration barrier in one place prior to
human impact. Heterozygosity (He) and allelic richness (AR) are two measures used
to describe the genetic diversity within a population. To describe the genetic differ-
ences between two populations FST are often used. FST is largely based on He be-
tween two populations. Deiner et al. (2007) found that there was a genetic difference
in rainbow trout between natural migration barriers and artificial migration barriers
in the Russian River in the United States. There was less genetic diversity for pop-
ulations that were isolated by waterfalls than by dams. Populations that were above
dams were more genetically similar to all populations that were below all kinds of
barriers. Both natural and artificial migration barriers affect the dispersal possibili-
ties different for different fish species (Deiner et al. 2007). Isolation time differ be-
tween natural and artificial migration barriers. This makes it possible to investigate
whether or not a dam has been a natural migration barrier to one fish species with
DNA analysis. How much of the genetic material that has disappeared from the
population by genetic drift, depends on the size of the effective population (Ne),
given that the population is isolated. The effective population size is the number of
individuals in a population that actually contributes with genetic material per gen-
eration. Because many of the old rapids and falls in Swedish rivers are or have been
exploited, it is often impossible to visually determine whether there has been a nat-
ural migration barrier in one place prior to the dam or not. Genetic methods could
be a good way to determine which fish species that historically have been able to
pass e.g. a hydropower dam without knowing the morphology of the historical rap-
ids or fall.

11
Historical documentation belongs to the more "traditional methods", which are
mostly used in the investigation of historical passability for fish (Andersson, 2005).
The documentation consists mostly of water rights verdicts, old maps, historical
photos and interviews. In addition, historical documentation of log driving, mills
and sawmills in the area, could help to assess which fish species that were able to
pass a site. Reviewing historical documentation is important to get an understanding
of the human impacts on the current site, in order to get an view of the site at given
times and whether the conditions for different fish species ever have been suitable
for upstream migration. It is also important to know whether human activity has
impaired or improved dispersal opportunities for freshwater organisms at the site.
Historical pictures often weigh heavily in assessment of historical passability. Pic-
ture show what it looked like at the site at the time the picture was taken and one
can usually say something about the passability of different fish species at the time.
Below, two new investigative methods are presented. Their purpose is to help to
determine historical passability for different fish species, their individual capabili-
ties will be discussed in chapter 6 and 7.
I. Biogeographical dispersal barriers have affected what fish species that can
colonize a habitat. Spens (2007) found that the names of lakes in northern
Sweden could be traced to trout populations. Names of a place often extend
further back in time than what can be found in archives about the location.
The prime question to be asked in this kind of investigation is; are there any
places, lake or rivers name that derived from various fish species that have
been able to pass a natural migration barrier at one time?
II. The second method is also based on historical names, not fish species names
but that of the actual migration barrier. So called nature names were used to
quick and easy refer to a certain place (Pamp, 1988). Names of flowing
water stretches have shown to generally include; current (-ström), rapids (-
fors), falls (-fall) and cliff (-stup). Can the name of the migration barrier say
something about the passability of different fish species in the same way as
names of lakes can be traced to various fish species?
Water authorities and county administration boards have a great responsibility in
water management. The authorities ensure that the Water Framework Directive
(WFD, 2000/60 / EC) is followed. The goal with the WFD is to ensure that all sur-
face water bodies achieved good ecological status/potential by December 22, 2015.
Surface water bodies that did not reach the objectives have in most cases been pro-
vided exceptions to 2021, or in some cases to 2027 (Naturvårdsverket, 2007).
Surface water bodies can be classified to any of:
High status / maximum potential

12
Good status / potential
Moderate status / potential
Unsatisfactory status / potential
Poor status / potential.
Biological factors are the primary determinants whether the water body can reach
good or high status/potential (EPA, 2007). However, it would be unreasonable to
investigate all water bodies in a county and to which biological class they corre-
spond to. Therefore expert assessments are made. To describe the physical impact
on the watercourse, an assessment criterion for the hydromorphological pressure is
used. There are three parameters to be determined in order to classify continuity
(current connectivity). They are the occurrence of artificial migration barriers, frag-
mentation degree and barrier effects. All these parameters can be determined based
on habitat mapping (Naturvårdsverket, 2007). All three parameters are based on the
artificial migration barriers. Recently, a fourth quality factor, connectivity, has been
introduced to replace continuity. This quality criterion is simply based on how many
fish species that are missing in a surface water body due to artificial migration bar-
riers.
Then the relevance of habitat mappings, in terms of describing the physical impact
on a watercourse, comes into question. The new quality criteria, that aims to de-
scribe the lack of a fish species due to artificial migration barriers, matters less when
the ecological dilemma remains. It is usually a dam that blocks fish migration.
Given the lack of knowledge to assess historical passability at artificial migration
barriers, it is important to consider which methods could be useful in future assess-
ments. In line with what has been said earlier in the introduction, miscalculation of
historic passability by artificial migration barriers can have negative ecological con-
sequences.
This report suggests tools to investigate the historical passability for fish species by
artificial migration barriers.
4.1 Aim
The purpose of this study is to investigate if there have previously been natural mi-
gration barriers at dams and hydropower dams, either definitive or partial. This
knowledge is important in order to avoid building fauna passages or fish ladders
where there has been a natural migration barrier in the reference condition. Further,
to investigate whether existing inventory methods are satisfactory or not for captur-
ing former natural migration barriers at today's artificial migration barriers. The in-
ventory (habitat mapping) of migration barriers made by the County Administrative
Board of Värmland is reviewed. This study will also in detail compare different

13
methods that one can use when assessing natural migration barriers by existing dams
and hydropower dams. What are the pros and cons of the different methods?
4.2 Goals
(I) Investigate the proportion of hydropower dams that originally may have
been built at natural migration barriers and examine whether the exist-
ing method (habitat mapping) is adequate with a focus on dams.
(II) Study in detail and compare a few different methods at one of Fortum's
hydropower dams (Horrmundsvalla).
5 Methods
5.1 Habitat mapping
Data has been provided from County Administrative Board of Värmland of the sur-
vey of migration barriers, whit a methodology based on Halldén et al. (2002). The
data has been processed in Excel 2010 and the statistical program R for analysis.
This was done to find correlations between different parameters and to evaluate if
this method is adequate for finding historical natural migration barriers by dams.
5.2 Toponymy of water stretches
Name of fast flowing water stretches have shown to generally include the following
after subsequent name; current (-ström), rapids (-fors), falls (-fall) and cliffs (-stup).
In order to confirm or dismiss that names of natural migration barriers can say some-
thing about the passability of various fish species, data was collected from “List of
Swedish waterfalls” and compiled regarding distances and heights at various sites
with guiding names. Names of water stretches have only been taken from the larger
rivers. A selection of fall heights and distances have been extracted from the histor-
ical data in "List of Swedish waterfalls" 1913-1942 (several editions) by “Kungliga
vattenfallsstyrelsen och statens meteorologisk-hydrografiska anstalt”. The data
from this source can be regarded as slightly inaccurate as the mapping include long
distances.

14
5.3 Case study Horrmundsvalla
5.3.1 Study area
Horrmundsvallen watercourse is located in
Malung-Sälen municipality in Dalarna (Fig-
ure 1). The river flows into Västerdalälven
River and has its original water flow from
the Lake Horrmunden. Today there is a hy-
dropower dam that stops the water flowing
into Horrmundsvallen. The water goes in-
stead through Horrmundsvalla power station
(built in 1960) and passes through a tailrace
tunnel directly into Västerdalälven River.
The power station has an annual production
of 25 GWh and an water capacity of 11 m3/s.
Horrmunden has a catchment area of 354
km2 and a MQ of 4 m3/s (SMHI vattenweb,
2015). The land use in the catchment area
consists mostly of forest and mire, a total of
90 % (SMHI vatenweb, 2015) (Figure 2).
Horrmundsvallen watercourse has a local
catchment area of 10 km2. The river is 3.7
kilometers long, with a total vertical drop of
90 m and an average water flow at the mouth
to the Västerdalälven River of 0.43 m3/s (lo-
cal runoff) (SMHI water Webb, 2015). Fur-
thermore, Lake Horrmunden is a storage res-
ervoir with a regulated amplitude of about 2
m. Horrmundsvallen have poor ecological
status, mainly because it is a “dry”
streambed. An assessment of the ecological
status for the watercourse, done in 2009,
found it to be in unsatisfying status (VISS,
2015). The biological parameter that was in-
vestigated was fish fauna. However, at the
same time the fish community parameter was
assessed to have good ecological status. The
fish community showed a relatively high density of trout (30 ind./100 m2) and a few
bullheads were found during the electrofishing in 2006-08-29 (Sers, 2016). In 2015
Figure 1: Lake Horrmunden catchment area,
dotted line. Horrmundsvallen local catchment
area, soild line (SMHI vattenwebb, 2015).
Figure 2: Land use in the whole catchment area.

15
a new assessment of the ecological status was made by the water authorities. In this
assessment, the river received poor ecological status. In the later assessment the in-
vestigated parameters were changed from quantities of fish to expert opinion. The
proposed action to achieve good ecological status is a fish ladder or bypass channels
to create connectivity between Västerdalälven River and Lake Horrmunden.
5.3.2 Names in the catchment area
All names that were water surfaces and land surfaces in close to water bodies were
collected using a digital map. Which place, lake or river name can be attributed to
various fish species or fishing methods in the river basin? Is it possible to apply
Spens (2007) method of fish names in the catchment area to investigate what fish
species that have been able to pass a natural migration barrier?
5.3.3 DNA of brown trout
Tissue samples (fin clips) were taken from brown trout
in Horrmundsvallen during electrofishing, 1 Oct. 2015.
This was done to examine whether trout upstream and
downstream of Horrmundsvallafallet (front picture)
originally formed the same population from before
1870 or not. In total 25 tissue samples were collected
downstream and 32 upstream of Horrmundsvallafallet.
Tissue samples were from five different locations
(sites) in the watercourse (Figure 3). Due to a low
amount of tissue samples collected from trout, samples
from all age groups were considered. The tissue sam-
ples were stored in alcohol prior to analysis. Microsat-
ellites were used to determine the genotype and a total
of ten microsatellites have been studied. Microsatellites
analyzes are described in Dannewitz et al. (2012).
5.3.3.1 Statistical analysis of DNA re-
sults
A series of statistical analyzes have been made to pro-
vide estimates of population structure, size and genetic
diversity. The statistical analysis was done by J. Öster-
gren. The interpretation of the results has been made by
the author.
COLONY 2.0.6.1 (Wang & Jones, 2009) was used to
estimate the number of full- and half-siblings in the two populations. This was done
Figure 3: Electrofishing sites and habitats for trout.
Dots shows electrofishing sites and where tissue sam-
ples were taken. Stretch 3 is the suspected definitive
natural migration barrier for trout. Stretch 3, 5, and
6 have been classified as zero habitat for trout.

16
to determine if the samples from Horrmundsvallen gave an unrepresentative picture
of the populations (many individuals from the same family group). If an unrepre-
sentative picture of the trout population would appear, the subsequent analyzes may
be incorrect (Hansen et al. 1997).
GENCLASS2 (Piry et al. 2004) was used to examine what population an individual
most likely belongs to. This was done to determine if some individuals from the
downstream population were more likely to belong to the upstream population or
vice versa. Also analysis if individuals who are more likely not belonging to neither
of the two populations.
STRUCTURE (Pritchard et al. 2000) was used to obtain information about how
populations are related to each other. STRUCTURE identifies a material of un-
known origin and divides them into how many "populations" most likely there are
within the material, also known as "genetic clusters" (K). The program uses Hardy-
Weinberg equilibrium and identifies a number of clusters that have the least devia-
tions from Hardy-Weinberg equilibrium.
FSTAT (Goudet, 1995) was used to calculate He (expected heterozygosity), AR (al-
lelic richness), FIS (average deviation from Hardy-Weinberg equilibrium), FST (ge-
netic difference between two populations) and GST (genetic difference between two
populations alternatively index to FST).
PHYLIP (Felsenstein, 2004) was used to examine how the trout in Horrmundsvallen
relates to other trout populations in Sweden and Dalälven River. The program uses
"neighbour-joining" method of chord distances (DCE).
5.3.3.2 Calculations of the effective population size and loss
of genetic material
Calculations were made on He and GST to investigate whether or not the two popu-
lations belonged to the same population in 1870 (the same calculation made in
Dannewitz et al. (2012)). The year 1870 was chosen because that year a weir was
built over Horrmundsvallafallet which most likely made it impossible for trout to
pass upstream of the fall.
Effective population size (Ne) is a measure of how many individuals actually con-
tributes with genetic material per generation. It is strongly linked to the rate of loss
of genetic material over a period of time. The relationship between reduced genetic
diversity (h) and Ne per generation is usually written as h = 1-(1/2 Ne) (Allendorf et
al. 2013). Because trout upstream Horrmundsvallafallet have had limited space
since 1870, I calculated how big the upstream trout population must have been for
the loss of genetic diversity to be reasonable, given that it is isolated. For calculating
the loss of genetic material (He and GST) the Hendry et al. (2000) calculation formula

17
is used. In total, there have been four assumptions: (I) a generation time of 4.6 years
(Dannewitz et al. 2012), (II) downstream population has no loss of He (due to less
degree of isolation because it is in contact with populations in Västerdalälven
River), (III), both populations originally had the same He at the time of isolation and
(IV) that no trout were able to migrate uppstream the waterfall Horrmundsvallafallet
since 1870.
A simple population estimate (N) was made on trout upstream of Horrmunds-
vallafallet based on the electrofishing data. This was done to investigate if it is rea-
sonable that the loss of genetic material, or the genetic difference between the pop-
ulations, has occurred since 1870. The population estimate was made solely on the
stretch (length) that was considered appropriate habitat for trout and not per area.
Trout density was also assumed to be reduced upstream in the river because due to
lower water and habitat quality (log driving had affected the stretch). Trout density
assumed to decline 5 %, 10 % or 15 % per 100 m from the largest population by the
fall. Stretch 5 and 6 were classified as a zero habitat for trout (Figure 3). Stretch 4
was the only stretch upstream of the fall that was considered appropriate habitat for
trout. The effective population size (Ne) is assumed to vary between 10 % and 20 %
of the total population (N) based on several studies of Ne:N conditions on trout pop-
ulations (Palm et al. 2003; Charlier et al. 2011; Allendorf et al. 2013). For this study
10 % and 20 % have been chosen to produce an interval of the effective population
size that occurs in Horrmundsvallen. It is difficult to calculate the exact Ne:N ratio
required for a population, however for this study the 10 % and 20 % ratio is suffi-
cient.
5.3.3.3 DNA comparison
What are the expected differences in FST, He and AR for populations that are sepa-
rated by barriers? A comparative study has been made of natural and artificial mi-
gration barriers with the results from Horrmundsvallen in this study and other stud-
ies were microsatellites have been used. Data has been obtained from studies made
on the Salmonidae family (appendix 1).
5.3.4 Traditional methods
Traditional methods include the collection of historical information which may be
relevant for assessing the passability of various fish species. In this list historical
documents are presented which are relevant to assess historic passability:
All water right permits and the basis of all water right permits for Hor-
rmundsvalla power station(1939-1971).

18
Log driving documentation from 1883 relating to a floating inspection of
the catchment area and the floating conditions in the catchment area (1873-
1936).
Historical pictures from SMHI historical archives (SMHI, historical gallery,
2015).
An 8-mm film about the log driving in Horrmundsvallen by Mats Elfqvist
(1960).
Historical maps from the land survey (Lantmäteriet).
Interview with Sune Brändholm (chairman of Malung-Sälen fishing asso-
ciation) regarding the fishing conditions in the catchment area.
Historical information from the “Kungl. Maj:ts Befallningshafvandes
femårsberättelser, Kopparbergs Län.” an old document about the county of
Dalarna (Statistiska centralbyrån , 2015).
Historical information and maps from the National Heritage Board (RAÄ).
Information from the ”Förteckning över Sveriges vattenfall” (List of Swe-
dish waterfalls) published by “Kungliga vattenfallsstyrelsen och statens me-
teorologisk-hydrografiska anstalt”.
5.3.5 Field visit to Horrmundsvalla
During the field visit to the watercourse and the migration barrier, information about
the habitat quality for trout and information on Horrmundsvallafallet was collected.
Migration barrier morphology, such as height, distance and slope were noted during
the field visits. Entering possibility (pool conditions) for fish was estimated as well.
6 Results
6.1 Habitat mapping
What kinds of different migration barriers and how many are there, in Värmland?
What types of dams are natural migration barriers? A study of natural migration
barriers based on raw data from Värmlands habitat mapping.
The habitat mapping of Värmland county is probably the most comprehensive sur-
vey of aquatic environments in Sweden. The survey started in 2005 and lasted until
2010, with a total of 2903 km waterways inventoried. The purpose of the survey
was to get an overall picture of the watercourses and the environment around them
as well as describe human impact on the waters. The results of the survey were
meant to provide a basis for restoration work, protection of environment and status
classification of hydromorphological quality elements. One of the many milestones

19
of the project was to describe migration barriers and examine the fragmentation de-
gree of the watercourses (County Administrative Board of Värmland, 2013). The
methodology for the habitat mapping is primarily directed to waterways in smaller
rivers.
The methodology used to survey migration barriers is partly based on Abra-
hamsson’s (1995) "methodology for surveying rapids and falls", in which he inves-
tigated different methods used to identify rapids and falls. A total of 41 items were
assessed as rapids after field visits. The sources he used included maps, aerial pho-
tographs, dam lists, electrofishing protocols, benthic fauna protocols and stream in-
ventories. Aerial photos could identify 71 % of the rapids and was rated as the best
identification method. Later, the methodology has been developed and revised by
Halldén et al. (2002) in "Habitat mapping - streams". The methodology proposed
by Halldén et al. is a method that is broadly used to survey migration barriers in
Värmland.
The basic information gathered in the field are; type of obstacles, drop height, flow,
dam chest appearance, number of spillways or drums, dry furrow and if it is a natural
migration barrier (Table 1). Also to be noted is function or the use of dams today
and the function it had in the past. An assessment is made whether the barriers are
passable, partial or definitive migration barrier for roach and trout separately. And
finally suggested actions that should be done at the barrier.
Table 1. Basic information that should be collected about the migration barrier.
Migration barrier infor-
mation
Information about respective parameter
Type of obstacle Rapid/fall, beaver dam, debris, other natural object, dam, culvert,
blast rock or other artificial object
Total head Head height: The whole drop height of the barrier, and if there are
several drops the total height should be listed.
Used head height: The height that is used by a hydropower plant
Flow Assess: The flow at the site in m3/s
Water flow: Asses if there is a low (L), middle (M) or high (H) wa-
ter flow.
Dam chest Length and width of the dam chest as well as a drawing of the dam.
No. of Spillways/Cul-
verts
Number of spillways by the dam or number of culverts by road pas-
sage.
Dry streambed If there is a dry streambed and how long it is.
Natural barrier Assess if the migration barrier has been a natural migration barrier.
Since it is difficult to determine one can chose; Yes, No or Unclear.
Culvert information Information about the culvert´s length, diameter, water velocity and
so on.

20
6.1.1 Result Habitat Mapping in Värmland
Of the 2385 migration barriers that were surveyed in Värmland, there were most
rapids / falls (661 pcs) followed by dams (624 pcs) and finally beaver dams (469
pcs) (Figure 4). Blast rock (161 pcs), culverts (150 pcs), "other artificial objects"
(130 pcs) and debris (136 pcs), constituted a smaller part of the migration barriers
in the landscape. The fewest migration barriers were made out of "other natural ob-
jects", in total 54 pieces. The total distance surveyed was 2903 km long, divided
into 478 water bodies. Of the 478 water bodies there were 57 water bodies that
completely lacked migration barriers for trout. Migration barriers that are consid-
ered natural are rapids / falls, beaver dams, debris and "other natural objects." The
artificial migration barriers are dams, culverts, "other artificial objects" and blasted
rock. Of the total 2385 migration barriers surveyed, 1319 of these were natural mi-
gration barriers and 1066 as artificial migration barriers in a rough estimate.
Contemporary use of dams in Värmland was divided into hydropower dams, regu-
lating dams, other dams and those not used (Figure 5). Most dams surveyed seen to
have no function or use today, 270 pieces. Furthermore, there were 190 pieces of
regulating dams and 130 pieces of hydropower dams. There were 18 dams that had
another function than the dams above and 12 dams who had not been classified
regarding present usage. Fourteen of the hydropower dams were classified as natural
Rapid/falls28%
Beaver dams20%
Debris6%
Other natural objects
2%
Blast rock7%
Culverts6%
Other artificial objects
5%
Dams26%
Figure 4: Different types of migration barriers in Värmland. Total 2385 pieces inventoried.

21
migration barriers (Figure 6). Regulating dams had 9 classified as natural migration
barriers. Of the dams that had no contemporary use (270), 46 were classified as
natural migration barriers.
Of the Culverts only four were classified as natural migration barriers. The migra-
tion barriers that were in the category blasted rock, 117 of 161 were classified as
natural migration barriers. Migration barriers which were of the type "other artificial
objects" 14 out of 130 were classified as natural migration barriers.
Figure 6: Proportions of dams that have been classified as natural migration barrier (N in the
diagram) for hydropower dams, regulating dams and dams that have no use today. Total of 594
dams, “different use” and “not given” have been removed from this figure due to low amount of
dams. The shares that have been pulled out of the circle diagram have been classified as natural
migration barriers.
Dams that had a total height drop between 0 and 1 m had the lowest proportion of
dams classified as natural migration barriers (Figure 7). Of the dams that had a total
height drop between 1.1 and 3 m had roughly 12-13 % classified as natural migra-
tion barriers. In dams that had a total height drop between 3.1 and 4.5 m there was
a varied amount of natural migration barriers. The dams had a higher total height
drop of over 4.5 m, 18-20 % were classified as natural migration barriers. For the
four height classes, see figure 8 for their 95 % confidence intervals.
No use today38%
No use today N
8%Hydropower
dams20%
Hydropower dams N
2%
Regulating dams31%
Regulating dams N
1%

22
Figure 7: Artificial and natural migration barriers for 607 dams. Dams have been sorted by to-
tal height of barriers (not always dam height) in steps of 0.5 m up to 5 m height. Dams that
have a total drop height between 5.1 and 10 m represent one interval. All dams over 10.1 m
have been sorted to an own interval. N represents the numbers of dams in each interval, note
that there is a difference in number of dams in different intervals. Dams that have been classi-
fied as uncertain (N=2) have been removed from the figure. Dams that did not have a total
height, have also been removed.
Figure 8: Expected share of natural migration barriers by dams based on the data from habi-
tat mapping in Värmland. Confident intervals (95 %) is based on number of dams that have
been classified as natural migration barrier in different height classes. Number of dams in the
analysis were 164, 274, 54 and 115 from the lowest to highest interval.
0%10%20%30%40%50%60%70%80%90%
100%
N=8
9
0-0
,5
N=7
5
0
,6-1
N=8
4
1,1
-1,5
N=
89
1,6
-2
N=3
7
2,1
-2,5
N=6
4
2
,6-3
N=2
2
3,1
-3,5
N=2
9
3
,6-4
N=
3
4
,1-4
,5
N=3
3
4
,6-5
N=5
7
5
,1-1
0
N=2
5
10
,1-9
0
N=6
07
A
ll
Artificial migrationbarriers
Natural migration barriers
0
5
10
15
20
25
30
35
< 1 m 1.1 - 3 m 3.1 - 4.5 m > 4.5 m
% o
f to
tal s
har
e o
f d
ams
inve
tori
ed
as
NM
B
Total height drop (m)

23
Of the action proposals that are linked to the 72 dams classified as natural migration
barriers, 50 dams had proposed actions that were linked to increase fish migration
(Figure 9). Only 5 of them stated that nothing should be done, and 17 of them had
no comment. For the 661 rapids and falls, there were 258 (39 %) action proposals
that can be related to increased fish migration. For the 275 definitive migration bar-
riers for trout in the class rapids and falls, there was 86 (31 %) suggested actions
linked to increased migration or dispersal of fish. Furthermore, there was a variation
among the survey personnel and how many natural migration barriers were being
classed among the dams (which you would expect when different people make dif-
ferent assessment on various dams).
6.2 Toponymy of water stretches
Four names almost always occur in the naming of water stretches that have a higher
water velocity than the rest of the watercourse. As stated earlier these are: current
(-ström), rapid (-fors), fall (-fall) and cliff (-stup). The greatest fall height in the
shortest length can be found in water stretches whose names end in –cliff and –fall
(Figure 10). Water stretches whose names ends in –current and –rapid have com-
parable slopes with each other and are both lower than –cliff and -fall. The sub-name
Fishladder; 25
Improve fishladder;
5Tear down; 11
Improve pool
depth; 6
Different; 3
No Comment;
17
None; 5
Figure 9: Proposed action to 72 dams that have been classified as natural migration bar-
riers. If there have been several actions suggestions to one dam, only one have been taken
into account.

24
can end with –s (-en, -et,), which can indicate if there have been one or more places
where water have dropped on the route.
Figure 10: Fall heights and distances for different name endings for some water stretches in
bigger rivers in Sweden. The coloured lines represent the best linear model for different endings.
6.3 Case study Horrmundsvalla
6.3.1 Names in the Horrmundsvalla catchment area
In total 218 names of places were collected of water surfaces and land surfaces in
the catchment area. In Horrmundsvalla basin following names can be derived from
fish and fishing: Abborrnäs (Perch) , Idbäckssätern (Ide), Idbäckfjärden (Ide),
Båthusviken (The Boathouse Bay) , Fiskbyvik (Fish village bay), Fisklösvik (No
fish bay) , Magerabborrtjärnen (Many Perch pond), Mörttjärn (Roach Pond), Ab-
borrtjärnen (Perch pond), Mjärdtjärnen (Trap pond), Gäddhån (Pike bay), Fisklösen
(No fish), Idvik (Ide bay), Idtjärnen (Ide pond), Mörttjärn (Roach Pond),
Gäddtjärnen (Pike pond) and Fiskbyudden (Fish village point). From these names,
one could predict that the roach, perch, pike and ide are present in the catchment.
All these fish are common species, and all are found in Lake Horrmunden. One can
also state that traps have been used as fishing gear. The main fish caught with traps
was pike and perch. There was also a tuft of grass in the water in the catchment area
called braxentuvan (bream grass) (Riksantikvarieämbetet, Fornsök, 2015). The
grass was called “bream grass” because of bream fishing. Since much of the catch-
ment is present in Älvdalen’s Parish, the Elfdalians fish names were also examined
0
10
20
30
40
50
60
70
0 2000 4000 6000 8000
He
igh
t
Distance
Current (Ström)
Rapid (Fors)
Fall (Fall)
Cliff (Stup)

25
for various fish species (Table 2). None of the fish names were Elfdalian. Further-
more, no names were found that derived from eel, bleak, whitefish, grayling and
trout in the river basin.
Table 2: Swedish, Elfdalian and English names for some common fish species.
Swedish Elfdalian English
Öring Orad, Örad Brown trout
Ål Ål Eel
Gädda Gedda, Pilågedd,
Knaivstsiedsgedd,
Ljåskuogedd
Pike
Abborre Abuorr, Kniktabuorr,
Kartabuorr
Perch
Mört Mört Roach
Id Smoid, Gambelid Ide
Braxen Braks Bream
Löja Loga Bleak
Sik Saik Whitefish
Siklöja Blikta Vendace
Lake Latsi Burbot
Harr Arre Grayling
6.3.2 DNA of brown trout
COLONY identified no full or half siblings in any of the populations. Therefore, all
individuals were retained for subsequent analyzes. GENCLASS placed 44 out of 57
(Q = 0.77) samples to the right fish location with the self-assignment feature (high
value tend to indicate distinct genetic populations, 0.77 can be seen as a quite low
value). Moreover, one individual was caught downstream of Horrmundsvallafallet
which was more likely to belong to the upstream population. One individual in the
downstream population could not be placed in neither the upstream nor downstream
population. STRUCTURE identified the trout samples from Horrmundsvallen to
most likely consist of two populations (K = 2, two clusters). The result from
STRUCTURE visualizes how the upstream and downstream populations are related
to each other using red and green colors (Figure 11). There is a larger element of
green color upstream than the downstream population, but it is not a clear difference
between the populations. One locus in the lower population deviated significantly
from the Hardy-Weinberg equilibrium, however, the mean for all deviations from

26
the Hardy-Weinberg equilibrium was not significant (i.e. not a significant devia-
tion). FST and GST among the populations was 0.023 and 0.012. Expected heterozy-
gosity (He) upstream of the fall was 0.62 and He downstream was 0.65. Alleic rich-
ness (AR) was 4.5 upstream and 5.2 downstream. Horrmundsvallens trout clusters
near other trout from Dalälven River (Figure 12, 13).
Figure 12: Dendrogram from 92 populations on Swedish trout (reference material) is con-
structed using "neighbour-joining" from chord distance (Dce) (Felsenstein, 2004). Sea migrat-
ing populations (red) and stationary or lake migrates (blue) and samples from fish farm (indi-
cates with $). Horrmundsvalla is showed with an arrow.
Figure 11: Results from STRUCTURE, 1 is the downstream population and 2 is the upstream
population. One individual represent one bar and the color represent genetic clusters.

27
Figure 13: Dendrogram for trout in Dalälven River catchment area. Hor-
mÖvre and HormNedre indicates upstream and downstream population,
respectively.

28
6.3.2.1 Calculations of the effective population size and the
loss of genetic diversity
The population upstream of Horrmundsvallafallet was too small to correspond to
the loss of genetic diversity since 1870, i.e. a much lower genetic diversity was ex-
pected in the sample today. Thus it is not reasonable that the genetic difference (GST)
between the two populations or the loss of genetic diversity have occurred since
1870, given the population estimates made (Table 3). The electrofishing showed
88.5 individuals per 100 m at the bottom of stretch 4, which is approximately 1700
m. Assuming that the trout density decreases by 5 %, 10 % or 15 % per 100 m
upstream, the total population should consist of 1030, 737, or 553 individuals (Table
3,4). Based on the electrofishing and adoption of various Ne:N ratios, Ne should vary
between 55 and 206 in the upper population. About 31 generations have passed since
1870 to 2015 with a generation time of 4.6 years. For GST to increase from 0 to 0.012
over 31 generations an effective population (Ne) of 320 in the upper population is
needed. Alternatively, He should decrease from 0.655 to 0.618, an effective popula-
tion (Ne) of about 270 is needed in the upper population, given all the assumptions
mentioned in the method section.
However, the loss of genetic diversity, or the difference between populations (GST),
coincides with when the hydropower plant was built in 1960 (Table 4). From 1960
to 2015, approximately 12 generations have passed with a generation time of 4.6
years. For GST to increase from 0 to 0.012 over 12 generations an effective popula-
tion (Ne) of 120 in the upstream population is needed. Alternatively, He should de-
cline to 0.618, an effective population (Ne) of about 103 in the upstream population
is needed. That is a better explanation for the decrease in heterogeneity and an in-
crease in GST (Table 4).

29
Table 3: Populations estimates (N) and different Ne:N ratios for trout upstream of
Horrmundsvallafallet. Expected decrease by loss of genetic diversity (He) since
1870. Alternative expected increase in GST between the upstream and downstream
populations in Horrmundsvallen since 1870.
Assumptions on decrease in
habitat and assumptions on
different Ne:N ratios
N Ne He GST Is it reasonable
loss of genetic
material since
1870?
15 % per 100 m. Ne:N 10% 553 55 0,493 0,065 No
10 % per 100 m. Ne:N 10% 737 74 0,531 0,050 No
5 % per 100 m. Ne:N 10% 1030 103 0,563 0,036 No
15 % per 100 m. Ne:N 20% 553 111 0,569 0,034 No
10 % per 100 m. Ne:N 20% 737 147 0,589 0,026 No
5 % per 100 m. Ne:N 20% 1030 206 0,607 0,019 No
Theoretical pop. (corresponds
to He)
270 0,618 0,014 -
Theoretical pop. (corresponds
to GST)
320 0,624 0,012 -
Table 4: Populations estimates (N) and different Ne:N ratios for trout upstream of
Horrmundsvallafallet. Expected decrease by loss of genetic diveristy (He) since
1960. Alternative expected increase in GST between the upstream and downstream
populations in Horrmundsvallen since 1960.
Assumptions on decrease in
habitat and assumptions on
different Ne:N ratios
N Ne He GST Is it reasonable
loss of genetic
material since
1960?
15 % per 100 m. Ne:N 10% 553 55 0,587 0,027 No
10 % per 100 m. Ne:N 10% 737 74 0,604 0,020 No
5 % per 100 m. Ne:N 10% 1030 103 0,618 0,014 Yes
15 % per 100 m. Ne:N 20% 553 111 0,620 0,013 Yes
10 % per 100 m. Ne:N 20% 737 147 0,629 0,010 No
5 % per 100 m. Ne:N 20% 1030 206 0,636 0,007 No
Theoretical pop. (corresponds
to He)
103 0,618 0,014 -
Theoretical pop. (corresponds
to GST)
120 0,623 0,012 -

30
6.3.2.2 DNA comparison
He and AR are expected to be lower upstream a barrier for fishes in the family Salm-
onidae (Deiner et al. 2007). Delta He and Delta AR are the difference between up-
stream and downstream populations for each studied barrier in figure 14, 15 and 16
below. There are correlations between FST, Delta He and Delta AR for all populations
that are separated by barriers (Figure 14, 15, 16). Horrmundsvalla have one of the
lowest FST, delta He and Delta AR values compared with other studies of natural
migration barriers and dams.
Figure 14: Data from different studies on difference in DNA upstream and downstream water-
falls and dams on Salmonides. Delta He is the difference between downstream and upstream
population. FST is measure for genetic differentiations between populations.
y = 0,8836x + 0,0243R² = 0,6688
0
0,1
0,2
0,3
0,4
0,5
0,6
-0,2 0 0,2 0,4 0,6
F ST
Delta He
Natural migrationbarriers
Dams
Horrmundsvalla
Linear (Naturalmigration barriers)

31
Figure 15: Data from different studies on difference in DNA upstream and downstream water-
falls and dams on Salmonides. Delta He is the difference between downstream and upstream
population. FST is measure for genetic differentiations between populations. Delta AR (allelic
richness) is the difference between downstream and upstream populations.
Figure 16: Data from different studies on difference in DNA upstream and downstream water-
falls and dams on Salmonides. Delta AR (allelic richness) is the difference between downstream
and upstream populations. FST is measure for genetic differentiations between populations.
y = 0,052x + 0,0543R² = 0,7626
-0,1
0
0,1
0,2
0,3
0,4
0,5
-2 0 2 4 6
Del
ta H
e
Delta AR
Natural migrationbarriers
Dams
Horrmundsvalla
Linear (Naturalmigration barriers)
y = 0,0257x + 0,1106R² = 0,2273
0
0,1
0,2
0,3
0,4
0,5
0,6
-1 1 3 5
F ST
Delta AR
Natural migrationbarriers
Dams
Horrmundsvalla
Linear (Naturalmigration barriers)
32
6.3.3 Traditional methods
6.3.3.1 Log driving in Horrmundsvalla 1871 to 1960
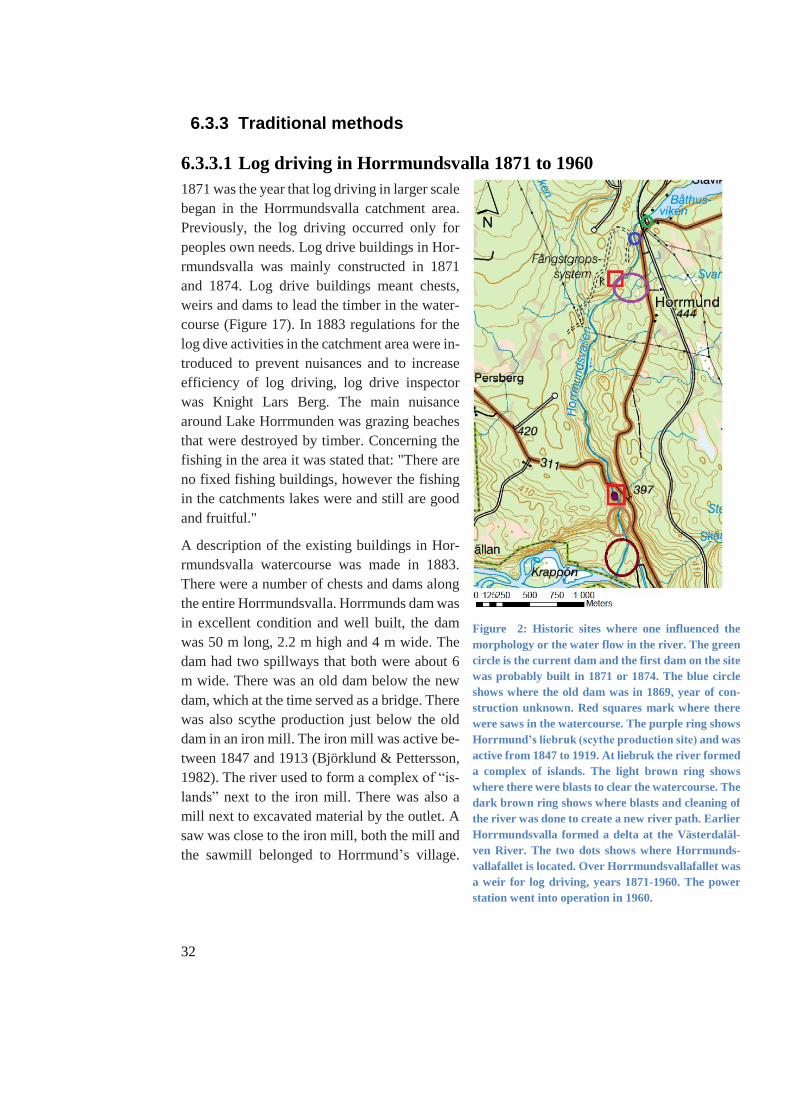
1871 was the year that log driving in larger scale
began in the Horrmundsvalla catchment area.
Previously, the log driving occurred only for
peoples own needs. Log drive buildings in Hor-
rmundsvalla was mainly constructed in 1871
and 1874. Log drive buildings meant chests,
weirs and dams to lead the timber in the water-
course (Figure 17). In 1883 regulations for the
log dive activities in the catchment area were in-
troduced to prevent nuisances and to increase
efficiency of log driving, log drive inspector
was Knight Lars Berg. The main nuisance
around Lake Horrmunden was grazing beaches
that were destroyed by timber. Concerning the
fishing in the area it was stated that: "There are
no fixed fishing buildings, however the fishing
in the catchments lakes were and still are good
and fruitful."
A description of the existing buildings in Hor-
rmundsvalla watercourse was made in 1883.
There were a number of chests and dams along
the entire Horrmundsvalla. Horrmunds dam was
in excellent condition and well built, the dam
was 50 m long, 2.2 m high and 4 m wide. The
dam had two spillways that both were about 6
m wide. There was an old dam below the new
dam, which at the time served as a bridge. There
was also scythe production just below the old
dam in an iron mill. The iron mill was active be-
tween 1847 and 1913 (Björklund & Pettersson,
1982). The river used to form a complex of “is-
lands” next to the iron mill. There was also a
mill next to excavated material by the outlet. A
saw was close to the iron mill, both the mill and
the sawmill belonged to Horrmund’s village.
Figure 2: Historic sites where one influenced the
morphology or the water flow in the river. The green
circle is the current dam and the first dam on the site
was probably built in 1871 or 1874. The blue circle
shows where the old dam was in 1869, year of con-
struction unknown. Red squares mark where there
were saws in the watercourse. The purple ring shows
Horrmund’s liebruk (scythe production site) and was
active from 1847 to 1919. At liebruk the river formed
a complex of islands. The light brown ring shows
where there were blasts to clear the watercourse. The
dark brown ring shows where blasts and cleaning of
the river was done to create a new river path. Earlier
Horrmundsvalla formed a delta at the Västerdaläl-
ven River. The two dots shows where Horrmunds-
vallafallet is located. Over Horrmundsvallafallet was
a weir for log driving, years 1871-1960. The power
station went into operation in 1960.

33
There was a saw belonging to Resjövallen’s village next to Horrmundsvallafallet.
The weir over Horrmundsvallafallet was at times 12 m wide and 21 m long.
To enable timber to float downstream Horrmundsvallafallet at lower water flows, a
chests along a mountain ridge and a weir that is 10 m long and 7.5 m wide over a
drop was needed. It was also proposed that a pool chest should be built and fills up
the deepest pool. It was also suggested to blow up a stretch of 23 m.
It was also proposed to build a 350 m long chest on the left side along the river's
new stream at the outlet. The use of explosives were also suggested for clearing the
entry to Västerdalälven River.
The dam at the lake began to be worn out around 1915, so one considered to recon-
struct the dam. However, in late April 1916 Dalälven River largest flood of the 20th
century occurred (SMHI Knowledge Bank, 2010). At Västerdalälven below the
Horrmundsvalla in Transtrand parish the water level was 139 cm above normal. The
dam at Lake Horrmunden was damaged during the flood and was no longer suitable
for log drive. The dam was probably renovated in late 1916 or early 1917.
The log driving lasted until 1960 when the hydropower plant was built. The last log
drive was documented with camera by Mats Elfqvist from Älvdalen (Mats Elfquists
collection movie No. 2, 1960). He illustrates the floating timber from Lake Hor-
rmund in large collections over the falls and into Västerdalälven River.
6.3.3.2 Water rights and the base of the water rights permits
It is stated that the fish species in Lake Horrmunden were: pike, perch, roach, ide,
bream, bleak, whitefish and restocked vendace, occasional trout, burbot and eel
could be found in Lake Horrmunden. One can suspect that there is a definitive nat-
ural migration barrier for trout in Horrmundsvallen based on the basis of the water
rights. However it is stated that eel migration will be blocked by the dam in Lake
Horrmunden. Different types of stocks are suggested to the Lake Horrmunden to
compensate the fish loss. For a full version of the water rights permits and the bases
of the water rights, see Landsarkivet in Härnösand.
6.3.3.3 Historical pictures
Four historical pictures of the falls have been found (Figure 18, 19, 20, 21). Two of
the photos are taken 1915-07-29 (SMHI, historical gallery, 2015). Figure 18 is from
a postcard probably older than 1915, there are no small trees at the side of the fall
compared to figure 19. The saw building, belonging to Resjövallens village could
also be seen on the picture. The picture was taken in the spring when log driving
activities occurred. Figure 19 shows a weir over the fall. Weirs were built to enhance
the log drive. It is noted that upstream passage of trout and weak swimming fish
species have not likely occurred over the weir. The smaller fall (Figure 20) shows

34
no signs of human impact. The most recent historic picture (Figure 21) is taken in
the summer, the saw building is no longer on the site. One picture was also found
of the dam and the railway track over Horrmundsvallen (Figure 22).
Figure 18: Horrmundsvallafallet, around year 1900. Picture from a postcard. Publisher: Er.
Larsson, Transtrand.

35
Figure 19: Horrmundsvallafallet, the fall is affected by the log driving activities. A weir has been
constructed to make the log driving easier. Stones have been places in the timber constructions.
The picture is taken 1915-07-29 (SMHI, historiskt bildgarlleri, 2015).
Figure 20: Downstream Horrmundsvallafallet, one cannot clearly see that morphology of the
water course has been altered drastically. Picture is taken 1915-07-29 (SMHI, historiskt bildgal-
leri, 2015).

36
Figure 21: Horrmundsvallafallet, 1920-1939 by N-E Eriksson (Riksantikvarieämbetet, 2015)

37
Figure 22: Railway bridge over Horrmundsvallen and the regulating dam by Lake Horrmunden.
A person with dresin, picture taken around 1915 (Flickr, Tekniska Museet, 2015)
6.3.3.4 Interview
Sune Brändholm (chairman of Malung-Sälen fishing association) was interviewed
about the fishing conditions in the catchment area. Since it is impossible for living
people to be able to answer whether the trout have been able to pass the waterfall
earlier than 1870 or not, so the question was not asked if trout has been able to pass
the fall. However he confirmed that there has historically been a good fishing spot
below the fall and that his father used to fish trout there. Furthermore, Mr. Bränd-
holm did not know any place where trout fishing occurred upstream in Lake Hor-
rmunden. In Björnån Strema there is only pike because it is a slow flowing stream.
Furthermore, Brändholm did not know if it is possible that some trout could occur
at the top of the river, but he had never heard anyone catching anything other than
pike in Björnån Stream. He also told that there is much bream in the lake nowadays,
one could get 50 pieces with fishing net that was in overnight and it is not uncom-
mon to get perch over a kg in Lake Horrmunden.

38
6.3.3.5 Curiosities
Name variations have occurred during the historical studies of Horrmundsvallen.
Hormundsvalla, Hormundsvallen, Horrmundsvallsån, Horrmundsvalla and Hor-
rmundsvallen are names that have appeared on the watercourse. Generally, one
should probably expect a variation in name on rivers and lakes in historical studies.
6.3.3.6 Field visit Horrmundsvallen
During the fieldwork six pieces of falls or rapids were found at stretch no. 3 (Figure
3). The first was about 1.5 m high and had been blasted, like the historical docu-
mentation from 1883 was indicating. The second step was slightly smaller than the
first one; this one was also blasted. The third, however, was less affected than the
first two. The fourth seems to be blasted, but significantly less affected than the first
and second rapids. The fifth consisted of a small drop of about 1-1.5 m (Figure 20,
24). The sixth and last was the largest one on the route and is called Horrmunds-
vallafallet (Figures 18, 19, 21, 23). Rapids and falls 1-5 on the route are historically
definite migration barriers to weak swimming fish species and partially passable for
trout. Horrmundsvallafallet is and has most likely been a historically (before the
weir, in 1870) definitive migration barrier to trout (Annex 1). A good entering ap-
proach (pool) does not exist at Horrmundsvallafallet and the trout have no chance
to pass the waterfall. None of the previous migration barriers in the stream had the
same high magnitude and often there were pools to rest in between the passages for
trout. Horrmundsvallafallet is about 8 m high (measured by GPS).

39
Figure 3: Horrmundsvallafallet today. The rod is 1.5 m high and is held somewhat
above the water level to represent more natural water conditions.
Figure 24: Horrmundsvallafall at longer distance. Compare figure 21, note that
the pictures are taken from different places.

40
7 Discussion
7.1 Habitat Mapping
Halldén et al. (2002) admits that it may be difficult to get an idea if an artificial
migration barrier has been a natural migration barrier solely through field visits,
therefore one can choose “uncertain” in the field protocol. In Värmland’s habitat
mapping, only two dams were classified as uncertain with respect to natural migra-
tion barrier. However, in the comment section, some notes were made that one did
not know if the dam might have been a natural migration barrier or not.
There are action proposals to increase fish movement for 30 % of rapids and falls
that are definitive migration barriers for trout from the raw data in Värmlands Hab-
itat mapping. That should mean that the probability is 30 % that dams originally
being a definite natural migration barrier for trout receive action proposals for fish
migration. There are two more plausible explanations for why there is such high
proportion of action proposals on dams that are classified as the natural migration
barriers. One is that the location originally has been a migration barrier for some
fish species but not for strong swimming species, such as trout. The second expla-
nation is that it is an artificial migration barrier and therefore one should fix so that
fish can pass the barrier, regardless the reference condition.
One possible explanation for the large proportion of possible actions related to nat-
ural migration barriers might be due to the migration barrier protocol. First, there is
a check box in which one can propose possible actions at the site which will proba-
bly make the inventor instinctively assess what could be done related to fish migra-
tion. The second possible explanation is that there is no room for assessment of the
historical passability at the current location (for natural migration barriers, dams).
Many of the dams historically may have been definitely natural migration barriers
for some species but not for all, this is not clear in the protocol. It is also important
to highlight that a natural migration barrier does not say anything about the passa-
bility of various fish species. Therefore, the assessment of a natural migration bar-
rier must be linked to the fish species that may possibly have been able to pass it
historically (Figure 25). The suggested change shown in figure 25 will reflect this
issue. This will likely tell how “many” dams that originally have been definitive
natural migration barriers to trout. Actions associated with increased fish migration
should be avoided. Furthermore, one will get an idea of how many fish species that
may be affected by the migration barrier. These amendments to the protocol will
probably cause proposed actions to have a better ecological relevance to the ecosys-
tem, i.e. no proposed actions related to fish migration should occur at total natural

41
migration barriers. Habitat mappings can capture parts of the natural migration bar-
riers regarding the reference conditions at dams but probably not all, which also was
suggested by Halldén et al. (2002).
Figure 15: Suggestion for how the migration barrier protocol should be changed to reflect the
historical passability for different fish species. The old protocol was used in the inventory of
migration barriers in Värmland. Passability of barriers today (X) should be combined with ref-
erence connectivity (RC) or unsure about reference connectivity (U).
A total of 43 % of the dams had no function today (11 % of the total amount migra-
tion barriers). Many of the dams that have no use today come from the log driving
era (County Administrative Board of Värmland, 2013). It must be seen as a surpris-
ingly high proportion of dams which have no or limited purpose today. Extrapolat-
ing the results from Värmlands habitat mapping throughout Sweden means that
about 4000 dams in Sweden have no use!
All but four culverts were classified as artificial migration barriers. It is a reasonable
assumption that the majority of culverts in Sweden have not been natural migration
barriers. In the category "blasted rock" 72 % were classified as natural migration
barriers then one can conclude that many of these migration barriers historically
probably belonged to the category rapids / falls and thus have been natural migration
barriers.
Furthermore, as expected, there were a low proportion of dams classified as natural
migration barriers of dams with a total drop of less than 1 m. There were 164 dams
that had a total drop equal to or lower than 1 m, and only 4 pieces of dams were
classified as natural migration barriers. Then it is reasonable that one should not

42
expect to find many natural migration barriers of dams with a total drop height of 1
m or less. Furthermore, it is expected that dams which have a higher total height
should have a higher share of natural migration barriers.
About 10 % of the hydropower dams were classified as natural migration barriers.
This can be seen as a first estimate how many hydropower dams that may have been
built by natural migration barriers in Sweden. As mentioned earlier, natural migra-
tion barriers do not say anything about which fish species that have been able to
pass the rapid or fall. Presumably this is because some hydropower dams are built
in places where a high head is utilized, probably 5 % to 10 % of hydropower dams
have been built by definitive natural migration barriers for trout in Sweden. How-
ever, the share of hydropower dams that have been built at definite natural migration
barriers to roach should be significantly higher than for trout.
7.2 Toponymy of water stretches
The slope of the linear function was steeper for guiding name for cliffs and falls than
for currents and rapids. That alone indicates that the guiding names say something
about passability. It is more difficult to pass water flowing stretches of the guiding
names ending by cliffs or falls. However, there is nothing to be generalized, because
Sweden's most famous waterfall ends by “rapid”, Tännforsen. Rapid names are
probably a more universal, appearing on many different types of water flowing
stretches. However, if a former waterfall has been called -cliff, one can strongly
suspect that passability for many fish species have been limited. If the waterfall have
one of the following descriptive names; big-, hell- or steep, one should also suspect
that passability of various fish species have been limted. Laxhoppet (Salmon jump)
in Umeälven River is an example of a waterfall where the name describes that
salmon jumps here (passed). Identification of water flowing stretches says more
than what many think when assessing passability for various fish species.
7.3 Case study Horrmundsvalla
7.3.1 Names in the catchment area
By examining different names in the catchment area one can get an idea of the dif-
ferent fish species and fishing practices that occurred historically. Names that trace
to highly migratory fish species such as salmon or eel, then one can assume that any
of these species has occurred in the area. That neither eel nor trout related name was
not found in the catchment area cannot confirm that Horrmundsvallafallet has been
a natural migration for these species. Perch, roach, ide, bream and pike are all spe-
cies that are not particularly strong-swimming species and then then this would in-

43
dicate that these species have been able to colonize the catchment from the Väster-
dalälven River. Because trout populations can appear as stationary in a river
throughout its life cycle, trout related names become as an indication of historical
occurrences (Spens, 2007). However, if a water surface had been called “spawning
current” (lekströmmen) or other that can be directly related to spawning of salmon-
ids, this could indicate that the fish could pass a certain location. All names, derived
from eel can most probably demonstrate that it has been passable at the current lo-
cation for eel (with reservation to Trollhättan Canal), since eel migrates from the
Sargasso Sea and up in Swedish waters for growth.
As a method to examine the historic passability of different fish species between
two sites, this should be seen as a low priority choice of methods for studying natural
migration barriers. In this case, one could see the lack of trout related names in the
catchment area could confirm that Horrmundsvallafallet has been a natural migra-
tion barrier for trout. But the chance of committing a false-positive result is high,
that trout exists in the catchment area though no name proves it. However, fish re-
lated names say something about the habitat type in an area (Spens, 2007). In this
case; roach, perch, pike, ide and bream were found. That fish related names could
indicate that they have been able to colonize the habitat themselves, can be rejected,
since a place may have adopted a name of a restocking event in the area.
Possibly in this survey, it is wrong to look at the names that can be related to various
fish species. Perhaps, upstream of Horrmundsvallafallet, was a more or less empty
fish basin. Then maybe No Fish (Fisklösen) and No fish bay (Fisklösvik) had been
better names to describe what fish species did exist in the catchment area. To con-
firm that the catchment area has been more or less fish empty in the past, paleolim-
nology methods might answer this types of questions better.
7.3.2 DNA of brown trout
The result of the difference in DNA between the populations in Horrmundsvallen
coincide with when the hydropower plant was built in 1960. On the one hand it
could be interpreted as less water in Horrmundsvallen made it impossible for trout
downstream to pass the fall. On the other hand, given that there is probably no trout
habitat upstream of Lake Horrmunden it is reasonable to believe that the two popu-
lations formed the same population before 1960; the same conclusion as Dannewitz
et al. (2012) did for Lake Mjörn. This would lead to the (probable) erroneous con-
clusion that trout passed upstream the weir, built around 1870. That is however
probably an erroneous conclusion. However, this is out of the question, because
there is a laminar water flow and the water velocity is too high.
The difference in GST and the decrease in He coincides with the hydropower plant
construction but is most likely due to fish stocking upstream from both populations.

44
At least 26,000 1+ brown trout (unknown origin) have been stocked into Lake Hor-
rmunden prior to 1960 (the construction of the hydropower plant prevented down-
stream dispersals of restocked trout). The earliest dams that were located in Hor-
rmundsvallen were for log driving and regulation of the water to hydropower plants
in Dalälven River. Water has gone from the lake through spillway to Horrmunds-
vallen and made it possible for restocked trout to find suitable habitat in Horrmunds-
vallen. Lake Horrmunden and the watercourses upstream is probably a very bad
habitat area for trout. Flowing water is a prerequisite for a good habitat and spawn-
ing area for trout. Björnån Stream (upstream of Lake Horrmunden) is a slow flowing
water with a vertical height of 70 m over a distance of about 45 km (average slope
of 0.0015 %). In addition, there are pike established in the river and there is probably
no trout population in the catchment area (except in Horrmundsvallen). The re-
stocked material could only colonize downstream to Horrmundsvallen.
One can also consider that the stocked trout did not establish in Horrmundsvallen.
But then the trout population upstream Horrmundsvallafallet needed at least to have
an effective population size between 270 and 320 to correspond to the reduction in
He since 1870. The most advantageous conditions are still lacking 70 Ne, a trout
density reduction of 5 % per 100 m and an Ne:N ratio of 20 %. But it is unreasonable
that the stocked material did not have an impact, as there is a surprisingly high He
in both populations compared with other trout populations in Sweden (Östergren,
2015).
One expects differences between AR, He, and FST (indirect GST) among populations
that are isolated by waterfalls and dams (Figure 17,18,19) (Deiner et al. 2007). The
factors that control how big the difference is; Ne upstream and downstream, time
(how long they have been isolated), and if they have contact with other populations
either upstream or downstream. A much larger difference was expected in AR and
He between the populations to be able to say for "sure" that both populations have
been isolated for a long time. Usually the case for natural migration barriers to Salm-
onidae is that downstream population have higher He and AR than upstream popula-
tion. If not, then one should investigate what is the cause; habitat size, Ne, contact
with other populations, restocks or isolations?
The dendrogram (Figure 15) indicates that stocked material in Lake Horrmunden
probably is from Dalälven River catchment area. Possibly it consisted of the down-
stream population because it was easy to catch trout there. But it is not plausible that
there are "genuine" Horrmundsvalla trout in the system, with such high He in both
populations. The stocked material did probably not consist of any of the already
"known" restocked materials such as Lake Siljan trout.
The assumption that the downstream population has no loss of genetic material (He),
seems to be reasonable when one trout from the lower population could not be

45
placed into either the downstream nor upstream populations. This suggests that the
downstream population have contact with trout from the Västerdalälven River. That
no upstream migration of trout has happened since 1870 is also a reasonable as-
sumption. The other two assumptions are probably a bit more uncertain. A genera-
tion time of 4.6 years is based on an estimate of Lake Lygnern and Lake Mjörn
(Dellefors & Dannewitz, 2007; Dannewitz et al. 2012). One can assume that gener-
ation times are longer in Dalarna, because of the warmer climate in Lygnern and
Mjörn. The assumption that trout populations had the same He at isolation time is
probably an erroneous assumption. Since isolation of populations by natural migra-
tion barriers probably occurs in stages (i.e. does not occur from one year to another).
It has been shown in this study that one must have very good track of stocking his-
tory and historical conditions, in order to be able to assess if a hydropower plant
have been built by a definitive natural migration barrier or not. It is also incredibly
important to know the effective population size of the system to be able to say any-
thing about how long the population has been isolated. The assumptions for Ne are
based on the electrofishing and is regarded as the biggest uncertainty in this study.
With a higher number of electrofishing locals upstream, it would be possible to a
better estimate of the Ne-value of the population. Alternatively, one could take more
DNA samples from trout upstream. Habitat quantity and quality is what control how
large Ne can be in a system. More genetic research on trout populations that is iso-
lated by natural migration barriers and habitat size that controls Ne in the populations
is needed. Stochastic gene flow downstream of natural migration barriers is some-
thing that is unexplored and is a factor for the downstream population development.
7.3.3 Traditional methods
It is important to combine relevant historical information with current information
about the location, and then make an assessment about which fish species that
passed the site. It isnot possible to assess historical passability based on a historical
picture or single historical sources of the passability of different fish species, alone.
Historical pictures can be very difficult to interpret (heights, lengths, water velocity,
etc.) and they do not say anything about the pool conditions.
There is nowhere explicitly stated that Horrmundsvallafallet is a definitive natural
migration barrier to trout, but there are several historical arguments for this:
First, there was a discussion between stakeholders prior the construction of
the hydropower plant that there was two populations of trout in Horrmunds-
vallen one over the weir and one in contact with the Västerdalälven River.
Trout population upstream of Horrmundsvallafallet is virtually isolated
from the weir with steep cliffs and the dam at Lake Horrmunden.
46
Second, experts (fiskeriintendenten and the freshwater laboratory) argues
that the eel migration to the lake will be impossible when the hydropower
plant is in operation. To discuss upstream migration of eel and not trout
means that they probably reflected on that the Horrmundsvallafallet was a
definite migration barrier to trout.
Third argument, historical catch was about 150 kg trout per year in the lower
part of Horrmundsvallen with rod. Which is also confirmed by Sune Bränd-
holm. During the field visit this was considered reasonable, when there were
many pools where trout probably rested between passing falls and rapids
(assuming that trout could not pass a certain place).
From the log drive movie one get a very good understanding of how high Hor-
rmundsvallafallet is and the smaller falls and rapids in Horrmundsvallen. The falls
in Horrmundsvallen must have been difficult to pass for trout based on the film. The
film was a better way to get an idea if trout has been able to pass Horrmunds-
vallafallet, or not, than the historical pictures in this case study, according to me.
There are some arguments that could be interpreted as that Horrmundsvallafallet has
been passable for trout. There was trout stocking in Lake Horrmunden, therefore,
Västerdalälven River trout must have been able to pass the fall.
There was historical trout catches in Lake Horrmunden, therefore, Västerdalälven
River trout must be able to pass the fall (assuming that there is probably no trout
habitat upstream in the catchment area).
What speaks against the two above arguments is that stocked trout in the lake was
something that was requested because of the increased recreational fishing and pike
compensation was no longer necessary because the residents in the area were no
longer as dependent on fishing for consumption.
Catch data on trout was from 1963 to 1968 at which time the hydropower plant had
been operating for 3 years (thus making it impossible for upstream migration of
trout because of the dam). Catch data on trout coincides well with the stocking data
from the period.
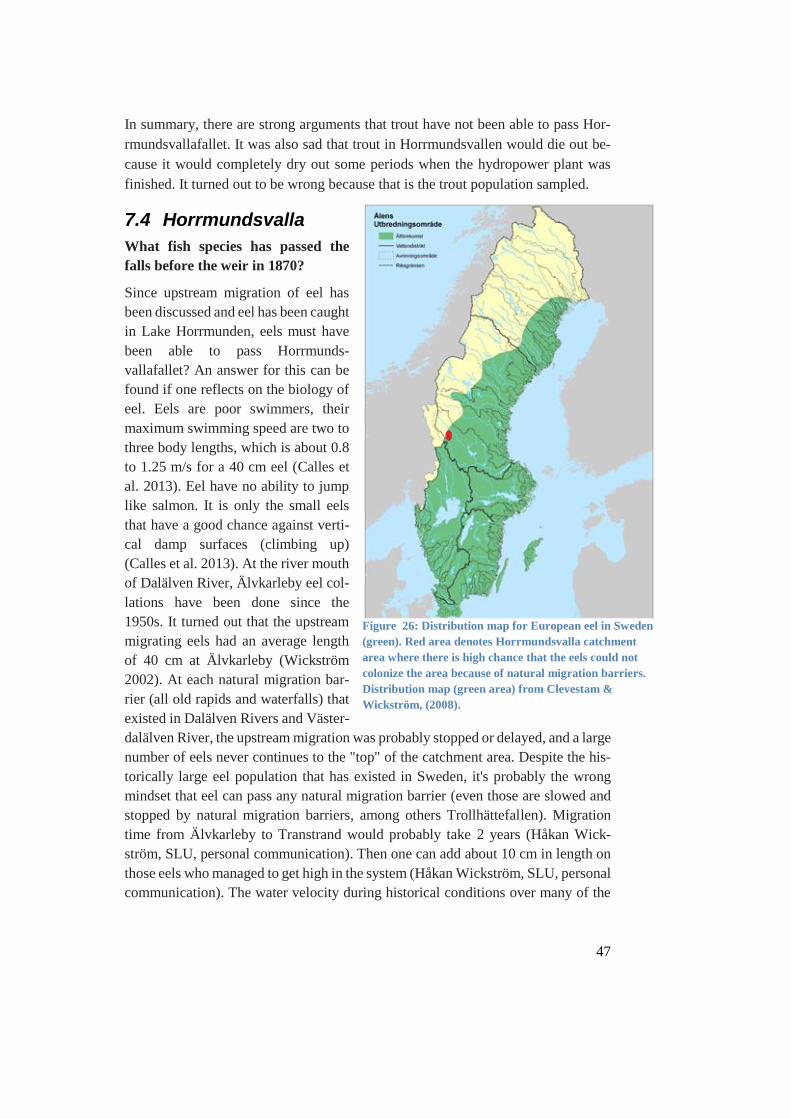
47
In summary, there are strong arguments that trout have not been able to pass Hor-
rmundsvallafallet. It was also sad that trout in Horrmundsvallen would die out be-
cause it would completely dry out some periods when the hydropower plant was
finished. It turned out to be wrong because that is the trout population sampled.
7.4 Horrmundsvalla
What fish species has passed the
falls before the weir in 1870?
Since upstream migration of eel has
been discussed and eel has been caught
in Lake Horrmunden, eels must have
been able to pass Horrmunds-
vallafallet? An answer for this can be
found if one reflects on the biology of
eel. Eels are poor swimmers, their
maximum swimming speed are two to
three body lengths, which is about 0.8
to 1.25 m/s for a 40 cm eel (Calles et
al. 2013). Eel have no ability to jump
like salmon. It is only the small eels
that have a good chance against verti-
cal damp surfaces (climbing up)
(Calles et al. 2013). At the river mouth
of Dalälven River, Älvkarleby eel col-
lations have been done since the
1950s. It turned out that the upstream
migrating eels had an average length
of 40 cm at Älvkarleby (Wickström
2002). At each natural migration bar-
rier (all old rapids and waterfalls) that
existed in Dalälven Rivers and Väster-
dalälven River, the upstream migration was probably stopped or delayed, and a large
number of eels never continues to the "top" of the catchment area. Despite the his-
torically large eel population that has existed in Sweden, it's probably the wrong
mindset that eel can pass any natural migration barrier (even those are slowed and
stopped by natural migration barriers, among others Trollhättefallen). Migration
time from Älvkarleby to Transtrand would probably take 2 years (Håkan Wick-
ström, SLU, personal communication). Then one can add about 10 cm in length on
those eels who managed to get high in the system (Håkan Wickström, SLU, personal
communication). The water velocity during historical conditions over many of the
Figure 26: Distribution map for European eel in Sweden
(green). Red area denotes Horrmundsvalla catchment
area where there is high chance that the eels could not
colonize the area because of natural migration barriers.
Distribution map (green area) from Clevestam &
Wickström, (2008).

48
smaller falls in stretch three will probably be greater than the critical limit of what
eel can swim. My conclusion then is that Horrmundsvallafallet / falls is a definitive
natural migration barrier for eel (Figure 26). One cannot be absolutely sure that eels
that were caught between 1910 and 1940 in Lake Horrmunden have not been able
to get up to the lake by their own. Because no stocking history of eel has been found
for the river catchment (stocking history have been found for 1952 and 1953). If
eels could pass Horrmundsvallafallet they must have passed the weir, something
Håkan Wickström sees unlikely. If stocking of eels can be confirmed between 1910
and 1940, then one can with higher confidence confirm that eels have not been able
to pass the falls in Horrmundsvallen. Domnarvet was the first dam that dammed up
Dalälven River (1870), and thereby blocking all eel migration upstream. It is prior
to Domnarvsforsen being exploited which is considered as a reference condition for
eels in this study.
With the adoption and knowledge they had at the time they built Horrmundsvalla
hydropower plant and suggested compensation, one can both say that trout most
probably was not able to pass Horrmundsvallafallet and eel migration most likely
did not occur in Horrmundsvallen.
Have bream been able to colonize Lake Horrmunden naturally?
Bream is the fish species which completely dominates in Lake Horrmunden today.
Bream is one of our most weak-swimming fish species in Sweden (Calles et al.
2013). In a review of historical fish data from 1860 to 1911 it was found that bream
mainly existed in eastern part and under the highest shoreline in Sweden (Schreiber
et al. 2003).The maximum altitude bream found was at 347 m above sea level
(Schreiber et al. 2003). In a comparable survey made in 1996, breams were found
at 488 m above sea level (more lakes in 1996) (Schreiber et al. 2003). In the histor-
ical survey, a majority of bream lakes were encountered below the highest coastline
and in southern Sweden, 98.2% of bream lakes. The remaining bream lakes (1.8 %,
10 pieces) were encountered in lakes above the highest coastline and in the northern
region. That said, it is noted that the bream had a limited dispersal opportunity in
the North and over highest shoreline. Lake Horrmunden is located at about 440 m
above sea level and in the northern region. Horrmundsvalla have several falls that
today are impossible for weak swimming fish species to pass. The critical stretch 3
(Figure 3) is approximately 500 m long and has a total drop of about 50 m, giving
an average slope of 10 %. The most favourable condition for colonization for bream
with respect to the slope of the watercourse would probably be just after the ice cap
retreated. The bream is a fish species that prefer warmer water (Schreiber et al.
2003). Thus colonization was not likely under the most favorable slope conditions.
Thus, bream could not have colonized Lake Horrmunden through Horrmundsvallen
and thereby should not be in the lake fauna according to the reference condition.

49
7.5 Proposed measures at Horrmundsvalla
That Horrmundsvallen would have poor ecological status is correct if it is the refer-
ence condition one is comparing with. It is impossible to recreate the reference con-
dition without removing the dam and restore from the log drive era. But that is not
the idea with the status classification of water bodies in Sweden. It is probably more
important to call the river what it is, a heavily modified water body.
Is connectivity needed (i.e. fish ladders or bypass channels) between Västerdalälven
River and Lake Horrmunden? No, it is a natural conclusion that it is not the solution
to achieve good ecological status or potential in the watercourse. It would create
dispersal opportunities that are unnatural for the catchment area and it can be seen
as something negative from an ecological perspective. Trout is isolated between the
dam and Horrmundsvallafallet. But since most probably no other trout habitat or
trout populations upstream the dam exists, one can question if trout has to migrate
upstream or if it will migrate/disperse upstream. If the trout would be able to migrate
upstream, it can be an ecological trap, because there are no suitable habitats up-
stream and the trout might not return to the watercourse (predation or stochastic
event).
The most important thing to try to achieve from an ecological perspective in Hor-
rmundsvalla is to not spill high flows in the "dry furrow". The system in Horrmunds-
vallen today is "adapted" to the local runoff downstream the dam. High flows
flushes away epiphytes from the system and probably some 0+ trout falls over the
fall. Also there is a high risk for stranding of fish when the spillways are closed
(hence the low number of trout during the electrofishing compared to 2006). Today,
the average water flow in Horrmundsvallen is 0,420 m3/s at the mouth of the river
to Västerdalälven River.
Minimum discharge?
No water spillage has occurred in the stream since at least 2003 to 2006-11-26 (older
spillage data is not available), i.e. trout which was electrofished in Horrmundsvallen
2006-08-29 had made it with local runoff. If the electrofishing made in 2006-08-29
will be the reference condition for zero spillage in Horrmundsvallen, there should
be about 30 trouts / 100 m2 corresponding to reference condition (at the same elec-
trofishing locale). To measure how much more trout Horrmundsvallen will get with
eg 5 % (0.2 m3/s) minimum discharge one would first have to wait so that the trout
in Horrmundsvallen can recover to levels that are not affected by the spillage in the
mainstream i.e. hopefully levels comparable to 2006 (deterministic population de-
velopment). Then consider minimum discharge e.g. 5% in Horrmundsvallen. To
measure the impact of minimum discharge, a monitoring program should be set up
(suggestive electrofishing). If minimum discharge is applied at once in Horrmunds-

50
vallen, one can impossibly know what effects it has on the system because it is af-
fected by spillage. One cannot tell if it is habitat quality or quantity of water that is
limiting the trout population in Horrmundsvallen.
There is water throughout the “dry stream” from the dam at the lake to Västerdaläl-
ven River due to a stream that enters Horrmundsvallen just downstream of the dam.
Just because it is a “dry stream” does not mean that it's just dry and lacks biological
values (Renöfält et al. 2015). The biological values at Horrmundsvallen can be seen
as trout upstream and downstream of Horrmundsvallafallet. Grayling, minnow and
bullhead were also found downstream the fall. The largest biological values in Hor-
rmundsvallen is probably not directly related to the hydropower or status classifica-
tion of the watercourse. On stretch three, with its many falls and rapids, there was
an interesting cryptogam fauna, consisting primarily of mosses and liverworts on
moist and shadow rock faces (an interesting cryptogam habitat in Sweden). Then
one should ask if more water in Horrmundsvallen could contribute to a better local
climate (humidity) for the cryptograms or not.
Fish Compensation to ecological compensation
Based on the information about the watershed and stocked trout in Lake Hor-
rmunden, suggestively that the stocking of trout in the lake should end. Freshwater
laboratory's earlier investigation, that the stocking of trout in the lake is not effective
is probably right. At a working meeting between Fortum Generation and the regu-
lator (Dalarna County Administrative Board with support from the fishing investi-
gation group (Fiskeutredningsgruppen), County Administrative Board of Väster-
norrland) in 2014 on how some fishing related operating conditions are being ap-
plied, it was proposed and it was decided that the fishing compensation in the form
of release of trout in the lake should be replaced by another fishing management
measure within the same cost bracket. This is a more efficient application since re-
sources can be directed to measures where they are more ecologically beneficial.
Continued trout restocking lacks ecological importance of the current water system.
Regarding stocking of trout in Västerdalälven River, suggestively that even this can
be exchanged for another equivalent fishery conservation measure in the Väster-
dalälven River system.
8 Applications
Here is an "overall methodology" one can use to examine what fish species that have
been able to pass a migration barrier. Furthermore, it is now know that one does not
need to examine all the dams in more detail. Dams that have a total height drop less
than 1 m is most likely not a natural migration barrier. It is also know that a majority

51
of culverts most likely have reduced connectivity. The proposed changes in the hab-
itat mapping template should be used to get a more accurate picture of the impact
of migration barriers on fish fauna. Template used today is not satisfying to describe
the impacts of migration barrier on fish fauna.
The information of historic passability is very important for priorities of connectiv-
ity restauration project in rivers!
9 Own reflections
What is the concept of connectivity? "The ability to disperse and free passages for
animals, plants, sediments and organic material in upstream and downstream direc-
tion, and from the river to the surrounding land areas, in relation to the reference
conditions" (HaV, 2013). Is the "disperse and free passages" reference conditions
when there are so many natural migration barriers, which Värmland habitat mapping
indicates? There were 57 of 478 (12 %) streams that had passable migration barriers
(no migration barriers, both artificial and natural) for trout. What is a reference con-
dition? Perhaps it is more common that natural migration barriers exist in our wa-
terways that prevent disperse of fresh water fauna? Clearing for log drive has been
widespread throughout Sweden. The Värmland habitat mapping indicates that ex-
tensive blastings have occurred in the water courses, 7 % of the migration barriers.
That 72 % of those were classified as natural migration barriers, i.e. former rapids
and falls before the impact (though “blasted rock” have not been investigated more
comprehensively in this study). It may also be that many of the "blasted rock" bar-
riers have worsened the dispersal opportunities for certain fish species because wa-
ter velocity increases by channeling. It was identified that “blasted rock” in Hor-
rmundsvallen made it easier to pass a rapids chest. A relevant scientific question to
be answered is how many of the waterways in Värmland County (suggested, be-
cause they have good data from there), have free dispersal of trout and roach respec-
tively as a reference condition?
Natural migration barriers will determine how freshwater fauna will develop with
time, because the fish fauna will be limited by natural migration barriers and all
natural migration barriers have different conditions for various fish species to dis-
perse or migrate. Then the local freshwater fauna will develop to a "unique" com-
position of fish species. Then a natural migration barrier is a key element in the
aquatic environment that should not be built off by a bypass channel (i.e. wrong
custom bypass channel including more fish species than the reference condition).
Lack of connectivity is something that is often stated as an argument for the con-
struction of a bypass channels or fish ladder. But there is no parameter in the status
classification that takes into account if a lake has more fish species in the system
than the reference condition. A new concept in water management is needed:

52
Over connectivity - disperse and passages for fish fauna (because fish fauna are the
main parameter in the status classification system) at a level that exceeds the refer-
ence condition (my definition).
Reduced connectivity - disperse and passages for fish fauna (because fish fauna
are the main parameter in the status classification system) at a level which is below
the reference condition (my definition).
Why introduce new concepts? The reason is to reflect the reference condition in the
system. Shall bypass channels or fish ladders for all occurring fish species really be
done?
What will the ecological consequences be if one choose to remove an old log drive
dam when many of the natural migration barriers in the stream already have been
blasted away (as many of the rapids in Horrmundsvallen)? There is probably no one
today who can tell if over connectivity in our water could be a large or small phe-
nomenon. However, it is know that there are approximately 11 000 dams in Sweden
(affecting connectivity in various ways, but fish fauna passage is not always the best
or only solution).
The issue of over connectivity may be investigated better if the new template for
fish passages is applied in the habitat mapping method. There are many places where
natural migration barriers have been removed, where the result has been over con-
nectivity. It may have been unconsciously e.g. Trollhättan Canal. Jockfall in Ka-
lixälven is a good example where it was made on purpose with a fish ladder over
the fall.
10 Conclusions
Current methodology (habitat mapping) is not sufficiently satisfying to capture nat-
ural migration barriers at artificial migration barriers. Proposed template improve-
ments should be implemented to increase assessing quality by artificial and natural
migration barriers. If additional investigations of migration barriers are needed, one
can follow the methodology presented here for Horrmundsvallafallet. This would
likely give an estimate closer to the truth regarding the historical passability for dif-
ferent fish species. One will never know for sure which historical information that
can be useful for assessing the historical passability at natural migration barriers.
Yet historical information is necessary for a reliable assessment of historical passa-
bility at artificial migration barriers. Scientific methods such as DNA analysis on
fish can provide some information about the migration barrier but it is appropriate
to always investigate historical stocking of fish as well.

53
When there are historical total natural migration barriers at artificial migration bar-
riers, then one does not need to build bypass channels or fish ladders. How many
historically natural migration barriers there are at artificial migration barriers, is dif-
ficult to say. But more than 5 % could have been built by definitive historical natural
migration barriers to trout by hydropower plants in Sweden (over 100 pieces). Fi-
nally, my conclusion is that Horrmundsvallafallet was historically (before 1870) a
total natural migration barrier to all fish species, even at natural water flows.
11 Suggestions for further studies
I. Investigate the reference connectivity for streams in Värmland County
for trout and roach separately. How many streams in County of Värm-
land have free dispersal for roach and trout as the reference conditions?
How many places have over connectivity (improved passability for
different fish species to spread upstream a natural migration barrier)?
II. A brief prediction of different distributions of fish species in Sweden
based on natural migration barriers. I have not seen any study from
Sweden that takes natural migration barriers into account when as-
sessing the historical distributions of various fish species. Often only
historical restocking has been taken into account where a fish species
has been found in a basin.
III. Detailed study of passability for various natural migration barriers of
various salmonids. How many manage to pass different kinds of natural
migration barriers? One could combine passability (radio tags) with ge-
netic methods. It is also very important to describe the barrier in detail
so the work can be implemented to historical assessments.
IV. In the historical studies of Horrmundsvalla, detailed maps of the ripar-
ian vegetation of Lake Horrmunden were found. Maps are available
both before and after the construction of the hydropower plant. How
does the riparian vegetation appear today around Lake Horrmunden?
The same thing applies to fishing conditions, information is available
on the fishing conditions before and after the hydropower plant. How
does the fish fauna appear today in Lake Horrmunden 56 years after the
hydropower plant was built?

54
12 Acknowledgments
First I want to thank Johan Östergren (SLU), which has been an incredible help in
my work with natural migration barriers, my knowledge of trout genetics feels "per-
fect" after all discussions about structure, GENCLASS etc. Marco Blixt (Fortum)
and Dag Cederborg (SWECO) who have been my supervisors from the business
world and contributed with knowledge in various fields of the work. Employees at
Fortum, especially Hans Bjerhag who contributed with good knowledge during the
work. Employees of freshwater laboratory: Stefan Palm, Håkan Wickström and oth-
ers who have contributed with valuable discussions during the work. Johnny
Norrgård for help with electrofishing and valuable discussions. Jenny Monsén
(County Administrative Board of Värmland) for providing images and raw data
from the habitat mapping.
Fortum and SWECO have funded the project.
13 Reference
Abrahamsson, I. (1995). Metodik för inventering av forsar och fall.
Länsstyrelsen i Älvsborgs län, Meddelande1995:11.
Allendorf, F. W., Luikart, G., & Aitken, S. N. (2013). Conservation and the
Genetics of populations (2nd uppl.). West Sussex: Wiley-Blackwell.
Alm, G. (1920). Resultaten av fisk inplanteringar i Sverige. Medd. Kungl.
Lantbruksstyr. 226.
Andersson, M. (2005). Har laxen i Säveån passerat Hedefors? Utredning om
huruvida fallet vid Hedefors har utgjort ett naturligt definitivt
vandringshinder. Länsstyrelsen Västra Götalands Län.
Björklund , S., & Pettersson, J.-E. T. (1982). Lima och Transtrand: ur två
socknars historia, myrjärn och smide. Malung.
Brundin, L. (1939). Resultaten av under perioden 1917-35 gjorda
fiskinplanteringar i svenska sjöar.Kungl. Lantbruksstyr., Medd.
Statens undersöknings- och försöksanst. för sötvattensfisket 16, 41s.
Calles, O., Degerman, E., Wickström, H., Christiansson, J., Gustafsson, S.,
& Näslund, I. (2013). Anordningar för upp- och nedströmspassage
av fisk vid vattenanläggningar. Göteborg: Havs och vatten
myndigheten.
Charlier, J., Palmé, A., Laikre, L., Andersson, J., & Ryman, N. (2011).
Census (NC) and genetically effective (Ne) population size in a lake-
55
resident population of brown trout Salmo trutta. Journal of fish
biology, 2074-2082.
Clevestam, P., & Wickström, H. (2008). RÄDDA ÅLEN OCH ÅLFISKET! -
ETT NATIONELLT BIDRAG TILL EN EUROPEISK
FÖRVALTNINGSPLAN. Bilaga. Stockholm: Fiskeriverkets
Sötvattenslaboratorium.
Dannewitz , J., Palm , S., Degerman, E., Olsson, J., Prestegard, T., &
Östergren, J. (2012). Genetisk kartläggning av öring i Mjörn.
Stockholm: Sveriges lantbruksuniversitet.
Degerman, E., Hammar, J., Nyberg, P., & Svärdson, G. (2001). Human
impact on the fish diversity in the four largest lakes of Sweden.
AMBIO, 522-528.
Deiner, K., Garza, J. C., Coey, R., & Girman, D. J. (2007). Population
structure and genetic diversity of trout (Oncorhynchus mykiss) above
and below natural and man-made barriers in the Russian River,
California. Conserv Genet, 437-454.
Dellefors, C., & Dannewitz, J. (2007). Insjööringen i sjön Lygnern –
härkomst, förekomst och återkomst. Biologisk återställning i kalkade
vatten. Länsstyrelsen Västra Götalands Län.
Felsenstein, J. (2004). PHYLIP (phylogeny Inference Package) version 3.6.
Department of Genome Sciences, University of Washington, Seattle.
Flickr, Tekniska Museet. (2015). Available at
https://www.flickr.com/photos/tekniskamuseet/12100706454/in/pho
tolist-jrihrU
Goudet, J. (1995). FSTAT (Version 1.2): a computer program to calculate F-
statistics. Journal of Heredity 86, 485-486.
Halldén, A., Liliegren, Y., & Lagerkvist, G. (2002). Biotopkartering -
vattendrag. Metodik för kartering av biotoper i och i anslutning till
vattendrag. Jönköping: Länsstyrelsen Jönköpings län.
Hansen, M. M., Nielsen, E. E., & Mensberg, K.-L. D. (1997). The problem
of sampling families rather than populations: Relatedness among
individuals in samples of juvenile brown trout Salmo trutta L.
Molecular Ecology, 6, 469-474.
HaV. (2013). Bedömningsgrunder för hydromorfologiska kvalitetsfaktorer i
sjöar, vattendrag, kustvatten och vatten i övergångszon . Havs och
vattenmyndigheten.

56
Hendry, A. P., Wenburg, J. K., Bentzen, P., Volk, E. C., & Quinn, T. P.
(2000). Rapid Evolution of Reproductive Isolation in the Wild:
Evidence from Introduced Salmon. Science 290, 516-518.
Kling, J. (2015). Miljöåtgärder i vattenkraftverk. Sammanställning av
åtgärder för att nå god ekologisk status och god ekologisk potential i
vattenförekomster med vattenkraft. Göteborg: Havs- och
vattenmyndigheten.
Landsarkivet i Härnösand . (1873–1935 ). Kungliga Domänstyrelsen.
Skogsbyrå I-III samt Skogstekniska byråns arkiv. .
SE/HLA/1350002/F/F 30/F 30 A/17.
Landsarkivet i Härnösand . (1883-1944). Kungliga Domänstyrelsen.
Skogsbyrå I-III samt Skogstekniska byråns arkiv.
SE/HLA/1350002/F/F 30/F 30 A/16.
Landsarkivet i Härnösand . (1962-1972). Siljan: Horrmundsjön, trängslet.
SE/HLA/1210006/H 1/26.
Landsarkivet i Härnösand. (1943-1956). Horrmundsvalla KVK. Ansökningar
m.m. SE/HLA/1210006/F 2 C/120.
Länsstyrelsen Värmland. (2013). Biotopkartering av vattendrag i Värmlands
län. En sammanfattning av data för vattenbiotoper och
vandringshinder 2005-2010. Karlstad: Länsstyrelsen Värmland.
Mats Elfquists samling film nr 2 (1960). [Film]. Svensk mediedatabas.
Meixler, M. S., Bain, M. B., & Walter, T. M. (2009). Predicting barrier
passage and habitat suitability for migratory fish species. Ecological
Modelling, 2782-2791.
Naturvårdsverket. (2007). Status, potential och kvalitetskrav för sjöar,
vattendrag, kustvatten och vatten i övergångszon. Stockholm.
Pakkasmaa, S., & Petersson, E. (2005). Fisk i fel vatten. Ekologiska
konsekvenser av utsättningar av fisk. Stockholm: Fiskeriverket,
Sötvattenslaboratoriet.
Palm, S., Laikre, L., Jorde, P.-E., & Ryman, N. (2003). Effective population
size and temporal genetic change in stream resident brown trout
(Salmo trutta, L.). Conservation Genetics 4, 249-264.
Pamp, B. (1988). Ortnamn i Sverige. Lund: Studentlitteratur AB.
Piry, S., Alapetite, A., Cornuet, J.-M., Paetkau, D., Baudouin, L., & Estoup,
A. (2004). GENECLASS2: A Software for Genetic Assignment and
First-Generation Migrant Detection. Journal of Heredity, 95(6), 536-
539.

57
Power, P. D., & Orsborn, J. F. (1985). Analysis of Barriers to upstream fish
migration. An investigation of the physical and biological conditions
affecting fish passage success at culverts and waterfalls. Pullman:
Bonneville Power Administration.
Pritchard, J., Stephens, M., & Donnelly, P. (2000). Inference of population
structure using multilocus genotype data. Genetics 155, 945-959.
Pryce-Tannatt T. E. (1938). Fish Passes. In Connection with obstructions in
salmin rivers. Edward Arnold & Co. London.
Rahel, F. J. (2007). Biogeographic barriers, connectivity and homogenization
of freshwater faunas: it's a small world after all. Frehwater biology,
696-710.
Renöfält, B., Jansson, R., & Ahonen, J. (2015). Ekologisk återställning i helt
eller delvis torrlagda fåror i anslutning till vattenkraft. Havs- och
vattenmyndigheten.
Riksantikvarieämbetet. (2015). Horrmundsvalla. Available at
http://kmb.raa.se/cocoon/bild/show-
image.html?id=16001000323024 den 26 03 2016
Riksantikvarieämbetet, Fornsök. (den 29 09 2015). Available at
Riksantikvarieämbetet:
http://www.fmis.raa.se/cocoon/fornsok/search.html?tab=3&page=1
&objektid=10239204720001 den 29 09 2015
Riksarkivet. (1943). Svea hovrätt, renovationer från Vattendomstolarna.
Arninge: SE/RA/420422/06 F 1 C:253.
Schindler, D. E., Knapp, R. A., & Leavitt, P. R. (2001). Alteration of nutrient
cycles and algal production resulting from fi sh introduction into
mountain lakes. Ecosystems 4, 308-321.
Schreiber, H., Filipsson, O., & Appelberg, M. (2003). Fisk och fiske i svenska
insjöar 1860-1911. Göteborg: Finfo.
Schrøder, K. M. (2016). Migration of sea trout Salmo tritta in relation to
environmental factors and catch-and relase angling in a
topographically complex river. Tromsø: University of Tromsø,
Department of Arctic and Marine Biology.
SMHI Kunskapsbanken. (den 13 09 2010). Available from Sveriges
meteorologiska och hydrologiska institut:
http://www.smhi.se/kunskapsbanken/hydrologi/1916-1900-talets-
varsta-oversvamningar-i-dalalven-intraffar-1.12883 den 06 10 2015

58
SMHI vattenwebb. (den 04 08 2015). Available from Sverige meteriologiska
och hydrologiska institut: http://vattenweb.smhi.se/modelarea/ den
04 08 2015
SMHI, Historiskt bildgalleri. (den 13 08 2015). Available from SMHI:
http://vattenweb.smhi.se/bildgalleri/ den 13 08 2015
Spens, J. (2007). Can historical names and fishers' konwledge help to
reconstruct the distribution of fish populations in lakes? Fishers’
Knowledge in Fisheries Science and Management (ss. 329-349).
Paris: UNECSO.
Spens, J., Englund, G., & Lundqvist, H. (2007). Network connectivity and
dispersal barrier: using geographical information system (GIS) tools
to predict landscape scale distribution of a key predator (Esox lucius)
among lakes. Journal of Applied Ecology, 1127-1137.
Statistiska centralbyrån. (2015). Hämtat från Statistiska centralbyrån:
http://www.scb.se/sv_/Hitta-statistik/Historisk-statistik/Sok-
historisk-statistik/ den 14 08 2015
Svensson, J.-E., & Lundberg, S. (2013). Inventering av vandrarmusslas
larver i Göta kanal och Kinda kanal 2013. Göteborg: Havs- och
vattenmyndigheten.
Wang, J., & Jones, O. (2009). COLONY: a program for parentage and
sibship inference from multilocus genotype data. Molecular Ecology
Resources 10, 551-555.
Wickström, H. (2002). Monitoring of eel recruitment in Sweden. Volume 2A:
Country reports, Northern part: 69–86. In: Monitoring of glass eel
recruitment. Dekker, W. (Ed). Monitoring of eel recruitment in
Sweden. Volume 2A: Country reports, Northern part: 69–86. In:
Monitoring of glass eel recruitment. Dekker, W. (Ed). Netherlands
Institute of Fisheries Research, Ijmuiden, The Netherlands, Report
C007/02-WD, 256 s.
Videler, J. J., & Wardle, C. S. (1991). Fish Swimming stride by stride: speed
limits and endurance. Fish biology and fisheries, 23-40.
VISS. (2015). Available at vatteninformationssystem Sverige:
http://www.viss.lansstyrelsen.se/Waters.aspx?waterEUID=SE68011
5-135765&timelineDateID=4 den 04 08 2015
Viss. (2015). Avancerat sök Vald kategori: Åtgärder. Available at VISS:
http://www.viss.lansstyrelsen.se/Search.aspx?searchType=Measures
&SearchOnLoad=true&LockWaterDataset=&LocationTypeSearch
Option=0&freeTextSearch=&competentAuthorityID=&areaID=&c

59
ountyID=&municipalityID=&basinID=&subUnitID_2=&subUnitID
_8=&subUnitID_1=&subUnit den 16 11 2015
Östergren, J. (2015). Genetisk analys av öring i hedströmmens
avrinningsområde Del II. Uppsala: Sveriges lantbruksuniversitet.
14 Appendix
Species Barrier Comments NO. mi-
crosatellite
HoΔ FST Reference
Oncorhynchus
mykiss
Waterfall waterfalls, 3 m
each
22 0.24 0.205 Deiner m fl. (2007)
Oncorhynchus
mykiss
Waterfall l 21.3 m waterfall 22 0.17 0.138 Deiner m fl. (2007)
Oncorhynchus
mykiss
Waterfall 6.1 m waterfall 22 0.1 0.213 Deiner m fl. (2007)
Oncorhynchus
mykiss
Waterfall 6.7 m waterfall 22 0.02 0.029 Deiner m fl. (2007)
Oncorhynchus
mykiss
Waterfall 21.3 m cascade 22 0.22 0.217 Deiner m fl. (2007)
Oncorhynchus
mykiss
Waterfall 12.2 m waterfall 22 0.17 0.161 Deiner m fl. (2007)
Oncorhynchus
mykiss
Waterfall 6.1 m waterfall 22 0.1 0.052 Deiner m fl. (2007)
Oncorhynchus
mykiss
Dam Built 1982 22 0.06 0.053 Deiner m fl. (2007)
Oncorhynchus
mykiss
Dam Built 1959 22 0.05 0.06 Deiner m fl. (2007)
Salmo trutta
(stationary)
Waterfall waterfall + 12 km 5 0.41 0.538 J. Carlsson (2000)
Salmo trutta
(Stationary)
Waterfall waterfall + 2 km 5 0.05 0.018 J. Carlsson (2000)
Salmo trutta
0.25 0.176 J Östergren (2006)
Salmo trutta
(migrating)
Waterfall Songstupet + 15
km
10 0.06 0.09 Dannewitz et al.
(2014)
Salmo trutta
(migrating)
Waterfall Songstupet + 15
km
10 0.19 0.13 Dannewitz et al.
(2014)
Salvelinus fon-
tinalis
Waterfall 61 m waterfall 8 0.23
0.35 Timm et al. (2015)
Salvelinus fon-
tinalis
Waterfall 4 m waterfall 8 0.22 0.15 Timm et at. (2015)