assessment of fish upstream migration at natural barriers...
TRANSCRIPT
T E C H N I C A L M E M O R A N D U M
ASSESSMENT OF FISH UPSTREAM MIGRATION AT NATURAL BARRIERS IN THE UPPER ALAMEDA CREEK SUB-WATERSHED
Prepared for San Francisco Public Utilities Commission
January 2010

Table of Contents
Barriers January 2010 Page i
TABLE OF CONTENTS
EXECUTIVE SUMMARY ...........................................................................................................................ES-1
1 INTRODUCTION .............................................................................................................................. 1-11.1 BACKGROUND ................................................................................................................... 1-11.2 PURPOSE.............................................................................................................................. 1-11.3 SCOPE................................................................................................................................... 1-11.4 ORGANIZATION OF TECHNICAL MEMORANDUM .................................................... 1-2
2 SETTING............................................................................................................................................ 2-12.1 UPPER ALAMEDA CREEK SUB-WATERSHED ............................................................. 2-1
2.1.1 Upper Alameda Creek Basin ................................................................................. 2-22.1.2 Calaveras Basin ..................................................................................................... 2-22.1.3 Arroyo Hondo Basin ............................................................................................. 2-5
2.2 STEELHEAD PRESENCE IN ALAMEDA CREEK WATERSHED.................................. 2-6
3 METHODOLOGY ............................................................................................................................. 3-13.1 POWERS AND ORSBORN METHODOLOGY SELECTION ........................................... 3-13.2 STUDY REACHES............................................................................................................... 3-2
3.2.1 Little Yosemite ...................................................................................................... 3-23.2.2 Calaveras Boulder Debris Field............................................................................. 3-23.2.3 Arroyo Hondo Landslide..................................................................................... 3-11
3.3 SURVEY DATES, PERSONNEL, AND FLOWS ............................................................. 3-113.3.1 Survey Dates and Personnel ................................................................................ 3-113.3.2 Stream Flow During Field Assessments.............................................................. 3-15
3.4 BARRIER PASSABILITY ASSESSMENT ....................................................................... 3-163.4.1 Physical Metrics .................................................................................................. 3-243.4.2 Fish Performance Metrics.................................................................................... 3-24
4 RESULTS ........................................................................................................................................... 4-14.1 LITTLE YOSEMITE............................................................................................................. 4-1
4.1.1 Feature 9 ................................................................................................................ 4-74.1.2 Feature 10 ............................................................................................................ 4-124.1.3 Feature 11 ............................................................................................................ 4-15
4.2 CALAVERAS BOULDER DEBRIS FIELD ...................................................................... 4-154.3 ARROYO HONDO LANDSLIDE...................................................................................... 4-19
5 DISCUSSION..................................................................................................................................... 5-15.1 LITTLE YOSEMITE............................................................................................................. 5-25.2 CALAVERAS BOULDER DEBRIS FIELD ........................................................................ 5-45.3 ARROYO HONDO LANDSLIDE........................................................................................ 5-5
6 CONCLUSIONS ................................................................................................................................ 6-1
7 REPORT PREPARATION................................................................................................................. 7-17.1 LIST OF PREPARERS ......................................................................................................... 7-17.2 ACKNOWLEDGMENTS ..................................................................................................... 7-1
8 REFERENCES ................................................................................................................................... 8-1
Assessment of Fish Upstream Migration at Natural Barriers in the Upper Alameda Creek Sub-Watershed
Barriers January 2010 Page ii
AppendixAppendix A Falls Type Barrier Assessment Data Sheet
Tables2-1 Approximate Acreage Within the Alameda Creek Watershed and Upper Alameda Creek Sub-
Watershed3-1 Survey Dates and Recorded Daily Average Flows 3-2 Steelhead Passage Element Timing 3-3 Parameters Studied to Physically Characterize Potential Barriers 3-4 Description of Fish Condition and Associated Numeric Value for
Coefficient of Fish Condition 3-5 Swimming Speeds of Average-Size Adult Steelhead 4-1 Latitude and Longitude Coordinates for Features in the Little Yosemite Reach 4-2 Parameters Recorded at Feature 9 during a Creek Flow of 2.5 cfs 4-3 Parameters Recorded at Feature 10 during a Creek Flow of 2.5 cfs 4-4 Parameters Recorded at the Waterfall on Arroyo Hondo
Figures1-1 Alameda Creek Watershed 2-1 Study Area and Vicinity 2-2 Discharge at the Upper Alameda Creek Flow Gage, 1997 Water Year 2-3 Daily Average Discharge at the Calaveras Dam Flow Gage, 2003 Water Year 2-4 Daily Average Discharge at the Arroyo Hondo Flow Gage, 1997 Water Year 3-1 Photograph of a Portion of the Little Yosemite Reach 3-2 Aerial View of the Little Yosemite Reach 3-3 Photograph of a Portion of the Calaveras Boulder Debris Field Reach 3-4 Aerial View of the Calaveras Boulder Debris Field Reach 3-5 Photographs of the Arroyo Hondo Landslide Reach 3-6 Aerial View of the Arroyo Hondo Landslide Reach 3-7 Summary Statistics and Exceedance Probability for Alameda Creek Flow 3-8 Daily Average Discharge at the Calaveras Dam Flow Gage, 2006 Water Year 3-9 Summary Statistics and Exceedance Probability for Arroyo Hondo Flow 3-10 Decision Tree for Determining Passability of a Falls Barrier 3-11 Conceptual Cross-Section Model of Falls 3-12 Steelhead at the BART Weir, March 4, 2006 4-1 Barrier Assessment Results for Little Yosemite 4-2 Barrier Assessment Results for Calaveras Boulder Debris Field 4-3 Barrier Assessment Results for Arroyo Hondo Landslide 4-4 Photographs of Little Yosemite Feature 2 4-5 Photographs of Little Yosemite Feature 9 4-6 Cross Section of Little Yosemite Feature 9 4-7 Steelhead Leaping Curves with the Horizontal and Vertical Components of Feature 9 Superimposed 4-8 Landing Point of Little Yosemite Passage Feature 9 4-9 Photographs of Little Yosemite Feature 10 4-10 Cross Section of Little Yosemite Passage Feature 10 4-11 Little Yosemite Passage Feature 11 4-12 Photographs of the Calaveras Boulder Debris Field Reach 4-13 Waterfall in the Calaveras Boulder Debris Field Reach 4-14 Waterfall on Arroyo Hondo 5-1 Little Yosemite Feature 10 at Low and High Flow 5-2 Waterfall on Arroyo Hondo at Low and High Flow
Table of Contents
Barriers January 2010 Page iii
List of Acronyms ACDD Alameda Creek Diversion Dam ACDT Alameda Creek Diversion Tunnel ACFCWCD Alameda County Flood Control and Water Conservation District ACFRW Alameda Creek Fisheries Restoration Workgroup ACWD Alameda County Water District CCC Central California Coast CDFG California Department of Fish and Game CEMAR Center for Ecosystem Management and Restoration Cfc coefficient of fish condition cfs cubic feet per second DPS Distinct Population Segment DWR Department of Water Resources EBRPD East Bay Regional Parks District ESA (Federal) Endangered Species Act ESU Evolutionarily Significant Unit fps feet per second g acceleration due to gravity HDR|SWRI HDR Engineering, Inc.|Surface Water Resources, Inc. mm millimeters MOU Memorandum of Understanding NMFS National Marine Fisheries Service PG&E Pacific Gas and Electric Company SFPD San Francisco Planning Department SFPUC San Francisco Public Utilities Commission SVWTP Sunol Valley Water Treatment Plant TAC Technical Advisory Committee URS URS Corporation USACE U.S. Army Corps of Engineers USFWS U.S. Fish and Wildlife Service USGS U.S. Geological Survey WSIP Water System Improvement Program


Executive Summary
Barriers January 2010 Page ES-1
EXECUTIVE SUMMARYThe San Francisco Public Utilities Commission (SFPUC) is a member of the Alameda Creek Fisheries Restoration Workgroup, and is working with other stakeholders to restore steelhead to the Alameda Creek Watershed. This memorandum presents information from a field assessment of potential natural barriers to future steelhead upstream migration in the Upper Alameda Creek Sub-Watershed. Evaluation of stream features that are potential barriers to adult steelhead immigration provides useful information to steelhead restoration efforts and helps inform related assessments of the feasibility of creating steelhead passage at Calaveras Dam and Alameda Creek Diversion Dam (ACDD).
The study area for this assessment includes creek reaches located within SFPUC property surrounding Calaveras Dam and Alameda Creek Diversion Dam. After completing a review of existing reports and conducting creek reconnaissance surveys, three key reaches were identified for assessment: an approximately 0.2-mile-long, high gradient section of Alameda Creek in the Upper Alameda Creek Basin with exposed bedrock and large boulders that is affected by a landslide (the “Little Yosemite” reach); the approximately 0.4-mile-long Calaveras boulder debris field, on Calaveras Creek below Calaveras Dam (in Calaveras Basin), which is bedrock controlled, heavily armored with boulders and cobbles, and contains a 12-foot waterfall; and the Arroyo Hondo landslide reach, located approximately 1.8 miles upstream of Calaveras Reservoir in the Arroyo Hondo Basin, where two landslides converge on an approximately 15-foot waterfall.
Prior to initiating this study, SFPUC solicited feedback from National Marine Fisheries Service (NMFS) and other agencies regarding selection of the Powers and Orsborn methodology for this investigation. The fish passage assessment methodology described by Powers and Orsborn was selected because it is rigorous enough to consider a wide variety of physical passage metrics and because it has been used successfully at other locations (e.g., above Lake Oroville in the Feather River watershed).
Using methods based on Powers and Orsborn, the passability of 13 potential barriers to adult steelhead immigration was evaluated, guided by a series of equations that relate the physical attributes of the barriers to the swimming and leaping ability of steelhead. This methodology allows for assessment under different flow conditions, which is useful because the passability of a barrier can be affected by flow. Variations in flow through Little Yosemite may affect the potential for steelhead upstream migration during the anticipated period of migration (December-April); therefore, potential barriers were assessed at both moderate (98 cubic feet per second [cfs]) and low (2.5 cfs) flows. The ability to assess potential barriers during higher flows, when a substantial portion of adult steelhead immigration may be expected to occur, is limited by the hazard posed to scientists attempting to collect data in a stream under high flow conditions, and by the infrequency at which such flows occur.
Eight of 11 features assessed in the Little Yosemite reach were determined to be readily passable at both the low and moderate flows present during the assessments, and three features required additional evaluation to estimate passability. Two of these features, one 7.9-foot waterfall and one 9.5-foot waterfall, were found to be impassable during both field assessments. The third feature was found to be passable, due to the presence of a potential passage route underneath the boulders that form this impediment, which otherwise would not likely be passable. While two barriers to potential steelhead immigration during low and moderate flow were identified, there is considerable uncertainty regarding the passability of the Little Yosemite reach under flows higher than 98 cfs.
Higher flows with potential to affect the passability of Little Yosemite are anticipated to occur infrequently and for short duration, and would be in associated with precipitation events. Such flows may foster hydraulic conditions sufficient for upstream migration by creating additional flow paths

Assessment of Fish Upstream Migration at Natural Barriers in the Upper Alameda Creek Sub-Watershed
Barriers January 2010 Page ES-2
around obstacles or decreasing the overall height differential from pool to pool. Conversely, higher flows may also create higher water velocities and a greater magnitude of turbulence, so some of the features evaluated may become less passable. It is unknown whether steelhead would be able to successfully immigrate through the entire Little Yosemite reach during one of these larger flow events.
Below Calaveras Dam, the boulder debris field reach of Calaveras Creek was also found to be impassable to immigrating adult steelhead. While a number of small impediments and subsurface flows may affect passage conditions at times of low stream flow, the primary barrier to steelhead migration is a 12-foot vertical waterfall. This feature is impassable because its vertical height exceeds the vertical leaping ability of steelhead, even under optimal conditions. The passability of the 12-foot-high waterfall in Calaveras Creek may be affected by changes in flow, controlled almost entirely by operation of Calaveras Dam, but it is unknown whether increases in stream discharge would improve hydraulic conditions sufficient for passage at this barrier.
In the landslide reach of Arroyo Hondo, an approximately 15-foot vertical waterfall blocks upstream fish migration approximately 1.8 miles upstream of Calaveras Reservoir. This waterfall is much taller than the vertical leaping ability of an immigrating steelhead, and therefore would be a vertical leaping barrier. Although Arroyo Hondo is an unimpaired tributary, the configuration of the channel is such that at high flow that can be expected to occur on an annual or semiannual basis, this feature may continue to be a 15-foot-high vertical leaping barrier.
This memorandum presents preliminary consideration of the potential to increase the passability of the features found to be barriers, either by manipulating flows or through physical modification, although this is not the primary focus of this field study. In all cases, where the memorandum describes modifications to facilitate passage as potentially feasible, additional investigation and analysis would be required to determine if such modifications are feasible, based on additional site-specific data.
Although the Little Yosemite reach is downstream of the Alameda Creek Diversion Dam, operation of water diversion facilities at the ACDD are not expected to have a strong influence on its passability. There may be greater potential to affect passability at Little Yosemite through physical modifications of the two features found to be impassable, thereby increasing the likelihood of passage at moderate flows that occur with some regularity. Minor modifications within the channel may be possible without destabilizing the slopes above the creek, but due to the presence of a landslide that terminates at Little Yosemite, any modifications would require detailed geotechnical evaluation.
Similarly, adult steelhead passage through the boulder debris field on Calaveras Creek, below Calaveras Dam, could potentially be facilitated through physical modification. While passage conditions could potentially be affected by massive releases from Calaveras Reservoir, it is uncertain how effective releases would be for facilitating passage. No active slides were observed in this reach, but modifications to facilitate passage would still require investigations of hydrology and geology.
Arroyo Hondo is an unimpaired tributary, so there is no way to influence flows for fish passage at the landslide reach. While passage at this barrier could potentially be facilitated either through direct physical modification or construction of a fish ladder, any attempt to facilitate fish passage at this barrier would require extensive geotechnical review due to the instability of the channel slopes. An approximately 2,000-foot-high landslide on the north canyon wall shows ongoing signs of instability and the toe of the slide is actively moving down into the creek channel where the finer soil and weathered rock are washed away during periods of high stream discharge. Excavation near the north or south channel slopes has potential to destabilize the slides and accelerate their movement, and could require major engineered slope stabilization solutions.
1.0 Introduction
Barriers January 2010 Page 1-1
1 INTRODUCTION
1.1 BACKGROUND The San Francisco Public Utilities Commission (SFPUC) has been working with other stakeholders since the late 1980s to restore steelhead to the Alameda Creek Watershed (TAC, 1989). In conjunction with other fisheries enhancement actions, the SFPUC removed Niles and Sunol dams from Alameda Creek in 2006 and is completing a Habitat Conservation Plan that includes steelhead as a covered species (SFPUC, 2009). The SFPUC is also a member of the Alameda Creek Fisheries Restoration Workgroup, which is working to restore steelhead to the Alameda Creek Watershed. The Alameda Creek Fisheries Restoration Workgroup is composed of a broad range of stakeholders, including representatives from the National Marine Fisheries Service (NMFS) and the California Department of Fish and Game (CDFG).
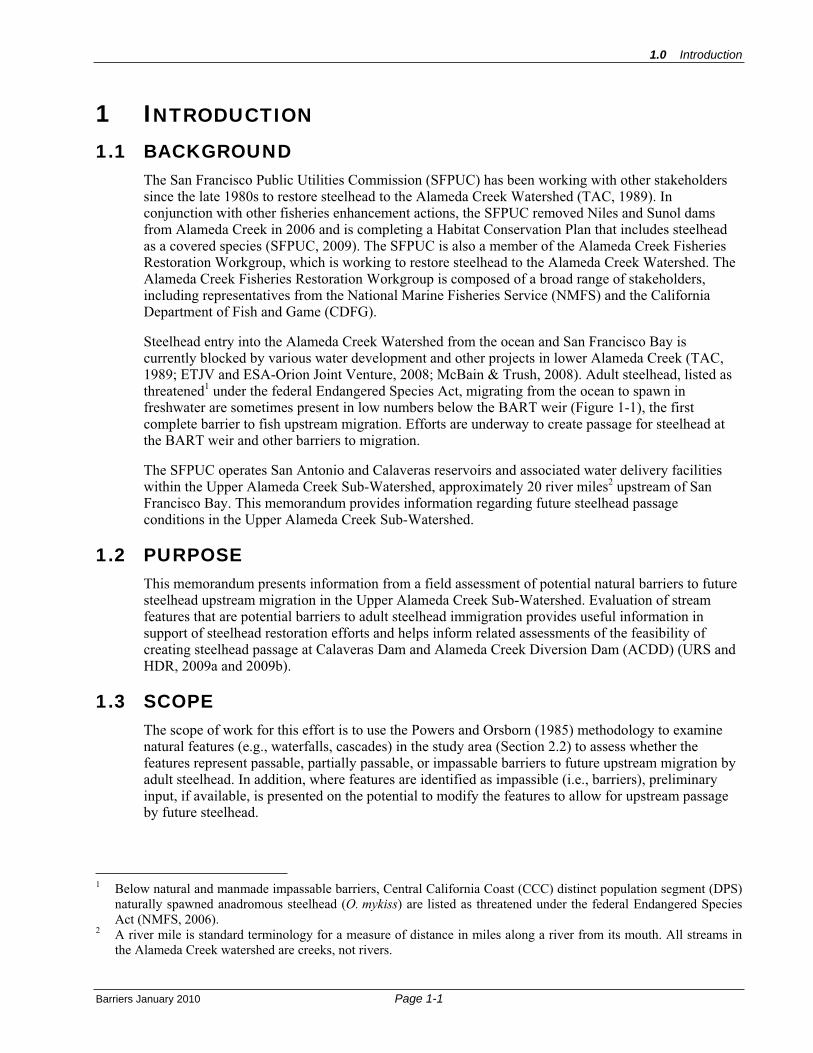
Steelhead entry into the Alameda Creek Watershed from the ocean and San Francisco Bay is currently blocked by various water development and other projects in lower Alameda Creek (TAC, 1989; ETJV and ESA-Orion Joint Venture, 2008; McBain & Trush, 2008). Adult steelhead, listed as threatened1 under the federal Endangered Species Act, migrating from the ocean to spawn in freshwater are sometimes present in low numbers below the BART weir (Figure 1-1), the first complete barrier to fish upstream migration. Efforts are underway to create passage for steelhead at the BART weir and other barriers to migration.
The SFPUC operates San Antonio and Calaveras reservoirs and associated water delivery facilities within the Upper Alameda Creek Sub-Watershed, approximately 20 river miles2 upstream of San Francisco Bay. This memorandum provides information regarding future steelhead passage conditions in the Upper Alameda Creek Sub-Watershed.
1.2 PURPOSEThis memorandum presents information from a field assessment of potential natural barriers to future steelhead upstream migration in the Upper Alameda Creek Sub-Watershed. Evaluation of stream features that are potential barriers to adult steelhead immigration provides useful information in support of steelhead restoration efforts and helps inform related assessments of the feasibility of creating steelhead passage at Calaveras Dam and Alameda Creek Diversion Dam (ACDD) (URS and HDR, 2009a and 2009b).
1.3 SCOPEThe scope of work for this effort is to use the Powers and Orsborn (1985) methodology to examine natural features (e.g., waterfalls, cascades) in the study area (Section 2.2) to assess whether the features represent passable, partially passable, or impassable barriers to future upstream migration by adult steelhead. In addition, where features are identified as impassible (i.e., barriers), preliminary input, if available, is presented on the potential to modify the features to allow for upstream passage by future steelhead.
1 Below natural and manmade impassable barriers, Central California Coast (CCC) distinct population segment (DPS) naturally spawned anadromous steelhead (O. mykiss) are listed as threatened under the federal Endangered Species Act (NMFS, 2006).
2 A river mile is standard terminology for a measure of distance in miles along a river from its mouth. All streams in the Alameda Creek watershed are creeks, not rivers.
Assessment of Fish Upstream Migration at Natural Barriers in the Upper Alameda Creek Sub-Watershed
Barriers January 2010 Page 1-2
After completing a review of existing reports and conducting creek reconnaissance surveys, three key reaches were identified for assessment: a high gradient section of Alameda Creek with exposed bedrock and large boulders (the “Little Yosemite” reach), a boulder debris field on Calaveras Creek below Calaveras Dam, and a reach of the Arroyo Hondo above Calaveras Reservoir, where two landslides converge.
1.4 ORGANIZATION OF TECHNICAL MEMORANDUM The organization of this memorandum is as follows:
Section 1 provides background information and introduces the purpose and scope of the assessment.
Section 2 presents information on historic and existing conditions, including information on steelhead presence and hydrology.
Section 3 defines the study area for this assessment, describes the study reaches, including a brief description of relevant geology, and describes the methodology used to assess the features studied in this memorandum.
Section 4 describes the results of the passage field assessment.
Section 5 presents a discussion of how flow outside the range observed during the field assessment may affect passability of the barriers, and preliminary input on the potential to facilitate passage at barriers.
Section 6 presents the conclusions of this study.
Section 7 lists the preparers of this memorandum.
Section 8 lists the reference materials used in the preparation of this memorandum.

SanFrancisco
Bay
Upper AlamedaCreek Basin
Arroyo HondoBasin
San AntonioBasin
Mid-AlamedaCreek Basin
CalaverasBasin
UpperAlameda CreekSub-Watershed
Arroyo de la LagunaSub-Watershed
LowerAlameda
CreekSub-Watershed
CalaverasReservoir
San AntonioReservoir
LakeDel Valle
Alameda CreekWatershed
TIDALLY INFLUENCED BAYLANDS
Alamed
a Creek
BART Weir andWater Diversion Facilities
Middle Rubber Dam
Upper Rubber Dam
680
205
580
238
880
130
35
9
17
237
85
87
262
85
84
84
Tracy
Alamo
Newark
Dublin
Fremont
Hayward
SaratogaCampbell
San Jose
Milpitas
Danville
Los Gatos
Cupertino
Los Altos
Sunnyvale
Livermore
San Ramon
Pleasanton
Santa Clara
Mountain View
Castro Valley
CCC Steelhead DPS
Alameda CreekWatershed
EXTENT OFMAIN MAP
PacificOcean
Napa
Ukiah
Fremont
Oakland
San Jose
Palo Alto
Livermore
Santa Cruz
Santa Rosa
Sacramento
Morgan Hill
Walnut Creek
San Francisco
L:\P
roje
cts\
Cal
aver
as_D
am_2
6814
408\
Mxd
\Cur
rent
Wor
king
Doc
umen
ts\B
iolo
gy\F
ish_
pass
age_
stud
y\B
arrie
rs\B
arrie
rs_F
ig1-
1_A
lam
edaC
reek
WS
.mxd
Central California Coast (CCC) SteelheadDistinct Population Segment (DPS) andAlameda Creek Watershed
0 20 4010
SCALE FOR INSET IN MILES
0 4 82
SCALE FOR MAIN MAP IN MILES
Alameda Creek Sub-Watersheds
Upper Alameda Creek Sub-Watershed Basins
SFPUC Land
Water Body
Stream
Major Road
UR
SC
orp
-Oak
land
CA
-C.R
aum
ann
Figure 1-1
Assessment of Fish Upstream Migration at Natural Barriersin the Upper Alameda Creek Sub-Watershed
Technical Memorandum
Alameda Creek Watershed
January 2010


2.0 Environmental Setting
Barriers January 2010 Page 2-1
2 SETTINGThis section describes the Alameda Creek Watershed with emphasis on the Upper Alameda Creek Sub-Watershed and its basins (Section 2.1), and provides a discussion of historic and current presence of steelhead in the Alameda Creek Watershed (Section 2.2).
2.1 UPPER ALAMEDA CREEK SUB-WATERSHED The approximately 440,000-acre Alameda Creek Watershed is the largest tributary to the South San Francisco Bay Estuary. It drains the interior hills and valleys east of San Francisco Bay, including the northwestern slopes of the Diablo Range and the Livermore-Amador and Sunol valleys, before cutting through the East Bay hills via Niles Canyon and flowing across its largely developed alluvial fan and floodplain. Unlike California watersheds that originate high in the Sierra Nevada Mountains, Alameda Creek Watershed does not accumulate snowpack in winter, so most of its tributaries are ephemeral. The watershed has been modified extensively for purposes of flood control and surface and groundwater supply, and contains three major reservoirs (Calaveras, San Antonio, and Del Valle).
Alameda Creek Watershed is composed of three sub-watersheds (Figure 1-1). The Upper Alameda Creek Sub-Watershed is the second largest of the three, which at approximately 130,000 acres drains just less than 30 percent of Alameda Creek Watershed (Table 2-1). The Upper Alameda Creek Sub-Watershed contains Calaveras Reservoir, Calaveras Dam, and the ACDD, water infrastructure owned and operated by SFPUC, as well as the study area for this investigation (Section 3.2).
Table 2-1 Approximate Acreage Within the Alameda Creek Watershed,
and Upper Alameda Creek Sub-Watershed Watershed Sub-Watershed Basin Acreage
Alameda Creek 440,000
Arroyo de la Laguna 270,000
Upper Alameda Creek 130,000
Arroyo Hondo 51,000
Upper Alameda Creek 26,000
San Antonio 25,000
Mid-Alameda Creek 15,000
Calaveras 13,000
Lower Alameda Creek 40,000
Note: Acreages reported for watersheds in this technical memorandum are based on CalWater data (January 2009), available at http://cain.ice.ucdavis.edu/calwater/caldata.html.
The Upper Alameda Creek Sub-Watershed is composed of five basins (Figure 1-1). Of particular relevance to this memorandum are the Upper Alameda Creek, Calaveras, and Arroyo Hondo basins, which contain the reaches assessed for potential steelhead migration in this memorandum, and are described in more detail in this section. The Upper Alameda Creek Sub-Watershed also contains the approximately 25,000-acre San Antonio Basin, which drains into San Antonio Reservoir, and the approximately 15,000-acre Mid-Alameda Creek Basin, which is below both the Calaveras and San Antonio reservoirs.

Assessment of Fish Upstream Migration at Natural Barriers in the Upper Alameda Creek Sub-Watershed
Barriers January 2010 Page 2-2
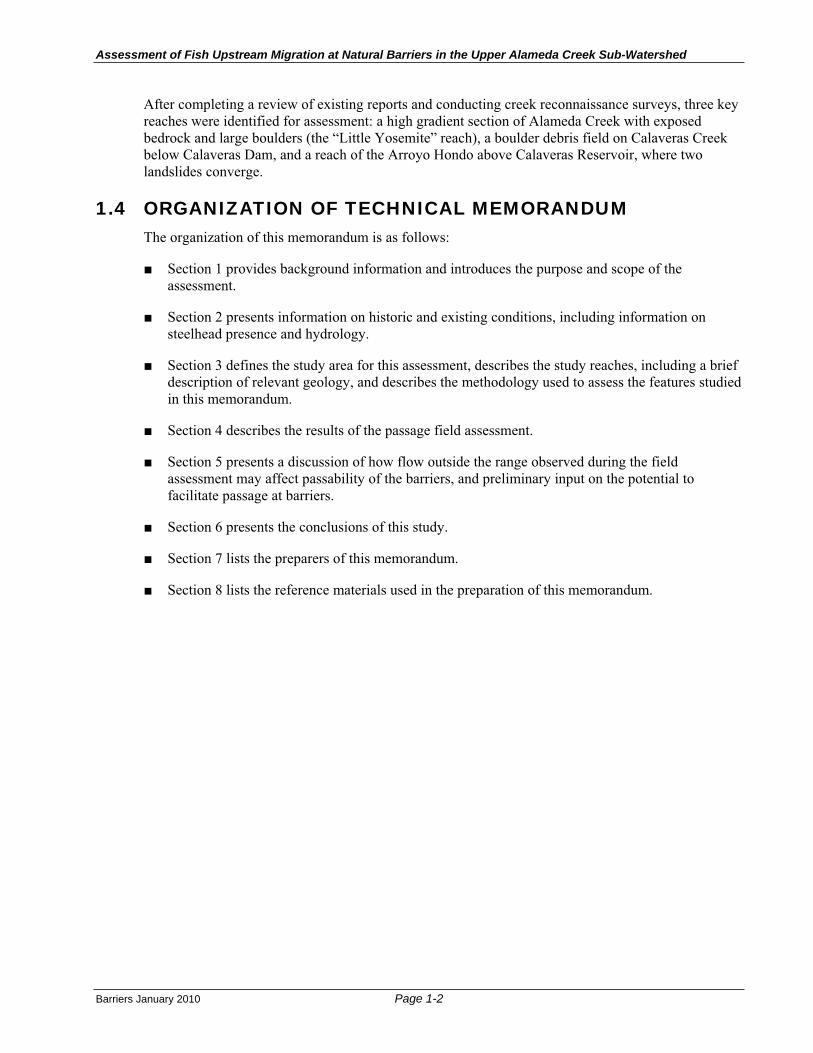
2.1.1 UPPER ALAMEDA CREEK BASIN The second largest basin in the Upper Alameda Creek Sub-Watershed is the approximately 26,000-acre Upper Alameda Creek Basin (Table 2-1), which contains the uppermost reaches of Alameda Creek. Despite being the namesake of the entire Alameda Creek Watershed, within the Upper Alameda Creek Basin, Alameda Creek typically does not have perennial flow, but rather is an intermittent stream that dries to a series of isolated pools and sections of wetted channel during the dry season (SFPUC, 2007; Hagar and Paine, 2008). Summer temperatures are higher and annual rainfall is somewhat lower than coastal streams draining directly to the Pacific Ocean (Gunther et al., 2000). Although Alameda Creek does not flow into Calaveras Reservoir, ACDD and the Alameda Creek Diversion Tunnel (ACDT) are used to divert wet season flows from a 21,000-acre catchment in the Upper Alameda Creek Basin to Calaveras Reservoir (Figure 2-1).
Above ACDD flows are unimpaired and are best characterized as flashy, rising rapidly following precipitation events and then quickly subsiding once precipitation ceases (Figure 2-2). Flows recorded at the U.S. Geological Survey (USGS) upper Alameda Creek gage (Gage Station 11172945; Figure 2-1) range from zero (periods when there is no measurable flow occur during most years) up to 3,390 cubic feet per second (cfs) recorded on January 9, 1995 (USGS, 2009a).
Between ACDD and the confluence with Calaveras Creek, Alameda Creek flows through a reach known as Little Yosemite, located approximately 2.6 miles downstream of ACDD and 0.2 mile upstream of the confluence with Calaveras Creek (Figure 2-1). The Little Yosemite reach of Alameda Creek is a high gradient, approximately 0.2-mile-long section of stream channel with exposed bedrock and large boulders that present potential impediments to fish immigration. Little Yosemite is one of the three reaches assessed for future steelhead migration in this memorandum (Section 3.2.1).
Stream flows through Little Yosemite are influenced by operation of ACDD and ACDT. Gates are used to shut off flow into the diversion tunnel when necessary. When the diversion is closed, flows through Little Yosemite are similar to those described above for the reach above ACDD. When open, the tunnel has the capacity to divert an estimated 650 cfs to Calaveras Reservoir, with remaining peak flows passing over ACDD. Under normal operation, water is diverted at ACDD during winter and early spring months (from approximately late November through April). In the spring, diversions are generally stopped, and the gates to ACDT are closed.
2.1.2 CALAVERAS BASIN Calaveras Basin is the smallest basin in the Upper Alameda Creek Sub-Watershed (Figure 1-1, Table 2-1). The basin is drained by Calaveras Creek, a roughly 5-mile-long intermittent stream that flows directly into Calaveras Reservoir (Figure 2-1). Calaveras Reservoir receives runoff directly from Calaveras and Arroyo Hondo basins, along with flows from the Upper Alameda Creek Basin via ACDT, and has a water storage capacity of approximately 96,850 acre-feet. Calaveras Dam is located at the northern end of Calaveras Reservoir. Downstream of the dam, Calaveras Creek continues north for less than 1 mile to the confluence of Calaveras Creek and Alameda Creek.
Above Calaveras Reservoir, Calaveras Creek is characterized by low to no flow in the summer, and flashy flow in winter months. In a 2-mile segment above Marsh Road, the average width of the creek is approximately 4 feet (Hagar and Payne, 2008). There is no stream flow gage on Calaveras Creek, but based on a recent modeling study, flows at a location roughly 0.6 mile upstream from the confluence of Calaveras Creek and the reservoir full pool elevation are strongly linked to precipitation events (ETJV and Hydroconsult Engineers, Inc., 2008). Single-day spikes in discharge (typically between 10 and 100 cfs) quickly drop within one or two days. Flows of 10 cfs or greater are expected to occur on approximately 24 days in an average year. For all years studied, the monthly average flow was expected to be above 5 cfs only during January, February, and March.
Arroyo Hondo
CalaverasReservoir
Little YosemiteAlameda CreekDiversion Dam
Alameda CreekDiversion Tunnel
Arroyo HondoLandslide
Calaveras BoulderDebris Field
Calaveras Dam
Arroyo Hondo
Alameda Creek
Calaveras Creek
Alameda C re ek
Calaveras Creek
Arroyo HondoBridge
MarshRoad
USGS Gage11172945
USGS Gage11173500
USGS Gage11173200
Figure 2-1
Assessment of Fish Upstream Migration at Natural Barriersin the Upper Alameda Creek Sub-Watershed
Technical Memorandum
Study Area and Vicinity
SFPUC Land
Upper Alameda Creek Sub-Watershed
Upper Alameda Creek Sub-Watershed Basins
Arroyo Hondo Basin
Calaveras Basin
Upper Alameda Creek Basin
Dam
Study Reach
0 1 20.5
MILES\\S02
1em
c2\g
isda
ta\P
roje
cts\
Cal
aver
as_D
am_2
6814
408\
Mxd
\Cur
rent
Wor
king
Doc
umen
ts\B
iolo
gy\F
ish_
pass
age_
stud
y\B
arrie
rs\B
arrie
rs_F
ig2-
1_S
tudy
Are
a.m
xdU
RS
Cor
p-O
akla
ndC
A-C
.Rau
man
n
January 2010

Assessment of Fish Upstream Migration at Natural Barriers in the Upper Alameda Creek Sub-Watershed
Barriers January 2010 Page 2-4
0
500
1000
1500
2000
250010
/1/19
9611
/1/19
9612
/1/19
961/1
/1997
2/1/19
973/1
/1997
4/1/19
975/1
/1997
6/1/19
977/1
/1997
8/1/19
979/1
/1997
Date
Dis
char
ge (c
fs),
15 M
inut
e In
terv
al D
ata
Figure 2-2 Discharge at the Upper Alameda Creek Flow Gage, 1997 Water Year3
Below Marsh Road, as it approaches Calaveras Reservoir, the character of Calaveras Creek changes. The channel has been significantly altered by past human attempts to contain and channelize flow (ETJV and Hydroconsult Engineers, Inc., 2008). Approximately 2,900 feet below Marsh Road the channel is no longer evident (Hagar and Payne, 2008). As it nears the high water surface elevation of Calaveras Reservoir, the ground surface is generally flat, with a gentle slope towards the reservoir. Overland flow takes multiple paths, floods low-lying areas, infiltrates into the ground, and likely changes flow paths frequently (ETJV and Hydroconsult Engineers, Inc., 2008).
Below Calaveras Reservoir and Dam, flows in the 0.7 mile reach of Calaveras Creek between Calaveras Reservoir and Alameda Creek are controlled almost entirely by operation of Calaveras Dam (Figure 2-1). Historically releases from Calaveras Dam have been typically limited to spills, which occur on a less than annual basis when the reservoir exceeds its storage capacity. There is also a steady seepage from the base of the dam, estimated to be approximately 0.5 cfs, although not all of the seepage is registered by the USGS gage below the dam. In years when the reservoir does not spill and when there are no releases from the dam’s water release valves, flows in Calaveras Creek below the dam are typically less than 1 cfs (Figure 2-3). During years where there are spills or controlled releases through the valves, flows can range between approximately 30 and 630 cfs over variable durations (SFPD, 2009).
3 The 1997 water year is characterized as a “wet” water year (in contrast to “dry” and “average”).

2.0 Environmental Setting
Barriers January 2010 Page 2-5
0
0.2
0.4
0.6
0.8
110
/1/20
0211
/1/20
0212
/1/20
021/1
/2003
2/1/20
033/1
/2003
4/1/20
035/1
/2003
6/1/20
037/1
/2003
8/1/20
039/1
/2003
Date
Dai
ly A
vera
ge D
isch
arge
(cfs
)
Figure 2-3 Daily Average Discharge at the Calaveras Dam Flow Gage, 2003 Water Year
An approximately 0.4-mile-long portion of the reach of Calaveras Creek below Calaveras Dam, referred to in this memorandum as the “Calaveras boulder debris field,” presents potential impediments to fish migration. The Calaveras boulder debris field is the second of three reaches assessed for future steelhead immigration in this memorandum (Section 3.2.2).
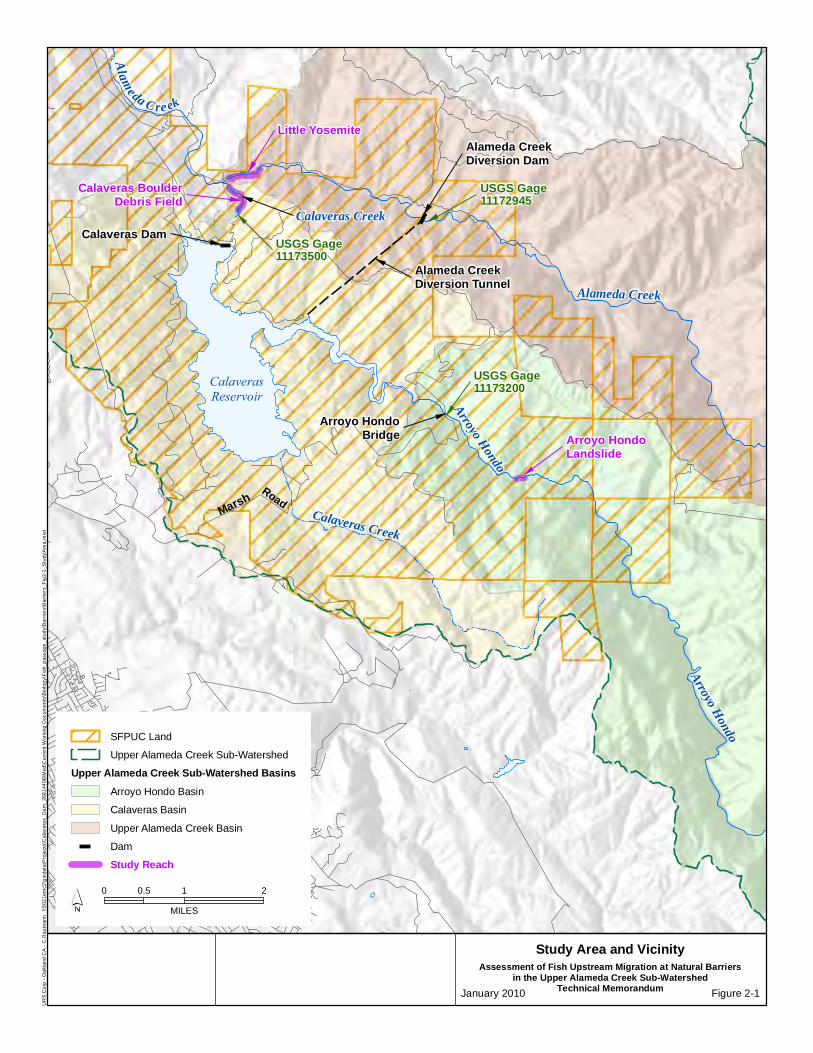
2.1.3 ARROYO HONDO BASIN Arroyo Hondo is the largest basin in the Upper Alameda Creek Sub-Watershed (Figure 1-1, Table 2-1). Arroyo Hondo is also the name of the stream that drains the Arroyo Hondo Basin into Calaveras Reservoir, the lowest reaches of which are perennial (Figure 2-1). Arroyo Hondo supports one of the largest stands of white alder riparian forest in the Alameda Creek Watershed (SFPD, 2007). Its tributaries drain approximately 51,000 acres, and Arroyo Hondo is the largest contributor of water to Calaveras Reservoir. Flows in Arroyo Hondo are not impeded by any major dams, and range from around 1 cfs during the dry season to well over 1,000 cfs during significant precipitation events (USGS, 2009b) (Figure 2-4). Similar to flows described for Alameda Creek (Section 2.1.1), flows in Arroyo Hondo are best described as flashy, rising quickly with precipitation events and dropping rapidly once precipitation ceases. The maximum discharge recorded during the period of record (1968 to 1981 and 1994 to present) at the Arroyo Hondo gage is 7,340 cfs on February 3, 1998, and the minimum flow recorded is 0.11 cfs on July 25 to 30, 1972.
Approximately 1.8 miles upstream from its confluence with the typical high water level of Calaveras Reservoir, Arroyo Hondo passes through a reach upon which two landslides converge (Figure 2-1). Upstream fish passage at this location is impeded, and the Arroyo Hondo landslide reach is assessed for future steelhead immigration in this memorandum (Section 3.2.3).
Assessment of Fish Upstream Migration at Natural Barriers in the Upper Alameda Creek Sub-Watershed
Barriers January 2010 Page 2-6
Figure 2-4 Daily Average Discharge at the Arroyo Hondo Flow Gage, 1997 Water Year
2.2 STEELHEAD PRESENCE IN ALAMEDA CREEK WATERSHED Historic population estimates of steelhead in the Alameda Creek Watershed are unavailable, but steelhead were historically present (Leidy, 2007). Based on various anecdotal accounts of steelhead presence in the watershed from as early as the 1930s, the size of the watershed, the presence of perennial streams, and various Oncorhynchus mykiss records from surveys since the 1930s, it is likely that in the past this watershed supported a large steelhead run, relative to other San Francisco Estuary streams (Leidy et al., 2005). Rainbow trout are currently present in the upper reaches of the Alameda Creek Watershed, and there are well documented reports of steelhead in the lower Alameda Creek channel below the BART weir (located approximately 10 miles upstream of San Francisco Bay and approximately 16 miles downstream of Calaveras Dam (Figure 1-1). This weir currently presents an impassable upstream migration barrier (Gunther et al., 2000; Hayes, 2001). Small numbers of adult steelhead have been observed attempting to pass the BART weir (Gunther et al., 2000), some of which have been relocated above the weir and subsequently tracked to Stonybrook Creek (located approximately 13 miles upstream of San Francisco Bay and approximately 13 miles downstream of Calaveras Dam) where they were observed spawning (San Jose Mercury News, 2008). Additional structures and natural cascades located upstream of the BART weir also present obstacles for upstream movement of fishes (Gunther et al., 2000).
A number of existing facilities under the jurisdiction of Alameda County Water District (ACWD), Alameda County Flood Control and Water Conservation District (ACFCWCD), California Department of Water Resources, SFPUC, and Zone 7 Water Agency, among others, strongly affect
0200400600800
100012001400160018002000220024002600
10/1/
1996
11/1/
1996
12/1/
1996
1/1/19
972/1
/1997
3/1/19
974/1
/1997
5/1/19
976/1
/1997
7/1/19
978/1
/1997
9/1/19
97
Date
Dai
ly A
vera
ge D
isch
arge
(cfs
)
2.0 Environmental Setting
Barriers January 2010 Page 2-7
hydrological and fisheries habitat conditions in the Alameda Creek Watershed. Many of these structures and facilities have been in existence for well over 80 years, and have resulted in substantial changes to the natural conditions that existed before the twentieth century when a steelhead run is presumed to have been present throughout the basin. Although built in the past, these existing facilities and influences continue to operate and affect habitat conditions for steelhead in the Alameda Creek Watershed. Some of these are direct barriers to fish migration; others pose various degrees of control/influence over habitat conditions (Gunther et al., 2000). Primary facilities (separated by sub-watershed) include the following:
In the Arroyo de la Laguna Sub-Watershed:
Del Valle Dam and Reservoir/South Bay Aqueduct, including State Water Project releases; Quarry lakes recharge facilities; Various channelized and culverted stream segments; and Expanding urban development of the Tri-Valley Area.
In the Upper Alameda Creek Sub-Watershed:
Calaveras Reservoir and Dam; Alameda Creek Diversion Dam and Tunnel; Sunol Valley aggregate mining operations and quarries; Turner Dam and San Antonio Reservoir; Sunol infiltration galleries; and Pacific Gas and Electric Company (PG&E) pipeline crossing protection covering (drop structure).
In the Lower Alameda Creek Sub-Watershed:
ACWD’s upper, middle, and lower inflatable dams and quarry pits recharge facilities; BART weir; and ACFCWCD channelization project.
All of these facilities, combined with urbanization and other land use activities, have resulted in substantial alteration of habitat conditions for steelhead in the watershed. Nielson (2003) examined mitochondrial DNA and 14 microsatellite loci of rainbow trout from Alameda Creek and found that trout from Arroyo Hondo, upper Alameda Creek, and San Antonio Reservoir are more closely related to steelhead captured in Alameda Creek below the BART weir than they are to any other wild or hatchery population of O. mykiss examined in the study. These trout were also found to be similar to populations from other creeks within the Central California Coast (CCC) steelhead Distinct Population Segment (DPS). A more recent analysis of the genetic diversity and population structure of O. mykiss in nearby streams of the Santa Clara Valley examined 18 microsatellite loci and found that populations of trout from above dams in the Guadalupe, Pajaro, and Permanente/Stevens basins are all of recent steelhead ancestry (Garza and Pearse, 2008). The SFPUC is supplying O. mykisstissue samples, collected annually since 2002 from a variety of locations within the Alameda Creek Watershed, to NMFS to supplement a regional genetics study designed to better understand the population structure of fish specific to southern San Francisco Bay. An analysis of these samples, employing the same set of 18 microsatellites used to genotype O. mykiss from the majority of steelhead streams draining into San Francisco Bay, as well as all of the adjacent coastal streams, is expected to allow for the large-scale geographic comparisons that have been lacking in previous Alameda Creek Watershed genetic analyses.
On January 5, 2006, the CCC DPS, including all naturally spawned anadromous steelhead (O. mykiss)populations below natural and manmade impassable barriers, were listed as threatened under the

Assessment of Fish Upstream Migration at Natural Barriers in the Upper Alameda Creek Sub-Watershed
Barriers January 2010 Page 2-8
federal Endangered Species Act by the Department of Commerce, National Oceanic and Atmospheric Administration, National Marine Fisheries Service (NMFS, 2006). The geographic extent of this DPS includes coastal drainages from Soquel Creek in Santa Cruz County (inclusive), north to the Russian River in Sonoma County (inclusive), and the drainages of San Francisco, San Pablo, and Suisun bays east of Chipps Island at the confluence of the Sacramento and San Joaquin river systems (inset box, Figure 1-1). Steelhead that spawn in the Sacramento-San Joaquin River Basin are within a separate DPS. In the Final Endangered Species Act Listing Determination, NMFS concluded that the resident rainbow trout population in Alameda Creek is not considered part of the DPS (NMFS, 2006), in part due to their reproductive isolation resulting from man-made barriers. When steelhead (CCC DPS) are successfully re-established in the Alameda Creek Watershed via the removal or modification of passage barriers, all rainbow trout (O. mykiss) in areas made accessible from the ocean will be considered as part of the same population regardless of their realized life history character (i.e., anadromous, fluvial, or adfluvial).
Efforts are currently underway to restore the migration of adult steelhead into the Alameda Creek Watershed. In 1999, the Alameda Creek Fisheries Restoration Workgroup (ACFRW) was established (CEMAR, 2002). The workgroup has generated a report that assesses the potential for a viable steelhead population to exist in Alameda Creek (i.e., Gunther et al., 2000). Efforts to restore steelhead populations to Alameda Creek have targeted the elimination of fish migration barriers, particularly those in the lower reaches (Gunther et al., 2000; Wood Rogers, 2007).
A number of future projects could potentially affect conditions for steelhead in the Upper and Lower Alameda Creek sub-watersheds. These projects include several that are in various stages of planning and implementation by public agencies, citizens’ groups, and quarry operators. They include removing/modifying dams, weirs, culverts, and pipelines that block fish passage, installation of positive barrier fish screen at water diversions, restoring and protecting habitat, and providing instream flows. Of particular importance to this analysis is the existence of several fish migration barriers in the watershed and associated future projects to address passage. These obstructions include the ACFCWCD’s grade control structure (also known as the BART weir) located about 9.5 miles upstream from the creek’s confluence with San Francisco Bay (Figure 1-1); ACWD rubber dams (ranging in location from about 2 miles upstream of the bay to just below Niles Canyon); and the PG&E concrete drop structure in the Sunol Valley. Two water diversion structures—the Nile and Sunol dams on Alameda Creek below the Sunol quarries—were removed in 2006 by the SFPUC. The East Bay Regional Parks District (EBRPD) also removed two small barriers from Sunol Wilderness Regional Preserve. ACWD removed its lowermost rubber dam in 2009 (CEMAR, 2009), and construction of a fish ladder at the BART weir and a second rubber dam is anticipated for 2011. Other migration barriers along the creek are in various stages of planning to address passage. Upon completion of these and other future projects, steelhead will have access to the Upper Alameda Creek Sub-Watershed.

3.0 Barrier Assessment Methodology
Barriers January 2010 Page 3-1
3 METHODOLOGYThis section defines the study area and describes the methodology used in this assessment, including selection of the Powers and Orsborn (1985) methodology. Descriptions of the study area presented in this section include relevant geologic information. Survey dates and the flow present in the study reaches at the time of the field assessments are also presented and described.
3.1 POWERS AND ORSBORN METHODOLOGY SELECTION Initial work in this study involved soliciting technical input from resource agencies on appropriate methodologies for studying instream features to confirm potential for upstream passage by future steelhead. The fish passage assessment methodology described by Powers and Orsborn (1985) was identified as a method that considers a wide variety of physical passage metrics. It has been used by the California Department of Water Resources and HDR|SWRI to assess potential fish passage impediments above Lake Oroville (DWR and SWRI, 2004). The prior, successful implementation of this methodology for barrier assessment above Lake Oroville with participation of personnel from NMFS and CDFG, and subsequent review of those results by NMFS, also led to it being proposed for use in this study. Additionally, this assessment methodology was recommended because it is:
A defensible assessment of fish passage over a subject impediment or potential barrier
Based on published literature and quantitative fish performance metrics
Capable of evaluating a variety of types of potential barriers
Flexible enough to support evaluation of several sizes or species of fish
Adjustable to changing hydraulic conditions (i.e., if a defined variable such as residual depth is changed, calculations can be recomputed to determine the passability at a potential barrier under different conditions)
Capable of evaluating passage conditions under potentially altered site conditions (e.g., following flood flows that have reorganized a channel)
Uses quantifiable measurements and allows for independent reproduction and validation of results (field measurements and subsequent calculations are reproducible)
The Powers and Orsborn methodology is limited in that it can only be applied to the study of individual passage features and does not assess a steelhead’s ability to negotiate multiple features through a stream reach given a time duration associated with a natural hydrologic event. This is discussed briefly in Section 5. In addition, NMFS has noted that the use of the methodology and related findings is generally limited to the range of flows observed and, like related investigative methodologies, is constrained in its ability to extrapolate findings to flows significantly higher than those observed (Stern, 2005). The methodology was demonstrated in the field for resource agency personnel on May 25, 2006; the methodology was circulated for comment on June 20, 2006; and agency personnel were invited but ultimately declined to participate in the field investigation.
In this study, the fish performance metrics (e.g., leaping curves), the requirements for physical site characterization, the formulas used in calculations of variables, and the mechanisms for decision-making regarding barrier passability are taken directly from Powers and Orsborn (1985). Although the elements described above are embedded within the text of the Powers and Orsborn methodology, the decision trees and data sheets included in this fish passage barrier assessment represent a synthesis

Assessment of Fish Upstream Migration at Natural Barriers in the Upper Alameda Creek Sub-Watershed
Barriers January 2010 Page 3-2
and reorganization of the materials originally presented by Powers and Orsborn. The reorganization involved arranging the information contained within Powers and Orsborn in a manner that allows for straightforward and efficient collection of data when in the field.
3.2 STUDY REACHES The study area for this assessment includes creek reaches located within SFPUC property surrounding Calaveras Dam and Alameda Creek Diversion Dam (Figure 2-1). This region is prone to landslides (Wentworth et al., 2007), some of which have potential to create fish passage barriers. Prior to initiating the field work, existing data were reviewed to determine where steelhead, when restored to the Upper Alameda Creek Sub-Watershed, might encounter potential barriers in the study area to upstream migration. The review indicated that three reaches within the study area contained potential impediments to upstream migration, and required field assessment. These include the Little Yosemite reach of Alameda Creek, the Calaveras boulder debris field below Calaveras Dam, and the landslide reach of Arroyo Hondo. Each of these study reaches is described in this section.
3.2.1 LITTLE YOSEMITE The Little Yosemite4 reach of Alameda Creek is in the Upper Alameda Creek Basin, and begins approximately 0.2 mile upstream of the confluence of Alameda and Calaveras creeks (Figure 2-1). Little Yosemite is a high gradient, approximately 0.2-mile-long section of stream channel with exposed bedrock and large boulders that present potential impediments to fish immigration (Figure 3-1). The channel gradient in the steepest sections ranges from 13 to 15 percent.
The stream channel and canyon become narrow near the upstream boundary of Little Yosemite due to a large landslide that has moved south into the stream channel from the north bank hill slope (Figure 3-2) (Nilsen, 1975a; Dibblee, 1980). The landslide extends up from the creek elevation of about 600 feet to near the ridge crest at about 1,200 feet (URS, 2009). This landslide, which may be several thousand years old, does not show any evidence of recent activity near the stream channel, but evidence of recent activity on the hillside above the channel is visible from aerial photographs. Much of the channel of Alameda Creek in the Little Yosemite reach is choked with 6-foot to greater than 50-foot-diameter boulders that are likely remains of the landslide mass (URS, 2009).
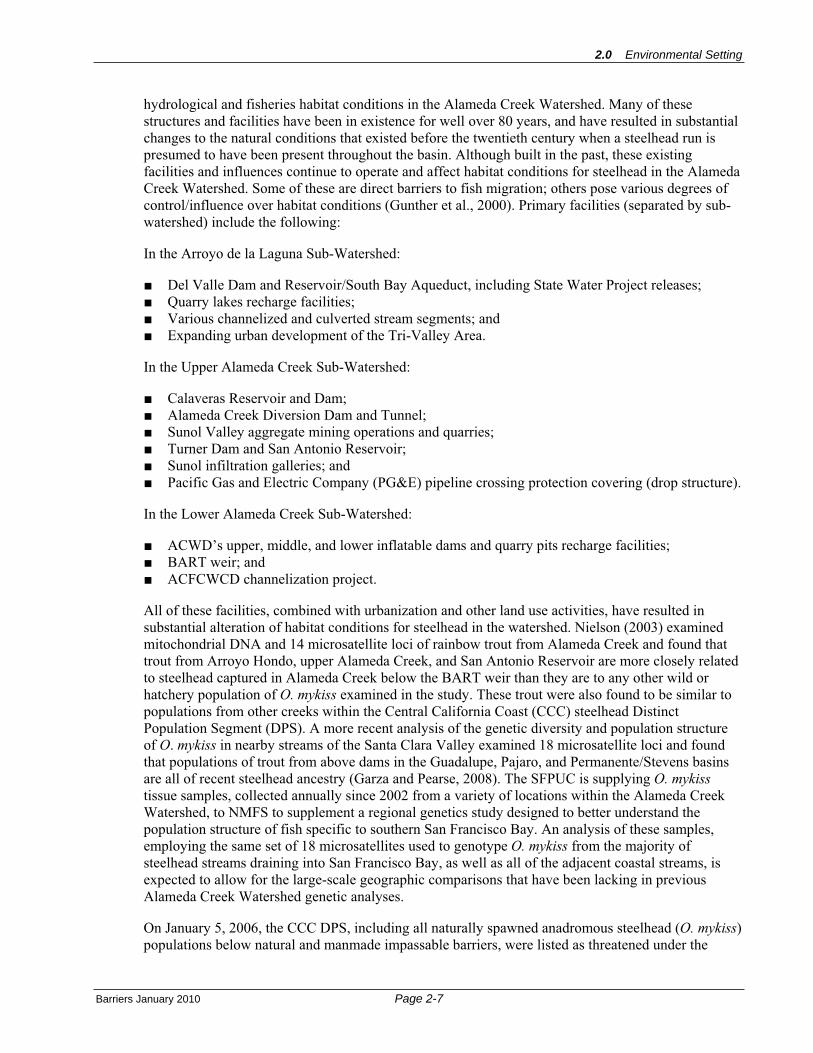
3.2.2 CALAVERAS BOULDER DEBRIS FIELD This approximately 0.4-mile-long reach of Calaveras Creek stretches from 0.3 mile downstream of the foot of Calaveras Dam to approximately 0.1 mile upstream of the confluence of Calaveras and Alameda creeks (Figure 2-1), and presents potential impediments to fish immigration. For ease of identification in this memorandum, the reach has been named “Calaveras boulder debris field” for the abundant boulders and cobbles that armor the channel throughout most of the reach (Figure 3-3). The channel gradient in the steepest sections of the reach ranges from 4 to 8 percent.
Although an ancient slide affected the right bank of Calaveras Creek within the boulder debris field reach, no large, active landslides are present within this reach. A wide talus slope of unweathered cobble to boulder-size rock debris extends up from the west bank of the creek, toward the previously operated earthfill and rock borrow area (URS, 2009) (Figure 3-4). The channel bottom is predominantly armored with boulders and cobbles but bedrock outcrops indicate that the overall gradient and base level are bedrock controlled. At some locations boulders have caused sediment to build up, which in turn have caused localized downstream erosion. Drill holes are present in some of
4 The name “Little Yosemite” has been part of the local vernacular for an unknown period of time, likely due to the reach’s steep canyon walls, high gradient, and waterfalls, and has been adopted for use in this memorandum.

A portion of the Little Yosemite reach of Alameda Creek on May 27, 2009(recreational users of Sunol Regional Wilderness in foreground)
January 2010 Figure 3-1
Photograph of a Portion of the Little Yosemite ReachAssessment of Fish Upstream Migration at
Natural Barriers in the Upper Alameda Creek Sub-WatershedTechnical Memorandum


Landslide
Study ReachDownstream Boundary
Study ReachUpstream Boundary
SFPUC LandLeased to
EBRPDSFPUC Land
SFPUC LandLeased to
EBRPD
EBRPD LandAlameda
Creek
directionof flow
900
700
800
1000
600
500
1100
1200
1300
0 400 800200
FEET
\\S02
1em
c2\g
isda
ta\P
roje
cts\
Cal
aver
as_D
am_2
6814
408\
Mxd
\Cur
rent
Wor
king
Doc
umen
ts\B
iolo
gy\F
ish_
pass
age_
stud
y\B
arrie
rs\B
arrie
rs_F
ig3-
2_LY
_Aer
ial.m
xdU
RS
Cor
p-O
akla
ndC
A-C
.Rau
man
n
Figure 3-2
Assessment of Fish Upstream Migration at Natural Barriersin the Upper Alameda Creek Sub-Watershed
Technical Memorandum
Aerial View of the Little Yosemite Reach
January 2010
Imagery source: DigitalGlobe ImageConnect Service, 4/1/2007
Ownership Boundary
Approximate Boundary of Landslide
Study Reach Boundary
Stream
Topographic Contour, 100-foot Interval

A portion of the Calaveras boulder debris field reach of Calaveras Creek on March 5, 2009 (looking downstream).
January 2010 Figure 3-3
Photograph of a Portion of theCalaveras Boulder Debris Field Reach
Assessment of Fish Upstream Migration atNatural Barriers in the Upper Alameda Creek Sub-Watershed
Technical Memorandum


Talus SlopeUSGS Gage 11173500
12-foot Waterfall
Study ReachUpstream Boundary
Study ReachDownstream Boundary
SFPUC Land
SFPUCLand
Leased toEBRPD
SFPUC LandLeased to
EBRPD
Calaver
asCree
k
direct
ionof
flow
700
600
500
800
900
0 200 400100
FEET
\\S02
1em
c2\g
isda
ta\P
roje
cts\
Cal
aver
as_D
am_2
6814
408\
Mxd
\Cur
rent
Wor
king
Doc
umen
ts\B
iolo
gy\F
ish_
pass
age_
stud
y\B
arrie
rs\B
arrie
rs_F
ig3-
4_C
BD
F_A
eria
l.mxd
UR
SC
orp
-Oak
land
CA
-C.R
aum
ann
Figure 3-4
Assessment of Fish Upstream Migration at Natural Barriersin the Upper Alameda Creek Sub-Watershed
Technical Memorandum
Aerial View of the Calaveras Boulder Debris Field Reach
January 2010
Imagery source: DigitalGlobe ImageConnect Service, 4/1/2007
Ownership Boundary
Approximate Boundary of Talus Slope
Study Reach Boundary
Stream
Topographic Contour, 100-foot Interval


3.0 Barrier Assessment Methodology
Barriers January 2010 Page 3-11
the boulders, indicating that some rocks in the channel were generated in the upslope rock borrow area. The smaller rocks present on the talus slope and in Calaveras Creek below the borrow area are less weathered than the larger boulders present in the reach, which are well eroded by flow. The largest boulders appear to have weathered out of the native rock, are present upstream and downstream of the borrow area, and do not appear to be related to the rock borrow operations.
A 12-foot vertical step is present in the channel about 200 feet below the upstream limit of the study reach. The step has formed where stream flow has eroded a jointed portion of bedrock in the channel bottom and the eroded area has backfilled with boulders that are wedged into the eroded slot (URS, 2009). Several very large boulders or eroded bedrock remnants trap much of the alluvium in the channel there, creating an approximately 12-foot waterfall when surface flows are present (Figure 3-4). Although not evaluated in detail, this waterfall appears to be a natural feature.
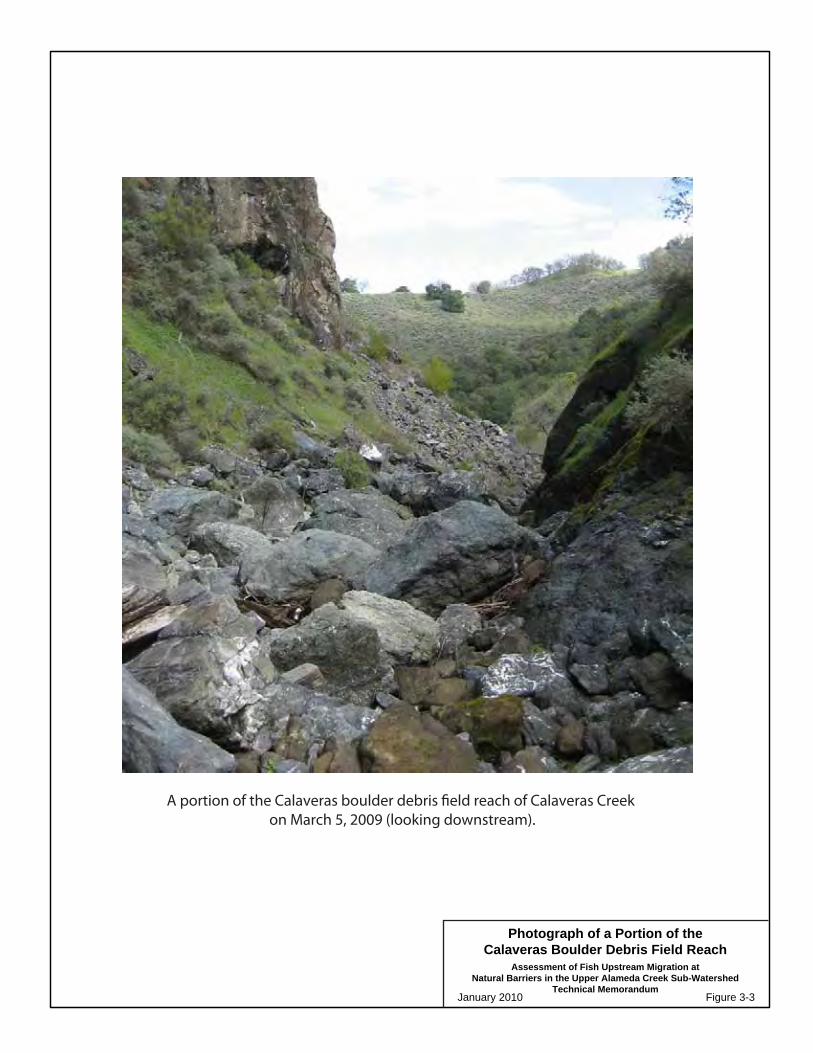
3.2.3 ARROYO HONDO LANDSLIDE The Arroyo Hondo landslide reach is located approximately 1.8 miles upstream from the confluence of Arroyo Hondo and the full pool water surface elevation of Calaveras Reservoir (Figure 2-1). At this location (Figure 3-5 [a]) two landslides converge on Arroyo Hondo (Figure 3-6). Much of the channel is choked with large, 6-foot to greater than 50-foot-diameter boulders, creating potential impediments to fish immigration, including an approximately 15-foot waterfall. The channel gradient in the steepest sections is between 13 and 16 percent.
Of the two landslides, the one that extends approximately 2,000 feet up the north canyon wall from the creek elevation is the larger (Figure 3-6). Many of the boulders that are present in the bottom of the canyon were part of this landslide (Nilsen, 1975b; Dibblee, 1973), which shows signs of recent activity over most of its length and continues to be unstable (URS, 2009). Another much smaller, but still large landslide is present on the south side of the stream; this second landslide extends up the south canyon slope to an elevation of about 1,500 feet. While many of the large boulders resting in the creek channel at this location were likely originally part of these landslide masses, the two largest “boulders” that create an approximately 15-foot-high waterfall may be bedrock outcrops.
The large northern landslide (and possibly the smaller southern landslide as well) appears to have been initiated by stream erosion at the toe of the slope, probably many thousands of years ago (URS, 2009). Farther upslope portions of the slide have sequentially become destabilized as adjacent downslope soil and rock materials have begun to move. The toes of both of these landslides are actively creeping down into the creek channel where the finer soil and weathered rock get washed away during periods of high stream discharge (Figure 3-5 [b]). The rocks and boulders currently in the channel appear to be providing a limited degree of buttressing against the toe of the northern slide.
3.3 SURVEY DATES, PERSONNEL, AND FLOWS This section discusses the survey dates, and the personnel who were involved in the field assessments conducted for this study (Section 3.3.1). Stream flow present in the study reaches at the time of the field assessments is also analyzed and presented in context (Section 3.3.2).
3.3.1 SURVEY DATES AND PERSONNEL URS and HDR|SWRI visited all of the study reaches on February 23, 2006. This initial reconnaissance was intended to familiarize the scientists who would be performing the barrier assessments with the study reaches. The Little Yosemite reach was surveyed on March 13 and June 23, Calaveras boulder debris field on March 13, and Arroyo Hondo landslide on February 23 (Table 3-1).
January 2010 Figure 3-5
Photographs of the Arroyo HondoLandslide Reach
Assessment of Fish Upstream Migration atNatural Barriers in the Upper Alameda Creek Sub-Watershed
Technical Memorandum
The landslide reach of Arroyo Hondo viewed from downstream on February 3, 2006, (a) with the smaller of two converging landslides visible on the south canyon wall, and (b) the unstable toe of the north landslide
where it meets Arroyo Hondo.
(a)
(b)

North Landslide
SouthLandslide
15-foot Waterfall
aRecently ErodedLandslide Toe
SFPUC LandArro
yoH
ondo
dire
ctio
nof
flow
PrivateLand
2400
2000
2300
2200
2100
2500
1800
1900
1100
1700
1600
1200
1300
1400
1500
2600
2700
2800
1000
900
2900
3000
1300
1100
2400
1200
1000
1400
0 400 800200
FEET
\\S02
1em
c2\g
isda
ta\P
roje
cts\
Cal
aver
as_D
am_2
6814
408\
Mxd
\Cur
rent
Wor
king
Doc
umen
ts\B
iolo
gy\F
ish_
pass
age_
stud
y\B
arrie
rs\B
arrie
rs_F
ig3-
6_A
H_A
eria
l.mxd
UR
SC
orp
-Oak
land
CA
-C.R
aum
ann
Figure 3-6
Assessment of Fish Upstream Migration at Natural Barriersin the Upper Alameda Creek Sub-Watershed
Technical Memorandum
Aerial View of the Arroyo Hondo Landslide Reach
January 2010
Imagery source: DigitalGlobe ImageConnect Service, 4/1/2007
Ownership Boundary
Approximate Boundary of Landslide
Stream
Topographic Contour, 100-foot Interval

3.0 Barrier Assessment Methodology
Barriers January 2010 Page 3-15
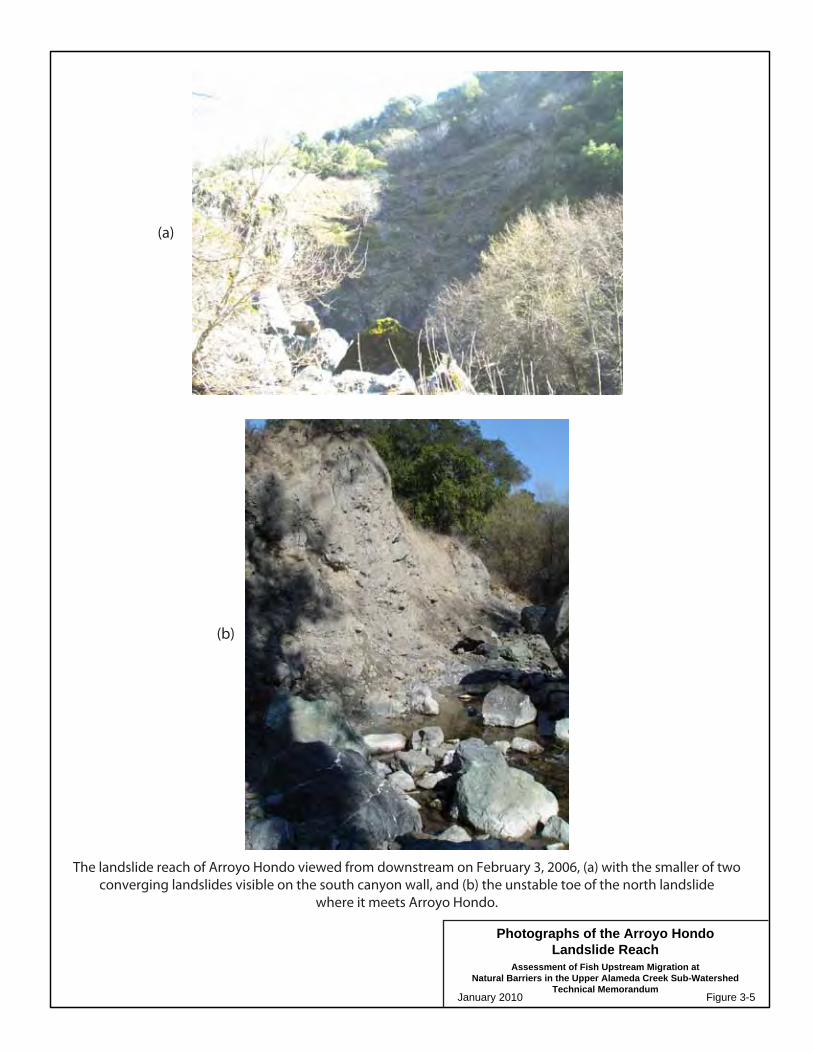
Table 3-1 Survey Dates and Recorded Daily Average Flows Study Reach Survey Dates (2006) Flows (cfs)
Little Yosemite March 13 and June 23 98 and 2.5
Calaveras Boulder Debris Field March 13 0.1
Arroyo Hondo Landslide February 23 17
Reconnaissance visits were made to the Little Yosemite and Calaveras Boulder Debris Field sites by URS and HDR on May 27, 2009.
3.3.2 STREAM FLOW DURING FIELD ASSESSMENTS Stream flow can affect the passability of potential barriers (Section 5), so it is necessary to contextualize flow at the time of the field assessments relative to historical and expected future flow that may be expected to occur during the steelhead immigration period. For the purposes of this analysis, the steelhead immigration period is defined as December through April (Table 3-2).
Table 3-2 Steelhead Passage Element Timing
Month
Passage Element Oct Nov Dec Jan Feb Mar Apr May Jun Jul Aug Sep
Adult Immigrationa
Juvenile Emigrationb
Post-spawn Adult Emigrationc
Sources: a Gunther et al., 2000; Moyle, 2002; Bjorkstedt et al., 2005 b Gunther et al., 2000; SFPUC, 2004; Bjorkstedt et al., 2005; Brian Sak, pers. comm., 2009a c Gunther et al., 2000
The daily average flow recorded at each of the most relevant USGS gages at the time of the field surveys are shown in Table 3-1, and described below.
LITTLE YOSEMITE During the field reconnaissance, it was determined that the passability of potential barriers in the Little Yosemite reach might be affected by variations in flow that could be expected to occur through that reach during the adult steelhead immigration period. Therefore, an effort was made to conduct the field surveys at Little Yosemite during flows that would help establish the frequency of passage opportunities at a given barrier, and help describe the range of flows at which a given barrier may be passable. It was determined that evaluation during both moderate and low flows would be possible, and would provide the most useful information. While evaluation during extremely high flows that occur on fewer than 1 percent of days during the adult immigration period (i.e., daily average flows >600 cfs) would also be valuable (see Section 5), the methodology employed in this study requires observers to enter the stream channel and collect measurements, an activity that would jeopardize the safety of the scientists conducting the survey if attempted during high flows. Prior to initiating the field assessment, it was determined that one assessment each should be conducted during the highest and lowest 15 percent of daily average flows recorded during the adult steelhead immigration period.
Assessment of Fish Upstream Migration at Natural Barriers in the Upper Alameda Creek Sub-Watershed
Barriers January 2010 Page 3-16
USGS surface-water daily statistics were used to characterize flow within the vicinity of Little Yosemite during the adult steelhead immigration period. The aggregated flow data from Alameda Creek (USGS 11172945)5 for its period of record is presented in Figure 3-7 (a). Summary statistics of the daily average flow are shown for each day of the year, providing an indication of the range of daily flows measured. Daily average flows during the December through April steelhead immigration period were ranked to determine that the lowest 15 percent ranged from near zero to 2.5 cfs, and the highest 15 percent ranged from 90 cfs to 1,200 cfs. At the time of the field survey on March 13, the daily average flow recorded above Little Yosemite was 98 cfs (Figure 3-7 [a]). Daily average flows are expected to exceed 98 cfs on 14 percent of days during the December-through-April steelhead immigration period (Figure 3-7 [b]). The daily average flow recorded on June 23 was 2.5 cfs. Daily average flows are expected to equal or exceed 2.5 cfs on 85 percent of days during the adult immigration period. Alternatively stated, daily average flows are expected to be less than 2.5 cfs on 15 percent of December-April days.
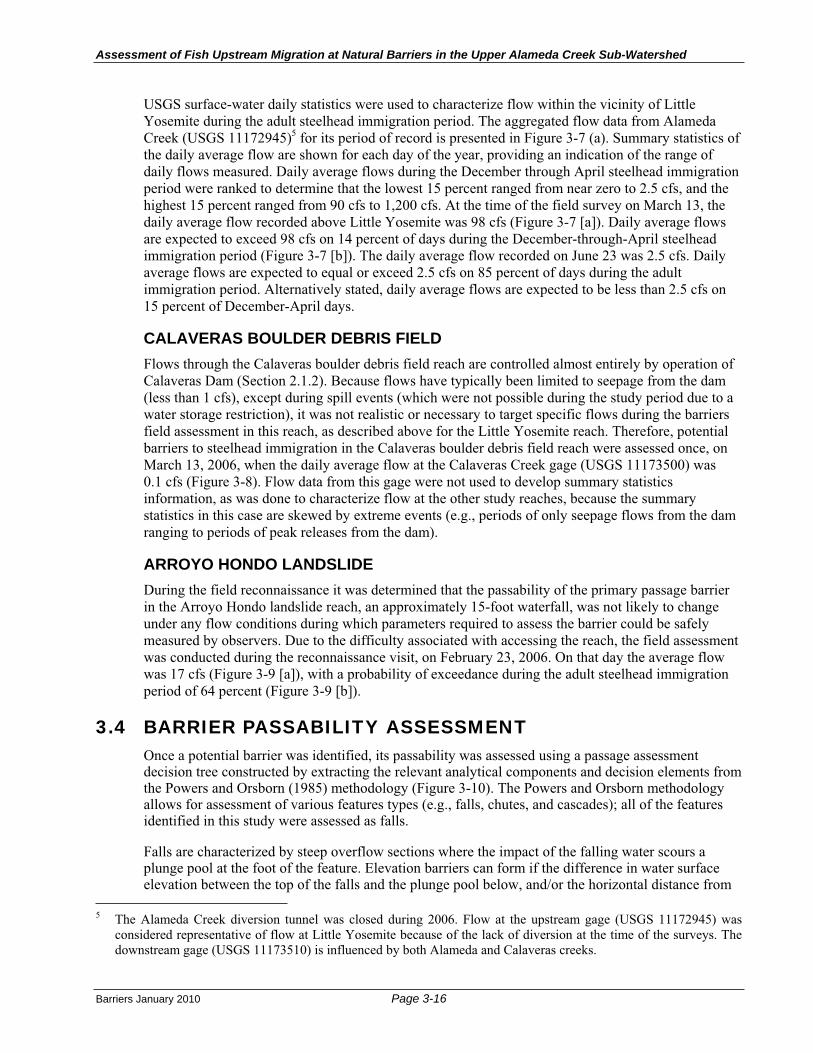
CALAVERAS BOULDER DEBRIS FIELD Flows through the Calaveras boulder debris field reach are controlled almost entirely by operation of Calaveras Dam (Section 2.1.2). Because flows have typically been limited to seepage from the dam (less than 1 cfs), except during spill events (which were not possible during the study period due to a water storage restriction), it was not realistic or necessary to target specific flows during the barriers field assessment in this reach, as described above for the Little Yosemite reach. Therefore, potential barriers to steelhead immigration in the Calaveras boulder debris field reach were assessed once, on March 13, 2006, when the daily average flow at the Calaveras Creek gage (USGS 11173500) was 0.1 cfs (Figure 3-8). Flow data from this gage were not used to develop summary statistics information, as was done to characterize flow at the other study reaches, because the summary statistics in this case are skewed by extreme events (e.g., periods of only seepage flows from the dam ranging to periods of peak releases from the dam).
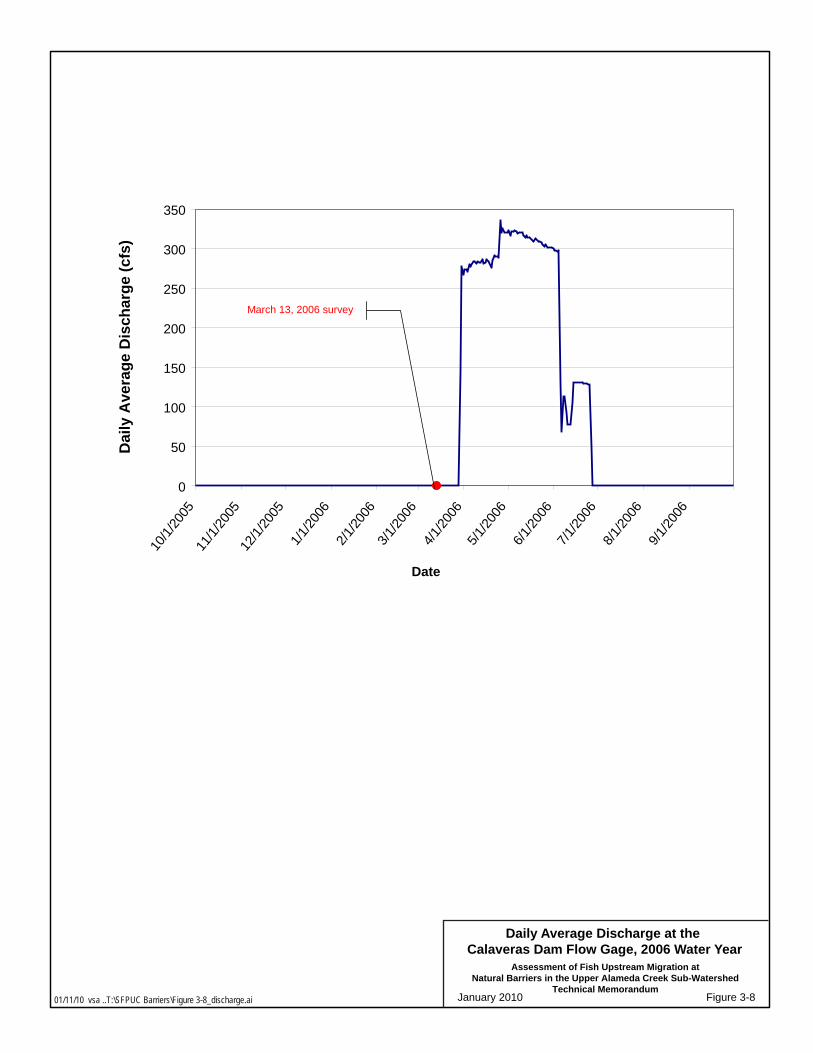
ARROYO HONDO LANDSLIDE During the field reconnaissance it was determined that the passability of the primary passage barrier in the Arroyo Hondo landslide reach, an approximately 15-foot waterfall, was not likely to change under any flow conditions during which parameters required to assess the barrier could be safely measured by observers. Due to the difficulty associated with accessing the reach, the field assessment was conducted during the reconnaissance visit, on February 23, 2006. On that day the average flow was 17 cfs (Figure 3-9 [a]), with a probability of exceedance during the adult steelhead immigration period of 64 percent (Figure 3-9 [b]).
3.4 BARRIER PASSABILITY ASSESSMENT Once a potential barrier was identified, its passability was assessed using a passage assessment decision tree constructed by extracting the relevant analytical components and decision elements from the Powers and Orsborn (1985) methodology (Figure 3-10). The Powers and Orsborn methodology allows for assessment of various features types (e.g., falls, chutes, and cascades); all of the features identified in this study were assessed as falls.
Falls are characterized by steep overflow sections where the impact of the falling water scours a plunge pool at the foot of the feature. Elevation barriers can form if the difference in water surface elevation between the top of the falls and the plunge pool below, and/or the horizontal distance from
5 The Alameda Creek diversion tunnel was closed during 2006. Flow at the upstream gage (USGS 11172945) was considered representative of flow at Little Yosemite because of the lack of diversion at the time of the surveys. The downstream gage (USGS 11173510) is influenced by both Alameda and Calaveras creeks.

January 2010
Summary Statistics and Exceedance Probabilityfor Alameda Creek Flow
Assessment of Fish Upstream Migration atNatural Barriers in the Upper Alameda Creek Sub-Watershed
Technical MemorandumFigure 3-7
Summary Statistics for Flow at Alameda Creek above ACDD (1995-2008)
0
200
400
600
800
1,000
1,200
1,400
10/1 11/1 12/1 1/1 2/1 3/1 4/1 5/1 6/1 7/1 8/1 9/1
Date
Dai
ly A
vera
ge F
low
(cfs
)
Maximum Average March 13, 2006 flowMinimum Median June 23, 2006 flow
March 13, 2006 survey (98 cfs)
June 23, 2006survey (2.5 cfs)
Probability of ExceedanceDaily Average Flow, December to April, at Alameda Creek above ACDD
0%
10%
20%
30%
40%
50%
60%
70%
80%
90%
100%
0 100 200 300 400 500 600 700 800 900 1,000 1,100 1,200
Daily Average Flow (cfs)
Prob
abili
ty (%
)
14%
98 cfs
14% of the December to April daily average flow values are greater than 98 cfs
(a)
(b)
Source Data: USGS 11172945 Alameda Creek above Diversion Dam near Sunol
January 2010 Figure 3-8
Assessment of Fish Upstream Migration atNatural Barriers in the Upper Alameda Creek Sub-Watershed
Technical Memorandum
0
50
100
150
200
250
300
350
10/1/
2005
11/1/
2005
12/1/
2005
1/1/20
062/1
/2006
3/1/20
064/1
/2006
5/1/20
066/1
/2006
7/1/20
068/1
/2006
9/1/20
06
Date
Dai
ly A
vera
ge D
isch
arge
(cfs
)
March 13, 2006 survey
Daily Average Discharge at the Calaveras Dam Flow Gage, 2006 Water Year
01/11/10 vsa ..T:\SFPUC Barriers\Figure 3-8_discharge.ai
January 2010
Summary Statistics and Exceedance Probabilityfor Arroyo Hondo Flow
Assessment of Fish Upstream Migration atNatural Barriers in the Upper Alameda Creek Sub-Watershed
Technical MemorandumFigure 3-9
Summary Statistics for Flow at Arroyo Hondo (1969-1981 and 1995-2008)
0
500
1,000
1,500
2,000
2,500
3,000
3,500
4,000
10/1 11/1 12/1 1/1 2/1 3/1 4/1 5/1 6/1 7/1 8/1 9/1
Date
Dai
ly A
vera
ge F
low
(cfs
)
Maximum Average Median Minimum February 23, 2006 flow
February 23, 2006 survey (17 cfs)
Probability of ExceedanceDaily Average Flow, December to April, at Arroyo Hondo
0%
10%
20%
30%
40%
50%
60%
70%
80%
90%
100%
0 500 1,000 1,500 2,000 2,500 3,000 3,500 4,000
Daily Average Flow (cfs)
Prob
abili
ty (%
) 64 %
17 cfs
64% of the December to April daily average flow values are greater than 17 cfs
(a)
(b)
Source Data: USGS 11173200 Arroyo Hondo near San Jose, CA


1. Is the vertical change in water surface elevation(H) greater than the maximum height of fish's leap(HL) where L = 90°?
Yes No
Stop: Elevationbarrier
2. Is the horizontal distance from the crestof the falls to the standing wave (X) greaterthan the horizontal distance of the fish'sleap at the highest point of the leap (XL)?
Landing conditions should beanalyzed as a chute (seeSteps 1-4 in Chute PassageAssessment)
Yes
Yes No
3. Does superimposition of the watersurface profile on fish leaping curvessuggest that the barrier is passable?
No
Stop: Horizontaldistance barrier
Yes No
Conditions not optimal for leaping.Reevaluate passability considering effectsof reduced propulsive power of fish's tailunder sub-optimal plunge pool conditions(e.g., estimate percentage leaping capacityreduction). Is barrier considered passablefollowing reevaluation based on reducedpropulsive power alone?
6. Using best professional judgment, is it the opinionof the team that the sum of the total effects on fish(turbulence, reduced propulsive power, and reducedangle from Step 5) resulting from sub-optimal plungepool conditions still result in the potential barrierbeing considered passable?
YesNo
Stop: Plungepool barrier
4. Is the depth of penetration of the falling water (dp)greater than the depth of the plunge pool (dpp) (i.e.,does the falling water impact the bottom of the plungepool)?
YesNo
Conditions not optimal for leaping. Reevaluate passabilityconsidering effects of turbulence in disorienting fish undersub-optimal plunge pool conditions (e.g., estimate percentage leaping capacity reduction). Is barrier considered passable following reevaluation based on effects of turbulence alone?
5. Is the length of the fish(LF) greater than the depthof the plunge pool (dpp)?
Calculate the maximumleaping angle if the fishsubmerges itself fully andsuperimpose the leapingangle on the leaping curves
Yes
No
Stop: Plungepool barrier
Yes
No
Stop: Plungepool barrier
7. Is the exit slope at the landingcondition (Se) positive or negative?
NegativePositive
8. Is critical depth (dc) located too farupstream for fish to reach during landing?
dc is at crest. Measure or calculate dc andmean velocity at critical depth (Vc).
YesNo
Landing conditions should be analyzed as a chute. 9. Is df > dc?
Yes No
Conditions not optimal for propulsion upon landing. Reevaluatepassability considering effects of reduced propulsive power offish's tail under sub-optimal landing conditions (e.g., estimatepercentage propulsion capacity reduction).
Is the mean velocity at criticaldepth (Vc) > the sustained fishswimming speed (VFS)?
YesNo
10. Is the combined effect of the total percentage of reduced leaping (Step 6), the re-evaluation conclusions incorporating turbulence, propulsion, and leaping angle(Step 6), and the percentage reduced propulsion (Step 9) enough combinedreduction in leaping capability and propulsion to suggest that the potential barrieris still passable?
Yes No
Passable Impassable
Decision Tree for DeterminingPassability of a Falls Barrier
Assessment of Fish Upstream Migration atNatural Barriers in the Upper Alameda Creek Sub-Watershed
Technical MemorandumJanuary 2010 Figure 3-10


3.0 Barrier Assessment Methodology
Barriers January 2010 Page 3-23
the plunge pool to the falls crest, exceed the leaping capabilities of the fish. In addition, the leaping efficiency of fish at a falls barrier depends on plunge pool conditions (e.g., depth, turbulence) at the takeoff point and landing conditions at the top of the falls. For example, if a leaping fish reaches the top of the falls successfully, it could potentially be swept back over the crest of the falls due to high water velocities and/or shallow depths at the landing point above the crest of the falls (Figure 3-11). In order to be passable, the distance between the takeoff point and a suitable landing point must not exceed the leaping ability of the fish.
Figure 3-11 Conceptual Cross-Section Model of Falls
Source: Powers and Orsborn (1985)
Notes:
A = point on fish exit bed slope where critical depth occurs; B = elevation of crest; C = farthest point upstream on bed of plunge pool; D = point just downstream of falling water (or standing wave) on bed of plunge pool; dc = critical depth (point A) dpp = depth in the plunge pool dp = depth the falling water plunges FH = fall height H = change in water surface elevation LF = length of fish Se = fish exit slope Sp = fish passage slope X = horizontal distance from the crest (point B) to standing wave (point D)
The falls assessment decision tree (Figure 3-10) is designed to simplify the assessment process for falls by sequencing decision making so that only one specific decision is made at a time. Each step in the passage assessment decision tree is a “yes or no” question that is clearly stated and based on quantitative metrics whenever possible. Decision tree questions logically break down the barrier into its physical component parts, allowing a systematic, repeatable, and comparable evaluation of each

Assessment of Fish Upstream Migration at Natural Barriers in the Upper Alameda Creek Sub-Watershed
Barriers January 2010 Page 3-24
potential barrier. An advantage to sequentially evaluating each component of a barrier is that if the answer to the first decision tree question suggests that a barrier is impassable, the evaluation is terminated and additional questions need not be addressed to determine barrier passability. Each step in the decision tree is designed to be executed sequentially until the result of “Stop” or “Passable” is reached. The decision process initially presented by Powers and Orsborn (1985) eliminates the inefficiency of collecting data that are not required to complete the evaluation of barrier passability.
To make each decision represented in the falls assessment decision tree, various metrics that physically characterize the potential barrier must be measured or calculated. The decision tree is accompanied by a data sheet that mimics the sequential steps in the tree (Appendix A). The data sheet describes the metrics and decisions required to complete the fish passage assessment and provides the information needed to complete the calculations to arrive at the answer to each question.
3.4.1 PHYSICAL METRICS Physical metrics collected during each potential barrier assessment characterize each barrier and may include physical attributes such as vertical height, horizontal width, depth of staging pool, and depth of landing site (Table 3-3). These metrics may change depending on flow conditions, and calculations can be repeated for all measured flow conditions to evaluate passage at a variety of flows. Calculated metrics, as opposed to metrics measured directly, are used to describe an attribute that is difficult to measure directly but can be easily estimated or directly calculated using other metrics. An example of a calculated metric would be slope (m), which is calculated after measuring the horizontal (x) and vertical (y) components of a barrier using the equation:
xym
Table 3-3 Parameters Studied to Physically Characterize Potential Barriers
ParameterData
Notation Definition
Vertical Height HThe change in water surface elevation between the anticipated leaping site and the anticipated landing site
Horizontal Width XThe horizontal distance between the anticipated leaping site and the anticipated landing site
Depth of Staging Pool dpp The depth of the takeoff pool where the leap originates
Depth of Landing Site dc The depth of the location anticipated to serve as the landing site
3.4.2 FISH PERFORMANCE METRICS Variables that required definition prior to analysis were determined through a review of the literature or site-specific data sets from other studies. These types of variables include the coefficient of fish condition and fish speed. The definition of each variable, as described by Powers and Orsborn (1985), and the rationale for assignment of a numerical value to each variable is discussed below.
COEFFICIENT OF FISH CONDITION The coefficient of fish condition (Cfc) is a relative measure of the physiological state of the fish during its upstream migration. The barrier assessment methodology uses a relative scale of fish

3.0 Barrier Assessment Methodology
Barriers January 2010 Page 3-25
condition to estimate the physical performance capabilities (i.e., height of leap, velocity of maximum burst speed) of the fish at the time of passage. From a study conducted on salmon6 (O. kisutch and O. keta) swimming up a high-velocity chute, it was concluded that in general the salmon were swimming at 50 percent, 75 percent, or 100 percent of their maximum burst speeds, depending on the condition of the fish (Bell, 1973; cited in Powers and Orsborn, 1985) indexed by freshwater migration distance. Descriptions of fish condition and associated values for Cfc are provided in Table 3-4.
Table 3-4 Description of Fish Condition and Associated Numeric Value for
Coefficient of Fish Condition (Cfc)
Fish Condition Coefficient
(Cfc)
Bright; fresh out of saltwater or still a long distance from spawning grounds; spawning colors not yet developed
1.00
Good; in the river for a short time; spawning colors apparent but not fully developed; still migrating upstream
0.75
Poor; in the river for a long time; full spawning colors developed and fully mature; very close to spawning grounds
0.50
Source: Powers and Orsborn (1985)
Steelhead entering Alameda Creek from December through April exhibit winter-run characteristics.Winter-run steelhead typically enter freshwater as maturing fish (indicated by a pink stripe along the lateral line and pink coloration on the operculum) that generally spawn relatively soon after arriving in freshwater (Barnhart, 1986). Little Yosemite (Section 3.2.1) is approximately 25 miles upstream of San Francisco Bay. Assuming that adult steelhead are migrating at the upper end of reported migration rates (22 miles per day [English et al., 2001]), it would take adult steelhead a little over 1 day to migrate the 25 miles to Little Yosemite. Based on this migration rate, photos of two adult steelhead attempting to migrate past the BART weir during March 2006 (Figure 3-12), a coefficient of condition for adult steelhead entering Alameda Creek, and the definitions of the coefficients of fish condition in Table 3-1, the “good” condition (Cfc = 0.75) appears to be the most reasonable descriptor of the condition to be expected of adult steelhead potentially arriving at the potential barriers assessed in this memorandum.
FISH SPEED Depending on the extent of the calculations required at a given barrier, three categories of fish swimming velocities may potentially be used in this analysis: sustained, prolonged, and burst (Hoar and Randall, 1978, as cited in Powers and Orsborn, 1985). Sustained swimming velocities are defined as the speed that a fish can maintain for extended periods without physiological stress or fatigue. Prolonged speeds are defined as activities lasting 15 seconds to 200 minutes that ultimately result in fatigue, and burst speeds are defined as swimming velocities that cause fatigue in 15 seconds or less. Powers and Orsborn (1985) use values for swimming velocities reported by Bell (1973) and described in Table 3-5. Powers and Orsborn (1985) and Bell (1973) recommend a 10-second burst speed duration (time to fatigue).
The uppermost value in the range of reported speeds for anadromous steelhead in each category was chosen for analysis, thereby representing the individuals with the greatest leaping capacity. For example, the burst speed used in this analysis was 26.5 feet per second (fps).
6 No such data was identified for O. mykiss so these values recorded for closely related Oncorhynchus species are used as surrogate.
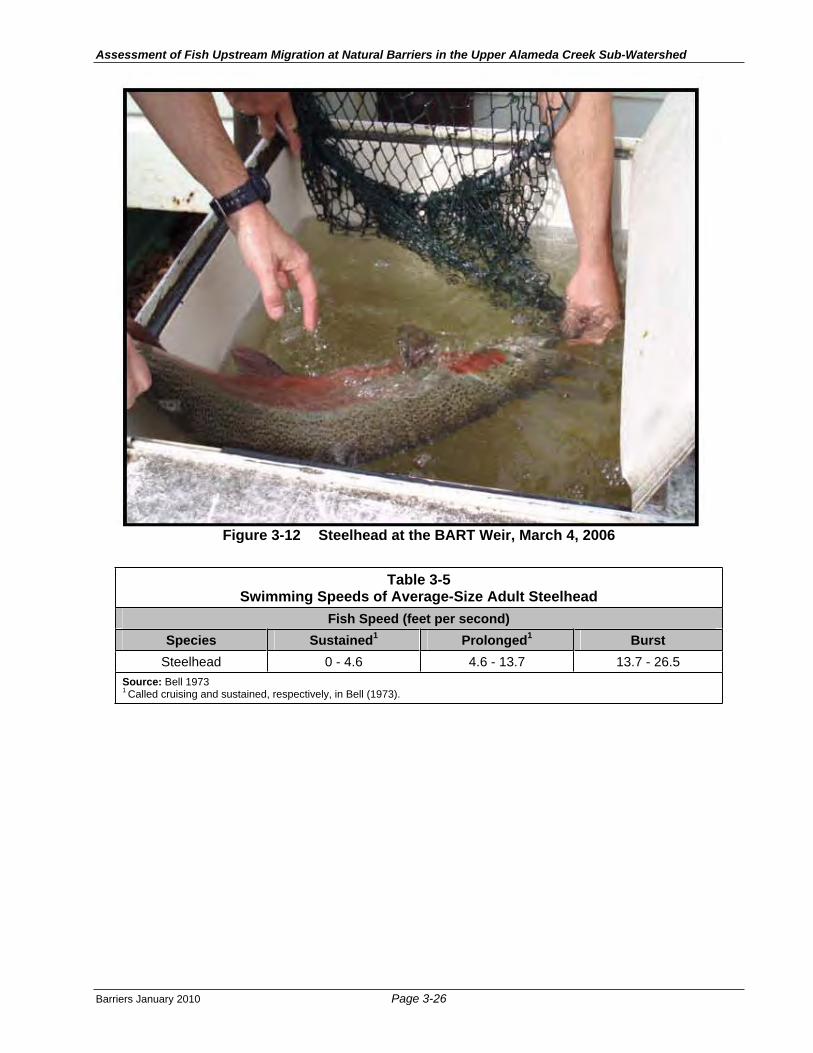
Assessment of Fish Upstream Migration at Natural Barriers in the Upper Alameda Creek Sub-Watershed
Barriers January 2010 Page 3-26
Figure 3-12 Steelhead at the BART Weir, March 4, 2006
Table 3-5 Swimming Speeds of Average-Size Adult Steelhead
Fish Speed (feet per second) Species Sustained1 Prolonged1 Burst
Steelhead 0 - 4.6 4.6 - 13.7 13.7 - 26.5 Source: Bell 1973 1 Called cruising and sustained, respectively, in Bell (1973).

4.0 Study Results
Barriers January 2010 Page 4-1
4 RESULTSIn order to provide useful information to steelhead restoration efforts and inform related assessments of the feasibility of creating steelhead passage at Calaveras Dam and Alameda Creek Diversion Dam (Section 1.2), the three study reaches (Section 3.2) were assessed for steelhead passage using the methodology described in Sections 3.4 and 3.5. Thirteen potential impediments to adult steelhead immigration were identified in Alameda Creek, Calaveras Creek, and Arroyo Hondo. Eleven of the potential barriers identified are in the Little Yosemite reach (Figure 4-1), and one each is in the reaches of the Calaveras boulder debris field (Figure 4-2) and Arroyo Hondo landslide (Figure 4-3). Additional description of the study reaches, including relevant geological information, is provided in Section 3.2, and detailed descriptions of stream flow at the time of the field assessments is provided in Section 3.3.2. This section presents the results from assessments of the potential fish passage barriers in each of the three study reaches.
4.1 LITTLE YOSEMITE The Little Yosemite reach of Alameda Creek (Section 3.2.1) is located in the Upper Alameda Creek Basin (Section 2.1.1). This 0.2-mile-long reach contains a barrier complex composed of a series of boulder cascades, turbulent cascades, and falls. Hydraulic conditions affecting upstream passage through the reach were evaluated at 11 potential impediments during creek flows of 98 and 2.5 cfs (see Section 3.3). Geographic coordinates of the 11 potential impediments are provided in Table 4-1 and are illustrated in Figure 4-1. The ability of fish to ascend potential passage barriers was evaluated based on the height of each step in the barrier complex, the distance from the takeoff point below the crest of the falls to the landing point at the crest of the falls, and the estimated amount of entrained air in the takeoff pools below passage features produced by surface turbulence, which can diminish the leaping performance of the fish.
Due to field team safety constraints from the high water velocities, water depth, and turbulence within the stream channel during the March 13, 2006 data collection, the team was unable to accurately measure some of the assessed features, or to collect water velocity measurements at the takeoff and landing locations of the potential passage barriers evaluated. Highly turbulent flow conditions are not conducive to accurate readings from water velocity meters because of the nondirectional nature of the flows that are produced by turbulence. For these reasons, the passability of barriers on March 13 was estimated visually using the decision tree shown in Figure 3-10 as a guide. Because water velocity information was not available for the March 13 assessment, and because low water velocities during the June 23 field assessment would be expected to have only a negligible effect on fish leaping ability, water velocity was not subtracted from the fish leaping performance estimates. (Water velocity would normally be factored into the calculations in Step 2 [Figure 3-10; Section 4.1.1; Appendix A], reducing the value calculated for XL, the horizontal leaping distance achieved by the fish at its maximum height.)
Of the 11 features surveyed, eight features (Features 1 through 8) met the criteria representing passable conditions during both field assessments (Figure 4-4; Table 4-1), while Features 9, 10, and 11 required more detailed analyses to determine passability (Figures 4-5, 4-9, and 4-11). Summary information from the studies of Features 9, 10, and 11 is presented in the following sections.

Figure 4-1
Assessment of Fish Upstream Migration at Natural Barriersin the Upper Alameda Creek Sub-Watershed
Technical Memorandum
Barrier Assessment Results for Little Yosemite
\\S02
1em
c2\g
isda
ta\P
roje
cts\
Cal
aver
as_D
am_2
6814
408\
Mxd
\Cur
rent
Wor
king
Doc
umen
ts\B
iolo
gy\F
ish_
pass
age_
stud
y\B
arrie
rs\B
arrie
rs_F
ig4-
1_R
esul
ts_L
Y.m
xdU
RS
Cor
p-O
akla
ndC
A-C
.Rau
man
n
January 2010
Study ReachDownstream Boundary
Study ReachUpstream Boundary
SFPUC LandLeased to
EBRPD
SFPUCLand
SFPUC LandLeased to
EBRPD
EBRPD Land
Alameda
Creek
directionof flow
9
8
7
65
4
3
2
1
11
10
Study Reach Boundary
Evaluated Fish Passage Feature
Impassable* Fish Barrier
Stream
Ownership Boundary
0 200 400100
FEET
Imagery source: DigitalGlobe ImageConnect Service, 4/1/2007
*Impassable at daily average flow of 2.5 and 98 cfs

Figure 4-2
Assessment of Fish Upstream Migration at Natural Barriersin the Upper Alameda Creek Sub-Watershed
Technical Memorandum
Barrier Assessment Results for Calaveras Boulder Debris Field
\\S02
1em
c2\g
isda
ta\P
roje
cts\
Cal
aver
as_D
am_2
6814
408\
Mxd
\Cur
rent
Wor
king
Doc
umen
ts\B
iolo
gy\F
ish_
pass
age_
stud
y\B
arrie
rs\B
arrie
rs_F
ig4-
2_R
esul
ts_C
BD
F.m
xdU
RS
Cor
p-O
akla
ndC
A-C
.Rau
man
n
January 2010
Study ReachUpstream Boundary
SFPUC Land
12-footWaterfall
0.3 Mile to Study ReachDownstream Boundary
Calaveras Creek
direction of flow
Study Reach Boundary
Evaluated Fish Passage Feature
Impassable* Fish Barrier
0 100 20050
FEET
Imagery source: DigitalGlobe ImageConnect Service
*Impassable at daily average flow of 2.5 and 98 cfs

Figure 4-3
Assessment of Fish Upstream Migration at Natural Barriersin the Upper Alameda Creek Sub-Watershed
Technical Memorandum
Barrier Assessment Results for Arroyo Hondo Landslide
\\S02
1em
c2\g
isda
ta\P
roje
cts\
Cal
aver
as_D
am_2
6814
408\
Mxd
\Cur
rent
Wor
king
Doc
umen
ts\B
iolo
gy\F
ish_
pass
age_
stud
y\B
arrie
rs\B
arrie
rs_F
ig4-
3_R
esul
ts_A
H.m
xdU
RS
Cor
p-O
akla
ndC
A-C
.Rau
man
n
January 2010
15-footWaterfall
SFPUC Land
Arro
yoH
ondo
dire
ctio
nof
flow
Evaluated Fish Passage Feature
Impassable* Fish Barrier
0 100 20050
FEET
Imagery source: DigitalGlobe ImageConnect Service, 4/1/2007
*Impassable at daily average flow of 2.5 and 98 cfs

Example photographs of one (Feature 2) of the readily passable features (Features 1-8)evaluated in the Little Yosemite reach of Alameda Creek (a) on March 13 and (b) June 23, 2006.
January 2010 Figure 4-4
Photographs of Little Yosemite Feature 2Assessment of Fish Upstream Migration at
Natural Barriers in the Upper Alameda Creek Sub-WatershedTechnical Memorandum
(a)
(b)

Photographs of Feature 9 in the Little Yosemite reach of Alameda Creek,on (a) March 13 and (b) June 23, 2006.
January 2010 Figure 4-5
Photographs of Little Yosemite Feature 9Assessment of Fish Upstream Migration at
Natural Barriers in the Upper Alameda Creek Sub-WatershedTechnical Memorandum
(a)
(b)

4.0 Study Results
Barriers January 2010 Page 4-7
Table 4-1 Latitude and Longitude Coordinates for Features in the Little Yosemite Reach
Feature Latitude Longitude Downstream Boundary 37.5045 121.8197
Feature 1 37.5048 121.8185 Feature 2 37.5048 121.8183 Feature 3 37.5050 121.8173 Feature 4 37.5050 121.8170 Feature 5 37.5050 121.8167 Feature 6 37.5050 121.8166 Feature 7 37.5051 121.8164 Feature 8 37.5051 121.8161 Feature 9 37.5052 121.8158
Feature 10 37.5053 121.8154 Feature 11 37.5054 121.8149
Upstream Boundary 37.5058 121.8137
Note: Datum for Latitude and Longitude coordinates reported in this memorandum is NAD83.
4.1.1 FEATURE 9 Feature 9 (Figure 4-5) is located approximately 300 feet from the upstream extent of Little Yosemite (Table 4-1, Figure 4-1).
On March 13, 2006, with daily average flow of 98 cfs, flow at Feature 9 was observed to be split by a boulder in the middle of the channel (Figure 4-5 [a]). Passage was visually estimated as impossible at that time. Potential passage routes through spaces between submerged boulders could have been obscured, however, and quantitative measurements of those features could not be obtained due to high flows. Therefore, the passability of this feature was further evaluated during the low-flow field assessment on June 23 before a conclusion regarding its passability could be reached.
On June 23, with daily average flows of 2.5 cfs, and the advantage of being able to clearly identify potential passage routes that had been obscured by flows on March 13, it was determined that no alternate passage routes other than leaping over the falls were available during either field assessment. Field measurements collected at Feature 9, as defined in Table 4-1, are provided in Table 4-2, and are diagrammed on Figure 4-6.
Table 4-2Parameters Recorded at Feature 9 During a Creek Flow of 2.5 cfs
Parameter Data Notation Measured Value (feet) Vertical Height H 7.9
Horizontal Width X 12
Depth of Staging Pool dpp 1.2
Depth of Landing Site dc 0.7

Assessment of Fish Upstream Migration at Natural Barriers in the Upper Alameda Creek Sub-Watershed
Barriers January 2010 Page 4-8
Note: The average flow on the day of the field assessment was 2.5 cfs.
Figure 4-6 Cross Section of Little Yosemite Feature 9
At both flows assessed in this memorandum, Feature 9 was determined to be an impassable elevation barrier to steelhead in good condition (and a horizontal distance barrier to steelhead in bright condition). This result is explained below.
The vertical height of the fall is 7.9 feet. The horizontal distance from the crest of the falls to the standing wave is approximately 2 feet (typically, X). However, the channel substrate below the falls is composed entirely of bedrock and boulders that extend approximately 12 feet into a pool downstream of the falls (Figure 4-5 [b]). This means that a fish attempting to ascend the falls would have to leave the water from a takeoff point 12 feet downstream of the crest of the falls (Figure 4-6), so X is actually equal to 12 feet7. In addition, the orientation of the takeoff point is not in direct alignment with the location of the landing point above the crest of the falls. The orientation of the takeoff point relative to the landing point would increase the difficulty of the fish’s leap, but no reduction in the fish-jumping capability was included in the calculations to reflect this complexity. To illustrate the calculation portion of the assessment process, the calculations involved in the assessment of Feature 9 are described in the following paragraphs.
7 Higher flows could potentially alter this distance. This distance was not measured at the higher flow assessment but the feature was visually estimated to be a barrier at that time.
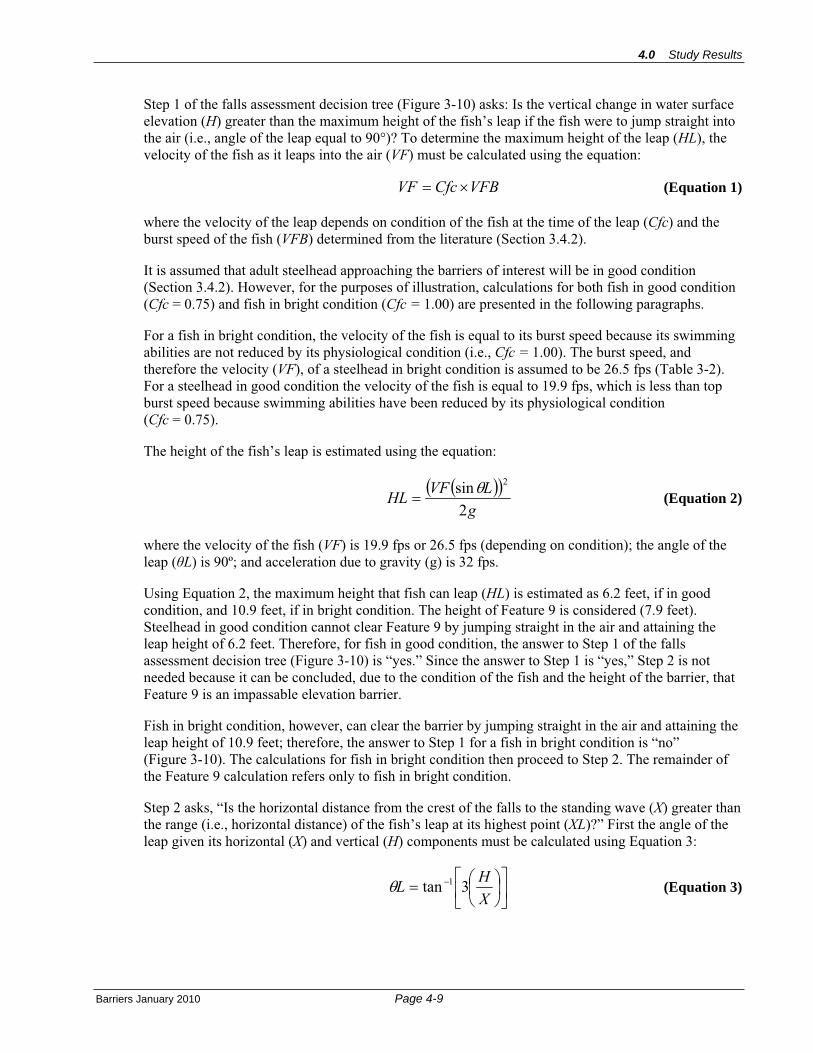
4.0 Study Results
Barriers January 2010 Page 4-9
Step 1 of the falls assessment decision tree (Figure 3-10) asks: Is the vertical change in water surface elevation (H) greater than the maximum height of the fish’s leap if the fish were to jump straight into the air (i.e., angle of the leap equal to 90°)? To determine the maximum height of the leap (HL), the velocity of the fish as it leaps into the air (VF) must be calculated using the equation:
VFBCfcVF (Equation 1)
where the velocity of the leap depends on condition of the fish at the time of the leap (Cfc) and the burst speed of the fish (VFB) determined from the literature (Section 3.4.2).
It is assumed that adult steelhead approaching the barriers of interest will be in good condition (Section 3.4.2). However, for the purposes of illustration, calculations for both fish in good condition (Cfc = 0.75) and fish in bright condition (Cfc = 1.00) are presented in the following paragraphs.
For a fish in bright condition, the velocity of the fish is equal to its burst speed because its swimming abilities are not reduced by its physiological condition (i.e., Cfc = 1.00). The burst speed, and therefore the velocity (VF), of a steelhead in bright condition is assumed to be 26.5 fps (Table 3-2). For a steelhead in good condition the velocity of the fish is equal to 19.9 fps, which is less than top burst speed because swimming abilities have been reduced by its physiological condition (Cfc = 0.75).
The height of the fish’s leap is estimated using the equation:
gLVFHL
2sin 2
(Equation 2)
where the velocity of the fish (VF) is 19.9 fps or 26.5 fps (depending on condition); the angle of the leap ( L) is 90º; and acceleration due to gravity (g) is 32 fps.
Using Equation 2, the maximum height that fish can leap (HL) is estimated as 6.2 feet, if in good condition, and 10.9 feet, if in bright condition. The height of Feature 9 is considered (7.9 feet). Steelhead in good condition cannot clear Feature 9 by jumping straight in the air and attaining the leap height of 6.2 feet. Therefore, for fish in good condition, the answer to Step 1 of the falls assessment decision tree (Figure 3-10) is “yes.” Since the answer to Step 1 is “yes,” Step 2 is not needed because it can be concluded, due to the condition of the fish and the height of the barrier, that Feature 9 is an impassable elevation barrier.
Fish in bright condition, however, can clear the barrier by jumping straight in the air and attaining the leap height of 10.9 feet; therefore, the answer to Step 1 for a fish in bright condition is “no” (Figure 3-10). The calculations for fish in bright condition then proceed to Step 2. The remainder of the Feature 9 calculation refers only to fish in bright condition.
Step 2 asks, “Is the horizontal distance from the crest of the falls to the standing wave (X) greater than the range (i.e., horizontal distance) of the fish’s leap at its highest point (XL)?” First the angle of the leap given its horizontal (X) and vertical (H) components must be calculated using Equation 3:
XHL 3tan 1 (Equation 3)
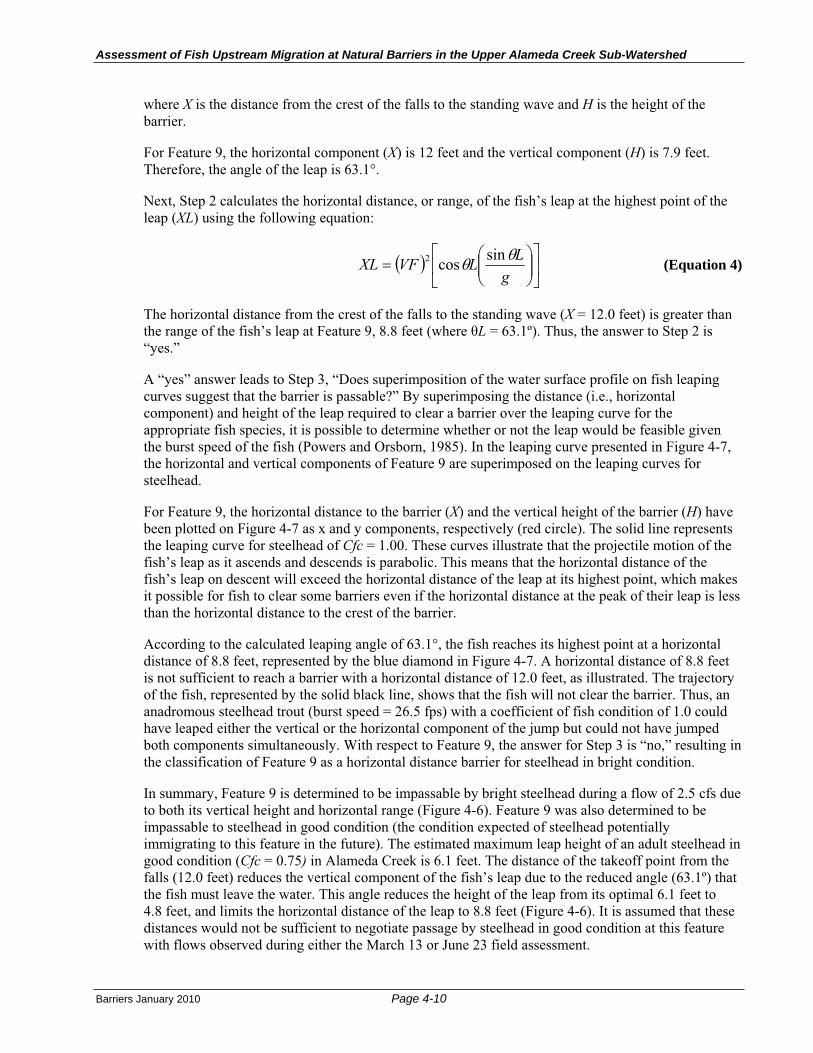
Assessment of Fish Upstream Migration at Natural Barriers in the Upper Alameda Creek Sub-Watershed
Barriers January 2010 Page 4-10
where X is the distance from the crest of the falls to the standing wave and H is the height of the barrier.
For Feature 9, the horizontal component (X) is 12 feet and the vertical component (H) is 7.9 feet. Therefore, the angle of the leap is 63.1°.
Next, Step 2 calculates the horizontal distance, or range, of the fish’s leap at the highest point of the leap (XL) using the following equation:
gLLVFXL sincos2 (Equation 4)
The horizontal distance from the crest of the falls to the standing wave (X = 12.0 feet) is greater than the range of the fish’s leap at Feature 9, 8.8 feet (where L = 63.1º). Thus, the answer to Step 2 is “yes.”
A “yes” answer leads to Step 3, “Does superimposition of the water surface profile on fish leaping curves suggest that the barrier is passable?” By superimposing the distance (i.e., horizontal component) and height of the leap required to clear a barrier over the leaping curve for the appropriate fish species, it is possible to determine whether or not the leap would be feasible given the burst speed of the fish (Powers and Orsborn, 1985). In the leaping curve presented in Figure 4-7, the horizontal and vertical components of Feature 9 are superimposed on the leaping curves for steelhead.
For Feature 9, the horizontal distance to the barrier (X) and the vertical height of the barrier (H) have been plotted on Figure 4-7 as x and y components, respectively (red circle). The solid line represents the leaping curve for steelhead of Cfc = 1.00. These curves illustrate that the projectile motion of the fish’s leap as it ascends and descends is parabolic. This means that the horizontal distance of the fish’s leap on descent will exceed the horizontal distance of the leap at its highest point, which makes it possible for fish to clear some barriers even if the horizontal distance at the peak of their leap is less than the horizontal distance to the crest of the barrier.
According to the calculated leaping angle of 63.1°, the fish reaches its highest point at a horizontal distance of 8.8 feet, represented by the blue diamond in Figure 4-7. A horizontal distance of 8.8 feet is not sufficient to reach a barrier with a horizontal distance of 12.0 feet, as illustrated. The trajectory of the fish, represented by the solid black line, shows that the fish will not clear the barrier. Thus, an anadromous steelhead trout (burst speed = 26.5 fps) with a coefficient of fish condition of 1.0 could have leaped either the vertical or the horizontal component of the jump but could not have jumped both components simultaneously. With respect to Feature 9, the answer for Step 3 is “no,” resulting in the classification of Feature 9 as a horizontal distance barrier for steelhead in bright condition.
In summary, Feature 9 is determined to be impassable by bright steelhead during a flow of 2.5 cfs due to both its vertical height and horizontal range (Figure 4-6). Feature 9 was also determined to be impassable to steelhead in good condition (the condition expected of steelhead potentially immigrating to this feature in the future). The estimated maximum leap height of an adult steelhead in good condition (Cfc = 0.75) in Alameda Creek is 6.1 feet. The distance of the takeoff point from the falls (12.0 feet) reduces the vertical component of the fish’s leap due to the reduced angle (63.1º) that the fish must leave the water. This angle reduces the height of the leap from its optimal 6.1 feet to 4.8 feet, and limits the horizontal distance of the leap to 8.8 feet (Figure 4-6). It is assumed that these distances would not be sufficient to negotiate passage by steelhead in good condition at this feature with flows observed during either the March 13 or June 23 field assessment.
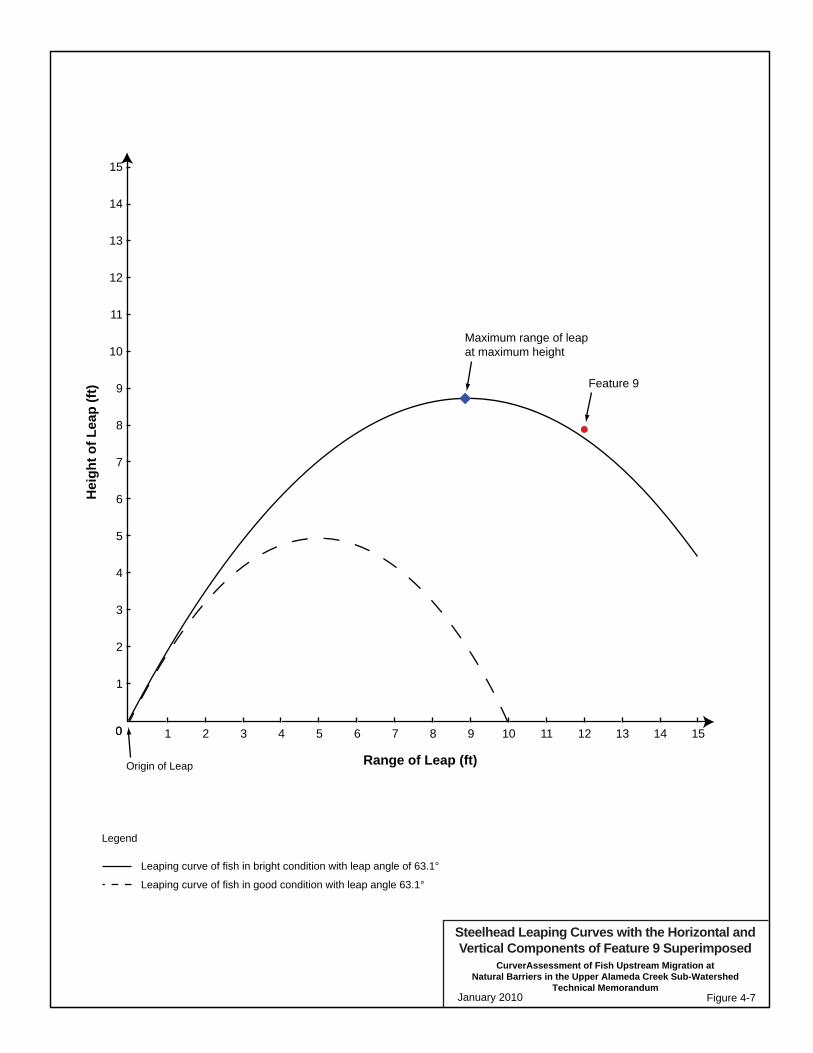
January 2010
Steelhead Leaping Curves with the Horizontal andVertical Components of Feature 9 Superimposed
CurverAssessment of Fish Upstream Migration atNatural Barriers in the Upper Alameda Creek Sub-Watershed
Technical MemorandumFigure 4-7
15
14
13
12
11
10
9
8
7
6
5
4
3
2
1
00 1
Legend
Leaping curve of fish in bright condition with leap angle of 63.1°
Leaping curve of fish in good condition with leap angle 63.1°
Range of Leap (ft)
Maximum range of leapat maximum height
Origin of Leap
Feature 9
Hei
ght o
f Lea
p (ft
)
2 3 4 5 6 7 8 9 10 11 12 13 14 15

Assessment of Fish Upstream Migration at Natural Barriers in the Upper Alameda Creek Sub-Watershed
Barriers January 2010 Page 4-12
Finally, it is noted that the landing at the top of the falls (Figure 4-8) is a chute (with a water depth of approximately 8 inches during the lower-flow field assessment) that would require the fish to achieve an adequate burst speed to reach a velocity refuge located approximately 3 feet upstream of the landing point. Figure 4-8 is a photograph taken from the top of the feature looking nearly straight down to show the narrow landing conditions, approximately one-half foot wide, at the top of the falls. It is uncertain if an adult steelhead (even in “bright” condition, Cfc = 1.00) would be able to achieve the level of precision required to navigate through this chute while descending through the air. The velocity of the chute and the distance to a velocity refuge upstream were determined not to be a limiting factor in the passability of this feature. It is unknown whether this feature poses a barrier to upstream migration at flows higher than 98 cfs (Section 5.1).
Figure 4-8 Landing Point of Little Yosemite Passage Feature 9
4.1.2 FEATURE 10 Feature 10 (Figure 4-9) is located approximately 200 feet from the upstream extent of Little Yosemite (Figure 4-1, Table 4-1).
On March 13, when the recorded daily average flow was 98 cfs, potential passage opportunities through the boulders that form this channel step were obscured by flowing water and therefore quantitative measurements were not obtained. As a result, the passability of this feature was further evaluated during the June field assessments.
Observations during the June 2006 assessment determined that the only opportunity available for fish to negotiate Feature 10 was to leap the existing falls. Measurements recorded at Feature 10 are shown in Table 4-3. The waterfall has a vertical height (H) of 9.5 feet during a creek flow of 2.5 cfs. The measured horizontal distance (X) from the takeoff point at the standing wave in the plunge pool to the landing is 4 feet (Figure 4-10).

Photographs of Feature 10 in the Little Yosemite reach ofAlameda Creek, on (a) March 13 and (b) June 23, 2006.
January 2010 Figure 4-9
Photographs of Little Yosemite Feature 10Assessment of Fish Upstream Migration at
Natural Barriers in the Upper Alameda Creek Sub-WatershedTechnical Memorandum
(a)
(b)
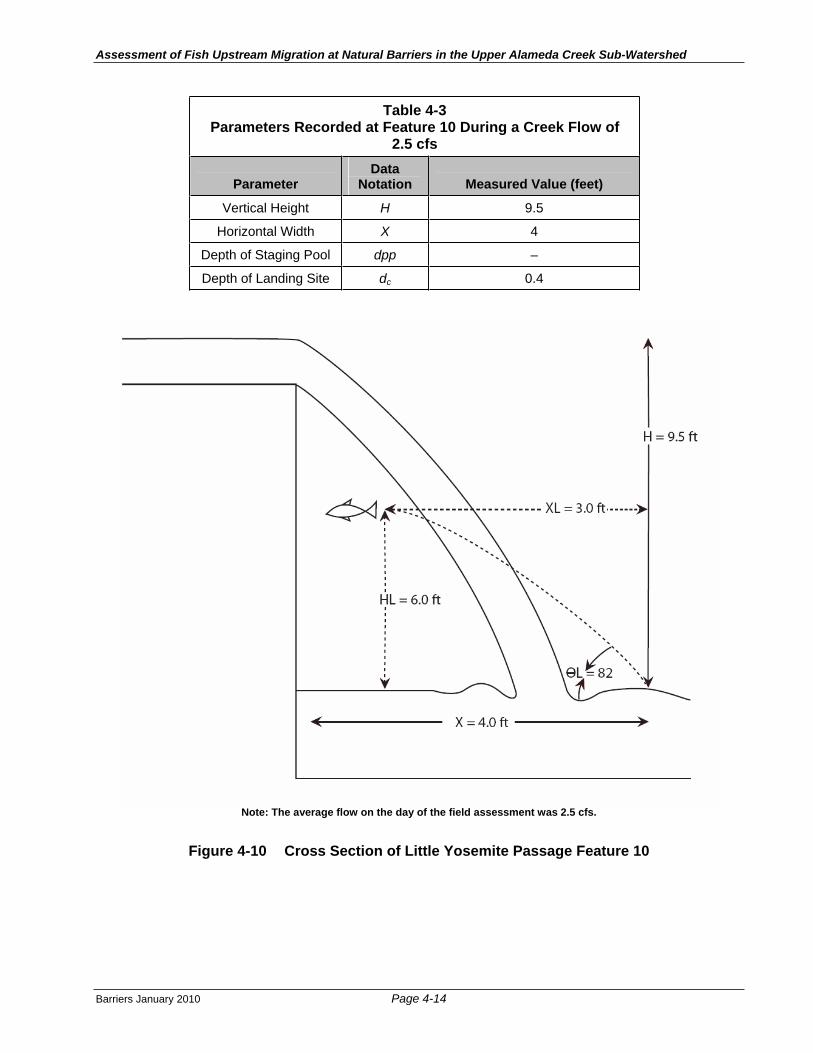
Assessment of Fish Upstream Migration at Natural Barriers in the Upper Alameda Creek Sub-Watershed
Barriers January 2010 Page 4-14
Table 4-3Parameters Recorded at Feature 10 During a Creek Flow of
2.5 cfs
ParameterData
Notation Measured Value (feet)
Vertical Height H 9.5
Horizontal Width X 4
Depth of Staging Pool dpp –
Depth of Landing Site dc 0.4
Note: The average flow on the day of the field assessment was 2.5 cfs.
Figure 4-10 Cross Section of Little Yosemite Passage Feature 10
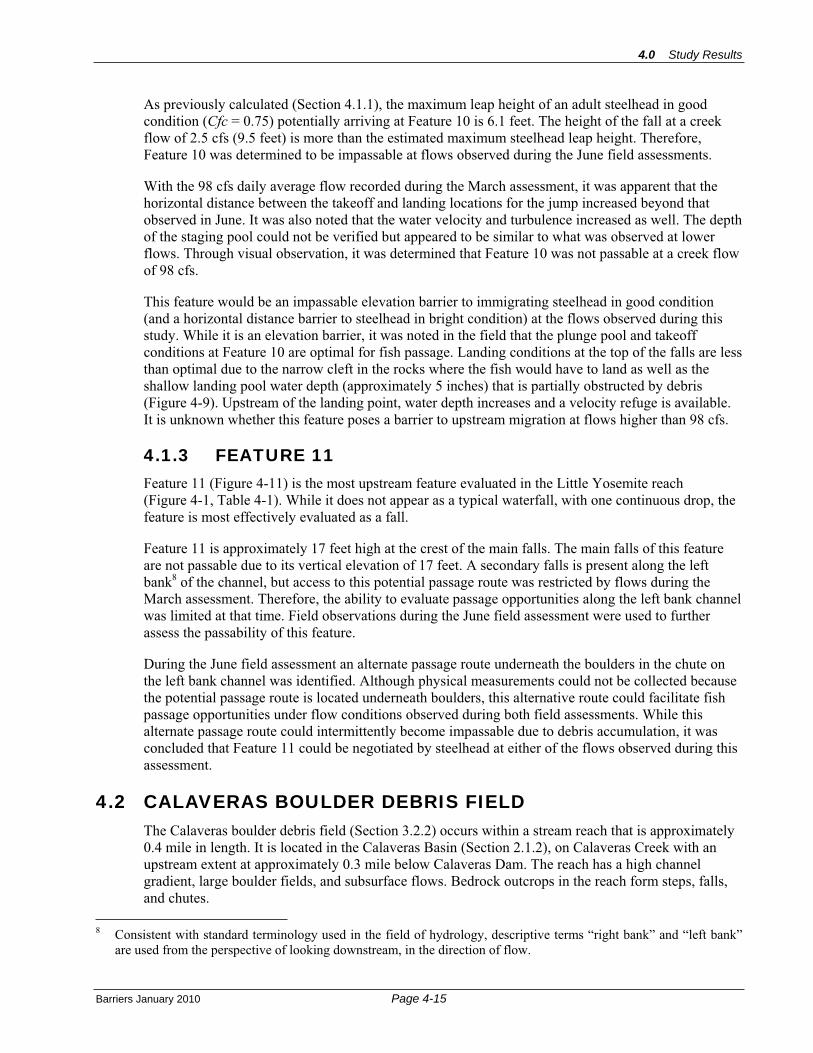
4.0 Study Results
Barriers January 2010 Page 4-15
As previously calculated (Section 4.1.1), the maximum leap height of an adult steelhead in good condition (Cfc = 0.75) potentially arriving at Feature 10 is 6.1 feet. The height of the fall at a creek flow of 2.5 cfs (9.5 feet) is more than the estimated maximum steelhead leap height. Therefore, Feature 10 was determined to be impassable at flows observed during the June field assessments.
With the 98 cfs daily average flow recorded during the March assessment, it was apparent that the horizontal distance between the takeoff and landing locations for the jump increased beyond that observed in June. It was also noted that the water velocity and turbulence increased as well. The depth of the staging pool could not be verified but appeared to be similar to what was observed at lower flows. Through visual observation, it was determined that Feature 10 was not passable at a creek flow of 98 cfs.
This feature would be an impassable elevation barrier to immigrating steelhead in good condition (and a horizontal distance barrier to steelhead in bright condition) at the flows observed during this study. While it is an elevation barrier, it was noted in the field that the plunge pool and takeoff conditions at Feature 10 are optimal for fish passage. Landing conditions at the top of the falls are less than optimal due to the narrow cleft in the rocks where the fish would have to land as well as the shallow landing pool water depth (approximately 5 inches) that is partially obstructed by debris (Figure 4-9). Upstream of the landing point, water depth increases and a velocity refuge is available. It is unknown whether this feature poses a barrier to upstream migration at flows higher than 98 cfs.
4.1.3 FEATURE 11 Feature 11 (Figure 4-11) is the most upstream feature evaluated in the Little Yosemite reach (Figure 4-1, Table 4-1). While it does not appear as a typical waterfall, with one continuous drop, the feature is most effectively evaluated as a fall.
Feature 11 is approximately 17 feet high at the crest of the main falls. The main falls of this feature are not passable due to its vertical elevation of 17 feet. A secondary falls is present along the left bank8 of the channel, but access to this potential passage route was restricted by flows during the March assessment. Therefore, the ability to evaluate passage opportunities along the left bank channel was limited at that time. Field observations during the June field assessment were used to further assess the passability of this feature.
During the June field assessment an alternate passage route underneath the boulders in the chute on the left bank channel was identified. Although physical measurements could not be collected because the potential passage route is located underneath boulders, this alternative route could facilitate fish passage opportunities under flow conditions observed during both field assessments. While this alternate passage route could intermittently become impassable due to debris accumulation, it was concluded that Feature 11 could be negotiated by steelhead at either of the flows observed during this assessment.
4.2 CALAVERAS BOULDER DEBRIS FIELD The Calaveras boulder debris field (Section 3.2.2) occurs within a stream reach that is approximately 0.4 mile in length. It is located in the Calaveras Basin (Section 2.1.2), on Calaveras Creek with an upstream extent at approximately 0.3 mile below Calaveras Dam. The reach has a high channel gradient, large boulder fields, and subsurface flows. Bedrock outcrops in the reach form steps, falls, and chutes.
8 Consistent with standard terminology used in the field of hydrology, descriptive terms “right bank” and “left bank” are used from the perspective of looking downstream, in the direction of flow.

Assessment of Fish Upstream Migration at Natural Barriers in the Upper Alameda Creek Sub-Watershed
Barriers January 2010 Page 4-16
Note: The average flow on the day of the field assessment was 98 cfs.
Figure 4-11 Little Yosemite Passage Feature 11
The Calaveras boulder debris field reach was surveyed from its downstream boundary (37.5029°N, 121.8197°W) to its upstream boundary (37.4987°N, 121.8176°W) (Figure 3-4) on March 13, 2006 when flows were less than 1 cfs (Section 3.3.2). While a number of small impediments to fish migration are present in the study reach, and subsurface flows may affect passage conditions at times of low stream flow (Figure 4-12), one primary barrier to steelhead upstream migration was identified.
A waterfall (37.4991°N, 121.8173°W), located approximately 200 feet downstream of the proposed limit of work for Calaveras Dam Replacement Project site, forms an elevation barrier to adult steelhead immigration in Calaveras Creek (Figure 4-13). The apex of the falls is 12 feet from the surface water in the pool below. This feature is currently impassable given that the maximum vertical leap of an Alameda Creek steelhead in good condition would be 6.1 feet (or 10.9 feet for a steelhead in bright condition) under optimal conditions. Although this 12-foot distance could change as the creek rises, and the distance could lessen, the feature was visually estimated to be a barrier during the higher-flow field assessment, when daily average flow was 98 cfs. The rate of flow with potential to lessen the 12-foot height of this barrier is not known at this time.
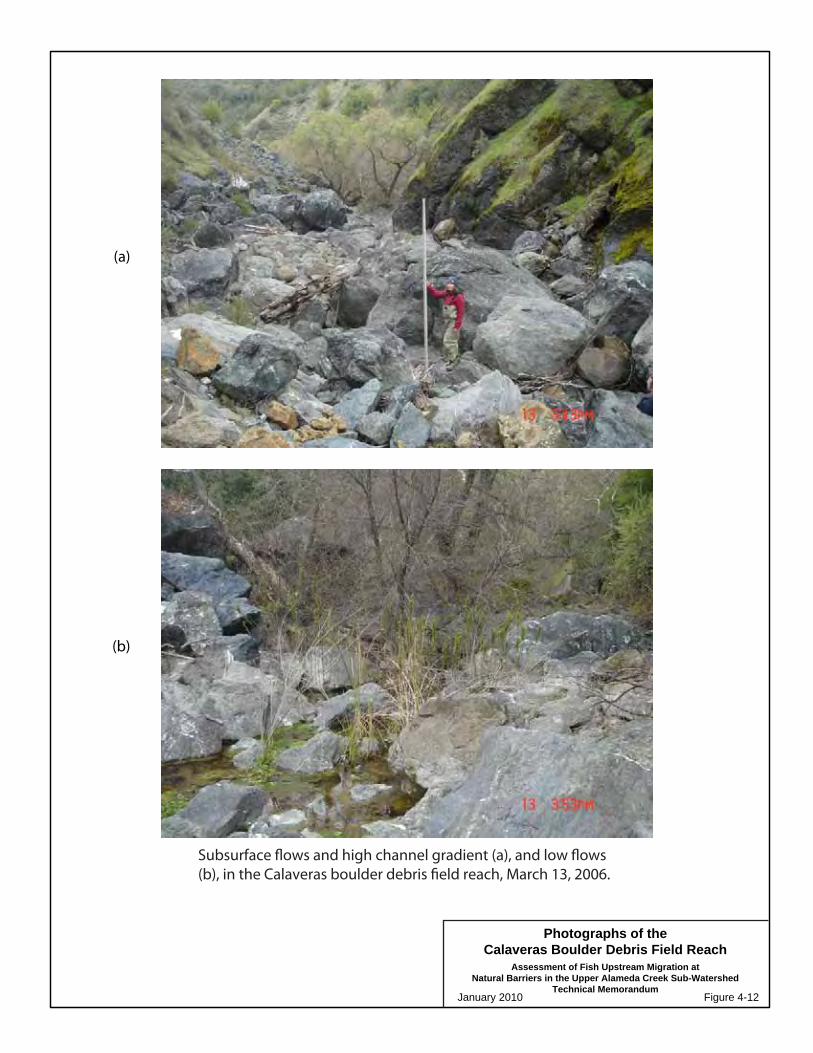
Subsurface flows and high channel gradient (a), and low flows(b), in the Calaveras boulder debris field reach, March 13, 2006.
January 2010 Figure 4-12
Photographs of theCalaveras Boulder Debris Field Reach
Assessment of Fish Upstream Migration atNatural Barriers in the Upper Alameda Creek Sub-Watershed
Technical Memorandum
(a)
(b)

January 2010 Figure 4-13
Waterfall in theCalaveras Boulder Debris Field Reach
Assessment of Fish Upstream Migration atNatural Barriers in the Upper Alameda Creek Sub-Watershed
Technical Memorandum

4.0 Study Results
Barriers January 2010 Page 4-19
4.3 ARROYO HONDO LANDSLIDE The landslide reach of Arroyo Hondo (Section 3.2.3) is located in the Arroyo Hondo Basin (Section 2.1.3). The reach was surveyed on February 23, 2006, when daily average flow was recorded as 17 cfs (Section 3.3.2).
Potential steelhead access to the Arroyo Hondo Basin would be limited by an approximately 15-foot waterfall (Figure 4-14), located approximately 1.8 miles upstream of Calaveras Reservoir (Figure 4-3). Measurements collected at the falls barrier in Arroyo Hondo are presented in Table 4-4. This feature is much taller than the vertical leaping ability of an immigrating steelhead, and therefore would be a vertical leaping barrier to potential steelhead immigration.
Table 4-4 Parameters Recorded at the Waterfall on Arroyo Hondo
ParameterData
Notation Measured Value (feet)
Vertical Height H 15
Horizontal Width X 3
Depth of Staging Pool dpp –
Depth of Landing Site dc –
The water spills from upstream through a gap in the boulders at the apex of the barrier. The horizontal distance from the leap takeoff point immediately downstream of the standing wave to the landing location at the top of the falls is approximately 3 feet. Although the takeoff pool conditions are good with adequate run-up length and water depth, the falls flow comes from underneath a large accumulation of boulder debris lodged at the top of the falls. This rock overhang above the landing at the top of the falls creates a similar landing access problem as would occur with fish passage at a pipe culvert, where the success of a fish’s leap would be limited by the lack of overhead clearance and shallow water depth at the landing site. Additionally, the landing at the top of the falls occurs at the bottom of the enclosed boulder debris chute, which creates an approximately 5-foot-long tunnel through the rock. A fish attempting to negotiate this feature would conceptually be leaping 15 feet up into a tunnel, against the hydraulic head created by water upstream. The water velocities in the tunnel could not be measured due to the enclosed nature of the feature, but if the vertical barrier height did not make the feature impassable, then the landing conditions and the velocity and turbulence of the water from the landing to a velocity refuge would likely make this feature impassable under all anticipated flow conditions.

January 2010 Figure 4-14
Waterfall on Arroyo HondoAssessment of Fish Upstream Migration at
Natural Barriers in the Upper Alameda Creek Sub-WatershedTechnical Memorandum

5.0 Discussion
Barriers January 2010 Page 5-1
5 DISCUSSIONIn many cases the passability of stream features changes with stream discharge. In some cases, increases in flow improve hydraulic conditions across a feature, making it passable. In other cases the opposite can be true. As flow increases, water depth and the width of the wetted channel perimeter increase, submerging boulder obstructions and potentially providing additional fish passage opportunities along the floodplain. However, flow increases are also associated with increases in water velocity and turbulence, which can reduce the passability of some features by increasing the distance from the takeoff point of a jump to the landing, increasing the velocity of the water on a landing to above the burst speed of the fish, or entraining large quantities of air in the water and reducing swimming ability. All of these factors affect the passability of stream features for fish attempting to migrate upstream. Depending on their physical characteristics, some features may be more passable during low-flow ranges, and others may be more passable at higher flow ranges. Therefore, conclusions regarding feature passability are improved as hydraulic conditions are evaluated over the full range of anticipated migration flows.
For example, if a falls barrier is impassable at 100 cfs because of its elevation, an increase in discharge could potentially increase the water surface elevation enough to allow a fish to ascend the falls. However, that same increase in discharge could also increase water velocity and turbulence below the falls, which would decrease the propulsive power of the fish at the takeoff point and possibly extend the distance between the jump takeoff and landing locations. The reduction in propulsive power due to turbulence reduces the leaping capacity of the fish, thus making the barrier potentially impassable.
Extreme high-flow events that are out of the range of the observed flows for this steelhead passage assessment occur infrequently on these and other tributaries. The ability to assess potential barriers during extremely high flows, when a substantial portion of adult steelhead immigration may be expected to occur, is limited by the infrequency at which such flows occur, as well as by the hazard posed to scientists attempting to collect data in a stream under high-flow conditions. The passability of potential fish passage barriers is expected to be different under extreme conditions. If extremely high flows affect the passability of features evaluated in this memorandum, depending upon the frequency at which the barriers are passable, those potential passage opportunities could have varying degrees of biological relevance. For example, it is possible that historical access by migrating steelhead occurred in the upper reaches of Alameda Creek on an infrequent basis and only when downstream hydraulic conditions were sufficient over each partial barrier for a required period of time. Infrequent access, however, could allow steelhead to repopulate a reach that could then be a source of returning adult steelhead in other reaches, potentially bolstering the steelhead metapopulation in the Alameda Creek Watershed. The biological relevance of potential high-flow passage opportunities or the potential biological benefit of passage at the features evaluated is not within the scope of this study.
In this section, the potential effect of flow conditions higher than those observed during the field assessments on the passability of the reaches evaluated is considered, based both on observations made during the field assessments described in this memorandum as well as additional information derived from other sources. It should be noted that while based on the professional opinion of qualified scientists, considerations of passability outside the range of flows evaluated in this memorandum are speculative.
This section also explores some potential physical or flow modifications that could be applied in the study reaches to either potentially make the features passable to immigrating adult steelhead or to potentially increase the range of flows or reliability of fish passage. These preliminary investigations into the potential for increasing the passability of these barriers is based on the results of the field assessments, estimated fish performance capabilities of steelhead, and field reconnaissance conducted by URS geologists (URS, 2009). It should be noted that prior to undertaking any modification to a fish passage barrier, a technical evaluation of the stream channel geology and fluvial dynamics would need to be conducted to ensure its long-term success (Hegberg et al., 2001).

Assessment of Fish Upstream Migration at Natural Barriers in the Upper Alameda Creek Sub-Watershed
Barriers January 2010 Page 5-2
Fish passage can be facilitated at natural channel features by modifying portions of the barrier (such as removing boulders that contribute to impassability), by the design and construction of volitional fish passage structures, or potentially through changes in flow to make features more passable. Volitional fish passage structures are designed to concentrate flows to provide water depth and velocity for traversing the slopes of impassable features such as falls. In their most basic forms they consist of multiple rock weirs set at different elevations to provide passage over a range of flow conditions (step pools), or artificially roughened channels that creates incremental resting places for a fish moving upstream (roughened channel).
Any barrier modifications should take into consideration the full range of performance capabilities of adult steelhead. As mentioned previously in the body of this document, the observed burst speed for steelhead ranges from 13.7 to 26.5 fps (Table 3-2). Migration history (length of migration, previous obstacles encountered, water quality, etc.) can affect the ability of a salmonid to pass a given obstacle (Reiser et al., 2006). Therefore, it would not be reasonable to assume that performance capabilities of a fish would be equal between the first and last passage impediment that it encountered along its migratory corridor. Physical barrier modifications should be scaled to the lowest possible adult steelhead performance capabilities to maximize passage opportunities for the greatest number of fish.
5.1 LITTLE YOSEMITE All of the potential impediments to steelhead immigration identified in the Little Yosemite reach of Alameda Creek (Figure 4-1) are either passable under both observed flow conditions (Section 3.3.2) or are impassable at both (Section 4.1). The features that are not passable at the moderate flows observed on March 13, 2006 are likely to continue to be impassable until flows reach a higher range of flows when additional potential passage pathways may become inundated. For example, during the field assessments it was noted that extremely high flows at Feature 10 could potentially create an additional fish passage route on the right bank channel.
It is noted that SFPUC and others observed high flows through the Little Yosemite reach in March 2009 (Figure 5-1(a)). The daily average flow recorded on March 4, 2009 was 545 cfs, which is expected to be exceeded only during 1 percent of days in the adult steelhead immigration period (Figure 3-7). Although flows of this magnitude may be uncommon, steelhead are known to wait in pools during low flows and then attempt to move upstream following a rain event (Shapovalov and Taft, 1954). From these March 2009 observations, it is clear that flow paths in addition to those evaluated during previous field assessments are present through the Little Yosemite reach at extremely high flows. Even under these conditions, however, it remains uncertain to what degree Little Yosemite would be passable to immigrating steelhead.
As discussed above, while some of the features evaluated may be more readily passable under high flows, others may be less passable. Additionally, the passability of Little Yosemite depends on the ability of steelhead to immigrate past the entire reach, rather than individual barriers in isolation. High flows that may make some otherwise impassable features passable occur for short durations (Figure 2-2). The most substantial impediments to immigration are in the uppermost portion of Little Yosemite (Features 9 and 10), and if a fish had not passed those features before storm flows subsided, it would not be able to pass the reach. Therefore, successful immigration would likely require steelhead to negotiate the entire reach without succumbing to exhaustion, prior to when flows dropped9. Given the estimates that burst speeds (13.7 to 26.5 fps) typically used for passing obstacles
9 No flow duration analysis or a storm peaking analysis has been performed for Little Yosemite. Such analysis could provide estimates of how often flow of specific rate and duration occurs through the reach.
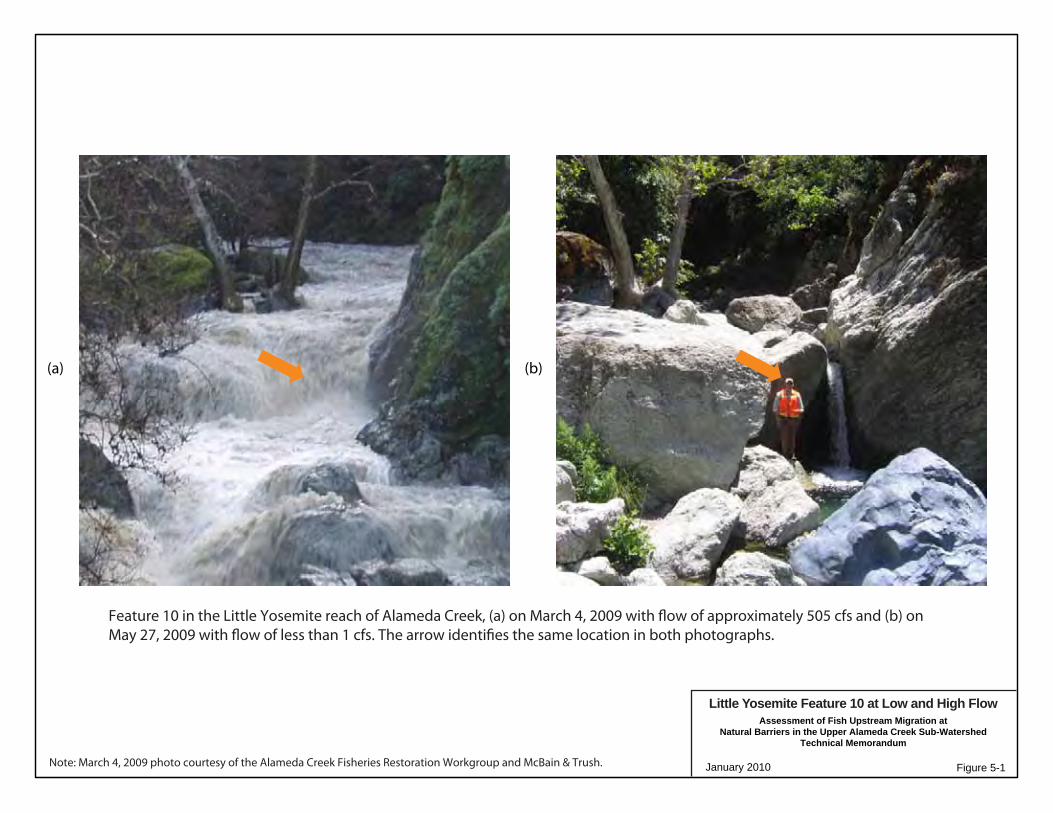
January 2010
Little Yosemite Feature 10 at Low and High FlowAssessment of Fish Upstream Migration at
Natural Barriers in the Upper Alameda Creek Sub-WatershedTechnical Memorandum
Figure 5-1
(a) (b)
Feature 10 in the Little Yosemite reach of Alameda Creek, (a) on March 4, 2009 with flow of approximately 505 cfs and (b) on May 27, 2009 with flow of less than 1 cfs. The arrow identifies the same location in both photographs.
Note: March 4, 2009 photo courtesy of the Alameda Creek Fisheries Restoration Workgroup and McBain & Trush.
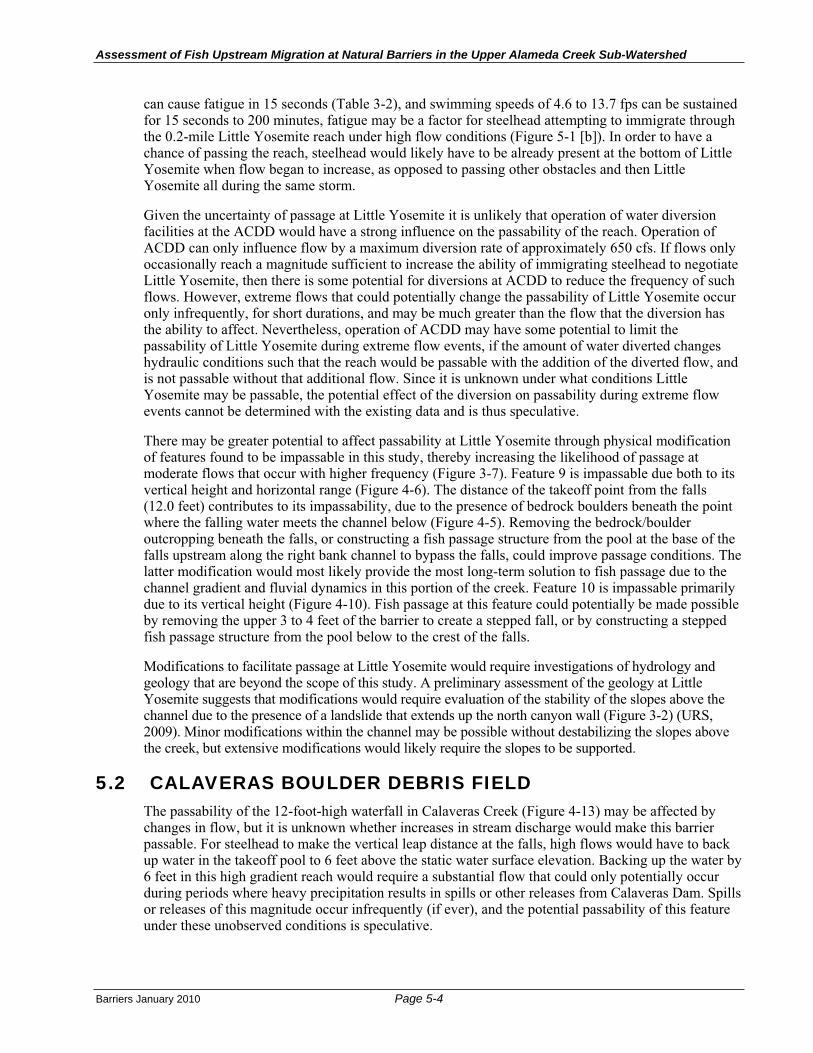
Assessment of Fish Upstream Migration at Natural Barriers in the Upper Alameda Creek Sub-Watershed
Barriers January 2010 Page 5-4
can cause fatigue in 15 seconds (Table 3-2), and swimming speeds of 4.6 to 13.7 fps can be sustained for 15 seconds to 200 minutes, fatigue may be a factor for steelhead attempting to immigrate through the 0.2-mile Little Yosemite reach under high flow conditions (Figure 5-1 [b]). In order to have a chance of passing the reach, steelhead would likely have to be already present at the bottom of Little Yosemite when flow began to increase, as opposed to passing other obstacles and then Little Yosemite all during the same storm.
Given the uncertainty of passage at Little Yosemite it is unlikely that operation of water diversion facilities at the ACDD would have a strong influence on the passability of the reach. Operation of ACDD can only influence flow by a maximum diversion rate of approximately 650 cfs. If flows only occasionally reach a magnitude sufficient to increase the ability of immigrating steelhead to negotiate Little Yosemite, then there is some potential for diversions at ACDD to reduce the frequency of such flows. However, extreme flows that could potentially change the passability of Little Yosemite occur only infrequently, for short durations, and may be much greater than the flow that the diversion has the ability to affect. Nevertheless, operation of ACDD may have some potential to limit the passability of Little Yosemite during extreme flow events, if the amount of water diverted changes hydraulic conditions such that the reach would be passable with the addition of the diverted flow, and is not passable without that additional flow. Since it is unknown under what conditions Little Yosemite may be passable, the potential effect of the diversion on passability during extreme flow events cannot be determined with the existing data and is thus speculative.
There may be greater potential to affect passability at Little Yosemite through physical modification of features found to be impassable in this study, thereby increasing the likelihood of passage at moderate flows that occur with higher frequency (Figure 3-7). Feature 9 is impassable due both to its vertical height and horizontal range (Figure 4-6). The distance of the takeoff point from the falls (12.0 feet) contributes to its impassability, due to the presence of bedrock boulders beneath the point where the falling water meets the channel below (Figure 4-5). Removing the bedrock/boulder outcropping beneath the falls, or constructing a fish passage structure from the pool at the base of the falls upstream along the right bank channel to bypass the falls, could improve passage conditions. The latter modification would most likely provide the most long-term solution to fish passage due to the channel gradient and fluvial dynamics in this portion of the creek. Feature 10 is impassable primarily due to its vertical height (Figure 4-10). Fish passage at this feature could potentially be made possible by removing the upper 3 to 4 feet of the barrier to create a stepped fall, or by constructing a stepped fish passage structure from the pool below to the crest of the falls.
Modifications to facilitate passage at Little Yosemite would require investigations of hydrology and geology that are beyond the scope of this study. A preliminary assessment of the geology at Little Yosemite suggests that modifications would require evaluation of the stability of the slopes above the channel due to the presence of a landslide that extends up the north canyon wall (Figure 3-2) (URS, 2009). Minor modifications within the channel may be possible without destabilizing the slopes above the creek, but extensive modifications would likely require the slopes to be supported.
5.2 CALAVERAS BOULDER DEBRIS FIELD The passability of the 12-foot-high waterfall in Calaveras Creek (Figure 4-13) may be affected by changes in flow, but it is unknown whether increases in stream discharge would make this barrier passable. For steelhead to make the vertical leap distance at the falls, high flows would have to back up water in the takeoff pool to 6 feet above the static water surface elevation. Backing up the water by 6 feet in this high gradient reach would require a substantial flow that could only potentially occur during periods where heavy precipitation results in spills or other releases from Calaveras Dam. Spills or releases of this magnitude occur infrequently (if ever), and the potential passability of this feature under these unobserved conditions is speculative.
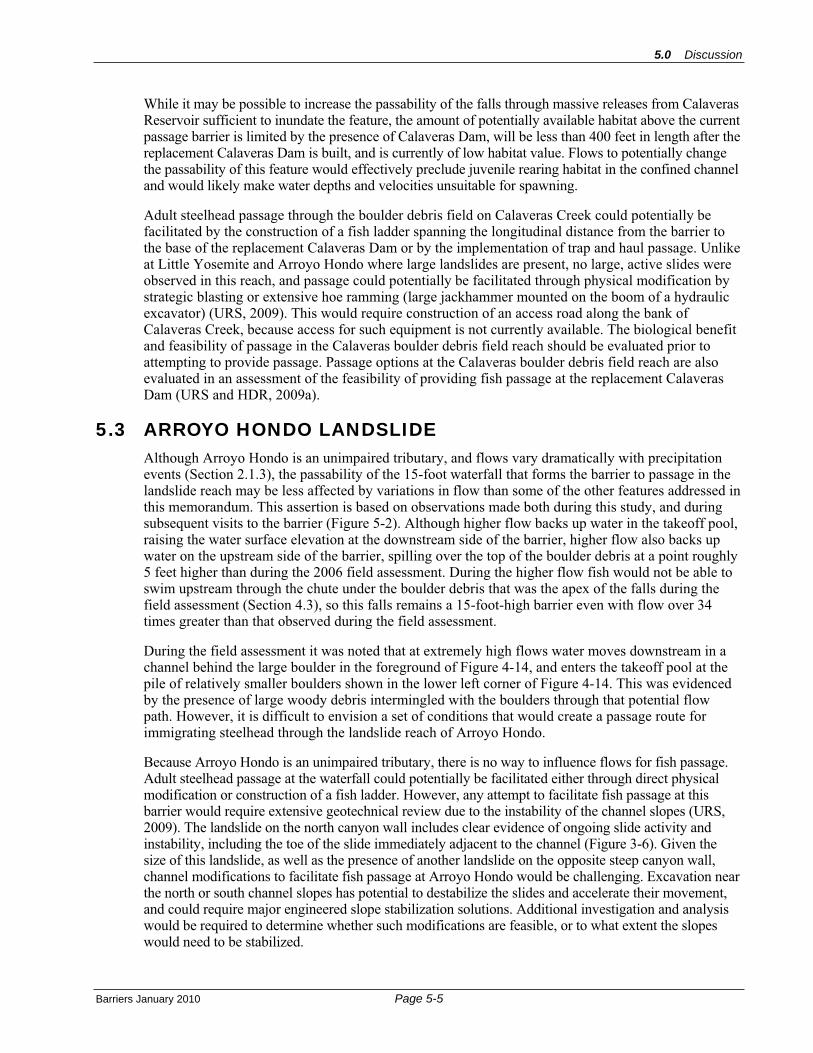
5.0 Discussion
Barriers January 2010 Page 5-5
While it may be possible to increase the passability of the falls through massive releases from Calaveras Reservoir sufficient to inundate the feature, the amount of potentially available habitat above the current passage barrier is limited by the presence of Calaveras Dam, will be less than 400 feet in length after the replacement Calaveras Dam is built, and is currently of low habitat value. Flows to potentially change the passability of this feature would effectively preclude juvenile rearing habitat in the confined channel and would likely make water depths and velocities unsuitable for spawning.
Adult steelhead passage through the boulder debris field on Calaveras Creek could potentially be facilitated by the construction of a fish ladder spanning the longitudinal distance from the barrier to the base of the replacement Calaveras Dam or by the implementation of trap and haul passage. Unlike at Little Yosemite and Arroyo Hondo where large landslides are present, no large, active slides were observed in this reach, and passage could potentially be facilitated through physical modification by strategic blasting or extensive hoe ramming (large jackhammer mounted on the boom of a hydraulic excavator) (URS, 2009). This would require construction of an access road along the bank of Calaveras Creek, because access for such equipment is not currently available. The biological benefit and feasibility of passage in the Calaveras boulder debris field reach should be evaluated prior to attempting to provide passage. Passage options at the Calaveras boulder debris field reach are also evaluated in an assessment of the feasibility of providing fish passage at the replacement Calaveras Dam (URS and HDR, 2009a).
5.3 ARROYO HONDO LANDSLIDE Although Arroyo Hondo is an unimpaired tributary, and flows vary dramatically with precipitation events (Section 2.1.3), the passability of the 15-foot waterfall that forms the barrier to passage in the landslide reach may be less affected by variations in flow than some of the other features addressed in this memorandum. This assertion is based on observations made both during this study, and during subsequent visits to the barrier (Figure 5-2). Although higher flow backs up water in the takeoff pool, raising the water surface elevation at the downstream side of the barrier, higher flow also backs up water on the upstream side of the barrier, spilling over the top of the boulder debris at a point roughly 5 feet higher than during the 2006 field assessment. During the higher flow fish would not be able to swim upstream through the chute under the boulder debris that was the apex of the falls during the field assessment (Section 4.3), so this falls remains a 15-foot-high barrier even with flow over 34 times greater than that observed during the field assessment.
During the field assessment it was noted that at extremely high flows water moves downstream in a channel behind the large boulder in the foreground of Figure 4-14, and enters the takeoff pool at the pile of relatively smaller boulders shown in the lower left corner of Figure 4-14. This was evidenced by the presence of large woody debris intermingled with the boulders through that potential flow path. However, it is difficult to envision a set of conditions that would create a passage route for immigrating steelhead through the landslide reach of Arroyo Hondo.
Because Arroyo Hondo is an unimpaired tributary, there is no way to influence flows for fish passage. Adult steelhead passage at the waterfall could potentially be facilitated either through direct physical modification or construction of a fish ladder. However, any attempt to facilitate fish passage at this barrier would require extensive geotechnical review due to the instability of the channel slopes (URS, 2009). The landslide on the north canyon wall includes clear evidence of ongoing slide activity and instability, including the toe of the slide immediately adjacent to the channel (Figure 3-6). Given the size of this landslide, as well as the presence of another landslide on the opposite steep canyon wall, channel modifications to facilitate fish passage at Arroyo Hondo would be challenging. Excavation near the north or south channel slopes has potential to destabilize the slides and accelerate their movement, and could require major engineered slope stabilization solutions. Additional investigation and analysis would be required to determine whether such modifications are feasible, or to what extent the slopes would need to be stabilized.

January 2010
Waterfall on Arroyo Hondo at Low and High FlowAssessment of Fish Upstream Migration at
Natural Barriers in the Upper Alameda Creek Sub-WatershedTechnical Memorandum
Figure 5-2
(a)
(b)
Fifteen-foot-high waterfall in the landslide reach of Arroyo Hondo, (a) on February 23, 2006 with flow of approximately 17 cfs, and (b) on March 3, 2009, with flow of approximately 590 cfs. The arrows identify the same locations in both photographs.
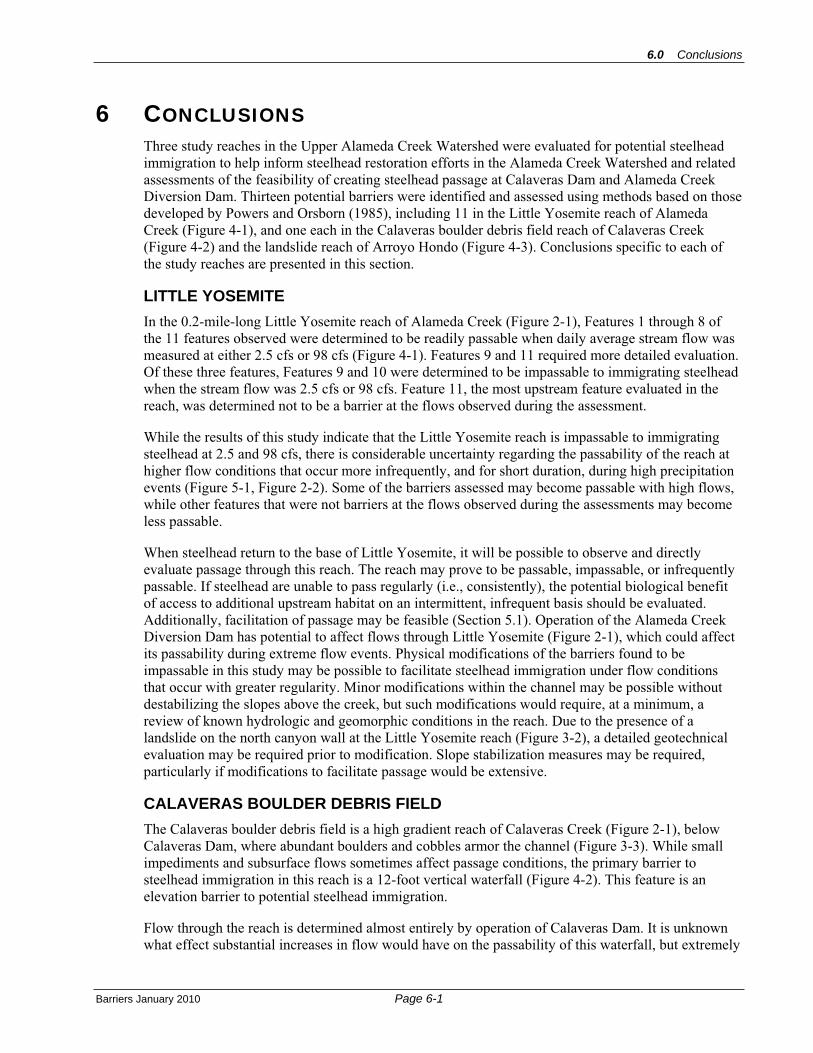
6.0 Conclusions
Barriers January 2010 Page 6-1
6 CONCLUSIONSThree study reaches in the Upper Alameda Creek Watershed were evaluated for potential steelhead immigration to help inform steelhead restoration efforts in the Alameda Creek Watershed and related assessments of the feasibility of creating steelhead passage at Calaveras Dam and Alameda Creek Diversion Dam. Thirteen potential barriers were identified and assessed using methods based on those developed by Powers and Orsborn (1985), including 11 in the Little Yosemite reach of Alameda Creek (Figure 4-1), and one each in the Calaveras boulder debris field reach of Calaveras Creek (Figure 4-2) and the landslide reach of Arroyo Hondo (Figure 4-3). Conclusions specific to each of the study reaches are presented in this section.
LITTLE YOSEMITE In the 0.2-mile-long Little Yosemite reach of Alameda Creek (Figure 2-1), Features 1 through 8 of the 11 features observed were determined to be readily passable when daily average stream flow was measured at either 2.5 cfs or 98 cfs (Figure 4-1). Features 9 and 11 required more detailed evaluation. Of these three features, Features 9 and 10 were determined to be impassable to immigrating steelhead when the stream flow was 2.5 cfs or 98 cfs. Feature 11, the most upstream feature evaluated in the reach, was determined not to be a barrier at the flows observed during the assessment.
While the results of this study indicate that the Little Yosemite reach is impassable to immigrating steelhead at 2.5 and 98 cfs, there is considerable uncertainty regarding the passability of the reach at higher flow conditions that occur more infrequently, and for short duration, during high precipitation events (Figure 5-1, Figure 2-2). Some of the barriers assessed may become passable with high flows, while other features that were not barriers at the flows observed during the assessments may become less passable.
When steelhead return to the base of Little Yosemite, it will be possible to observe and directly evaluate passage through this reach. The reach may prove to be passable, impassable, or infrequently passable. If steelhead are unable to pass regularly (i.e., consistently), the potential biological benefit of access to additional upstream habitat on an intermittent, infrequent basis should be evaluated. Additionally, facilitation of passage may be feasible (Section 5.1). Operation of the Alameda Creek Diversion Dam has potential to affect flows through Little Yosemite (Figure 2-1), which could affect its passability during extreme flow events. Physical modifications of the barriers found to be impassable in this study may be possible to facilitate steelhead immigration under flow conditions that occur with greater regularity. Minor modifications within the channel may be possible without destabilizing the slopes above the creek, but such modifications would require, at a minimum, a review of known hydrologic and geomorphic conditions in the reach. Due to the presence of a landslide on the north canyon wall at the Little Yosemite reach (Figure 3-2), a detailed geotechnical evaluation may be required prior to modification. Slope stabilization measures may be required, particularly if modifications to facilitate passage would be extensive.
CALAVERAS BOULDER DEBRIS FIELD The Calaveras boulder debris field is a high gradient reach of Calaveras Creek (Figure 2-1), below Calaveras Dam, where abundant boulders and cobbles armor the channel (Figure 3-3). While small impediments and subsurface flows sometimes affect passage conditions, the primary barrier to steelhead immigration in this reach is a 12-foot vertical waterfall (Figure 4-2). This feature is an elevation barrier to potential steelhead immigration.
Flow through the reach is determined almost entirely by operation of Calaveras Dam. It is unknown what effect substantial increases in flow would have on the passability of this waterfall, but extremely
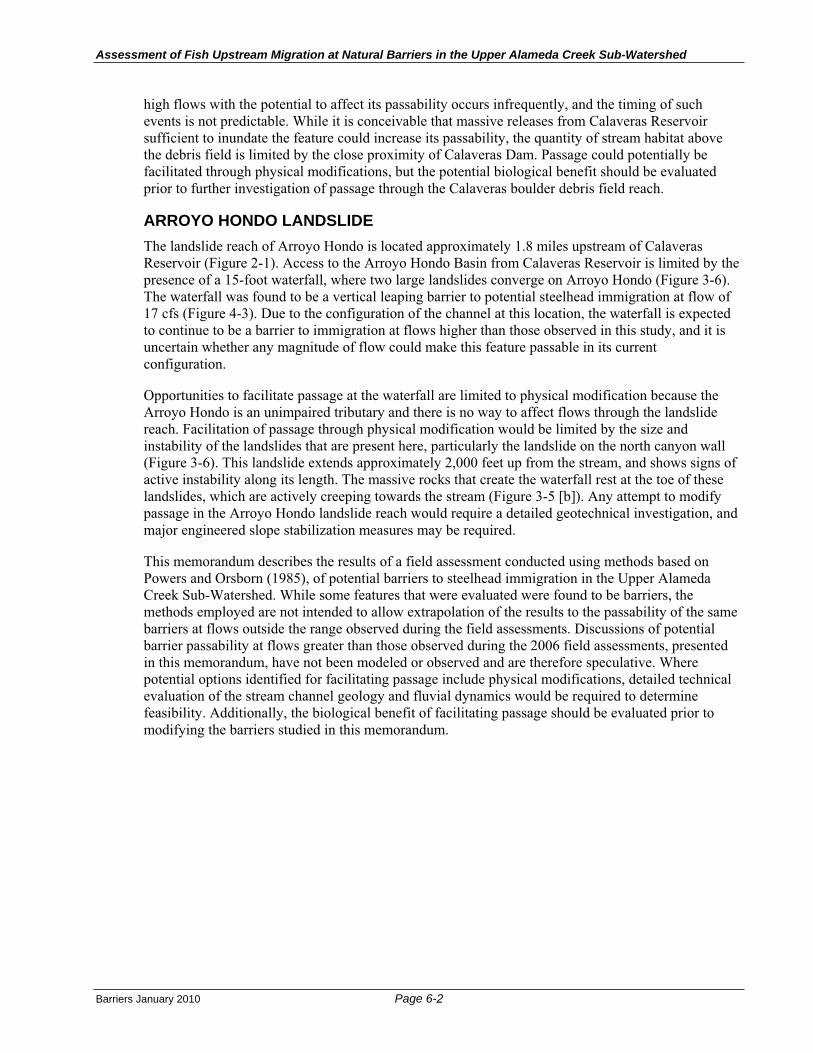
Assessment of Fish Upstream Migration at Natural Barriers in the Upper Alameda Creek Sub-Watershed
Barriers January 2010 Page 6-2
high flows with the potential to affect its passability occurs infrequently, and the timing of such events is not predictable. While it is conceivable that massive releases from Calaveras Reservoir sufficient to inundate the feature could increase its passability, the quantity of stream habitat above the debris field is limited by the close proximity of Calaveras Dam. Passage could potentially be facilitated through physical modifications, but the potential biological benefit should be evaluated prior to further investigation of passage through the Calaveras boulder debris field reach.
ARROYO HONDO LANDSLIDE The landslide reach of Arroyo Hondo is located approximately 1.8 miles upstream of Calaveras Reservoir (Figure 2-1). Access to the Arroyo Hondo Basin from Calaveras Reservoir is limited by the presence of a 15-foot waterfall, where two large landslides converge on Arroyo Hondo (Figure 3-6). The waterfall was found to be a vertical leaping barrier to potential steelhead immigration at flow of 17 cfs (Figure 4-3). Due to the configuration of the channel at this location, the waterfall is expected to continue to be a barrier to immigration at flows higher than those observed in this study, and it is uncertain whether any magnitude of flow could make this feature passable in its current configuration.
Opportunities to facilitate passage at the waterfall are limited to physical modification because the Arroyo Hondo is an unimpaired tributary and there is no way to affect flows through the landslide reach. Facilitation of passage through physical modification would be limited by the size and instability of the landslides that are present here, particularly the landslide on the north canyon wall (Figure 3-6). This landslide extends approximately 2,000 feet up from the stream, and shows signs of active instability along its length. The massive rocks that create the waterfall rest at the toe of these landslides, which are actively creeping towards the stream (Figure 3-5 [b]). Any attempt to modify passage in the Arroyo Hondo landslide reach would require a detailed geotechnical investigation, and major engineered slope stabilization measures may be required.
This memorandum describes the results of a field assessment conducted using methods based on Powers and Orsborn (1985), of potential barriers to steelhead immigration in the Upper Alameda Creek Sub-Watershed. While some features that were evaluated were found to be barriers, the methods employed are not intended to allow extrapolation of the results to the passability of the same barriers at flows outside the range observed during the field assessments. Discussions of potential barrier passability at flows greater than those observed during the 2006 field assessments, presented in this memorandum, have not been modeled or observed and are therefore speculative. Where potential options identified for facilitating passage include physical modifications, detailed technical evaluation of the stream channel geology and fluvial dynamics would be required to determine feasibility. Additionally, the biological benefit of facilitating passage should be evaluated prior to modifying the barriers studied in this memorandum.

7.0 Report Preparation
Barriers January 2010 Page 7-1
7 REPORT PREPARATIONBarrier field assessments were conducted in 2006 by an HDR|SWRI field team led by David Olson, and including Samantha Hadden and John Cornell. Results, conclusions, and recommendations made in this memorandum are based on data obtained by this team.
7.1 LIST OF PREPARERS This technical memorandum was prepared with the participation of professional scientists and engineers from URS, HDR|SWRI, HDR|FishPro’s Fishery Design Center, and SFPUC.
Edward Donahue, HDR|FishPro – National Fisheries Technical Advisor responsible for senior technical review of this memorandum.
Michael Garello, HDR|FishPro – Fisheries Engineer who contributed to the development of this memorandum and was responsible for technical review.
Samantha Hadden, HDR|SWRI – Environmental Scientist responsible for technical support and research for biological components, and authorship of the draft memorandum.
Steve Leach, URS Corporation – Senior Project Biologist responsible for task management and editorial review of this memorandum.
David Olson, HDR|SWRI – Scientist responsible for technical review and management of the biological components of this memorandum.
David Reel, URS Corporation – URS Project Manager responsible for review and management of this memorandum.
William Snider, HDR|SWRI – Fisheries Biologist supporting coordination and review of this memorandum.
Jonathan Stead, URS Corporation – Project Ecologist responsible for revisions to this memorandum.
7.2 ACKNOWLEDGMENTS The preparers would like to acknowledge the input and field site participation of SFPUC and other City and County of San Francisco staff, third-party consultants, and resource agency staff. A partial list of these participants includes Kristine Atkinson, Leo Bauer, Jill Blanchard, David Briggs, Michael Carlin, John Chester, Cheryl Davis, Craig Freeman, Josh Fuller, Donn Furman, Paul Gambon, Marcia Grefsrud, Jeff Hagar, Mike Horvath, Janice Hutton, Dan Johnson, Ellen Levin, Steve Meirs, Josh Milstein, Joe Naras, Erik Olafsson, Ryan Olah, Tim Ramirez, Dave Rogers, Brian Sak, Jim Salerno, Steve Shaw, Gilbert Tang, Bill Trush, and Dan Wade.


8.0 References
Barriers January 2010 Page 8-1
8 REFERENCESBarnhart, R. A., 1986. Species Profiles: Life Histories and Environmental Requirements of Coast Fishes and
Invertebrates (Pacific Southwest)—Steelhead. U.S. Fish Wildl. Serv. Bio. Rep. 82 (11.60). U.S. Army Corps of Engineers, TR EL-82-4.
Bell, M. C., 1973. Fisheries Handbook of Engineering Requirements and Biological Criteria. Portland, OR: U.S. Army Engineering Division, North Pacific Corps of Engineers. Cited in Powers, P. D. and J. F. Orsborn, 1985. Analysis of Barriers to Upstream Migration: An Investigation of the Physical and Biological Conditions Affecting Fish Passage Success at Culverts and Waterfalls. BPA Report No. DOE/BP-36523-1.
CEMAR (Center for Ecosystem Management and Restoration), 2002. Draft Steelhead Restoration Action Plan for the Alameda Creek Watershed. Prepared for the Alameda Creek Fisheries Restoration Workgroup.
Bjorkstedt, E. P., B. C. Spence, J. C. Garza, D. G. Hankin, D. Fuller, W. E. Jones, J. J. Smith, and R. Macedo, 2005. An Analysis of Historical Population Structure for Evolutionary Significant Units of Chinook Salmon, Coho Salmon, and Steelhead in the North-Central California Coast Recovery Domain. U.S. Department of Commerce, National Oceanic and Atmospheric Administration, National Marine Fisheries Service, Southwest Fisheries Science Center, NOAA-TM-NMFS-SWFSC-382. October.
CEMAR (Center for Ecosystem Management and Restoration), 2009. Fish Passage Facility Update – December 2008. Available (February 2009): http://www.cemar.org/alamedacreek/alamedacreekindex.html.
Dibblee, T. W., Jr., 1973. Preliminary geologic map of the Calaveras Reservoir quadrangle, Alameda and Santa Clara Counties, California: U.S. Geological Survey Open-File Report 73-58, scale 1: 24,000.
Dibblee, T. W., Jr., 1980. Preliminary geologic map of the La Costa Valley quadrangle, Alameda County, California: U.S. Geological Survey Open-File Report 80-533-A, scale 1: 24,000.
DWR (Department of Water Resources) and SWRI, 2004. Final Report: Assessment of Potential Fish Passage Impediments above Lake Oroville’s High Water Mark, SP-F3.1, Task 1A. FERC Project No. 2100. May 20.
English, K. K., C. Sliwinski, B. Nass, and J. R. Stevenson, 2001. Assessment of Adult Steelhead Migration Through the Mid-Columbia River Using Radio-Telemetry. Prepared for Public Utility District, No. 2, Grant County, Public Utility District No. 1, Chelan County, and Public Utility District No. 1, Douglas County.
ETJV (EDAW & Turnstone Joint Venture), 2008. Calaveras Dam Replacement Project Fisheries Technical Report 2008. Prepared by Hagar Environmental Science and Thomas R. Payne and Associates for EDAW & Turnstone Joint Venture and SFPUC.
ETJV (EDAW-Turnstone Joint Venture) and ESA-Orion Joint Venture, 2008. Analysis of Potential Future Presence of Steelhead in Alameda Creek. July 7.
ETJV (EDAW-Turnstone Joint Venture) and Hydroconsult Engineers, Inc., 2008. Draft Mitigation and Monitoring Plan for Waters of the United States and State, Calaveras Dam Replacement Project, Alameda and Santa Clara Counties, California. Second Administrative Draft. Prepared for San Francisco Public Utilities Commission. November 2008.
Assessment of Fish Upstream Migration at Natural Barriers in the Upper Alameda Creek Sub-Watershed
Barriers January 2010 Page 8-2
Garza, J. C. and D. Pearse, 2008. Population Genetics of Oncorhynchus mykiss in the Santa Clara Valley Region. Final report to the Santa Clara Valley Water District. March.
Gunther, A. J., J. Hagar, and P. Salop, 2000. An Assessment of the Potential for Restoring a Viable Steelhead Trout Population in the Alameda Creek Watershed. Prepared for the Alameda Creek Fisheries Restoration Workgroup by Applied Marine Sciences, Livermore, CA, and Hagar Environmental Science, Richmond, California. February 7.
Hagar and Payne (Hagar Environmental Science and Thomas R. Payne and Associates), 2008. Draft Survey of Aquatic Habitat Conditions: Calaveras Creek Upstream of Calaveras Reservoir, Arroyo Hondo Upstream of the Large Slide, and Alameda Creek Upstream of Camp Ohlone. Prepared for EDAW Turnstone Joint Venture and SFPUC. October 3, 2008.
Hayes, Darrel, 2001. Conceptual Fish Passage Designs and Cost Estimates for Lower Alameda Creek. Prepared for the Alameda County Water District, Alameda County Flood Control and Water Conservation District by CH2M Hill, January 16, 2001.
Hegberg, C. H., S. Jacobs, P. A. Schlindwein, and S. J. Cohen, 2001. Natural Fish Passage Structures in Urban Streams - Part 2: Hydraulic Design and Analysis. 1-22.
Hoar, W. S. and D. J. Randall, 1978. Fish Physiology. Academic Press: New York. As cited in P. D. Powers and J. F. Orsborn, 1985.
Leidy, R. A., 2007. Ecology, Assemblage Structure, Distribution, and Status of Fishes in Streams Tributary to the San Francisco Estuary, California. SFEI Contribution #530. San Francisco Estuary Institute. Oakland, California.
Leidy, R.A., G. S. Becker, and B. N. Harvey, 2005. Historical Distribution and Current Status of Steelhead/Rainbow Trout (Oncorhynchus mykiss) in Streams of the San Francisco Estuary, California. Center for Ecosystem Management and Restoration, Oakland, CA.
McBain & Trush, Inc., 2008. Alameda Creek Population Recovery Strategies and Instream Flow Assessment for Steelhead Trout. Prepared for the Alameda Creek Fisheries Restoration Workgroup. January.
Moyle, P. B., 2002. Inland Fishes of California. Revised and expanded. University of California Press. Berkeley and Los Angeles, California.
Nielsen, J. L., 2003. Population Genetic Structure of Alameda Creek Rainbow/Steelhead Trout – 2002. U.S. Geological Survey, Alaska Science Center, Anchorage, Alaska. Final report submitted to Hagar Environmental Science. December 4.
Nilsen, T. H., 1975a. Preliminary photointerpretation map of landslide and other surficial deposits, La Costa Valley 7½-minute quadrangle, Alameda County, California: U.S. Geological Survey Open-File Report 75-277-23, scale 1: 24,000.
Nilsen, T. H., 1975b. Preliminary photointerpretation map of landslide and other surficial deposits, Calaveras Reservoir 7½-minute quadrangle, Alameda and Santa Clara Counties, California: U.S. Geological Survey Open-File Report 75-277-10, scale 1: 24,000.
NMFS, 2006. Endangered and Threatened Species: Final Listing Determinations for 10 Distinct Population Segments of West Coast Steelhead; Final Rule, National Oceanic and Atmospheric Administration, Department of Commerce. Federal Register 71:834-862.

8.0 References
Barriers January 2010 Page 8-3
Olson, D., 2009. Telephone conversation with Jonathan Stead, URS Corporation, regarding field work in support of the Upper Alameda Creek Sub-Watershed barriers assessment. June 22.
Powers, P. D. and J. F. Orsborn, 1985. Analysis of Barriers to Upstream Migration: An Investigation of the Physical and Biological Conditions Affecting Fish Passage Success at Culverts and Waterfalls. BPA Report No. DOE/BP-36523-1. Available at http://www.efw.bpa.gov/cgi-bin/efw/FW/publications.cgi.
Reiser, D. W., C. M. Huang, S. Beck, M. Gagner, and E. Jeanes, 2006. Defining Flow Windows for Upstream Passage of Adult Anadromous Salmonids at Cascades and Falls. Volume 135.
Sak, B., San Francisco Public Utilities Commission, 2009a. Personal communication. Email correspondence with Jonathan Stead, URS Corporation. January 13.
Sak, B., San Francisco Public Utilities Commission, 2009b. Personal communication. Email correspondence with Craig Freeman, SFPUC, titled “ACDD Passage Document: spawning surveys above ACDD to Camp Ohlone,” forwarded to Jonathan Stead, URS Corporation, by Craig Freeman. January 7.
Sak, B., 2006. B. Sak, Supervising Biologist, SFPUC Natural Resources Division, Fisheries and Wildlife Group, Sunol, California; Email Communication, Environmental Scientist, HDR, Sacramento, California; Fish Data Inquiry, April 10, 2006.
Sak, Brian, 2009. Brian Sak, San Francisco Public Utilities Commission. Personal communication. Email correspondence with Jonathan Stead, URS Corporation. January 13.
San Jose Mercury News, 2008. After five decades, steelhead trout babies spotted in Niles Canyon watershed. May 3. Available (February 2009) at http://www.alamedacreek.org/Media_Articles/San%20Jose%20Mercury%20News%205-3-08.pdf.
SFPD (San Francisco Planning Department), 2007. Draft Program Environmental Impact Report for the San Francisco Public Utility Commission’s Water System Improvement Program: Volume 3. “Section 5.4: Alameda Creek Watershed and Reservoirs.” State Clearinghouse No. 2005092026.
SFPD (San Francisco Planning Department), 2009. Draft Environmental Impact Report for the Calaveras Dam Replacement Project. City and County of San Francisco, San Francisco Planning Department, State Clearinghouse No. 2005102102. October 6.
SFPUC (San Francisco Public Utilities Commission), 1991. Memorandum to Larry E. Week, California Department of Fish and Game, from Norman H. Lougee, Water Supply Engineer, October 11, 1991.
SFPUC (San Francisco Public Utilities Commission), 2004. Alameda Creek Aquatic Resource Monitoring Report, 2002. Prepared by the San Francisco Public Utilities Commission, Water Quality Bureau, Sunol, California.
SFPUC (San Francisco Public Utilities Commission), 2006. Water System Improvement Program. January.
SFPUC (San Francisco Public Utilities Commission), 2007. Alameda Creek Little Yosemite to Diversion Dam 2006 Wetted Channel Monitoring Technical Memorandum No. 2-07-009. May.
SFPUC (San Francisco Public Utilities Commission), 2008. Memorandum Regarding Calaveras Dam Replacement Project and Alameda Creek Fishery Enhancement Project Descriptions. Sent August 19 from Ed Harrington, General Manager and Michael P. Carlin, Assistant General Manager to Diana Sokolove, Major Environmental Analysis, San Francisco Planning Department.

Assessment of Fish Upstream Migration at Natural Barriers in the Upper Alameda Creek Sub-Watershed
Barriers January 2010 Page 8-4
SFPUC (San Francisco Public Utilities Commission), 2009. Alameda Watershed Habitat Conservation Plan informational webpage. Available (March 2009): http://sfwater.org/mto_main.cfm/MC_ID/20/MSC_ID/188/MTO_ID/401.
Shapovalov, L., and A. C. Taft, 1954. The Life Histories of the Steelhead Rainbow Trout (Salmo gairdneri gairdneri) and Silver Salmon (Oncorhynchus kisutch), with Special Reference to Waddell Creek, California, and Recommendations Regarding Their Management. California Department of Fish and Game, Fish Bulletin No. 98.
Stern, Gary, 2005. Email correspondence between Gary Stern, National Marine Fisheries Service, and Janice Hutton, copied to Craig Freeman, San Francisco Public Utilities Commission. December 19.
TAC (Technical Advisory Committee), 1989. “Establishment of a Steelhead Fishery in Alameda Creek.” May.
URS (URS Corporation), 2009. Geologic Evaluation of Potential Barriers to Upstream Fish Migration in the Upper Alameda Creek Sub-Watershed. File memo from Senior Engineering Geologist David Simpson to Senior Project Biologist Steve Leach. December.
URS and HDR, 2009a. Feasibility of Fish Passage at Calaveras Dam. Prepared for San Francisco Public Utilities Commission. June.
URS and HDR, 2009b. Feasibility of Fish Passage at the Alameda Creek Diversion Dam. Prepared for San Francisco Public Utilities Commission. June.
URS and HDR, 2009c. Assessment of Fish Migration at Riffles in Sunol Valley Quarry Reach of Alameda Creek. Prepared for San Francisco Public Utilities Commission. In preparation.
USGS (U.S. Geological Survey), 2009a. National Water Information System: Web Interface. USGS Gage 11172945, Alameda Creek above Diversion Dam. Downloaded from http://waterdata.usgs.gov/ca/nwis/nwisman/?site_no=11172945&agency_cd=USGS.
USGS (U.S. Geological Survey), 2009b. National Water Information System: Web Interface. USGS Gage 11173200, Arroyo Hondo. Downloaded from http://waterdata.usgs.gov/ca/nwis/nwisman/?site_no=11173200&agency_cd=USGS.
Wentworth, C.M., S. E. Graham, R. J. Pike, G. S. Beukelman, D. W. Ramsey, and A. D. Barron, 1997. San Francisco Bay Region Landslide Folio Part C - Summary distribution of slides and earth flows in the San Francisco Bay region, California: U.S. Geological Survey Open-File Report 97-0745-C.
Whitney, R. R., L. D. Calvin, M. W. Erho Jr., and C. C. Coutant, 1997. Downstream Passage for Salmon at Hydroelectric Projects in the Columbia River Basin: Development, Installation, and Evaluation. Portland, Oregon: Northwest Power Planning Council.
Wood Rodgers, 2007. Alternatives Evaluation Report, Lower Alameda Creek/BART Weir Fish Passage Assessment. Prepared for Alameda County Flood Control and Water Conservation District. December 14.
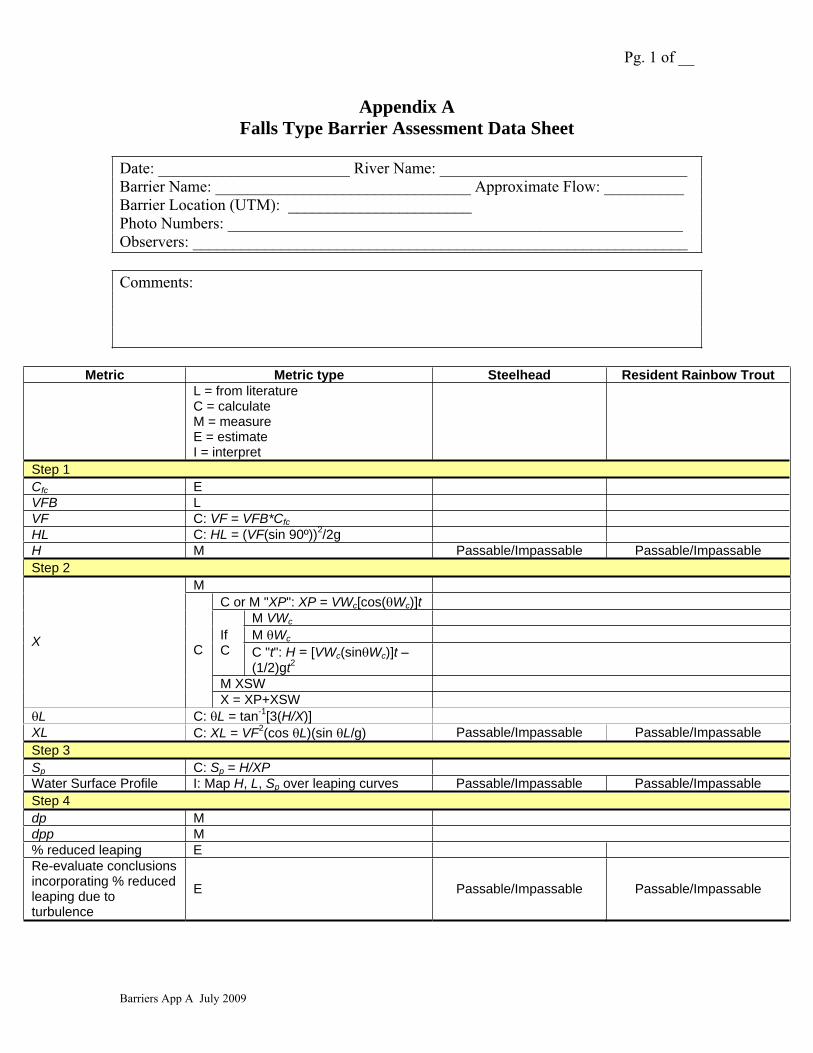
Pg. 1 of __
Barriers App A July 2009
Appendix A Falls Type Barrier Assessment Data Sheet
Date: ________________________ River Name: _______________________________ Barrier Name: ________________________________ Approximate Flow: __________ Barrier Location (UTM): _______________________ Photo Numbers: _________________________________________________________ Observers: ______________________________________________________________
Comments:
Metric Metric type Steelhead Resident Rainbow Trout L = from literature C = calculate M = measure E = estimate I = interpret
Step 1 Cfc E VFB L VF C: VF = VFB*Cfc HL C: HL = (VF(sin 90º))2/2g H M Passable/Impassable Passable/Impassable Step 2
MC or M "XP": XP = VWc[cos( Wc)]t
M VWc
M WcIfC C "t": H = [VWc(sin Wc)]t –
(1/2)gt2
M XSW
X C
X = XP+XSW L C: L = tan-1[3(H/X)]
XL C: XL = VF2(cos L)(sin L/g) Passable/Impassable Passable/Impassable Step 3 Sp C: Sp = H/XPWater Surface Profile I: Map H, L, Sp over leaping curves Passable/Impassable Passable/Impassable Step 4 dp Mdpp M% reduced leaping E Re-evaluate conclusions incorporating % reduced leaping due to turbulence
E Passable/Impassable Passable/Impassable
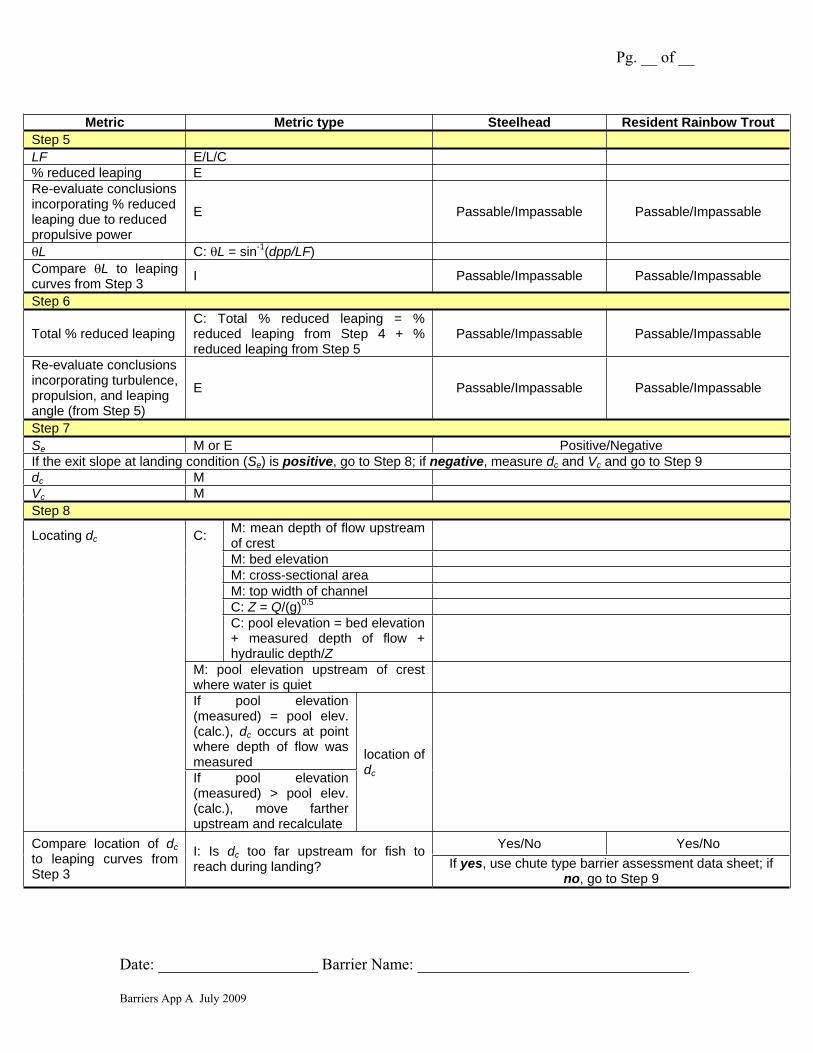
Pg. __ of __
Date: ____________________ Barrier Name: __________________________________
Barriers App A July 2009
Metric Metric type Steelhead Resident Rainbow Trout Step 5 LF E/L/C % reduced leaping E Re-evaluate conclusions incorporating % reduced leaping due to reduced propulsive power
E Passable/Impassable Passable/Impassable
L C: L = sin-1(dpp/LF)Compare L to leaping curves from Step 3 I Passable/Impassable Passable/Impassable
Step 6
Total % reduced leaping C: Total % reduced leaping = % reduced leaping from Step 4 + % reduced leaping from Step 5
Passable/Impassable Passable/Impassable
Re-evaluate conclusions incorporating turbulence, propulsion, and leaping angle (from Step 5)
E Passable/Impassable Passable/Impassable
Step 7 Se M or E Positive/Negative If the exit slope at landing condition (Se) is positive, go to Step 8; if negative, measure dc and Vc and go to Step 9 dc MVc MStep 8
Locating dc C: M: mean depth of flow upstream of crest
M: bed elevation M: cross-sectional area M: top width of channel C: Z = Q/(g)0.5
C: pool elevation = bed elevation + measured depth of flow + hydraulic depth/Z
M: pool elevation upstream of crest where water is quiet If pool elevation (measured) = pool elev. (calc.), dc occurs at point where depth of flow was measuredIf pool elevation (measured) > pool elev. (calc.), move farther upstream and recalculate
location of dc
Yes/No Yes/No Compare location of dcto leaping curves from Step 3
I: Is dc too far upstream for fish to reach during landing? If yes, use chute type barrier assessment data sheet; if
no, go to Step 9

Pg. __ of __
Date: ____________________ Barrier Name: __________________________________
Barriers App A July 2009
Metric Metric type Steelhead Resident Rainbow Trout Step 9 df E % reduced propulsion E
% propulsion capability C: % propulsion capability = 1 – % reduced propulsion
VFSlit L
VFS C: VFS = (VFSlit)(% propulsion capability)
Step 10
Combined % reduced abilities
C: Combined % reduced abilities = Total % reduced leaping from Step 6 + % reduced propulsion from Step 9
Final Evaluation Passable/Impassable Passable/Impassable
Metric Definitions
Cfc = coefficient of fish conditiondc = critical depth df = body depth of fishdp = depth the falling water plunges dpp = depth in the plunge pool g = acceleration due to gravity 32.2 ft/s2
H = vertical change in surface elevation; i.e., height of barrier HL = height of fish leap L = angle of fish leap
LF = length of fish Se = fish exit slope (slope at fish landing location Sp = fish passage slope (water transition; X/XP)Vc = mean velocity at critical depth (dc)VF = fish velocity VFB = fish burst speed velocityVFSlit = sustained speed of fish from literature VFS = sustained speed of fish calculated VWc = water velocity (c=crest) as it leaves the crest Wc = angle the water leaves the crest at in relation to the horizontal
X = horizontal distance from crest of falls to standing wave XL = horizontal distance of the fish’s leap at the highest point of the leap XP = horizontal distance from the crest to the point of the falling water XSW = horizontal distance from point where falling water plunges to standing wave