national waste management startegy
TRANSCRIPT

Ministry of Natural Resources and EnvironmentMinistry of Natural Resources and Environment
National Waste Management Strategy
2019-2023
National Waste Management Strategy
2019-2023


National Waste Management Strategy
(2019-2023)
Ministry of Natural Resources and Environment


National Waste Management Strategy Ministry of Natural Resources and Environment
1
Table of Contents
Part 1 Executive Summary .................................................................. 6
1 Introduction ............................................................................................ 6 2 Scope of the NWMS ............................................................................... 6 3 Strategy ................................................................................................... 7
3.1 Vision .............................................................................................................. 7 3.2 Mission ........................................................................................................... 7 3.3 Guiding Principles .......................................................................................... 7 3.4 Priority areas ................................................................................................... 7 3.5 Top Priority Activities .................................................................................... 8 3.6 Monitoring Framework (Indicators) ............................................................... 9
Part 2 Strategy Context ...................................................................... 10
1 General Background ............................................................................. 10 1.1 Geographic features and location ................................................................. 10 1.2 Population ..................................................................................................... 11 1.3 Social organization ....................................................................................... 12
2 Understanding Solid Waste Management System ................................ 13 2.1 Waste generation amount and composition .................................................. 13 2.2 Waste collection............................................................................................ 16 2.3 Final disposal ................................................................................................ 20 2.4 Revenue and expenditure on SWM .............................................................. 22 2.5 Statistic information availability on SWM ................................................... 22 2.6 3R activities .................................................................................................. 22 2.7 Waste Stream in Upolu and Savaii ............................................................... 24 2.8 Legal and institutional framework ................................................................ 26
3 Understanding Chemical and Hazardous Waste Management System 32 3.1 Current situation of Chemical and Hazardous Waste Management ............. 32 3.2 Legal and institutional framework ................................................................ 33
4 Issues and Challenges ........................................................................... 34 4.1 Solid Waste Management Issues and Challenges ......................................... 34 4.2 Chemical and Hazardous Waste Management Issues and Challenges ......... 35
Part 3 Strategy .................................................................................... 36
1 Purpose ................................................................................................. 36 2 Formulation Process ............................................................................. 36 3 Priority areas ......................................................................................... 37 4 Risks ..................................................................................................... 38

National Waste Management Strategy Ministry of Natural Resources and Environment
2
5 Assumptions ......................................................................................... 38 6 Action Plan ........................................................................................... 38 7 Monitoring and Evaluation ................................................................... 51
7.1 Measuring Progress ...................................................................................... 51 7.2 Periodic Review of the Action Plan .............................................................. 51 7.3 NWMS Steering Committee ......................................................................... 51 7.4 NWMS Sub Steering Committee .................................................................. 52 7.5 Financial Considerations .............................................................................. 53
Part 4 Annex ....................................................................................... 54
1 Future forecast of indicators ................................................................. 54 2 ToR for Steering Committee ................................................................ 60 3 References ............................................................................................ 61

National Waste Management Strategy Ministry of Natural Resources and Environment
3
Acronyms
AG Attorney General CDL Container Deposit Legislation CHWM Chemical and Hazardous Waste Management EPC Electric Power Corporation JICA Japan International Cooperation Agency LTA Land Transport Authority MAF Ministry of Agriculture & Fisheries MCIL Ministry of Commerce Industry & Labour MESC Ministry of Education Sports & Culture MFAT Ministry of Foreign Affairs & Trade MfR Ministry for Revenue MJCA Ministry of Justice & Courts Administration MNRE Ministry of Natural Resources and Environment MOF Ministry of Finance MOH Ministry of Health MOP Ministry of Police MPE Ministry of Public Enterprises MPMC Ministry of the Prime Minster & Cabinet MWCSD Ministry of Women Community & Social Development MWTI Ministry of Works & Transport & Infrastructure NHS National Health Services NUS National University of Samoa NWMS National Waste Management Strategy POPs Persistent Organic Pollutants PSC Public Service Commission SAA Samoa Airport Authority SBS Samoa Bureau of Statistics SCC Samoa Chamber of Commerce SFESA Samoa Fire Emergency Services Authority SLC Samoa Land Corporation SPA Samoa Port Authority SPREP Secretariat of the Pacific Regional Environment Programme SROS Scientific Research Organization of Samoa SRWMA Samoa Recycling & Waste Management Association SSC Samoa Shipping Corporation STA Samoa Tourism Authority SUNGO Samoa Umbrella of Non-Governmental Organization SWA Samoa Water Authority SWM Solid Waste Management USP University of South Pacific / Alafua

National Waste Management Strategy Ministry of Natural Resources and Environment
4
Foreword
The formulation of the National Waste Management Strategy of Samoa is one of mandates under Waste Management Act 2010 and also triggered by the need to respond to significant changes in the waste sector in the Pacific Region and globally. In particular, the changing consumption pattern in the last ten years saw the proliferation of more wasteful imported products. With current constraints on land space, resources, inadequacy in institutional and human capacity, the increased generation of wastes becomes very challenging.
The sustained proper management of wastes will rely on a roadmap to guide the government and relevant stakeholders in delivering desired outcomes, by way of an endorsed strategy and its implementation. This National Waste Management Strategy will be a milestone for Samoa being the first to be endorsed. Through this Strategy, the Government of Samoa can facilitate approaches that minimizes the volume of wastes generated in the islands and diverting more wastes away from disposal sites with very limited capacity. This Strategy will also explore every possible opportunity to reduce, re-use and recycle waste materials to reduce operational costs and health/environmental impacts. Apart from this, resilience strategies through proper waste management can also contribute to addressing global issues such as resource depletion and climate change.
The Strategy also considers the National obligations in the SDGs Goal 11.6 specifically and the SDS which again in line with the current National Environment Sector Plan (NESP).
I would like to convey my sincere gratitude and appreciation with the continuous assistance and partnership with JICA through the Japanese Technical Cooperation Project for Promotion of Regional Initiative on Solid Waste Management in Pacific Island Countries Phase II (J-PRISM II) and the tireless assistance by SPREP in assisting Samoa in the Waste Management and thus the development of this National document to guide the sound and environmentally friendly management of wastes in Samoa.
Just a kind reminder to us all; “Waste Management is Everyone’s’ Responsibility.
Thank you,

National Waste Management Strategy Ministry of Natural Resources and Environment
5
About the document This document consist 4 parts as follows,
Part 1 Executive Summary
Part 1 summarizes the key contents of strategy for quick reference.
Part 2 Strategy Context
Part 2 provides context for the development of the National Waste Management Strategy and summarizes the institutional mechanisms governing the management of wastes in the country as well as the issues and challenges faced in the delivery of waste services. It also highlights current efforts in waste management and resource recovery and presents the drivers for change based on issues besetting the waste management.
Part 3 Strategy
Part 3 presents the strategic actions which will define the direction Samoa has to take to address the key issues presented in Part 2.
Part 4 Annex
Part 4 provides detail information regarding contents in this document and references.

National Waste Management Strategy Ministry of Natural Resources and Environment
6
Part 1 Executive Summary
1 Introduction
Improvement of waste management is a key environmental issue in Samoa and it is one of the global issues as well. Prior to the formulation of National Waste Management Strategy, “Cleaner Pacific 2025” which is waste management strategy for pacific region, was developed and addressed key waste issues and countermeasures at the regional level with action plan for 2016-2025 (SPREP, 2014). On the other hand, Samoan government addressed waste management in the Strategy for the Development of Samoa (SDS) 2016/17 - 2019/20 under priority area 4 Environment, which also refers relevant Sustainable Development Goals (MOF, 2016). National Environment Sector Plan (NESP) 2017-2021 (MNRE, 2017) also addressed waste management under “Sustainable and Resilient Built Environment”.
Formulation of National Waste Management Strategy (NWMS) is also required under the Waste Management Act 2010 (MNRE, 2010). The act addresses 17 Functions of MNRE and the formulation of the NWMS is one of these functions. This strategy will guide the waste management of Samoa for the period of 2019 to 2023 based on the baseline data collected through several surveys and outcomes of series of discussions amongst stakeholders in broad aspects of waste management in Samoa. The NWMS will be revised in 2023 based on review of progress.
Considering the alignment and context mentioned above, as well as comments collected through consultation in the process of the formulation, National Waste Management Strategy (2019-2023) has been developed as integrated waste management strategy which targets both solid wastes and chemical and hazardous wastes to address priority actions to be taken for the next 5 years from 2019.
2 Scope of the NWMS
The NWMS has been developed by covering solid waste and chemical and hazardous waste. Solid waste which includes general waste generated from households and businesses, while chemical and hazardous waste is a substance or matter which is toxic or poisonous or may cause injury or damage to human health or the environment as well as those items specified under international conventions.
Figure 1-1 Definition of waste in the strategy
• •

National Waste Management Strategy Ministry of Natural Resources and Environment
7
3 Strategy
3.1 Vision
Clean and Healthy Samoa
3.2 Mission
Collaboration with every citizen through participatory approach and commitment to waste management
3.3 Guiding Principles
Reduce, Reuse, Recycle, Return Polluter pays principle Public consultation and participation Sound decision making Selection of appropriate and affordable technology Public-private partnership
3.4 Priority areas
A: Enhance environmental awareness of the public on waste related issues and the countermeasures
B: Strengthen operational planning on SWM
C: Implement regular survey for Basic SWM data collection
D: Study Feasibility of future SWM options
E: Establish efficient monitoring system on SWM operation
F: Strengthen legal framework and enforcement
G: Improve capacity of officials related to SWM
H: Improve Chemical and Hazardous Waste Management
National Waste Management Strategy Ministry of Natural Resources and Environment
8
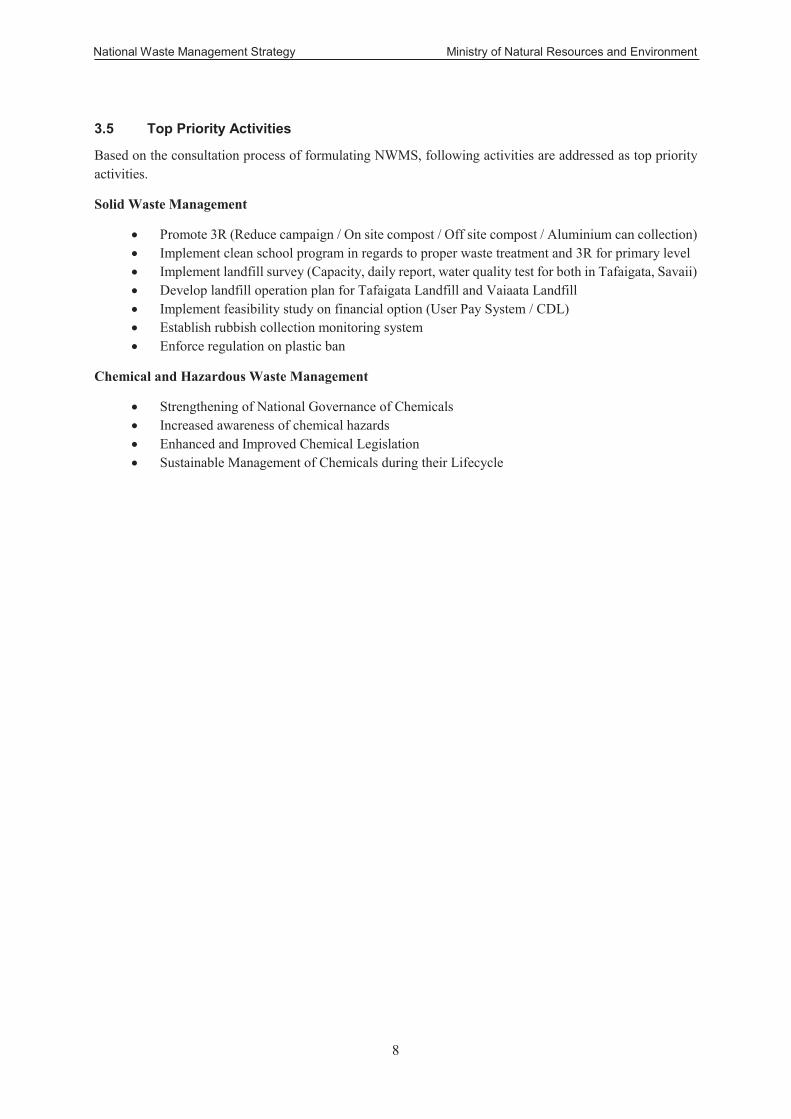
3.5 Top Priority Activities
Based on the consultation process of formulating NWMS, following activities are addressed as top priority activities.
Solid Waste Management
Promote 3R (Reduce campaign / On site compost / Off site compost / Aluminium can collection) Implement clean school program in regards to proper waste treatment and 3R for primary level Implement landfill survey (Capacity, daily report, water quality test for both in Tafaigata, Savaii) Develop landfill operation plan for Tafaigata Landfill and Vaiaata Landfill Implement feasibility study on financial option (User Pay System / CDL) Establish rubbish collection monitoring system Enforce regulation on plastic ban
Chemical and Hazardous Waste Management
Strengthening of National Governance of Chemicals Increased awareness of chemical hazards Enhanced and Improved Chemical Legislation Sustainable Management of Chemicals during their Lifecycle

National Waste Management Strategy Ministry of Natural Resources and Environment
9
3.6 Monitoring Framework (Indicators)
The following tables show indicators’ baseline as of 2017 and those target goals for 2023 which are planned to be achieved through implementation of action plan in the NWMS. The progress and achievement of the NWMS are measured not only by monitoring implementation of activities in the action plan but also the changes in the value of indicators during 5 years by 2023.
3.6.1 Solid Waste Management Indicators
No. Indicator Baseline as of 2017
Forecast in 2023
(Without strategic actions)
Target by 2023 (With
strategic actions)
1 Household waste discharged amount (g/person/day) 387 394 367
2 Organic waste in discharged waste from household (g/person/day) 165 168 140
3 Recycling ratio of aluminum cans from household in Upolu (%) 44 44 61
4 Collection coverage for household in Upolu by amount (%) 38 39 61
5 Collection coverage for Upolu by track (%) 61 61 80 6 Ratio of unmanaged waste in Upolu (%) 58 58 47 7 Ratio of SWM revenue in cost (%) 3 3 5
8 Newly available or updated performance Indicator during 2018-2023 0 0 8
9 Number of legal framework developed or enhance enforcement during 2018-2023 0 0 5
10 Number of accident at landfill 2 2 0 11 Number of complaints for waste collection service 100 100 50
12 Ratio of plastics in discharged waste from household (%) 16 16 8
13 Number of Schools involved in clean school program 0 0 10
3.6.2 Chemical and Hazardous Waste Management Indicators
No. Indicator Baseline as of 2017
Forecast in 2023
(Without strategic actions)
Target by 2023 (With
strategic actions)
1 Number of New Inventories Identified 0 0 2
2 Number of awareness programs conducted for CHWM 6 10 20
3 Number of regulating tools developed 0 0 2 4 Number of minimization programs conducted 0 0 4

National Waste Management Strategy Ministry of Natural Resources and Environment
10
Part 2 Strategy Context
1 General Background
1.1 Geographic features and location
The Independent State of Samoa is situated in the south of equator, approximately 1,800 miles away from New Zealand and 80 miles away from American Samoa. The Independent State of Samoa consists of two main islands, Savaii and Upolu, with eight smaller islands Apolima, Manono, Fanuatapu, Namu’a, Nu’utele,Nu’ulua, Nu’ulopa, and Nu’usafe’e. The total land area is 2830 square km. (SBS, 2018).
Figure 2-1 Map of Samoa
Samoa is rich in nature resources and 60 percent of area is forested as of 2009 (FAO, 2009). Both of main islands have relatively mountainous landscape with symbolic mountains, the Mount Fito (1,110m) in Upolu Island and the Mount Silisili (1,848m) in Savaii Island. While most of the settlements are concentrated along the narrow flat land along costal line for both of main islands. Road network is developed on both islands connecting all villages.
Samoa has a tropical climate with distinction dry season (May-Oct) and wet season (June-Sep). The average temperature is 26-27 degree Celsius throughout the year (MNRE, 2016). Occasionally, tropical cyclone strikes the nation and causes serious impacts on SWM.

National Waste Management Strategy Ministry of Natural Resources and Environment
11
Figure 2-2 Rainfall and temperature
1.2 Population
According to the national census (SBS, 2017), the population as of 2016 is 151,364 in Upolu, 884 in Manono, 96 in Apolima and 43,499 in Savaii with a total population of 195,843. The total population in 2023 is estimated to be 207,075 with the annual population growth rate of 1,605 persons/year.
Figure 2-3 Population estimates of Samoa

National Waste Management Strategy Ministry of Natural Resources and Environment
12
1.3 Social organization
The nation is divided into 48 districts with total of 338 villages. At the village level, the governance is through a traditional body of village councils. The village council consists of matais representative of each family in the village. The Matai plays an important role in broad aspect of local community affairs by making important decisions for the village and formulation of village rules and laws. Village mayors are the Government arm as a representative of the Government in the village under the administration of the MWCSD.
Further, each village appoints a representative called sui o le nuu from the matai which works for interactive communication between the government and the village.
Samoan government usually consults these representatives and ascertains the cooperation from the community for implementing the Strategies, Policies, etc. The following table shows the number of districts and villages in Samoa (SBS, 2017).
Table 2-1 Number of districts and villages in Samoa
Island Number of district Number of village Upolu 29 229 Savaii 19 102 Manono (Under Aiga i le Tai district in
Upolu) 6
Apolima 1 Total 48 338

National Waste Management Strategy Ministry of Natural Resources and Environment
13
2 Understanding Solid Waste Management System
This section highlights baseline information on SWM and also provides legal framework which governs the overall management of solid waste on the national level.
2.1 Waste generation amount and composition
Waste amount and composition is one of the fundamental indicators of SWM which enables to estimate the amount of waste generated in the country and thus highlight the dominant waste category occupies by ratio in total. Two different concepts of “waste amount” were adopted to consider waste amount and composition. One is “Waste generation amount” and the other is “Waste discharged amount”. “Waste generation amount” refers to all kinds of waste generated at generation source. “Waste discharged amount” only includes waste categories which are discharged on the platform (Waste collection point). There is also a concept of “Potential Waste” which could be waste but are not generated actually by practicing Reduce, Reuse, Refuse and Repair policy at waste generation source but it is quite difficult to measure the potential waste amount, hence this concept was excluded from the analysis. Above mentioned concept of “waste amount” is summarized in the figure below.
Figure 2-4 Concept of waste amount
The Waste Generation Amount and Waste discharged amount and those compositions were surveyed with Waste Audit conducted in Nov 2017. The audit was conducted by collecting waste samples from selected 40 households with 365 persons in 5 villages for 1 week. As a result of the survey, the waste generation amount was identified as 1,060 g/person/day and discharged amount was 387g/person/day. Major waste categories in discharged waste were organic waste (Green waste + Food scrap) (43%) followed by Plastics (16%), paper and cardboard (13%) and Diaper (12%).
Table 2-2 Waste Generation Amount and Waste Discharged Amount
Waste Generation Amount (g/person/day) 1,060 Waste Discharged Amount (g/person/day) 387
PotentialWaste
Self DisposalOn site
Recycling
TotalDischarged
Waste
Waste Generation Am
ount
Waste Discharged
Amount
Waste prevention measure practiced at waste generation source(Reduce/Reuse/Refuse/Repair etc. )
Practices conducted at waste generation source (Open Burning/Open Dumping/Feeding Animal/On-site Compost/Returnable Glass bottle Separation)
Discharged waste from the generation source(Collected waste/Uncollected waste/Illegal dumping)

Nat
iona
l Was
te M
anag
emen
t Stra
tegy
M
inis
try o
f Nat
ural
Res
ourc
es a
nd E
nviro
nmen
t
14
Figu
re 2
-5 C
ompo
sitio
n fo
r gen
erat
ion
was
te
15%
42%
4%1%4%
1%1%
4%
23%
0%2%
0%0%
1%0%
0%
Com
posit
ion
for g
ener
atio
n w
aste
(g/p
erso
n/da
y)
1. G
reen
2. F
ood
Scra
p3.
Pap
er4.
Car
dboa
rd5.
Pla
stic
bags
/pap
ers
6. P
ET b
ottle
s7.
Pla
stic
cont
aine
rs8.
Dia
per
9. G
lass
10. C
eram
ic11
. Ste
el12
. Alu
min
ium
13. O
ther
met
al14
. Tex
tile
15. R
ubbe
r

Nat
iona
l Was
te M
anag
emen
t Stra
tegy
M
inis
try o
f Nat
ural
Res
ourc
es a
nd E
nviro
nmen
t
15
Figu
re 2
-6 C
ompo
sitio
n fo
r dis
char
ged
was
te
7%
36%
10%
3%
10%
2%4%
12%
4%1%6%
1%1%
3%
1%1%
Com
posit
ion
for d
ischa
rged
was
te(g
/per
son/
day)
1. G
reen
2. F
ood
Scra
p3.
Pap
er4.
Car
dboa
rd5.
Pla
stic
bags
/pap
ers
6. P
ET b
ottle
s7.
Pla
stic
cont
aine
rs8.
Dia
per
9. G
lass
10. C
eram
ic11
. Ste
el12
. Alu
min
ium
13. O
ther
met
al14
. Tex
tile
15. R
ubbe
r

National Waste Management Strategy Ministry of Natural Resources and Environment
16
Comparing the result with waste audit results in 2011 (MNRE, 2011), there is a slight increase in waste discharge amount (7g/person/day). If we consider entire of Samoa, waste discharge amount is estimated as 71.4 ton/day as of 2011 with the population of 187,820, while it is estimated as 76.4 ton/day with the population of 197,448 as of 2017 which indicates 5 tons of increase in daily waste discharge amount nationwide. As for waste composition, organic waste (Green waste, food scrap) is still the most dominant category in household waste. The composition was changed slightly by increase of paper, cardboard, plastics and textiles.
2.2 Waste collection
2.2.1 Waste collection system
MNRE provides waste collection service for all households and small businesses located in collection zone by its contractors.
Majority of the households and small businesses located in the collection zones have “Plat form” which are raised waste collection (or discharge) point made of concrete block or other locally available materials and are visually placed along the roadside.
On the other hand, there are households which don’t have access to the waste collection services although they are located within the collection zone. Actual situation of collection points and collection service provided by contractors in both Upolu Island and Savaii Island were surveyed through the time and motion survey conducted in 2017.
Table 2-4 below summarizes collection points confirmed in time and motion survey in Upolu Island.
Among 6,260 collection points, waste of 5,287 collection points (84.5 percent) were collected while 34 (0.5 percent) were mistakenly not collected. The other 939 collection points (15.0 percent) were without waste even though the day was the collection day.
Except for the above mentioned collection points, there were 258 cases confirmed that even there were not collection points but waste was collected directly from resident.
Basically, the collection vehicle stops by each of collection points and collect the waste discharged on the collection points. As for those houses without collection points, the waste only collected when the residents of those houses are waiting in front of the road with the waste when the collection vehicle arrives, otherwise their wastes are not collected and which might potentially cause open dumping.
Table 2-3 Collection Point in Upolu Island
Category No. Proportion (%) Collected CP 5,287 84.5 Uncollected CP 34 0.5 Empty CP 939 15.0 Total No of CP 6260 100.0 Waste collected without CP 258

National Waste Management Strategy Ministry of Natural Resources and Environment
17
There are 14 zones in the Upolu and 4 zones in the Savaii. The coverage of collection service for each zone was identified based on the actual track taken at the time and motion survey. As a result, approximately 60 percent of the length of designated road was collected while the other 40 percent of the road was not collected.
The overall result of time & motion survey indicates that contractors are mostly collecting waste in the area where they normally take, while not covering all the designated areas.
In order to examine the cause of the low collection coverage, implementation of regular monitoring on contractor’s performance and user’s discharge manner as well as development of user database to identify the location of problematic points are required.

Nat
iona
l Was
te M
anag
emen
t Stra
tegy
M
inis
try o
f Nat
ural
Res
ourc
es a
nd E
nviro
nmen
t
18
Figu
re 2
-7 W
aste
col
lect
ion
serv
ice
map
in U
polu
(inc
ludi
ng M
anon
o an
d Ap
olim
a)

Nat
iona
l Was
te M
anag
emen
t Stra
tegy
M
inis
try o
f Nat
ural
Res
ourc
es a
nd E
nviro
nmen
t
19
Fi
gure
2-8
Was
te C
olle
ctio
n Se
rvic
e M
ap in
Sav
aii

National Waste Management Strategy Ministry of Natural Resources and Environment
20
Table 2-4 Collection route and actual track at the T&M Survey
ID Zone Route (m) Actual track (m) Coverage (%) 1 A 27,208 21,392 79 2 B1 41,996 29,539 70 3 B2 55,998 28,583 51 4 B3 67,271 26,625 40 5 C1 37,862 24,403 64 6 C2 63,848 52,223 82 7 D1 40,491 18,331 45 8 D2 117,533 72,999 62 9 E1 54,215 20,349 38
10 E2 49,737 19,456 39 11 E3 91,087 55,577 61 12 F1 56,693 48,870 86 13 F2 81,961 56,044 68 14 Fagaloa 20,833 20,833 100 15 M/A N/A N/A N/A 16 Savaii1 61,517 34,991 57 17 Savaii2 101,075 74,089 73 18 Savaii3 76,626 56,349 74 19 Savaii4 106,323 69,999 66
2.3 Final disposal
2.3.1 Location and area of landfill
In Samoa, there are 2 approved landfills namely, Tafaigata Landfill and Vaiaata Landfill. There are 15.4 acres for Tafaigata and 9.8 acres for Vaiaata Landfill including related functions or facilities of landfills. However, there is no system in place to monitor the remaining capacity and operation.
Table 2-5 Outline of approved landfill in Samoa
Tafaigata Landfill Vaiaata Landfill Location Tafaigata, Upolu Island Vaiaata, Savaii Island Area of Landfill 15.4 acres 9.8 acres
2.3.2 Functions of landfills
There are known and systematic functions of landfills. There is a waste separation and collection system already in place at Tagfaigata Landfill. Basically recyclables at the landfill area are separately collected by registered waste pickers and recyclers based within the landfill site and recyclers buy those recyclables from the waste pickers. There is composting yard within the landfill area at Tafaigata Landfill but currently not fully functioning due to lack of staffs with relevant skills.

National Waste Management Strategy Ministry of Natural Resources and Environment
21
Table 2-6 Functions of landfill
Tafaigata Landfill Vaiaata Landfill Separation and collection Recyclables such as
Aluminum can, Aluminum, White goods are separated by waste pickers and recycling company
N/A
Compost N/A (There is compost yard but currently not operated)
N/A
Disposal General waste from household and businesses is accepted.
General waste from household and businesses is accepted.
Incinerator for healthcare waste
Healthcare waste is incinerated.
Healthcare waste is incinerated.
Leachate Pond Quality of the leachate is monitored in 2018.
Quality of the leachate is not monitored.
2.3.3 Incoming waste
Wastes collected by the contractors as well as waste directly transported by public institutions, businesses and individuals are accepted at the landfills. According to incoming waste record taken at Tafaigata Landfill during 1 week in Jan 2018, 45 tons was recorded from incoming wastes on a daily average. Majority of incoming vehicles are from contractors.
Table 2-7 Incoming waste record at Tafaigata Landfill
Date Day No. of incoming
vehicle with waste (No.)
Total weight (kg)
2018/1/29 Mon 46 66,791 2018/1/30 Tue 44 89,045 2018/1/31 Wed 36 31,745 2018/2/1 Thu 33 37,121 2018/2/2 Fri 54 56,771 2018/2/3 Sat 39 33,693 2018/2/4 Sun(Closed) 0 0
Total 252 315,166 Daily average
(Excludes Sunday) 42 52,528
Daily average (Includes Sunday)
36 45,023
National Waste Management Strategy Ministry of Natural Resources and Environment
22
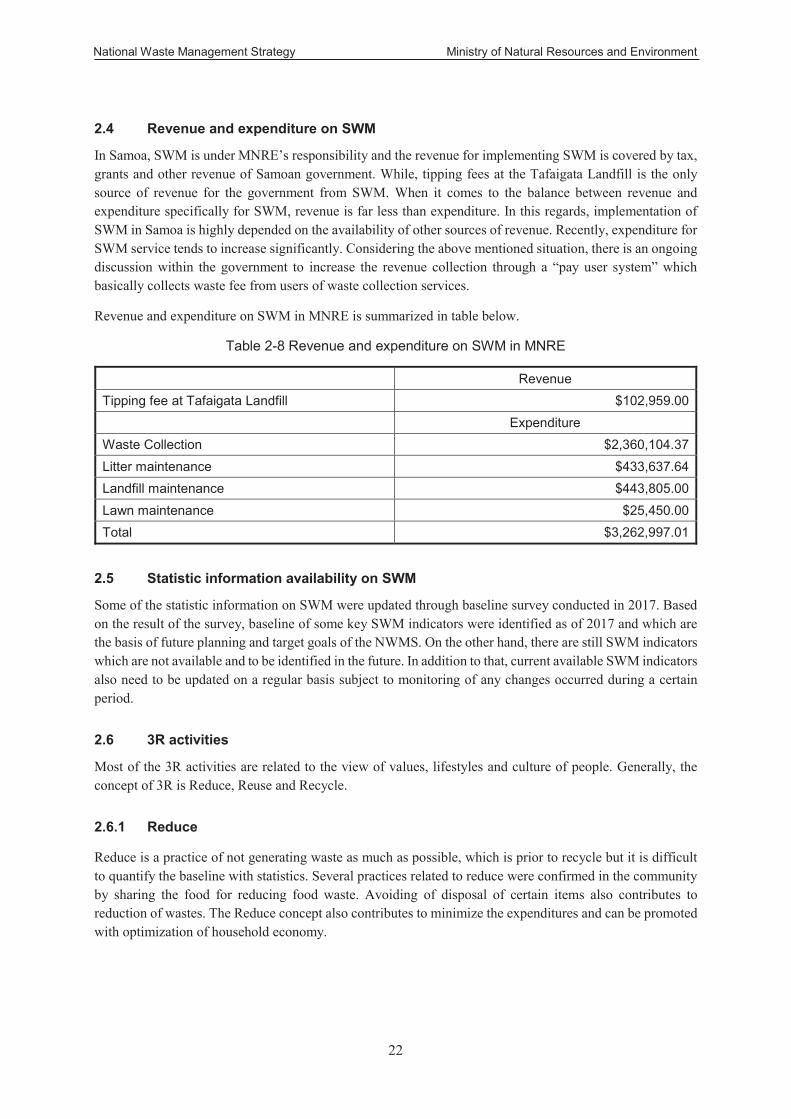
2.4 Revenue and expenditure on SWM
In Samoa, SWM is under MNRE’s responsibility and the revenue for implementing SWM is covered by tax, grants and other revenue of Samoan government. While, tipping fees at the Tafaigata Landfill is the only source of revenue for the government from SWM. When it comes to the balance between revenue and expenditure specifically for SWM, revenue is far less than expenditure. In this regards, implementation of SWM in Samoa is highly depended on the availability of other sources of revenue. Recently, expenditure for SWM service tends to increase significantly. Considering the above mentioned situation, there is an ongoing discussion within the government to increase the revenue collection through a “pay user system” which basically collects waste fee from users of waste collection services.
Revenue and expenditure on SWM in MNRE is summarized in table below.
Table 2-8 Revenue and expenditure on SWM in MNRE
Revenue Tipping fee at Tafaigata Landfill $102,959.00 Expenditure Waste Collection $2,360,104.37 Litter maintenance $433,637.64 Landfill maintenance $443,805.00 Lawn maintenance $25,450.00 Total $3,262,997.01
2.5 Statistic information availability on SWM
Some of the statistic information on SWM were updated through baseline survey conducted in 2017. Based on the result of the survey, baseline of some key SWM indicators were identified as of 2017 and which are the basis of future planning and target goals of the NWMS. On the other hand, there are still SWM indicators which are not available and to be identified in the future. In addition to that, current available SWM indicators also need to be updated on a regular basis subject to monitoring of any changes occurred during a certain period.
2.6 3R activities
Most of the 3R activities are related to the view of values, lifestyles and culture of people. Generally, the concept of 3R is Reduce, Reuse and Recycle.
2.6.1 Reduce
Reduce is a practice of not generating waste as much as possible, which is prior to recycle but it is difficult to quantify the baseline with statistics. Several practices related to reduce were confirmed in the community by sharing the food for reducing food waste. Avoiding of disposal of certain items also contributes to reduction of wastes. The Reduce concept also contributes to minimize the expenditures and can be promoted with optimization of household economy.

National Waste Management Strategy Ministry of Natural Resources and Environment
23
2.6.2 Reuse
Reuse is a practice of using the same material repeatedly as much as possible which is also prior to recycle and again, it is difficult to quantify the baseline with statistics. Basically, glass bottles of local beverages in Samoa are being reused but not recycled through a refund system.
2.6.3 Recycle (and return)
Recycle is a practice to produce new products or materials from the ones that are out of use. It is the last option and is specifically for certain materials such as aluminum cans, etc.
When it comes to recycle, many people think about recycling of industrial products with high technology. However, the concept of recycle also refers composting which has been practiced since long ago traditionally.
2.6.4 Recycle of industrial product included in wastes in Samoa
Since Samoa is highly depended on import for domestic consumption, most of the wastes are generated from products imported from overseas particularly from packaging. In many cases, packages of those products or products themselves are recycled in the country where the products are manufactured, while those are just landfilled together with other wastes in Samoa due to absence of a proper recycling system. The only exception, is for recyclables with relatively high value in the world market which can produce some profit by collecting in Samoa and exporting to the country where those materials can be re-processed and recycled. Among the waste streams of households and small businesses, aluminum cans are the only material that are collected in Samoa and exported to New Zealand, Australia and etc.
2.6.5 Composting in Samoa
Composting can be divided into two categories by the location of composting. On-site compost is a way of composting practiced at waste generation source usually at household level. While Off-site composting is a way of composting practiced at designated place developed for composting and organic wastes collected from several waste generation sources. Off-site compost is adopted usually for composting green waste generated from businesses.
There are composting practiced in Samoa but there are no statistical data readily available.
On-site composting at household level was confirmed during the waste audit. People generally apply green waste to the roots of plant in their home gardens as nourishment and it is called mulching. Since green waste and food scrap are the main components of the discharged waste from household, promotion of composting can be an option to reduce the waste generation amount.

Nat
iona
l Was
te M
anag
emen
t Stra
tegy
M
inis
try o
f Nat
ural
Res
ourc
es a
nd E
nviro
nmen
t
24
2.7
Was
te S
trea
m in
Upo
lu a
nd S
avai
i
Bas
ed o
n th
e da
ta c
olle
cted
thro
ugh
base
line
surv
ey, w
aste
stre
am fo
r Upo
lu a
nd S
avai
i wer
e de
velo
ped
as s
how
n be
low
. Was
te s
tream
for S
avai
i is d
evel
oped
bas
ed
on th
e da
ta in
Upo
lu.
Figu
re 2
-9 W
aste
Stre
am in
Upo
lu

Nat
iona
l Was
te M
anag
emen
t Stra
tegy
M
inis
try o
f Nat
ural
Res
ourc
es a
nd E
nviro
nmen
t
25
Figu
re 2
-10
Was
te S
tream
in S
avai
i

National Waste Management Strategy Ministry of Natural Resources and Environment
26
2.8 Legal and institutional framework
The section summarizes existing legal framework and describes the current functions of MNRE as specified in the Waste Management Act 2010.
2.8.1 Lands, Surveys and Environment Act 1989
This act was developed in 1989 under the Department of Land, Surveys and Environment. In relation to waste, the Division 8 “Litter Control” prescribed the provisions for litter control measures. It lumps up dumping and depositing of wastes as littering in public places and private lands. The division 8 also imposes penalties on breaching provisions of the Act in general.
2.8.2 Waste Management Act 2010
This act is the most fundamental legal framework on waste management in Samoa. It defines the roles and responsibilities of MNRE and relevant stakeholders by waste category in the general context of waste management. There are 17 MNRE’s mandated functions. MNRE is willing to fulfill those functions as the main responsible ministry for waste management. However, the insufficient capacity of MNRE limits its ability to fulfill its obligations. The current status of MNRE’s performance for each of the functions is summarized in the Table 2-2.
2.8.3 Waste (Plastic Bag) Management Regulations 2018
This Regulations repeals the Plastic Bag Prohibition on Importation Regulation 2006. The primary objective of the Regulations is to ban certain plastic materials in particularly shopping bags, packing bags and straws. It is evident that more than 12.7 Mt of plastics entered the oceans globally. The adverse impact in the marine resources from plastics has turn the tide for countries to implement actions to prohibit the use of certain plastic materials.
The Regulations highlighted that a person who in possession of plastic, Styrofoam plastic or straw for the purpose of:
a. Manufacturing; or
b. Exportation; or
c. Selling and distribution in Samoa
Is prohibited.

Nat
iona
l Was
te M
anag
emen
t Stra
tegy
M
inis
try o
f Nat
ural
Res
ourc
es a
nd E
nviro
nmen
t
27
Tabl
e 2-
9 M
NR
E Fu
nctio
n an
d cu
rrent
sta
tus
D
escr
iptio
n M
ain
Obj
ectiv
e Ac
tion
Cur
rent
con
ditio
n N
eces
sary
act
ion
(a)
The
form
ulat
ion
and
impl
emen
tatio
n of
a
Nat
iona
l W
aste
M
anag
emen
t St
rate
gy
and
othe
r rel
ated
stra
tegi
es, a
nd
the
perio
dic
revi
ew
and
amen
dmen
t of s
uch
stra
tegi
es;
N
atio
nal
Was
te
Man
agem
ent
Stra
tegy
Oth
er
Rel
ated
St
rate
gies
(a) -
1 Fo
rmul
atio
n (a
) -2
Impl
emen
tatio
n (a
) -3
Perio
dic
Rev
iew
(a
) -4
Amen
dmen
t
(a)-1
Nat
iona
l Sol
id W
aste
Man
agem
ent
Stra
tegy
has
be
en F
orm
ulat
ed
(a)-2
To
be im
plem
ente
d (a
)-3 T
o be
revi
ewed
(a
)-4 T
o be
am
ende
d
Form
ulat
e th
e N
atio
nal
Solid
W
aste
M
anag
emen
t St
rate
gy.
(b)
Mak
ing
arra
ngem
ents
fo
r th
e pr
ovis
ion
of
com
mer
cial
, in
dust
rial
and
resi
dent
ial
was
te
colle
ctio
n se
rvic
es;
Pr
ovis
ion
of
com
mer
cial
, in
dust
rial
and
resi
dent
ial
was
te c
olle
ctio
n se
rvic
e
(b) -
1 M
akin
g
Arra
ngem
ents
(b
)-1 W
aste
col
lect
ion
serv
ice
is a
rrang
ed f
or s
mal
l bu
sine
sses
and
hou
seho
lds
loca
ted
in t
he c
olle
ctio
n zo
ne d
esig
ned
by M
NR
E. H
owev
er, t
here
are
freq
uent
co
mpl
ains
. Th
ere
are
busi
ness
es a
nd h
ouse
hold
s w
hich
don
’t ha
ve
acce
ss t
o th
e w
aste
col
lect
ion
serv
ice
but
the
actu
al
num
ber i
s no
t ide
ntifi
ed.
Pa
rt of
com
mer
cial
and
res
iden
tial
was
te i
s di
rect
ly
trans
porte
d to
land
fill b
y th
ose
gene
rate
d w
aste
.
Col
lect
ion
of i
ndus
trial
was
te i
s ou
t of
sco
pe o
f th
e se
rvic
e pr
ovid
ed
by
the
cont
ract
ors
unde
r M
NR
E.
Rec
ycla
ble
is c
olle
cted
by
recy
clin
g co
mpa
nies
. H
azar
dous
was
te is
mon
itore
d de
pend
s on
the
rep
ort
rece
ived
.
Impr
ove
the
mon
itorin
g on
co
llect
ion
serv
ice.
C
ondu
ct s
urve
y to
de
velo
p se
rvic
e us
er d
atab
ase.
C
ontin
ue
wei
ghbr
idge
re
cord
. C
olle
ct
stat
istic
in
form
atio
n on
re
cycl
able
s,
haza
rdou
s w
aste
. (c
) En
surin
g th
at a
dequ
ate
prov
isio
n is
mad
e fo
r w
aste
man
agem
ent
faci
litie
s in
Sam
oa, i
nclu
ding
the
iden
tific
atio
n,
deve
lopm
ent
and
man
agem
ent
of l
andf
ill ar
eas
in
acco
rdan
ce
with
th
is
law
an
d ot
her
law
s re
latin
g to
de
velo
pmen
t con
trols
;
W
aste
M
anag
emen
t Fa
cilit
ies
(c) -
1 En
surin
g th
e
adeq
uate
pro
visi
on
Land
fill s
ite is
exi
sted
in b
oth
Upo
lu a
nd S
avai
i. Bo
th o
f th
e la
ndfil
ls a
re a
dopt
ing
sem
i-aer
obic
land
fill s
yste
m s
o ca
lled
Fuku
oka
Met
hod.
Th
ere
is n
o op
erat
ion
plan
for t
he la
ndfil
ls.
Dev
elop
la
ndfil
l op
erat
ion
plan
for
Ta
faig
ata
and
Vaia
ata
Land
fills
.
Nat
iona
l Was
te M
anag
emen
t Stra
tegy
M
inis
try o
f Nat
ural
Res
ourc
es a
nd E
nviro
nmen
t
28
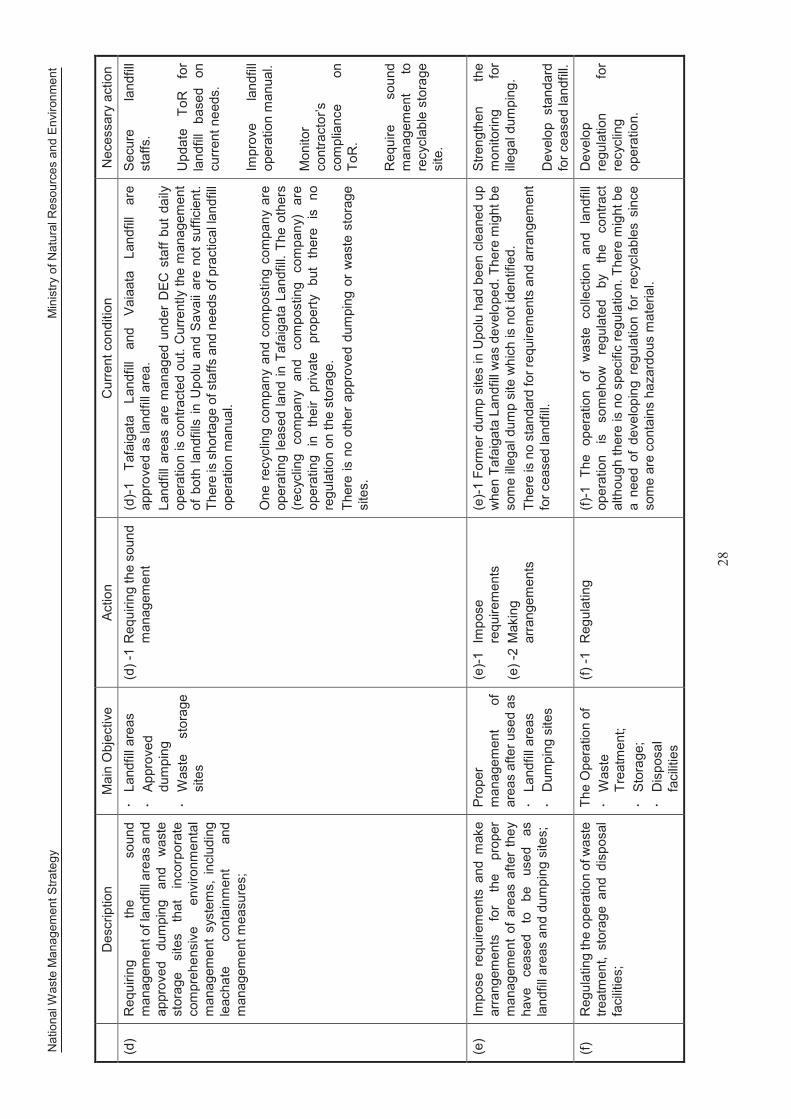
D
escr
iptio
n M
ain
Obj
ectiv
e Ac
tion
Cur
rent
con
ditio
n N
eces
sary
act
ion
(d)
Req
uirin
g th
e so
und
man
agem
ent o
f lan
dfill
area
s an
d ap
prov
ed
dum
ping
an
d w
aste
st
orag
e si
tes
that
in
corp
orat
e co
mpr
ehen
sive
en
viro
nmen
tal
man
agem
ent
syst
ems,
incl
udin
g le
acha
te
cont
ainm
ent
and
man
agem
ent m
easu
res;
La
ndfil
l are
as
Ap
prov
ed
dum
ping
Was
te
stor
age
site
s
(d) -
1 R
equi
ring
the
soun
d
man
agem
ent
(d)-1
Ta
faig
ata
Land
fill
and
Vaia
ata
Land
fill
are
appr
oved
as
land
fill a
rea.
La
ndfil
l are
as a
re m
anag
ed u
nder
DEC
sta
ff bu
t dai
ly
oper
atio
n is
con
tract
ed o
ut. C
urre
ntly
the
man
agem
ent
of b
oth
land
fills
in U
polu
and
Sav
aii a
re n
ot s
uffic
ient
. Th
ere
is s
horta
ge o
f sta
ffs a
nd n
eeds
of p
ract
ical
land
fill
oper
atio
n m
anua
l. O
ne r
ecyc
ling
com
pany
and
com
post
ing
com
pany
are
op
erat
ing
leas
ed la
nd in
Taf
aiga
ta L
andf
ill. T
he o
ther
s (re
cycl
ing
com
pany
an
d co
mpo
stin
g co
mpa
ny)
are
oper
atin
g in
the
ir pr
ivat
e pr
oper
ty b
ut t
here
is
no
regu
latio
n on
the
stor
age.
Th
ere
is n
o ot
her
appr
oved
dum
ping
or
was
te s
tora
ge
site
s.
Secu
re
land
fill
staf
fs.
Upd
ate
ToR
fo
r la
ndfil
l ba
sed
on
curre
nt n
eeds
. Im
prov
e la
ndfil
l op
erat
ion
man
ual.
Mon
itor
cont
ract
or’s
co
mpl
ianc
e on
To
R.
Req
uire
so
und
man
agem
ent
to
recy
clab
le s
tora
ge
site
.
(e)
Impo
se r
equi
rem
ents
and
mak
e ar
rang
emen
ts
for
the
prop
er
man
agem
ent o
f ar
eas
afte
r th
ey
have
ce
ased
to
be
us
ed
as
land
fill a
reas
and
dum
ping
site
s;
Prop
er
man
agem
ent
of
area
s af
ter u
sed
as
La
ndfil
l are
as
D
umpi
ng s
ites
(e)-1
Im
pose
requ
irem
ents
(e
) -2
Mak
ing
ar
rang
emen
ts
(e)-1
For
mer
dum
p si
tes
in U
polu
had
bee
n cl
eane
d up
w
hen
Tafa
igat
a La
ndfil
l was
dev
elop
ed. T
here
mig
ht b
e so
me
illega
l dum
p si
te w
hich
is n
ot id
entif
ied.
Th
ere
is n
o st
anda
rd fo
r req
uire
men
ts a
nd a
rrang
emen
t fo
r cea
sed
land
fill.
Stre
ngth
en
the
mon
itorin
g fo
r ille
gal d
umpi
ng.
Dev
elop
sta
ndar
d fo
r cea
sed
land
fill.
(f)
Reg
ulat
ing
the
oper
atio
n of
was
te
treat
men
t, st
orag
e an
d di
spos
al
faci
litie
s;
The
Ope
ratio
n of
Was
te
Trea
tmen
t;
Stor
age;
Dis
posa
l fa
cilit
ies
(f) -1
Reg
ulat
ing
(f)-1
The
ope
ratio
n of
was
te c
olle
ctio
n an
d la
ndfil
l op
erat
ion
is
som
ehow
re
gula
ted
by
the
cont
ract
al
thou
gh th
ere
is n
o sp
ecifi
c re
gula
tion.
The
re m
ight
be
a ne
ed o
f de
velo
ping
reg
ulat
ion
for
recy
clab
les
sinc
e so
me
are
cont
ains
haz
ardo
us m
ater
ial.
Dev
elop
re
gula
tion
for
recy
clin
g op
erat
ion.

Nat
iona
l Was
te M
anag
emen
t Stra
tegy
M
inis
try o
f Nat
ural
Res
ourc
es a
nd E
nviro
nmen
t
29
D
escr
iptio
n M
ain
Obj
ectiv
e Ac
tion
Cur
rent
con
ditio
n N
eces
sary
act
ion
(g)
Ensu
ring
that
ad
equa
te
was
te
man
agem
ent
serv
ices
ar
e pr
ovid
ed t
o ai
rcra
ft an
d sh
ips,
an
d th
e im
posi
tion
of
requ
irem
ents
to
be o
bser
ved
by
pilo
ts a
nd s
hips
mas
ters
in
this
re
gard
;
Was
te
man
agem
ent
serv
ice
to
airc
raft
and
ship
s
(g) -
1 En
surin
g th
e pr
ovis
ion
(g) -
2 Im
posi
tion
of
requ
irem
ents
(g)-1
Was
te g
ener
ated
fro
m a
irpor
t is
col
lect
ed b
y Ai
rpor
t Aut
horit
y (A
A) a
nd S
amoa
Shi
ppin
g C
orpo
ratio
n (S
SC)
colle
cts
was
te g
ener
ated
by
thei
r sh
ips
and
faci
litie
s. T
he w
aste
gen
erat
ed b
y ot
her p
rivat
e sh
ips
is
not c
olle
cted
by
SSC
.
Col
lect
in
form
atio
n fo
r w
aste
ge
nera
ted
by p
rivat
e sh
ip.
(h)
Prom
otin
g re
cycl
ing,
an
d im
plem
entin
g m
easu
res
to
min
imiz
e w
aste
s ha
ving
pa
rticu
lar
adve
rse
impl
icat
ions
fo
r hu
man
he
alth
an
d th
e en
viro
nmen
t;
Was
te
min
imiz
atio
n (h
) -1
Prom
otin
g re
cycl
ing
(h) -
2 Im
plem
entin
g
mea
sure
s
(h)-1
MN
RE
is le
asin
g la
nd to
rec
yclin
g co
mpa
ny a
nd
com
post
ing
com
pany
to p
rom
ote
recy
clin
g.
(h)-2
The
re u
sed
to b
e “P
last
ic B
ag P
rohi
bitio
n on
Im
porta
tion
Reg
ulat
ions
20
06”
whi
ch
regu
late
s th
e im
porta
tion
of p
last
ic p
rodu
cts
to p
rovi
de b
io d
egra
dabl
e pl
astic
bag
s.
(h)-2
Bot
h U
polu
and
Sav
aii h
ave
inci
nera
tor f
or h
ealth
ca
re w
aste
(Und
er M
oH).
Prom
ote
3R
and
was
te
min
imiz
atio
n at
ge
nera
tion
sour
ce.
(i)
Mon
itorin
g th
e ef
fect
s of
was
tes
on
hum
an
heal
th
and
the
envi
ronm
ent,
and
enha
ncin
g co
oper
atio
n w
ith a
ll of
ficer
s in
the
disc
harg
e of
th
eir
law
ful
resp
onsi
bilit
ies
rela
ting
to
regu
latin
g an
d m
onito
ring
was
tes
and
mon
itorin
g w
aste
m
anag
emen
t pr
oces
ses
and
faci
litie
s;
Effe
cts
of
was
tes
on
hum
an
heal
th
and
the
envi
ronm
ent
(i) -1
M
onito
ring
(i) -2
En
hanc
ing
the
co
oper
atio
n w
ith a
ll
offic
ers
(i)-1
, 2 T
he w
ater
qua
lity
of th
e la
ndfil
l was
sur
veye
d w
ith
coop
erat
ion
of S
RO
S an
d m
onito
red
by M
NR
E on
a
regu
lar b
asis
unt
il 201
5 bu
t not
upd
ated
sin
ce th
en. T
his
mig
ht b
e re
late
d to
the
budg
et a
nd c
hang
e in
sta
ffs a
t la
ndfil
l . (i)
-1,
2 Ill
egal
dum
ping
is
mon
itore
d by
MN
RE
with
co
oper
atio
n of
env
ironm
enta
l ran
ger a
nd lo
cal p
eopl
e.
Dev
elop
st
aff
skills
fo
r co
nduc
ting
surv
ey.
Impr
ove
mon
itorin
g sy
stem
by
mak
ing
use
of
the
envi
ronm
enta
l ra
nger
. (j)
R
egul
atin
g pe
rson
s in
volv
ed i
n th
e tra
nspo
rtatio
n, s
tora
ge a
nd
disp
osal
of w
aste
s in
acc
orda
nce
with
this
Act
and
any
law
rela
ting
to th
e m
anag
emen
t of w
aste
s;
Pers
ons
invo
lved
in
th
e tra
nspo
rtatio
n,
stor
age
and
disp
osal
of w
aste
s
(j) -1
R
egul
atin
g (j)
-1
The
Con
tract
so
meh
ow
regu
late
s th
e pe
rson
in
volv
ed in
rubb
ish
colle
ctio
n an
d la
ndfil
l ope
ratio
n bu
t th
ere
is c
halle
nge
in it
s en
forc
emen
t.
Ther
e is
no
spec
ific
regu
latio
n.
Nee
d so
me
regu
latio
n on
was
te.
Enfo
rce
the
cond
ition
. D
evel
op
recy
clab
le
regu
latio
n.

Nat
iona
l Was
te M
anag
emen
t Stra
tegy
M
inis
try o
f Nat
ural
Res
ourc
es a
nd E
nviro
nmen
t
30
D
escr
iptio
n M
ain
Obj
ectiv
e Ac
tion
Cur
rent
con
ditio
n N
eces
sary
act
ion
(k)
The
prep
arat
ion,
ad
optio
n an
d en
forc
emen
t of
rul
es,
oper
atin
g m
anua
ls,
code
s of
pra
ctic
e an
d st
anda
rds
regu
latin
g ac
tiviti
es
asso
ciat
ed w
ith th
e m
anag
emen
t of
was
tes
in S
amoa
;
R
ules
Ope
ratin
g M
anua
ls
C
odes
of
pr
actic
e
(k) -
1 Pr
epar
atio
n (k
) -2
Adop
tion
(k) -
3 En
forc
emen
t
(k)-1
, 2,
3
Ther
e is
so
me
cond
ition
m
entio
ned
in
cont
ract
. But
not
cov
ered
for a
ll as
pect
s.
Impr
ove
Land
fill
oper
atio
n m
anua
l. D
evel
op
regu
latio
n on
re
cycl
able
. (l)
Im
plem
entin
g lit
ter
and
was
te
cont
rol m
easu
res;
Li
tter
and
was
te
cont
rol m
easu
res
(l) -1
Im
plem
entin
g (l)
-1 L
itter
mai
nten
ance
ser
vice
is c
ontra
cted
out
. Bu
t si
tuat
ion
on th
e lit
ter i
s no
t im
prov
ed.
Con
duct
aw
aren
ess
for
prev
ent l
itter
. (m
) Th
e pr
epar
atio
n of
rep
orts
and
th
e co
mpi
latio
n of
st
atis
tics
rele
vant
to
the
man
agem
ent
of
was
tes
in S
amoa
, and
the
regu
lar
repo
rting
of
su
ch
mat
ters
in
ac
cord
ance
with
this
Act
;
Rep
orts
an
d St
atis
tics
(m) -
1 Pre
para
tion
of
re
ports
(m
) -2 C
ompi
latio
n of
stat
istic
s (m
) -3 R
egul
ar R
epor
ting
(m)-1
, 3 M
onito
ring
repo
rt on
litte
ring,
rubb
ish
colle
ctio
n,
land
fill a
nd il
lega
l dum
ping
are
pre
pare
d m
onth
ly b
ut n
ot
effic
ient
. (m
)-2 T
here
are
var
iety
of d
ata
on s
tatis
tics
but m
ost o
f da
ta is
out
dat
ed a
nd n
ot u
tiliz
ed.
Impr
ove
mon
itorin
g ef
ficie
ncy.
C
ondu
ct
surv
eys
on a
regu
lar b
asis
. (n
) R
aisi
ng
publ
ic
awar
enes
s of
m
atte
rs
conc
erni
ng
the
min
imiz
atio
n of
the
gene
ratio
n of
w
aste
s an
d th
e ef
fect
ive
man
agem
ent o
f was
tes;
M
inim
izat
ion
of
the
gene
ratio
n of
was
tes
Ef
fect
ive
Man
agem
ent
of
was
tes
(n) -
1 R
aisi
ng
publ
ic
aw
aren
ess
(n)-1
Aw
aren
ess
is im
plem
ente
d in
som
e sc
hool
s an
d co
mm
uniti
es d
epen
d on
the
requ
est.
(n
)-1 E
nviro
nmen
t wee
k is
one
of t
he o
ppor
tuni
ties
for
awar
enes
s.
(n)-1
Sch
edul
e of
rubb
ish
colle
ctio
n is
adv
ertis
ed o
n TV
an
d ne
wsp
aper
.
Con
duct
ef
ficie
nt
awar
enes
s fo
r sp
ecifi
c ta
rget
.
(o)
The
form
ulat
ion,
im
plem
enta
tion
and
enfo
rcem
ent
of
polic
ies,
pr
ogra
ms,
in
itiat
ives
, st
anda
rds
and
requ
irem
ents
ai
med
to
re
duce
the
gene
ratio
n of
was
tes
Po
licie
s
Prog
ram
s
Initi
ativ
es
St
anda
rds
R
equi
rem
ents
To
re
duce
th
e ge
nera
tion
of
was
tes
(o) -
1 Fo
rmul
atio
n (o
) -2
Impl
emen
tatio
n (o
) -3
Enfo
rcem
ent
(o)-1
Was
te m
anag
emen
t pol
icy
was
form
ulat
ed b
ut it
’s
alre
ady
outd
ated
. Th
ere
is n
o pr
ogra
m,
initi
ativ
es o
n w
aste
redu
ctio
n.
Form
ulat
e an
d im
plem
ent
the
Nat
iona
l So
lid
Was
te
Man
agem
ent
Stra
tegy
.

Nat
iona
l Was
te M
anag
emen
t Stra
tegy
M
inis
try o
f Nat
ural
Res
ourc
es a
nd E
nviro
nmen
t
31
D
escr
iptio
n M
ain
Obj
ectiv
e Ac
tion
Cur
rent
con
ditio
n N
eces
sary
act
ion
(p)
The
form
ulat
ion
of
appr
opria
te
arra
ngem
ents
and
pro
cedu
res
for
the
man
agem
ent o
f la
ndfil
ls a
nd
was
te m
anag
emen
t fa
cilit
ies
in
the
even
t of n
atur
al
disa
ster
s,
fires
, an
d ot
her
emer
genc
ies,
co
nsis
tent
w
ith
law
s de
alin
g w
ith d
isas
ter
and
emer
genc
y m
anag
emen
t;
Man
agem
ent o
f
Land
fills
was
te
man
agem
ent
faci
litie
s in
th
e em
erge
ncy
case
s
(p) -
1 Fo
rmul
atio
n of
appr
opria
te
ar
rang
emen
ts
(p) -
2 Fo
rmul
atio
n of
appr
opria
te
pr
oced
ures
Ther
e is
no
pl
an
of
form
ulat
ing
for
appr
opria
te
arra
ngem
ents
and
its
proc
edur
es.
Mak
e us
e of
R
egio
nal
Dis
aste
r w
aste
m
anag
emen
t gu
idel
ine
to
be
deve
lope
d.
(q)
Perfo
rmin
g an
y ot
her
func
tions
pr
ovid
ed f
or b
y la
w o
r ve
sted
in
the
Min
istry
by
Cab
inet
Oth
er fu
nctio
ns
(q) -
1 Pe
rform
ing
N/A
N/A

National Waste Management Strategy Ministry of Natural Resources and Environment
32
3 Understanding Chemical and Hazardous Waste Management System
3.1 Current situation of Chemical and Hazardous Waste Management
Chemical use in Samoa is relatively small, although demand is rapidly rising with increased economic development and improved living standards. About 117 million Samoan Tala was expended on chemical imports in 2009, with petroleum products 82%, consumer chemicals 6%, industrial and pharmaceutical chemicals 5% each, and pesticides 2%. But while recognizing the important role that chemicals play in national development, there is also growing alarm about the hazardous nature of chemicals and their adverse effects on human health and the environment. Concerns have been raised on the lack of effective control of chemical imports, unsafe usage, and improper disposal of chemical waste. To integrate the Chemical and Hazardous component of the Strategy, the national chemical and hazardous status has been analyzed and summarized below:
International linkages / Implementation of MEAs: strong linkages were established between the government of Samoa and the secretariats of the international chemical and waste conventions, but capacity for effective implementation was lacking.
Chemical Trade and use: There was limited knowledge of actual inventories of chemical imports and subsequent chemical waste.
Priority concerns related to chemicals during their life cycle: one of the main concerns in Hazardous and Chemical management was the lack of knowledge of the movement of chemicals – from imports to waste.
Legal instruments and non-regulatory mechanisms for hazardous and chemical management: existing chemical laws were inconsistent and fragmented, resulting in a lack integrated or interagency approach to hazardous and chemical management.
Government agencies and private sector organizations participating in hazardous and chemical management: there was limited participation in hazardous and chemical management activities by private sector companies and non-governmental organizations (NGOs).
Interagency commissions and coordinating mechanisms: there was limited cooperation and collaboration among government agencies and organizations involved in hazardous and chemical management.
Data access and use: there was lack of information sharing and data exchange among the key chemical stakeholders including regulators, importers users and communities.
Technical Infrastructure: there were no national bodies with the facilities for scientific research and technical assessment, except for the newly established Scientific Research Organization of Samoa (SROS). There were also no storage, recovery and disposal facilities for hazardous and chemical management in the country.
Awareness and understanding of stakeholders: a number of mechanisms have been developed to promote public awareness generally, but very little was done to create specific understanding among stakeholders of the risks to health and the environment from exposure to hazardous chemicals.
Resources available and needed for hazardous and chemical management: insufficient financial and other resources were allocated for the implementation of chemical management program.

National Waste Management Strategy Ministry of Natural Resources and Environment
33
3.2 Legal and institutional framework
3.2.1 Waste Management Act 2010
This act is the most fundamental legal framework on waste management in Samoa. It defines the roles and responsibilities of MNRE and relevant stakeholders by waste category in the general context of waste management. There are 17 MNRE’s mandated functions. MNRE is willing to fulfill those functions as the main responsible ministry for waste management. However, the insufficient capacity of MNRE limits its ability to fulfill its obligations. The current status of MNRE’s performance for each of the functions is summarized in the Table 2-2. Regarding to chemical and hazardous waste, the Act also highlighted the Conventions that Samoa has already a party of.
3.2.2 Waste Management (Importation of Waste for Electricity Generation) Regulations 2015
This regulation developed in 2015 cited as the Waste Management (Importation of Wastes for Electricity and Energy Recovery) through the generation of electricity through a pyrolysis process or combustion of waste, the controlled extraction of material or the retrieval of energy from waste or any operation for energy recovery specified in the Basel Convention and the Waigani Convention in an environmentally sound manner.

National Waste Management Strategy Ministry of Natural Resources and Environment
34
4 Issues and Challenges
4.1 Solid Waste Management Issues and Challenges
Issues and challenges on SWM in Samoa are summarized by sub-category of SWM based on the result of the baseline survey as well as consultation in the formulation process.
4.1.1 Generation source
Littering issue along the road and river Open dumping and burning waste at back yard of household Illegal dumping in both public and private property Inappropriate discharge practice at collection point Large amount of green waste Lack of cooperation with community and business with regards to waste management Increase in waste amount
4.1.2 Collection
Inefficient monitoring system for contractors' operation Insufficient database on boundary, route and collection point for rubbish collection Frequent complaints from households and contractors.
4.1.3 Disposal
Fire accidents or improper operation at landfill Inefficient monitoring system for contractors' operation
4.1.4 SWM Finance
Increase of operational cost Shortage of operational budget Lack of resource (staff/equipment)
4.1.5 Capacity for SWM
Limited institutional and human capacity Lack of effective feedback system as output from technical training Lack of regulation on recycling Insufficient enforcement of existing act Insufficient awareness and promotion of waste issues and solutions
4.1.6 Survey and Analysis on SWM
Limited availability for SWM basic data Lack of vision for future SWM system
National Waste Management Strategy Ministry of Natural Resources and Environment
35
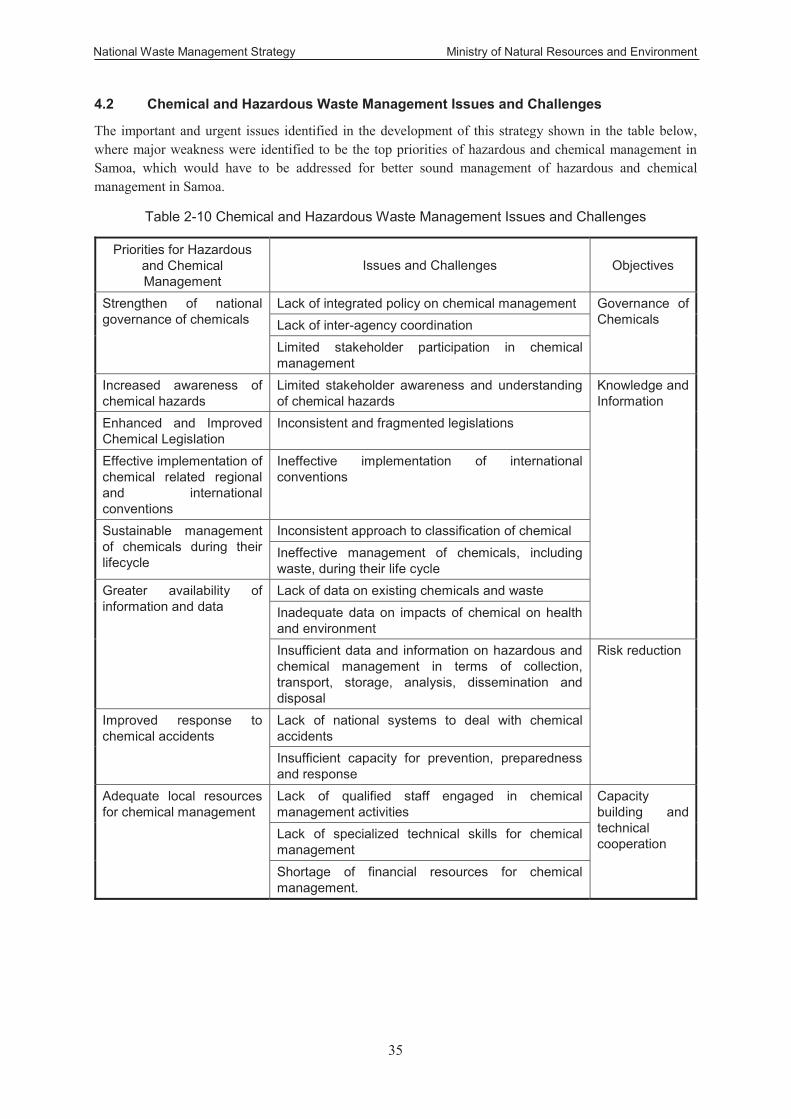
4.2 Chemical and Hazardous Waste Management Issues and Challenges
The important and urgent issues identified in the development of this strategy shown in the table below, where major weakness were identified to be the top priorities of hazardous and chemical management in Samoa, which would have to be addressed for better sound management of hazardous and chemical management in Samoa.
Table 2-10 Chemical and Hazardous Waste Management Issues and Challenges
Priorities for Hazardous and Chemical Management
Issues and Challenges Objectives
Strengthen of national governance of chemicals
Lack of integrated policy on chemical management Governance of Chemicals Lack of inter-agency coordination
Limited stakeholder participation in chemical management
Increased awareness of chemical hazards
Limited stakeholder awareness and understanding of chemical hazards
Knowledge and Information
Enhanced and Improved Chemical Legislation
Inconsistent and fragmented legislations
Effective implementation of chemical related regional and international conventions
Ineffective implementation of international conventions
Sustainable management of chemicals during their lifecycle
Inconsistent approach to classification of chemical Ineffective management of chemicals, including waste, during their life cycle
Greater availability of information and data
Lack of data on existing chemicals and waste Inadequate data on impacts of chemical on health and environment Insufficient data and information on hazardous and chemical management in terms of collection, transport, storage, analysis, dissemination and disposal
Risk reduction
Improved response to chemical accidents
Lack of national systems to deal with chemical accidents Insufficient capacity for prevention, preparedness and response
Adequate local resources for chemical management
Lack of qualified staff engaged in chemical management activities
Capacity building and technical cooperation
Lack of specialized technical skills for chemical management Shortage of financial resources for chemical management.

National Waste Management Strategy Ministry of Natural Resources and Environment
36
Part 3 Strategy
1 Purpose
This Strategy will be the first waste-related Strategy endorsed in Samoa. This will serve as a guide in proper management of wastes to achieve the vision of “clean and healthy” Samoa by 2023. While there were a lot of initiatives implemented and challenges being addressed in the recent years, the roadmap has to be re-directed to allow for changes and emerging issues currently faced by the waste sector.
2 Formulation Process
The NWMS has been developed through the following consultation process with relevant ministries, private sectors and community.
Figure 3-1 Formulation Process of the strategy
Stakeholder Meeting
(Private sector, Community)
Develop 2nd Draft of the
NWMS
Technical Working Group
2nd Steering Committee Meeting for
NWMSCabinet
Discussing on the Issues & Problems on waste
Drafted by JET and staffs in DEC reflecting the result of discussions
Technical InputDiscussing on the Action Plan of the NWMS
ApprovalDiscussing on the final draft of the NWMS
SubmissionSubmit the final draft of the NWMS to the cabinet
Develop the 1st Draft
Framework
Internal Discussion on the 1st
Draft Framework
Develop 1st Draft of the
NWMS
Internal Discussion on the 1st
Draft of the NWMS
1st SteeringCommitteeMeeting for
NWMS
Drafted by JET and staffs in DEC
Discussing on the 1st draft framework
Drafted by JET and staffs in DEC based on the internal discussion
Discussing on the 1st draft of the NWMS and further schedule in DEC
Discussing on the Problems & Issues on waste
February March - July
July August - Dec

National Waste Management Strategy Ministry of Natural Resources and Environment
37
3 Priority areas
Based on the current situation, followings were extracted as priority areas.
A Enhance environmental awareness of the public on waste related issues and the countermeasures
Due to lack of awareness of public on waste and its negative impact on environment if treated inappropriately, there are lots of issues at waste generation source. This area targets general people, community and school children as well as businesses and government agencies to raise their understanding on waste related issues and promote activities which can be conducted by them for attracting better cooperation and participation for waste management.
B Strengthen operational planning on SWM
There are needs of developing operational plan in order to secure sustainable waste management through proper provision of waste collection services and landfill operations. This area includes the conduction of activities to develop practical operational plan on waste management.
C Implement regular survey for Basic SWM data collection
Lack of basic data makes it difficult to identify and clarify current status of waste management hence; reliable data is the key information for decision making. This area includes activities to enhance availability of basic data related to waste management through the implementation of surveys.
D Study Feasibility of future SWM options
There are different options to improve waste management. Therefore, it is important to assess and identify feasibility of potential SWM options. This area includes activities to conduct feasibility studies of some potential future SWM options.
E Establish efficient monitoring system on SWM operation
Due to the nature of Samoan waste management system which adopts contract out of waste collection and landfill operation, securing proper monitoring for contractors is very important. This area includes activities to establish efficient monitoring system.
F Strengthen legal framework and enforcement
There are needs of developing new regulations as well as enforcing existing acts and regulations considering global context of waste management. This area includes activities to strengthen legal framework and enforcement for Samoa.
G Improve capacity of officials related to SWM
There are opportunities of enhancement of the capacity of officials involved in waste management. Therefore, it is important to make use of opportunities through trainings and sharing and transferring of knowledge and skills to the others effectively. This area includes activities to improve capacity of officials related to waste management.

National Waste Management Strategy Ministry of Natural Resources and Environment
38
H Improve Chemical and Hazardous Waste Management
There is a need to improve Chemical and Hazardous Waste management based on the gaps identified. This area targets all activities with regards to Chemical and Hazardous Waste Management.
4 Risks
The following risks should be assessed by the Steering Committee during the implementation of this Strategy:
Withdrawal of support of donors on selected activities Change in governance reducing financial commitment to waste services Failure to gain expected community and stakeholders’ commitment Natural calamities damaging waste infrastructure and interrupting delivery of waste services
5 Assumptions
Economic growth will be maintained regardless of changes to global economy. The current political system remains stable and will continue to provide commitment to the waste
sector in adherence to the sustainable development goals. The implementing agencies will remain compliant to its mandate of improving waste
management in the country; the Waste Management Sections of MNRE will continue to be a dedicated office for waste management.
Measurement of waste data will be a priority for more informed decisions and translated to management actions.
The principle of waste hierarchy will be the prevailing guide for resolving waste issues geared more towards 3R + Return with global market prices favouring recycling.
Traditional and cultural values are highly regarded in providing sustainable solutions, e.g. composting to assist in food security.
Positive results of waste management initiatives will not be negated by natural disasters. There will still be assistance from development partners during the course of the Strategy.
6 Action Plan
The specific activities to support the implementation of the strategy have been determined and presented in the action plan. The action plan will define the priorities in the next five years which should be translated into the annual work programme of the MNRE’s Waste Management Sections as well as other relevant government and NGOs such as SRWMA as well as institutions and businesses.

Nat
iona
l Was
te M
anag
emen
t Stra
tegy
M
inis
try o
f Nat
ural
Res
ourc
es a
nd E
nviro
nmen
t
39
Pr
iorit
y ar
ea A
: Enh
ance
env
ironm
enta
l Aw
aren
ess
of th
e pu
blic
2019
2020
2021
2022
2023
2024
-
Cam
paig
n is
pla
nned
XX
XX
XX
Cam
paig
n is
impl
emen
ted
XX
XX
XX
Targ
et a
rea
is id
entif
ied
X
Aw
aren
ess i
s pla
nned
XA
war
enes
s is i
mpl
emen
ted
XA
ppro
pria
te 3
R m
easu
re is
iden
tifie
d.X
XX
XX
X
Targ
et a
rea
is id
entif
ied.
XX
XX
XC
ondu
ct in
pilo
t 3R
act
iviti
es in
gove
rnm
ent s
ecto
rX
xX
XX
X
Met
hodo
logy
of p
rom
otio
n is
iden
tifie
d.X
XX
XX
X
3R p
rom
otio
n is
impl
emen
ted
(Pro
mot
e 3R
initi
ativ
e in
min
istry
leve
l).X
XX
XX
X
Tege
t sch
ool i
s ide
ntifi
edX
XX
Con
tent
s of p
rogr
am is
pla
nned
XX
X
Prog
ram
is im
plem
ente
dX
XX
Cos
t ite
m
Med
iaA
war
enes
s mat
eria
l(b
illbo
ard,
pos
ter)
Fiel
d A
ssis
tant
(Can
be e
nviro
nmen
tal
Ran
gers
)
Wor
ksho
p (V
enue
,Lu
nch)
Med
iaA
war
enes
s mat
eria
lC
ages
for r
ecyc
ling
mat
eria
l
4,5,
6,11
1,2,
3,8
Impl
emen
t “N
o lit
ter c
ampa
ign”
at M
ain
Bus
Ter
min
al in
the
Upo
lu a
nd S
avai
i Isl
and
Impl
emen
t aw
aren
ess f
or th
e co
mm
unity
new
ly in
clud
ed in
the
colle
ctio
n ar
ea a
nd a
ssis
tanc
e fo
r ins
tallm
ent o
f pro
per
disc
harg
e po
int
Prom
ote
3R (R
educ
e ca
mpa
ign
/ On
site
com
post
/Off
site
com
post
/ Alu
min
um c
an c
olle
ctio
n)
2 3
Mat
ai,
Con
traco
r,MW
CSD
,M
ESC
Red
uce
Cam
paig
n(M
inis
try, B
usin
esse
s)O
n-si
te fo
r com
mun
ity(M
WC
SD, M
atai
, MA
F,W
IBD
I etc
.)O
ff-s
ite c
ompo
st(P
rivat
e se
ctor
, Lar
gesc
ale
farm
er, h
otel
sM
AF)
Alu
min
um c
anco
llect
ion
(Com
mun
ity,
SRW
MA
, was
te p
icke
r)
20,0
00(2
.1.3
.1, N
ESP)
1,12
0,00
0(2
.1.3
.3/2
.1.3
.4/2
.1.3
.6/2
.1.3
.7/2
.1.3
.10,
NES
P)
16
Act
ions
Proc
ess
Pote
ntia
l Par
tner
Rel
evan
ce to
indi
cato
rsTi
mel
ine
STA
, LTA
, MES
C,
Med
ia, N
US
Cos
t Est
imat
e(W
ST)
TBC
in th
eim
plem
enta
tion
phas
e.
4Im
plem
ent c
lean
scho
ol p
rogr
am in
rega
rds t
o pr
oper
was
tetre
atm
ent a
nd 3
R fo
r prim
ary
leve
lN
US,
USP
, MES
C,
Priv
ate
Sect
or1,
2,3,
4,6,
13M
ater
ial t
oim
plem
ent p
rogr
am
TBC
in th
eim
plem
enta
tion
phas
e.(2
.1.3
.5, 2
.1.3
.11,
NES
P)
Prio
rity
area
A: E
nhan
ce e
nviro
nmen
tal A
war
enes
s of
the
publ
ic o
n w
aste
rela
ted
issu
es a
nd th
e co
unte
rmea
sure
s

Nat
iona
l Was
te M
anag
emen
t Stra
tegy
M
inis
try o
f Nat
ural
Res
ourc
es a
nd E
nviro
nmen
t
40
Prio
rity
Are
a B:
Stre
ngth
en o
pera
tiona
l pla
nnin
g on
SW
M
2019
2020
2021
2022
2023
2024
-
The
fram
ewor
k of
the
oper
atio
n pl
anof
Taf
aiga
ta L
andf
ill is
dev
elop
ed.
XX
The
oper
atio
n pl
an o
f Taf
aiga
taLa
ndfil
l is d
evel
oped
.X
X
The
fram
ewor
k of
the
oper
atio
n pl
anof
Vai
aata
Lan
dfill
is d
evel
oped
.X
X
The
oper
atio
n pl
an o
f Vai
aata
Land
fill i
s dev
elop
ed.
XX
Targ
et z
one
is se
lect
ed.
XX
Issu
es in
the
curr
ent z
onin
g is
anal
yzed
.X
X
Act
ual s
ituat
ion
of c
olle
ctio
n zo
ne is
surv
eyed
.X
X
New
zon
ing
is p
lann
ed.
XX
Zoni
ng fo
r sel
ecte
d co
llect
ion
zone
is re
vise
d.X
X
Cos
t Est
imat
e(W
ST)
TBC
in th
eim
plem
enta
tion
phas
e.
TBC
in th
eim
plem
enta
tion
phas
e.(2
.1.2
.3, N
ESP)
Act
ions
Proc
ess
Pote
ntia
l Par
tner
Rel
evan
ce to
indi
cato
rsTi
mel
ine
1 2
Con
tract
or, M
OH
, NH
S,M
WTI
, SLC
, SR
OS
Con
tract
or, L
TA, S
LC
Dev
elop
land
fill o
pera
tion
plan
for T
afai
gata
Lan
dfill
and
Vai
aata
Lan
dfill
Rev
ise
zone
pla
n fo
r rub
bish
col
lect
ion
for t
he c
ontra
ctfr
om 2
020.
8,10
4,5,
11
Cos
t ite
m
Prin
ting
Fuel
, Sur
vey
Wor
ksho
p

Nat
iona
l Was
te M
anag
emen
t Stra
tegy
M
inis
try o
f Nat
ural
Res
ourc
es a
nd E
nviro
nmen
t
41
Prio
rity
Are
a C
: Im
plem
ent r
egul
ar s
urve
y fo
r Bas
ic S
WM
dat
a co
llect
ion
2019
2020
2021
2022
2023
2024
-
Was
te a
udit
is p
lann
edX
X
Was
te a
udit
is im
plem
ente
dX
X
The
surv
ey is
pla
nned
X
The
surv
ey is
impl
emen
ted
X
The
surv
ey is
pla
nned
(Sur
vey
item
,Sc
hedu
le, e
tc)
X
The
surv
ey is
impl
emen
ted
XX
XX
XX
Res
ult o
f the
surv
ey is
Sum
mar
ized
XX
XX
XX
The
reco
rdin
g sy
stem
is p
lann
ed.
XX
XX
XX
The
reco
rdin
g is
impl
emen
ted.
XX
XX
XX
Cos
t Est
imat
e(W
ST)
40,0
00(2
.1.1
.6, N
ESP)
TBC
in th
eim
plem
enta
tion
phas
e.(2
.1.2
.5, N
ESP)
TBC
in th
eim
plem
enta
tion
phas
e.
1SR
OS,
MW
CSD
, NU
S,U
SP, E
nviro
nmen
tal
Ass
ocia
tion
Act
ions
Proc
ess
Pote
ntia
l Par
tner
Rel
evan
ce to
indi
cato
rsTi
mel
ine
2 3
Con
tract
or, L
TA, S
LC
8,10
44,
6,8
N/A
Impl
emen
t was
te a
udit
(in ru
ral a
rea
in U
polu
, Sav
aii)
Impl
emen
t tim
e an
d m
otio
n su
rvey
and
pla
tform
surv
ey
Impl
emen
t lan
dfill
surv
ey (C
apac
ity, d
aily
repo
rt, w
ater
qual
ity te
st fo
r bot
h in
Taf
aiga
ta, S
avai
i)
Impl
emen
t con
tinuo
us w
eigh
brid
ge re
cord
ing
(Taf
aiga
ta /
Sava
ii)
SRO
S, N
US,
USP
, SB
S,M
OF,
MW
TI,
MO
F, C
ontra
ctor
, MFR
1,2,
3,4,
6,8
5,8,
11
Cos
t ite
m
Veh
icle
Fuel
Fiel
d A
ssis
tant
Equi
pmen
t (B
acke
t,Tr
ashb
ag, T
aper
en,
Glo
ve, M
ask,
Mea
sure
, Han
gw
eigh
t, B
room
, For
k,B
rash
)
Veh
icle
Fuel
Fiel
d A
ssis
tant
GPS
Equi
mpm
ent (
Dro
ne,
Sam
ple
bottl
e, te
stki
t, te
st fe
e)
Wei
ghbr
idge
,M
onito
ring
form

Nat
iona
l Was
te M
anag
emen
t Stra
tegy
M
inis
try o
f Nat
ural
Res
ourc
es a
nd E
nviro
nmen
t
42
Prio
rity
Are
a D
: Stu
dy F
easi
bilit
y of
futu
re S
WM
opt
ions
2019
2020
2021
2022
2023
2024
-
Sele
ct th
e fin
anci
al o
ptio
n to
be
stud
ied.
XX
X
Feas
ibili
ty st
udy
on p
oten
tial
finan
cial
opt
ion
is im
plem
ente
d.X
XX
Surv
ey it
em is
dis
cuss
ed.
XX
X
Col
lect
nec
essa
ry d
ata.
XX
XA
naly
ze c
olle
cted
dat
a.X
XX
Sum
mar
ize
the
resu
lt of
the
stud
yX
XX
Rem
aini
ng c
apac
ity o
f the
land
fill i
sas
sess
ed,
XX
Cos
t req
uire
d fo
r exp
ansi
on a
ndre
loca
tion
is e
stim
ated
.X
X
Res
ult o
f the
stud
y is
sum
mar
ized
.X
X
Prio
rity
Are
a E:
Est
ablis
h ef
ficie
nt m
onito
ring
syst
em o
n SW
M o
pera
tion
2019
2020
2021
2022
2023
2024
-
Prop
er m
onito
ring
syst
em is
desi
gned
XX
Mon
itorin
g sy
stem
is in
trodu
ced
XX
Prop
er m
onito
ring
syst
em is
desi
gned
XX
Mon
itorin
g sy
stem
is in
trodu
ced
XX
17
Act
ions
Proc
ess
Rel
evan
ce to
indi
cato
rsTi
mel
ine
Cos
t Est
imat
e(W
ST)
60,0
00(2
.1.3
.9, N
ESP)
2 3
7 6,9
1,33
9,79
8(2
.1.1
.2, N
ESP)
TBC
in th
eim
plem
enta
tion
phas
e.(2
.1.4
.1, 2
.1.4
.2,
NES
P)
1 2
Impl
emen
t fea
sibi
lity
stud
y on
Ups
calin
g So
lid W
aste
Man
agem
ent S
ectio
n
Impl
emen
t fea
sibi
lity
stud
y on
exp
ansi
on o
f Taf
aiga
taLa
ndfil
l with
Pub
lic P
rivat
e Pa
rtner
ship
or r
eloc
atio
n of
the
Land
fill
Esta
blis
h ru
bbis
h co
llect
ion
mon
itorin
g sy
stem
Esta
blis
h la
ndfil
l ope
ratio
n m
onito
ring
syst
em
Impl
emen
t fea
sibi
lity
stud
y on
fina
ncia
l opt
ion
(Use
r Pay
Syst
em /
CD
L )
Pote
ntia
l Par
tner
MO
F, M
FR, P
SC, E
PC,
SWA
, MPE
MO
F, M
FR, P
SC, E
PC,
SWA
, MPE
MO
F, M
FR, L
TA, S
LA,
MW
CSD
, MO
H, S
RO
S,PU
MA
MW
CSD
, SB
S
MPE
, MW
TI
4,5,
11
10
Act
ions
Proc
ess
Pote
ntia
l Par
tner
Rel
evan
ce to
indi
cato
rsTi
mel
ine
Cos
t Est
imat
e(W
ST)
TBC
in th
eim
plem
enta
tion
phas
e.(2
.1.2
.1, N
ESP)
TBC
in th
eim
plem
enta
tion
phas
e.(2
.1.2
.3, N
ESP)
Cos
t ite
m
Cos
t ite
m
TBC
in th
eim
plem
enta
tion
phas
e.
TBC
in th
eim
plem
enta
tion
phas
e.
TBC
in th
eim
plem
enta
tion
phas
e.
Veh
icle
Fuel
Sign
boa
rd

Nat
iona
l Was
te M
anag
emen
t Stra
tegy
M
inis
try o
f Nat
ural
Res
ourc
es a
nd E
nviro
nmen
t
43
Prio
rity
Act
ion
F: S
treng
then
lega
l fra
mew
ork
and
enfo
rcem
ent
2019
2020
2021
2022
2023
2024
-
Scop
e of
the
regu
latio
n is
dete
rmin
ed.
XX
Reg
ulat
ion
is d
evel
oped
XX
Reg
ulat
ion
is a
ppro
ved
XX
Reg
ulat
ion
is d
evel
oped
.X
XLi
tterin
g an
d ill
egal
dum
ping
are
mon
itore
dX
XX
XX
X
Enfo
rce
regu
latio
n fo
r lite
ring
and
illeg
al d
umpi
ng c
ases
.X
XX
XX
X
Met
hodo
logy
is p
lann
ed.
XC
ontra
ctor
's al
ignm
ent o
n co
de o
fpr
actic
e is
mon
itore
dX
XX
XX
Cod
e of
pra
ctic
e is
stric
tly c
ontro
led
base
d on
WM
A 2
010
XX
XX
X
Met
hodo
logy
is p
lann
ed.
X
Fee
colle
ctio
n is
mon
itore
d ba
sed
onth
e w
eigh
brid
ge re
cord
XX
XX
XX
Was
te d
ispo
sal f
ee c
olle
ctio
n is
stirc
tly c
ontro
lled.
XX
XX
XX
Met
hodo
logy
is p
lann
ed.
X
Plas
tic it
em is
mon
itore
d.X
XX
XX
XIm
port
of p
last
ic is
stirc
tlyco
ntro
lled.
XX
XX
XX
6R
evis
e W
aste
Man
agem
ent P
olic
yR
evie
w th
e W
aste
Man
agem
ent
Polic
y 20
01.
AG
, MW
CSD
, MO
F,M
CIL
9X
XX
Ven
ue10
,000
(2.1
.1.1
, NES
P)
8,00
0(2
.1.3
.2, N
ESP)
5En
forc
e re
gula
tion
on p
last
ic b
anM
JCA
, MO
F, M
FR, A
G12
Aw
aren
ess
Veh
icle
Cam
era
2
Act
ions
Proc
ess
Rel
evan
ce to
indi
cato
rsTi
mel
ine
3 41
Enfo
rce
code
of p
ract
ices
for t
he c
ontra
ctor
s and
staf
fs
Enfo
rce
was
te d
ispo
sal f
ee b
y w
eigh
t at t
he T
afai
gata
Land
fill
Form
ulat
e re
gula
tion
for r
ecyc
labl
e
Dev
elop
regu
latio
n fo
r enf
orce
men
t of l
itter
ing
and
illig
aldu
mpi
ng
MJC
A, M
CIL
, PSC
, AG
,M
OF,
MPE
, LTA
,SR
WM
A
MJC
A, M
OF,
MFR
, AG
Pote
ntia
l Par
tner
MJC
A, M
FAT,
AG
,SR
WM
A
MJC
A, A
G, M
OP
8,9
6,9 9 7,9
Ven
ueR
efre
shm
ent
Veh
icle
Cam
era
safe
ty g
ear
Sign
boa
rdG
ate
Cos
t Est
imat
e
60,0
00(2
.1.1
.3, N
ESP)
60,0
00(2
.1.1
.4, 2
.1.2
.4,
NES
P)
TBC
in th
eim
plem
enta
tion
phas
e.
TBC
in th
eim
plem
enta
tion
phas
e.
Cos
t ite
m
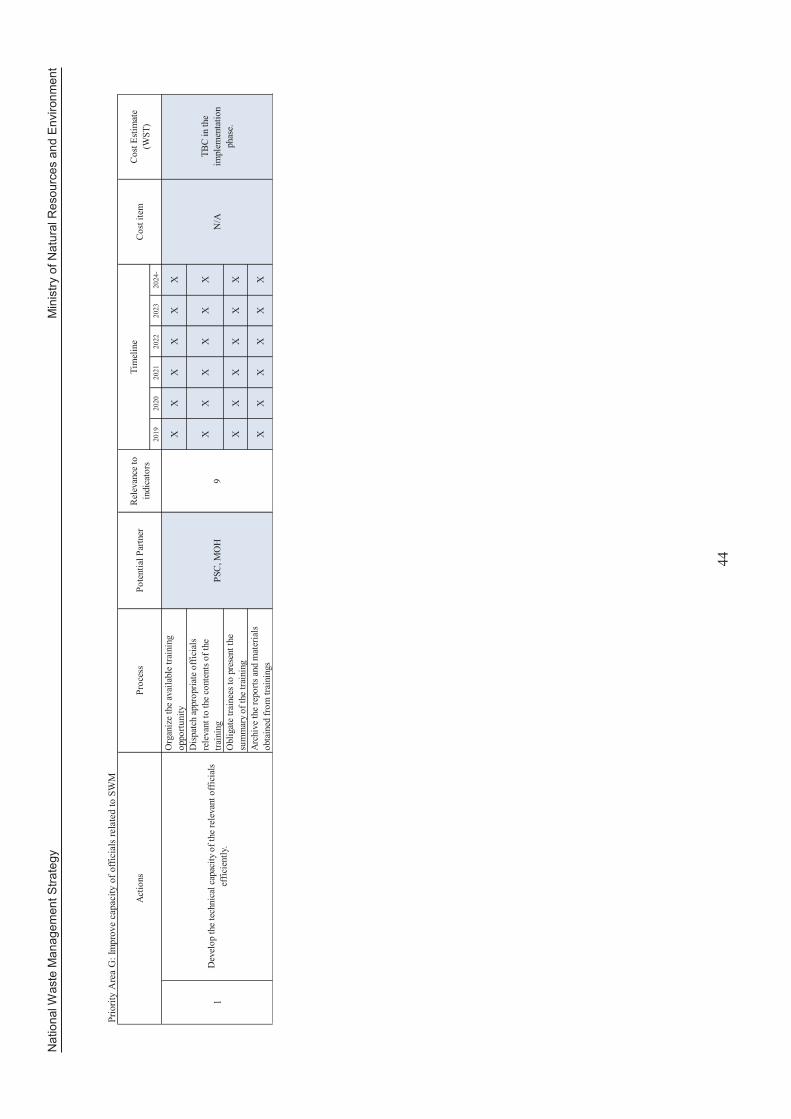
Nat
iona
l Was
te M
anag
emen
t Stra
tegy
M
inis
try o
f Nat
ural
Res
ourc
es a
nd E
nviro
nmen
t
44
Prio
rity
Are
a G
: Im
prov
e ca
paci
ty o
f offi
cial
s re
late
d to
SW
M
2019
2020
2021
2022
2023
2024
-
Org
aniz
e th
e av
aila
ble
train
ing
oppo
rtuni
tyX
XX
XX
X
Dis
patc
h ap
prop
riate
off
icia
lsre
leva
nt to
the
cont
ents
of t
hetra
inin
gX
XX
XX
X
Obl
igat
e tra
inee
s to
pres
ent t
hesu
mm
ary
of th
e tra
inin
gX
XX
XX
X
Arc
hive
the
repo
rts a
nd m
ater
ials
obta
ined
from
trai
ning
sX
XX
XX
X
Cos
t Est
imat
e(W
ST)
TBC
in th
eim
plem
enta
tion
phas
e.1
Dev
elop
the
tech
nica
l cap
acity
of t
he re
leva
nt o
ffic
ials
effic
ient
ly.
PSC
, MO
H9
Act
ions
Proc
ess
Pote
ntia
l Par
tner
Rel
evan
ce to
indi
cato
rsTi
mel
ine
N/A
Cos
t ite
m
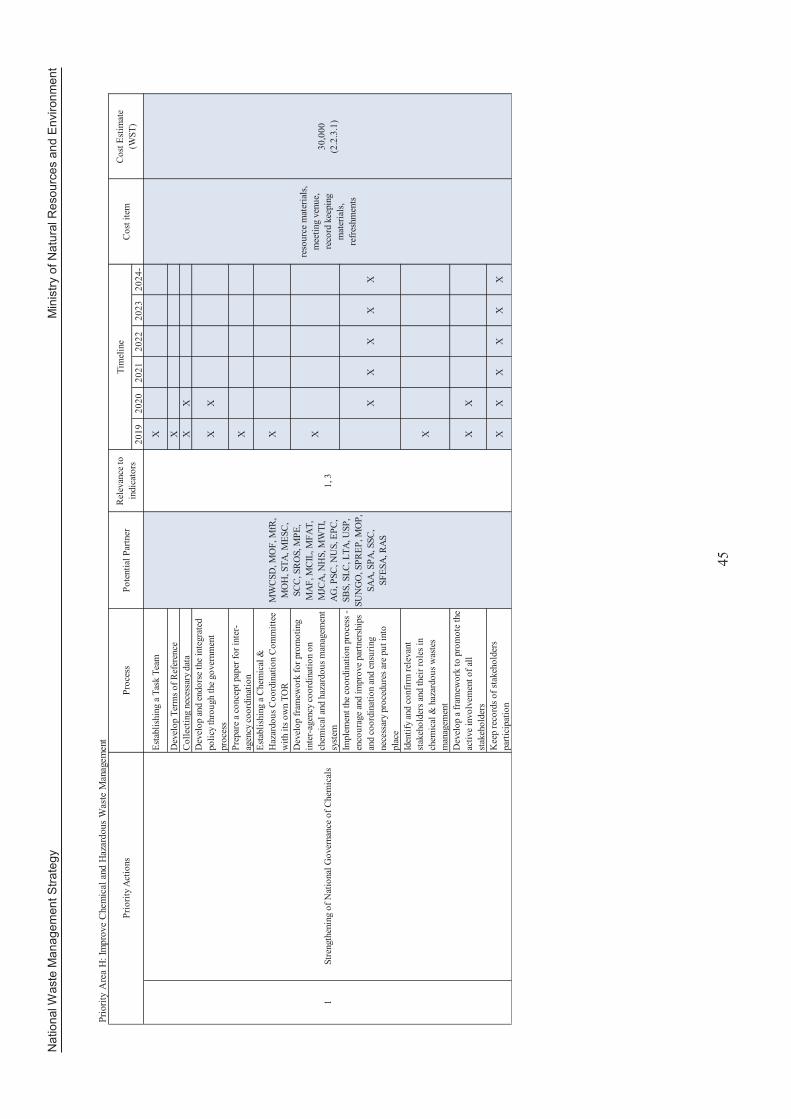
Nat
iona
l Was
te M
anag
emen
t Stra
tegy
M
inis
try o
f Nat
ural
Res
ourc
es a
nd E
nviro
nmen
t
45
Prio
rity
Are
a H
: Im
prov
e C
hem
ical
and
Haz
ardo
us W
aste
Man
agem
ent
2019
2020
2021
2022
2023
2024
-
Esta
blis
hing
a T
ask
Team
X
Dev
elop
Ter
ms o
f Ref
eren
ceX
Col
lect
ing
nece
ssar
y da
taX
XD
evel
op a
nd e
ndor
se th
e in
tegr
ated
polic
y th
roug
h th
e go
vern
men
tpr
oces
sX
X
Prep
are
a co
ncep
t pap
er fo
r int
er-
agen
cy c
oord
inat
ion
X
Esta
blis
hing
a C
hem
ical
&H
azar
dous
Coo
rdin
atio
n C
omm
ittee
with
its o
wn
TOR
X
Dev
elop
fram
ewor
k fo
r pro
mot
ing
inte
r-ag
ency
coo
rdin
atio
n on
chem
ical
and
haz
ardo
us m
anag
emen
tsy
stem
X
Impl
emen
t the
coo
rdin
atio
n pr
oces
s -en
cour
age
and
impr
ove
partn
ersh
ips
and
coor
dina
tion
and
ensu
ring
nece
ssar
y pr
oced
ures
are
put
into
plac
e
XX
XX
X
Iden
tify
and
conf
irm re
leva
ntst
akeh
olde
rs a
nd th
eir r
oles
inch
emic
al &
haz
ardo
us w
aste
sm
anag
emen
t
X
Dev
elop
a fr
amew
ork
to p
rom
ote
the
activ
e in
volv
emen
t of a
llst
akeh
olde
rsX
X
Kee
p re
cord
s of s
take
hold
ers
parti
cipa
tion
XX
XX
XX
Cos
t Est
imat
e(W
ST)
30,0
00(2
.2.3
.1)
MW
CSD
, MO
F, M
fR,
MO
H, S
TA, M
ESC
,SC
C, S
RO
S, M
PE,
MA
F, M
CIL
, MFA
T,M
JCA
, NH
S, M
WTI
,A
G, P
SC, N
US,
EPC
,SB
S, S
LC, L
TA, U
SP,
SUN
GO
, SPR
EP, M
OP,
SAA
, SPA
, SSC
,SF
ESA
, RA
S
Pote
ntia
l Par
tner
Rel
evan
ce to
indi
cato
rsPr
iorit
y A
ctio
nsPr
oces
s
1St
reng
then
ing
of N
atio
nal G
over
nanc
e of
Che
mic
als
Cos
t ite
m
1, 3
reso
urce
mat
eria
ls,
mee
ting
venu
e,re
cord
kee
ping
mat
eria
ls,
refr
eshm
ents
Tim
elin
e

Nat
iona
l Was
te M
anag
emen
t Stra
tegy
M
inis
try o
f Nat
ural
Res
ourc
es a
nd E
nviro
nmen
t
46
Prio
rity
Are
a H
: Im
prov
e C
hem
ical
and
Haz
ardo
us W
aste
Man
agem
ent
2019
2020
2021
2022
2023
2024
-Id
entif
y w
hat t
ypes
of h
azar
dsex
pose
d to
hea
lth a
nd e
nviro
nmen
tdu
ring
chem
ical
and
man
agem
ent
proc
ess
XX
Dev
elop
and
impr
ove
awar
enes
sra
isin
g m
ater
ials
bas
ed o
n th
eid
entif
ied
haza
rds f
aced
XX
XX
XX
Und
erta
ke a
war
enes
s-ra
isin
gac
tiviti
es fo
rco
nsum
ers/
stak
ehol
ders
, in
parti
cula
r by
educ
atin
g th
em o
n be
stpr
actic
es fo
r che
mic
al u
se, r
isks
that
chem
ical
s may
pos
e to
thei
r hea
lthan
d th
e en
viro
nmen
t.
XX
XX
XX
Esta
blis
h tim
ely
arra
ngem
ents
for t
heex
chan
ge o
f inf
orm
atio
n to
min
imiz
eba
rrie
rs in
info
rmat
ion
exch
ange
(loca
l lan
guag
e an
d si
mpl
e te
rms
used
)
XX
XX
XX
Prep
are
Term
s of R
efer
ence
XId
entif
ying
Tec
hnic
al C
onsu
ltant
sX
Hol
istic
revi
ew o
f Leg
isla
tion
syst
em fo
r Che
mic
al a
nd H
azar
dous
with
the
aim
of h
arm
oniz
ing
the
legi
slat
ion
XX
Prep
are
impr
oved
/revi
sed
legi
slat
ion
for c
hem
ical
man
agem
ent
XX
Cos
t Est
imat
e(W
ST)
130,
000
(2.2
.3.1
, 2.2
.3.2
,2.
2.3.
3 N
ESP)
140,
000
(2.2
.1.1
, 2.2
.1.6
,2.
2.1.
7 N
ESP)
MA
F, M
fR, M
OH
,N
HS,
MC
IT, M
ESC
MA
F, M
fR,
NH
S, A
G,
MO
F, M
WC
SD,
Prio
rity
Act
ions
Proc
ess
Pote
ntia
l Par
tner
2In
crea
sed
awar
enes
s of c
hem
ical
haz
ards
3En
hanc
ed a
nd Im
prov
ed C
hem
ical
Leg
isla
tion
1, 2
, 3, 4
3
prom
otio
nal
mat
eria
ls -
post
ers,
pam
phle
ts,
billb
oard
s, si
gnag
es,
adve
rtism
ents
adve
rtise
men
ts,
eval
uatio
n m
eetin
gs,
wor
ksho
ps,
com
mun
ityco
nsul
tatio
ns,
refr
eshm
ents
Rel
evan
ce to
indi
cato
rsTi
mel
ine
Cos
t ite
m

Nat
iona
l Was
te M
anag
emen
t Stra
tegy
M
inis
try o
f Nat
ural
Res
ourc
es a
nd E
nviro
nmen
t
47
Prio
rity
Are
a H
: Im
prov
e C
hem
ical
and
Haz
ardo
us W
aste
Man
agem
ent
2019
2020
2021
2022
2023
2024
-D
evel
op n
atio
nal c
hem
ical
guid
elin
es a
nd a
lign
with
inte
rnat
iona
l req
uire
men
ts,
espe
cial
ly th
e ob
ligat
ions
und
er e
ach
of th
e co
nven
tions
.
XX
Prom
ote
ratif
icat
ion
and
impl
emen
tatio
n of
all
rele
vant
inte
rnat
iona
l ins
trum
ents
on
chem
ical
s and
haz
ardo
us w
aste
s
XX
XX
XX
Ensu
re in
tern
atio
nal p
roce
dure
s are
follo
wed
as p
er p
arty
's ob
ligat
ions
XX
XX
XX
Col
lect
and
man
age
data
and
reco
rds
for r
epor
ting
purp
oses
XX
XX
XX
Prep
are
repo
rts fo
r con
vent
ions
annu
ally
XX
X
Esta
blis
h te
chni
cal w
orki
ng g
roup
tow
ork
on c
lass
ifica
tion
of c
hem
ical
sin
Sam
oaX
Alig
n al
l cla
ssifi
catio
ns w
ith th
ein
tern
atio
nal c
lass
ifica
tion
syst
em,
espe
cial
ly th
e G
loba
l Har
mon
ized
Syst
em (G
HS)
XX
Dev
elop
a p
rogr
am o
n to
intro
duce
the
GH
S in
to th
e cl
assi
ficat
ion
syst
em fo
r che
mic
als n
atio
nally
XX
Impl
emen
tatio
n of
the
prog
ram
with
rele
vant
key
stak
ehol
ders
XX
XX
X
Con
duct
revi
ew a
fter e
very
five
(5)
year
sX
App
ly li
fe-c
ycle
man
agem
ent
appr
oach
es to
ens
ure
that
che
mic
als
man
aem
ent d
ecis
ions
are
con
sist
ent
with
the
goal
s of s
usta
inab
lede
velo
pmen
t
XX
XX
X
App
ly B
asel
and
Wai
gani
Con
vent
ions
regi
mes
in th
em
anag
emen
t of c
hem
ical
was
tes i
nSa
moa
XX
XX
XX
120,
000
(2.2
.1.2
, 2.2
.1.4
,2.
2.1.
5, N
ESP)
68,0
00(2
.2.2
.2, 2
.2.2
.5,
2.2.
2.7,
NES
P)
Cos
t Est
imat
e(W
ST)
MA
F, M
fR,
MFA
T,SP
REP
,
MA
F, M
fR, M
OH
,N
HS,
MES
C, S
RO
S,U
SP, N
US,
MFA
T,SP
REP
, SFE
SA, M
OP,
LTA
Prio
rity
Act
ions
Proc
ess
Pote
ntia
l Par
tner
4Ef
fect
ive
Impl
emen
tatio
n of
Che
mic
al R
elat
ed R
egio
nal
and
Inte
rnat
iona
l Con
vent
ions
5Su
stai
nabl
e M
anag
emen
t of C
hem
ical
s dur
ing
thei
rLi
fecy
cle
1, 2
, 3
1, 2
, 3, 4
wor
ksho
ps a
ndm
eetin
g ve
nues
,aw
aren
ess a
ndpr
omot
iona
lm
ater
ials
mee
ting
venu
es a
ndm
ater
ials
, PPE
s,re
srou
ce to
ols,
Rel
evan
ce to
indi
cato
rsTi
mel
ine
Cos
t ite
m

Nat
iona
l Was
te M
anag
emen
t Stra
tegy
M
inis
try o
f Nat
ural
Res
ourc
es a
nd E
nviro
nmen
t
48
Prio
rity
Act
ion
H: I
mpr
ove
Che
mic
al a
nd H
azar
dous
Was
te M
anag
emen
t
2019
2020
2021
2022
2023
2024
-C
ondu
ct b
asel
ine
surv
eyX
Dev
elop
dat
abas
e an
d in
vent
orie
s for
Che
mic
al a
nd H
azar
dous
XX
Reg
ular
ly u
pdat
e an
d re
vise
thes
eda
taba
se a
nd in
vent
orie
sX
XX
X
Dev
elop
nat
iona
l pro
files
and
impl
emen
t act
ion
plan
s for
soun
dm
anag
emen
t of c
hem
ical
sX
X
Thro
ugh
the
inte
r-ag
ency
com
mitt
ee,
colla
bora
te w
ith M
OH
to ta
ke le
adon
this
wor
k, e
spec
ially
for t
hehe
alth
and
env
ironm
ent w
ork
XX
XX
X
Prep
are
natio
nal r
epor
t on
a re
gula
rba
sis,
ever
y tw
o (2
) yea
rsX
XX
Esta
blis
h ro
les a
nd re
spon
sibi
litie
sfo
r diff
eren
t sec
tors
rela
ted
to th
etra
de a
nd u
se o
f che
mic
als
XX
Dev
elop
a p
rogr
am o
n in
vent
ory
and
data
base
of c
hem
ical
s and
haz
ardo
usw
aste
s in
Sam
oaX
Reg
ular
ly u
pdat
e an
d re
vise
thes
eda
taba
se a
nd in
vent
orie
sX
XX
XX
Cos
t Est
imat
e(W
ST)
67,0
00(2
.2.1
.3, 2
.2.2
.3,
2.2.
2.11
, NES
P)
SBS,
MO
F, M
fR, M
AF,
MO
H, N
HS,
MES
C,
MC
IT
Prio
rity
Act
ions
6G
reat
er a
vaila
bilit
y of
Info
rmat
ion
and
data
trans
porta
tion,
pet
rol,
reso
urce
mat
eria
ls1,
3, 4
Proc
ess
Pote
ntia
l Par
tner
Rel
evan
ce to
indi
cato
rsTi
mel
ine
Cos
t ite
m
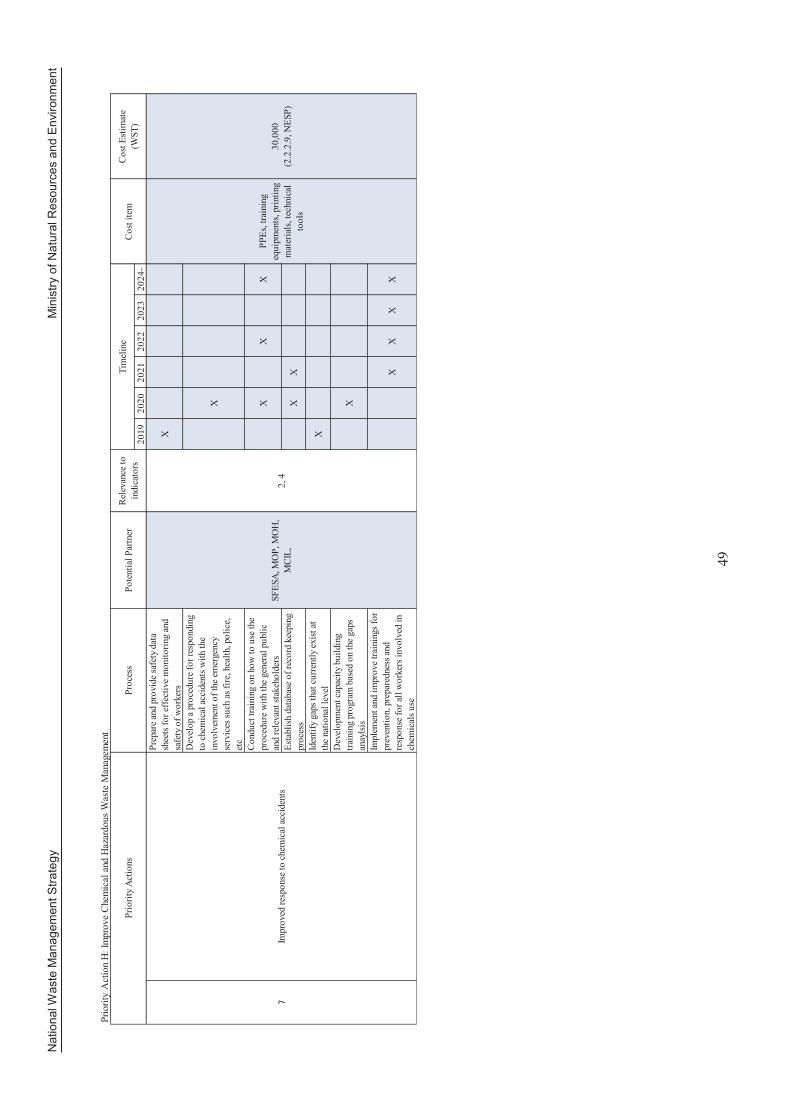
Nat
iona
l Was
te M
anag
emen
t Stra
tegy
M
inis
try o
f Nat
ural
Res
ourc
es a
nd E
nviro
nmen
t
49
Prio
rity
Act
ion
H: I
mpr
ove
Che
mic
al a
nd H
azar
dous
Was
te M
anag
emen
t
2019
2020
2021
2022
2023
2024
-Pr
epar
e an
d pr
ovid
e sa
fety
dat
ash
eets
for e
ffec
tive
mon
itorin
g an
dsa
fety
of w
orke
rsX
Dev
elop
a p
roce
dure
for r
espo
ndin
gto
che
mic
al a
ccid
ents
with
the
invo
lvem
ent o
f the
em
erge
ncy
serv
ices
such
as f
ire, h
ealth
, pol
ice,
etc
X
Con
duct
trai
ning
on
how
to u
se th
epr
oced
ure
with
the
gene
ral p
ublic
and
rele
vant
stak
ehol
ders
XX
X
Esta
blis
h da
taba
se o
f rec
ord
keep
ing
proc
ess
XX
Iden
tify
gaps
that
cur
rent
ly e
xist
at
the
natio
nal l
evel
X
Dev
elop
men
t cap
acity
bui
ldin
gtra
inin
g pr
ogra
m b
ased
on
the
gaps
anay
lsis
X
Impl
emen
t and
impr
ove
train
ings
for
prev
entio
n, p
repa
redn
ess a
ndre
spon
se fo
r all
wor
kers
invo
lved
inch
emic
als u
se
XX
XX
Cos
t Est
imat
e(W
ST)
30,0
00(2
.2.2
.9, N
ESP)
Impr
oved
resp
onse
to c
hem
ical
acc
iden
tsSF
ESA
, MO
P, M
OH
,M
CIL
,
PPEs
, tra
inin
geq
uipm
ents
, prin
ting
mat
eria
ls, t
echn
ical
tool
s
2, 4
Prio
rity
Act
ions
Proc
ess
Pote
ntia
l Par
tner
Rel
evan
ce to
indi
cato
rsTi
mel
ine
Cos
t ite
m

Nat
iona
l Was
te M
anag
emen
t Stra
tegy
M
inis
try o
f Nat
ural
Res
ourc
es a
nd E
nviro
nmen
t
50
Pr
iorit
y A
ctio
n H
: Im
prov
e C
hem
ical
and
Haz
ardo
us W
aste
Man
agem
ent
2019
2020
2021
2022
2023
2024
-Id
entif
y ga
ps th
at c
urre
ntly
exi
st a
tth
e na
tiona
l lev
elX
Esta
blis
h pr
ogra
ms f
or sc
ient
ific
and
tech
nica
l tra
inin
g of
per
sonn
el,
incl
udin
g cu
stom
s per
sonn
elX
X
Prom
ote
nece
ssar
y tra
inin
g ne
eds
and
capa
city
-bui
ldin
g fo
r all
peop
lein
volv
ed d
irect
ly a
nd in
dire
ctly
with
chem
ical
use
and
dis
posa
l
XX
XX
X
Impl
emen
t the
cap
acity
bui
ldin
gtra
inin
g w
ith sp
ecifi
c ag
enci
es a
ndst
akeh
olde
rsX
XX
XX
X
Eval
uate
the
capa
city
on
a re
gula
rba
sis
XX
XX
XX
Und
erta
ke g
aps a
nd n
eeds
ana
lysi
sfo
r the
spec
ializ
ed te
chni
cal s
kills
inth
e co
untry
and
pre
pare
repo
rtX
Dev
elop
a p
rogr
am to
impr
ove
the
spec
ializ
ed te
chni
cal s
kills
nat
iona
llyX
X
Impl
emen
t the
pro
gram
to e
stab
lish
natio
nal l
abor
ator
y fa
cilit
ies,
com
plet
e w
ith m
oder
n te
chno
logi
esan
d eq
uipm
ents
for t
estin
g em
issi
ons
and
setti
ng n
atio
nal s
tand
ards
XX
XX
Dev
elop
reso
urce
s for
nat
iona
lim
plem
enta
tion
plan
s and
pro
ject
sX
XX
XX
X
Expl
ore
fund
ing
mec
hani
sms a
ndpr
ocur
e re
sour
ces t
o su
ppor
tch
emic
al m
anag
emen
t int
itiat
ives
XX
XX
XX
Mak
e av
aila
ble
suff
icie
nt fi
nanc
ial
and
tech
nica
l res
ourc
es to
supp
ort
natio
nal a
nd re
gion
al c
apac
ity-
build
ing
proj
ects
XX
XX
XX
Cos
t Est
imat
e(W
ST)
TBC
in th
eim
plem
enta
tion
phas
e.
MO
F, M
AF,
MO
H,
NH
S, R
AS,
SPR
EP,
SRO
S, N
US,
USP
Ade
quat
e lo
cal r
esou
rces
for c
hem
ical
man
agem
ent
Prio
rity
Act
ions
Proc
ess
Pote
ntia
l Par
tner
prin
ting
mat
eria
ls,
mee
ting
venu
es,
reso
urce
mat
eria
ls2,
3, 4
Rel
evan
ce to
indi
cato
rsTi
mel
ine
Cos
t ite
m

National Waste Management Strategy Ministry of Natural Resources and Environment
51
7 Monitoring and Evaluation
7.1 Measuring Progress
The likelihood of success in implementing the NWMS will depend on an established mechanism to regularly monitor and periodically evaluate progress of the planned activities. The monitoring and evaluation mechanism will take into account feedback on findings through a Waste Monitoring System and lessons learned to enhance performance and results.
The baseline data presented in the strategy context is very critical as reference points to establish targets for the achievement of the set goals for the duration of the plan. The monitoring framework will be developed in consultation with the constituted multi-sectoral Steering Committee using the guidance to be provided at the regional level (Regional Waste Monitoring System).
7.2 Periodic Review of the Action Plan
The following framework outlines the proposed review process of the implementation of the Strategy and Action Plan.
Figure 3-2 Process for reviewing the implementation of the Strategy
7.3 NWMS Steering Committee
7.3.1 Member of Steering Committee
CEO, ACEO and principal officers or equivalent officers of following ministries and government agency were identified as member of Steering Committee. Chairman is CEO of MNRE.
The Committee performed its functions and responsibilities agreed through an approved Terms of Reference

National Waste Management Strategy Ministry of Natural Resources and Environment
52
Table 3-1 Member of Steering Committee
1 MNRE Ministry of Natural Resource and Environment 2 MWCSD Ministry of Women Community & Social Development
3 MOF Ministry of Finance
4 MfR Ministry for Revenue 5 MOH Ministry of Health
6 STA Samoa Tourism Authority
7 MESC Ministry of Education Sports & Culture 8 SCC Samoa Chamber of Commerce
9 SROS Scientific Research Organization of Samoa
10 MPE Ministry of Public Enterprises 11 MAF Ministry of Agriculture & Fisheries
12 MCIL Ministry of Commerce Industry & Labour
13 MFAT Ministry of Foreign Affairs & Trade 14 MJCA Ministry of Justice & Courts Administration
15 NHS National Health Services
16 MWTI Ministry of Works & Transport & Infrastructure 17 MPMC Ministry of the Prime Minster & Cabinet
18 AG Attorney General
19 PSC Public Service Commission 20 NUS National University of Samoa
21 EPC Electric Power Corporation
22 SBS Samoa Bureau of Statistics 23 SLC Samoa Land Corporation
24 LTA Land Transport Authority
25 USP University of South Pacific / Alafua 26 SUNGO Samoa Umbrella of Non-Governmental Organization
27 SPREP Secretariat of the Pacific Regional Environment Programme
28 MOP Ministry of Police 29 SAA Samoa Airport Authority
30 SPA Samoa Port Authority
31 SSC Samoa Shipping Corporation 32 SFESA Samoa Fire Emergency Services Authority
33 SWA Samoa Water Authority
34 SRWMA Samoa Recycling & Waste Management Association
7.4 NWMS Sub Steering Committee
The NWMS Sub Steering Committee might be formulated under the NWMS Steering Committee depends on its necessity for monitoring of the implementation of the NWMS. A separate TOR will be developed to indicate the specific operational functions of the Committee.

National Waste Management Strategy Ministry of Natural Resources and Environment
53
7.5 Financial Considerations
The implementation of the strategy requires substantial financial and technical resources. Funding can be sourced through national budget allocation and development partners’ assistance.
The following recommended strategies can be explored:
Establishing user-pay and polluter-pay systems to cover costs for waste service delivery, Mainstreaming waste management with other priority development areas such as climate change,
economic development (agriculture and tourism), and biodiversity conservation, among others, allowing for cross-sectoral issues to be addressed and multi-sectoral engagement enhanced,
Continuously raising the profile of waste management among politicians, decision-makers, communities and development partners to invite more funding to the sector; and
Ensuring that project outcomes and outputs are significantly achieved to encourage more investment into the waste sector from both the government and development partners.

Nat
iona
l Was
te M
anag
emen
t Stra
tegy
M
inis
try o
f Nat
ural
Res
ourc
es a
nd E
nviro
nmen
t
54
Part
4
Anne
x
1 Fu
ture
fore
cast
of i
ndic
ator
s
Bel
ow ta
ble
show
s fut
ure
fore
cast
of in
dica
tors
with
out a
ny st
rate
gic
actio
n un
til 2
023.
Tabl
e 4-
1 Fu
ture
fore
cast
of i
ndic
ator
s w
ithou
t any
stra
tegi
c ac
tion
2011
2012
2013
2014
2015
2016
2017
2018
2019
2020
2021
2022
2023
pers
on18
7,82
018
9,42
519
1,02
919
2,63
419
4,23
819
5,84
319
7,44
819
9,05
220
0,65
720
2,26
120
3,86
620
5,47
120
7,07
5
Popu
latio
n in
Upo
lupe
rson
152,
344
153,
592
154,
840
156,
089
157,
337
158,
585
159,
833
161,
081
pers
on43
,499
43,8
5544
,212
44,5
6844
,925
45,2
8145
,637
45,9
94
g/pe
rson
/day
26.5
426
.62
26.7
026
.78
26.8
626
.94
27.0
2
g/pe
rson
/day
138.
1513
8.56
138.
9713
9.39
139.
8014
0.21
140.
62
g/pe
rson
/day
37.3
037
.41
37.5
237
.63
37.7
537
.86
37.9
7
g/pe
rson
/day
10.9
510
.98
11.0
211
.05
11.0
811
.11
11.1
5
g/pe
rson
/day
39.5
539
.67
39.7
939
.90
40.0
240
.14
40.2
6
g/pe
rson
/day
7.33
7.35
7.37
7.40
7.42
7.44
7.46
g/pe
rson
/day
14.2
314
.27
14.3
114
.36
14.4
014
.44
14.4
8
g/pe
rson
/day
46.2
646
.40
46.5
446
.67
46.8
146
.95
47.0
9
g/pe
rson
/day
14.5
914
.63
14.6
814
.72
14.7
614
.81
14.8
5
g/pe
rson
/day
2.42
2.43
2.43
2.44
2.45
2.46
2.46
g/pe
rson
/day
21.6
521
.71
21.7
821
.84
21.9
121
.97
22.0
4
g/pe
rson
/day
3.69
3.70
3.71
3.72
3.73
3.75
3.76
g/pe
rson
/day
4.87
4.88
4.90
4.91
4.93
4.94
4.96
g/pe
rson
/day
11.3
111
.34
11.3
811
.41
11.4
511
.48
11.5
1
g/pe
rson
/day
3.07
3.08
3.09
3.10
3.11
3.12
3.12
g/pe
rson
/day
5.02
5.03
5.05
5.06
5.08
5.09
5.11
g/pe
rson
/day
380
386.
9338
8.09
389.
2439
0.40
391.
5539
2.71
393.
86
Item
Uni
tPa
stFu
ture
For
ecas
t
Stee
l
Popu
latio
n
Popu
latio
n in
Sav
aii
H o u s e h o l d W a s t e
Gre
en w
aste
Food
scr
ap
Pape
r
Car
dboa
rd
Plas
tic b
ags/
pape
rs
PET
bottl
es
Plas
tic c
onta
iner
s
Dia
per
Gla
ss
Cer
amic
Tota
l
Alim
inum
Oth
er m
etal
Text
ile
Rubb
er
Oth
ers

Nat
iona
l Was
te M
anag
emen
t Stra
tegy
M
inis
try o
f Nat
ural
Res
ourc
es a
nd E
nviro
nmen
t
55
2011
2012
2013
2014
2015
2016
2017
2018
2019
2020
2021
2022
2023
ton/
day
59.4
360
.09
60.7
661
.42
62.0
962
.77
63.4
4
ton/
day
16.9
717
.16
17.3
517
.54
17.7
317
.92
18.1
2
ton/
day
47.9
148
.72
49.5
550
.39
51.2
552
.12
53.0
1
ton/
day
13.6
813
.91
14.1
514
.39
14.6
314
.88
15.1
4
ton/
day
107.
3410
8.81
110.
3111
1.81
113.
3411
4.89
116.
45
ton/
day
30.6
531
.07
31.5
031
.93
32.3
632
.80
33.2
5
ton/
day
137.
9913
9.88
141.
8014
3.74
145.
7114
7.69
149.
70
Off-
site
com
post
in U
polu
ton/
day
N/A
N/A
N/A
N/A
N/A
N/A
N/A
Off-
site
com
post
in S
avai
ito
n/da
yN
/AN
/AN
/AN
/AN
/AN
/AN
/A
Alu
min
ium
can
s fro
m h
ouse
hold
sep
arat
ed fo
r rec
yclin
g in
Upo
luto
n/da
y0.
240.
240.
250.
250.
250.
260.
26
Alu
min
ium
can
s fro
m h
ouse
hold
sep
arat
ed fo
r rec
yclin
g in
Sav
aii
ton/
day
0.00
0.00
0.00
0.00
0.00
0.00
0.00
Alu
min
ium
can
s fro
m b
usin
ess
sepa
rate
d fo
r rec
yclin
g in
Upo
luto
n/da
y0.
060.
060.
060.
060.
060.
060.
07
Alu
min
ium
can
s fro
m b
usin
ess
sepa
rate
d fo
r rec
yclin
g in
Sav
aii
ton/
day
0.00
0.00
0.00
0.00
0.00
0.00
0.00
Recy
clin
g Ra
tio o
f Alu
min
um c
ans
from
hou
seho
ld in
Upo
lu%
44.0
044
.00
44.0
044
.00
44.0
044
.00
44.0
0
Recy
clin
g Ra
tio o
f Alu
min
um c
ans
from
hou
seho
ld in
Sav
aii
%0.
000.
000.
000.
000.
000.
000.
00
Recy
clin
g Ra
tio o
f Alu
min
um c
ans
from
bus
ines
s in
Upo
lu%
N/A
N/A
N/A
N/A
N/A
N/A
N/A
Recy
clin
g Ra
tio o
f Alu
min
um c
ans
from
bus
ines
s in
Sav
aii
%0.
000.
000.
000.
000.
000.
000.
00
Hou
seho
ld W
aste
tran
spor
ted
by c
ontra
ctor
at T
afai
gata
ton/
day
22.6
022
.91
23.2
223
.54
23.8
624
.19
24.5
2
Busi
ness
Was
te tr
ansp
orte
d by
con
tract
or a
t Taf
aiga
tato
n/da
y1.
201.
221.
231.
251.
271.
281.
30
Hou
seho
ld W
aste
dire
ctly
tran
spor
ted
at T
afai
gata
ton/
day
2.20
2.23
2.26
2.29
2.32
2.35
2.39
Busi
ness
Was
te d
irect
ly tr
ansp
orte
d at
Taf
aiga
tato
n/da
y19
.00
19.2
619
.53
19.7
920
.06
20.3
420
.61
Hou
seho
ld W
aste
tran
spor
ted
by c
ontra
ctor
at V
aiaa
tato
n/da
yN
/AN
/AN
/AN
/AN
/AN
/AN
/A
Busi
ness
Was
te tr
ansp
orte
d by
con
tract
or a
t Vai
aata
ton/
day
N/A
N/A
N/A
N/A
N/A
N/A
N/A
Hou
seho
ld W
aste
dire
ctly
tran
spor
ted
at V
aiaa
tato
n/da
yN
/AN
/AN
/AN
/AN
/AN
/AN
/A
Busi
ness
Was
te d
irect
ly tr
ansp
orte
d at
Vai
aata
ton/
day
N/A
N/A
N/A
N/A
N/A
N/A
N/A
Gen
eral
was
te fr
om h
ouse
hold
in U
polu
Gen
eral
was
te fr
om h
ouse
hold
in S
avai
i
Gen
eral
was
te fr
om b
usin
ess
in U
polu
Gen
eral
was
te fr
om b
usin
ess
in S
avai
i
Gen
eral
was
te in
Sam
oa
Futu
re F
orec
ast
Item
Uni
tPa
st
Gen
eral
was
te in
Sav
aii
Gen
eral
was
te in
Upo
lu

Nat
iona
l Was
te M
anag
emen
t Stra
tegy
M
inis
try o
f Nat
ural
Res
ourc
es a
nd E
nviro
nmen
t
56
2011
2012
2013
2014
2015
2016
2017
2018
2019
2020
2021
2022
2023
ton/
day
45.0
145
.63
46.2
546
.89
47.5
348
.18
48.8
3
ton/
day
N/A
N/A
N/A
N/A
N/A
N/A
N/A
m3
22.5
122
.81
23.1
323
.44
23.7
624
.09
24.4
2
m3
N/A
N/A
N/A
N/A
N/A
N/A
N/A
Alu
min
um c
an c
olle
cted
at T
afai
gata
Lan
dfill
ton/
day
0.01
0.01
0.01
0.01
0.01
0.01
0.01
Alu
min
um c
an c
olle
cted
at V
aiaa
ta L
andf
illto
n/da
y0.
000.
000.
000.
000.
000.
000.
00
Fina
l Dis
pose
d w
aste
at T
afai
gata
ton/
day
45.0
045
.62
46.2
446
.88
47.5
248
.16
48.8
2
Fina
l Dis
pose
d w
aste
at V
aiaa
tato
n/da
yN
/AN
/AN
/AN
/AN
/AN
/AN
/A
Fina
l Dis
posa
l rat
io in
Upo
lu%
4242
4242
4242
42
Fina
l Dis
posa
l rat
io in
Sav
aii
%N
/AN
/AN
/AN
/AN
/AN
/AN
/A
Rem
aini
ng C
apac
ity o
f Taf
aiga
ta L
andf
illm
3N
/AN
/AN
/AN
/AN
/AN
/AN
/A
Rem
aini
ng C
apac
ity o
f Vai
aata
Lan
dfill
m3
N/A
N/A
N/A
N/A
N/A
N/A
N/A
%38
3838
3838
3939
Col
lect
ion
cove
rage
for S
avai
i by
was
te a
mou
nt%
N/A
N/A
N/A
N/A
N/A
N/A
N/A
Leng
th o
f col
lect
ion
rout
e in
Upo
lum
806,
734
806,
734
806,
734
Leng
th o
f col
lect
ion
rout
e in
Sav
aii
m34
5,54
034
5,54
034
5,54
0
Leng
th o
f act
ual t
rack
con
firm
ed a
t T&
M in
Upo
lum
495,
224
495,
224
495,
224
Leng
th o
f act
ual t
rack
con
firm
ed a
t T&
M in
Sav
aii
m23
5,42
723
5,42
723
5,42
7
Col
lect
ion
cove
rage
for U
polu
by
track
%61
.00
61.0
061
.00
61.0
0
Col
lect
ion
cove
rage
for S
avai
i by
track
%68
.00
68.0
068
.00
68.0
0
Unm
anag
ed W
aste
in U
polu
ton/
day
62.0
462
.89
63.7
564
.63
65.5
166
.40
67.3
1
Unm
anag
ed W
aste
in S
avai
ito
n/da
yN
/AN
/AN
/A
Ratio
of u
nman
aged
was
te in
Upo
lu%
5858
5858
5858
58
Ratio
of u
nman
aged
was
te in
Sav
aii
%N
/AN
/AN
/A
Cos
t for
was
te c
olle
ctio
n se
rvic
e in
Upo
luW
ST/y
ear
1,68
6,96
6
Cos
t for
was
te c
olle
ctio
n se
rvic
e in
Sav
aii
WST
/yea
r67
3,13
8
Cos
t for
litte
r mai
nten
ance
WST
/yea
r43
3,63
8
Cos
t for
Law
n m
aint
enan
ceW
ST/y
ear
25,4
50
Cos
t for
Lan
dfill
Mai
nten
ance
in U
polu
WST
/yea
r29
9,80
5
Cos
t for
Lan
dfill
Mai
nten
ance
in S
avai
iW
ST/y
ear
144,
000
Reve
nue
from
wei
ghbr
idge
WST
/yea
r10
2,95
9N
/AN
/AN
/AN
/AN
/AN
/A
Ratio
of S
WM
reve
nue
in c
ost
%3
3
Ratio
of p
last
ics
in d
isch
arge
d w
aste
from
hou
seho
ld%
1616
1616
1616
16
Was
te in
com
ing
to T
afai
gata
Lan
dfill
Was
te in
com
ing
to V
aiaa
ta L
andf
ill
Vol
ume
of W
aste
inco
min
g to
Taf
aiga
ta L
andf
ill
Vol
ume
of W
aste
inco
min
g to
Vai
aata
Lan
dfill
Col
lect
ion
cove
rage
for U
polu
by
was
te a
mou
ntItem
Uni
tPa
stFu
ture
For
ecas
t

Nat
iona
l Was
te M
anag
emen
t Stra
tegy
M
inis
try o
f Nat
ural
Res
ourc
es a
nd E
nviro
nmen
t
57
Tabl
e 4-
2 Fu
ture
fore
cast
of i
ndic
ator
s w
ith s
trate
gic
actio
ns
2011
2012
2013
2014
2015
2016
2017
2018
2019
2020
2021
2022
2023
pers
on18
7,82
018
9,42
519
1,02
919
2,63
419
4,23
819
5,84
319
7,44
819
9,05
220
0,65
720
2,26
120
3,86
620
5,47
120
7,07
5
Popu
latio
n in
Upo
lupe
rson
152,
344
153,
592
154,
840
156,
089
157,
337
158,
585
159,
833
161,
081
pers
on43
,499
43,8
5544
,212
44,5
6844
,925
45,2
8145
,637
45,9
94
g/pe
rson
/day
26.5
426
.62
25.8
225
.02
24.2
223
.42
22.6
3
g/pe
rson
/day
138.
1513
8.56
134.
4113
0.25
126.
0912
1.93
117.
78
g/pe
rson
/day
37.3
037
.41
61.3
968
.76
68.9
669
.16
69.3
7
g/pe
rson
/day
10.9
510
.98
11.0
211
.05
11.0
811
.11
11.1
5
g/pe
rson
/day
39.5
539
.67
15.9
115
.96
16.0
116
.06
16.1
0
g/pe
rson
/day
7.33
7.35
7.37
7.40
7.42
7.44
7.46
g/pe
rson
/day
14.2
314
.27
14.3
17.
187.
207.
227.
24
g/pe
rson
/day
46.2
646
.40
46.5
446
.67
46.8
146
.95
47.0
9
g/pe
rson
/day
14.5
914
.63
14.6
814
.72
14.7
614
.81
14.8
5
g/pe
rson
/day
2.42
2.43
2.43
2.44
2.45
2.46
2.46
g/pe
rson
/day
21.6
521
.71
21.7
821
.84
21.9
121
.97
22.0
4
g/pe
rson
/day
3.69
3.70
3.71
3.72
3.73
3.75
3.76
g/pe
rson
/day
4.87
4.88
4.90
4.91
4.93
4.94
4.96
g/pe
rson
/day
11.3
111
.34
11.3
811
.41
11.4
511
.48
11.5
1
g/pe
rson
/day
3.07
3.08
3.09
3.10
3.11
3.12
3.12
g/pe
rson
/day
5.02
5.03
5.05
5.06
5.08
5.09
5.11
g/pe
rson
/day
380
386.
9338
8.09
383.
7937
9.50
375.
2137
0.92
366.
62
Futu
re F
orec
ast
Item
Uni
tPa
st
Stee
l
Popu
latio
n
Popu
latio
n in
Sav
aii
H o u s e h o l d W a s t e
Gre
en w
aste
Food
scr
ap
Pape
r
Car
dboa
rd
Plas
tic b
ags/
pape
rs
PET
bottl
es
Plas
tic c
onta
iner
s
Dia
per
Gla
ss
Cer
amic
Tota
l
Alim
inum
Oth
er m
etal
Text
ile
Rubb
er
Oth
ers

Nat
iona
l Was
te M
anag
emen
t Stra
tegy
M
inis
try o
f Nat
ural
Res
ourc
es a
nd E
nviro
nmen
t
58
2011
2012
2013
2014
2015
2016
2017
2018
2019
2020
2021
2022
2023
ton/
day
59.4
360
.09
59.9
159
.71
59.5
059
.28
59.0
6
ton/
day
16.9
717
.16
17.1
017
.05
16.9
916
.93
16.8
6
ton/
day
47.9
148
.72
49.5
550
.39
51.2
552
.12
53.0
1
ton/
day
13.6
813
.91
14.1
514
.39
14.6
314
.88
15.1
4
ton/
day
107.
3410
8.81
109.
4611
0.10
110.
7511
1.40
112.
07
ton/
day
30.6
531
.07
31.2
531
.44
31.6
231
.81
32.0
0
ton/
day
137.
9913
9.88
140.
7114
1.54
142.
3814
3.21
144.
06
Off-
site
com
post
in U
polu
ton/
day
N/A
N/A
N/A
N/A
N/A
N/A
N/A
Off-
site
com
post
in S
avai
ito
n/da
yN
/AN
/AN
/AN
/AN
/AN
/AN
/A
Alu
min
ium
can
s fro
m h
ouse
hold
sep
arat
ed fo
r rec
yclin
g in
Upo
luto
n/da
y0.
240.
260.
280.
300.
320.
340.
36
Alu
min
ium
can
s fro
m h
ouse
hold
sep
arat
ed fo
r rec
yclin
g in
Sav
aii
ton/
day
0.00
0.00
0.00
0.00
0.00
0.00
0.00
Alu
min
ium
can
s fro
m b
usin
ess
sepa
rate
d fo
r rec
yclin
g in
Upo
luto
n/da
y0.
060.
060.
060.
060.
060.
060.
06
Alu
min
ium
can
s fro
m b
usin
ess
sepa
rate
d fo
r rec
yclin
g in
Sav
aii
ton/
day
0.00
0.00
0.00
0.00
0.00
0.00
0.00
Recy
clin
g Ra
tio o
f Alu
min
um c
ans
from
hou
seho
ld in
Upo
lu%
44.0
047
.00
50.0
053
.00
55.0
058
.00
61.0
0
Recy
clin
g Ra
tio o
f Alu
min
um c
ans
from
hou
seho
ld in
Sav
aii
%0.
000.
000.
000.
000.
000.
000.
00
Recy
clin
g Ra
tio o
f Alu
min
um c
ans
from
bus
ines
s in
Upo
lu%
N/A
N/A
N/A
N/A
N/A
N/A
N/A
Recy
clin
g Ra
tio o
f Alu
min
um c
ans
from
bus
ines
s in
Upo
lu%
0.00
0.00
0.00
0.00
0.00
0.00
0.00
Hou
seho
ld W
aste
tran
spor
ted
by c
ontra
ctor
at T
afai
gata
ton/
day
22.6
024
.80
27.0
029
.20
31.4
033
.60
35.8
0
Busi
ness
Was
te tr
ansp
orte
d by
con
tract
or a
t Taf
aiga
tato
n/da
y1.
201.
221.
221.
231.
241.
251.
25
Hou
seho
ld W
aste
dire
ctly
tran
spor
ted
at T
afai
gata
ton/
day
2.20
2.23
2.24
2.26
2.27
2.28
2.30
Busi
ness
Was
te d
irect
ly tr
ansp
orte
d at
Taf
aiga
tato
n/da
y19
.00
19.2
619
.37
19.4
919
.60
19.7
219
.84
Hou
seho
ld W
aste
tran
spor
ted
by c
ontra
ctor
at V
aiaa
tato
n/da
yN
/AN
/AN
/AN
/AN
/AN
/AN
/A
Busi
ness
Was
te tr
ansp
orte
d by
con
tract
or a
t Vai
aata
ton/
day
N/A
N/A
N/A
N/A
N/A
N/A
N/A
Hou
seho
ld W
aste
dire
ctly
tran
spor
ted
at V
aiaa
tato
n/da
yN
/AN
/AN
/AN
/AN
/AN
/AN
/A
Busi
ness
Was
te d
irect
ly tr
ansp
orte
d at
Vai
aata
ton/
day
N/A
N/A
N/A
N/A
N/A
N/A
N/A
Gen
eral
was
te fr
om h
ouse
hold
in U
polu
Gen
eral
was
te fr
om h
ouse
hold
in S
avai
i
Gen
eral
was
te fr
om b
usin
ess
in U
polu
Gen
eral
was
te fr
om b
usin
ess
in S
avai
i
Gen
eral
was
te in
Sam
oa
Futu
re F
orec
ast
Item
Uni
tPa
st
Gen
eral
was
te in
Sav
aii
Gen
eral
was
te in
Upo
lu
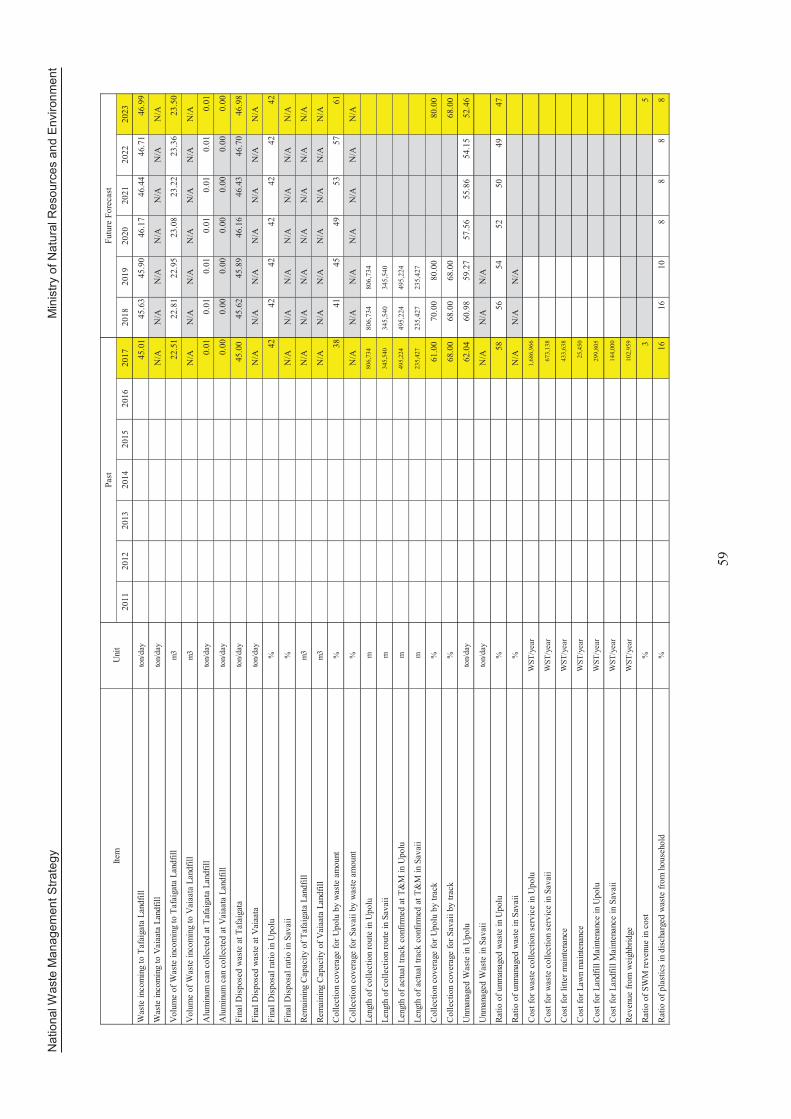
Nat
iona
l Was
te M
anag
emen
t Stra
tegy
M
inis
try o
f Nat
ural
Res
ourc
es a
nd E
nviro
nmen
t
59
2011
2012
2013
2014
2015
2016
2017
2018
2019
2020
2021
2022
2023
ton/
day
45.0
145
.63
45.9
046
.17
46.4
446
.71
46.9
9
ton/
day
N/A
N/A
N/A
N/A
N/A
N/A
N/A
m3
22.5
122
.81
22.9
523
.08
23.2
223
.36
23.5
0
m3
N/A
N/A
N/A
N/A
N/A
N/A
N/A
Alu
min
um c
an c
olle
cted
at T
afai
gata
Lan
dfill
ton/
day
0.01
0.01
0.01
0.01
0.01
0.01
0.01
Alu
min
um c
an c
olle
cted
at V
aiaa
ta L
andf
illto
n/da
y0.
000.
000.
000.
000.
000.
000.
00
Fina
l Dis
pose
d w
aste
at T
afai
gata
ton/
day
45.0
045
.62
45.8
946
.16
46.4
346
.70
46.9
8
Fina
l Dis
pose
d w
aste
at V
aiaa
tato
n/da
yN
/AN
/AN
/AN
/AN
/AN
/AN
/A
Fina
l Dis
posa
l rat
io in
Upo
lu%
4242
4242
4242
42
Fina
l Dis
posa
l rat
io in
Sav
aii
%N
/AN
/AN
/AN
/AN
/AN
/AN
/A
Rem
aini
ng C
apac
ity o
f Taf
aiga
ta L
andf
illm
3N
/AN
/AN
/AN
/AN
/AN
/AN
/A
Rem
aini
ng C
apac
ity o
f Vai
aata
Lan
dfill
m3
N/A
N/A
N/A
N/A
N/A
N/A
N/A
%38
4145
4953
5761
Col
lect
ion
cove
rage
for S
avai
i by
was
te a
mou
nt%
N/A
N/A
N/A
N/A
N/A
N/A
N/A
Leng
th o
f col
lect
ion
rout
e in
Upo
lum
806,
734
806,
734
806,
734
Leng
th o
f col
lect
ion
rout
e in
Sav
aii
m34
5,54
034
5,54
034
5,54
0
Leng
th o
f act
ual t
rack
con
firm
ed a
t T&
M in
Upo
lum
495,
224
495,
224
495,
224
Leng
th o
f act
ual t
rack
con
firm
ed a
t T&
M in
Sav
aii
m23
5,42
723
5,42
723
5,42
7
Col
lect
ion
cove
rage
for U
polu
by
track
%61
.00
70.0
080
.00
80.0
0
Col
lect
ion
cove
rage
for S
avai
i by
track
%68
.00
68.0
068
.00
68.0
0
Unm
anag
ed W
aste
in U
polu
ton/
day
62.0
460
.98
59.2
757
.56
55.8
654
.15
52.4
6
Unm
anag
ed W
aste
in S
avai
ito
n/da
yN
/AN
/AN
/A
Ratio
of u
nman
aged
was
te in
Upo
lu%
5856
5452
5049
47
Ratio
of u
nman
aged
was
te in
Sav
aii
%N
/AN
/AN
/A
Cos
t for
was
te c
olle
ctio
n se
rvic
e in
Upo
luW
ST/y
ear
1,68
6,96
6
Cos
t for
was
te c
olle
ctio
n se
rvic
e in
Sav
aii
WST
/yea
r67
3,13
8
Cos
t for
litte
r mai
nten
ance
WST
/yea
r43
3,63
8
Cos
t for
Law
n m
aint
enan
ceW
ST/y
ear
25,4
50
Cos
t for
Lan
dfill
Mai
nten
ance
in U
polu
WST
/yea
r29
9,80
5
Cos
t for
Lan
dfill
Mai
nten
ance
in S
avai
iW
ST/y
ear
144,
000
Reve
nue
from
wei
ghbr
idge
WST
/yea
r10
2,95
9
Ratio
of S
WM
reve
nue
in c
ost
%3
5
Ratio
of p
last
ics
in d
isch
arge
d w
aste
from
hou
seho
ld%
1616
108
88
8
Was
te in
com
ing
to T
afai
gata
Lan
dfill
Was
te in
com
ing
to V
aiaa
ta L
andf
ill
Vol
ume
of W
aste
inco
min
g to
Taf
aiga
ta L
andf
ill
Vol
ume
of W
aste
inco
min
g to
Vai
aata
Lan
dfill
Col
lect
ion
cove
rage
for U
polu
by
was
te a
mou
ntItem
Uni
tPa
stFu
ture
For
ecas
t

National Waste Management Strategy Ministry of Natural Resources and Environment
60
2 ToR for Steering Committee
2.1.1 Function of Steering Committee Meeting
Oversee formulation, implementation, monitoring and revision process of NWMS. Mobilize and facilitate support in relation to NWMS across the members. Address key issues and problems for implementation of NWMS. Appraise progress of and constraints of implementation of NWMS.
2.1.2 Meeting schedule
Regular Steering Committee meetings will be held in every year. Extraordinary or Special Steering Committee meetings may be organized as and when required,
e.g. to discuss urgent issues related to NWMS.
2.1.3 Coordination of Steering Committee
Coordination is under responsible of MNRE. Followings are the main coordination function of Steering Committee.
Taking of Minutes Drafting Agenda Preparation of Presentation Material Tabling of Special Matters (Appraisal/Review/Endorsement etc.) Providing Logistical Support Liaison with Members on Sector Related Matters

National Waste Management Strategy Ministry of Natural Resources and Environment
61
3 References
(1) Food and Agriculture Organization (FAO), 2009, “SAMOA FORESTRY OUTLOOK STUDY”
http://www.fao.org/3/a-am246e.pdf (Available as of 2018/10/17)
(2) Ministry of Finance, 2016, “STRATEGY FOR THE DEVELOPMENT OF SAMOA (SDS) 2016/17 - 2019/20”,
https://www.mof.gov.ws/Services/Economy/EconomicPlanning/tabid/5618/Default.aspx (Available as of 2018/10/17).
(3) Ministry of Natural Resources and Environment, 1989, “Land, Survey and Environment Act 1989”, http://extwprlegs1.fao.org/docs/pdf/sam37633.pdf (Available as of 2018/10/17).
(4) Ministry of Natural Resources and Environment, 2010, “Waste Management Act 2010” http://www.palemene.ws/new/parliament-business/acts-regulations/acts-2010/ (Available as of 2018/10/17).
(5) Ministry of Natural Resources and Environment, 2011, “NATIONAL SAICM IMPLEMENTATION PLAN”.
(6) Ministry of Natural Resources and Environment, 2011, “Solid Waste Characterization and
Generation Study 2011.VAITELE.”.
(7) Ministry of Natural Resources and Environment, 2016, “Climate data 2016-Final”, http://sbs.gov.ws/index.php/new-document-library (Available as of 2018/10/17).
(8) Ministry of Natural Resources and Environment, 2016, “Ministry of Natural Resources and Environment Annual Report 2016-1017”, https://www.mnre.gov.ws/wp-content/uploads/2017/08/MNRE-AR-English.pdf (Available as of 2018/10/17).
(9) Ministry of Natural Resources and Environment, 2016, National Environment Sector Plan (NESP) 2017-2021, https://www.mnre.gov.ws/publications/ (Available as of 2018/10/17).
(10) Samoa Bureau of Statistics, 2017, “2016 Census Brief No.1”, http://sbs.gov.ws/index.php/new-document-library (Available as of 2018/10/17).
(11) Samoa Bureau of Statistics, 2018, “Statistical Abstract 2017”, http://www.sbs.gov.ws/ (Available as of 2018/10/17).
(12) Secretariat of the Pacific Regional Environment Programme, 2014, “Cleaner Pacific 2025 Pacific Regional Waste and Pollution Management Strategy 2016–2025”. https://www.sprep.org/attachments/Publications/WMPC/cleaner-pacific-strategy-2025.pdf (Available as of 2018/10/17).


“Clean and Healthy Samoa”“Clean and Healthy Samoa”
Ministry of Natural Resources and EnvironmentMinistry of Natural Resources and Environment