nabanita datta gupta*, daniel lau and dario pozzoli the...
TRANSCRIPT
Nabanita Datta Gupta*, Daniel Lau and Dario Pozzoli
The Impact of Education and Occupation onTemporary and Permanent Work Incapacity
DOI 10.1515/bejeap-2015-0055Published online March 15, 2016
Abstract: This paper investigates whether education and working in a physicallydemanding job causally impact temporary work incapacity (TWI), i. e. sicknessabsence and permanent work incapacity (PWI), i. e. the inflow to disability viasickness absence. Our contribution is to allow for endogeneity of both educationand occupation by estimating a quasi-maximum-likelihood discrete factormodel. Data on sickness absence and disability spells for the population ofolder workers come from the Danish administrative registers for 1998–2002.We generally find causal effects of both education and occupation on TWI.Once we condition on temporary incapacity, we find again a causal effect ofeducation on PWI, but no effect of occupation. Our results confirm that workersin physically demanding jobs are broken down by their work over time (womenmore than men) but only in terms of TWI.
Keywords: work incapacity, education, occupation, factor analysis, discretefactor modelJEL Classification: J18, I12, I20, C33, C35
1 Introduction
Despite the impressive medical breakthroughs that have improved aggregatehealth over the last decades, large numbers of people of working age persis-tently leave the workforce and rely on health-related income support such assickness absence and disability benefits (Autor and Duggan 2006; Pettersson-Lidbom and Thoursie 2013). This trend is witnessed in virtually all Organisationfor Economic Co-operation and Development (OECD) countries today, includingDenmark, and the lost work effort of these individuals represent a great cost to
*Corresponding author: Nabanita Datta Gupta, Department of Economics and BusinessEconomics, Aarhus University, Fuglesangs Alle 4, DK-8210 Aarhus, Denmark, E-mail:[email protected]://orcid.org/0000-0001-7904-445XDaniel Lau, Department of Economics, Cornell University, Ithaca, NY, USADario Pozzoli, Department of Economics, Copenhagen Business School and IZA,Copenhagen, Denmark
BE J. Econ. Anal. Policy 2016; 16(2): 577–617
Brought to you by | Aarhus University Library / StatsbiblioteketAuthenticated
Download Date | 2/26/18 11:39 AM

society.1 Health-related exit from the labor market thus continues to present anobstacle to raising labor force participation rates and keeping public expendi-tures under control.
Previous, mainly descriptive, research shows a significant educational gra-dient in the onset of long-term sickness absence and disability (see e. g. Friedand Guralnik 1997; Freedman and Martin 1999; Cutler and Lleras-Muney 2007)and the few studies that estimate causal effects of education on self-reporteddisability status also find significant negative effects (Kemptner et al. 2011;Oreopoulous 2006). An occupational gradient in health is also well documented(Case and Deaton 2005; Fletcher, Sindelar, and Yamaguchi 2011; Morefield,Ribar, and Ruhm 2012; for Denmark, see Christensen et al. 2008). Yet no studyhas tried to simultaneously uncover the relationships between these variablesand health deterioration of older workers.
The aim of this paper is to empirically model and estimate the relationshipsbetween education, working in a physically demanding job and individualhealth-related exit from the labor market. Our study adds to the literature inthis field in several respects. Our main contribution is to distinguish betweenwhether lower labor market attrition among elderly educated workers is due toless wear-and-tear and fewer accidents on their jobs, or whether it is due to theprotective effect of education leading to greater health knowledge, more cautionand greater efficiency in health investments, the so-called causal effect ofeducation. This is a valuable addition to current econometric studies thatestimate either the causal effect of education on disability or estimate the effectof occupational status or cumulative effect of job characteristics on self-assessedhealth or disability in a panel framework (Oreopoulous 2006; Kemptner et al.2011; Case and Deaton 2005; Fletcher, Sindelar, and Yamaguchi 2011, Morefield,Ribar, and Ruhm 2012). We are not aware of any previous study that attempts asimultaneous estimation of the causal effects of both education and occupa-tional demands on disability exit, exploiting data across individuals and time.For the purpose of identifying the appropriate policy response to curb the highdisability exit in many countries, we need to know what types of investments areneeded, i. e. is it sufficient to raise the educational level of the population or dowe need to improve working conditions as well, and if both effects are impor-tant, what are their relative magnitudes?
1 On average, expenditures on disability and sickness benefits account for about 2% of GDP inOECD countries, about 2.5 times what is spent on unemployment benefits. This ranges from0.4% for Canada to 5% in Norway. In the United States, it is 1.4% of GDP, while in Denmark3.1% of GDP is spent annually (OECD 2007).
578 N. Datta Gupta et al.
Brought to you by | Aarhus University Library / StatsbiblioteketAuthenticated
Download Date | 2/26/18 11:39 AM

By applying clear identification strategies based on a major educationalreform and on pre-sample characteristics of local labor supply, we aim touncover causal impacts of both education and working in a physically demand-ing job on sickness absence and disability. Specifically following Arendt (2005,2008), we exploit the change in urban–rural differences in education due to the1958 reform to identify the education effect on work incapacity. Whereas as aninstrument for having a physically demanding job, we use a historic measure ofthe average physical demands of the occupation (separately for male andfemale) of all workers in an individual’s current local labor market. These causaleffects are estimated by applying a quasi-maximum-likelihood (quasi-ML) esti-mator with discrete factor approximations (Mroz 1999; Picone et al. 2003; Arendt2008). This econometric approach compares favorably with instrumental vari-able (IV)-type estimators in terms of precision and bias, especially in the pre-sence of weak instruments (Mroz 1999).
Since the institutional setup is one in which sickness absence is a precondi-tion for being considered for disability pension, we model the pathway ofdisability exit going through sickness absence and we also explore similaritiesand differences in the factors affecting behavior for these two processes.
Furthermore, to construct a highly reliable measure of the physical demandsof jobs, we use very detailed skill information in the Dictionary of OccupationalTitles (DOT) data in conjunction with the information provided in the US censusoccupation codes and the Danish register’s occupation codes.2
A further advantage of using detailed administrative data is that, whereasmuch of the previous research on disability is based on error-prone self-reportedmeasures, we access more objective register-based indicators.3 On the otherhand, of course subjective measures may capture latent health factors (forinstance, how ill the individual actually feels, how well they are able to functionwith their ailment) which the cruder objective measures cannot do.
Our analyses are carried out in the homogeneous welfare-state setting ofDenmark. Denmark has disability-related exit, universal health-care access andcoverage and generous health benefits provision. Thus, any socioeconomicgradient in health in Denmark is less likely to be due to differential access,
2 In a sensitivity analysis, we try an alternative measure of physical demands using the DWECSdata which has less detailed skill measures compared to the DOT.3 The reliability of self-reported measures has in fact been questioned because of reportingheterogeneity (Bago d’Uva et al. 2008; Kaptyen, Smith, and van Soest 2007; Datta Gupta,Kristensen, and Pozzoli 2010) as individuals may have an incentive to overplay their ownhealth problems for the purpose of gaining disability benefits.
Impact of Education and Occupation on Work Incapacity 579
Brought to you by | Aarhus University Library / StatsbiblioteketAuthenticated
Download Date | 2/26/18 11:39 AM

allowing for cleaner identification of the effects of education and occupation onhealth-related exit from the labor market.
The comprehensiveness of the Danish register data enable us to estimate arecursive model of work incapacity, education and occupation with correlatedcross-equation errors and unobserved heterogeneity. Our findings show thatboth education and occupation have causal effects on work incapacity. Ourresults for temporary work incapacity (TWI) (sickness absence) show that educa-tion generally reduces sickness absence, although more strongly for womenthan men. At the same time, we find an independent and stronger role foroccupation, but which also differs by gender. More specifically, a strongercausal effect of the physical demands of the occupation increasing TWI is seenfor women than men, despite the average probability of sickness absence beingfairly similar by gender. The effects of education and occupation on permanentwork incapacity (PWI) or disability, on the other hand, are imprecisely esti-mated, conditional on TWI. These results may be relevant for other welfare statecountries and can inform policy in these cases of the ways in which to stem theinflow into sickness absence and disability, respectively, temporary and perma-nent incapacity.
The paper is organized as follows. Section 2 reviews the related literature,derives the main theoretical hypotheses and describes the institutional setting.Section 3 introduces the data set and presents main descriptive statistics. Section4 provides details on the empirical strategy. Section 5 explains the results of ourempirical analysis, and Section 6 concludes.
2 Background
In the first part of this section we explore the theoretical channels linkingeducation and the physical demands of the job to health. In the second part,we present information on the institutional setting.
2.1 Theoretical Foundation
A possible theoretical basis for a socioeconomic gradient in health arising fromboth education and the nature of jobs is provided in the modified version ofGrossman’s (1972) intertemporal model of health (Muurinen 1982; Muurinen andLe Grand 1985; Case and Deaton 2005). According to the Grossman’s originaltheoretical setup, health deteriorates over time but it is maintained by education
580 N. Datta Gupta et al.
Brought to you by | Aarhus University Library / StatsbiblioteketAuthenticated
Download Date | 2/26/18 11:39 AM

through various channels. First, education raises the efficiency of inputs neededto restore health by following directions on medicine packages (Goldman andLakdawalla 2001), i. e. education increases productive efficiency. Second, edu-cation gives people greater health knowledge (Kenkel 1991) and enables them tochoose the right input mix, i. e. enhancing allocative efficiency. A third channelproposed by Fuchs (1982) and Becker and Mulligan (1997) is that education canchange people’s rate of time or risk preferences and thereby lead them to investin better health. A final pathway between education and health is that educatedindividuals can avoid physically demanding jobs and this reduces the rate atwhich their health deteriorates (Muurinen 1982; Muurinen and Le Grand 1985;Case and Deaton 2005). That is, health is also affected by the extent to which“health capital” is used in consumption and in work. Some consumption activ-ities are harder on the body than others and manual or physically demandingwork is harder on the body than nonmanual work. Allowing for the healthdeterioration rate to depend on physical effort provides an explanation forwhy health may deteriorate faster with age among the low-educated or manualworkers. In our setup, we are able to isolate the independent causal effects ofboth education and occupation on health (disability).
In a health-care system with universal access and insurance such as theDanish one, we would expect financial constraints to be less binding for thepurpose of meeting health needs. Maurer (2007) analyzes comparable cross-national data from the SHARE on 10 European countries. Estimating health-care utilization using flexible semi- and nonparametric methods, there is noevidence of a socioeconomic gradient in health-care usage in Denmark. Acharacteristic of the Danish labor market that works against finding work-relatedhealth deterioration is a relatively high degree of employer accommodation paidfor by the municipalities. Danish workplaces are reportedly among the mostaccommodating in Europe, especially after the twin pillars of corporate socialresponsibility and activation of marginalized groups were incorporated startingfrom the mid-1990s (Bengtsson 2007). Larsen (2006) reports that almost half ofthe private and public workplaces in Denmark with at least 10 employees andwith a least one employee above the age of 50 make an effort to retain olderworkers. These institutional features imply that any work-related health dete-rioration in manual jobs found in Denmark is probably only a lower bound ofwhat can be found in other settings.
At the same time, prior research has convincingly shown that sicknessabsence and disability can be forms of moral hazard behavior in settingswhere agents are fully insured, e. g. in welfare states with generous benefitprovision for health-related problems (Johansson and Palme 2005; Larsson2006; Hofmann 2013). Compensation-seeking behavior can be of two types: ex
Impact of Education and Occupation on Work Incapacity 581
Brought to you by | Aarhus University Library / StatsbiblioteketAuthenticated
Download Date | 2/26/18 11:39 AM
ante moral hazard, implying individuals do not undertake sufficient measures orinvestments to prevent diseases/disability or ex post moral hazard, according towhich individuals claim compensation for hard to verify diseases, overplay theirsymptoms or even withhold their labor supply during the awarding phase suchas continuing to be on sickness absence while waiting for a decision on adisability application (Bolduc et al. 2002). In Denmark, municipalities pay fornecessary workplace adaptations, provide employers with wage subsidies andgive sick-listed workers a form of social support that facilitates continued workwithout risk of benefit loss, barring for the first few weeks which are covered bythe employer. Educated people and individuals working in nonmanual jobs havelower expected payoffs from disability insurance or sickness benefits, i. e. theywould be less prone to compensation-seeking behavior. We refrain from includ-ing any measure of the (expected) benefit replacement rates in our models out ofconcerns for endogeneity, but assume instead that education, age, gender,region and occupation are good proxies for income, and hence replacementrates, in a setting with low-income dispersion. Unmeasured individual propen-sities to engage in moral hazard constitute an important source of unobservedheterogeneity that needs to be accounted for. Apart from time-invariant moralhazard tendencies, time-varying preferences for compensation-seeking behaviorcould induce a (unobserved) correlation between investing in education/work-ing in a physically demanding job and exiting via disability, which will also becaptured in our framework.
2.2 Institutional Setting and Data
2.2.1 The 1958 School Reform
Our identification strategy in the case of education is based on a Danish schoolreform in 1958 that abolished a division of schooling that occurred after the fifthgrade and affected attendance particularly beyond the seventh grade, i. e.beyond primary school. The reform also eliminated a distinction between ruraland urban elementary schools wherein only urban schools could offer classesfrom 8th to 10th grades. Prior to the reform, schooling in the sixth and seventhgrades was determined on the basis of a test conducted at the end of fifth grade,and the curriculum level and the number of lessons were lower in rural schoolsthan urban schools. These differences were abolished in 1958, which we use toidentify causal effects of increasing years of education (and to some extent alsoquality) for individuals born in rural areas from 1946 onwards, compared to theirurban counterparts. The impact specific to schools in rural areas came about
582 N. Datta Gupta et al.
Brought to you by | Aarhus University Library / StatsbiblioteketAuthenticated
Download Date | 2/26/18 11:39 AM

because a distinction between rural and city elementary schools was eliminated.The city schools were placed in 87 cities of reasonable size and historical orgeographical significance. Prior to the reform the curriculum level and thenumber of lessons were lower in the rural schools, and only city schools couldoffer classes for 8th to 10th form (preparing for upper secondary schooling).4 Itis a common view that the 1958 reform helped to alleviate barriers to furthereducation that existed prior to 1958, which were pronounced for children fromless educated backgrounds or living outside areas with city schools (Bryld et al.1990). Thus, the impact of the reform on individuals is based on their year andarea of birth (on the parish level). Whether the area had an urban or rural schoolis specified in the same way as in Arendt (2008). And as in Arendt (2008), weuse a binary variable denoting education beyond primary schooling as theendogenous covariate. Measuring the effect on beyond primary educationexploits changes in the rural–urban difference from before to after the reform.
2.2.2 TWI and PWI in Denmark
Some institutional background is necessary in the case of the outcome measuresas well. TWI is defined as sickness absence for more than 8 consecutive weeks.Workers can receive the benefit for up to 52 weeks, but the benefit period may beextended under certain circumstances, e. g. if the worker has an ongoing work-ers’ compensation or disability benefit claim. The sick-listed worker reports theonset of the injury or sickness to the employer who in turn registers the spellwith the municipality. Both the employer and municipality can require verifica-tion of the condition from the medical authorities.5 The threshold of 8 weeks ischosen as municipalities in Denmark are obliged to follow up on all cases ofsickness benefit within 8 weeks after the first day of work incapacity. Thisthreshold also aligns with other studies using Danish register data
4 Note that following the earlier 1937 middle school reform, rural schools could join forces andprovide 6th–9th grades as in the urban areas (the so-called centrale skoler), but because ofwartime shortages school consolidation was delayed in the rural areas, so leading up to the1958 reform, rural educational opportunities still lagged considerably behind those of the urbanareas. Still, it is likely that there was selection into educational quantity, so the exogenousvariation induced by the 1958 reform could potentially be arising from the lower end of ability/income distribution. Source: http://danmarkshistorien.dk/leksikon-og-kilder/vis/materiale/lov-om-folkeskolen-18-maj-1937/.5 These rules are dictated by the national sickness absence law and applies uniformly across alloccupations. Employers finance their workers’ sickness benefits for the first 3 weeks, and publicauthorities finance the remaining period.
Impact of Education and Occupation on Work Incapacity 583
Brought to you by | Aarhus University Library / StatsbiblioteketAuthenticated
Download Date | 2/26/18 11:39 AM

(Christensen et al. 2008, Lund, Labriola, and Christensen 2006) and combinedsurvey register data (Høgelund and Holm 2006 and Høgelund, Holm, andMcIntosh 2010). After the first 8 weeks of sickness, the municipality must per-form a follow-up assessment every 4th week in complicated cases and every 8thweek in uncomplicated cases. The primary goal of the assessments is to restorethe sick-listed worker’s labor market attachment. The assessments must takeplace in cooperation with the sick-listed worker and other relevant agents, suchas the employer and medical experts. If return to ordinary work is impossiblebecause of permanently reduced working capacity, the municipality may referthe sick-listed worker to a Flexjob, the latter being wage-subsidized jobs withtasks accommodated to the worker’s working capacity and with reduced work-ing hours. The criterion for being assigned to such a Flexjob is that there hasbeen a permanent reduction in working capacity as assessed by the countymedical examiners, and all other channels of obtaining regular unemploymenthave been exhausted. Depending on the reduction of the worker’s workingcapacity, the wage subsidy equals either one-half or two-thirds of the minimumwage as stipulated in the relevant collective agreement. If a person with perma-nently reduced working capacity is incapable of working in a wage-subsidizedjob, the municipality may award a permanent disability benefit, which isfinanced entirely by public authorities. Workers assigned wage-subsidized jobsretain these permanently in our sample period, transiting only to full-termdisability or old age pension. A recent reform, however, will grant wage-sub-sidized jobs for a 5-year period only, though renewable. In 2012, 60,000 disabledpersons annually were on wage-subsidized jobs but demand exceeded supply,so currently there is wait unemployment of around 30%.
3 Data Description and Variables
The data sample begins with all individuals born between 1943 and 1950, whichare cohorts a few years prior to and after the school reform, and followed overthe period from 1998 to 2002. The year 1998 is selected as the first year becausereliable information on sickness spells is only available starting from that pointon. Prior to this, sickness spells are indistinguishable from maternity leavespells for women. Furthermore, because we are concerned about encounteringmajor changes in the disability policy scheme in 2003, 2002 is the last year in thesample period. Moreover, this period is chosen to allow the chosen cohorts priorand after the school reform to reach a target age range, which is relevant inorder to study how education and occupation affects individuals’ labor market
584 N. Datta Gupta et al.
Brought to you by | Aarhus University Library / StatsbiblioteketAuthenticated
Download Date | 2/26/18 11:39 AM

exit due to sickness or disability. Individuals selected for the sample arerequired to be employed at least in 1997.6 Data are taken from administrativeregisters from Statistics Denmark. These are sourced from the IntegratedDatabase for Labor Market Research (IDA) and include characteristics of indivi-duals such as highest educational attainment, marital status and occupation foreach year. Work incapacity data come from another administrative dataset,DREAM (Danish Register-Based Evaluation of Marginalisation), which containsinformation on weekly receipts of all social transfer payments for all citizens inDenmark since 1991, and separately records sickness absence since 1998.7
In this paper, we estimate two different sets of models. The first modelfocuses on the probability of TWI, and it uses the entire population of Danishworkers who meet the selection criteria stated earlier. The second model usesthe full sample of individuals who experience TWI. It considers PWI as thereceipt of disability benefit or the transit to wage-subsidized jobs and usesdata for welfare and employment status following TWI, which is also takenfrom the DREAM register. We look at the longest spell within the first 24weeks after experiencing TWI to determine the destination status. The latter isgrouped into four categories: PWI, self-sufficiency, early retirement and otherwelfare receipts (see Table 1).8 PWI includes disability benefits and wage-sub-sidized jobs while self-sufficiency is largely full-time employment. About 68% ofthe sample goes back to ordinary work after experiencing TWI and a consider-able share (22%) transits to a status of PWI.
As a measure of education, we use a binary variable denoting educationbeyond primary schooling. Whether or not an individual has a physicallydemanding job is proxied by an occupational brawn score. The latter is con-structed on the basis the individual’s contemporaneous occupation codes linkedto detailed job characteristics from the US DOT. The fourth edition (1977) of theDOT provides measures of job content, reporting 38 job characteristics for over12,000 occupations. Rendall (2010) performs factor analysis on the 38 jobcharacteristics in DOT, taken across occupations and employment from the US1970 census.9 Following Ingram (2006), Rendall arrives at three factors, which
6 Around 5 % of the sample is lost as a result of this sample selection criteria.7 No observation is lost by merging IDA to DREAM.8 In principle, mortality may be another pathway that competes with disability risk. In practice,not so many in our age group (max 59 years in the sample period) would use it, as on overageonly 4,600 individuals within this age group die every year.9 Given that we cannot rule out that technological advances may have changed the main jobcharacteristics for some occupations since 1970, we also propose an alternative measure ofbrawny job, based on responses to a more recent survey conducted in Denmark, as a robustnesscheck.
Impact of Education and Occupation on Work Incapacity 585
Brought to you by | Aarhus University Library / StatsbiblioteketAuthenticated
Download Date | 2/26/18 11:39 AM

are labeled brain, brawn and motor coordination.10 We use the results of factoranalysis by Rendall (2010) on these characteristics and obtain a single measureof brawn for each occupational code provided in the Danish register set.
We then use crosswalks to match census occupation codes to the Danishregister’s occupation codes, called DISCO (Danish ISCO – International StandardClassification of Occupations). Specifically we use a crosswalk of 506 occupa-tions at Ganzeboom (2003) to map 1980 census codes to ISCO-88. The four-digitISCO code is organized hierarchically in four levels and is almost identical toDISCO (390 vs. 372 codes).11 The first digit aligns broadly with the educationlevel required for the job, and the job classification becomes more detailed withthe second and third digits. If a direct match from a DISCO code to 1980 censuscode is not found, we use the nearest category, above or immediately adjacent(based on preceding digits). One to many matches receive an average of thebrawn score. Over 92% of workers have an occupation code to which a brawnscore can be attributed.
We proceed with two alternative measures of physical demands of the job.One is related only to the brawn level of the current job being above the 75th
Table 1: Destinations state after temporary work incapacity (1998–2002).
Permanent workincapacity ()
Self-sufficiency ()
Earlyretirement ()
Otherdestinations ()
All . . . .Women . . . .With education
beyond primary. . . .
With a physicallydemanding job
. . . .
N , , ,
Note: (1) Disability benefit (førtidspension) and subsidized jobs (flexjob and skånejob); (2)mostly employment; (3) early retirement scheme (efterløn); (4) unemployment benefits, activelabor market policies and sickness benefits.
10 The orthogonal factor analysis results in three factors explaining 93 % of the total covar-iance. A partition of job characteristics into the three factors is chosen, according to highcoefficients from the analysis. This partition is then used to construct a second factor analysisthat allows for correlation across factors. We sum the scores on the six variables contributing tothe brawn factor, weighted by the coefficients from factor loading, so that for each 1970 censusoccupation, we obtain a single value denoting brawn level. Additional details about the factorloadings are available on request from the authors.11 http://www.dst.dk/Vejviser/Portal/loen/DISCO/DISCO-88/Introduktion.aspx.
586 N. Datta Gupta et al.
Brought to you by | Aarhus University Library / StatsbiblioteketAuthenticated
Download Date | 2/26/18 11:39 AM

percentile of the gender-specific brawn distribution while the other is based onhaving a history of brawny work in the last 3 years.12
3.1 Descriptive Statistics
The full sample consists of 2.3 million observations of individuals born between1943 and 1950, employed in 1997, and subsequently observed in 1998–2002.Table 2 presents descriptive statistics for both the full sample and conditionalon TWI split by gender, and within-gender group, separately for all and for thehigher of the two educational groups (above primary level). Means are taken overall person years 1998–2002 when workers are between 48 and 59 years of age.
Around 3% of women and men aged 48–59 experience TWI. For those witheducation beyond primary level, the corresponding shares are on averageslightly lower. Years of education are, by definition, lower for all workerscompared to educated workers, almost 10 years versus 12 years. Women andmen in the full sample are similar in terms of age, the average being 53 years.Looking at the shares of workers employed in physically demanding occupa-tions, a striking gender difference is seen. While 12% of women work in suchoccupations, 25% of all men work in brawny jobs, reflecting the high degree ofoccupational segregation by gender in the Danish labor market. Moreover, theaverage brawn level in women’s commuting areas (see footnote 15) is alsoconsiderably lower, 67, compared with men, 98. Marriage rates among olderworking women are about 2 percentage points lower than among their malecounterparts. Educated workers – both women and men – are more likely to beborn in a city. Table 2 also shows that the proportion which is not affected by theeducation reform instrument and which is used as a control group is approxi-mately 26% for both the sample of women and men. Due to mortality riskincreasing with age, there is slightly more representation of the younger cohortsin the sample; however, differences in cohort sizes are not large.
When conditioning on TWI, 21–23% of women and 19–21% of men are onPWI, so the differences are not large. The TWI sample is also less educated thanthe full sample but is about the same age. Those on TWI are more likely to work inbrawny jobs than those in the full sample. The brawniness of their (the TWI)
12 Ideally, we would like to go further back than the past 3 years when defining the historymeasure. However, the cross-walk available in the O*NET that allows us to merge Danishregisters with the American DOT is only available for DISCO codes after 1994. To measure thebrawniness we need to match for each DISCO code the task content retrieved from O*NET foreach occupation.
Impact of Education and Occupation on Work Incapacity 587
Brought to you by | Aarhus University Library / StatsbiblioteketAuthenticated
Download Date | 2/26/18 11:39 AM

Table 2: Descriptive statistics.
Variables Women Men
All Education beyond
primary
All Education beyond
primary
Full sampleTemporary work incapacity . . . .
Years of education . . . .
Education beyond primary . .
Age . . . .
Physically demanding job . . . .
Average brawn at the
commuting area
. . . .
Married . . . .
Urban . . . .
Reform × urban . . . .
Cohort () . . . .
Cohort () . . . .
Cohort () . . . .
Cohort () . . . .
Cohort () . . . .
Cohort () . . . .
Cohort () . . . .
Cohort () . . . .
N , , , ,
Sample of individuals with temporary
work incapacityPermanent work incapacity . . . .
Years of education . . . .
Education beyond primary . .
Age . . . .
Physically demanding job . . . .
Average brawn at the commuting area . . . .
Married . . . .
Urban . . . .
Reform × urban . . . .
Cohort () . . . .
Cohort () . . . .
Cohort () . . . .
Cohort () . . . .
Cohort () . . . .
Cohort () . . . .
Cohort () . . . .
Cohort () . . . .
N , , , ,
588 N. Datta Gupta et al.
Brought to you by | Aarhus University Library / StatsbiblioteketAuthenticated
Download Date | 2/26/18 11:39 AM

commuting area is, however, similar to that of all workers. They are also lesslikely to be married compared to the full worker sample, perhaps indicative of thehealth benefits that can be obtained from marriage (Wilson and Owsald 2005).Means of the remaining factors in this table (born in urban, reform×born inurban, cohort dummies) appear to be largely the same for the TWI subsampleas for the full sample.
Not surprisingly, Figure 1 shows a negative, even though imperfect, correla-tion between having a physically demanding job and our education variable forboth genders. The share of individuals with a brawny job is in fact higher amongthose with below primary education for both genders. The same share does notdecrease with age for those with the lowest educational level and it is on anegative trend for both women and men with above primary education.
4 Empirical Strategy
Our point of departure for describing the determinants of either TWI or PWI is aset of modified versions of Grossman’s intertemporal model of health (Muurinen1982; Muurinen and Le Grand 1985; Case and Deaton 2005). According to this
Figure 1: Share of individuals with physically demanding job by education and age.
Impact of Education and Occupation on Work Incapacity 589
Brought to you by | Aarhus University Library / StatsbiblioteketAuthenticated
Download Date | 2/26/18 11:39 AM

theoretical setup, utility maximization determines the optimal level of healthinputs and yields a reduced form model of the demand of health, such as
Hi =Xiβ+ γ1Ei + γ2PJi + ξ i, [1]
where Hi is the health stock of individual i, Xi include a number of exogenousregressors in the health equation, Ei is education, PJi is having a physicallydemanding job and ξi is an error term. Education may be correlated with theunobserved component as those with better “endowment” to obtain more edu-cation and are at the same time more healthy as adults (Card 1999; Rosenzweigand Schultz 1983). Alternatively a correlation between education and ξi maystem from the assumption that individuals with higher preferences for the futureare more likely to engage in activities with current costs and future benefits suchas education and health investments (Fuchs 1982; Grossman and Kæstner 1997).Similarly, underlying preferences for compensation-seeking behavior couldaffect both education and health and later as we shall see, also working in aphysically demanding job and health. To take account of this endogeneity issue,we assume a model, where education, measured by a dummy variable takingvalue of 1 for those having any education greater than 8 years of registeredschooling, and the health outcome, WIi (work incapacity), in our case theprobability of either TWI or PWI, is related through the following two equations:
WIi = f X1iβ1 + γ1Ei + γ2PJi + ξ 1i� �
Ei = g X2iβ2 +ϕ1URBi +ϕ2 URBi × REFið Þ+ϕ3 × REFi + ξ 2i� �
.
([2]
The vector X1i includes age, age squared, gender13, whether married and born inan urban area, the average work incapacity (TWI or PWI) annual growth rate foreach level of brawn, cohort and region of living dummies. Education is a functionof cohort dummies (X2i) and whether born in an urban area (URBi) and whetheraffected by the 1958 school reform (REFi), where the latter is equal to 1 for cohortsborn in 1946 and later. Following Arendt (2005, 2008), the interaction of the urbanand reform dummies constitute our exclusion restrictions. That is, the change inurban–rural differences in education due to the 1958 reform is exploited toidentify the education effect on work incapacity14. Figure 2 on the number of
13 To allow the effects of education and occupation to be gender specific, we will provideestimation results separately for women and men.14 The coefficient on the interaction of the urban and reform dummies thus should beestimated with negative sign if urban–rural differences narrow after the reform. Note that thismodel is exactly equivalent to interacting the reform with living in a rural area and including acontrol for rural area in addition. The estimated coefficient on the interaction is simply of theopposite sign in that case.
590 N. Datta Gupta et al.
Brought to you by | Aarhus University Library / StatsbiblioteketAuthenticated
Download Date | 2/26/18 11:39 AM

years of education registered for each cohort in the rural areas reveals thateducation shows a small jump in correspondence with the 1946 cohort andaccelerates its growth with time for women and it increases at decreasing ratesprior to the reform year and at increasing rates thereafter for men.15
The previous model is then extended to also endogenize the physically demand-ing job variable (PJ):
WIi = f X1iβ1 + γ1Ei + γ2PJi + ξ 1i� �
,
Ei = g X2iβ2 +ϕ1URBi +ϕ2 URBi ×REFið Þ+ ξ 2ið Þ,PJi = h X3iβ3 + δ1Ei + δ2BRAW N AV Ei + ξ 3i
� �.
8>><>>: [3]
Figure 2: The school reform and the share of individuals with at least primary education.Note: Trends before and after the school reform are calculated with a quadratic fit.
15 Note that Figure 1 is fitted with a quadratic trend, as suggested by Holmlund (2008). Sincethe quadratic terms did not improve the fit considerably over the linear terms (the figure alsoshows mainly a linear trend) the regression model includes 14 region dummies and cohortdummies to capture differences in trends.
Impact of Education and Occupation on Work Incapacity 591
Brought to you by | Aarhus University Library / StatsbiblioteketAuthenticated
Download Date | 2/26/18 11:39 AM
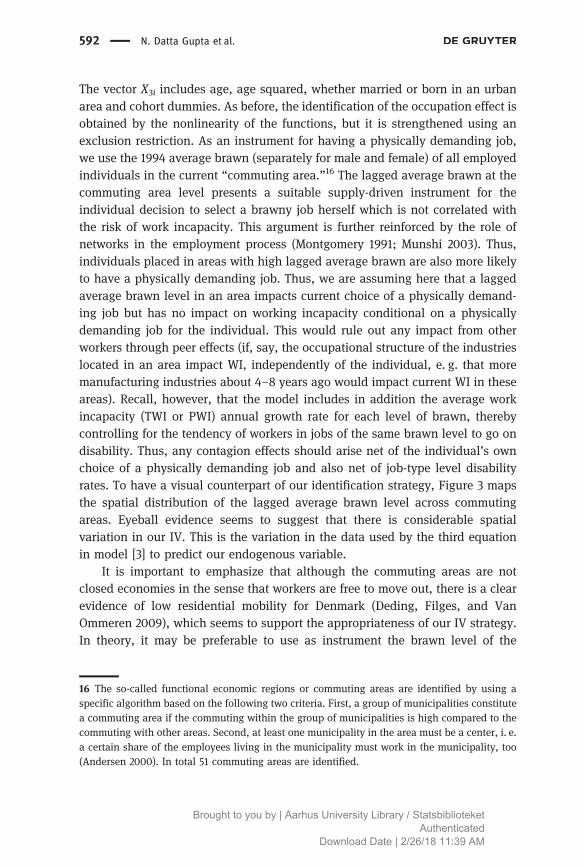
The vector X3i includes age, age squared, whether married or born in an urbanarea and cohort dummies. As before, the identification of the occupation effect isobtained by the nonlinearity of the functions, but it is strengthened using anexclusion restriction. As an instrument for having a physically demanding job,we use the 1994 average brawn (separately for male and female) of all employedindividuals in the current “commuting area.”16 The lagged average brawn at thecommuting area level presents a suitable supply-driven instrument for theindividual decision to select a brawny job herself which is not correlated withthe risk of work incapacity. This argument is further reinforced by the role ofnetworks in the employment process (Montgomery 1991; Munshi 2003). Thus,individuals placed in areas with high lagged average brawn are also more likelyto have a physically demanding job. Thus, we are assuming here that a laggedaverage brawn level in an area impacts current choice of a physically demand-ing job but has no impact on working incapacity conditional on a physicallydemanding job for the individual. This would rule out any impact from otherworkers through peer effects (if, say, the occupational structure of the industrieslocated in an area impact WI, independently of the individual, e. g. that moremanufacturing industries about 4–8 years ago would impact current WI in theseareas). Recall, however, that the model includes in addition the average workincapacity (TWI or PWI) annual growth rate for each level of brawn, therebycontrolling for the tendency of workers in jobs of the same brawn level to go ondisability. Thus, any contagion effects should arise net of the individual’s ownchoice of a physically demanding job and also net of job-type level disabilityrates. To have a visual counterpart of our identification strategy, Figure 3 mapsthe spatial distribution of the lagged average brawn level across commutingareas. Eyeball evidence seems to suggest that there is considerable spatialvariation in our IV. This is the variation in the data used by the third equationin model [3] to predict our endogenous variable.
It is important to emphasize that although the commuting areas are notclosed economies in the sense that workers are free to move out, there is a clearevidence of low residential mobility for Denmark (Deding, Filges, and VanOmmeren 2009), which seems to support the appropriateness of our IV strategy.In theory, it may be preferable to use as instrument the brawn level of the
16 The so-called functional economic regions or commuting areas are identified by using aspecific algorithm based on the following two criteria. First, a group of municipalities constitutea commuting area if the commuting within the group of municipalities is high compared to thecommuting with other areas. Second, at least one municipality in the area must be a center, i. e.a certain share of the employees living in the municipality must work in the municipality, too(Andersen 2000). In total 51 commuting areas are identified.
592 N. Datta Gupta et al.
Brought to you by | Aarhus University Library / StatsbiblioteketAuthenticated
Download Date | 2/26/18 11:39 AM
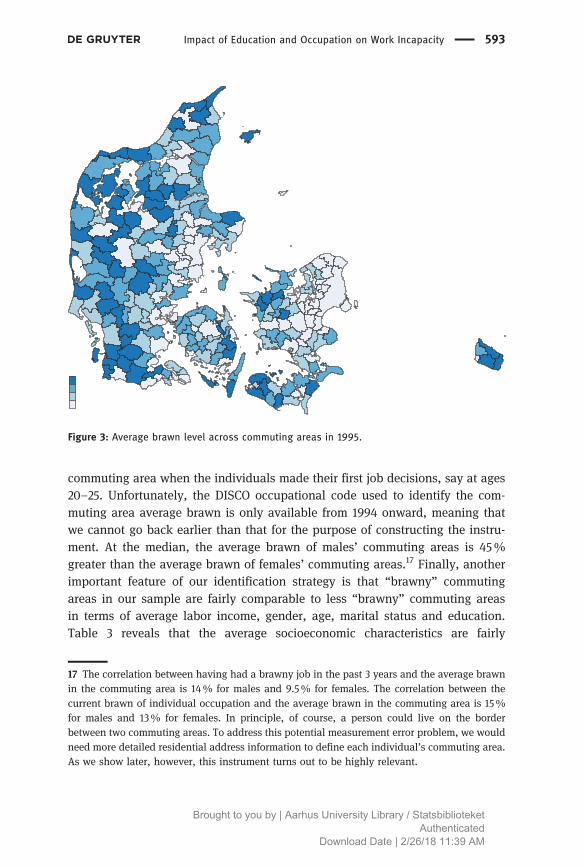
commuting area when the individuals made their first job decisions, say at ages20–25. Unfortunately, the DISCO occupational code used to identify the com-muting area average brawn is only available from 1994 onward, meaning thatwe cannot go back earlier than that for the purpose of constructing the instru-ment. At the median, the average brawn of males’ commuting areas is 45%greater than the average brawn of females’ commuting areas.17 Finally, anotherimportant feature of our identification strategy is that “brawny” commutingareas in our sample are fairly comparable to less “brawny” commuting areasin terms of average labor income, gender, age, marital status and education.Table 3 reveals that the average socioeconomic characteristics are fairly
Figure 3: Average brawn level across commuting areas in 1995.
17 The correlation between having had a brawny job in the past 3 years and the average brawnin the commuting area is 14% for males and 9.5% for females. The correlation between thecurrent brawn of individual occupation and the average brawn in the commuting area is 15%for males and 13% for females. In principle, of course, a person could live on the borderbetween two commuting areas. To address this potential measurement error problem, we wouldneed more detailed residential address information to define each individual’s commuting area.As we show later, however, this instrument turns out to be highly relevant.
Impact of Education and Occupation on Work Incapacity 593
Brought to you by | Aarhus University Library / StatsbiblioteketAuthenticated
Download Date | 2/26/18 11:39 AM

comparable across commuting areas with different brawn levels, although some-what lower average education and a much larger share of men are recorded inthose areas with the highest brawn levels.18
To estimate model [3], we apply a quasi-ML estimator with discrete factorapproximations (Mroz 1999; Picone et al. 2003; Arendt 2008). The advantages ofthis approach are twofold. First, it is particularly suited to correct for endogene-ity and selection bias caused by unmeasured explanatory variables in dichot-omous-dependent variable models (Cameron and Taber 1998). Second, it avoidsthe need to evaluate multivariate normal integrals and it is less expensive
Table 3: Average socioeconomic characteristics across commuting areas with different levels ofoccupational brawn.
Distribution of occupational brawn
Variables thpercentile
thpercentile
thpercentile
thpercentile
Years of education . . . .Age . . . .Men . . . .Married . . . .
Log of annual laborincome
. . . .
N , , , ,
Note: The column 25th percentile reports the average of the socioeconomic variables for thosecommuting areas with occupational brawn up to the 25th percentile of the brawn indexdistribution. The column 50th percentile reports the average of the socioeconomic variables forthose commuting areas with occupational brawn between the 25th and the 50th percentiles ofthe brawn index distribution. The column 75th percentile reports the average of the socio-economic variables for those commuting areas with occupational brawn between the 50th andthe 75th percentiles of the brawn index distribution. The column 100th percentile reports theaverage of the socioeconomic variables for those commuting areas with occupational brawnabove the 75th percentile of the brawn index distribution.
18 The latter should not be a problem as the analysis is conditional on gender, but the formermay indicate some spatial segregation between typically white- and blue-collar geographicareas. To further reassure ourselves that this is not a problem for the interpretation of theresults, we have performed the analysis by excluding metropolitan areas (Copenhagen,Frederiksberg, Aarhus and Odense) and altering the definition of job physical demands (bytaking the 80th percentile threshold rather than the 75th percentile threshold). The resultsobtained from these additional analysis are fairly similar to those reported in the paper and areavailable on request from the authors.
594 N. Datta Gupta et al.
Brought to you by | Aarhus University Library / StatsbiblioteketAuthenticated
Download Date | 2/26/18 11:39 AM
computationally. According to Mroz (1999), the discrete factor method comparesfavorably with efficient estimators in terms of precision and bias. Therefore, theidentification of the effects of education and occupation is obtained by thenonlinearity of the f(·), g(·) and h(·) functions, but it is strengthened usingexclusion restrictions.
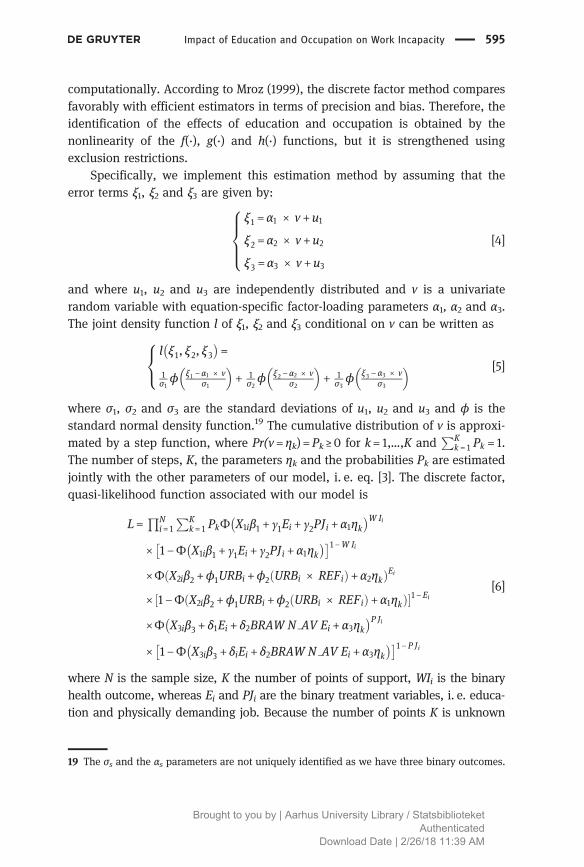
Specifically, we implement this estimation method by assuming that theerror terms ξ1, ξ2 and ξ3 are given by:
ξ 1 = α1 × v + u1
ξ 2 = α2 × v + u2
ξ 3 = α3 × v + u3
8>><>>: [4]
and where u1, u2 and u3 are independently distributed and v is a univariaterandom variable with equation-specific factor-loading parameters α1, α2 and α3.The joint density function l of ξ1, ξ2 and ξ3 conditional on v can be written as
l ξ 1, ξ 2, ξ 3� �
=
1σ1ϕ ξ 1 − α1 × v
σ1
� �+ 1
σ2ϕ ξ 2 − α2 × v
σ2
� �+ 1
σ3ϕ ξ 3 − α3 × v
σ3
� �8<: [5]
where σ1, σ2 and σ3 are the standard deviations of u1, u2 and u3 and ϕ is thestandard normal density function.19 The cumulative distribution of v is approxi-mated by a step function, where Pr(v= ηk) =Pk ≥0 for k= 1,…,K and
PKk = 1 Pk = 1.
The number of steps, K, the parameters ηk and the probabilities Pk are estimatedjointly with the other parameters of our model, i. e. eq. [3]. The discrete factor,quasi-likelihood function associated with our model is
L=QN
i= 1
PKk = 1 PkΦ X1iβ1 + γ1Ei + γ2PJi + α1ηk
� �W Ii
× 1−Φ X1iβ1 + γ1Ei + γ2PJi + α1ηk� �� �1−W Ii
×Φ X2iβ2 +ϕ1URBi +ϕ2 URBi × REFið Þ+ α2ηkð ÞEi
× 1−Φ X2iβ2 +ϕ1URBi +ϕ2 URBi × REFið Þ+ α1ηkð Þ½ �1−Ei
×Φ X3iβ3 + δ1Ei + δ2BRAW N AV Ei + α3ηk� �P Ji
× 1−Φ X3iβ3 + δiEi + δ2BRAW N AV Ei + α3ηk� �� �1−P Ji
[6]
where N is the sample size, K the number of points of support, WIi is the binaryhealth outcome, whereas Ei and PJi are the binary treatment variables, i. e. educa-tion and physically demanding job. Because the number of points K is unknown
19 The σs and the αs parameters are not uniquely identified as we have three binary outcomes.
Impact of Education and Occupation on Work Incapacity 595
Brought to you by | Aarhus University Library / StatsbiblioteketAuthenticated
Download Date | 2/26/18 11:39 AM

and there can be many local maxima, it is important to look for good startingvalues. We use single equation estimates and add one point of support for themixing distribution at a time. Unfortunately, there is no standard theory indicatinghow to select K in a finite sample. Following Cameron and Taber (2004) andHeckman and Singer (1984), we add additional points of support until the like-lihood (and AIC) fails to improve. We added up to three points of support.20
5 Results
5.1 The Effects of Education and Occupation on TWI
We begin by exploring the effects of education and working in a physicallydemanding job on TWI. In Tables 4 and 5, the dependent variable is TWI, i. e.the probability of having a sickness spell of at least 8 weeks, for, respectively,women and men. Coefficient estimates from the quasi-ML model with discretefactor approximation are shown together with standard errors. For educationand physically demanding job, we also report the calculated marginal effects, inbrackets below. Five models (columns) are discussed. Model 1 treats botheducation and occupation as exogenous variables and does not account fortime-invariant unobserved heterogeneity. Model 2 is the same as model 1 butaccounts for unobserved heterogeneity. Model 3 simultaneously models theendogeneity of both education and occupation variables and accounts forunobserved heterogeneity. Finally, models 4 and 5 are the same as model 3but where alternative definitions of occupation are applied. As clarified in theprevious section, to minimize other sources of potential endogeneity, we includeonly few covariates in the specification of the main equation: age, age squared,marital status, born in a city, the average work incapacity annual growth rate foreach level of brawn, seven cohort dummies and 14 regional dummies.
The results for women, in Table 4, are discussed first. Model 1 shows thateducation exceeding primary school level reduces their likelihood of TWI sig-nificantly by 1.4 pp. Working in a physically demanding job, as expected,increases the likelihood of females going on TWI by 1.3 pp, and this effect is
20 Similarly to Mroz (1999) and Picone et al. (2003), we set η0 = 0 and ηK= 1. The other K–2
points of support are given by ηk =exp θ1kð Þ
1 + exp θ1kð Þ k= 1,…,K–1. The probabilities Pk are also restricted
to be between 0 and 1: Pk =exp θ2kð Þ
1 + exp θ2kð Þ, k= 1,…,K – 1, where θ2k is the log odds for location k. When
K points are specified, K – 1 log odds are estimated to give the K probabilities.
596 N. Datta Gupta et al.
Brought to you by | Aarhus University Library / StatsbiblioteketAuthenticated
Download Date | 2/26/18 11:39 AM

Table4:
Educationan
doccupa
tion
effectson
tempo
rary
workincapa
city,wom
en.
Tempo
rary
workincapa
city
Mod
el
Mod
el
Mod
el
Mod
el
Mod
el
(S.E.)[M
.E.]
(S.E.)[M
.E.]
(S.E.)[M
.E.]
(S.E.)[M
.E.]
(S.E.)[M
.E.]
Educationbe
yond
prim
ary
–.***
–.***
–.***
–.***
–.***
(.)
(.)
(.)
(.)
(.)
[–.]
[–.]
[–.]
[–.]
[–.]
Physically
deman
ding
job
.***
.***
.***
. ***
(.)
(.)
(.)
(.)
[.]
[.]
[.]
[.]
Physically
deman
ding
jobin
thelast
years
.***
(.)
[.]
Educationbe
yond
prim
ary
Bornin
city
.***
.***
.***
(.)
(.)
(.)
Reform
.***
.***
(.)
(.)
Reform
×bo
rnin
city
–.***
–.***
–.***
(.)
(.)
(.)
Physically
deman
ding
job
Education
–.***
–.***
–.***
(.)
(.)
(.)
Average
braw
nat
thecommutingarea
.***
.***
.***
(.)
(.)
(.)
(con
tinu
ed)
Impact of Education and Occupation on Work Incapacity 597
Brought to you by | Aarhus University Library / StatsbiblioteketAuthenticated
Download Date | 2/26/18 11:39 AM
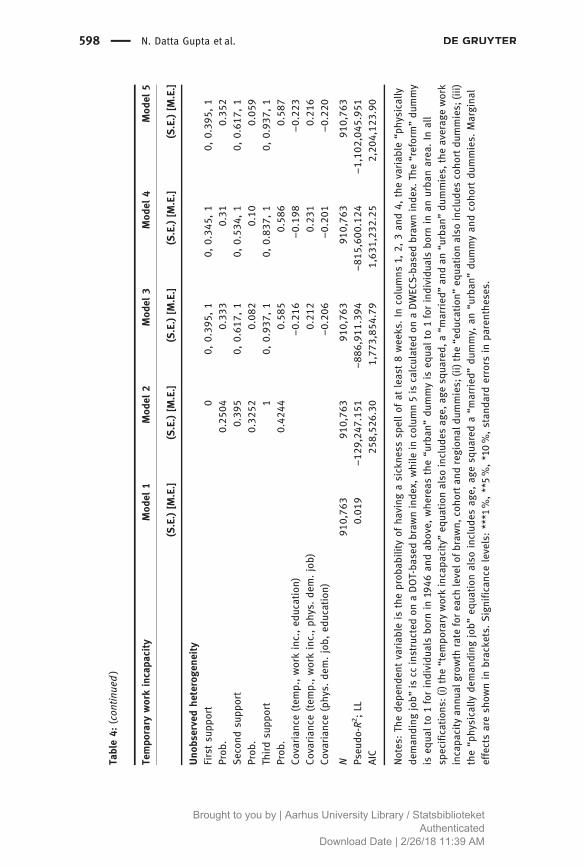
Table4:
(con
tinu
ed)
Tempo
rary
workincapa
city
Mod
el
Mod
el
Mod
el
Mod
el
Mod
el
(S.E.)[M
.E.]
(S.E.)[M
.E.]
(S.E.)[M
.E.]
(S.E.)[M
.E.]
(S.E.)[M
.E.]
Uno
bservedhe
teroge
neity
Firstsu
pport
,.,
,.,
,.,
Prob
..
.
.
.
Secon
dsu
pport
.
,.,
,.,
,.,
Prob
..
.
.
.
Thirdsu
pport
,.,
,.,
,.,
Prob
..
.
.
.
Covarianc
e(tem
p.,workinc.,ed
ucation)
–.
–.
–.
Covarianc
e(tem
p.,workinc.,ph
ys.de
m.job)
.
.
.
Covarianc
e(phy
s.de
m.job,
education)
–.
–.
–.
N,
,
,
,
,
Pseu
do-R
;LL
.
–,.
–,.
–,.
–,,.
AIC
,.
,,.
,,.
,,.
Notes:Th
ede
pend
entvariab
leis
theprob
ability
ofha
ving
asickne
sssp
ellof
atleast8wee
ks.In
columns
1,2,
3an
d4,
thevariab
le“p
hysically
deman
ding
job”
iscc
instructed
onaDOT-ba
sedbraw
ninde
x,while
incolumn5is
calculated
onaDWEC
S-based
braw
ninde
x.Th
e“reform”du
mmy
iseq
ualto
1forindividu
alsbo
rnin
1946
andab
ove,
whe
reas
the“u
rban
”du
mmyis
equa
lto
1forindividu
alsbo
rnin
anurba
narea
.In
all
specification
s:(i)the
“tem
porary
workincapa
city”eq
uation
also
includ
esag
e,ag
esq
uared,
a“m
arried
”an
dan
“urban
”du
mmies,
theaverag
ework
incapa
city
annu
algrow
thrate
forea
chlevelo
fbrawn,
coho
rtan
dregion
aldu
mmies;
(ii)the“edu
cation
”eq
uation
also
includ
escoho
rtdu
mmies;
(iii)
the“p
hysically
deman
ding
job”
equa
tion
also
includ
esag
e,ag
esq
uareda“m
arried
”du
mmy,
an“u
rban
”du
mmyan
dcoho
rtdu
mmies.
Margina
leffectsaresh
ownin
bracke
ts.Significanc
elevels:***1
%,**5%,*10%,stan
dard
errors
inpa
renthe
ses.
598 N. Datta Gupta et al.
Brought to you by | Aarhus University Library / StatsbiblioteketAuthenticated
Download Date | 2/26/18 11:39 AM

Table5:
Educationan
doccupa
tion
effectson
tempo
rary
workincapa
city,men
.
Tempo
rary
workincapa
city
Mod
el
Mod
el
Mod
el
Mod
el
Mod
el
(S.E.)[M
.E.]
](S.E.)[M
.E.]
(S.E.)[M
.E.]
(S.E.)[M
.E.]
(S.E.)[M
.E.]
Educationbe
yond
prim
ary
–.***
–.***
–.***
–.***
–.***
(.)
(.)
(.)
(.)
(.)
[–.]
[–.]
[–.]
[–.]
[–.]
Physically
deman
ding
job
.***
.***
.***
. ***
(.)
(.)
(.)
(.)
[.]
[.]
[.]
[.]
Physically
deman
ding
jobin
thelast
years
.***
(.)
[.]
Educationbe
yond
prim
ary
Bornin
city
.***
.***
.***
(.)
(.)
(.)
Reform
.***
.***
.***
(.)
(.)
(.)
Reform
×bo
rnin
city
–.***
–.***
–.***
(.)
(.)
(.)
Physically
deman
ding
job
Education
–.***
–.**
–.***
(.)
(.)
(.)
(con
tinu
ed)
Impact of Education and Occupation on Work Incapacity 599
Brought to you by | Aarhus University Library / StatsbiblioteketAuthenticated
Download Date | 2/26/18 11:39 AM

Table5:
(con
tinu
ed)
Tempo
rary
workincapa
city
Mod
el
Mod
el
Mod
el
Mod
el
Mod
el
(S.E.)[M
.E.]
](S.E.)[M
.E.]
(S.E.)[M
.E.]
(S.E.)[M
.E.]
(S.E.)[M
.E.]
Average
braw
nat
thecommutingarea
.***
.***
.***
(.)
(.)
(.)
Uno
bservedhe
teroge
neity
Firstsu
pport
,.,
,.,
,.,
Prob
..
.
.
.
Secon
dsu
pport
.
,.,
,.,
,.,
Prob
..
.
.
.
Thirdsu
pport
,.,
,.,
,.,
Prob
..
.
.
.
Covarianc
e(tem
p.,workinc.,ed
ucation)
–.
–.
–.
Covarianc
e(tem
p.,workinc.,ph
ys.de
m.job)
.
.
.
Covarianc
e(phy
s.de
m.job,
education)
–.
–.
–.
N,
,
,
,
,
Pseu
do-R
;LL
.
–,.
–,.
–,.
–,.
AIC
,.
,,.
,,.
,,.
Note:
Thede
pend
entvariab
leis
theprob
ability
ofha
ving
asickne
sssp
ellof
atleast8wee
ks.In
columns
1,2,
3an
d4,
thevariab
le“p
hysically
deman
ding
job”
iscons
tructedon
aDOT-ba
sedbraw
ninde
x,while
incolumn5itis
calculated
onaDWEC
S-based
braw
ninde
x.Th
e“reform”du
mmy
iseq
ualto
1forindividu
alsbo
rnin
1946
andab
ove,
whe
reas
the“u
rban
”du
mmyis
equa
lto
1forindividu
alsbo
rnin
anurba
narea
.In
all
specification
s:(i)the“tem
porary
workincapa
city”eq
uation
also
includ
esag
e,ag
esq
uared,
a“m
arried
”an
d“u
rban
”du
mmies,
theaverag
ework
incapa
city
annu
algrow
thrate
forea
chlevelo
fbrawn,
coho
rtan
dregion
aldu
mmies;
(ii)the“edu
cation
”eq
uation
also
includ
escoho
rtdu
mmies;
(iii)
the“p
hysically
deman
ding
job”
equa
tion
also
includ
esag
e,ag
esq
uareda“m
arried
”du
mmy,
“urban
”du
mmyan
dcoho
rtdu
mmies.
Margina
leffects
aresh
ownin
bracke
ts.Significanc
elevels:***1
%,**5%,*10%,stan
dard
errors
inpa
renthe
ses.
600 N. Datta Gupta et al.
Brought to you by | Aarhus University Library / StatsbiblioteketAuthenticated
Download Date | 2/26/18 11:39 AM

also statistically significant.21 Accounting for time-invariant unobserved hetero-geneity in model 2 hardly changes the results and produces, if anything, evenlarger effects of education and occupation on TWI.
In model 3, when instrumenting education by the urban–rural difference ineducation following the 1958 school reform, we see that the instrument issignificantly related to the education measure at the 1% level and shows, asexpected, that the urban–rural difference in the share attaining educationbeyond primary level decreased after the reform.22 The effect of education onreducing TWI likelihood now is reduced by half to 0.7 pp. An almost identicaleffect of education is estimated from an augmented specification, where weinclude a full set of interactions between the urban and the cohort dummiesin the education equation. This allows us to dismiss the issue that our instru-ment is confounded by a potential relative trend between treatment and controlgroups. This is also confirmed by the fact that, when we plot the residuals from aregression of cohort dummies on the education variable for each of the fourgroups (men control, men treated, women control, women treated), there is stilla visible discontinuity within and across groups as in Figure 2.23. In model 3,current occupation is at the same time instrumented by the (lagged) averagebrawn in a worker’s commuting area. The average brawn is positively related tothe brawniness of a female worker’s job and is also highly significant, i. e. at the1% level. Instrumenting occupation, as can be expected, reduces its effect onTWI but only slightly to 1.2 pp. The marginal effects of education and occupationare equivalent to, respectively, a decrease and a rise in the probability of TWI by21% and 35%, respectively.24 We cannot, however, conclude anything about thestatistical significance of those figures, as in nonlinear models significance of
21 It is important to note that our measure of physically demanding job relies on a brawnindex, which is estimated and therefore has a variance of its own. Therefore, the standard errorson this variable are likely to be underestimated. We think, however, this may be less of a issuein our case, as we specify the physically demanding job as a dummy variable.22 To assess the validity of our instrument, we have also run a placebo test, by estimatingmodel 3 on the pre-reform period, i. e. the one including the cohorts 1943, 1944, 1945 and 1946.For this sub-sample, we have specified a “placebo” reform as a dummy variable equal to 1 forthe cohorts 1945 and beyond and we have interacted the latter with the urban dummy. Theresults from this test, available on request, clearly corroborate the appropriateness of our mainresults as this modified version of the instrument loses its power in terms of predictingindividuals’ education.23 All these additional results are available on request from the authors.24 The figures are obtained using the average sample probability of TWI. From Table 2 theaverage probability of TWI is approximately 3%. Therefore, the changes in the probability ofTWI, in percentage terms, are (–0.007/0.034) × 100=–20.58 and (0.012/0.034) × 100= 35.3,respectively.
Impact of Education and Occupation on Work Incapacity 601
Brought to you by | Aarhus University Library / StatsbiblioteketAuthenticated
Download Date | 2/26/18 11:39 AM

the underlying parameters does not necessarily imply the significance of themarginal effects. Interestingly, when computed separately by age, we also findthat the marginal effect of having a physically demanding job increases withage, except for a flattening off between ages 52 and 55. These results arereported in Figure 4 and seem to confirm the “broken down by work” hypothesisformulated in Case and Deaton (2005). However, given that it is not possible tocontrol for the age, cohort and time factors at the same time, we cannot rule outthat these age effects are artifacts of general trends in TWI.
What if it is not the brawniness of the current occupation but rather having apast experience of brawny jobs that matters for TWI? Workers approaching theend of their careers, particularly those experiencing health deterioration, mayswitch to softer “bridge” jobs or partial retirement before retiring that may evenbe outside the occupation of the career job (Ruhm 1990). This would imply thatthe physical demands of the job are erroneously proxied by current occupationbrawn.25 Furthermore, it may be that it is the cumulative exposure to physical
0.00
20.
004
0.00
60.
008
0.01
0.01
2
Mar
gina
l effe
ct o
f phy
sica
lly d
eman
ding
job
48 49 50 51 52 53 54 55 56 57 58 59Age
Figure 4: Marginal effects of physically demanding job on temporary work incapacity by age,women.Note: Marginal effects estimated from model 3 of Table 4.
25 In our sample, around 30% of workers changes their occupation on average. Among thoseswitchers, around 80% changes their occupation only once over the sample period. This
602 N. Datta Gupta et al.
Brought to you by | Aarhus University Library / StatsbiblioteketAuthenticated
Download Date | 2/26/18 11:39 AM

demands and/or environmental conditions on the job that matters for healthbreakdown (Fletcher, Sindelar, and Yamaguchi 2011). However, when applyingthe lagged measure of the physical demands of the job (having a brawny job inthe last 3 years) in model 4, it can be seen that occupation still has a causaleffect on females’ probability of TWI and that the marginal effect is fairly similarto the one estimated from model 3. Thus, for women, the attributes of the currentjob matter for sickness absence as much as having had physically demandingwork in the past. Presumably, this result shows that bridge jobs are not asimportant a mechanism in high-wage, high labor cost regimes such as inDenmark, where it may be more difficult for older workers to switch jobs atthe end of their careers and/or the incentives to do so may be lower.Furthermore, Danish workplaces are said to be among the most accommodatingin the world, and the possibility to decrease work hours or negotiate moreflexible conditions would be tried before switching employment. Educationremains significant in this specification.
Moving to the results of the effect of education and occupation on TWI formen, in Table 5 we see in model 1 that the effect of working in a physicallydemanding occupation is slightly smaller than it is for women, increasing thechances of TWI by 0.9 pp. Similar to women, education beyond primarydecreases men’s likelihood of TWI by 1.4 pp (model 2). As in the case forwomen, accounting for time-invariant unobserved heterogeneity does notchange the results substantially.
Proceeding to the most general specification in which both education andoccupation are modeled as endogenous in model 3, we find that both educationand occupation are statistically significant. Education exceeding primary schoollevel reduces the likelihood of TWI by 0.2 pp, which is more than half as large asthe effect for women. Working in a physically demanding occupation has also alower marginal effect compared to the one estimated for women, 0.7 pp com-pared to 1.2 pp. Relative to the mean, these figures are equivalent to a decreaseand a rise in the probability of TWI by 7% and 25%, respectively.26 As in thecase for women, the impact of occupation magnifies with age, as clearly indi-cated in Figure 5; however, the incline is not as steep. Trying out the alternativedefinition of occupation based on history of physically demanding work in
suggests that both the current and the lag measure may be a good proxy for the physicaldemands experienced at work by the individual in our sample.26 From Table 2, the average probability of TWI is 2.8%. Therefore, the changes in theprobability of TWI, in percentage terms, are (–0.002/0.028) × 100=–7.14 and (0.007/0.028) ×100= 25, respectively.
Impact of Education and Occupation on Work Incapacity 603
Brought to you by | Aarhus University Library / StatsbiblioteketAuthenticated
Download Date | 2/26/18 11:39 AM

model 4 does not change the results for men: the coefficient on educationremains negative and significant and occupation exerts a statistically significanteffect on increasing TWI with a marginal effect of 0.6 pp.
Finally, for both men and women, in model 3, the covariance betweeneducation and TWI is estimated to be negative (i. e. the unobserved factorsaffecting a greater tendency to go on TWI vary negatively with the unobservedfactors affecting more education), the covariance between working in a physi-cally demanding job and TWI is positive, and the covariance between educationand physically demanding job is negative, as may be expected. The negative(positive) correlation between TWI and education (physically demanding job)could reflect the impact of unobservables such as time preferences or compen-sation-seeking behavior that was mentioned earlier.
5.2 The Effects of Education and Occupation on PWI
To probe further the effects of occupation and education on work incapacity, inTables 6 and 7 we estimate their impact on the probability of PWI (either the
0.00
40.
006
0.00
80.
010.
012
Mar
gina
l effe
ct o
f phy
sica
lly d
eman
ding
job
48 49 50 51 52 53 54 55 56 57 58 59
Age
Figure 5: Marginal effects of physically demanding job on temporary work incapacity by age,men.Note: Marginal effects estimated from model 3 of Table 4.
604 N. Datta Gupta et al.
Brought to you by | Aarhus University Library / StatsbiblioteketAuthenticated
Download Date | 2/26/18 11:39 AM

Table6:Ed
ucationan
doccupa
tion
effectson
perm
anen
tworkincapa
city,wom
en.
Perm
anen
tworkincapa
city
Mod
ell
Mod
el
Mod
el
Mod
el
Mod
el
Mod
elö
Mod
el
(S.E.)[M
.E.]
(S.E.)[M
.E.]
(S.E.)[M
.E.]
(S.E.)[M
.E.]
(S.E.)[M
.E.]
(S.E.)[M
.E.]
(S.E.)[M
.E.]
Educationbe
yond
prim
ary
–.***
–.***
–.***
–.***
–.***
–.***
–.***
–.
–.
–.
–.
–.
–.
–.
[–.]
[–.
[–.]
[–.]
[–. ]
[–.]
[–.]
Physically
deman
ding
job
.
.
.
.
.
.
–.
–.
–.
–.
–.
–.
[.]
[.]
[.]
[.]
[.]
[.]
Physically
deman
ding
jobin
the
last
years
.
–.
[.]
Educationbe
yond
prim
ary
Bornin
city
.***
.***
.***
.***
.***
(.)
(.)
(.)
(.)
(.)
Reform
.***
.***
.***
.***
.***
(.)
(.)
(.)
(.)
(.)
Reform
×bo
rnin
city
–.***
–.***
–.***
–.***
–. ***
(.)
(.)
(.)
(.)
(.)
(con
tinu
ed)
Impact of Education and Occupation on Work Incapacity 605
Brought to you by | Aarhus University Library / StatsbiblioteketAuthenticated
Download Date | 2/26/18 11:39 AM

Table6:(con
tinu
ed)
Perm
anen
tworkincapa
city
Mod
ell
Mod
el
Mod
el
Mod
el
Mod
el
Mod
elö
Mod
el
(S.E.)[M
.E.]
(S.E.)[M
.E.]
(S.E.)[M
.E.]
(S.E.)[M
.E.]
(S.E.)[M
.E.]
(S.E.)[M
.E.]
(S.E.)[M
.E.]
Physically
deman
ding
job
Education
–.***
–.***
–.***
–.***
–.***
(.)
(.)
(.)
(.)
(.)
Average
braw
nat
thecommuting
area
.***
.***
.***
.***
.***
(.)
(.)
(.)
(.)
(.)
Uno
bservedhe
teroge
neity
Firstsu
pport
,.,
,.,
,.,
,.,
,.,
Prob
..
.
.
.
.
.
Secon
dsu
pport
.
,.,
,.,
,.,
,.,
,.,
Prob
..
.
.
.
.
.
Thirdsu
pport
,.,
,.,
,.,
,.,
,.,
Prob
..
.
.
.
.
.
Covarianc
e(workdisability,
education)
–.
–.
–.
–.
–.
Covarianc
e(workdisability,
phys.
dem.job)
.
.
.
.
.
606 N. Datta Gupta et al.
Brought to you by | Aarhus University Library / StatsbiblioteketAuthenticated
Download Date | 2/26/18 11:39 AM
Covarianc
e(phy
s.de
m.job,
education)
.
.
.
.
.
N,
,
,
,
,
,
,
Pseu
do-R
;LL
.
–.
–.
–.
–.
–.
–.
AIC
.
.
.
.
.
.
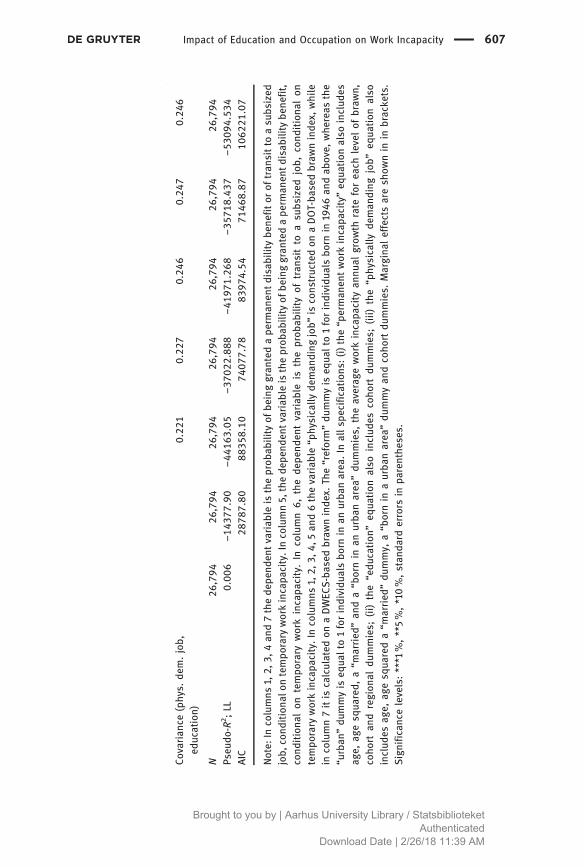
Note:
Incolumns
1,2,
3,4an
d7thede
pend
entvariab
leis
theprob
ability
ofbe
inggran
tedape
rman
entdisabilitybe
nefitor
oftran
sitto
asu
bsized
job,
cond
itiona
lontempo
rary
workincapa
city.Incolumn5,
thede
pend
entvariab
leis
theprob
ability
ofbe
inggran
tedape
rman
entdisabilitybe
nefit,
cond
itiona
lon
tempo
rary
workincapa
city.In
column
6,thede
pend
entvariab
leis
theprob
ability
oftran
sitto
asu
bsized
job,
cond
itiona
lon
tempo
rary
workincapa
city.In
columns
1,2,
3,4,
5an
d6thevariab
le“p
hysically
deman
ding
job”
iscons
tructedon
aDOT-ba
sedbraw
ninde
x,while
incolumn7itis
calculated
onaDWEC
S-based
braw
ninde
x.Th
e“reform”du
mmyis
equa
lto
1forindividu
alsbo
rnin
1946
andab
ove,
whe
reas
the
“urban
”du
mmyis
equa
lto
1forindividu
alsbo
rnin
anurba
narea
.In
allsp
ecification
s:(i)the“p
erman
entworkincapa
city”eq
uation
also
includ
esag
e,ag
esq
uared,
a“m
arried
”an
da“b
ornin
anurba
narea
”du
mmies,
theaverag
eworkincapa
city
annu
algrow
thrate
forea
chlevelof
braw
n,coho
rtan
dregion
aldu
mmies;
(ii)
the“edu
cation
”eq
uation
also
includ
escoho
rtdu
mmies;
(iii)
the“p
hysically
deman
ding
job”
equa
tion
also
includ
esag
e,ag
esq
uareda“m
arried
”du
mmy,
a“b
ornin
aurba
narea
”du
mmyan
dcoho
rtdu
mmies.
Margina
leffectsaresh
ownin
inbracke
ts.
Significanc
elevels:***1
%,**5%,*10%,stan
dard
errors
inpa
renthe
ses.
Impact of Education and Occupation on Work Incapacity 607
Brought to you by | Aarhus University Library / StatsbiblioteketAuthenticated
Download Date | 2/26/18 11:39 AM

Table7:
Educationan
doccupa
tion
effectson
perm
anen
tworkincapa
city,men
.
Perm
anen
tworkincapa
city
Mod
el
Mod
el
Mod
el
Mod
el
Mod
el
Mod
el
Mod
el
(S.E.)[M
.E.]
(S.E.)[M
.E.]
(S.E.)[M
.E.]
(S.E.)[M
.E.]
(S.E.)[M
.E.]
(S.E.)[M
.E.]
(S.E.)[M
.E.]
Educationbe
yond
prim
ary
–.***
(.)
[–.]
–.***
(.)
[–.]
–.***
(.)
[–.]
–.**
(.)
[–.]
–.*
(.)
[–.]
–. ***
(.)
[–.]
–.***
(.)
[–.]
Physically
deman
ding
job
–.
(.)
[–.]
–.
(.)
[–.]
–.
(.)
[–.]
–.
(.)
[–.]
–.
(.)
[–.]
–.
(.)
[.]
Physicallyde
man
ding
jobin
thelast
years
–.
(.)
[–.]
Educationbe
yond
prim
ary
Bornin
city
.***
.***
.***
.***
.***
(.)
(.)
(.)
(.)
(.)
Reform
.***
.***
.***
.***
.***
(.)
(.)
(.)
(.)
(.)
Reform
×bo
rnin
city
–.***
–.**
–.***
–.*
–.*
(.)
(.)
(.)
(.)
(.)
Physically
deman
ding
job
Education
–.***
–.***
–.***
–.***
–.***
(.)
(.)
(.)
(.)
(.)
Average
braw
nat
the
commutingarea
.***
.***
.***
.***
.***
(.)
(.)
(.)
(.)
(.)
Uno
bservedhe
teroge
neity
Firstsu
pport
,.,
,.,
,.,
,.,
,.,
Prob
..
.
.
.
.
.
608 N. Datta Gupta et al.
Brought to you by | Aarhus University Library / StatsbiblioteketAuthenticated
Download Date | 2/26/18 11:39 AM

Secon
dsu
pport
.
,.,
,.,
,.,
,.,
,.,
Prob
..
.
.
.
.
.
Thirdsu
pport
,.,
,.,
,.,
,.,
,.,
Prob
..
.
.
.
.
.
Covarianc
e(workdisability,
education)
–.
–.
–.
–.
–.
Covarianc
e(workdisability,
phys.de
m.job)
.
.
.
.
.
Covarianc
e(phy
s.de
m.job,
education)
.
.
.
.
.
N,
,
,
,
,
,
,
Pseu
do-R
;LL
.
–,.
–,.
–,.
–,.
–,.
–,.
AIC
,.
,.
,.
,.
,.
,.
Note:
Incolumns
1,2,
3,4an
d7thede
pend
entvariab
leis
theprob
ability
ofbe
inggran
tedape
rman
entdisabilitybe
nefitor
oftran
sitto
asu
bsized
job,
cond
itiona
lontempo
rary
workincapa
city.Incolumn5,
thede
pend
entvariab
leis
theprob
ability
ofbe
inggran
tedape
rman
entdisabilitybe
nefit,
cond
itiona
lon
tempo
rary
workincapa
city.In
column6,thede
pend
entvariab
leis
theprob
ability
oftran
sitto
asu
bsized
job,
cond
itiona
lon
tempo
rary
workincapa
city.In
columns
1,2,
3,4,
5an
d6thevariab
le“p
hysically
deman
ding
job”
iscons
tructedon
aDOT-ba
sedbraw
ninde
x,while
incolumn7itis
calculated
onaDWEC
S-based
braw
ninde
x.Th
e“reform”du
mmyis
equa
lto
1forindividu
alsbo
rnin
1946
andab
ove,
whe
reas
the
“urban
”du
mmyis
equa
lto
1forindividu
alsbo
rnin
anurba
narea
.In
allsp
ecification
s:(i)the“p
erman
entworkincapa
city”eq
uation
also
includ
esag
e,ag
esq
uared,
a“m
arried
”an
da“b
ornin
anurba
narea
”du
mmies,
theaverag
eworkincapa
city
annu
algrow
thrate
forea
chlevelof
braw
n,coho
rtan
dregion
aldu
mmies;
(ii)the“edu
cation
”eq
uation
also
includ
escoho
rtdu
mmies;
(iii)
the“p
hysically
deman
ding
job”
equa
tion
also
includ
esag
e,ag
esq
uareda“m
arried
”,a“b
ornin
anurba
narea
”an
dcoho
rtdu
mmies.
Margina
leffects
arein
bracke
ts.Significanc
elevels:***1
%,
**5%,*10%,stan
dard
errors
arein
parenthe
ses.
Impact of Education and Occupation on Work Incapacity 609
Brought to you by | Aarhus University Library / StatsbiblioteketAuthenticated
Download Date | 2/26/18 11:39 AM

receipt of disability benefits or the transit to nonregular subsidized jobs) condi-tional on TWI, hence, the lower sample sizes. Here too, several different modelsare estimated for, respectively, women and men. As was the case for TWI, thesame parsimonious specification is chosen for the equation for PWI. Besideseducation and occupation (and their instruments), only age and its square,marital status and residence in an urban area are included as determinants.Although in principle PWI and TWI could be separate processes with each oftheir own determinants, we retain a sparse set of common determinants for bothmeasures of work incapacity. This is because our focus is on uncovering therelationships between education, occupation and the relevant measure of workincapacity controlling for the most obvious sources of heterogeneity and not onaccounting for all the variation in the measure of work incapacity. While con-sidering different determinants for each type of work incapacity is certainly aworthwhile approach, it would introduce many potentially endogenous determi-nants which further complicate the analysis, given that we already are handlingtwo sources of endogeneity simultaneously.
Results for women in Table 6 show that although the workers have a TWI, ahigher level of education still reduces their probability of a PWI by 4.4 pp(model 1). Moreover, working in a physically demanding job increases thisprobability by 1 pp. When endogenizing both variables simultaneously, onlythe coefficient on education retains its significance. The effect of occupation isnot statistically significant even in the specification based on the occupationalhistory.27 As in Andren (2011), we also estimate the most general specification bydistinguishing between the probability of “full-time work disability,” i. e. thereceipt of disability benefits, and the probability of “part-time work disability,”i. e. working as subsidized worker at reduced working hours. The results arereported, respectively, in columns 5 and 6 of Table 6 and compared to theprevious ones show that the effect of education is precisely estimated for bothtypes of transitions. Very similar effects are found for men in Table 7, except thatthe effect of education on PWI for men is precisely estimated for part-timedisability only, although the effect for full-time disability is estimated to beroughly the same size.
For both men and women, in Tables 6 and 7, the cross-equation correlationsbetween education and PWI are estimated to be negative (i. e. the unobservedfactors affecting a greater tendency to go on PWI vary negatively with theunobserved factors affecting more education) and the covariance between
27 Additional results not reported in this paper show that the impact of occupation on PWIdoes not even vary with age. These additional calculations are available on request from theauthors.
610 N. Datta Gupta et al.
Brought to you by | Aarhus University Library / StatsbiblioteketAuthenticated
Download Date | 2/26/18 11:39 AM
working in a physically demanding job and PWI is positive. As mentionedearlier, a possible explanation for these plausible correlations could be, control-ling for other things, that educated people and individuals working in nonman-ual jobs have lower discount rates and lower expected replacement rates fromdisability insurance and, therefore, would be less prone to compensation-seek-ing behavior.
5.3 Robustness Test
All the previous findings on occupation are based on our novel measure of aphysically demanding job, so we test the sensitivity of results to this measure. Tothis end, we run the model using an alternative measure of brawny job based onresponses to the Danish Work Environment Cohort Study (DWECS) conducted in2000. DWECS monitors the working population for the prevalence of occupa-tional risk factors. The study conducted phone interviews on physical, thermo-chemical and psychosocial exposures, health and symptoms, including adoctor’s diagnosis, as well as self- and peer assessment. It is a representativesample of the Danish labor force. Details of the sampling are in Burr, Bjorner,and Kristensen (2003, 2006). The purpose of the DWECS survey is not to derive acomplete description of the job or activities, so it is not appropriate to useprincipal component analysis on the entire questionnaire, as variation drivenby any factor accounts for too little of the total variation. Instead, we selectquestions about more intrinsic (objective) aspects of the job (rather than of theworkplace, or of the manager and colleagues), and these include all questionsabout physical activity in the workplace. They also include aspects of job controland autonomy, and mental or emotional demands.
The first principal component accounts for almost 30% of the variation,whose eigenvector reflects a brawn-like dimension. Although it is driven byvariation of jobs in relation to other jobs, rather than by fundamental tasks oranalysis of the composition of a job, it appears that the most objective questionsin the survey highlight variation in brawniness as the main dimension alongwhich to discriminate occupations. The eigenvector corresponding to the firstprincipal component is used to score each occupation for brawn. The 61 ele-ments in the eigenvector, each corresponding to a survey question, are theloadings given to each survey question. As most of the questions have orderedmultiple choice (two or five) answers, we use the polychoric package in Stata(Kolenikov and Angeles 2009) to derive principal components from the 105occupations for which there were at least 10 respondents. If a direct matchfrom an occupation to a DISCO code from the full sample is not found, we use
Impact of Education and Occupation on Work Incapacity 611
Brought to you by | Aarhus University Library / StatsbiblioteketAuthenticated
Download Date | 2/26/18 11:39 AM
the nearest category. For each individual in the full sample, the instrument ofcommuting area level brawn based on the new index is generated in the sameway as for the DOT-based index. Results obtained using this alternative measureof brawny job are reported in the last columns of Tables 4–7. In line with themain results, we find that women (men) working in a physically demanding jobhave a 1.2 (0.6) percentage points higher likelihood of TWI than otherwisecomparable women (men).28 Furthermore, for both women and men, the effectson the probability of PWI are imprecisely estimated, as we have previouslyfound in Section 4, exploiting the DOT-based brawn index.
6 Conclusions
Large numbers of working age individuals continue to leave the labor force viadisability pension enroute sickness absence in almost all OECD countries todayand the lost work effort of these individuals constitutes a great cost to theseeconomies. The objective of this paper is to empirically model the relationshipsbetween education, working in a physically demanding job and health-relatedexit from the labor market with a view to determining whether these factors havecausal impacts on sickness absence and the inflow to disability and their relativeimportance for each of these processes.
Theoretically, health and disability can be impacted through both educationand the nature of jobs. For this reason, we estimate a recursive model of workincapacity and education and occupation with correlated cross-equation errorsand unobserved heterogeneity on comprehensive Danish longitudinal data.These data contain objective register-based sickness absence and disabilityspells, unlike self-reported measures used in the previous literature. The empiri-cal model simultaneously allows for endogenous education and occupation, andidentification is achieved by applying as exclusion restrictions a carefully con-structed measure of the physical demands of the occupations at the commutingarea level and the exogenous variation induced by a major educational reform.
Our findings show that education has a negative causal effect on both TWIand PWI, while working in a physically demanding occupation causally affectsTWI only.29 For both men and women, education exceeding primary school level
28 From Table 2, the average probability of TWI is 3.4% and 2.8% for, respectively, women andmen. Therefore, the changes in the probability of TWI, in percentage terms, are, respectively(0.012/0.034) × 100= 35.29 and (0.006/0.028) × 100= 21.4, respectively.29 Indeed, a sizable fraction of the causal effect of education (50–75%) is indirect, i. e. workingthrough the choice of occupation (compare column 2 with column 3 in Tables 4 and 5).
612 N. Datta Gupta et al.
Brought to you by | Aarhus University Library / StatsbiblioteketAuthenticated
Download Date | 2/26/18 11:39 AM

decreases the probability of TWI, but more so for women than men (21% versus7%). The causal effect of education suggests that the extra education benefitswomen more, via more health knowledge, changed time rate of preferences orgreater efficiency in health investments.
At the same time, we find a causal effect of occupation, which also differsby gender. More specifically, a stronger causal effect increasing TWI is seen forwomen than men (35% versus 25%), despite the average probability of TWIbeing fairly similar by gender. We also uncover evidence of workers in physi-cally demanding jobs, both men and women, being “broken down by work”over time, and women more so than men, even though the average brawn levelof men’s jobs was significantly higher. A number of explanations could beoffered for the stronger effect of a physically demanding occupation onwomen’s transit to sickness absence such as biological differences in theperception of pain, a greater socialization of men to “tolerate” declining healthand remain on the job or a higher degree of employer accommodation in men’sjobs. Future work could look into which of these potential explanations carrymerit.
Our second major finding for both genders is that, while education signifi-cantly affects in most cases PWI, brawniness of the occupation has no effect onthe inflow to disability, conditional on TWI. A mechanism could be the rise inthe share of awards based on mental disorders over this period, going from32.1% of all grants in 2001 to 44.4% in 2006 and a decline in the share of grantsbased on musculoskeletal disorders implying a decreasing role for occupationalbrawn. Recall that the factor analysis based on DWECS data included questionsrelating to job control and autonomy, and mental or emotional demands inaddition to physical demands. However, occupations distinguished themselvesmost from each other in the DWECS according to a brawn-like aspect. A remain-ing explanation for the lack of an effect of brawn on PWI could be greaterworkplace accommodation and efforts to retain workers in Danish workplaces. Afinal concern could be that moral hazard and not work-induced health deteriora-tion drives the greater transit to TWI of workers in brawny jobs who may beusing sickness absence as a waiting state prior to a disability award decision(Bolduc et al. 2002). The fact that brawn did not relate to permanent receipt ofdisability may, on the face of it, corroborate this compensation-seeking story.However, since we control for time constant individual heterogeneity in themodel, we should be able to rule out this explanation unless the individualpropensity to seek moral hazard was time varying and correlated with brawnyjobs. Several robustness checks on the definition of work incapacity and physi-cally demanding job confirmed the results earlier.
Impact of Education and Occupation on Work Incapacity 613
Brought to you by | Aarhus University Library / StatsbiblioteketAuthenticated
Download Date | 2/26/18 11:39 AM

Acknowledgments: The authors would like to thank Jakob Arendt, Pilar Garcia-Gomez, Hans van Kippersluis, Petter Lundborg, Filip Pertold, David C. Ribar andChan Shen for helpful comments and suggestions. We also appreciate commentsfrom participants at seminars organized by Lund University, University ofMaastricht, The Danish Institute of Governmental Research (AKF) and TheSwedish Institute of Social Research (SOFI), and participants at the workshopon Health, Work and the Workplace, Aarhus University, May 2011, at the 32ndNordic Health Economists Study Group Meeting, Odense, August 2011, at theASHE conference in Minneapolis, June 2012, the invited lecture at the 10th TEPPconference in Le Mans on Research in Health and Labour Economics. The usualdisclaimer applies.
Funding: Funding from the Danish Council for Independent Research – SocialSciences, grant no. x09-064413/FSE, is gratefully acknowledged.
References
Andersen, A. K. 2000. Commuting Areas in Denmark. Copenhagen: AKF Forlaget.Arendt, J. N. 2005. “Does Education Cause Health? A Panel Data Analysis Using School Reforms
for Identification.” The Economics of Education Review 24 (2):149160.Arendt, J. N. 2008. “In Sickness and in Health- Till Education Do Us Part: Education Effects on
Hospitalization.” The Economics of Education Review 27 (2):161–72.Andren, D. 2011. “Half Empty of Half Full: The Importance of the Definition of Part-Time Sick
Leave When Estimating Its Effects.” Örebro University working paper, 4/2011.Autor, D. H., and M. G. Duggan. 2006. “The Growth in the Social Security Disability Rolls:
A Fiscal Crisis Unfolding.” Journal of Economic Perspectives 20 (3):71–96.Bago d’Uva, T., E. van Doorslaer, M. Lindeboom, and O. O’Donnell. 2008. “Does Reporting
Heterogeneity Bias Health In Equality Measurement?” Health Economics 17 (3):351–75.Becker, G. S., and C. B. Mulligan. 1997. “The Endogenous Determination of Time Preference.”
Quarterly Journal of Economics 112:729–58.Bengtsson, S., 2007. “Report on the Employment of Disabled Persons in European Countries,
Country: Denmark. The Academic Network of European Disability Experts (ANED).”VT/2007/005.
Bolduc, D., B. Fortin, F. Labrecque, and P. Lanoie. 2002. “Workers’ Compensation, Moral Hazardand Composition of Workplace Injuries.” Journal of Human Resources 37 (3):623–52.
Bryld, C.-J., H. Haue, K. H. Andersen, and I. Svane. 1990. GL 100. Skole, Stand, Forening,Gymnasieskolernes Lrerforening 1890 1990. Kbenhavn: Gyldendal.
Burr, H., J. B. Bjorner, T. S. Kristensen, et al. 2003. “Trends in the Danish Work Environment in1990–2000 and Their Associations withLabor-Force Changes.” Scandinavian Journal ofWork, Environment & Health 29:270–9.
Burr, H., E. Bach, H. Gram, and E. Villadsen. 2006. Arbejdsmiljø I Danmark 2005 – Et OverblikFra Den Nationale Arbejdsmiljøkohorte. Kobenhavn, Arbejdsmiljø Instituttet. http://www.arbejdsmiljøforskning.dk//media/Arbejdsmiljoedata/NAK/nak2005- arbejdsmiljø.pdf.
614 N. Datta Gupta et al.
Brought to you by | Aarhus University Library / StatsbiblioteketAuthenticated
Download Date | 2/26/18 11:39 AM

Cameron, S., and C. Taber. 2004. “Borrowing Constraints and the Returns to Schooling.”Journal of Political Economy 112:132–82.
Card, D. 1999. “Causal Effects of Education on Earnings.” Handbook of Labor Economics3A:1801–63.
Case, A., and A. Deaton. 2005. “Broken Down by Work and Sex: How Our Health Declines.” InAnalyses in the Economics of Aging, edited by D. A. Wise, 195–205. Chicago: University ofChicago Press.
Christensen, K. B., M. Labriola, M. Kivimaki, and T. Lund. 2008. “Explaining the Social Gradientin Long-Term Sickness Absence: A Prospective Study of Danish Employees.” Journal ofEpidemiology and Community Health 62:181–3.
Cutler, D. M., and A. Lleras-Muney. 2007. “The Education Gradient in Old-Age Disability.” NBERforthcoming chapter in the Research Findings in the Economics of Aging.
Datta Gupta, N., N. Kristensen, and D. Pozzoli. 2010. “External Validation of the Use ofVignettes in Cross-Country Health Studies.” Economic Modelling 27 (4):854–65.
Deding, M., T. Filges, and J. Van Ommeren. 2009. “Spatial Mobility and Commuting: The Case ofTwo-Earner Households.” Journal of Regional Science 49:113–47.
Fletcher, J. M., J. Sindelar, and S. Yamaguchi. 2011. “Cumulative Effects of Job Characteristics onHealth.” Health Economics 20 (5):553–70.
Freedman, V. A., and L. G. Martin. 1999. “The Role of Education in Explaining and ForecastingTrends in Functional Limitations among Older Americans.” Demography 36 (4):461–73.
Fried, L. P., and J. M. Guralnik. 1997. “Disability and Older Adults: Evidence RegardingSignificance, Etiology and Risk.” Journal of American Geriatric Society 45:92–100.
Fuchs, V. 1982. “Time Preference and Health: An Exploratory Study.” In Economic Aspects ofHealth: Second NBER Conference in Standford, edited by V. Fuchs, 93–119. Chicago:University of Chicago Press.
Ganzeboom, H. B. G., and D. J. Treiman. 2003. “International Stratification and Mobility File:Conversion Tools.” Accessed February 26. http://home.fsw.vu.nl/hbg.ganzeboom/ismf/occisko.
Goldman, D. P., and D. Lakdawalla. 2001. “Understanding Health Disparities across EducationGroups.” NBER working paper, no. 8328.
Grossman, M. 1972. “On the Concept of Health Capital and the Demand for Health.” Journal ofPolitical Economy 80 (2):223–55.
Grossman, M., and R. Kæstner. 1997. “The Effects of Education on Health.” The Social Benefitsof Education, MI: 69–123.
Heckman, J., and B. Singer. 1984. “A Method for Minimizing the Impact of DistributionalAssumptions in Econometric Models for Duration Data.” Econometrica 52 (2):271–320.
Hofmann, B. 2013. “Sick of Being Activated?” Empirical Economics 47 (3):1103–27.Holmlund, H. 2008. “A Researcher’s Guide to the Swedish Compulsory School Reform.” LSE
Research Online Documents in Economics 19382, London School of Economics andPolitical Science, LSE Library.
Høgelund, J., and A. Holm. 2006. “Case Management Interviews and the Return to Work ofDisabled Employees.” Journal of Health Economics 25 (3):500–19.
Høgelund, J., A. Holm, and J. McIntosh. 2010. “Does Graded Return-to-Work Improve Sick-ListedWorkers’ Chance of Returning to Regular Working Hours?” Journal of Health Economics,Elsevier 29 (1):158–69.
Ingram, B. F., and G. R. Neumann. 2006. “The Returns to Skill.” Labour Economics 13 (1):35–59.
Impact of Education and Occupation on Work Incapacity 615
Brought to you by | Aarhus University Library / StatsbiblioteketAuthenticated
Download Date | 2/26/18 11:39 AM

Larsen, M. 2006. “Fastholdelse Og Rekruttering Af Ældre. Arbejdspladsers Indsats. (Retainingand Recruiting the Elderly: Workplace Interventions).” Copenhagen: The Danish NationalCentre for Social Research, WP 06: 09.
Larsson, L. 2006. “Sick of Being Unemployed? Interactions between Unemployment andSickness Insurance.” Scandinavian Journal of Economics 108 (1):97113.
Johansson, P., and M. Palme. 2005. “Moral Hazard and Sickness Insurance.” Journal of PublicEconomics 89:1879–90.
Kemptner, D., H. Jurges, and S. Reinhold. 2011. “Changes in Compulsory Schooling and theCausal Effect of Education on Health: Evidence from Germany.” Journal of HealthEconomics 30:340–54.
Kenkel, D. 1991. “Health Behavior, Health Knowledge and Schooling.” Journal of PoliticalEconomy 99:287–305.
Kolenikov, S., and G. Angeles. 2009. “Socioeconomic Status Measurement with Discrete ProxyVariables: Is Principal Component Analysis a Reliable Answer?” Review of Income andWealth 55 (1):128–65.
Lund, T., M. Labriola, K. B. Christensen, et al. 2006. “Physical Work Environment Risk Factorsfor Long Term Sickness: Prospective Findings among a Cohort of 5357 Employees inDenmark.” BMJ 332:449–52.
Maurer, J. 2007. “Socioeconomic and Health Determinants of Health Care Utilization amongElderly Europeans: A New Look at Equity, Intensity and Responsiveness in Ten EuropeanCountries.” HEDG working paper 07/26.
Montgomery, J. D. 1991. “Social Networks and Labor Market Outcomes: Toward an EconomicAnalysis.” American Economic Review 81:1408–18.
Morefield, B., D. Ribar, and C. Ruhm. 2012 “Occupational Status and Health Transitions.”The B.E. Journal of Economic Analysis & Policy 11:3.
Mroz, T. 1999. “Discrete Factor Approximations in Simultaneous Equations Models: Estimatingthe Impact of a Dummy Endogenous Variable on a Continuous Outcome.” Journal ofEconometrics 72 (2):233–74.
Munshi, K. 2003. “Networks in the Modern Economy: Mexican Migrants in the US LaborMarket.” The Quarterly Journal of Economics 118:549–99.
Muurinen, J. M. 1982. “Demand for Health: A Generalized Grossman Model.” Journal of HealthEconomics 1 (1):5–28.
Muurinen, J. M., and Le. Grand. 1985. “The Economic Analysis of Inequalities in Health.” SocialScience and Medicine 20 (10):1029–35.
Kaptyen, A., J. Smith, and A. van Soest. 2007. “Vignettes and Self-Reports of Work Disability inthe United States and the Netherlands.” American Economic Review 97 (1):461–73.
OECD, 2007. “Thematic review on reforming sickness and disability policies to improve workincentives, Country Note – Denmark.”
Oreopoulos, P. 2006. “Estimating Average and Local Average Treatment Effects of EducationWhen Compulsory Schooling Laws Really Matter.” American Economic Review 96 (1):152–75, March.
Pettersson-Lidbom, P., and T. Peter Skogman. 2013. “Temporary Disability Insurance andLabor Supply: Evidence from a Natural Experiment.” Scandinavian Journal of Economics115 (2):485–507.
Picone, G. R., F. Slone, S. -Y. Chou, and D. Taylor. 2003. “Does Higher Hospital Cost ImplyHigher Quality of Care?” The Review of Economics and Statistics 85 (1):51–62.
616 N. Datta Gupta et al.
Brought to you by | Aarhus University Library / StatsbiblioteketAuthenticated
Download Date | 2/26/18 11:39 AM

Rendall, M. 2010. “Brain Versus Brawn: The Realization of Women’s Comparative Advantage.”Working paper no.491, Institute for empirical research in Economics, University of Zurich.
Rosenzweig, M. R., and T. P. Schultz. 1983. “Estimating a Household Production Function:Heterogeneity, the Demand for Health Inputs and Their Effects on Birth Weight.”The Journal of Political Economy 91 (5):723–46.
Ruhm, C. J. 1990. “Bridge Jobs and Partial Retirement.” Journal of Labor Economics 8 (4):482–501.
Wilson, C. M., and A. J. Oswald. 2005. “How Does Marriage Affect Physical and PsychologicalHealth? A Survey of the Longitudinal Evidence.” The War-Wick Economics Research PaperSeries (TWERPS) 728, Department of Economics, University of Warwick.
Impact of Education and Occupation on Work Incapacity 617
Brought to you by | Aarhus University Library / StatsbiblioteketAuthenticated
Download Date | 2/26/18 11:39 AM