municipal building and police department 54 …muni+and+police...municipal building and police...
TRANSCRIPT
June 28, 2010
Local Government Energy Program
Energy Audit Final Report
Borough of Chatham Municipal Building and Police Department
54 Fairmount Avenue Chatham, NJ 07928
Project Number: LGEA64
Steven Winter Associates, Inc. 293 Route 18, Suite 330 Telephone (866) 676-1972 Building Systems Consultants East Brunswick, NJ 08816 Facsimile (203) 852-0741 www.swinter.com
Steven Winter Associates, Inc. - LGEA Final Report Chatham-Municipal Building and Police Department Page 2/57
TABLE OF CONTENTS
EXECUTIVE SUMMARY ................................................................................................................. 3
INTRODUCTION ............................................................................................................................. 5
HISTORICAL ENERGY CONSUMPTION ........................................................................................ 6
EXISTING FACILITY AND SYSTEMS DESCRIPTION .................................................................. 12
RENEWABLE AND DISTRIBUTED ENERGY MEASURES .......................................................... 23
PROPOSED ENERGY CONSERVATION MEASURES ................................................................ 25
PROPOSED FURTHER RECOMMENDATIONS ........................................................................... 28
APPENDIX A: EQUIPMENT LIST ................................................................................................. 38
APPENDIX B: LIGHTING STUDY ................................................................................................. 41
APPENDIX C: THIRD PARTY ENERGY SUPPLIERS .................................................................. 45
APPENDIX D: GLOSSARY AND METHOD OF CALCULATIONS ............................................... 48
APPENDIX E: STATEMENT OF ENERGY PERFORMANCE FROM ENERGY STAR® ............... 52
APPENDIX F: INCENTIVE PROGRAMS ....................................................................................... 53
APPENDIX G: ENERGY CONSERVATION MEASURES ............................................................. 55
APPENDIX H: METHOD OF ANALYSIS ....................................................................................... 57
Steven Winter Associates, Inc. - LGEA Final Report Chatham-Municipal Building and Police Department Page 3/57
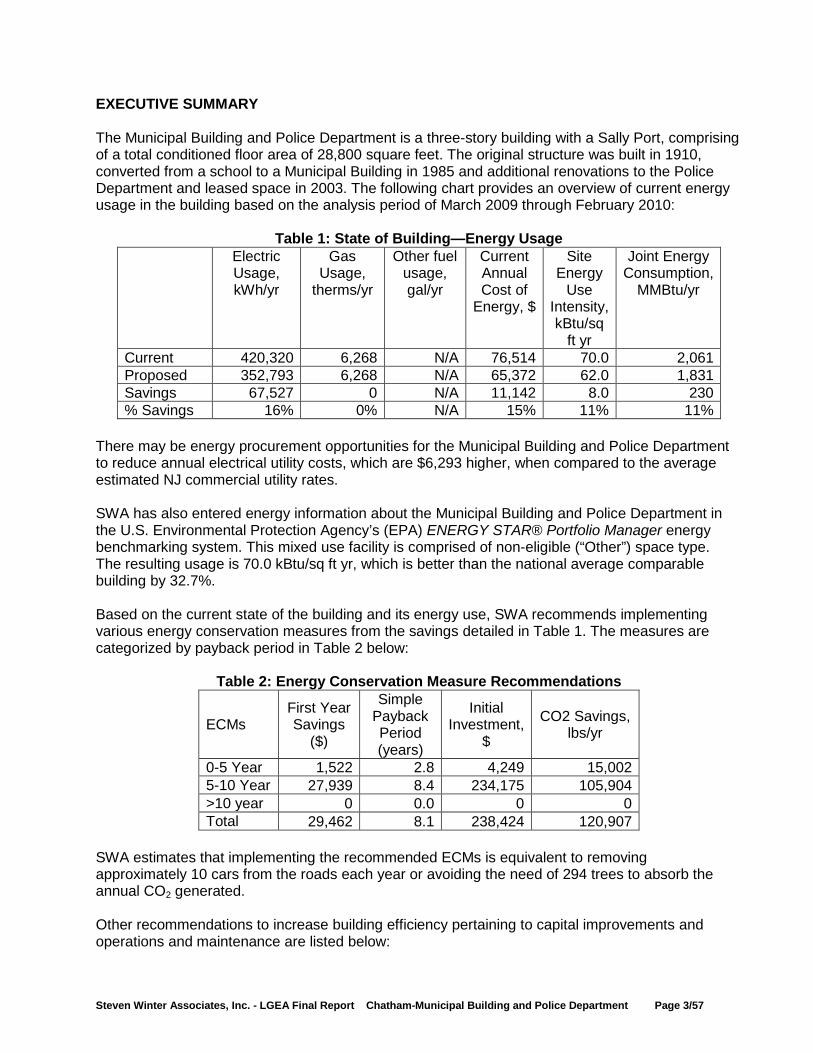
EXECUTIVE SUMMARY The Municipal Building and Police Department is a three-story building with a Sally Port, comprising of a total conditioned floor area of 28,800 square feet. The original structure was built in 1910, converted from a school to a Municipal Building in 1985 and additional renovations to the Police Department and leased space in 2003. The following chart provides an overview of current energy usage in the building based on the analysis period of March 2009 through February 2010:
Table 1: State of Building—Energy Usage Electric
Usage, kWh/yr
Gas Usage,
therms/yr
Other fuel usage, gal/yr
Current Annual Cost of
Energy, $
Site Energy
Use Intensity, kBtu/sq
ft yr
Joint Energy Consumption,
MMBtu/yr
Current 420,320 6,268 N/A 76,514 70.0 2,061 Proposed 352,793 6,268 N/A 65,372 62.0 1,831 Savings 67,527 0 N/A 11,142 8.0 230 % Savings 16% 0% N/A 15% 11% 11%
There may be energy procurement opportunities for the Municipal Building and Police Department to reduce annual electrical utility costs, which are $6,293 higher, when compared to the average estimated NJ commercial utility rates. SWA has also entered energy information about the Municipal Building and Police Department in the U.S. Environmental Protection Agency’s (EPA) ENERGY STAR® Portfolio Manager energy benchmarking system. This mixed use facility is comprised of non-eligible (“Other”) space type. The resulting usage is 70.0 kBtu/sq ft yr, which is better than the national average comparable building by 32.7%. Based on the current state of the building and its energy use, SWA recommends implementing various energy conservation measures from the savings detailed in Table 1. The measures are categorized by payback period in Table 2 below:
Table 2: Energy Conservation Measure Recommendations
ECMs First Year Savings
($)
Simple Payback Period (years)
Initial Investment,
$
CO2 Savings, lbs/yr
0-5 Year 1,522 2.8 4,249 15,002 5-10 Year 27,939 8.4 234,175 105,904 >10 year 0 0.0 0 0 Total 29,462 8.1 238,424 120,907
SWA estimates that implementing the recommended ECMs is equivalent to removing approximately 10 cars from the roads each year or avoiding the need of 294 trees to absorb the annual CO2 generated. Other recommendations to increase building efficiency pertaining to capital improvements and operations and maintenance are listed below:
Steven Winter Associates, Inc. - LGEA Final Report Chatham-Municipal Building and Police Department Page 4/57
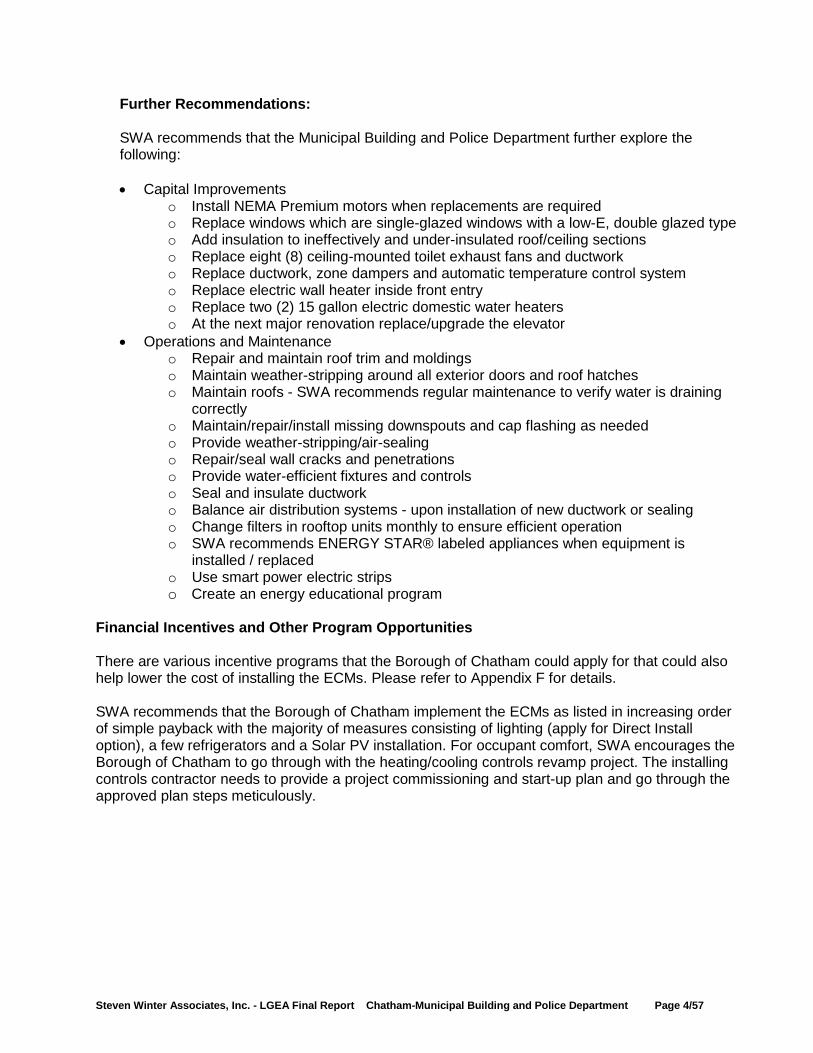
Further Recommendations: SWA recommends that the Municipal Building and Police Department further explore the following:
• Capital Improvements
o Install NEMA Premium motors when replacements are required o Replace windows which are single-glazed windows with a low-E, double glazed type o Add insulation to ineffectively and under-insulated roof/ceiling sections o Replace eight (8) ceiling-mounted toilet exhaust fans and ductwork o Replace ductwork, zone dampers and automatic temperature control system o Replace electric wall heater inside front entry o Replace two (2) 15 gallon electric domestic water heaters o At the next major renovation replace/upgrade the elevator
• Operations and Maintenance o Repair and maintain roof trim and moldings o Maintain weather-stripping around all exterior doors and roof hatches o Maintain roofs - SWA recommends regular maintenance to verify water is draining
correctly o Maintain/repair/install missing downspouts and cap flashing as needed o Provide weather-stripping/air-sealing o Repair/seal wall cracks and penetrations o Provide water-efficient fixtures and controls o Seal and insulate ductwork o Balance air distribution systems - upon installation of new ductwork or sealing o Change filters in rooftop units monthly to ensure efficient operation o SWA recommends ENERGY STAR® labeled appliances when equipment is
installed / replaced o Use smart power electric strips o Create an energy educational program
Financial Incentives and Other Program Opportunities There are various incentive programs that the Borough of Chatham could apply for that could also help lower the cost of installing the ECMs. Please refer to Appendix F for details. SWA recommends that the Borough of Chatham implement the ECMs as listed in increasing order of simple payback with the majority of measures consisting of lighting (apply for Direct Install option), a few refrigerators and a Solar PV installation. For occupant comfort, SWA encourages the Borough of Chatham to go through with the heating/cooling controls revamp project. The installing controls contractor needs to provide a project commissioning and start-up plan and go through the approved plan steps meticulously.
Steven Winter Associates, Inc. - LGEA Final Report Chatham-Municipal Building and Police Department Page 5/57
INTRODUCTION Launched in 2008, the Local Government Energy Audit (LGEA) Program provides subsidized energy audits for municipal and local government-owned facilities, including offices, courtrooms, town halls, police and fire stations, sanitation buildings, transportation structures, schools and community centers. The Program will subsidize up to 100% of the cost of the audit. The Board of Public Utilities (BPUs) Office of Clean Energy has assigned TRC Energy Services to administer the Program. Steven Winter Associates, Inc. (SWA) is a 38-year-old architectural/engineering research and consulting firm, with specialized expertise in green technologies and procedures that improve the safety, performance, and cost effectiveness of buildings. SWA has a long-standing commitment to creating energy-efficient, cost-saving and resource-conserving buildings. As consultants on the built environment, SWA works closely with architects, developers, builders, and local, state, and federal agencies to develop and apply sustainable, ‘whole building’ strategies in a wide variety of building types: commercial, residential, educational and institutional. SWA performed an energy audit and assessment for the Municipal Building and Police Department at 54 Fairmount Avenue, Chatham, NJ. The process of the audit included facility visits on April 7, 12 and 22, 2010, benchmarking and energy bills analysis, assessment of existing conditions, energy modeling, energy conservation measures and other recommendations for improvements. The scope of work includes providing a summary of current building conditions, current operating costs, potential savings, and investment costs to achieve these savings. The facility description includes energy usage, occupancy profiles and current building systems along with a detailed inventory of building energy systems, recommendations for improvement and recommendations for energy purchasing and procurement strategies. The goal of this Local Government Energy Audit is to provide sufficient information to the Borough of Chatham to make decisions regarding the implementation of the most appropriate and most cost-effective energy conservation measures for the Municipal Building and Police Department.
Steven Winter Associates, Inc. - LGEA Final Report Chatham-Municipal Building and Police Department Page 6/57
HISTORICAL ENERGY CONSUMPTION
Energy usage, load profile and cost analysis
SWA reviewed utility bills from March 2008 through February 2010 that were received from the utility companies supplying the Municipal Building and Police Department with electric and natural gas. A 12 month period of analysis from March 2009 through February 2010 was used for all calculations and for purposes of benchmarking the building.
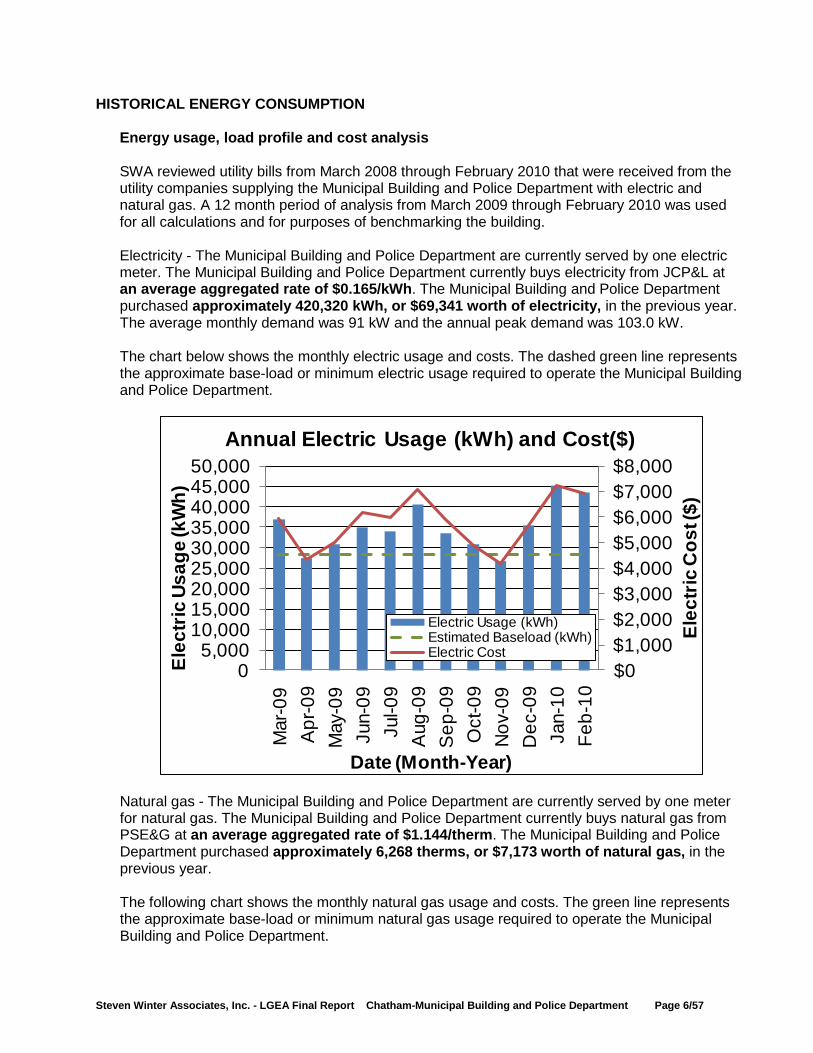
Electricity - The Municipal Building and Police Department are currently served by one electric meter. The Municipal Building and Police Department currently buys electricity from JCP&L at an average aggregated rate of $0.165/kWh. The Municipal Building and Police Department purchased approximately 420,320 kWh, or $69,341 worth of electricity, in the previous year. The average monthly demand was 91 kW and the annual peak demand was 103.0 kW. The chart below shows the monthly electric usage and costs. The dashed green line represents the approximate base-load or minimum electric usage required to operate the Municipal Building and Police Department.
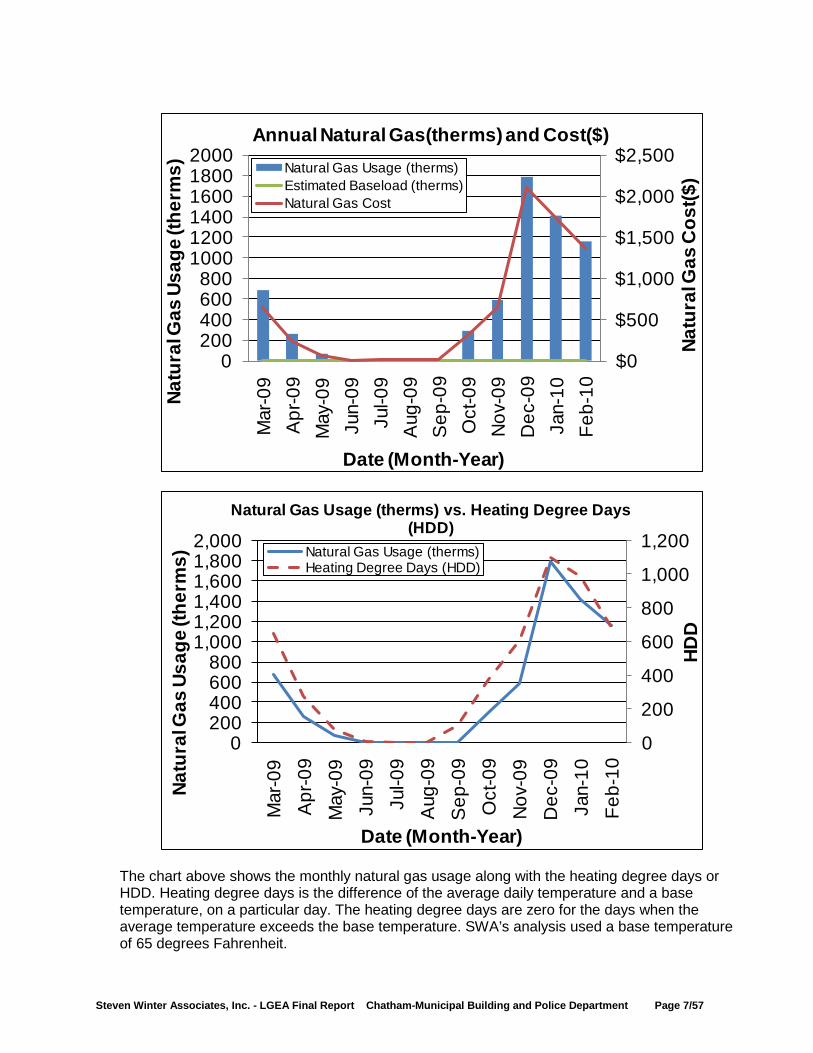
Natural gas - The Municipal Building and Police Department are currently served by one meter for natural gas. The Municipal Building and Police Department currently buys natural gas from PSE&G at an average aggregated rate of $1.144/therm. The Municipal Building and Police Department purchased approximately 6,268 therms, or $7,173 worth of natural gas, in the previous year. The following chart shows the monthly natural gas usage and costs. The green line represents the approximate base-load or minimum natural gas usage required to operate the Municipal Building and Police Department.
$0 $1,000 $2,000 $3,000 $4,000 $5,000 $6,000 $7,000 $8,000
05,000
10,00015,00020,00025,00030,00035,00040,00045,00050,000
Mar
-09
Apr
-09
May
-09
Jun-
09Ju
l -09
Aug
-09
Sep
-09
Oct
-09
Nov
-09
Dec
-09
Jan-
10Fe
b-10
Elec
tric
Cos
t ($)
Elec
tric
Usa
ge (k
Wh)
Date (Month-Year)
Annual Electric Usage (kWh) and Cost($)
Electric Usage (kWh)Estimated Baseload (kWh)Electric Cost
Steven Winter Associates, Inc. - LGEA Final Report Chatham-Municipal Building and Police Department Page 7/57
The chart above shows the monthly natural gas usage along with the heating degree days or HDD. Heating degree days is the difference of the average daily temperature and a base temperature, on a particular day. The heating degree days are zero for the days when the average temperature exceeds the base temperature. SWA’s analysis used a base temperature of 65 degrees Fahrenheit.
$0
$500
$1,000
$1,500
$2,000
$2,500
0200400600800
100012001400160018002000
Mar
-09
Apr
-09
May
-09
Jun-
09Ju
l-09
Aug
-09
Sep
-09
Oct
-09
Nov
-09
Dec
-09
Jan-
10Fe
b-10
Natu
ral G
as C
ost($
)
Natu
ral G
as U
sage
(the
rms)
Date (Month-Year)
Annual Natural Gas(therms) and Cost($)Natural Gas Usage (therms)Estimated Baseload (therms)Natural Gas Cost
0
200
400
600
800
1,000
1,200
0200400600800
1,0001,2001,4001,6001,8002,000
Mar
-09
Apr
-09
May
-09
Jun-
09Ju
l-09
Aug
-09
Sep
-09
Oct
-09
Nov
-09
Dec
-09
Jan-
10Fe
b-10
HDD
Natu
ral G
as U
sage
(the
rms)
Date (Month-Year)
Natural Gas Usage (therms) vs. Heating Degree Days (HDD)
Natural Gas Usage (therms)Heating Degree Days (HDD)
Steven Winter Associates, Inc. - LGEA Final Report Chatham-Municipal Building and Police Department Page 8/57
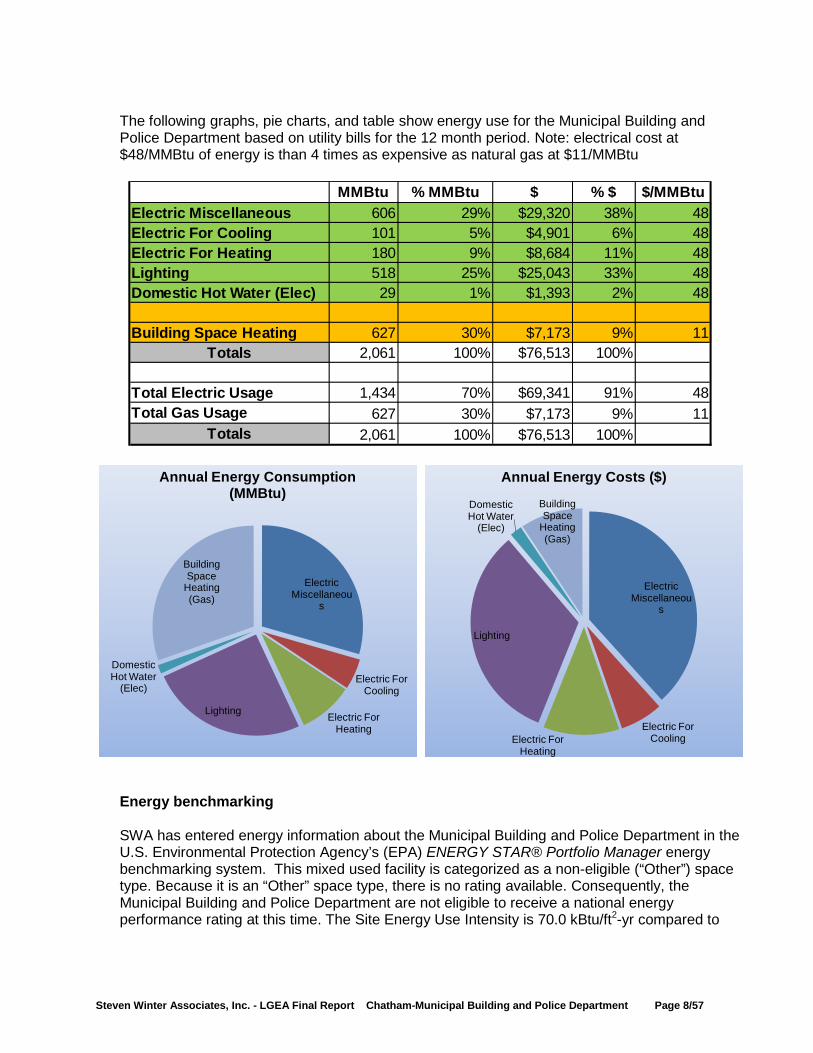
The following graphs, pie charts, and table show energy use for the Municipal Building and Police Department based on utility bills for the 12 month period. Note: electrical cost at $48/MMBtu of energy is than 4 times as expensive as natural gas at $11/MMBtu
Energy benchmarking
SWA has entered energy information about the Municipal Building and Police Department in the U.S. Environmental Protection Agency’s (EPA) ENERGY STAR® Portfolio Manager energy benchmarking system. This mixed used facility is categorized as a non-eligible (“Other”) space type. Because it is an “Other” space type, there is no rating available. Consequently, the Municipal Building and Police Department are not eligible to receive a national energy performance rating at this time. The Site Energy Use Intensity is 70.0 kBtu/ft2-yr compared to
MMBtu % MMBtu $ % $ $/MMBtu606 29% $29,320 38% 48101 5% $4,901 6% 48180 9% $8,684 11% 48518 25% $25,043 33% 4829 1% $1,393 2% 48
627 30% $7,173 9% 112,061 100% $76,513 100%
1,434 70% $69,341 91% 48627 30% $7,173 9% 11
2,061 100% $76,513 100%
Electric For HeatingLightingDomestic Hot Water (Elec)
Building Space Heating Totals
Total Electric UsageTotal Gas Usage
Totals
Electric For CoolingElectric Miscellaneous
Electric Miscellaneou
s
Electric For Cooling
Electric For Heating
Lighting
Domestic Hot Water
(Elec)
Building Space
Heating (Gas)
Annual Energy Consumption (MMBtu)
Electric Miscellaneou
s
Electric For CoolingElectric For
Heating
Lighting
Domestic Hot Water
(Elec)
Building Space
Heating (Gas)
Annual Energy Costs ($)
Steven Winter Associates, Inc. - LGEA Final Report Chatham-Municipal Building and Police Department Page 9/57
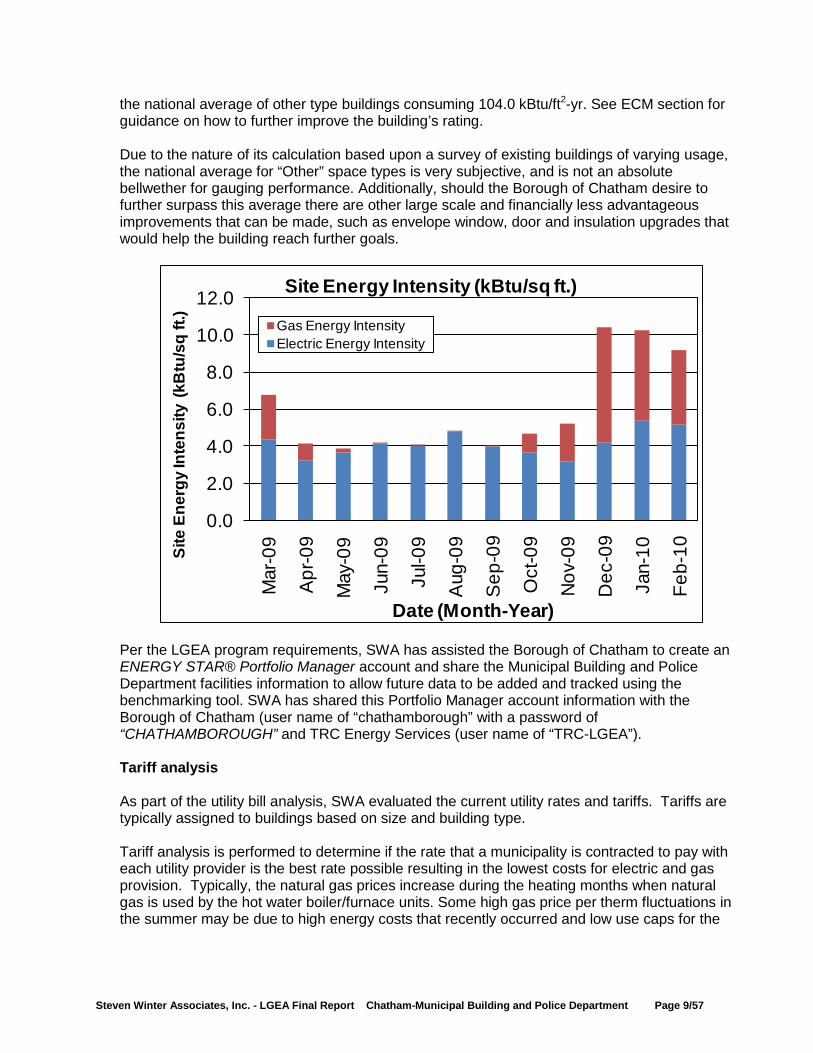
the national average of other type buildings consuming 104.0 kBtu/ft2-yr. See ECM section for guidance on how to further improve the building’s rating. Due to the nature of its calculation based upon a survey of existing buildings of varying usage, the national average for “Other” space types is very subjective, and is not an absolute bellwether for gauging performance. Additionally, should the Borough of Chatham desire to further surpass this average there are other large scale and financially less advantageous improvements that can be made, such as envelope window, door and insulation upgrades that would help the building reach further goals.
Per the LGEA program requirements, SWA has assisted the Borough of Chatham to create an ENERGY STAR® Portfolio Manager account and share the Municipal Building and Police Department facilities information to allow future data to be added and tracked using the benchmarking tool. SWA has shared this Portfolio Manager account information with the Borough of Chatham (user name of “chathamborough” with a password of “CHATHAMBOROUGH” and TRC Energy Services (user name of “TRC-LGEA”). Tariff analysis
As part of the utility bill analysis, SWA evaluated the current utility rates and tariffs. Tariffs are typically assigned to buildings based on size and building type. Tariff analysis is performed to determine if the rate that a municipality is contracted to pay with each utility provider is the best rate possible resulting in the lowest costs for electric and gas provision. Typically, the natural gas prices increase during the heating months when natural gas is used by the hot water boiler/furnace units. Some high gas price per therm fluctuations in the summer may be due to high energy costs that recently occurred and low use caps for the
0.0
2.0
4.0
6.0
8.0
10.0
12.0M
ar-0
9
Apr
-09
May
-09
Jun-
09
Jul-0
9
Aug
-09
Sep
-09
Oct
-09
Nov
-09
Dec
-09
Jan-
10
Feb-
10Site
Ene
rgy
Inte
nsity
(kB
tu/s
q ft.
)
Date (Month-Year)
Site Energy Intensity (kBtu/sq ft.)
Gas Energy IntensityElectric Energy Intensity
Steven Winter Associates, Inc. - LGEA Final Report Chatham-Municipal Building and Police Department Page 10/57
non-heating months. Typically, electricity prices also increase during the cooling months when electricity is used by the HVAC condensing equipment. The supplier charges a market-rate price based on use, and the billing does not break down demand costs for all periods because usage and demand are included in the rate. Currently, the Borough of Chatham is paying a general service rate for natural gas. Demand is not broken out in the bill. Thus the building pays for fixed costs such as meter reading charges during the summer months. The building is direct metered and currently purchases electricity at a general service rate for usage with an additional charge for electrical demand factored into each monthly bill. The general service rate charges a market-rate prices based on usage and demand. Demand prices are reflected in the utility bills and can be verified by observing the price fluctuations throughout the year. Energy Procurement strategies
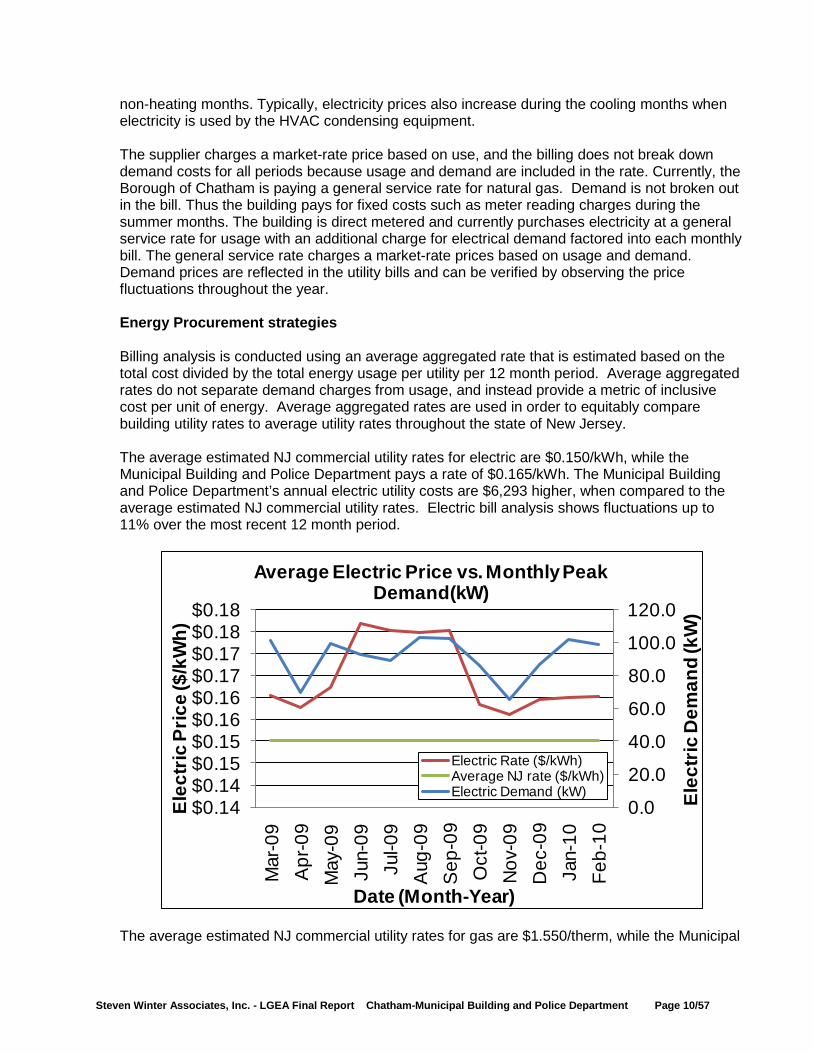
Billing analysis is conducted using an average aggregated rate that is estimated based on the total cost divided by the total energy usage per utility per 12 month period. Average aggregated rates do not separate demand charges from usage, and instead provide a metric of inclusive cost per unit of energy. Average aggregated rates are used in order to equitably compare building utility rates to average utility rates throughout the state of New Jersey. The average estimated NJ commercial utility rates for electric are $0.150/kWh, while the Municipal Building and Police Department pays a rate of $0.165/kWh. The Municipal Building and Police Department’s annual electric utility costs are $6,293 higher, when compared to the average estimated NJ commercial utility rates. Electric bill analysis shows fluctuations up to 11% over the most recent 12 month period.
The average estimated NJ commercial utility rates for gas are $1.550/therm, while the Municipal
0.0
20.0
40.0
60.0
80.0
100.0
120.0
$0.14$0.14$0.15$0.15$0.16$0.16$0.17$0.17$0.18$0.18
Mar
-09
Apr
-09
May
-09
Jun-
09Ju
l -09
Aug
-09
Sep
-09
Oct
-09
Nov
-09
Dec
-09
Jan-
10Fe
b-10
Elec
tric
Dem
and
(kW
)
Elec
tric
Pric
e ($
/kW
h)
Date (Month-Year)
Average Electric Price vs. Monthly Peak Demand(kW)
Electric Rate ($/kWh)Average NJ rate ($/kWh)Electric Demand (kW)
Steven Winter Associates, Inc. - LGEA Final Report Chatham-Municipal Building and Police Department Page 11/57
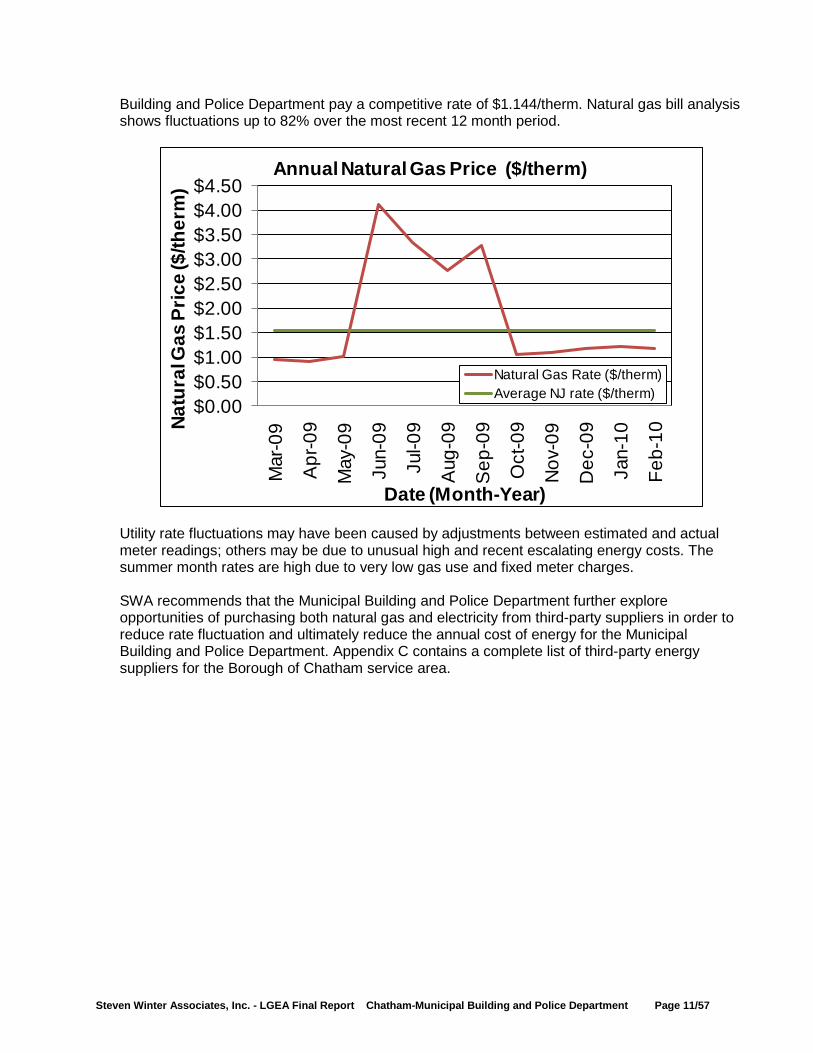
Building and Police Department pay a competitive rate of $1.144/therm. Natural gas bill analysis shows fluctuations up to 82% over the most recent 12 month period.
Utility rate fluctuations may have been caused by adjustments between estimated and actual meter readings; others may be due to unusual high and recent escalating energy costs. The summer month rates are high due to very low gas use and fixed meter charges. SWA recommends that the Municipal Building and Police Department further explore opportunities of purchasing both natural gas and electricity from third-party suppliers in order to reduce rate fluctuation and ultimately reduce the annual cost of energy for the Municipal Building and Police Department. Appendix C contains a complete list of third-party energy suppliers for the Borough of Chatham service area.
$0.00$0.50$1.00$1.50$2.00$2.50$3.00$3.50$4.00$4.50
Mar
-09
Apr
-09
May
-09
Jun-
09
Jul-0
9
Aug
-09
Sep
-09
Oct
-09
Nov
-09
Dec
-09
Jan-
10
Feb-
10
Natu
ral G
as P
rice
($/th
erm
)
Date (Month-Year)
Annual Natural Gas Price ($/therm)
Natural Gas Rate ($/therm)Average NJ rate ($/therm)
Steven Winter Associates, Inc. - LGEA Final Report Chatham-Municipal Building and Police Department Page 12/57
EXISTING FACILITY AND SYSTEMS DESCRIPTION
This section gives an overview of the current state of the facility and systems. Please refer to the Proposed Further Recommendations section for recommendations for improvement. Based on visits from SWA on April 7, 12 and 22, 2010, the following data was collected and analyzed.
Building Characteristics
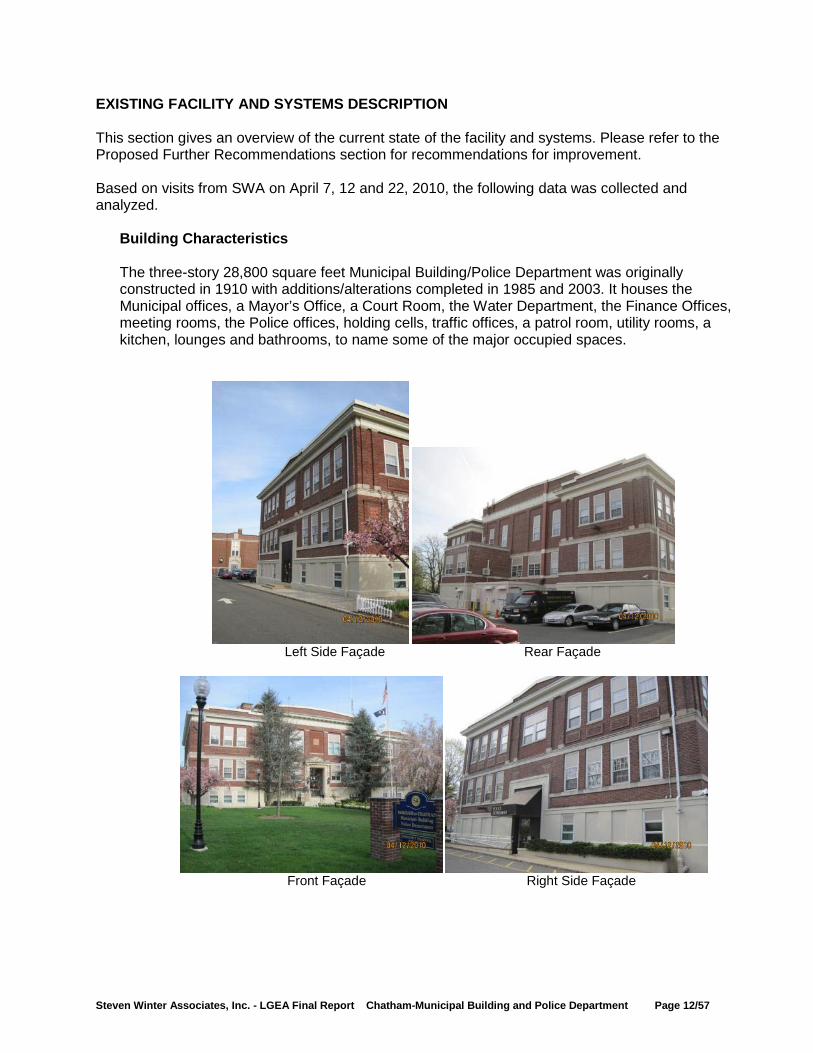
The three-story 28,800 square feet Municipal Building/Police Department was originally constructed in 1910 with additions/alterations completed in 1985 and 2003. It houses the Municipal offices, a Mayor’s Office, a Court Room, the Water Department, the Finance Offices, meeting rooms, the Police offices, holding cells, traffic offices, a patrol room, utility rooms, a kitchen, lounges and bathrooms, to name some of the major occupied spaces.
Left Side Façade Rear Façade
Front Façade Right Side Façade
Steven Winter Associates, Inc. - LGEA Final Report Chatham-Municipal Building and Police Department Page 13/57
Building Occupancy Profiles
Its occupancy is approximately 30 Municipal employees daily from 8:00 am to 4:00 pm Monday through Friday, 20 to 25 Police Department employees daily from 7:00 am to 7:00 pm Monday through Friday, with 7 to 10 employees on night shift and weekends. The Community Personnel services tenant also has 8 to 10 employees working from 8:00 am to 5:00 pm Monday through Friday.
Building Envelope
Due to unfavorable weather conditions (min. 18 deg. F delta-T in/outside and no/low wind), no exterior envelope infrared (IR) images were taken during the field audit.
Exterior Walls
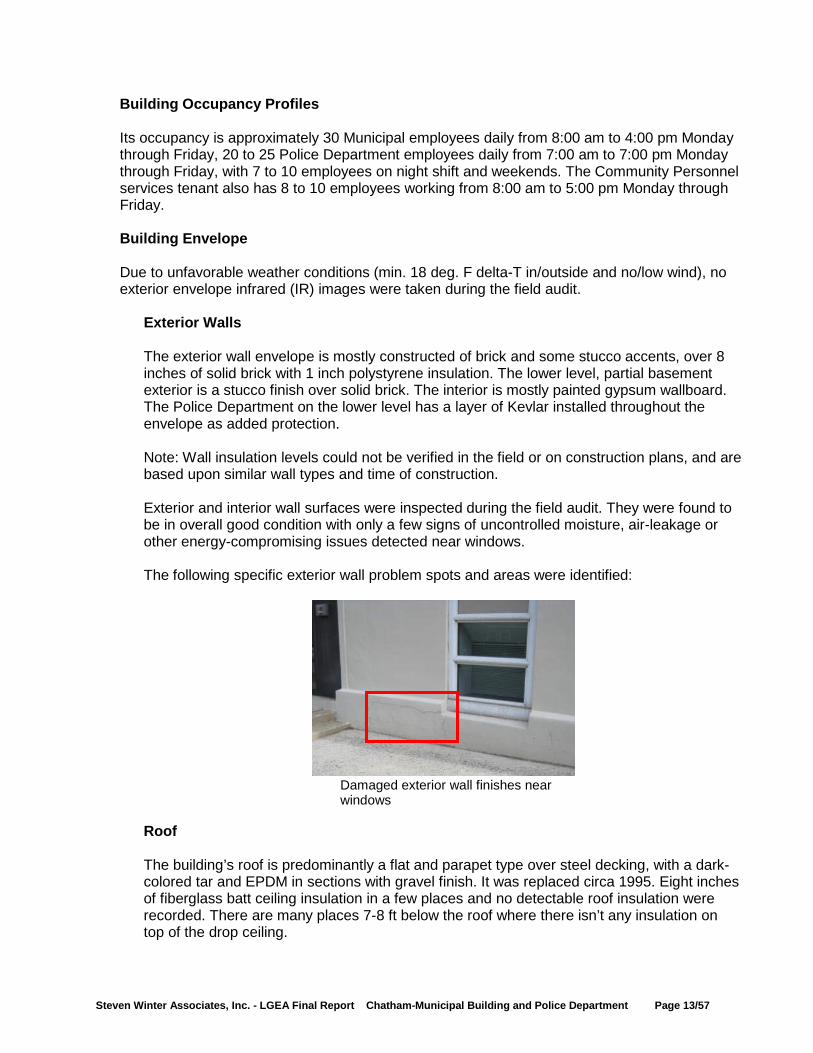
The exterior wall envelope is mostly constructed of brick and some stucco accents, over 8 inches of solid brick with 1 inch polystyrene insulation. The lower level, partial basement exterior is a stucco finish over solid brick. The interior is mostly painted gypsum wallboard. The Police Department on the lower level has a layer of Kevlar installed throughout the envelope as added protection. Note: Wall insulation levels could not be verified in the field or on construction plans, and are based upon similar wall types and time of construction. Exterior and interior wall surfaces were inspected during the field audit. They were found to be in overall good condition with only a few signs of uncontrolled moisture, air-leakage or other energy-compromising issues detected near windows. The following specific exterior wall problem spots and areas were identified:
Roof
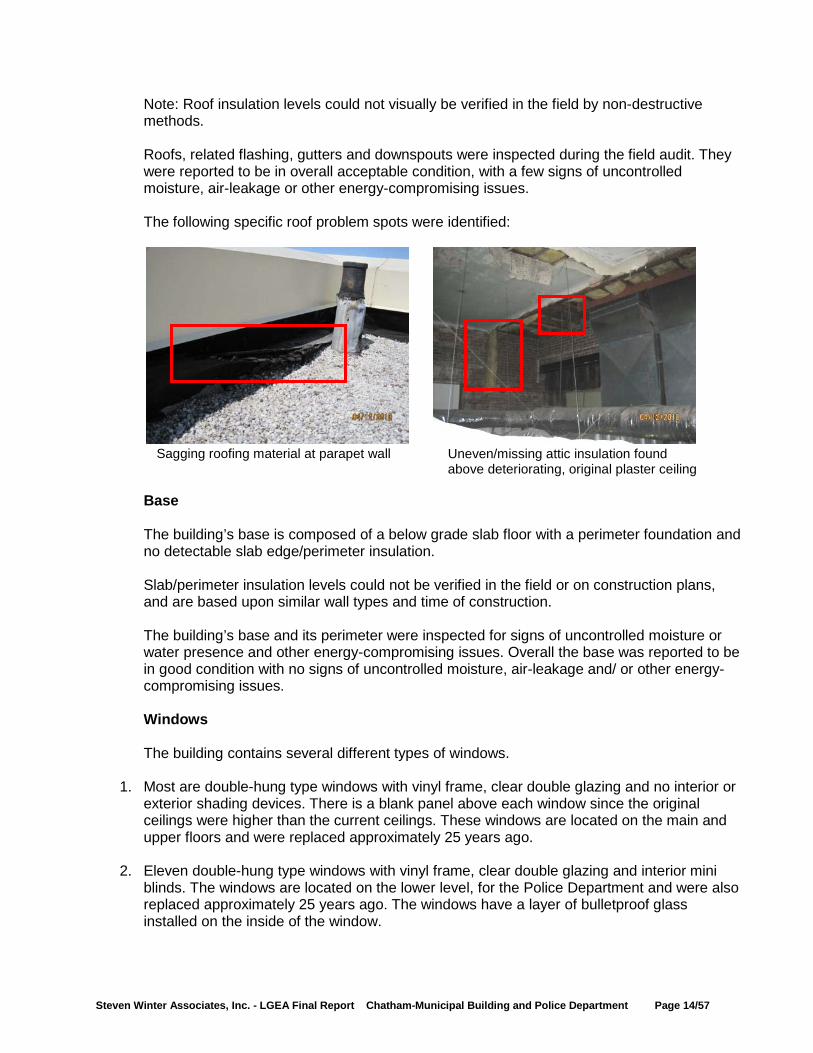
The building’s roof is predominantly a flat and parapet type over steel decking, with a dark-colored tar and EPDM in sections with gravel finish. It was replaced circa 1995. Eight inches of fiberglass batt ceiling insulation in a few places and no detectable roof insulation were recorded. There are many places 7-8 ft below the roof where there isn’t any insulation on top of the drop ceiling.
Damaged exterior wall finishes near windows
Steven Winter Associates, Inc. - LGEA Final Report Chatham-Municipal Building and Police Department Page 14/57
Note: Roof insulation levels could not visually be verified in the field by non-destructive methods. Roofs, related flashing, gutters and downspouts were inspected during the field audit. They were reported to be in overall acceptable condition, with a few signs of uncontrolled moisture, air-leakage or other energy-compromising issues. The following specific roof problem spots were identified:
Base The building’s base is composed of a below grade slab floor with a perimeter foundation and no detectable slab edge/perimeter insulation. Slab/perimeter insulation levels could not be verified in the field or on construction plans, and are based upon similar wall types and time of construction. The building’s base and its perimeter were inspected for signs of uncontrolled moisture or water presence and other energy-compromising issues. Overall the base was reported to be in good condition with no signs of uncontrolled moisture, air-leakage and/ or other energy-compromising issues. Windows The building contains several different types of windows.
1. Most are double-hung type windows with vinyl frame, clear double glazing and no interior or exterior shading devices. There is a blank panel above each window since the original ceilings were higher than the current ceilings. These windows are located on the main and upper floors and were replaced approximately 25 years ago.
2. Eleven double-hung type windows with vinyl frame, clear double glazing and interior mini blinds. The windows are located on the lower level, for the Police Department and were also replaced approximately 25 years ago. The windows have a layer of bulletproof glass installed on the inside of the window.
Sagging roofing material at parapet wall Uneven/missing attic insulation found above deteriorating, original plaster ceiling
Steven Winter Associates, Inc. - LGEA Final Report Chatham-Municipal Building and Police Department Page 15/57
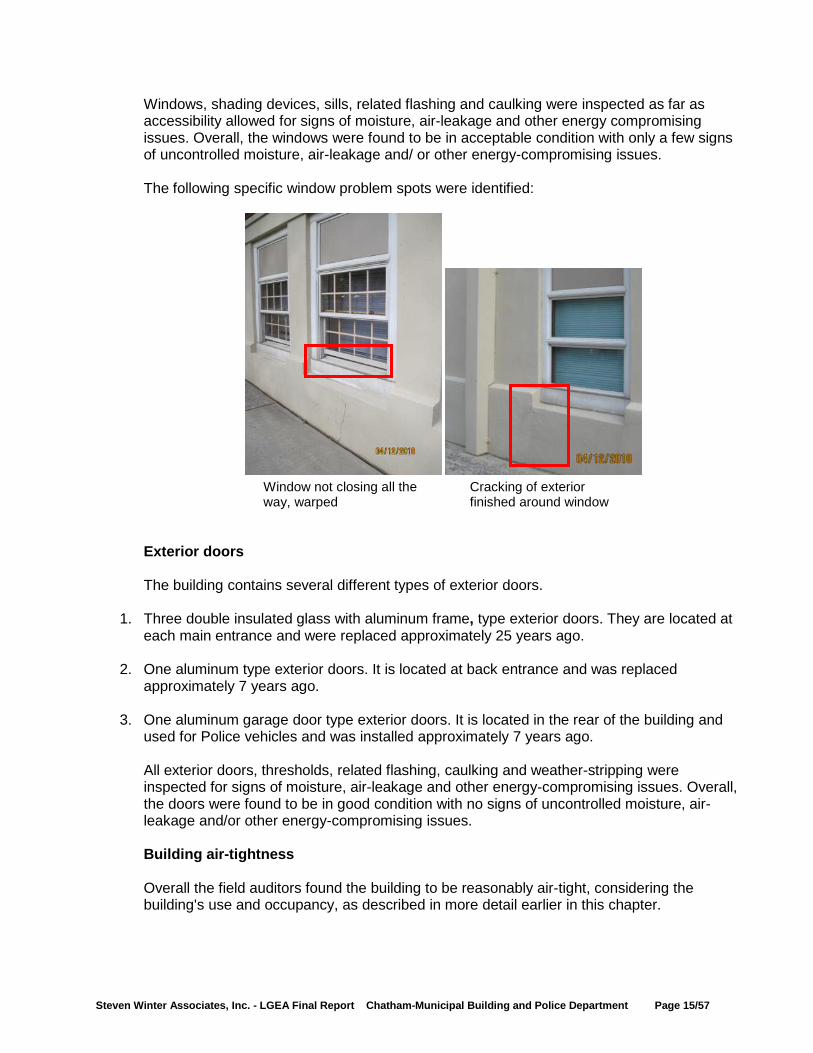
Windows, shading devices, sills, related flashing and caulking were inspected as far as accessibility allowed for signs of moisture, air-leakage and other energy compromising issues. Overall, the windows were found to be in acceptable condition with only a few signs of uncontrolled moisture, air-leakage and/ or other energy-compromising issues. The following specific window problem spots were identified:
Exterior doors The building contains several different types of exterior doors.
1. Three double insulated glass with aluminum frame, type exterior doors. They are located at each main entrance and were replaced approximately 25 years ago.
2. One aluminum type exterior doors. It is located at back entrance and was replaced approximately 7 years ago.
3. One aluminum garage door type exterior doors. It is located in the rear of the building and used for Police vehicles and was installed approximately 7 years ago. All exterior doors, thresholds, related flashing, caulking and weather-stripping were inspected for signs of moisture, air-leakage and other energy-compromising issues. Overall, the doors were found to be in good condition with no signs of uncontrolled moisture, air-leakage and/or other energy-compromising issues. Building air-tightness Overall the field auditors found the building to be reasonably air-tight, considering the building's use and occupancy, as described in more detail earlier in this chapter.
Window not closing all the way, warped
Cracking of exterior finished around window
Steven Winter Associates, Inc. - LGEA Final Report Chatham-Municipal Building and Police Department Page 16/57
The air tightness of buildings helps maximize all other implemented energy measures and investments, and minimizes potentially costly long-term maintenance, repair and replacement expenses.
Mechanical Systems
Heating Ventilation Air Conditioning The building is primarily conditioned by six (6) gas-fired packaged rooftop HVAC units. The distribution ductwork contains zone dampers tied to local thermostats for temperature control of multiple zones per floor. In general, the thermostats are mostly not operational or functioning poorly, leading to poor temperature control throughout the building. In particular, complaints were received about the temperature control in the Building Department, where the thermostat does not seem to bring on cooling. In addition, several breaches were noted in the ductwork, causing conditioned air to exit the ductwork into the ceiling plenum. The Billing Office was noted to receive especially low airflow. The Borough currently is receiving proposals for the replacement of the ductwork and temperature control systems.
Equipment
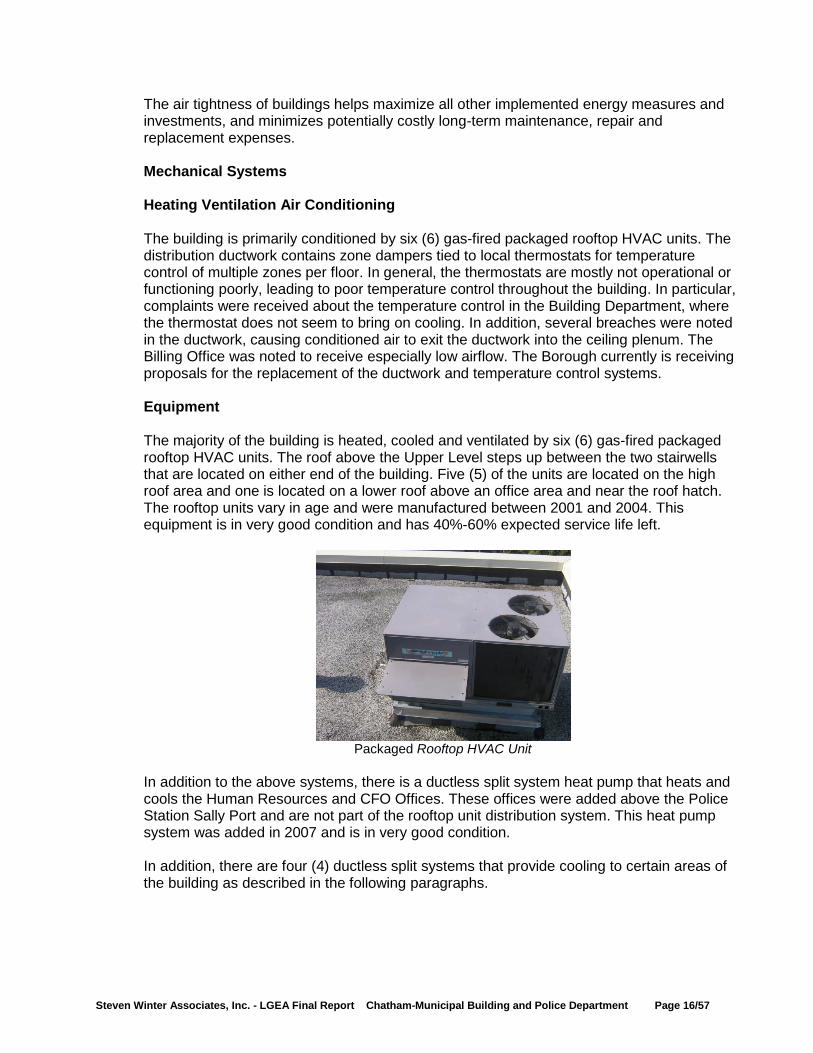
The majority of the building is heated, cooled and ventilated by six (6) gas-fired packaged rooftop HVAC units. The roof above the Upper Level steps up between the two stairwells that are located on either end of the building. Five (5) of the units are located on the high roof area and one is located on a lower roof above an office area and near the roof hatch. The rooftop units vary in age and were manufactured between 2001 and 2004. This equipment is in very good condition and has 40%-60% expected service life left.
Packaged Rooftop HVAC Unit
In addition to the above systems, there is a ductless split system heat pump that heats and cools the Human Resources and CFO Offices. These offices were added above the Police Station Sally Port and are not part of the rooftop unit distribution system. This heat pump system was added in 2007 and is in very good condition. In addition, there are four (4) ductless split systems that provide cooling to certain areas of the building as described in the following paragraphs.
Steven Winter Associates, Inc. - LGEA Final Report Chatham-Municipal Building and Police Department Page 17/57
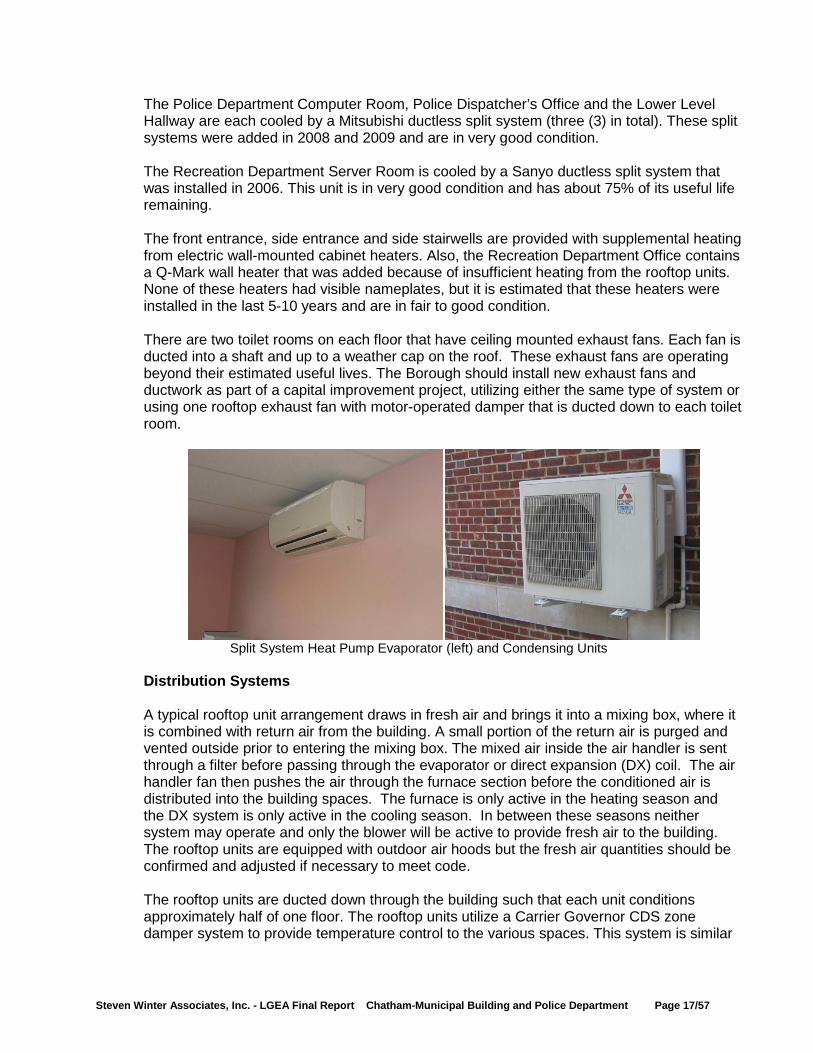
The Police Department Computer Room, Police Dispatcher’s Office and the Lower Level Hallway are each cooled by a Mitsubishi ductless split system (three (3) in total). These split systems were added in 2008 and 2009 and are in very good condition. The Recreation Department Server Room is cooled by a Sanyo ductless split system that was installed in 2006. This unit is in very good condition and has about 75% of its useful life remaining. The front entrance, side entrance and side stairwells are provided with supplemental heating from electric wall-mounted cabinet heaters. Also, the Recreation Department Office contains a Q-Mark wall heater that was added because of insufficient heating from the rooftop units. None of these heaters had visible nameplates, but it is estimated that these heaters were installed in the last 5-10 years and are in fair to good condition. There are two toilet rooms on each floor that have ceiling mounted exhaust fans. Each fan is ducted into a shaft and up to a weather cap on the roof. These exhaust fans are operating beyond their estimated useful lives. The Borough should install new exhaust fans and ductwork as part of a capital improvement project, utilizing either the same type of system or using one rooftop exhaust fan with motor-operated damper that is ducted down to each toilet room.
Split System Heat Pump Evaporator (left) and Condensing Units
Distribution Systems A typical rooftop unit arrangement draws in fresh air and brings it into a mixing box, where it is combined with return air from the building. A small portion of the return air is purged and vented outside prior to entering the mixing box. The mixed air inside the air handler is sent through a filter before passing through the evaporator or direct expansion (DX) coil. The air handler fan then pushes the air through the furnace section before the conditioned air is distributed into the building spaces. The furnace is only active in the heating season and the DX system is only active in the cooling season. In between these seasons neither system may operate and only the blower will be active to provide fresh air to the building. The rooftop units are equipped with outdoor air hoods but the fresh air quantities should be confirmed and adjusted if necessary to meet code. The rooftop units are ducted down through the building such that each unit conditions approximately half of one floor. The rooftop units utilize a Carrier Governor CDS zone damper system to provide temperature control to the various spaces. This system is similar
Steven Winter Associates, Inc. - LGEA Final Report Chatham-Municipal Building and Police Department Page 18/57
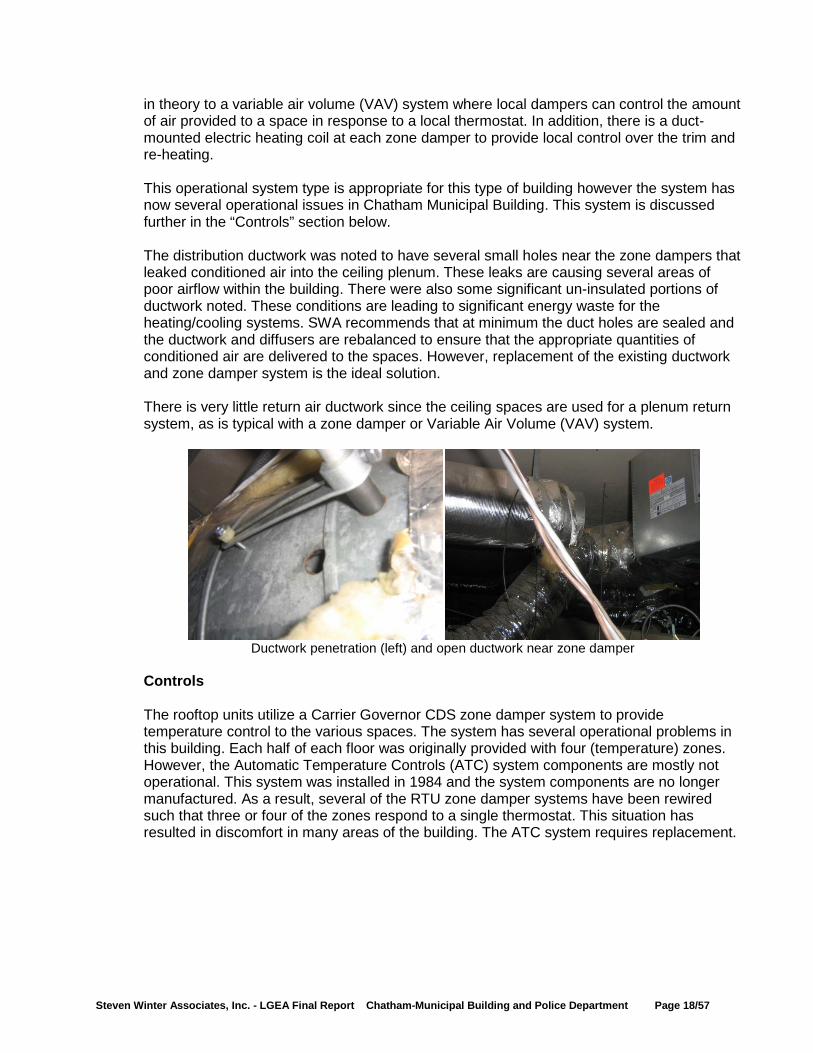
in theory to a variable air volume (VAV) system where local dampers can control the amount of air provided to a space in response to a local thermostat. In addition, there is a duct-mounted electric heating coil at each zone damper to provide local control over the trim and re-heating. This operational system type is appropriate for this type of building however the system has now several operational issues in Chatham Municipal Building. This system is discussed further in the “Controls” section below. The distribution ductwork was noted to have several small holes near the zone dampers that leaked conditioned air into the ceiling plenum. These leaks are causing several areas of poor airflow within the building. There were also some significant un-insulated portions of ductwork noted. These conditions are leading to significant energy waste for the heating/cooling systems. SWA recommends that at minimum the duct holes are sealed and the ductwork and diffusers are rebalanced to ensure that the appropriate quantities of conditioned air are delivered to the spaces. However, replacement of the existing ductwork and zone damper system is the ideal solution. There is very little return air ductwork since the ceiling spaces are used for a plenum return system, as is typical with a zone damper or Variable Air Volume (VAV) system.
Ductwork penetration (left) and open ductwork near zone damper
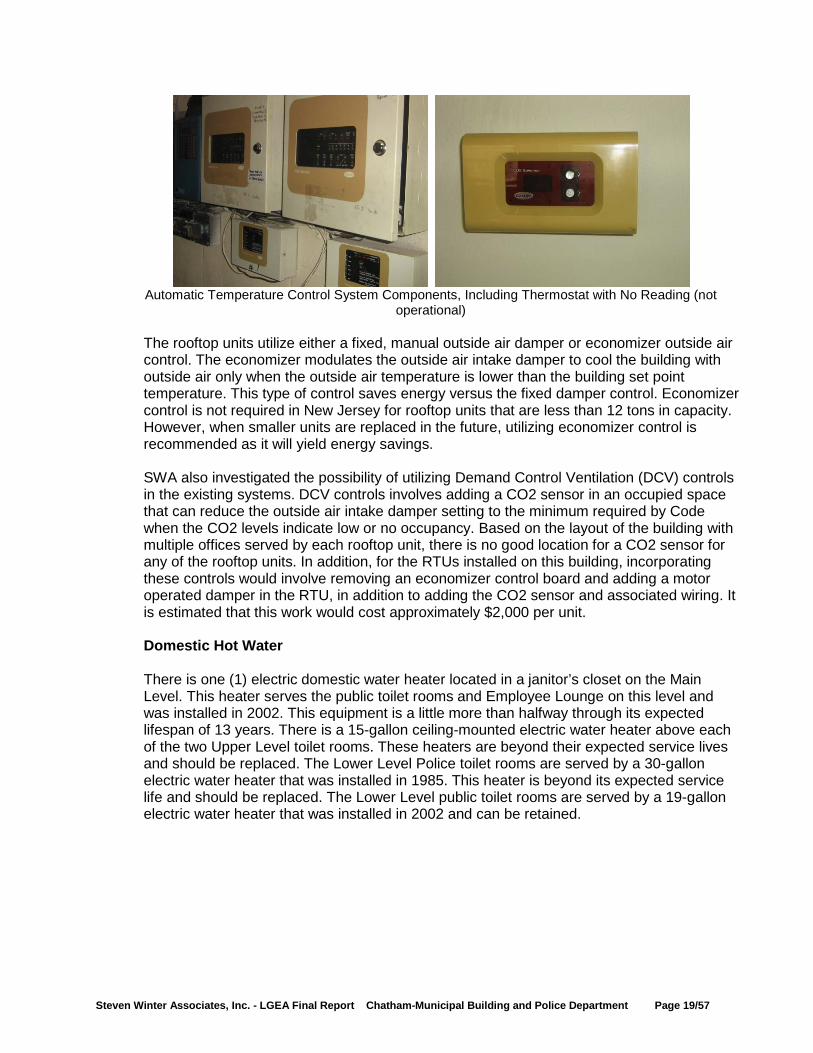
Controls The rooftop units utilize a Carrier Governor CDS zone damper system to provide temperature control to the various spaces. The system has several operational problems in this building. Each half of each floor was originally provided with four (temperature) zones. However, the Automatic Temperature Controls (ATC) system components are mostly not operational. This system was installed in 1984 and the system components are no longer manufactured. As a result, several of the RTU zone damper systems have been rewired such that three or four of the zones respond to a single thermostat. This situation has resulted in discomfort in many areas of the building. The ATC system requires replacement.
Steven Winter Associates, Inc. - LGEA Final Report Chatham-Municipal Building and Police Department Page 19/57
Automatic Temperature Control System Components, Including Thermostat with No Reading (not
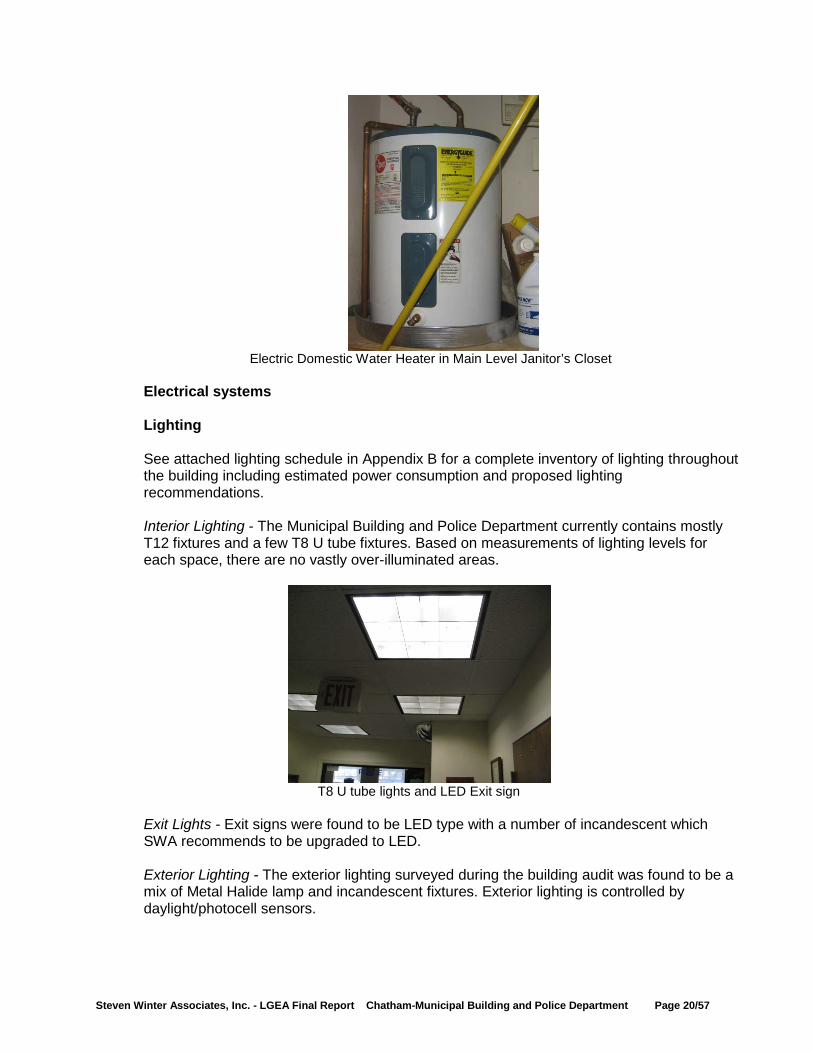
operational) The rooftop units utilize either a fixed, manual outside air damper or economizer outside air control. The economizer modulates the outside air intake damper to cool the building with outside air only when the outside air temperature is lower than the building set point temperature. This type of control saves energy versus the fixed damper control. Economizer control is not required in New Jersey for rooftop units that are less than 12 tons in capacity. However, when smaller units are replaced in the future, utilizing economizer control is recommended as it will yield energy savings. SWA also investigated the possibility of utilizing Demand Control Ventilation (DCV) controls in the existing systems. DCV controls involves adding a CO2 sensor in an occupied space that can reduce the outside air intake damper setting to the minimum required by Code when the CO2 levels indicate low or no occupancy. Based on the layout of the building with multiple offices served by each rooftop unit, there is no good location for a CO2 sensor for any of the rooftop units. In addition, for the RTUs installed on this building, incorporating these controls would involve removing an economizer control board and adding a motor operated damper in the RTU, in addition to adding the CO2 sensor and associated wiring. It is estimated that this work would cost approximately $2,000 per unit. Domestic Hot Water There is one (1) electric domestic water heater located in a janitor’s closet on the Main Level. This heater serves the public toilet rooms and Employee Lounge on this level and was installed in 2002. This equipment is a little more than halfway through its expected lifespan of 13 years. There is a 15-gallon ceiling-mounted electric water heater above each of the two Upper Level toilet rooms. These heaters are beyond their expected service lives and should be replaced. The Lower Level Police toilet rooms are served by a 30-gallon electric water heater that was installed in 1985. This heater is beyond its expected service life and should be replaced. The Lower Level public toilet rooms are served by a 19-gallon electric water heater that was installed in 2002 and can be retained.
Steven Winter Associates, Inc. - LGEA Final Report Chatham-Municipal Building and Police Department Page 20/57
Electric Domestic Water Heater in Main Level Janitor’s Closet
Electrical systems
Lighting See attached lighting schedule in Appendix B for a complete inventory of lighting throughout the building including estimated power consumption and proposed lighting recommendations. Interior Lighting - The Municipal Building and Police Department currently contains mostly T12 fixtures and a few T8 U tube fixtures. Based on measurements of lighting levels for each space, there are no vastly over-illuminated areas.
T8 U tube lights and LED Exit sign
Exit Lights - Exit signs were found to be LED type with a number of incandescent which SWA recommends to be upgraded to LED.
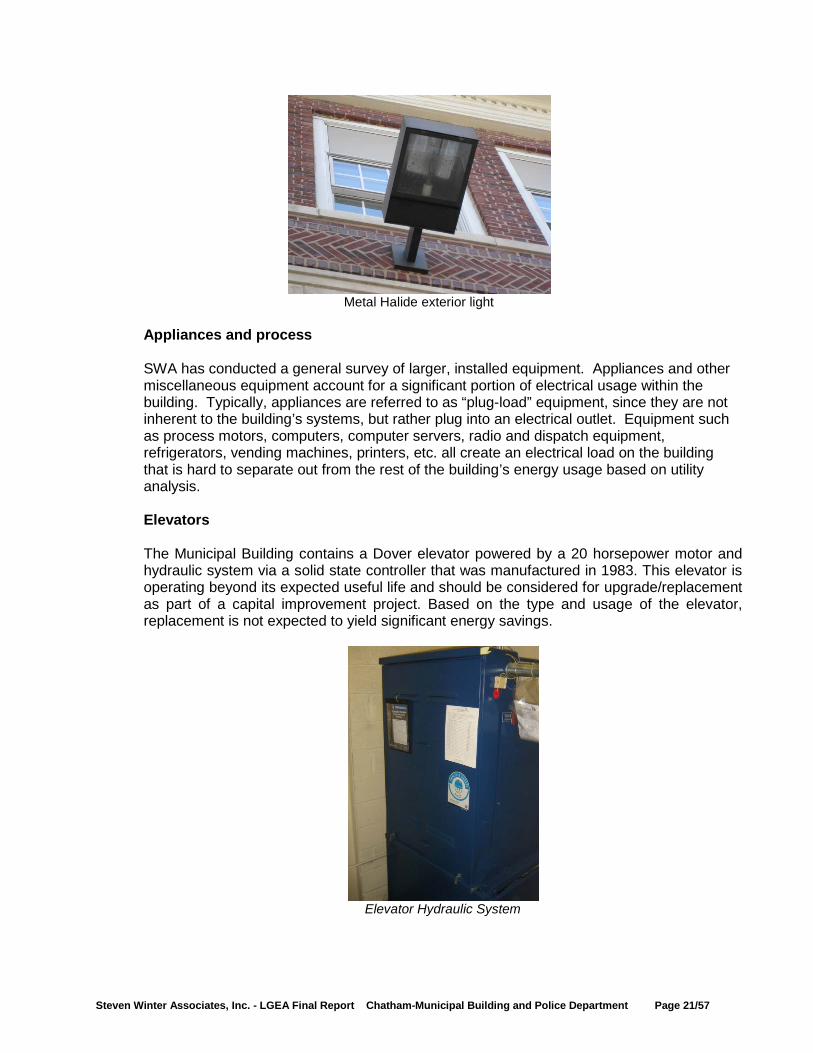
Exterior Lighting - The exterior lighting surveyed during the building audit was found to be a mix of Metal Halide lamp and incandescent fixtures. Exterior lighting is controlled by daylight/photocell sensors.
Steven Winter Associates, Inc. - LGEA Final Report Chatham-Municipal Building and Police Department Page 21/57
Metal Halide exterior light
Appliances and process
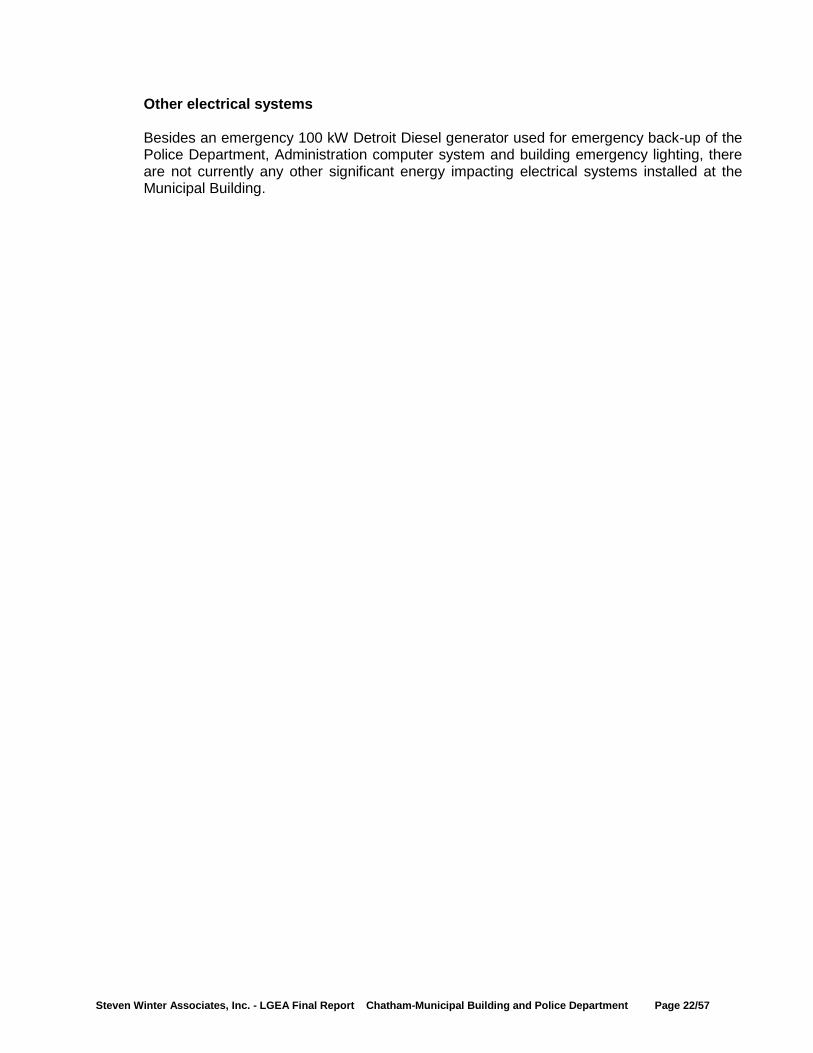
SWA has conducted a general survey of larger, installed equipment. Appliances and other miscellaneous equipment account for a significant portion of electrical usage within the building. Typically, appliances are referred to as “plug-load” equipment, since they are not inherent to the building’s systems, but rather plug into an electrical outlet. Equipment such as process motors, computers, computer servers, radio and dispatch equipment, refrigerators, vending machines, printers, etc. all create an electrical load on the building that is hard to separate out from the rest of the building’s energy usage based on utility analysis. Elevators The Municipal Building contains a Dover elevator powered by a 20 horsepower motor and hydraulic system via a solid state controller that was manufactured in 1983. This elevator is operating beyond its expected useful life and should be considered for upgrade/replacement as part of a capital improvement project. Based on the type and usage of the elevator, replacement is not expected to yield significant energy savings.
Elevator Hydraulic System
Steven Winter Associates, Inc. - LGEA Final Report Chatham-Municipal Building and Police Department Page 22/57
Other electrical systems Besides an emergency 100 kW Detroit Diesel generator used for emergency back-up of the Police Department, Administration computer system and building emergency lighting, there are not currently any other significant energy impacting electrical systems installed at the Municipal Building.
Steven Winter Associates, Inc. - LGEA Final Report Chatham-Municipal Building and Police Department Page 23/57
RENEWABLE AND DISTRIBUTED ENERGY MEASURES Renewable energy is defined as any power source generated from sources which are naturally replenished, such as sunlight, wind and geothermal. Technology for renewable energy is improving, and the cost of installation is decreasing, due to both demand and the availability of state and federal government-sponsored funding. Renewable energy reduces the need for using either electricity or fossil fuel, therefore lowering costs by reducing the amount of energy purchased from the utility company. Technology such as photovoltaic panels or wind turbines, use natural resources to generate electricity on the site. Geothermal systems offset the thermal loads in a building by using water stored in the ground as either a heat sink or heat source. Solar thermal collectors heat a specified volume of water, reducing the amount of energy required to heat water using building equipment. Cogeneration or CHP allows you to generate electricity locally, while also taking advantage of heat wasted during the generation process.
Existing systems Currently there are no renewable energy systems installed in the building. Evaluated Systems Solar Photovoltaic Photovoltaic panels convert light energy received from the sun into a usable form of electricity. Panels can be connected into arrays and mounted directly onto building roofs, as well as installed onto built canopies over areas such as parking lots, building roofs or other open areas. Electricity generated from photovoltaic panels is generally sold back to the utility company through a net meter. Net-metering allows the utility to record the amount of electricity generated in order to pay credits to the consumer that can offset usage and demand costs on the electric bill. In addition to generation credits, there are incentives available called Solar Renewable Energy Credits (SRECs) that are subsidized by the state government. Specifically, the New Jersey State government pays a market-rate SREC to facilities that generate electricity in an effort to meet state-wide renewable energy requirements. Based on utility analysis and a study of roof conditions, the Chatham Municipal Building is a good candidate for a 29.0 kW Solar PV Panel installation. See ECM#8 for details. Solar Thermal Collectors Solar thermal collectors are not cost-effective for this building and would not be recommended due to the insufficient and intermittent use of domestic hot water throughout the building to justify the expenditure. Geothermal The Chatham Municipal Building is not a good candidate for geothermal installation since it would require replacement of the entire existing HVAC system, of which major components still have between 40% and 90% remaining useful lives.
Steven Winter Associates, Inc. - LGEA Final Report Chatham-Municipal Building and Police Department Page 24/57
Combined Heat and Power The Chatham Municipal Building is not a good candidate for CHP installation and would not be cost-effective due to the size and operations of the building. Typically, CHP is best suited for buildings with a high electrical base-load to accommodate the electricity generated, as well as a means for using waste heat generated. Typical applications include buildings with an absorption chiller or with a high domestic water load year round, where waste heat would be used efficiently. Wind The Chatham Municipal Building is not a good candidate for a wind power system since the area does not have winds of sufficient velocity to justify installing a wind turbine system.
Steven Winter Associates, Inc. - LGEA Final Report Chatham-Municipal Building and Police Department Page 25/57
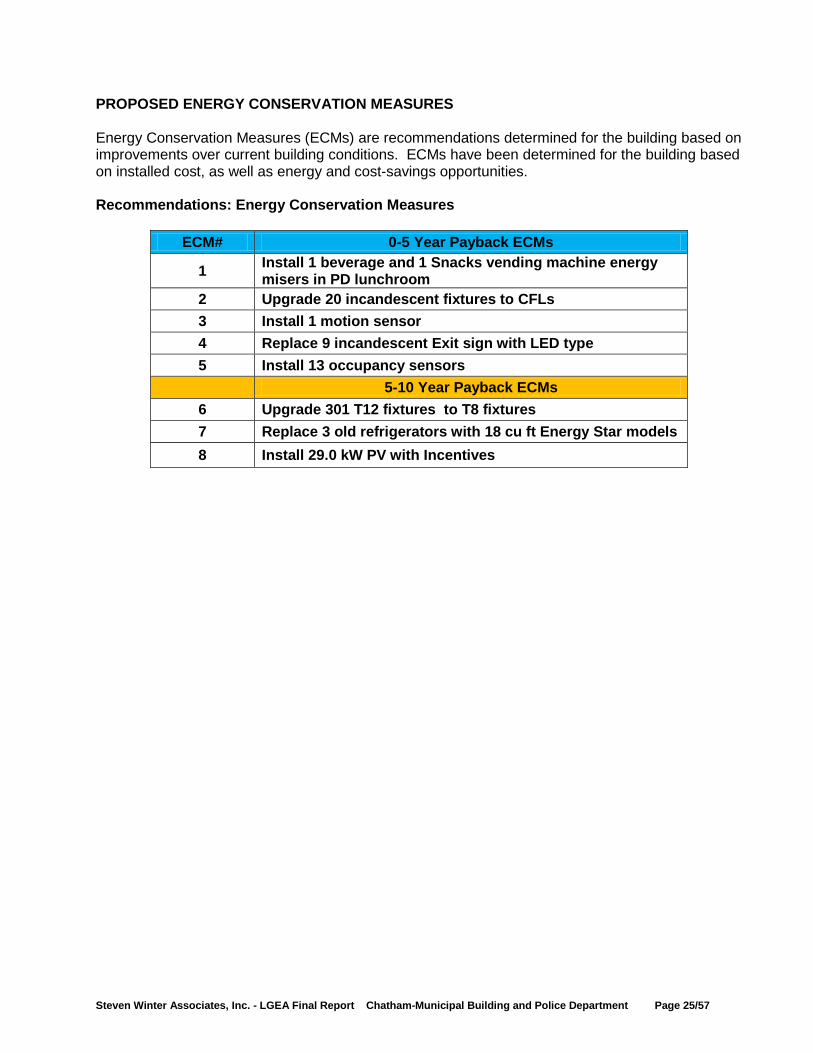
PROPOSED ENERGY CONSERVATION MEASURES Energy Conservation Measures (ECMs) are recommendations determined for the building based on improvements over current building conditions. ECMs have been determined for the building based on installed cost, as well as energy and cost-savings opportunities. Recommendations: Energy Conservation Measures
ECM# 0-5 Year Payback ECMs
1 Install 1 beverage and 1 Snacks vending machine energy misers in PD lunchroom
2 Upgrade 20 incandescent fixtures to CFLs 3 Install 1 motion sensor 4 Replace 9 incandescent Exit sign with LED type 5 Install 13 occupancy sensors
5-10 Year Payback ECMs 6 Upgrade 301 T12 fixtures to T8 fixtures 7 Replace 3 old refrigerators with 18 cu ft Energy Star models 8 Install 29.0 kW PV with Incentives
Steven Winter Associates, Inc. - LGEA Final Report Chatham-Municipal Building and Police Department Page 26/57
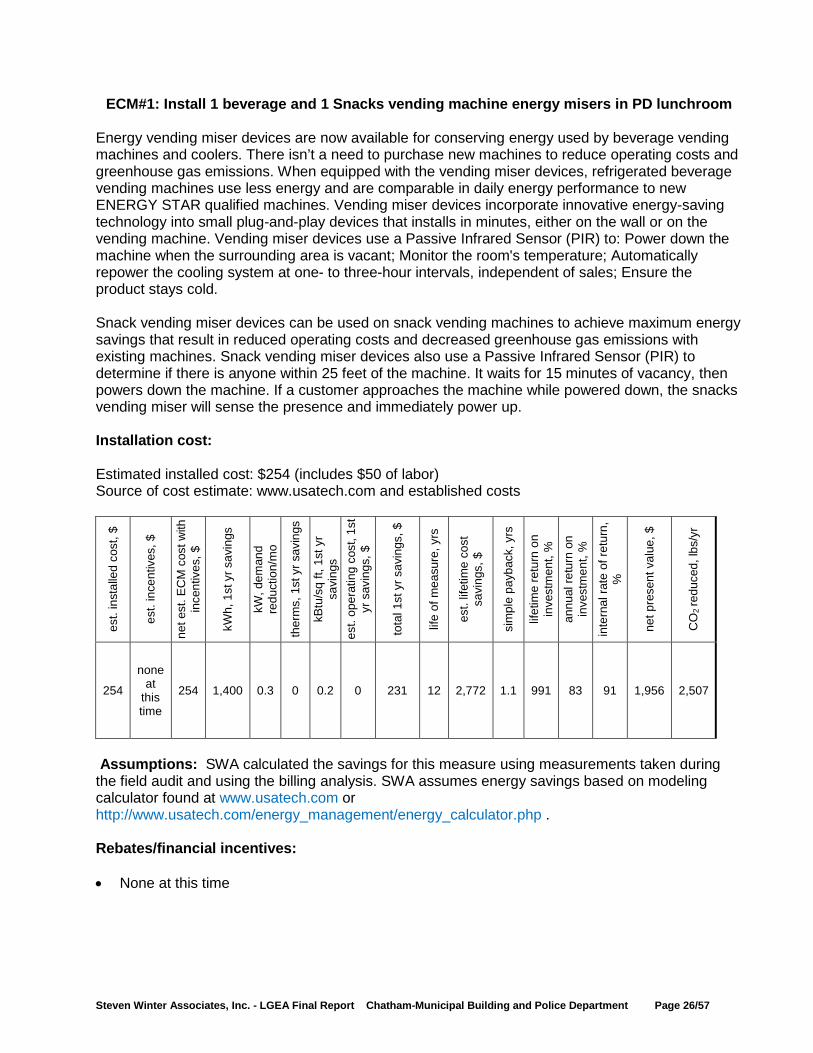
ECM#1: Install 1 beverage and 1 Snacks vending machine energy misers in PD lunchroom Energy vending miser devices are now available for conserving energy used by beverage vending machines and coolers. There isn’t a need to purchase new machines to reduce operating costs and greenhouse gas emissions. When equipped with the vending miser devices, refrigerated beverage vending machines use less energy and are comparable in daily energy performance to new ENERGY STAR qualified machines. Vending miser devices incorporate innovative energy-saving technology into small plug-and-play devices that installs in minutes, either on the wall or on the vending machine. Vending miser devices use a Passive Infrared Sensor (PIR) to: Power down the machine when the surrounding area is vacant; Monitor the room's temperature; Automatically repower the cooling system at one- to three-hour intervals, independent of sales; Ensure the product stays cold. Snack vending miser devices can be used on snack vending machines to achieve maximum energy savings that result in reduced operating costs and decreased greenhouse gas emissions with existing machines. Snack vending miser devices also use a Passive Infrared Sensor (PIR) to determine if there is anyone within 25 feet of the machine. It waits for 15 minutes of vacancy, then powers down the machine. If a customer approaches the machine while powered down, the snacks vending miser will sense the presence and immediately power up. Installation cost: Estimated installed cost: $254 (includes $50 of labor) Source of cost estimate: www.usatech.com and established costs
Assumptions: SWA calculated the savings for this measure using measurements taken during the field audit and using the billing analysis. SWA assumes energy savings based on modeling calculator found at www.usatech.com or http://www.usatech.com/energy_management/energy_calculator.php . Rebates/financial incentives: • None at this time
est.
inst
alle
d co
st, $
est.
ince
ntiv
es, $
net e
st. E
CM
cos
t with
in
cent
ives
, $
kWh,
1st
yr s
avin
gs
kW, d
eman
d re
duct
ion/
mo
ther
ms,
1st
yr s
avin
gs
kBtu
/sq
ft, 1
st y
r sa
ving
s es
t. op
erat
ing
cost
, 1st
yr
sav
ings
, $
tota
l 1st
yr s
avin
gs, $
life
of m
easu
re, y
rs
est.
lifet
ime
cost
sa
ving
s, $
sim
ple
payb
ack,
yrs
lifet
ime
retu
rn o
n in
vest
men
t, %
annu
al re
turn
on
inve
stm
ent,
%
inte
rnal
rate
of r
etur
n,
%
net p
rese
nt v
alue
, $
CO
2 re
duce
d, lb
s/yr
254
none at
this time
254 1,400 0.3 0 0.2 0 231 12 2,772 1.1 991 83 91 1,956 2,507
Steven Winter Associates, Inc. - LGEA Final Report Chatham-Municipal Building and Police Department Page 27/57
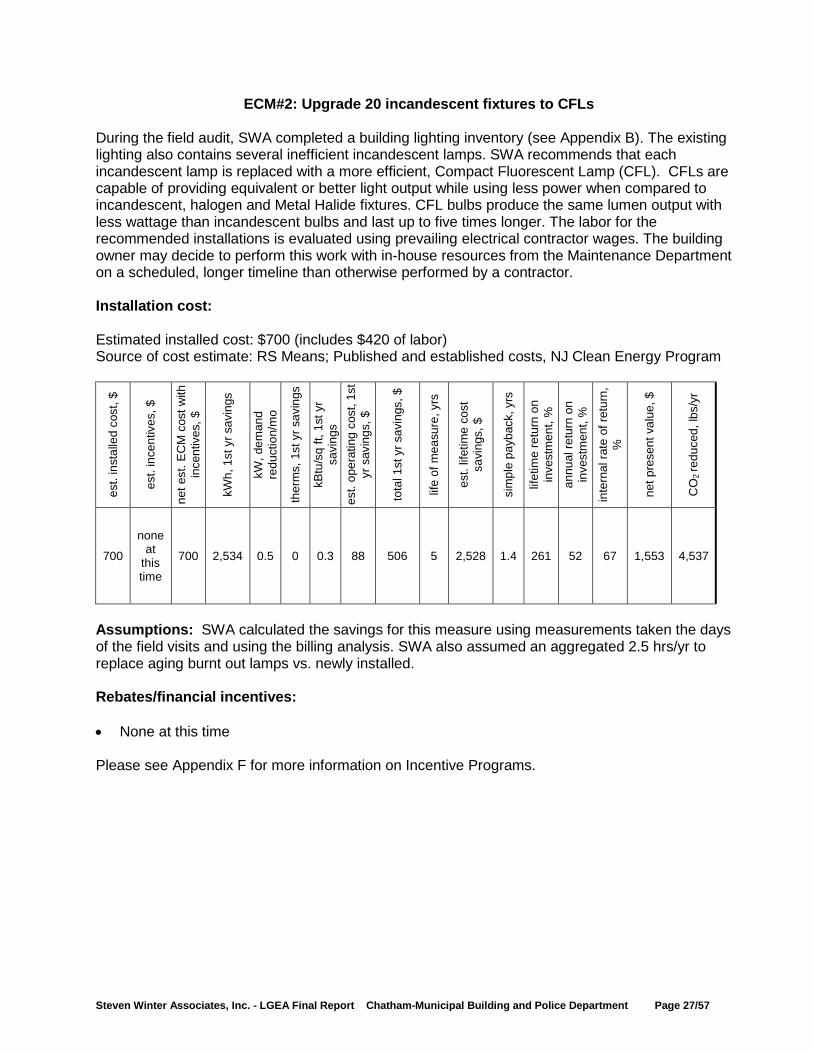
ECM#2: Upgrade 20 incandescent fixtures to CFLs During the field audit, SWA completed a building lighting inventory (see Appendix B). The existing lighting also contains several inefficient incandescent lamps. SWA recommends that each incandescent lamp is replaced with a more efficient, Compact Fluorescent Lamp (CFL). CFLs are capable of providing equivalent or better light output while using less power when compared to incandescent, halogen and Metal Halide fixtures. CFL bulbs produce the same lumen output with less wattage than incandescent bulbs and last up to five times longer. The labor for the recommended installations is evaluated using prevailing electrical contractor wages. The building owner may decide to perform this work with in-house resources from the Maintenance Department on a scheduled, longer timeline than otherwise performed by a contractor. Installation cost: Estimated installed cost: $700 (includes $420 of labor) Source of cost estimate: RS Means; Published and established costs, NJ Clean Energy Program
Assumptions: SWA calculated the savings for this measure using measurements taken the days of the field visits and using the billing analysis. SWA also assumed an aggregated 2.5 hrs/yr to replace aging burnt out lamps vs. newly installed. Rebates/financial incentives: • None at this time Please see Appendix F for more information on Incentive Programs.
est.
inst
alle
d co
st, $
est.
ince
ntiv
es, $
net e
st. E
CM
cos
t with
in
cent
ives
, $
kWh,
1st
yr s
avin
gs
kW, d
eman
d re
duct
ion/
mo
ther
ms,
1st
yr s
avin
gs
kBtu
/sq
ft, 1
st y
r sa
ving
s es
t. op
erat
ing
cost
, 1st
yr
sav
ings
, $
tota
l 1st
yr s
avin
gs, $
life
of m
easu
re, y
rs
est.
lifet
ime
cost
sa
ving
s, $
sim
ple
payb
ack,
yrs
lifet
ime
retu
rn o
n in
vest
men
t, %
annu
al re
turn
on
inve
stm
ent,
%
inte
rnal
rate
of r
etur
n,
%
net p
rese
nt v
alue
, $
CO
2 re
duce
d, lb
s/yr
700
none at
this time
700 2,534 0.5 0 0.3 88 506 5 2,528 1.4 261 52 67 1,553 4,537
Steven Winter Associates, Inc. - LGEA Final Report Chatham-Municipal Building and Police Department Page 28/57
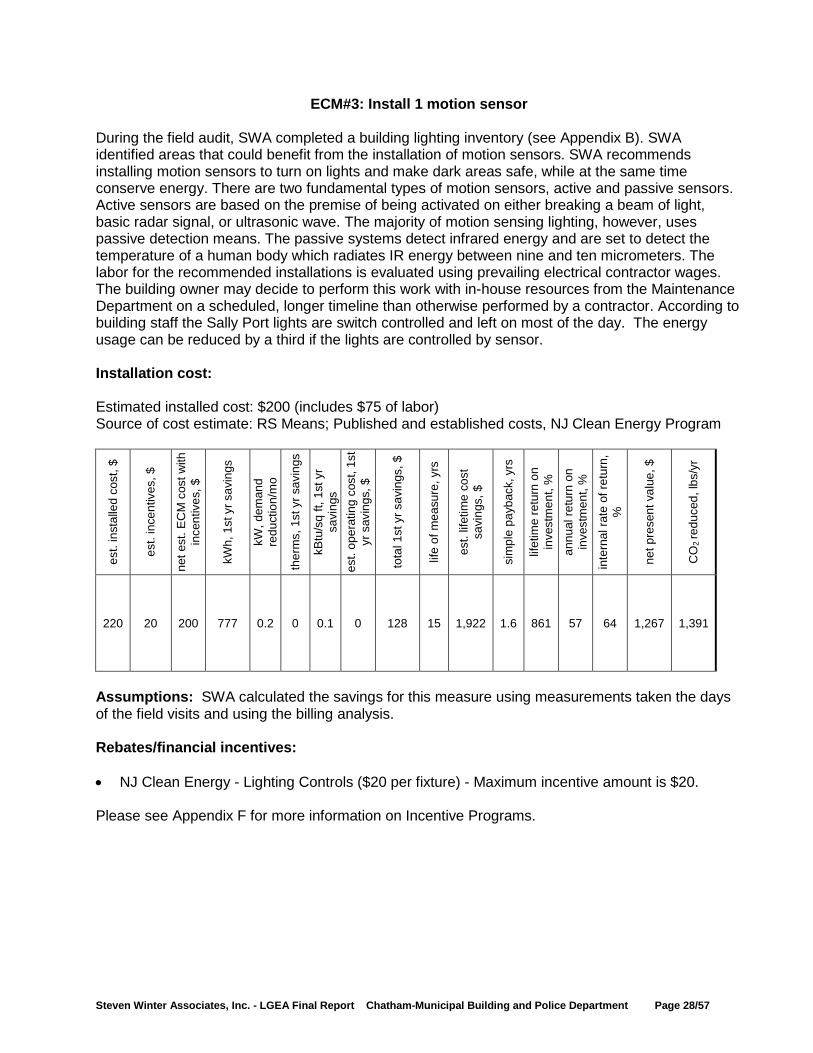
ECM#3: Install 1 motion sensor
During the field audit, SWA completed a building lighting inventory (see Appendix B). SWA identified areas that could benefit from the installation of motion sensors. SWA recommends installing motion sensors to turn on lights and make dark areas safe, while at the same time conserve energy. There are two fundamental types of motion sensors, active and passive sensors. Active sensors are based on the premise of being activated on either breaking a beam of light, basic radar signal, or ultrasonic wave. The majority of motion sensing lighting, however, uses passive detection means. The passive systems detect infrared energy and are set to detect the temperature of a human body which radiates IR energy between nine and ten micrometers. The labor for the recommended installations is evaluated using prevailing electrical contractor wages. The building owner may decide to perform this work with in-house resources from the Maintenance Department on a scheduled, longer timeline than otherwise performed by a contractor. According to building staff the Sally Port lights are switch controlled and left on most of the day. The energy usage can be reduced by a third if the lights are controlled by sensor. Installation cost: Estimated installed cost: $200 (includes $75 of labor) Source of cost estimate: RS Means; Published and established costs, NJ Clean Energy Program
Assumptions: SWA calculated the savings for this measure using measurements taken the days of the field visits and using the billing analysis. Rebates/financial incentives: • NJ Clean Energy - Lighting Controls ($20 per fixture) - Maximum incentive amount is $20. Please see Appendix F for more information on Incentive Programs.
est.
inst
alle
d co
st, $
est.
ince
ntiv
es, $
net e
st. E
CM
cos
t with
in
cent
ives
, $
kWh,
1st
yr s
avin
gs
kW, d
eman
d re
duct
ion/
mo
ther
ms,
1st
yr s
avin
gs
kBtu
/sq
ft, 1
st y
r sa
ving
s es
t. op
erat
ing
cost
, 1st
yr
sav
ings
, $
tota
l 1st
yr s
avin
gs, $
life
of m
easu
re, y
rs
est.
lifet
ime
cost
sa
ving
s, $
sim
ple
payb
ack,
yrs
lifet
ime
retu
rn o
n in
vest
men
t, %
annu
al re
turn
on
inve
stm
ent,
%
inte
rnal
rate
of r
etur
n,
%
net p
rese
nt v
alue
, $
CO
2 re
duce
d, lb
s/yr
220 20 200 777 0.2 0 0.1 0 128 15 1,922 1.6 861 57 64 1,267 1,391
Steven Winter Associates, Inc. - LGEA Final Report Chatham-Municipal Building and Police Department Page 29/57
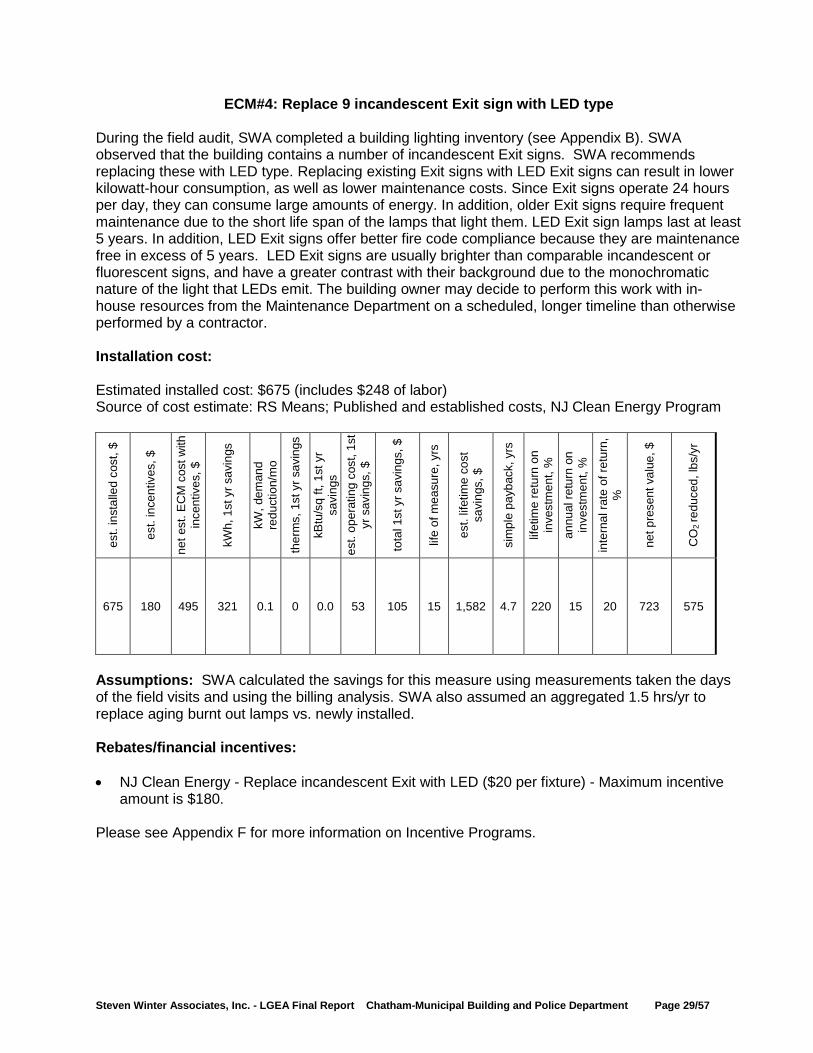
ECM#4: Replace 9 incandescent Exit sign with LED type During the field audit, SWA completed a building lighting inventory (see Appendix B). SWA observed that the building contains a number of incandescent Exit signs. SWA recommends replacing these with LED type. Replacing existing Exit signs with LED Exit signs can result in lower kilowatt-hour consumption, as well as lower maintenance costs. Since Exit signs operate 24 hours per day, they can consume large amounts of energy. In addition, older Exit signs require frequent maintenance due to the short life span of the lamps that light them. LED Exit sign lamps last at least 5 years. In addition, LED Exit signs offer better fire code compliance because they are maintenance free in excess of 5 years. LED Exit signs are usually brighter than comparable incandescent or fluorescent signs, and have a greater contrast with their background due to the monochromatic nature of the light that LEDs emit. The building owner may decide to perform this work with in-house resources from the Maintenance Department on a scheduled, longer timeline than otherwise performed by a contractor. Installation cost: Estimated installed cost: $675 (includes $248 of labor) Source of cost estimate: RS Means; Published and established costs, NJ Clean Energy Program
Assumptions: SWA calculated the savings for this measure using measurements taken the days of the field visits and using the billing analysis. SWA also assumed an aggregated 1.5 hrs/yr to replace aging burnt out lamps vs. newly installed. Rebates/financial incentives: • NJ Clean Energy - Replace incandescent Exit with LED ($20 per fixture) - Maximum incentive
amount is $180. Please see Appendix F for more information on Incentive Programs.
est.
inst
alle
d co
st, $
est.
ince
ntiv
es, $
net e
st. E
CM
cos
t with
in
cent
ives
, $
kWh,
1st
yr s
avin
gs
kW, d
eman
d re
duct
ion/
mo
ther
ms,
1st
yr s
avin
gs
kBtu
/sq
ft, 1
st y
r sa
ving
s es
t. op
erat
ing
cost
, 1st
yr
sav
ings
, $
tota
l 1st
yr s
avin
gs, $
life
of m
easu
re, y
rs
est.
lifet
ime
cost
sa
ving
s, $
sim
ple
payb
ack,
yrs
lifet
ime
retu
rn o
n in
vest
men
t, %
annu
al re
turn
on
inve
stm
ent,
%
inte
rnal
rate
of r
etur
n,
%
net p
rese
nt v
alue
, $
CO
2 re
duce
d, lb
s/yr
675 180 495 321 0.1 0 0.0 53 105 15 1,582 4.7 220 15 20 723 575
Steven Winter Associates, Inc. - LGEA Final Report Chatham-Municipal Building and Police Department Page 30/57
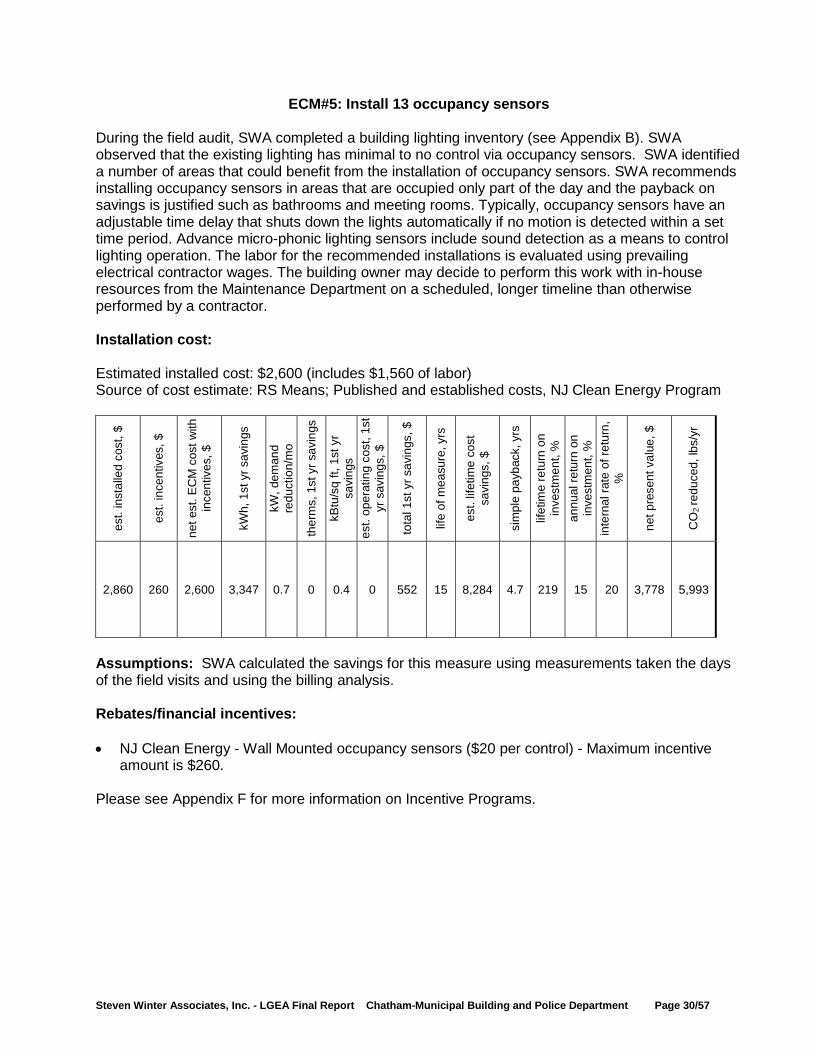
ECM#5: Install 13 occupancy sensors During the field audit, SWA completed a building lighting inventory (see Appendix B). SWA observed that the existing lighting has minimal to no control via occupancy sensors. SWA identified a number of areas that could benefit from the installation of occupancy sensors. SWA recommends installing occupancy sensors in areas that are occupied only part of the day and the payback on savings is justified such as bathrooms and meeting rooms. Typically, occupancy sensors have an adjustable time delay that shuts down the lights automatically if no motion is detected within a set time period. Advance micro-phonic lighting sensors include sound detection as a means to control lighting operation. The labor for the recommended installations is evaluated using prevailing electrical contractor wages. The building owner may decide to perform this work with in-house resources from the Maintenance Department on a scheduled, longer timeline than otherwise performed by a contractor. Installation cost: Estimated installed cost: $2,600 (includes $1,560 of labor) Source of cost estimate: RS Means; Published and established costs, NJ Clean Energy Program
Assumptions: SWA calculated the savings for this measure using measurements taken the days of the field visits and using the billing analysis. Rebates/financial incentives: • NJ Clean Energy - Wall Mounted occupancy sensors ($20 per control) - Maximum incentive
amount is $260. Please see Appendix F for more information on Incentive Programs.
est.
inst
alle
d co
st, $
est.
ince
ntiv
es, $
net e
st. E
CM
cos
t with
in
cent
ives
, $
kWh,
1st
yr s
avin
gs
kW, d
eman
d re
duct
ion/
mo
ther
ms,
1st
yr s
avin
gs
kBtu
/sq
ft, 1
st y
r sa
ving
s es
t. op
erat
ing
cost
, 1st
yr
sav
ings
, $
tota
l 1st
yr s
avin
gs, $
life
of m
easu
re, y
rs
est.
lifet
ime
cost
sa
ving
s, $
sim
ple
payb
ack,
yrs
lifet
ime
retu
rn o
n in
vest
men
t, %
an
nual
retu
rn o
n in
vest
men
t, %
in
tern
al ra
te o
f ret
urn,
%
net p
rese
nt v
alue
, $
CO
2 re
duce
d, lb
s/yr
2,860 260 2,600 3,347 0.7 0 0.4 0 552 15 8,284 4.7 219 15 20 3,778 5,993
Steven Winter Associates, Inc. - LGEA Final Report Chatham-Municipal Building and Police Department Page 31/57
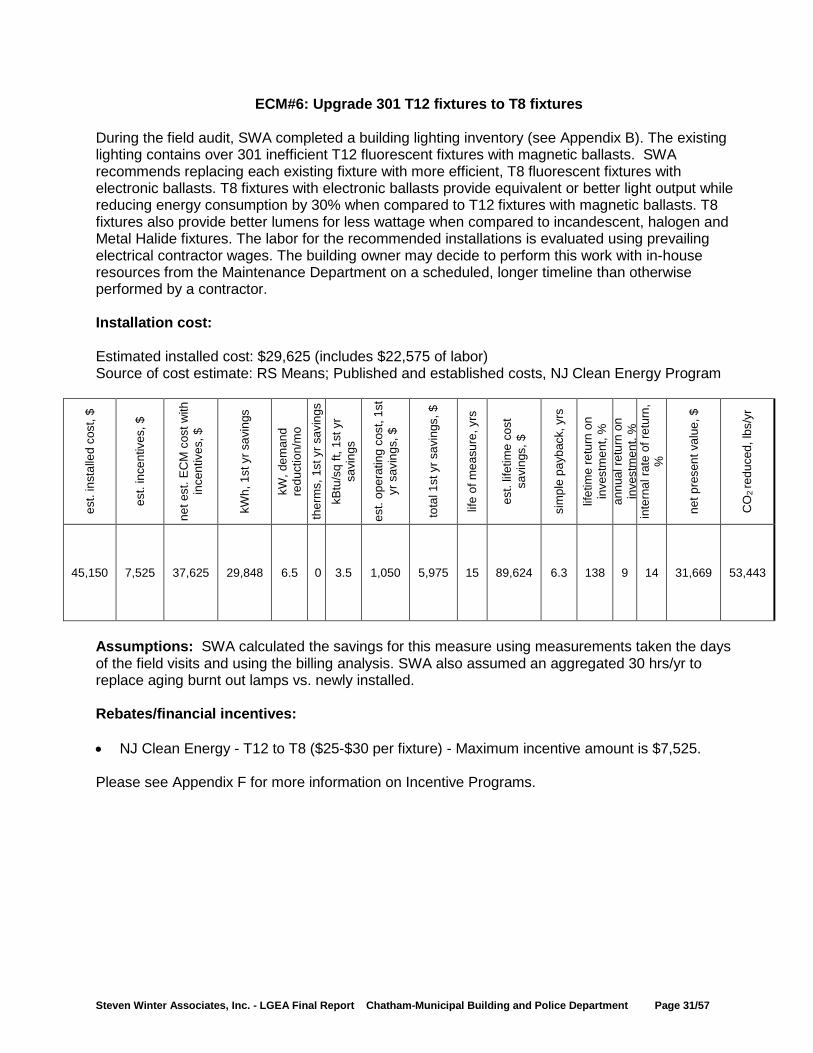
ECM#6: Upgrade 301 T12 fixtures to T8 fixtures During the field audit, SWA completed a building lighting inventory (see Appendix B). The existing lighting contains over 301 inefficient T12 fluorescent fixtures with magnetic ballasts. SWA recommends replacing each existing fixture with more efficient, T8 fluorescent fixtures with electronic ballasts. T8 fixtures with electronic ballasts provide equivalent or better light output while reducing energy consumption by 30% when compared to T12 fixtures with magnetic ballasts. T8 fixtures also provide better lumens for less wattage when compared to incandescent, halogen and Metal Halide fixtures. The labor for the recommended installations is evaluated using prevailing electrical contractor wages. The building owner may decide to perform this work with in-house resources from the Maintenance Department on a scheduled, longer timeline than otherwise performed by a contractor. Installation cost: Estimated installed cost: $29,625 (includes $22,575 of labor) Source of cost estimate: RS Means; Published and established costs, NJ Clean Energy Program
Assumptions: SWA calculated the savings for this measure using measurements taken the days of the field visits and using the billing analysis. SWA also assumed an aggregated 30 hrs/yr to replace aging burnt out lamps vs. newly installed. Rebates/financial incentives: • NJ Clean Energy - T12 to T8 ($25-$30 per fixture) - Maximum incentive amount is $7,525. Please see Appendix F for more information on Incentive Programs.
est.
inst
alle
d co
st, $
est.
ince
ntiv
es, $
net e
st. E
CM
cos
t with
in
cent
ives
, $
kWh,
1st
yr s
avin
gs
kW, d
eman
d re
duct
ion/
mo
ther
ms,
1st
yr s
avin
gs
kBtu
/sq
ft, 1
st y
r sa
ving
s
est.
oper
atin
g co
st, 1
st
yr s
avin
gs, $
tota
l 1st
yr s
avin
gs, $
life
of m
easu
re, y
rs
est.
lifet
ime
cost
sa
ving
s, $
sim
ple
payb
ack,
yrs
lifet
ime
retu
rn o
n in
vest
men
t, %
an
nual
retu
rn o
n in
vest
men
t, %
in
tern
al ra
te o
f ret
urn,
%
net p
rese
nt v
alue
, $
CO
2 re
duce
d, lb
s/yr
45,150 7,525 37,625 29,848 6.5 0 3.5 1,050 5,975 15 89,624 6.3 138 9 14 31,669 53,443
Steven Winter Associates, Inc. - LGEA Final Report Chatham-Municipal Building and Police Department Page 32/57
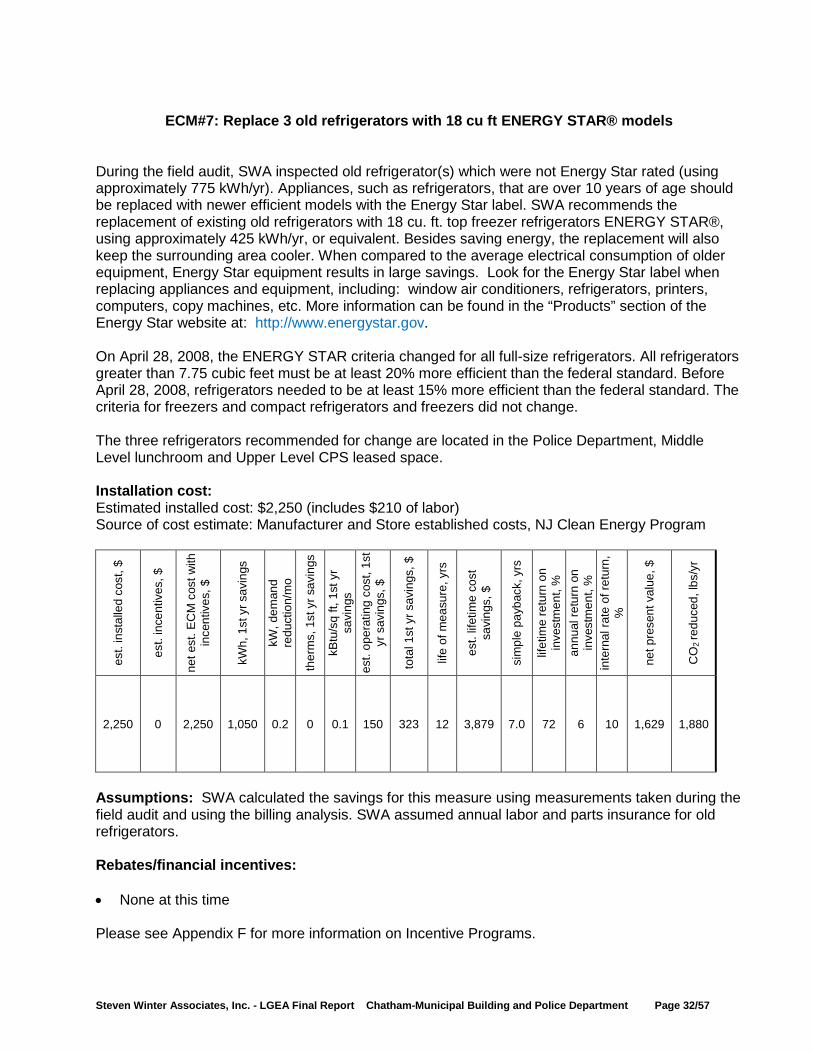
ECM#7: Replace 3 old refrigerators with 18 cu ft ENERGY STAR® models
During the field audit, SWA inspected old refrigerator(s) which were not Energy Star rated (using approximately 775 kWh/yr). Appliances, such as refrigerators, that are over 10 years of age should be replaced with newer efficient models with the Energy Star label. SWA recommends the replacement of existing old refrigerators with 18 cu. ft. top freezer refrigerators ENERGY STAR®, using approximately 425 kWh/yr, or equivalent. Besides saving energy, the replacement will also keep the surrounding area cooler. When compared to the average electrical consumption of older equipment, Energy Star equipment results in large savings. Look for the Energy Star label when replacing appliances and equipment, including: window air conditioners, refrigerators, printers, computers, copy machines, etc. More information can be found in the “Products” section of the Energy Star website at: http://www.energystar.gov. On April 28, 2008, the ENERGY STAR criteria changed for all full-size refrigerators. All refrigerators greater than 7.75 cubic feet must be at least 20% more efficient than the federal standard. Before April 28, 2008, refrigerators needed to be at least 15% more efficient than the federal standard. The criteria for freezers and compact refrigerators and freezers did not change. The three refrigerators recommended for change are located in the Police Department, Middle Level lunchroom and Upper Level CPS leased space. Installation cost: Estimated installed cost: $2,250 (includes $210 of labor) Source of cost estimate: Manufacturer and Store established costs, NJ Clean Energy Program
Assumptions: SWA calculated the savings for this measure using measurements taken during the field audit and using the billing analysis. SWA assumed annual labor and parts insurance for old refrigerators. Rebates/financial incentives: • None at this time
Please see Appendix F for more information on Incentive Programs.
est.
inst
alle
d co
st, $
est.
ince
ntiv
es, $
net e
st. E
CM
cos
t with
in
cent
ives
, $
kWh,
1st
yr s
avin
gs
kW, d
eman
d re
duct
ion/
mo
ther
ms,
1st
yr s
avin
gs
kBtu
/sq
ft, 1
st y
r sa
ving
s es
t. op
erat
ing
cost
, 1st
yr
sav
ings
, $
tota
l 1st
yr s
avin
gs, $
life
of m
easu
re, y
rs
est.
lifet
ime
cost
sa
ving
s, $
sim
ple
payb
ack,
yrs
lifet
ime
retu
rn o
n in
vest
men
t, %
an
nual
retu
rn o
n in
vest
men
t, %
in
tern
al ra
te o
f ret
urn,
%
net p
rese
nt v
alue
, $
CO
2 re
duce
d, lb
s/yr
2,250 0 2,250 1,050 0.2 0 0.1 150 323 12 3,879 7.0 72 6 10 1,629 1,880
Steven Winter Associates, Inc. - LGEA Final Report Chatham-Municipal Building and Police Department Page 33/57
ECM#8: Install 29.0 kW PV System Currently the Chatham Municipal Building and Police Department does not use any renewable energy systems. Renewable energy systems such as photovoltaic (PV) panels can be mounted on the building roofs facing south, which can offset a portion of the purchased electricity for the building. Power stations generally have two separate electrical charges: usage and demand. Usage is the amount of electricity in kilowatt-hours that a building uses from month to month. Demand is the amount of electrical power that a building uses at any given instance in a month’s period. During the summer periods, electric demand at a power station is high due to the amount of air conditioners, lights and other equipment being used within the region. Demand charges increase to offset the utility’s cost to provide enough electricity at that given time. Photovoltaic systems offset the amount of electricity used by a building and help to reduce the building’s electrical demand, resulting in a higher cost savings. Installing a PV system will offset electrical demand and reduce the annual electric consumption for the building, while utilizing available state incentives. PV systems are modular and readily allow for future expansion.
The size of the system was determined considering the available roof surface area, without compromising service space for roof equipment and safety, as well as the facility’s annual base load and mode of operation. A PV system could be installed on a portion of the roof with panels facing south. A commercial multi-crystalline 230 watt panel has 17.5 square feet of surface area (providing 13.1 watts per square foot). A 29.0 kW system needs approximately 126 panels which would take up 2,205 square feet. A PV system would reduce the building’s electric load and allow more capacity for surrounding buildings as well as serve as an example of energy efficiency for the community. The building is not eligible for a residential 30% federal tax credit. Chatham Municipal Building may consider applying for a grant and/or engage a PV generator/leaser who would install the PV system and then sell the power at a reduced rate. JCP&L provides the ability to buy SREC’s at $600/MWh or best market offer. Please note that this analysis did not consider the structural capability of the existing building to support the above recommended system. SWA recommends that the Borough of Chatham contract with a structural engineer to determine if additional building structure is required to support the recommended system and what costs would be associated with incorporating the additional supports prior to system installation. Should additional costs be identified, the Borough should include these costs in the financial analysis of the project. Installation cost: Estimated installed cost: $194,300 (including $77,720 total labor cost) Source of cost estimate: Similar projects
Steven Winter Associates, Inc. - LGEA Final Report Chatham-Municipal Building and Police Department Page 34/57
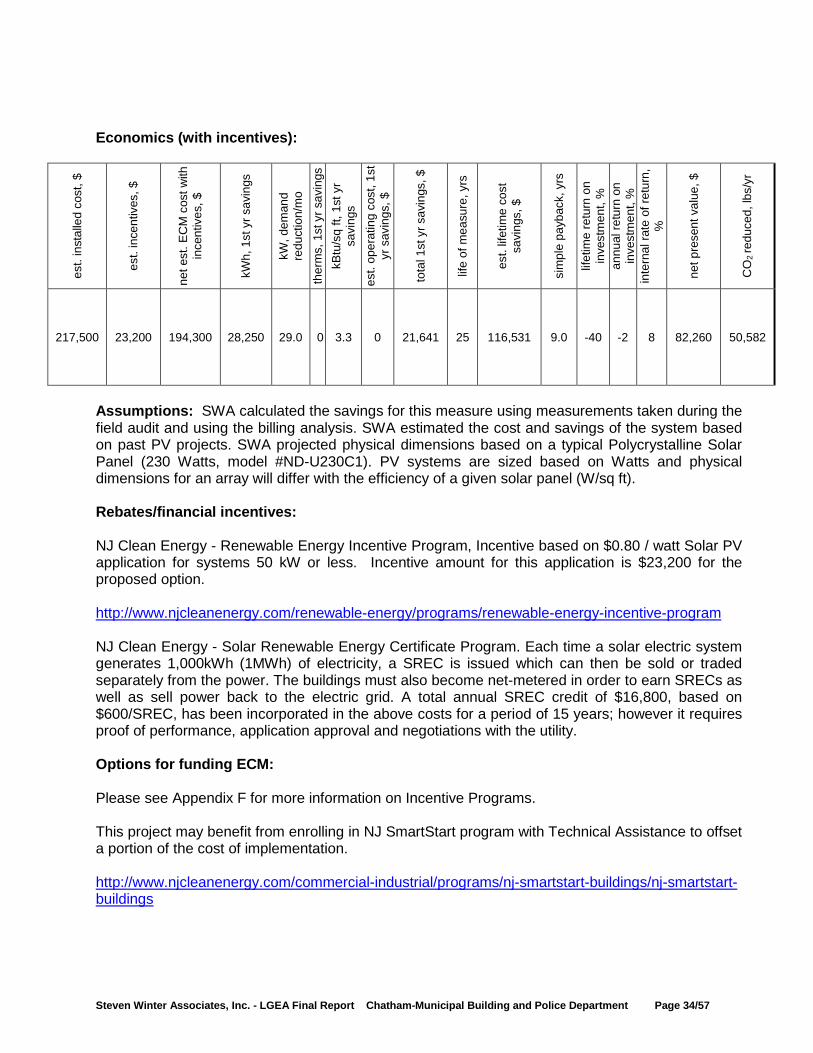
Economics (with incentives):
Assumptions: SWA calculated the savings for this measure using measurements taken during the field audit and using the billing analysis. SWA estimated the cost and savings of the system based on past PV projects. SWA projected physical dimensions based on a typical Polycrystalline Solar Panel (230 Watts, model #ND-U230C1). PV systems are sized based on Watts and physical dimensions for an array will differ with the efficiency of a given solar panel (W/sq ft). Rebates/financial incentives: NJ Clean Energy - Renewable Energy Incentive Program, Incentive based on $0.80 / watt Solar PV application for systems 50 kW or less. Incentive amount for this application is $23,200 for the proposed option. http://www.njcleanenergy.com/renewable-energy/programs/renewable-energy-incentive-program NJ Clean Energy - Solar Renewable Energy Certificate Program. Each time a solar electric system generates 1,000kWh (1MWh) of electricity, a SREC is issued which can then be sold or traded separately from the power. The buildings must also become net-metered in order to earn SRECs as well as sell power back to the electric grid. A total annual SREC credit of $16,800, based on $600/SREC, has been incorporated in the above costs for a period of 15 years; however it requires proof of performance, application approval and negotiations with the utility. Options for funding ECM: Please see Appendix F for more information on Incentive Programs. This project may benefit from enrolling in NJ SmartStart program with Technical Assistance to offset a portion of the cost of implementation. http://www.njcleanenergy.com/commercial-industrial/programs/nj-smartstart-buildings/nj-smartstart-buildings
est.
inst
alle
d co
st, $
est.
ince
ntiv
es, $
net e
st. E
CM
cos
t with
in
cent
ives
, $
kWh,
1st
yr s
avin
gs
kW, d
eman
d re
duct
ion/
mo
ther
ms,
1st
yr s
avin
gs
kBtu
/sq
ft, 1
st y
r sa
ving
s
est.
oper
atin
g co
st, 1
st
yr s
avin
gs, $
tota
l 1st
yr s
avin
gs, $
life
of m
easu
re, y
rs
est.
lifet
ime
cost
sa
ving
s, $
sim
ple
payb
ack,
yrs
lifet
ime
retu
rn o
n in
vest
men
t, %
an
nual
retu
rn o
n in
vest
men
t, %
in
tern
al ra
te o
f ret
urn,
%
net p
rese
nt v
alue
, $
CO
2 re
duce
d, lb
s/yr
217,500 23,200 194,300 28,250 29.0 0 3.3 0 21,641 25 116,531 9.0 -40 -2 8 82,260 50,582
Steven Winter Associates, Inc. - LGEA Final Report Chatham-Municipal Building and Police Department Page 35/57
PROPOSED FURTHER RECOMMENDATIONS Capital Improvements Capital Improvements are recommendations for the building that may not be cost-effective at the current time, but that could yield a significant long-term payback. These recommendations should typically be considered as part of a long-term capital improvement plan. Capital improvements should be considered if additional funds are made available, or if the installed costs can be shared with other improvements, such as major building renovations. SWA recommends the following capital improvements for the Municipal Building and Police Department:
• Install premium motors when replacements are required - Select NEMA Premium motors when
replacing motors that have reached the end of their useful operating lives.
• Replace all original windows which are single-glazed windows with a low-E, double glazed type.
• Add insulation to ineffectively and under-insulated roof/ceiling sections. SWA suggests as an option applying closed-cell spray-foam (R-19 min.) to the underside of rafters. Another option would be to lay 6” batt fiberglass insulation evenly over the drop ceilings.
• Replace eight (8) ceiling-mounted toilet exhaust fans and ductwork - This equipment is run by
fractional horsepower motors and the operational hours are not significant, so the replacements cannot be justified by energy savings alone and there are no NJ Clean Energy rebates available. However, due to the age and condition of the equipment, replacement is recommended. The estimated replacement installed cost for this measure is $3,000 and the estimated payback is greater than 25 years.
• Replace ductwork, zone dampers and automatic temperature control system - The existing
ductwork was noted to have significant leakage in some areas as well as areas with compromised or no insulation. In some areas, this condition has led to noticeable air balancing issues. In addition, many of the thermostats are not operational and replacement parts are not available. As a result, several thermostats have been wired together to achieve control over a few large zones per floor instead of the intended 8-10 zones per floor. This repair strategy has led to discomfort in most of the building. This work is currently being bid out by the Borough. SWA estimates the cost of work to install new ductwork, insulation and zone dampers to be $125,000 and the cost for the Automatic Temperature Controls (ATC) System replacement to be $70,000. Cost estimate for ATC system is based on Carrier 3V VVT system with Carrier i-Vu Web Interface with requirements for the characteristics of this building. It is estimated that the ductwork and controls upgrade with proper balancing and commissioning will result in about 12,000 kWh per year of savings, with an estimated savings of $1,980 per year and a 95 year simple payback. Despite the long payback, it is highly recommended that these upgrades are made to improve comfort and achieve energy savings. One option to shorten payback may be to repair ductwork and repair/replace zone dampers as needed to reduce the initial cost of this measure.
• Replace electric wall heater inside front entry - the electric wall heater inside the front entrance is operating beyond its useful life. Replacement (in kind) will yield negligible energy savings. The estimated cost for this measure is $600.
Steven Winter Associates, Inc. - LGEA Final Report Chatham-Municipal Building and Police Department Page 36/57
• Replace two (2) 15 gallon electric domestic water heaters above Upper Level toilet room ceilings, and one (1) 30 gallon electric domestic water heater above Lower Level toilet room ceiling that are beyond their useful lives. Although there is natural gas piping in the building, the cost to tie into the existing gas piping in addition to the cost to install the required flue piping through an outside wall or roof would make replacement with gas heaters cost prohibitive and the simple payback would be long. Also, the smallest high efficiency gas-fired water heaters are approximately 40 gallons in size, which is oversized for these applications. For these reasons, SWA recommends replacement in kind with electric heaters, which will yield negligible energy savings. The estimated cost for this upgrade is $2,000.
• At the next major renovation replace/upgrade the elevator. This elevator is approaching 30
years of operation and is at the end of its expected service life. Replacement will yield negligible energy savings. The estimated replacement cost is $60,000.
Operations and Maintenance Operations and Maintenance measures consist of low/no cost measures that are within the capability of the current building staff to handle. These measures typically require little investment, and they yield a short payback period. These measures may address equipment settings or staff operations that, when addressed will reduce energy consumption or costs. • Repair and maintain roof trim and moldings.
• Maintain weather-stripping around all exterior doors and roof hatches.
• Maintain roofs - SWA recommends regular maintenance to verify water is draining correctly.
• Maintain downspouts and cap flashing - Repair/install missing downspouts and cap flashing as
needed to prevent water/moisture infiltration and insulation damage. SWA recommends round downspout elbows to minimize clogging.
• Provide weather-stripping/air-sealing - SWA observed that exterior door weather-stripping was beginning to deteriorate in places. Doors and vestibules should be observed annually for deficient weather-stripping and replaced as needed. The perimeter of all window frames should also be regularly inspected, and any missing or deteriorated caulking should be re-caulked to provide an unbroken seal around the window frames. Any other accessible gaps or penetrations in the thermal envelope penetrations should also be sealed with caulk or spray foam.
• Repair/seal wall cracks and penetrations - SWA recommends as part of the maintenance program installing weep holes, installing proper flashing and correct masonry efflorescence, and sealing wall cracks and penetrations wherever necessary in order to keep insulation dry and effective.
• Provide water-efficient fixtures and controls - Adding controlled on/off timers on all lavatory faucets is a cost-effective way to reduce domestic hot water demand and save water. Building staff can also easily install faucet aerators and/or low-flow fixtures to reduce water consumption. There are many retrofit options, which can be installed now or incorporated as equipment is replaced. Routine maintenance practices that identify and quickly address water leaks are a low-cost way to save water and energy. Retrofitting with more efficient water-consumption

Steven Winter Associates, Inc. - LGEA Final Report Chatham-Municipal Building and Police Department Page 37/57
fixtures/appliances will reduce energy consumption for water heating, while also decreasing water/sewer bills.
• Seal and insulate ductwork - If the ductwork is not replaced, SWA recommends sealing all
breached in the existing ductwork and installing duct insulation to ensure that adequate conditioned air is delivered efficiently to the intended spaces.
• Balance air distribution systems - upon installation of new ductwork or sealing and insulating
existing ductwork, SWA recommends that the systems are balanced by a certified air balance contractor to achieve the air quantities intended by the original design.
• Change filters in rooftop units monthly to ensure efficient operation of the fan, ensure adequate air delivery to the spaces and avoid overheating of the furnaces’ heat exchangers, which can cause cracking and require replacement.
• SWA recommends that the building considers purchasing the most energy-efficient equipment,
including ENERGY STAR® labeled appliances, when equipment is installed or replaced. More information can be found in the “Products” section of the ENERGY STAR® website at:
http://www.energystar.gov.
• Use smart power electric strips - in conjunction with occupancy sensors to power down computer equipment when left unattended for extended periods of time.
• Create an energy educational program - that teaches how to minimize energy use. The U.S. Department of Energy offers free information for hosting energy efficiency educational programs and plans. For more information please visit: http://www1.eere.energy.gov/education/.
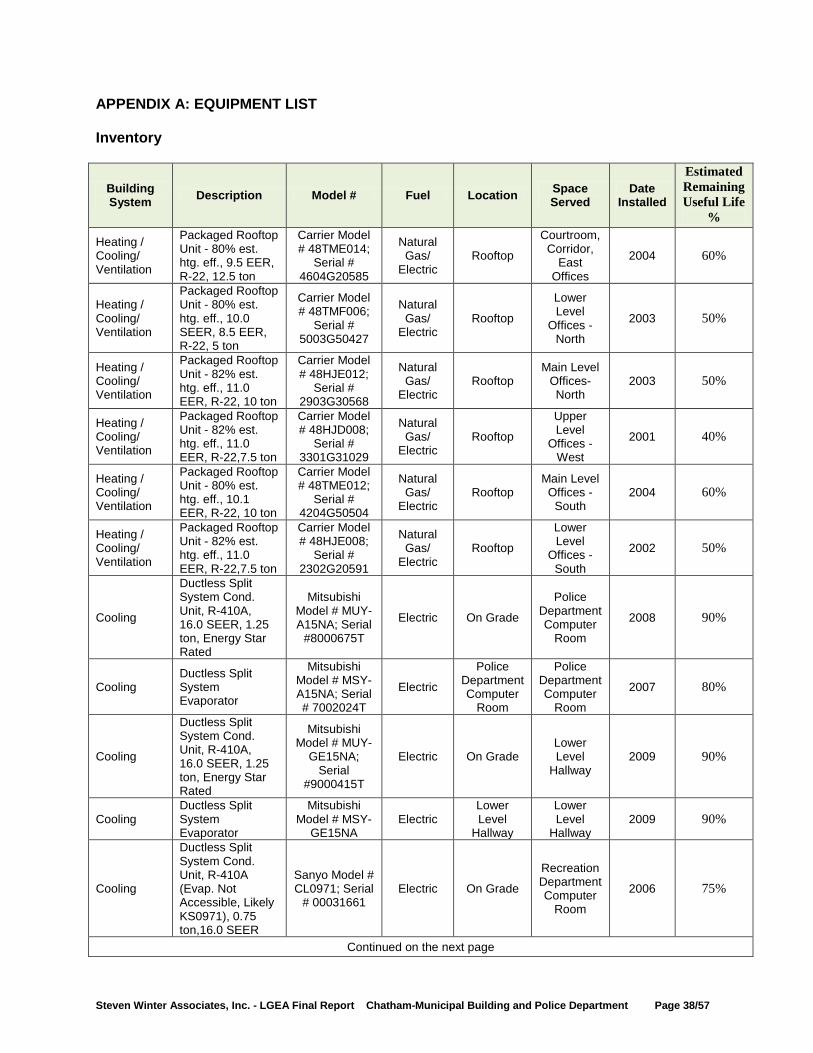
Steven Winter Associates, Inc. - LGEA Final Report Chatham-Municipal Building and Police Department Page 38/57
APPENDIX A: EQUIPMENT LIST Inventory
Building System Description Model # Fuel Location Space
Served Date
Installed
Estimated Remaining Useful Life
%
Heating / Cooling/ Ventilation
Packaged Rooftop Unit - 80% est. htg. eff., 9.5 EER, R-22, 12.5 ton
Carrier Model # 48TME014;
Serial # 4604G20585
Natural Gas/
Electric Rooftop
Courtroom, Corridor,
East Offices
2004 60%
Heating / Cooling/ Ventilation
Packaged Rooftop Unit - 80% est. htg. eff., 10.0 SEER, 8.5 EER, R-22, 5 ton
Carrier Model # 48TMF006;
Serial # 5003G50427
Natural Gas/
Electric Rooftop
Lower Level
Offices - North
2003 50%
Heating / Cooling/ Ventilation
Packaged Rooftop Unit - 82% est. htg. eff., 11.0 EER, R-22, 10 ton
Carrier Model # 48HJE012;
Serial # 2903G30568
Natural Gas/
Electric Rooftop
Main Level Offices- North
2003 50%
Heating / Cooling/ Ventilation
Packaged Rooftop Unit - 82% est. htg. eff., 11.0 EER, R-22,7.5 ton
Carrier Model # 48HJD008;
Serial # 3301G31029
Natural Gas/
Electric Rooftop
Upper Level
Offices - West
2001 40%
Heating / Cooling/ Ventilation
Packaged Rooftop Unit - 80% est. htg. eff., 10.1 EER, R-22, 10 ton
Carrier Model # 48TME012;
Serial # 4204G50504
Natural Gas/
Electric Rooftop
Main Level Offices -
South 2004 60%
Heating / Cooling/ Ventilation
Packaged Rooftop Unit - 82% est. htg. eff., 11.0 EER, R-22,7.5 ton
Carrier Model # 48HJE008;
Serial # 2302G20591
Natural Gas/
Electric Rooftop
Lower Level
Offices - South
2002 50%
Cooling
Ductless Split System Cond. Unit, R-410A, 16.0 SEER, 1.25 ton, Energy Star Rated
Mitsubishi Model # MUY-A15NA; Serial
#8000675T
Electric On Grade
Police Department Computer
Room
2008 90%
Cooling Ductless Split System Evaporator
Mitsubishi Model # MSY-A15NA; Serial # 7002024T
Electric
Police Department Computer
Room
Police Department Computer
Room
2007 80%
Cooling
Ductless Split System Cond. Unit, R-410A, 16.0 SEER, 1.25 ton, Energy Star Rated
Mitsubishi Model # MUY-
GE15NA; Serial
#9000415T
Electric On Grade Lower Level
Hallway 2009 90%
Cooling Ductless Split System Evaporator
Mitsubishi Model # MSY-
GE15NA Electric
Lower Level
Hallway
Lower Level
Hallway 2009 90%
Cooling
Ductless Split System Cond. Unit, R-410A (Evap. Not Accessible, Likely KS0971), 0.75 ton,16.0 SEER
Sanyo Model # CL0971; Serial
# 00031661 Electric On Grade
Recreation Department Computer
Room
2006 75%
Continued on the next page
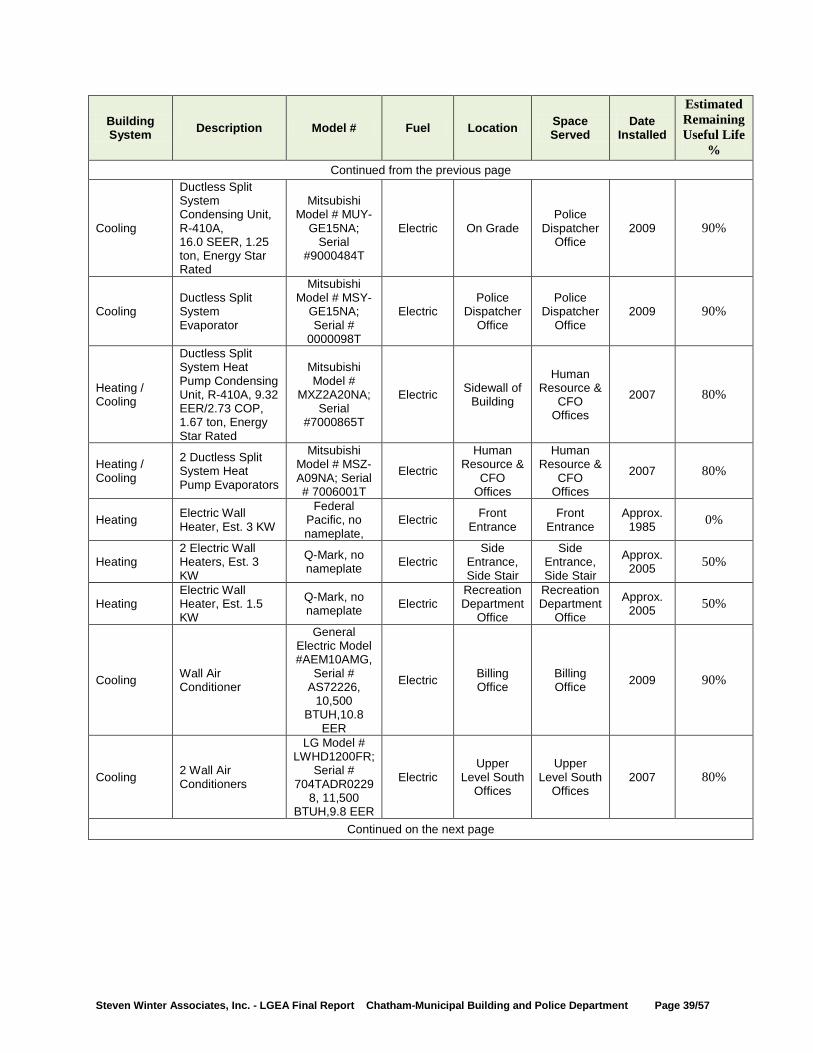
Steven Winter Associates, Inc. - LGEA Final Report Chatham-Municipal Building and Police Department Page 39/57
Building System Description Model # Fuel Location Space
Served Date
Installed
Estimated Remaining Useful Life
% Continued from the previous page
Cooling
Ductless Split System Condensing Unit, R-410A, 16.0 SEER, 1.25 ton, Energy Star Rated
Mitsubishi Model # MUY-
GE15NA; Serial
#9000484T
Electric On Grade Police
Dispatcher Office
2009 90%
Cooling Ductless Split System Evaporator
Mitsubishi Model # MSY-
GE15NA; Serial #
0000098T
Electric
Police
Dispatcher Office
Police
Dispatcher Office
2009 90%
Heating / Cooling
Ductless Split System Heat Pump Condensing Unit, R-410A, 9.32 EER/2.73 COP, 1.67 ton, Energy Star Rated
Mitsubishi Model #
MXZ2A20NA; Serial
#7000865T
Electric Sidewall of Building
Human Resource &
CFO Offices
2007 80%
Heating / Cooling
2 Ductless Split System Heat Pump Evaporators
Mitsubishi Model # MSZ-A09NA; Serial # 7006001T
Electric
Human Resource &
CFO Offices
Human Resource &
CFO Offices
2007 80%
Heating Electric Wall Heater, Est. 3 KW
Federal Pacific, no nameplate,
Electric Front Entrance
Front Entrance
Approx. 1985 0%
Heating 2 Electric Wall Heaters, Est. 3 KW
Q-Mark, no nameplate Electric
Side Entrance, Side Stair
Side Entrance, Side Stair
Approx. 2005 50%
Heating Electric Wall Heater, Est. 1.5 KW
Q-Mark, no nameplate Electric
Recreation Department
Office
Recreation Department
Office
Approx. 2005 50%
Cooling Wall Air Conditioner
General Electric Model #AEM10AMG,
Serial # AS72226,
10,500 BTUH,10.8
EER
Electric Billing Office
Billing Office 2009 90%
Cooling 2 Wall Air Conditioners
LG Model # LWHD1200FR;
Serial # 704TADR0229
8, 11,500 BTUH,9.8 EER
Electric Upper
Level South Offices
Upper Level South
Offices 2007 80%
Continued on the next page
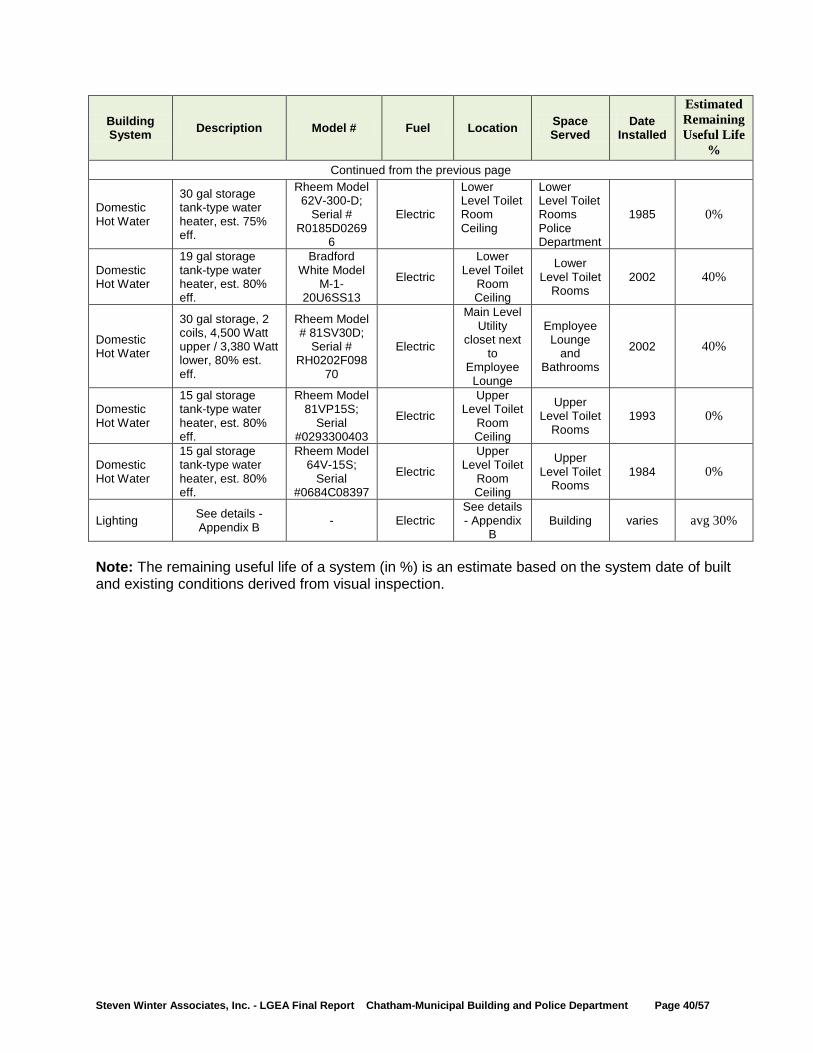
Steven Winter Associates, Inc. - LGEA Final Report Chatham-Municipal Building and Police Department Page 40/57
Building System Description Model # Fuel Location Space
Served Date
Installed
Estimated Remaining Useful Life
% Continued from the previous page
Domestic Hot Water
30 gal storage tank-type water heater, est. 75% eff.
Rheem Model 62V-300-D;
Serial # R0185D0269
6
Electric
Lower Level Toilet Room Ceiling
Lower Level Toilet Rooms Police Department
1985 0%
Domestic Hot Water
19 gal storage tank-type water heater, est. 80% eff.
Bradford White Model
M-1-20U6SS13
Electric
Lower Level Toilet
Room Ceiling
Lower Level Toilet
Rooms 2002 40%
Domestic Hot Water
30 gal storage, 2 coils, 4,500 Watt upper / 3,380 Watt lower, 80% est. eff.
Rheem Model # 81SV30D;
Serial # RH0202F098
70
Electric
Main Level Utility
closet next to
Employee Lounge
Employee Lounge
and Bathrooms
2002 40%
Domestic Hot Water
15 gal storage tank-type water heater, est. 80% eff.
Rheem Model 81VP15S;
Serial #0293300403
Electric
Upper Level Toilet
Room Ceiling
Upper Level Toilet
Rooms 1993 0%
Domestic Hot Water
15 gal storage tank-type water heater, est. 80% eff.
Rheem Model 64V-15S;
Serial #0684C08397
Electric
Upper Level Toilet
Room Ceiling
Upper Level Toilet
Rooms 1984 0%
Lighting See details - Appendix B - Electric
See details - Appendix
B Building varies avg 30%
Note: The remaining useful life of a system (in %) is an estimate based on the system date of built and existing conditions derived from visual inspection.
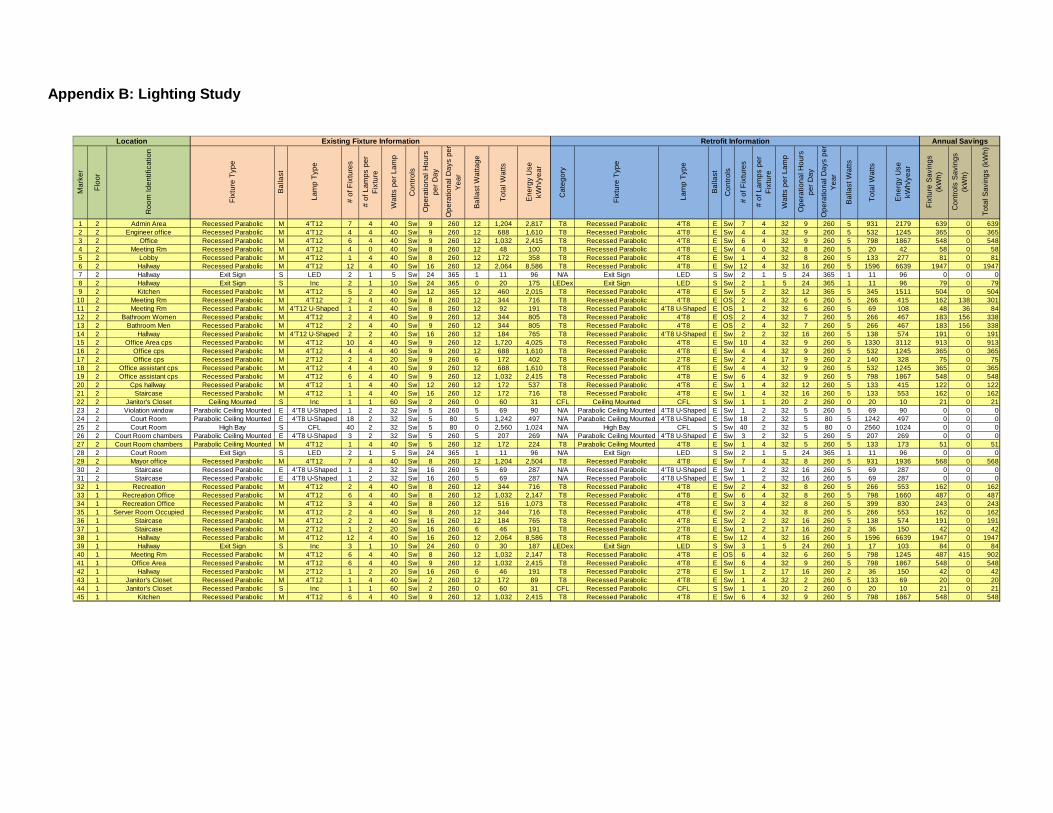
Appendix B: Lighting Study
Mar
ker
Floo
r
Roo
m Id
entif
icat
ion
Fixt
ure
Type
Bal
last
Lam
p Ty
pe
# of
Fix
ture
s
# of
Lam
ps p
er
Fixt
ure
Wat
ts p
er L
amp
Con
trols
Ope
ratio
nal H
ours
pe
r Day
Ope
ratio
nal D
ays
per
Yea
r
Bal
last
Wat
tage
Tota
l Wat
ts
Ene
rgy
Use
kW
h/ye
ar
Cat
egor
y
Fixt
ure
Type
Lam
p Ty
pe
Bal
last
Con
trols
# of
Fix
ture
s
# of
Lam
ps p
er
Fixt
ure
Wat
ts p
er L
amp
Ope
ratio
nal H
ours
pe
r Day
Ope
ratio
nal D
ays
per
Yea
r
Bal
last
Wat
ts
Tota
l Wat
ts
Ene
rgy
Use
kW
h/ye
ar
Fixt
ure
Sav
ings
(k
Wh)
Con
trols
Sav
ings
(k
Wh)
Tota
l Sav
ings
(kW
h)
1 2 Admin Area Recessed Parabolic M 4'T12 7 4 40 Sw 9 260 12 1,204 2,817 T8 Recessed Parabolic 4'T8 E Sw 7 4 32 9 260 5 931 2179 639 0 6392 2 Engineer office Recessed Parabolic M 4'T12 4 4 40 Sw 9 260 12 688 1,610 T8 Recessed Parabolic 4'T8 E Sw 4 4 32 9 260 5 532 1245 365 0 3653 2 Office Recessed Parabolic M 4'T12 6 4 40 Sw 9 260 12 1,032 2,415 T8 Recessed Parabolic 4'T8 E Sw 6 4 32 9 260 5 798 1867 548 0 5484 2 Meeting Rm Recessed Parabolic M 4'T12 4 0 40 Sw 8 260 12 48 100 T8 Recessed Parabolic 4'T8 E Sw 4 0 32 8 260 5 20 42 58 0 585 2 Lobby Recessed Parabolic M 4'T12 1 4 40 Sw 8 260 12 172 358 T8 Recessed Parabolic 4'T8 E Sw 1 4 32 8 260 5 133 277 81 0 816 2 Hallway Recessed Parabolic M 4'T12 12 4 40 Sw 16 260 12 2,064 8,586 T8 Recessed Parabolic 4'T8 E Sw 12 4 32 16 260 5 1596 6639 1947 0 19477 2 Hallway Exit Sign S LED 2 1 5 Sw 24 365 1 11 96 N/A Exit Sign LED S Sw 2 1 5 24 365 1 11 96 0 0 08 2 Hallway Exit Sign S Inc 2 1 10 Sw 24 365 0 20 175 LEDex Exit Sign LED S Sw 2 1 5 24 365 1 11 96 79 0 799 2 Kitchen Recessed Parabolic M 4'T12 5 2 40 Sw 12 365 12 460 2,015 T8 Recessed Parabolic 4'T8 E Sw 5 2 32 12 365 5 345 1511 504 0 50410 2 Meeting Rm Recessed Parabolic M 4'T12 2 4 40 Sw 8 260 12 344 716 T8 Recessed Parabolic 4'T8 E OS 2 4 32 6 260 5 266 415 162 138 30111 2 Meeting Rm Recessed Parabolic M 4'T12 U-Shaped 1 2 40 Sw 8 260 12 92 191 T8 Recessed Parabolic 4'T8 U-Shaped E OS 1 2 32 6 260 5 69 108 48 36 8412 2 Bathroom Women Recessed Parabolic M 4'T12 2 4 40 Sw 9 260 12 344 805 T8 Recessed Parabolic 4'T8 E OS 2 4 32 7 260 5 266 467 183 156 33813 2 Bathroom Men Recessed Parabolic M 4'T12 2 4 40 Sw 9 260 12 344 805 T8 Recessed Parabolic 4'T8 E OS 2 4 32 7 260 5 266 467 183 156 33814 2 Hallway Recessed Parabolic M 4'T12 U-Shaped 2 2 40 Sw 16 260 12 184 765 T8 Recessed Parabolic 4'T8 U-Shaped E Sw 2 2 32 16 260 5 138 574 191 0 19115 2 Office Area cps Recessed Parabolic M 4'T12 10 4 40 Sw 9 260 12 1,720 4,025 T8 Recessed Parabolic 4'T8 E Sw 10 4 32 9 260 5 1330 3112 913 0 91316 2 Office cps Recessed Parabolic M 4'T12 4 4 40 Sw 9 260 12 688 1,610 T8 Recessed Parabolic 4'T8 E Sw 4 4 32 9 260 5 532 1245 365 0 36517 2 Office cps Recessed Parabolic M 2'T12 2 4 20 Sw 9 260 6 172 402 T8 Recessed Parabolic 2'T8 E Sw 2 4 17 9 260 2 140 328 75 0 7518 2 Office assistant cps Recessed Parabolic M 4'T12 4 4 40 Sw 9 260 12 688 1,610 T8 Recessed Parabolic 4'T8 E Sw 4 4 32 9 260 5 532 1245 365 0 36519 2 Office assistant cps Recessed Parabolic M 4'T12 6 4 40 Sw 9 260 12 1,032 2,415 T8 Recessed Parabolic 4'T8 E Sw 6 4 32 9 260 5 798 1867 548 0 54820 2 Cps hallway Recessed Parabolic M 4'T12 1 4 40 Sw 12 260 12 172 537 T8 Recessed Parabolic 4'T8 E Sw 1 4 32 12 260 5 133 415 122 0 12221 2 Staircase Recessed Parabolic M 4'T12 1 4 40 Sw 16 260 12 172 716 T8 Recessed Parabolic 4'T8 E Sw 1 4 32 16 260 5 133 553 162 0 16222 2 Janitor's Closet Ceiling Mounted S Inc 1 1 60 Sw 2 260 0 60 31 CFL Ceiling Mounted CFL S Sw 1 1 20 2 260 0 20 10 21 0 2123 2 Violation window Parabolic Ceiling Mounted E 4'T8 U-Shaped 1 2 32 Sw 5 260 5 69 90 N/A Parabolic Ceiling Mounted 4'T8 U-Shaped E Sw 1 2 32 5 260 5 69 90 0 0 024 2 Court Room Parabolic Ceiling Mounted E 4'T8 U-Shaped 18 2 32 Sw 5 80 5 1,242 497 N/A Parabolic Ceiling Mounted 4'T8 U-Shaped E Sw 18 2 32 5 80 5 1242 497 0 0 025 2 Court Room High Bay S CFL 40 2 32 Sw 5 80 0 2,560 1,024 N/A High Bay CFL S Sw 40 2 32 5 80 0 2560 1024 0 0 026 2 Court Room chambers Parabolic Ceiling Mounted E 4'T8 U-Shaped 3 2 32 Sw 5 260 5 207 269 N/A Parabolic Ceiling Mounted 4'T8 U-Shaped E Sw 3 2 32 5 260 5 207 269 0 0 027 2 Court Room chambers Parabolic Ceiling Mounted M 4'T12 1 4 40 Sw 5 260 12 172 224 T8 Parabolic Ceiling Mounted 4'T8 E Sw 1 4 32 5 260 5 133 173 51 0 5128 2 Court Room Exit Sign S LED 2 1 5 Sw 24 365 1 11 96 N/A Exit Sign LED S Sw 2 1 5 24 365 1 11 96 0 0 029 2 Mayor office Recessed Parabolic M 4'T12 7 4 40 Sw 8 260 12 1,204 2,504 T8 Recessed Parabolic 4'T8 E Sw 7 4 32 8 260 5 931 1936 568 0 56830 2 Staircase Recessed Parabolic E 4'T8 U-Shaped 1 2 32 Sw 16 260 5 69 287 N/A Recessed Parabolic 4'T8 U-Shaped E Sw 1 2 32 16 260 5 69 287 0 0 031 2 Staircase Recessed Parabolic E 4'T8 U-Shaped 1 2 32 Sw 16 260 5 69 287 N/A Recessed Parabolic 4'T8 U-Shaped E Sw 1 2 32 16 260 5 69 287 0 0 032 1 Recreation Recessed Parabolic M 4'T12 2 4 40 Sw 8 260 12 344 716 T8 Recessed Parabolic 4'T8 E Sw 2 4 32 8 260 5 266 553 162 0 16233 1 Recreation Office Recessed Parabolic M 4'T12 6 4 40 Sw 8 260 12 1,032 2,147 T8 Recessed Parabolic 4'T8 E Sw 6 4 32 8 260 5 798 1660 487 0 48734 1 Recreation Office Recessed Parabolic M 4'T12 3 4 40 Sw 8 260 12 516 1,073 T8 Recessed Parabolic 4'T8 E Sw 3 4 32 8 260 5 399 830 243 0 24335 1 Server Room Occupied Recessed Parabolic M 4'T12 2 4 40 Sw 8 260 12 344 716 T8 Recessed Parabolic 4'T8 E Sw 2 4 32 8 260 5 266 553 162 0 16236 1 Staircase Recessed Parabolic M 4'T12 2 2 40 Sw 16 260 12 184 765 T8 Recessed Parabolic 4'T8 E Sw 2 2 32 16 260 5 138 574 191 0 19137 1 Staircase Recessed Parabolic M 2'T12 1 2 20 Sw 16 260 6 46 191 T8 Recessed Parabolic 2'T8 E Sw 1 2 17 16 260 2 36 150 42 0 4238 1 Hallway Recessed Parabolic M 4'T12 12 4 40 Sw 16 260 12 2,064 8,586 T8 Recessed Parabolic 4'T8 E Sw 12 4 32 16 260 5 1596 6639 1947 0 194739 1 Hallway Exit Sign S Inc 3 1 10 Sw 24 260 0 30 187 LEDex Exit Sign LED S Sw 3 1 5 24 260 1 17 103 84 0 8440 1 Meeting Rm Recessed Parabolic M 4'T12 6 4 40 Sw 8 260 12 1,032 2,147 T8 Recessed Parabolic 4'T8 E OS 6 4 32 6 260 5 798 1245 487 415 90241 1 Office Area Recessed Parabolic M 4'T12 6 4 40 Sw 9 260 12 1,032 2,415 T8 Recessed Parabolic 4'T8 E Sw 6 4 32 9 260 5 798 1867 548 0 54842 1 Hallway Recessed Parabolic M 2'T12 1 2 20 Sw 16 260 6 46 191 T8 Recessed Parabolic 2'T8 E Sw 1 2 17 16 260 2 36 150 42 0 4243 1 Janitor's Closet Recessed Parabolic M 4'T12 1 4 40 Sw 2 260 12 172 89 T8 Recessed Parabolic 4'T8 E Sw 1 4 32 2 260 5 133 69 20 0 2044 1 Janitor's Closet Recessed Parabolic S Inc 1 1 60 Sw 2 260 0 60 31 CFL Recessed Parabolic CFL S Sw 1 1 20 2 260 0 20 10 21 0 2145 1 Kitchen Recessed Parabolic M 4'T12 6 4 40 Sw 9 260 12 1,032 2,415 T8 Recessed Parabolic 4'T8 E Sw 6 4 32 9 260 5 798 1867 548 0 548
Location Existing Fixture Information Retrofit Information Annual Savings
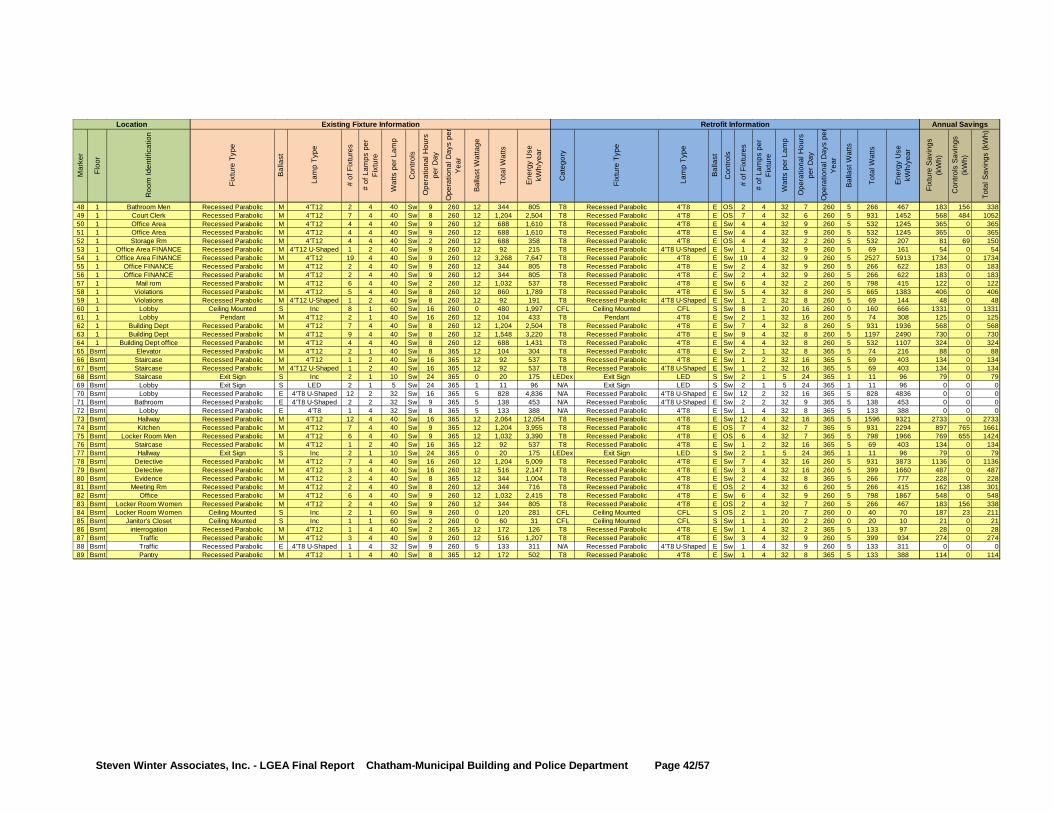
Steven Winter Associates, Inc. - LGEA Final Report Chatham-Municipal Building and Police Department Page 42/57
Mar
ker
Floo
r
Roo
m Id
entif
icat
ion
Fixt
ure
Type
Bal
last
Lam
p Ty
pe
# of
Fix
ture
s
# of
Lam
ps p
er
Fixt
ure
Wat
ts p
er L
amp
Con
trols
Ope
ratio
nal H
ours
pe
r Day
Ope
ratio
nal D
ays
per
Yea
r
Bal
last
Wat
tage
Tota
l Wat
ts
Ene
rgy
Use
kW
h/ye
ar
Cat
egor
y
Fixt
ure
Type
Lam
p Ty
pe
Bal
last
Con
trols
# of
Fix
ture
s
# of
Lam
ps p
er
Fixt
ure
Wat
ts p
er L
amp
Ope
ratio
nal H
ours
pe
r Day
Ope
ratio
nal D
ays
per
Yea
r
Bal
last
Wat
ts
Tota
l Wat
ts
Ene
rgy
Use
kW
h/ye
ar
Fixt
ure
Sav
ings
(k
Wh)
Con
trols
Sav
ings
(k
Wh)
Tota
l Sav
ings
(kW
h)
48 1 Bathroom Men Recessed Parabolic M 4'T12 2 4 40 Sw 9 260 12 344 805 T8 Recessed Parabolic 4'T8 E OS 2 4 32 7 260 5 266 467 183 156 33849 1 Court Clerk Recessed Parabolic M 4'T12 7 4 40 Sw 8 260 12 1,204 2,504 T8 Recessed Parabolic 4'T8 E OS 7 4 32 6 260 5 931 1452 568 484 105250 1 Office Area Recessed Parabolic M 4'T12 4 4 40 Sw 9 260 12 688 1,610 T8 Recessed Parabolic 4'T8 E Sw 4 4 32 9 260 5 532 1245 365 0 36551 1 Office Area Recessed Parabolic M 4'T12 4 4 40 Sw 9 260 12 688 1,610 T8 Recessed Parabolic 4'T8 E Sw 4 4 32 9 260 5 532 1245 365 0 36552 1 Storage Rm Recessed Parabolic M 4'T12 4 4 40 Sw 2 260 12 688 358 T8 Recessed Parabolic 4'T8 E OS 4 4 32 2 260 5 532 207 81 69 15053 1 Office Area FINANCE Recessed Parabolic M 4'T12 U-Shaped 1 2 40 Sw 9 260 12 92 215 T8 Recessed Parabolic 4'T8 U-Shaped E Sw 1 2 32 9 260 5 69 161 54 0 5454 1 Office Area FINANCE Recessed Parabolic M 4'T12 19 4 40 Sw 9 260 12 3,268 7,647 T8 Recessed Parabolic 4'T8 E Sw 19 4 32 9 260 5 2527 5913 1734 0 173455 1 Office FINANCE Recessed Parabolic M 4'T12 2 4 40 Sw 9 260 12 344 805 T8 Recessed Parabolic 4'T8 E Sw 2 4 32 9 260 5 266 622 183 0 18356 1 Office FINANCE Recessed Parabolic M 4'T12 2 4 40 Sw 9 260 12 344 805 T8 Recessed Parabolic 4'T8 E Sw 2 4 32 9 260 5 266 622 183 0 18357 1 Mail rom Recessed Parabolic M 4'T12 6 4 40 Sw 2 260 12 1,032 537 T8 Recessed Parabolic 4'T8 E Sw 6 4 32 2 260 5 798 415 122 0 12258 1 Violations Recessed Parabolic M 4'T12 5 4 40 Sw 8 260 12 860 1,789 T8 Recessed Parabolic 4'T8 E Sw 5 4 32 8 260 5 665 1383 406 0 40659 1 Violations Recessed Parabolic M 4'T12 U-Shaped 1 2 40 Sw 8 260 12 92 191 T8 Recessed Parabolic 4'T8 U-Shaped E Sw 1 2 32 8 260 5 69 144 48 0 4860 1 Lobby Ceiling Mounted S Inc 8 1 60 Sw 16 260 0 480 1,997 CFL Ceiling Mounted CFL S Sw 8 1 20 16 260 0 160 666 1331 0 133161 1 Lobby Pendant M 4'T12 2 1 40 Sw 16 260 12 104 433 T8 Pendant 4'T8 E Sw 2 1 32 16 260 5 74 308 125 0 12562 1 Building Dept Recessed Parabolic M 4'T12 7 4 40 Sw 8 260 12 1,204 2,504 T8 Recessed Parabolic 4'T8 E Sw 7 4 32 8 260 5 931 1936 568 0 56863 1 Building Dept Recessed Parabolic M 4'T12 9 4 40 Sw 8 260 12 1,548 3,220 T8 Recessed Parabolic 4'T8 E Sw 9 4 32 8 260 5 1197 2490 730 0 73064 1 Building Dept office Recessed Parabolic M 4'T12 4 4 40 Sw 8 260 12 688 1,431 T8 Recessed Parabolic 4'T8 E Sw 4 4 32 8 260 5 532 1107 324 0 32465 Bsmt Elevator Recessed Parabolic M 4'T12 2 1 40 Sw 8 365 12 104 304 T8 Recessed Parabolic 4'T8 E Sw 2 1 32 8 365 5 74 216 88 0 8866 Bsmt Staircase Recessed Parabolic M 4'T12 1 2 40 Sw 16 365 12 92 537 T8 Recessed Parabolic 4'T8 E Sw 1 2 32 16 365 5 69 403 134 0 13467 Bsmt Staircase Recessed Parabolic M 4'T12 U-Shaped 1 2 40 Sw 16 365 12 92 537 T8 Recessed Parabolic 4'T8 U-Shaped E Sw 1 2 32 16 365 5 69 403 134 0 13468 Bsmt Staircase Exit Sign S Inc 2 1 10 Sw 24 365 0 20 175 LEDex Exit Sign LED S Sw 2 1 5 24 365 1 11 96 79 0 7969 Bsmt Lobby Exit Sign S LED 2 1 5 Sw 24 365 1 11 96 N/A Exit Sign LED S Sw 2 1 5 24 365 1 11 96 0 0 070 Bsmt Lobby Recessed Parabolic E 4'T8 U-Shaped 12 2 32 Sw 16 365 5 828 4,836 N/A Recessed Parabolic 4'T8 U-Shaped E Sw 12 2 32 16 365 5 828 4836 0 0 071 Bsmt Bathroom Recessed Parabolic E 4'T8 U-Shaped 2 2 32 Sw 9 365 5 138 453 N/A Recessed Parabolic 4'T8 U-Shaped E Sw 2 2 32 9 365 5 138 453 0 0 072 Bsmt Lobby Recessed Parabolic E 4'T8 1 4 32 Sw 8 365 5 133 388 N/A Recessed Parabolic 4'T8 E Sw 1 4 32 8 365 5 133 388 0 0 073 Bsmt Hallway Recessed Parabolic M 4'T12 12 4 40 Sw 16 365 12 2,064 12,054 T8 Recessed Parabolic 4'T8 E Sw 12 4 32 16 365 5 1596 9321 2733 0 273374 Bsmt Kitchen Recessed Parabolic M 4'T12 7 4 40 Sw 9 365 12 1,204 3,955 T8 Recessed Parabolic 4'T8 E OS 7 4 32 7 365 5 931 2294 897 765 166175 Bsmt Locker Room Men Recessed Parabolic M 4'T12 6 4 40 Sw 9 365 12 1,032 3,390 T8 Recessed Parabolic 4'T8 E OS 6 4 32 7 365 5 798 1966 769 655 142476 Bsmt Staircase Recessed Parabolic M 4'T12 1 2 40 Sw 16 365 12 92 537 T8 Recessed Parabolic 4'T8 E Sw 1 2 32 16 365 5 69 403 134 0 13477 Bsmt Hallway Exit Sign S Inc 2 1 10 Sw 24 365 0 20 175 LEDex Exit Sign LED S Sw 2 1 5 24 365 1 11 96 79 0 7978 Bsmt Detective Recessed Parabolic M 4'T12 7 4 40 Sw 16 260 12 1,204 5,009 T8 Recessed Parabolic 4'T8 E Sw 7 4 32 16 260 5 931 3873 1136 0 113679 Bsmt Detective Recessed Parabolic M 4'T12 3 4 40 Sw 16 260 12 516 2,147 T8 Recessed Parabolic 4'T8 E Sw 3 4 32 16 260 5 399 1660 487 0 48780 Bsmt Evidence Recessed Parabolic M 4'T12 2 4 40 Sw 8 365 12 344 1,004 T8 Recessed Parabolic 4'T8 E Sw 2 4 32 8 365 5 266 777 228 0 22881 Bsmt Meeting Rm Recessed Parabolic M 4'T12 2 4 40 Sw 8 260 12 344 716 T8 Recessed Parabolic 4'T8 E OS 2 4 32 6 260 5 266 415 162 138 30182 Bsmt Office Recessed Parabolic M 4'T12 6 4 40 Sw 9 260 12 1,032 2,415 T8 Recessed Parabolic 4'T8 E Sw 6 4 32 9 260 5 798 1867 548 0 54883 Bsmt Locker Room Women Recessed Parabolic M 4'T12 2 4 40 Sw 9 260 12 344 805 T8 Recessed Parabolic 4'T8 E OS 2 4 32 7 260 5 266 467 183 156 33884 Bsmt Locker Room Women Ceiling Mounted S Inc 2 1 60 Sw 9 260 0 120 281 CFL Ceiling Mounted CFL S OS 2 1 20 7 260 0 40 70 187 23 21185 Bsmt Janitor's Closet Ceiling Mounted S Inc 1 1 60 Sw 2 260 0 60 31 CFL Ceiling Mounted CFL S Sw 1 1 20 2 260 0 20 10 21 0 2186 Bsmt interrogation Recessed Parabolic M 4'T12 1 4 40 Sw 2 365 12 172 126 T8 Recessed Parabolic 4'T8 E Sw 1 4 32 2 365 5 133 97 28 0 2887 Bsmt Traffic Recessed Parabolic M 4'T12 3 4 40 Sw 9 260 12 516 1,207 T8 Recessed Parabolic 4'T8 E Sw 3 4 32 9 260 5 399 934 274 0 27488 Bsmt Traffic Recessed Parabolic E 4'T8 U-Shaped 1 4 32 Sw 9 260 5 133 311 N/A Recessed Parabolic 4'T8 U-Shaped E Sw 1 4 32 9 260 5 133 311 0 0 089 Bsmt Pantry Recessed Parabolic M 4'T12 1 4 40 Sw 8 365 12 172 502 T8 Recessed Parabolic 4'T8 E Sw 1 4 32 8 365 5 133 388 114 0 114
Location Existing Fixture Information Retrofit Information Annual Savings
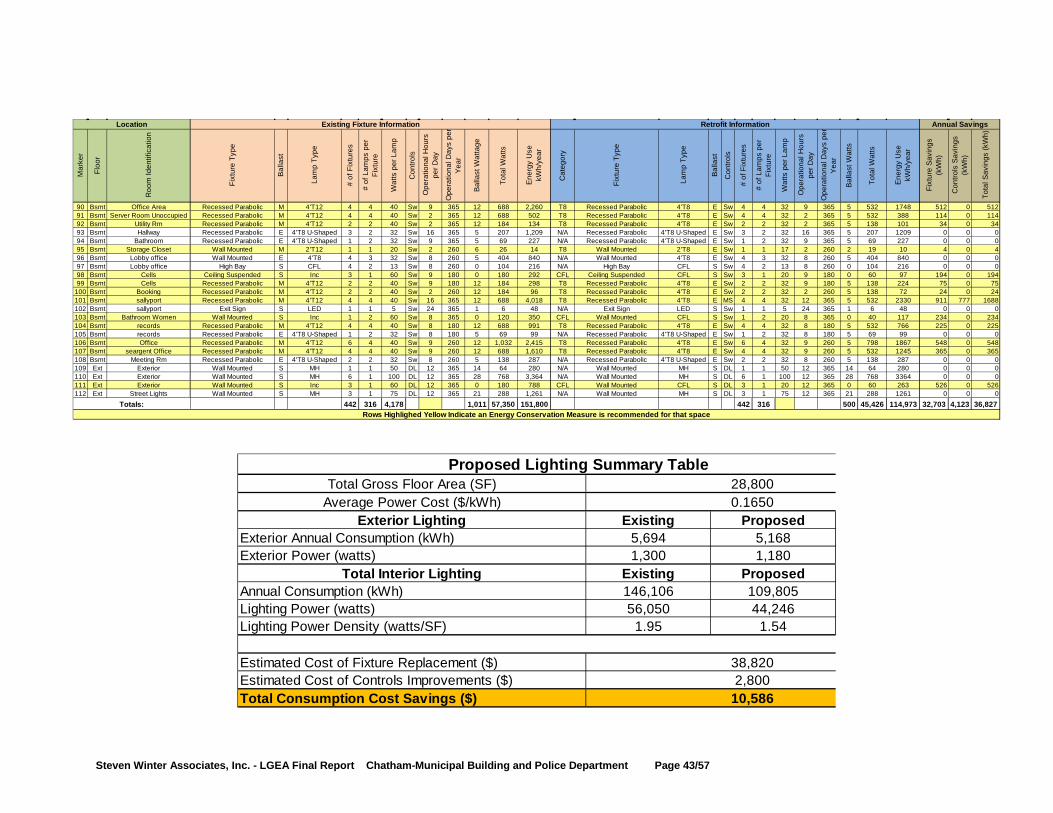
Steven Winter Associates, Inc. - LGEA Final Report Chatham-Municipal Building and Police Department Page 43/57
Mar
ker
Floo
r
Roo
m Id
entif
icat
ion
Fixt
ure
Type
Bal
last
Lam
p Ty
pe
# of
Fix
ture
s
# of
Lam
ps p
er
Fixt
ure
Wat
ts p
er L
amp
Con
trols
Ope
ratio
nal H
ours
pe
r Day
Ope
ratio
nal D
ays
per
Yea
r
Bal
last
Wat
tage
Tota
l Wat
ts
Ene
rgy
Use
kW
h/ye
ar
Cat
egor
y
Fixt
ure
Type
Lam
p Ty
pe
Bal
last
Con
trols
# of
Fix
ture
s
# of
Lam
ps p
er
Fixt
ure
Wat
ts p
er L
amp
Ope
ratio
nal H
ours
pe
r Day
Ope
ratio
nal D
ays
per
Yea
r
Bal
last
Wat
ts
Tota
l Wat
ts
Ene
rgy
Use
kW
h/ye
ar
Fixt
ure
Sav
ings
(k
Wh)
Con
trols
Sav
ings
(k
Wh)
Tota
l Sav
ings
(kW
h)
90 Bsmt Office Area Recessed Parabolic M 4'T12 4 4 40 Sw 9 365 12 688 2,260 T8 Recessed Parabolic 4'T8 E Sw 4 4 32 9 365 5 532 1748 512 0 51291 Bsmt Server Room Unoccupied Recessed Parabolic M 4'T12 4 4 40 Sw 2 365 12 688 502 T8 Recessed Parabolic 4'T8 E Sw 4 4 32 2 365 5 532 388 114 0 11492 Bsmt Utility Rm Recessed Parabolic M 4'T12 2 2 40 Sw 2 365 12 184 134 T8 Recessed Parabolic 4'T8 E Sw 2 2 32 2 365 5 138 101 34 0 3493 Bsmt Hallway Recessed Parabolic E 4'T8 U-Shaped 3 2 32 Sw 16 365 5 207 1,209 N/A Recessed Parabolic 4'T8 U-Shaped E Sw 3 2 32 16 365 5 207 1209 0 0 094 Bsmt Bathroom Recessed Parabolic E 4'T8 U-Shaped 1 2 32 Sw 9 365 5 69 227 N/A Recessed Parabolic 4'T8 U-Shaped E Sw 1 2 32 9 365 5 69 227 0 0 095 Bsmt Storage Closet Wall Mounted M 2'T12 1 1 20 Sw 2 260 6 26 14 T8 Wall Mounted 2'T8 E Sw 1 1 17 2 260 2 19 10 4 0 496 Bsmt Lobby office Wall Mounted E 4'T8 4 3 32 Sw 8 260 5 404 840 N/A Wall Mounted 4'T8 E Sw 4 3 32 8 260 5 404 840 0 0 097 Bsmt Lobby office High Bay S CFL 4 2 13 Sw 8 260 0 104 216 N/A High Bay CFL S Sw 4 2 13 8 260 0 104 216 0 0 098 Bsmt Cells Ceiling Suspended S Inc 3 1 60 Sw 9 180 0 180 292 CFL Ceiling Suspended CFL S Sw 3 1 20 9 180 0 60 97 194 0 19499 Bsmt Cells Recessed Parabolic M 4'T12 2 2 40 Sw 9 180 12 184 298 T8 Recessed Parabolic 4'T8 E Sw 2 2 32 9 180 5 138 224 75 0 75
100 Bsmt Booking Recessed Parabolic M 4'T12 2 2 40 Sw 2 260 12 184 96 T8 Recessed Parabolic 4'T8 E Sw 2 2 32 2 260 5 138 72 24 0 24101 Bsmt sallyport Recessed Parabolic M 4'T12 4 4 40 Sw 16 365 12 688 4,018 T8 Recessed Parabolic 4'T8 E MS 4 4 32 12 365 5 532 2330 911 777 1688102 Bsmt sallyport Exit Sign S LED 1 1 5 Sw 24 365 1 6 48 N/A Exit Sign LED S Sw 1 1 5 24 365 1 6 48 0 0 0103 Bsmt Bathroom Women Wall Mounted S Inc 1 2 60 Sw 8 365 0 120 350 CFL Wall Mounted CFL S Sw 1 2 20 8 365 0 40 117 234 0 234104 Bsmt records Recessed Parabolic M 4'T12 4 4 40 Sw 8 180 12 688 991 T8 Recessed Parabolic 4'T8 E Sw 4 4 32 8 180 5 532 766 225 0 225105 Bsmt records Recessed Parabolic E 4'T8 U-Shaped 1 2 32 Sw 8 180 5 69 99 N/A Recessed Parabolic 4'T8 U-Shaped E Sw 1 2 32 8 180 5 69 99 0 0 0106 Bsmt Office Recessed Parabolic M 4'T12 6 4 40 Sw 9 260 12 1,032 2,415 T8 Recessed Parabolic 4'T8 E Sw 6 4 32 9 260 5 798 1867 548 0 548107 Bsmt seargent Office Recessed Parabolic M 4'T12 4 4 40 Sw 9 260 12 688 1,610 T8 Recessed Parabolic 4'T8 E Sw 4 4 32 9 260 5 532 1245 365 0 365108 Bsmt Meeting Rm Recessed Parabolic E 4'T8 U-Shaped 2 2 32 Sw 8 260 5 138 287 N/A Recessed Parabolic 4'T8 U-Shaped E Sw 2 2 32 8 260 5 138 287 0 0 0109 Ext Exterior Wall Mounted S MH 1 1 50 DL 12 365 14 64 280 N/A Wall Mounted MH S DL 1 1 50 12 365 14 64 280 0 0 0110 Ext Exterior Wall Mounted S MH 6 1 100 DL 12 365 28 768 3,364 N/A Wall Mounted MH S DL 6 1 100 12 365 28 768 3364 0 0 0111 Ext Exterior Wall Mounted S Inc 3 1 60 DL 12 365 0 180 788 CFL Wall Mounted CFL S DL 3 1 20 12 365 0 60 263 526 0 526112 Ext Street Lights Wall Mounted S MH 3 1 75 DL 12 365 21 288 1,261 N/A Wall Mounted MH S DL 3 1 75 12 365 21 288 1261 0 0 0
442 316 4,178 1,011 57,350 151,800 442 316 500 45,426 114,973 32,703 4,123 36,827Totals:Rows Highlighed Yellow Indicate an Energy Conservation Measure is recommended for that space
Location Existing Fixture Information Retrofit Information Annual Savings
Average Power Cost ($/kWh) 0.1650
10,586
38,820
Proposed Lighting Summary Table28,800
ExistingExterior Annual Consumption (kWh)
56,050
5,694
Total Consumption Cost Savings ($)Estimated Cost of Controls Improvements ($)
146,106
1.54
2,800Estimated Cost of Fixture Replacement ($)
1.95
Annual Consumption (kWh)
Lighting Power Density (watts/SF)Lighting Power (watts)
109,80544,246
Total Interior Lighting Existing ProposedExterior Power (watts) 1,300 1,180
Proposed
Total Gross Floor Area (SF)
Exterior Lighting5,168
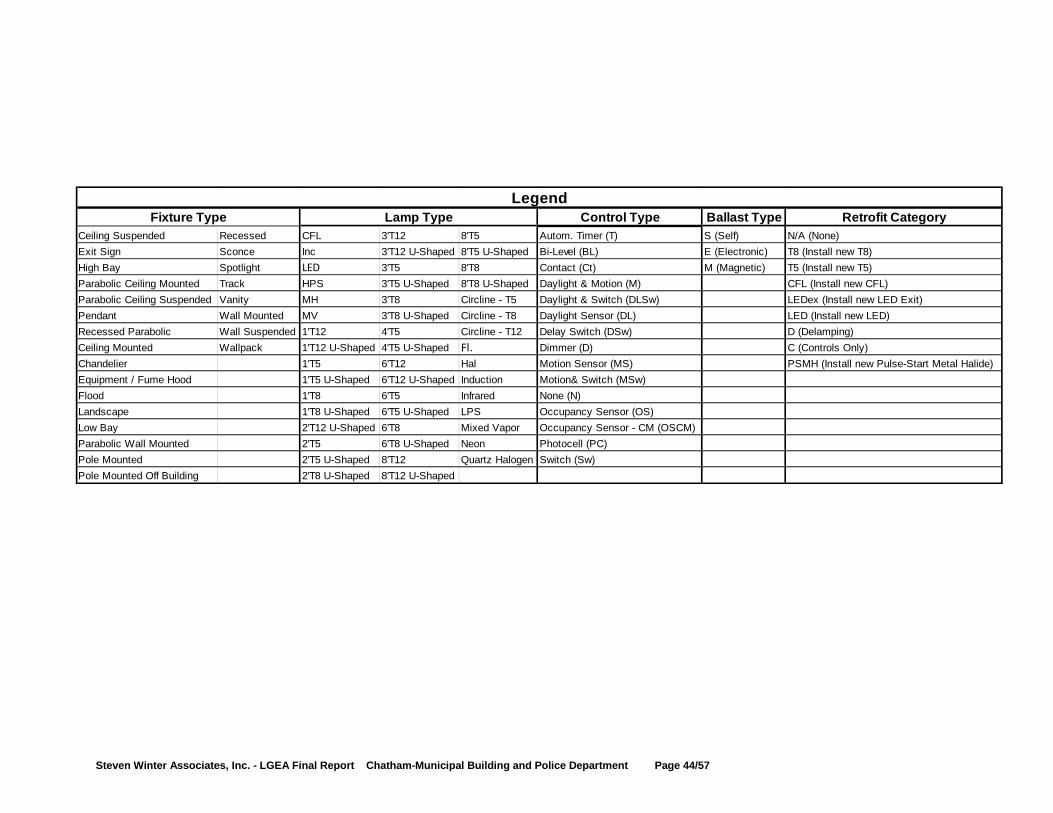
Steven Winter Associates, Inc. - LGEA Final Report Chatham-Municipal Building and Police Department Page 44/57
Control Type Ballast Type Retrofit CategoryCeiling Suspended Recessed CFL 3'T12 8'T5 Autom. Timer (T) S (Self) N/A (None)Exit Sign Sconce Inc 3'T12 U-Shaped 8'T5 U-Shaped Bi-Level (BL) E (Electronic) T8 (Install new T8)High Bay Spotlight LED 3'T5 8'T8 Contact (Ct) M (Magnetic) T5 (Install new T5)Parabolic Ceiling Mounted Track HPS 3'T5 U-Shaped 8'T8 U-Shaped Daylight & Motion (M) CFL (Install new CFL)Parabolic Ceiling Suspended Vanity MH 3'T8 Circline - T5 Daylight & Switch (DLSw) LEDex (Install new LED Exit)Pendant Wall Mounted MV 3'T8 U-Shaped Circline - T8 Daylight Sensor (DL) LED (Install new LED)Recessed Parabolic Wall Suspended 1'T12 4'T5 Circline - T12 Delay Switch (DSw) D (Delamping)Ceiling Mounted Wallpack 1'T12 U-Shaped 4'T5 U-Shaped Fl. Dimmer (D) C (Controls Only)Chandelier 1'T5 6'T12 Hal Motion Sensor (MS) PSMH (Install new Pulse-Start Metal Halide)Equipment / Fume Hood 1'T5 U-Shaped 6'T12 U-Shaped Induction Motion& Switch (MSw)Flood 1'T8 6'T5 Infrared None (N)Landscape 1'T8 U-Shaped 6'T5 U-Shaped LPS Occupancy Sensor (OS)Low Bay 2'T12 U-Shaped 6'T8 Mixed Vapor Occupancy Sensor - CM (OSCM)Parabolic Wall Mounted 2'T5 6'T8 U-Shaped Neon Photocell (PC)Pole Mounted 2'T5 U-Shaped 8'T12 Quartz Halogen Switch (Sw)Pole Mounted Off Building 2'T8 U-Shaped 8'T12 U-Shaped
LegendFixture Type Lamp Type
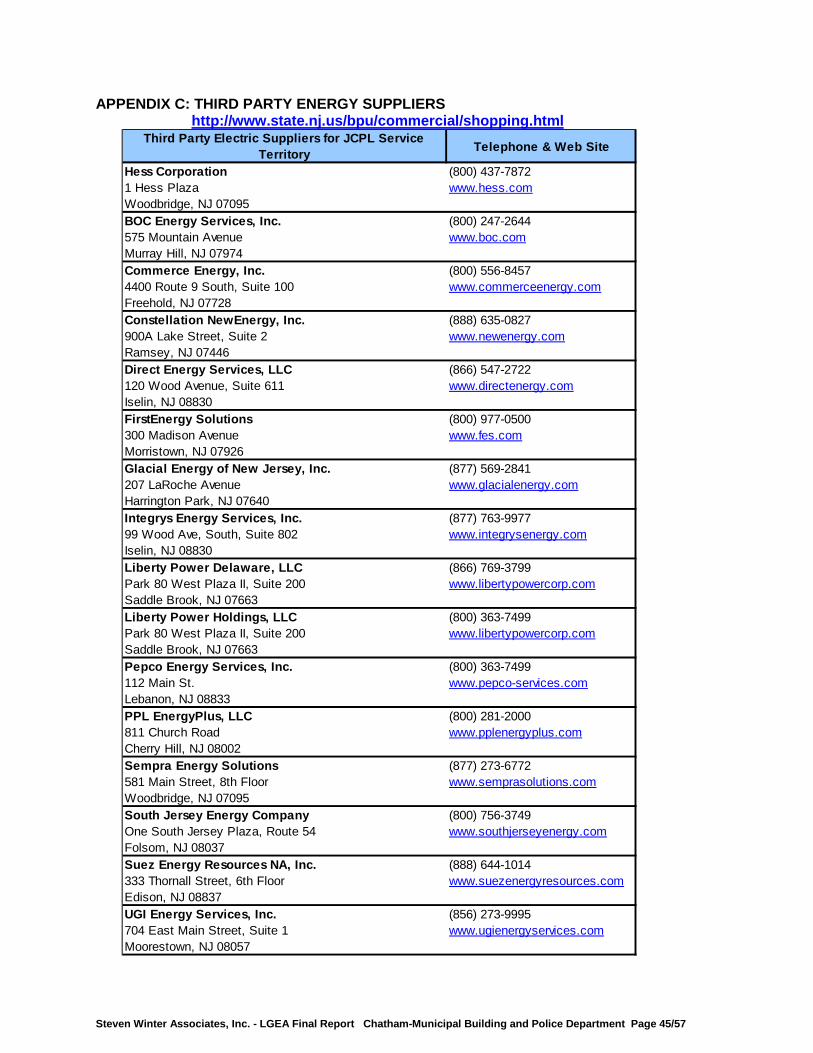
Steven Winter Associates, Inc. - LGEA Final Report Chatham-Municipal Building and Police Department Page 45/57
APPENDIX C: THIRD PARTY ENERGY SUPPLIERS http://www.state.nj.us/bpu/commercial/shopping.html
Third Party Electric Suppliers for JCPL Service Territory Telephone & Web Site
Hess Corporation (800) 437-78721 Hess Plaza www.hess.comWoodbridge, NJ 07095BOC Energy Services, Inc. (800) 247-2644575 Mountain Avenue www.boc.comMurray Hill, NJ 07974Commerce Energy, Inc. (800) 556-84574400 Route 9 South, Suite 100 www.commerceenergy.comFreehold, NJ 07728Constellation NewEnergy, Inc. (888) 635-0827900A Lake Street, Suite 2 www.newenergy.comRamsey, NJ 07446Direct Energy Services, LLC (866) 547-2722120 Wood Avenue, Suite 611 www.directenergy.comIselin, NJ 08830FirstEnergy Solutions (800) 977-0500300 Madison Avenue www.fes.comMorristown, NJ 07926Glacial Energy of New Jersey, Inc. (877) 569-2841207 LaRoche Avenue www.glacialenergy.comHarrington Park, NJ 07640Integrys Energy Services, Inc. (877) 763-997799 Wood Ave, South, Suite 802 www.integrysenergy.comIselin, NJ 08830Liberty Power Delaware, LLC (866) 769-3799Park 80 West Plaza II, Suite 200 www.libertypowercorp.comSaddle Brook, NJ 07663Liberty Power Holdings, LLC (800) 363-7499Park 80 West Plaza II, Suite 200 www.libertypowercorp.comSaddle Brook, NJ 07663Pepco Energy Services, Inc. (800) 363-7499112 Main St. www.pepco-services.comLebanon, NJ 08833PPL EnergyPlus, LLC (800) 281-2000811 Church Road www.pplenergyplus.comCherry Hill, NJ 08002Sempra Energy Solutions (877) 273-6772581 Main Street, 8th Floor www.semprasolutions.comWoodbridge, NJ 07095South Jersey Energy Company (800) 756-3749One South Jersey Plaza, Route 54 www.southjerseyenergy.comFolsom, NJ 08037Suez Energy Resources NA, Inc. (888) 644-1014333 Thornall Street, 6th Floor www.suezenergyresources.comEdison, NJ 08837UGI Energy Services, Inc. (856) 273-9995704 East Main Street, Suite 1 www.ugienergyservices.comMoorestown, NJ 08057
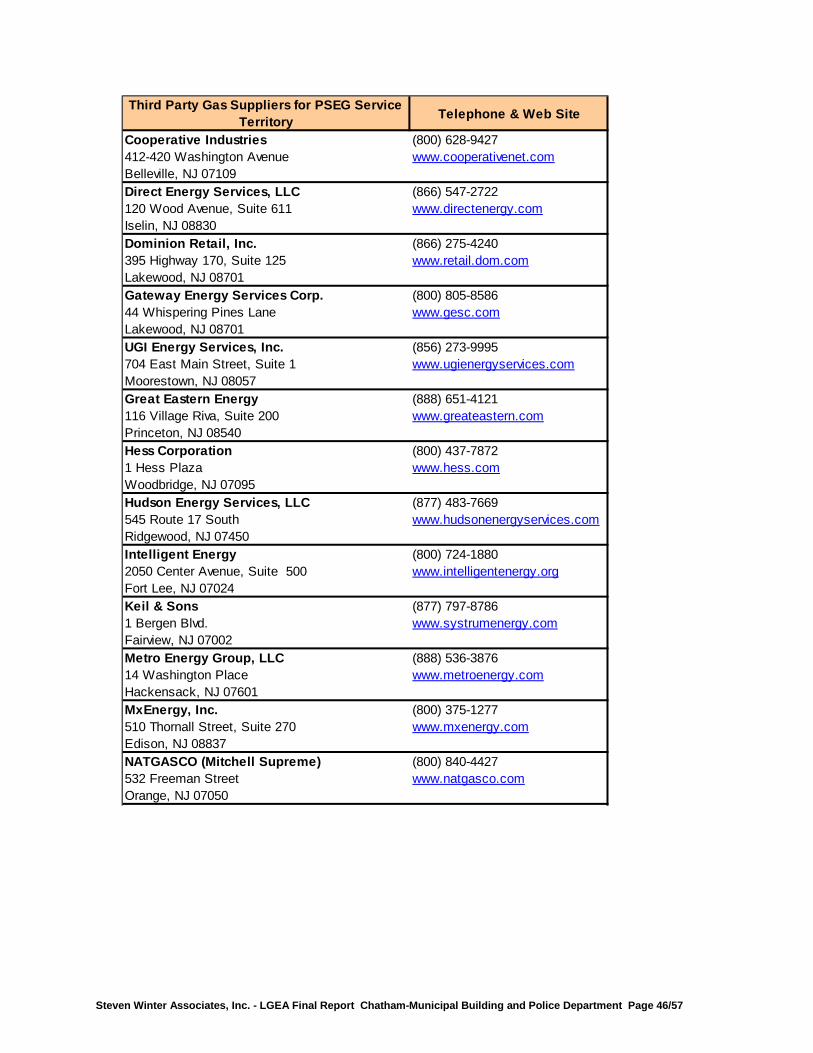
Steven Winter Associates, Inc. - LGEA Final Report Chatham-Municipal Building and Police Department Page 46/57
Third Party Gas Suppliers for PSEG Service Territory Telephone & Web Site
Cooperative Industries (800) 628-9427412-420 Washington Avenue www.cooperativenet.comBelleville, NJ 07109Direct Energy Services, LLC (866) 547-2722120 Wood Avenue, Suite 611 www.directenergy.comIselin, NJ 08830Dominion Retail, Inc. (866) 275-4240395 Highway 170, Suite 125 www.retail.dom.comLakewood, NJ 08701Gateway Energy Services Corp. (800) 805-858644 Whispering Pines Lane www.gesc.comLakewood, NJ 08701UGI Energy Services, Inc. (856) 273-9995704 East Main Street, Suite 1 www.ugienergyservices.comMoorestown, NJ 08057Great Eastern Energy (888) 651-4121116 Village Riva, Suite 200 www.greateastern.comPrinceton, NJ 08540Hess Corporation (800) 437-78721 Hess Plaza www.hess.comWoodbridge, NJ 07095Hudson Energy Services, LLC (877) 483-7669545 Route 17 South www.hudsonenergyservices.comRidgewood, NJ 07450Intelligent Energy (800) 724-18802050 Center Avenue, Suite 500 www.intelligentenergy.orgFort Lee, NJ 07024Keil & Sons (877) 797-87861 Bergen Blvd. www.systrumenergy.comFairview, NJ 07002Metro Energy Group, LLC (888) 536-387614 Washington Place www.metroenergy.comHackensack, NJ 07601MxEnergy, Inc. (800) 375-1277510 Thornall Street, Suite 270 www.mxenergy.comEdison, NJ 08837NATGASCO (Mitchell Supreme) (800) 840-4427532 Freeman Street www.natgasco.comOrange, NJ 07050
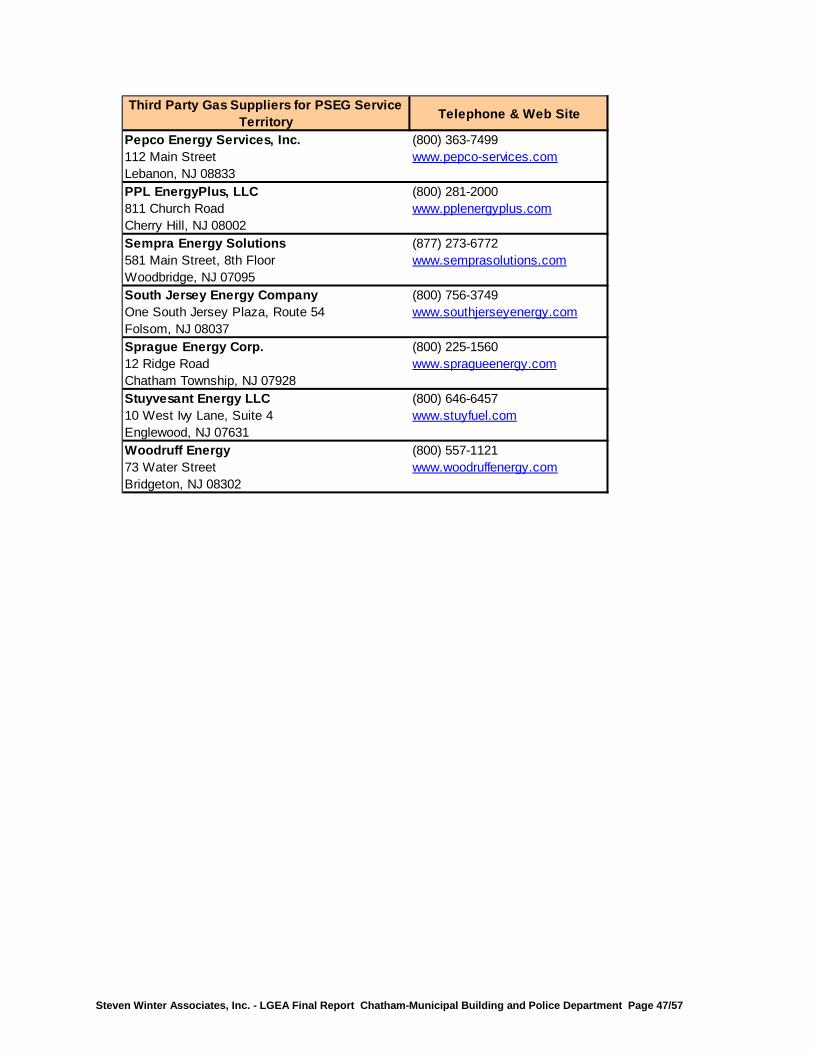
Steven Winter Associates, Inc. - LGEA Final Report Chatham-Municipal Building and Police Department Page 47/57
Third Party Gas Suppliers for PSEG Service Territory Telephone & Web Site
Pepco Energy Services, Inc. (800) 363-7499112 Main Street www.pepco-services.comLebanon, NJ 08833PPL EnergyPlus, LLC (800) 281-2000811 Church Road www.pplenergyplus.comCherry Hill, NJ 08002Sempra Energy Solutions (877) 273-6772581 Main Street, 8th Floor www.semprasolutions.comWoodbridge, NJ 07095South Jersey Energy Company (800) 756-3749One South Jersey Plaza, Route 54 www.southjerseyenergy.comFolsom, NJ 08037Sprague Energy Corp. (800) 225-156012 Ridge Road www.spragueenergy.comChatham Township, NJ 07928Stuyvesant Energy LLC (800) 646-645710 West Ivy Lane, Suite 4 www.stuyfuel.comEnglewood, NJ 07631Woodruff Energy (800) 557-112173 Water Street www.woodruffenergy.comBridgeton, NJ 08302
Steven Winter Associates, Inc. - LGEA Final Report Chatham-Municipal Building and Police Department Page 48/57
APPENDIX D: GLOSSARY AND METHOD OF CALCULATIONS Net ECM Cost: The net ECM cost is the cost experienced by the customer, which is typically the total cost (materials + labor) of installing the measure minus any available incentives. Both the total cost and the incentive amounts are expressed in the summary for each ECM. Annual Energy Cost Savings (AECS): This value is determined by the audit firm based on the calculated energy savings (kWh or Therm) of each ECM and the calculated energy costs of the building. Lifetime Energy Cost Savings (LECS): This measure estimates the energy cost savings over the lifetime of the ECM. It can be a simple estimation based on fixed energy costs. If desired, this value can factor in an annual increase in energy costs as long as the source is provided. Simple Payback: This is a simple measure that displays how long the ECM will take to break-even based on the annual energy and maintenance savings of the measure. ECM Lifetime: This is included with each ECM so that the owner can see how long the ECM will be in place and whether or not it will exceed the simple payback period. Additional guidance for calculating ECM lifetimes can be found below. This value can come from manufacturer’s rated lifetime or warranty, the ASHRAE rated lifetime, or any other valid source. Operating Cost Savings (OCS): This calculation is an annual operating savings for the ECM. It is the difference in the operating, maintenance, and / or equipment replacement costs of the existing case versus the ECM. In the case where an ECM lifetime will be longer than the existing measure (such as LED lighting versus fluorescent) the operating savings will factor in the cost of replacing the units to match the lifetime of the ECM. In this case or in one where one-time repairs are made, the total replacement / repair sum is averaged over the lifetime of the ECM. Return on Investment (ROI): The ROI is expresses the percentage return of the investment based on the lifetime cost savings of the ECM. This value can be included as an annual or lifetime value, or both. Net Present Value (NPV): The NPV calculates the present value of an investment’s future cash flows based on the time value of money, which is accounted for by a discount rate (assumes bond rate of 3.2%). Internal Rate of Return (IRR): The IRR expresses an annual rate that results in a break-even point for the investment. If the owner is currently experiencing a lower return on their capital than the IRR, the project is financially advantageous. This measure also allows the owner to compare ECMs against each other to determine the most appealing choices. Gas Rate and Electric Rate ($/therm and $/kWh): The gas rate and electric rate used in the financial analysis is the total annual energy cost divided by the total annual energy usage for the 12 month billing period studied. The graphs of the monthly gas and electric rates reflect the total monthly energy costs divided by the monthly usage, and display how the average rate fluctuates throughout the year. The average annual rate is the only rate used in energy savings calculations.
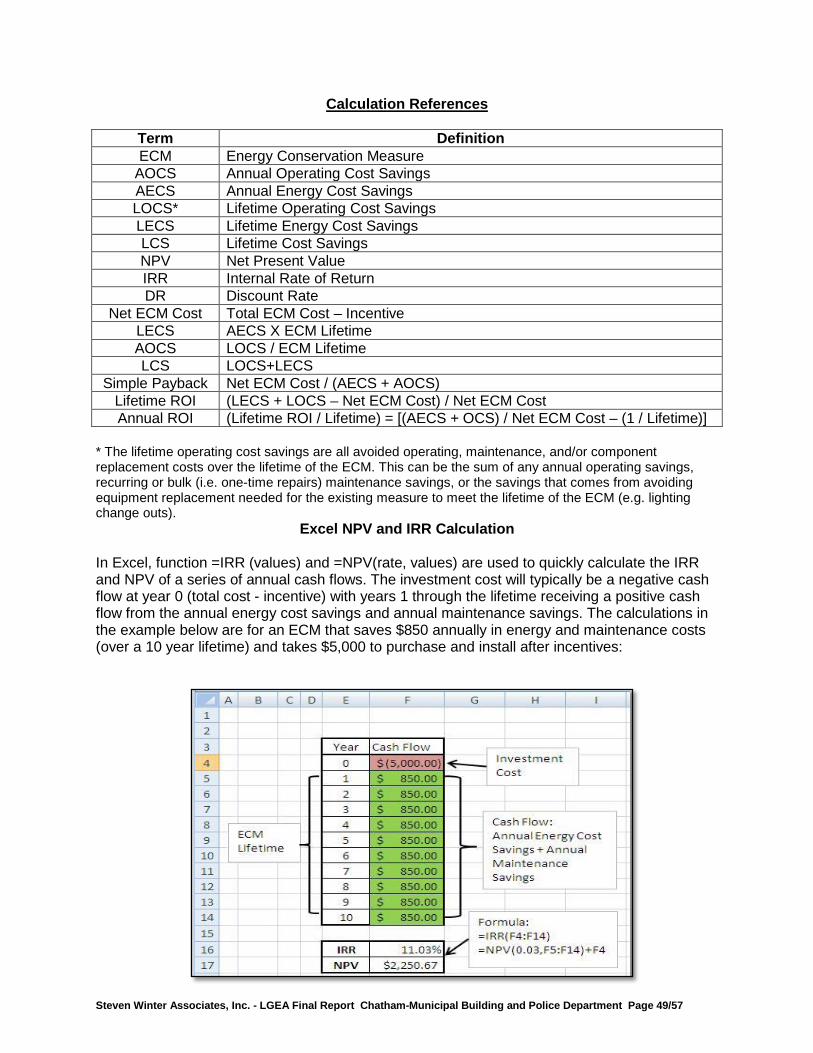
Steven Winter Associates, Inc. - LGEA Final Report Chatham-Municipal Building and Police Department Page 49/57
Calculation References
Term Definition ECM Energy Conservation Measure
AOCS Annual Operating Cost Savings AECS Annual Energy Cost Savings LOCS* Lifetime Operating Cost Savings LECS Lifetime Energy Cost Savings LCS Lifetime Cost Savings NPV Net Present Value IRR Internal Rate of Return DR Discount Rate
Net ECM Cost Total ECM Cost – Incentive LECS AECS X ECM Lifetime AOCS LOCS / ECM Lifetime LCS LOCS+LECS
Simple Payback Net ECM Cost / (AECS + AOCS) Lifetime ROI (LECS + LOCS – Net ECM Cost) / Net ECM Cost Annual ROI (Lifetime ROI / Lifetime) = [(AECS + OCS) / Net ECM Cost – (1 / Lifetime)]
* The lifetime operating cost savings are all avoided operating, maintenance, and/or component replacement costs over the lifetime of the ECM. This can be the sum of any annual operating savings, recurring or bulk (i.e. one-time repairs) maintenance savings, or the savings that comes from avoiding equipment replacement needed for the existing measure to meet the lifetime of the ECM (e.g. lighting change outs).
Excel NPV and IRR Calculation In Excel, function =IRR (values) and =NPV(rate, values) are used to quickly calculate the IRR and NPV of a series of annual cash flows. The investment cost will typically be a negative cash flow at year 0 (total cost - incentive) with years 1 through the lifetime receiving a positive cash flow from the annual energy cost savings and annual maintenance savings. The calculations in the example below are for an ECM that saves $850 annually in energy and maintenance costs (over a 10 year lifetime) and takes $5,000 to purchase and install after incentives:
Steven Winter Associates, Inc. - LGEA Final Report Chatham-Municipal Building and Police Department Page 50/57
Solar PV ECM Calculation There are several components to the calculation: Costs: Material of PV system including panels, mounting and net-metering +
Labor Energy Savings: Reduction of kWh electric cost for life of panel, 25 years Incentive 1: NJ Renewable Energy Incentive Program (REIP), for systems of size
50kW or less, $1/Watt incentive subtracted from installation cost Incentive 2: Solar Renewable Energy Credits (SRECs) – Market-rate incentive.
Calculations assume $600/Megawatt hour consumed per year for a maximum of 15 years; added to annual energy cost savings for a period of 15 years. (Megawatt hour used is rounded to nearest 1,000 kWh)
Assumptions: A Solar Pathfinder device is used to analyze site shading for the building and determine maximum amount of full load operation based on available sunlight. When the Solar Pathfinder device is not implemented, amount of full load operation based on available sunlight is assumed to be 1,180 hours in New Jersey.
Total lifetime PV energy cost savings = kWh produced by panel * [$/kWh cost * 25 years + $600/Megawatt hour /1000 * 15 years]
ECM and Equipment Lifetimes Determining a lifetime for equipment and ECM’s can sometimes be difficult. The following table contains a list of lifetimes that the NJCEP uses in its commercial and industrial programs. Other valid sources are also used to determine lifetimes, such as the DOE, ASHRAE, or the manufacturer’s warranty. Lighting is typically the most difficult lifetime to calculate because the fixture, ballast, and bulb can all have different lifetimes. Essentially the ECM analysis will have different operating cost savings (avoided equipment replacement) depending on which lifetime is used. When the bulb lifetime is used (rated burn hours / annual burn hours), the operating cost savings is just reflecting the theoretical cost of replacing the existing case bulb and ballast over the life of the recommended bulb. Dividing by the bulb lifetime will give an annual operating cost savings. When a fixture lifetime is used (e.g. 15 years) the operating cost savings reflects the avoided bulb and ballast replacement cost of the existing case over 15 years minus the projected bulb and ballast replacement cost of the proposed case over 15 years. This will give the difference of the equipment replacement costs between the proposed and existing cases and when divided by 15 years will give the annual operating cost savings.
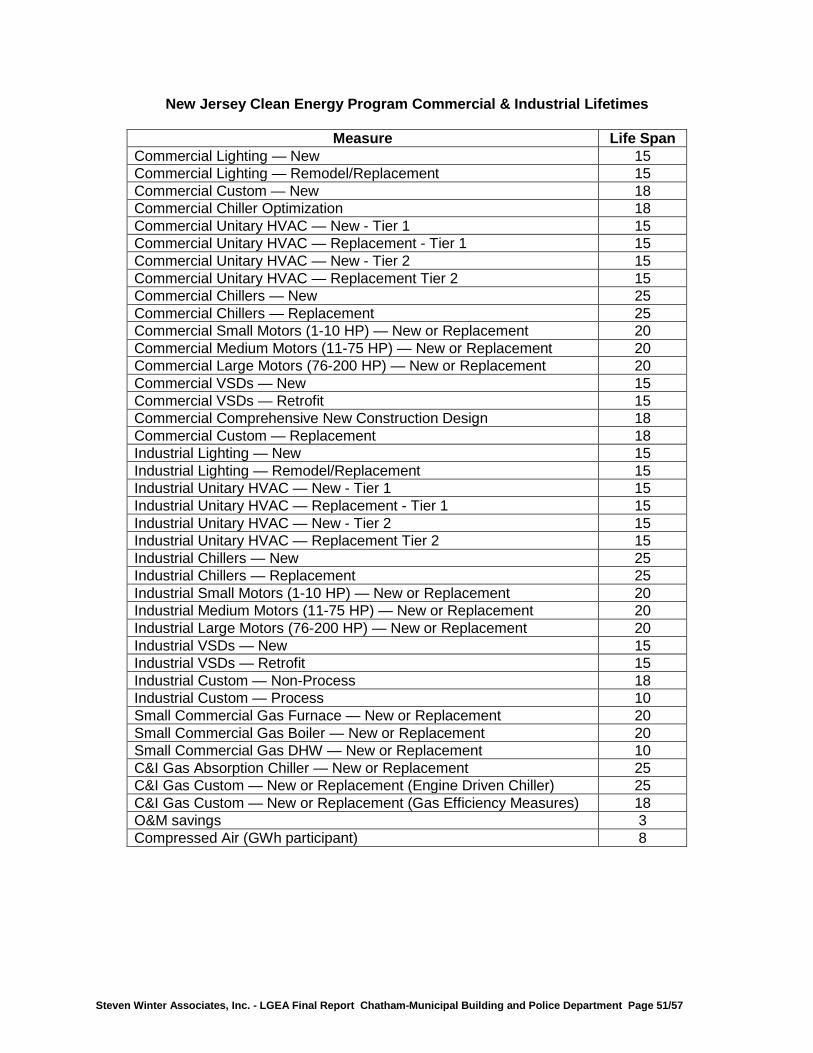
Steven Winter Associates, Inc. - LGEA Final Report Chatham-Municipal Building and Police Department Page 51/57
New Jersey Clean Energy Program Commercial & Industrial Lifetimes
Measure Life Span Commercial Lighting — New 15 Commercial Lighting — Remodel/Replacement 15 Commercial Custom — New 18 Commercial Chiller Optimization 18 Commercial Unitary HVAC — New - Tier 1 15 Commercial Unitary HVAC — Replacement - Tier 1 15 Commercial Unitary HVAC — New - Tier 2 15 Commercial Unitary HVAC — Replacement Tier 2 15 Commercial Chillers — New 25 Commercial Chillers — Replacement 25 Commercial Small Motors (1-10 HP) — New or Replacement 20 Commercial Medium Motors (11-75 HP) — New or Replacement 20 Commercial Large Motors (76-200 HP) — New or Replacement 20 Commercial VSDs — New 15 Commercial VSDs — Retrofit 15 Commercial Comprehensive New Construction Design 18 Commercial Custom — Replacement 18 Industrial Lighting — New 15 Industrial Lighting — Remodel/Replacement 15 Industrial Unitary HVAC — New - Tier 1 15 Industrial Unitary HVAC — Replacement - Tier 1 15 Industrial Unitary HVAC — New - Tier 2 15 Industrial Unitary HVAC — Replacement Tier 2 15 Industrial Chillers — New 25 Industrial Chillers — Replacement 25 Industrial Small Motors (1-10 HP) — New or Replacement 20 Industrial Medium Motors (11-75 HP) — New or Replacement 20 Industrial Large Motors (76-200 HP) — New or Replacement 20 Industrial VSDs — New 15 Industrial VSDs — Retrofit 15 Industrial Custom — Non-Process 18 Industrial Custom — Process 10 Small Commercial Gas Furnace — New or Replacement 20 Small Commercial Gas Boiler — New or Replacement 20 Small Commercial Gas DHW — New or Replacement 10 C&I Gas Absorption Chiller — New or Replacement 25 C&I Gas Custom — New or Replacement (Engine Driven Chiller) 25 C&I Gas Custom — New or Replacement (Gas Efficiency Measures) 18 O&M savings 3 Compressed Air (GWh participant) 8
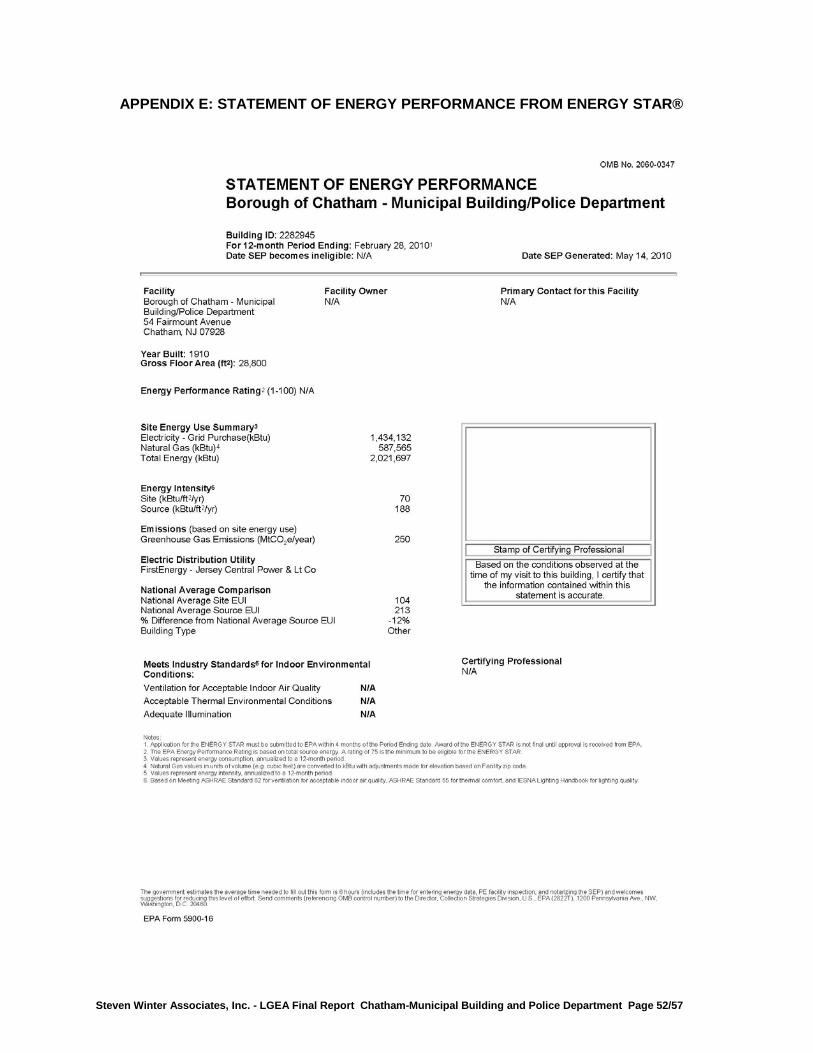
Steven Winter Associates, Inc. - LGEA Final Report Chatham-Municipal Building and Police Department Page 52/57
APPENDIX E: STATEMENT OF ENERGY PERFORMANCE FROM ENERGY STAR®
Steven Winter Associates, Inc. - LGEA Final Report Chatham-Municipal Building and Police Department Page 53/57
APPENDIX F: INCENTIVE PROGRAMS New Jersey Clean Energy Pay for Performance The NJ Clean Energy Pay for Performance (P4P) Program relies on a network of Partners who provide technical services to clients. LGEA participating clients who are not receiving Direct Energy Efficiency and Conservation Block Grants are eligible for P4P. SWA is an eligible Partner and can develop an Energy Reduction Plan for each project with a whole-building traditional energy audit, a financial plan for funding the energy measures and an installation construction schedule. The Energy Reduction Plan must define a comprehensive package of measures capable of reducing a building’s energy consumption by 15+%. P4P incentives are awarded upon the satisfactory completion of three program milestones: submittal of an Energy Reduction Plan prepared by an approved Program Partner, installation of the recommended measures and completion of a Post-Construction Benchmarking Report. The incentives for electricity and natural gas savings will be paid based on actual savings, provided that the minimum 15%performance threshold savings has been achieved. For further information, please see: http://www.njcleanenergy.com/commercial-industrial/programs/pay-performance/existing-buildings . Direct Install 2010 Program Direct Install is a division of the New Jersey Clean Energy Programs’ Smart Start Buildings. It is a turn-key program for small to mid-sized facilities to aid in upgrading equipment to more efficient types. It is designed to cut overall energy costs by upgrading lighting, HVAC and other equipment with energy efficient alternatives. The program pays up to 80% of the retrofit costs, including equipment cost and installation costs. Eligibility:
• Existing small and mid-sized commercial and industrial facilities with peak electrical demand below 200 kW within 12 months of applying
• Must be located in New Jersey • Must be served by one of the state’s public, regulated or natural gas companies
• Electric: Atlantic City Electric, Jersey Central Power & Light, Orange Rockland Electric, PSE&G
• Natural Gas: Elizabethtown Gas, New Jersey Natural Gas, PSE&G, South Jersey Gas
For the most up to date information on contractors in New Jersey who participate in this program, go to: http://www.njcleanenergy.com/commercial-industrial/programs/direct-install Smart Start New Jersey’s SmartStart Building Program is administered by New Jersey’s Office of Clean Energy. The program also offers design support for larger projects and technical assistance for smaller projects. If your project specifications do not fit into anything defined by the program, there are even incentives available for custom projects.

Steven Winter Associates, Inc. - LGEA Final Report Chatham-Municipal Building and Police Department Page 54/57
There are a number of improvement options for commercial, industrial, institutional, government, and agricultural projects throughout New Jersey. Alternatives are designed to enhance quality while building in energy efficiency to save money. Project categories included in this program are New Construction and Additions, Renovations, Remodeling and Equipment Replacement. For the most up to date information on how to participate in this program, go to: http://www.njcleanenergy.com/commercial-industrial/programs/nj-smartstart-buildings/nj-smartstart-buildings. Renewable Energy Incentive Program The Renewable Energy Incentive Program (REIP) provides incentives that reduce the upfront cost of installing renewable energy systems, including solar, wind, and sustainable biomass. Incentives vary depending upon technology, system size, and building type. Current incentive levels, participation information, and application forms can be found at the website listed below. Solar Renewable Energy Credits (SRECs) represent all the clean energy benefits of electricity generated from a solar energy system. SRECs can be sold or traded separately from the power, providing owners a source of revenue to help offset the cost of installation. All solar project owners in New Jersey with electric distribution grid-connected systems are eligible to generate SRECs. Each time a system generates 1,000 kWh of electricity an SREC is earned and placed in the customer's account on the web-based SREC tracking system. For the most up to date information on how to participate in this program, go to: http://www.njcleanenergy.com/renewable-energy/home/home.
Utility Sponsored Programs Check with your local utility companies for further opportunities that may be available. Federal and State Sponsored Programs Other federal and state sponsored funding opportunities may be available, including BLOCK and R&D grant funding. For more information, please check http://www.dsireusa.org/.
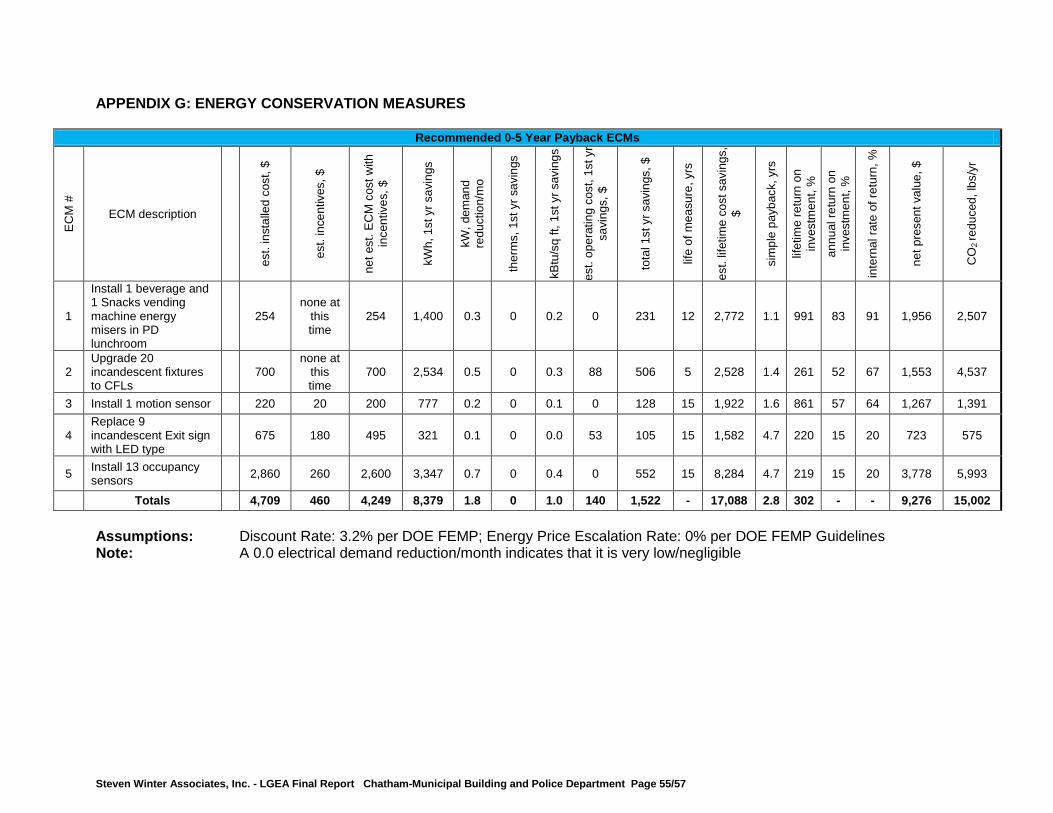
Steven Winter Associates, Inc. - LGEA Final Report Chatham-Municipal Building and Police Department Page 55/57
APPENDIX G: ENERGY CONSERVATION MEASURES
Recommended 0-5 Year Payback ECMs
EC
M #
ECM description
est.
inst
alle
d co
st, $
est.
ince
ntiv
es, $
net e
st. E
CM
cos
t with
in
cent
ives
, $
kWh,
1st
yr s
avin
gs
kW, d
eman
d re
duct
ion/
mo
ther
ms,
1st
yr s
avin
gs
kBtu
/sq
ft, 1
st y
r sav
ings
est.
oper
atin
g co
st, 1
st y
r sa
ving
s, $
tota
l 1st
yr s
avin
gs, $
life
of m
easu
re, y
rs
est.
lifet
ime
cost
sav
ings
, $
sim
ple
payb
ack,
yrs
lifet
ime
retu
rn o
n in
vest
men
t, %
annu
al re
turn
on
inve
stm
ent,
%
inte
rnal
rate
of r
etur
n, %
net p
rese
nt v
alue
, $
CO
2 re
duce
d, lb
s/yr
1
Install 1 beverage and 1 Snacks vending machine energy misers in PD lunchroom
254 none at
this time
254 1,400 0.3 0 0.2 0 231 12 2,772 1.1 991 83 91 1,956 2,507
2 Upgrade 20 incandescent fixtures to CFLs
700 none at
this time
700 2,534 0.5 0 0.3 88 506 5 2,528 1.4 261 52 67 1,553 4,537
3 Install 1 motion sensor 220 20 200 777 0.2 0 0.1 0 128 15 1,922 1.6 861 57 64 1,267 1,391
4 Replace 9 incandescent Exit sign with LED type
675 180 495 321 0.1 0 0.0 53 105 15 1,582 4.7 220 15 20 723 575
5 Install 13 occupancy sensors 2,860 260 2,600 3,347 0.7 0 0.4 0 552 15 8,284 4.7 219 15 20 3,778 5,993
Totals 4,709 460 4,249 8,379 1.8 0 1.0 140 1,522 - 17,088 2.8 302 - - 9,276 15,002 Assumptions: Discount Rate: 3.2% per DOE FEMP; Energy Price Escalation Rate: 0% per DOE FEMP Guidelines Note: A 0.0 electrical demand reduction/month indicates that it is very low/negligible
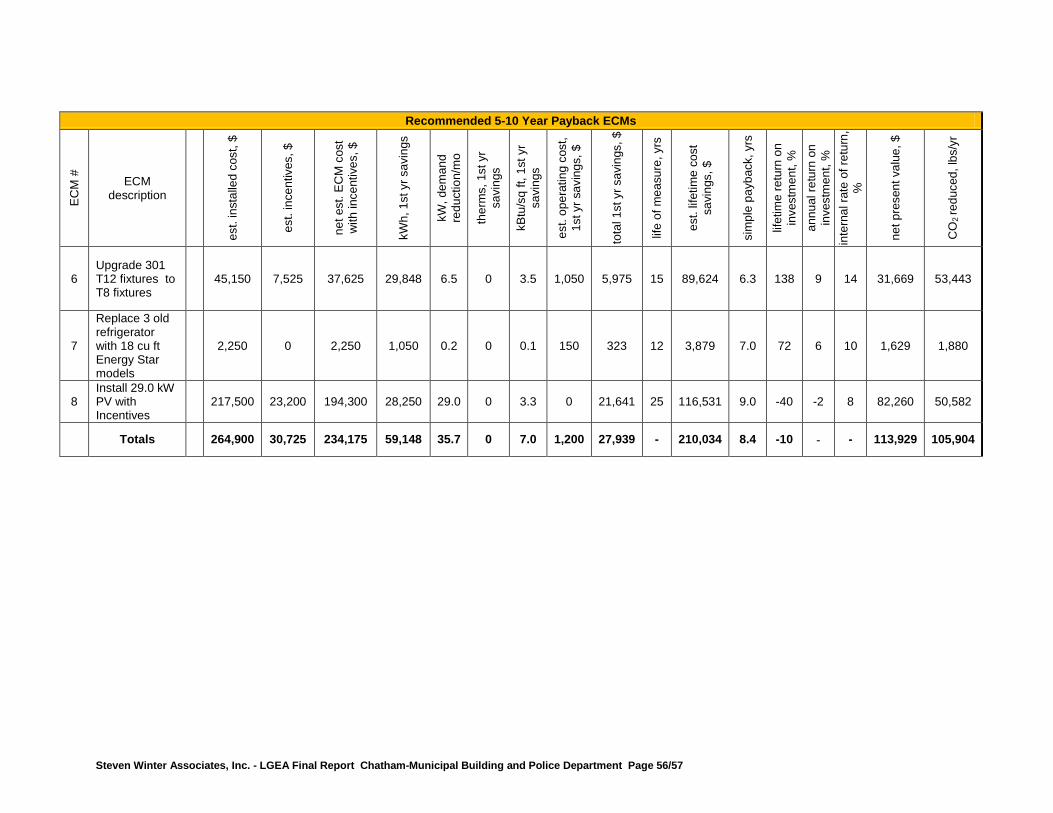
Steven Winter Associates, Inc. - LGEA Final Report Chatham-Municipal Building and Police Department Page 56/57
Recommended 5-10 Year Payback ECMs
EC
M #
ECM description
est.
inst
alle
d co
st, $
est.
ince
ntiv
es, $
net e
st. E
CM
cos
t w
ith in
cent
ives
, $
kWh,
1st
yr s
avin
gs
kW, d
eman
d re
duct
ion/
mo
ther
ms,
1st
yr
savi
ngs
kBtu
/sq
ft, 1
st y
r sa
ving
s
est.
oper
atin
g co
st,
1st y
r sav
ings
, $
tota
l 1st
yr s
avin
gs, $
life
of m
easu
re, y
rs
est.
lifet
ime
cost
sa
ving
s, $
sim
ple
payb
ack,
yrs
lifet
ime
retu
rn o
n in
vest
men
t, %
an
nual
retu
rn o
n in
vest
men
t, %
in
tern
al ra
te o
f ret
urn,
%
net p
rese
nt v
alue
, $
CO
2 re
duce
d, lb
s/yr
6 Upgrade 301 T12 fixtures to T8 fixtures
45,150 7,525 37,625 29,848 6.5 0 3.5 1,050 5,975 15 89,624 6.3 138 9 14 31,669 53,443
7
Replace 3 old refrigerator with 18 cu ft Energy Star models
2,250 0 2,250 1,050 0.2 0 0.1 150 323 12 3,879 7.0 72 6 10 1,629 1,880
8 Install 29.0 kW PV with Incentives
217,500 23,200 194,300 28,250 29.0 0 3.3 0 21,641 25 116,531 9.0 -40 -2 8 82,260 50,582
Totals 264,900 30,725 234,175 59,148 35.7 0 7.0 1,200 27,939 - 210,034 8.4 -10 - - 113,929 105,904
Steven Winter Associates, Inc. - LGEA Final Report Chatham-Municipal Building and Police Department Page 57/57
APPENDIX H: METHOD OF ANALYSIS
Assumptions and tools
Energy modeling tools: Established/standard industry assumptions, E-Quest Cost estimates: RS Means 2009 (Facilities Maintenance & Repair Cost Data)
RS Means 2009 (Building Construction Cost Data) RS Means 2009 (Mechanical Cost Data)
Published and established specialized equipment material and labor costs Cost estimates also based on utility bill analysis and prior experience with similar projects
Disclaimer
This engineering audit was prepared using the most current and accurate fuel consumption data available for the site. The estimates that it projects are intended to help guide the owner toward best energy choices. The costs and savings are subject to fluctuations in weather, variations in quality of maintenance, changes in prices of fuel, materials, and labor, and other factors. Although we cannot guarantee savings or costs, we suggest that you use this report for economic analysis of the building and as a means to estimate future cash flow.
THE RECOMMENDATIONS PRESENTED IN THIS REPORT ARE BASED ON THE RESULTS OF ANALYSIS, INSPECTION, AND PERFORMANCE TESTING OF A SAMPLE OF COMPONENTS OF THE Municipal Building and Police Department SITE. ALTHOUGH CODE-RELATED ISSUES MAY BE NOTED, SWA STAFF HAVE NOT COMPLETED A COMPREHENSIVE EVALUATION FOR CODE-COMPLIANCE OR HEALTH AND SAFETY ISSUES. THE OWNER(S) AND MANAGER(S) OF THE Municipal Building and Police Department(S) CONTAINED IN THIS REPORT ARE REMINDED THAT ANY IMPROVEMENTS SUGGESTED IN THIS SCOPE OF WORK MUST BE PERFORMED IN ACCORDANCE WITH ALL LOCAL, STATE, AND FEDERAL LAWS AND REGULATIONS THAT APPLY TO SAID WORK. PARTICULAR ATTENTION MUST BE PAID TO ANY WORK WHICH INVOLVES HEATING AND AIR MOVEMENT SYSTEMS, AND ANY WORK WHICH WILL INVOLVE THE DISTURBANCE OF PRODUCTS CONTAINING MOLD, ASBESTOS, OR LEAD.