multiple shear key connections for precast shear wall panels · 2017-10-21 · multiple shear key...
TRANSCRIPT
Multiple Shear Key Connections for Precast
Shear Wall Panels Sami H. Rizkalla
Professor Head of the Structures Division
Department of Civil Engineering University of Manitoba
Winnipeg, Manitoba, Canada
Reynaud L. Serrette Doctoral Candidate Department of Civil Engineering Cornell University Ithaca, New York
J. Scott Heuvel Principal
ARC + CADD Winnipeg, Manitoba, Canada
Emmanuel K. Attiogbe Research Associate Department of Civil Engineering University of Manitoba Winnipeg, Manitoba, Canada
P recast concrete shear wall panels are used extensively in high rise con
struction. Their attractiveness and economy are mainly due to the high quality control that is achieved at the man ufacturing plant, and the ease and speed of panel assembly at the construction site.
concrete construction is the method by which the panels are connected. Connections must provide adequate strength, ductility and continuity in order to insure the integrity of the structure under various loading conditions.
The typical connections currently used for elevator shaft shear wall panels One of the main concerns in precast
104
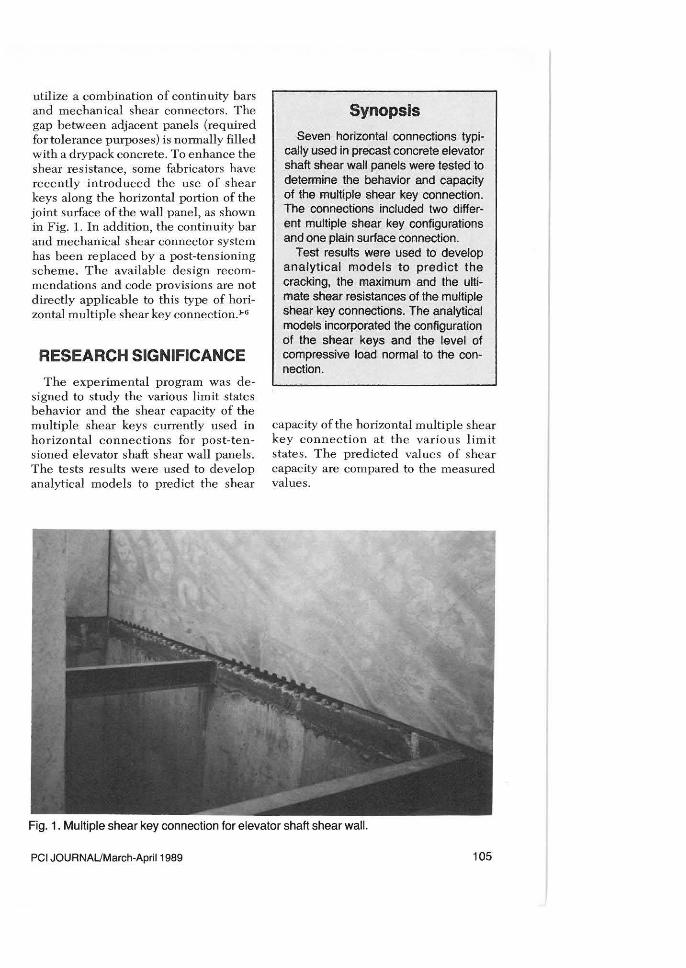
utilize a combination of continuity bars and mechanical shear connectors. The gap between adjacent panels (required for tolerance purposes) is normally filled with a drypack concrete. To enhance the shear resistance, some fabricators have recently introduced the use of shear keys along the horizontal portion of the joint surface of the wall panel, as shown in Fig. 1. In addition, the contin uity bar and mechanical shear connector system has been replaced by a post-tensioning scheme. The available design recommendations and code provisions are not directly applicable to this type of horizontal multiple shear key connection. J- 6
RESEARCH SIGNIFICANCE
The experimental program was designed to study the various limit states behavior and the shear capacity of the multiple shear keys currently used in horizontal connections for post-tensioned elevator shaft shear wall panels. The tests results were used to develop analytical models to predict the shear
Synopsis
Seven horizontal connections typically used in precast concrete elevator shaft shear wall panels were tested to determine the behavior and capacity of the mUltiple shear key connection. The connections included two different multiple shear key configurations and one plain surface connection.
Test results were used to develop analytical models to predict the cracking, the maximum and the ultimate shear resistances of the multiple shear key connections. The analytical models incorporated the configuration of the shear keys and the level of compressive load normal to the connection.
capacity of the horizontal multiple shear key connection at the various limit states. The predicted values of shear capacity are compared to the measured values.
Fig. 1. Multiple shear key connection for elevator shaft shear wall.
PCI JOURNAUMarch-ApriI1989 105
APPLIED SHEAR LOAD
0 <t 0
E -' E w
0:: 0 "-0 o<l 0 N W
-' "-"-<t
E E
0 N 0
INDEPENDENT POST - TENSIONING
SYSTEM
DRY PACK
b~20mm
1880 mm
Panel thickness, t = 200 mm
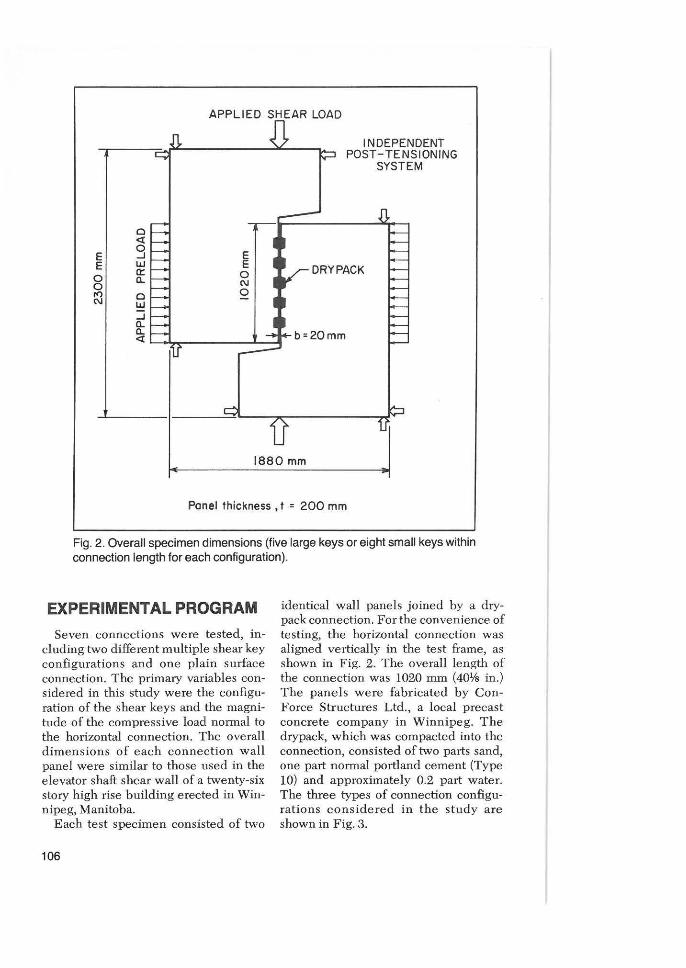
Fig. 2. Overall specimen dimensions (five large keys or eight small keys within connection length for each configuration).
EXPERIMENTAL PROGRAM
Seven connections were tested, including two different multiple shear key configurations and one plain surface connection. The primary variables considered in this study were the configuration of the shear keys and the magnitude of the compressive load normal to the horizontal connection. The overall dimensions of each connection wall panel were similar to those used in the elevator shaft shear wall of a twenty-six story high rise building erected in Winnipeg, Manitoba.
Each test specimen consisted of two
106
identical wall panels joined by a drypack connection. For the convenience of testing, the horizontal connection was aligned vertically in the test frame, as shown in Fig. 2. The overall length of the connection was 1020 mm (40Vs in.) The panels were fabricated by ConForce Structures Ltd" a local precast concrete company in Winnipeg. The drypack, which was compacted into the connection, consisted of two parts sand, one part nonnal portland cement (Type 10) and approximately 0.2 part water. The three types of connection configurations considered in the study are shown in Fig. 3.
h; IOOmm
-oa.--b;20mm b ;20mm
d ; 25mm
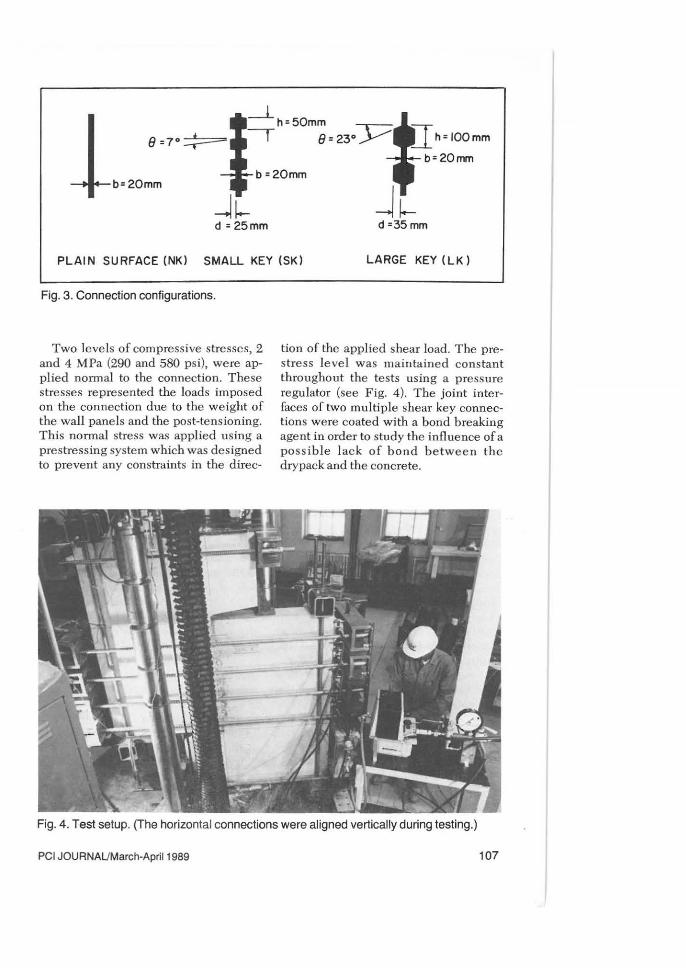
PLAIN SURFACE (NK) SMALL KEY (SK) LARGE KEY (LK)
Fig. 3. Connection configurations.
Two levels of compressive stresses, 2 and 4 MPa (290 and 580 psi), were applied nonnal to the connection. These stresses represented the loads imposed on the connection due to the weight of the wall panels and the post-tensioning. This nonnal stress was applied using a prestressing system which was designed to prevent any constraints in the direc-
tion of the applied shear load. The prestress leve l was maintained constant throughout the tests using a pressure regulator (see Fig. 4). The joint interfaces of two multiple shear key connections were coated with a bond breaking agent in order to study the influence of a poss ible lac k of bond b e tween the drypack and the concrete.
Fig. 4. Test setup. (The horizontal connections were aligned vertically during testing.)
PCI JOURNALJMarch-ApriI1989 107
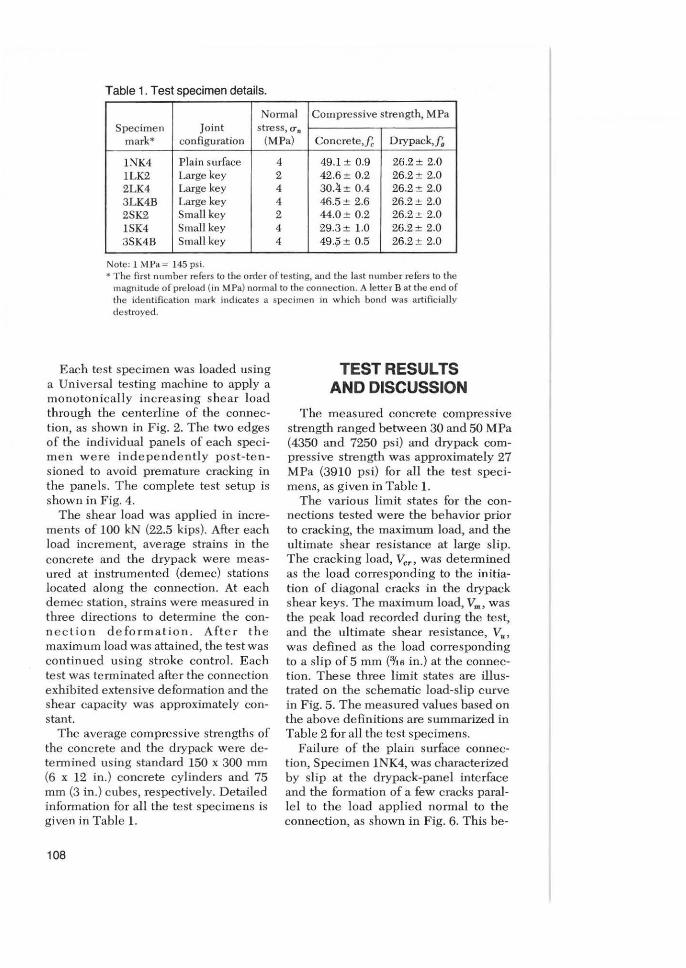
Table 1. Test specimen details.
Normal Compressive strength, MPa Specimen Joint stre ss , U II
mark* configuration (MPa) Concrete,J~ Drypack,J;
INK4 Plain surface 4 49.1 ± 0.9 26.2± 2.0 lLK2 Large key 2 42.6 ± 0.2 26.2± 2.0 2LK4 Large key 4 30.4 ± 0.4 26.2± 2.0 3LK4B Large key 4 46.S± 2.6 26.2~ 2.0 2SK2 Small key 2 44.0 ± 0.2 26.2± 2.0 lSK4 Small key 4 29.3 ± 1.0 26.2± 2.0 3SK4B Small key 4 49.'± O.S 26.2± 2.0
Note: 1 MPa= 145 psi, • The first number refers to the order of testing, and the last number refers to the
magnitude of preload (in M Pa) normal to the eonnection . A letter B at the end of the identification mark indicates a spec imen in which bond was artificially destroyed .
Each test specimen was loaded using a Universal testing machine to apply a monotonically increasing shear load through the centerline of the connec~ tion, as shown in Fig. 2. The two edges of the individual panels or each specimen were indepe ndently post·ten· sioned to avoid premature cracking in the panels. The complete test setup is shown in Fig. 4.
The shear load was applied in increments of 100 kN (22.5 kips). After each load incre ment, average strains in the concrete and the drypack were meas· ured at instrumented (demec) stations located a long the connection. At each demec station, strains were measured in three directions to determine the can· n ec tion deformation. After the maximum load was attained, the test was continued using stroke control. Each test was terminated after the connection exhibited extensive defonnation and the shear capacity was approximately constant.
The average compressive strengths of the concrete and the drypack were detenn ined using standard 150 x 300 mm (6 x 12 in.) concrete cylinders and 75 mm (3 in.) cubes, respective ly. Detailed information for all the test specimens is given in Table 1.
108
TEST RESULTS AND DISCUSSION
The measured concrete compressive strength ranged between 30 and 50 MPa (4350 and 7250 psi ) and dry pack compressive strength was approximately 27 MPa (3910 psi) for all the test specimens, as given in Table 1.
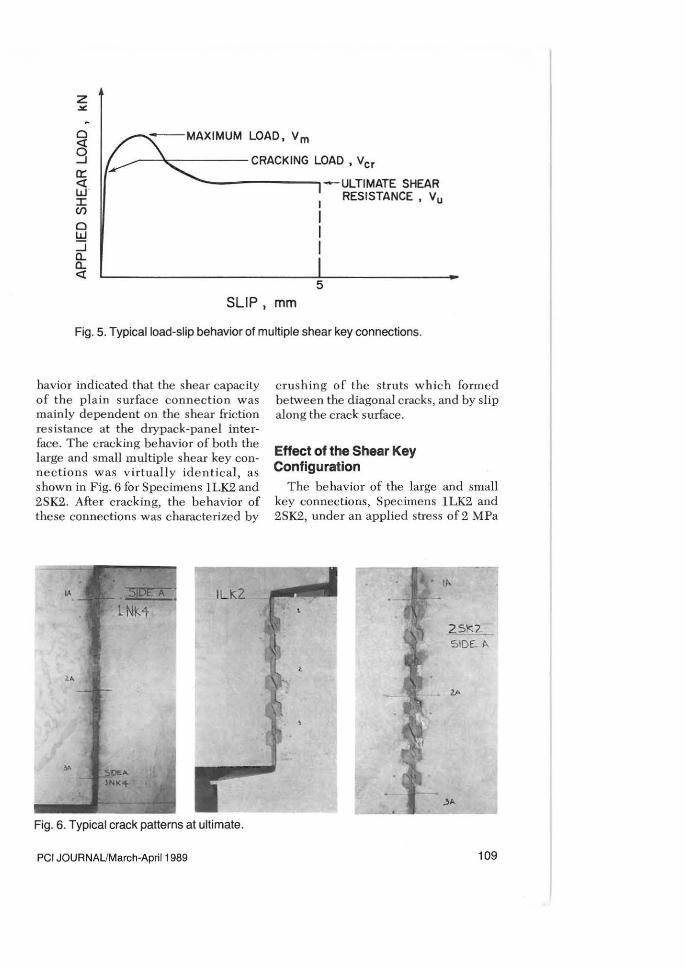
The various limit states for the connections tested were the behavior prior to cracking, the maximum load, and the ultimate shear resistance at large slip. The cracking load, Vcr, was detennined as the load corresponding to the initiation of diagonal cracks in the drypack shear keys. The maximwn load, V7ll , was the peak load recorded during the test, and the ultimate shear resistance, VIP was defined as the load corresponding to a slip of 5 mm (¥16 in.) at the connection . These three limit states are illustrated on the schematic load·slip curve in Fig. 5. The measured values based on the above d efinitions are summarized in Table 2 for all the test specimens.
Failure of the plain surface connection, Specimen INK4, was characterized by slip at the drypack-panel interface and the fonnation of a few cracks paralle l to the load applied normal to the connection, as shown in Fig. 6. This be-
~ g LOAD, Vm
____ -~;:-----CRACKING LOAD, Vcr a:: <:( W ' I CI)
o W ::J CL CL <:(
5
-ULTIMATE SHEAR RESISTANCE, Vu
SLIP, mm
Fig. 5. Typical load-slip behavior of multiple shear key connections.
havior indicated that the shear capacity of the plain s urface connection was main ly dependent on the shear friction res istance at the drypack-pane l interface. The cracking be havior of both the large and small multiple shear key connect ion s was virtually identical, as shown in Fig. 6 for Specime ns lLK2 and 2SK2 . Afte r cracking, the behavior of these connections was characte rized by
\A ILK2.
Fig. 6. Typical crack patterns at ultimate.
PCI JOURNALJMarch-ApriI1989
crushin g of the struts which formed between the diagonal cracks, and by slip along the crack surface.
Effect of the Shear Key Configuration
T he behavior of the large and small key connections, Spec imens lLK2 and 2SK2, under an applied stress of 2 MPa
109
1.2
Z -'" 1.0 0 0 0 . 0.8
o--<J 3SK4B
.- 3LK4B
<>--<> 2LK4
L>--6 ISK4
_ 2SK2 0 g a: <l: W I (f)
0 W .J CL CL <l:
0 .6 '>--'V ILK2
0 .4
0 .2
0.0 0 2 4 6 8
SLlP,mm
Fig. 7. Effect of key configuration and level of preload.
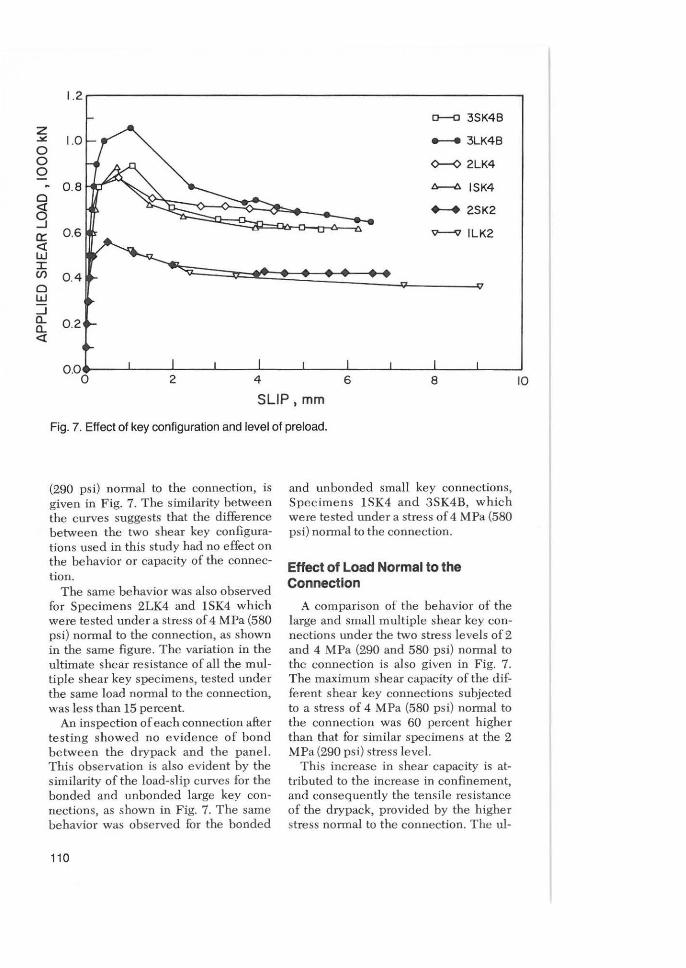
(290 psi) normal to the connection, is given in Fig. 7. The s imilarity between the curves suggests that the difference between the two shear key configurations used in this study had no effect on the behavior or capacity of the connection.
The same behavior was also observed for Specimens 2LK4 and ISK4 which were tested under a stress of 4 MPa (580 psi) normal to the connection, as shown in the same figure, The variat ion in the ultimate shear resistance of all the multiple shear key specimens, tested under the same load normal to the connection, was less than 15 percent.
An inspection of each connection after testing showed no evidence of bond between the drypack and the panel. This observation is also evident by the s imilarity of the load-slip curves for the bonded and unbonded large key connections, as shown in Fig. 7. The same behavior was observed for the bonded
110
and unbonded small key connections, Specimens ISK4 and 3SK4B, which were tested unde r a stress of 4 M Pa (580 psi) nonnal to the connection .
Effect of Load Normal to the Connection
A comparison of the behavior of the large and small multiple shear key connections under the two stress levels of 2 and 4 MPa (290 and 580 psi) normal to the connection is also given in Fig. 7. The maximum shear capacity of the different shear key connections subjected to a stress of 4 MPa (580 psi) normal to the connection was 60 percent higher than that for sim ilaT specimens at the 2 MPa (290 psi) stress level.
This increase in shear capacity is attributed to the increase in confinement, and consequently the tensile res istance of the drypack, provided by the higher stress nonnal to the connection. The ul-
10
1.2r------------------------,
Z ...liI: 1.0-o o Q
- 0 .8
<>-<> 2LK4
l>-lJ. ISK4
........ INK4 o <t
:3 c:: <t W I en o w :J a.. a.. <t
I , I I
4
SLlP,mm
6 8 10
Fig. 8. Effect of shear keys.
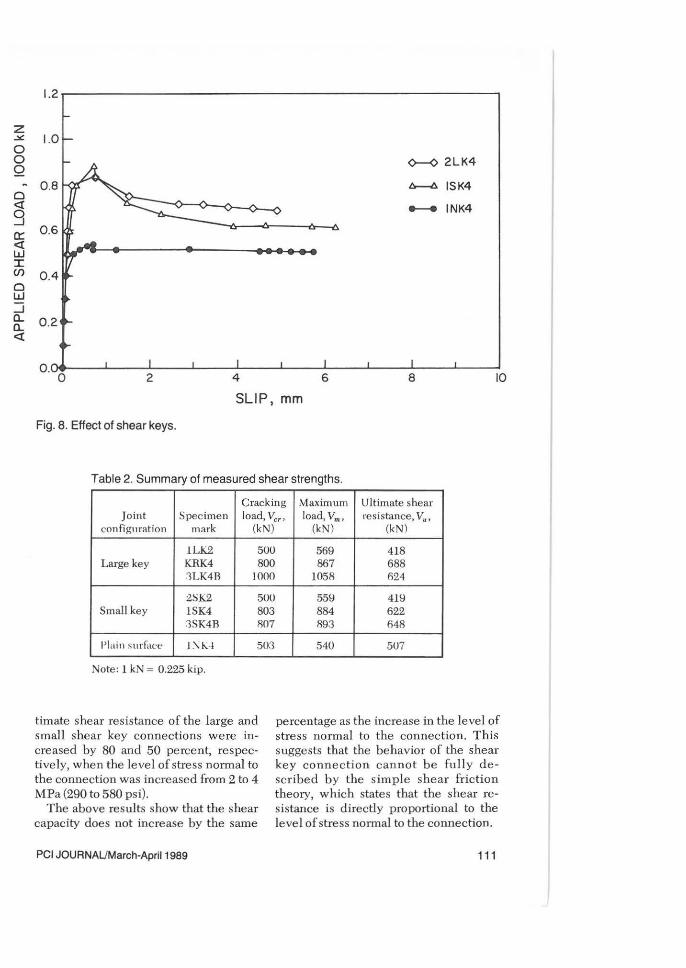
Table 2. Summary of measured shear strengths.
Crack ing Max imum Ultimate shear Jo int Specimen load, Vcr> load, Vm• resistance, VII'
con figl 1 ration mark (kN) (kN) (kN)
1LK2 5UO 569 418 Large key KRK4 800
.1LK4R WOO
2SK2 SUU Small key ISK4 803
.1SK4R R07
Plain surhl('t' 1" 1(4 SU3
Note: 1 kN = 0.225 kip.
timate shear resistance of the large and small shear key connections were increased by 80 and 50 percent, respective ly, when the level of stress normal to the connection was increased from 2 to 4 MPa (290 to 580 psi).
The above results show that the shear capacity does not increase by the same
PCI JOURNAlJMarch-ApriI1989
887 688 W SR 024
559 419 884 622 R93 648
540 507
percentage as the increase in the level of stress normal to the connection. This suggests that the behavior of the shear key connectio n can not be fu ll y described by the simple shear friction theory, which states that the shear resistance is directly proportional to the leve l of stress nonnal to the connection.
111
MODEL I MODEL 2
SLIP
SLIP SURFACE
SURFACE 0 0 <:(
C5 9 DIAGONAL
...J w w a:: CRACK a:: DIAGONAL n. n. CRACK h h
t = Thickness of Connection
(a)
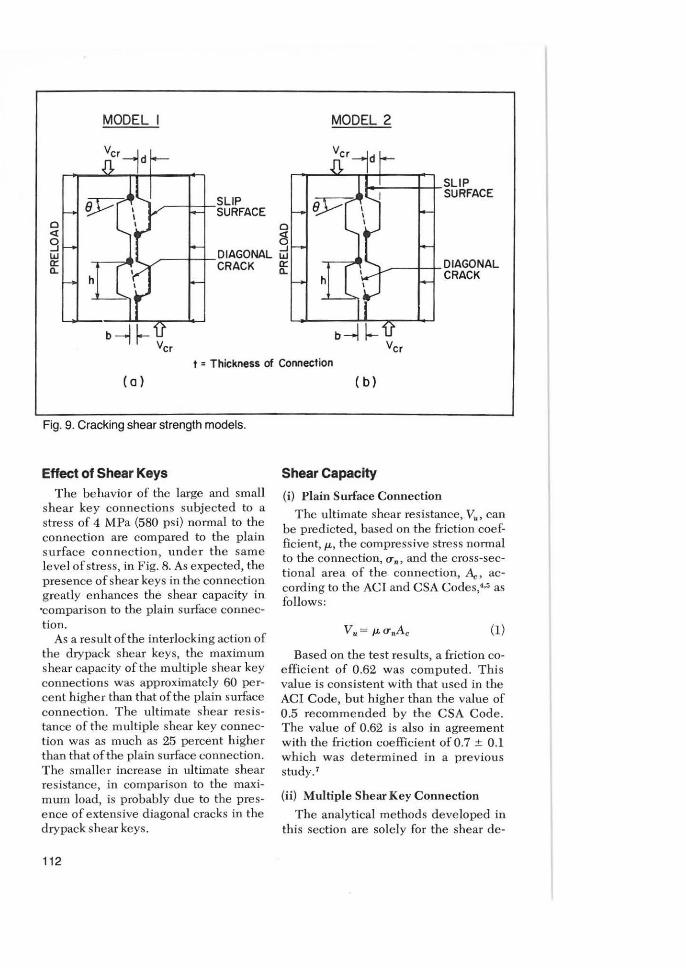
Fig. 9. Cracking shear strength models.
Effect of Shear Keys The be havior of the large and small
shear key co nnections subjected to a stress of 4 MPa (580 psi) normal to the connection are compared to the plain s urface connection, unde r the sam e level of stress, in Fig. 8. As expected, the presence of shear keys in the connection greatly enhances the shear capacity in ·comparison to the plain surface connection.
As a result of the interlocking action of the d rypack shear keys, the maximum shear capacity of the multiple shear key connections was approximately 60 percent higher than that of the plain surface connection. T he ultimate shea r res istance of the multip le shear key connection was as much as 25 percent highe r than that of the plain surface connection. The smaller increase in ultimate shear resistance, in comparison to the maximum load, is probably due to the prese nce of extensive diagonal c racks in the drypack shear keys.
112
( b)
Shear Capacity (i) Plain Surface Connection
The ultimate shear resistance, Vu , can be predicted, based on the friction coeffi c ient, /L, the compressive stress normal to the connection, (Tn, and the cross-sectional a rea of the connection, .4.:, according to the ACI and CSA Codes,'" as follows:
(1)
Based on the test results, a friction coefficient of 0.62 was computed. This value is consistent with that used in the ACI Code, but higher than the value of 0 .5 recommended by the CSA Code. The value of 0.62 is also in agreement with the friction coefficient of 0.7 ± 0.1 which was de termined in a previous study.7
(ii) Multiple Shear Key Connection
The analytical methods deve loped in this section are solely for the shear de-
sign of multiple shear key connections. The presence of tensile stresses due to overturning moments cau ld b e accounted for by limiting the joint length to the compression stress block of the panel. However, in this research program it is assumed that under the effect of the various load combinations, the wall panels are post-tensioned so as to produce a net compressive stress along the length of the horizontal connection.
(A) Cracking Shear Load, V"
The proposed model for the cracking shear capacity, V cr, is dependent on the combined action of the shear friction resistance, VI> and the bearing resistance, Vb, along the sloped edge of the drypack shear keys as follows:
(2)
The two possible shear friction paths associated with the multiple shear key connections tested in this study are shown in Fig. 9. The shear resistance according to the friction path described in Fig. 9(a) is based on the assumption that slip can occur along all the bearing surfaces.
This shear resistance can be calculated in terms of the shear key configuration, the friction coefficient, J.L, and the stress normal to the connection, 0'"/1, as follows:
where
n = number of drypack shear keys d = depth of shear key t = thickness of connection 8 = inclination of shear key to hori
zontal
The shear resistance according to the second friction path, Fig. 9(b), is based on the assumption that slip occurs only at the drypack-panel interface in the region between the drypack shear keys. This shear resistance may be estimated as:
PCI JOURNALIMarch-ApriI1989
(4)
The bearing stress at the sloped edge of the shear keys induces a state of tensile stress in the shear keys. Thus, the bearing capacity, Vb, is ultimately controlled by the tensile strength of the drypack. The bearing component, Vb, may therefore be estimated as follows:
(5)
where It is the tensile strength of the dI)'pack and Acr is the total cross-sectional area of the diagonal cracks in the drypack shear keys .
The tensile strength of the drypack,j" can be calculated based on the compressive strength,!;, as:
fr = O.6J7[, (6)
The cross-sectional area of the diagonal cracks in the multiple shear key connection is calculated as:
(7)
Consequently, two possible models could be used to predict the cracking shear strength of the multiple shear key connections as follows:
Modell:
V,, = I'-CT.IA ,- ndt tan 0) + ~f,{Jr+ CT.)A"
(8)
Model2:
V,, = I'-CT.IA,-nht ) + ~f,(J, + CT.)A"
(9)
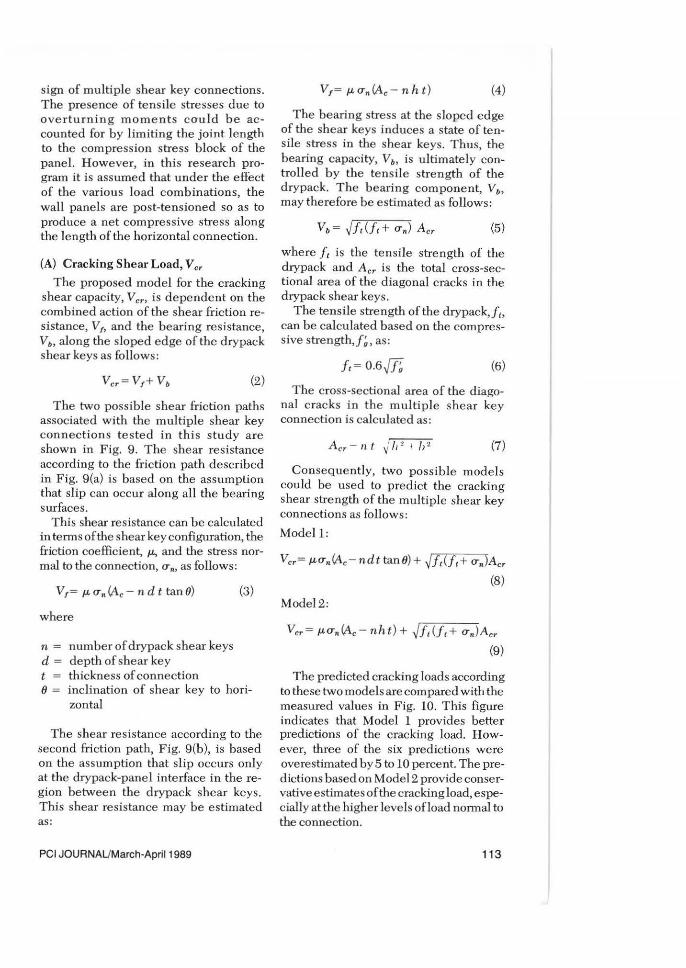
The predicted cracking loads according to these two models are compared with the measured values in Fig. 10. This figure indicates that Model 1 provides better predictions of the cracking load. However, three of the six predictions were overestimated by 5 to 10 percent. The predictions based on Model2 provide conservative estimates of the cracking load, especially at the higher levels ofload nonna! to the connection.
113
MULTIPLE SHEAR KEY CONNECTIONS IllIIlIIII MOO EL I Ng,)) MODEL 2
Fig. 10. Comparison of predicted to cracking shear loads.
(B) Maximum Shear Load, V m
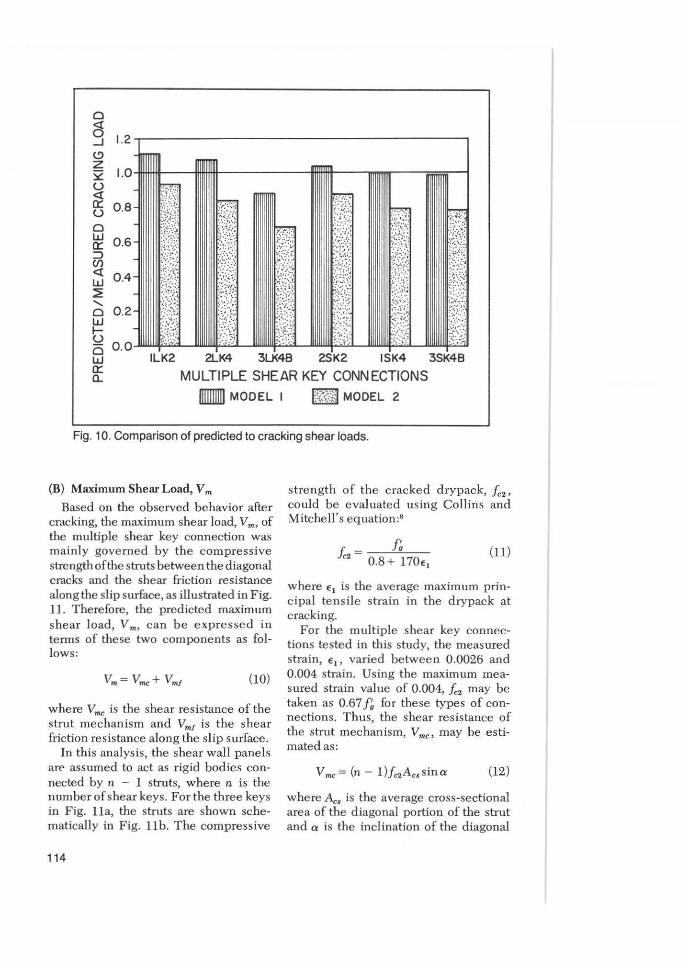
Based on the observed behavior after cracking, the maximum shear load, V m. of the multiple shear key connection was mainly governed by the compressive strength of the struts between the diagonal cracks and the shear friction resistance along the sl ip surface, as illustrated in Fig. 11. Therefore, the predicted maximum shear load, V m. can be expressed in terms of these two components as follows:
(10)
where V",e is the shear resistance of the strut mechanism and Vml is the shear friction resistance along the slip surface.
In this analysis, the shear wall panels are assumed to act as rigid bodies connected by n - 1 struts, where n is the number of shear keys. For the three keys in Fig. l1a, the struts are shown schematically in Fig. lIb. The compressive
114
strength of the cracked drypack, f", could be evaluated uSing Collins and Mitchell's equation:8
f: ];, ~ 0.8 + '170<, (ll )
where £ 1 is the average maximum principal tensile strain in the drypack at cracking.
For the multiple shear key connections tested in this study, the measured stra in, £1' varied between 0.0026 and 0.004 strain. Using the maximum measured strain value of 0.004, !c2 may be taken as 0.67 f~ for these types of connections. Thus, the shear resistance of the strut mechanism, Vmc , may be estimated as:
where Ac, is the average cross-sectional area of the diagonal portion of the strut and a is the inclination of the diagonal
Vm
SLIP SURFACE d
cos 8
0 <t 0 ~ L&J a: "- TYPICAL
b STRUT cos 8
, = Ponel Thickness
Vm (0)
P
~~ STRUT FORCES
1\ \
P
( b)
Fig. 11 . Maximum shear strength model.
port jon of the strut to the horizontaL T hese two parame ters may he com
puted in terms of the shear key d imensions as fo llows:
.4.0, ~ V2(b + d)tlcos8 (13)
a ~ tan- ' (hlh ) (14 )
PCI JOURNAUMarch-ApriI1989
SHEAR FRICTION
STRU~ 0 <t 0 ~
FORCE ---"\ j ~
(2P) ~ <t ::;; a:
;l :J 0 z 0
1-::;;0 l!!
L&J a: <3-J ~ "-Zo~ "-z _ <I
Vm ( c )
Representing the con nection by a rectangu lar strip, the d ist ribution of forces at the con nection, including the shear friction resistance, V mI. provided by slip along the drypack-panel in terface and along the diagonal cracks, is shown in Fig. lIe. T he shear friction re-
115
o § ~ :::E X <t :::E o w 0:: ::J (f)
<t W :::E ..... o w t; is w ILK2 ISK4 0:: D- MULTIPLE SHEAR KEY CONNECTIONS
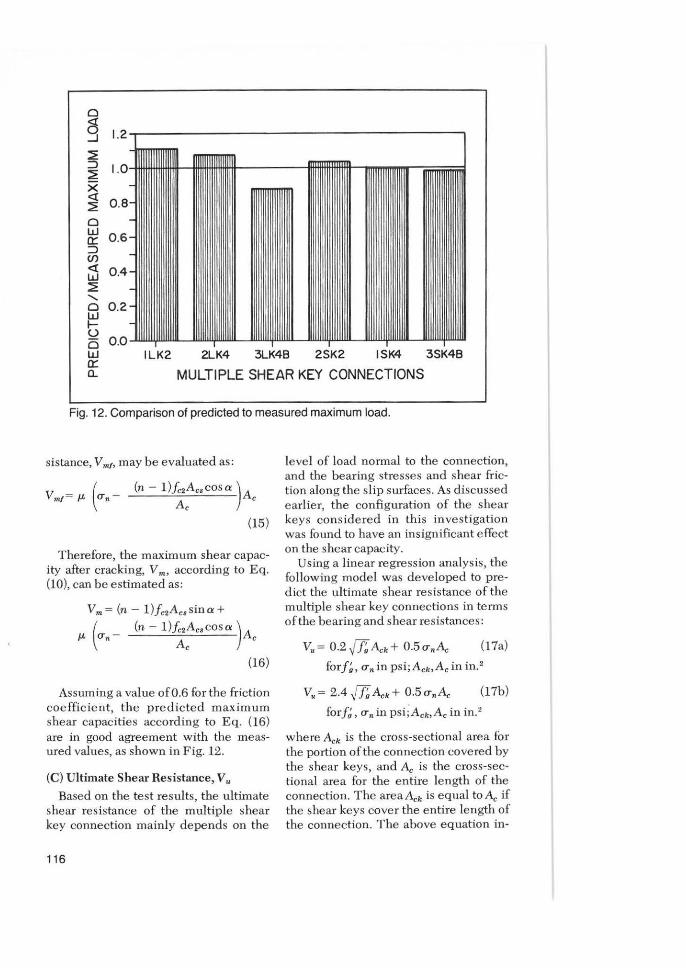
Fig. 12. Comparison of predicted to measured maximum load.
sistance, V ml> may be evaluated as :
(15)
Therefore, the maximum shear capacity after cracking, V m, according to Eq. (10), can be estimated a"
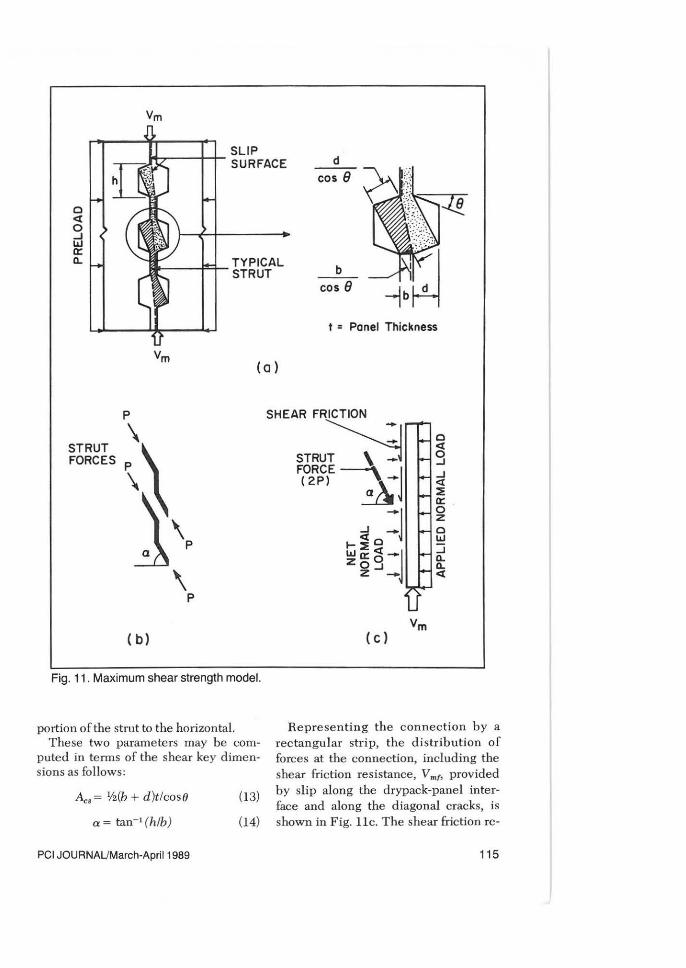
Assum ing a value 0[0.6 for the friction coeffi c ient, the predicted maximum shear capacities according to Eq. (16) are in good agreement with the measured values, as shown in Fig. 12.
(C) Ultimate Shear Resistance, V u
Based on the test results, the ultimate shear resistance of the multiple shear key connection mainly de pends on the
116
level of load normal to the connection, and the bearing stresse s and shear fri ction along the slip surfaces. As discussed earlie r, the configuration of the shear keys cons idered in thi s inve stigation was found to have an insignificant e ffect on the shear capacity.
Using a linear regress ion analys is, the following model was deve loped to predict the ultimate shear resistance of the multiple shear key connections in te rms of the bearing and shear resistances :
V.= 0.2 .{J;A, . + 0.500,.4.0 (17a)
forf;, (Tn in psi;Ack,Ac in in. 2
V. = 2.4 .{J;.4.0.+ 0.5oo, A, (17b)
for f;, (J" II in psi;Ack.Ac in in.2
where Ack is the cross-sectional area for the portion of the connection covered by the shear keys, and Ac is the cross-sectional area for the entire length of the connection. T he areaAck is equal toAc if the shear keys cover the e ntire length of the connection. The above equation in-
MULTIPLE SHEAR KEY CONNECTIONS
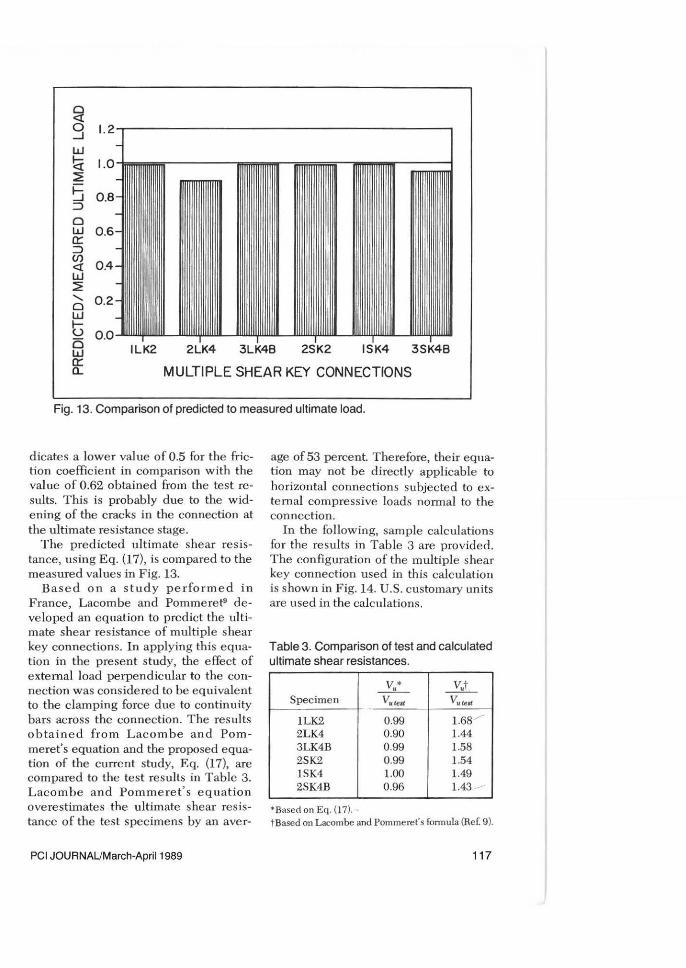
Fig. 13. Comparison of predicted to measured ultimate load.
dicates a lower value of 0.5 for the friction coeffic ie nt in comparison with the value of 0.62 obtained from the test results. This is probably due to the wide ning of the c racks in the connection at the ultimate resistance stage.
The predicted ultimate shear resistance, using Eq. (17), is compared to the measured values in Fig. 13.
Based on a stud y perform e d in France, Lacombe and Pomme re t9 deve loped an equation to predict the ultimate shear res istance of multipl e shear key connections. In applying this equation in the present study, the effect of e xternal load perpendicular to the connec tion w as conside re d to be equivalent to the damping force due to continuity bars across the connection. The results obtained from Lac ombe and Pommeret's equation and the proposed equation of the current study, Eq. (17), are compared to the test results in T able 3. Lacombe and Pomm e ret's e quation ove restimates the ultimate shear resistance of the test specimens by an ave r-
PCI JOURNAUMarch-ApriI1989
age of 53 perce nt There fore, the ir equation may not be directly applicable to horizontal connections subjected to exte rnal compress ive loads nonnal to the connection.
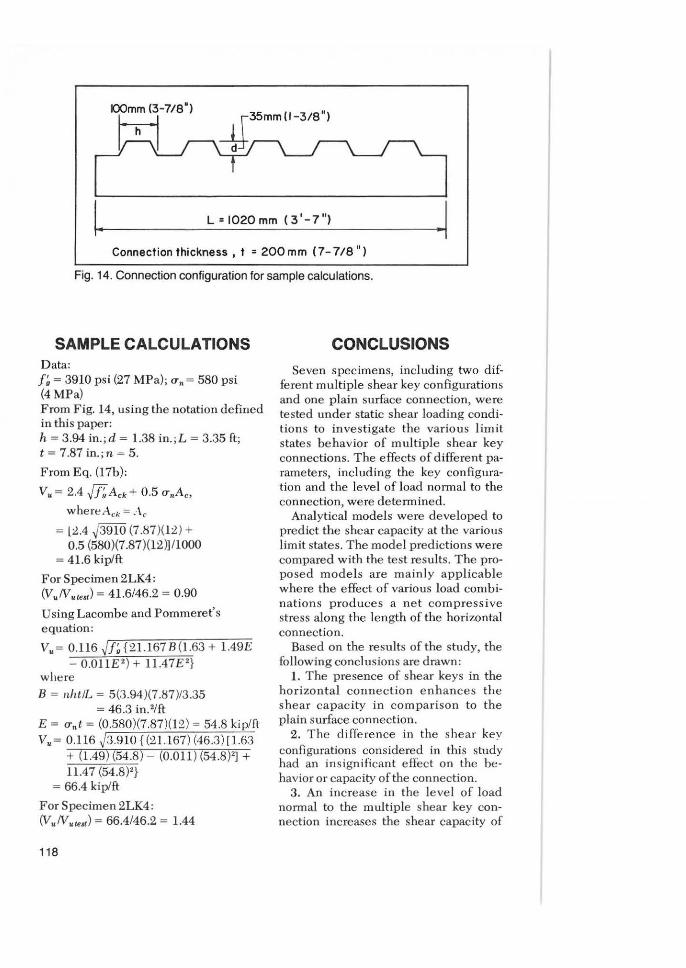
In the following, sample calculations for the results in Table 3 are provided. The configuration of the multiple shear key connection used in this calculation is shown in Fig. 14. U. S. customary units are used in the calculations.
Table 3. Comparison of test and calculated ultimate shear resistances.
V ' -,- ~ Spec imen V I/UfI. VI/uS!
lLK2 0.99 1.68 / 2LK4 0.90 1.44 3LK4B 0.99 1.58 2SK2 0.99 1.54 lSK4 1.00 1.49 2SK4B 0.96 1.43 /
• Based on Eq. (17) . . t Based on Lacombe and Pomme ret's fonnula (Ref. 9).
117
~ I L = 1020 mm (3' -7 ") I
Connection thickness, t = 200 mm (7-718")
Fig. 14. Connection configuration for sample calculations.
SAMPLE CALCULATIONS Data: J; = 3910 psi (27 MPa); CT. = 580 psi (4 MPa) From Fig. 14, using the notation defined in this paper: h = 3.94 in.;d = 1.38 in.;L = 3.35 ft; t = 7.87 in.;n = 5.
From Eq. (17b):
Vu = 2.4 f]';ACk+ 0.5 unAc.
whereAck = A c
= 1~.4 .J391O (7.87 )(12) + 0.5 (580)(7.87 )(12)J / I000
= 41.6 kip/ft
For Specimen 2LK4: (V.N.",,) = 41.6/46.2 = 0.90
U sing Lacombe and Pommeret's equation:
V. = 0.116 JJ;{2 1.167 B(1.63 + 1.49E - O.OIlE') + 11.47E '}
where
B = "htlL = 5(3.94 )(7.87)/3.35 = 46.3 in. '1ft
E = CT.t = (0.580)(7.87)(12) = 54.8 kiplft V. = 0.116 ~3.910 {(21.167) (46.3)[ 1.63
+ (1.49) (54.8) (0.011) (54.8)'J + 11.47 (54.8)')
= 66.4 kip/ft
For Specimen 2LK4: (V.N.",,) = 66.4/46.2 = 1.44
118
CONCLUSIONS
Seven specimens, including two different multiple shear key configuration s and one plain surface connection, were tested under static shear loading conditions to investigate the various limit states behavior of multiple shear key connections. The effects of different parameters, including the key configuration and the level of load normal to the connection, were detennined.
Analytical models were developed to predict the shear capacity at the various limit states. The model predictions were compared with the test results. The pro· pose d models are mainly applicable where the effect of various load combinations produces a net compress ive stress along the length of the horizontal connection.
Based on the results of the study, the following conclusions are drawn:
1. The presence of shear keys in the horizontal connection enhances the shear capacity in comparison to the plain surface connection.
2. The difference in the shear key configurations considered in this study had an insignificant effect on the be· havior or capacity of the connection.
3. An increase in the level of load normal to the multiple shear key connection increases the shear capacity of
the connection. The percentage increase in shear capacity is, however, not equal to the percentage increase in load nonnal to the connection.
4. The cracking load may be conservatively estimated using the proposed model given in Eq. (9 ).
5. The equation based on the study perfonned in France does not appear to be directly applicable to horizontal connections subjected to external compressive loads normal to the connection.
6. The proposed models for the prediction of maximum shear load, Eq. (16), and ultimate shear resistance, Eq. (17), compare well with the test results.
* *
ACKNOWLEDGMENTS
This study was carried out in the Department of Civil Engineering at the University of Manitoba. The financial assistance provided h y Con-Force Structures LtJ., Winnipeg, Manitoba, and the National Research Council of Canada IRAP program is gratefully appreciated.
The authors are grateful to the reviewers of the PCI JOURNAL for their constructive comments and particularly to Dr. Alex Aswad for bringing the French investigation (see Ref 9) to their attention.
*
REFERENCES
1. Chakrabarti, S. G, Nayak, G. c., and Paul, D. K., "Shear Characteristics of Cast-inPlace Vertical Joints in Story-High Precast Wall Assembly," ACI Structural Journal, V. 85, No.1, January-February 1988, pp. 30-45.
2. Cholewicki, A., "Load Bearing Capacity and Deformability of Vertical Joints in Structural Walls of Large Panel Buildings," Building Science, V. 6, No.1, May, 1971 , pp. 163-184.
3. Hansen, et aI., "Keyed Shear Joints," SBI-Report 97, Danish Building Research Institute, Statens Byggeforskningsinstitut, 1976,33 pp.
4. ACI Committee 318, " Building Code Requirements for Reinforced Concrete (ACI 318M-83)," Detroit, Michigan, III pp.
5. Canadian Standards Association (CSA), "Design of Concrete Structures for
PCI JOURNALJMarch-ApriI1989
Bu;id;ngs (CAN3-A23.3-M84)," Rexdale, Ontario, 1984.
6. PCl Design Handbook - Precast and Prestressed Concrete, Third Edition, Prestressed Concrete Institute, Chicago, Illinois, 1985.
7. Foerster, H. R., Rizkall a, S. H ., and Heuvel, J. S., "Behavior and Design of Shear Connections for Loadbearing Wall Panel s," PCI JOURNAL, V. 34, No. I , January-February 1989, pp. 102-119.
8. Collins, M. P., and Mitchell, D., Prestressed Concrete Basics, Ottawa, Ontario, 1987, pp. 318-320.
9. Lacombe, G., and Pommeret, M., "Les Joints Structuraux dans les Constructions e n Grands Panneaux Prefabriques," Annales de l'Institut Technique du Batiment et des Travaux Publics, No. 314, February 1974, pp.1l4-140.
11 9

APPENDIX - NOTATION
Ac = cross-sectional area for entire length of connection
ACk = cross-sectional area for portion of connection covered by shear keys
Acr = cross-sectional area of diagonal cracks
Ac3 = cross-sectional area o f diagonal portion of a strut
B ratio of key area tOjaint length b minim um space between indi-
vidual panels d depth of drypack shear key E total force nonnal to connection Ie? compressive strength of cracked
drypack j~ specified compressive strength of
concrete f~ compressive strength of dry pack j, tensile strength of drypack h height of drypack shear key L length of connection
n number of drypack shear keys t thickness of connection Vb bearin g res istance at drypack
shear keys Vcr = cracking shear capacity VI = shear friction res istance Vm = maximum shear capacity Vmc = shear resistance of strut mechan-
ism Vmf = shear friction resistance at maxi
mum load VIt nominal shear capac ity a = inclination of diagonal portion of
strut to horizontal €l maximum tensile strain at crack
ing o inclination of shear key to hori
zontal Un compressive st ress normal to
connection JL friction coefficient
* * *
NOTE: Discussion of this paper is invited. Please submit your comments to PCI Headquarters by December 1, 1989.
120