multiple linear combination (mlc) regression tests for ... ·...
TRANSCRIPT
Received: 31 January 2016 Revised: 25 May 2016 Accepted: 27 September 2016 Published on: 25 November 2016
DOI: 10.1002/gepi.22024
R E S E A R C H A R T I C L E
Multiple linear combination (MLC) regression tests for commonvariants adapted to linkage disequilibrium structure
Yun Joo Yoo1,2 Lei Sun3,4 Julia G. Poirier6 Andrew D. Paterson4,5 Shelley B. Bull4,6
1Department of Mathematics Education, Seoul
National University, Seoul, South Korea
2Interdisciplinary Program in Bioinformatics, Seoul
National University, Seoul, South Korea
3Department of Statistical Sciences, University of
Toronto, Toronto, Canada
4Division of Biostatistics, Dalla Lana School of
Public Health, University of Toronto, Toronto,
Canada
5Program in Genetics and Genome Biology,
Hospital for Sick Children Research Institute,
Toronto, Canada
6Prosserman Centre for Health Research, Lunenfeld-
Tanenbaum Research Institute, Sinai Health System,
Toronto, Canada
CorrespondenceShelley B. Bull, Lunenfeld-Tanenbaum Research
Institute, Sinai Health System, 60 Murray Street, Box
No. 18, Toronto, ON, M5T 3L9 Canada
Email: [email protected]
Yun Joo Yoo, Department of Mathematics
Education, Seoul National University, Seoul 08826,
South Korea
Email: [email protected]
Grant sponsor: National Research Foundation
of Korea (NRF); Grant numbers:
NRF-2012R1A1A3012428,
NRF-2015R1A1A3A04001269, and
NRF-2015R1A2A2A01006885; Grant sponsor:
Canadian Institutes of Health Research;
Grant number: MOP-84287
ABSTRACTBy jointly analyzing multiple variants within a gene, instead of one at a time, gene-based multiple regres-
sion can improve power, robustness, and interpretation in genetic association analysis. We investigate mul-
tiple linear combination (MLC) test statistics for analysis of common variants under realistic trait mod-
els with linkage disequilibrium (LD) based on HapMap Asian haplotypes. MLC is a directional test that
exploits LD structure in a gene to construct clusters of closely correlated variants recoded such that the
majority of pairwise correlations are positive. It combines variant effects within the same cluster linearly,
and aggregates cluster-specific effects in a quadratic sum of squares and cross-products, producing a test
statistic with reduced degrees of freedom (df) equal to the number of clusters. By simulation studies of 1000
genes from across the genome, we demonstrate that MLC is a well-powered and robust choice among exist-
ing methods across a broad range of gene structures. Compared to minimum P-value, variance-component,
and principal-component methods, the mean power of MLC is never much lower than that of other meth-
ods, and can be higher, particularly with multiple causal variants. Moreover, the variation in gene-specific
MLC test size and power across 1000 genes is less than that of other methods, suggesting it is a com-
plementary approach for discovery in genome-wide analysis. The cluster construction of the MLC test
statistics helps reveal within-gene LD structure, allowing interpretation of clustered variants as haplotypic
effects, while multiple regression helps to distinguish direct and indirect associations.
K E Y W O R D S
common variants, linkage disequilibrium, multibin linear combination test, multivariant test, quantitative
trait
1 INTRODUCTION
In genome-wide association studies (GWAS) and large-scale
candidate gene studies, researchers typically scan a large
number of single nucleotide polymorphism (SNP) markers,
one by one, to detect SNP-trait association signals. This
single-SNP analysis strategy has been preferred as a sim-
ple and effective approach assuming the design and scale
of the studies are sufficient to capture the marginal direct
or indirect association of a SNP with complex disease traits
This is an open access article under the terms of the Creative Commons Attribution-NonCommercial License, which permits use, distribution and reproduction
in any medium, provided the original work is properly cited and is not used for commercial purposes.
© 2016 The Authors Genetic Epidemiology Published by Wiley Periodicals, Inc.
(Kraft & Cox, 2008; Risch & Merikangas, 1996). As an
alternative to single SNP test statistics, combined analy-
sis of multiple SNPs within a gene (or a specified region)
is a natural and interpretable analytic strategy at the gene
level, and various methods have been advocated. A gene-
based approach offers other analytical merits—reduction
of multiple testing burden, robustness to population dif-
ferences regarding LD and allele frequency, and improved
ability to replicate associations (Luo et al., 2010; Neale &
Sham, 2004).
Genet. Epidemiol. 2017; 41: 108–121 www.geneticepi.org 108
YOO ET AL. 109
An established class of gene-based methods applies
multiple regression analysis in which each SNP is coded as a
covariate (Chapman & Whittaker, 2008; Clayton, Chapman,
& Cooper, 2004; Moskvina et al., 2012; Wason & Dud-
bridge, 2012). A multi-SNP global statistic is constructed to
represent a gene and test the global null hypothesis where the
degrees of freedom (df) correspond to the number of SNPs.
Alternatively, SNP genotypes can be represented by one
or more principal components that explain their variability
(Gauderman, Murcray, Gilliland, & Conti, 2007). Other
reduced df global statistics have been constructed from single
or multiple SNP analysis: the weighted sum method uses a
linear combination of regression coefficients or their corre-
sponding test statistics, but performance depends on the direc-
tion of the per-SNP association, and how minor and major
alleles are coded (Han & Pan, 2010; Madsen & Browning,
2009; Schaid, McDonnell, Hebbring, Cunningham, &
Thibodeau, 2005; Wang & Elston, 2007). A weighted
squared sum test of per-SNP marginal effects avoids this
problem, and is powerful for certain alternatives (Pan, 2009).
Similar gene-based tests include kernel regression and related
variance component methods (Goeman, van de Geer, & van
Houwelingen, 2005; Kwee, Liu, Lin, Ghosh, & Epstein,
2008; Schaid et al., 2005; Wu et al., 2010).
To improve power and robustness of genetic association
analysis to gene structure and trait architecture, we proposed
multiple linear combination (MLC) regression for regional
testing (Bull, Yoo, & Sun, 2009; Yoo, Sun, & Bull, 2013).
The MLC test adapts to the LD structure of SNPs in a gene by
partitioning and recoding SNPs into bins of positively corre-
lated SNPs, using only the pairwise SNP correlations. From a
regression analysis of multiple SNPs in a gene, the individual
SNP coefficients are combined linearly within each bin and
then bin-specific terms are combined in a weighted sum of
squared and cross-product (i.e., quadratic) terms. Trait asso-
ciation with the gene region is then represented by an overall
global statistic with df equal to the number of bins. In this way,
we improve robustness to the problem of opposing direction
of effects and achieve some reduction in df while retaining
the parsimony of a linear combination of multiple SNP effects
within a bin.
In Yoo et al. (2013) and Yoo, Sun, Poirier, and Bull (2014),
we constructed bins using LDSelect, an established method
for tagSNP selection that lends itself to bin construction (Carl-
son et al., 2004). Initially, we examined trait model sce-
narios with one or two low frequency causal SNPs, ana-
lyzing only noncausal low-frequency and/or common SNPs,
and observed that reduced df MLC tests often showed bet-
ter power than the full df Wald test. In further developments,
we evaluated an alternative clustering method to construct
bins for the MLC test by modeling SNPs as graphs and find-
ing a substructure of the graph (Yoo, Kim, & Bull, 2015).
Compared to LDSelect, this clustering algorithm tends to pro-
duce smaller clusters with stronger positive correlation, so the
MLC test is less likely to be affected by the occurrence of
opposing signs in the individual SNP effect coefficients.
The purpose of this report is to characterize conditions in
which the clustering-based MLC test performs better or worse
than other gene-based tests, limiting attention to non trait-
adaptive methods. Because MLC tests are based on multiple
regression analysis, they are well-designed for common vari-
ants. Their strength comes from incorporating the linkage dis-
equilibrium (LD) structure among causal and neutral SNPs,
which is expected to be more extensive for common SNPs. We
illustrate application and interpretation of gene-based analysis
in candidate gene analysis of HDL cholesterol in participants
of the Diabetes Control and Complications Trial. We inves-
tigate MLC test power in comparison with other gene-based
statistics for scenarios with multiple common causal variants
(minor allele frequency (MAF) > 0.05) and conduct simula-
tion studies under various genetic models where multi-SNP
regressions include all typed SNPs or exclude untyped causal
SNPs. We consider realistic LD structure among causal and
neutral SNPs based on SNP distributions and LD structures in
HapMap Asian population data for 1,000 genes sampled from
across the genome.
We propose two main applications of the MLC approach:
(1) computationally efficient genome-wide gene-based gene
discovery, as a complement to conventional single-SNP anal-
ysis, and (2) large-scale candidate gene studies or regional fine
mapping of candidate regions; in both settings, we avoid the
multiple testing cost associated with adaptive use of trait data
in test construction. Although all gene-based methods reduce
the level of genome-wide multiplicity by treating the gene
as the unit of analysis, advantages of common-variant mul-
tiple regression include computationally inexpensive use of
asymptotic test distributions, variant prioritization and local-
ization within a gene, ability to capture haplotype information
at least approximately, and biological interpretability.
2 STATISTICAL METHODS
2.1 Estimation and hypothesis testing in multi-SNPregression models
Denote the genotypes of 𝐾 SNPs as 𝑋 = (𝑋1, 𝑋2,⋯ , 𝑋𝐾 )and the trait variable as 𝑌. Initially, we code the genotype val-
ues of 0, 1, and 2 as a count of the minor allele. Inference con-
cerning overall association between the trait and the SNPs is
obtained via a multi-SNP regression model:
𝑔−1{𝐸(𝑌 |𝑋)} = 𝛽0 + 𝛽1𝑋1 + 𝛽2𝑋2 +⋯ + 𝛽𝐾𝑋𝐾, (1)
where𝐸(𝑌 |𝑋)is the expected value of 𝑌𝑖 given 𝑋 and 𝑔−1(⋅)is the link function. In this report, we focus on a quantita-
tive trait, using the identity function for 𝑔−1(⋅), but analogous
approaches can be applied to categorical traits, as typical in
case-control studies, or time-to-event traits in cohort studies.

110 YOO ET AL.
Hypothesis tests for association in the joint multi-
SNP regression model are constructed using the parame-
ter estimates 𝛽 = (𝛽1,⋯ , 𝛽𝐾 )𝑇 and the corresponding esti-
mated variance-covariance matrix Σ𝐵 , obtained by least
squares/maximum-likelihood methods under large sample
assumptions. In large samples, it is sufficient to assume
that the regression coefficients 𝛽 follow a multivariate nor-
mal distribution with variance-covariance matrix of rank
𝐾 . In linear regression, Σ = 𝜎2
𝑛(𝑆𝑋)−1depends on a con-
sistent error variance estimate and on SNP genotype vari-
ances/covariances in 𝑆𝑋 = 𝑋𝑇𝑋. A generalized, that is,
multi-df Wald test of the global null hypothesis of no asso-
ciation (𝛽𝑗 = 0 for all 𝑗) against the alternative that at least
one 𝛽𝑗 ≠ 0 is defined as 𝐺𝑊 = 𝛽𝑇Σ−1𝐵𝛽 which has a quadratic
form. The asymptotic null distribution of this statistic is chi-
squared with K df, assuming the SNP design matrix is of
full rank, that is, no linear dependency among SNPs. Single-
df tests of 𝛽𝑗 = 0 against the alternative that 𝛽𝑗 ≠ 0, tak-
ing into account other SNPs in the regression, correspond to
𝑍𝑗 = 𝛽𝑗∕√
Var(𝛽𝑗) = 𝛽𝑗∕√
(Σ𝐵)𝑗𝑗with large sample covari-
ance Σ𝑍 , which can be derived from Σ𝐵 as the correlation
matrix of 𝛽 = (𝛽1,⋯ , 𝛽𝐾 )𝑇 .
2.2 Multibin linear combination L df tests
Two versions of a multibin linear combination test 𝐺𝑀 =(𝐶𝛽)𝑇 (𝐶𝑇
∑𝐶)−1(𝐶𝛽) can be constructed using 𝛽 estimates
from the multi-SNP regression model, and C, a K by L matrix
of linear contrasts. One MLC test version combines param-
eter estimates (MLC-B: 𝛽 = (𝛽1,… , 𝛽𝐾 )𝑇 ) and the other
combines the corresponding test statistics (MLC-Z: 𝑍 =(𝑍1,… , 𝑍𝐾 )𝑇 ). In our evaluations, they give similar results.
Both versions incorporate predetermined bins into the con-
struction of the test statistics; we discuss bin construction and
allele coding in the following subsection. For now, suppose
that L bins are formed from K SNPs (L≤K). Let J be a K by Lmatrix where the jth column represents assignment to jth bin,
that is, 𝐽𝑖𝑖 = 1 if the ith SNP belongs to the jth bin and 𝐽𝑖𝑖 = 0if not. We assume that the bins consist of mutually exclusive
sets of SNPs. MLC tests of multiple bins are then defined as:
MLC-B = (𝛽𝑇𝑊𝐵)(𝑊 𝑇𝐵Σ𝐵𝑊𝐵)−1(𝑊 𝑇
𝐵𝛽),
MLC-Z = (𝛽𝑇𝑊𝑍 )(𝑊 𝑇𝑍Σ𝑍𝑊𝑍 )−1(𝑊𝑍
𝑇 𝛽)
with 𝑊𝐵=(Σ−1𝐵𝐽 )(𝐽𝑇Σ−1
𝐵𝐽 )−1 and 𝑊𝑍 =(Σ−1
𝑍𝐽 )(𝐽𝑇Σ−1
𝑍𝐽 )−1,
respectively. Assuming a fixed design matrix X and a prespec-
ified bin definition algorithm, the matrix J is fixed and does
not depend on the trait data;Σ𝐵 estimation is carried out under
the unrestricted linear regression model. The null distribution
of MLC-B (MLC-Z) is approximately L df chi-squared under
the null hypothesis 𝜷 = 0. MLC is a directional test with power
oriented toward a restricted alternative specified by the matrix
C (see Supplementary Methods B. for details). In the absence
of knowledge about underlying genetic architecture, the added
value of the proposed method is its ability to adapt to complex
LD structure in constructing a reduced df test statistic, without
incurring the price paid for examination of trait data.
The global regression Wald test is a special case in which
each bin consists of one SNP, that is, J = diag(1, 1, …, 1),
L = K. In this case, the test is fully quadratic with each regres-
sion coefficient entering the test statistic in squared and cross-
product terms. At the other extreme, 1 df linear combina-
tion tests (LC-B, LC-Z) can be constructed as special cases
of MLC tests where J = (1, 1, ..., 1)T, that is, all SNPs are
in the same bin. LC-B is a fully linear statistic in which the
regression coefficients enter with sign corresponding to the
direction of association with the trait. The gene-based MLC
test statistic with L df based on bins that reflect LD structure
is a linear-quadratic hybrid constructed from L bin-specific
linear combinations. The bin-specific terms are aggregated
in a sum of squared and cross-product terms (Supplementary
Methods B).
As we demonstrate in the application below, a bin-specific
statistic extracted from this sum can provide a refined local-
ization compared to gene-level and single SNP level analysis
in that the global gene-level test will usually represent a
region too large for localization, while localization at the
single-SNP level can be misleading. Bin-specific statistics
can reveal association with a multilocus causal haplotype
or multiple causal haplotypes for which single-SNP signals
would be weak.
The LC tests follow from early consideration of multi-
ple outcomes in clinical trial data analysis (O’Brien, 1984;
Pocock, Geller, & Tsiatis, 1987). We note that LC-B is equiv-
alent to the Wald-type test statistic described by Stram, Wei,
and Ware (1988) and the score test statistic proposed by
Schaid et al. (2005). The LC test statistics asymptotically
follow chi-square distributions with 1 df, and therefore may
be more powerful than the K df Wald test or the L df MLC
test in certain conditions. However, such linear combinations
are sensitive to the direction of alternatives in the parameter
space. In particular, LC statistics are attenuated when mul-
tiple causal variants in a gene are coded such that the trait
is affected both positively and negatively. This results in the
occurrence of opposite signs among 𝛽1,… , 𝛽𝐾 and possible
cancellation of the effects in the linear combination, produc-
ing substantial loss of power. To reduce this problem, without
introducing bias into the MLC test statistic from trait associa-
tion evidence in 𝛽1,… , 𝛽𝐾 we take an allele recoding and bin
construction strategy that is independent of trait information.
2.3 Construction of SNP bins and allele coding
Our objective in bin construction is to cluster SNPs into sub-
sets using within-gene LD information such that correlation
between additively coded SNPs within a bin is high and pos-
itive, while correlation between SNPs in different bins is low.

YOO ET AL. 111
To this end, we conduct bin selection based on a clique-based
clustering algorithm called CLQ developed in a previous
study (Yoo et al., 2015). As a clustering criterion, CLQ uses
the LD measure r, which is calculated as the Pearson corre-
lation of a pair of additively coded SNPs, and can be positive
or negative in sign. In this algorithm, we first model SNPs as
a graph 𝐺 = (𝑉 ,𝐸) with a vertex set V of SNPs and an edge
set E of which each edge denotes a pair of adjacent SNPs
with |r| > c, a given threshold value. The CLQ algorithm
partitions the graph G into cliques that are subsets such that
all pairs of vertices of each clique are adjacent (see Yoo et al.,
2015 for details). The size and number of clusters depends
on the choice of the threshold value c. Based on simulations
presented below, we recommend c = 0.5 for general use,
and find that type 1 error and power are not sensitive to
modest changes in this threshold value. When threshold
choice is based only on LD structure, and not on results
of genotype-phenotype analysis using multiple threshold
values, uncertainty in bin assignment does not need to be
taken into account in the analysis.
In the multi-SNP regression (1), the sign of the regression
coefficients is determined by SNP coding of the minor
and major alleles (usually coded as 1 and 0, respectively).
Assuming an additive genotype score for an allele, switch-
ing the minor and major alleles changes the sign of the
corresponding 𝛽𝑖 estimate and its covariance with other 𝛽
estimates. This affects the linear combination test statistics,
but has no effect on the quadratic Wald statistic. A widely
used allele coding method designates the minor allele as the
“deleterious” allele under the presumption that this will be
the case for most of the SNPs. If, however, the SNPs being
tested are merely tagging a causal SNP or some of the causal
effects are actually protective, the signs of the regression
coefficients of these SNPs may be reversed.
To address potential inconsistencies in effect direction in
the context of linear combination tests, we apply a coding cor-
rection method proposed by Wang and Elston (2007). Accord-
ingly, the allele coding decision based on the genotype data
is applied within each bin of the MLC test (or to the entire
gene in the LC test) so that the number of positively corre-
lated SNPs is maximized within a bin (or within a gene for
the LC test). This approach first catalogues SNPs using the
number of negative pairwise correlations with other SNPs for
a given initial coding scheme (usually minor alleles coded as
1). Starting from the SNP with the largest number of negative
pairwise correlations with others, the 1/0 coding is reversed.
The correlation status between SNPs after recoding one SNP
is reexamined and the procedure is repeated iteratively until
the number of SNPs negatively correlated with one SNP is
less than half of the number of SNPs. After applying this cod-
ing correction, the resulting matrix of pairwise LD measures
r will have a minimized number of negative pairwise corre-
lations between SNPs. However, we recognize that complete
resolution can be difficult with linear combinations consisting
of more than a few SNPs. Uncertainty in clique-based clus-
tering and recoding does not affect the validity of the asymp-
totic distribution of the MLC test, because the clustering and
recoding that determine the direction of the test are based only
on the genotype data, and variance estimation is carried out
under the unrestricted linear regression model. Because this
adaptive coding procedure ignores the direction of the trait
association, it does not inflate the type I error of MLC and
LC tests. We apply the recoding procedure in construction of
the MLC and LC statistics throughout the subsequent appli-
cation and evaluations.
2.4 Other gene-based tests
We compare the performance of MLC tests against several
popular gene-based analysis methods (for details see Supple-
mentary Methods A). One class of methods for gene-based
analysis derives a test of global association from multiple
single-SNP results, that is, from multiple marginal analy-
ses (Pan, 2009). The sum of squared marginal beta coef-
ficients (SSB) and sum of squared marginal beta coeffi-
cients with inverse variance weights (SSBw) statistics (Pan,
2009) are quadratic statistics obtained from the sum of
squared beta coefficients with weights W = (1, 1, …, 1)T
and𝑊 = (Var(𝛽𝑀1 )−1,… ,Var(𝛽𝑀𝐾)−1)𝑇 , respectively, where
𝛽𝑀 = (𝛽𝑀1 ,… , 𝛽𝑀𝐾)𝑇 is the marginal regression coefficients
vector. GWAS investigators performing single-SNP-based
analysis effectively apply an intrinsic region-based approach
by using a maximum statistic (MinP-M), which selects one
SNP with the strongest association within a region (WTCCC,
2007). This practice implies that the biggest test score (or
smallest P-value) has been chosen as a global statistic for
the region, but this approach can be insensitive when multi-
ple independent moderate associations occur within a region.
We consider a similar minimum P-value test obtained from
multi-SNP regression (MinP-J). The sequence kernel asso-
ciation test (SKAT) is derived from a variance-component
model in which beta parameters follow a random effects dis-
tribution (Ballard, Cho, & Zhao, 2010; Kwee et al., 2008).
The SKAT-O statistic is a combination of the quadratic SKAT
statistic with a linear combination test statistic that aggregates
minor allele variant counts (Lee et al., 2012; Wu et al., 2011).
Finally, our comparisons include a gene-based multi-df statis-
tic from multiple regression of principal components of mul-
tiple SNP genotypes (PC80) proposed by Gauderman et al.
(2007) that performs well overall when there is more than
one causal variant in the gene (Ballard et al., 2010; Petersen,
Alvarez, DeClaire, & Tintle, 2013).
3 APPLICATION IN THE DCCT/EDICCANDIDATE GENE STUDY
The Diabetes Control and Complications Trial/Epidemiology
of Diabetes Interventions and Complications (DCCT/EDIC)
112 YOO ET AL.
study is a long-term follow-up study of randomized trial par-
ticipants with type 1 diabetes (T1D; DCCT, 1993; EDIC,
1999). The DCCT/EDIC Genetics Study was designed to
investigate the association of SNPs in a large set of candi-
date genes with complications of T1D. As detailed in the
methods of Al-Kateb et al. (2008), tagging SNPs within 5
kb flanking either side of each of 201 candidate genes were
selected not to be in strong LD and to have MAF greater
than 5% based on data from the HapMap Project. Study par-
ticipants were genotyped by a custom Illumina GoldenGate
Beadarray assay, and data were subjected to standard QC
procedures. This set of candidate genes includes several
recently reported by Teslovich et al. (2010) to be asso-
ciated with high-density lipoprotein (HDL) cholesterol in
the general population: CETP, APOB, IRS1, LPL, ABCA1,APOA1, LIPC, LCAT, MC4R. It is of interest to assess these
and other candidate genes for association in a population
with T1D.
The dataset we analyzed for genetic associations with HDL
consists of 1,362 white probands with genotyping data for
1,213 SNPs (MAF > 5%) in 183 candidate genes (with ≥2
SNPs per gene). The number of SNPs genotyped per gene
ranges from 2 to 47, with a median value of 4. We applied the
MLC tests and other gene-based tests to the logged and cen-
tered HDL measures obtained at the DCCT baseline assess-
ment. For each gene, we constructed clusters for the MLC
tests using the threshold values in the range c = 0.1 ∼ 0.9
(see supplementary Table S1 with results for all 183 genes).
At c = 0.5, the recommended value from simulations, we
obtained 1 to 30 clusters (median = 3) per gene. Out of 183
genes, 21 have at least one test that meets a liberal signifi-
cance criterion of P-value < 0.03, with 12 of these detected
by the MLC method with c = 0.5 compared to 9 by the global
Wald test, and 10 by MinP-M (supplementary Table S2). As
expected, there is strong concordance between MLC-B and
MLC-Z, and between LC-B and LC-Z. With the exception
of LC tests, which detected few genes, the various tests give
similar signals for six of the genes, but otherwise there is lit-
tle concordance among the tests. In this application, the Wald
and MinP-J tests perform relatively better than in the simula-
tion studies below because the genotyped SNPs were selected
to be in low LD.
The P values for the established HDL-related gene CETPare genome-wide significant for all the methods except MinP-
J, but for the remaining 182 genes, none of the methods reach
a Bonferroni adjusted P-value criterion of 3 × 10⁻⁴. For
CETP, the PC80 test P-value (4 df) is the smallest, although
the MLC-B (5 df) and SSBw tests yield similar small P val-
ues. The 10 SNPs in the CETP region cluster into five bins
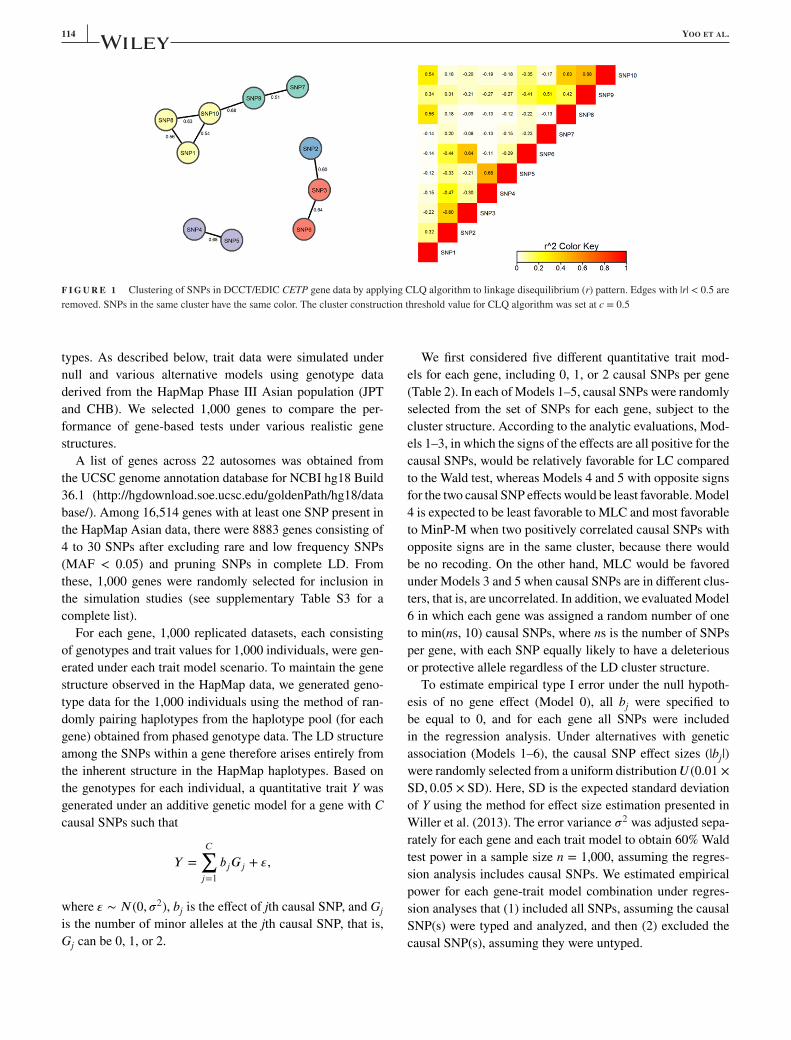
(Table 1 and Fig. 1). Two of the SNPs with strong marginal
signals (SNP4, SNP5) are highly correlated (r = 0.68) and
consequently the SNP5 signal disappears in joint regression
of all 10 SNPs. SNP4 (rs12720922), with the strongest sig-
nal in the joint multi-SNP regression, has been reported pre-
viously as associated with HDL (Asselbergs et al., 2012;
Enquobahrie et al., 2008; Wu et al., 2013). SNP2, and SNP7
and SNP9 also have attenuated signals in the joint regres-
sion; the former possibly due to LD with SNP3 or SNP5,
and the latter likely due to LD with SNP10 in the first clus-
ter (see Fig. 1). Cluster-specific statistics, constructed using
SNP-specific beta coefficients and the covariance matrix esti-
mate from the joint regression analysis, also suggest haplo-
types carrying the minor allele of SNP4 be given priority
for further attention. In contrast, from the marginal analysis
alone, the signals from SNP2, SNP5, SNP7, and SNP9 are
difficult to differentiate from the SNP4 association without
further analysis.
4 ANALYTIC POWER COMPARISONS
To gain insight into the relative performance of MinP and
Wald, MLC-B, and LC-B tests, we analytically derived
asymptotic distributions under simplified genetic models and
LD structure (see supplementary Methods B). MinP-M shows
good performance for one causal SNP, but for two or more
causal SNPs, the power depends on correlation between SNPs
and can be low relative to the other statistics (see supplemen-
tary Methods and Figs. S1 and S2). Although less sensitive
than LC-B to the direction of the causal effects, the power of
MLC-B depends on within-gene correlation and the underly-
ing trait model.
The K-df Wald test statistic can be partitioned into the sum
of an L-df MLC test statistic and an independent K-L df statis-
tic (Li & Lagakos, 2006). When the direction of the MLC test
is well chosen, it will capture most of the information in the
Wald test, but with fewer df and hence higher power. How-
ever, MLC test power will be affected adversely if the deter-
mined direction is not well chosen. The worst case for MLC
occurs when opposing regression coefficients occur among
correlated SNPs within a cluster. MLC performs best when
high within-cluster SNP correlation is combined with low
variation in the within-cluster variance-standardized regres-
sion coefficients, such as would occur with multiple causal
and/or indirect effects within a cluster. Thus in principle,
the proposed MLC clustering approach can show substantial
improved power compared to the Wald test, based on stan-
dard computationally efficient linear regression estimation,
and requiring only straightforward preanalysis to cluster the
SNP genotypes.
5 SIMULATION STUDIES
5.1 Design and methods
To better understand the data and model characteristics that
influence the performance of the methods, we conducted a
series of simulation studies based on observed human geno-

YOO ET AL. 113
TA
BL
E1
Ap
pli
cati
on
toD
CC
T/E
DIC
gen
etic
sst
ud
y:
Reg
ress
ion
anal
ysi
san
dgen
e-b
ased
anal
ysi
sre
sult
sfo
ras
soci
atio
nof
the
HD
Ltr
ait
wit
h10
SN
PS
inth
eC
ETP
gen
e
Reg
ress
ion
Ana
lysis
Res
ults
Join
tAna
lysis
Mar
gina
lAna
lysis
SNP
rsID
bpPo
sitio
nC
lust
erA
lloca
tion
MA
FBe
taP-
Valu
eLC
-Bpe
rC
lust
erW
ald
per
Clu
ster
Beta
P-Va
lue
SN
P1
rs1
72
45
71
55
69
61
07
81
0.0
82
–0
.04
00
.07
50
.17
5.5
60
.00
60
.70
9
SN
P8
rs1
27
20
89
85
69
77
33
11
0.0
68
0.0
48
0.0
58
(P=
0.6
82
)(P
=0
.13
5)
0.0
37
0.0
43
SN
P1
0rs
18
01
70
65
69
83
75
01
0.1
66
–0
.01
80
.55
60
.01
40
.26
2
SN
P3
rs7
08
27
35
69
66
03
72
0.2
99
0.0
01
0.9
85
0.3
72
0.4
82
–0
.01
20
.23
0
SN
P6
rs2
89
71
75
69
75
47
62
0.3
47
–0
.01
10
.49
7(P
=0
.54
2)
(P=
0.7
86
)–
0.0
12
0.2
06
SN
P4
rs1
27
20
92
25
69
66
97
33
0.1
73
–0
.06
30
.00
11
0.5
12
.6–
0.0
80
4.3
3×
10−
11
SN
P5
rs1
10
76
17
65
69
73
53
43
0.1
93
–0
.00
80
.76
7(P
=0
.00
1)
(P=
5.0
0×
10−
8)
–0
.06
75
.34×
10−
9
SN
P7
rs7
36
27
45
69
75
85
74
0.1
09
0.0
11
0.6
90
0.7
89
0.8
13
0.0
45
0.0
02
SN
P9
rs5
88
25
69
82
18
04
0.3
04
0.0
03
0.8
93
(P=
0.3
74
)(P
=0
.66
6)
0.0
32
0.0
01
SN
P2
rs3
81
61
17
56
96
22
46
50
.46
90
.03
50
.17
31
.86
1.8
60
.05
51
.45×
10−
9
(P=
0.1
72
)(P
=0
.17
2)
Gen
e-Ba
sed
Ana
lysis
Res
ults
Join
tAna
lysis
Mar
gina
lAna
lysis
Wal
daM
LC-B
MLC
-ZM
inP-
JPC
80LC
-BLC
-ZSS
BSS
BwSK
ATSK
AT-O
Min
P-M
Sta
t7
1.6
62
.56
0.9
10
.76
60
.43
2.7
32
.50
.01
91
46
.45
––
45
.46
df1
05
5–
41
1–
––
––
P2
.18×
10−
11
3.6
9×
10−
12
7.9
6×
10−
12
0.0
09
2.3
9×
10−
12
1.0
9×
10−
81
.17×
10−
81
.98×
10−
92
.83×
10−
12
5.4
02×
10−
11
2.1
6×
10−
10
1.4
0×
10−
10
aL
ist
of
test
stat
isti
cs:
Wal
d:
gen
eral
ized
Wal
dte
st(1
0df
);M
LC
-B:
ML
Cte
stu
sing
bet
aco
effici
ents
;M
LC
-Z:
ML
Cte
stu
sing
Zst
atis
tics
;L
C-B
:li
nea
rco
mb
inat
ion
test
usi
ng
bet
aco
effici
ents
;L
C-Z
:li
nea
rco
mb
inat
ion
test
usi
ng
Zst
atis
tics
;M
inP
-J:
min
imum
P-val
ue
test
bas
edon
join
tre
gre
ssio
nan
alysi
s;M
inP
-M:
min
imum
P-val
ue
test
bas
edon
mar
gin
alre
gre
ssio
nan
alysi
s;P
C80:
glo
bal
test
bas
edon
reg
ress
ion
usi
ng
the
min
imum
nu
mb
ero
fp
rin
cip
alco
mp
on
ents
cap
turi
ng
80
%o
fvar
ian
ce(G
aud
erm
anet
al.,
20
07
);S
SB
:su
mo
fsq
uar
edm
arg
inal
bet
aco
effici
ents
(Pan
,2
00
9);
SS
Bw
:S
um
of
squ
ared
mar
gin
albet
aco
effici
ents
wit
hin
ver
sevar
iance
wei
gh
ts(P
an,
20
09
);S
KA
T:
SK
AT
for
com
mo
nvar
ian
tsw
ith
wei
gh
tso
bta
ined
fro
mB
eta(
0.5
,0.5
)d
ensi
tyfu
nct
ion
(Io
nit
a-L
aza
etal
.,2
01
3);
SK
AT
-O:
Lin
ear
com
bin
atio
no
fS
KA
Tan
dburd
ente
stw
ith
opti
miz
ed
mix
ing
pro
po
rtio
n(L
eeet
al.,
20
12
).
114 YOO ET AL.
F I G U R E 1 Clustering of SNPs in DCCT/EDIC CETP gene data by applying CLQ algorithm to linkage disequilibrium (r) pattern. Edges with |r| < 0.5 are
removed. SNPs in the same cluster have the same color. The cluster construction threshold value for CLQ algorithm was set at c = 0.5
types. As described below, trait data were simulated under
null and various alternative models using genotype data
derived from the HapMap Phase III Asian population (JPT
and CHB). We selected 1,000 genes to compare the per-
formance of gene-based tests under various realistic gene
structures.
A list of genes across 22 autosomes was obtained from
the UCSC genome annotation database for NCBI hg18 Build
36.1 (http://hgdownload.soe.ucsc.edu/goldenPath/hg18/data
base/). Among 16,514 genes with at least one SNP present in
the HapMap Asian data, there were 8883 genes consisting of
4 to 30 SNPs after excluding rare and low frequency SNPs
(MAF < 0.05) and pruning SNPs in complete LD. From
these, 1,000 genes were randomly selected for inclusion in
the simulation studies (see supplementary Table S3 for a
complete list).
For each gene, 1,000 replicated datasets, each consisting
of genotypes and trait values for 1,000 individuals, were gen-
erated under each trait model scenario. To maintain the gene
structure observed in the HapMap data, we generated geno-
type data for the 1,000 individuals using the method of ran-
domly pairing haplotypes from the haplotype pool (for each
gene) obtained from phased genotype data. The LD structure
among the SNPs within a gene therefore arises entirely from
the inherent structure in the HapMap haplotypes. Based on
the genotypes for each individual, a quantitative trait Y was
generated under an additive genetic model for a gene with Ccausal SNPs such that
𝑌 =𝐶∑𝑗=1
𝑏𝑗𝐺𝑗 + 𝜀,
where 𝜀 ∼ 𝑁(0, 𝜎2), bj is the effect of jth causal SNP, and Gjis the number of minor alleles at the jth causal SNP, that is,
Gj can be 0, 1, or 2.
We first considered five different quantitative trait mod-
els for each gene, including 0, 1, or 2 causal SNPs per gene
(Table 2). In each of Models 1–5, causal SNPs were randomly
selected from the set of SNPs for each gene, subject to the
cluster structure. According to the analytic evaluations, Mod-
els 1–3, in which the signs of the effects are all positive for the
causal SNPs, would be relatively favorable for LC compared
to the Wald test, whereas Models 4 and 5 with opposite signs
for the two causal SNP effects would be least favorable. Model
4 is expected to be least favorable to MLC and most favorable
to MinP-M when two positively correlated causal SNPs with
opposite signs are in the same cluster, because there would
be no recoding. On the other hand, MLC would be favored
under Models 3 and 5 when causal SNPs are in different clus-
ters, that is, are uncorrelated. In addition, we evaluated Model
6 in which each gene was assigned a random number of one
to min(ns, 10) causal SNPs, where ns is the number of SNPs
per gene, with each SNP equally likely to have a deleterious
or protective allele regardless of the LD cluster structure.
To estimate empirical type I error under the null hypoth-
esis of no gene effect (Model 0), all bj were specified to
be equal to 0, and for each gene all SNPs were included
in the regression analysis. Under alternatives with genetic
association (Models 1–6), the causal SNP effect sizes (|bj|)
were randomly selected from a uniform distribution 𝑈 (0.01 ×SD, 0.05 × SD). Here, SD is the expected standard deviation
of Y using the method for effect size estimation presented in
Willer et al. (2013). The error variance 𝜎2 was adjusted sepa-
rately for each gene and each trait model to obtain 60% Wald
test power in a sample size n = 1,000, assuming the regres-
sion analysis includes causal SNPs. We estimated empirical
power for each gene-trait model combination under regres-
sion analyses that (1) included all SNPs, assuming the causal
SNP(s) were typed and analyzed, and then (2) excluded the
causal SNP(s), assuming they were untyped.
YOO ET AL. 115
T A B L E 2 Trait models for simulation study
Model Description for Causal SNP SelectionNo. ofSNP Effect Sizea Correlationb Error (𝝈)b
AlleleFrequency
0 No SNP association 4∼30 All zero HapMap 5 HapMap
1 One causal SNP within a gene 4∼30 b1 > 0, randomc HapMap Adjusted HapMap
2 Two causal SNPs in the same cluster, both
deleterious
4∼30 b1 > 0, b2 > 0, random HapMap Adjusted HapMap
3 Two causal SNPs in different clusters, both
deleterious
4∼30 b1 > 0, b2 > 0, random HapMap Adjusted HapMap
4 Two causal SNPs in the same cluster, one
deleterious, and one protective
4∼30 b1 > 0, b2 < 0, random HapMap Adjusted HapMap
5 Two causal SNPs in different clusters, one
deleterious, and one protective
4∼30 b1 > 0, b2 < 0, random HapMap Adjusted HapMap
6 Up to ten deleterious or protective causal SNPs,
randomly assigned within a gene
4∼30 bj sign and magnitude,
random
HapMap Adjusted HapMap
aThe trait model is 𝑌 =∑𝐶
𝑗=1 𝑏𝑗𝐺𝑗 + 𝜀, where 𝜀 ∼ 𝑁(0, 𝜎2), C is the number of causal SNPs, bj is the effect of jth causal SNP, and Gj is the number of causal
alleles for the jth causal SNP. The jth SNP with j > C means neutral SNP.bHapMap: Based on the distribution and patterns of HapMap Asian gene panels.
Adjusted: The error variance is adjusted to make the power of Wald test 60% for each gene.c |𝑏𝑗 | ∼ 𝑈 (0.01 × SD, 0.05 × SD).
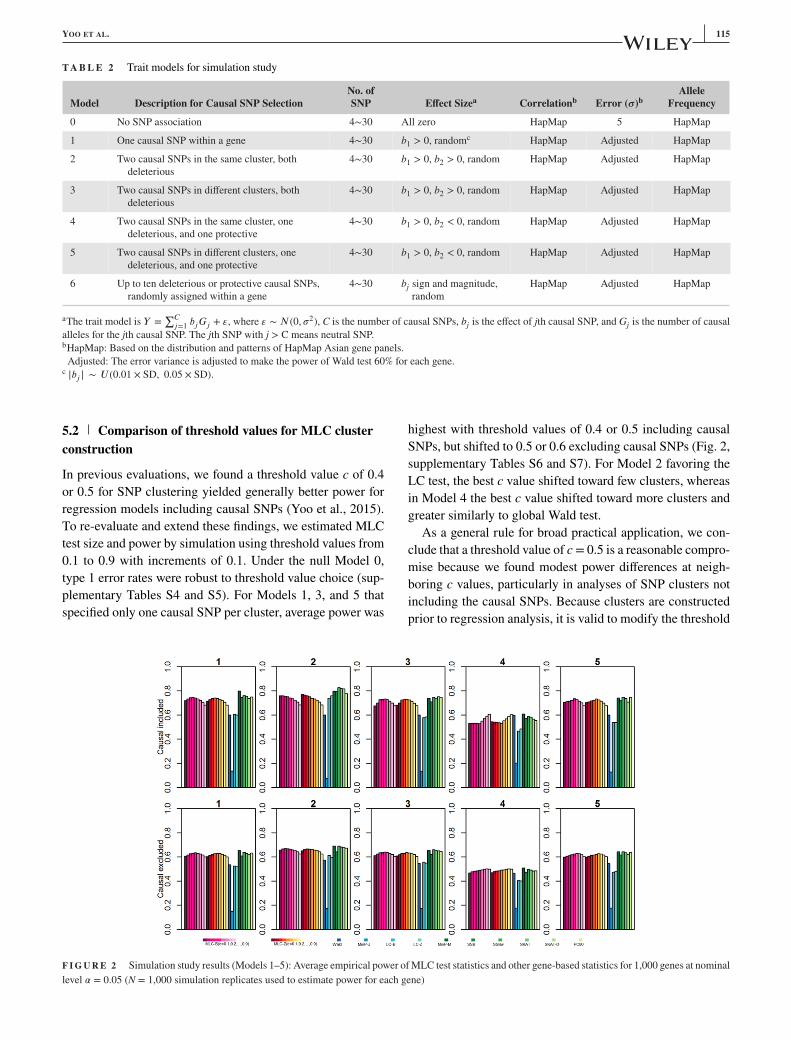
5.2 Comparison of threshold values for MLC clusterconstruction
In previous evaluations, we found a threshold value c of 0.4
or 0.5 for SNP clustering yielded generally better power for
regression models including causal SNPs (Yoo et al., 2015).
To re-evaluate and extend these findings, we estimated MLC
test size and power by simulation using threshold values from
0.1 to 0.9 with increments of 0.1. Under the null Model 0,
type 1 error rates were robust to threshold value choice (sup-
plementary Tables S4 and S5). For Models 1, 3, and 5 that
specified only one causal SNP per cluster, average power was
highest with threshold values of 0.4 or 0.5 including causal
SNPs, but shifted to 0.5 or 0.6 excluding causal SNPs (Fig. 2,
supplementary Tables S6 and S7). For Model 2 favoring the
LC test, the best c value shifted toward few clusters, whereas
in Model 4 the best c value shifted toward more clusters and
greater similarly to global Wald test.
As a general rule for broad practical application, we con-
clude that a threshold value of c = 0.5 is a reasonable compro-
mise because we found modest power differences at neigh-
boring c values, particularly in analyses of SNP clusters not
including the causal SNPs. Because clusters are constructed
prior to regression analysis, it is valid to modify the threshold
F I G U R E 2 Simulation study results (Models 1–5): Average empirical power of MLC test statistics and other gene-based statistics for 1,000 genes at nominal
level 𝛼 = 0.05 (N = 1,000 simulation replicates used to estimate power for each gene)
116 YOO ET AL.
according to the LD structure of a specific gene, but post-
analysis choice would need to account for multiple testing.
5.3 Type I error evaluation
The validity of MLC tests and other gene-based tests was
assessed for each of 1,000 genes at two nominal significance
levels (𝛼 = 0.05 and 0.01). For the majority of the 1,000 genes,
the estimated type I error rate (test size) of the MLC tests for
a threshold c = {0.1, 0.2,..., 0.9} is within the nominal signif-
icance level range expected in 1,000 replicates (supplemen-
tary Tables S4 and S5); at c = 0.5, we observe 95% of 1,000
genes within 0.037∼0.064 and 0.005∼0.017 for 𝛼 = 0.05 and
0.01, respectively. Under the null hypothesis, MLC test size
SDs vary little across the threshold values suggesting that
clustering and recoding do not affect standard error estimates.
The average of the estimated Type I error rates over 1,000
genes is closest to nominal for the MLC (c = 0.5), LC, SKAT,
and PC80 tests, while the average size of the generalized
Wald, SSB, SSBw, and SKAT-O tests tends to be inflated,
MinP-J is conservative, and the distribution for MinP-M is
skewed toward elevated values with higher variance. In par-
ticular, because MinP-M gene-specific type I error is elevated
for many genes, we assessed average power differences both
unadjusted and adjusted for Type I error differences (see sup-
plementary Fig. S3 for details).
5.4 Power comparison between MLC tests and othergene-based tests
For each of 1,000 genes, the power of each gene-based test
was estimated under nominal critical values for 𝛼 = 0.05
from the asymptotic null distribution for the corresponding
statistic. For Models 1–5, we calculate the average and SD of
empirical power estimates across all 1,000 genes under each
trait model (Fig. 2 and supplementary Tables S6 and S7); to
directly compare test statistics at the gene level, we also plot-
ted gene-specific power differences (supplementary Figs. S4–
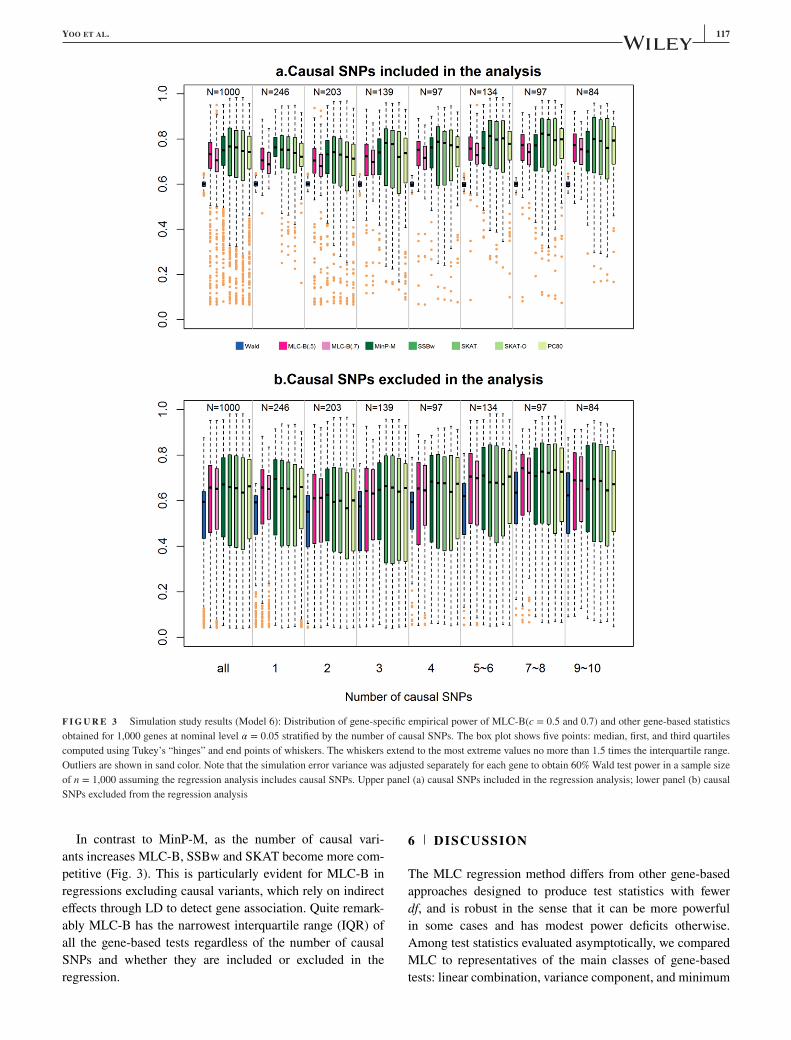
S6). For Model 6, we constructed box plots of gene-specific
power stratified by the number of causal SNPs (Fig. 3).
Average MLC test power (both MLC-B and MLC-Z) is
higher than global Wald test power whether or not the regres-
sion includes causal SNPs, with the exception of Model 4 in
which the causal SNP effects have opposite directions and are
located in the same cluster (Fig. 2). Under Model 4, average
MLC test power is lower than average Wald test power for
most cluster threshold values when causal SNPs are included
in the regression, but is slightly higher than Wald when causal
SNPs are excluded. For the vast majority of genes, MLC has
higher power than the Wald test, except under the unfavor-
able Model 4 (supplementary Fig. S6). This suggests overall
advantages of a reduced df MLC-B statistic compared to the
Wald statistic, while the low power exceptions may be due to
difficulties in effective recoding within a particular gene clus-
ter when positively correlated SNPs have opposing effects.
On average, power of MinP-J tests is quite low, and average
LC power is lower than MLC for most CLQ cluster thresh-
old values except under Model 2 with two deleterious causal
SNPs in the same cluster, both typed. For a proportion of the
genes, MLC exhibits a large power advantage over the LC test
(i.e., when there are opposing effects); it is however worth not-
ing that LC can be modestly more powerful than MLC (up to
0.20) for more than 50% of genes (supplementary Fig. S6).
For Models 1, 2, and 4, average MinP-M power is 0.057–
0.079 higher than average MLC-B(c = 0.5) test power for
regression including causal SNPs, but only 0.019–0.024
higher excluding causal SNPs (supplementary Table S8). For
Models 3 and 5, average power differences are even less:
0.003–0.018 higher for MinP-M compared to MLC-B(0.5).
Because type I error for MinP-M tends to be elevated and
overdispersed across genes, we also calculated adjusted power
differences by regressing the gene-specific power differences
on the corresponding type I error differences in the 1,000
genes for each of the models. Although average differences
are essentially unchanged by adjustment (supplementary
Table S8), it is evident that gene-specific power differences
can be as large as ±0.4 and that MLC-B power is higher than
MinP-M power for a substantial number of genes (supplemen-
tary Fig. S3). Although the MinP-M test performs well overall
under trait models with one or two causal variants, previous
studies and our analytic results suggest that this may not be the
case for trait models with multiple causal variants. In simula-
tion studies under trait models with up to 10 causal variants
(Model 6), we confirmed that MinP-M becomes increasingly
less competitive as the number of causal variants increases
beyond 5 (Fig. 3, supplementary Table S9).
The MLC-B, SSBw, SKAT, and PC80 tests perform well
overall (Fig. 2). For all trait models, SSB has lower aver-
age power than SSBw, and SKAT usually has higher aver-
age power than SKAT-O (except for Models 2 and 3 with
typed causal SNPs that are favorable to a linear statistic).
Average power of the MLC, PC80, SSBw, and SKAT gene-
based tests is remarkably similar for trait models with one or
two causal SNPs (Models 1–5). For Models 2 and 4, aver-
age SSBw power is 0.059–0.115 higher than average MLC-B
(c = 0.5) power for regressions including causal SNPs, but
only 0.011–0.021 higher for Models 1, 3, and 5 (supplemen-
tary Table S8). For regressions excluding causal SNPs, aver-
age power differences are even less: 0.004–0.021 higher for
SSBw compared to MLC-B(0.5) (supplementary Table S8).
Moreover, the SD of MLC-B gene-specific empirical power
among the 1,000 genes is generally smaller than those of the
existing methods (supplementary Tables S7 and S8). Gene-
level comparisons between MLC-B and the other tests also
indicate that MLC-B can be more powerful than SSBw, PC80,
SKAT, or SKAT-O tests, depending on the trait models, the
gene structures, and whether the causal variant is typed (sup-
plementary Figs. S4 and S5).
YOO ET AL. 117
F I G U R E 3 Simulation study results (Model 6): Distribution of gene-specific empirical power of MLC-B(c = 0.5 and 0.7) and other gene-based statistics
obtained for 1,000 genes at nominal level 𝛼 = 0.05 stratified by the number of causal SNPs. The box plot shows five points: median, first, and third quartiles
computed using Tukey’s “hinges” and end points of whiskers. The whiskers extend to the most extreme values no more than 1.5 times the interquartile range.
Outliers are shown in sand color. Note that the simulation error variance was adjusted separately for each gene to obtain 60% Wald test power in a sample size
of n = 1,000 assuming the regression analysis includes causal SNPs. Upper panel (a) causal SNPs included in the regression analysis; lower panel (b) causal
SNPs excluded from the regression analysis
In contrast to MinP-M, as the number of causal vari-
ants increases MLC-B, SSBw and SKAT become more com-
petitive (Fig. 3). This is particularly evident for MLC-B in
regressions excluding causal variants, which rely on indirect
effects through LD to detect gene association. Quite remark-
ably MLC-B has the narrowest interquartile range (IQR) of
all the gene-based tests regardless of the number of causal
SNPs and whether they are included or excluded in the
regression.
6 DISCUSSION
The MLC regression method differs from other gene-based
approaches designed to produce test statistics with fewer
df, and is robust in the sense that it can be more powerful
in some cases and has modest power deficits otherwise.
Among test statistics evaluated asymptotically, we compared
MLC to representatives of the main classes of gene-based
tests: linear combination, variance component, and minimum
118 YOO ET AL.
P-value statistics. We observed that different methods can be
more powerful than others under certain genetic structures,
but genome-wide, MLC test size and power are less variable
compared to existing methods, and become increasingly com-
petitive with increasing number of causal variants in a gene.
This suggests the potential value of combining MLC with
complementary methods for genome-wide discovery analy-
sis when the genetic architecture is unknown. MLC uniquely
combines within- and between-cluster signals in a global
test statistic adapted to the gene LD structure, but is free of
selection bias arising from trait-based optimization. Because
MLC derives from multiple regression, the coefficients are
adjusted for all variants in the model, aiding in identifica-
tion of independent associations within the gene. Moreover,
cluster-specific statistics can be extracted to assist in within-
gene localization.
In practical application of regression-based tests, some
computational issues need to be considered. First, depending
on the LD structure in the dataset, the joint analysis model
using multi-SNP regression may encounter linear dependen-
cies among the SNPs and near singularity in the variance-
covariance matrix. This can arise due to complete pairwise
LD between SNPs or higher order multi-SNP linear depen-
dence; the latter is a particular concern for regressions that
include SNPs imputed from genotyped SNPs. Most statisti-
cal software performing linear regression can deal with such
singularities and automatically remove covariates to obtain a
nonsingular matrix. By removing the SNPs that are redundant
(in complete LD with some other SNP), possible singularity
problems can often be resolved prior to analysis. Depending
on sample size, regression analysis including low frequency
SNPs may be underpowered and unstable. However, if a legit-
imate regression analysis can be performed for low-frequency
SNPs, the MLC tests can always be constructed.
MLC tests constructed from joint regression analysis and
SNP-specific beta coefficients thus account for direct and
indirect association of all the SNPs in the regression. Clusters
of SNPs in high correlation within a gene region represent
haplotypes with relatively low diversity (Chapman & Whit-
taker, 2008; Wason & Dudbridge, 2012). The SNPs located
at the extreme genomic positions of a cluster can be inter-
preted as the rough start and end points of the detected under-
lying haplotype. As illustrated in the detailed analysis of the
DCCT/EDIC study CETP application (Fig. 1), MLC cluster
construction by the CLQ algorithm is based on pairwise r val-
ues from (phased) genotype data, and SNPs within the clus-
ters identified are not necessarily within physically consecu-
tive blocks. Because the clique-based clustering algorithm we
incorporated in MLC testing can construct clusters of noncon-
secutive SNPs, the spans of different haplotypes can overlap
allowing for representation of a mosaic structure of haplotype
intervals.
Cluster-specific statistics can be constructed as shown in
the CETP genotype analysis. To the extent that clusters asso-
ciated with the trait correspond to possible causal haplotypes,
cluster-specific statistics can assist in potential cluster-level
localization. For example, once an associated gene region
is identified by a MLC test, clusters of closely correlated
SNPs may be examined to identify haplotypes that contribute
to the overall gene region signal. In the CETP application,
gene-based statistics including MLC showed an overall strong
signal, with a relatively strong cluster-specific signal in the
SNP4/SNP5 cluster. In the joint regression analysis, SNP4 is
the only SNP with a P-value as small as 0.001 (and large
beta −0.063), consistent with previous reports of associa-
tion between this SNP (rs12720922) and HDL (Asselbergs
et al., 2012; Enquobahrie et al., 2008; Wu et al., 2013).
We can conclude that the cluster including SNP4 represents
a possible causal haplotype and is a candidate for dense
fine-mapping.
By means of evaluations performed under various trait
models for each of 1,000 representative genes using HapMap
Asian data, we determined the performance of the MLC
test in two general situations. In one, the regression analy-
sis excluded causal SNPs so as to imitate the complexity of
conventional GWAS analysis consisting mainly of common
tagging SNPs. In the second, to imitate the settings of GWAS
imputation or dense genomic data such as exome array data,
the regression analysis included both causal and noncausal
SNPs. Our Asian HapMap gene panels included a large num-
ber of genes selected to represent the overall distribution of
within-gene LD structure across the genome; the number of
SNPs per gene ranged from 4 to 30, and random assignment
of causal variants and genetic associations under the alterna-
tive genetic models produced diverse genetic architectures,
including variation in the number and proportion of causal
variants per gene.
Based on the analytic and simulation results, we conclude
that MLC tests can perform better than Wald, MinP-J, LC, and
SSB tests for genes with a complex LD structure. According
to simulation results, MinP-M, SSBw, and SKAT showed bet-
ter performance on average than MLC-B tests across five sim-
ple genetic models. In scenarios with multiple causal SNPs,
however, MinP-M, SSBw, and SKAT had larger IQR, and for
untyped causal variants, they had lower median power than
MLC tests. The Wald test is robust to the presence of multi-
ple causal variants, but may not exploit LD information effi-
ciently. MinP-M does use LD information to adjust P values
but can be prone to inflated type I error and is more suitable
for situations with a single causal SNP. The SSBw statistic
performs well with increasing numbers of causal SNPs, and
incorporates LD through robust covariance estimation to pro-
vide an effective global gene-based test. Here, however, the
beta coefficients obtained are marginal and do not as eas-
ily lend themselves to localization of causal variants. The
SKAT variance-component method is also based on marginal
beta coefficients, and furthermore does not incorporate SNP
covariances directly into the test statistic. The linear burden
YOO ET AL. 119
test component of SKAT-O also ignores SNP LD, whereas
the LC test can benefit from positive SNP covariances. Our
observation that power for SKAT is often greater than for
SKAT-O is consistent with rare variant study findings that the
burden test is less powerful than the variance component test
when many variants are noncausal (Lee, Abecasis, Boehnke,
& Lin, 2014), which is predominantly the situation in our sim-
ulations. The principal component based method, PC80, also
reduces the df based on the LD structure, and is close in spirit
to the MLC method, yielding similar power for a majority of
genes (supplementary Fig. S2); it showed overall good per-
formance in this and previous studies. However, each princi-
pal component may not always have a ready biological inter-
pretation, and some information may be lost by choosing a
subset of the principal components. In contrast, each cluster
in the MLC statistics maintains meaning as a small cluster of
SNPs with high LD, and the df are effectively reduced using
LD information while explicitly combining information from
correlated SNPs. We therefore conclude that the MLC regres-
sion test has merits for gene-based analysis of genetic associ-
ation data as a robust, interpretable, and reasonably powerful
multi-SNP method.
The MLC methods have potential for application in large
regional testing such as described by Paré, Asma, and Deng
(2015) for analysis of common-frequency whole genome
scans not limited to prespecified SNP sets corresponding
to genes. To proceed with regional analysis within a whole
genome scan, genomic variants must be assigned to analy-
sis units such as genes, haplotype blocks, or other biological
regions (Wu et al., 2010). Kwee et al. (2008) suggest that only
regions of modest size be examined; Petersen et al. (2013)
suggest that only intergenic SNPs that are in high LD with
intragenic SNPs be included in region-based analysis. To limit
the number of SNPs jointly analyzed in a multi-SNP statistic,
a sliding window approach can be useful to examine analytic
units (Kwee et al., 2008; Paré et al., 2015; Petersen et al.,
2013). Application of the MLC approach to dense genome-
wide data similarly requires partitioning of inter- and intra-
genic regions into workable analysis units prior to cluster con-
struction. LD block regions consisting of consecutive SNPs
can be determined using software such as Haploview (Barrett,
Fry, Maller, & Daly, 2005). Although LD blocks could be
used to identify haplotype blocks instead of clique clusters
for the bin assignment for MLC, this precludes specification
of multiple overlapping haplotypes. Furthermore, LD block
sizes vary and large blocks with many SNPs may exacer-
bate problems of opposing effect directions. For MLC SNP
clustering, it is undesirable to include SNPs that do not
correlate well with their physical neighbors. Because MLC
is focused on capturing within-gene structure (and poten-
tially, multiple causal associations), multiple clusters corre-
sponding to different haplotypes are more likely to provide
homogeneous within-cluster effects suitable for combining
statistically.
Multivariant methods designed for rare variants analysis
are well-developed (see Derkach, Lawless, & Sun, 2014, Lee
et al., 2014; Pan, Kim, Zhang, Shen, & Wei, 2014; Wang
& Biernacka, 2015 for recent reviews), and some methods
can be applied to both rare and common variants (Ayers &
Cordell, 2013; Ionita-Laza, Lee, Makarov, Buxbaum, & Lin,
2013; Pan, Kwak, & Wei, 2015; Wang, Morris, Zhu, & Elston,
2013; Yoo et al., 2013). In gene-based analysis, a high pro-
portion of noncausal variants within a regional analytic unit
reduces test effectiveness in rare variant analysis (Derkach
et al., 2014; Lee et al., 2012), as well as in joint analysis of
common SNPs (Petersen et al., 2013). Although test statistics
that use trait association evidence can be more powerful, bias
introduced by such adaptation needs to be taken into account,
which can require adjustment to df or use of intensive compu-
tation (Bacanu, 2012; Derkach et al., 2014; Han & Pan, 2010;
Pan et al., 2015). Furthermore, knowledge about relative test
performance for rare variant analysis may not apply for com-
mon variant analysis, given that LD among common variants
is stronger than among rare variants. Uniformly most power-
ful methods rarely exist for jointly evaluating multiple param-
eters, so no one method can be most powerful. Evaluations
of methods for gene-based analysis of typical GWAS data
consisting mainly of genotyped common variants (with or
without additional imputed SNPs) have largely concluded that
without knowledge of underlying genetic architecture, it may
be wise to apply complementary approaches (Asimit, Yoo,
Waggott, Sun, & Bull, 2009; Bacanu, 2012; Ballard et al.,
2010; Clayton et al., 2004; Gauderman et al., 2007; Han &
Pan, 2010; Kwee et al., 2008; Pan, 2009; Petersen et al., 2013;
Taub, Schwender, Youkin, Louis, & Ruczinski, 2013; Wason
& Dudbridge, 2012; Yang et al., 2012).
We find MLC to be a well-powered and robust choice
among the existing methods across a broad range of complex
genetic architectures. We are not aware of other studies that
compare multiple methods in haplotypes drawn from 1,000
different genes. Compared to other methods, MLC test size
and power are less variable, and mean power is never much
lower, and can be higher, particularly with multiple causal
variants. With accumulating evidence that LD structure influ-
ences the power of gene-based tests, methods such as MLC
specifically designed to utilize LD information are worthy of
consideration as an alternative for analysis of dense genetic
association data with correlated SNPs and complex LD
structure.
ACKNOWLEDGMENTS
The Diabetes Control and Complications Trial (DCCT) and
its follow-up the Epidemiology of Diabetes Interventions
and Complications (EDIC) study were conducted by the
DCCT/EDIC Research Group and supported by National
Institute of Health grants and contracts and by the General
Clinical Research Center Program, NCRR. This manuscript
120 YOO ET AL.
was not prepared under the auspices of the DCCT/EDIC study
and does not represent analyses or conclusions either of the
DCCT/EDIC study group or the National Institutes of Health.
This work was supported by the National Research Founda-
tion of Korea (NRF) grant NRF-2012R1A1A3012428, NRF-
2015R1A1A3A04001269 and NRF-2015R1A2A2A0100
6885, and the Canadian Institutes of Health Research
operating grant MOP-84287.
CONFLICT OF INTERESTS
The authors declare no conflict of interest.
R E F E R E N C E SAl-Kateb, H., Boright, A. P., Mirea, L., Xie, X., Sutradhar, R., Mowjoodi, A.,
…; Diabetes Control and Complications Trial/Epidemiology of Diabetes
Interventions and Complications Research Group. (2008). Multiple superox-
ide dismutase 1/splicing 19 factor serine alanine 15 variants are associated
with the development and progression of diabetic nephropathy. Diabetes, 57,
218–228.
Asimit, J. L., Yoo, Y. J., Waggott, D., Sun, L., & Bull, S. B. (2009). Region-based
analysis in GWA of FHS blood lipid traits. BMC Proceedings Supplement, 7,
S127.
Asselbergs, F. W., Guo, Y., van Iperen, E. P., Sivapalaratnam, S., Tragante, V.,
Lanktree, M. B., … Drenos, F. (2012). Large-scale gene-centric meta-analysis
across 32 studies identifies multiple lipid loci. American Journal of HumanGenetics, 91, 823–838.
Ayers, K. L., & Cordell, H. J. (2013). Identification of grouped rare and common
variants via penalized regression. Genetic Epidemiology, 37, 592–602.
Bacanu, S-A. (2012). On optimal gene-based analysis of genome scans. GeneticEpidemiology, 3, 333–339.
Ballard, D. H., Cho, J., & Zhao, H. (2010). Comparisons of multi-marker associ-
ation methods to detect association between a candidate region and disease.
Genetic Epidemiology, 34, 201–212.
Barrett, J. C., Fry, B., Maller, J., & Daly, M. J. (2005). Haploview: Analysis and
visualization of LD and haplotype maps. Bioinformatics, 21, 263–265.
Bull, S., Yoo, Y., & Sun, L. (2009). Regression multi-marker tests for gene-
based genetic association analysis; (Abstract #1698). Presented at the 59th
annual meeting of the American Society of Human Genetics, October 25,
2009, Honolulu, Hawaii. Retrieved from http://www.ashg.org/2009meeting/
abstracts/fulltext/f10648.htm
Carlson, C. S., Eberle, M. A., Rieder, M. J., Yi, Q., Kruglyak, L., & Nickerson, D.
A. (2004). Selecting a maximally informative set of single-nucleotide poly-
morphisms for association analysis using linkage disequilibrium. AmericanJournal of Human Genetics, 74, 106–120.
Chapman J, & Whittaker J. (2008). Analysis of multiple SNPs in a candidate gene
or region. Genetic Epidemiology, 32, 560–566.
Clayton, D., Chapman, J., & Cooper, J. (2004). Use of unphased multilocus geno-
type data in indirect association studies. Genetic Epidemiology, 27, 415–428.
Derkach, A., Lawless, J. F., & Sun, L. (2014). Pooled association tests for rare
genetic variants: A review and some new results. Statistical Science, 29(2),
302–321.
Diabetes Control and Complications Trial Research Group (DCCT). (1993). The
effect of intensive treatment of diabetes on the development and progression of
long-term complications in insulin-dependent diabetes mellitus. New EnglandJournal of Medicine, 329, 977–986.
Enquobahrie, D. A., Smith, N. L., Bis, J. C., Carty, C. L., Rice, K. M., Lumley, T.,
… Psaty, B. M. (2008). Cholesterol ester transfer protein, interleukin-8, per-
oxisome proliferator activator receptor alpha, and Toll-like receptor 4 genetic
variations and risk of incident nonfatal myocardial infarction and ischemic
stroke. American Journal of Cardiology, 101, 1683–1688.
Epidemiology of Diabetes Interventions and Complications (EDIC). (1999).
Design, implementation, and preliminary results of a long-term follow-up of
the Diabetes Control and Complications Trial cohort. Diabetes Care, 22, 99–
111.
Gauderman, W. J., Murcray, C., Gilliland, F., & Conti, D. V. (2007). Testing asso-
ciation between disease and multiple SNPs in a candidate gene. Genetic Epi-demiology, 31, 383–395.
Goeman, J. J., van de Geer, S. A., & van Houwelingen, H. C. (2005). Testing
against a high-dimensional alternative. Journal of the Royal Statistical Soci-ety: Series B, 68, 477–493.
Han, F., & Pan, W. (2010). A data-adaptive sum test for disease association with
multiple common or rare variants. Human Heredity, 70, 42–54.
Ionita-Laza, I., Lee, S., Makarov, V., Buxbaum, J. D., & Lin, X. (2013). Sequence
kernel association tests for the combined effect of rare and common variants.
American Journal of Human Genetics, 92, 841–853.
Kraft, P., & Cox, D. G. (2008). Study designs for genome-wide association studies.
Advances in Genetics, 60, 465–504.
Kwee, L. C., Liu, D., Lin, X., Ghosh, D., & Epstein, M. P. (2008). A powerful and
flexible multilocus association test for quantitative traits. American Journal ofHuman Genetics, 82, 386–397.
Lee, S., Abecasis, G. R., Boehnke, M., & Lin, X. (2014). Rare-variant associa-
tion analysis: Study designs and statistical tests. American Journal of HumanGenetics, 95, 5–23.
Lee, S., Emond, M. J., Bamshad, M. J., Barnes, K. C., Rieder, M. J., Nickerson, D.
A., … Lin, X. (2012). Optimal unified approach for rare-variant association
testing with application to small-sample case-control whole-exome sequenc-
ing studies. American Journal of Human Genetics, 91, 224–237.
Li, Q. H., & Lagakos, S. W. (2006). On the relationship between directional
and omnibus statistical tests. Scandinavian Journal of Statistics, 33, 239–
246.
Luo, L., Peng, G., Zhu, Y., Dong, H., Amos, C. I., & Xiong, M. (2010). Genome-
wide gene and pathway analysis. European Journal of Human Genetics, 18,
1045–1053.
Madsen, B. E., & Browning, S. R. (2009). A groupwise association test for rare
mutations using a weighted sum statistic. PLoS Genetics, 5, e1000384.
Moskvina, V., Schmidt, K. M., Vedernikov, A., Owen, M. J., Craddock, N., Hol-
mans, P., & O’Donovan, M. C. (2012). Permutation-based approaches do not
adequately allow for linkage disequilibrium in gene-wise multi-locus associ-
ation analysis. European Journal of Human Genetics, 20, 890–896.
Neale, B. M., & Sham, P. C. (2004). The future of association studies: Gene-based
analysis and replication. American Journal of Human Genetics, 75, 353–
362.
O’Brien, P. C. (1984). Procedures for comparing samples with multiple endpoints.
Biometrics, 40, 1079–1087.
Pan, W. (2009). Asymptotic tests of association with multiple SNPs in linkage
disequilibrium. Genetic Epidemiology, 33, 497–507.
Pan, W., Kim, J., Zhang, Y., Shen, X., & Wei, P. (2014). A powerful and adaptive
association test for rare variants. Genetics, 197, 1081–1095.
Pan, W., Kwak, I-Y., & Wei, P. (2015). A powerful pathway-based adaptive test
for genetic association with common or rare variants. American Journal ofHuman Genetics, 97, 86–98.
Paré, G., Asma, S., & Deng, W. Q. (2015). Contribution of large region joint asso-
ciations to complex traits genetics. PLoS Genetics, 11, e1005103.
Petersen, A., Alvarez, C., DeClaire, S., & Tintle, N. L. (2013). Assessing methods
for assigning SNPs to genes in gene-based tests of association using common
variants. PLoS One, 8, e62161.
Pocock, S. J., Geller, N. L., & Tsiatis, A. A. (1987). The analysis of multiple end-
points in clinical trials. Biometrics, 43, 487–498.

YOO ET AL. 121
Risch, N., & Merikangas, K. (1996). The future of genetic studies of complex
human diseases. Science, 273, 1516–1517.
Schaid, D. J., McDonnell, S. K., Hebbring, S. J., Cunningham, J. M., & Thibodeau,
S. N. (2005). Nonparametric tests of association of multiple genes with human
disease. American Journal of Human Genetics, 76, 780–793.
Stram, D. O., Wei, L. J., & Ware, J. H. (1988). Analysis of repeated ordered
categorical outcomes with possibly missing observations and time-dependent
covariates. Journal of the American Statistical Association, 83, 631–637.
Taub, M. A., Schwender, H. R., Youkin, S. G., Louis, T. A., & Ruczinski, I.
(2013). On multi-marker tests for association in case-control studies. Fron-tiers in Genetics, 4, 252.
Teslovich, T. M., Musunuru, K., Smith, A. V., Edmondson, A. C., Stylianou, I. M.,
Koseki, M., and others. (2010). Biological, clinical and population relevance
of 95 loci for blood lipids. Nature, 466, 707–713.
The Wellcome Trust Case-Control Consortium (WTCCC). (2007). Genome-wide
association study of 14,000 cases of seven common diseases and 3,000 shared
controls. Nature, 447, 661–678.
Wang, T., & Elston, R. C. (2007). Improved power by use of a weighted score test
for linkage disequilibrium mapping. American Journal of Human Genetics,
80, 353–360.
Wang, X., & Biernacka, J. M. (2015). Assessing the effects of multiple markers in
genetic association studies. Editorial, Front Genet, 6, 66.
Wang, X., Morris, N. J., Zhu, X., & Elston, R. C. (2013). A variance compo-
nent based multi-marker association test using family and unrelated data. BMCGenetics, 14, 17.
Wason, J. M. S., & Dudbridge, F. (2012). A general framework for two-stage anal-
ysis of genome-wide association studies and its application to case-control
studies. American Journal of Human Genetics, 90, 760–773.
Willer, C. J., Schmidt, E. M., Sengupta, S., Peloso, G. M., Gustafsson, S., Kanoni,
S. (2013). Discovery and refinement of loci associated with lipid levels. NatureGenetics, 45, 1274–1283.
Wu, M., Kraft, P., Epstein, M. P., Taylor, D. N., Chanock, S. J., Hunter, D. J.,
& Lin, X. (2010). Powerful SNP-set analysis for case-control genome-wide
association studies. American Journal of Human Genetics, 86, 929–942.
Wu, M., Lee, S., Cai, T., Li, Y., Boehnke, M., & Lin, X. (2011). Rare-variant
association testing for sequencing data with the sequence kernel association
test. American Journal of Human Genetics, 89, 82–93.
Wu, Y., Waite, L. L., Jackson, A. U., Sheu, W. H., Buyske, S., Absher, D., and
others. (2013). Trans-ethnic fine-mapping of lipid loci identifies population-
specific signals and allelic heterogeneity that increases the trait variance
explained. PLoS Genetics, 9(3), e1003379.
Yang, J., Ferreira, T., Morris, A. P., Medland, S. E., Madden, P. A. F., Heath, A.
C., and others. (2012). Conditional and joint multiple-SNP analysis of GWAS
summary statistics identifies additional variants influencing complex traits.
Nature Genetics, 44, 369–375
Yoo, Y. J., Kim, S. A., & Bull, S. B. (2015). Clique-based clustering of corre-
lated SNPs in a gene can improve performance of gene-based multi-bin linear
combination test. BioMed Research International, 2015. Article ID 852341.
Yoo, Y. J., Sun, L., & Bull, S. B. (2013). Gene-based multiple regression associa-
tion testing for combined examination of common and low frequency variants
in quantitative trait analysis. Front Genet, 4, 233.
Yoo, Y. J., Sun, L., Poirier, J., & Bull, S. B. (2014). Multi-bin multi-variant tests
for gene-based linear regression analysis of genetic association. Technical
Report Series, Department of Statistical Sciences, University of Toronto.
Retrieved from http://www.utstat.toronto.edu/wordpress/wp-content/uploads/
2011/09/Multi-bin-multi-variant-tests-for-gene-based-linear-regression-
analysis-of-genetic-association.pdf
SUPPORTING INFORMATION
Additional Supporting Information may be found online in
the supporting information tab for this article.