multichannel processing for airborne gamma-ray...
TRANSCRIPT

GEOPHYSICS, VOL. 63, NO. 6 (NOVEMBER-DECEMBER 1998); P. 1971–1985, 14 FIGS., 2 TABLES.
Multichannel processing for airborne gamma-ray spectrometry
Brian R. S. Minty∗, Phil McFadden∗, and Brian L. N. Kennett‡
ABSTRACTThe conventional approach to the processing of air-
borne gamma-ray spectrometric data is to first sum theobserved spectra over three relatively broad energy win-dows. These three window count rates are then processedto obtain estimates of the potassium (K), uranium (U),and thorium (Th) elemental abundances. However, mul-tichannel spectra contain additional information on theconcentrations of K, U, and Th in the source, on thedistance between the source and the detector, and onthe relative contribution of atmospheric radon to theobserved spectrum. This information can be extractedusing multichannel processing procedures.
The observed spectrum is considered as the sum ofthree terrestrial and three background component spec-tra, which are determined through suitable airborneand ground calibrations. The background componentscan be calculated independently and removed from the
observed spectra. A parametric model based on a princi-pal component analysis of the terrestrial components asfunctions of simulated detector height is then used to findthe effective heights at which the K, U, and Th terrestrialcomponents best fit the background-corrected airbornedata. The component spectra for these heights are thenfitted to the background-corrected observed spectra toobtain elemental count rates. The multichannel process-ing results in significant reductions in the fractional er-rors associated with the estimated elemental count rates.For three surveys processed using the new methodology,the average deviations of the K, U, and Th elementalcount rates from the estimated mean elemental countrates at each observation point are reduced by 12.4%,26.5%, and 20.3%, respectively, when compared with theconventional three-channel method. This results in a bet-ter structural resolution of small anomalies in enhancedimages of the processed data.
INTRODUCTION
Although most airborne gamma-ray spectrometers canrecord at least 256 channels of data in the energy range 0–3 MeV, little of this data is actually used. The conventionalapproach to the processing of airborne gamma-ray spectro-metric data (the three-channel method) is to first sum the ob-served spectra over three relatively broad energy windows.These three-channel count rates are then processed to obtainestimates of potassium (K), uranium (U), and thorium (Th) ele-mental abundances. The data processing includes a correctionfor the deadtime of the spectrometer; the removal of back-ground radiation; the unmixing of the K, U, and Th contribu-tions to the three windows (stripping); and the correction of thestripped count rates for the height of the detector. An obviouslimitation of the three-channel approach is that the methoddoes not use all of the information in the observed spectra. Inaddition to the concentrations of K, U, and Th in the source,multichannel spectra contain information on (1) the distance
Manuscript received by the Editor May 23, 1997; revised manuscript received April 29, 1998.∗Australian Geological Survey Org., GPO Box 378, Canberra ACT 2601, Australia. E-mail: [email protected].‡Research School of Earth Sciences, Australian National University, Canberra ACT 0200, Australia. E-mail: [email protected]© 1998 Society of Exploration Geophysicists. All rights reserved.
between the source and the detector and (2) the relative con-tribution of atmospheric radon to the observed spectrum.
The typical airborne gamma-ray spectrometric inverse prob-lem is as follows. Gamma-ray spectra are recorded at a nominalheight of 60 to 100 m using a sample integration time of 1 s.The source of the gamma rays is a combination of a 2-D distri-bution of K, U, and Th sources on the ground and backgroundradiation attributable to cosmic radiation, the radioactivity ofthe aircraft, and radon in the air. The problem is to separatethese components and determine the distribution of terrestrialsources given a knowledge of the spectral shapes of each ofthe terrestrial and background components (the componentspectra).
Few documents on multichannel airborne gamma-ray spec-trometry have been published. Dickson et al. (1979) use two en-ergy windows to model the change in spectrum shape with ura-nium overburden thickness. Dickson (1980) and Dickson et al.(1981) use a principal component analysis to study the changein shape of the gamma-ray spectrum as a function of the height
1971
Downloaded 22 Feb 2010 to 150.203.10.78. Redistribution subject to SEG license or copyright; see Terms of Use at http://segdl.org/

1972 Minty et al.
of the detector. In a related study, Bailey (1986) presents an an-alytic model, which is loosely based on the underlying physics,to describe this change in shape with height. Crossley and Reid(1982) describe a matrix method for inverting multichannelairborne gamma-ray spectra. They also present a method forobtaining a measure of the inversion importance of each chan-nel. Both Dickson (1980) and Grasty et al. (1985) investigatethe statistical improvement in the processed data that couldbe achieved using a full multichannel analysis as opposed tothe conventional three-channel method. Grasty et al. (1985)conclude that the multichannel method can reduce statisticalerrors by about 25% compared with the conventional three-channel method. But neither Dickson (1980) nor Grasty et al.(1985) consider a comprehensive strategy for processing multi-channel airborne data. Their analysis of real data is restrictedto a series of lines over a test strip.
This paper describes a model-based approach for process-ing multichannel spectra. We demonstrate that K, U, and Thcomponent spectra acquired in calibration experiments can beused to model airborne spectra. The component spectra aremeasured over concrete calibration sources with the aircrafton the ground. The height of the detector above the groundduring survey operations is simulated in the calibration exper-iments through the use of high-density building board to shieldthe detector and thus simulate the attenuation of the gammarays by air.
The spectra acquired during survey operations are reducedto elemental count rates in two stages. We use a model based ona principal component analysis of the K, U, and Th componentspectra as functions of simulated detector height to estimatethe effective height of the aircraft above K, U, and Th sourceson the ground. These effective heights are combined with theradio-altimeter height to estimate the K, U, and Th componentspectra that best fit the observed spectra. The component spec-tra are then fit to the observed spectra using a three-component(K, U, and Th component spectra), three-parameter (K, U, andTh elemental count rates) model. The elemental count ratesare height corrected and transformed to elemental concentra-tions on the ground in the same way as for the three-channelmethod.
Spectra acquired over a calibration range are used to demon-strate that the model and component spectra provide a good fitto observed data. Experiments with synthetic spectra and sim-ulated noise demonstrate that the choice of model minimizesthe propagation of observational errors into the estimates ofthe K, U, and Th elemental count rates.
COMPONENT SPECTRA
The shape of an observed airborne spectrum is a result of acomplex interaction of several different effects. Source thick-ness, source width, the presence of attenuating material be-tween the source and detector, and the distribution of sourcesin the field of view of the detector all affect the energy distribu-tion of the gamma-ray fluence rate at the detector. Modelingof these effects is constrained by the availability of adequatecomponent spectra.
Gamma-ray transport simulation is a possible means for es-timating component spectra for multichannel processing, butadequate consideration of the detector response is a significantproblem. In airborne gamma-ray spectrometry a large propor-
tion of the observed counts is because of scattered radiation,and the effects of partial outscatter, escape peaks, etc., mustbe considered in developing an adequate detector responsefunction. Grasty (1979) suggests the detector response can besatisfactorily determined only through a combination of exper-iment and Monte Carlo simulations.
An alternative approach is to acquire the required compo-nent spectra through observation. The aircraft, cosmic, andatmospheric radon spectra are empirically determined fromairborne calibration flights. The K, U, and Th terrestrial compo-nents are determined from measurements on the ground overradioactive concrete sources. The detector is shielded from thesources using an attenuating material that simulates the atten-uation of the gamma rays by air. The component spectra arethen fitted to the observed spectra to estimate the relative con-tribution of each of the components to the observed spectra.
Terrestrial components
Dickson et al. (1981) used large airport calibration pads toacquire K, U, and Th component spectra at various simulatedheights. They used plywood sheets to shield a detector andthus simulate the attenuation of the gamma rays by air. Weadopt a similar approach to the simulation of detector heightbut have used much smaller, portable, rectangular slab sources.The sources comprise a set of four 1× 1× 0.3-m slabs, similarto those used by Grasty et al. (1991) for the calibration ofportable gamma-ray spectrometers. Three of the slabs havehigh concentrations of either K, U, or Th, respectively, whilethe fourth slab is doped to have concentrations of the radioelements as near as possible to that of the impurities in theother three slabs and serves as a background slab.
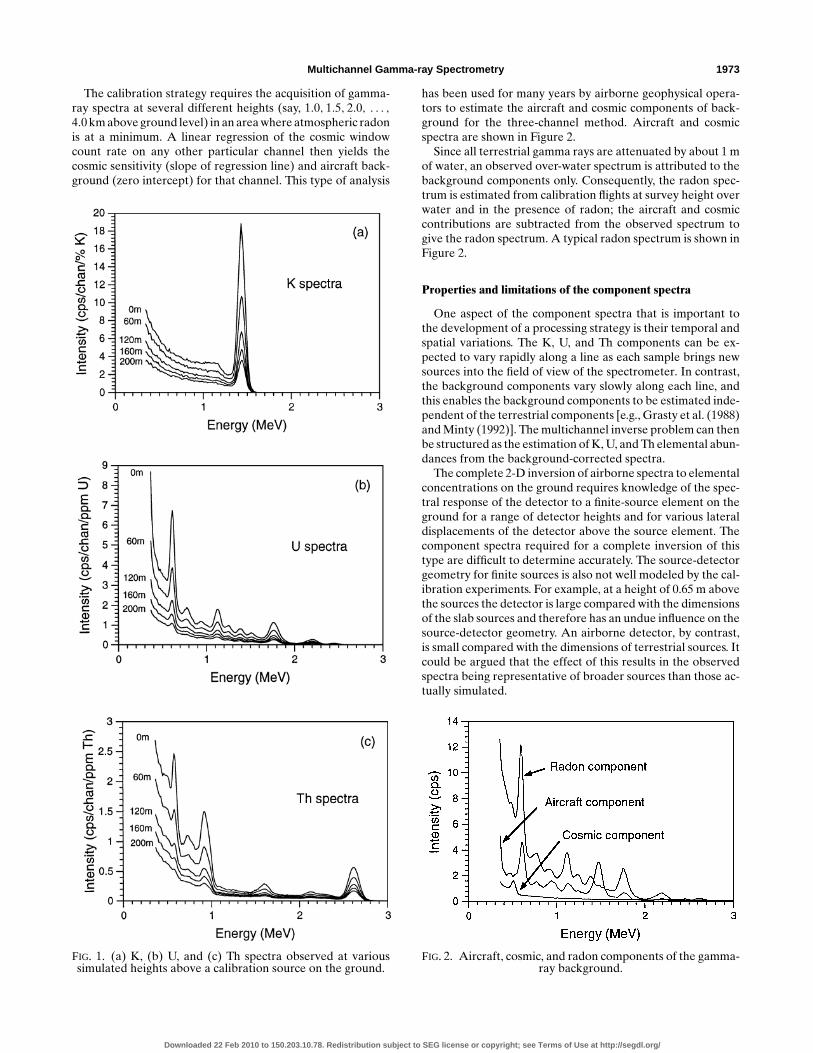
Each slab was placed in turn directly beneath the detector,and either 0, 3, 6, 8, or 10 sheets of 0.015-m high-density build-ing board (density= 1.733× 10³ kg/m3) were used to shield thedetector from the source. The building board has a basic com-position of Portland cement, ground sand, cellulose fiber, andwater. These materials have almost the same number of elec-trons per unit mass as air. Thus, using the argument of Dickson(1980), the shielding corresponds to simulated heights of 0, 60,120, 160, and 200 m of dry air at 0◦C. Each observed spectrumwas corrected for deadtime, energy drift, and background be-fore making a final correction for the impurities in the sources.The final corrected spectra attributed to each of K, U, and That each simulated detector height are shown in Figure 1.
Background components
The procedure for determining aircraft and cosmic back-ground uses the fact that in the lower atmosphere the cosmicspectrum has a near-constant shape, but its amplitude decreaseswith decreasing height (Aviv and Vulcan, 1983). Also, at en-ergies greater than 3.0 MeV, all natural radiation is cosmic inorigin, and airborne spectrometers routinely monitor a cosmicwindow (typically 3.0–6.0 MeV) to facilitate estimation of cos-mic background. The constant shape of the cosmic spectrummeans the cosmic contribution in any channel is proportionalto the cosmic window count rate. If the shape of the cosmicspectrum is known, then the cosmic window count rate canbe used to estimate the cosmic contribution in any particularchannel.
Downloaded 22 Feb 2010 to 150.203.10.78. Redistribution subject to SEG license or copyright; see Terms of Use at http://segdl.org/
Multichannel Gamma-ray Spectrometry 1973
The calibration strategy requires the acquisition of gamma-ray spectra at several different heights (say, 1.0, 1.5, 2.0, . . . ,4.0 km above ground level) in an area where atmospheric radonis at a minimum. A linear regression of the cosmic windowcount rate on any other particular channel then yields thecosmic sensitivity (slope of regression line) and aircraft back-ground (zero intercept) for that channel. This type of analysis
FIG. 1. (a) K, (b) U, and (c) Th spectra observed at varioussimulated heights above a calibration source on the ground.
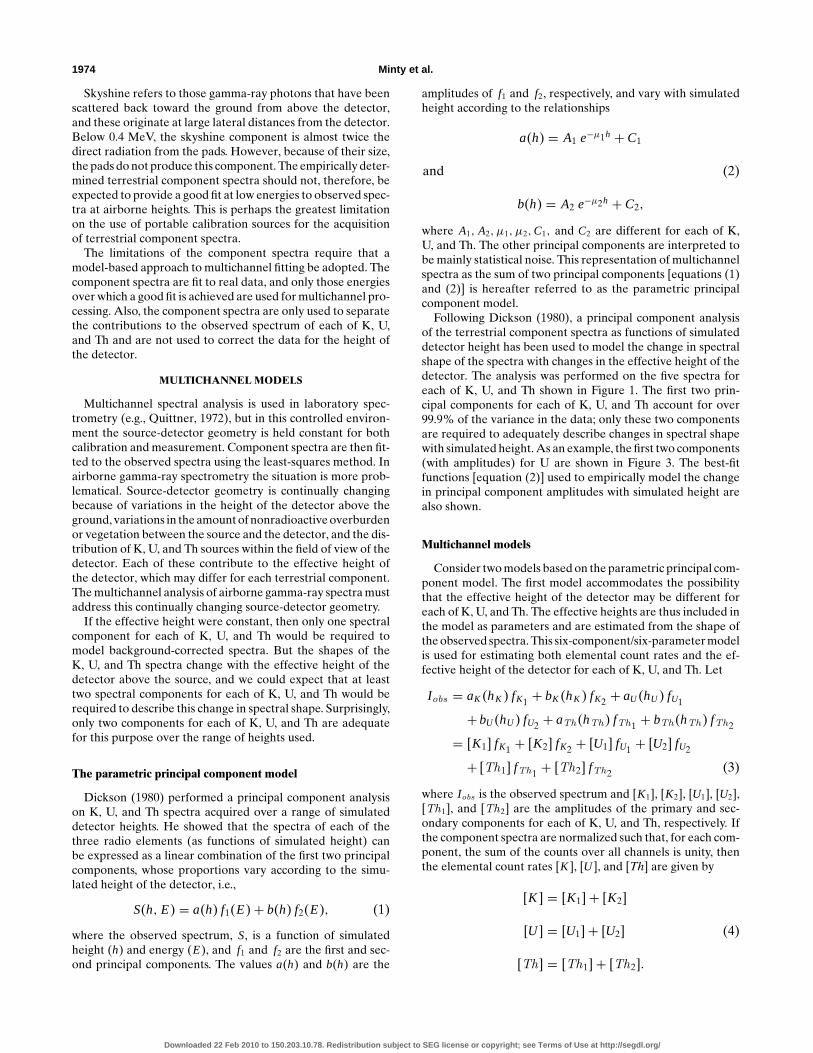
has been used for many years by airborne geophysical opera-tors to estimate the aircraft and cosmic components of back-ground for the three-channel method. Aircraft and cosmicspectra are shown in Figure 2.
Since all terrestrial gamma rays are attenuated by about 1 mof water, an observed over-water spectrum is attributed to thebackground components only. Consequently, the radon spec-trum is estimated from calibration flights at survey height overwater and in the presence of radon; the aircraft and cosmiccontributions are subtracted from the observed spectrum togive the radon spectrum. A typical radon spectrum is shown inFigure 2.
Properties and limitations of the component spectra
One aspect of the component spectra that is important tothe development of a processing strategy is their temporal andspatial variations. The K, U, and Th components can be ex-pected to vary rapidly along a line as each sample brings newsources into the field of view of the spectrometer. In contrast,the background components vary slowly along each line, andthis enables the background components to be estimated inde-pendent of the terrestrial components [e.g., Grasty et al. (1988)and Minty (1992)]. The multichannel inverse problem can thenbe structured as the estimation of K, U, and Th elemental abun-dances from the background-corrected spectra.
The complete 2-D inversion of airborne spectra to elementalconcentrations on the ground requires knowledge of the spec-tral response of the detector to a finite-source element on theground for a range of detector heights and for various lateraldisplacements of the detector above the source element. Thecomponent spectra required for a complete inversion of thistype are difficult to determine accurately. The source-detectorgeometry for finite sources is also not well modeled by the cal-ibration experiments. For example, at a height of 0.65 m abovethe sources the detector is large compared with the dimensionsof the slab sources and therefore has an undue influence on thesource-detector geometry. An airborne detector, by contrast,is small compared with the dimensions of terrestrial sources. Itcould be argued that the effect of this results in the observedspectra being representative of broader sources than those ac-tually simulated.
FIG. 2. Aircraft, cosmic, and radon components of the gamma-ray background.
Downloaded 22 Feb 2010 to 150.203.10.78. Redistribution subject to SEG license or copyright; see Terms of Use at http://segdl.org/
1974 Minty et al.
Skyshine refers to those gamma-ray photons that have beenscattered back toward the ground from above the detector,and these originate at large lateral distances from the detector.Below 0.4 MeV, the skyshine component is almost twice thedirect radiation from the pads. However, because of their size,the pads do not produce this component. The empirically deter-mined terrestrial component spectra should not, therefore, beexpected to provide a good fit at low energies to observed spec-tra at airborne heights. This is perhaps the greatest limitationon the use of portable calibration sources for the acquisitionof terrestrial component spectra.
The limitations of the component spectra require that amodel-based approach to multichannel fitting be adopted. Thecomponent spectra are fit to real data, and only those energiesover which a good fit is achieved are used for multichannel pro-cessing. Also, the component spectra are only used to separatethe contributions to the observed spectrum of each of K, U,and Th and are not used to correct the data for the height ofthe detector.
MULTICHANNEL MODELS
Multichannel spectral analysis is used in laboratory spec-trometry (e.g., Quittner, 1972), but in this controlled environ-ment the source-detector geometry is held constant for bothcalibration and measurement. Component spectra are then fit-ted to the observed spectra using the least-squares method. Inairborne gamma-ray spectrometry the situation is more prob-lematical. Source-detector geometry is continually changingbecause of variations in the height of the detector above theground, variations in the amount of nonradioactive overburdenor vegetation between the source and the detector, and the dis-tribution of K, U, and Th sources within the field of view of thedetector. Each of these contribute to the effective height ofthe detector, which may differ for each terrestrial component.The multichannel analysis of airborne gamma-ray spectra mustaddress this continually changing source-detector geometry.
If the effective height were constant, then only one spectralcomponent for each of K, U, and Th would be required tomodel background-corrected spectra. But the shapes of theK, U, and Th spectra change with the effective height of thedetector above the source, and we could expect that at leasttwo spectral components for each of K, U, and Th would berequired to describe this change in spectral shape. Surprisingly,only two components for each of K, U, and Th are adequatefor this purpose over the range of heights used.
The parametric principal component model
Dickson (1980) performed a principal component analysison K, U, and Th spectra acquired over a range of simulateddetector heights. He showed that the spectra of each of thethree radio elements (as functions of simulated height) canbe expressed as a linear combination of the first two principalcomponents, whose proportions vary according to the simu-lated height of the detector, i.e.,
S(h, E) = a(h) f1(E)+ b(h) f2(E), (1)
where the observed spectrum, S, is a function of simulatedheight (h) and energy (E), and f1 and f2 are the first and sec-ond principal components. The values a(h) and b(h) are the
amplitudes of f1 and f2, respectively, and vary with simulatedheight according to the relationships
a(h) = A1 e−µ1h + C1
and (2)
b(h) = A2 e−µ2h + C2,
where A1, A2, µ1, µ2,C1, and C2 are different for each of K,U, and Th. The other principal components are interpreted tobe mainly statistical noise. This representation of multichannelspectra as the sum of two principal components [equations (1)and (2)] is hereafter referred to as the parametric principalcomponent model.
Following Dickson (1980), a principal component analysisof the terrestrial component spectra as functions of simulateddetector height has been used to model the change in spectralshape of the spectra with changes in the effective height of thedetector. The analysis was performed on the five spectra foreach of K, U, and Th shown in Figure 1. The first two prin-cipal components for each of K, U, and Th account for over99.9% of the variance in the data; only these two componentsare required to adequately describe changes in spectral shapewith simulated height. As an example, the first two components(with amplitudes) for U are shown in Figure 3. The best-fitfunctions [equation (2)] used to empirically model the changein principal component amplitudes with simulated height arealso shown.
Multichannel models
Consider two models based on the parametric principal com-ponent model. The first model accommodates the possibilitythat the effective height of the detector may be different foreach of K, U, and Th. The effective heights are thus included inthe model as parameters and are estimated from the shape ofthe observed spectra. This six-component/six-parameter modelis used for estimating both elemental count rates and the ef-fective height of the detector for each of K, U, and Th. Let
Iobs = aK (hK ) fK1 + bK (hK ) fK2 + aU (hU ) fU1
+bU (hU ) fU2 + aTh(hTh) fTh1 + bTh(hTh) fTh2
= [K1] fK1 + [K2] fK2 + [U1] fU1 + [U2] fU2
+ [Th1] fTh1 + [Th2] fTh2 (3)
where Iobs is the observed spectrum and [K1], [K2], [U1], [U2],[Th1], and [Th2] are the amplitudes of the primary and sec-ondary components for each of K, U, and Th, respectively. Ifthe component spectra are normalized such that, for each com-ponent, the sum of the counts over all channels is unity, thenthe elemental count rates [K ], [U ], and [Th] are given by
[K ] = [K1]+ [K2]
[U ] = [U1]+ [U2] (4)
[Th] = [Th1]+ [Th2].
Downloaded 22 Feb 2010 to 150.203.10.78. Redistribution subject to SEG license or copyright; see Terms of Use at http://segdl.org/

Multichannel Gamma-ray Spectrometry 1975
The model is linear with respect to [K1], [K2], [U1], [U2], [Th1],and [Th2], and these can be solved directly using the weightedleast-squares method. The effective heights are obtained iter-atively from the ratios [K2]/[K1], [U2]/[U1], and [Th2]/[Th1]because there is a one-to-one correspondence between the ef-fective heights and the ratios of the secondary to primary com-ponent contributions to the observed spectrum for each of K,U, and Th. The ratio
bK (hK )aK (hK )
= [K2][K1]
, (5)
for example, is a monotonic function of hK and can be used todetermine the effective height of the detector for K. The valueshU and hTh are determined in similar fashion.
The second model is a three-component/three-parametermodel where the parametric principal component model isused merely as a convenient means of storing and interpo-lating the component spectra. We assume that the K, U, andTh effective heights of the detector at each observation pointare known. The measured radio-altimeter height, for exam-ple, could be used as an estimate of these effective heights.The effective heights are then used to generate the component
FIG. 3. Principal component analysis of U spectra at various simulated detector heights. Views (a) and (b) show the first two principalcomponents (PC), respectively; (c) and (d) show the corresponding amplitudes for each component (triangles) and the exponentialmodel used to empirically model these amplitudes (solid line).
spectra ( fK , fU , and fTh) to be used to perform the inversionat each observation point. Thus,
Iobs = [K ] fK + [U ] fU + [Th] fTh . (6)
In matrix notation, equation (6) can be written as
d = Gm, (7)
where d is a vector of observed channel count rates (the ob-served spectrum), m are the elemental count rates, and G is thematrix of unit component spectra. Thus the columns of G arefK , fU , and fTh . Equation (7) has the weighted least-squaressolution
m = (Gt V−1G)−1Gt V−1d, (8)
where V is the covariance matrix associated with the elementsof d. Crouthamel (1970) refers to this as spectrum unfolding.It is generally assumed that the component spectra (i.e., thematrix G) are known with no uncertainty. The variance in theestimates of the elemental count rates is then given by
var m = (Gt V−1G)−1, (9)
Downloaded 22 Feb 2010 to 150.203.10.78. Redistribution subject to SEG license or copyright; see Terms of Use at http://segdl.org/
1976 Minty et al.
where
νi j = σ 2i = ni (i = j ),
(10)
νi j = 0 (i 6= j ),
and ni is the estimated mean count rate for each channel priorto background removal. This is based on the assumption thatthe covariance between the errors in each channel is zero, i.e.,channel count rate errors are independent. The data are thusweighted inversely by their variances.
Error propagation
There are two aspects to the appropriateness of the appli-cation of a particular model. The first relates to how well themodel fits real data, and this will be dealt with later. The secondrelates to how random errors in the observed data are propa-gated by the model into the estimates of the model parametersin terms of both the precision and the accuracy of the estimates.
The precision of the model parameter estimates associatedwith the six-component/six-parameter model has been inves-tigated for channels 45–256 (0.515–3.0 MeV) in the followingway. The parametric principal component model has been usedto generate a synthetic 1-s spectrum for a 32-liter detector at100 m height from a source with typical crustal concentrationsof the radio elements (2000 ppm K, 2.5 ppm U, and 9 ppm Th).A background spectrum comprising aircraft and cosmic com-ponents and a radon contribution based on average concentra-tions of atmospheric radon typically encountered in airbornesurveying (25 cps in the conventional U window) was also syn-thesized. A pseudorandom number generator was then used togenerate a count rate for each channel that is a random variatedrawn from a Poisson distribution with mean equal to the sumof the terrestrial and background components in that channel.The background was subtracted, and the model parameters foreach model were estimated from this synthetic spectrum andsaved. This process was repeated several thousand times to al-low the solutions for each model parameter to be analyzed formean and variance.
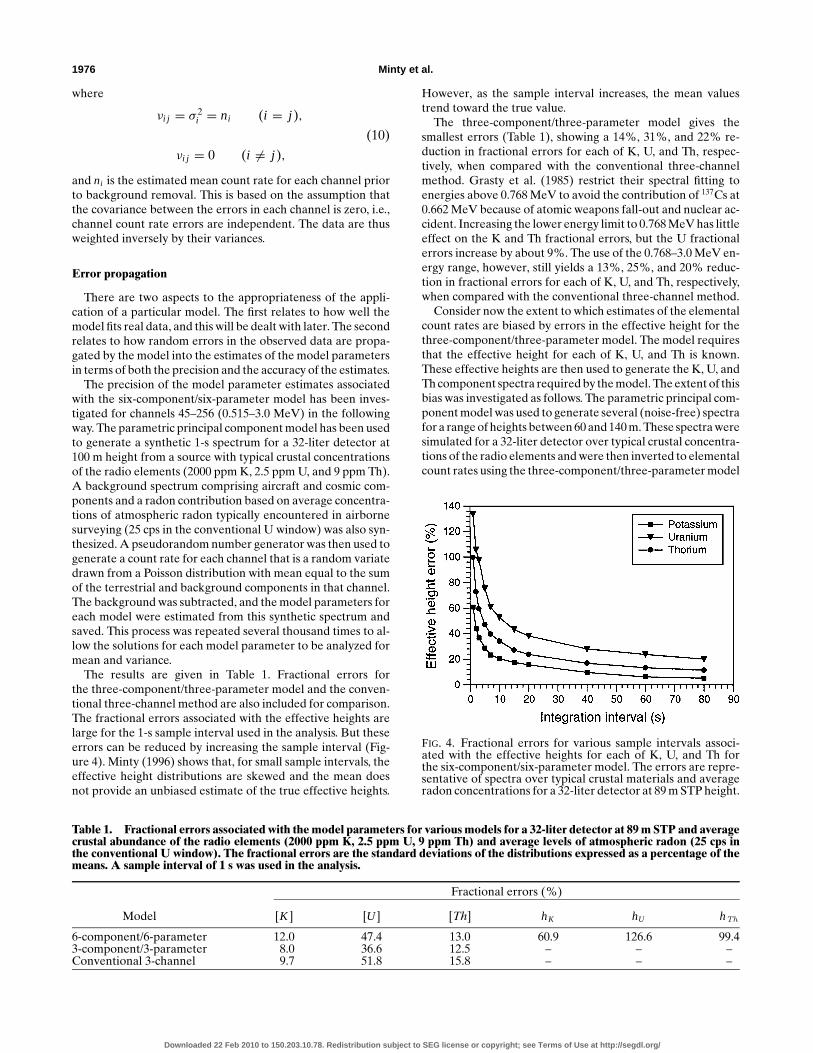
The results are given in Table 1. Fractional errors forthe three-component/three-parameter model and the conven-tional three-channel method are also included for comparison.The fractional errors associated with the effective heights arelarge for the 1-s sample interval used in the analysis. But theseerrors can be reduced by increasing the sample interval (Fig-ure 4). Minty (1996) shows that, for small sample intervals, theeffective height distributions are skewed and the mean doesnot provide an unbiased estimate of the true effective heights.
Table 1. Fractional errors associated with the model parameters for various models for a 32-liter detector at 89 m STP and averagecrustal abundance of the radio elements (2000 ppm K, 2.5 ppm U, 9 ppm Th) and average levels of atmospheric radon (25 cps inthe conventional U window). The fractional errors are the standard deviations of the distributions expressed as a percentage of themeans. A sample interval of 1 s was used in the analysis.
Fractional errors (%)
Model [K ] [U ] [Th] hK hU hTh
6-component/6-parameter 12.0 47.4 13.0 60.9 126.6 99.43-component/3-parameter 8.0 36.6 12.5 – – –Conventional 3-channel 9.7 51.8 15.8 – – –
However, as the sample interval increases, the mean valuestrend toward the true value.
The three-component/three-parameter model gives thesmallest errors (Table 1), showing a 14%, 31%, and 22% re-duction in fractional errors for each of K, U, and Th, respec-tively, when compared with the conventional three-channelmethod. Grasty et al. (1985) restrict their spectral fitting toenergies above 0.768 MeV to avoid the contribution of 137Cs at0.662 MeV because of atomic weapons fall-out and nuclear ac-cident. Increasing the lower energy limit to 0.768 MeV has littleeffect on the K and Th fractional errors, but the U fractionalerrors increase by about 9%. The use of the 0.768–3.0 MeV en-ergy range, however, still yields a 13%, 25%, and 20% reduc-tion in fractional errors for each of K, U, and Th, respectively,when compared with the conventional three-channel method.
Consider now the extent to which estimates of the elementalcount rates are biased by errors in the effective height for thethree-component/three-parameter model. The model requiresthat the effective height for each of K, U, and Th is known.These effective heights are then used to generate the K, U, andTh component spectra required by the model. The extent of thisbias was investigated as follows. The parametric principal com-ponent model was used to generate several (noise-free) spectrafor a range of heights between 60 and 140 m. These spectra weresimulated for a 32-liter detector over typical crustal concentra-tions of the radio elements and were then inverted to elementalcount rates using the three-component/three-parameter model
FIG. 4. Fractional errors for various sample intervals associ-ated with the effective heights for each of K, U, and Th forthe six-component/six-parameter model. The errors are repre-sentative of spectra over typical crustal materials and averageradon concentrations for a 32-liter detector at 89 m STP height.
Downloaded 22 Feb 2010 to 150.203.10.78. Redistribution subject to SEG license or copyright; see Terms of Use at http://segdl.org/

Multichannel Gamma-ray Spectrometry 1977
with component spectra calculated for an effective height of100 m. Deviations in the estimated elemental count rates fromthe true elemental count rates at each height are attributed tothe bias in the estimates, resulting from the use of an incorrecteffective height, and are shown in Figure 5. The bias in the es-timates is given as the percentage deviation of the estimatedelemental count rates from the true elemental count rates foreach height. Thus, a+40% systematic error in the K, U, and Theffective heights at 100 m results in a 6.3%, 13.5%, and 3.9%bias in the estimates of the elemental count rates from K, U,and Th, respectively.
MULTICHANNEL PROCESSING
The proposed strategy for processing multichannel data fol-lows a sequence similar to that used for processing three-channel data. Wherever possible, calibration constants are de-termined empirically under survey conditions. The observedspectra are deadtime corrected, energy calibrated, and back-ground corrected. The spectra are then converted to elemen-tal count rates at airborne height using a two-pass approachthat uses both the six-component/six-parameter and three-component/three-parameter models.
The six-component/six-parameter model is applied using alarge sample interval to obtain average effective heights foreach line. These average effective heights are then combinedwith the radio-altimeter heights to give K, U, and Th effec-tive heights at each point along the line. The rationale forthis procedure, and the way in which the effective heightsand radio-altimeter heights are combined, will be explainedlater. The effective heights are used to generate the threecomponent spectra for each sample required by the three-component/three-parameter model for reduction of the ob-served spectra to elemental count rates. The elemental countrates are then height corrected and transformed to elementalconcentrations on the ground in exactly the same way as forthe three-channel method. The height correction uses a sim-
FIG. 5. Bias in the estimates of K, U, and Th elemental countrates for deviations in the effective height of the observed spec-tra from the nominal 100 m height used for the calculation ofcomponent spectra for the three-component/three-parametermodel. The bias is quoted as the percentage deviation of theestimated elemental count rates from the true elemental countrates. The simulated spectra are representative of spectra overtypical crustal materials for a 32-liter detector.
ple exponential model of the fall-off of radiation with detec-tor height to correct the elemental count rates to the nominalsurvey height, and the attenuation coefficients for this modelare determined empirically from airborne calibration flightsover a range of detector heights. The elemental count rates arethen transformed to elemental concentrations on the groundby scaling the count rates by empirically determined sensitivitycoefficients.
While the use of principal components to model changes inspectral shape with source-detector geometry offers a simpleempirical solution to the modeling of several complex pro-cesses, the method is purely empirical and is only valid withinthe range of the measurements. Also, in view of the limitationsof the component spectra, we must still establish that the six-component/six-parameter and hence three-component/three-parameter models actually fits real data. This is demonstratedin the following section using data acquired over a calibrationrange.
Airborne calibrations
Access to a suitable calibration range is an essential require-ment for the new multichannel processing strategy. Flights overthe calibration range at several heights are required: to deter-mine empirically the attenuation coefficients for an exponen-tial model of the fall-off of elemental count rates with detec-tor height, to estimate sensitivity coefficients for the nominalsurvey height, to establish the relationship between simulatedheights and actual heights, and to demonstrate a good fit of themultichannel models and component spectra to real data.
The calibration range is described by Minty (1996) and sat-isfies most of the criteria expected of an airborne calibrationrange. The range is situated approximately 15 km northwest ofAlbury, New South Wales, Australia. Flights over Lake Hume(about 27 km distant) are used to obtain estimates of totalbackground.
The airborne survey comprised seven 16-km-long back-ground lines over the main basin on Lake Hume at heights of60, 90, 120, 150, 180, 210, and 240 m above ground level, respec-tively. These were followed by seven passes over the 16-kmcalibration range at the same heights. Initial data processinginvolved truncation of the airborne data so that each line tra-versed the same stretch of ground. The airborne spectra werethen deadtime corrected, energy calibrated, and converted toelemental count rates using the six-component/six-parametermodel.
The elemental count rates include both scattered and un-scattered photons; in the case of the U and Th decay series,these rates are attributed to gamma-ray emissions at severaldifferent energies. We assume that the elemental count ratescan be modeled as functions of detector height using an expo-nential model of the fall-off of radiation and an effective heightattenuation coefficient for each of K, U, and Th. The effectiveheight attenuation coefficients are estimated from an exponen-tial regression of the elemental count rates against height. Anexample is shown in Figure 6. This shows a good fit between theelemental count rates and the exponential model for the fall-offof radiation intensity with detector height. The height attenu-ation coefficients were found to be similar to those estimatedfor the conventional three-channel method. This means theamplification of errors by the multichannel height correction
Downloaded 22 Feb 2010 to 150.203.10.78. Redistribution subject to SEG license or copyright; see Terms of Use at http://segdl.org/
1978 Minty et al.
procedure is similar to the three-channel method. Sensitivitycoefficients for the multichannel method were estimated usingthe results of a ground survey along an 8-km stretch of thecalibration range that was conducted using a portable spec-trometer at the same time as the airborne survey was flown.
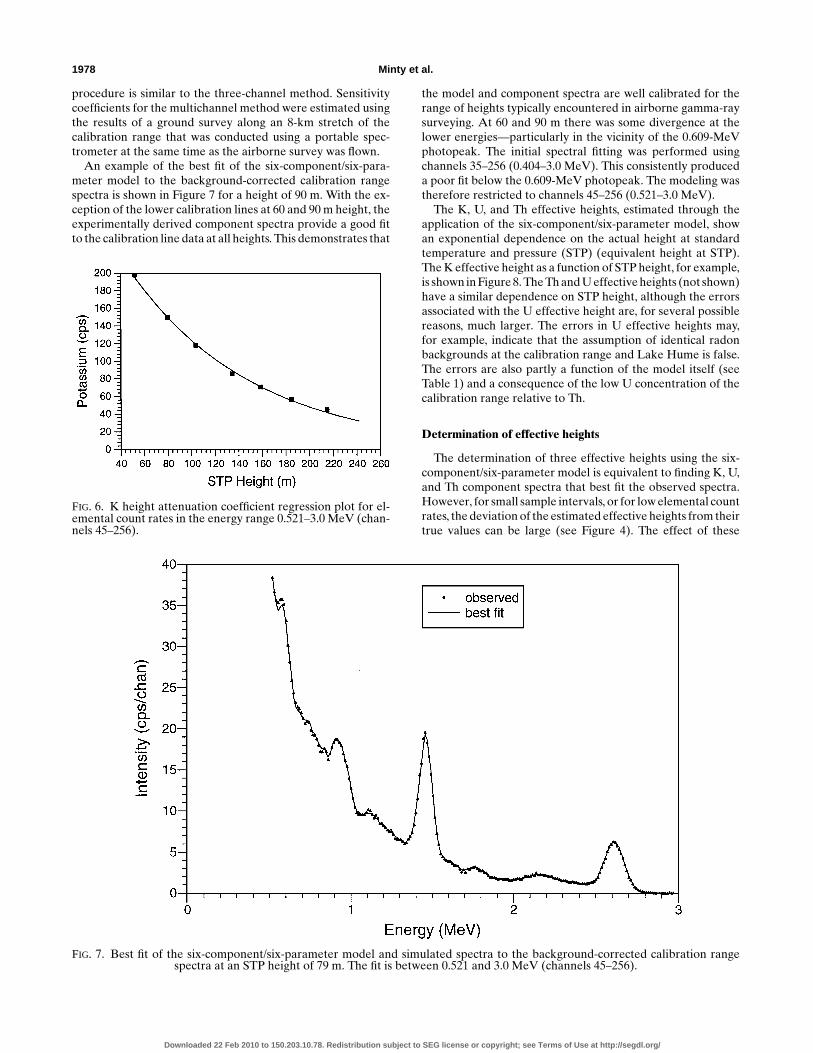
An example of the best fit of the six-component/six-para-meter model to the background-corrected calibration rangespectra is shown in Figure 7 for a height of 90 m. With the ex-ception of the lower calibration lines at 60 and 90 m height, theexperimentally derived component spectra provide a good fitto the calibration line data at all heights. This demonstrates that
FIG. 6. K height attenuation coefficient regression plot for el-emental count rates in the energy range 0.521–3.0 MeV (chan-nels 45–256).
FIG. 7. Best fit of the six-component/six-parameter model and simulated spectra to the background-corrected calibration rangespectra at an STP height of 79 m. The fit is between 0.521 and 3.0 MeV (channels 45–256).
the model and component spectra are well calibrated for therange of heights typically encountered in airborne gamma-raysurveying. At 60 and 90 m there was some divergence at thelower energies—particularly in the vicinity of the 0.609-MeVphotopeak. The initial spectral fitting was performed usingchannels 35–256 (0.404–3.0 MeV). This consistently produceda poor fit below the 0.609-MeV photopeak. The modeling wastherefore restricted to channels 45–256 (0.521–3.0 MeV).
The K, U, and Th effective heights, estimated through theapplication of the six-component/six-parameter model, showan exponential dependence on the actual height at standardtemperature and pressure (STP) (equivalent height at STP).The K effective height as a function of STP height, for example,is shown in Figure 8. The Th and U effective heights (not shown)have a similar dependence on STP height, although the errorsassociated with the U effective height are, for several possiblereasons, much larger. The errors in U effective heights may,for example, indicate that the assumption of identical radonbackgrounds at the calibration range and Lake Hume is false.The errors are also partly a function of the model itself (seeTable 1) and a consequence of the low U concentration of thecalibration range relative to Th.
Determination of effective heights
The determination of three effective heights using the six-component/six-parameter model is equivalent to finding K, U,and Th component spectra that best fit the observed spectra.However, for small sample intervals, or for low elemental countrates, the deviation of the estimated effective heights from theirtrue values can be large (see Figure 4). The effect of these
Downloaded 22 Feb 2010 to 150.203.10.78. Redistribution subject to SEG license or copyright; see Terms of Use at http://segdl.org/

Multichannel Gamma-ray Spectrometry 1979
deviations is to introduce a bias into the estimates of theelemental count rates determined using the three-component/three-parameter model. Examples of this bias are given in Fig-ure 5. The use of a particular sample interval thus representsan obvious trade-off between the errors in the effective heights(and consequent bias in the elemental count rates) and the res-olution of the effective heights along a flight line.
Unfortunately, there is no apparent way of knowing the truevariations in effective heights across a survey area. A sampleinterval of about 2.6 km (40-s sample integration time) hastherefore been selected (largely arbitrarily) to evaluate the six-component/six-parameter model using real data. For a 32-literdetector at 89 m STP and average crustal concentrations of theradio elements, fractional errors of 10%, 28%, and 17% forthe K, U, and Th effective heights, respectively, can be expected(see Figure 4). These errors could introduce a bias of up to 10%into the estimates of the elemental count rates (Figure 5) if theywere used to calibrate the three-component/three-parametermodel for reduction to elemental count rates.
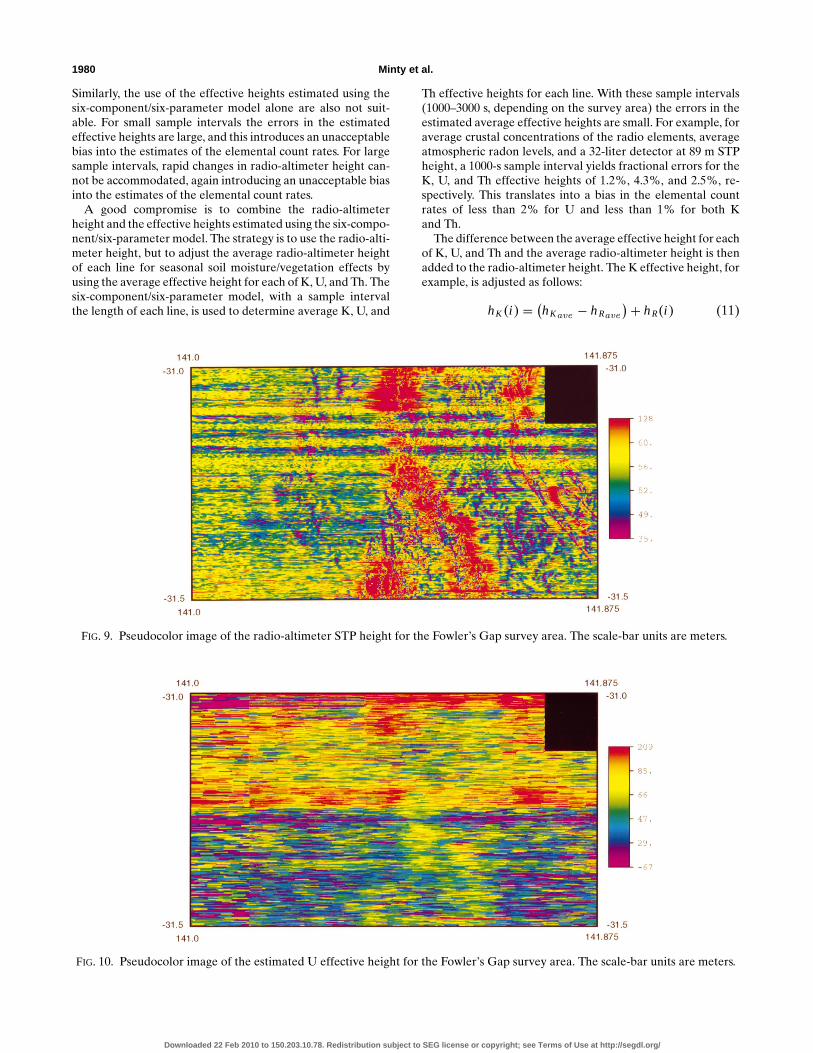
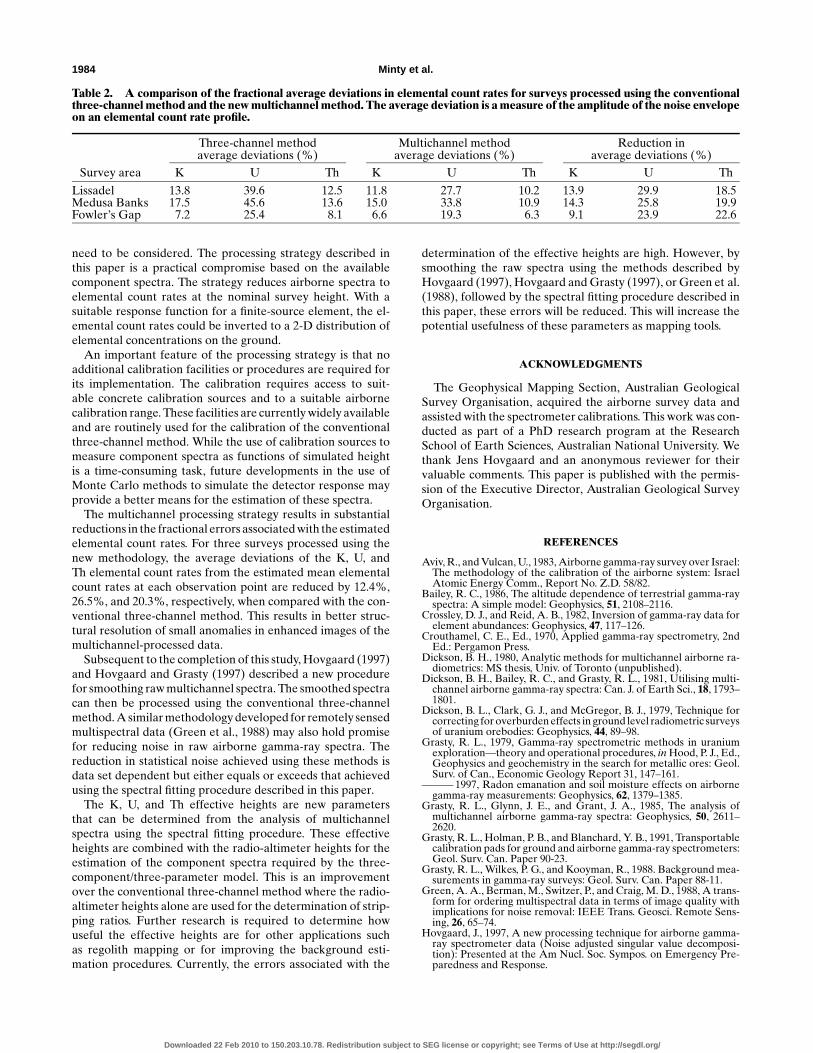
The airborne data from three surveys have been used to eval-uate the multichannel processing method. These surveys are ofthe Fowler’s Gap area (western New South Wales, Australia)Lissadel sheet area (Western Australia), and the Medusa Bankssheet area (Joseph Bonaparte Gulf, Western Australia). Thechange in effective heights over all survey areas studied showsa good correlation with the measured radio-altimeter height.However, large variations in the effective heights with timewere evident for the Fowler’s Gap survey. The radio-altimeterheight for this survey is shown in Figure 9, and the U effec-tive height is shown in Figure 10. While the U effective heightshows a correlation with the radio-altimeter height, the imageis dominated by large level shifts between lines and betweengroups of lines. Similar level shifts were seen in images of theK and Th effective heights (not shown). Also, while the levelshifts in the K and Th effective heights appeared to correlatewell, the level shifts in the U effective height showed a neg-ative correlation with K and Th. These effects are interestingbecause the pattern of level shifts reflects the date on whichthe lines were flown.
Figure 11 represents the sequence in which the Fowler’s Gapsurvey lines were flown (over two field seasons). Blocks were
FIG. 8. Exponential modeling of the relationship between K ef-fective height, simulated in the ground calibration experiments,and STP heights of observed calibration range spectra.
flown in the order 95a, 95b, and 95c during October–November1995 and then 96a and 96b during March–April 1996. While thesurvey flight plan was not entirely systematic, the arrows in eachblock approximate the direction of progressive accumulationof data within each block. A comparison of the U effectiveheight in Figure 10 and the flight plan shown in Figure 11 revealsseveral features.
There is a marked difference in average effective heights be-tween the 1995 and 1996 stages of the survey for K, U, and Th.On average, the effective heights for the 1995 survey lines are5 m higher for K and Th yet 25 m lower for U. While there maybe several possible explanations for this effect, we suspect thatthe effective heights shown in Figure 10 reflect a bias in the esti-mation of radon background because of a seasonal variation inthe moisture content of the soils within the survey area. For ex-ample, consider the possibility that the true U effective heightis a function of soil moisture content. Since the radio-altimeterheights were used for determining the component spectra forthe full-spectrum estimation of radon background, the radonbackground estimates are in error where the radio-altimeterheights differ from the true effective heights. High U effec-tive heights reflect areas where too much radon backgroundhas been removed, and low U effective heights reflect the factthat too little radon background has been removed. Radonbackground estimation errors have thus introduced a bias intothe estimation of the effective heights since the background-corrected spectra are now corrupt. Low U effective height val-ues are compensated by high K and Th values, and vice versa.
The 1996 survey started in block 96a, progressing from northto south. This was followed by block 96b, again progressingfrom north to south. In general, the estimated U effectiveheights follow a similar pattern, with the effective heights in-creasing as the survey progressed. The survey started four daysafter heavy rains in the area. Surface water was still present atthe start of the survey, suggesting the soil moisture content wasnear saturation. The soil gradually dried out over the remainderof the survey period. High U effective heights are thus inter-preted to reflect low soil moisture conditions for this survey,and low heights reflect high soil moisture conditions.
An explanation for the postulated dependence of U effectiveheight on soil moisture can be found from a study of the distri-bution of 222Rn in soils under various soil moisture conditions.Figure 12 shows the concentration of the emanating fraction of222Rn with depth for a soil under three different soil moistureconditions (after Grasty, 1996). The interesting feature of thesedepth distributions is that for high moisture concentrations,the depth distribution of emanating radon begins to approxi-mate that of a two-layer earth—i.e., a high-concentration andinfinitely thick layer at a depth of 10 to 15 cm overlain by a thin,low-concentration layer. It is thus reasonable to speculate thatthe effective height of the detector above uranium sources isaffected by the soil moisture concentration.
The choice of effective heights for generating the K, U, andTh component spectra for each sample along a flight line isa crucial consideration for the multichannel processing strat-egy. While the radio-altimeter height has been related to theK, U, and Th effective heights using the Lake Hume calibra-tion data, this mapping of the effective heights may not bevalid elsewhere under different soil type and soil moistureconditions and for different vegetation cover. The use of theradio-altimeter height alone is therefore considered unsuitable.
Downloaded 22 Feb 2010 to 150.203.10.78. Redistribution subject to SEG license or copyright; see Terms of Use at http://segdl.org/
1980 Minty et al.
Similarly, the use of the effective heights estimated using thesix-component/six-parameter model alone are also not suit-able. For small sample intervals the errors in the estimatedeffective heights are large, and this introduces an unacceptablebias into the estimates of the elemental count rates. For largesample intervals, rapid changes in radio-altimeter height can-not be accommodated, again introducing an unacceptable biasinto the estimates of the elemental count rates.
A good compromise is to combine the radio-altimeterheight and the effective heights estimated using the six-compo-nent/six-parameter model. The strategy is to use the radio-alti-meter height, but to adjust the average radio-altimeter heightof each line for seasonal soil moisture/vegetation effects byusing the average effective height for each of K, U, and Th. Thesix-component/six-parameter model, with a sample intervalthe length of each line, is used to determine average K, U, and
FIG. 9. Pseudocolor image of the radio-altimeter STP height for the Fowler’s Gap survey area. The scale-bar units are meters.
FIG. 10. Pseudocolor image of the estimated U effective height for the Fowler’s Gap survey area. The scale-bar units are meters.
Th effective heights for each line. With these sample intervals(1000–3000 s, depending on the survey area) the errors in theestimated average effective heights are small. For example, foraverage crustal concentrations of the radio elements, averageatmospheric radon levels, and a 32-liter detector at 89 m STPheight, a 1000-s sample interval yields fractional errors for theK, U, and Th effective heights of 1.2%, 4.3%, and 2.5%, re-spectively. This translates into a bias in the elemental countrates of less than 2% for U and less than 1% for both Kand Th.
The difference between the average effective height for eachof K, U, and Th and the average radio-altimeter height is thenadded to the radio-altimeter height. The K effective height, forexample, is adjusted as follows:
hK (i ) = (hKave − hRave
)+ hR(i ) (11)
Downloaded 22 Feb 2010 to 150.203.10.78. Redistribution subject to SEG license or copyright; see Terms of Use at http://segdl.org/

Multichannel Gamma-ray Spectrometry 1981
where hK (i ) is the adjusted K effective height profile, hR(i ) isthe observed radio-altimeter height profile, hKave is the whole-line average K effective height, and hRave is the whole-lineaverage radio-altimeter height. The U and Th effective heightsare determined in similar fashion. This strategy enables thebest possible radio-altimeter height to be used while accom-modating base level shifts due to soil moisture or vegetationfor each line.
Determination of elemental count rates
Further considerations for a multichannel processing strat-egy are the low count rates in individual channels, the computertime required to process the data, and the effect of energydrift in observed spectra. For example, for low count rates aPoisson statistical model is required to invert the data. But forthis model the solution is nonlinear and must be determinediteratively. The summing of channel count rates to reduce the
FIG. 11. The sequence in which the Fowler’s Gap survey lineswere flown. The arrows indicate the direction of progressiveaccumulation of data within each block.
FIG. 12. The variation in the concentration of the 222Rn ema-nating fraction with depth below ground level for three differ-ent soil moisture conditions (after Grasty, 1996).
number of channels in multichannel airborne gamma-ray spec-trometry minimizes the effect of these problems.
Minty and Kennett (1995) introduce the concept of gen-eralized channels, which are the summation of one or more12-keV data channels that are not necessarily contiguous inthe spectrum. The summing increases the count rates in eachgeneralized channel so that their error distributions approacha Gaussian distribution. It is then appropriate to use the least-squares method for inversion of the data. The processing time isminimized through a reduction in the number of channels usedin the inversion, and the use of generalized channels reducesthe effect of energy calibration errors on the processed data(Minty, 1996). The summing of channel count rates also mini-mizes the covariance between channels, which is introducedthrough energy calibration of the observed spectra (Minty,1996). The trade-off for these benefits is a small increase inthe fractional errors in the estimates of the model parameters.Minty (1996) suggests the use of 21 generalized channels forprocessing multichannel data.
Finally, the weighted least-squares method requires that thechannel count rates are weighted inversely as their variances.The approach we have adopted is to make an initial estimateof the variance associated with each channel count rate foreach observed spectrum. Changes to these variances are tracedthrough the data processing procedures to the point where thevariances are used in the weighted least-squares method.
The multichannel processing procedure can now be summa-rized as follows:
a) An estimate of the variance associated with each channelof each spectrum is made by smoothing the raw spectrain two stages. Each channel is first low-pass filtered alongthe line. A low-pass filter is then passed across each spec-trum. The channel count rates thus filtered are acceptedas estimates of the variance for each channel.
b) The raw spectra (unfiltered) are corrected for deadtimeand then energy calibrated. Both the deadtime correctionand the energy calibration affect the variance of eachchannel count rate. The estimated variances are thereforeadjusted accordingly.
c) Aircraft, cosmic, and radon background are removed.Either the spectral-ratio method or the full-spectrummethod (Minty, 1996) is used to estimate the radon back-grounds using a sample interval of 100 to 200 s. Back-ground removal does not affect the estimated varianceassociated with each channel count rate.
d) Channel count rates are summed to the optimum 21 gen-eralized channels for the six-component/six-parametermodel. The estimated channel variances are adjustedaccordingly. The six-component/six-parameter model isused to estimate effective heights for each of K, U, andTh. Average effective heights are obtained by setting thesample interval to the length of each line. K, U, and Theffective heights are determined for each line by com-bining the average effective heights for each line with theradio-altimeter STP heights as described above.
e) Channel count rates are summed to the optimum 21generalized channels for the three-component/three-parameter model. The estimated channel variancesare adjusted accordingly. The three-component/three-parameter model is used to estimate the elemental count
Downloaded 22 Feb 2010 to 150.203.10.78. Redistribution subject to SEG license or copyright; see Terms of Use at http://segdl.org/

1982 Minty et al.
rates attributed to each of K, U, and Th. The componentspectra for the three-component/three-parameter modelare estimated at each observation point using the effec-tive heights estimated in (d) above.
f) The elemental count rates are corrected for variations inthe radio-altimeter STP height from the nominal surveyheight and then scaled to elemental concentrations onthe ground.
The analysis of variance presented earlier predicted a 14%,31%, and 22% reduction in fractional errors for K, U, and Th,respectively, for the six-component/six-parameter model as op-posed to the conventional three-channel method. We use thefollowing measure (the average deviation) to compare the rela-tive performance of the multichannel and three-channel meth-ods on real data. Both the three-channel and multichannel
FIG. 13. Gradient-enhanced pseudocolor images of U elemental count rates for data processed using (a) the three-channel methodand (b) the multichannel method. The data are for the Fowler’s Gap survey area.
elemental count rates are low-pass filtered using a recursivefilter (Tammenmaa et al., 1976), and the smoothed count ratesare then assumed to provide a good measure of the true meanelemental count rate at each observation point. The absolutedeviation between the unfiltered elemental count rates and theestimated mean count rate at each observation point is calcu-lated and averaged over all observation points in the survey.This is done for each of the K, U, and Th elemental count rates.
Multichannel processing of the Fowler’s Gap survey resultedin a reduction in the K, U, and Th average deviation of 9.1%,23.9%, and 22.6%, respectively, when compared with the samedata processed using the conventional three-channel method.As an example, Figure 13a shows a pseudocolor image of the Uwindow count rate for the Fowler’s Gap survey after processingusing the conventional three-channel method. The correspond-ing multichannel-processed data are shown in Figure 13b. The
Downloaded 22 Feb 2010 to 150.203.10.78. Redistribution subject to SEG license or copyright; see Terms of Use at http://segdl.org/

Multichannel Gamma-ray Spectrometry 1983
images have been enhanced by modulating the saturation andintensity of color using an east–west gradient of the image. Themultichannel image shows a better resolution of structure thanthe corresponding three-channel image.
The reduction in average deviations achieved for theFowler’s Gap survey using the multichannel method is typicalof all surveys processed. Figure 14a shows the U window countrates for the Lissadel survey after processing using the conven-tional three-channel method. The multichannel-processed Uelemental count rates for this survey are shown in Figure 14b.A significant improvement in structural resolution is again evi-dent in the multichannel-processed U data. Similar results wereachieved for the Medusa Banks survey. In general, all surveysalso showed a small visual improvement in the resolution of themultichannel-processed Th data. The reduction in fractionalerrors for the multichannel-processed K data was not visu-ally apparent. Table 2 summarizes the reduction in average
FIG. 14. Gradient-enhanced pseudocolor images of U elemental count rates for data processed using (a) the three-channel methodand (b) the multichannel method. The data are for the Lissadel survey area.
deviations achieved through multichannel processing for thethree surveys processed.
DISCUSSION AND CONCLUSIONS
The complete 2-D inversion of airborne spectra to elemen-tal concentrations on the ground requires knowledge of thespectral response of the detector to a finite-source element onthe ground for a range of detector heights and for various lat-eral displacements of the source element beneath the detector.The component spectra required for a complete inversion ofthis type are not currently available. Perhaps the only way ofestimating such component spectra would be through a MonteCarlo-type simulation of gamma-ray transport that includesthe response function of the detector. A complete inversionof this type would, however, be complicated; the changes inthe radiation output and effective heights because of varyingsoil moisture conditions during the course of a survey would
Downloaded 22 Feb 2010 to 150.203.10.78. Redistribution subject to SEG license or copyright; see Terms of Use at http://segdl.org/
1984 Minty et al.
Table 2. A comparison of the fractional average deviations in elemental count rates for surveys processed using the conventionalthree-channel method and the new multichannel method. The average deviation is a measure of the amplitude of the noise envelopeon an elemental count rate profile.
Three-channel method Multichannel method Reduction inaverage deviations (%) average deviations (%) average deviations (%)
Survey area K U Th K U Th K U Th
Lissadel 13.8 39.6 12.5 11.8 27.7 10.2 13.9 29.9 18.5Medusa Banks 17.5 45.6 13.6 15.0 33.8 10.9 14.3 25.8 19.9Fowler’s Gap 7.2 25.4 8.1 6.6 19.3 6.3 9.1 23.9 22.6
need to be considered. The processing strategy described inthis paper is a practical compromise based on the availablecomponent spectra. The strategy reduces airborne spectra toelemental count rates at the nominal survey height. With asuitable response function for a finite-source element, the el-emental count rates could be inverted to a 2-D distribution ofelemental concentrations on the ground.
An important feature of the processing strategy is that noadditional calibration facilities or procedures are required forits implementation. The calibration requires access to suit-able concrete calibration sources and to a suitable airbornecalibration range. These facilities are currently widely availableand are routinely used for the calibration of the conventionalthree-channel method. While the use of calibration sources tomeasure component spectra as functions of simulated heightis a time-consuming task, future developments in the use ofMonte Carlo methods to simulate the detector response mayprovide a better means for the estimation of these spectra.
The multichannel processing strategy results in substantialreductions in the fractional errors associated with the estimatedelemental count rates. For three surveys processed using thenew methodology, the average deviations of the K, U, andTh elemental count rates from the estimated mean elementalcount rates at each observation point are reduced by 12.4%,26.5%, and 20.3%, respectively, when compared with the con-ventional three-channel method. This results in better struc-tural resolution of small anomalies in enhanced images of themultichannel-processed data.
Subsequent to the completion of this study, Hovgaard (1997)and Hovgaard and Grasty (1997) described a new procedurefor smoothing raw multichannel spectra. The smoothed spectracan then be processed using the conventional three-channelmethod. A similar methodology developed for remotely sensedmultispectral data (Green et al., 1988) may also hold promisefor reducing noise in raw airborne gamma-ray spectra. Thereduction in statistical noise achieved using these methods isdata set dependent but either equals or exceeds that achievedusing the spectral fitting procedure described in this paper.
The K, U, and Th effective heights are new parametersthat can be determined from the analysis of multichannelspectra using the spectral fitting procedure. These effectiveheights are combined with the radio-altimeter heights for theestimation of the component spectra required by the three-component/three-parameter model. This is an improvementover the conventional three-channel method where the radio-altimeter heights alone are used for the determination of strip-ping ratios. Further research is required to determine howuseful the effective heights are for other applications suchas regolith mapping or for improving the background esti-mation procedures. Currently, the errors associated with the
determination of the effective heights are high. However, bysmoothing the raw spectra using the methods described byHovgaard (1997), Hovgaard and Grasty (1997), or Green et al.(1988), followed by the spectral fitting procedure described inthis paper, these errors will be reduced. This will increase thepotential usefulness of these parameters as mapping tools.
ACKNOWLEDGMENTS
The Geophysical Mapping Section, Australian GeologicalSurvey Organisation, acquired the airborne survey data andassisted with the spectrometer calibrations. This work was con-ducted as part of a PhD research program at the ResearchSchool of Earth Sciences, Australian National University. Wethank Jens Hovgaard and an anonymous reviewer for theirvaluable comments. This paper is published with the permis-sion of the Executive Director, Australian Geological SurveyOrganisation.
REFERENCES
Aviv, R., and Vulcan, U., 1983, Airborne gamma-ray survey over Israel:The methodology of the calibration of the airborne system: IsraelAtomic Energy Comm., Report No. Z.D. 58/82.
Bailey, R. C., 1986, The altitude dependence of terrestrial gamma-rayspectra: A simple model: Geophysics, 51, 2108–2116.
Crossley, D. J., and Reid, A. B., 1982, Inversion of gamma-ray data forelement abundances: Geophysics, 47, 117–126.
Crouthamel, C. E., Ed., 1970, Applied gamma-ray spectrometry, 2ndEd.: Pergamon Press.
Dickson, B. H., 1980, Analytic methods for multichannel airborne ra-diometrics: MS thesis, Univ. of Toronto (unpublished).
Dickson, B. H., Bailey, R. C., and Grasty, R. L., 1981, Utilising multi-channel airborne gamma-ray spectra: Can. J. of Earth Sci., 18, 1793–1801.
Dickson, B. L., Clark, G. J., and McGregor, B. J., 1979, Technique forcorrecting for overburden effects in ground level radiometric surveysof uranium orebodies: Geophysics, 44, 89–98.
Grasty, R. L., 1979, Gamma-ray spectrometric methods in uraniumexploration—theory and operational procedures, in Hood, P. J., Ed.,Geophysics and geochemistry in the search for metallic ores: Geol.Surv. of Can., Economic Geology Report 31, 147–161.
——— 1997, Radon emanation and soil moisture effects on airbornegamma-ray measurements: Geophysics, 62, 1379–1385.
Grasty, R. L., Glynn, J. E., and Grant, J. A., 1985, The analysis ofmultichannel airborne gamma-ray spectra: Geophysics, 50, 2611–2620.
Grasty, R. L., Holman, P. B., and Blanchard, Y. B., 1991, Transportablecalibration pads for ground and airborne gamma-ray spectrometers:Geol. Surv. Can. Paper 90-23.
Grasty, R. L., Wilkes, P. G., and Kooyman, R., 1988. Background mea-surements in gamma-ray surveys: Geol. Surv. Can. Paper 88-11.
Green, A. A., Berman, M., Switzer, P., and Craig, M. D., 1988, A trans-form for ordering multispectral data in terms of image quality withimplications for noise removal: IEEE Trans. Geosci. Remote Sens-ing, 26, 65–74.
Hovgaard, J., 1997, A new processing technique for airborne gamma-ray spectrometer data (Noise adjusted singular value decomposi-tion): Presented at the Am Nucl. Soc. Sympos. on Emergency Pre-paredness and Response.
Downloaded 22 Feb 2010 to 150.203.10.78. Redistribution subject to SEG license or copyright; see Terms of Use at http://segdl.org/

Multichannel Gamma-ray Spectrometry 1985
Hovgaard, J., and Grasty, R. L., 1997, Reducing statistical noise inairborne gamma-ray data through spectral component analysis, inGubins, A. G., Proceedings of Exploration 97: Fourth DecennialConference on Mineral Exploration, 753–764.
Minty, B. R. S., 1992, Airborne gamma-ray spectrometric backgroundestimation using full spectrum analysis: Geophysics, 57, 279–287.
——— 1996, The analysis of multichannel airborne gamma-ray spectra:PhD thesis, Australian National Univ.
Minty, B. R. S., and Kennett, B. L. N., 1995, Optimum channel combi-nations for multichannel airborne gamma-ray spectrometry: Expl.Geophys., 26, 292–301.
Quittner, P., 1972. Gamma-ray spectroscopy, with particular referenceto detector and computer evaluation techniques: Halsted Press.
Tammenmaa, J. K., Grasty, R. L., and Peltaniemi, M., 1976, The reduc-tion of statistical noise in airborne radiometric data: Can. J. of EarthSci., 13, 1351–1357.
Downloaded 22 Feb 2010 to 150.203.10.78. Redistribution subject to SEG license or copyright; see Terms of Use at http://segdl.org/