airborne gamma survey of the upper south alligator river ... · report 353 k pfitzner & p...
TRANSCRIPT

in t e rna lr epor t 353
K Pfitzner & P Martin
Airborne gamma survey
of the upper South
Alligator River valley:
First report
supervising scientist

1
Summary A number of small uranium mines and prospects operated in the upper South Alligator
River valley from 1956 to 1964 when contemporary environmental rehabilitation
legislation did not exist. A number of field investigations and a hazard reduction
program have occurred since mining ceased. In August 2000, Project 1125 "Airborne
gamma survey of the upper South Alligator River valley" (file ref SG2000/0144)
commenced in order to provide remotely sensed data and images giving information
on the state of abandoned uranium mine sites in the upper South Alligator Valley. The
project is designed to provide remotely sensed data, including interpretation, to help
Parks North in their planning process for rehabilitation of the abandoned uranium
mines in the valley, as well as rehabilitation of tailings in the vicinity of Rockhole
Mine Creek. Despite airborne gamma surveys being primarily utilised in the
exploration and geological mapping industries, it was considered appropriate to test
the application of an airborne gamma survey to mine site rehabilitation applications.
A number of remotely sensed data sets will be used for this project. The primary
remotely sensed data set is a 50m line spaced airborne gamma survey, flown in
October 2000. Parks North and eriss jointly funded the acquisition of the airborne
gamma data set. A digital airborne camera was also flown over the valley, in
September 2000, funded by eriss. Approximately 600 scenes were recorded (in the
infrared, red, and green wavelengths) at 50cm resolution. In addition, a hyperspectral
data set was collected as part of the MASTER series during September 2000, at 10m
resolution. The hyperspectral data set was also funded by eriss. Other remotely sensed
data sets readily available covering the valley include: AGSO radiometric data set
from 1988 at 250 m line spacing, SPOT and Landsat TM satellite imagery.
During the overpass of remotely sensed surveys, eriss staff maintained and collected
radon data at two stations in the valley, at El Sherana and Koolpin George. In
addition, eriss staff collected meteorological data at the El Sherana Airstrip.
This report includes only information relating to the 50m line spacing airborne
gamma survey flown in 2000. An overview of the airborne gamma survey, including a
description of the aircraft and survey equipment follows. Raw data formats and the

2
processing steps undertaken by UTS Geophysics prior to receiving the data are
described. Examples of the imagery obtained, particularly for the U channel of the
radiometric data, are illustrated. Finally, because field based validations and further
interpretations have not yet been performed, the issue of ancillary information and an
appropriate disclaimer to be embedded on images passed on to parties other than eriss
are discussed.
Future reports will further detail the radiometric, magnetic and elevation data, other
remotely sensed data sets outlined above, as well as field validations.
1. Airborne Gamma Survey - Overview
1.1 Details of Acquisition Parameters
In October 2000, UTS Geophysics conducted a low-level airborne geophysical survey
over the Upper South Alligator Valley. The survey commenced on the 13th October
2000 and was completed on the 17th October 2000. The area surveyed was
approximately 90km south west of Jabiru in the Northern Territory. The survey was
flown using the AMG84 coordinate system, Universal Transverse Mercator
projection, derived from the Australian Geodetic datum. The survey area was
contained within Zone 53 with a central meridian of 135 degrees. The scene
coordinates are as follows:
214500.000 8514200.000
242250.000 8494050.000
244900.000 8497700.000
217150.000 8517850.000
The survey resulted in the collection of airborne radiometric data (U, Th, K and Total
Count measures), magnetic, and digital elevation data. The next section outlines the
UTS Geophysics Airborne System.
1.2 UTS Geophysics Airborne System
The following information was supplied by UTS Geophysics and relates to the system
for acquiring detailed airborne, radiometric and digital elevation.

3
The UTS navigation flight control computer, data acquisition system, and geophysical
sensors were installed into a specialised geophysical survey aircraft. The list of
geophysical and navigation equipment used for the survey is as follows:
• FU24-954 fixed wing survey aircraft
• UTS flight planning and survey navigation system
• UTS high speed digital data acquisition system
• Novatel 3951R, 12 channel precision navigation GPS
• Satellite transmitted differential GPS correction receiver
• UTS LCD pilot navigation display and external track guidance display
• UTS post mission data verification and processing system
• Bendix King KRA-405 radar altimeter
According to UTS Geophysics, the fixed wing survey aircraft has the following
characteristics:
• Cruise speed 105 Kn
• Survey speed 105 Kn
• Stall speed 45 Kn
• Range 970 Km
• Endurance (no reserves) 5 hours
• Fuel tank capacity 490 litres
• Engine type Single engine, Lycoming, IO-720
• Fuel type AV-GAS
Magnetic Data Acquisition Equipment, as used by UTS Geophysics, is as follows:
• UTS tail stinger magnetometer installation
• Scintrex Cesium vapour CS-2 total field magnetometer
• Fluxgate three component vector magnetometer
• RMS Aeromagnetic Automatic Digital Compensator (AADC II)
• Diurnal monitoring magnetometer (Scintrex Envimag)
Radiometric Data Acquisition Equipment, as used by UTS Geophysics, is as follows:
• Exploranium GR-820 gamma ray spectrometer
• Exploranium gamma ray detectors

4
• Barometric altimeter (height and pressure measurements)
• Temperature and humidity sensor
According to UTS Geophysics, survey data positioning and flight line navigation was
derived using real-time differential GPS (Global Positioning System). Navigation was
through an electronic pilot navigation system providing computer controlled digital
navigation instrumentation mounted in the cockpit as well as an externally mounted
track guidance system. GPS derived positions were used to provide both aircraft
navigation and survey data location information.
The GPS systems, as used by UTS Geophysics, for the survey were as follows:
• Aircraft GPS model Novatel 3951R
• GPS satellite tracking channels 12 parallel
• Typical differentially corrected accuracy 2-3 metres (horizontal)
• Real-time differential service RACAL Landstar
Accurate survey heights above the terrain were measured using a King radar altimeter
installed in the aircraft. The height of each survey data point was measured by the
radar altimeter and stored by the UTS data acquisition system. The altitude acquisition
equipment, as used by UTS Geophysics, is as follows:
• Radar altimeter King KRA-405, twin antenna altimeter
• Accuracy 0.3 metres
• Resolution 0.1 metres
• Range 0-500 metres
• Sample rate 0.1 Seconds (10Hz)
The installation platform used for the acquisition of magnetic data was a tail mounted
stinger. This stinger system was constructed of carbon fibre and designed for
maximum rigidity and stability. Both the total and field magnetometer and three
component vector magnetometer were located within the tail stinger. Total field
magnetic data readings for the survey were made using a Scrintrex Cesium Vapour

5
CS-2 Magnetometer. This precision sensor, as used by UTS Geophysics, has the
following specifications:
• Model Scintrex Cesium Vapour CS-2 magnetometer
• Sample Rate 0.1 seconds (10Hz)
• Resolution 0.001nT
• Operating Range 15,000nT to 100,000nT
• Temperature Range -20°C to +50°C
According to UTS Geophysics, at the start of the survey, the system was calibrated for
reduction of magnetic heading error. The heading and manoeuvre effects of the
aircraft on the magnetic data were removed using a RMS Automatic Airborne Digital
Compensator (AADC II). Calibration of the aircraft heading effects were measured by
flying a series of pitch, roll and yaw manoeuvres at high altitude while monitoring
changes in the three axis magnetometer and the effect on total field readings. A 26
term model of the aircraft magnetic noise covering permanent induced and eddy
current fields was determined. These coefficients were then applied to the data
collected during the survey in real-time. UTS static compensation techniques were
also employed to reduce the initial magnetic effects of the aircraft upon the survey
data. According to UTS Geophysics, a base station magnetometer was located in a
low gradient area beyond the region of influence by any man made interference to
monitor diurnal variations during the survey. The diurnal base station magnetometer
was located 2 km from the Jabiru Airstrip for the survey period (13/10/00-17/10/00).
The specifications for the magnetometer, as used by UTS Geophysics, are as follows:
• Model Scintrex Envimag
• Resolution 0.1 nT
• Sampling Interval 10 seconds (0.1Hz)
• Operating range 20,000nT to 90,000nT
• Temperature -20°C to + 50°C
An Air DB barometric altimeter was installed in the aircraft so as to record and
monitor barometric height and pressure. The data was recorded at 0.33 second
intervals and used for the reduction of the radiometric data. The barometric altimeter
acquisition equipment, as used by UTS Geophysics, is as follows:

6
• Model Air DB barometric altimeter
• Accuracy 2 metres
• Height resolution 0.1 metres
• Height range 0 - 3500 metres
• Maximum operating pressure 1,300 mb
• Pressure resolution 0.01 mb
• Sample rate 3 Hz
Temperature and Humidity measurements were made during the survey at a sample
rate of 10Hz. Ambient temperature was measured with a resolution of 0.1 degree
Celsius and ambient humidity to a resolution of 0.1 percent.
The gamma ray spectrometer used for the survey was capable of recording 256
channels and was self stabilising in order to minimise spectral drift. The detectors
used contain thallium activated sodium iodide crystals. Thorium, cesium and uranium
source measurements were made each survey day to monitor system resolution and
sensitivity. A calibration line was also flown at the start and end of each survey day to
monitor ground moisture levels and system performance. The radiometric data
acquisition, as used by UTS Geophysics, is as follows:
• Spectrometer model Exploranium GR820
• Detector volume 50 litres
1.2 Details of Survey Parameters
The survey data acquisition specifications were with line spacing of 50m, line
direction of 125-305, tie line spacing of 500m, and, tie line direction of 035-215. The
total number of line kilometres of survey data collected over the survey area was
3,403km. Sensor hight was at 50m, which, according to UTS Geophysics may vary
where topographic relief or laws pertaining to built up areas do not allow this altitude
to be maintained, or where the safety of the aircraft and equipment is endangered.
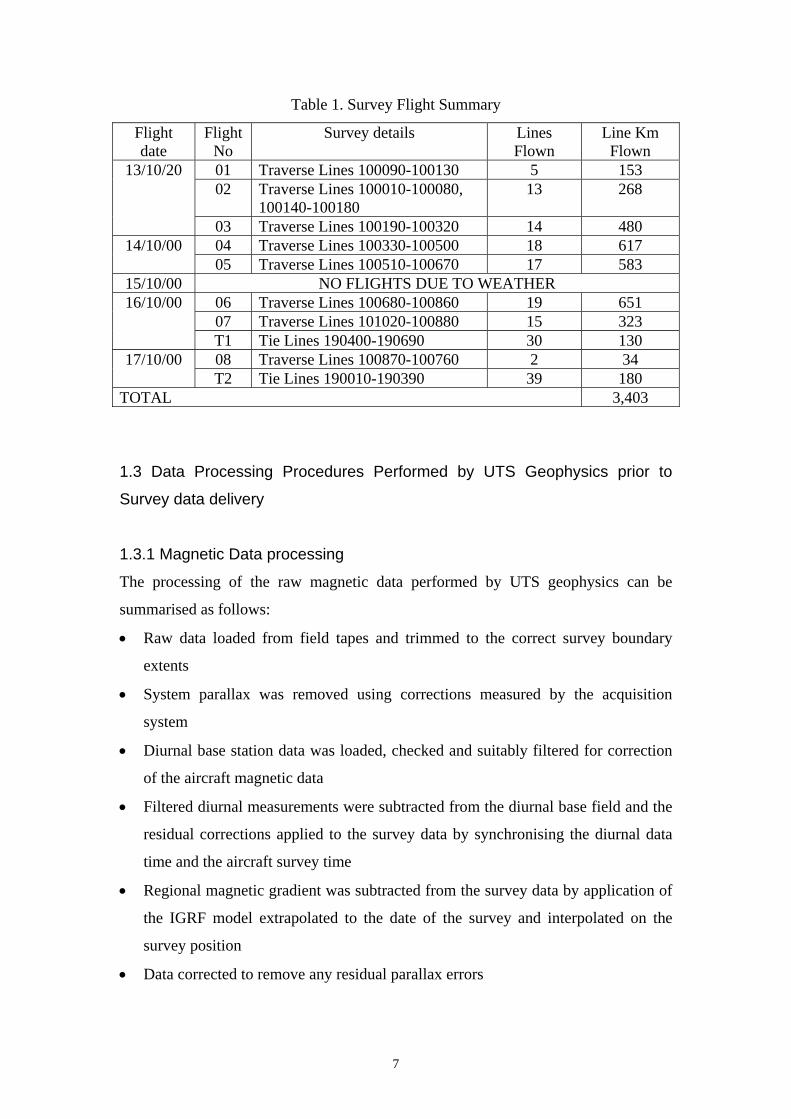
Table 1 summarises the flight logs for the survey area flown:
7
Table 1. Survey Flight Summary
Flight date
Flight No
Survey details Lines Flown
Line Km Flown
01 Traverse Lines 100090-100130 5 153 02 Traverse Lines 100010-100080,
100140-100180 13 268
13/10/20
03 Traverse Lines 100190-100320 14 480 04 Traverse Lines 100330-100500 18 617 14/10/00 05 Traverse Lines 100510-100670 17 583
15/10/00 NO FLIGHTS DUE TO WEATHER 06 Traverse Lines 100680-100860 19 651 07 Traverse Lines 101020-100880 15 323
16/10/00
T1 Tie Lines 190400-190690 30 130 08 Traverse Lines 100870-100760 2 34 17/10/00 T2 Tie Lines 190010-190390 39 180
TOTAL 3,403
1.3 Data Processing Procedures Performed by UTS Geophysics prior to
Survey data delivery
1.3.1 Magnetic Data processing
The processing of the raw magnetic data performed by UTS geophysics can be
summarised as follows:
• Raw data loaded from field tapes and trimmed to the correct survey boundary
extents
• System parallax was removed using corrections measured by the acquisition
system
• Diurnal base station data was loaded, checked and suitably filtered for correction
of the aircraft magnetic data
• Filtered diurnal measurements were subtracted from the diurnal base field and the
residual corrections applied to the survey data by synchronising the diurnal data
time and the aircraft survey time
• Regional magnetic gradient was subtracted from the survey data by application of
the IGRF model extrapolated to the date of the survey and interpolated on the
survey position
• Data corrected to remove any residual parallax errors

8
• Tie line levelling was applied to the parallax corrected data by measuring tie line
crossover points with the survey traverse line data
• Final microlevelling techniques were then applied to the tie line levelled data to
remove minor residual variations in profile intensities
• Located and gridded data were generated from the final processed magnetic data
1.3.2 Radiometric Data Processing
The processing of the raw radiometric data performed by UTS geophysics can be
summarised as follows:
• Raw data loaded from field tapes and trimmed to the correct survey boundary
extents
• System parallax was removed using corrections measured by the acquisition
system
• Statistical noise reduction of the 256 channel data was performed using the
Maximum Noise Fraction (MNF) method
• Principal component transformation of the noise-whitened data performed
• Signal-rich components were retained and spectral data reconstructed without the
noise fraction
• Channels 30-250 only are noise-cleaned, as these contain the regions of interest
• Energy peaks between the potassium and thorium peaks were recalibrated from
the noise-cleaned 256 channel measurements
• 256 channel data was windowed to the 5 primary channels of total count,
potassium, uranium, thorium, and low-energy uranium
• Dead time corrections applied
• Cosmic and aircraft background corrections applied
• Radon background removal performed using the Minty Spectral Ratio method
• Spectral stripping was applied to the windowed data
• Radar altimeter was corrected to standard temperature and pressure
• Height corrections based on the STP radar altimeter were then performed to
remove and altitude variation effects from the data
• Corrected count rate data was then converted to ground concentrations for
potassium, thorium and uranium

9
• Microlevelling of the total count, potassium, thorium and uranium data was
applied to remove and minor residual variations in profile intensities
For further information refer to the "Logistics Report for a Detailed Airborne
Magnetic, Radiometric and Digital Elevation Survey for the Jabiru Project carried out
on behalf of ERISS by UTS Geophysics, Job #A406" held in the eriss library. For
UTS contact details refer to: Head Office
UTS Geophysics Valentine Road, Perth Airport REDCLIFFE WA 6104 Tel: +61 8 9479 4232 Fax: +61 8 9479 7361
1.4 Survey Data Received
On November 3rd 2000, the survey data arrived at eriss from UTS Geophysics.
The data was written to CD and contained magnetics, radiometrics and Digital Terrain
data in the following formats:
File Name File Format a40601K Potassium counts (Ermapper data portion has no extension) a40601k.ers Ermapper gridded data header file - see below a40601r.hdr Radiometric header file a40601r.ldt Located digital data file a40601tc Total count data (Ermapper data portion has no extension) a40601tc.ers Ermapper gridded data header file - see below a40601th Thorium counts (Ermapper data portion has no extension) a40601th.ers Ermapper gridded data header file - see below a40601u Uranium counts a40601u.ers Ermapper gridded data header file - see below a40601m Magnetic data (Ermapper data portion has no extension) a40601m.ers Ermapper gridded data header file - see below a40601m.hdr magnetic header file a40601m.ldt Located digital data file a40601dt Digital terrain data (Ermapper data portion has no extension) a40601dt.ers Ermapper gridded data header file - see below a40601dt.hdr Digital terrain header file a40601dt.ltd Located digital data file

10
Ermapper gridded data header files information included the following information:
Coordinate System: UTM Projection Type: AMG Data Type: ieee4bytereal # of lines: 1986 # of pixels: 2541 Value: Counts per second x dimension: 12m y dimension: 12m Beginning easting: 214444 Beginning northing: 8517876
The radiometric header file (a40601r.hdr) included the following information:
Data Processing Specifications
The radiometric data has been corrected using the following processes:
• System parallax corrections applied
• Statistical noise reduction techniques applied
• The energy spectrum between the K and Th peaks was recalibrated using
the 256 channel data
• Dead time corrections applied
• Cosmic and aircraft background was removed
• Radon background was removed using the Minty Spectral Ratio method
• Stripping coefficients were applied
• Height attenuation corrections were applied
• Conversion to radioelement concentrations performed
• The four primary channels data were microlevelled to remove minor
residual variations in their profile intensities
Gridded Data set Formats
The magnetic data has been gridded using a bicubic spline algorithm.
The digital terrain and radiometric channels have been gridded using
a minimum curvature algorithm.
The magnetic header file (a40601m.hdr) included the following information:
Data Processing Specifications
The magnetic data has been corrected using the following processes:

11
• Diurnal corrections derived from the diurnal base station were applied to
the survey data
• The regional magnetic gradient (IGRF) computed at the date of the survey
was removed from the survey data
• System positional parallax was corrected
• The magnetic data was levelled using the survey tie line data
• The final magnetic data was microlevelled to remove minor residual
variations in profile intensities
IGRF model date: 2000.875
IGRF base level: 47049 nT
Inclination: -41.686 deg
Declination: 3.848 deg
Diurnal base level: 46430 nT
The elevation header file (a40601dt.hdr) included the following information:
Data Processing Specifications
The terrain elevation data has been corrected using the following processes:
• The terrain height was calculated by subtracting the radar altimeter height
from the GPS height
• System positional parallax was corrected
• The terrain data was levelled using the survey tie line data
• The final terrain data was microlevelled to remove minor residual
variations in profile intensities
Terrain height datum : WGS84
Gridded Data set Formats:
The magnetic data has been gridded using a bicubic spline algorithm.
The digital terrain and radiometric channels have been gridded using
a minimum curvature algorithm.
The following grid formats have been provided:
* ERMapper format
Coordinate System Information

12
WGS84 - WORLD GEODETIC SYSTEM 1984
Coordinate type: Geographical
Semi Major Axis: 6378137m
Flattening: 1/298.257223563
AMG84 - AUSTRALIAN MAP GRID 1984
Coordinate type: Universal Transverse Mercator Projection
Geodetic datum: Australian Geodetic Datum
Semi major axis: 6378160m
Flattening: 1/298.25
MGA94 - MAP GRID OF AUSTRALIA 1994
Coordinate type: Universal Transverse Mercator Projection
Geodetic datum: Geodetic Datum of Australia
Semi major axis: 6378137m
Flattening: 1/298.257222101
2 Image Display Procedures
2.1 Basic data import and Image Display
All data supplied by UTS Geophysics was in ERMapper format. Future processing
was performed in ENVI image processing software. The U, K, Th, total count,
digital terrain and magnetic data was imported into ENVI software as floating point
data. Files were then masked to transform the null value from the default -999999
(supplied by UTS Geophysics) to a null value of 0.0. This allows the collection of
image based statistics, ignoring the 0.0 null value in the calculations. The map
attributes and image coordinates were then manually entered based on the header
information. Figures 1 - 4 illustrate the U, Th, K, and, total count images respectively,
displayed as grey scale without any data manipulation. Figure 5 illustrates the digital
terrain image, displayed as grey scale without any data manipulation. In all cases, the
lighter the greyscale tone, the higher the digital number and the darker the grey scale

13
tone, the lower the digital number. Figure 6 illustrates K, Th and U as a RGB colour
composite.

14
Figure 1. Greyscale U Channel, as received from UTS Geophysics. UTM grid has been added, based on digital image coordinates.

15
Figure 2. Greyscale Th Channel, as received from UTS Geophysics. UTM grid has been added, based on digital image coordinates.

16
Figure 3. Greyscale K Channel, as received from UTS Geophysics. UTM grid has been added, based on digital image coordinates.

17
Figure 4. Greyscale Total Count, as received from UTS Geophysics. UTM grid has been added, based on digital image coordinates.

18
Figure 5. Greyscale Digital Terrain, as received from UTS Geophysics. UTM grid has been added, based on digital image coordinates.

19
Figure 6. K, Th, U (RGB) colour combination. UTM grid has been added, based on digital image coordinates.

20
2.2 Basic display of the U Channel
Because the U channel is of prime importance for characterising elevated U levels, the
remainder of this report will deal with the U channel. Future reports will describe
other channels and data obtained from UTS Geophysics. Figure 7 illustrates the U
channel displayed with a "Rainbow" colour table, where red colours illustrate the
highest digital numbers and the lightest shade of blue the lowest digital numbers. By
applying a contrast stretch (figure 8) to the Rainbow colour table, the higher digital
numbers are emphasised and a greater portion of the scene is represented as blue.
Basic statistics were generated from the U channel data and are outlined in Table 2.
These values are in counts per second, as supplied by UTS Geophysics.
Table 2. Basic statistics from the U channel (counts per second).
Minimum number
Maximum number
Mean value Standard Deviation
2.154733 1681.237915 64.085955 52.251740
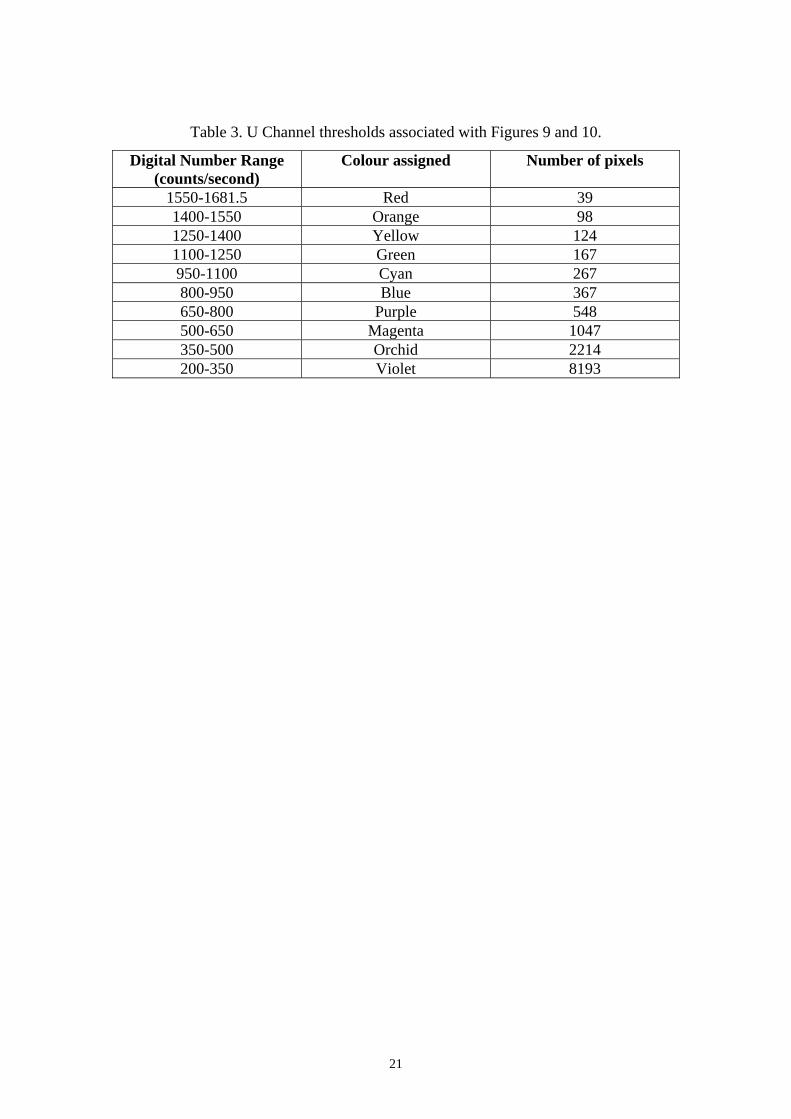
The range of digital numbers in the U channel greater than 200 counts/second were
then thresholded into ranges of 150 digital numbers. 10 classes resulted, highlighting
the sources of varying levels of higher counts. Table 3 illustrates the ranges used in
the threshold (digital number), the colour assigned, and, the number of pixels
associated with the particular thresholds. Figure 9 illustrates these ranges, with counts
less than 200 being displayed as grey scale.
Coordinates of known mine site coordinates, which were obtained by GPS locations
in the field (supplied by Peter Waggitt) were overlayed on the image (figure 10).
From figure 10 it can be seen that the majority of higher digital numbers correspond
to known mine site locations. Refer to enlarged A3 illustrations of figures 9 and 10 at
the end of this report.
21
Table 3. U Channel thresholds associated with Figures 9 and 10.
Digital Number Range (counts/second)
Colour assigned Number of pixels
1550-1681.5 Red 39 1400-1550 Orange 98 1250-1400 Yellow 124 1100-1250 Green 167 950-1100 Cyan 267 800-950 Blue 367 650-800 Purple 548 500-650 Magenta 1047 350-500 Orchid 2214 200-350 Violet 8193

22
Figure 7. U Channel - Rainbow Colour Table

23
Figure 8. U Channel - Rainbow Colour Table, with contrast stretch

24
Figure 9. U Channel with highest counts thresholded

25
Figure 10. U Channel with highest counts thresholded

26
2.3 Disclaimer Requirements
Parks Australia North (PAN), together with Earth Water Life Sciences (EWL) have
requested copies of the results of the airborne gamma ray survey, in particular the U
channel. It is considered important to respond to such requests in a timely fashion in
order to assist with the rehabilitation planning effort. However, because the data have
only recently been received, and because no further interpretations or validations
including field work have been performed as yet, it is considered essential to make
known the limitations of the survey data until such validation has been performed.
Figures 9 and 10 were supplied to both PAN and EWL on the 1st of December 2000.
It should be noted that the title reads "Preliminary Results" and there is ancillary
information in the bottom right corner. This information reads:
RADIOMETRICS Spectrometer: Explorium GR-820 Detector Volume: 50 l Flight line Spacing: 50 m Recording Interval: 1.0 second or 50 m Sensor Height: 50 m Survey Date: October 2000 Survey flown by: UTS Geophysics Coordinate System: AMG84 PRELIMINARY RESULTS OF AIRBORNE SURVEY These preliminary data have been provided for information only, and should not be used for the estimation of actual soil concentrations or dose rates at specific locations. Further interpretations and validations to follow. Not for publication. Commonwealth of Australia
The information above and within this report should draw the attention of the data
receiver to a number of cautionary points. These are summarised below.
• The detector is not collimated to receive counts from a particular direction. The
recorded gamma rays may come from any direction. Count rates will be higher
where the crystal is closest to the source of counts.
• Flight lines are nominally parallel at 50m distance from each other, but in practice
operational restrictions mean that the aircraft will stray from its intended line.
27
• The recording interval for each reading was 1 second. In this time the aircraft flies
a nominal 50 m along the flight line. However, aircraft speed will vary over the
course of the flight.
• The aircraft height is nominally 50 m but the aircraft cannot maintain this height
over the whole survey, particularly in hilly country such as that covered by the
present survey.
• From the above points, it follows that the counts received by the detector will not
be from an exact 50 m x 50 m footprint. Rather, the detection efficiency will vary
over the nominal footprint, and a proportion of the signal received comes from
outside this area. This proportion will vary depending upon the actual aircraft
height and geographic location at the time.
• Within a 50 m x 50 m “footprint” area, it may be that a particular area has a much
elevated concentration of the radionuclide of interest compared with the average
over the rest of the area. If this elevated area does not cover the whole footprint, it
should be noted that the count rate recorded in the imagery will be an average of
these levels to provide a single digital number. It should also be noted that the raw
counts have then been interpolated, and in this case, the smallest element size is
12 m on the imagery. For these reasons, relationships with actual soil
concentrations in specific locations should not be used for direct correlation with
airborne results.
• Count rates will vary exponentially with the depth of the source below the soil
surface.
• The signal is reduced with increasing soil moisture. The presence of waterbodies
will reduce the signal dramatically; for example, the presence of the South
Alligator River may be seen on some of the figures as a line of low count rate (e.g.
see Figure 10).
• The so-called “U” signal does not in fact represent directly a signal from the
element uranium. In general, it can be best thought of as indicating the presence of
Ra-226 (radium-226) in the soil (Ra-226 is one of the radioactive progeny of U-
238). This point is especially important in the present survey because of the
known presence of uranium mill tailings in the area covered by the survey. It
follows that the so-called “U” signal in this survey should not be taken to be a
measure of concentrations of the element uranium.

28
• The detector volume for the radiometrics was a 50 litre crystal, whereas
commonly a 33 litre crystal is used for radiometric surveys. The larger crystal was
chosen to maximise the counts received.
• Whilst every care is taken to ensure the accuracy of products produced from these
surveys, eriss makes no representations or warranties about accuracy, reliability,
completeness or suitability for any particular purpose and disclaims all
responsibility and liability until such validations and further interpretations are
complete.
From these points, it follows that the airborne results should be used only as an
indicator of relative differences in count rates averaged over broad areas until ground
truthing and further validations and interpretations have been completed.
Nevertheless, the initial preliminary results (see Figures 9 and 10) are encouraging
and the authors are confident that much useful information will be derived from future
work concerning the airborne gamma survey flown over the upper South Alligator
Valley. Further reports will be supplied on an ongoing basis as this work progresses
so that the information can be used by managers of the area.