multi-level analytic network process model to …
TRANSCRIPT

MULTI-LEVEL ANALYTIC NETWORK PROCESS MODEL TO MITIGATE SUPPLY
CHAIN DISRUPTIONS IN DISASTER RECOVERY PLANNING
A Thesis presented to
the Faculty of California Polytechnic State University, San Luis Obispo
In Partial Fulfillment of the Requirements for the Degree
Master of Science in Industrial Engineering
by
Martina U. Kroener April 2016

ii
© 2016
Martina U. Kroener ALL RIGHTS RESERVED

iii
COMMITTEE MEMBERSHIP
TITLE: Multi-level Analytic Network Process Model to Mitigate Supply Chain Disruptions in Disaster Recovery Planning
AUTHOR: Martina U. Kroener DATE SUBMITTED: April 2016 COMMITTEE CHAIR: Reza Pouraghabagher, Ph.D. Professor of Industrial Engineering California Polytechnic State University COMMITTEE MEMBER: Jianbiao (John) Pan, Ph.D. Professor of Industrial Engineering California Polytechnic State University COMMITTEE MEMBER: Xuan Wang, Ph.D. Assistant Professor of Industrial Engineering California Polytechnic State University

iv
ABSTRACT
Multi-level Analytic Network Process Model to Mitigate Supply Chain
Disruptions in Disaster Recovery Planning
Martina U. Kroener
Over the past few decades, environmental changes have led to more frequent occurrences and greater intensities of natural disasters worldwide. In terms of globally connected supply chains, this has resulted in an enormous economical loss for corpora-tions. Therefore, Business Continuity and Disaster Recovery (BC/DR) planning and management has become essential for businesses in order to protect their critical busi-ness flow. Yet there is a lack of systematic and transparent methodologies for compa-nies to handle this problem.
Hence, this thesis introduces a novel approach to combine consecutive steps of the Disaster Recovery Planning (DRP) process within one application. The multi-criteria decision-making (MCDM) tool called the Analytic Network Process (ANP) is employed to identify critical products of a business and match them with optimal disruption mitigation strategies based on an evaluation of benefits, opportunities, costs, and risks (BOCR).
To validate the method developed in this thesis, a case study using historical da-ta of a U.S. company (Company XYZ) is introduced. The results of the ANP mathemati-cal modeling demonstrate that the developed methodology provides a valuable approach to analyze and confirm BC/DR planning decisions. Moreover, an expert of Company XYZ confirmed that the suggested solution established through this case study is in agreement with the preferable choice based on his expertise and professional decision-making.
Further research could extend the proposed methodology to other fields of BC/DR planning, such as IT Disaster Recovery Planning or Human Disaster Relief. Keywords: Analytic Network Process, Business Continuity, Critical Products, Disaster Recovery, Mitigation Strategies, Supply Chain

v
ACKNOWLEDGMENTS
First, I would like to express my sincere gratitude to my advisor Professor Reza
Pouraghabagher for the continuous support of my research, for his academic advice, patience, motivation, enthusiasm, and immense knowledge. His guidance helped me during all the time of research, writing of this thesis, and making decisions regarding my professional development.
Besides my advisor, I would like to thank the rest of my thesis committee: Prof.
Dr. Jianbiao Pan, and Prof. Dr. Xuan Wang for their support with the model implementa-tion and validation, their continuous encouragement, and insightful suggestions.
My sincere thanks also goes to the American and German Fulbright Program,
which allowed me to participate in this Masters’ degree program in Industrial Engineering at California Polytechnic State University. In particular, I want to thank Mrs. Laurie Ste-vens for the endless support of my academic and professional requests.
Last but not the least, I would like to thank my family and friends for supporting
me in all my decisions, especially my dear friend Marissa for revising this thesis.

vi
TABLE OF CONTENTS
Page
LIST OF TABLES ............................................................................................................. vii LIST OF FIGURES .......................................................................................................... viii LIST OF ACRONYMS ....................................................................................................... x CHAPTER 1. Introduction ................................................................................................................. 1
2. Literature Review ........................................................................................................ 4
2.1 Great East Japan Earthquake Case Studies ............................................................ 4
2.2 Overview of Business Continuity and Disaster Recovery Practices ......................... 5
2.3 Analytic Network Process ...................................................................................... 11
3. Model Design and Implementation ........................................................................... 25
3.1 Model Assumptions ................................................................................................ 25
3.2 Design of Multiple Level ANP Model ...................................................................... 27
3.3 Implementation of Multiple Level ANP Model ......................................................... 31
4. Testing, Evaluation and Discussion .......................................................................... 57
4.1 Case Study ............................................................................................................. 57
4.2 Discussion .............................................................................................................. 64
5. Conclusions and Future Work ................................................................................... 69
REFERENCES ................................................................................................................ 73
APPENDICES
A) Matrices of Product Selection ANP Model ............................................................. 77
B) Limitmatrices for Benefits, Opportunities, Costs, and Risks ................................... 79
C) Overview of Control Criteria and Decision Networks for each BOCR Merit ........... 80
D) Limitmatrices for Decision Networks ...................................................................... 81
E) Table of Rating Standards used for BOCR-ANP Model ......................................... 84
F) Case Study: ANP Input Questionnaire ................................................................... 85
G) Case Study: Priorities per BOCR Merit .................................................................. 86
H) Case Study: Rating of Strategic Criteria vs. BOCR Merits ..................................... 87
I) Case study: Super-/Limitmatrices for each BOCR Merit ........................................ 88

vii
LIST OF TABLES
Table Page
Table 1: Tactics for Managing Disruption Risks .............................................................. 10
Table 2: Fundamental Scale of Judgments ..................................................................... 14
Table 3: Criteria to Identify Key Products ........................................................................ 33
Table 4: Product Ranking Based on Obtained Priorities ................................................. 37
Table 5: Priorities Obtained for Criteria in each BOCR Merit .......................................... 42
Table 6: Priorities Obtained for Disruption Mitigation Strategies per BOCR Merit .......... 50
Table 7: Strategic Criteria of BOCR-ANP Model ............................................................. 51
Table 8: Priority Rating of Strategic Criteria against BOCR Merits ................................. 55
Table 9: Synthesizing BOCR for each Alternative Using the Ideal Mode ........................ 56
Table 10: Final Ranking of Disruption Mitigation Strategies for Product B ...................... 62

viii
LIST OF FIGURES
Figure Page
Figure 1: Worldwide Natural Disasters 2014 ..................................................................... 1
Figure 2: Risk Analysis and Business Continuity Process ................................................ 6
Figure 3: From Business Continuity Management to Disaster Recovery Planning ........... 7
Figure 4: Structures of AHP and ANP ............................................................................. 13
Figure 5: Network Structure with Generalized Supermatrix ............................................ 17
Figure 6: Step 1 and 2 of AHP Process .......................................................................... 20
Figure 7: Step 3 and 4 of AHP Process .......................................................................... 20
Figure 8: Supermatrix of AHP Process ........................................................................... 21
Figure 9: Final synthesis of AHP Process ....................................................................... 21
Figure 10: Flowchart for Multi-Level ANP Model Design ................................................. 29
Figure 11: Implementation of ANP via Multiple Levels with SuperDecisions .................. 30
Figure 12: Zoom into Flowchart (Process Steps 1-6) ...................................................... 32
Figure 13: Screenshot of ANP to Identify Key Products ................................................. 35
Figure 14: Pairwise Comparisons for Critical Products in SuperDecisions Software ...... 36
Figure 15: Zoom into Flowchart (Process Steps 7-12) .................................................... 39
Figure 16: BOCR Control Criteria Hierarchies ................................................................ 40
Figure 17: Pairwise Comparisons for Control Criteria of Benefits in SuperDecisions ..... 41
Figure 18: Overview of Benefits Merit and Decision Networks ....................................... 45
Figure 19: Overview of Opportunities Merit and Decision Networks ............................... 46
Figure 20: Overview of Costs Merit and Decision Networks ........................................... 47
Figure 21: Overview of Risks Merit and Decision Networks ........................................... 48
Figure 22: Zoom into Flowchart (Process Steps 13-18) .................................................. 49

ix
Figure 23: Screenshot of Strategic Criteria Network ....................................................... 53
Figure 24: Priorities Obtained in Strategic Criteria Network ............................................ 53
Figure 25: Data Gathering for Input of ANP Models ........................................................ 57
Figure 26: Screenshot of "Key Product Selection" Network (Case Study) ...................... 58
Figure 27: Screenshot of Benefits Merit (Case Study) .................................................... 59
Figure 28: Screenshot of Opportunities Merit (Case Study) ............................................ 60
Figure 29: Screenshot of Costs Merit (Case Study) ........................................................ 60
Figure 30: Screenshot of Risks Merit (Case Study) ........................................................ 61
Figure 31: Sensitivity Analysis for each BOCR Merit ...................................................... 63

x
LIST OF ACRONYMS
AHP Analytic Hierarchy Process
ANP Analytic Network Process
BC/DR Business Continuity / Disaster Recovery
BCM Business Continuity Management
BCP Business Continuity Planning
BIA Business Impact Analysis
BOCR Benefits, Opportunities, Costs, Risks
BOCR-ANP ANP with Benefit, Opportunity, Cost, and Risk Merits
BOM Bill of Materials
DEMATEL Decision Making Trial and Evaluation Laboratory
DRM Disaster Recovery Management
DRP Disaster Recovery Planning
IPO Input/Process/Output model
MCDM Multi-criteria Decision-Making
SCM Supply Chain Management

1
1. INTRODUCTION
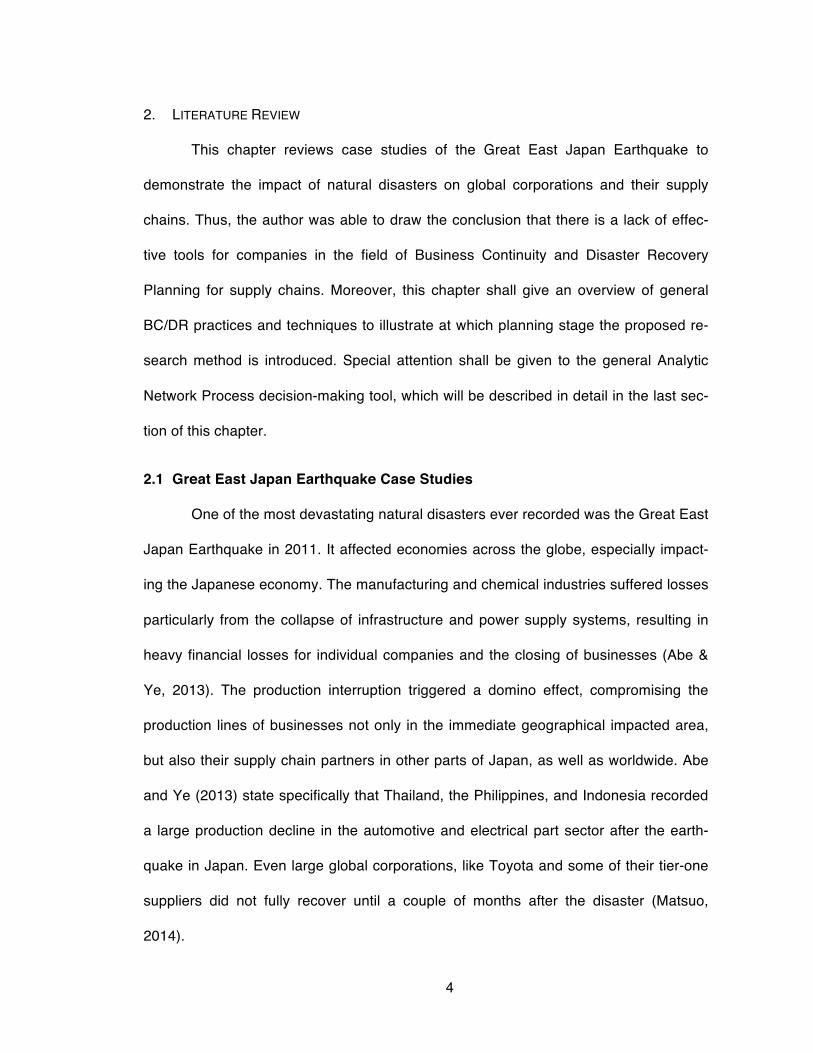
The occurrence and impact of natural disasters has risen over the last centu-
ries, resulting in great human misery and enormous economic losses. In 2014 alone,
there were more than 900 weather-related catastrophes, as shown in Figure 1, caused
by earthquakes, storms, floods, and droughts. These disasters killed 6,900 people and
created 97 billion U.S. dollars in overall losses and 30 billion U.S. dollars in insured
losses (Munich Re, 2015).
Figure 1: Worldwide Natural Disasters 2014 (Source: Munich Re, NatCatSERVICE, 2015)
At the same time, companies have become more and more global by transfer-
ring parts of their production facilities to other countries and having supply chains
worldwide. In this way, businesses are more vulnerable to supply chain disruptions and
Geophysical events (Earthquake, tsunami, volcanic activity)
Meteorological events (Tropical storm, extratropical storm, convective storm, local storm)
Hydrological events (Flood, mass movement)
Loss events
Climatological events (Extreme temperature, drought, wildfire)
Selection of catastrophes Overall losses ≥ US$ 1,500m
NatCatSERVICE
Loss events worldwide 2014 Geographical overview
© 2015 Münchener Rückversicherungs-Gesellschaft, Geo Risks Research, NatCatSERVICE – As at January 2015
Drought Brazil, 2014
Winter damage Japan, 7–16 Feb
Winter damage USA, Canada, 5–8 Jan
Drought USA, 2014
Earthquake China, 3 Aug
Floods India, Pakistan, 3–15 Sep
Floods United Kingdom, Dec 2013–Feb 2014
Severe storms France, Belgium, Germany, 7–10 Jun
Flash floods USA,11–13 Aug
Cyclone Hudhud India, 11–13 Oct
Severe storms USA, 18–23 May
Severe storms USA, 2–4 Apr
Severe storms USA, 27 Apr–1 May
Severe storms USA, 3–5 Jun
Typhoon Rammasun China, Philippines, Vietnam, 11–22 Jul
Source: Munich Re, NatCatSERVICE, 2015
Hurricane Odile Mexico, 11–17 Sep
980 Loss events
Typhoon Kalmaegi China, Philippines, Vietnam, 12–20 Sep
Floods Bosnia and Herzegovina, Serbia, Croatia, Romania, 13–30 May

2
their unpredictable challenges. As an example, 25% of businesses impacted by a ma-
jor disaster never resume their operations (Hewlett-Packard Development Company
L.P., 2007). Therefore, it is essential that businesses invest in Business Continuity and
Disaster Recovery (BC/DR) Planning and Management to proactively prepare for dis-
ruptions in their supply chains and production facilities.
During the last couple of years, researchers and organizations have intensified
their research activities in the field of BC/DR planning. While most managers focus on
protecting their businesses against reoccurring, low-impact disruptions of supply
chains, researchers are trying to develop new methods to mitigate high-impact, low-
likelihood risks such as natural disasters. Both parties agree that an organization will
never be able to restore all processes at the same time when a disaster hits the plant.
Therefore, a business should identify its critical processes and products, and prioritize
products for which business resilience practices will be implemented.
The intention of this research is to employ a unique approach of multi-criteria
decision-making (MCDM) in the field of BC/DR planning for supply chains. The specific
MCDM technique applied in this research is called Analytic Network Process (ANP),
which allows analyzing and making complex decisions based on mathematical model-
ing. The proposed framework for this investigation is divided in two parts. The first ANP
model ranks the products of a company with respect to multiple criteria. Based on the
ranking, they are then categorized into critical and non-critical products. For these criti-
cal products, a second ANP model is employed to identify the optimal disruption mitiga-
tion strategy based on an evaluation of benefits, opportunities, costs, and risks. In or-
der to implement this extensive network model, decision-making software employing
the Analytic Network Process, called SuperDecisions, will be utilized.

3
This thesis is divided into four chapters following this introductory first chapter.
Chapter 2 will provide a review of disaster planning and mitigation procedures and ex-
pand the focus on the ANP decision-making tool. The third chapter describes the de-
sign and implementation of a multiple layer ANP model to identify critical products of a
company and match these with optimal disruption mitigation strategies based on an
assessment of benefits, opportunities, costs, and risks. Chapter 4 illustrates a case
study applying data from a field expert, followed by a thorough discussion of the pro-
posed model and method. The last chapter offers conclusions of the proposed and val-
idated ANP framework and makes recommendations for future research.
4
2. LITERATURE REVIEW
This chapter reviews case studies of the Great East Japan Earthquake to
demonstrate the impact of natural disasters on global corporations and their supply
chains. Thus, the author was able to draw the conclusion that there is a lack of effec-
tive tools for companies in the field of Business Continuity and Disaster Recovery
Planning for supply chains. Moreover, this chapter shall give an overview of general
BC/DR practices and techniques to illustrate at which planning stage the proposed re-
search method is introduced. Special attention shall be given to the general Analytic
Network Process decision-making tool, which will be described in detail in the last sec-
tion of this chapter.
2.1 Great East Japan Earthquake Case Studies
One of the most devastating natural disasters ever recorded was the Great East
Japan Earthquake in 2011. It affected economies across the globe, especially impact-
ing the Japanese economy. The manufacturing and chemical industries suffered losses
particularly from the collapse of infrastructure and power supply systems, resulting in
heavy financial losses for individual companies and the closing of businesses (Abe &
Ye, 2013). The production interruption triggered a domino effect, compromising the
production lines of businesses not only in the immediate geographical impacted area,
but also their supply chain partners in other parts of Japan, as well as worldwide. Abe
and Ye (2013) state specifically that Thailand, the Philippines, and Indonesia recorded
a large production decline in the automotive and electrical part sector after the earth-
quake in Japan. Even large global corporations, like Toyota and some of their tier-one
suppliers did not fully recover until a couple of months after the disaster (Matsuo,
2014).

5
In Toyota’s case, the disaster did not directly damage their manufacturing and
assembly plants, but nevertheless Toyota had to shut down their domestic sites for
nearly two weeks after the earthquake due to missing materials and parts from suppli-
ers (Matsuo, 2014). One of Toyota’s main problems stemmed from an unclear supply
chain. Toyota ran out of raw materials and components for critical products without
knowing exactly which suppliers could continue to deliver. Although Toyota was able to
identify all of their main suppliers (first and second tier), they could not distinguish sup-
pliers of critical parts further down the supply chain due to a lack of visibility in their ex-
tensive supply chain. As a result, Toyota faced production shortages until approximate-
ly three months after the earthquake (Matsuo, 2014). After the disaster, a thorough
analysis of Toyota’s supply chain identified three weak links accounting for the loss of
efficiency in the production system. The losses in productivity could have been pre-
vented with the systemization of well-formulated plans and the implementation of strat-
egies for disaster recovery in response to weather-related natural events. The Toyota
case study illustrates that even large companies can be impacted heavily by disrup-
tions including natural disasters. Thus, it is essential that businesses proactively plan
for disruptions in their supply chains and production facilities, in addition to developing
recovery strategies to mitigate negative long-term impacts. The next section expands
on practices employed in BC/DR planning and management and develops an approach
to mitigate supply chain disruptions with the help of proactive decision-making models.
2.2 Overview of Business Continuity and Disaster Recovery Practices
Although disasters cannot be prevented, companies can prepare and mitigate
the effects of natural disasters on their businesses. The case studies of the Great East
Japan Earthquake demonstrate the significance of thorough Supply Chain Manage-

6
ment (SCM), including the identification of supply chain risks and proactive planning for
supply chain disruptions.
Figure 2: Risk Analysis and Business Continuity Process (Source: World Continuity Congress, 2011)
In order to begin to explain Business Continuity and Disaster Recovery Man-
agement practices, definitions are required. Often, the terms “business continuity” and
“disaster recovery” are used interchangeably and thus lead to confusion. Figure 2 illus-
trates the general risk analysis process, which managers use in their organizations.
First, risks are identified and analyzed, and then matching response strategies are de-
veloped. Business Continuity Planning (BCP) is introduced as a specific part of a risk
reduction treatment. In general, Business Continuity Management (BCM) is a man-
agement process with the goal to plan, implement, and continually improve a manage-
ment system that prepares for any disruptive events that could potentially harm an or-
ganization (ISO 22301:2012, 2012). Business Continuity Management (BCM) methods

7
require the involvement of the whole organization, including middle and upper man-
agement, and the use of a general crisis management process to prepare and react to
business threats. Evans and Elphick (2005) describe four stages as a general se-
quence recommended for crisis management, introduced as the “4 R’s”: Reduction,
Readiness, Response, and Recovery. Following these four stages, an organization can
establish tailored mitigation and contingency strategies to overcome potentially nega-
tive long-term effects.
Figure 3: From Business Continuity Management to Disaster Recovery Planning
Disaster Recovery Planning (DRP), represents the planning phase of Disaster
Recovery Management (DRM), which is a specific part of the BCM (Sahebjamnia,
Torabi, & Mansouri, 2015). As Figure 3 illustrates, an organization develops multiple
DRP’s to successfully mitigate and overcome any disasters harming the success of
their particular business units or functions. This thesis focuses on Disaster Recovery

8
Planning for supply chains. The next section will describe the DRP process in more de-
tail.
In general, the goal of applying DRP to supply chains is to evaluate all potential
scenarios and risks that could lead to a disruption or delay of material, cash flow, or
information (Wieland & Wallenburg, 2012). The DRP process is carried out through
several iterations of business impact analysis (Step A in Figure 3), development of re-
covery strategies (Step B in Figure 3), and implementation and testing of the proce-
dures (Step C in Figure 3).
Business Impact Analysis (BIA) describes the methodology of identifying all
risks that could potentially trigger a supply chain breakdown (Torabi, Rezaei Soufi, &
Sahebjamnia, 2014). These risks are then evaluated by their impact and likelihood. In
general, disruptions caused by natural disasters are often classified as low-likelihood
risks with high impacts on the supply chain network. Organizations typically develop
plans to reduce supply chain risks and mitigate negative impacts that are more likely to
occur, and hence create a higher risk for the company. Companies often overlook dis-
astrous events that could severely harm their business operations, but are not likely to
occur on a regular basis. As a result, the challenge for managers is to protect their
business against high frequency, low-impact risks while also developing strategies to
successfully mitigate low-likelihood, high-impact disruptions for their most important
products and processes (Chopra & Sodhi, 2004).
Focusing on the BIA (Step A in Figure 3) of supply chains, Torabi et al. (2014)
developed a novel approach for prioritizing critical business products and processes.
This prioritization systematic is necessary since a business is never able to recover all
their products and processes at the same time after a disaster strikes. Torabi et. al

9
(2014) divided the BIA into three steps: (1) Identification of key products, (2) Identifica-
tion of critical processes, and (3) Development of continuity measures for key products
and critical functions. A main difference between Torabi et al.’s approach and previous
research was that their process was based on a specific multiple criteria decision-
making tool called Analytic Network Process (ANP).
ANP allows identifying critical products and processes based on multiple criteria
instead of only one criterion such as revenue. Using ANP as a decision-making tool in
DRP has a couple of advantages for organizations. First, decision-making models
based on ANP are relatively easily to develop and to employ (Taslicali & Ercan, 2006)
and are therefore ideal business solutions. Additionally, ANP decision-making takes a
wide array of factors into account instead of basing the choice on one aspect, or solely
relying on the intuition of managers. Since supply chain disruptions caused by natural
disasters are less likely to occur but result in a high-impact on organizations, a tool for
hypothetical decision-making is required. The ANP method represents a powerful ap-
plication to model complex decision-making environments, which are usually influenced
by a mix of tangible and intangible factors. As a result, the ANP method is employed in
this thesis and will therefore be discussed in detail in the next section of this literature
review.
Referring back to Figure 3, the next step following the BIA is the identification
and implementation of recovery strategies in response to supply chain disruptions. In
general, strategies to reduce and prepare for disruptions are called mitigation strate-
gies; whereas, contingency strategies describe tactics after a disaster strikes. Tomlin
(2006) introduces six widely used mitigation and contingency strategies (Table 1) for
managing supply chain disruption risks.

10
Table 1: Tactics for Managing Disruption Risks (Based on Tomlin, 2006)
Category Tactic
Financial mitigation Business interruption insurance Operational mitigation Inventory Sourcing Operational contingency Rerouting Demand management
Another approach of tackling disruption risks, referred to as “passive ac-
ceptance,” fits neither the category of mitigation nor contingency strategies. It describes
a company that does not choose to invest in recovery practices and agrees to risk an
interruption of their operations. This tactic is obviously the preferred choice when com-
panies are hesitant to invest, but it is important to acknowledge possible effects and
costs of low-likelihood but high-impact risks such as weather-related disasters (Chopra
& Sodhi, 2004). In general, the implementation of recovery strategies is expensive as
Tomlin (2006) states, and therefore should only be considered for key products and
processes of a company.
The previous literature research revealed that there is a missing link in the Dis-
aster Recovery Planning process between the Business Impact Analysis (Step A) and
the selection of appropriate Recovery Strategies (Step B), as shown in Figure 3. As a
result, the intention of this research is to employ a novel approach in multi-attribute de-
cision-making by combining two ANP models in an effort to:
1. Identify critical products of a company or business unit based on multiple
criteria.
11
2. Analyze and find the optimal disruption mitigation strategy for a critical
product based on the assessment of benefits, opportunities, costs, and risks
of a set of strategies.
Input for both ANP models are measures and strategies found through the liter-
ature review of this thesis. The product selection ANP model employs measures sug-
gested by Torabi et al. (2014). In the second ANP model, various supply chain disrup-
tion mitigation strategies defined by Tomlin (2006) shall be evaluated in this investiga-
tion. This proposed research statement represents a unique approach since there has
been no former work identified which extends BIA steps with the succeeding DRP pro-
cess step of implementing recovery strategies. Additionally, the suggested investigation
requires the combination of two separate Analytic Network Processes into one com-
prehensive, multiple level ANP model. For the extensive calculations required in the
multi-level ANP model, ANP decision-making software will be employed. The next
chapter describes the working mechanics of the Analytic Network Process in more de-
tail.
2.3 Analytic Network Process
Introduction
The Analytic Network Process (ANP) and its more specific form, called the Ana-
lytic Hierarchy Process (AHP), are methods in multi-criteria decision-making. Whereas
the ANP allows non-linear relationships and feedback between elements to structure a
decision problem, the AHP consists solely of linear connections. In general, MCDM
techniques are used to determine the best alternative based on individual preferences
of decision-makers rather than objective measurements. Using personal preference
12
means that the outcome for one person applying the decision-making method will be
completely different from another person’s outcome that reflects their individual goals
and judgment (Saaty, 2009).
ANP and AHP are methods of relative measurement and intangibles, which as-
sist in making complex decisions based on the perception and experience of decision-
makers and experts. Thomas L. Saaty developed the Analytic Network Process as a
broader form of the Analytic Hierarchy Process allowing non-linear relationships and
interdependencies such as cycles (mutual outer dependencies) and loops (inner de-
pendencies) between elements of a network (Saaty & Vargas, 2013).
The general approach of both decision-making methods is based on the same
principles. For this purpose, rationality as well as intuition is taken into account when
the best option from a number of alternatives are evaluated with regard to several crite-
ria. Therefore, a decision-maker is needed to carry out simple pairwise comparisons of
criteria with respect to alternatives and vice-versa. The judgments are then turned into
overall priorities for ranking alternatives. Finally, Saaty noted that intuitive judgments
may lead to inconsistencies, which need to be minimized before a final synthesis is
made (Saaty & Vargas, 2001).
Building the Structure: Hierarchy or Network?
Figure 4 shows a hierarchy model on the left side, which provides the simplest
form of structuring decision problems. The goal of a decision problem is stated on the
first level (followed by criteria used for evaluation) and alternatives on the next lower
level of the hierarchy. The arrows indicate the way comparisons are carried out. Crite-
ria are pairwise compared with respect to the goal to establish the importance of each
criterion; then alternatives are pairwise compared with regard to each criterion. On the

13
right side of Figure 4, a network model is shown where elements are freely arranged
and connected to each other, instead of the AHP’s linear structure (Saaty, 2009).
Hence, ANP models allow simulating feedback loops and interdependencies between
all elements, representing a more realistic scenario of complex decision-making.
Figure 4: Structures of AHP and ANP (Source: Saaty and Vargas, 2001)
An essential characteristic of ANP is the way in which pairwise comparisons are
conducted. Saaty introduces the term control criterion to describe an element, which
serves as a common denominator when two elements are compared to each other.
This signifies that all elements can be pairwise compared to each other when they
have common feature towards a third element serving as basis. Thus, alternatives can
be pairwise compared to a criterion, and criteria can be pairwise compared to a alterna-
tive. This was not possible with the AHP method where all elements were compared
based on a top-down approach. To structure detailed ANP models wisely, Saaty intro-
duces clusters, which refer to grouping of homogenous elements together, such as al-
ternatives, criteria, and subcriteria. Determining the relationships between all elements
leads to outer dependencies as well as inner dependencies between clusters of the
ANP, as shown on the right hand side of Figure 4.

14
The Fundamental Scale for Making Comparisons with Judgments
In order to obtain priorities, which resemble human decision logic most accu-
rate, two measurement systems are used: absolute and relative measurement sys-
tems, with the intention of deriving ratio scales. For absolute measurements, rating
standards are established and elements are compared once at a time against the
standards. An example of a standard are grades from A to F with which each letter rep-
resents a specific numerous value (Saaty & Vargas, 2001). Absolute measurements in
AHP and ANP are used when certain ideals already exist and alternatives can be rated
against them.
Table 2: Fundamental Scale of Judgments (Source: Saaty and Vargas, 2001)
Intensity of importance
Definition Explanation
1 Equal importance Two activities contribute equally to the objective.
2 Weak 3 Moderate importance Experience and judgment slightly fa-
vor one activity over another. 4 Moderate plus 5 Strong importance Experience and judgment strongly
favor one activity over another. 6 Strong plus 7 Very strong or demonstrated
importance An activity is favored very strongly over another; its dominance demon-strated in practice.
8 Very, very strong 9 Extreme importance The evidence favoring one activity
over another is of the highest possi-ble order of affirmation.
Reciprocals of above
If activity i has one of the above nonzero numbers assigned to it when compared with activity j, then j has the reciprocal value when compared with i.
A reasonable assumption.

15
A more common approach, however, is the application of relative measure-
ments. In this approach, two elements are compared with respect to a common proper-
ty, and a ratio is assigned accordingly. Saaty and Vargas (2001) suggested a funda-
mental scale with integers between one and nine to express the nature of the prefer-
ence between two elements with a quantitative judgment. Table 2 gives the quantitative
and qualitative description for the intensities of importance.
Using the fundamental scale, a specific value representing the intensity of im-
portance is assigned to element ! when compared to element !. Then, element ! auto-
matically receives the reciprocal value when compared to !. Performing pairwise com-
parisons for all elements with respect to a common feature results in a consistent recip-
rocal matrix of judgments:
! = (!!") with !!", !!" = !!!"
and !!! = 1,
where ! represents the row elements, ! the column elements of the matrix and !!" the
importance of the !th element compared to the !th element (Chung, Lee, and Pearn,
2005). Saaty and Vargas (2001) discuss the significance of the comparison matrix for
developing an estimate of the relative importance of all elements by deriving a local
priority vector, which will from now on referred to as !"#$%&$'()* !. In general, the pri-
ority vector is obtained by solving the following equation (Chung et al., 2005):
! ∗ ! = !!"# ∗ !,
where ! is a matrix of pairwise comparisons, ! is the eigenvector, and !!"# is intro-
duced as the largest eigenvalue of !. The derivation of the eigenvector approach to
obtain the relative importance of elements, as well as the procedures for how to ap-
proximate the eigenvector ! are extensively elaborated on in Saaty’s comprehensive
literature involving AHP and ANP from 2001, 2005, and 2009.

16
The eigenvector solution emphasizes the relevance of consistency when mak-
ing judgments. However, the way humans make decisions leads to inconsistencies,
and with this solution the inconsistency of each comparison matrix can be measured as
a percentage. Saaty and Vargas (2001) define a maximum value of 10% as accepta-
ble. If the inconsistency ratio is higher than the upper limit, judgments should be re-
vised; otherwise, false conclusions might be drawn. For details on the mathematical
determination of the measurement of consistency and inconsistency, the reader can
refer to Saaty’s and Vargas’ book from 2001: “Models, Methods, Concepts and Appli-
cations of the Analytic Hierarchy Process.” The employed ANP software in this thesis
provides a function to monitor and reduce inconsistencies. It shall be indicated, that all
computations throughout this project conform to the maximal inconsistency index of
10%.
The following section describes how the eigenvector solution is used to obtain
priorities for criteria and alternatives. For this purpose, Saaty’s (2004) concepts of the
“supermatrix,” “clustermatrix,” and “limitmatrix” are introduced.
The Supermatrix Concept
All priority vectors derived from the comparison matrix are entered as column
vectors with respect to their control criterion into a new matrix called the supermatrix
(Saaty, 2004). Saaty introduced the supermatrix concept to model relationships and
interdependencies between elements in a system. Figure 5 shows a simplified network
structure with its corresponding supermatrix in which:
- !!" is a vector that represents the impact of the goal on the criteria,
- !!! is a matrix that represents an inner dependence between criteria,
- !!" is a matrix that represents the impact of detailed criteria on control criteria,

17
- !!! is a matrix that represents an inner dependence between subcriteria,
- !!" is a matrix that represents the impact of criteria on each of the alternatives,
- ! is the identity matrix (Chung et al., 2005).
Note that all fields where elements do not have influence on each other are filled with
zeros.
Figure 5: Network Structure with Generalized Supermatrix (Source: Chung et al., 2005)
For the Analytic Network Process, it is necessary to distinguish between two
phases of the supermatrix: The unweighted and weighted supermatrix. When the su-
permatrix is obtained, its columns consisting of local priority vectors commonly sum up
to a value greater than one. The reason for this are the interdependencies between
clusters in a network structure. Spoken in mathematical terms, the supermatrix does
not fulfill the requirement of stochasticity, which is necessary to obtain final priorities.
Thus, the supermatrix is called an unweighted supermatrix and requires a weighting
process that leads to unity in each column of the matrix (Chung et al., 2005). For a de-
tailed mathematical explanation of the stochasticity specification, refer to Saaty’s “Fun-
damentals of the Analytic Network Process - Dependence and feedback in decision-
making with a single network” (2004).

18
In order to reduce the supermatrix to a column stochastic matrix, Saaty (2004)
suggests comparing all clusters with influence on each other in a pairwise manner with
respect to a common property they share. Again, this results in multiple comparison
matrices and eigenvectors can be derived to determine the influence of the clusters. A
new matrix, called the clustermatrix, is developed by this approach, and for each col-
umn the eigenvector is multiplied by the elements of the respective block in the un-
weighted supermatrix. This results of weighting each column of the supermatrix is that
it sums up to one. Hence, this new matrix is called the weighted supermatrix and fulfills
the requirement of stochasticity, as mentioned earlier and described by Chung et al.
(2005).
The final transformation to obtain global priorities is the determination of a lim-
itmatrix through the exponentiation of the supermatrix by (2! + 1), where ! is a ran-
domly large number, until all columns of the limitmatrix display an equal number. This
process can only be performed by software applications. To acquire the final priorities
of the elements including the priority weights for all alternatives, each cluster is normal-
ized (Saaty, 2004).
In the following section, the computational steps of solving an AHP problem will
be described in detail with the example of a case study in SCM. In this case study, the
eigenvector and supermatrix computations required for the employed AHP model were
approximated. This demonstrates an effective example for gaining a better understand-
ing of the previous theoretical paragraphs on the working mechanics of AHP and ANP.
Computational Example of a Hierarchy Process Model
Saaty and Vargas (2001) suggests several methods to obtain final priorities of
alternatives through the supermatrix and limitmatrix transformations. An exact solution

19
can only be acquired by using a software application, but there are ways to approxi-
mate the eigenvector solution. This can be especially helpful to solve simple hierarchy
problems where software utilization would waste time and money. However, methods
of approximation can falsify the results and therefore should be used with caution. One
way to approximate the eigenvector solution is to normalize all columns of the compari-
son matrix and then average each row. This method shall be employed when calculat-
ing the final priorities in the following SCM case study.
Sapci and Pouraghabagher (2003) combine the Analytic Hierarchy Process with
the Quality Function Deployment analysis to utilize customer expectations for supplier
selection. The following example follows the approximation process for the synthesis of
a hierarchical model without the intention of providing details of the researchers’ supply
chain expertise. For additional information, the reader can refer to “A systematic ap-
proach for selection of suppliers through an integration of Quality Function Deployment
(QFD) and Analytical Hierarchy Process (AHP)” by Sapci and Pouraghabagher (2003).
The following computational steps were applied by Sapci and Pouraghabagher
(2003) in order to employ the AHP method in their case study:
1. Compare each supplier in pairs to the selection criteria once at a time (Step 1 of
Figure 6).
2. Normalize the matrix for each selection criterion (Step 2 of Figure 6).
3. Compare the selection criteria pairwise to each other based on the importance
of each criterion (Step 3 of Figure 7).
4. Normalize the criteria comparison matrix (Step 4 of Figure 7).
5. Synthesize the overall matrix.
6. Prioritize the suppliers.

20
Figure 6: Step 1 and 2 of AHP Process (Source: Sapci & Pouraghabagher, 2003)
Figure 7: Step 3 and 4 of AHP Process (Source: Sapci & Pouraghabagher, 2003)
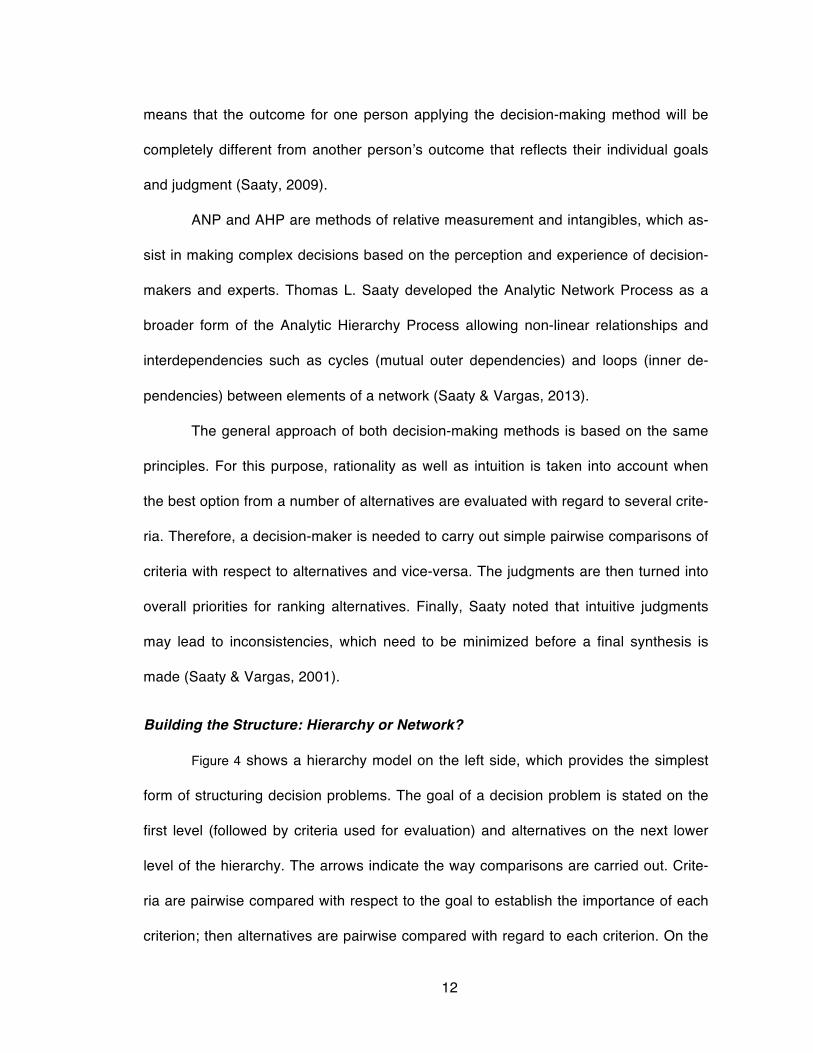
The supermatrix is compiled throughout Step 5. The matrix shows the suppliers
as rows and the selection criteria as columns. The priorities, which approximate the
21
eigenvector solution, are established by taking the average of each of the normalized
rows of the matrices in Step 2 and Step 4, resulting in the following matrix (Figure 8):
Figure 8: Supermatrix of AHP Process (Source: Sapci & Pouraghabagher, 2003)
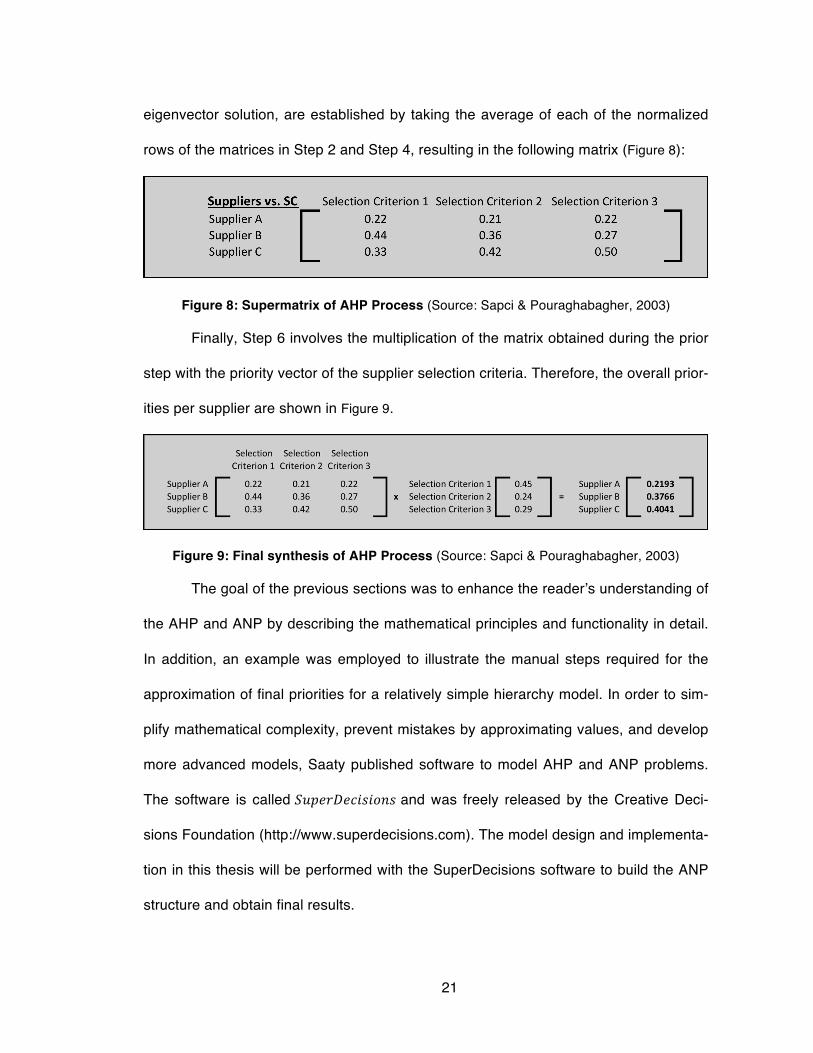
Finally, Step 6 involves the multiplication of the matrix obtained during the prior
step with the priority vector of the supplier selection criteria. Therefore, the overall prior-
ities per supplier are shown in Figure 9.
Figure 9: Final synthesis of AHP Process (Source: Sapci & Pouraghabagher, 2003)
The goal of the previous sections was to enhance the reader’s understanding of
the AHP and ANP by describing the mathematical principles and functionality in detail.
In addition, an example was employed to illustrate the manual steps required for the
approximation of final priorities for a relatively simple hierarchy model. In order to sim-
plify mathematical complexity, prevent mistakes by approximating values, and develop
more advanced models, Saaty published software to model AHP and ANP problems.
The software is called !"#$%&$'()(*+) and was freely released by the Creative Deci-
sions Foundation (http://www.superdecisions.com). The model design and implementa-
tion in this thesis will be performed with the SuperDecisions software to build the ANP
structure and obtain final results.

22
The next section will provide an overview of how the ANP method can be used
to make decisions based on an assessment of benefits, opportunities, costs, and risks.
This approach will be applied to the proposed framework of this project.
ANP with Benefit, Opportunity, Cost, and Risk Merits (BOCR-ANP)
When modeling real life scenarios in order to make decisions, it is necessary to
compare alternatives based on positive and negative aspects. For example, when al-
ternatives are compared to the extent of a priority in beauty or importance, the resulting
values would be based on a positive scale. However, it might be necessary to make
judgments depending on which alternative is most costly, leading to negative prioritiza-
tion. In order to find the best overall solution, both positive and negative values have to
be taken into account. Saaty (2009) developed a special form of the Analytic Network
Process to meet these requirements. A multiple layer model consisting of subnets for
benefits (B), opportunities (O), costs (C), and risks (R) networks will be introduced to
find the best alternative of each category. The results will then be combined by a for-
mula to account for the positive and negative priorities.
In order to model these fairly complex networks models, the SuperDecisions
software will be utilized. The following description of employing a multiple layer ANP
model with BOCR merits is based on the software application of SuperDecisions. In
every layer, a significant step towards the final goal of obtaining overall priorities for
alternatives is made. The layers are divided into a “strategic criteria network,” “control
criteria network,” and “decision network.” The first level introduces strategic criteria of a
decision, which are essential to help the decision makers assess whether a particular
decision should be made in terms of the overall goal and effected parties (Saaty,
2009). The next layer implements a hierarchy, or network, structure for each BOCR

23
merit with multiple criteria to allow the decision-maker to evaluate all significant influ-
ences of a merit. Elements are compared pairwise with the goal of identifying the most
beneficial, opportune, costly and risky alternatives. Priorities derived from the compari-
son matrix demonstrate which elements have the highest influence on the final deci-
sion. These elements are called control criteria, which serve as subnets for decision
networks in the final layer of the BOCR model. A decision network contains the alterna-
tives and criteria directly influencing them and thus builds the basis for obtaining the
final priorities of alternatives. To synthesize every BOCR merit, the software application
uses the local priorities of the decision networks and passes them to the next highest
layer. There they are weighed by the priorities of the control criteria network and added
up to finally emerge in a ranking of alternatives for each BOCR merit (Saaty, 2009).
Going back to the first layer in the model, the best alternative of every merit
(BOCR) is rated against the strategic criteria to find the final weight of each BOCR mer-
it. These weights are introduced as “b” for the Benefits merit, “o” for the Opportunities
merit, “c” for the Costs merit, and “r” for the Risks merit. The reason for using a rating
system is to encourage giving each BOCR merit individual importance based on the
subjective evaluation of strategic criteria. This approach helps to improve the decision-
making model based on a real world scenario where cost considerations might be more
relevant than potential benefits, opportunities, or risks.
The final answer for the best overall strategy is realized when positive priorities
of the benefits and opportunities merits and negative priorities of the costs and risks
merits are combined through a formula. Two formulas have been introduced in BOCR-
ANP applications to account for negative priorities (Saaty, 2009): The multiplicative (ra-
tio) and additive (total) formula. For the additive formula, the ratings of each merit

24
(!, !, !, !"# !) are multiplied with the ideal priorities obtained for every alternative ! in
the specific merit (!,!,!, !"# !). The multiplicative formula does not use the weights
(!, !, !, !"# !) since they would cancel out when the obtained results are normalized.
!""#$#%& !"#$%&' = ( !!! + !!! − !!! + !!! )
!"#$%&#%'($%)* !"#$%&' = !! ∗ !!!! ∗ !!
In general, results gained with the additive formula represent the best alterna-
tive under long-term considerations, whereas the multiplicative formula suggests the
best short-term solution (Saaty, 2009).
In conclusion, the BOCR-ANP approach helps to make decisions based on an
evaluation of multiple criteria categorized into benefit, opportunity, cost, and risk merits.
The objective of this research is to employ the BOCR-ANP approach to identify critical
products of a company and match them with ideal supply chain disruption mitigation
strategies. The next chapter will describe the design and implementation of the pro-
posed research method.

25
3. MODEL DESIGN AND IMPLEMENTATION
Referring back to the objective of this research, an Analytic Network Process
model shall be developed to match key products of a company with optimal supply
chain disruption strategies. For this purpose, the proposed framework is based on two
main models organized in multiple levels. The initial network process ranks products of
a company based on multiple criteria, assisting the analyst in selecting products that
are critical for the organization. Then, for these key products, a BOCR-ANP model
evaluates different disruption mitigation strategies based on an assessment of benefits,
opportunities, costs, and risks. The following sections specify assumptions of the pro-
posed research method, and describe its design and implementation in detail.
3.1 Model Assumptions
Before the proposed research method is described in more detail, assumptions
need to be defined. Assumptions are necessary to obtain plausible results and interpret
them correctly. In this research, assumptions made can be differentiated into input-
specific assumptions and process-specific assumptions. The following paragraphs fur-
ther explain these two categories.
Input-specific Assumptions
In general, the typical user would be a manufacturing company which is prone
to disruptions in their supply chain or production facilities and which needs a tool for
product prioritization and disruption strategy matching. It shall be assumed that prod-
ucts can be compared to each other with regard to multiple criteria. This requires com-
parable product structures, also referred to as the bill of materials (BOM), and sourcing
practices. For example, the proposed method will not be significant for products con-

26
sisting of hundreds of subassemblies, parts, or raw materials due to a high sourcing
complexity, which cannot be modeled properly. In this research, an ideal test environ-
ment is assumed, characterized by a simple BOM structure. Good examples for such
products and companies are be found in the steel forging or semiconductor industries.
When evaluating strategies based on the BOCR assessment, it shall be as-
sumed that they are in general suitable and realizable for the specific product. The cri-
teria used to compare the disruption mitigation strategies must be applicable to at least
one of the alternatives; otherwise, they shall be removed from the ANP model. Addi-
tionally, referring to the sourcing practices of raw materials and parts, only first-tier
supply chain partners shall be considered when deciding on strategies for supply chain
disruption mitigation.
Process-specific Assumptions
Process-specific assumptions refer to the decision-making methodology of the
ANP and its consequences. A decision-maker expresses judgments in ANP through
pairwise comparisons of criteria and alternatives using the fundamental scale from one
to nine. This may lead to inconsistencies because human judgment is based on opin-
ions and changes depending on the elements that are pairwise compared. This can be
further explained by an example: a user determines element “X” to be twice as im-
portant as element “Y,” “Y” to be three times as important as “Z,” but “X” only five times
as important as “Z.” This results in an inconsistency because the mathematical solution
would automatically define “X” as six times more important than “Z.”
Inconsistencies represent a necessity when modeling human decision-making
since they express the human ability to learn and comprehend complexity. Neverthe-
less, large inconsistencies could lead to wrong decisions. One process-specific re-

27
quirement is therefore that inconsistencies are kept at a minimum. Fortunately, when
specific ANP software, such as SuperDecisions, is utilized, the inconsistencies in the
ANP model are expressed and calculated through a value called the “Inconsistency
Index.” This value shall be kept at a maximum of 10%; otherwise, pairwise compari-
sons need to be adjusted. For more details of the concept of inconsistency in ANP, the
reader should refer to Saaty and Vargas (2001).
In general, a decision-maker carries out comparisons based on individual judg-
ment and expertise. Therefore, the user should not only be knowledgeable about the
theory and functionality of ANP but also about the company’s capabilities. A lack of
theoretical as well as practical competence could result in wrong conclusions. After all
assumptions are made, the design for the suggested research method can be devel-
oped.
3.2 Design of Multiple Level ANP Model
This chapter will describe the design of the proposed research method based
on a multiple-level ANP model. To refresh the intention of this thesis, the following par-
agraph summarizes the objectives and general approach for the suggested design.
In general, after a disaster paralyzes a company’s production system or supply
chain, the company will not be able to recover all processes simultaneously due to lim-
ited resources. As an integral step of BC/DR planning for supply chains, it is therefore
crucial for companies to identify critical processes and products. Often, the importance
of products is evaluated solely based on the generated revenue, while other important
measures are neglected. Torabi et al. (2014) introduced a set of tangible and intangible
measures that should be considered when ranking products in terms of their priority for

28
recovery (Table 3). These measures will be defined as an input for the initial network
model, which identifies the key products of a company.
After critical products of a company are identified, the following step in BC/DR
planning involves the assessment of recovery strategies. Tomlin (2006) identified sev-
eral tactics specifically for managing disruption risks in supply chains. He categorized
them into financial and operational mitigation strategies, as well as operational contin-
gency strategies. The question of which single strategy or combination of multiple
strategies a company chooses to implement depends on the company’s interest in
BC/DR planning as well as their willingness to invest in it financially. Hence, an ANP
model based on the evaluation of benefits, opportunities, costs, and risks shall be in-
troduced to find the overall best supply chain disruption strategy from a set of strate-
gies introduced by Tomlin (2006). As a result, combining the two described consecutive
steps of BC/DR planning within one decision-making tool leads to a multiple-level ANP
model.
The flowchart diagram (Figure 10) outlines all process steps for the proposed re-
search framework. After the ANP has been designed, the model can be implemented
with the ANP software, SuperDecisions. White rectangles in Figure 10 represent activi-
ties carried out by the decision-maker via the ANP software. The colored (blue, red,
green, and orange) boxes depict ANP computations performed by the software. All
process steps will be described in detail in the next chapter when the proposed design
is implemented. In general, the flowchart in Figure 10 describes the logical sequence of
steps required to set up the proposed ANP model. However, when the SuperDecisions
software is employed to model the fairly complex ANP, the logic flow is interrupted. A

29
software-specific requirement of SuperDecisions is that every judgment procedure re-
quires its own layer or level in the software.
Figure 10: Flowchart for Multi-Level ANP Model Design
In this thesis, there are a minimum of four judgment procedures necessary in
order to:

30
• Identify critical products (compare to process step 4 in Figure 10)
• Select control criteria (process step 8 in Figure 10)
• Rank disruption mitigation strategies (process step 12 in Figure 10)
• Evaluate strategic criteria (process step 15 in Figure 10)
Thus, several layers are necessary to implement the proposed design with the
SuperDecisions ANP software. In order to build and connect levels to each other in the
ANP software, so-called “subnetworks” are introduced.
Figure 11: Implementation of ANP via Multiple Levels with SuperDecisions

31
Figure 11 illustrates the setup and structure of the multiple level ANP suggested
for this project. Level 1 is built upon a network process to identify critical products. Eve-
ry key product is then connected to a subnetwork containing the four BOCR merits in
Level 2. Again, each BOCR merit will be linked to a subnetwork containing control crite-
ria networks assigned to each merit, representing Level 3 of the proposed model. Final-
ly, significant control criteria are once again connected to subnetworks containing the
decision networks in Level 4. In conclusion, the proposed ANP model will result in a
multiple-level network consisting of a first-level, at least four second-levels (4 BOCR
merits per key product), and many third- and forth-levels. Figure 11 illustrates each lev-
el, a description of the specific input, process, and output (IPO), as well as a software
screenshot. The IPO connects the process steps of Figure 10 to each level implement-
ed in the SuperDecisions software.
3.3 Implementation of Multiple Level ANP Model
This chapter will describe the implementation process of the proposed multiple-
level ANP model design. For this purpose, the ANP software “SuperDecisions” is em-
ployed to model all process steps, as illustrated earlier in the flowchart of Figure 10.
Subsequently, sections of the flowchart are used to introduce the implementation of
each process step in detail. In general, each process step will describe a detailed pro-
cedure of implementing the suggested ANP design so future users may employ and
modify the methodology individually. It will then be explained how the design is imple-
mented specifically for the scope of this thesis.
Figure 12 illustrates a section of the overall flowchart zoomed in to Process
Steps one through six, which will be specified in the following paragraphs.

32
Figure 12: Zoom into Flowchart (Process Steps 1-6)
Process Step 1
In Process Step 1, alternatives for the ANP are selected. In this initial ANP
model, the alternatives are the products of a company or business unit, which are in
the end ranked. There is no limit to the quantity of products that can be input into the
ANP framework. A requirement for input is, however, that the products can be com-
pared to each other with respect to specific criteria that will be chosen in the subse-
quent process step. In this case, the input could be a list of products that are to be
ranked. As an example in this thesis, there were four products selected, referred as to
Product A, Product B, Product C, and Product D.

33
Process Step 2
In Process Step 2, a decision-maker selects the criteria to rank products ac-
cording to their recovery importance or priority when a company faces disruption to its
supply chain. In this thesis, the criteria selected are based on Torabi et al.’s measures.
Torabi et al. conducted interviews with BC/DR experts and studied literature in this field
to come up with ten criteria to measure the importance of products (Torabi et al., 2014).
Table 3 names these criteria and includes a short description of what they entail.
Table 3: Criteria to Identify Key Products (Source: Torabi et al., 2014)
Criteria Description 1. Loss of revenue Lost sales in the event of supply chain and production
breakdown .
2. Loss of interested par-ties
Lost interested parties supports in the event of supply chain and production breakdown.
3. Defection of customers Loss of customers’ demands in the event of supply chain and production breakdown.
4. Higher insurance cost High compensation costs in the event of supply chain and production breakdown.
5. Degree of damage on company’s image and reputation
Lack of manufacturing famous products will permanently damage reputation of company.
6. Influence on markets Degree of losing markets for products in the event of sup-ply chain and production breakdown.
7. Importance of product for the country
Regulatory obligations when a product has an important role in country.
8. Influence on human resources
Number of staff are fired or become unemployed in the event of supply chain and production breakdown.
9. Rate of deviation from company objectives
Lack of manufacturing product influences company’s ob-jectives .
10. Loss of technological level of company
Ability of developing product will be lost in the event of supply chain and production breakdown.

34
Process Step 3
With the alternatives and criteria selected in the two previous steps, the network
structure of the ANP can be developed. First, the user categorizes criteria and
alternatives in clusters. A cluster is, in general, a group of homogenous elements which
can either be criteria or alternatives. As a next step, connections are made between
elements that influence each other. These relationships, which are triggered by
feedback and dependecies between specific elements, result in arrows between
clusters on the software interface. As a general rule, when connecting the first element
to the second element in the ANP software application, an arrow emerges pointing
from the second element to the first. This represents the way comparisons are carried
out later in the process. The following paragraphs describe how Process Step 3 will be
implemented in this research.
To start with, alternatives and criteria must be arranged in clusters. For this
purpose, three clusters are set up: one for the alternatives (products), one for
quantifiable criteria (criterion no. 1, 4, and 8 of Table 3), and one for unquantifiable
criterion (criterion no. 2, 3, 5, 6, 7, 9, and 10 of Table 3). Elements within these clusters
need to be connected to each other. For a better understanding of the connections
made in this research, Figure 13 shows a screenshot of the ANP structure. The grey
Boxes, labelled from A to C, represent clusters including alternatives and criterion,
respectively. Following Figure 13, the connections between elements of the clusters will
be described in more detail.

35
Figure 13: Screenshot of ANP to Identify Key Products
In the above shown network structure, the alternatives cluster (Box A) and each
criterion cluster (Boxes B and C) are connected by double sided arrows. This implies
that Products A, B, C, and D (Box A) are influenced by the elements in the
“Quantifiable” cluster (Box B) and “Unquantifiable criteria” cluster (Box C), and vice-
versa. The arrow between the two criteria clusters (Box B and C) indicates that
elements of Box B impact elements of Box C. More specifically, “1. Loss of revenue”
(Criterion 1 of Table 3, Figure 13) affects the, “5. Degree of damage on company’s
image and reputation,” (Criterion 5 of Table 3 and Figure 13) and, “Rate of deviation
from company objectives,” (Criterion 9 of Table 3 and Figure 13) respectively. The arrow
making a loop in the “Unquantifiable Criteria” cluster (Box C) demonstrates an inner

36
dependence between elements in this cluster. Again, Criterion 5 and 9 are affected by
Criterion 2 and 3.
Process Step 4
After the network structure is set up, a decision-maker can conduct pairwise
comparisons between criterion and alternatives with the goal of ranking the products.
Comparisons originate from connected elements, as described in the previous process
step; therefore, it is crucial that the network structure is set up correctly. In order to
compare elements pairwise with respect to a commonality, the analyst applies Saaty’s
fundamental scale of one to nine. For further explanation of the functionality of ANP,
please refer back to a detailed description of the ANP process in Chapter 2.3.
Figure 14 shows how comparisons can be conducted in the ANP software appli-
cation. For example, Product A is considered to be eight times more important than
Product B with respect to Criterion “1. Loss of revenue.” After comparisons are made,
priority vectors for criteria and alternatives can be derived. This will be part of the next
process step.
Figure 14: Pairwise Comparisons for Critical Products in SuperDecisions Software

37
In this thesis, Products A, B, C, and D are compared in pairs with every con-
nected element in the quantifiable and unquantifiable criteria cluster. Since there is
more than one criteria cluster in this network, clusters can be pairwise compared as
well. In general, this is done when a difference in importance between the two clusters
is demonstrated. In this specific example, quantifiable criteria are evaluated as twice as
important as unquantifiable criteria.
Process Step 5
In Process Step 5, ANP software is employed to obtain the final priorities for
each alternative. Computational steps include the weighting of priority vectors for crite-
ria and alternatives with cluster priorities, and exponentiating the supermatrix to obtain
the final limitmatrix. From there, the idealized priorities are normalized, and hence a
ranking of products is synthesized. Again, these process steps were discussed in detail
in Chapter 2.3, "Analytic Network Process.”
In this investigation, outputs of the software calculations are shown in Table 4.
Each product has an assigned “Ideal,” “Normal,” and “Raw” priority. In general, priori-
ties obtained in SuperDecisions matrix are displayed in three ways. “Raw” values are
derived directly from the limitmatrix, “Normal” values are “Raw” values normalized per
cluster, and “Ideal” values are obtained by dividing the “Raw” or “Normals” by the
largest value.
Table 4: Product Ranking Based on Obtained Priorities

38
Results of Table 4 emerge from the stochastic supermatrix and limitmatrix com-
puted in the SuperDecisions software. The reader can refer to these matrices in Ap-
pendix A (p. 77).
Process Step 6
After ranking the alternatives in the previous process step, a decision-maker
can now select the critical products. A requirement is the definition of a threshold value,
which categorizes products as either critical or non-critical. This represents an essential
step for proceeding to the next ANP model. For key products only, disruption mitigation
strategies will be assessed regarding their benefits, opportunities, costs, and risks.
Non-critical products will not be further considered in this ANP project.
In this research, a minimum value of 25% was set to categorize products as
critical and non-critical. This means that all products that achieve a normalized priority
higher than 25% will be considered as critical. Referring back to the results of the pre-
vious process step shown in Table 4, Product A and Product C are determined to be
key products. Thus, for these two products a new ANP model will be created with the
goal of finding optimal disruption mitigation strategies. Products B and D do not qualify
for further considerations in the proposed decision-making process.
Figure 15 illustrates the flowchart for Process Steps seven through twelve. It is
important to mention that all succeeding process steps in this implementation will be
performed twice, since the previous step identified both Products A and C as critical.
However, the process implementation will only be spelled out for the example of Prod-
uct A.

39
Figure 15: Zoom into Flowchart (Process Steps 7-12)
Process Step 7
A requirement for Process Step 7 is the start of a new ANP model with the goal
of evaluating supply chain disruption mitigation strategies based on their benefits, op-
portunities, costs, and risks. Thus, Product A is connected to a new subnetwork in or-
der to implement the ANP structure. Process Step 7 includes the set-up of criteria hier-
archies for each BOCR merit. For a detailed description of the working mechanics of
the BOCR-ANP, the reader should refer back to Chapter 2.3.
The first step towards a BOCR-ANP model is the set-up of each BOCR merit
subnetwork. A decision-maker usually structures the merits according to a hierarchy
model including a goal node and multiple criteria/subcriteria specific to each BOCR

40
merit. In general, the goal of every BOCR network is the identification of control criteria.
Control criteria are defined as criteria, which strongly influence the final outcome. A re-
quirement for a criteria input is that each criterion must be applicable to at least one of
the alternatives but not necessarily to all of them. In this thesis, the following criteria,
shown in Figure 16, were selected as inputs and connected to a goal node in each
BOCR network.
Figure 16: BOCR Control Criteria Hierarchies
Process Step 8
In each BOCR merit, a decision-maker pairwise compares criteria with respect
to goals, which vary according to each merit. For example, for the benefits merit, the
goal is to identify the most beneficial criteria when evaluating disruption mitigation
strategies. Likewise, the goal of the other merits is to find the most opportune, costly
and risky criteria respectively. Pairwise comparisons will then result in highest priorities
for the most influential criteria (control criteria) of every merit. In general, the reason for
identifying control criteria is for them to be connected to subnetworks in the following

41
process steps. In these subnetworks, called decision networks, the alternatives will be
finally compared with respect to multiple criteria influenced by each control criteria. As
before, pairwise comparisons carried out in the SuperDecisions software are based on
Saaty’s and Vargas’ (2001) fundamental scale. Figure 17 shows an example of pairwise
comparisons run for the benefits merit with the goal of identifying the most beneficial
criteria.
Figure 17: Pairwise Comparisons for Control Criteria of Benefits in SuperDecisions
Process Step 9
Again, in Process Step 9, the ANP software is employed to obtain the final pri-
orities for each criterion. Computational steps include the weighting of priority vectors
for criteria with cluster priorities and exponentiating the supermatrix, which results in
the final limitmatrix. From there, the idealized priorities are normalized and hence a list
of criteria with their priorities is synthesized. In this project, synthesis by the SuperDe-
cisions software leads to the priorities, which were normalized per merit and are shown
in Table 5. For computational details, please refer to Appendix B. The limitmatrices are
individually shown for all BOCR merits. From there, priorities for all criteria can directly
be derived.

42
Table 5: Priorities Obtained for Criteria in each BOCR Merit
Process Step 10
After the priorities for all criteria of the BOCR merits are obtained, the decision-
maker needs to select control criteria. As stated earlier, the term “control criteria” refer
to criteria, which influence the overall merit the most. As a general rule of thumb of
ANP, criteria or subcriteria obtaining priorities smaller than 3% should not be further
considered in the decision-making process. However, ANP users are able to determine
individual threshold values based on their personal evaluation and expertise. If criteria
are not determined to be control criteria, they will not further be considered in the deci-
sion-making process. The reason for this is that criteria with overall low priorities could
impact the outcomes negatively, and this must be prevented.
In this investigation, the decision has been made that all criteria obtaining priori-
ties equal or greater than 10% shall serve as control criteria. Referring back to Table 5,
all criteria qualify to the established threshold value in this research. Therefore, a sub-
network will be connected to each criterion containing decision network structures.
Merit Control criteria Local priorities Benefits Operational benefits 0.36 Financial benefits 0.54 Organizational benefits 0.10 Opportunities Competitive opportunities 0.33 Technological opportunities 0.67 Costs Cost of goods sold 0.16 Operating expenses 0.11 Disaster recovery cost 0.73 Risks External risks
Internal risks 0.80 0.20

43
Process Step 11
The next step includes setting up decision networks for each identified control
criterion. In general, decision networks are structured in the same way as usual net-
work models, consisting of criteria and alternatives. In this case, the alternatives are
represented by different supply chain disruption mitigation strategies, and criteria are
individual elements influencing the alternatives under each control criteria. Both sets of
elements are connected to represent the relationships and dependencies between
each other, and finally, pairwise comparisons are conducted.
In this thesis, all ten criteria of the BOCR merits (Table 5) were identified as con-
trol criteria. Consequently, ten decision networks need to be developed. Since the im-
plementation of this process step demonstrates a main part of the proposed research
design, the following paragraphs will describe the inputs (strategies and criteria) and
setup of each control criteria under the respective BOCR merits in detail.
In all decision networks, the same strategies will be evaluated based on differ-
ent criteria. For this project implementation, four strategies, widely used in BC/DR
planning shall be compared. Two of the mitigation strategies are based on Tomlin’s
research (2006), referred to in more detail in Chapter 2.2 “Overview of Business Conti-
nuity and Disaster Recovery Practices.” Subsequently, all strategies are described in-
dividually:
• Strategy 1: Establish a Supplier Network
Identify and collaborate with multiple suppliers for every key product to mitigate
disruptions in case one supplier cannot deliver. It shall be assumed that it is
possible to determine multiple suppliers for all critical products.

44
• Strategy 2: Carry Excess Inventory
Build up inventory to overcome a certain period of delivery disruptions. This
strategy is based on the assumption that there are no physical regulations that
hinder a company from carrying extra inventory.
• Strategy 3: Invent/Research/Invest in Technological Substitution
Identify new and/or different materials and/or technologies to produce critical
products. For this alternative it needs to be assumed that substitution is a tech-
nologically feasible possibility and that the company has access to appropriate
resources (funds, staff, and material).
• Strategy 4: Passive Acceptance
Accept the risk of supply chain disruptions and act only in response to disas-
ters. This approach represents the category of “risk acceptance” and is either
consciously or unconsciously chosen when there is little to no investment will-
ingness. Although this alternative may not represent a proper disruption mitiga-
tion strategy, it might be a valid risk response tactic for some companies. Since
this research model is based on a profound analysis of benefits, opportunities,
costs, and risks, this strategy might achieve higher priorities than other alterna-
tives.
These four strategies are included in a cluster for all the ten decision networks.
For each network, criteria were individually selected with respect to the control criteria.
The following paragraphs describe the setup of the decision networks, which will be
grouped according to their BOCR merit.

45
• Benefits Decision Network
Figure 18 shows the three decision networks for operational, financial, and or-
ganizational benefits. In addition to alternatives, each subnetwork contains cri-
teria specific to the corresponding control criteria.
Figure 18: Overview of Benefits Merit and Decision Networks
For example, the “Operational Benefits” network includes “Flexibility,” “Re-
sponse time,” and “Production downtime.” The connections between “Produc-
tion downtime” with respect to “Flexibility” and “Response time,” stem from a
higher probabilities of continuous production when the supply chain is charac-
terized by a fast response time and high flexibility. The “Financial Benefits” net-
work consists of two criteria clusters: “Decreased Cost” and “Increased Sales.”
Subcriteria of “Decreased Costs” are “Lower investment/capital cost,” “Lower
insurance cost,” and “Lower product/purchasing cost.” Thus the criteria are only

46
compared with respect to the strategies. The decision network for “Organiza-
tional Benefits” contains three criteria clusters. “Risk aversion” influences “Inde-
pendence,” and “Administrative effort” due to the consequences of enacting a
certain risk attitude. The relationship between these three clusters can be ex-
plained by the higher effort of avoiding disruption risks leading to a higher de-
pendence on suppliers and an increased administrative effort.
• Opportunity Decision Networks
Figure 19 illustrates the opportunities merit with its two decision networks for
“Competitive Opportunities” and “Technological Opportunities.” The first deci-
sion network consists of two criteria clusters for “Supplier Relations” and “Sales
Growth,” including subcriteria for “Product Diversification” and “New Market En-
try.” The connection between these two clusters can be explained through an
enhanced supplier relationship if the sales of a company increase. For example,
an organization may be able to extend their total available market by choosing
the technological substitution strategy. The “Technological Opportunities” net-
work is characterized by the subcriteria: “Improved processes through skipping
steps” and “New Product Introduction,” which are only connected to the strategy
cluster.
Figure 19: Overview of Opportunities Merit and Decision Networks
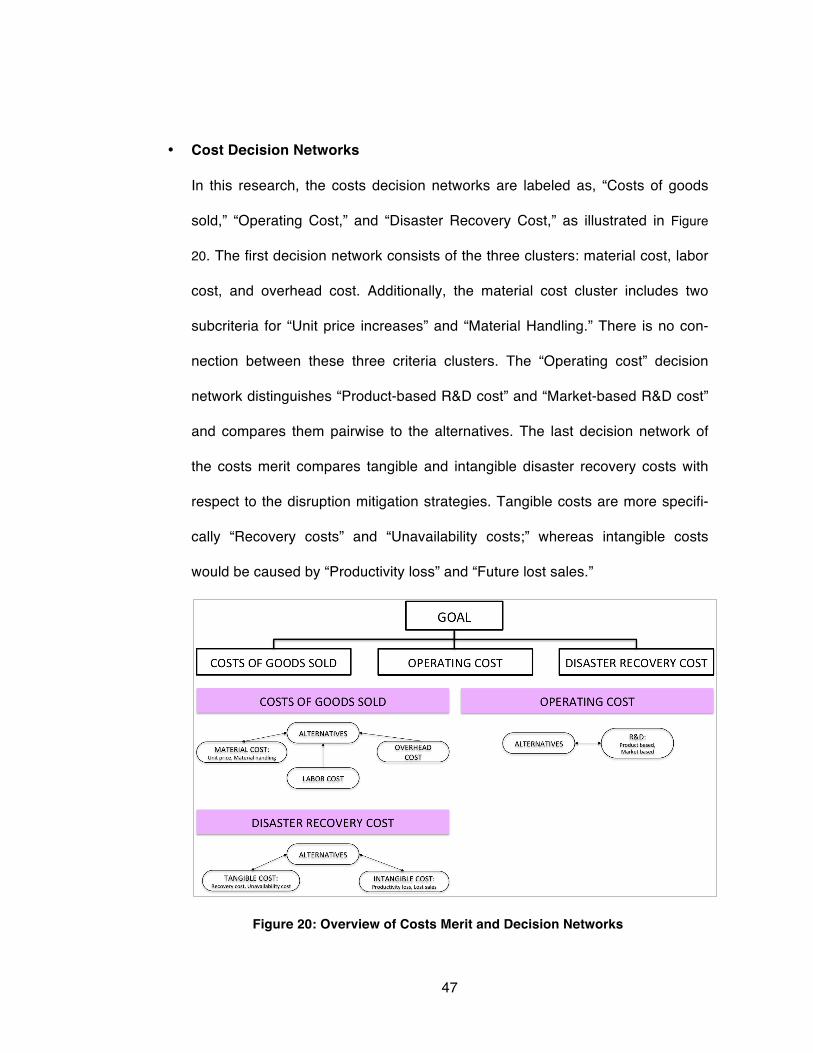
47
• Cost Decision Networks
In this research, the costs decision networks are labeled as, “Costs of goods
sold,” “Operating Cost,” and “Disaster Recovery Cost,” as illustrated in Figure
20. The first decision network consists of the three clusters: material cost, labor
cost, and overhead cost. Additionally, the material cost cluster includes two
subcriteria for “Unit price increases” and “Material Handling.” There is no con-
nection between these three criteria clusters. The “Operating cost” decision
network distinguishes “Product-based R&D cost” and “Market-based R&D cost”
and compares them pairwise to the alternatives. The last decision network of
the costs merit compares tangible and intangible disaster recovery costs with
respect to the disruption mitigation strategies. Tangible costs are more specifi-
cally “Recovery costs” and “Unavailability costs;” whereas intangible costs
would be caused by “Productivity loss” and “Future lost sales.”
Figure 20: Overview of Costs Merit and Decision Networks

48
• Risk Decision Networks
Figure 21 illustrates two decisions networks for the risks merit: external and in-
ternal risks. The external risks include a cluster for “Relations” with subcriteria
“Customer relations” and “Supplier relations” and a cluster for “Reputation.” The
“Internal risks” decision subnetwork includes the criteria “Financial risk” and
“Product Quality Decline.” All criteria clusters of the risks merit are directly con-
nected to the alternatives (disruption mitigation strategies). A summary of all the
ten decision networks sorted by each BOCR merit can be found in Appendix C.
Figure 21: Overview of Risks Merit and Decision Networks
Process step 11 demonstrates a major phase of this thesis’ proposed ANP
model. With these decision networks, the analyst will be able to carry out pairwise
comparisons with the goal to evaluate the different disruption mitigation strategies.
Process Step 12
After all decision networks have been set up, a decision-maker can conduct
pairwise comparisons according to all connected elements. Again, when making com-
parisons, the decision-maker has to keep the overall goal of the decision network in

49
mind. For example, for the decision networks of the benefits merit, the objective is to
identify the most beneficial disruption mitigation strategy. Likewise, for decision net-
works in the opportunity/cost/risk merit, the most opportune/costly/risky alternative
must be ranked highest. Pairwise comparisons are run the same way as described in
previous stages, such as in Process Steps 4 and 8.
Figure 22: Zoom into Flowchart (Process Steps 13-18)
Figure 22 highlights the succeeding Process Steps 13 – 18, which will be de-
scribed in the following paragraphs.
Process Step 13
Again, in Process Step 13, the ANP software is employed to obtain the alterna-
tives’ priorities for each decision network. Computational steps include the weighting of
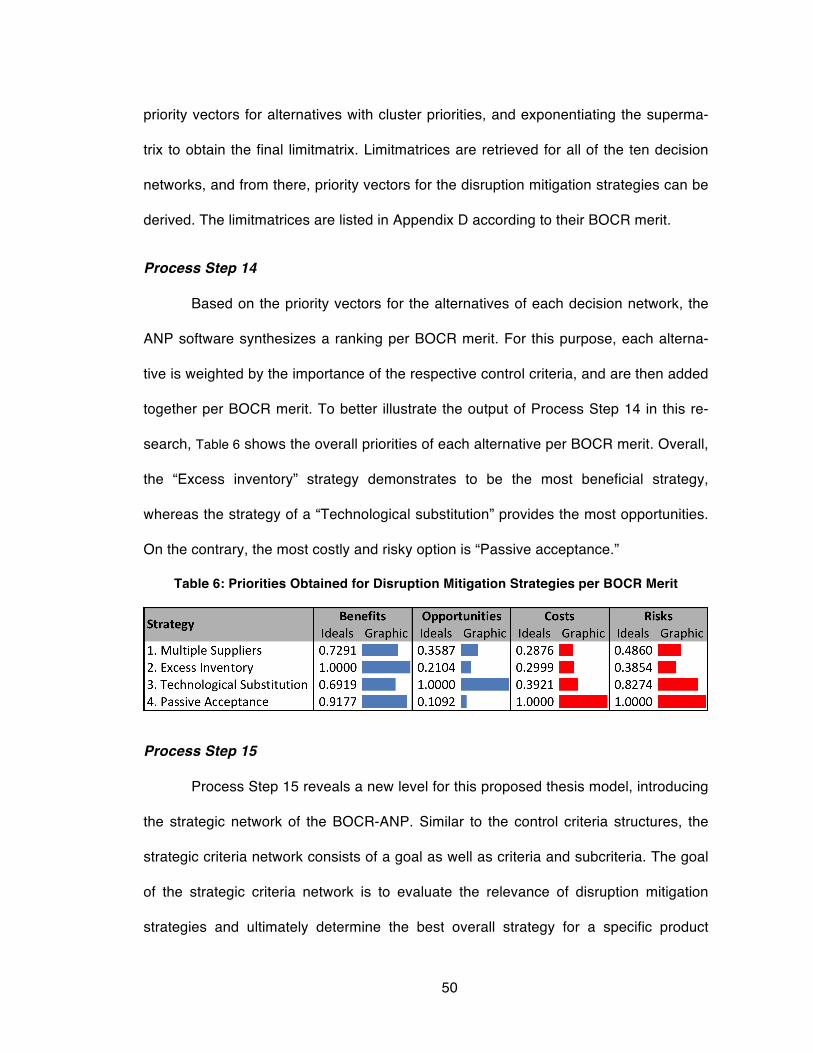
50
priority vectors for alternatives with cluster priorities, and exponentiating the superma-
trix to obtain the final limitmatrix. Limitmatrices are retrieved for all of the ten decision
networks, and from there, priority vectors for the disruption mitigation strategies can be
derived. The limitmatrices are listed in Appendix D according to their BOCR merit.
Process Step 14
Based on the priority vectors for the alternatives of each decision network, the
ANP software synthesizes a ranking per BOCR merit. For this purpose, each alterna-
tive is weighted by the importance of the respective control criteria, and are then added
together per BOCR merit. To better illustrate the output of Process Step 14 in this re-
search, Table 6 shows the overall priorities of each alternative per BOCR merit. Overall,
the “Excess inventory” strategy demonstrates to be the most beneficial strategy,
whereas the strategy of a “Technological substitution” provides the most opportunities.
On the contrary, the most costly and risky option is “Passive acceptance.”
Table 6: Priorities Obtained for Disruption Mitigation Strategies per BOCR Merit
Process Step 15
Process Step 15 reveals a new level for this proposed thesis model, introducing
the strategic network of the BOCR-ANP. Similar to the control criteria structures, the
strategic criteria network consists of a goal as well as criteria and subcriteria. The goal
of the strategic criteria network is to evaluate the relevance of disruption mitigation
strategies and ultimately determine the best overall strategy for a specific product

51
based on the assessment of benefits, opportunities, costs, and risks. The following
paragraphs describe how the strategic criteria network is implemented in this research.
For this purpose, seven criteria were selected to assess the significance of disruption
mitigation strategies. Table 7 categorizes these criteria into three groups and provides a
short description for each criterion.
Table 7: Strategic Criteria of BOCR-ANP Model
Cluster Strategic criteria Short description External influences
Increased probability of disasters (1)
Quantity and severity of disasters statisti-cally increased the last decades.
Globalization (2)
Companies and their supply chains be-come more global.
Competitive behavior (3)
Competitors invest in BC/DR strategies.
Internal influences
Growth/Long-term orientation (4)
Long-term plans of company might include more global approaches for sourcing, sell-ing or partnerships.
Consequences Profit (5)
Disasters might have long-term impact on profit.
Image (6)
Corporate image might suffer due to lack of precautions taken.
Stakeholders (7) Abandonment of interested parties.
With reference to Table 7, each criteria shall be discussed further regarding its
relevance to make a decision about investing in BC/DR practices. For example, the ge-
ographical location of a company as well as the location of supply chain partners shall
be taken into account. Since some countries are especially prone to disasters, organi-
zations in these countries show a higher willingness to invest in resilience. However, a
company should also consider the overall increased probability and severity of disas-
ters (Strategic Criterion 1, Table 7). Additionally, businesses face global interactions

52
(Strategic Criterion 2) on a daily basis, which is another indicator for the need for a
more elaborate disaster planning process. Proactive planning and investing in disrup-
tion mitigation strategies might lead to competitive advantages (Strategic Criterion 3),
and thus companies should consider an investment. In summary, Criteria 1 through 3
are external influences triggering a company’s investment in resilience practices.
Further, internal impacts exist that a company should consider when making
decisions about BC/DR management. For instance, investing in a broader supplier
network might lead to collaborations and change the long-term orientation and thus
projected growth strategy of a company (Strategic Criterion 4). Eventually, conse-
quences will be taken into account when deciding about an investment in disruption
mitigation strategies. A production disruption due to a disaster might lead to a decrease
in profit (Strategic Criterion 5), a negative influence on the company’s reputation (Stra-
tegic Criterion 6), and lost interest of stakeholders (Strategic Criterion 7).
After choosing appropriate criteria, the network structure can be set up. Again,
clusters are used to gather similar criteria, and connections between elements are
made. Figure 23 shows a screenshot of the strategic criteria network of this project in
the SuperDecisions software. There are two relationships that are noteworthy. The first
one is an inner dependence in the “consequences” cluster, which stems from negative
effects on concerned stakeholders (Strategic Criterion 7), on the profit (Criterion 5), and
on the company image (Criterion 6) during a production interruption. The outer de-
pendencies between the elements: “Growth/Long-term orientation” (Strategic Criterion
4) and “Image” as well as “Stakeholders” (Strategic Criteria 6 and 7) refer to a potential
impact on the long-term development of a company, depending upon how the company
is perceived by the public and by third parties.

53
Figure 23: Screenshot of Strategic Criteria Network
As a next step, strategic criteria are pairwise compared against one another ac-
cording to their connections. This leads to the priorities illustrated in Figure 24, which
will be employed to individually rate the BOCR merits during next process step.
Figure 24: Priorities Obtained in Strategic Criteria Network

54
Process Step 16
The goal of Process Step 16 is to rate the benefits, opportunities, costs, and
risk merits of the BOCR-ANP model in this thesis. Initially, each of the four merits will
contribute equally (25% each) to the final result. This will not necessarily represent a
realistic scenario where a user might prioritize cost considerations over possible bene-
fits or opportunities. Therefore, each merit will be rated against strategic criteria to de-
termine the overall importance of each merit. Rating standards will be applied to trans-
late a qualitative judgment into a numeric value.
In this research, the BOCR merits are evaluated according to the strategic crite-
ria introduced in the earlier process step (Table 7 and Figure 24). During the rating pro-
cess, the analyst refers to the highest ranked alternative of each merit, as shown in Ta-
ble 6, and rates it against each strategic criteria. For example, when comparing the
most beneficial alternative, “Excess inventory,” to strategic criterion no. 3, “Competitive
behavior,” the following question is asked: “How beneficial is it to choose excess inven-
tory with respect to the competitive behavior?”
In this example, the standard, “High,” is assigned because carrying excess in-
ventory, and thus ensuring a longer supply, could lead to a competitive advantage
while competitors face production unavailability. This rating procedure is repeated for
every criterion with respect to its merit. For this purpose, a numeric value assigned to
the verbal rating standard (Appendix E) is multiplied by the strategic criteria priorities
and summed. Finally, the obtained priorities are normalized for all merits. Table 8
shows the assigned rating values of the strategic criteria against the BOCR merits and
the final normalized priorities per merit in this project.

55
Table 8: Priority Rating of Strategic Criteria against BOCR Merits
Benefits Opportunities Costs Risks 1. Increased probability of disasters (0.11) 0.00 0.00 0.00 0.00 2. Globalization (0.04) 0.00 0.00 0.00 0.00 3. Competitive behavior (0.03) 0.71 0.71 0.05 0.05 4. Growth/Long-term orientation (0.06) 0.71 0.71 0.05 0.05 5. Profit (0.16) 0.24 0.71 0.24 0.00 6. Image (0.19) 0.71 0.00 0.24 0.00 7. Stakeholders (0.41) 0.00 0.00 0.00 0.05 SUM(Strategic criteria priority * Rating) 0.24 0.18 0.09 0.02
Normalized Priorities 0.45 0.34 0.17 0.04
Process Step 17
Process Step 17 entails the final computations to obtain the overall priorities for
all disruption mitigation strategies. Therefore, the “positive” priorities (of the benefits
and opportunities merits) for each alternative are combined with the “negative” priorities
(of the costs and risks merits) in a formula. Two formulas, introduced in Chapter 2.3,
can be employed to counterbalance the conflicting priorities. Referring back to the ANP
theory, the additive formula gives the best results based on long-term considerations,
whereas the multiplicative formula is favorable concerning decisions influencing the
near future.
In this thesis, both formulas were applied to come to a final conclusion. In both
cases, Strategy Number 3, “Technological substitution,” obtains the highest priority,
whereas Strategy No. 4, “Passive acceptance,” represents the worst option. The over-
all ideal priorities for each mitigation strategy are shown in Table 9.

56
Table 9: Synthesizing BOCR for each Alternative Using the Ideal Mode
Process Step 18
By now all necessary ANP calculations have been conducted, and final results
have been synthesized. As a final step, a sensitivity analysis shall be performed to val-
idate the adequacy of the decision process. In general, the goal of a sensitivity analysis
is to demonstrate how stable final results are to input changes. In the case of a BOCR-
ANP, an input is defined as the priority of each of the BOCR nodes. After confirming
the stability of the proposed decision-making model, the BOCR-ANP model ends. In
the next chapter, the proposed multiple-level ANP model is applied to a case study to
prove the applicability and effectiveness of this thesis research.

57
4. TESTING, EVALUATION AND DISCUSSION
This chapter describes the validation process for the generic research frame-
work developed in this thesis through a case study using historical data of a U.S. semi-
conductor company. For confidentiality reasons, the company is referred as to “Com-
pany XYZ”. The case study was conducted in collaboration with a BC/DR-expert of
Company XYZ. In addition, this chapter compares the positive attributes of the pro-
posed model with limitations of the generic method, and limitations encountered during
the implementation process.
4.1 Case Study
For the case study, an expert in the field of BC/DR management with several
years of experience in the semiconductor industry determined the input data and con-
ducted comparisons through the proposed multi-layer ANP model. The data-gathering
process was enforced in two steps, as shown in Figure 25.
Figure 25: Data Gathering for Input of ANP Models

58
First, the expert filled out a questionnaire to determine the inputs required for
setting up the ANP model (Appendix F). The researcher then customized the ANP
model specifically to the requirements of the user. For reasons of simplification, the ge-
neric model, developed and described in the previous chapter, was adjusted to the us-
er-specific inputs. As a next step of this case study, an interview with the expert was
conducted to directly carry out comparisons within the ANP software model. The follow-
ing two sections first describe the ANP input and process, and then the output of this
case study.
Case Study: ANP Input and Process
With the help of the questionnaire, the critical product selection model was set
up in the SuperDecisions software. The decision-maker then compared products pair-
wise with respect to the selected criteria to identify the key products of his company.
Due to confidentiality reasons, the products are subsequently referred as to “Product A”
and “Product B.” The user chose “Dissatisfied customers” and “Loss of revenue” as
criteria to pairwise compare
his products.
Figure 26 shows a screenshot
of the ANP model developed
in the SuperDecisions appli-
cation. The arrows on the
software interface demon-
strate the relationships be-
tween cluster elements. In
Figure 26: Screenshot of "Key Product Selection" Net-work (Case Study)

59
this specific case, there is an inner dependence between the two selection criteria. This
can be explained by the influence of dissatisfied customers on potential future sales.
When the ANP model was set up in SuperDecisions, the expert was asked to conduct
pairwise comparisons with the result that Product B obtained higher priorities than
Product A, with 68.3% versus 31.7% priority respectively. Thus, the case study expert
decided that an assessment of disruption recovery strategies should only be employed
for Product B.
The user then proceeded with the second ANP model to find an optimal strate-
gy to mitigate supply chain disruptions for his Product B. He chose to compare two
strategies, based on their usefulness for his business. The strategies were “Build a
supplier network” and “Establish a technological substitution.” Again, the BOCR-ANP
model was set up specifically to the inputs determined through the questionnaire. To
enhance the readers understanding, all necessary network structures including their
inputs and relationships between elements will be described in detail in the following
paragraphs.
Figure 27 shows the control
criteria network of “Bene-
fits.” The model consists of
three clusters for operation-
al, financial, and organiza-
tional benefits. The opera-
tional benefits cluster con-
tains the nodes increased
Figure 27: Screenshot of Benefits Merit (Case Study)

60
flexibility, uninterrupted production,
and faster response time. Finan-
cial benefits are described trough
a “Minor investment in R&D.”
“Less required administrative ef-
fort” is the main criterion for organ-
izational benefits.
For the opportunities merit, the expert decided on a network with a cluster for
competitive and technological opportunities. As illustrated in Figure 28, criteria are “Im-
proved supplier relations” and “New product development” respectively.
Figure 29 shows the costs merit with three criteria clusters. The node “Price per
unit increases” describes the first cluster, “Costs of goods sold.” The second cluster,
“Operating expenses,” contains the criteria “Research and Development” and “Adminis-
trative expenses.” “Recovery cost” and “Unavailability cost” are criteria for the “Disaster
Recovery Cost” cluster.
As shown in Figure 30, the
risks merit contains two clus-
ters for external and internal
risks with the nodes “Dissat-
isfied customers due to
product unavailability” and
“Financial losses.” The
BOCR merits in this case
Figure 28: Screenshot of Opportunities Merit (Case Study)
Figure 29: Screenshot of Costs Merit (Case Study)

61
study display a relatively simple
network structure. Thus, the two
alternative strategies were input
as a cluster directly to each of
the BOCR merit networks.
With this ANP model set
up accordingly to the user’s in-
put, the expert was able to carry out pairwise comparisons in each of the BOCR merit
networks. To remind the reader, in the benefits and opportunities networks, the deci-
sion-maker compared elements to find the most beneficial or opportune disruption miti-
gation strategy for Product B. The goal of costs and risks networks, however, was to
identify the most costly or risky choice. After the expert expressed his judgments via
pairwise comparisons in each of the BOCR merits, the supermatrices and limitmatrices
were obtained in the SuperDecisions software. Appendix G provides details on the pri-
orities of each criterion of the BOCR merits. In addition, the supermatrices and limitma-
trices for the benefits, opportunities, costs, and risks nodes can be found in Appendix I.
As a note, the structure of the strategic criteria network was kept identical to the
generic model described in the previous chapter. The expert rated the BOCR merits
according to his judgment with respect to the strategic criteria. Details on the rating
procedure can be found in Appendix H.
Case Study: ANP Output
A final synthesis was run in the ANP software application applying two formulas
(additive and multiplicative) to retrieve overall priorities for each alternative. Table 10
shows the final results, indicating that the “Build a supplier network” strategy represents
Figure 30: Screenshot of Risks Merit (Case Study)

62
the best overall alternative. The strategy “Establish a technological substitution” results
in an overall negative priority when the additive formula is employed. This implies that
the negative priorities of the costs and risks merits dominate the outcome over the
positive benefits and opportunities merits. Thus, a technological substitution is not only
less favorable when compared to the supplier network strategy, but appears to be a
poor choice for Product B in general. When employing the multiplicative formula, which
gives the best short-term outcome, the hypothesis that the “Supplier network” strategy
is more favorable than the “Technological substitution” strategy is supported.
Table 10: Final Ranking of Disruption Mitigation Strategies for Product B
In order to validate the results obtained by the BOCR-ANP model, the re-
searcher performed a sensitivity analysis for each merit with the ANP software. In gen-
eral, the sensitivity analysis reveals how stable the highest ranked alternative is when
input parameters are changed. Figure 31 shows the sensitivity graphs for each BOCR
merit with red lines representing the supplier network strategy and blue lines represent-
ing the technological substitution strategy. In general, changing the priority for each
merit might lead to a change in the ranking of alternatives. However, in this case study,
the output remained stable for each of the four merits, proving that the “Supplier net-
work” is the preferred choice over the “Technological substitution” tactic for Product B.

63
Figure 31: Sensitivity Analysis for each BOCR Merit
A thorough analysis of the benefits merit exposed that under a priority rating of
0.3 (30%) the “Technological Substitution” strategy (blue line) results in a negative pri-
ority, which means that it is not beneficial to choose. A similar trend can be seen for the
opportunities merit. Only when costs and risks are compared, the sensitivity graph indi-
cates that the “Supplier network” (red line) obtains negative weights when priorities
over 0.55 (55%) are selected for each merit. The sensitivity analysis confirms the initial
conclusion that the “Supplier network” strategy is the best overall strategy for Product
64
B. In addition, the sensitivity analysis verifies the stability of the results obtained from
input changes in the proposed BOCR-ANP model. When the final results of this case
study were discussed with the expert, he confirmed that the supplier network strategy
was the favorable strategy based on his expertise and professional decision-making.
4.2 Discussion
Positive Attributes
In general, the Analytic Network Process demonstrates a strong method for de-
cision-making based on multiple criteria. It accounts for tangible and intangible factors
when judgments are made in order to come to a conclusion without solely relying on
just one measure or intuition. Additionally, the ANP provides a framework to justify in-
consistencies, which are a natural consequence of human decision-making. Compared
to other multi-criteria decision-making (MCDM) approaches, the ANP is especially use-
ful for organizations since it allows the reinforcement of management decisions with a
mathematical justification (Taslicali & Ercan, 2006). Another benefit is that ANP can be
used in combination with other tools to simplify and carry out managerial decision-
making based on the judgment of individual experts or a group of experts. With the
help of ANP software, such as the freely accessible SuperDecisions application, the
ANP method is relatively easy to apply to business problems. In conclusion, it can be
said that the Analytic Network Process represents a powerful tool when making deci-
sions in unstable, fast-changing environments such as BC/DR planning.
Referring to this research, the proposed methodology of employing the Analytic
Network Process is unique in two aspects. First, in the field of BC/DR planning, there
has been no tool developed to match critical products of a company with optimal dis-

65
ruption mitigation strategies. For this extensive investigation, a multiple level network
structure was required to combine two individual operating ANP models with the goal of
identifying the optimal resilience strategy for the key products of a company. No com-
parable or similar approach has been found in any research papers or applications, by
Saaty nor others. Furthermore, the proposed generic model in this thesis can be quick-
ly adjusted according to the user input and is therefore ideal for organizations con-
cerned about proactive BC/DR planning.
Limitations of ANP Methodology
The Analytic Network Process and its specialized linear form, the Analytic Hier-
archy Process, are criticized in literature for some of their features. Widely discussed is
the term of “Rank preservation and reversal” (Saaty & Vargas, 2001). Axioms in deci-
sion theory state that the ranking of alternatives should not change when new alterna-
tives are added or insignificant alternatives are eliminated. In particular, AHP is prone
to rank reversal; however, Taslicali and Ercan (2006) state that this phenomenon is
alleviated by the use of a network structure instead of a hierarchical structure. Moreo-
ver, inconsistencies could falsify results if not kept at an acceptable level. Fortunately,
however, SuperDecisions software provides an application to monitor and reduce in-
consistencies.
Another limitation that some researchers allege is the ability of decision-makers
to structure the model in a way that their favorable outcome will obtain the highest pri-
orities. It may therefore be implied that users who carry out the comparisons should not
design the ANP framework. Another way to appease personal preference of single de-
cision-makers is through gathering groups judgments for ANP instead of referring to
the opinion of an individual.

66
When comparisons are made, Saaty’s fundamental scale of judgment is em-
ployed to assign a qualitative opinion to a scale from one to nine. Using a limited set of
integers to make comparisons may not be an effective approach when modeling com-
plex problems. One way to address this issue is the use of “Fuzzy Logic” to model hu-
man judgments. Fuzzy logic was not used in this research; however, more information
on the theory of fuzzy logic can be found by Zadeh (1976) and could be applied in fu-
ture work.
Utilizing a specific type of ANP software led to a couple of disadvantages. One
limitation of SuperDecisions is that it does not include an instrument to directly gather
group judgments. Data gathering (questionnaires and interviews) and statistical meth-
ods are required to process large groups of data (Saaty & Vargas, 2001) before being
entered into the software application. Another limitation of the SuperDecisions software
was found in the verification of the proposed ANP model. In general, after results are
synthesized the performance of a sensitivity analysis is recommended for each BOCR
node in order to validate the stability of the ranking. For this purpose, the priorities
placed on each BOCR merit (referred to earlier as b, o, c, and r) must be varied, and
hence the ranking of alternatives may change; however, this can only be done by the
SuperDecisions software if the additive formula is selected. For the multiplicative for-
mula, the priorities placed on each BOCR merit (b, o, c, and r) cancel out. As a result, it
is questionable how valuable the utilization of the multiplicative formula is. As a general
approach, the decision-maker should always use both formulas to acquire reliable re-
sults.

67
Requirements for the Success of the Proposed Model
The goal of developing a generic model was to include criteria and alternatives
for as many scenarios as possible, so that in the best case little to no adjustment will
be required. The intention is to minimize the effort for future users. Therefore, the re-
searcher chose a set of elements (criteria, subcriteria and alternatives) to apply to the
generic ANP model in order to identify key products and match optimal disruption miti-
gation strategies. The reader should keep in mind that each model needs to be adjust-
ed and judgments must be entered individually before conclusions can be drawn. In
addition, the network structure has to be set up correctly. Therefore, it is absolutely
necessary that users are knowledgeable about the working mechanics of the ANP and
know how the software application is utilized.
Another requirement to ensure quality results is the determination of threshold
values used throughout the decision-making procedure. In the first product selection
ANP model, a determinant value must be set to categorize products based on their im-
portance for the company. As a result, the succeeding ANP model that evaluates dis-
ruption mitigation strategies is then set up only for critical products. Additionally, the
user defines critical measures for the control decision networks. Only criteria with major
influence on each BOCR network will be linked to a decision network. As a general
rule, the decision maker should exclude criteria and subcriteria with less than 3% of the
total priority from being control criteria (Saaty, 2009).
The effectiveness of the proactive decision-making model is dependent on the
users’ input and judgments. Again, this supports the concern that the decision-maker
should be knowledgeable about the ANP methodology. For the case study introduced
in this thesis, one industry expert was exposed to the proposed ANP model. After he

68
determined the inputs, the model was adjusted accordingly. Judgments were then di-
rectly entered into the software application. Results obtained with the proposed ANP
method were confirmed according to the user’s expertise. Hence, it can be concluded
that the case study in this research provides a reasonable approach to testing and vali-
dating the proposed method. However, the results could change if a panel of decision-
makers with different backgrounds and specialization fields were involved and a con-
sensus on judgments were to be required. Although group decision-making would lead
to the most accurate and predictable results, doing so ultimately depends on the com-
pany’s willingness to invest resources and training required to employ the proposed
BC/DR planning tool.

69
5. CONCLUSIONS AND FUTURE WORK
The objective of this research was to develop a framework to identify critical
products of a company and then match these products with optimal disruption mitiga-
tion strategies. To support the decision process in BC/DR planning, a multiple level
Analytic Network Process model was generated to combine two separate but consecu-
tive parts of Disaster Recovery Planning for supply chains in one tool. Using the model
described in this thesis, organizations will be able to evaluate their product importance
according to monetary and non-monetary criteria. Additionally, they will identify ideal
strategies for disruption mitigation of their supply chains based on an assessment of
benefits, opportunities, costs, and risks. The structure and all inputs of the ANP can be
adjusted to target it specifically to the user’s needs. After entering the inputs into the
system, results will be obtained by ANP software. In conclusion, the proposed method-
ology provides an extremely helpful tool for organizations to proactively plan the mitiga-
tion of supply chain disruptions.
Comparing the proposed model with previous research performed in the field of
BC/DR planning, it can be said that this research demonstrates a unique approach.
First, no tool has been developed before to combine parts of the Business Impact
Analysis with the evaluation of resilience strategies. In addition, the proposed model is
a novel approach which combines two separate ANP models together into one detailed
multiple level ANP model. Moreover, analysis of disruption mitigation strategies is
based on a thorough evaluation of the strategies’ benefits, opportunities, costs, and
risks. ANP offers a solution to extend a simple network structure to a comprehensive
model, including a BOCR analysis. Since this research framework results in a fairly

70
complex ANP model, a specific ANP decision-making software called SuperDecisions
was utilized.
In order to test the functionality and effectiveness of the thesis proposal, the au-
thor developed a generic model with predetermined criteria, subcriteria, and alterna-
tives in SuperDecisions. The model was then validated using data from a semi-
conductor company (Company XYZ). An analyst from Company XYZ, who has been a
BC/DR expert for several years, gave input and carried out the comparisons required
for the ANP. Synthesis of the first ANP model led to a conclusion that according to his
input one key product should be matched with an optimal disruption mitigation strategy.
For his critical product, two common supply chain disruption mitigation strategies
(“Supplier network” and “Technological substitution”) were then evaluated based on
their benefits, opportunities, costs, and risks. After the user pairwise compared criteria
and alternatives within the software application, the results were calculated. The strat-
egy of establishing a supplier network obtained a higher priority than the strategy of
investing into a technological substitution. In order to validate these results, a sensitivity
analysis was performed for all merits of the model with the conclusion that the supplier
network strategy would in this case study always be preferable over the technological
substitution alternative.
After final outcomes of this case study were obtained, Company’s XYZ expert
was interviewed about his opinions on the effectiveness and applicability of the pro-
posed method. The highest ranked strategy of the ANP model was indeed his preferred
choice when asked to make a decision based on his intuition. This demonstrates that
the proposed framework provides a valuable approach to identify, and more important-
ly, reinforce BC/DR planning decisions based on a mathematical justification.

71
As mentioned before, the generic model was adjusted to the expert’s inputs for
the case study. To further validate and test the usefulness and effectiveness of the
proposed framework, multiple case studies involving various companies from different
industries and multiple decision-makers should be implemented. This would provide an
insight to whether the proposed method is reliable in yielding valid and consistent re-
sults. Additionally, the question of how applicable and effective the proposed method is
for users can only be answered if tested adequately in various environments.
In general, there are opportunities for improvement. First, consulting groups in-
stead of individuals could increase the plausibility of the results. For this purpose, an-
other tool needs to be implemented to gather and prepare data sufficiently before en-
tering it into the SuperDecisions software. As an example, Torabi et al. (2014) applied
the Decision Making Trial and Evaluation Laboratory (DEMATEL) method to translate
the consensus on judgments of an experienced group into a number from the funda-
mental scale of ANP. Moreover, ANP can be combined with other techniques applied
to decision-making models to increase the reliability of outcomes. As described in the
Discussion Chapter, one possibility would be the application of fuzzy logic, rather than
using a fixed scale, in order to better simulate the way humans make decisions. Anoth-
er opportunity to enhance this research is the application of resource allocation, which
enables the researcher to distribute resources optimally amongst a set of alternatives.
In this specific investigation, doing so could lead to a precise determination of budgets
for disruption mitigation strategies.
Future work could include the research and application of other MCDM tools to
challenge and validate outcomes and the effectiveness of the proposed ANP method.
In addition, applying a multiple layer ANP model to solve a problem in BC/DR planning

72
is only one example of how the proposed framework can be used. To date, ANP has
been applied to several fields of decision-making, including political, social, technologi-
cal, and economical/management environments. One specific example of extending
the proposed application to another field of BC/DR planning would be the analysis of
Information Technology (IT) disaster recovery planning. In today’s digitalized world,
organizations need to decide how to protect their businesses from software and hard-
ware interruptions and data loss. A thorough assessment of benefits, opportunities,
costs, and risks might be a valuable approach for organizations when deciding whether
to invest in IT resilience strategies.
In addition, the proposed framework could be applied to more topics of general
public interest, such as humanitarian aid and disaster relief. A tool to evaluate various
mitigation strategies based on a monetary and non-monetary assessment could be es-
pecially helpful for non-governmental and disaster relief agencies. Supporting decisions
involving social and political aspects with a tool that provides mathematical justification
might lead to improvements in humanitarian disaster planning.
Overall, this thesis helps to expand the knowledge of applicable solutions in
BC/DR planning for organizations. The proposed framework is a unique approach of a
modifiable ANP model to combine the identification of key products with the matching
of ideal supply chain disruption mitigation strategies. Future research could include the
expansion to other fields, such as human disaster relief, where reliable planning tools
are crucial to mitigate the devastating effects of disasters.
73
REFERENCES
Abe, M., & Ye, L. (2013). Building Resilient Supply Chains against Natural Disasters:
The Cases of Japan and Thailand. Global Business Review, 14(4), 567–586. doi:10.1177/0972150913501606
Chopra, S., & Sodhi, M. S. (2004). Managing risk to avoid supply-chain breakdown. MIT Sloan Management Review, 46(46109), 53–61.
Chung, S. H., Lee, a. H. I., & Pearn, W. L. (2005). Analytic network process (ANP) ap-proach for product mix planning in semiconductor fabricator. International Journal
of Production Economics, 96, 15–36. doi:10.1016/j.ijpe.2004.02.006
Evans, N., & Elphick, S. (2005). Models of crisis management: An evaluation of their
value for Strategic Planning in the International Travel Industry. The International
Journal of Tourism Research, 7(3), 135.
Hewlett-Packard Development Company L.P. (2007). Impact on U. S. Small Business
of Natural & Man-Made Disasters. Retrieved from www.webwizebackup.com/impactofDisaster.pdf
International Organization for Standardization. (2012). ISO 22301:2012. International Organization for Standardization.
Lockamy III, A. (2014). Assessing disaster risks in supply chains. Industrial Manage-ment & Data Systems, 114, 755–777. doi:10.1108/IMDS-11-2013-0477
Matsuo, H. (2014). Implications of the Tohoku earthquake for Toyota’s coordination mechanism: Supply chain disruption of automotive semiconductors. International
Journal of Production Economics, 1–11. doi:10.1016/j.ijpe.2014.07.010
Munich Re. (2015). Natural disasters 2014 (p. 2).
Saaty, T. L. (2004). Fundamentals of the analytic network process — Dependence and
feedback in decision-making with a single network. Journal of Systems Science and Systems Engineering, 13(2), 129–157. doi:10.1007/s11518-006-0158-y

74
Saaty, T. L. (2009). Theory and Applications of the Analytic Network Process: Decision
Making with Benefits, Opportunities, Costs, and Risks (pp. 1–352). Pittsburgh, PA: RWS Publications.
Saaty, T. L., & Vargas, L. G. (2001). Models, Methods, Concepts & Applications of the Analytic Hierarchy Process (Second edition). New York: Springer International
Publishing. doi:10.1007/978-1-4614-3597-6
Saaty, T. L., & Vargas, L. G. (2013). Decision Making with the Analytic Network Pro-
cess. Economic, Political, Social and Technological Applications with Benefits, Opportunities, Costs and Risks. (Second Edi.). New York: Springer International
Publishing. Retrieved from http://search.ebscohost.com.ezproxy.liv.ac.uk/login.aspx?direct=true&db=cat0000
3a&AN=lvp.b2803680&site=eds-live&scope=site
Sahebjamnia, N., Torabi, S. A., & Mansouri, S. A. (2015). Integrated business continui-ty and disaster recovery planning: Towards organizational resilience. European
Journal of Operational Research, 242(1), 261–273. doi:10.1016/j.ejor.2014.09.055
Sapci, S., & Pouraghabagher, R. (2003). A systematic approach for selection of suppli-
ers through an integration of Quality Function Deployment (QFD) and Analytical Hierarchy Process (AHP). In 8th International Symposium on Logistics (pp. 319–
326). Seville, Spain.
Taslicali, A. K., & Ercan, S. (2006). The analytic hierarchy & the analytic network pro-
cesses in multicriteria decision-making: A comparative study. Journal of Aero-nautics & Space Technologies, 2(4), 55–65. Retrieved from
http://search.ebscohost.com/login.aspx?direct=true&profile=ehost&scope=site&au
thtype=crawler&jrnl=13040448&AN=29406822&h=15wa5keRdC9ufELEwaGErfjgtTekdlfYF8+0RGh+9Jk2S2MAxfxWiMo9cbA9KW/y/DKhxsrlI9IYvRVeumAyog==&c
rl=c
Tomlin, B. (2006). On the Value of Mitigation Supply for Managing and Contingency
Chain Disruption Strategies Risks. Management Science, 52(May), 639–657.

75
Torabi, S. A., Rezaei Soufi, H., & Sahebjamnia, N. (2014). A new framework for busi-
ness impact analysis in business continuity management (with a case study). Safety Science, 68, 309–323. doi:10.1016/j.ssci.2014.04.017
Wieland, A., & Wallenburg, C. M. (2012). Dealing with supply chain risks: Linking risk management practices and strategies to performance. International Journal of
Physical Distribution & Logistics Management, 42(10), 887–905.
World Continuity Congress. (2011). Risk analysis and Business Continuity Process
Graphic. Retrieved from www.worldcontinuitycongress.com
Zadeh, L. (1976). A fuzzy-algorithmic approach to the definition of complex or impre-
cise concepts. International Journal of Man-Machine Studies, 8, 249–291.

76
APPENDICES

77
A) Matrices of Product Selection ANP Model
Supermatrix

78
Limitmatrix

79
B) Limitmatrices for Benefits, Opportunities, Costs, and Risks

80
C) Overview of Control Criteria and Decision Networks for each BOCR Merit

81
D) Limitmatrices for Decision Networks
Benefits decision networks

82
Opportunities decision networks
Costs decision networks

83
Risks decision networks

84
E) Table of Rating Standards used for BOCR-ANP Model

85
F) Case Study: ANP Input Questionnaire

86
G) Case Study: Priorities per BOCR Merit
Merit Criteria Subcriteria Local priorities
Benefits Operational benefits Increased flexibility 0.0948 Uninterrupted production 0.0163 Faster response time 0.0098
Financial benefits Minor investment in R&D 0.7641
Organizational benefits
Less required administrative effort 0.1149
Opportunities Competitive opportunities
Improved supplier relations 0.7500
Technological opportuni-ties
New product development/introduction 0.2500
Costs Costs of goods sold
Price per unit increases 0.5265
Operating expenses Research and Development 0.2451
Administrative expenses
0.0817
Disaster Recovery Cost Recovery cost 0.0367
Unavailability cost
0.1101
Risks External effects Dissatisfied customers due to product una-vailability
0.1667
Internal effects Financial losses 0.8333

87
H) Case Study: Rating of Strategic Criteria vs. BOCR Merits
Strategic criteria Rating of highest ranked alternative Benefits Opportunities Costs Risks
Increased probability of disasters (0.0190)
Low No influence Medium Medium
Globalization (0.0066)
No influence No influence No influence No influence
Competitive behavior (0.0273)
High High Medium Medium
Growth/Long-term orientation (0.2664)
Medium Medium Medium Medium
Profit (0.0586)
Increase Increase Stable Stable
Image (0.2718)
Stable Stable Stable Stable
Stakeholders (0.3503) Negative Negative Negative Negative
Priorities 0.2744 0.2744 0.2263 0.2263

88
I) Case study: Super-/Limitmatrices for each BOCR Merit
Supermatrix for Benefits merit

89
Limitmatrix for Benefits merit

90
Supermatrix for Opportunities merit
Limitmatrix for Opportunities merit

91
Supermatrix for Costs merit

92
Limitmatrix for Costs merit (Lockamy III, 2014)

93
Supermatrix for Risks merit
Limitmatrix for Risks merit