analytic network process (anp) for housing quality
TRANSCRIPT

Western UniversityScholarship@Western
Electronic Thesis and Dissertation Repository
September 2014
Analytic Network Process (ANP) for HousingQuality Evaluation: A Case Study in GhanaLucia Kafui HusseyThe University of Western Ontario
SupervisorDr. Jacek MalczewskiThe University of Western Ontario
Graduate Program in Geography
A thesis submitted in partial fulfillment of the requirements for the degree in Master of Arts
© Lucia Kafui Hussey 2014
Follow this and additional works at: https://ir.lib.uwo.ca/etd
Part of the Geographic Information Sciences Commons, Human Geography Commons, and theOther Geography Commons
This Dissertation/Thesis is brought to you for free and open access by Scholarship@Western. It has been accepted for inclusion in Electronic Thesisand Dissertation Repository by an authorized administrator of Scholarship@Western. For more information, please contact [email protected],[email protected].
Recommended CitationHussey, Lucia Kafui, "Analytic Network Process (ANP) for Housing Quality Evaluation: A Case Study in Ghana" (2014). ElectronicThesis and Dissertation Repository. 2407.https://ir.lib.uwo.ca/etd/2407

ANALYTIC NETWORK PROCESS (ANP) FOR HOUSING QUALITY
EVALUATION: A CASE STUDY IN GHANA
(Thesis Format: Monograph)
By
Lucia Kafui Hussey
Graduate Program in Geography
A thesis submitted in partial fulfillment
of the requirements for the degree of
Master of Arts
The School of Graduate and Postdoctoral Studies
The University of Western Ontario
London, Ontario, Canada
© Lucia Kafui Hussey 2014

ii
Abstract
Quality of housing is crucial to an individual's quality of life as it is known to affect human
health and well-being. Several studies have employed different methods to assess housing
quality. These methods, however, failed to account for the interdependence among the
factors (criteria) used for evaluating the quality of housing. This thesis proposes an
Analytic Network Process (ANP)-based framework, integrated into Geographic
Information Systems (GIS), to assess housing quality. ANP is a multicriteria analysis
method. It provides a tool for identifying the relative importance of all the elements
(criteria) influencing a goal of decision/evaluation problem (e.g., the problem of evaluating
housing quality). The method allows for incorporating dependence relationships into the
multicriteria evaluation procedure. A case study of housing quality evaluation at the district
level in Ghana using the framework is presented. A set of quality based indicators related
to the physical (structural material, dwelling types, housing services), socio-economic
(tenure and household density (overcrowding) and environmental (modes of solid waste
and liquid waste disposal) aspects of dwellings was used for the evaluation. The results
demonstrate the effectiveness of the proposed approach. The GIS-based ANP approach
allows for examining spatial distribution of housing quality. It also identifies the most
important factors (indicators) contributing to the variability of housing quality in Ghana.
Key words: Analytic Network Process (ANP), Geographic Information Systems (GIS),
Multicriteria Decision Analysis (MCDA), Housing quality, Ghana.

iii
Acknowledgement
To God be the glory! Indeed, your grace and mercies had brought me this far. This thesis
would not have been successful without the support of countless people. My profound
gratitude goes to my supervisor, Dr. Jacek Malczewski for his guidance and advice
throughout the writing of this thesis. It was truly an excellent learning experience. I would
also like to express my gratitude to my supervisory committee member, Dr. Godwin Arku,
who gave me valuable suggestions during my study. I extend thanks to my thesis examiners
(Dr. Michael Buzzelli, Dr. Isaac Luginaah and Dr. Girma Bitsuamlak) for the time spent
reading through my thesis and the useful comments provided.
Without the relevant data, this thesis would not have been completed. I would like to thank
Dr. Alex Barimah Owusu of the Department of Geography and Resource Development,
University of Ghana, for taking time off his busy schedule to follow up and obtain the data
used for this research. I am grateful to Mr. Frederick Armah, for his time spent reading
through my thesis. Your invaluable comments and suggestions on various drafts of this
work is very much appreciated. I wish to thank the staff in the Department of Geography
at Western University; especially Lori Johnson for all the help.
Finally, none of this would have been possible without the love and support of my family.
I appreciate all your prayers, encouragement and continuous support. Mr. Kuadzi and
Benedicta, this journey would not have been possible without your financial support, I am
grateful. Mum, your constant phone calls to check on me and your prayers gave me the
strength to come this far, thank you. Throughout the writing of this thesis, I have had the
support of many of my friends. Some supported me with their prayers, time and constant
encouragement. God bless you all.

iv
Table of Contents
Abstract ....................................................................................................................... ii
Acknowledgement ...................................................................................................... iii
Table of Contents ....................................................................................................... iv
List of Tables ............................................................................................................. vii
List of Figures .......................................................................................................... viii
List of Plates ................................................................................................................ x
List of Appendices ...................................................................................................... xi
CHAPTER ONE ...................................................................................................... 1
INTRODUCTION AND CHAPTER OUTLINE ........................................................ 1
1.1 Introduction ........................................................................................................ 1
1.2 Objectives ........................................................................................................... 6
1.3 Rationale and Contribution to Literature ............................................................ 8
1.4 Thesis Organization ............................................................................................ 9
CHAPTER TWO ....................................................................................................... 10
LITERATURE REVIEW .......................................................................................... 10
2.1 Introduction ...................................................................................................... 10
2.2 Overview of Analytic Network Process ........................................................... 10
2.2.1 Decision/Evaluation Problem .............................................................. 14
2.2.2 Input ...................................................................................................... 15
2.2.3 Evaluation Criteria ............................................................................... 16
2.2.4 Methodology and Software ................................................................... 18
2.2.5 Effectiveness of the ANP method and advantages of integrating GIS
with ANP ............................................................................................... 19
2.3 Housing Quality ............................................................................................... 22
2.3.1 Introduction .......................................................................................... 22
2.3.2 Concept of Housing Quality ................................................................. 22
2.3.3 Measurement of Housing Quality ......................................................... 24
2.3.4 Types of Indicators ............................................................................... 28
2.3.4.1 Indicators used by Empirical Studies ................................................... 30

v
2.3.5 Determinants of Housing Quality ......................................................... 33
2.3.6 Methods ................................................................................................ 35
2.4 Summary and Conclusion ................................................................................ 36
CHAPTER THREE ................................................................................................... 38
THE GIS-ANP METHOD ........................................................................................ 38
3.1 Introduction ...................................................................................................... 38
3.2 Multicriteria Decision Analysis ........................................................................ 38
3.3 Spatial Multicriteria Analysis ........................................................................... 39
3.4 GIS-based (spatial) Multicriteria Decision Analysis Framework .................... 40
3.5 Analytic Network Process (ANP) .................................................................... 42
3.6 The ANP Procedure .......................................................................................... 46
3.7 GIS-ANP Framework ....................................................................................... 53
3.8 Summary .......................................................................................................... 56
CHAPTER FOUR ..................................................................................................... 57
GIS-ANP: APPROACH TO EVALUATE HOUSING QUALITY ........................ 57
4.1 Introduction ...................................................................................................... 57
4.2 Study Area Profile ............................................................................................ 57
4.2.1 Location and Size and Administrative Characteristics ........................ 57
4.2.2 Housing Profile of Ghana .................................................................... 60
4.3 Data and Data Sources ..................................................................................... 62
4.4 An Illustrative Example: The ANP Housing Quality Evaluation .................... 63
4.4.1 Structuring of the Decision Problem ................................................. 63
4.4.1.1 1st Cluster: Physical Criterion ........................................................... 66
4.4.1.2 2nd Cluster: Socio-economic Criterion ............................................. 66
4.4.1.3 3rd Cluster: Environmental Criterion ................................................ 67
4.4.2 ANP Model Construction ................................................................... 68
4.4.3 Conducting the Pairwise Comparisons between Elements ................ 71
4.4.4 Constructing the Supermatrices of ANP ............................................ 96
4.5 GIS Integration ................................................................................................ 107
4.6 Summary. ........................................................................................................ 108

vi
CHAPTER FIVE ..................................................................................................... 109
RESULTS AND DISCUSSION ............................................................................. 109
5.1 Introduction .................................................................................................... 109
5.2 The Results ..................................................................................................... 109
5.3 Discussion of the Results ............................................................................... 110
5.3.1 Global Analysis .................................................................................. 110
5.3.2 Analysis by Cluster ............................................................................. 120
5.4 Sensitivity Analysis ........................................................................................ 122
5.5 GIS Integration ............................................................................................... 128
5.6 Summary and Conclusions ............................................................................. 140
CHAPTER 6 ............................................................................................................ 142
SUMMARY AND CONCLUSIONS ...................................................................... 142
6.1 Introduction .................................................................................................... 142
6.2 Overview of Study and Strengths of the ANP-based Framework .................. 142
6.3 Limitations of the ANP-based Framework for Housing Quality Evaluation . 144
6.4 Implications and Recommendations .............................................................. 145
6.5 Research Contribution and Recommendations for Future work .................... 147
REFERENCES ........................................................................................................ 149
APPENDICES ......................................................................................................... 159
Appendix 1: Rating Model ................................................................................... 159
Appendix II: Final Priorities (Limiting and Normalized by Cluster Priorities) for the
Districts by Regions……..................................................................166
Appendix III: Unweighted Supermatrix ................................................................. 177
Appendix IV: Curriculum Vitae ............................................................................. 196

vii
List of Tables
Table 2.1: GIS-ANP Applications…………….……………………..........................13
Table 2.2: Relevant Studies on Housing Quality……………...…..………………...26
Table 3.1: Scale for Pairwise Comparison………………………………….………..48
Table 3.2: Ratio Index for different values of n…………….………..……..….…....50
Table 4.1: List of housing quality criteria together with elements..............................67
Table 4.2: Indicator Classification and Ranking………………………..……..….…74
Table 4.3: Priorities for variables (Housing services and Environmental sanitation) for
Greater Accra Region from the Rating Model……...…………….….…..86
Table 4.4: Weights for each indicator from the Rating Model for Greater Accra
Region……………………………...……….…………………………....87
Table 4.5: Pairwise Judgments of Dwelling type for Alternatives.…..………..…....89
Table 4.6: Pairwise Judgments of Housing Services for Alternatives...………....….89
Table 4.7a: Supermatrix of unweighted priorities for Greater Accra Region …….…..98
Table 4.7b: Supermatrix of Unweighted Priorities for Greater Accra Region
(continuation)………………………………………………………..…...99
Table 4.8a: Weighted Supermatrix for Greater Accra Region……………………….101
Table 4.8b: Weighted Supermatrix for Greater Accra Region (continuation)…..…..102
Table 4.9a: Limit Supermatrix for Greater Accra Region……..…………………….104
Table 4.9b: Limit Supermatrix for Greater Accra Region (continuation)…..….……105
Table 4.10: Limiting Priorities and Normalized by Cluster Priorities………….……106
Table 5.1: Combination of Weights for the Sensitivity Analysis…….…….....……123

viii
List of Figures
Figure 3.1: Spatial Multicriteria Decision Analysis Framework…………….……….41
Figure 3.2: Comparison of a Hierarchy with a Network……………………..…...….44
Figure 3.3: The Bridge Model Presented in a Hierarchy (a) and Network (b) of Criteria
(“clusters”, denoted by ovals) and Alternatives (“nodes”, dots within
clusters) with Feedback…………….…………….………………………45
Figure 3.4: Steps followed in the Analytic Network Process ……………..…………46
Figure 3.5: General structure of a Supermatrix……………………………...……..…51
Figure 3.6: Framework for Evaluating Housing Quality……………………….….….54
Figure 4.1: Regional and District map of Ghana…………….……………………......59
Figure 4.2: Structure of Housing Quality Evaluation Problem in Ghana……….….....65
Figure 4.3: The ANP Model for Evaluating Housing Quality at the District Level in
Ghana…………………………………...………………………………..70
Figure 4.4: Element Dwelling Type connected to Alternatives…………….….…….70
Figure 4.5: Feedback structure with respect to the Accra Metropolis……………..….71
Figure 4.6: Housing Quality Evaluation Problem: The Response Choices for the
Variables (Subcriteria)…………………………………………………...73
Figure 4.7: Cross section of the Rating model for Housing Quality….………………81
Figure 4.8: Spreadsheet for Rating Model……….……………….…………………..82
Figure 4.9: Deriving Priorities for the Outer Material Criterion Categories..................82
Figure 4.10: The Questionnaire Mode for Comparing Alternatives with Respect to
Dwelling Type Node in the Physical Cluster. …………………………...88
Figure 4.11: Comparison of Nodes in the Physical Cluster with respect to Accra
Metropolis……………………………………………………………..…91
Figure 4.12: Comparison of Nodes in the Economic/Social Cluster with respect to
Accra Metropolis…...…………………………...…………………..…...91
.

ix
Figure 4.13: Comparison of Nodes in the Environmental Cluster with respect to Accra
Metropolis….………………………………………...……………….….91
Figure 4.14: Inner Dependent Comparison for the Physical Cluster: Which Influences
Housing Services more, Itself, Dwelling Type or Outer/ External
material?.....................................................................................................93
Figure 4.15: Outer Dependence Comparison of the Physical and Economic/Social
Clusters: Which Influences Housing Services more: crowding or
ownership………………………………………………………………...96
Figure 4.16: Cluster Matrix for Greater Accra Region………..….….……….…...…..100
Figure 4.17: Final Results of Housing Quality for Districts in Greater Accra Region
…………………………………………………………………………..106
Figure 4.18: Spatial Variation of Housing Quality for the Greater Accra Region....….107
Figure 5.1: Spatial Variation of Housing Quality for the Ashanti Region……….…..129
Figure 5.2: Spatial Variation of Housing Quality for the Brong Ahafo Region…...…130
Figure 5.3: Spatial Variation of Housing Quality for the Central Region…….…...…131
Figure 5.4: Spatial Variation of Housing Quality for the Eastern Region…………...132
Figure 5.5: Spatial Variation of Housing Quality for the Greater Accra Region........133
Figure 5.6: Spatial Variation of Housing Quality for the Northern Region…….…....134
Figure 5.7: Spatial Variation of Housing Quality for the Upper East Region…….….135
Figure 5.8: Spatial Variation of Housing Quality for the Upper West Region.............136
Figure 5.9: Spatial Variation of Housing Quality for the Volta Region……….…....137
Figure 5.10: Spatial Variation of Housing Quality for the Western Region……..…..138

x
List of Plates
Plate 4.1: The Four Dominant Types of Housing in Ghana…………………………61

xi
List of Appendices
Appendix 1: Rating Model .......................................................................................... 159
Appendix II: Final Priorities (Limiting and Normalized by Cluster Priorities) for
Districts by Regions………………………………………....……...….166
Appendix III: Unweighted Supermatrix ....................................................................... 177
Appendix IV: Curriculum Vitae ................................................................................... 196

1
CHAPTER ONE
INTRODUCTION AND CHAPTER OUTLINE
1.1 Introduction
Housing is one of the basic necessities of life and a key aspect of human existence.
Irrespective of the level of society’s socio-economic development, it remains a basic
human need with its quality, cost and availability being vital to an individual's quality of
life (Bogdanović & Mitković, 2005; Jiboye, 2010a). Availability of housing constitutes a
critical component of quality of life and a vital indicator for measuring quality of life.
Previous studies have established relationship between quality of life and housing (Das,
2008; Oswald et al., 2003; So & Leung, 2004; Zebardast, 2009). These studies
demonstrated that housing is an important domain that contributes to the overall quality of
life of individuals. Das (2008) reported that, satisfaction from condition of housing is
strongly correlated with satisfaction with overall quality of life. Oswald et al. (2003) found
that housing related variables explains a substantial portion of the variance in life
satisfaction. So and Leung (2004) have shown that there is a strong correlation between
sufficient housing, visual acceptability of the houses and quality of life.
Housing may vary in its type, size and design, but whatever form it takes, there is a need
to measure its quality to ensure that it gratifies the resident’s family and cultural norms
(Mohit, Ibrahim & Rashid, 2010). Human beings spend more than 85 per cent of their
entire life inside buildings, hence, the characteristics of the buildings are of utmost
importance to an individual’s quality of life (So & Leung, 2004). Based on the need to
assess the quality of the houses and recognizing the importance of housing satisfaction to

2
a person’s overall quality of life, numerous studies have employed different methods to
assess housing quality. Housing quality assessment have been applied in several studies.
Twitchell (1948) presented the appraisal method used by the Committee on the Hygiene of
Housing (USA) to evaluate housing quality in the United States. The method measured
housing quality based on a system of numerical scores. This was a unique feature of the
method. These numerical scores consisted of penalty points that are assigned to conditions
of the dwellings that fail to meet accepted housing standards as stipulated by the committee.
Houses that fail to meet these standards comprised of houses with deficiencies, which may
adversely affect health, safety or essential livability. Each deficiency in the houses is
graded according to the seriousness of that condition as a threat to health or safety or as an
impairment of general livability. For comparative purposes, the approach classified houses
into quality grades based on the median total penalty scores and shown on a map, which
summarizes the appraisal of the houses. This method is intended for use primarily in areas
known to contain mediocre or poor housing and not for city-wide applications.
Pollard (1953) adopted a method similar to the appraisal method to assess housing quality.
However, this method takes statistical equivalent as a point of departure (% of dwelling
units that are dilapidated in a given census tract is equivalent to the probability that any
one dwelling unit in that tract is dilapidated). Pollard argued that the appraisal method
would largely fail to produce a clear picture of the relative quality of housing. This is
because there are an uneven number of dwelling units in each group (a group being those
building blocks having the same number of penalty points). Just like the appraisal method,
Pollard’s method involved allocation of penalty points to the percent of dilapidated

3
buildings for each census tract. These methods were used in developed country,
specifically the USA.
Unlike the developed world, developing countries lack an active real estate (housing)
market with well-documented housing information, which can be used for effective
assessment of housing quality. As such, Rindfuss et al. (2007) proposed a new method
based on a standardized subjective rating process. This method involves observation from
outside including taking pictures of dwelling units, having an intuitive sense of their
relative value and ranking them on a five-point quality scale. They argued that, the standard
building-components method (asking questions on building materials used in the dwelling
unit) that was being used in developing countries is poor at measuring housing quality as
these surveys do not have a standardized set of questions.
Furthermore, Kurian and Thampuran (2011) developed a methodology for assessing
housing quality using requirements of a target population based on multivariate statistics.
The method identified various indicators (location, design of buildings, materials and
construction techniques, aesthetics etc.) that contributed to the housing quality
requirements of a homogeneous population in a community and their relative weightings.
In order to study the relationships between the various factors and indicators, they used a
stepwise multiple regression model.
Although different methods have been proposed and used to assess quality of houses, a
common limitation of these methods is that, except Twitchell (1948), none of them
accounted for the spatial patterns of housing quality as an important aspect in making well-
informed housing decisions as classifying areas according to the quality of houses. Also,

4
they are limited by their selected application areas; that is, their focus on homogenous
population and non-city-wide case studies. In addition, these methods used very basic
techniques for the evaluation, as a result not able to produce a comprehensive appraisal of
housing quality. Because of the simplistic nature of these methods, it is necessary to
consider a more comprehensive approach to evaluate housing quality. Moreover, the
indicators used for housing quality assessment have multiple and conflicting aspects that
need to be addressed as housing quality evaluation. Multicriteria Decision Analysis
(MCDA) techniques are suitable for addressing these challenges.
MCDA allows for capturing the diversity of indicators (criteria) for the assessment of
housing quality, providing decision makers (and policy makers) a better understanding of
the trade-offs between evaluation criteria (Natividade-Jesus, Coutinho-Rodrigues, &
Antunes, 2007). MCDA can combine a large number of evaluation criteria to obtain a
composite measure of housing quality and allows weighting of individual indicators. The
MCDA-based composite housing quality scores could inform subsequent housing
decision-making like tenants or buyers choosing suitable dwellings, and architects
selecting the best design alternatives during the preconstruction stages.
Studies that used MCDA to assess housing quality include Can (1992) and Meng and Hall
(2006). Can (1992) used generalized concordance-discordance analysis to assess
residential quality as a discrete multicriteria evaluation problem and generated a general
performance score for geographical units based on their socioeconomic attributes. Meng
and Hall (2006) employed a relatively simple multi-attribute analysis. The method
involved ranking and weighting of housing quality indicators by community people to

5
create an index. The weighted sum of the indicators was used to create the housing quality
index.
However, Can (1992) and Meng and Hall (2006) methods fail to account for the
relationships between the indicators used for the assessment of housing quality. To address
this limitation, Analytic Network Process (ANP) could be used. Thomas Saaty, who is also
the author of the well-known Analytic Hierarchy Process (AHP), proposed the ANP
technique (Saaty, 1996). The ANP is a MCDA method that incorporates the influences and
interactions among the elements of the system (decision problem) and allows for more
complex, interdependent, relationships, and feedback among elements in the hierarchy.
Furthermore, ANP makes it possible to consider all kinds of dependence and feedback in
the decision problem (Sipahi & Timor, 2010).
ANP is gaining popularity and has found application in various fields. In the field of solid
waste management, Khan and Faisal (2008) have used ANP for prioritizing and selecting
appropriate municipal solid waste disposal methods, Aragone´s-Beltra`n et al. (2010)
applied the method to select the optimal location of municipal solid waste plant in Valencia
(Spain). Other studies that have used ANP include Banar et al. (2007) for choosing one of
the four alternative landfill sites in Eskisehir (Turkey). In the transport sector, Banai (2010)
applied ANP in light rail route selection by taking into account the station area landuse
interaction and property value. Likewise, Bottero and Lami (2010) used the method to
support the decision-making process related to the choice of different transport scenarios
in the town of Venaria Reale, Northern Italy. In risk assessment, Nekhay, Arriaza, and
Boerboom (2009) used ANP for soil erosion risk evaluation in Spain by identifying
agricultural areas with higher soil erosion risk, and Neaupane and Piantanakulchai (2006)

6
employed the method for landslide hazard assessment in Nepal, Spain. Other areas of the
ANP method applications include industrial management (Karsak, Sozer, & Alptekin,
2003; Partovi, 2006), construction planning and project selection (Chen et al., 2005; Cheng
& Li, 2005), energy policy (Erdogmus et al., 2006; Ulutas, 2005) and forest management
(Wolfslehner et al., 2004). Most of these studies (e.g. Banai, 2010; Nekhay et al, 2009)
have indicated the effectiveness of the ANP method in their application areas as it allowed
for interdependence and interrelationships among the factors and indicators used and
further measured dependencies among them. Other studies (e.g. Banai, 2010, Nekhay et
al., 2009) have stipulated that ANP can be used as a tool for making predictions under
uncertainty (limited data).
Although ANP has found its application in different fields with much success, it remains
to be explored in its application to housing quality evaluation. The method has not been
applied in this field, especially in the GIS-MCDA domain. This research therefore seeks to
apply ANP method to assess housing quality at the district level in Ghana to find out how
effective the method would be in evaluating housing quality by taking into account the
relationship between the indicators.
1.2 Objectives
There are three main objectives of this thesis:
1. to develop an ANP-based framework for housing quality evaluation,
2. to integrate the framework into GIS, and
3. to apply the framework for housing quality evaluation in Ghana.

7
Assessment of housing quality is a complex process that involves selecting and evaluating
several criteria (indicators) which affects the quality of houses. There are dependencies
among these criteria that have to be analyzed as housing quality evaluation. ANP as a
multicriteria decision analysis method is particularly suitable for dealing with complex
decision problems which are characterized by inter-relationships among the elements.
Using ANP for housing quality evaluation can help the decision maker(s) to translate a
number of indicators and the relationships between them into manageable units of
information. The ANP through its network structure can better capture the complex
evaluation problem of housing quality by allowing the dependence relationships among the
criteria (indicators) to be assessed, and the relative importance of all the indicators that
have an influence on housing quality to be evaluated.
Housing quality is considered as an abstract, theoretical entity with no straightforward
operational definition (Goodman, 1978). Ibem (2012) used the term housing quality to
denote those highly valued attributes that housing possesses that make it suitable in meeting
occupants’ needs. According to Meng and Hall (2006) a normative definition of housing
quality generally refers to:
The grade or level of acceptability of dwelling units and their associated and
immediate residential environment, including the design and functionality of
housing structures, building materials used, the amount of internal and
external space pertaining to the dwelling, housing utilities, and basic service
provision. (p. 415).
For the purpose of this research, Meng and Hall (2006) definition was adopted. In housing
quality assessment, two dominant approaches are used, objective (quantitative) and
subjective (qualitative) measures. The quantitative aspect of housing quality evaluates the

8
physical, social and economic components. The subjective evaluation is based on user's
assessment of the ‘comfort’ or ‘quality of life’ that are afforded by different dwelling types.
Because of the difficulty in measuring housing quality with the subjective approach, the
objective measurements have often been used for housing quality index (e.g. Can, 1992;
Fiadzo et al., 2001; Meng & Hall, 2006; Muoghalu, 1991). The objective measurement
evaluates the physical features, amenities, services, and environment of the dwelling units.
However, objective measurements have been criticized for failing to explain the
psychosocial aspects of residential satisfaction (Mohit et al., 2010). Nevertheless, this study
adopted the objective approach, because the perceptions of residents are not incorporated
into the assessment.
1.3 Rationale and Contribution to Literature
The provision of housing has been a burden for some time now creating deficit in access
to housing in Ghana. The shortage in the housing availability is estimated at 1.7 million
housing units (Ansah, 2013). While trying to meet the general housing needs of the people,
access to decent and good quality housing still pose another serious challenge to sustainable
growth and development, as it is a stimulant to the national economy. There has been an
increasing demand for additional housing stock, the condition and total quality of the
existing stock, most of which falls short of the expected quality standards. Greatest of the
existing stock lack basic amenity and infrastructure and are deteriorating fast due to lack
of maintenance. What is currently known is that, there is difference in housing quality
between urban and rural areas. Further, within the urban areas, there exist a difference in
housing quality between the rich neighbourhoods and the poor ones. However, the

9
disparities at the district levels have not been examined. In order to address imbalances in
housing and housing quality, existing spatial variations in quality have to be identified. The
effectiveness of the MCDA method, specifically ANP, in assessing the spatial pattern of
housing quality, would be a precursor to any attempt at addressing this nagging issue of
housing imbalances at the districts in Ghana. In addition, the findings of this study is of
significance to housing policy and housing development in Ghana.
This study intends to contribute to the literature by demonstrating the usefulness of the
ANP method for analysing spatial patterns of housing quality. In this regard, the findings
of this work would advance research in the area of MCDA. Additionally, this study would
be useful to researchers who are interested in probing the usability of ANP in tackling other
spatial evaluation problems such as site selection and land use assessment problems.
1.4 Thesis Organization
The rest of the thesis is organized into five chapters. Chapter 2 overviews relevant literature
on housing quality evaluation (definition, indicators and measurement approaches) as well
as GIS-based ANP applications (various fields, criteria used, etc.). The GIS-ANP based
framework for housing quality evaluation is described in Chapter 3. Chapter 4 focuses on
application of the GIS-ANP framework to housing quality evaluation in Ghana. Results
and discussions are presented in Chapter 5. Finally, Chapter 6 provides a summary of the
research and concluding remarks. Discussion of the strengths and limitations of the GIS-
ANP approach for housing quality evaluation, implications of the study and suggestions
for future work are presented.

10
CHAPTER TWO
LITERATURE REVIEW
2.1 Introduction
The chapter presents a review of literature on Analytic Network Process (ANP) and
housing quality assessment. It is structured into two sections. The first section discusses
the ANP applications with a focus on those using Geographic Information System (GIS)
based ANP. Section two provides an assessment of the definition of the concept of housing
quality, measurement approaches of housing quality, followed by the types of indicators
used to operationalize the concept. The chapter concludes with a synopsis on how GIS-
ANP has been used and how housing quality has been assessed.
2.2 Overview of Analytic Network Process
Analytic Network Process as a multicriteria decision (evaluation) method is a more general
form of the Analytic Hierarchy Process (AHP). The AHP is a theory of measurement
introduced in 1980 by Thomas Saaty. It is used to derive relative priorities on absolute
scales from both discrete and continuous paired comparisons in multilevel hierarchic
structures (Saaty, 2006). This method adopts a hierarchical structuring of the decision or
evaluation problem. The top element of the hierarchy is the overall goal for a decision with
the alternatives listed in the bottom level of the hierarchy.
The AHP assumes independence between the elements of the same level and between
different levels (upper levels from lower levels) in the hierarchy. This implies that, AHP
does not allow for the option of having top-to-bottom and bottom-to-top interdependent

11
relationships between a group of factors, or for interdependent relationships within a cluster
of factors (Taslicali & Ercan, 2006). Consequently, AHP is limited to rather static and
unidirectional interactions among the decision problems and alternatives with little
feedback. AHP has also been criticised for the problem of rank reversal (Belton & Gear,
1983; Dyer, 1990; Holder, 1990; Khan & Faisal, 2008; Leung & Cao, 2001). This problem
is attributed to the assumption of the hierarchic decomposition of the AHP method (Saaty,
1986), which can produce arbitrary results or the rankings of alternatives (Belton & Gear
1983; Dyer, 1990). Saaty (1996) proposed the generalization of AHP called Analytic
Network Process (ANP) in order to overcome the limitations of the AHP method.
The ANP method offers a general framework to deal with decisions without making
assumptions about the independence of higher level elements from lower level elements
and the independence of the elements within a level (Saaty, 1999). Many decision
problems cannot be designed hierarchically because they comprise the interaction and
dependence of higher-level elements in a hierarchy on lower-level elements (Saaty, 2006)
as independence of elements rarely occurs in real life situation. Therefore, ANP is
represented by a network, rather than a hierarchy and does not specify levels in a hierarchy.
As in most real world situations, the method considers elements to be interdependent of
each other. The replacement of the single direction relationships of AHP with dependence
and feedback of ANP makes it more powerful than AHP in the decision situations with
uncertainty and dynamics. In addition, ANP avoids the problem of rank reversal, making
the method more accurate and useful than AHP as a decision or evaluation tool for complex
situations (Taslicali & Ercan, 2006). Sabri and Yaakup (2008) carried out a comparative

12
analysis of AHP and ANP in assessing urban sprawl. They concluded that the results
obtained from ANP seem more rational than that of AHP.
Although AHP uses a linear hierarchic structure and ANP adopts a network structure, both
methods apply pairwise comparisons among elements using a 1-9 numerical scale (Saaty’s
fundamental scale); where one means equal importance of two factors (e.g., evaluation
criteria) and nine indicate an extreme level of importance of one criterion over the other.
While the two models rely on pairwise comparison matrix, both models use expert opinions
as inputs for decision factor weighting. But the benefit of ANP comprises the option of
network model structuring that echoes the interdependence between the things in the real
world quite well (Nekhay et al., 2009). ANP can help the decision makers to translate a
number of variables and the relationships between them into manageable units of
information (Aminu et al., 2013). Further, ANP can model complex decision problems
where AHP is not sufficient. Considering the ANP as an extension of the AHP, the
fundamental differences between the two MCDA methods can be summarized as:
1. with the AHP, decision problems are structured into a hierarchy (top to down),
whiles with the ANP, they are structured as a network.
2. in AHP, elements are considered/ assumed as independent, hence the
consideration of the decision criteria as such, whiles the ANP assumes
interdependence of the elements and decision criteria.
3. AHP considers alternatives as independent from each other as well as from the
decision criteria, whereas the ANP considers them to be dependent on the decision
criteria and each other.
13
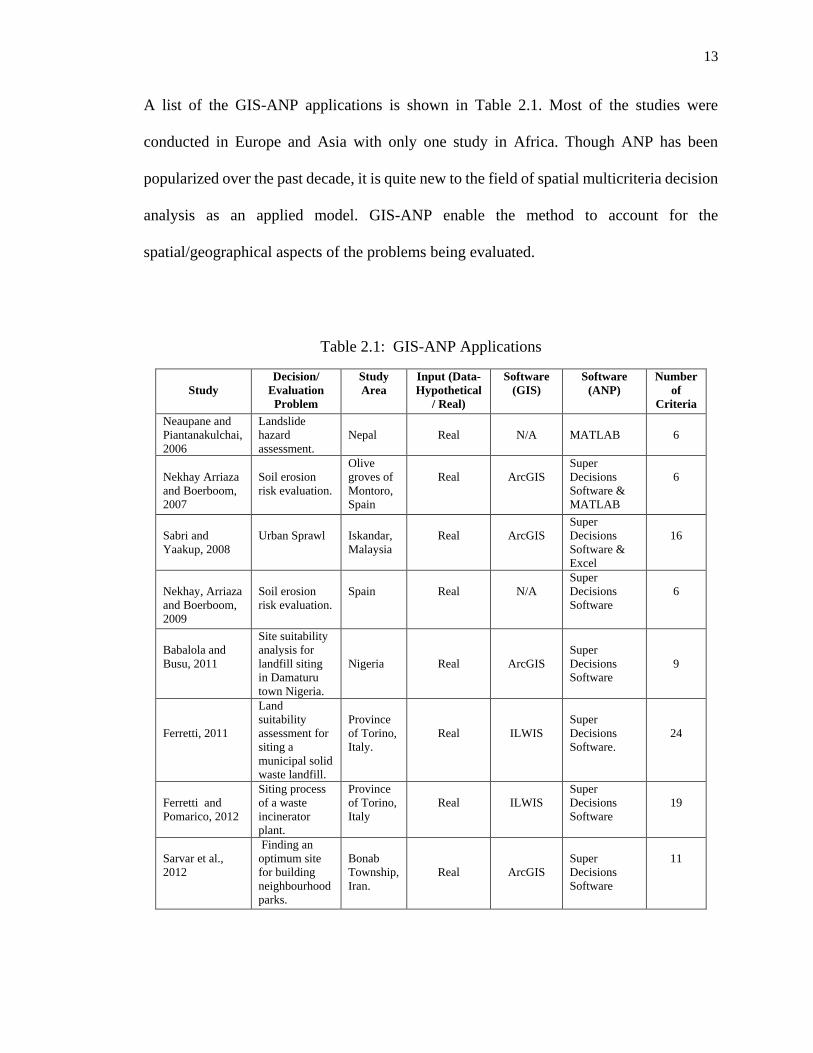
A list of the GIS-ANP applications is shown in Table 2.1. Most of the studies were
conducted in Europe and Asia with only one study in Africa. Though ANP has been
popularized over the past decade, it is quite new to the field of spatial multicriteria decision
analysis as an applied model. GIS-ANP enable the method to account for the
spatial/geographical aspects of the problems being evaluated.
Table 2.1: GIS-ANP Applications
Study
Decision/
Evaluation
Problem
Study
Area
Input (Data-
Hypothetical
/ Real)
Software
(GIS)
Software
(ANP)
Number
of
Criteria
Neaupane and
Piantanakulchai,
2006
Landslide
hazard
assessment.
Nepal
Real
N/A
MATLAB
6
Nekhay Arriaza
and Boerboom,
2007
Soil erosion
risk evaluation.
Olive
groves of
Montoro,
Spain
Real
ArcGIS
Super
Decisions
Software &
MATLAB
6
Sabri and
Yaakup, 2008
Urban Sprawl
Iskandar,
Malaysia
Real
ArcGIS
Super
Decisions
Software &
Excel
16
Nekhay, Arriaza
and Boerboom,
2009
Soil erosion
risk evaluation.
Spain
Real
N/A
Super
Decisions
Software
6
Babalola and
Busu, 2011
Site suitability
analysis for
landfill siting
in Damaturu
town Nigeria.
Nigeria
Real
ArcGIS
Super
Decisions
Software
9
Ferretti, 2011
Land
suitability
assessment for
siting a
municipal solid
waste landfill.
Province
of Torino,
Italy.
Real
ILWIS
Super
Decisions
Software.
24
Ferretti and
Pomarico, 2012
Siting process
of a waste
incinerator
plant.
Province
of Torino,
Italy
Real
ILWIS
Super
Decisions
Software
19
Sarvar et al.,
2012
Finding an
optimum site
for building
neighbourhood
parks.
Bonab
Township,
Iran.
Real
ArcGIS
Super
Decisions
Software
11

14
Isalou et al.,
2013
Locating a
suitable place
for landfilling
municipal solid
wastes.
Kahak
Town,
Qom City,
Iran.
Real
ArcGIS
Microsoft
Office Excel
2007
& MATLAB
11
Agarwal et al.,
2013
Delineation of
groundwater
potential zone.
Unnao
District,
Uttar
Pradesh
India.
Real
N/A
N/A
10
Aminu, et al.,
2013
Sustainable
tourism
planning in
wetland
environment.
Malaysia
Hypothetical
ArcGIS
Super
Decisions
Software
N/A
Shahmoradi and
Isalou, 2013
Selection of
a suitable site
for establishing
wastewater
treatment plant
Kahak,
Iran.
Real
N/A
Super
Decisions
Software
12
Ferretti and
Pomarico,
2013a
Analysing land
suitability for
ecological
connectivity
Piedmont
Region,
Italy.
Real
IDRISI
Super
Decisions
Software
12
Ferretti and
Pomarico,
2013b
Land
suitability
for ecological
corridors
Piedmont
Region,
Italy
Real IDRISI
&
ILWIS
Super
Decisions
Software
12
2.2.1 Decision/Evaluation Problem
GIS-based ANP has found application in different fields across a number of decision or
evaluation problems. The major categories of problems are related to waste management
(Babalola & Busu, 2011; Ferretti, 2011; Ferretti & Pomarico, 2012; Isalou, Zamani,
Shahmoradi, & Alizadeh, 2013; Shahmoradi & Isalou, 2013) and risk assessment
(Neaupane & Piantanakulchai, 2006; Nekhay et al., 2007, 2009). In terms of waste
management, scholars have used the method to assess different decision problems
including site selection problems for landfilling municipal solid wastes (Babalola & Busu
2011; Ferretti, 2011; Ferretti & Pomarico, 2012; Isalou et. al., 2013) and wastewater
treatment plant (Shahmoradi & Isalou, 2013). In relation to the problem of risk assessment,

15
Nekhay et al. (2007, 2009) evaluated soil erosion risk. Neaupane and Piantanakulchai
(2006) assessed landslide hazard. Few studies have tackled other decision or evaluation
problems such as: land sustainable for tourism development (Aminu, et al., 2013),
evaluating urban sprawl (Sabri & Yaakup, 2008), delineation of ground water potential
zone location (Agarwal, Agarwal, & Garg, 2013), ecological land suitability (Ferretti &
Pomarico, 2013a; Ferretti & Pomarico, 2013b), and locating neighbourhood parks (Sarvar,
Hesari, Mousavi, & Orooji, 2012).
2.2.2 Input
The input utilized by these studies were real world problems as outlined above, except
Aminu et al. (2013) who adopted a hypothetical input (see Table 2.1). Although these
studies differed in terms of the specific problems, it was noted that, in terms of data inputs,
most of the studies used topographic and thematic maps (Agarwal et al., 2013; Babalola &
Busu, 2011; Ferretti, 2011; Ferretti & Pomarico, 2012; Ferretti & Pomarico, 2013b;
Neaupane & Piantanakulchai, 2006; Nekhay et al., 2009; Shahmoradi & Isalou, 2013),
field surveys and questionnaires (Agarwal et al., 2013; Nekhay et al., 2007, 2009; Sabri &
Yaakup, 2008; Sarvar et al., 2012), followed by expert opinion (Ferretti, 2011; Ferretti &
Pomarico 2012; Ferretti & Pomarico, 2013a; Ferretti & Pomarico, 2013b; Nekhay et al.,
2007, 2009; Sabri & Yaakup, 2008; Sarvar et al., 2012) and satellite and aerial photos
(Agarwal et al., 2013; Neaupane & Piantanakulchai, 2006; Nekhay et al., 2007). The
diversity of data inputs is a testimony to the usefulness of ANP in dealing with a wide
variety of decision and evaluation problems.

16
2.2.3 Evaluation Criteria
Once decision problems are identified, a set of evaluation criteria is used to operationalize
them. Different researchers have used varying criteria with the total number also varying
due mainly to the different problems that they assessed. This is in relation to the fact that
the set of evaluation criteria is problem-specific.
The number of criteria adopted by the studies varied and ranged from a minimum of three
(Ferretti & Pomarico, 2013a; Ferretti & Pomarico, 2013b; Sarvar et al., 2012) to a
maximum of twelve (Shahmoradi & Isalou, 2013). With the sub-criteria, ranging from a
minimum of eleven (Isalou et al., 2013; Sarvar et al., 2012) to a maximum of twenty-four
by Ferretti (2011). Agarwal et al. (2013) in delineating ground water potential zone location
used ten criteria. Ferretti and Pomarico (2013a) in their ecological land suitability analysis
relied on three criteria and twelve sub-criteria. Sarvar et al. (2012) used three criteria and
eleven sub-criteria to aid in finding an optimum site for building neighbourhood parks.
Sabri and Yaakup (2008) assessed urban sprawl problem using four criteria and sixteen
sub-criteria.
There were also substantial differences in the number of criteria and subcriteria used in
studies dealing with similar decision/evaluation problems. For example, different sets of
criteria were considered by the studies on the waste management decision/evaluation
problem. Whilst Shahmoradi and Isalou (2013) considered twelve criteria, Ferretti and
Pomarico (2012) took into consideration four criteria and twenty sub-criteria. Isalou et al.
(2013) used four criteria and eleven sub-criteria in their study of site suitability for
landfilling municipal solid wastes.

17
Some of the criteria and sub-criteria adopted by the studies (Babalola & Busu, 2011;
Ferretti, 2011; Ferretti & Pomarico, 2012; Isalou et al., 2013; Shahmoradi & Isalou, 2013)
were related and can be put under the broad index of hydrology (distance from rivers and
water bodies, wells and springs (groundwater), accessibility (distance from roads, and
residential areas and distance from city/town), natural-topography (slope, wind direction,
and aspect) and general public acceptance index (soil texture, land use, and geology).
Apart from these general criteria, Babalola and Busu (2011) in determining sites that are
appropriate for landfill siting in Damaturu town, Nigeria used rainfall as one of the criteria
whereby the annual average rainfall data of the study area were collected and used. In
addition, Ferretti (2011) and Ferretti and Pomarico (2012) used other sub-criteria in
combination with the above mentioned criteria. They are: slides, flood areas, ground water
depth, elevation, river basin, watershed protection plan, an index of naturalness, water
quality index, distance to dangerous industries and population density of the area. Ferretti
(2011) added distance to land reclamation areas and distance to waste production centre.
In the area of risk assessment, Nekhay et al. (2007, 2009) considered six factors, and
Neaupane and Piantanakulchai (2006) measured five factors in their studies of risk
assessment. Four factors (criteria) cut across the studies, they are: rivers and streams
proximity/ channel proximity, land use and vegetation cover/ grass vegetation cover
factors, slope steepness and slope length. In evaluating soil erosion risk in Spain, Nekhay
et al. (2007, 2009) also made use of rainfall runoff factor and soil erodibility. Whiles,
underlying geology and groundwater hydrology were used by Neaupane and
Piantanakulchai (2006) in their landslide hazard assessment in Nepal.

18
2.2.4 Methodology and Software
In terms of the methodology employed, apart from the GIS and ANP techniques, a few
studies included other methods. Example, Agarwal et al. (2013) combined remote sensing,
GIS and ANP. Ferretti (2013b) combined Ordered Weighted Average (OWA) with ANP
and GIS, while Shahmoradi and Isalou (2013) and Isalou et al. (2013) used GIS, integrated
fuzzy logic and ANP models. In applying the ANP method, the existing studies made use
of the various steps introduced by Saaty (2006) which include the following: (1) Definition
of the network structure; (2) Pairwise comparison of elements in clusters; (3) Forming the
super matrix by putting all weights yield from last step; (4) Forming the weighted matrix
by multiplying weights of clusters to super matrix; (5) Forming the limit matrix; and (6)
Synthesizing the results to get the priorities. In order to determine the weights among the
attributes as well as criteria, the studies used pairwise comparison and the matrix
manipulation method, which involve computing the unweighted supermatrix, weighted
supermatrix, and the limit matrix (Saaty, 1999; 2006).
The software utilized to carry out the ANP computations had variations among studies.
The most common software was the Super Decisions software (Babalola & Busu, 2011;
Ferretti, 2011; Ferretti & Pomarico, 2012; Ferretti & Pomarico 2013a, 2013b; Nekhay et
al., 2007, 2009; Sabri & Yaakup, 2008; Sarvar et al., 2012; Shahmoradi & Isalou, 2013).
Super Decisions software aids in the creation of the network structure of the
decision/evaluation problem, the interdependence of the clusters and further, implements
the ANP for the pairwise comparisons.

19
Few studies used MATLAB (Isalou et al., 2013; Neaupane & Piantanakulchai, 2006).
Others used MATLAB in addition to Super Decisions software (Nekhay et al., 2007, 2009).
Nekhay et al. (2007, 2009) argued that, Super Decisions software supports only a simple
cluster comparison and in order to reach the weighted supermatrix they relied on
MATLAB. Whiles Sarvar et al. (2012) used the MATLAB to process the results of the
questionnaire from experts. Aside Super Decisions and MATLAB, Isalou et al. (2013),
Sabri and Yaakup (2008) and Sarvar et al. (2012) used Microsoft office excel. For example,
Isalou et al. (2013) used Excel for the ANP calculations.
The ANP technique and its computation software do not include cartographic functions, as
a result, GIS software was employed by the existing studies. GIS software was used to
develop layers of spatial information (thematic maps), displaying and representing the
results of the ANP computations, standardization of maps, carrying out overlay analysis of
the weighted and criterion maps, site identification and modelling the final maps. Many of
the studies used ArcGIS (Babalola & Busu, 2011; Isalou et al., 2013; Nekhay et al., 2007,
2009; Sabri & Yaakup, 2008; Sarvar et al., 2012), few studies used ILIWIS (Ferretti, 2011;
Ferretti & Pomarico, 2012; Ferretti & Pomarico, 2013b) and IDRISI (Ferretti & Pomarico,
2013a).
2.2.5 Effectiveness of the ANP Method and Advantages of Integrating GIS with ANP
The effectiveness of the ANP method for tackling the decision/evaluation problems has
been reported in some of the reviewed studies. According to Khan and Faisal (2008) ANP
helped in arriving at a more holistic conclusion and provided an understanding as to why a

20
waste disposal alternative ought to be preferred. The capability of ANP to account for
interdependencies between the factors and the different importance of the factors used in
the evaluation was emphasised by several studies (Ferretti, 2011; Ferretti & Pomarico
2013a; Isalou et al., 2013; Neaupane & Piantanakulchai, 2006; Nekhay et al., 2009; Sarvar
et al., 2012). Nekhay et al. (2009) stated that ANP allowed them to model the
interdependence of the processes responsible for soil erosion and also resolved the
complexity of the physical process of soil erosion through the introduction of expertise into
the evaluation exercise. Further, Isalou et al. (2013) in their study of site selection for
landfilling municipal solid wastes acknowledged that applying the ANP model provided
the possibility of assessing effective relationships of each discrete criterion on each other
and on its overall goal in the form of network. Ferretti (2011) in her study of land
suitability assessment for siting a municipal solid waste landfill also argued that the
application of ANP allowed the dependence relationships among the criteria to be assessed,
and the relative importance of all the elements that play an influence on the final choice to
be evaluated. Therefore, ANP is a useful tool to help in making the decision/evaluation
process traceable and reliable.
The reviewed studies further indicated the ability of GIS as a veritable tool for decision
support. Babalola and Busu (2011) in their study demonstrated the efficiency of GIS in the
site selection process for landfill. The efficacy of integrating ANP and GIS has been
alluded to in the reviewed studies as giving a favourable result (e.g. Babalola & Busu,
2011; Sabri &Yaakup, 2008). Neaupane and Piantanakulchai (2006), Sarvar et al. (2012)
and Agarwal et al. (2013) acknowledged the efficiency of GIS-ANP in dealing with
complex decision/evaluation problems. For example, Neaupane and Piantanakulchai

21
(2006) in their study generated a hazard map of potentially unstable parts in lesser
Himalayas to demonstrate the successful application of the method. Sarvar et al. (2012)
specified that combining the final criteria weights using the ANP model with the GIS
capability showed proper areas for locating neighbourhood parks at districts of the city.
According to Ferretti and Pomarico (2013a) spatial ANP is a powerful tool for solving
complex problems with connections and correlations among multiple objectives as
recorded in their evaluation of land suitability for ecological connectivity. Thus, the
integration of GIS and ANP methods provides a mechanism with which complex issues
can be carefully explored and immediate feedback for decision-makers (DM) provided.
Further, other studies confirmed the ability of GIS-based ANP to be able to evaluate the
decision problem in the event of limited data; uncertainty (Neaupane & Piantanakulchai,
2006; Nekhay et al., 2007; 2009) as noted with the conventional approach by Banai (2010).
In addition, GIS-based ANP allows handling of heterogeneous information and provides a
significant contribution in the strategic decision-making phase (Ferretti & Pomarico,
2013b). The integrated approach affords the means by which to execute complex trade-offs
on multiple evaluation criteria while taking the DM’s preferences and the spatial variability
of the criteria into account (Ferretti & Pomarico, 2012). Ferretti (2011) and Ferretti and
Pomarico (2012) alluded to the suitability of the GIS-ANP method for assessing real world
problems. Through feedback enabled by the network structure of ANP, it better captures
the complex effects interplay in human society.

22
2.3 Housing Quality
2.3.1 Introduction
This section first examines the definition of the concept of housing quality and the
measurement approaches used in evaluating housing quality. This is followed by the types
of indicators used to operationalize the concept.
2.3.2 Concept of Housing Quality
Housing quality has long been an important benchmark for measuring the condition of the
living environment of humans and how it meets their needs. Housing quality was originally
considered as one of the six housing norms including: space, tenure, structure type,
expenditure, and neighbourhood norms as identified in the housing adjustment and
adaptation theory of Morris and Winter (Morris et al., 1976, as cited in Ibem 2012; Yust,
Hadjiyanni & Ponce, 1997). Norms as put forward by the housing adjustment and
adaptation theory comprised of culturally derived criteria that households use to judge their
housing and that of others (Yust et al., 1997).
Housing quality has been interpreted in many ways. According to Lawrence (1995) the
concept is a complex one that is neither absolute nor static. As a result, it varies between
countries and among specific groups of people in each country at varying time scales. The
concept of housing quality has attracted the attention of researchers from many disciplines,
which has resulted in a wide range of contributions to the subject. Currently, there is no
universally accepted definition as the concept has been defined and interpreted variously
across disciplines and researchers.

23
Aliu and Adebayo (2010) adopted a theoretical definition by considering housing quality
as a function of six latent indices, namely neighbourhood prestige, living convenience,
location, use value, structural design and mobility control. Lee and Oh (2012) defined the
scope of quality of housing as covering all areas including the characteristics of residential
service that are formed based on various elements. These elements include an indoor
residential environment, an environment of an inner complex, an environment of complex
surroundings, a service brand and other factors. Rindfuss et al. (2007) considered the
quality of housing from the health and affordability standpoint. They defined quality as
including characteristics (those required for public health, including toilet facilities,
cooking facilities, and protection from the elements) in addition to the value of housing.
Other scholars have adopted definitions that highlighted the characteristics of the dwelling
units; for example, Kurian and Thampuran (2011) argued that a good habitat requires
enough space, separate rooms for different purposes and enough privacy, good climatic
conditions such as enough sunlight, free passage of air and availability of water nearby,
good drainage and sanitary facilities. Likewise, Ibem (2012) used the concept to refer to
those highly valued attributes or defining characteristics of housing (such as durability of
construction materials, structural soundness, spatial adequacy etc.) that appeal to
occupants’ needs.
From the foregoing, it can be deduced that the definition of housing quality embraces
many factors, which include the physical condition of the building and other facilities and
services that make living in a particular area conducive (Aribigbola, 2008). In addition, it
can be observed that, housing quality as used by the different authors is a multifaceted
abstract term that has cultural, social and economic connotations. It accounts for both

24
quantitative and qualitative aspects of residential units, their immediate surroundings, and
the needs of the occupants (Meng & Hall, 2006). Further, the concept can be seen as an
expression of an idea, which proposes that a project or development is closer to perfect or
further away from perfect (Ibem, 2012). This means that what constitutes an ideal is context
specific and varies among individuals and different socioeconomic groups. While for some
researchers, the ideal lies within existing standards and codes, for others, the ideal lies
within what users interpret as ideal (Amole, 2008).
2.3.3 Measurement of Housing Quality
Housing quality as a multi-dimensional and complex concept is difficult to define and to
measure. As a result, researchers have used different ways of measuring it. Lawrence
(1995) argued that given the wide range of contributions on the subject, there has been little
consensus about the means and measures used to assess housing quality. Lawrence (1995)
identified three approaches that focus on:
(i) the point-of-view of the individual, be it that of an architect, a building
contractor, a housing administrator, or a resident; by this approach, people are meant to
evaluate a specific residential environment using one or more sociological and/or
psychological research methods,
(ii) the material/quantifiable characteristics of housing, especially in terms of the
external appearance of residential buildings and their functional, technical and construction
components, and
(iii) the supply of housing (annual construction output), of the cost of new
residential buildings, of the rationale and outcomes of housing construction grants to public
authorities and private firms, and of housing subsidies and allowances to households.

25
A review of the housing quality literature indicates that two primary methodological
approaches are used in measuring housing quality: objective (quantitative) and subjective
(qualitative) approaches (see Table 2.2). The quantitative aspect of housing quality refers
primarily to the structural, material, social and economic constituents of housing products
or outcomes that can be measured and that result from the performance of the housing
sector. These factors include: price, tenure, economic impacts, environmental impacts and
structural norms of housing standards (Meng & Hall, 2006). Others include physical
characteristics, facilities and services in dwellings (Mohit, Ibrahim, & Rashid, 2010). On
the other hand, the qualitative dimension is much more subjective. It represents the
perceived meanings and values of factors such as the ‘comfort’ or ‘quality of life’ that are
afforded by different dwelling types, lifestyles, and the preferences and expectations of the
inhabitants (Meng & Hall, 2006). As a result, what is considered as perfect lies within the
purview of inhabitants. This implies that what is perceived as high quality, by one person
or group of persons may be of limited or low quality to other individuals. Therefore, this
perception is closely related to the psychosocial aspects of the resident. This approach is
therefore considered as ‘bottom-up’ approach, since the assessment is from the point of
view of the residents themselves.

26
Table 2.2: Relevant Studies on Housing Quality
Study (Year)
City
Approach
Method and
Software Used
Data
Indicators
Mapped
Results
Spain, 1990
USA
Objective
Statistical
Annual Housing
Survey data,
1983.
Environmental
Social
Muoghalu,
1991
Benin,
Nigeria.
Objective
Similar to
Appraisal Method
- assignment of
penalty scores to
houses that fail to
meet minimum
standards
Fieldwork
Physical
Social
Can, 1992
City of
Syracuse
(NY)
Objective
Multivariate
statistics
(Factor analysis)
and Multicriteria
analysis
(Generalized
Concordance-
Discordance
Analysis)
US Census
Bureau’s
TIGER files and
the Census of
Population and
Housing, 1980
Summary Tape
File 1
Physical
Economic
Social
Yes
Beamish,
1994
USA Objective Stepwise
Regression
Census Data,
1980.
Physical
Social
Cook and
Bruin, 1994
USA
Integrated
Stepwise
Regression
National
American
Housing
Survey (AHS),
1987.
Environmental
Social
Fiadzo,
Houston
and Godwin,
2001
Ghana
Objective
Cronbach’s
Alpha and Factor
Analysis.
Core Welfare
Indicators
Questionnaire
(CWIQ) survey
of 1997.
Social
Physical
Economic
Environmental
Meng and
Hall, 2006
Lima, Peru.
Objective
Multicriteria
Analysis- Simple
Multi-attribute
Analysis (MCA)
Micro-level
census data
(households)
Physical
Social
Economic
Yes
(ArcGIS)
Olotuah,
2006
Oba-Ile-
Nigeria.
Subjective Multiple
Regression
Analysis
Field survey
(questionnaire)
Physical
Environmental
Rindfuss,
Piotrowski,
Thongthai and
Prasartkul,
2007
Nang Rong
District,
North-East
Thailand.
Subjective
Standardized
subjective rating
process
(also called,
Relative
Housing Quality
Method)
Interviews
Physical

27
Coker,
Awokola,
Olomolaiye,
and Booth,
2008
Ibadan
Objective
American Public
Health
Association
(APHA)
Method-
Penalty scoring
Field survey:
Housing quality
Survey Form
(HQSF) and
Environmental
Survey Form
(ESF).
Physical
Aliu and
Adebayo,
2010
Lagos
State,
Nigeria.
Objective
Logistic
Multivariate
Technique
Structured
questionnaires
Physical
Environmental
Aderamo
and Ayobolu,
2010
Ilronin,
Nigeria.
Objective
Factor Analysis
Primary
(structured
questionnaire)
and Secondary
sources.
Environmental
Physical
Economic
Yes
Jiboye 2010b
Osogbo,
Nigeria.
Subjective
Descriptive
statistics and
Analysis of
Variance
(ANOVA)
Questionnaire
Physical
Jiboye, 2011
Southwest
Nigeria.
Subjective
Analysis of
Variance test
(ANOVA) and
SPSS
Questionnaire
Physical
Environmental
Kurian and
Thampuran,
2011
Kerala
Subjective
Stepwise
Multiple
Regression
Model and SPSS.
Survey
(questionnaire)
Physical
Environmental
Amao, 2012
Apete-
Ibadan,
Nigeria.
Objective
Correlation
Analysis
Questionnaire
administration
and personal
observation
Physical
Environmental
Bradley and
Putnick,
2012
28
Developing
Countries.
Objective
Statistics
(ANOVA)
The Multiple
Indicator Cluster
Survey (MICS),
2005–2007
Physical
Buckenberger
2012
Manukau
City,
Auckland
Region,
New
Zealand.
Subjective
Qualitative-Nvivo
In-depth
interviews and
brainstorming
Physical
Environmental
Ibem 2012
Nigeria
Subjective
Descriptive
statistics,
Categorical
Regression
Analysis and
SPSS
Cross sectional
Survey
(structured
questionnaires)
Physical
Environmental
Management
Lee and Oh,
2012
Korea
Integrated
Housing Quality
Index (HQI)
Scoring Method
and Market
Participant Study
Method.
Questionnaire,
Real estate
pricing
Physical
Environmental

28
Due to the high local and regional disparities in the quantitative and qualitative dimensions
of housing quality, it is challenging to define a standardized set of criteria and indicators
that apply equally to all areas at all times. Further, it is challenging to capture broad-based
meanings and principles of qualitative concepts such as comfort and quality of life if only
quantitative indicators are used (Meng & Hall, 2006). Currently, there are calls to integrate
both approaches.
With regard to the reviewed studies, the two major approaches (objective and subjective)
were dominant with few adopting an integrated approach (Table 2.2). Studies by Aliu and
Adebayo (2010), Amao (2012), Beamish (1994), Bradley and Putnick (2012), Can (1992),
Coker et al. (2008), Cook and Bruin (1994), Fiadzo et al. (2001), Meng and Hall (2006),
Muoghalu (1991) and Spain (1990) adopted objective approach. Aderamo and Ayobulu
(2010), Buckenberger (2012), Ibem (2012), Jiboye (2010b; 2011), Kurian and Thampuran
(2011), Olotuah (2006) and Rindfuss et al. (2007) provide examples of a subjective
approach. Cook and Bruin (1994) and Lee and Oh (2012) applied an integrated approach.
2.3.4 Types of Indicators
Housing quality is usually evaluated from the perspective of economic, social and/or
physical conditions (Francescato, Weidemann, Anderson & Chenoweth, 1979; Jiboye,
2010b). Economic criterion seeks to provide the relationship between rent and income;
physical criterion focuses on the integrity of the dwelling in terms of design, appearance
and appropriateness of fixtures; while social criterion relates to the incidences of diseases
and the degree of overcrowding (Jiboye, 2010b).

29
According to Meng and Hall (2006) four criteria provide the basis for identifying indicators
to produce a meaningful housing quality index (HQI). These include objective,
scientific/technical, management, and socio-cultural criteria. Each class of criteria has its
own concerns that govern the selection of specific indicators from available data resources.
The indicators of the objective criteria should represent the local environment and must be
comprehensive enough to address problems that include poverty and inequity in the
housing sector. With regard to the scientific/technical criteria, the indicators ought to be
separable into geographically localized components and must be based on household-level
data so that they can be measured both locally and globally as well as spatially in order to
identify statistical and spatial distributions of HQI. Regarding the management criteria,
indicators should be easily obtained from available data and succeeding calculations and
must be easy to understand, and cost-effective so that the analysis of housing quality and
housing segregation can be effectively utilized by policy makers within a study area.
Lastly, the indicators of social and cultural criteria should contain the preferences and
priorities of the community in the housing programs. And that, local participants should be
able to appraise indicators selected from the above criteria to make housing enhancement
proposals acceptable relative to local norms and expectations.
Kutty (1999) stipulated that commonly used indicators of housing quality include structural
adequacy, neighbourhood quality, residents’ perception of neighbourhood safety, level of
public services provided, access to work and other amenities, room density and housing
affordability.

30
2.3.4.1 Indicators used by Empirical Studies
As suggested above, there is little consensus about the indicators that should be used to
examine housing quality within specific cities. This has resulted in considerable variability
in the indicators that are adopted. They can broadly be grouped under four headings:
physical, environmental, social and economic criteria. Each class of criteria incorporates
variables/ indicators that are used to operationalize them.
The physical criterion of housing quality considers the quality of housing in terms of
adequacy and availability of basic housing infrastructures, suitability of the building
design, integrity of the building elements (physical sustainability) as well as that of fixtures
within the dwellings. Indicators such as the adequacy and availability of basic housing
infrastructures (internal facilities/amenities or housing services) include variables such as
the presence of water, presence of electricity, access to solid and liquid waste treatment,
type of toilet, type of kitchen etc.; suitability of the building design have aesthetics, number
of storeys; the integrity of the building elements (physical sustainability) looks at physical
quality and have variables such as material quality (type of wall materials, type of floors,
type of roof, whether walls are painted or not etc.).
The environmental criterion reflects environmental quality of neighbourhoods and takes
into account location, environmental sanitation and neighbourhood facilities (basic
infrastructures). That is, accessibility/ proximity to facilities (schools, market, banks etc.),
mode of refuse collection and frequency, external environment of house, landscape,
neighbourhood prestige etc.

31
Regarding the social criterion, it takes into account the space and household density.
Overcrowding (number of persons per room, households per house) is used as an indicator
for the social criterion which considers density. The economic criterion which reflects
housing affordability is defined in terms of such measures as: tenure, gross rent, housing
cost burden (percentage of household income devoted to housing), housing value, etc.
Regardless of the methodological approach (subjective or objective) adopted, the
indicators did not differ much as they overlap the different approaches. Except for the
accessibility and distance factors that was embraced much by the studies that used the
objective approach. For example, with respect to the subjective approach, Jiboye (2010b)
in assessing housing quality in Nigeria used indicators such as the adequacy and
availability of basic infrastructures like water, electricity and road, access to solid and
liquid waste treatment; suitability of the building design; the integrity of the building
elements like doors, windows, roofs, floors and walls, as well as that of fixtures within the
dwellings. Ibem (2012) used housing unit attributes (number of bedrooms, size of kitchen
and storage, size of bedrooms); housing services and infrastructure (sanitary and drainage
facilities, power supply, portable water supply, external lighting, garbage disposal
facilities); and neighbourhood facilities (public transport service, playground for children,
healthcare facilities, educational facilities) to study residents’ perception of the quality of
public housing in urban areas in Ogun State, Nigeria. Likewise, Olotuah (2006) in
assessing housing quality in suburban areas in Oba–Ile, Nigeria used variables consisting
of age of buildings, number of bedrooms, household size, type of kitchen, use of kitchen,
regularity of electricity supply, type of toilet, use of toilet etc. Rindfuss et al. (2007) in
measuring housing quality in Thailand used lagged indicators consisting of the size of the
32
house, the number of storeys, state of repair, roof material, whether walls are painted and
whether the walls of concrete block have a finish, etc.
With regards to studies that applied the objective approach, Fiadzo et al. (2001) in
assessing housing quality in Ghana, constructed, and used housing quality index
comprising structural quality (e.g. type of wall and roofing material), physical amenities
(cooking fuel, lighting fuel, source of drinking water and type of sanitation), accessibility
of location and quality of life amenities (distance to the nearest source of drinking water,
markets, schools, health centres, public transportation). Spain (1990) adopted the number
of persons-per-room (overcrowding), housing value, gross rent and tenure as indicators of
housing quality against which he appraised the importance of race, residential mobility,
household composition, gender and other factors in the United States of America.
Similarly, Cook and Bruin (1994) using an integrated approach relied on three housing
indicators: crowding, affordability and satisfaction examined the extent to which White,
African-American and Hispanic single-parent women experienced housing problems.
Further, Lee and Oh (2012) using indicators such as: indoor residential environment, an
environment of an inner complex, an environment of complex surroundings, a service
brand and other factors, included variables such as the sufficiency of open space, that is,
the adjacent park, the quality of the educational environment, distance to bus stop, distance
to elementary school, the number of rooms and size, structure of apartment etc. in assessing
housing quality in Bundang New Town, Korea.

33
2.3.5 Determinants of Housing Quality
From the findings of the studies it can be deduced that, the physical aspect of housing tends
to affect the quality of dwellings more as most of the studies identified it as a factor or had
the residents mentioning variables relating to physical criteria as impacting on their
housing quality when the subjective approach was used. Aderamo and Ayobolu (2010)
revealed that five structural variables affect housing quality including: basic facilities,
energy and ownership, material quality, water quality, and utility factors. Kurian and
Thampuran (2011) in their assessment of housing quality using location, infrastructure,
design, aesthetics, materials and construction techniques, sustainability and concept (ideas
individuals have about their dwellings in terms of design, type of building, materials to be
used etc.) as their indicators found that the order of importance regarding housing quality
in Kerala, India is as follows: materials and construction techniques, sustainability,
aesthetics, concept, infrastructure, design and location. Further, Jiboye (2011) found that
the quality of residential neighbourhoods of Bodija and Moremi Estates in Nigeria is
determined and affected by factors which deal mainly with the quality of the dwelling,
environment and those that are demographic in nature. Factors that deal with the quality of
dwelling include: satisfaction with building design and adequacy of storage spaces and
room sizes, privacy level, adequate security, ventilation, lighting conditions and suitability
of dwelling components such as roof, wall, floor, window etc. Amao (2012) found that a
positive and significant relationship exists between housing quality and variables like
ventilation, lighting, spaces, aesthetic, security, drainage, sanitation, type of construction
materials, landscape, and external environment of the house. This implies that housing
quality in the study area tends to increase as the conditions and availability of these
variables (ventilation, lighting, spaces, aesthetic, security, landscape, sanitation, type of

34
construction materials and external environment of the house) improves within the area.
Using a multiple regression model to assess housing quality in suburban areas of Nigeria,
Olotuah (2006) found that there is a significant relationship between housing quality and
three predictor variables: age of buildings, use of toilet and frequency of collection of
refuse. Buckenberger (2012) indicated that the quietness of the location and the proximity
to schools were very important for families. On the other hand, physical (fixed elements)
quality attributes were central to their dwelling perceptions.
Other studies established a relationship between income, tenure and education on the one
hand and housing quality, on the other hand. Amao (2012) argues that it is the income of
the household that determines the quality of the house as most of houses with poor
condition belong to the low income category. This is because income influences the type
of structure that is built. Further, Ibem (2012) in his study of resident’s perception of the
quality of public housing in urban areas in Ogun State, Nigeria found that housing delivery
strategies, spatial deficiencies in housing units, organizational capacity of housing
providers, age, income, education and tenure status of the residents were the key factors
influencing residents’ perception of housing quality. Spain (1990) using the number of
persons-per-room (overcrowding), housing value, gross rent and tenure as indicators of
housing quality against which he evaluated the importance of race, residential mobility,
household composition, gender and other determinants in the USA found that factors such
as marital status, household composition, income and race had significant influence on
housing quality.

35
2.3.6 Methods
Most of the studies employed statistical methods for creating housing quality index
(Aderamo & Ayobulu, 2010; Aliu & Adebayo, 2010; Beamish, 1994; Bradley & Putnick,
2012; Cook & Bruin, 1994; Fiadzo, et al, 2001; Ibem 2012; Jiboye, 2010b, 2011; Kurian
& Thampuran, 2011; Olotuah, 2006; Spain, 1990). The statistical methods used include:
factor analysis (Aderamo & Ayobulu, 2010), multiple regression analysis (Olotuah, 2006),
stepwise regression (Beamish 1994; Cook & Bruin, 1994) and stepwise multiple regression
model (Kurian & Thampuran, 2011). Ibem (2012) used categorical regression analysis and
descriptive statistics, and Jiboye (2010b) used descriptive statistics and ANOVA. Fiadzo,
et al. (2001) however, adopted factor analysis and Cronbach’s alpha in creating a housing
quality index.
Some studies adopted what can be termed as the scoring method (see Coker et al., 2008;
Lee & Oh, 2012; Muoghalu, 1991). The method involves assigning penalty scores to
buildings that failed to meet minimum standards. Coker et al. (2008) used the method by
the American Public Health Association (APHA) which involves a system of penalty
scoring rather than positive scoring. That is, the higher the arithmetic score of the condition
under evaluation, the more substandard is the situation. Muoghalu (1991) used a method
which is similar to the appraisal method employed by the Committee on the Hygiene of
Housing in the USA. Meng and Hall (2006) and Can (1990) adopted multicriteria analysis.
Can (1990) integrated multicriteria analysis (generalized concordance-discordance
analysis) with a statistical method (factor analysis).

36
2.4 Summary and Conclusion
The review of relevant studies indicates that there is a very limited research about
integrating GIS and ANP. As far as the author is aware there is no study that used GIS-
ANP for evaluating housing quality. In terms of the evaluation criteria used for assessing
the decision/evaluation problems, the review reveals that the ANP method can be used for
tackling problems with a number of criteria ranging from 6 to 24. However, many studies
argue that with an increase in the number of criteria, the complexities increase in relation
to the pairwise comparisons (Bayazit, 2006; Begicevic, Divjak, & Hunjak, 2010; Ferretti
& Pomarico, 2013b; Nekhay et al., 2007, 2009; Wolfsleher et al., 2005).
Further examination of the literature reveals that, though ANP is new to the field of GIS,
the method can be applied to deal with a wide range of decision/evaluation problems. This
affirms that the method has potential to be applied to any decision/evaluation problem,
provided that the accurate evaluation criteria are identified and there are some
dependencies among them.
From the housing quality review, it was found that a single standardized set of indicators
or variables is not available for assessing housing quality. However, there were similarities
among the indicators and variables. For example, in the USA, Spain (1990) used two
criteria (social and economic) with four variables (crowding, housing value, gross rent and
tenure) and Beamish (1994) used two criteria (physical and social) with three variables:
age of structures, units that were crowded and units that lacked plumbing.
Housing quality variables used in developed countries did not differ much from those
adopted by studies in developing countries. However, due to lack of active housing market

37
in most developing countries, the economic criterion variables (housing value, housing cost
burden, gross rent, etc.) were not used much by studies (especially those that adopted
objective approach) in developing countries. Studies such as Fiadzo et al. (2001), Meng
and Hall (2006) and Aderamo and Ayobolu (2010) only used tenure as part of their
variables. It was revealed that most studies in developing countries relied typically on the
physical criterion. This can be attributed to the data availability and accessibility of relevant
datasets. With regards to the approach, it was found that whether the study was done in
developed or developing country did not impact the adopted approach as the approaches
overlap across studies.

38
CHAPTER THREE
THE GIS-ANP METHOD
3.1 Introduction
This chapter presents the GIS-based Analytic Network Process (GIS-ANP) approach for
evaluating the quality of housing. A background of GIS based multicriteria decision
analysis (GIS-MCDA) is discussed first, followed by a description of the ANP method.
The main section of the chapter presents the GIS-ANP framework to be used for the
empirical study of housing quality evaluation.
3.2 Multicriteria Decision Analysis
Multicriteria decision analysis (MCDA) is a family of techniques that aid decision makers
in properly structuring multi-faceted decisions and evaluating decision alternatives on the
basis of multiple, conflicting criteria and selecting the best alternative(s) under the presence
of diverse criterion priorities (Greene, Devillers, Luther, & Eddy, 2011; Jankowski, 1995;
Voogd, 1983). The fundamental principle of multicriteria decision-making is that decisions
should be made by use of multiple criteria (Cheng, Li, & Yu, 2005).
MCDA allows complex qualitative and quantitative information to be appraised and
measured in a systematic way while taking account of subjective views of the evaluation
criteria and their relative importance. Criterion in the context of MCDA is a generic term
that includes both the concept of attributes and objectives (Malczewski, 1999).
Consequently, two broad classes of multicriteria decision analysis or decision problems
can be distinguished: multiattribute decision analysis (MADA) and multiobjective decision

39
analysis (MODA) (Hwang & Yoon, 1981). Attributes are properties of real-world
geographical system. They are used as the measurements of preference related to
objectives. While objectives is a statement about the desired state of the system under
consideration and are functionally related to, or derived from, a set of attributes
(Malczewski, 1999).
Multiattribute decision problems have usually specific single objective or overall goal (e.g.,
site suitability analysis for housing development) and are connected with a finite set/limited
number of predetermined alternatives and discrete preference ratings (Jankowski, 1995;
Tzeng & Huang, 2011; Zanakis et al., 1998). The set of alternatives are known and the
MADA procedure involves evaluating and ordering the alternative decisions and selecting
the best or most preferred alternative. However, multiobjective decision problems have
multiple (conflicting) objectives which are to be achieved simultaneously while evaluating
a very large or an infinite set of feasible alternatives. The multiobjective analysis is model-
oriented, where the alternatives must be designed using the methods of mathematical
programming of optimization problems (Jankowski, 1995; Tzeng & Huang, 2011). For the
most part, GIS-MCDA belongs to the domain of multiattribute analysis (Malczewski,
2006) within which this research is situated.
3.3 Spatial Multicriteria Analysis
Conventional MCDA techniques have largely been non-spatial. Given the limited
capabilities of conventional MCDA to analyse and visualize the geospatial
data/information, the combination of the MCDA methods with spatial analysis and
visualization techniques could improve the decision support procedures in terms of

40
presenting and communicating the results to the decision makers. Hence, there is
opportunity for integration of MCDA methods with GIS (Carver, 1991).
Spatial MCDA is a process that consists of procedures involving the utilization of
geographical data and the preferences of the decision maker (DM), and the manipulation
of data and preferences according to specified decision rules. Spatial MCDA takes
advantage of both the capability of GIS to manage and process spatial information (facts)
and the ability of MCDA to aggregate the geographical data with value-based information
(decision maker’s preferences) into one-dimensional value (Malczewski, 1999).
According to Ferretti and Pomarico (2012) the foremost benefit of the GIS-MCDA
integration is the fact that decision makers can introduce their own opinions (preferences
with respect to evaluation criteria) into the decision making process and receive feedback
on their influence in policy evaluations through geovisualization. Integration of GIS and
MCDA support a decision-making process through a systematic, transparent and replicable
approach enabled by use of thematic maps.
3.4 GIS-based (spatial) Multicriteria Decision Analysis Framework
Decision making is a process; hence, it involves a sequence of activities. Malczewski
(1999) outlined the sequence of activities in the GIS-MCDA framework which involves
the following components: defining the decision problem, identifying evaluation criteria
and constraints, determining decision alternatives, criteria weighting, applying a decision
rule, performing sensitivity analysis and making a recommendation (see Figure 3.1).

41
The decision making process starts with recognition and definition of a decision or
evaluation problem to be solved. At this phase, GIS provides a support of the decision
making process by its capability to store, manage, retrieve and analysis of spatial data.
After articulating the decision problem, a set of evaluation criteria (objectives and
attributes) is identified on the basis of which the alternatives are evaluated. Attributes are
a measure of achieving the objectives, which reflects all concerns relevant to the decision
problem. The evaluation criteria are represented in the form of maps, otherwise referred
to as criteria/attribute maps, thematic or data layers. The criterion map is a geographical
attribute of the alternatives which are used to evaluate their performance. Identification of
decision alternatives defined geographically in terms of location, spatial pattern etc.
follows. Alternatives are defined in terms of restrictions (constraints) which determine
feasible alternatives. They are often generated in GIS based on spatial principles of
proximity, connectivity and overlay methods.
Alternatives
Decision- maker’s
Preferences
Constraints
Decision
Rules
Sensitivity
Analysis
Recommendation
Problem
Definition
Decision
Matrix
Evaluation
Criteria
Figure 3.1: Spatial Multicriteria Decision Analysis Framework (Source: Malczewski, 1999).

42
Decision maker’s preferences regarding the evaluation criteria are then incorporated into
the analysis in terms of weights (importance of each criterion relative to other criteria).
Decision makers’ preferences reflect their values and interests with respect to the
evaluation criteria. The evaluation criteria, alternatives and criteria weights are usually
organized in the form of an evaluation matrix.
The decision rule phase integrates the preceding steps. A decision rule determines how
best to evaluate alternatives or to decide which alternative is preferred to another by
allowing the ordering (ranking) of the alternatives. It integrates the data (geographical data
layers) and information on a set of alternatives and decision makers’ preferences into an
overall assessment of each alternative. The robustness of the results (rankings of
alternatives) is determined through sensitivity analysis, which involves ascertaining the
effects of changes in the inputs (geographical data and decision maker’s preferences) on
the outputs (ranking of alternatives). If modifications of inputs do not affect the outputs
considerably, the ranking is considered robust.
The final stage of the procedure is the recommendation phase. It is based on the ranking of
the alternatives and the sensitivity analysis. Recommendation may include the best
alternatives or set of alternatives for implementation.
3.5 Analytic Network Process (ANP)
The ANP method is an extension of the Analytic Hierarchy Process (AHP). Unlike AHP,
the ANP approach does not make any assumptions about the independence of higher-level
elements from lower level elements in a hierarchy or about the independence of the
elements within a level in the hierarchy. As a result, ANP utilizes a network structure

43
without the need to specify levels (Saaty, 2004). ANP extends the applications of the AHP
to incorporate components, dependence and feedback using the supermatrix approach
(Saaty, 1996).
Many decision problems cannot be structured hierarchically as they involve the interaction
and dependence of high-level elements on lower-level elements. Not only does the
significance of the criteria define the significance of the alternatives in a hierarchy, but also
the significance of the alternatives themselves defines the importance of the evaluation
criteria. Consequently, in ANP the decision alternatives can rely upon criteria and each
other as well as criteria can rely upon alternatives and other criteria (Saaty, 2001). The
hierarchical relation between criteria and alternatives are generalized to the network
structure. The network structure of ANP makes it possible to model various criteria
without concern about the order of priorities. Therefore, ANP can be considered as a
system-oriented method. It provides the possibility to take interdependencies between the
decision factors into consideration by allowing interaction and feedback within clusters
(inner-dependence) and between clusters (outer-dependence). The fundamental concepts
behind the ANP approach has been summarized by Saaty (1999) as follows; the ANP
method:
1. is built on AHP;
2. by allowing for dependence, the ANP goes beyond the AHP by including
independence and hence also the AHP as a special case;
3. is a nonlinear structure that deals with sources, cycles, and sinks.
A hierarchy is linear, with a goal in the top level, and the alternatives in the
bottom level;

44
4. deals with dependence within a set of elements (called inner dependence)
and among different sets of elements (called outer dependence);
5. makes possible the representation of any decision problem without concern
for what comes first and what comes next as in a hierarchy through its looser
network structure;
6. prioritize not just elements but also groups or clusters of elements; and
7. utilizes the idea of control hierarchy or a control network to deal with
different criteria, eventually leading to the analysis of benefits,
opportunities, costs, and risks.
The structural difference between the AHP (hierarchy) and the ANP (network) is illustrated
in Figure 3.2. A hierarchy is a linear top down structure with no feedback from lower to
upper levels, with the goal at the top level and the alternatives at the bottom level. Network
C2
Arc from component
C4 to C2 indicates the
outer dependence of
the elements in C2 on
the elements in C4
with respect to a
common property
C4
C3
C1
Feedback
Loop in a component indicates inner dependencies of
the elements in that component with respect to a
common property
Alternatives
Subcriteria
Criteria
A loop indicates that each
element depends only on
itself
element
Goal
component,
cluster
(Level)
Linear Hierarchy
Feedback Network with Components
having Inner and Outer dependence
among their Elements
Figure 3.2: Comparison of a Hierarchy with a Network (Source: Saaty, 2004).
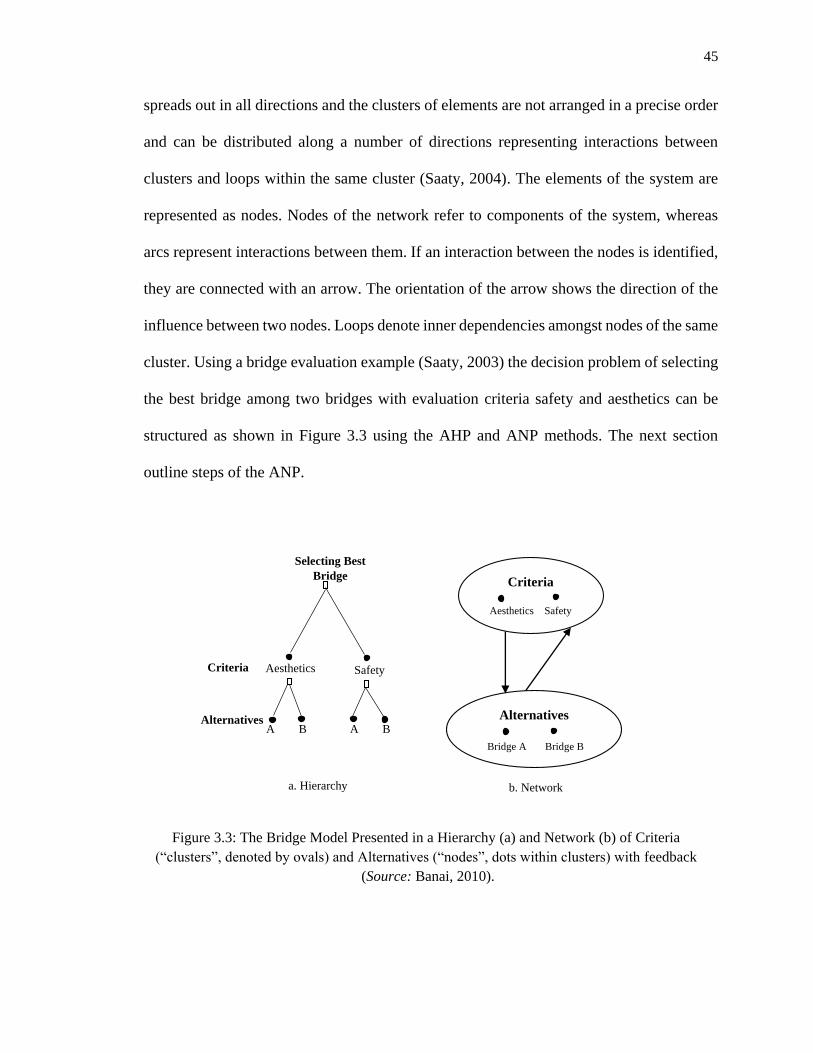
45
spreads out in all directions and the clusters of elements are not arranged in a precise order
and can be distributed along a number of directions representing interactions between
clusters and loops within the same cluster (Saaty, 2004). The elements of the system are
represented as nodes. Nodes of the network refer to components of the system, whereas
arcs represent interactions between them. If an interaction between the nodes is identified,
they are connected with an arrow. The orientation of the arrow shows the direction of the
influence between two nodes. Loops denote inner dependencies amongst nodes of the same
cluster. Using a bridge evaluation example (Saaty, 2003) the decision problem of selecting
the best bridge among two bridges with evaluation criteria safety and aesthetics can be
structured as shown in Figure 3.3 using the AHP and ANP methods. The next section
outline steps of the ANP.
Safety Aesthetics
Selecting Best
Bridge
A B A B
Criteria
Alternatives
a. Hierarchy
Criteria
Aesthetics Safety
Alternatives
b. Network
Figure 3.3: The Bridge Model Presented in a Hierarchy (a) and Network (b) of Criteria
(“clusters”, denoted by ovals) and Alternatives (“nodes”, dots within clusters) with feedback
(Source: Banai, 2010).
Bridge A Bridge B

46
3.6 The ANP Procedure
Decision making with ANP involves a sequence of steps along the lines outlined in
Figure 3.4.
Step 1: Model construction and problem structuring
This step entails developing the structure of the decision making process. It includes
defining the main objective and identifying groups or ‘clusters’ constituted by various
elements (‘nodes’) that influences the objective (Saaty, 2001). The clusters and elements
belonging to the respective clusters have to be determined; that is, the decision makers have
to determine a goal cluster, a criterion and sub-criterion cluster, and an alternative cluster
with possible influences between them identified. Further, the problem should be stated
and decomposed into a rational network system (Lee, 2010). The network construction
represents an important and a very creative phase in the problem-solving process.
Define the decision
problem
Connect (link) the
appropriate
elements in the
decision clusters
Perform pairwise
comparisons on the
clusters that influence each
other (because their
elements are linked)
Set up clusters and
elements in decision
(criteria, subcriteria and
alternatives)
Perform pairwise
comparisons on
elements based on
dependency linkages
Compute decision
supermatrices
Compute the limit
priorities of the
stochastic supermatrix
Synthesize to obtain
final priorities
Figure 3.4: Steps followed in the Analytic Network Process
(Source: Adapted from Saaty, 2008a).
47
Step 2: Pairwise comparison and determination of priority vectors
With regard to this step, the relative importance of each criterion with respect to the others
is carried out, in order to find the level of contribution of each criterion to the achievement
of its related objectives. Comparative or relative judgements are made on pairs of elements.
The relative importance values of each element are determined based on a ratio scale of
1–9, that is Saaty’s fundamental scale (see Table 3.1). Although this step is same for the
ANP and AHP methods, the basic question asked in ANP is considerably different from
that in AHP. It is expressed as follows: ‘‘with respect to the control (parent) element, given
a component of the network, and given a pair of components, how much more will one
member of the pair dominates (influence) the other component?’’, whiles in the AHP
method the question is about the dominance of one element over another with respect to
the parent component” (Nekhay et al., 2009, pg. 3097).

48
Table 3.1: Scale for Pairwise Comparison
There are two levels of pairwise comparisons in the ANP method: the cluster level, which
is more strategic, and the node/element level, which is more specialized (Ferretti, 2011).
Cluster comparisons involve comparing clusters with respect to another cluster. While
paired comparisons on the elements within the clusters themselves are performed according
to their influence on each element in another cluster they are connected to (outer
dependence) or on elements in their own cluster (inner dependence). Aside the two levels,
alternative comparisons are carried out whereby all the alternatives are compared with
respect to each of the elements within components. Comparison of elements is made
Intensity of Definition Explanation
importance
Source: Saaty (2004).
1 Equal importance Two activities contribute equally to the objective
2 Weak or slight
3 Moderate importance Experience and judgment slightly favor one activity over
another.
4 Moderate plus
5 Strong importance Experience and judgment strongly favor one activity over
another.
6 Strong plus
7 Very strong or demonstrated An activity is favored very strongly over another; its
importance dominance demonstrated in practice
8 Very, very strong
9 Extreme importance The evidence favoring one activity over another is of the
highest possible order of affirmation.
Reciprocals If activity i has one of the above A reasonable assumption
of above nonzero numbers assigned to it
when compared with activity j,
the j has the reciprocal value
when compared with i.

49
according to which element influences a given element more than another element.
Element comparisons are made with a control criterion or sub-criterion of the control
hierarchy in mind. Pairwise comparisons are represented in a matrix format. If there are n
components to be compared, the matrix is defined as:
When comparing two components, the score of p12 in the pairwise comparison matrix
represents the relative importance of the component in the C1 row over the component in
the C2 column, i.e., p12 = w1/w2. The reciprocal value of the expression (1/p12) is used when
the component C2 is more important than the component C1. Instead of assigning two
numbers (weights) w1 and w2 to the components C1 and C2 and forming the ratio w1/w2, we
allocate a single number from 1 to 9 from the fundamental scale to represent the ratio
(w1/w2). For example, the score of 1 represents equal importance of the two components
(C1, C2) and 9 signifies extreme importance of the component C1 over the component C2. The
absolute number from the scale is an approximation to the w1/w2 ratio. The derived scale
gives w1 and w2. After all pairwise comparison is completed; the priority weight vector (w)
is computed. That is, each value in the pairwise matrix is divided by the sum of its column
and then the criterion (priority) weight is calculated as an average value of the normalized
𝐶1 𝐶2
… 𝐶𝑛
𝑤1/𝑤1 𝑤1/𝑤2 …𝑤2/𝑤1 𝑤2/𝑤2 …
⋮ ⋮
𝑤1/𝑤𝑛 𝑤2/𝑤𝑛 ⋮
𝑤𝑛/𝑤1 𝑤𝑛/𝑤2 …
𝑤𝑛/𝑤𝑛
P =
C1
C2 ⋮
Cn
𝐶1 𝐶2 …
𝐶𝑛
1 𝑝12 …
1/𝑝12 1 …⋮ ⋮ ⋱
𝑝1𝑛 𝑝2𝑛 ⋮
1/𝑝1𝑛 1/𝑝2𝑛 …
1
C1
C2 ⋮
Cn
=

50
pairwise comparisons. A measure of consistency is then calculated using equations (3.1)
and (3.2) respectively to capture uncertainty in judgements:
CI= 𝜆𝑚𝑎𝑥−n
𝑛−1 (3.1)
CR = 𝐶𝐼
𝑅𝐼 (3.2)
where CI and CR are Consistency Index and Consistency Ratio, respectively, λmax is the
largest priority of the pairwise comparison matrix and n is the number of classes. RI is the
Ratio Index. The value of RI for different n is given in Table 3.2. A consistency ratio of
less than or equal to 0.10 or 10% is acceptable. If CR is greater than 10%, we need to revise
the pairwise comparisons.
Table 3.2: Ratio Index for different values of n.
Step 3: Supermatrix formation
After the weights have been derived from the pairwise comparison matrix, the next step
consists of the progressive formation of three supermatrices: the initial or unweighted, the
weighted, and the limit supermatrix. All priority vectors from the pairwise comparisons are
organized in appropriate columns, which in turn forms the supermatrix, a two-dimensional
matrix of elements by elements (Figure 3.5).
Order (n) 1 2 3 4 5 6 7 8 9 10
10 RI 0 0 0.52 0.89 1.11 1.25 1.35 1.40 1.45 1.49
1.49 Source: Saaty (2008b).

51
Figure 3.5: General structure of a Supermatrix (Source: Saaty, 2008b).
From the supermatirx, the component C1 includes all the priority vectors derived for nodes
that are “parent” nodes in the C1 cluster. The supermatrix represents the influence priority
of an element on the left of the matrix on an element at the top of the matrix with respect
to a particular control criterion. Each column of a supermatrix is either a normalized
priority with possibly some zero entries or all of its block entries are zero. For example, if
there is no linkage between, say component C1 and C2, then W12 would be zero. However,
if there is some relationship, then the entry would be non-zero suggesting an outer
dependence. An inner dependence would exist if there is a linkage within the components
of a cluster, {e11, e12,…𝑒1𝑛1}. This supermatrix is not weighted, and called the unweighted
supermatrix which may not be stochastic. The unweighted supermatrix is transformed by
the matrix of cluster priorities into a column stochastic matrix (columns add to one) called
the weighted supermatrix; i.e. multiplying all the elements of the unweighted supermatrix
by the corresponding cluster weight (the priorities obtained from the cluster level
comparison, with respect to the general goal which were determined in step 2).
The limit supermatrix is computed by raising the weighted supermatrix to powers until it
converges to obtain a long-term stable set of weights. The supermatrix is raised to a limiting

52
power, such as in equation (3.3), to obtain a matrix where all the columns are identical and
each gives the global priority vector (Bottero and Lami, 2010).
lim 𝑊𝑘 (3.3)
k→∞
where, W = weighted supermatrix and k = the number of successive powers through which
the weighted supermatrix is raised. The limit matrix provides the relative importance
weights for every element in the model.
Step 4: Determining final priorities
The last step determines the final values (weights) of the elements by their prioritization
with respect to the structure of the whole system. The final priority weights which account
for component (element) interactions can be extracted from the limiting matrix and can be
read from any column since they are all the same. In addition, the final priorities of all the
elements in the network can be normalized (that is, the values associated with elements are
determined by normalizing each block (cluster) of the limit supermatrix).
It is import to indicate that the ANP method has some inherent weaknesses. Due to the
complexity of the method, its application is time consuming compared to AHP. Further,
the ANP method involves numerical calculations in assessing composite priorities; as a
result, the pairwise comparison calculations become complex when the number of criteria
increases as very high number of pairwise comparisons need to be conducted (Nekhay et
al., 2007, 2009; Percin, 2008; Wolfsleher et al., 2005; Wu, Lin & Peng, 2009). However,
there are numerous different ways in which the pairwise comparison input data can be
carried out such as graphic, verbal, matrix and questionnaire formats that can be used to
53
input the data, which can make the data collection and analysis easier (Hallikainen,
Kivijärvi, & Tuominen, 2009).
3.7 GIS-ANP Framework
The framework for the housing quality assessment problem is shown in Figure 3.6. The
framework integrates the ANP methodology with GIS techniques. It can be subdivided into
four major steps: (i) the problem definition/ criteria identification, (ii) data input (iii) ANP
procedure, and (iv) GIS implementation.

54
i. The Problem definition / Criteria identification and selection
The first step in the housing quality assessment is to define the problem by developing a
conceptual model for the decision/evaluation problem. This is the central part of the
Perform sensitivity analysis
Housing quality
GOAL
Define the problem
Identify and select evaluation criteria (housing quality indicators)
Literature sources Expert opinion
Obtain Data
(Census data, Fieldwork)
Figure 3.6: Framework for Evaluating Housing Quality.
GIS
Import of the ANP model results in GIS environment
Model result maps and display to show
the spatial patterns of housing quality
Build the supermatrices
ANP computations (pairwise comparisons between and within clusters)
Build the model structure (establishing the clusters and identifying the relationships)
Determine the final score (weights) and rankings of alternatives
AN
P

55
qualitative component of the ANP as this conceptual model drive all succeeding works for
solving the decision problem. It is important to have a clear starting point with specific
goals and objectives. In general, the problem of housing quality evaluation involves
choices among criteria (factors) which affect the quality of the houses that are multiple and
often with conflicting nature. Once the goal is defined, the next step is to identify and select
the criteria to be used for the assessment. Criteria identification can be done through experts
identifying the factors and/or through literature search to find the factors used by previous
studies and selecting those that are applicable to a particular case study.
ii. Data input
After the criteria has been selected, the next process is to obtain the relevant data needed
for the assessment. Data about houses relating to the selected evaluation criteria should be
collected. For example, with the criteria structural quality, data related to the quality of the
dwelling units should be collected such as type of wall material, floor, etc.; the datasets can
be obtained from census data or through field work. Preparation and classification of the
obtained data is carried out for the ANP model (adaptation of the data to the necessity of
the ANP model).
iii. ANP procedure
The ANP procedure is adopted for obtaining the criteria weights (see Section 3.6). The
ANP computations will be performed using the Super Decisions software and the results
transferred into GIS. The ArcGIS software will be used. After, a sensitivity analysis can be
carried out to test the robustness of the pairwise comparisons.

56
iv. GIS implementation
Upon completion of the ANP analysis, the ANP model is synthesized for the final weights.
The weights are imported into Microsoft Excel spreadsheets. Data cleanup and editing are
then performed on the spreadsheets including verifying that the text for each geographic
reference in the data tables matched the text in the ArcGIS shapefile that it would be joined
with. Other cleanup procedures include removing the limit matrix column that contains the
general weights of the criteria used for the assessment and those of the alternatives
(districts). Once the data tables for the ANP model are cleaned, the table containing the
normalized values (weights) is joined in ArcMap to the shapefile of alternatives (district
administrative boundaries of Ghana) based on a common identifier using the Join and
Relate tool. After incorporating the data into GIS, modelling of the data (weights) is carried
out to develop the housing quality spatial maps. This allows for examining the spatial
patterns of housing quality.
3.8 Summary
MCDA is a well-known approach for supporting decision-making process. The method
can be integrated into GIS for performing spatial multicriteria decision analysis or GIS-
based MCDA. The main concern of this chapter was the ANP method utilized for
evaluating housing quality. The chapter elaborates on the procedures involved in using the
method and discusses the GIS-ANP framework to be used for the housing quality
assessment in this study.

57
CHAPTER FOUR
GIS-ANP: APPROACH TO EVALUATE HOUSING QUALITY
4.1 Introduction
This chapter focuses on an application of the GIS-ANP method for evaluating housing
quality at the districts in Ghana. The GIS-ANP framework discussed in the previous
chapter will be employed. The first sections provide a brief description of the study area
and details of the data utilized in this research as well as the selected variables, followed
by a demonstration of the GIS-ANP framework to evaluate the quality of housing.
4.2 Study Area Profile
This section provides a profile of the study area. It is divided into two parts. The first part
gives a brief description of Ghana, starting with the location and size characteristics. It then
proceeds to describe the administrative structure of the country. The second part of the
section follows with a description of the housing profile of the country.
4.2.1 Location and Size and Administrative Characteristics
Ghana is located on the west coast of Africa. It shares its northern boundary with Burkina
Faso, eastern with the Republic of Togo, western with La Cote d'Ivoire and to the south by
the Gulf of Guinea. Ghana lies between latitude 4° and 12° north of the equator. It also lies
astride longitude 0° and 10 minutes east. Ghana has a total land area of 230,020 km2, with
a population of 24,658,823 based on the 2010 population and housing census (Ghana
Statistical Service [GSS], 2012).

58
Ghana is constituted of ten administrative regions, which are subdivided into districts. As
of 2010, 170 administrative districts existed in Ghana, made-up of 164 districts/municipal
and 6 metropolitan areas. However, post censual assessment recommended that 45 new
districts be created bringing the total number of districts currently to 216, subdivided into
6 metropolitan, 49 municipalities, and 161 district assemblies. The districts are considered
the third-level administrative subdivision of the decentralized administrative system of the
country. The three-tier system in use is the national, the regional and the district (which is
the spatial unit of analysis in this study). Figure 4.1 is a map of the study area showing the
regional and district maps of Ghana based on the 170 administrative districts.

59
Figure 4.1: Regional and District map of Ghana.

60
4.2.2 Housing Profile of Ghana
Housing conditions in Ghana are affected by several factors, which include the location of
the building, the local culture, the construction materials, and the amenities and funding
services. The 2000 and 2010 Population and Housing Censuses of Ghana classify dwelling
units into the following categories: Separate house, Semi-detached house, Flat/Apartment,
Compound house (rooms), Huts/Buildings (same compound), Huts/Buildings (different
compounds), Tent, Improvised home (kiosk, container), Living quarters attached to
office/shop, Uncompleted building and other.
In Ghana, four key housing types predominate: single family homes, flats/apartments, single
room occupancy in compound housing, and huts (buildings made up of earthen materials)
shown in Plate 4.1. Compound housing dominates, which is followed by huts, single family
and multi-family (flats/apartments) housing (Fiadzo et al., 2001). According to Fiadzo et
al. the traditional compound house comprises of a large rectangular structure facing a
courtyard with generally, 10 to 15 rooms around three sides of a courtyard.
The 2010 population and housing census indicate that, the total stock of houses in the
country is 3,392,745 with a percentage of 57.7% in rural areas and the urban share of 42.3%.
In terms of regional distribution, Ashanti has the highest proportion of houses (16.9%),
followed by the Greater Accra (14.0%) and Eastern (12.7%) regions. The Upper West
region has the lowest number of houses that is a total housing stock of 2.4% (GSS, 2012).
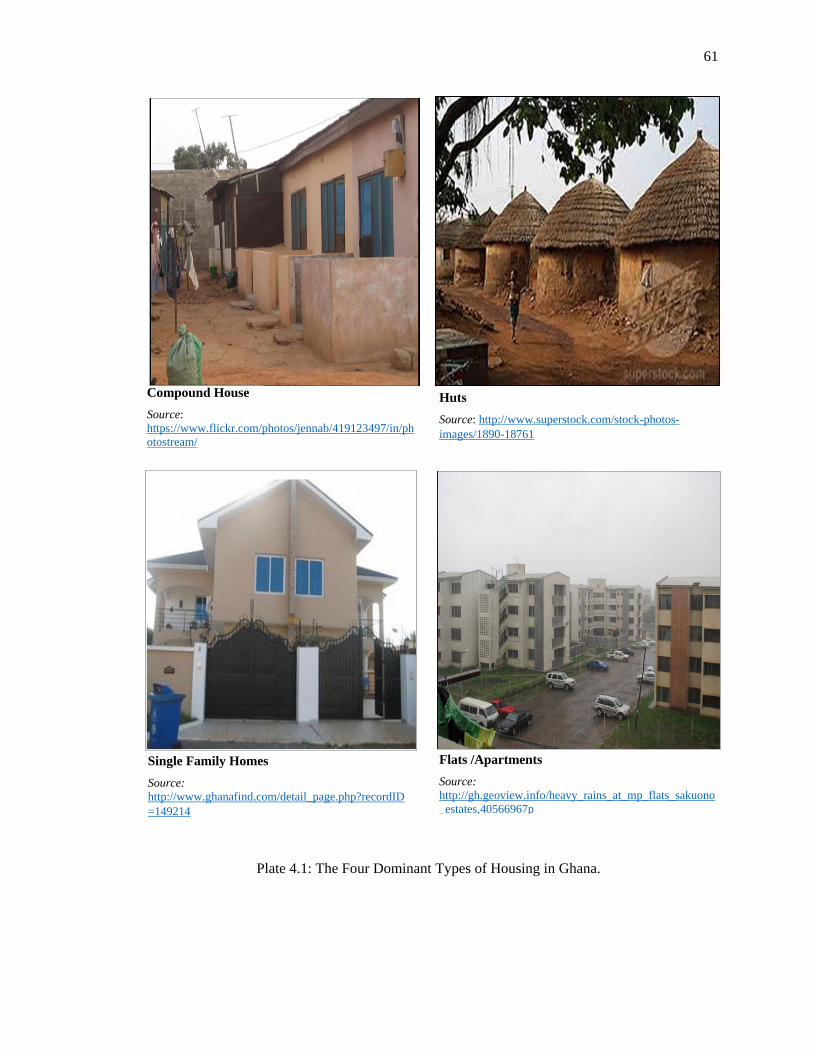
61
Compound House
Source:
https://www.flickr.com/photos/jennab/419123497/in/ph
otostream/
Huts
Source: http://www.superstock.com/stock-photos-
images/1890-18761
Single Family Homes
Source:
http://www.ghanafind.com/detail_page.php?recordID
=149214
Flats /Apartments
Source:
http://gh.geoview.info/heavy_rains_at_mp_flats_sakuono
_estates,40566967p
Plate 4.1: The Four Dominant Types of Housing in Ghana.

62
The 2010 population and housing census specifies that 51.5% of households reside in
rooms in compound houses, 28.7% in separate houses and makeshift dwelling units (tents,
kiosks, containers and attachment to shops or offices) constitute 2.0% (GSS, 2012).
According to the Ghana Statistical Service (2008) living in semi-detached houses, flats or
apartments is not common among Ghanaian households. However, flats or apartments are
more common in the urban areas than the rural.
4.3 Data and Data Sources
This study utilized secondary data; that is, the 2010 Population and Housing Census of
Ghana. The data were acquired from the Ghana Statistical Service. The data collected
comprises of information on dwelling types, the quality of structural materials used in
constructing the housing units (walls, floors, and roof), ownership type (holding/tenure
arrangement) and internal unit facilities (housing services) including type of lighting,
source of water supply and toilet facilities etc. Data were also collected on the method of
disposal of solid and liquid waste as well as household composition per dwelling. In Ghana,
housing data are produced at the level of enumeration areas, which are later aggregated to
the district level. Currently, there are 216 districts in Ghana, but this study made use of
data based on the 170 administrative districts (164 districts/municipal and 6 metropolitan
areas) that were in operation during the 2010 population and housing census.
Datasets used for the evaluation of housing quality consist of structural quality of building
materials, types of physical amenities in the house, types of dwelling units, household
characteristics and tenancy arrangements. These datasets were operationalized in the form

63
of indicators and variables that was used in measuring housing quality.
The map coverages used for this analysis was provided by the Remote Sensing and
Geographic Information System Lab at the Department of Geography and Resource
Development, University of Ghana.
4.4 An Illustrative Example: The ANP Housing Quality Evaluation
The next sections illustrate the procedure for using the GIS-ANP framework introduced in
the previous chapter to assess housing quality. The main goal of the process is to rank
districts within a region according to their housing quality scores and also identify the
relative importance of the housing quality factors to housing quality for the districts.
4.4.1 Structuring of the Decision Problem
In the context of housing quality assessment, the goal of the decision/evaluation problem
is to rank geographical units according to selected indicators. The spatial units constitute a
finite set of alternatives with the indicators constituting a finite set of criteria. The overall
objective of the analysis is to assess housing quality at the district level in Ghana. The next
step in structuring the decision problem is to define the indicators to be included. The
problem of evaluating the quality of residential areas at the district level in Ghana present
us with a situation in which one has to combine a number of evaluation criteria (indicators)
to obtain a measure of housing quality. The assessment of housing quality at the district
level in Ghana was carried out based on variables considered as relevant indicators of
housing quality. Set of criteria was identified through a survey of literature that provided

64
information on various factors (indicators) that contribute to housing quality. By reviewing
the literature, it was found that various researchers had used a certain set of criteria for
assessing housing quality (see Section 2.3.4.1). These studies provided the base for
selecting the set of criteria used in this case study.
A comprehensive set of evaluation criteria that reflect all the concerns relevant to the
evaluation problem was identified according to indicators that contribute to housing quality
and their respective variables used to operationalize them. Housing quality was measured
with a variety of indicators (criteria) clustered into four main groups: physical, economic,
social and environmental attributes of housing. Figure 4.2 shows the framework of the
evaluation problem structured by a hierarchical network or heirnet model (see Khan
& Faisal, 2007), where the goal according to which the problem has been structured and
the evaluation criteria that assess the achievement of the objective are presented. There are
four components in the model, namely: goal, evaluation criteria, sub-criteria, and
alternatives (districts in the Greater Accra region have been listed here for demonstration).
There are hierarchic dependences from goal to evaluation criteria and from criteria to
decision alternatives. The relevance of these hierarchic dependencies is to show how the
goal is decomposed into a set of criteria and how alternatives (districts) are evaluated from
this set of criteria. Evaluation criteria and alternatives have a feedback control link so that
a strong connected structure could be attained to ensure that the evaluation components are
linked to the goal. There is an inner dependence within the physical group indicated by the
loop, while there is outer dependence between the physical and economic criteria groups
shown by the dashed arrow.

65
Subcriteria
Wall
materials
Housing
type
Bathing
facility
Water
supply
Cooking
fuel
Cooking
space Toilet
facility
Lightning
Accra Metropolis
Tema Metropolis
Adenta Municipal
Dangbe East
Ashaiman Municipal
Ledzokuku / Krowor Municipal
Ga East
Dangbe West
Ga West
Weija (Ga South)
Alternatives
Goal Criteria Subcriteria Alternatives / Network
Figure 4.2: Structure of Housing Quality Evaluation Problem in Ghana.
Goal HOUSING QUALITY
Dwelling
type
Structural
Quality
Housing
Services
Physical Criteria
Amount of
open space
Sanitation
Facility
Environmental
Housing
density
Solid
waste
disposal
Liquid
waste
disposal
Economic / Social
Ownership Crowding
Household
density
House
ownership

66
Seven categories of criteria shown in Figure 4.2 relevant to the physical, economic, social
and environmental attributes of housing were used to operationalize the clusters used in the
ANP model. These sets of criteria can be assembled numerically at the individual
household level and represented on a map in aggregate form for district levels. Following
is a description of the clusters and their respective elements (nodes).
4.4.1.1 1st Cluster: Physical Criterion
This cluster represents the physical attributes that contributes to housing quality. It includes
the following indicators: dwelling type, housing services and structural quality. Dwelling
type comprised of the different models of housing in Ghana; housing services is made up
of the housing facilities or internal amenities that are available in the residence (measured
by variables such as type of toilet facility, type of bathing facility etc.); structural quality
involves the materials used for the dwelling, including outer/wall material, floor material
and roof material (only wall material was used in this study due to data constraint and it
was coded as outer material).
4.4.1.2 2nd Cluster: Socio-economic Criterion
The economic criterion embraces tenancy arrangements (ownership), which involves
whether a dwelling is rented or owner occupied. One variable (rent free) was dropped
because people who fall into this category were neither owners nor renters. In Ghana, this
set of occupants usually have a family member who might be a household member or not,
owning the residence in which they live or they stay in a family residence. The social
criterion encompasses variables related to overcrowding. Average household size per
dwelling was used in this study to measure overcrowding.

67
4.4.1.3 3rd Cluster: Environmental Criterion
The physical environment is recognized as an essential part of housing. The quality of life
in a housing environment is both influenced by the quality of the dwelling place and the
quality of the immediate environment; i.e. the residential complex as a whole (entire
residential neighbourhood) (Bogdanović and Mitković, 2005). This criterion takes into
account physical characteristics of the environment. Environmental factors include
environmental sanitation and crowding of the land. Environmental sanitation was
measured using modes for solid and liquid waste disposal, whereas crowding of the land
by buildings; i.e. the amount of open space in neighbourhood was measured using housing
density. Table 4.1 summarizes the selected clusters and their respective elements/nodes.
Once the clusters and respective elements were selected, the ANP model was constructed.
Table 4.1: List of Housing Quality Criteria together with Elements
CLUSTER ELEMENTS
PHYSICAL
Structural Quality Wall material
Housing Facilities / Services Source of water supply
Source of lighting
Type of cooking fuel
Type of cooking space
Type of toilet facility
Type of bathroom
Structural Design Type of housing
SOCIO-ECONOMIC
Ownership Owner occupied
Renting
Overcrowding Number of households per house
ENVIRONMENTAL
Amount of Open Space Housing density
Environmental Sanitation Mode of drainage disposal
Mode of refuse disposal

68
4.4.2 ANP Model Construction
To develop an ANP model, one needs to identify the problem, define criteria and sub-
criteria and specify the relations between them and their interactions. A network model has
a criteria cluster and an alternative cluster, but no goal. The network model was structured
with a single control criterion: housing quality. The objective is to try and determine
housing quality for the districts in Ghana by considering what housing characteristics and
attributes affect and contributes to housing quality and introduce them as clusters, nodes
and influence links in a network. The decision alternatives are the districts.
In the present application, the model has been developed according to the simple network
structure. A simple network contains clusters, nodes/elements and connections or links
which are all contained in a single window. In a case of a more complex problem, Saaty
(2005) recommends the use of four sub-networks: Benefits, Opportunities, Costs, and
Risks (BOCR) (i.e. structuring the decision problem according to the complex network
structure). The “complex” network makes it possible to abridge the problem structuring by
classifying issues in the traditional categories of positive and negative aspects. The
favourable characteristics are called benefits, while the unfavourable ones are called costs;
the uncertain aspects of a decision are the positive opportunities that the decision might
generate and the negative risks that it can necessitate. Each of these four aspects employs
a separate network structure for the decision situation (Saaty & Vargas, 2006).
Consideration of these sub-networks permits keeping in mind all scopes of the decision
problem. The “simple” network is a free-modelling approach, which is not supported by
any guide or pre-determined structure (complex network structure). The network structure
of the housing quality decision problem and the interdependences between the clusters

69
have been simulated using Super Decisions 2.2.6. Software1, which creates a list of the
pairwise comparisons needed to run the assessment. The selected criteria for the decision
problem refer to physical, economic, social and environmental indicators of housing
quality and were clustered into three main groups (clusters) as outlined above. Figure 4.3
displays the model with the clusters and their respective elements.
According to the ANP methodology, once the network has been identified, it is necessary
to represent the influences (or interrelationships) among the elements (nodes). This task
was approached in the following way. First, all the elements in the clusters were supposed
to have an influence on the alternatives (see Figure 4.4). Second, further relationships were
identified concerning the potential influences among the elements of each cluster (outer
dependence); i.e. between the physical and economic/social cluster represented by the
arrow from the physical cluster to the economic/social cluster in Figure 4.3. Third, a
feedback structure was introduced whereby alternatives were linked to criteria in order to
compare them for preference to find out what set of criteria contributes more to housing
quality of a district (see Figure 4.5).
1 www.superdecisions.com.

70
Figure 4.3: The ANP Model for Evaluating Housing Quality at the District Level in Ghana.
Figure 4.4: Element Dwelling Type connected to Alternatives.

71
Figure 4.5: Feedback structure with respect to the Accra Metropolis.
A single direction arrow in the model (Figure 4.3) shows the dominance of one factor over
another. A double direction arrow shows the mutual influence between the factors
(feedback). Loops indicate inner dependences. In this study, only one inner dependence
was identified. That is with regards to the physical cluster. After determining the clusters
and their elements with the relationships between them, pairwise comparisons were
performed on elements within clusters and between clusters to prioritize alternatives.
4.4.3 Conducting the Pairwise Comparisons between Elements
This section consists of conducting all existing pairwise comparisons which are obtained
through evaluations using the fundamental scale (Table 3.1). After articulating

72
interdependencies, pairwise comparisons is implemented with respect to all those factors
that have an impact on other factors within their own cluster or other clusters of the
network. In this case, the factors in a cluster are compared according to their influence on
a factor in another cluster to which they are connected (or factors in their own cluster). Due
to the nature of the data and variables used for this study, before carrying out the pairwise
comparisons for the network model, first an AHP rating model was employed to rate the
indicators as to how much they are contributing to housing quality at the various district
levels. The indicators outlined above were decomposed into set of subcriteria, consisting
of a set of thirteen variables which were used to measure them (see Figure 4.6). The
response choices under the variables were categorised based on various classifications and
ranked (see Table 4.2) in relation to their contribution to housing quality. Categories that
could better distinguish between different levels of housing quality were assigned higher
ranks.

73
Figure 4.6: Housing Quality Evaluation Problem: The Response Choices for the Variables (Subcriteria)
Amount of
open space
Sanitation
Facility
Housing
Density
Solid waste
Disposal
Liquid
waste
Disposal
Average
number
of
houses
per acre
Collected
Burned
Public dump
(container)
Public dump
(open space)
Dumped
indiscriminately
Buried
Sewerage
system
Drainage
system
into gutter
Drainage
into pit
(soak
away)
Thrown
onto street/
outside the
house
Thrown
into Gutter
Thrown
onto
Compound
Environmental
HOUSING QUALITY Goal
Dwelling
Type
Housing
Services
Structural
Quality
Physical
Subcriteria Wall
Material
s
Cooking
Fuel
Bathing
Facility
Housing
Type
Water
Supply
Lighting Cooking
Space
Toilet
Facility
Separate
house
Semi-
detached
house
Flat /
Apartment
Compound
house
Huts (same
compound)
Huts
(different
compound)
Tent
Improvised
home
Living
quarters
attached to
office
/shop
Electricity
Firewood
Gas
Kerosene
Charcoal
Crop
residue
Saw dust
Animal
waste
Electricity
Kerosene
lamp
Gas lamp
Candle
Torch/
flashlight
Firewood
Crop
residue
Pipe borne
(dwelling)
Pipe borne
(outside
dwelling)
Public tap
Borehole/
tube well
Protected
well
Unprotected
well
Tanker
/Vendor
River/Stream
Dugout/pond/
Lake/ Dam
Bottled water
Sachet water
Own
bathroom
Shared
bathroom
(same
house)
Private
open
cubicle
Shared
open
cubicle
Public bath
house
Bathroom
(another
house)
Open space
around
house
River
/Pond/Dam
/Lake
No facility
(bush/
beach)
Water
closet
Public
toilet
Pit latrine
Bucket /
Pan
KVIP
Separate
room
Separate
room
(shared)
Enclosure
(no roof)
Structure
with roof
(no walls)
Bedroom/
Living
Verandah
Open space
(compound)
Mud brick
/ Earth
Wood
Metal
sheet
Stone
Burnt
Bricks
Cement
blocks /
concrete
Land Crete
Bamboo
Palm leaf /
Thatch
Economic / Social
Ownership Crowding
Owner
occupied
Rent
Average
household
per house
Household
Density
House
Ownership
Criteria
Response Choices

74
Table 4.2: Indicator Classification and Ranking
Indicator
Categories and Ranks
Reasons for Clustering and Rankings
Type of
External
Material
1. Fairly- /Non -sustainable:
(Wood, Mud brick/Earth,
Metal sheet/Slate/Asbestos,
Palm leaf/Thatch (grass)
/Raffia, Bamboo).
2. Most- sustainable:
(Land Crete, Stone, Burnt
bricks, Cement blocks/
Concrete).
Ranked based on items relative durability. The
ranking was adapted from Meng and Hall,
(2006).
Types of
Dwellings
1. Poor /Least quality
(Tent, Improvised home
(kiosk/container, Living
quarters attached to office/shop,
Huts/Buildings (same
compound), Huts/Buildings
(different compound).
2. Moderate quality
(Compound house (rooms).
3. High quality
(Separate house, Semi-detached
house, Flat/Apartment).
Ranked based on quality of building material,
privacy and noise levels.
The least category comprised of makeshift and
other improvised dwellings. Huts were added to
this category based on the quality of the building
materials used.
Source of
Lighting
1. More/Fairly/Least-efficient:
(Kerosene lamp, Flashlight/
Torch, Candle, Crop residue,
Firewood)
2. Most-efficient:
(Electricity, Gas lamp).
The nature of the source of lighting is one of the
indicators of quality of life. As society advances,
the source of lighting shifts from use of low
quality sources such as fuel wood to more
efficient ones such as electricity (GSS, 2013).
Electricity was considered by Arias and Devos
(1996) as the best source of lighting, hence
assigned the highest value.
Other lighting sources, such as crop residues and
firewood, were not as reliable and a permanent
source of power. Therefore, assigned the lowest
values. Kerosene lamp was added to this category
based on its pollutant levels.
Ranked based on durability and pollutant level as
well as efficiency and quality.

75
Source of
Water
Supply
(Drinking)
1. Unimproved:
(River/Stream/Dugout/Pond/
Lake/Dam/Canal, Unprotected
well, Tanker supply/Vendor
provided, bottled and sachet
water).
2. Improved:
(Protected well, Bore-
hole/Pump/Tube well, Rain
water, Public tap/Standpipe,
Protected spring).
3. Improved (Piped into
dwelling):
(Pipe-borne outside dwelling,
Pipe-borne inside dwelling).
The availability of and access to improved
drinking water is an important aspect of the
health of household members. According to
Bradley and Putnick (2012) a hallmark of
housing quality in poor and developing countries
is clean drinking water.
The main source of drinking water was ranked
based on hygienic conditions of the water source
using the Sanitation Ladder recommended by
WHO and UNICEF (2008).
Bottled and sachet water was considered
unimproved sources, because most of them are
not regulated and water from other unimproved
sources is sometimes bottled and sold in
developing countries (Bradley & Putnick, 2012)
with Ghana being no exception.
Type of
Toilet
Facility
1. Unimproved:
(Bucket/Pan, Pit latrine,
Public toilet, No facilities -
bush/beach/field).
2. Improved:
(*KVIP, Water Closet.)
An effective and hygienic method of human
waste disposal available in a dwelling unit is a
critical indicator of the sanitary situation of the
unit and is an indirect measure of the
socioeconomic status of a household (GSS,
2013).
As a result, this category was ranked based on
hygienic standards, using the classification by the
Joint Monitory Programme (JMP) of WHO and
UNICEF (2008).
* The Kumasi Ventilated Improved Pit latrine is a local
alternative of the internationally-used VIP toilet. When
used in public toilets it tends to be termed KVIP, while
in private use it is just VIP (Jenkins & Scott, 2007).
Only the private form are included under KVIP as
people using public toilets are classified under public
toilet.
Type of
Bathing
Facility
1. Moderate /Low privacy and
quality:
(Public bath house, Bathroom
in another house, River/Pond/
Lake/Dam, Open space around
the house, Shared open
cubicle, Private open cubicle)
2. High privacy and quality:
(Shared separate bathroom in
the same house).
3. Highest privacy and quality:
(Own bathroom for exclusive
use).
Were ranked based on privacy and quality.
Shared open cubicle and private open cubicle
were added to the least category because they are
improvised.
Sharing of bathrooms presents greater problems
because of the risks involved as the intensity and
number of users (households) increase. In
addition, shared bathroom cleaning
responsibilities sometimes generates conflicts and
squabbles among housewives.
As a result, the ranking of the shared separate
bathroom as second.

76
Type of
Cooking
Fuel
1. Low quality:
(Crop residue/Saw dust,
Firewood, Animal waste).
2. Medium quality:
(Charcoal, Kerosene).
3. High quality:
(Gas, Electricity).
The type of fuel used by household also relates to
the type and quality of building occupied by
households.
Electricity was considered by Arias and Devos
(1996) as the best source of cooking fuel.
Gas and Electricity were ranked higher because
they are considered as the modern fuel types
(IARC, 2010).
Though kerosene is also considered among the
modern fuels, was ranked as medium quality due
to the high pollution levels associated with it
compared to Gas and Electricity. Rank 1 can be
considered as traditional, rank 2 intermediate and
rank 3 modern.
Having open fires in the house increases
proneness to respiratory illness. Exposure to
wood smoke can have adverse health
consequences. Example, prenatal exposure can
lead to low birth weight (Siddiqui et al., 2008)
therefore this category was ranked low.
Ordered in terms of quality (Fiadzo, 2001) and
pollution levels.
Type of
Cooking
Space
1. Fairly/Least private and
comfortable:
(Bedroom/Hall/Living room,
Verandah, Enclosure without
roof, Open space in
compound, Structure with roof
but without walls).
2. Moderately private and
moderately comfortable:
(Separate room shared with
other household(s).
3. Most private and most
comfortable:
(Separate room for exclusive
use of household).
Households with no kitchens at all sometimes
cook along the corridor, or in their rooms.
According to Muoghalu (1991) this increases the
discomfort level of their houses through the
production of smoke and increase in house
temperature. Hence the addition of
bedroom/hall/living room and verandah to the
least ranked category.
Also, sharing of kitchen invades on family
privacy as families would like to prepare their
meals privately (Muoghalu, 1991) therefore
ranked second.
Ranked based on privacy and discomfort levels.

77
Over-
crowding
Average Households per house
1. = >2
2. = 1- 2
Ranking adapted from Meng and Hall (2006).
Overcrowding is a standard displaying a socially
intolerable level of crowding measured by room
or household occupancy factor indicator
(Muoghalu, 1991).
According to Meng and Hall (2006) households
per occupied dwelling unit articulates a certain
aspect of living space as a basic requirement of
shelter to maintain health and privacy.
In Ghana, multiple families sharing one dwelling
unit is a common phenomenon. Hence,
occupancy ratio was considered in assessing
housing quality. Dwellings with average
household size 1-2 is considered not crowded
with greater than 2 as overcrowded.
Tenancy
1. Renting
2. Owner occupied
Ranked based on tenancy arrangement.
Owning indicates higher quality than renting does
(Aliu & Adebayo, 2010; Spain, 1990).
According to Aliu & Adebayo (2010) lack of
economic strength or poverty in most developing
countries has undermined the quality of housing
available to people, the majority of whom are
poor. To them, environmental and dwelling
attributes are swayed by socioeconomic indices
which also define the individual level of
wellbeing.
They argued that no matter what predilection a
renter may express for neighbourhood and
dwelling quality, the eventual determinant of
housing quality of individuals is their
socioeconomic status as a renter or owner
occupiers.
Ibem (2012) found that tenure status affects
dwelling quality. Secured tenure is therefore
considered as a vital indicator of good housing
quality.
Therefore, the rank of 2 for owner occupied and 1
for renting.

78
Mode of
Refuse
Disposal
1. Fairly /Least acceptable:
(Burned by household,
Dumped indiscriminately,
Buried by household, Public
dump (open space).
2. Most acceptable:
(Collected, Public dump
(container).
Ranked based on safe disposal and acceptable
modes.
Acceptable waste management helps to prevent
the spread of some types of infections and
improves the quality of the environment.
Though public dump (container), with periodic
collection have the disposed waste uncollected
for a period of times, sometimes up to weeks, was
ranked highest together with door to door
collection based on the modes of refuse disposal
available in Ghana. It is one of the accepted
modes since they normally constitute a central
dumping site where the waste is dumped into a
bin rather than discriminatory and in open spaces.
Type of
Drainage
System/
Facility
1. Fairly/ Least improved:
(Thrown onto the compound,
Thrown onto the
street/outside, Through a
drainage system into a gutter,
Thrown into a gutter).
2. Most improved:
(Through the sewerage
system, Through drainage
into a pit (soak away).
Ranked based on hygienic standards.
Part of the quality of residence is the drainage
provision which defines the level of water
stagnation and invariably the preponderance of
breeding grounds for mosquitoes and consequent
exposure to the risk of malaria (Aliu & Adebayo,
2010).
Throwing of liquid waste onto the compound and
gutters pose a threat to residents as this enhances
the breeding of vermins, mosquitoes and flies
which pose serious threat to life as most of the
gutters in Ghana are not covered and sometimes
clogged leading to water stagnation.
Consequently, the assignment of the least rank to
these category.

79
Housing
Density
1. = ≥ 22
2. = 11-21
3. = ≤ 11
This indicator was considered in assessing
housing quality because, the quality of housing
and neighbourhood environment reduces as the
degree of density or level of crowdedness
increases (Coker et al., 2008).
In Ghana, average plot sizes differ across regions
and even within regions and districts. With the
state and vested land, the average residential plot
size is 30 x 30m (900 square metres). In
customary areas, different plot sizes are presently
being demarcated, including 30 x 24m (720
square metres), 30 x 27m (810 square metres), 30
x 23m (690 square metres) and 37 x 30m (1110
square metres).
Therefore the state and vested plot size (30 x 30m
(900 square metres) was adopted for this study,
which gives a net density of 11 plots per hectare
(UN-HABITAT, 2011).
69.88% and 21.20% of the total land area in
Ghana as at 2011 is agricultural and forested land
respectively (World Bank, 2014). Therefore, in
calculating the housing density in this study, 10%
of the total land area of the districts was adopted
as residential lands.
Housing density was computed using the formula
total number of houses in the district divided by
total land area i.e. 10% of the total land for the
districts.
Using the net density of 11 plots per hectare as a
benchmark, the classification used to measure
housing density was done. With housing density
less than or equal to 11 considered as low density,
11-21 as medium density and greater than 22 as
high density.
Using the rating method of AHP (Figure 4.7) categories or standards are established for
the criteria (indicators), and then they are rated one at a time by selecting the appropriate
category under each criterion using the rating spreadsheet (Figure 4.8). The categories are
prioritized by pairwise comparing. For example, the standards/categories for the criterion

80
of outer/external material are: most–sustainable and fairly-/non-sustainable. Judgments are
entered for such questions as: How much is the most–sustainable category more important
than the fairly/non-sustainable category for the outer/external material criterion? The
priorities for the various categories were obtained by transforming the ranks of the
categories to priority weights.
A rank order of the categories was created for each criterion. That is, every criterion under
consideration was ranked in order of preference (their contribution to housing quality).
Inverse ranking was used whereby the least contributing category was ranked 1 and the
highest 3. Rank sum method was used to transform the ranks into priorities. With this
method, each rank is converted to a weight (the higher the weight, the more important the
criterion). In this study the higher the weights, the more that category contributes to
housing quality. A category with a rank of 3, 2, and 1 was weighted 9, 6 and 3,
respectively. In cases of only two categories, the highest rank was weighted 9 and the
lowest (rank 1) was weighted 4.5. Using the direct entry mode for the pairwise comparison
in the Super Decisions software, these weights (9, 6, 4.5, and 3) were entered for the various
categories under each criteria which automatically created the pairwise comparisons and
their resultant normalized weights. This is demonstrated for the outer/external material
criterion in Figure 4.9.

81
Figure 4.7: Cross section of the Rating model for Housing Quality.
* For the rest of the categories for the other variables, please refer to Table 4.2.
Bathing Facility
Moderate /Low
Privacy & quality
High Privacy &
quality
Highest Privacy &
Quality
Cooking Space
Fairly/Least Private
and Comfort
Moderate Private and
Comfort
Most Private and
Comfort
Tenure Holding
Renting
Owner Occupied
Housing type
Poor/Least quality
Moderate quality
High quality
Water Supply
Unimproved
Improved
Improved (Piped into
Dwelling)

82
Figure 4.8: Spreadsheet for Rating Model.
Figure 4.9 illustrates the process of deriving the intensities under the outer/external material
criterion. Here, the rank weight of 9 for most-sustainable materials and that of fairly-/non-
sustainable (4.5) were entered into the Super Decisions software which translated into
derived weights of 0.666 and 0.333 with the resultant ideal weights of 1.0 and 0.5 after the
pairwise comparisons were automatically created based on the entered values for the
Figure 4.9: Deriving Priorities for the Outer Material Criterion Categories.

83
categories. The process was repeated to compare the intensities for each of the other
indicators.
After the pairwise comparison to derive the intensities for the various categories based on
the classifications done in Table 4.2, the response choices for each variable from the census
data were aggregated for the categories. In rating the indicators, the category with the
highest number of response choices was selected as the dominant one for the indicator
under rank for each district. For example, for Jomoro district, under the indicator type of
cooking fuel, the total number of response choices for high quality (electricity and gas) is
3,488, medium quality (charcoal, kerosene) 8,063 and low quality (crop residue, sawdust,
firewood) 20,795. As a result of these categorized response choices, the indicator type of
cooking fuel will have the category for low quality being entered for it, since it has the
highest response choices and reflect the dominant type of cooking fuel used by households.
The rating method was employed for this process because, the districts are not compared
against each other. As a result, there is no dependence between them. In addition, since
expert weighting was not used in this study, it afforded the researcher the opportunity to
predict how much each indicator is contributing to housing quality at the various districts
which enabled comparison in the ANP model.
The weights (results) from the rating method for the various criteria were used as inputs
for the ANP pairwise comparisons. The weights of the criteria for the rating model was
converted to percentages and ranked on a scale converted to that of the fundamental scale.

84
4.4.3.1 ANP Pairwise Comparisons
To reflect interdependencies in the network, pairwise comparisons among all the factors
are conducted. A pairwise comparison is a numerical representation of the relationship
between two elements that discerns which element is more important with respect to a
higher criterion. According to the ANP methodology, the comparison and evaluation phase
is based on the pairwise comparison of the elements under consideration which involves
comparison between clusters which is more general and the comparison between nodes
which is more detailed. The generic question of the pairwise comparisons has the following
form: given an element in any component, how much more does a given element of a pair
influence that element with respect to a control subcriterion (criterion)? The same kind of
question is asked about the comparison of clusters. Cluster comparison is done to establish
their importance with respect to each cluster they are linked from. In this study, the clusters
are weighted the same. The linked nodes in a given cluster are pairwise compared for their
influence on the node they are linked from (the parent node) to determine the priority of
their influence on the parent node. All the comparison questions are asked from the
perspective of what is contributing more to housing quality. Each comparison has a
respective question; for example, “with respect to physical factors of housing quality,
which indicator is contributing more to the quality of housing: dwelling type or housing
services, and to what degree?” The same question is made for all elements that have an
impact on other elements, whether they belong to the same cluster (inner dependence) or
to another cluster (outer dependence). The point in doing the comparisons is to obtain their
relative weights; i.e. each element/cluster has a certain importance in the network/model,
which is represented by weights. During the pairwise comparison process of all the factors,
the consistency of the responses must be checked by calculating the Consistency Ratio

85
(CR). A consistency less than 0.1 is acceptable (see Section 3.6). In this study the
consistency ratio was calculated automatically by the Super Decisions software.
In order to assign intensity of importance to each set of indicators, the individual indicators
were weighted in relation to each other; i.e. pairwise comparison was carried out for all
connections in the model. Results from the rating method formed the basis of the weights
assigned to each indicator in the pairwise comparison of the ANP model. This weighting
procedure of using the results from the rating method afforded the researcher the
opportunity to identify how much each factor or element was contributing to the overall
goal of housing quality for each district and hence their subsequent weights assigned. Since
some of the indicators had more than one variable used to measure them, the average
weights of the variables under those indicators were taken. An average was taken of the six
(6) variables (bathing facility, cooking fuel, cooking space, lighting, toilet facility, water
supply) used to measure housing services for the physical criterion and the variables (liquid
waste disposal and solid waste disposal) for sanitation under the environmental criterion.
The final weights of the rating model (see Appendix I) were used as input for the ANP
model. The Greater Accra region will be used for demonstrating the pairwise comparison.
The final weights for housing services for the Accra Metropolis is calculated by taking the
average of the six variables outlined above, which gives a value of 0.6389 (see the housing
services column in Table 4.3). The average of liquid and solid waste disposal is calculated
in a similar way, resulting in a value of 0.7500 (see the sanitation column in Table 4.3).
The same procedure was carried out for all the other districts.

86
Table 4.3: Priorities for variables (Housing services and Environmental sanitation) for
Greater Accra Region from the Rating Model.
DISTRICT/
VARIABLES
Bathing
Facility
Cooking
Fuel
Cooking
Space
Lighting
Toilet
Facility
Water
Supply
Housing
Services
Liquid
Waste
Disposal
Solid
Waste
Disposal
Sanitation
Accra
Metropolis 0.3333 0.6667 0.3333 1.0000 0.5000 1.0000 0.6389 0.5000 1.0000 0.7500
Adenta
Municipal 0.3333 1.0000 0.3333 1.0000 0.5000 0.3333 0.5833 0.5000 1.0000 0.7500
Ashaiman
Municipal 0.3333 0.6667 0.3333 1.0000 0.5000 1.0000 0.6389 0.5000 1.0000 0.7500
Dangbe East 0.3333 0.6667 0.3333 1.0000 0.5000 0.6667 0.5833 0.5000 0.5000 0.5000
Dangbe
West 0.3333 0.6667 0.3333 1.0000 0.5000 1.0000 0.6389 0.5000 0.5000 0.5000
Ga East
Municipal
1.0000 1.0000 0.3333 1.0000 1.0000 0.3333 0.7778 0.5000 1.0000 0.7500
Ga West
Municipal
0.3333 1.0000 0.3333 1.0000 1.0000 0.3333 0.6667 0.5000 1.0000 0.7500
Ledzokuku/
Krowor
0.3333 1.0000 0.3333 1.0000 0.5000 1.0000 0.6944 0.5000 1.0000 0.7500
Tema
Metropolis 1.0000 1.0000 0.3333 1.0000 1.0000 1.0000 0.8889 0.5000 1.0000 0.7500
Weija
(Ga South)
0.3333 0.6667 0.3333 1.0000 0.5000 1.0000 0.6389 0.5000 0.5000 0.5000
The weights from the rating method were converted into a 100 point scale. In each pairwise
comparison, any two variables of the same magnitude were assigned a value of 1 from the
fundamental scale. The value of 1 was considered the baseline and values higher and below
this threshold were assigned based on the magnitude of each indicator. For instance, under
the physical criterion, if housing services and dwelling type each had a magnitude of 50,
then the weight assigned was 1. If the housing services and dwelling type had magnitudes
of 50 and 60 or 50 and 70, then dwelling type was assigned values of 2 and 3, respectively.

87
This implies that the dwelling type is 2 (weak or slightly) and 3 (moderately) contributing
to the quality of housing than the housing services. Alternatively, if the housing services
and dwelling type had magnitudes of 50 and 40 or 50 and 30, then housing services was
assigned values of 3 and 4, respectively. This implies that the housing services is 3
(moderately) and 4 (moderate plus) contributing to quality than dwelling type. In both
instances, it is the magnitude and not the direction that was considered. Based on the
weights in Table 4.4, the pairwise comparison was carried out using the questionnaire mode
in the Super Decisions software (Figure 4.10). From Table 4.4, the values of 66.67 for
housing type, 63.89 for housing services and 100 for outer materials for the Accra
Metropolis denote weights of 0.6667, 0.6389, and 1.0000 from the rating model.
Table 4.4: Weights for each Indicator from the Rating Model for Greater Accra Region
District
Physical Criteria
Economic/Social
Criteria
Environmental
Criteria
Housing
Type
Housing
Services
Outer
Material
Household
Density
Tenure
Holding
Housing
Density Sanitation
Accra
Metropolis 66.67 63.89 100 50 50 33.33 75
Adenta
Municipal 100 58.33 100 100 100 66.67 75
Ashaiman
Municipal 66.67 63.89 100 50 50 33.33 75
Dangbe East 66.67 58.33 100 100 100 100 50
Dangbe West 66.67 63.89 100 100 100 100 50
Ga East
Municipal 100 77.78 100 100 50 33.33 75
Ga West
Municipal 66.67 66.67 100 100 50 66.67 75
Ledzokuku/
Krowor 66.67 69.45 100 50 50 33.33 75
Tema
Metropolis 100 88.89 100 100 100 66.67 75
Weija (Ga
South) 100 63.89 100 100 100 66.67 50

88
Figure 4.10: The Questionnaire Mode for Comparing Alternatives with Respect to Dwelling
Type Node in the Physical Cluster.
Since all the factors (nodes) within the clusters affect the alternatives, the alternatives were
compared with respect to each cluster criteria. For example, the physical cluster is
connected to the alternative cluster, therefore the districts (alternatives) were compared to
the elements in the physical cluster. Since the dwelling type, housing services and outer
material are connected to elements in the alternative cluster, there would be a set of
numerical judgements for each indicator and the derived weights from these judgements,
represented in the reciprocal matrix shown in Tables 4.5 and 4.6 for dwelling type and
housing services respectively. A similar procedure was carried out for outer material and
the elements in the other clusters; i.e. economic/social (overcrowding and tenure holding)
and environmental (housing density and sanitation).

89
Table 4.5: Pairwise Judgments of Dwelling Type for Alternatives
Inconsistency: 0.0000
Table 4.6: Pairwise Judgments of Housing Services for Alternatives
Inconsistency: 0.02983
Accra
Adenta
Ashaiman
Dangbe
East
Dangbe
West
Ga
East
Ga
West
Ledzokuku
/ Krowor
Tema Weija Priorities
Accra
Metropolis
1 1/5 1 1 1 1/5 1 1 1/5 1/5 0.03846
Adenta
Municipal
5 1 5 5 5 1 5 5 1 1 0.19231
Ashaiman
Municipal
1 1/5 1 1 1 1/5 1 1 1/5 1/5 0.03846
Dangbe
East
1 1/5 1 1 1 1/5 1 1 1/5 1/5 0.03846
Dangbe
West
1 1/5 1 1 1 1/5 1 1 1/5 1/5 0.03846
Ga East
Municipal
5 1 5 5 5 1 5 5 1 1 0.19231
Ga West
Municipal
1 1/5 1 5 1 1/5 1 1 1/5 1/5 0.03846
Ledzokuku/
Krowor
1 1/5 1 1 1 1/5 1 1 1/5 1/5 0.03846
Tema
Metropolis
5 1 5 5 5 1 5 5 1 1 0.19231
Weija
(Ga South)
5 1 5 5 5 1 5 5 1 1 0.19231
Accra
Adenta
Ashaiman
Dangbe
East
Dangbe
West
Ga
East
Ga
West
Ledzokuku
/ Krowor
Tema Weija Priorities
Accra
Metropolis
1 2 1 2 1 1/3 1/3 1/3 1/4 1 0.0593
Adenta
Municipal
1/2 1 1/2 1 1/2 1/3 1/2 1/3 1/4 1/2 0.0406
Ashaiman
Municipal
1 2 1 3 1 1/3 1/2 1/2 1/4 1 0.0669
Dangbe
East
1/2 1 1/3 1 1/2 1/3 1/2 1/3 1/4 1/2 0.0396
Dangbe
West
1 2 1 2 1 1/3 1/2 1/2 1/4 1 0.0631
Ga East
Municipal
3 3 3 3 3 1 3 1/2 1/2 3 0.1587
Ga West
Municipal
3 2 2 2 2 1/3 1 1/2 1/4 1 0.0914
Ledzokuku/
Krowor
3 3 2 3 2 2 2 1 1/3 2 0.1491
Tema
Metropolis
4 4 4 4 4 2 4 3 1 4 0.2637
Weija
(Ga South)
1 2 1 2 1 1/3 1 1/2 1/4 1 0.0675

90
The judgments in the first row of the reciprocal matrix for the dwelling type indicate that
in considering the contribution of the element to the housing quality of the districts,
dwelling types in Accra Metropolis contributes a fifth of that of Adenta, Ga East, Tema
and Weija (Ga South), but contributing the same as that of Ashaiman, Dangbe East, Dangbe
West and Ga West and Ledzokuku-Krowor Municipal. The derived priorities in the last
column are computed by dividing each value by the sum of its column and then taking the
average of the normalized row sum. Each priority vector’s entries sum to one and are placed
in their appropriate location in the supermatrix.
After comparing the alternatives with respect to each cluster criteria, the reverse was done
whereby, criteria was compared with respect to the alternatives. This is as a result of the
feedback links in the model. With regard to this pairwise comparison in the physical
cluster, the dwelling type, housing services and outer/external materials were compared
with respect to each district. For example, when comparing dwelling type, housing
services and outer/external materials with respect to Accra Metropolis, the question is:
which factor is contributing more to housing quality, dwelling types, housing services or
outer/external materials, and to what degree? From the reciprocal matrix in Figure 4.11,
outer material (structural quality) is contributing more to housing quality in the district with
a priority of 0.70886, followed by dwelling type and housing services. This procedure was
carried out for the other clusters (economic/social and environmental) (Figures 4.12 and
4.13) as well as the other districts.

91
Figure 4.11: Comparison of Nodes in the Physical Cluster with respect to Accra Metropolis.
Figure 4.12: Comparison of Nodes in the Economic/Social Cluster with respect to Accra
Metropolis.
Figure 4.13: Comparison of Nodes in the Environmental Cluster with respect to Accra
Metropolis.

92
As the physical cluster is inner dependent (connected to itself), it is one of the three clusters
being pairwise compared with respect to the physical cluster. Since nodes in the physical
cluster are connected to other nodes in that cluster, it influences itself. As a result, nodes in
this cluster are being compared with respect to other nodes in the same cluster. Though
dwelling type influences housing quality for a district, it also influences housing services
and outer material with respect to their contribution. Therefore, the question was asked
about which influences the quality contribution of housing services more: itself, dwelling
type or outer/external material? And which influences the quality contribution of outer
material more: itself, dwelling type or housing services? With regards to which influences
the quality of housing services more, a judgment of 9 was assigned to dwelling type over
outer/external material and 7 to dwelling type over housing services (Figure 4.14). The
value of 9 assigned from the fundamental scale means that the evidence favouring one
activity over another is of the highest possible order. In this case dwelling type influencing
housing services compared to the outer material. The judgement of 7 means that an activity
is favoured strongly over another; its dominance is demonstrated in practice.
This judgment was assigned on the basis that the type of dwelling sometimes influences
whether a facility in a house would be shared or not. For example, compound houses are
comprised of more than one family; therefore, the likelihood of sharing facilities (toilet,
bathroom, and kitchen) among more than one household or family is high. Sharing of
facilities among more than a household or family contributes to poor quality of dwellings
as issues of privacy arises. According to Muoghalu (1991), sharing presents greater
problems with respect to bathrooms, kitchen and toilet because of the risks involved as the
intensity and number of users increase. According to Muoghalu, sharing of kitchen space

93
not only engenders conflicts and quarrels among housewives, but also infringes on family
privacy as people (families) want to prepare their meals privately. Concerning the question,
which influences the quality contribution of structural quality (outer material) more; itself,
dwelling type or housing services? Dwelling type was assigned a judgement of 9 over
housing services and 7 over structural quality. That is the dwelling type influences outer
material, hence influencing its contribution to housing quality. For example, if a dwelling
type is a hut or improvised structure, then there is the likelihood that the outer material will
be of low quality (mud, scraps, wood etc.). Therefore, contributing to the low quality of
houses.
Figure 4.14: Inner Dependent Comparison for the Physical Cluster: Which Influences Housing
Services more, Itself, Dwelling Type or Outer/ External material?
Further, outer dependence exists between the physical and the economic/social clusters.
That is, an element in the physical cluster is being connected to elements in the
economic/social cluster. In this case, housing services is linked to overcrowding
(household density) and tenure holding (ownership) in the economic/social cluster.

94
Therefore, crowding and ownership is pairwise compared with respect to housing services
for their influence in contribution to housing quality.
Overcrowding measured by average household per house influences housing services
contribution to housing quality. The higher the average of number of households per
house, the higher the sharing rate of facilities such as bathroom, kitchen and toilet. Sharing
of facilities influences housing quality. When facilities such as bathroom and toilet sharing
increases, it imposes a health risk to residents. High sharing of toilet creates unsanitary and
unkempt conditions. According to Boadi and Kuitunen (2005) these conditions provide
conducive environments for vectors and pathogenic organisms connected with diarrhoea
infection, and also increases the possibility of transmitting pathogens from one infected
household to others. They found in their study in the Accra Metropolitan area in Ghana
that, households who share a toilet facility with more than five other households are more
likely to have a high incidence of childhood diarrhoea.
In addition, ownership of a residence has an influence on the maintenance, quality and
longevity of facilities and services in the house. When a dwelling is owner-occupied, the
owner usually invests in the housing services for long term purposes. Since they are for
long term purposes, they are mostly of the highest standards that ends up contributing to
the quality of the residence compared to the rental ones, whereby due to the temporal nature
of the residents, they do not invest in the maintenance of facilities in the house if the
landlord or landlady does not provide. For example, in compound houses with limited
bathing services, residents might resort to improvised bathrooms such as cubicle
(open/shared) which is of poorer quality instead of investing in a bathroom of higher

95
quality. Consequently, the status of residents in the dwelling affects the housing services
they provide.
A comparison question was asked as to whether crowding (average household per house)
or ownership, which influences the quality contribution of housing services more. A
judgment of 7 was assigned to crowding (Figure 4.15); that is, the contribution of crowding
to the quality of housing services is more than the contribution of ownership to the quality
of housing services. This judgment was assigned on the premise that although the status of
residents affects their maintenance of facilities and services in the house and by extension,
the housing services they provide, this is not usually the case as some owner-occupied
dwellings still lack some essential housing services. The economic status of some owners
occasionally affects their capacity to provide high quality services in the house. However,
with regard to household crowding, even if high quality housing services are available, the
burden imposed on the service by multiple users in the households will hasten the
deterioration of the service thereby affecting the overall quality status of the dwellings.
After completing the paired comparisons among the clusters and their elements, the
supermatrices are formed.

96
Figure 4.15: Outer Dependence Comparison of the Physical and Economic/Social Clusters:
Which Influences Housing Services more: crowding or ownership.
4.4.4 Constructing the Supermatrices of ANP
After obtaining the pairwise comparison matrix, supermatrix of the ANP model was
constructed to represent the relative priority of elements. This step consists of the
progressive formation of three supermatrices: the initial or unweighted, the weighted, and
the limit supermatrix. A supermatrix is a two-dimensional matrix of elements by elements.
The supermatrix represents the influence priority of an element on the left of the matrix on
an element at the top of the matrix with respect to a particular control criterion.
The original supermatrix of column priorities is obtained from pairwise comparison
matrices of elements; i.e. the priorities derived from the different pairwise comparisons.
Once all the pairwise comparison matrices (weights obtained from the reciprocal matrixes)
have been filled in, the totality of the related priority vectors at the node level forms the
unweighted supermatrix. The unweighted supermatrix contains all the network clusters and
nodes and represents its interrelationships, which is based on the flow of effect from one

97
element to another, or from a cluster to itself as in the loop. The column for a node contains
the priorities of all the nodes that have been pairwise compared with respect to it and
influence it with respect to the control criterion “housing quality”. If an element or a
component has no input, a zero is entered in the corresponding priority vector. In each
block of the supermatrix, a column is either a normalized priority with possibly some zero
entries, or all of its elements are equal to zero. The supermatrix of unweighted priorities
for the network is shown in two parts in Tables 4.7a and 4.7b.
In the supermatrix of Table 4.7a and 4.7b, the sum of each column corresponds to the
number of comparison sets. If Accra Metropolis only had three comparison sets, then the
corresponding column would sum to 3 because each priority vector sums to 1. By
incorporating the results of each reciprocal matrix into one matrix (unweighted
supermatrix) results in the sum of each line (column) being more than one. Therefore, each
column in Table 4.7a and 4.7b is normalized so that the entries sum to 1 to ensure the
matrix is column stochastic. This is done by using the resulting matrix of numbers
(weights) from the pairwise comparison of the clusters to weight the corresponding blocks
of the original unweighted supermatrix. For example, the values in the (economic/social,
alternatives) cell of the cluster matrix (Figure 4.16) is used to weight the unweighted
supermatrix by multiplying the value in each cell in the (economic/social, alternatives)
component of the unweighted supermatrix. Every component is weighted with its
corresponding cluster matrix weight in this way.

98
Table 4.7a: Supermatrix of Unweighted Priorities for Greater Accra Region
ALTERNATIVES
Accra
Metropolis
Adenta
Municipal
Ashaiman
Municipal
Dangbe
East
Dangbe
West
Ga East
Municipal
Ga West
Municipal
Ledzokuku
/Krowor
Municipal
Tema
Metropolis
Weija (Ga
South)
Municipal
ALTERNATIVES
Accra Metropolis 0.0000 0.0000 0.0000 0.0000 0.0000 0.0000 0.0000 0.0000 0.0000 0.0000
Adenta Municipal 0.0000 0.0000 0.0000 0.0000 0.0000 0.0000 0.0000 0.0000 0.0000 0.0000
Ashaiman
Municipal 0.0000 0.0000 0.0000 0.0000 0.0000 0.0000 0.0000 0.0000 0.0000 0.0000
Dangbe East 0.0000 0.0000 0.0000 0.0000 0.0000 0.0000 0.0000 0.0000 0.0000 0.0000
Dangbe West 0.0000 0.0000 0.0000 0.0000 0.0000 0.0000 0.0000 0.0000 0.0000 0.0000
Ga East Municipal 0.0000 0.0000 0.0000 0.0000 0.0000 0.0000 0.0000 0.0000 0.0000 0.0000
Ga West Municipal 0.0000 0.0000 0.0000 0.0000 0.0000 0.0000 0.0000 0.0000 0.0000 0.0000
Ledzokuku/Krowor
Municipal 0.0000 0.0000 0.0000 0.0000 0.0000 0.0000 0.0000 0.0000 0.0000 0.0000
Tema Metropolis 0.0000 0.0000 0.0000 0.0000 0.0000 0.0000 0.0000 0.0000 0.0000 0.0000
Weija (Ga South)
Municipal 0.0000 0.0000 0.0000 0.0000 0.0000 0.0000 0.0000 0.0000 0.0000 0.0000
ECONOMIC/SOCIAL
Overcrowding
(household density) 0.6667 0.5000 0.5000 0.5000 0.5000 0.8750 0.8750 0.5000 0.5000 0.5000
Ownership 0.3333 0.5000 0.5000 0.5000 0.5000 0.1250 0.1250 0.5000 0.5000 0.5000
ENVIRONMENTAL
Amount of Open
Space 0.1429 0.3333 0.1667 0.8750 0.8750 0.1667 0.3333 0.1667 0.3333 0.7500
Sanitation Facilities 0.8571 0.6667 0.8333 0.1250 0.1250 0.8333 0.6667 0.8333 0.6667 0.2500
PHYSICAL
Dwelling Type 0.1786 0.4615 0.1786 0.1721 0.1786 0.4444 0.1429 0.1125 0.4286 0.4545
Housing Services /
Infrastructure 0.1125 0.0769 0.1125 0.1020 0.1125 0.1111 0.1429 0.1786 0.1429 0.0909
Structural Quality 0.7089 0.4615 0.7089 0.7258 0.7089 0.4444 0.7143 0.7089 0.4286 0.4545

99
Table 4.7b: Supermatrix of Unweighted Priorities for Greater Accra Region (continuation)
ECONOMIC/SOCIAL ENVIRONMENTAL PHYSICAL
Overcrowding
(household
density)
Ownership
Amount
of Open
Space
Sanitation
Facilities
Dwelling
Type
Housing
Services
Structural
Quality
ALTERNATIVES
Accra Metropolis 0.0192 0.0250 0.0218 0.1290 0.0385 0.0593 0.1000
Adenta Municipal 0.1346 0.1750 0.0855 0.1290 0.1923 0.0407 0.1000
Ashaiman
Municipal 0.0192 0.0250 0.0218 0.1290 0.0385 0.0669 0.1000
Dangbe East 0.1346 0.1750 0.2855 0.0323 0.0385 0.0396 0.1000
Dangbe West 0.1346 0.1750 0.2855 0.0323 0.0385 0.0631 0.1000
Ga East
Municipal 0.1346 0.0250 0.0218 0.1290 0.1923 0.1587 0.1000
Ga West
Municipal 0.1346 0.0250 0.0855 0.1290 0.0385 0.0914 0.1000
Ledzokuku/
Krowor
Municipal 0.0192 0.0250 0.0218 0.1290 0.0385 0.1491 0.1000
Tema Metropolis 0.1346 0.1750 0.0855 0.1290 0.1923 0.2637 0.1000
Weija (Ga South)
Municipal 0.1346 0.1750 0.0855 0.0323 0.1923 0.0675 0.1000
ECONOMIC
/SOCIAL
Overcrowding
(household
density) 0.0000 0.0000 0.0000 0.0000 0.0000 0.8750 0.0000
Ownership 0.0000 0.0000 0.0000 0.0000 0.0000 0.1250 0.0000
ENVIRONMENTAL
Amount of Open
Space 0.0000 0.0000 0.0000 0.0000 0.0000 0.0000 0.0000
Sanitation
Facilities 0.0000 0.0000 0.0000 0.0000 0.0000 0.0000 0.0000
PHYSICAL
Dwelling Type 0.0000 0.0000 0.0000 0.0000 0.0000 0.7511 0.7511
Housing Services 0.0000 0.0000 0.0000 0.0000 0.0000 0.2053 0.0436
Structural Quality 0.0000 0.0000 0.0000 0.0000 0.0000 0.0436 0.2053
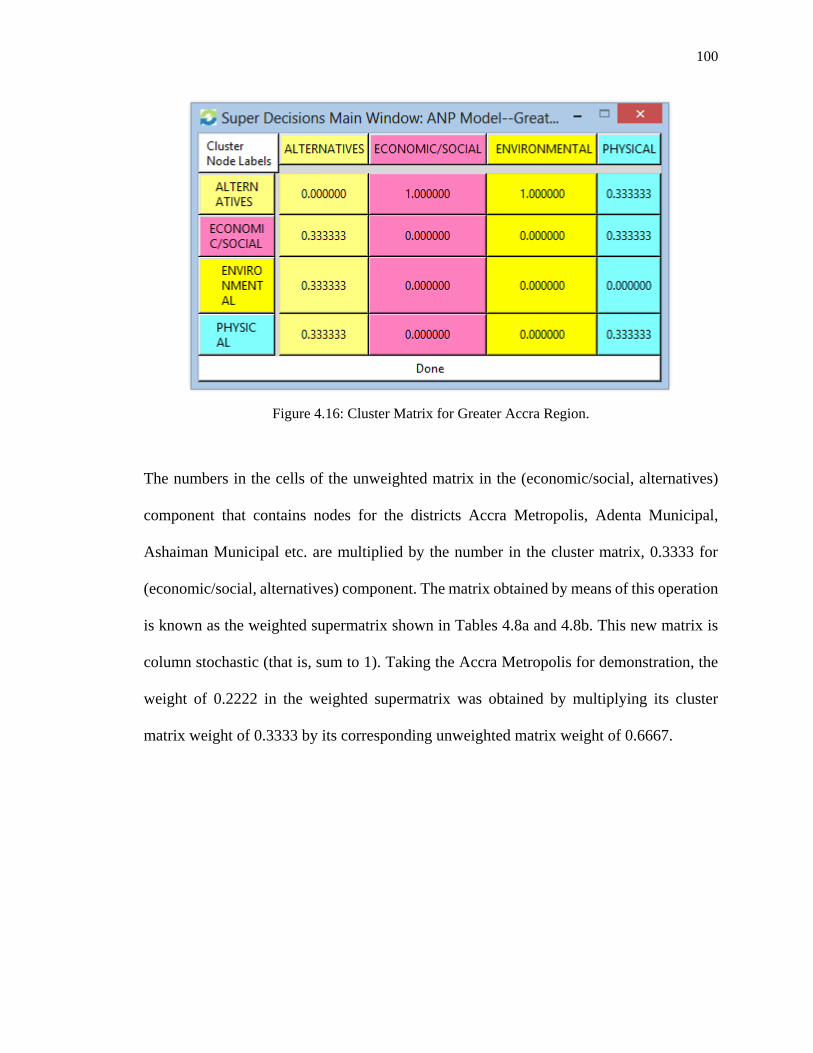
100
Figure 4.16: Cluster Matrix for Greater Accra Region.
The numbers in the cells of the unweighted matrix in the (economic/social, alternatives)
component that contains nodes for the districts Accra Metropolis, Adenta Municipal,
Ashaiman Municipal etc. are multiplied by the number in the cluster matrix, 0.3333 for
(economic/social, alternatives) component. The matrix obtained by means of this operation
is known as the weighted supermatrix shown in Tables 4.8a and 4.8b. This new matrix is
column stochastic (that is, sum to 1). Taking the Accra Metropolis for demonstration, the
weight of 0.2222 in the weighted supermatrix was obtained by multiplying its cluster
matrix weight of 0.3333 by its corresponding unweighted matrix weight of 0.6667.

101
Table 4.8a: Weighted Supermatrix for Greater Accra Region
ALTERNATIVES
Accra
Metropolis
Adenta
Municipal
Ashaiman
Municipal
Dangbe
East
Dangbe
West
Ga East
Municipal
Ga West
Municipal
Ledzokuku
/Krowor
Municipal
Tema
Metropolis
Weija (Ga
South)
Municipal
ALTERNATIVES
Accra Metropolis 0.0000 0.0000 0.0000 0.0000 0.0000 0.0000 0.0000 0.0000 0.0000 0.0000
Adenta Municipal 0.0000 0.0000 0.0000 0.0000 0.0000 0.0000 0.0000 0.0000 0.0000 0.0000
Ashaiman
Municipal 0.0000 0.0000 0.0000 0.0000 0.0000 0.0000 0.0000 0.0000 0.0000 0.0000
Dangbe East 0.0000 0.0000 0.0000 0.0000 0.0000 0.0000 0.0000 0.0000 0.0000 0.0000
Dangbe West 0.0000 0.0000 0.0000 0.0000 0.0000 0.0000 0.0000 0.0000 0.0000 0.0000
Ga East Municipal 0.0000 0.0000 0.0000 0.0000 0.0000 0.0000 0.0000 0.0000 0.0000 0.0000
Ga West Municipal 0.0000 0.0000 0.0000 0.0000 0.0000 0.0000 0.0000 0.0000 0.0000 0.0000
Ledzokuku/Krowor
Municipal 0.0000 0.0000 0.0000 0.0000 0.0000 0.0000 0.0000 0.0000 0.0000 0.0000
Tema Metropolis 0.0000 0.0000 0.0000 0.0000 0.0000 0.0000 0.0000 0.0000 0.0000 0.0000
Weija (Ga South)
Municipal 0.0000 0.0000 0.0000 0.0000 0.0000 0.0000 0.0000 0.0000 0.0000 0.0000
ECONOMIC/SOCIAL
Overcrowding
(household density) 0.2222 0.1667 0.1667 0.1667 0.1667 0.2917 0.2917 0.1667 0.1667 0.1667
Ownership 0.1111 0.1667 0.1667 0.1667 0.1667 0.0417 0.0417 0.1667 0.1667 0.1667
ENVIRONMENTAL
Amount of Open
Space 0.0476 0.1111 0.0556 0.2917 0.2917 0.0556 0.1111 0.0556 0.1111 0.2500
Sanitation Facilities 0.2857 0.2222 0.2778 0.0417 0.0417 0.2778 0.2222 0.2778 0.2222 0.0833
PHYSICAL
Dwelling Type 0.0595 0.1538 0.0595 0.0574 0.0595 0.1481 0.0476 0.0375 0.1429 0.1515
Housing Services /
Infrastructure 0.0375 0.0256 0.0375 0.0340 0.0375 0.0370 0.0476 0.0595 0.0476 0.0303
Structural Quality 0.2363 0.1538 0.2363 0.2419 0.2363 0.1481 0.2381 0.2363 0.1429 0.1515

102
Table 4.8b: Weighted Supermatrix for Greater Accra Region (continuation)
ECONOMIC/SOCIAL ENVIRONMENTAL PHYSICAL
Overcrowding
(household
density)
Ownership
Amount
of Open
Space
Sanitation
Facilities
Dwelling
Type
Housing
Services
Structural
Quality
ALTERNATIVES
Accra Metropolis 0.0192 0.0250 0.0218 0.1290 0.0385 0.0198 0.0500
Adenta Municipal 0.1346 0.1750 0.0855 0.1290 0.1923 0.0136 0.0500
Ashaiman
Municipal 0.0192 0.0250 0.0218 0.1290 0.0385 0.0223 0.0500
Dangbe East 0.1346 0.1750 0.2855 0.0323 0.0385 0.0132 0.0500
Dangbe West 0.1346 0.1750 0.2855 0.0323 0.0385 0.0210 0.0500
Ga East Municipal 0.1346 0.0250 0.0218 0.1290 0.1923 0.0529 0.0500
Ga West Municipal 0.1346 0.0250 0.0855 0.1290 0.0385 0.0305 0.0500
Ledzokuku/Krowor
Municipal 0.0192 0.0250 0.0218 0.1290 0.0385 0.0497 0.0500
Tema Metropolis 0.1346 0.1750 0.0855 0.1290 0.1923 0.0879 0.0500
Weija (Ga South)
Municipal 0.1346 0.1750 0.0855 0.0323 0.1923 0.0225 0.0500
ECONOMIC/SOCIAL
Overcrowding
(household density) 0.0000 0.0000 0.0000 0.0000 0.0000 0.2917 0.0000
Ownership 0.0000 0.0000 0.0000 0.0000 0.0000 0.0417 0.0000
ENVIRONMENTAL
Amount of Open
Space 0.0000 0.0000 0.0000 0.0000 0.0000 0.0000 0.0000
Sanitation Facilities 0.0000 0.0000 0.0000 0.0000 0.0000 0.0000 0.0000
PHYSICAL
Dwelling Type 0.0000 0.0000 0.0000 0.0000 0.0000 0.2504 0.3756
Housing Services 0.0000 0.0000 0.0000 0.0000 0.0000 0.0684 0.0218
Structural Quality 0.0000 0.0000 0.0000 0.0000 0.0000 0.0145 0.1026

103
The weighted supermatrix is then raised to powers using equation (3.3) until it converges
to yield the limit supermatrix shown in Tables 4.9a and 4.9b. The limit supermatrix
represents all possible interactions in the system. The relative values for the districts are
obtained from any column of the limit supermatrix that in this case are all the same.
Afterwards, the respective columns are normalized to obtain the final priorities (see Table
4.9). Normalizing the limit matrix numbers yields their respective housing quality shown
in Figure 4.17. The unweighted supermatrix, weighted supermatrix and limit matrix are
calculated by the Super Decisions software.

104
Table 4.9a: Limit Supermatrix for Greater Accra Region
ALTERNATIVES
Accra
Metropolis
Adenta
Municipal
Ashaiman
Municipal
Dangbe
East
Dangbe
West
Ga East
Municipal
Ga West
Municipal
Ledzokuku
/Krowor
Municipal
Tema
Metropolis
Weija
(Ga
South)
Municipal
ALTERNATIVES
Accra Metropolis 0.0247 0.0247 0.0247 0.0247 0.0247 0.0247 0.0247 0.0247 0.0247 0.0247
Adenta Municipal 0.0644 0.0644 0.0644 0.0644 0.0644 0.0644 0.0644 0.0644 0.0644 0.0644
Ashaiman
Municipal 0.0248 0.0248 0.0248 0.0248 0.0248 0.0248 0.0248 0.0248 0.0248 0.0248
Dangbe East 0.0570 0.0570 0.0570 0.0570 0.0570 0.0570 0.0570 0.0570 0.0570 0.0570
Dangbe West 0.0572 0.0572 0.0572 0.0572 0.0572 0.0572 0.0572 0.0572 0.0572 0.0572
Ga East Municipal 0.0507 0.0507 0.0507 0.0507 0.0507 0.0507 0.0507 0.0507 0.0507 0.0507
Ga West Municipal 0.0408 0.0408 0.0408 0.0408 0.0408 0.0408 0.0408 0.0408 0.0408 0.0408
Ledzokuku/Krowor
Municipal 0.0254 0.0254 0.0254 0.0254 0.0254 0.0254 0.0254 0.0254 0.0254 0.0254
Tema Metropolis 0.0660 0.0660 0.0660 0.0660 0.0660 0.0660 0.0660 0.0660 0.0660 0.0660
Weija (Ga South)
Municipal 0.0566 0.0566 0.0566 0.0566 0.0566 0.0566 0.0566 0.0566 0.0566 0.0566
ECONOMIC/SOCIAL
Overcrowding
(household
density) 0.0970 0.0970 0.0970 0.0970 0.0970 0.0970 0.0970 0.0970 0.0970 0.0970
Ownership 0.0660 0.0660 0.0660 0.0660 0.0660 0.0660 0.0660 0.0660 0.0660 0.0660
ENVIRONMENTAL
Amount of Open
Space 0.0733 0.0733 0.0733 0.0733 0.0733 0.0733 0.0733 0.0733 0.0733 0.0733
Sanitation
Facilities 0.0826 0.0826 0.0826 0.0826 0.0826 0.0826 0.0826 0.0826 0.0826 0.0826
PHYSICAL
Dwelling Type 0.0912 0.0912 0.0912 0.0912 0.0912 0.0912 0.0912 0.0912 0.0912 0.0912
Housing Services 0.0215 0.0215 0.0215 0.0215 0.0215 0.0215 0.0215 0.0215 0.0215 0.0215
Structural Quality 0.1008 0.1008 0.1008 0.1008 0.1008 0.1008 0.1008 0.1008 0.1008 0.1008

105
Table 4.9b: Limit Supermatrix for Greater Accra Region (continuation)
ECONOMIC/SOCIAL ENVIRONMENTAL PHYSICAL
Overcrowding
(household
density)
Ownership
Amount
of Open
Space
Sanitation
Facilities
Dwelling
Type
Housing
Services
Structural
Quality
ALTERNATIVES
Accra Metropolis 0.0247 0.0247 0.0247 0.0247 0.0247 0.0247 0.0247
Adenta Municipal 0.0644 0.0644 0.0644 0.0644 0.0644 0.0644 0.0644
Ashaiman
Municipal 0.0248 0.0248 0.0248 0.0248 0.0248 0.0248 0.0248
Dangbe East 0.0570 0.0570 0.0570 0.0570 0.0570 0.0570 0.0570
Dangbe West 0.0572 0.0572 0.0572 0.0572 0.0572 0.0572 0.0572
Ga East Municipal 0.0507 0.0507 0.0507 0.0507 0.0507 0.0507 0.0507
Ga West Municipal 0.0408 0.0408 0.0408 0.0408 0.0408 0.0408 0.0408
Ledzokuku/Krowor
Municipal 0.0254 0.0254 0.0254 0.0254 0.0254 0.0254 0.0254
Tema Metropolis 0.0660 0.0660 0.0660 0.0660 0.0660 0.0660 0.0660
Weija (Ga South)
Municipal 0.0566 0.0566 0.0566 0.0566 0.0566 0.0566 0.0566
ECONOMIC/SOCIAL
Overcrowding
(household density) 0.0970 0.0970 0.0970 0.0970 0.0970 0.0970 0.0970
Ownership 0.0660 0.0660 0.0660 0.0660 0.0660 0.0660 0.0660
ENVIRONMENTAL
Amount of Open
Space 0.0733 0.0733 0.0733 0.0733 0.0733 0.0733 0.0733
Sanitation
Facilities 0.0826 0.0826 0.0826 0.0826 0.0826 0.0826 0.0826
PHYSICAL
Dwelling Type 0.0912 0.0912 0.0912 0.0912 0.0912 0.0912 0.0912
Housing Services 0.0215 0.0215 0.0215 0.0215 0.0215 0.0215 0.0215
Structural Quality 0.1008 0.1008 0.1008 0.1008 0.1008 0.1008 0.1008

106
Table 4.10: Limiting Priorities and Normalized by Cluster Priorities
Figure 4.17: Final Results for Housing Quality for Districts in Greater Accra Region.
Normalized By
Cluster Priorities
Limiting
Priorities
ALTERNATIVES
Accra Metropolis 0.0529 0.0247
Adenta Municipal 0.1377 0.0644
Ashaiman Municipal 0.0530 0.0248
Dangbe East 0.1220 0.0570
Dangbe West 0.1223 0.0572
Ga East Municipal 0.1084 0.0507
Ga West Municipal 0.0873 0.0408
Ledzokuku/Krowor Municipal 0.0543 0.0254
Tema Metropolis 0.1411 0.0660
Weija (Ga South) Municipal 0.1210 0.0566
ECOCNOMIC/SOCIAL
Overcrowding (household density) 0.5950 0.0970
Ownership 0.4050 0.0660
ENVIRONMENTAL
Amount of Open Space 0.4701 0.0733
Sanitation Facilities 0.5300 0.0826
PHYSICAL
Dwelling Type 0.4272 0.0912
Housing Services 0.1005 0.0215
Structural Quality 0.4723 0.1008

107
4.5 GIS Integration
After the final weights have been synthesized to obtain the priorities of the districts in
terms of their rankings of housing quality, the weights were imported into GIS (see Section
3.7). A housing quality map was then generated displaying the spatial pattern of housing
quality at the district level. In order to observe the spatial pattern in the housing quality
map, normalized scores were classified into four classes with equal intervals. Figure 4.18
represents the housing quality map generated by ArcGIS 10.2.
Figure 4.18: Spatial Variation of Housing Quality for the Greater Accra Region.
This procedure demonstrated here for the Greater Accra region was carried out for all the
districts in the rest of the nine regions to identify their respective ranks as to housing quality
and what are the spatial patterns. The weights (final results) from the ANP model is used

108
as input for mapping the spatial pattern of housing quality for the districts. The next chapter
discusses the analysis and results of the ANP models for the regions, including that of the
Greater Accra region.
4.6 Summary
This chapter provided a case study of the ANP method to evaluate housing quality at the
district level in Ghana using the Greater Accra region for demonstration. It described the
study area, the decision framework, the ANP model and the steps that are carried out when
using the ANP method to obtain the final priorities for each district.

109
CHAPTER FIVE
RESULTS AND DISCUSSION
5.1 Introduction
This chapter discusses the results of the empirical analysis of housing quality at the district
level for the ten regions of Ghana. The results of the ANP models are presented and
examined. The chapter encompasses the key findings of the study regarding the factors/
indicators contributing to housing quality and the spatial patterns of housing quality for the
districts at the regions. The chapter concludes with a summary.
5.2 The Results
The analysis of housing quality was performed at the district level for the rest of the
9 regions of Ghana using the procedure exemplified in Chapter 4 for the Greater Accra
region (see Appendix III for the unweighted matrix for the regions). The results of this
study are presented graphically in two forms: tabular and geographic (map) formats. See
Appendix II for the results of the ANP models presented in tabular form. These results are
later classified into classes for the maps. The next section focuses on the discussion of the
results with respect to the final priorities of the elements in the ANP model.

110
5.3 Discussion of the Results
5.3.1 Global Analysis
The ANP method has been applied to evaluate and rank districts according to their housing
quality. Model 1 shows the final weights of the districts and the housing quality factors
(see Appendix II). From the results of the ANP model, the lower and higher values
(weights) indicate lower and higher residential quality/ranking of the districts. Higher
scores on an indicator implies that the factor is contributing more to the quality of housing.
Based on the rankings of the districts within the regions, it was found that, the districts with
the highest housing quality are: Sekyere Central for the Ashanti region, Dormaa East for
the Brong Ahafo region, Tema Metropolis for the Greater Accra region and Komenda-
Edina-Eguafo-Abirem for the Central region. With regards to the Eastern region, we have
Kwahu South, with the Western region having Ahanta West. The Upper East and Upper
West regions have Builsa and Wa East respectively. Whiles the Volta region have Keta
Municipal, and Sawla-Tuna-Kalba for the Northern region.
When analysed globally, it was found that the order of increasing importance of the factors
contributing to housing quality for the districts in model 1 from the limiting priorities is as
follows. Greater Accra region: structural quality, overcrowding, dwelling type, sanitation,
amount of open space, ownership and housing services. Northern region: the amount of
open space, dwelling type, overcrowding, ownership, structural quality, housing services
and sanitation. In the Central region, the order of increasing importance was amount of
open space, overcrowding, ownership, structural quality, housing services and sanitation.
The order of importance for Volta region is: amount of open space, dwelling type,
overcrowding, ownership, structural quality, sanitation and housing services. For the

111
Eastern region, the importance of housing quality indicators in increasing order of
magnitude was as follows: the amount of open space, dwelling type, overcrowding,
structural quality, ownership, housing services and sanitation. This order is identical to the
order of housing quality indicators for the Ashanti region. The order is the same for the
Western region except that ownership and structural quality switch places. In the case of
the Brong Ahafo region the order of increasing importance of the factors was amount of
open space, dwelling type, overcrowding, ownership, structural quality, housing services
and sanitation. Regarding the Upper East and Upper West regions, importance of housing
quality indicators in increasing order of magnitude was as follows: amount of open space,
dwelling type, overcrowding, ownership, housing services, structural quality and sanitation
contributing the least.
The factors that most contributes to the quality of housing in the study area are amount of
open space, dwelling type and overcrowding. The amount of open space and dwelling type
received the highest scores for nine out of the 10 regions. Overcrowding also received a
high score in all ten regions by consistently being among the top three housing quality
indicators. At the national level, the average number of households per house according
to the 2010 Population and Housing Census was 1.6; thus accounting for the high
contribution of this indicator.
The results of the empirical analysis revealed that housing services, sanitation and
structural quality are the three least contributing factors to the quality of housing in Ghana,
although housing ownership was recorded among the last three housing quality indicators
in three regions: the Greater Accra, Eastern and Ashanti regions. This suggests that
housing quality in the study area tends to increase as the conditions and availability of the

112
variables used to measure these indicators (housing services, environmental sanitation and
structural quality) improve within the study area. For housing services, all the ten regions
recorded least scores on this indicator. With the exception of the Greater Accra region,
environmental sanitation was ranked seventh in the Eastern, Central, Northern, Brong
Ahafo, Ashanti, Western, Upper East and Upper West regions and sixth in the Volta region.
With reference to structural quality, with the exception of the Eastern, Ashanti and Greater
Accra regions, the rest of the regions received least scores on this indicator, ranking sixth
in the Upper East and West regions and fifth in the rest (Brong Ahafo, Western, Central,
Volta and Northern regions).
A least score received on an indicator means that the districts in these regions performed
poorly on the variables used to measure the indicator. In relation to sanitation, the majority
of households adopted the modes of solid waste disposal that are termed as least or fairly
acceptable in this study such as burning by household, dumping indiscriminately, burying
of the refuse by household and usage of public dump (open space). While they use liquid
waste disposal modes termed least or fairly improved such as throwing onto the compound,
throwing onto the street/outside, through a drainage system into a gutter etc. For example,
in the Ashanti region, with the exception of Kumasi Metropolis and the Obuasi
Municipality, all the districts performed poorly on the indicator of environmental
sanitation. The 2010 Population and Housing Census analytical report for the Ashanti
region indicates that 41.9% of households dispose their solid waste (refuse) by dumping in
open public places, 35.4% by putting it in containers in public places and 9.1% percent
have it collected. The situation is similar in the other regions which had the least score on
this indicator. In the Brong Ahafo region, all the districts performed poorly except the

113
Sunyani Municipality. Within this region, public dumps are the most common outlet of
solid waste disposal in the region. 53.3% used the mode of public dumps in open spaces,
with 23.9% and 11.9% using public dumps in containers and indiscriminate dumping
respectively. Only 2.9% of households have their waste collected (GSS, 2013).
Concerning liquid waste, three methods are used in disposing liquid waste in the region:
dumping waste within the compound, the street or outside in the gutter. The compound and
the gutter accounts for 90% of the disposal means used by households. As can be seen from
these statistics, the population that adopts the fairly or least acceptable modes of refuse
disposal exceed those that adopts the acceptable form (public dump in containers and
collection) as well as those that adopted improved modes of liquid waste disposal. As a
result, the poor contribution of the environmental quality indicator to housing quality in
these regions is because of the poor local environmental conditions. In Ghana, waste
management difficulties extend from the state to the local municipalities (Thompson,
2011). The quality of the neighbourhood environment influencing housing quality have
also been established in studies such as (Amao, 2012; Jiboye, 2011). Jiboye found that, the
quality of residential neighbourhoods of Bodija and Moremi estates in Nigeria is
determined and affected by factors which deals with the quality of the environment such
as clean drainages and safe disposal of garbage.
Although poor environmental sanitation is contributing to poor housing quality, it was
observed that the district within which the regional capital2 is located performed well on
2 Regional capitals with their respective districts. Ashanti Region: Kumasi (Kumasi Metropolis); Brong Ahafo
Region: Sunyani (Sunyani Municipal); Greater Accra Region: Accra (Accra Metropolis); Central Region: Cape
Coast (Cape Coast Metropolis); Eastern Region: Koforidua (New Juaben Municipal); Upper East Region:
Bolgatanga (Bolgatanga Municipal District); Volta Region: Ho (Ho Municipal); Western Region: Sekondi-
Takoradi (Sekondi-Takoradi Metropolis); Northern Region: Tamale (Tamale Metropolis); and Upper West
Region: Wa (Wa Municipal).

114
this indicator. Out of the ten regions, seven (Ashanti, Brong Ahafo, Central, Eastern,
Greater Accra, Northern and Western regions) had the district with the regional capital
receiving the highest scores of the environmental sanitation indicator especially on the
variable mode of solid waste disposal. This suggests that sanitation seems to have a priority
in the urban centres.
With respect to structural quality, measured by the variable ‘type of outer wall material’,
the least contribution of the indicator to the quality of housing in Ghana reflects the current
situation on the ground. The main construction materials for outer walls are cement,
concrete and mud/mud bricks or earth. At the national level, the 2010 Population and
Housing Census found that although there has been a reduction in the proportion of
dwelling units with mud/mud brick or earth constituting the outer wall, the figure is still
high. A substantial number of dwelling units (34.2%) are made up of these materials, with
the share of dwelling units with outer walls of cement or concrete being 57.5 % (GSS,
2012). Lower scores obtained on this indicator can be attributed to the fact that the majority
of the housing stock in the country is found within rural areas (57.7%). Many of these
dwellings are built from less durable materials. The national census report states that 60.5%
of dwelling units in rural areas were made with mud/earth, which means that most of the
share of dwellings with cement and concrete as outer wall materials are found in the urban
areas with the less housing stock. As a result, the least contribution of this indicator, since
the proportion of houses in rural areas is higher than the urban ones with durable wall
materials.
It was also found that both the Upper East and Upper West regions had the indicator
ranking lower than the other regions which also recorded lower weights on this indicator

115
as stated above. The least ranking of this indicator in these two regions reflects the
predominant building material that is used in these regions. The foremost building material
used in these regions includes mud, mud brick/earth and thatch. For the Upper East region,
mud brick or earth constitutes (80.7%) and cement blocks/concrete (16.0%) of the outer
wall material. While the Upper West region have 75% of all materials used for outer walls
being mud, mud brick/earth and cement blocks/concrete, having a share of about 21.1%
(GSS, 2013).
As stated above, environmental sanitation, housing services and structural quality are the
three least contributing factors to housing quality in Ghana. However, in the Ashanti and
Eastern regions, structural quality was replaced by ownership, with ownership and the
amount of open space, replacing environmental sanitation and structural quality in the
Greater Accra region. With housing ownership, though the Ashanti, Eastern and Greater
Accra regions all have this indicator as one of their least contributing ones, the indicator
ranked lower (6th) in the Greater Accra region compared to the other two where it ranked
5th. The least score of the ownership indicator in the Greater Accra region can be attributed
to the fact that nearly half the households in the region rent their dwellings (47%), with
32.7% owning the dwelling they live in (GSS, 2013). Further, the lowest score on amount
of open space (housing density) in the region can be attributed to the housing stock of the
region. Out of the total housing stock of the country, the Greater Accra region accounts for
14% of the total (the second largest share), though the region has the smallest land area in
the country. This share of the region is higher than the 13.4% share of the three northern
regions (Northern, Upper East, and Upper West) which include the region with the largest
land area of the country i.e. the Northern region. Further, the region has the highest

116
percentage of makeshift dwellings (6.1%) (GSS, 2012). This is reflected in the subsequent
highest housing density of districts in the region; to that end, the poor contribution in the
amount of open space to housing quality. With the exception of Dangbe East and Dangbe
West districts, all the districts in the region received lower weights on this indicator with
four districts (Accra Metropolis, Ashaiman Municipal, Ga East Municipal and Ledzokuku-
Krowor Municipal) having a housing density greater than the 22 used in this study.
In Ghana, issues related to the variables used to assess the indicator of housing
infrastructures and services is of a national nature. For example, source of drinking water
for households used as a variable under this indicator is a national problem. An access to
improved water sources, especially piped water, is still a national issue, with no major
difference between the urban areas and the rural. As stated by the Economist Information
Unit (EIU) (1993, cited in UN-HABITAT, 2011) only eight of the country’s 170 district
capitals have comprehensive piped water networks. An efficient and hygienic method of
human waste disposal in a dwelling is of an utmost importance to the health of households.
Available toilet facilities in the study area are either of poor quality or inadequate.
Currently, the proportion of households that used efficient facilities is about the lower
share. It is reported that one in five dwelling units had no toilet facilities and household
members either used open fields, the beach or other open areas. 34.6% of households use
public toilet facilities, with only 15.4% using a flush toilet and 10.5% using KVIP (GSS,
2012) incorporated under the improved type in this study. Issues of lack of frequent water
provisioning in the country make it either difficult or expensive for those households with
even the flush toilets to use them; especially in the cities as it demands too much water. As
a consequence, most houses end up not providing this kind of improved facility. Therefore,

117
most households resort to the use of public toilets. With variables such as cooking space,
cooking fuel, types of bathroom etc., the majority of households were using low or poor
quality facilities in dwellings related to them. Further, compound housing is the
predominant housing type in the country. This multi-occupancy unit facilitates high rate of
sharing due to the large number of households. The WHO and UNICEF (2008) reports that
more than five households in Ghana share sanitation facilities irrespective of whether urban
or rural. This results in the inadequate facilities in the dwelling not being in good conditions
as they are burdened due to overcrowding. These issues can be attributed to the low
contribution of this indicator to housing quality in the country as many houses lack basic
facilities like toilets, bathrooms and kitchen etc.
In view of evidence in literature linking the availability of basic amenities in housing with
housing quality (Aderamo & Ayobolu, 2010; Fiadzo et al., 2001), one can infer from this
result that inadequate provision of housing facilities (e.g. toilet facilities, bathroom,
cooking spaces, safe drinking water) have influence on housing quality in Ghana. This
appears to be consistent with findings of prior studies (Aderamo & Ayobolu, 2010; Ibem,
2012). The quality of internal housing facilities and lack of access to them have been
established by these studies as accounting for poor housing quality.
From the global analysis, it was also found that the districts in which the regional capitals
were located performed poorly in terms of their aggregate housing quality weights,
especially those located in the southern sector of the country, with the exclusion of the
Volta region. Accra Metropolis, Kumasi Metropolis, New Juaben Municipal, Sunyani
Municipal, Cape Coast Metropolis and Sekondi-Takoradi Municipal all had the lowest
scores in their various regions. Ho Municipal was ranked second in the Volta region. The
118
lower ranks of these districts can be attributed to issues of urbanization and lack of
economic opportunities. As a consequence of urbanization and lack of economic
opportunities in rural areas, many people move to the cities, especially from the northern
sector of the country. Therefore, the population growth in these cities has surpassed their
capacity and ability to provide basic shelter leading to inadequate housing stock. Most of
the regions within which these districts are located showed positive net-migration,
according to the 2010 Population and Housing Census. Further, most of these cities are
known to be dealing with issues of overcrowding and infrastructure problems. These issues
impact the availability and affordability of housing, forcing many to live in substandard
dwellings with poor housing quality in these cities. As a result, it was found that these cities
performed poorly on many of the indicators used in assessing housing quality, due to high
population and dwelling unit densities and poor housing conditions. For example,
regarding the indicators of overcrowding (measured by household density), housing
ownership (measured by tenure) and amount of open space (measured by housing density),
these districts performed poorly on these indicators. Only Sunyani Municipal performed
well on the housing density indicator and Sekondi-Takoradi Metropolis on ownership.
These reflect the fact that housing in urban Ghana in general is reasonably well built, but
it is highly rented and overcrowded.
With the other regions, Tamale ranked fourth in the Northern region, Bolgatanga municipal
and Wa Municipal ranked sixth and fourth for the Upper East and Upper West regions,
respectively. It was observed that these districts together with Ho Municipal of the Volta
region, performed well on the indicators of household density, housing density and
ownership. The higher scores on the indicator of house ownership is attributed to the high

119
rate of ownership in these regions. For example, the Upper East, Upper West and Northern
regions have over 80 percent of all dwellings being owner-occupied (GSS, 2012). This
high ownership rate can be attributed to the construction material used. The predominant
outer material for these regions is mud/mud brick or earth, which are easy to acquire and
relatively inexpensive. This enables households to construct their own dwellings from the
cheapest and most easily obtained materials.
From the results of the top contributing factors in the global analysis, based on the higher
contribution of the overcrowding (average household per house) factor, it can be suggested
that dwellings in the country are generally not overcrowded with relation to the number of
households within a dwelling. This could be explained by the fact that, at even the national
level, the average figure is not high (1.6). In addition, based on the calculations and
classifications used to measure housing density, it can be argued that, in general, the
neighbourhood environment of dwellings in Ghana is not crowded, with the exception of
the Greater Accra region, which happens to be the only region with the highest densities
and the urban areas in Ashanti, Central, Eastern, and Western regions. Further, it can be
stated that, in general, the dwelling types in the country are of the moderate quality as the
majority of the districts have the major dwelling type being compound houses. From the
analysis, it was found that the most distinguishing factor is housing services; measured by
facilities and infrastructures available in dwellings. At the district levels, it was found that
most of the districts had similar scores on the other factors, but it varied when it came to
housing services.

120
5.3.2 Analysis by Cluster
With respect to the clusters, as can be seen from the original model (normalized with
respect to the cluster section) (see Appendix II), for the Ashanti, Brong Ahafo, Central,
Eastern, Northern, Upper East, Volta and Western regions, environmental sanitation was
contributing less to housing quality, compared to housing density used as the measure for
the amount of open space of the environmental cluster. The gap between the weights of
these two indicators are much of a difference, showing how poor environmental sanitation
is contributing to the quality of dwellings in Ghana. This difference is consistent for all the
above mentioned regions. However, it was observed that the weights obtained in the case
of the Ashanti, Western, Eastern and Central regions are a little higher than those obtained
by the Upper East, Upper West, Volta, Northern and the Brong Ahafo regions, showing
that environmental sanitation in the latter set of regions is of the poorest nature. However,
for the Greater Accra region, the situation changes, with environmental sanitation
contributing more compared to the amount of open space. The highest weight on the
environmental sanitation indicator is as a result of the high collection rate of rubbish in this
region; especially, the routine house-to-house collection. At the national level, the region
has the highest rate with 48.5% of dwelling units having their solid waste collected from
their homes (GSS, 2012). Sanitation is known to be quite poor in Ghana’s cities. The UN-
Habitat (2011) report on Ghana’s housing profile states that only 16% of households in
Ghanaian cities have their garbage (solid waste) collected; however, it is 41% in the Greater
Accra Metropolitan Area (GAMA) which is within this region.
For the physical cluster, Ashanti, Brong Ahafo, Central, Eastern, Northern, Volta and
Western regions all had dwelling type contributing more, followed by structural quality

121
and housing services. Although dwelling type and structural quality are contributing more
to the quality of houses than housing services for these regions, it was found that the
difference between the weights for Eastern region were approximately equal to 0.47 for
dwelling type and 0.42 for structural quality. Indicating that most of the dwellings in the
region have high quality and durable materials such as cement and concrete as their outer
wall material. For the Volta, Western, Northern and Brong Ahafo regions, the opposite
were found whereby the gap between these two indicators was large. For the Volta region,
the gap was approximately equal to 0.66 for dwelling type and 0.25 for structural quality,
0.62 and 0.20 for the Northern, 0.66 and 0.25 for Western, with Brong Ahafo having 0.52
and 0.35. These weights reflect the fact that most of the outer materials for dwellings in
these regions are of the less quality and durable nature, such as mud/mud brick or earth.
For the Upper East and Upper West regions, structural quality and housing service swaps
with structural quality contributing less, followed by housing services, and dwelling type
contributing more. Similar to the environmental cluster, the contribution of the indicators
for the Greater Accra region changes, with structural quality contributing more, followed
by dwelling type and housing services. The higher weights of structural quality show that
the region has most of its dwellings being built from the high durability and quality material
of cement or concrete. The national analytical report of the 2010 Population and Housing
Census of Ghana show that about eight in ten dwellings in the region (82.2%) had outer
walls built of cement. Consequently, the high contribution of this indicator to the quality
of dwellings in the region.

122
For the economic/social cluster, overcrowding is contributing more than ownership for all
the regions. However, it was observed that the weight difference is not that much, which
indicates that both factors are contributing much to the quality of houses in the study area.
From the cluster analysis, it was found that dwelling type had the biggest impact on housing
quality as the main factor contributing more to the quality of housing in the study area for
the physical cluster. Regarding the economic/social cluster, both household density and
ownership are contributing much to housing quality in the study area. Although the weights
for the household density indicator was slightly higher than that of ownership among all
the regions. While amount of open space in the neighbourhood of the environmental cluster
is the factor contributing more to the environmental quality of housing in the study area.
5.4 Sensitivity Analysis
In this research, the sensitivity analysis considers the effect of changes in the cluster
weights upon the overall housing quality index. In the initial model (model 1) (see
Appendix II), a neutral focused perspective was adopted whereby all criteria had equal
weights. In order to identify the effects of the various housing quality factors, a ‘‘what-if’’
analysis was carried out. This type of analysis is concerned with a ‘‘what-if’’ kind of
question to see how the ultimate answer varies when the inputs, whether judgments or
priorities, are revised. The aim of the analysis is to see how these changes affect the final
orderings of alternatives. Scenario analysis was carried out and three different housing
quality maps are generated by changing the weight assigned to the three clusters in which
the evaluation problem was divided: economic/social, environmental and physical factors.

123
The following three sets of weights (Table 5.1) were considered to simulate the presence
of different perspectives on the evaluation process.
Scenario I (economic/social focused perspective): the ‘economic/social’ cluster
dominates the others. This case shows the situation where economic/social factors
weigh 50 % and environmental factors weigh 30% and physical factors, the
remaining 20 % in achieving the objective;
Scenario II (physical focused perspective): the ‘physical’ cluster dominates the
others. With this simulation, the physical factors weigh 50%; and
Scenario III (environmental focused perspective): the ‘environmental’ cluster
dominates the others by weighing 50%, physical 30% and economic/social 20%.
Table 5.1: Combination of Weights for the Sensitivity Analysis
Table 5.1 summarizes the combination of weights associated with each scenario. Models
2 to 4 (see Appendix II) show the results of the ‘‘what-if’’ analysis. The scenario analysis
reveals some interesting findings. When the weights of the physical cluster were increased
(model 3), dwelling type received the highest weight in all the regions at the global level
except the Greater Accra region. In Ghana, the largest dwelling type is the compound
housing, which is a multi-occupancy structure. Even though not of the highest quality like
single-family houses and apartments due to high sharing rates and lack of privacy issues,
Cluster Weights
Scenarios Physical Economic/ Environmental
Social
I 0.20 0.50 0.30
II 0.50 0.30 0.20
III 0.30 0.20 0.50

124
it is still of a moderate quality compared to the other forms of makeshift facilities and huts.
The higher dominance of this dwelling structure can be attributed to the higher weight of
this indicator when housing is assessed from the physical perspective. It was also found
that five out of the ten regions performed well on the indicator of structural quality. Eastern,
Ashanti, Brong Ahafo and Central regions all had structural quality receiving the second
highest weight with the Greater Accra region having the indicator ranking first. Whereas,
Western, Northern, Volta, Upper East, and Upper West regions all performed poorly on
the indicator of structural quality. The same regions had this indicator ranking among the
least three in all the other models. This shows how structural quality is poorly contributing
to housing quality in these regions.
Further, assessing housing quality from the economic/social focused perspective (model
2), the overcrowding factor which ranked third in most of the regions in model 1, ranked
first in seven of the regions (Eastern, Ashanti, Brong Ahafo, Greater Accra, Northern,
Upper East, and Upper West). This gives the indication that, at the national level the
dwellings in Ghana are generally not crowded based on the average household size per
house. In addition, it can also be argued that, economic/social aspects of housing is
contributing much to the quality of dwellings in the study area as both the indicators used
to operationalize this cluster ranked among the highest three indicators in nine regions
when housing is assessed from the economic/social perspective, with overcrowding also
ranking among the top three in all the regions from the physical perspective.
With model 4 (the environmental perspective), as in the neutral perspective (model 1),
amount of open space received the highest weight in nine of the regions. Environmental
sanitation was still ranked among the least three with a rank of 6th in eight of the regions

125
and 7th in the Upper West region not including the Greater Accra and Western regions. The
least ranks of this indicator even when the environmental cluster is prioritized shows how
serious the issue of environmental sanitation is in the country.
Regarding the cluster level, when the weights of the various clusters were increased, no
changes were recorded in the rankings of the indicators in the physical and environmental
clusters for the regions in all the three models. The rankings were the same as reported for
model 1. However, there were changes in the economic/social cluster. As in model 1,
Ashanti, Brong Ahafo, Eastern, Greater Accra, Northern, Upper East, Upper West, and
Volta regions still had overcrowding contributing much to the quality of houses compared
to ownership in all the three models. However, there were noticeable changes for the
Western and Central regions. In the case of the former, ownership was ranked first when
housing quality was assessed from both the environmental and economic/social perspective
(model 4 and model 2, respectively). In the case of the latter, ownership ranked first in
economic/social perspective (model 2) and second in the rest.
As indicated above, the aim of the analysis is to see how changes in clusters modify the
final evaluation scores of alternatives. The various perspectives resulted in some changes
in the rankings for some alternatives which can be seen in the models under their various
rankings. Only substantial changes will be discussed here. For the Brong Ahafo region,
Sunyani Municipal performed well when environmental cluster weights are increased by
moving from rank 22nd in model 1 to 13th in model 4. This change in ranking can be
attributed to the fact that Sunyani the regional capital is located within this district, hence
it enjoys better sanitation compared to the other districts. This is reflected in the highest
score recorded by the district when it came to the variable mode of solid waste disposal.

126
The Sunyani Municipality reported the highest frequency of collection of solid wastes from
households and dumping of wastes in public containers. Berekum also moved from 21st in
model 1 to 15th and 16th in models 2 and 3, respectively. Kintampo South, Asunafo, and
Atebubu districts all dropped a rank in model 3 from their rank in model 1, and further
dropped two ranks in model 4. Kintampo South dropped from 20th in model 1 to 21st in
model 3 and 22nd in model 4.
In the Ashanti region, Atwima Nwabiagya district moved from 24th in model 1 to 21st in
model 3 and to 22nd in model 4. An interesting case was Mampong Municipal. It ranked
11th according to the results of models 1 and 3, moved to 10th in model 4, but dropped to
17th in model 2 when the importance of economic/social cluster was increased. This drop
in rank can be attributed to the higher performance on this cluster by districts in the region.
Within the Central region, Effutu Municipal performed well when the environmental
cluster weight was increased by moving from 16th in all the previous models to 11th in
model 4. This change is not unexpected; the district is one of the two most urbanised
districts in the region. Together with Cape Coast Metropolis, they are the highest
performing districts when it comes to issues of environmental sanitation in the region.
The Western region had Wassa Amenfi East moving from 11th in model 1 to the 7th position
in model 2 and 9th in models three and four. Whiles Sefwi Akontobra and Aowin drop
rank in model 2. The former fell to 8th in model 2 from 7th in model 1, with the latter
dropping to 9th from 8th in model 1.
For the Eastern region, Kwahu West, Akyemansa, Lower Manya, and Suhum-Kraboa
Coaltar all recorded some changes in their various rankings. Kwahu West moved from the

127
19th in model 1 to 16th in models 3 and 4. Lower Manya moved from the 20th in model 1
to 17th in models 3 and 4. Akyemansa and Suhum-Kraboa Coaltar districts also dropped
their respective ranks. Akyemansa from 16th in model 1 to 18th in models 3 and 4, whiles
Suhum-Kraboa Coaltar drops to 20th in models 3 and 4 from 18th in model 1.
Regarding the Greater Accra region, which seems to present interesting cases throughout
the analysis, Weija (Ga South) Municipal moved from 5th in model 1 to 3rd in model 3. Ga
East Municipal also moved from 6th in model 1 to 4th in model 3. Dangbe East also dropped
from 4th in model 1 to 6th in model 3. It was realized that the major changes in the ranks of
the alternatives in the district happened when housing quality was assessed with an increase
importance of the physical cluster. The Ga East district received the second highest score
on the housing services indicator (Tema ranked first). For example, concerning the type of
toilet used by households, the district had the second share of flush toilet, aside Tema. In
addition, the district also has the second highest share of exclusive bathroom for
households and the highest percent of households who use gas as cooking fuel (53.9%).
Further, it is also among the four districts which doesn’t have compound housing
prevailing. Hence, these can be attributed to the move in rank of the district when the
physical cluster is weighted high as the district performed well on most of the indicators
used to operationalize this cluster. With Dangbe East, the drop can be attributed to the fact
that the district had the highest occupancy of hut buildings (either on the same or different
compound) in the region which are made of less durable wall materials. In addition, about
45% of households have no toilet facilities. All these factors could be suggested as the
reason for drop in rank as the physical criteria seem to be contributing poorly to the quality
of dwellings in the district. Regarding the Northern, Volta, Western, Upper East, and Upper

128
West regions, there were no changes in the ranks of the alternatives in all the three
simulations.
5.5 GIS Integration
In order to examine the spatial patterns of housing quality, the overall housing quality
weights from the ANP model were exported into GIS for visualization. Four housing
quality classes were defined using an equal classification ranging from low, moderate, high
and highest quality. The class thresholds were selected by subdividing the range of values
that occur in the area (among districts in a region) under analysis into equal intervals. The
classification was based on the normalized by cluster weights for the alternatives. The
shading pattern utilizes an increasing density of shading to reflect an increasing level of
housing quality. Figures 5.1 to 5.10 displays the housing quality maps obtained from each
simulation.

129
Figure 5.1: Spatial Variation of Housing Quality for the Ashanti Region.

130
Figure 5.2: Spatial Variation of Housing Quality for the Brong Ahafo Region.

131
Figure 5.3: Spatial Variation of Housing Quality for the Central Region.

132
Figure 5.4: Spatial Variation of Housing Quality for the Eastern Region.
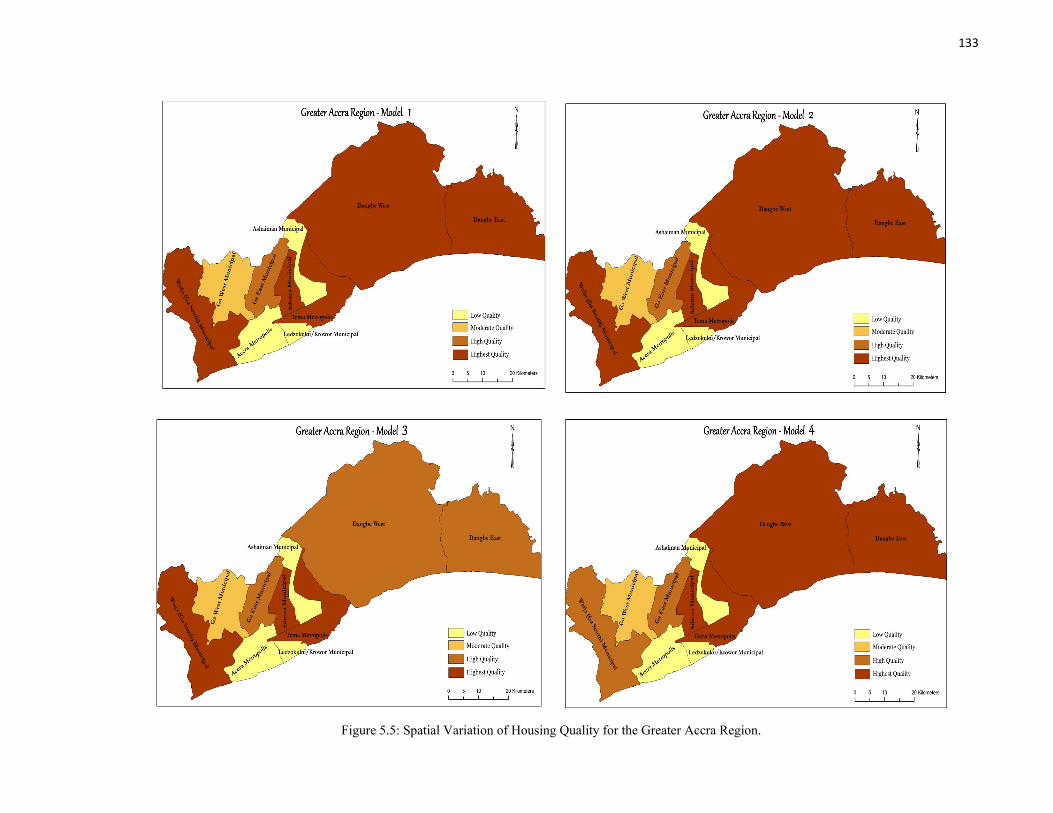
133
Figure 5.5: Spatial Variation of Housing Quality for the Greater Accra Region.

134
Figure 5.6: Spatial Variation of Housing Quality for the Northern Region.

135
Figure 5.7: Spatial Variation of Housing Quality for the Upper East Region.

136
Figure 5.8: Spatial Variation of Housing Quality for the Upper West Region.

137
Figure 5.9: Spatial Variation of Housing Quality for the Volta Region.

138
Figure 5.10: Spatial Variation of Housing Quality for the Western Region.

139
The visual examination of these maps indicates that the spatial patterning of residential
quality in the study area is influenced by the factors or criteria that are prioritized in the
assessment. It can be observed that when the physical criteria is prioritized by weighting
it higher than the rest, eight out of the ten regions experienced changes in their spatial
patterning of housing quality apart from the Volta and Upper East regions. In model 2
when the economic/social cluster is prioritized changes to five regions (Ashanti, Brong
Ahafo, Eastern, Western, and Central) occurred. Similarly, the spatial patterning of housing
quality changed in the Ashanti, Brong Ahafo, Eastern, Greater Accra, and Western regions
when environmental factors were weighted higher than the other factors. These changes
in pattern suggest that the physical aspects of housing seem to have a major impact on the
quality of housing in the study area, compared to the economic/social and the
environmental factors. Prior research has shown that the physical aspects of housing are a
major determinant of housing quality. Studies such as (Aderamo & Ayobolu, 2010; Amao,
2012; Jiboye, 2011; Muoghalu, 1991) all identified or established a relationship between
variables and indicators related to the physical aspects of housing as influencing housing
quality. For instance, in an empirical study, Aderamo and Ayobolu (2010) identified factors
such as internal facilities, major materials for roofing and materials for external walls, the
type of toilet and bathroom facilities available, and the source of lighting in the house when
centrally provided electricity is not available as the most important factors that account for
housing quality in Ilorin, Nigeria. All these factors relate to the physical aspects of housing.
As identified in previous research, the physical aspects of housing in Ghana affect its
quality. The quality of housing in Ghana is influenced by the structural quality and the
availability and adequacy of housing services and infrastructure.

140
Although the criteria prioritized seems to have modifications in the spatial patterns of
housing quality in the study area, it was noticed that the Volta and Upper East regions had
no substantial changes in their spatial patterns generated by the three models. This
consistency shows how similar the districts in these regions are in relation to aspects of
housing.
5.6 Summary and Conclusions
This chapter presented the results of an integrated GIS-ANP framework to evaluate
housing quality at the district level in Ghana. It examined the factors that contribute to the
quality of housing in the study area and the underlying reasons for the differential
contribution to housing quality. This was followed by a scenario analysis whereby housing
quality was assessed from three different perspectives by prioritizing the different criteria
clusters to see how they impact the overall quality of houses in Ghana. It can be argued
that the lower contributing factors to the quality of houses in Ghana are environmental
sanitation, measured in this study by modes of solid and liquid waste disposal, housing
services and structural quality of the dwellings. However, the three top contributing factors
are housing density used as an indicator for amount of open space, types of dwellings and
household density used as a measure of overcrowding. The classifications of these factors
according to their importance is based on the fact that they are found in the ranks in most
of the regions in the various models. Based on the findings from this study, it is argued
that the physical aspects of dwellings impact negatively on housing quality followed by
environmental sanitation. Two out of the three indicators (structural quality and housing
services) used to operationalize the physical cluster ranked among the least three factors in

141
most of the regions for the models regardless of the cluster that was prioritized. It was
further revealed that the facilities that are available in a dwelling determines greatly the
housing quality of dwellings. Therefore, the dwelling facilities factor can be recognized as
the major determinant of housing quality in Ghana. This factor is inherent in the
unavailability of housing facilities.
From the scenario analysis, it can be deduced that the contribution of the various factors
used in evaluating the quality of dwellings was subject to the perspective that is being
prioritized in the evaluation process, although housing services have been consistent as
poor contributor irrespectively of the perspective. Based on the findings of this study, it
can therefore be argued that there is substantial spatial variability of housing quality
between the districts and regions of Ghana.

142
CHAPTER 6
SUMMARY AND CONCLUSIONS
6.1 Introduction
This chapter begins with an overview of this study and the main findings of the research.
It highlights the advantages of adopting an ANP-based framework to assess housing quality
as well as the limitations of the method. Finally, the chapter gives some directions and
suggestions for future research and recommendations.
6.2 Overview of Study and Strengths of the ANP-based Framework
This study proposed an ANP-based framework for assessing housing quality and
integrating the framework into a GIS environment. The framework was demonstrated using
an assessment of housing quality at the district level in Ghana. Housing quality was
evaluated based on three groups of criteria: physical, socio-economic and environmental.
The 2010 Ghana Population and Housing census data on tenancy arrangement, housing
characteristics and amenities were used.
Using the framework to assess housing quality allowed for the interdependences between
elements of the evaluation problem to be accounted for. It also provides the possibility of
assessing effective relationships of each criterion on each other and on the final goal
through the form of a network. Also, the GIS-ANP framework was able to prove the
‘where’, in addition to ‘what’ and how ‘much’. That is, where the dwellings with high or
low housing quality in the country at the districts are, what factors are contributing to
quality of dwellings and how much they are contributing, whether low or high? Based on

143
the weighing scheme of the ANP method, the contributions of the various factors to the
overall housing quality of districts and the relative importance of all the elements that play
an influence can be identified. Further, because there does not exist a generally accepted
technique for deriving a single index for housing quality, it becomes difficult to evaluate
the individual attributes of the dwelling units due to the difficulty of establishing a
weighting scheme for combining the attribute measures into a single index. However, with
the adoption of the ANP-based framework, this issue was overcome due to the pairwise
comparison scale inherent in the ANP method that allowed weighting of the various
attributes of the housings on a common scale. In addition, the ANP procedure can be
executed using a computational software (Super Decisions), and the results indicated that
this software makes the computations easier and reduces the possibility of computational
errors.
Due to the intrinsic spatial nature of the housing quality evaluation problem, the ANP-
based framework was coupled with GIS. While the results from the ANP method allows
for ranking the districts as well as identifying which factors are contributing more or less
to housing quality, mapping the results provides a tool for examining spatial patterns of
housing quality. ArcGIS was used to visualize the results of ANP. The GIS capabilities
help in identifying the districts which have the lowest housing quality scores and which
districts need urgent attention. This allows for area-based housing interventions to be
directed towards specific district or region. The results from the study show that GIS can
be effectively integrated with the ANP method and was successfully applied in evaluating
housing quality at the districts in Ghana.

144
6.3 Limitations of the ANP-based Framework for Housing Quality
Evaluation
There are some limitations of the ANP method. The main drawback, especially in the
practical application of ANP, is the large number of comparisons that need to be done. The
greater number of comparisons is exacerbated by the number of evaluation criteria. This
leads to complexity in the weighting procedure, which makes it difficult for the decision
maker to comprehend the decision outcomes if they are not familiar with the method.
Further, in cases where there are several alternatives in the decision model as in this study,
the pairwise comparisons become quite demanding. The computational software for the
ANP method enabled the performance of the pairwise comparisons and hence made the
procedure less chaotic, but it was found that the software can only solve problems involving
30 or less decision alternatives.
There is the potential presence of uncertainties in any multicriteria decision/evaluation
problem. These uncertainties arise in two ways: (1) incomplete or incorrect information
about the decision problem, and (2) uncertainties might result from the inherent
assumptions of the method (Malczewski, 1999; Voogd, 1983). In this present application,
given to a certain extent the deterministic nature of the decision problem; i.e., the number
of alternatives is known and fixed, and the criteria are objective indicators measured on a
quantitative scale, the amount of uncertainty in this study is limited to the specification of
weights and measurement errors present in the data. Sensitivity analysis, which is a method
for dealing with uncertainties was employed to test the robustness of the evaluation. This
process was used to test whether changes in cluster weights modify the rankings of the
alternatives. Although there were changes in the rankings for some regions, the position of

145
the different alternatives in the rankings did not change much. As a conclusion of this
analysis, we can state that the results obtained are sufficiently stable.
6.4 Implications and Recommendations
The results from this study provide an aggregate picture of housing quality at the districts
in Ghana. The implications of the findings of this study are of significance to housing
policy and residential development in Ghana. One significant feature regarding the
outcome of this study among several others is that, housing quality factors are contributing
differently to housing quality among the districts and regions in the country, especially
based on the emphasized perspective in the evaluation. This finding indicates that different
districts and regions have a distinct set of housing quality determinants which are peculiar
to them. Therefore, knowledge of relevant factors that affect residential and neighbourhood
quality of districts can serve as a useful guide to housing developers and agencies in their
decisions on housing and neighbourhood improvement in the country especially at the
districts. By considering the outcome of this study which essentially provides relevant
information about the factors that are contributing to the housing quality of each district as
well as districts that are performing poorly on housing quality, it is possible to direct
interventions to tackle the specific areas of deficiency in terms of housing for these
districts. Further, the findings of housing services and environmental sanitation
contributing poorly to housing quality in the country confirms the poor or deplorable
conditions of housing facilities in the country as well as issues related to solid waste

146
management. The need thus arises for efforts towards the incorporation of housing quality
standards in the planning and design of aspects of housing development in Ghana.
Lack of access to housing services, structural sustainability of building materials and
environmental sanitation accounts for poor quality of housing in the study area. Housing
services in the country are either inadequate or mostly of the poorest quality in many of the
cases in which they exist due to high sharing rate that results in poor conditions of the
facilities. Most of the houses are characterized by poor access to water, poor or non-existent
drainage and poor sanitation, inadequate cooking, bathing and toilet facilities. Housing
improvement depends on the successful implementation of a series of measures that
include: enforcements of standards related to the provision of basic housing infrastructures
such as toilet facilities, and cooking spaces by the relevant agencies and departments such
as the Ministry of Works and Housing. By requiring all landlords to provide these basic
facilities. Although bye-laws have been passed requesting landlords to provide toilet
facilities in houses, such laws are not enforced, resulting in a major proportion of
households resorting to public toilets due to lack of this facility in their housing. Efforts
should also be directed towards upgrading the existing housing facilities which are of low
quality. Since these are of critical importance to the quality of dwellings in the country.
Further, the finding of this study also underscores the need for the improvement of the
overall housing environment through effective waste management strategies and the
provision of basic infrastructures. Environmental sanitation is poorly contributing to the
quality of houses in the study area. The provision of facilities required for achieving good
disposal systems are measures that favour good environmental quality. Therefore,

147
investment should be made in solid waste disposal and drainage modes in the country as
the physical environment of the dwellings impact the quality of housing, which further
influences the health of households. The outcome of such interventions and efforts towards
ensuring quality of residential environments would be beneficial to the people and society
at large.
6.5 Research Contribution and Recommendations for Future work
This section concludes the study by presenting contribution of this study and future
research. The main purpose of this study was to evaluate housing quality using the ANP
method. The major contribution of this study is with regards to the advancement of the
application areas of the ANP method. The study developed an ANP-based framework for
evaluating housing quality and integrated it into GIS. The implementation of the spatial
ANP technique to housing quality evaluation gives an originality value to the present
research because it represents the first attempt to apply spatial ANP for housing quality
evaluation. The study has established the applicability of the suggested framework in
evaluating housing quality. This framework is adaptive as it uses housing datasets derived
from national database i.e. national census to assist with housing policy making and
intervention. Further, this research being the first to attempt an evaluation of housing
quality at the district level in Ghana provides insight into the spatial patterns of housing
quality at the districts in Ghana. As well as the housing quality indicators that impact the
quality of housing in the various districts. As a result, accounting for the imbalances in
housing quality among the districts. Altogether, these issues are of importance to housing
intervention and development in Ghana.

148
Despite the successful implementation of the proposed framework for assessing housing
quality in Ghana, there are still a number of opportunities for expanding the study and for
validating the results. Future works should endeavour to incorporate expert opinion into
the weighting and assessment phase of the decision problem to see how their opinions
impact on the results of this study. In this study, the GIS integration with ANP is limited
to data visualization. Future studies should implement the full integration to provide the
analytical capabilities of GIS-ANP for examining spatial patterns.

149
REFERENCES
Aderamo, A., & Ayobolu, D. (2010). Spatial structure of housing quality in Ilorin,
Nigeria. Research Journal of Social Sciences, 1(5), 12-21.
Agarwal, E., Agarwal, R., Garg, R. D., & Garg, P. K. (2013). Delineation of groundwater
potential zone: An AHP/ANP approach. Journal of Earth System Science, 122 (3),
887–898.
Aliu, I. R., & Adebayo, A. (2010). Evaluating the influence of housing quality on Urban
Residents' wellbeing: The Case of Lagos Nigeria. International Journal of
Academic Research, 2(6), 400-409.
Amao, F. L. (2012). Housing quality in informal settlements and Urban upgrading in
Ibadan, Nigeria. Developing Country Studies, 2(10), 68-80.
Aminu, M., Matori, A. N., Yusof, K, W., & Zainol, R. B. (2013). A framework for
sustainable tourism planning in Johor Ramsar sites, Malaysia: A Geographic
Information System (GIS) based Analytic Network Process (ANP) approach.
Research Journal of Applied Sciences, Engineering and Technology, 6(3), 417-422.
Amole, D. (2008). Exploring the relationship between typology and quality in the context
of students’ residential facilities. Global Built Environment Review, 6(3), 34-53.
Ansah, J. (2013, July 8). Government provides incentives for real estate developers.
Graphic Online. Retrieved from http://graphic.com.gh/General-News/govt-
provides-incentives-for-real-estate-developers.html
Aragonés-Beltrán, P., Pastor-Ferrando, J. P., García-García, F., & Pascual-Agulló, A.
(2010). An Analytic Network Process approach for siting a municipal solid waste
plant in the metropolitan area of Valencia (Spain). Journal of Environmental
Management, 91 (5), 1071-1086.
Arias, E., & De Vos, S. (1996). Using housing items to indicate socioeconomic status:
Latin America. Social Indicators Research, 38(1), 53-80.
Aribigbola, A. (2008). Housing policy formulation in developing countries: Evidences of
programme implementation from Akure, Ondo State Nigeria. Journal of Human
Ecology, 23 (2), 125-134.
Azis, I. J. (2003, November). Analytic Network Process with feedback influence: A new
approach to impact study. In Prepared for a seminar organized by the Department
of Urban and Regional Planning, University of Illinois at Urbana-Champaign, in
conjunction with the Investiture Ceremony for Professor John Kim.
Babalola, A., & Busu, I. (2011). Selection of landfill sites for solid waste treatment in
Damaturu Town-using GIS techniques. Journal of Environmental Protection, 2,
1-10.

150
Banai, R. (2010). Evaluation of Landuse-Transportation Systems with the Analytic
Network Process. Journal of Transport and Land Use, 3(1), 85-112.
Banar, M., Kose, B. M., Ozkan, A., & Acar, I. P. (2007). Choosing a municipal landfill site
by Analytic Network Process. Environmental Geology, 52(4), 747-751.
Bayazit, O. (2006). Use of Analytic Network Process in vendor selection
decisions. Benchmarking: An International Journal, 13(5), 566-579.
Beamish, J. O. (1994). A casual model of barriers and incentives to affordable housing in
southern rural communities: Housing quality. Housing and Society, 21(1), 25-36.
Begičević, N., Divjak, B., & Hunjak, T. (2010). Decision-making on prioritization of
projects in higher education institutions using the Analytic Network Process
approach. Central European Journal of Operations Research, 18(3), 341-364.
Belton, V., & Gear, T. (1983). On a short-coming of Saaty's method of Analytic
Hierarchies. Omega, 11(3), 228-230.
Boadi, K. O., & Kuitunen, M. (2005). Childhood diarrheal morbidity in the Accra
Metropolitan Area, Ghana: Socio-economic, environmental and behavioral risk
determinants. Journal of Health & Population in Developing Countries, 7, 1-13.
Bogdanović, I., & Mitković, P. (2005). Revitalization of residential complexes in the
context of housing quality improvement. Facta universitatis-series: Architecture
and Civil Engineering, 3(2), 219-233.
Bottero, M., & Lami, I. M. (2010). Analytic Network Process and sustainable mobility: An
application for the assessment of different scenarios. Journal of Urbanism, 3(3),
275-293.
Bradley, R. H., & Putnick, D. L. (2012). Housing quality and access to material and
learning resources within the home environment in developing countries. Child
Development, 83(1), 76-91.
Buckenberger, C. (2012). Meanings of housing qualities in suburbia: Empirical evidence
from Auckland, New Zealand. Journal of Housing and the Built
Environment, 27(1), 69-88.
Can, A. (1992). Residential quality assessment: Alternative Approaches Using GIS. The
Annals of Regional Science, 26(1), 97-110.
Carver, S. J. (1991). Integrating Multi-criteria evaluation with Geographical Information
Systems. International Journal of Geographical Information Systems, 5(3): 321-
339.
Chen, Z., Li, H., & Wong, C. T. (2005). EnvironalPlanning: Analytic Network Process
model for environmentally conscious construction planning. Journal of
Construction Engineering and Management, 131(1), 92-101.
151
Cheng, E. W., & Li, H. (2005). Analytic Network Process applied to project
selection. Journal of Construction Engineering and Management, 131(4), 459-466.
Cheng, E. W., Li, H., & Yu, L. (2005). The Analytic Network Process (ANP) approach to
location selection: A shopping mall illustration. Construction Innovation:
Information, Process, Management, 5(2), 83-97.
Coker, A. O., Awokola, O. S., Olomolaiye, P., & Booth, C. (2008). Challenges of urban
housing quality and its associations with neighbourhood environments: Insights
and experiences of Ibadan City, Nigeria. Journal of Environmental Health
Research, 7(1), 21-30.
Cook, C. C., & Bruin, M. J. (1994). Determinants of housing quality: A comparison of
white, African-American, and Hispanic single-parent women. Journal of Family
and Economic Issues, 15(4), 329-347.
Das, D. (2008). Urban quality of life: A case study of Guwahati. Social Indicators
Research, 88(2), 297-310.
Dyer, J.S. (1990). Remarks on the Analytic Hierarchy Process. Management Science, 36,
249–258.
Erdoğmuş, Ş., Aras, H., & Koç, E. (2006). Evaluation of alternative fuels for residential
heating in Turkey using Analytic Network Process (ANP) with group decision-
making. Renewable and Sustainable Energy Reviews, 10(3), 269-279.
Ferretti, V. (2011). A multicriteria spatial decision support system development for siting
a landfill in the province of Torino (Italy). Journal of Multi‐Criteria Decision
Analysis, 18(5-6), 231-252.
Ferretti, V., & Pomarico, S. (2012). Integrated sustainability assessments: A spatial
multicriteria evaluation for siting a waste incinerator plant in the Province of Torino
(Italy). Environment, Development and Sustainability, 14(5), 843-867.
Ferretti, V., & Pomarico, S. (2013a). Ecological land suitability analysis through spatial
indicators: An application of the Analytic Network Process technique and Ordered
Weighted Average approach. Ecological Indicators, 34, 507-519.
Ferretti, V., & Pomarico, S. (2013b). An integrated approach for studying the land
suitability for ecological corridors through spatial multicriteria evaluations.
Environment, Development and Sustainability, 15(3), 859-885.
Fiadzo, E. D., Houston, J. E., & Godwin, D. D. (2001). Estimating housing quality for
poverty and development policy analysis: CWIQ in Ghana. Social Indicators
Research, 53(2), 137-162.

152
Francescato, G., Weidemann, S., Anderson, J. R., & Chenoweth, R. (1979). Residents'
satisfaction in HUD-assisted housing: Design and management factors. Prepared
for the Office of Policy Development and Research, US Department of Housing and
Urban Development.
Ghana Statistical Service. (2008). Ghana Living Standards Survey: Report of the Fifth
Round (GLSS 5). Accra, Ghana: Ghana Statistical Service. Retrieved from
http://www.statsghana.gov.gh/docfiles/glss5_report.pdf
Ghana Statistical Service. (2012). 2010 Population and Housing Census: Summary Report
of Final Results. Accra, Ghana: Ghana Statistical Service. Retrieved from
http://www.statsghana.gov.gh/docfiles/2010phc/Census2010_Summary_report_of
_final_results.pdf
Ghana Statistical Service. (2013). 2010 Population and Housing Census: National
Analytical Report. Accra, Ghana: Ghana Statistical Service. Retrieved from
http://www.statsghana.gov.gh/docfiles/publications/2010_PHC_National_Analyti
cal_Report.pdf
Ghana Statistical Service. (2013). 2010 Population and Housing Census: Regional
Analytical Report, Ashanti Region. Accra, Ghana: Ghana Statistical Service.
Retrieved from
http://www.statsghana.gov.gh/docfiles/2010phc/2010_PHC_Regional_Analytical
_Reports_Ashanti_Region.pdf
Ghana Statistical Service. (2013). 2010 Population and Housing Census: Regional
Analytical Report, Brong Ahafo Region. Accra, Ghana: Ghana Statistical Service.
Retrieved from
http://www.statsghana.gov.gh/docfiles/2010phc/2010_PHC_Regional_Analytical
_Reports_Brong_Ahafo_Region%20.pdf
Goodman Jr, J. L. (1978). Causes and indicators of housing quality. Social Indicators
Research, 5(1-4), 195-210.
Greene, R., Devillers, R., Luther, J. E., & Eddy, B. G. (2011). GIS‐Based multiple criteria
decision analysis. Geography Compass, 5(6), 412-432.
Hallikainen, P., Kivijärvi, H., & Tuominen, M. (2009). Supporting the module sequencing
decision in the ERP implementation process: An application of the ANP
method. International Journal of Production Economics, 119(2), 259-270
Holder, R. D. (1990). Some comments on the Analytic Hierarchy Process. Journal of the
Operational Research Society, 41, 1073–1076.
Hwang, C. L., and Yoon, K. L. (1981). Multiple attribute decision making: Methods and
applications. New York: Springer-Verlag.

153
IARC Working Group on the Evaluation of Carcinogenic Risks to Humans, & International
Agency for Research on Cancer. (2010). Household use of solid fuels and high-
temperature frying. IARC Monographs on the Evaluation of Carcinogenic Risks to
Humans (Vol. 95). Lyon, France: International Agency for Research on Cancer.
Retrieved from http://monographs.iarc.fr/ENG/Monographs/vol95/mono95.pdf
World Health Organization and United Nations Children’s Fund Joint Monitoring
Programme for Water Supply and Sanitation. (2008). Progress on drinking water
and sanitation: Special focus on sanitation. New York: UNICEF, and Geneva:
WHO. Retrieved from
http://www.who.int/water_sanitation_health/monitoring/jmp2008.pdf
Ibem, E. O. (2012). Residents' perception of the quality of public housing in urban areas in
Ogun State, Nigeria. International Journal of Quality & Reliability
Management, 29(9), 1000-1018.
Isalou, A. A., Zamani, V., Shahmoradi, B., & Alizadeh, H. (2013). Landfill site selection
using integrated Fuzzy logic and Analytic Network Process (F-ANP).
Environmental Earth Sciences, 68(6), 1745-1755.
Jankowski, P. (1995). Integrating Geographical Information Systems and Multiple Criteria
Decision Making methods. International Journal of Geographical Information
Systems, 9 (3), 251-273.
Jenkins, M. W., & Scott, B. (2007). Behavioral indicators of household decision-making
and demand for sanitation and potential gains from social marketing in
Ghana. Social science & medicine, 64(12), 2427-2442.
Jiboye, A. D. (2011). Use of Neighborhoods’ quality evaluation to determine the
performance of residential development in Southwestern Nigeria. Elixir His. Pres.,
34, 2565-2574.
Jiboye, D. (2010a). The correlates of public housing satisfaction in Lagos, Nigeria. Journal
of Geography and Regional Planning, 3(2), 017-028.
Jiboye, D. A. (2010b). Evaluating the pattern of residential quality in Nigeria: The case of
Osogbo Township. Facta Universitatis-Series: Architecture and Civil
Engineering, 8(3), 307-316.
Karsak, E. E., Sozer, S., & Alptekin, S. E. (2003). Product planning in quality function
deployment using a combined Analytic Network Process and goal programming
approach. Computers & industrial engineering, 44(1), 171-190.
Khan, S., & Faisal, M. N. (2008). An Analytic Network Process model for municipal solid
waste disposal options. Waste management, 28(9), 1500-1508.

154
Khumpaisal, S., & Chen, Z. (2007). Risks assessment in real estate development: An
application of Analytic Network Process. School of Built Environment, Liverpool
John Moores University, Liverpool, United Kingdom.
Kurian, S. M., & Thampuran, A. (2011). Assessment of Housing Quality. Institute of Town
Planners, India Journal, 8 (2), 74 – 85.
Kutty, N. K. (1999). Determinants of structural adequacy of dwellings. Journal of Housing
Research, 10 (1), 27-43.
Lawrence, R. J. (1995). Housing quality: An Agenda for research. Urban Studies, 32 (10),
1655–1664.
Lee, J. S., & Oh, D. H. (2012). Housing quality evaluation and housing choice using PIF:
A case of the Bundang New Town housing market in Korea .International Journal
of Urban Sciences, 16(1), 63-83.
Lee, M. C. (2010). The Analytic Hierarchy and the Network Process in multicriteria
decision making: Performance evaluation and selecting key performance indicators
based on ANP model. In M. Crisan (Ed.), Convergence and Hybrid Information
Technologies (pp. 125-149) Croatia: INTECH.
Leung, L. C., & Cao, D. (2001). On the efficacy of modelling multi-attribute decision
problems using AHP and Sinarchy. European Journal of Operational Research,
132, 39–49.
Malczewski, J. (1999). GIS and Multicriteria Decision Analysis. John Wiley & Sons.
Malczewski, J. (2006). Integrating Multicriteria Analysis and Geographic Information
Systems: The Ordered Weighted Averaging (OWA) approach. International
Journal of Environment Technology and Management, 6 (1/2), 7–19.
Meng, G., & Hall, G. B. (2006). Assessing housing quality in metropolitan Lima,
Peru. Journal of Housing and the Built Environment, 21(4), 413-439.
Mohit, M. A., Ibrahim, M., & Rashid, Y. R. (2010). Assessment of residential satisfaction
in newly designed public low-cost housing in Kuala Lumpur, Malaysia. Habitat
International, 34(1), 18-27.
Morris, E.W., Crull, S.R. & Winter, M. (1976). Housing norms, housing satisfaction and
the propensity to move. Journal of Marriage and the Family, 38 (2), 309-20.
Muoghalu, L. N. (1991). Measuring housing and environmental quality as indicator of
quality of urban life: A case of traditional city of Benin, Nigeria. Social Indicators
Research, 25(1), 63-98.

155
Natividade-Jesus, E., Coutinho-Rodrigues, J., & Antunes, C. H. (2007). A multicriteria
decision support system for housing evaluation. Decision Support Systems, 43(3),
779-790.
Neaupane, K. M., & Piantanakulchai, M. (2006). Analytic Network Process model for
landslide hazard zonation. Engineering Geology, 85(3), 281-294.
Nekhay, O. M., Arriaza, M., & Boerboom, L. (2007). Soil erosion risk evaluation based on
expert knowledge and GIS technology: A case study from the Spanish mountainous
olive plantations (Montoro, Andalusia Region). Soil 2007. Т. 8, № 1–2.
Nekhay, O., Arriaza, M., & Boerboom, L. (2009). Evaluation of soil erosion risk using
Analytic Network Process and GIS: A case study from Spanish mountain olive
plantations. Journal of Environmental Management, 90(10), 3091-3104.
Olotuah, O., & Olukayode, A. (2006). Housing Quality in Suburban Areas: An Empirical
Study of Oba-Ile, Nigeria. Dimensi Teknik Arsitektur, 34(2), 133-137.
Oswald, F., Wahl, H. W., Mollenkopf, H., & Schilling, O. (2003). Housing and life
satisfaction of older adults in two rural regions in Germany. Research on
Aging, 25(2), 122-143.
Partovi, F. Y. (2006). An analytic model for locating facilities strategically. Omega, 34(1),
41-55.
Percin, S. (2008). Using the ANP approach in selecting and benchmarking ERP
systems. Benchmarking: An International Journal, 15(5), 630-649.
Pollard, L. (1953). Technique for Determining the Relative Housing Quality. Journal of
the American Institute of Planners, 19(4), 234-238.
Rindfuss, R. R., Piotrowski, M., Thongthai, V., & Prasartkul, P. (2007). Measuring housing
quality in the absence of a monetized real estate market. Population Studies, 61(1),
35-52.
Saaty, R. W. (2003). Decision making in complex environments. The Analytic Hierarchy
Process (AHP) for decision making and Analytic Network Process (ANP) for
decision making with dependence and feedback. Manual of Software for Decision
Making with Dependence and Feedback. Retrieved from
http://beta.superdecisions.com/tutorial-1-building-ahp-models/manual-for-
building-anp-decision-models/
Saaty, T. L. (2008a). Decision making with the Analytic Hierarchy Process. International
journal of services sciences, 1(1), 83-98.
Saaty, T.L. (2008b). The Analytic Network Process. Iranian Journal of Operation
Research, 1(1), 1-27.

156
Saaty, T. L. (2006). The Analytic Network Process. In Saaty, T. L., & Vargas, L. G.
(Eds.), Decision making with the Analytic Network Process: Economic, political,
social and technological applications with benefits, opportunities, costs and risks
(pp. 1-26). Springer.
Saaty, T.L. (2005). Theory and Applications of the Analytic Network Process: Decision
Making with Benefits, Opportunities, Costs, and Risks (3rd ed.). Pittsburgh, USA:
RWS Publications.
Saaty, T. L. (2004). Fundamentals of the Analytic Network Process- Dependence and
feedback in decision-making with a single network. Journal of Systems Science and
Systems Engineering, 13(2), 129-157.
Saaty, T.L. (2001). The Analytic Network Process. Pittsburgh, PA: RWS Publications.
Saaty, T. L. (1999). Fundamentals of the ANP: ISAHP Proc. In Kobe, Japan (Vol. 16).
Saaty, T. L. (1996). Decision Making with Dependence and Feedback: The Analytic
Network Process. Pittsburgh, PA 15213: RWS Publications, 4922 Ellsworth
Avenue.
Saaty, T.L. (1986). Axiomatic foundation of the Analytic Hierarchy Process. Management
Sciences, 32 (7), 841-855.
Saaty, T. L., & Vargas, L. G. (2006). Decision Making with the Analytic Networking
Process; Economic, Political, Social and Technological Applications with Benefits,
Opportunities, Costs and Risks. New York: Springer Science+ Business Media,
LLC.
Sabri, S., & Yaakup, A. (2008). Multi-criteria decision making for urban sprawl, using
Analytic Network Process and GIS, Case of Iskandar Malaysia Region. Map Asia.
Sarvar, R., Rashidi Ebrahim Hesari A., Mousavi M. N., & Orooji H. (2012). Optimum
location of neighbourhood parks in Bonab City using Analytic Network Process
(ANP). J. Civil Eng. Urban, 2(6), 226-234.
Shahmoradi, B., & Isalou, A. A. (2013). Site selection for wastewater treatment plant using
integrated fuzzy logic and multicriteria decision model: A case study in
Kahak. Journal of Advances in Environmental Health Research, 1(1), 51-60.
Siddiqui, A. R., Gold, E. B., Yang, X., Lee, K., Brown, K. H., & Bhutta, Z. A. (2008).
Prenatal exposure to wood fuel smoke and low birth weight. Environmental Health
Perspectives, 116(4), 543.
Sipahi, S., & Timor, M. (2010). The Analytic Hierarchy Process and Analytic Network
Process: An overview of applications. Management Decision, 48(5), 775-808.

157
So, A. T., & Leung, A. Y. (2004). Survey on attitudes towards buildings in three Chinese
cities: Hong Kong, Shanghai and Taipei. Facilities, 22(3/4), 100-108.
Spain, D. (1990). The effect of residential mobility and household composition on housing
quality. Urban Affairs Review, 25(4), 659-683.
ANP Team. (2013). Super Decisions (Version 2.2.6) [AHP/ANP Software]. Creative
Decisions Foundation: USA: Pittsburgh. Retrieved January 18, 2013. Available
from http://www.superdecisions.com/
Taslicali, A. K., & Ercan, S. (2006). The Analytic Hierarchy & the Analytic Network
Processes in multicriteria decision making: A comparative study. Journal of
Aeronautics & Space Technologies/Havacilik ve Uzay Teknolojileri Dergisi, 2(4),
55-65.
Thompson, I. (2010). Domestic waste management strategies in Accra, Ghana and other
urban cities in tropical developing nations. Cleveland: Case Western Reserve
University.
Twichell, A. A. (1948). An appraisal method for measuring the quality of
housing. American Sociological Review, 13(3), 278-287.
Tzeng, G. H. & Huang, J. J. (2011). Multiple Attribute Decision Making: Methods and
Applications. Taylor & Francis.
Ulutaş, B. H. (2005). Determination of the appropriate energy policy for Turkey.
Energy, 30(7), 1146-1161.
UN-HABITAT. (2011). Housing Sector Profile Series: Ghana Housing Profile. UN-
HABITAT. Kenya. Retrieved from
http://mirror.unhabitat.org/pmss/listItemDetails.aspx?publicationID=3258
Voogd, H. (1983). Multicriteria evaluation for urban and regional planning. London: Pion
Ltd.
World Bank. (2014). Ghana: World Development Indicators. Retrieved from
http://data.worldbank.org/country/ghana
World Health Organization and United Nations Children’s Fund Joint Monitoring
Programme for Water Supply and Sanitation (JMP). (2008). Progress on drinking
water and sanitation: Special focus on sanitation. New York: UNICEF, and
Geneva: WHO. Retrieved from
http://www.who.int/water_sanitation_health/monitoring/jmp2008.pdf

158
Wolfslehner, B., Vacik, H., & Lexer, M. J. (2005). Application of the Analytic Network
Process in multicriteria analysis of sustainable forest management. Forest Ecology
and Management, 207(1), 157-170.
Wu, W. H., Lin, C. T., & Peng, K. H. (2009). Determination of a hospital management
policy using conjoint analysis in the Analytic Network Process. Quality &
Quantity, 43(1), 145-154.
Yust, B.L., Hadjiyanni, T., & Ponce, L.B. (1997). Exploring housing quality measures in
a rural area of the Philippines. Housing and Society, 24(1), 60-74.
Zanakis, S. H., Solomon, A., Wishart, N., & Dublish, S. (1998) Multi-attribute decision
making: A simulation comparison of select methods. European Journal of
Operation Research, 107(3), 507-529.
Zebardast, E. (2009). The housing domain of quality of life and life satisfaction in the
spontaneous settlements on the Tehran metropolitan fringe. Social Indicators
Research, 90(2), 307-324.

159
APPENDICES
Appendix 1: Rating Model
ALTERNATIVES
(DISTRCITS)
Weights
0.0769 0.0769 0.0769 0.0769 0.0769 0.0769 0.0769 0.0769 0.0769 0.0769 0.0769 0.0769 0.0769
Totals Priorities Bathing
Facility
Cooking
Fuel
Cooking
Space
Water
Supply
Toilet
Facility Lighting
Housing
Type
Outer
material Tenureship
Household
Density
Solid
Waste
Disposal
Drainage Housing
Density
Abura-Asebu-
Kwamankese 0.679 0.006 0.333 0.333 0.333 0.667 0.500 1.000 0.667 1.000 1.000 1.000 0.500 0.500 1.000
Accra Metropolis 0.641 0.006 0.333 0.667 0.333 1.000 0.500 1.000 0.667 1.000 0.500 0.500 1.000 0.500 0.333
Adaklu Anyigbe 0.628 0.005 0.333 0.333 0.333 0.667 0.500 0.500 1.000 0.500 1.000 1.000 0.500 0.500 1.000
Adansi North 0.718 0.006 0.333 0.333 1.000 0.667 0.500 1.000 1.000 0.500 1.000 1.000 0.500 0.500 1.000
Adansi South 0.679 0.006 0.333 0.333 1.000 0.667 0.500 0.500 1.000 0.500 1.000 1.000 0.500 0.500 1.000
Adenta Municipal 0.744 0.006 0.333 1.000 0.333 0.333 0.500 1.000 1.000 1.000 1.000 1.000 1.000 0.500 0.667
Afigya Kwabre 0.731 0.006 0.667 0.667 0.333 0.667 0.500 1.000 0.667 1.000 1.000 1.000 0.500 0.500 1.000
Afigya Sekyere 0.705 0.006 0.667 0.333 0.333 0.667 0.500 1.000 0.667 1.000 1.000 1.000 0.500 0.500 1.000
Agona East 0.641 0.006 0.333 0.333 0.333 0.667 0.500 0.500 0.667 1.000 1.000 1.000 0.500 0.500 1.000
Agona West
Municipal 0.641 0.006 0.333 0.333 0.333 0.667 0.500 1.000 0.667 1.000 1.000 0.500 0.500 0.500 1.000
Ahafo Ano North 0.603 0.005 0.333 0.333 0.333 0.667 0.500 0.500 0.667 0.500 1.000 1.000 0.500 0.500 1.000
Ahafo Ano South 0.603 0.005 0.333 0.333 0.333 0.667 0.500 0.500 0.667 0.500 1.000 1.000 0.500 0.500 1.000
Ahanta West 0.756 0.007 0.333 0.333 1.000 0.667 0.500 1.000 1.000 1.000 1.000 1.000 0.500 0.500 1.000
Ajumako-Enyan-
Essiam 0.641 0.006 0.333 0.333 0.333 0.667 0.500 1.000 0.667 0.500 1.000 1.000 0.500 0.500 1.000
Akatsi 0.628 0.005 0.333 0.333 0.333 0.667 0.500 0.500 1.000 0.500 1.000 1.000 0.500 0.500 1.000
Akwapem North 0.679 0.006 0.333 0.333 0.333 0.667 0.500 1.000 0.667 1.000 1.000 1.000 0.500 0.500 1.000
Akwapem South
Municipal 0.731 0.006 0.667 0.667 0.333 0.667 0.500 1.000 0.667 1.000 1.000 1.000 0.500 0.500 1.000
Akyemansa 0.692 0.006 0.333 0.333 1.000 0.667 0.500 1.000 0.667 0.500 1.000 1.000 0.500 0.500 1.000
Amansie Central 0.679 0.006 0.333 0.333 1.000 0.667 0.500 0.500 1.000 0.500 1.000 1.000 0.500 0.500 1.000
Amansie West 0.667 0.006 0.333 0.333 0.333 0.667 0.500 1.000 1.000 0.500 1.000 1.000 0.500 0.500 1.000

160
Aowin/Suaman 0.705 0.006 1.000 0.333 1.000 0.333 0.500 0.500 1.000 0.500 1.000 1.000 0.500 0.500 1.000
Asante Akim North
Municipal 0.705 0.006 0.667 0.333 0.333 0.667 0.500 1.000 0.667 1.000 1.000 1.000 0.500 0.500 1.000
Asante Akim South 0.679 0.006 0.333 0.333 1.000 0.667 0.500 0.500 1.000 0.500 1.000 1.000 0.500 0.500 1.000
Ashaiman
Municipal 0.641 0.006 0.333 0.667 0.333 1.000 0.500 1.000 0.667 1.000 0.500 0.500 1.000 0.500 0.333
Asikuma-Odoben
Brakwa 0.654 0.006 0.333 0.333 1.000 0.667 0.500 0.500 0.667 0.500 1.000 1.000 0.500 0.500 1.000
Assin North
Municipal 0.654 0.006 0.333 0.333 1.000 0.667 0.500 0.500 0.667 0.500 1.000 1.000 0.500 0.500 1.000
Assin South 0.679 0.006 0.333 0.333 1.000 0.667 0.500 0.500 1.000 0.500 1.000 1.000 0.500 0.500 1.000
Asunafo North
Municipal 0.603 0.005 0.333 0.333 0.333 0.667 0.500 0.500 0.667 0.500 1.000 1.000 0.500 0.500 1.000
Asunafo South 0.654 0.006 0.333 0.333 1.000 0.667 0.500 0.500 0.667 0.500 1.000 1.000 0.500 0.500 1.000
Asuogyaman 0.705 0.006 0.333 0.333 0.333 0.667 0.500 1.000 1.000 1.000 1.000 1.000 0.500 0.500 1.000
Asutifi 0.628 0.005 0.667 0.333 0.333 0.667 0.500 0.500 0.667 0.500 1.000 1.000 0.500 0.500 1.000
Atebubu Amantin 0.603 0.005 0.333 0.333 0.333 0.667 0.500 0.500 0.667 0.500 1.000 1.000 0.500 0.500 1.000
Atiwa 0.731 0.006 0.333 0.333 1.000 0.667 0.500 1.000 0.667 1.000 1.000 1.000 0.500 0.500 1.000
Atwima
Kwanwoma 0.731 0.006 0.667 0.667 0.333 0.667 0.500 1.000 0.667 1.000 1.000 1.000 0.500 0.500 1.000
Atwima Mponua 0.654 0.006 0.333 0.333 1.000 0.667 0.500 0.500 0.667 0.500 1.000 1.000 0.500 0.500 1.000
Atwima Nwabiagya 0.692 0.006 0.667 0.667 0.333 0.667 0.500 1.000 0.667 1.000 1.000 0.500 0.500 0.500 1.000
Bawku Municipal 0.603 0.005 0.333 0.333 0.333 0.667 0.500 0.500 0.667 0.500 1.000 1.000 0.500 0.500 1.000
Bawku West 0.705 0.006 1.000 0.333 1.000 0.667 0.500 0.500 0.667 0.500 1.000 1.000 0.500 0.500 1.000
Bekwai Municipal 0.756 0.007 0.667 0.333 1.000 0.667 0.500 1.000 0.667 1.000 1.000 1.000 0.500 0.500 1.000
Berekum
Municipal 0.667 0.006 0.667 0.333 0.333 0.667 0.500 1.000 0.667 1.000 0.500 1.000 0.500 0.500 1.000
Bia 0.705 0.006 1.000 0.333 1.000 0.667 0.500 0.500 0.667 0.500 1.000 1.000 0.500 0.500 1.000
Biakoye 0.628 0.005 0.333 0.333 0.333 0.667 0.500 0.500 1.000 0.500 1.000 1.000 0.500 0.500 1.000
Birim Municipal 0.705 0.006 0.667 0.333 0.333 0.667 0.500 1.000 0.667 1.000 1.000 1.000 0.500 0.500 1.000
Birim North 0.705 0.006 0.333 0.333 0.333 0.667 0.500 1.000 1.000 1.000 1.000 1.000 0.500 0.500 1.000
Birim South 0.731 0.006 0.333 0.333 1.000 0.667 0.500 1.000 0.667 1.000 1.000 1.000 0.500 0.500 1.000
Bole 0.628 0.005 0.333 0.333 0.333 0.667 0.500 0.500 1.000 0.500 1.000 1.000 0.500 0.500 1.000
Bolgatanga
Municipal 0.641 0.006 0.333 0.333 0.333 0.667 0.500 1.000 0.667 0.500 1.000 1.000 0.500 0.500 1.000

161
Bongo 0.654 0.006 1.000 0.333 0.333 0.667 0.500 0.500 0.667 0.500 1.000 1.000 0.500 0.500 1.000
Bosome Freho 0.731 0.006 1.000 0.333 1.000 0.667 0.500 0.500 1.000 0.500 1.000 1.000 0.500 0.500 1.000
Bosumtwi 0.705 0.006 0.667 0.333 0.333 0.667 0.500 1.000 0.667 1.000 1.000 1.000 0.500 0.500 1.000
Builsa 0.705 0.006 1.000 0.333 1.000 0.667 0.500 0.500 0.667 0.500 1.000 1.000 0.500 0.500 1.000
Bunkpurugu-
Yunyoo 0.705 0.006 1.000 0.333 1.000 0.667 0.500 0.500 0.667 0.500 1.000 1.000 0.500 0.500 1.000
Cape Coast
Metropolis 0.692 0.006 0.667 0.667 0.333 1.000 0.500 1.000 0.667 1.000 0.500 0.500 1.000 0.500 0.667
Chereponi 0.705 0.006 1.000 0.333 1.000 0.667 0.500 0.500 0.667 0.500 1.000 1.000 0.500 0.500 1.000
Dangbe East 0.705 0.006 0.333 0.667 0.333 0.667 0.500 1.000 0.667 1.000 1.000 1.000 0.500 0.500 1.000
Dangbe West 0.731 0.006 0.333 0.667 0.333 1.000 0.500 1.000 0.667 1.000 1.000 1.000 0.500 0.500 1.000
Dormaa East 0.782 0.007 0.667 0.333 1.000 0.667 0.500 1.000 1.000 1.000 1.000 1.000 0.500 0.500 1.000
Dormaa Municipal 0.744 0.006 0.667 0.333 1.000 0.667 0.500 1.000 1.000 0.500 1.000 1.000 0.500 0.500 1.000
East Akim
Municipal 0.756 0.007 0.667 0.333 1.000 0.667 0.500 1.000 0.667 1.000 1.000 1.000 0.500 0.500 1.000
East Gonja 0.577 0.005 0.333 0.333 0.333 0.333 0.500 0.500 0.667 0.500 1.000 1.000 0.500 0.500 1.000
Effutu Municipal 0.692 0.006 0.333 0.667 0.333 1.000 0.500 1.000 0.667 1.000 0.500 0.500 1.000 0.500 1.000
Ejisu Juaben
Municipal 0.705 0.006 0.667 0.333 0.333 0.667 0.500 1.000 0.667 1.000 1.000 1.000 0.500 0.500 1.000
Ejura-
Sekyedumase 0.641 0.006 0.333 0.333 0.333 0.667 0.500 0.500 0.667 1.000 1.000 1.000 0.500 0.500 1.000
Ellembelle 0.756 0.007 0.667 0.333 1.000 0.667 0.500 1.000 0.667 1.000 1.000 1.000 0.500 0.500 1.000
Ewutu Senya 0.679 0.006 0.333 0.667 0.333 0.333 0.500 1.000 0.667 1.000 1.000 1.000 0.500 0.500 1.000
Fanteakwa 0.654 0.006 0.333 0.333 1.000 0.333 0.500 0.500 1.000 0.500 1.000 1.000 0.500 0.500 1.000
Ga East Municipal 0.769 0.007 1.000 1.000 0.333 0.333 1.000 1.000 1.000 1.000 0.500 1.000 1.000 0.500 0.333
Ga West Municipal 0.718 0.006 0.333 1.000 0.333 0.333 1.000 1.000 0.667 1.000 0.500 1.000 1.000 0.500 0.667
Garu Tempane 0.603 0.005 0.333 0.333 0.333 0.667 0.500 0.500 0.667 0.500 1.000 1.000 0.500 0.500 1.000
Gomoa East 0.731 0.006 0.333 0.667 0.333 0.667 0.500 1.000 1.000 1.000 1.000 1.000 0.500 0.500 1.000
Gomoa West 0.679 0.006 0.333 0.333 0.333 0.667 0.500 1.000 0.667 1.000 1.000 1.000 0.500 0.500 1.000
Gonja Central 0.603 0.005 0.333 0.333 0.333 0.333 0.500 0.500 1.000 0.500 1.000 1.000 0.500 0.500 1.000
Gushiegu 0.603 0.005 0.333 0.333 0.333 0.667 0.500 0.500 0.667 0.500 1.000 1.000 0.500 0.500 1.000
Ho Municipal 0.731 0.006 0.333 0.333 0.333 1.000 0.500 1.000 1.000 1.000 1.000 1.000 0.500 0.500 1.000
Hohoe Municipal 0.692 0.006 0.333 0.333 0.333 1.000 0.500 1.000 1.000 0.500 1.000 1.000 0.500 0.500 1.000
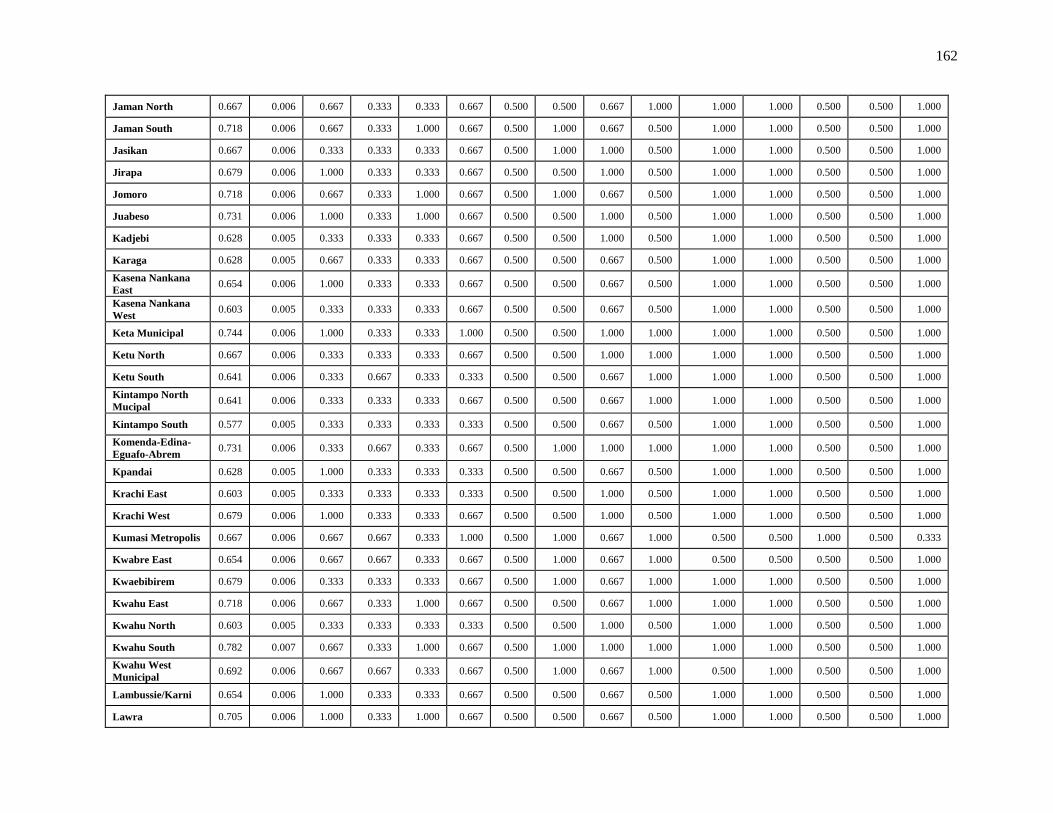
162
Jaman North 0.667 0.006 0.667 0.333 0.333 0.667 0.500 0.500 0.667 1.000 1.000 1.000 0.500 0.500 1.000
Jaman South 0.718 0.006 0.667 0.333 1.000 0.667 0.500 1.000 0.667 0.500 1.000 1.000 0.500 0.500 1.000
Jasikan 0.667 0.006 0.333 0.333 0.333 0.667 0.500 1.000 1.000 0.500 1.000 1.000 0.500 0.500 1.000
Jirapa 0.679 0.006 1.000 0.333 0.333 0.667 0.500 0.500 1.000 0.500 1.000 1.000 0.500 0.500 1.000
Jomoro 0.718 0.006 0.667 0.333 1.000 0.667 0.500 1.000 0.667 0.500 1.000 1.000 0.500 0.500 1.000
Juabeso 0.731 0.006 1.000 0.333 1.000 0.667 0.500 0.500 1.000 0.500 1.000 1.000 0.500 0.500 1.000
Kadjebi 0.628 0.005 0.333 0.333 0.333 0.667 0.500 0.500 1.000 0.500 1.000 1.000 0.500 0.500 1.000
Karaga 0.628 0.005 0.667 0.333 0.333 0.667 0.500 0.500 0.667 0.500 1.000 1.000 0.500 0.500 1.000
Kasena Nankana
East 0.654 0.006 1.000 0.333 0.333 0.667 0.500 0.500 0.667 0.500 1.000 1.000 0.500 0.500 1.000
Kasena Nankana
West 0.603 0.005 0.333 0.333 0.333 0.667 0.500 0.500 0.667 0.500 1.000 1.000 0.500 0.500 1.000
Keta Municipal 0.744 0.006 1.000 0.333 0.333 1.000 0.500 0.500 1.000 1.000 1.000 1.000 0.500 0.500 1.000
Ketu North 0.667 0.006 0.333 0.333 0.333 0.667 0.500 0.500 1.000 1.000 1.000 1.000 0.500 0.500 1.000
Ketu South 0.641 0.006 0.333 0.667 0.333 0.333 0.500 0.500 0.667 1.000 1.000 1.000 0.500 0.500 1.000
Kintampo North
Mucipal 0.641 0.006 0.333 0.333 0.333 0.667 0.500 0.500 0.667 1.000 1.000 1.000 0.500 0.500 1.000
Kintampo South 0.577 0.005 0.333 0.333 0.333 0.333 0.500 0.500 0.667 0.500 1.000 1.000 0.500 0.500 1.000
Komenda-Edina-
Eguafo-Abrem 0.731 0.006 0.333 0.667 0.333 0.667 0.500 1.000 1.000 1.000 1.000 1.000 0.500 0.500 1.000
Kpandai 0.628 0.005 1.000 0.333 0.333 0.333 0.500 0.500 0.667 0.500 1.000 1.000 0.500 0.500 1.000
Krachi East 0.603 0.005 0.333 0.333 0.333 0.333 0.500 0.500 1.000 0.500 1.000 1.000 0.500 0.500 1.000
Krachi West 0.679 0.006 1.000 0.333 0.333 0.667 0.500 0.500 1.000 0.500 1.000 1.000 0.500 0.500 1.000
Kumasi Metropolis 0.667 0.006 0.667 0.667 0.333 1.000 0.500 1.000 0.667 1.000 0.500 0.500 1.000 0.500 0.333
Kwabre East 0.654 0.006 0.667 0.667 0.333 0.667 0.500 1.000 0.667 1.000 0.500 0.500 0.500 0.500 1.000
Kwaebibirem 0.679 0.006 0.333 0.333 0.333 0.667 0.500 1.000 0.667 1.000 1.000 1.000 0.500 0.500 1.000
Kwahu East 0.718 0.006 0.667 0.333 1.000 0.667 0.500 0.500 0.667 1.000 1.000 1.000 0.500 0.500 1.000
Kwahu North 0.603 0.005 0.333 0.333 0.333 0.333 0.500 0.500 1.000 0.500 1.000 1.000 0.500 0.500 1.000
Kwahu South 0.782 0.007 0.667 0.333 1.000 0.667 0.500 1.000 1.000 1.000 1.000 1.000 0.500 0.500 1.000
Kwahu West
Municipal 0.692 0.006 0.667 0.667 0.333 0.667 0.500 1.000 0.667 1.000 0.500 1.000 0.500 0.500 1.000
Lambussie/Karni 0.654 0.006 1.000 0.333 0.333 0.667 0.500 0.500 0.667 0.500 1.000 1.000 0.500 0.500 1.000
Lawra 0.705 0.006 1.000 0.333 1.000 0.667 0.500 0.500 0.667 0.500 1.000 1.000 0.500 0.500 1.000

163
Ledzokuku/Krowor
Municipal 0.667 0.006 0.333 1.000 0.333 1.000 0.500 1.000 0.667 1.000 0.500 0.500 1.000 0.500 0.333
Lower Manya 0.692 0.006 0.333 0.667 0.333 1.000 0.500 1.000 0.667 1.000 0.500 1.000 0.500 0.500 1.000
Mampong
Municipal 0.731 0.006 0.667 0.333 0.333 1.000 0.500 1.000 0.667 1.000 1.000 1.000 0.500 0.500 1.000
Mamprusi East 0.654 0.006 1.000 0.333 0.333 0.667 0.500 0.500 0.667 0.500 1.000 1.000 0.500 0.500 1.000
Mamprusi West 0.628 0.005 0.667 0.333 0.333 0.667 0.500 0.500 0.667 0.500 1.000 1.000 0.500 0.500 1.000
Mfantsiman
Municipal 0.705 0.006 0.333 0.667 0.333 0.667 0.500 1.000 0.667 1.000 1.000 1.000 0.500 0.500 1.000
Mpohor-Wassa
East 0.679 0.006 0.333 0.333 1.000 0.667 0.500 0.500 1.000 0.500 1.000 1.000 0.500 0.500 1.000
Nadowli 0.705 0.006 1.000 0.333 1.000 0.667 0.500 0.500 0.667 0.500 1.000 1.000 0.500 0.500 1.000
Nanumba North 0.603 0.005 0.333 0.333 0.333 0.667 0.500 0.500 0.667 0.500 1.000 1.000 0.500 0.500 1.000
Nanumba South 0.654 0.006 1.000 0.333 0.333 0.667 0.500 0.500 0.667 0.500 1.000 1.000 0.500 0.500 1.000
New Juaben
Municipal 0.692 0.006 0.667 0.667 0.333 1.000 0.500 1.000 0.667 1.000 0.500 0.500 1.000 0.500 0.667
Nkoranza North 0.667 0.006 0.333 0.333 0.333 0.667 0.500 1.000 1.000 0.500 1.000 1.000 0.500 0.500 1.000
Nkoranza South 0.705 0.006 0.333 0.333 0.333 0.667 0.500 1.000 1.000 1.000 1.000 1.000 0.500 0.500 1.000
Nkwanta North 0.628 0.005 1.000 0.333 0.333 0.333 0.500 0.500 0.667 0.500 1.000 1.000 0.500 0.500 1.000
Nkwanta South 0.628 0.005 0.333 0.333 0.333 0.667 0.500 0.500 1.000 0.500 1.000 1.000 0.500 0.500 1.000
North Dayi 0.705 0.006 0.333 0.333 0.333 0.667 0.500 1.000 1.000 1.000 1.000 1.000 0.500 0.500 1.000
North Tongu 0.603 0.005 0.333 0.333 0.333 0.333 0.500 0.500 1.000 0.500 1.000 1.000 0.500 0.500 1.000
Nzema East 0.718 0.006 0.333 0.333 1.000 0.667 0.500 1.000 1.000 0.500 1.000 1.000 0.500 0.500 1.000
Obuasi Municipal 0.705 0.006 0.667 0.667 0.333 0.667 0.500 1.000 0.667 1.000 0.500 1.000 1.000 0.500 0.667
Offinso Municipal 0.705 0.006 0.667 0.333 0.333 0.667 0.500 1.000 0.667 1.000 1.000 1.000 0.500 0.500 1.000
Offinso North 0.603 0.005 0.333 0.333 0.333 0.667 0.500 0.500 0.667 0.500 1.000 1.000 0.500 0.500 1.000
Prestea/Huni
Valley 0.705 0.006 0.333 0.333 0.333 0.667 0.500 1.000 1.000 1.000 1.000 1.000 0.500 0.500 1.000
Pru 0.603 0.005 0.333 0.333 0.333 0.667 0.500 0.500 0.667 0.500 1.000 1.000 0.500 0.500 1.000
Saboba Chereponi 0.654 0.006 1.000 0.333 0.333 0.667 0.500 0.500 0.667 0.500 1.000 1.000 0.500 0.500 1.000
Savelugu-Nanton 0.628 0.005 0.667 0.333 0.333 0.667 0.500 0.500 0.667 0.500 1.000 1.000 0.500 0.500 1.000
Sawla-Tuna-Kalba 0.731 0.006 1.000 0.333 1.000 0.667 0.500 0.500 1.000 0.500 1.000 1.000 0.500 0.500 1.000
Sefwi Akontombra 0.705 0.006 1.000 0.333 1.000 0.333 0.500 0.500 1.000 0.500 1.000 1.000 0.500 0.500 1.000

164
Sefwi Bibiani-
Anhwiaso-Bekwai 0.756 0.007 0.667 0.333 1.000 0.667 0.500 1.000 0.667 1.000 1.000 1.000 0.500 0.500 1.000
Sefwi Wiawso 0.769 0.007 1.000 0.333 1.000 0.667 0.500 1.000 1.000 0.500 1.000 1.000 0.500 0.500 1.000
Sekondi -Takoradi 0.731 0.006 0.667 0.667 0.333 1.000 0.500 1.000 0.667 1.000 1.000 0.500 1.000 0.500 0.667
Sekyere Afram
Plains 0.615 0.005 0.333 0.333 0.333 0.333 0.500 0.500 0.667 1.000 1.000 1.000 0.500 0.500 1.000
Sekyere Central 0.641 0.006 0.333 0.333 0.333 0.333 0.500 0.500 1.000 1.000 1.000 1.000 0.500 0.500 1.000
Sekyere East 0.705 0.006 0.667 0.333 0.333 0.667 0.500 1.000 0.667 1.000 1.000 1.000 0.500 0.500 1.000
Sene 0.628 0.005 0.333 0.333 0.333 0.667 0.500 0.500 1.000 0.500 1.000 1.000 0.500 0.500 1.000
Shama 0.731 0.006 0.333 0.667 0.333 0.667 0.500 1.000 1.000 1.000 1.000 1.000 0.500 0.500 1.000
Sissala East 0.603 0.005 0.333 0.333 0.333 0.667 0.500 0.500 0.667 0.500 1.000 1.000 0.500 0.500 1.000
Sissala West 0.654 0.006 1.000 0.333 0.333 0.667 0.500 0.500 0.667 0.500 1.000 1.000 0.500 0.500 1.000
South Dayi 0.641 0.006 0.333 0.333 0.333 0.333 0.500 1.000 1.000 0.500 1.000 1.000 0.500 0.500 1.000
South Tongu 0.667 0.006 0.333 0.333 0.333 0.667 0.500 0.500 1.000 1.000 1.000 1.000 0.500 0.500 1.000
Suhum-Kraboa
Coaltar 0.603 0.005 0.333 0.333 0.333 0.667 0.500 0.500 0.667 0.500 1.000 1.000 0.500 0.500 1.000
Sunyani Municipal 0.718 0.006 0.667 0.667 0.333 1.000 0.500 1.000 0.667 1.000 0.500 0.500 1.000 0.500 1.000
Sunyani West 0.705 0.006 0.667 0.333 0.333 0.667 0.500 1.000 0.667 1.000 1.000 1.000 0.500 0.500 1.000
Tain 0.628 0.005 0.333 0.333 0.333 0.667 0.500 0.500 1.000 0.500 1.000 1.000 0.500 0.500 1.000
Talensi Nabdam 0.705 0.006 1.000 0.333 1.000 0.667 0.500 0.500 0.667 0.500 1.000 1.000 0.500 0.500 1.000
Tamale Metropolis 0.795 0.007 0.667 0.667 0.333 1.000 0.500 1.000 0.667 1.000 1.000 1.000 1.000 0.500 1.000
Tano North 0.705 0.006 0.667 0.333 0.333 0.667 0.500 1.000 0.667 1.000 1.000 1.000 0.500 0.500 1.000
Tano South 0.705 0.006 0.667 0.333 0.333 0.667 0.500 1.000 0.667 1.000 1.000 1.000 0.500 0.500 1.000
Tarkwa Nsuaem
Municipal 0.705 0.006 0.333 0.333 0.333 0.667 0.500 1.000 1.000 1.000 1.000 1.000 0.500 0.500 1.000
Techiman
Municipal 0.731 0.006 0.667 0.667 0.333 0.667 0.500 1.000 0.667 1.000 1.000 1.000 0.500 0.500 1.000
Tema Metropolis 0.885 0.008 1.000 1.000 0.333 1.000 1.000 1.000 1.000 1.000 1.000 1.000 1.000 0.500 0.667
Tolon-Kumbugu 0.603 0.005 0.667 0.333 0.333 0.333 0.500 0.500 0.667 0.500 1.000 1.000 0.500 0.500 1.000
Twifo-Hemang-
Lower Denkyira 0.718 0.006 0.333 0.333 1.000 0.667 0.500 1.000 1.000 0.500 1.000 1.000 0.500 0.500 1.000
Upper Denkyira
East 0.718 0.006 0.667 0.333 1.000 0.667 0.500 1.000 0.667 0.500 1.000 1.000 0.500 0.500 1.000
Upper Denkyira
West 0.718 0.006 0.333 0.333 1.000 0.667 0.500 1.000 1.000 0.500 1.000 1.000 0.500 0.500 1.000

165
Upper Manya 0.628 0.005 0.333 0.333 0.333 0.667 0.500 0.500 1.000 0.500 1.000 1.000 0.500 0.500 1.000
Wa East 0.731 0.006 1.000 0.333 1.000 0.667 0.500 0.500 1.000 0.500 1.000 1.000 0.500 0.500 1.000
Wa Municipal 0.731 0.006 0.667 0.667 0.333 0.667 0.500 1.000 0.667 1.000 1.000 1.000 0.500 0.500 1.000
Wa West 0.731 0.006 1.000 0.333 1.000 0.667 0.500 0.500 1.000 0.500 1.000 1.000 0.500 0.500 1.000
Wassa Amenfi East 0.705 0.006 1.000 0.333 1.000 0.333 0.500 0.500 1.000 0.500 1.000 1.000 0.500 0.500 1.000
Wassa Amenfi
West 0.679 0.006 0.333 0.333 1.000 0.667 0.500 0.500 1.000 0.500 1.000 1.000 0.500 0.500 1.000
Weija (Ga South)
Municipal 0.731 0.006 0.333 0.667 0.333 1.000 0.500 1.000 1.000 1.000 1.000 1.000 0.500 0.500 0.667
Wenchi Municipal 0.679 0.006 0.333 0.333 0.333 0.667 0.500 1.000 0.667 1.000 1.000 1.000 0.500 0.500 1.000
West Akim
Municipal 0.679 0.006 0.333 0.333 0.333 0.667 0.500 1.000 0.667 1.000 1.000 1.000 0.500 0.500 1.000
West Gonja 0.603 0.005 0.333 0.333 0.333 0.667 0.500 0.500 0.667 0.500 1.000 1.000 0.500 0.500 1.000
Yendi Municipal 0.603 0.005 0.333 0.333 0.333 0.667 0.500 0.500 0.667 0.500 1.000 1.000 0.500 0.500 1.000
Yilo Krobo 0.667 0.006 0.333 0.667 0.333 0.667 0.500 1.000 0.667 0.500 1.000 1.000 0.500 0.500 1.000
Zabzugu-Tatale 0.654 0.006 1.000 0.333 0.333 0.667 0.500 0.500 0.667 0.500 1.000 1.000 0.500 0.500 1.000

166
Appendix II:
Final Priorities (Limiting and Normalized by Cluster Priorities) for the Districts by Regions
ASHANTI REGION Model 1 Model 2 (Scenario 1) Model 3 (Scenario 2) Model 4 (Scenario 3)
Normalized
By Cluster
Limiting
Priorities Rank
Normalized
By Cluster
Limiting
Priorities Rank
Normalized
By Cluster
Limiting
Priorities Rank
Normalized
By Cluster
Limiting
Priorities Rank
A
L
T
E
R
N
A
T
I
V
E
S
Adansi North 0.04795 0.022622 3 0.04467 0.021553 3 0.0527 0.024217 3 0.04662 0.022112 3
Adansi South 0.04759 0.022453 5 0.04445 0.021449 5 0.05217 0.023971 5 0.0463 0.021959 5
Afigya
Kwabre 0.03612 0.017038 9 0.03765 0.018166 9 0.03457 0.015887 9 0.03606 0.017104 9
Afigya
Sekyere 0.0358 0.016887 17 0.03746 0.018072 16 0.03409 0.015666 17 0.03578 0.016967 17
Ahafo Ano
North 0.03188 0.015042 23 0.03508 0.016926 23 0.02836 0.013033 24 0.03222 0.015281 24
Ahafo Ano
South 0.03205 0.015121 21 0.03531 0.017039 21 0.02853 0.013108 22 0.03233 0.015332 21
Amansie
Central 0.0476 0.022455 4 0.04446 0.02145 4 0.05217 0.023974 4 0.04631 0.021961 4
Amansie
West 0.0475 0.02241 7 0.0444 0.021422 7 0.05203 0.023908 7 0.04622 0.02192 7
Asante Akim
North
Municipal 0.03595 0.016958 12 0.03759 0.018139 11 0.03417 0.0157 12 0.03601 0.01708 12
Asante Akim
South 0.04758 0.022445 6 0.04444 0.021444 6 0.05214 0.023959 6 0.04629 0.021952 6
Atwima
Kwanwoma 0.03608 0.017021 10 0.03763 0.018155 10 0.03452 0.015861 10 0.03603 0.017088 11
Atwima
Mponua 0.03333 0.015724 20 0.03709 0.017896 19 0.02977 0.013678 20 0.03314 0.015718 20
Atwima
Nwabiagya 0.03013 0.014216 24 0.02918 0.014077 24 0.02885 0.013256 21 0.03231 0.015324 22
Bekwai
Municipal 0.03666 0.017293 8 0.03797 0.018322 8 0.03538 0.016259 8 0.03655 0.017335 8
Bosome
Freho 0.04848 0.022871 2 0.04498 0.021705 2 0.0535 0.024582 2 0.0471 0.022337 2
Bosumtwi 0.0358 0.016889 16 0.03746 0.018074 15 0.0341 0.015669 16 0.03578 0.016969 16
Ejisu Juaben
Municipal 0.03581 0.016894 15 0.03747 0.018077 14 0.03412 0.015676 15 0.03579 0.016973 15
Ejura-
Sekyedumase 0.03449 0.016272 19 0.03581 0.01728 20 0.03271 0.015031 19 0.03489 0.016546 19

167
Kumasi
Metropolis 0.02064 0.009735 27 0.01723 0.008314 27 0.02212 0.010165 27 0.02251 0.010676 27
Kwabre East 0.02522 0.011898 26 0.02178 0.010508 26 0.02438 0.011201 26 0.02944 0.013963 25
Mampong
Municipal 0.03595 0.01696 11 0.03737 0.018032 17 0.03437 0.015793 11 0.03605 0.017096 10
Obuasi
Municipal 0.02729 0.012876 25 0.02664 0.012855 25 0.02773 0.01274 25 0.02747 0.013029 26
Offinso
Municipal 0.03581 0.016894 14 0.03747 0.018077 13 0.03412 0.015676 14 0.03579 0.016973 14
Offinso North 0.03189 0.015045 22 0.03508 0.016928 22 0.02837 0.013038 23 0.03223 0.015284 23
Sekyere
Afram Plains 0.03551 0.016752 18 0.03729 0.01799 18 0.03366 0.015467 18 0.03552 0.016845 18
Sekyere
Central 0.05106 0.024086 1 0.04656 0.022464 1 0.05723 0.026295 1 0.04945 0.023452 1
Sekyere East 0.03583 0.016901 13 0.03747 0.018081 12 0.03414 0.015686 13 0.0358 0.01698 13
ECONOMIC
/SOCIAL
Crowding
(household
density) 0.51764 0.08566
0.50677 0.124822
0.52966 0.079372
0.5256 0.053766
Ownership 0.48236 0.079823 0.49323 0.121485 0.47034 0.070483 0.4744 0.048528
ENVIRON-
MENTAL
Amount of
open space 0.84511 0.132895 0.84795 0.12274 0.84379 0.077543 0.84364 0.20005
Sanitation
Facilities 0.15489 0.024357 0.15205 0.022009 0.15621 0.014356 0.15636 0.037078
PHYSICAL
Dwelling
type 0.49035 0.100769 0.48627 0.061488 0.49788 0.14874 0.48729 0.090791
Housing
Services /
Infrastructure 0.12014 0.024689 0.12006 0.015181 0.12057 0.036021 0.11985 0.02233
Structural
Quality 0.38952 0.080048 0.39368 0.04978 0.38155 0.113988 0.39287 0.073199

168
BRONG AHAFO REGION Model 1 Model 2 (Scenario 1) Model 3 (Scenario 2) Model 4 (Scenario 3)
Normalized
By Cluster
Limiting
Priorities Rank
Normalized
By Cluster
Limiting
Priorities Rank
Normalized
By Cluster
Limiting
Priorities Rank
Normalized
By Cluster
Limiting
Priorities Rank
A
T
E
R
N
A
T
I
V
E
S
Asunafo North
Municipal 0.03792 0.017944 19 0.04172 0.02017 19 0.0338 0.015594 20 0.03824 0.018187 21
Asunafo South 0.03841 0.018177 15 0.04202 0.020315 15 0.03452 0.015928 16 0.03869 0.018399 17
Asutifi 0.03811 0.018036 16 0.04184 0.020227 16 0.03408 0.015725 17 0.03842 0.01827 18
Atebubu Amantin 0.03792 0.017944 17 0.04172 0.02017 17 0.0338 0.015594 18 0.03824 0.018187 19
Berekum
Municipal 0.03669 0.017363 21 0.03481 0.016829 21 0.03596 0.01659 15 0.03925 0.018666 16
Dormaa East 0.06372 0.030153 1 0.05718 0.027646 1 0.07257 0.033483 1 0.06144 0.02922 1
Dormaa Municipal 0.05862 0.027742 3 0.05412 0.026168 3 0.06502 0.029997 3 0.05681 0.027016 3
Jaman North 0.04321 0.020447 12 0.04489 0.021705 12 0.04164 0.01921 12 0.04305 0.020474 12
Jaman South 0.03948 0.018684 14 0.04267 0.02063 14 0.0361 0.016656 14 0.03966 0.018859 15
Kintampo North
Municipal 0.04301 0.020355 13 0.04478 0.021649 13 0.04135 0.019079 13 0.04288 0.020391 14
Kintampo South 0.03781 0.017894 20 0.04165 0.020139 20 0.03364 0.015522 21 0.03815 0.018142 22
Nkoranza North 0.05734 0.027136 4 0.05334 0.025791 4 0.06313 0.029128 4 0.05565 0.026466 4
Nkoranza South 0.06244 0.029547 2 0.0564 0.02727 2 0.07069 0.032614 2 0.06029 0.02867 2
Pru 0.03792 0.017944 18 0.04172 0.02017 18 0.0338 0.015594 19 0.03824 0.018187 20
Sene 0.05663 0.026798 6 0.05256 0.025411 6 0.06231 0.028746 6 0.05512 0.026215 6
Sunyani Municipal 0.03523 0.016673 22 0.02943 0.014228 22 0.03333 0.015379 22 0.04291 0.020405 13
Sunyani West 0.04363 0.020647 8 0.04515 0.02183 9 0.04226 0.019497 8 0.04343 0.020655 9
Tain 0.05706 0.027002 5 0.05317 0.025708 5 0.06272 0.028936 5 0.0554 0.026344 5
Tano North 0.04363 0.020647 9 0.04515 0.02183 10 0.04226 0.019497 9 0.04343 0.020655 10
Tano South 0.04363 0.020647 10 0.04515 0.02183 11 0.04226 0.019497 10 0.04343 0.020655 11
Techiman
Municipal 0.04403 0.020837 7 0.04539 0.021948 7 0.04285 0.019771 7 0.0438 0.020829 7
Wenchi Municipal 0.04352 0.020596 11 0.04515 0.02183 8 0.04191 0.019334 11 0.04347 0.020674
8
ECONOMIC
/SOCIAL
Crowding
(household density) 0.53347 0.089006
0.52134 0.128983
0.54468 0.082508
0.54354 0.056193
Ownership 0.46653 0.077837 0.47866 0.118426 0.45532 0.068973 0.45646 0.047191
ENVIRON-
MENTAL
Amount of open
space 0.87078 0.137354 0.87106 0.126345 0.87109 0.080379 0.87019 0.206917
Sanitation Facilities 0.12922 0.020383 0.12894 0.018703 0.12891 0.011895 0.12981 0.030867

169
PHYSICAL
Dwelling type 0.51513 0.104163 0.51337 0.063684 0.52033 0.15343 0.51188 0.093809
Housing Services /
Infrastructure 0.13509 0.027316 0.13694 0.016987 0.13296 0.039207 0.13537 0.024808
Structural Quality 0.34978 0.070728 0.34969 0.043379 0.34671 0.102236 0.35275 0.064646
GREATER ACCRA
REGION
Model 1 Model 2 (Scenario 1) Model 3 (Scenario 2) Model 4 (Scenario 3) Normalized
By Cluster
Limiting
Priorities Rank
Normalized
By Cluster
Limiting
Priorities Rank
Normalized
By Cluster
Limiting
Priorities Rank
Normalized
By Cluster
Limiting
Priorities Rank
A
L
T
E
R
N
A
T
I
V
E
S
Accra Metropolis 0.0529 0.02474 10 0.04543 0.021807 10 0.05153 0.023378 10 0.06173 0.029031 10
Adenta Municipal 0.13771 0.064401 2 0.13872 0.066593 2 0.1441 0.065372 2 0.13051 0.061379 2
Ashaiman
Municipal 0.05302 0.024795 9 0.0455 0.02184 9 0.0517 0.023457 9 0.06184 0.029081 9
Dangbe East 0.12195 0.05703 4 0.13548 0.065035 4 0.10635 0.048248 6 0.12386 0.058251 4
Dangbe West 0.12231 0.057198 3 0.13569 0.065138 3 0.10689 0.048491 5 0.12419 0.058405 3
Ga East
Municipal 0.10836 0.050672 6 0.09858 0.047325 6 0.12184 0.055274 4 0.10471 0.049244 6
Ga West
Municipal 0.08732 0.040833 7 0.08939 0.042911 7 0.08063 0.036578 7 0.09176 0.043152 7
Ledzokuku/
Krowor Municipal 0.05428 0.025383 8 0.04625 0.022201 8 0.05358 0.024308 8 0.06298 0.029618 8
Tema Metropolis 0.14112 0.065995 1 0.14076 0.06757 1 0.14919 0.067681 1 0.13361 0.062837 1
Weija (Ga South)
Municipal 0.12103 0.056598 5 0.12421 0.059625 5 0.1342 0.060883 3 0.10482 0.049297 5
ECONOMIC
/SOCIAL
Overcrowding
(household
density) 0.59504 0.09701
0.58338 0.142582
0.60505 0.088612
0.60288 0.060647
Ownership 0.40496 0.066022 0.41662 0.101823 0.39495 0.057842 0.39712 0.039949
ENVIRON-
MENTAL
Amount of Open
Space 0.47005 0.073272 0.49159 0.070796 0.45708 0.041473 0.46136 0.108487
Sanitation
Facilities 0.52995 0.08261 0.50841 0.073217 0.54292 0.049261 0.53864 0.126661
PHYSICAL
Dwelling Type 0.42717 0.091174 0.42651 0.056101 0.43403 0.134176 0.42111 0.081679
Housing Services
/ Infrastructure 0.1005 0.021451 0.09992 0.013143 0.10047 0.031059 0.10111 0.019612
Structural Quality 0.47233 0.100814 0.47357 0.062291 0.4655 0.143906 0.47778 0.09267

170
CENTRAL
REGION Model 1 Model 2 (Scenario 1) Model 3 (Scenario 2) Model 4 (Scenario 3)
Normalized
By Cluster
Limiting
Priorities Rank
Normalized
By Cluster
Limiting
Priorities Rank
Normalized
By Cluster
Limiting
Priorities Rank
Normalized
By Cluster
Limiting
Priorities Rank
A
L
T
E
R
N
A
T
I
V
E
S
Abura-Asebu-
Kwamankese 0.05707 0.026926 9 0.06036 0.029132 8 0.05429 0.024946 9 0.05649 0.026792 9
Agona East 0.05687 0.026833 10 0.06024 0.029073 10 0.05401 0.024813 10 0.05632 0.026708 10
Agona West
Municipal 0.04645 0.021918 15 0.04537 0.021895 15 0.04412 0.020272 15 0.04982 0.023628 16
Ajumako-Enyan-
Essiam 0.05094 0.024033 14 0.05669 0.027362 14 0.04521 0.020773 14 0.05089 0.024135 15
Asikuma-Odoben
Brakwa 0.05123 0.024171 13 0.05687 0.027448 13 0.04564 0.02097 13 0.05115 0.024259 14
Assin North Municipal 0.05123 0.024171 12 0.05687 0.027448 12 0.04564 0.02097 12 0.05115 0.024259 13
Assin South 0.07439 0.035098 5 0.07073 0.034138 5 0.08067 0.037064 5 0.07188 0.034089 5
Cape Coast Metropolis 0.03088 0.014572 17 0.02482 0.011978 17 0.03357 0.015422 17 0.03427 0.016253 17
Effutu Municipal 0.04412 0.020816 16 0.03703 0.01787 16 0.04076 0.018728 16 0.05456 0.025876 11
Ewutu Senya 0.05707 0.026926 8 0.06036 0.029132 9 0.05429 0.024946 8 0.05649 0.026792 8
Gomoa East 0.08078 0.038114 2 0.07456 0.035984 2 0.09013 0.041412 2 0.07772 0.036857 2
Gomoa West 0.05712 0.02695 7 0.06039 0.029147 7 0.05437 0.024981 7 0.05654 0.026814 7
Komenda-Edina-
Eguafo-Abirem 0.08078 0.038114 1 0.07456 0.035984 1 0.09013 0.041412 1 0.07772 0.036857 1
Mfantsiman Municipal 0.05766 0.027204 6 0.06072 0.029305 6 0.05516 0.025344 6 0.05702 0.027043 6
Twifo-Hemang-Lower
Denkyira 0.07523 0.035496 3 0.07125 0.034387 3 0.08191 0.037634 3 0.07264 0.034449 3
Upper Denkyira East
Municipal 0.05295 0.024983 11 0.05793 0.027957 11 0.04817 0.022133 11 0.0527 0.024994 12
Upper Denkyira West 0.07523 0.035496 4 0.07125 0.034387 4 0.08191 0.037634 4 0.07264 0.034449 4
ECONOMIC
/SOCIAL
Overcrowding
(household density) 0.50519 0.084311
0.49253 0.121819
0.51901 0.078683
0.51438 0.053262
Ownership 0.49481 0.082578 0.50747 0.125514 0.48099 0.07292 0.48562 0.050284
ENVIRON-
MENTAL
Amount of Open
Space 0.85496 0.134463 0.85878 0.124341 0.85376 0.078453 0.85234 0.202113
Sanitation Facilities 0.14504 0.022811 0.14122 0.020447 0.14624 0.013438 0.14766 0.035013
PHYSICAL
Dwelling Type 0.49465 0.100916 0.49322 0.061777 0.50037 0.148636 0.49051 0.090781
Housing Services /
Infrastructure 0.14139 0.028846 0.14419 0.01806 0.13903 0.0413 0.14095 0.026086
Structural Quality 0.36396 0.074254 0.36259 0.045416 0.36059 0.107115 0.36855 0.068209

171
EASTERN REGION Model 1 Model 2 (Scenario 1) Model 3 (Scenario 2) Model 4 (Scenario 3)
Normalized
By Cluster
Limiting
Priorities Rank
Normalized
By Cluster
Limiting
Priorities Rank
Normalized
By Cluster
Limiting
Priorities Rank
Normalized
By Cluster
Limiting
Priorities Rank
A
L
T
E
R
N
A
T
I
V
E
S
Akwapem North 0.0451 0.021225 13 0.04747 0.022874 13 0.04267 0.019533 13 0.04511 0.021349 13
Akwapem South
Municipal 0.04571 0.021514 9 0.04785 0.023054 9 0.04357 0.019946 9 0.04567 0.021612 9
Akyemansa 0.04071 0.019157 16 0.04483 0.021599 16 0.03615 0.016547 18 0.04113 0.019465 18
Asuogyaman 0.06353 0.029898 3 0.05848 0.028177 3 0.07055 0.032292 3 0.06164 0.02917 3
Atiwa 0.04571 0.021514 10 0.04785 0.023054 10 0.04357 0.019946 10 0.04567 0.021612 10
Birim Municipal 0.04523 0.021285 12 0.04755 0.022912 12 0.04285 0.019616 12 0.04522 0.021403 12
Birim North 0.06353 0.029898 2 0.05848 0.028177 2 0.07055 0.032292 2 0.06164 0.02917 2
Birim South 0.04569 0.021505 11 0.04784 0.023048 11 0.04355 0.019933 11 0.04565 0.021603 11
East Akim
Municipal 0.04622 0.021751 7 0.04816 0.023202 7 0.04431 0.020284 7 0.04612 0.021827 7
Fanteakwa 0.05907 0.0278 4 0.05579 0.02688 4 0.06396 0.029277 4 0.05759 0.027257 4
Kwaebibirem 0.0451 0.021225 14 0.04747 0.022874 14 0.04267 0.019533 14 0.04511 0.021349 14
Kwahu East 0.04613 0.021712 8 0.0481 0.023174 8 0.04422 0.020241 8 0.04604 0.021789 8
Kwahu North 0.05732 0.026978 6 0.05474 0.026377 6 0.06132 0.028069 6 0.05603 0.026515 6
Kwahu South 0.06488 0.030534 1 0.05937 0.028607 1 0.07232 0.033102 1 0.06301 0.029822 1
Kwahu West
Municipal 0.0393 0.018496 19 0.0374 0.018019 19 0.03834 0.017549 16 0.0421 0.019925 16
Lower Manya 0.03857 0.018153 20 0.03703 0.017844 20 0.03701 0.016939 17 0.0416 0.019689 17
New Juaben
Municipal 0.02449 0.011524 21 0.0198 0.009541 21 0.02625 0.012014 21 0.02739 0.012964 21
Suhum-Kraboa
Coaltar 0.03995 0.018801 18 0.04437 0.021377 18 0.03504 0.016039 20 0.04045 0.019141 20
Upper Manya 0.05838 0.027474 5 0.05538 0.026681 5 0.06291 0.028798 5 0.05697 0.026963 5
West Akim
Municipal 0.0451 0.021224 15 0.04747 0.022873 15 0.04267 0.019531 15 0.04511 0.021348 15
Yilo Krobo 0.04028 0.018958 17 0.04457 0.021475 17 0.03553 0.016263 19 0.04075 0.019284 19
ECONOMIC
/SOCIAL
Overcrowding
(household density) 0.54509 0.089631
0.53457 0.131303
0.55353 0.08199
0.55466 0.056312
Ownership 0.45491 0.074801 0.46543 0.11432 0.44647 0.066131 0.44534 0.045214
ENVIRON-
MENTAL
Amount of
Open Space 0.86174 0.135185 0.86427 0.124927 0.86078 0.078803 0.86016 0.203538
Sanitation Facilities 0.13826 0.02169 0.13573 0.019619 0.13922 0.012745 0.13984 0.03309

172
PHYSICAL
Dwelling Type 0.47159 0.098123 0.46871 0.060001 0.47706 0.144354 0.46921 0.088488
Housing Services /
Infrastructure 0.10897 0.022673 0.11047 0.014141 0.10706 0.032396 0.10935 0.020623
Structural Quality 0.41944 0.087273 0.42082 0.053871 0.41587 0.125838 0.42144 0.07948
UPPER EAST REGION Model 1 Model 2 (Scenario 1) Model 3 (Scenario 2) Model 4 (Scenario 3)
Normalized
By Cluster
Limiting
Priorities
Rank
Normalized
By Cluster
Limiting
Priorities
Rank
Normalized
By Cluster
Limiting
Priorities Rank
Normalized
By Cluster
Limiting
Priorities Rank
A
L
T
E
R
N
A
T
I
V
E
S
Bawku Municipal 0.10881 0.051803 9 0.10973 0.053265 9 0.10764 0.050044 9 0.10904 0.052164 9
Bawku West 0.11431 0.054424 2 0.11303 0.054863 2 0.11593 0.053899 2 0.11399 0.054532 2
Bolgatanga
Municipal 0.10988 0.052312 6 0.11037 0.053575 6 0.10925 0.050792 6 0.11 0.052624 6
Bongo 0.11046 0.052589 4 0.11072 0.053744 4 0.11013 0.0512 4 0.11052 0.052874 4
Builsa 0.11431 0.054424 1 0.11303 0.054863 1 0.11593 0.053899 1 0.11399 0.054532 1
Garu Tempane 0.10892 0.051858 8 0.1098 0.053299 8 0.10781 0.050124 8 0.10914 0.052213 8
Kasena Nankana
East 0.11036 0.05254 5 0.11066 0.053714 5 0.10997 0.051127 5 0.11043 0.05283 5
Kasena Nankana
West 0.10898 0.051883 7 0.10983 0.053314 7 0.10789 0.050161 7 0.10919 0.052236 7
Talensi Nabdam 0.11398 0.054266 3 0.11283 0.054767 3 0.11543 0.053666 3 0.11369 0.054389 3
ECONOMIC
/SOCIAL
Overcrowding
(household density) 0.53396 0.093179
0.51432 0.129782
0.55358 0.090081
0.5487 0.060335
Ownership 0.46604 0.081325 0.48568 0.122556 0.44642 0.072643 0.4513 0.049625
ENVIRON-
MENTAL
Amount of Open
Space 0.875 0.138862 0.875 0.127419 0.875 0.081359 0.875 0.209298
Sanitation Facilities 0.125 0.019837 0.125 0.018203 0.125 0.011623 0.125 0.0299
PHYSICAL
Dwelling Type 0.58153 0.110896 0.58208 0.067892 0.58083 0.162275 0.58167 0.100308
Housing Services /
Infrastructure 0.24863 0.047414 0.24781 0.028904 0.24966 0.069752 0.24843 0.042841
Structural Quality 0.16984 0.032388 0.1701 0.01984 0.16951 0.047358 0.16991 0.0293

173
VOLTA REGION Model 1 Model 2 (Scenario 1) Model 3 (Scenario 2) Model 4 (Scenario 3)
Normalized
By Cluster
Limiting
Priorities Rank
Normalized
By Cluster
Limiting
Priorities Rank
Normalized
By Cluster
Limiting
Priorities Rank
Normalized
By Cluster
Limiting
Priorities Rank
A
T
E
R
N
A
T
I
V
E
S
Adaklu Anyigbe 0.05483 0.026448 14 0.05512 0.026972 14 0.05445 0.025809 14 0.0549 0.026578 14
Akatsi 0.05483 0.026448 13 0.05512 0.026972 13 0.05445 0.025809 13 0.0549 0.026578 13
Biakoye 0.05483 0.026448 15 0.05512 0.026972 15 0.05445 0.025809 15 0.0549 0.026578 15
Ho Municipal 0.06116 0.029504 2 0.05891 0.028826 2 0.06399 0.03033 2 0.0606 0.029336 2
Hohoe Municipal 0.05573 0.026883 7 0.05567 0.027237 7 0.0558 0.026448 7 0.05571 0.026971 7
Jasikan 0.05524 0.026646 8 0.05537 0.027092 8 0.05506 0.026099 8 0.05527 0.026757 8
Kadjebi 0.05484 0.026453 11 0.05513 0.026975 11 0.05447 0.025816 11 0.05491 0.026583 11
Keta Municipal 0.06139 0.029612 1 0.05905 0.028892 1 0.06432 0.030489 1 0.0608 0.029434 1
Ketu North 0.06026 0.029069 5 0.05837 0.028561 5 0.06264 0.029691 5 0.05979 0.028943 5
Ketu South 0.04755 0.022938 17 0.05074 0.024827 17 0.04359 0.02066 17 0.04835 0.023405 17
Krachi East 0.05467 0.026372 16 0.05503 0.026925 16 0.05421 0.025697 16 0.05476 0.026509 16
Krachi West 0.05603 0.027028 6 0.05585 0.027325 6 0.05625 0.026661 6 0.05598 0.027102 6
Nkwanta North 0.04235 0.020429 18 0.04763 0.023307 18 0.03574 0.016941 18 0.04367 0.021141 18
Nkwanta South 0.055 0.026529 10 0.05522 0.027021 10 0.0547 0.025928 10 0.05505 0.026651 10
North Dayi 0.06084 0.029348 3 0.05872 0.02873 3 0.0635 0.0301 3 0.06031 0.029195 3
North Tongu 0.05484 0.026453 12 0.05513 0.026974 12 0.05447 0.025816 12 0.05491 0.026582 12
South Dayi 0.0552 0.026629 9 0.05535 0.027082 9 0.05501 0.026074 9 0.05524 0.026741 9
South Tongu 0.06043 0.02915 4 0.05847 0.02861 4 0.06289 0.02981 4 0.05994 0.029016 4
ECONOMIC
/SOCIAL
Overcrowding
(household
density) 0.51309 0.085488
0.50536 0.125431
0.52125 0.078573
0.51931 0.05301
Ownership 0.48691 0.081125 0.49464 0.122769 0.47875 0.072166 0.48069 0.049067
ENVIRON-
MENTAL
Amount of Open
Space 0.875 0.140697 0.875 0.128441 0.875 0.082948 0.875 0.211794
Sanitation
Facilities 0.125 0.0201 0.125 0.018349 0.125 0.01185 0.125 0.030256
PHYSICAL
Dwelling Type 0.66021 0.125573 0.66076 0.076458 0.65949 0.18497 0.66035 0.11343
Housing Services /
Infrastructure 0.09174 0.01745 0.09205 0.010651 0.09137 0.025626 0.09182 0.015772
Structural Quality 0.24805 0.047179 0.24719 0.028603 0.24915 0.06988 0.24783 0.042571
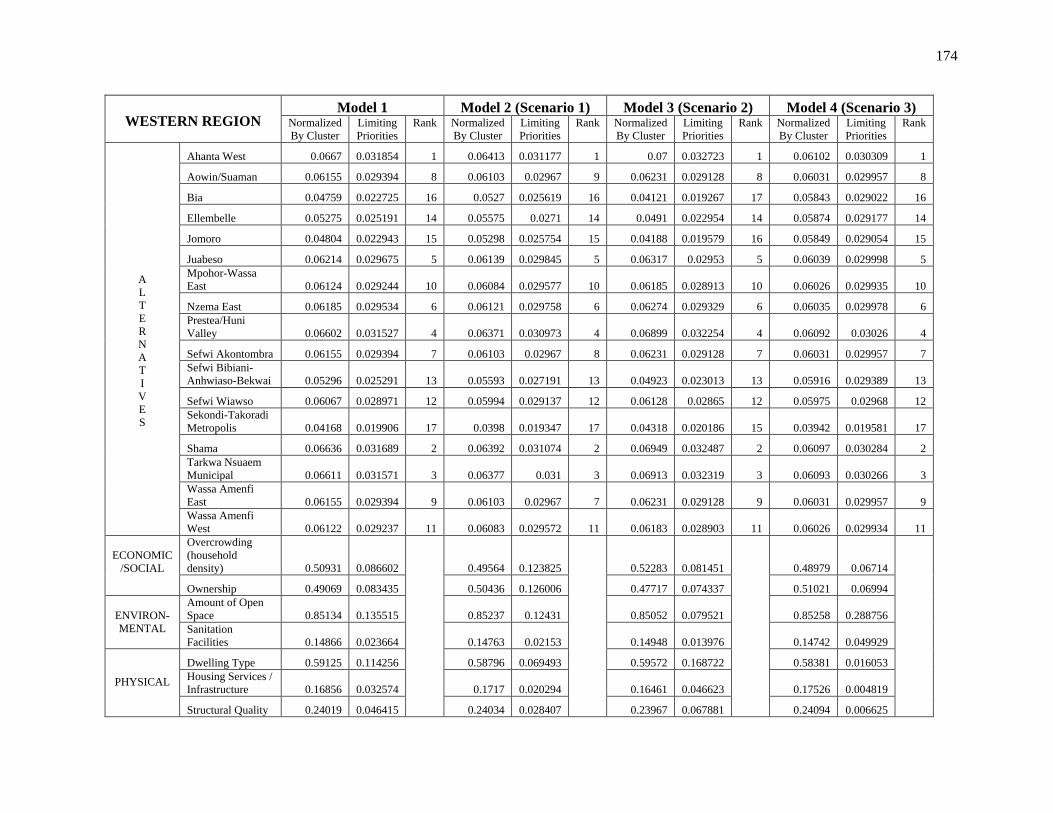
174
WESTERN REGION Model 1 Model 2 (Scenario 1) Model 3 (Scenario 2) Model 4 (Scenario 3)
Normalized
By Cluster
Limiting
Priorities
Rank
Normalized
By Cluster
Limiting
Priorities
Rank
Normalized
By Cluster
Limiting
Priorities
Rank
Normalized
By Cluster
Limiting
Priorities
Rank
A
L
T
E
R
N
A
T
I
V
E
S
Ahanta West 0.0667 0.031854 1 0.06413 0.031177 1 0.07 0.032723 1 0.06102 0.030309 1
Aowin/Suaman 0.06155 0.029394 8 0.06103 0.02967 9 0.06231 0.029128 8 0.06031 0.029957 8
Bia 0.04759 0.022725 16 0.0527 0.025619 16 0.04121 0.019267 17 0.05843 0.029022 16
Ellembelle 0.05275 0.025191 14 0.05575 0.0271 14 0.0491 0.022954 14 0.05874 0.029177 14
Jomoro 0.04804 0.022943 15 0.05298 0.025754 15 0.04188 0.019579 16 0.05849 0.029054 15
Juabeso 0.06214 0.029675 5 0.06139 0.029845 5 0.06317 0.02953 5 0.06039 0.029998 5
Mpohor-Wassa
East 0.06124 0.029244 10 0.06084 0.029577 10 0.06185 0.028913 10 0.06026 0.029935 10
Nzema East 0.06185 0.029534 6 0.06121 0.029758 6 0.06274 0.029329 6 0.06035 0.029978 6
Prestea/Huni
Valley 0.06602 0.031527 4 0.06371 0.030973 4 0.06899 0.032254 4 0.06092 0.03026 4
Sefwi Akontombra 0.06155 0.029394 7 0.06103 0.02967 8 0.06231 0.029128 7 0.06031 0.029957 7
Sefwi Bibiani-
Anhwiaso-Bekwai 0.05296 0.025291 13 0.05593 0.027191 13 0.04923 0.023013 13 0.05916 0.029389 13
Sefwi Wiawso 0.06067 0.028971 12 0.05994 0.029137 12 0.06128 0.02865 12 0.05975 0.02968 12
Sekondi-Takoradi
Metropolis 0.04168 0.019906 17 0.0398 0.019347 17 0.04318 0.020186 15 0.03942 0.019581 17
Shama 0.06636 0.031689 2 0.06392 0.031074 2 0.06949 0.032487 2 0.06097 0.030284 2
Tarkwa Nsuaem
Municipal 0.06611 0.031571 3 0.06377 0.031 3 0.06913 0.032319 3 0.06093 0.030266 3
Wassa Amenfi
East 0.06155 0.029394 9 0.06103 0.02967 7 0.06231 0.029128 9 0.06031 0.029957 9
Wassa Amenfi
West 0.06122 0.029237 11 0.06083 0.029572 11 0.06183 0.028903 11 0.06026 0.029934 11
ECONOMIC
/SOCIAL
Overcrowding
(household
density) 0.50931 0.086602
0.49564 0.123825
0.52283 0.081451
0.48979 0.06714
Ownership 0.49069 0.083435 0.50436 0.126006 0.47717 0.074337 0.51021 0.06994
ENVIRON-
MENTAL
Amount of Open
Space 0.85134 0.135515 0.85237 0.12431 0.85052 0.079521 0.85258 0.288756
Sanitation
Facilities 0.14866 0.023664 0.14763 0.02153 0.14948 0.013976 0.14742 0.049929
PHYSICAL
Dwelling Type 0.59125 0.114256 0.58796 0.069493 0.59572 0.168722 0.58381 0.016053
Housing Services /
Infrastructure 0.16856 0.032574 0.1717 0.020294 0.16461 0.046623 0.17526 0.004819
Structural Quality 0.24019 0.046415 0.24034 0.028407 0.23967 0.067881 0.24094 0.006625

175
NORTHERN REGION Model 1 Model 2 (Scenario 1) Model 3 (Scenario 2) Model 4 (Scenario 3)
Normalized
By Cluster
Limiting
Priorities Rank
Normalized
By Cluster
Limiting
Priorities Rank
Normalized
By Cluster
Limiting
Priorities Rank
Normalized
By Cluster
Limiting
Priorities Rank
A
L
T
E
R
N
A
T
I
V
E
S
Bole 0.0748 0.035838 2 0.06473 0.031534 2 0.0877 0.0412 2 0.0721 0.034681 2
Bunkpurugu-
Yunyoo 0.04599 0.022034 5 0.04753 0.023153 5 0.04417 0.02075 5 0.04623 0.022237 5
Chereponi 0.04592 0.022001 6 0.04749 0.023133 6 0.04407 0.020703 6 0.04617 0.022208 6
East Gonja 0.04384 0.021007 20 0.04622 0.022518 20 0.04101 0.019267 20 0.04429 0.021306 20
Gonja Central 0.07463 0.03576 3 0.06463 0.031486 3 0.08746 0.041087 3 0.07195 0.03461 3
Gushiegu 0.044 0.02108 18 0.04632 0.022563 18 0.04124 0.019373 18 0.04443 0.021373 18
Karaga 0.04441 0.021276 12 0.04657 0.022684 12 0.04184 0.019656 12 0.0448 0.021551 12
Kpandai 0.0443 0.021224 14 0.0465 0.022652 14 0.04168 0.019581 14 0.0447 0.021503 14
Mamprusi East 0.04487 0.021499 7 0.04685 0.022822 7 0.04252 0.019977 7 0.04522 0.021752 7
Mamprusi West 0.04441 0.021276 13 0.04657 0.022684 13 0.04184 0.019656 13 0.0448 0.021551 13
Nanumba North 0.044 0.02108 19 0.04632 0.022563 19 0.04124 0.019373 19 0.04443 0.021373 19
Nanumba South 0.04483 0.02148 9 0.04682 0.02281 9 0.04246 0.01995 9 0.04518 0.021735 9
Saboba Chereponi 0.04483 0.02148 8 0.04682 0.02281 8 0.04246 0.01995 8 0.04518 0.021735 8
Savelugu-Nanton 0.04441 0.021276 11 0.04657 0.022684 11 0.04184 0.019656 11 0.0448 0.021551 11
Sawla-Tuna-Kalba 0.07673 0.036765 1 0.06591 0.032108 1 0.09055 0.042539 1 0.07384 0.035521 1
Tamale Metropolis 0.06133 0.029387 4 0.05845 0.028473 4 0.06192 0.02909 4 0.0635 0.030547 4
Tolon-Kumbugu 0.04401 0.021085 17 0.04632 0.022566 17 0.04125 0.01938 17 0.04444 0.021377 17
West Gonja 0.04401 0.021085 16 0.04632 0.022566 16 0.04125 0.01938 16 0.04444 0.021377 16
Yendi Municipal 0.04401 0.021085 15 0.04632 0.022566 15 0.04125 0.01938 15 0.04444 0.021377 15
Zabzugu-Tatale 0.0447 0.021415 10 0.04674 0.02277 10 0.04226 0.019856 10 0.04506 0.021676 10
ECONOMIC
/SOCIAL
Overcrowding
(household
density) 0.52472 0.089717
0.51044 0.127888
0.53883 0.084713
0.53601 0.057046
Ownership 0.47528 0.081265 0.48956 0.122658 0.46117 0.072505 0.46399 0.049381
ENVIRON-
MENTAL
Amount of Open
Space 0.8704 0.139013 0.87061 0.127235 0.87036 0.081779 0.87024 0.20931
Sanitation
Facilities 0.1296 0.020699 0.12939 0.018909 0.12964 0.012181 0.12976 0.031211
PHYSICAL
Dwelling Type 0.62042 0.117985 0.61743 0.071722 0.62542 0.174506 0.61854 0.106395
Housing Services /
Infrastructure 0.17779 0.03381 0.18008 0.020919 0.17501 0.048831 0.17822 0.030656
Structural Quality 0.20179 0.038375 0.20249 0.023522 0.19957 0.055683 0.20324 0.03496

176
UPPER WEST
REGION
Model 1 Model 2 (Scenario 1) Model 3 (Scenario 2) Model 4 (Scenario 3)
Normalized
By Cluster
Limiting
Priorities Rank
Normalized
By Cluster
Limiting
Priorities Rank
Normalized
By Cluster
Limiting
Priorities Rank
Normalized
By Cluster
Limiting
Priorities Rank
A
L
T
E
R
N
A
T
I
V
E
S
Jirapa 0.13673 0.064978 3 0.12631 0.061208 3 0.1501 0.069718 3 0.1341 0.064034 3
Lambussie /Karni 0.09309 0.044241 8 0.10033 0.04862 8 0.08398 0.039008 8 0.09491 0.045319 8
Lawra 0.09678 0.045995 6 0.10258 0.049711 6 0.08939 0.041523 6 0.09824 0.046911 6
Nadowli 0.09678 0.045995 5 0.10258 0.049711 5 0.08939 0.041523 5 0.09824 0.046911 5
Sissala East 0.09235 0.043888 9 0.09988 0.0484 9 0.08289 0.038502 9 0.09424 0.044998 9
Sissala West 0.09322 0.0443 7 0.10041 0.048657 7 0.08417 0.039094 7 0.09502 0.045373 7
Wa East 0.14042 0.066731 1 0.12856 0.0623 1 0.15551 0.072234 1 0.13744 0.065627 1
Wa Municipal 0.1102 0.052371 4 0.11077 0.053679 4 0.10905 0.050655 4 0.11037 0.052703 4
Wa West 0.14042 0.066731 2 0.12856 0.0623 2 0.15551 0.072234 2 0.13744 0.065627 2
ECONOMIC
/SOCIAL
Overcrowding
(household
density) 0.53324 0.092687
0.51427 0.129536
0.55133 0.08901
0.54793 0.059995
Ownership 0.46676 0.081131 0.48573 0.122345 0.44867 0.072436 0.45207 0.049499
ENVIRON-
MENTAL
Amount of
Open Space 0.875 0.138609 0.875 0.127204 0.875 0.081286 0.875 0.208908
Sanitation
Facilities 0.125 0.019801 0.125 0.018172 0.125 0.011612 0.125 0.029844
PHYSICAL
Dwelling Type 0.56543 0.108869 0.55933 0.066089 0.57343 0.161228 0.56388 0.098257
Housing Services
/ Infrastructure 0.24008 0.046225 0.24343 0.028763 0.23579 0.066296 0.24092 0.041981
Structural Quality 0.1945 0.037449 0.19724 0.023305 0.19078 0.053641 0.1952 0.034014

177
Appendix III: Unweighted Supermatrix
ASHANTI
REGION (A)
ALTERNATIVES
Adansi
North
Adansi
South
Afigya
Kwabre
Afigya
Sekyere
Ahafo
Ano
North
Ahafo
Ano
South
Amansie
Central
Amansie
West
Asante
Akim
North
Municipal
Asante
Akim
South
Atwima
Kwanwoma
Atwima
Mponua
Atwima
Nwabiagya
Bekwai
Municipal
Bosome
Freho Bosumtwi
Ejisu
Juaben
Municipal
A
L
T
E
R
N
A
T
I
V
E
S
Adansi
North 0.000 0.000 0.000 0.000 0.000 0.000 0.000 0.000 0.000 0.000 0.000 0.000 0.000 0.000 0.000 0.000 0.000
Adansi
South 0.000 0.000 0.000 0.000 0.000 0.000 0.000 0.000 0.000 0.000 0.000 0.000 0.000 0.000 0.000 0.000 0.000
Afigya
Kwabre 0.000 0.000 0.000 0.000 0.000 0.000 0.000 0.000 0.000 0.000 0.000 0.000 0.000 0.000 0.000 0.000 0.000
Afigya
Sekyere 0.000 0.000 0.000 0.000 0.000 0.000 0.000 0.000 0.000 0.000 0.000 0.000 0.000 0.000 0.000 0.000 0.000
Ahafo Ano
North 0.000 0.000 0.000 0.000 0.000 0.000 0.000 0.000 0.000 0.000 0.000 0.000 0.000 0.000 0.000 0.000 0.000
Ahafo Ano
South 0.000 0.000 0.000 0.000 0.000 0.000 0.000 0.000 0.000 0.000 0.000 0.000 0.000 0.000 0.000 0.000 0.000
Amansie
Central 0.000 0.000 0.000 0.000 0.000 0.000 0.000 0.000 0.000 0.000 0.000 0.000 0.000 0.000 0.000 0.000 0.000
Amansie
West 0.000 0.000 0.000 0.000 0.000 0.000 0.000 0.000 0.000 0.000 0.000 0.000 0.000 0.000 0.000 0.000 0.000
Asante
Akim North
Municipal 0.000 0.000 0.000 0.000 0.000 0.000 0.000 0.000 0.000 0.000 0.000 0.000 0.000 0.000 0.000 0.000 0.000
Asante
Akim South 0.000 0.000 0.000 0.000 0.000 0.000 0.000 0.000 0.000 0.000 0.000 0.000 0.000 0.000 0.000 0.000 0.000
Atwima
Kwanwoma 0.000 0.000 0.000 0.000 0.000 0.000 0.000 0.000 0.000 0.000 0.000 0.000 0.000 0.000 0.000 0.000 0.000
Atwima
Mponua 0.000 0.000 0.000 0.000 0.000 0.000 0.000 0.000 0.000 0.000 0.000 0.000 0.000 0.000 0.000 0.000 0.000
Atwima
Nwabiagya 0.000 0.000 0.000 0.000 0.000 0.000 0.000 0.000 0.000 0.000 0.000 0.000 0.000 0.000 0.000 0.000 0.000
Bekwai
Municipal 0.000 0.000 0.000 0.000 0.000 0.000 0.000 0.000 0.000 0.000 0.000 0.000 0.000 0.000 0.000 0.000 0.000
Bosome
Freho 0.000 0.000 0.000 0.000 0.000 0.000 0.000 0.000 0.000 0.000 0.000 0.000 0.000 0.000 0.000 0.000 0.000
Bosumtwi 0.000 0.000 0.000 0.000 0.000 0.000 0.000 0.000 0.000 0.000 0.000 0.000 0.000 0.000 0.000 0.000 0.000
Ejisu
Juaben
Municipal 0.000 0.000 0.000 0.000 0.000 0.000 0.000 0.000 0.000 0.000 0.000 0.000 0.000 0.000 0.000 0.000 0.000
Ejura Sekye
Dumasi 0.000 0.000 0.000 0.000 0.000 0.000 0.000 0.000 0.000 0.000 0.000 0.000 0.000 0.000 0.000 0.000 0.000
Kumasi
Metropolis 0.000 0.000 0.000 0.000 0.000 0.000 0.000 0.000 0.000 0.000 0.000 0.000 0.000 0.000 0.000 0.000 0.000
Kwabre
East 0.000 0.000 0.000 0.000 0.000 0.000 0.000 0.000 0.000 0.000 0.000 0.000 0.000 0.000 0.000 0.000 0.000
Mampong
Municipal 0.000 0.000 0.000 0.000 0.000 0.000 0.000 0.000 0.000 0.000 0.000 0.000 0.000 0.000 0.000 0.000 0.000
Obuasi
Municipal 0.000 0.000 0.000 0.000 0.000 0.000 0.000 0.000 0.000 0.000 0.000 0.000 0.000 0.000 0.000 0.000 0.000

178
Offinso
Municipal 0.000 0.000 0.000 0.000 0.000 0.000 0.000 0.000 0.000 0.000 0.000 0.000 0.000 0.000 0.000 0.000 0.000
Offinso
North 0.000 0.000 0.000 0.000 0.000 0.000 0.000 0.000 0.000 0.000 0.000 0.000 0.000 0.000 0.000 0.000 0.000
Sekyere
Afram
Plains 0.000 0.000 0.000 0.000 0.000 0.000 0.000 0.000 0.000 0.000 0.000 0.000 0.000 0.000 0.000 0.000 0.000
Sekyere
Central 0.000 0.000 0.000 0.000 0.000 0.000 0.000 0.000 0.000 0.000 0.000 0.000 0.000 0.000 0.000 0.000 0.000
Sekyere
East 0.000 0.000 0.000 0.000 0.000 0.000 0.000 0.000 0.000 0.000 0.000 0.000 0.000 0.000 0.000 0.000 0.000
Economic
/ Social
Crowding
(household
density) 0.500 0.500 0.500 0.500 0.500 0.500 0.500 0.500 0.500 0.500 0.500 0.500 0.125 0.500 0.500 0.500 0.500
Ownership 0.500 0.500 0.500 0.500 0.500 0.500 0.500 0.500 0.500 0.500 0.500 0.500 0.875 0.500 0.500 0.500 0.500
Environ-
mental
Amount of
open space 0.875 0.875 0.875 0.875 0.875 0.875 0.875 0.875 0.875 0.875 0.875 0.875 0.875 0.875 0.875 0.875 0.875
Sanitation
Facilities 0.125 0.125 0.125 0.125 0.125 0.125 0.125 0.125 0.125 0.125 0.125 0.125 0.125 0.125 0.125 0.125 0.125
Physical
Dwelling
type 0.731 0.745 0.179 0.172 0.630 0.630 0.758 0.758 0.172 0.769 0.179 0.594 0.179 0.113 0.731 0.172 0.172
Housing
Services 0.188 0.156 0.113 0.102 0.218 0.218 0.151 0.151 0.102 0.147 0.113 0.249 0.113 0.179 0.188 0.102 0.102
Structural
Adequacy 0.081 0.099 0.709 0.726 0.151 0.151 0.091 0.091 0.726 0.084 0.709 0.157 0.709 0.709 0.081 0.726 0.726
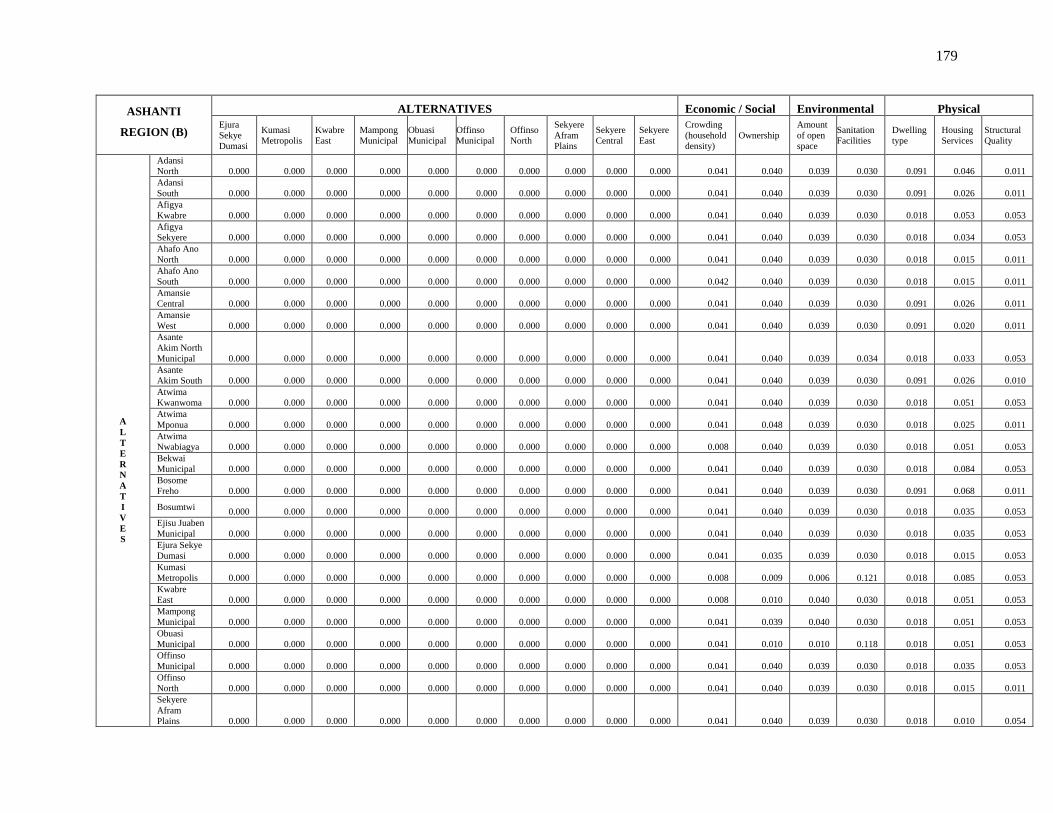
179
ASHANTI
REGION (B)
ALTERNATIVES Economic / Social Environmental Physical
Ejura
Sekye
Dumasi
Kumasi
Metropolis
Kwabre
East
Mampong
Municipal
Obuasi
Municipal
Offinso
Municipal
Offinso
North
Sekyere
Afram
Plains
Sekyere
Central
Sekyere
East
Crowding
(household
density)
Ownership
Amount
of open
space
Sanitation
Facilities
Dwelling
type
Housing
Services
Structural
Quality
A
L
T
E
R
N
A
T
I
V
E
S
Adansi
North 0.000 0.000 0.000 0.000 0.000 0.000 0.000 0.000 0.000 0.000 0.041 0.040 0.039 0.030 0.091 0.046 0.011
Adansi
South 0.000 0.000 0.000 0.000 0.000 0.000 0.000 0.000 0.000 0.000 0.041 0.040 0.039 0.030 0.091 0.026 0.011
Afigya
Kwabre 0.000 0.000 0.000 0.000 0.000 0.000 0.000 0.000 0.000 0.000 0.041 0.040 0.039 0.030 0.018 0.053 0.053
Afigya
Sekyere 0.000 0.000 0.000 0.000 0.000 0.000 0.000 0.000 0.000 0.000 0.041 0.040 0.039 0.030 0.018 0.034 0.053
Ahafo Ano
North 0.000 0.000 0.000 0.000 0.000 0.000 0.000 0.000 0.000 0.000 0.041 0.040 0.039 0.030 0.018 0.015 0.011
Ahafo Ano
South 0.000 0.000 0.000 0.000 0.000 0.000 0.000 0.000 0.000 0.000 0.042 0.040 0.039 0.030 0.018 0.015 0.011
Amansie
Central 0.000 0.000 0.000 0.000 0.000 0.000 0.000 0.000 0.000 0.000 0.041 0.040 0.039 0.030 0.091 0.026 0.011
Amansie
West 0.000 0.000 0.000 0.000 0.000 0.000 0.000 0.000 0.000 0.000 0.041 0.040 0.039 0.030 0.091 0.020 0.011
Asante
Akim North
Municipal 0.000 0.000 0.000 0.000 0.000 0.000 0.000 0.000 0.000 0.000 0.041 0.040 0.039 0.034 0.018 0.033 0.053
Asante
Akim South 0.000 0.000 0.000 0.000 0.000 0.000 0.000 0.000 0.000 0.000 0.041 0.040 0.039 0.030 0.091 0.026 0.010
Atwima
Kwanwoma 0.000 0.000 0.000 0.000 0.000 0.000 0.000 0.000 0.000 0.000 0.041 0.040 0.039 0.030 0.018 0.051 0.053
Atwima
Mponua 0.000 0.000 0.000 0.000 0.000 0.000 0.000 0.000 0.000 0.000 0.041 0.048 0.039 0.030 0.018 0.025 0.011
Atwima
Nwabiagya 0.000 0.000 0.000 0.000 0.000 0.000 0.000 0.000 0.000 0.000 0.008 0.040 0.039 0.030 0.018 0.051 0.053
Bekwai
Municipal 0.000 0.000 0.000 0.000 0.000 0.000 0.000 0.000 0.000 0.000 0.041 0.040 0.039 0.030 0.018 0.084 0.053
Bosome
Freho 0.000 0.000 0.000 0.000 0.000 0.000 0.000 0.000 0.000 0.000 0.041 0.040 0.039 0.030 0.091 0.068 0.011
Bosumtwi 0.000 0.000 0.000 0.000 0.000 0.000 0.000 0.000 0.000 0.000 0.041 0.040 0.039 0.030 0.018 0.035 0.053
Ejisu Juaben
Municipal 0.000 0.000 0.000 0.000 0.000 0.000 0.000 0.000 0.000 0.000 0.041 0.040 0.039 0.030 0.018 0.035 0.053
Ejura Sekye
Dumasi 0.000 0.000 0.000 0.000 0.000 0.000 0.000 0.000 0.000 0.000 0.041 0.035 0.039 0.030 0.018 0.015 0.053
Kumasi
Metropolis 0.000 0.000 0.000 0.000 0.000 0.000 0.000 0.000 0.000 0.000 0.008 0.009 0.006 0.121 0.018 0.085 0.053
Kwabre
East 0.000 0.000 0.000 0.000 0.000 0.000 0.000 0.000 0.000 0.000 0.008 0.010 0.040 0.030 0.018 0.051 0.053
Mampong
Municipal 0.000 0.000 0.000 0.000 0.000 0.000 0.000 0.000 0.000 0.000 0.041 0.039 0.040 0.030 0.018 0.051 0.053
Obuasi
Municipal 0.000 0.000 0.000 0.000 0.000 0.000 0.000 0.000 0.000 0.000 0.041 0.010 0.010 0.118 0.018 0.051 0.053
Offinso
Municipal 0.000 0.000 0.000 0.000 0.000 0.000 0.000 0.000 0.000 0.000 0.041 0.040 0.039 0.030 0.018 0.035 0.053
Offinso
North 0.000 0.000 0.000 0.000 0.000 0.000 0.000 0.000 0.000 0.000 0.041 0.040 0.039 0.030 0.018 0.015 0.011
Sekyere
Afram
Plains 0.000 0.000 0.000 0.000 0.000 0.000 0.000 0.000 0.000 0.000 0.041 0.040 0.039 0.030 0.018 0.010 0.054

180
Sekyere
Central 0.000 0.000 0.000 0.000 0.000 0.000 0.000 0.000 0.000 0.000 0.041 0.040 0.039 0.030 0.091 0.011 0.053
Sekyere
East 0.000 0.000 0.000 0.000 0.000 0.000 0.000 0.000 0.000 0.000 0.041 0.040 0.039 0.030 0.018 0.036 0.053
Economic
/ Social
Crowding
(household
density) 0.500 0.500 0.500 0.500 0.875 0.500 0.500 0.500 0.500 0.500 0.000 0.000 0.000 0.000 0.000 0.875 0.000
Ownership 0.500 0.500 0.500 0.500 0.125 0.500 0.500 0.500 0.500 0.500 0.000 0.000 0.000 0.000 0.000 0.125 0.000
Environ-
mental
Amount of
open space 0.875 0.143 0.875 0.875 0.333 0.875 0.875 0.875 0.875 0.875 0.000 0.000 0.000 0.000 0.000 0.000 0.000
Sanitation
Facilities 0.125 0.857 0.125 0.125 0.667 0.125 0.125 0.125 0.125 0.125 0.000 0.000 0.000 0.000 0.000 0.000 0.000
Physical
Dwelling
type 0.205 0.113 0.179 0.179 0.179 0.172 0.625 0.199 0.471 0.172 0.000 0.000 0.000 0.000 0.000 0.751 0.751
Housing
Services 0.073 0.179 0.113 0.113 0.113 0.102 0.137 0.068 0.059 0.102 0.000 0.000 0.000 0.000 0.000 0.205 0.044
Structural
Quality 0.722 0.709 0.709 0.709 0.709 0.726 0.238 0.733 0.471 0.726 0.000 0.000 0.000 0.000 0.000 0.044 0.205

181
BRONG
AHAFO (A)
ALTERNATIVES
Asunafo
North
Municipal
Asunafo
South Asutifi
Atebubu
Amantin
Berekum
Municipal
Dormaa
East
Dormaa
Municipal
Jaman
North
Jaman
South
Kintampo
North
Municipal
Kintampo
South
Nkoranza
North
Nkoranza
South Pru Sene
Sunyani
Municipal
A
T
E
R
N
A
T
I
V
E
S
Asunafo
North
Municipal 0.000 0.000 0.000 0.000 0.000 0.000 0.000 0.000 0.000 0.000 0.000 0.000 0.000 0.000 0.000 0.000
Asunafo
South 0.000 0.000 0.000 0.000 0.000 0.000 0.000 0.000 0.000 0.000 0.000 0.000 0.000 0.000 0.000 0.000
Asutifi 0.000 0.000 0.000 0.000 0.000 0.000 0.000 0.000 0.000 0.000 0.000 0.000 0.000 0.000 0.000 0.000
Atebubu
Amantin 0.000 0.000 0.000 0.000 0.000 0.000 0.000 0.000 0.000 0.000 0.000 0.000 0.000 0.000 0.000 0.000
Berekum
Municipal 0.000 0.000 0.000 0.000 0.000 0.000 0.000 0.000 0.000 0.000 0.000 0.000 0.000 0.000 0.000 0.000
Dormaa
East 0.000 0.000 0.000 0.000 0.000 0.000 0.000 0.000 0.000 0.000 0.000 0.000 0.000 0.000 0.000 0.000
Dormaa
Municipal 0.000 0.000 0.000 0.000 0.000 0.000 0.000 0.000 0.000 0.000 0.000 0.000 0.000 0.000 0.000 0.000
Jaman
North 0.000 0.000 0.000 0.000 0.000 0.000 0.000 0.000 0.000 0.000 0.000 0.000 0.000 0.000 0.000 0.000
Jaman
South 0.000 0.000 0.000 0.000 0.000 0.000 0.000 0.000 0.000 0.000 0.000 0.000 0.000 0.000 0.000 0.000
Kintampo
North
Municipal 0.000 0.000 0.000 0.000 0.000 0.000 0.000 0.000 0.000 0.000 0.000 0.000 0.000 0.000 0.000 0.000
Kintampo
South 0.000 0.000 0.000 0.000 0.000 0.000 0.000 0.000 0.000 0.000 0.000 0.000 0.000 0.000 0.000 0.000
Nkoranza
North 0.000 0.000 0.000 0.000 0.000 0.000 0.000 0.000 0.000 0.000 0.000 0.000 0.000 0.000 0.000 0.000
Nkoranza
South 0.000 0.000 0.000 0.000 0.000 0.000 0.000 0.000 0.000 0.000 0.000 0.000 0.000 0.000 0.000 0.000
Pru 0.000 0.000 0.000 0.000 0.000 0.000 0.000 0.000 0.000 0.000 0.000 0.000 0.000 0.000 0.000 0.000
Sene 0.000 0.000 0.000 0.000 0.000 0.000 0.000 0.000 0.000 0.000 0.000 0.000 0.000 0.000 0.000 0.000
Sunyani
Municipal 0.000 0.000 0.000 0.000 0.000 0.000 0.000 0.000 0.000 0.000 0.000 0.000 0.000 0.000 0.000 0.000
Sunyani
West 0.000 0.000 0.000 0.000 0.000 0.000 0.000 0.000 0.000 0.000 0.000 0.000 0.000 0.000 0.000 0.000
Tain 0.000 0.000 0.000 0.000 0.000 0.000 0.000 0.000 0.000 0.000 0.000 0.000 0.000 0.000 0.000 0.000
Tano North 0.000 0.000 0.000 0.000 0.000 0.000 0.000 0.000 0.000 0.000 0.000 0.000 0.000 0.000 0.000 0.000
Tano South 0.000 0.000 0.000 0.000 0.000 0.000 0.000 0.000 0.000 0.000 0.000 0.000 0.000 0.000 0.000 0.000
Techiman
Municipal 0.000 0.000 0.000 0.000 0.000 0.000 0.000 0.000 0.000 0.000 0.000 0.000 0.000 0.000 0.000 0.000
Wenchi
Municipal 0.000 0.000 0.000 0.000 0.000 0.000 0.000 0.000 0.000 0.000 0.000 0.000 0.000 0.000 0.000 0.000
Economic
/ Social
Crowding
(household
density) 0.500 0.500 0.500 0.500 0.875 0.500 0.500 0.500 0.500 0.500 0.500 0.500 0.500 0.500 0.500 0.500
Ownership 0.500 0.500 0.500 0.500 0.125 0.500 0.500 0.500 0.500 0.500 0.500 0.500 0.500 0.500 0.500 0.500

182
Environ-
mental
Amount of
open space 0.833 0.875 0.875 0.875 0.875 0.875 0.875 0.875 0.875 0.875 0.875 0.875 0.875 0.875 0.875 0.800
Sanitation
Facilities 0.167 0.125 0.125 0.125 0.125 0.125 0.125 0.125 0.125 0.125 0.125 0.125 0.125 0.125 0.125 0.200
Physical
Dwelling
type 0.630 0.540 0.600 0.625 0.172 0.455 0.731 0.167 0.333 0.205 0.614 0.758 0.462 0.630 0.773 0.113
Housing
Services 0.218 0.297 0.200 0.137 0.102 0.091 0.188 0.094 0.528 0.073 0.117 0.151 0.077 0.218 0.139 0.179
Structural
Quality 0.151 0.163 0.200 0.238 0.726 0.455 0.081 0.740 0.140 0.722 0.268 0.091 0.462 0.151 0.088 0.709

183
BRONG
AHAFO (B)
Economic / Social Environmental Physical
Crowding
(household density) Ownership
Amount of
open space
Sanitation
Facilities
Dwelling
type
Housing
Services
Structural
Quality
A
L
T
E
R
N
A
T
I
V
E
S
Asunafo North Municipal 0.047 0.049 0.045 0.040 0.022 0.019 0.011
Asunafo South 0.047 0.049 0.045 0.040 0.022 0.044 0.011
Asutifi 0.047 0.049 0.045 0.040 0.022 0.029 0.011
Atebubu Amantin 0.047 0.049 0.045 0.040 0.022 0.019 0.011
Berekum Municipal 0.047 0.007 0.045 0.040 0.022 0.051 0.080
Dormaa East 0.047 0.049 0.045 0.040 0.109 0.100 0.080
Dormaa Municipal 0.047 0.049 0.045 0.040 0.109 0.100 0.011
Jaman North 0.047 0.049 0.045 0.040 0.022 0.029 0.080
Jaman South 0.047 0.049 0.045 0.040 0.022 0.100 0.011
Kintampo North Municipal 0.047 0.049 0.045 0.040 0.022 0.019 0.080
Kintampo South 0.047 0.049 0.045 0.040 0.022 0.013 0.011
Nkoranza North 0.047 0.049 0.045 0.040 0.109 0.033 0.011
Nkoranza South 0.047 0.049 0.045 0.040 0.109 0.033 0.080
Pru 0.047 0.049 0.045 0.040 0.022 0.019 0.011
Sene 0.045 0.049 0.045 0.040 0.109 0.019 0.011
Sunyani Municipal 0.008 0.007 0.045 0.154 0.022 0.100 0.080
Sunyani West 0.047 0.049 0.045 0.040 0.022 0.051 0.080
Tain 0.047 0.049 0.045 0.040 0.109 0.019 0.011
Tano North 0.047 0.049 0.045 0.040 0.022 0.051 0.080
Tano South 0.047 0.049 0.045 0.040 0.022 0.051 0.080
Techiman Municipal 0.047 0.049 0.045 0.040 0.022 0.072 0.080
Wenchi Municipal 0.047 0.049 0.045 0.045 0.022 0.033 0.080
Economic /
Social
Crowding (household density) 0.000 0.000 0.000 0.000 0.000 0.875 0.000
Ownership 0.000 0.000 0.000 0.000 0.000 0.125 0.000
Environmental
Amount of open space 0.000 0.000 0.000 0.000 0.000 0.000 0.000
Sanitation Facilities 0.000 0.000 0.000 0.000 0.000 0.000 0.000
Physical
Dwelling type 0.000 0.000 0.000 0.000 0.000 0.751 0.751
Housing Services 0.000 0.000 0.000 0.000 0.000 0.205 0.044
Structural Quality 0.000 0.000 0.000 0.000 0.000 0.044 0.205

184
CENTRAL
REGION (A)
ALTERNATIVES
Abura-
Asebu-
Kwamankese
Agona
East
Agona
West
Municipal
Ajumako-
Enyan-
Essiam
Asikuma-
Odoben
Brakwa
Assin
North
Municipal
Assin
South
Cape
Coast
Metropolis
Effutu
Municipal
Ewutu
Senya
Gomoa
East
Gomoa
West
Komenda-
Edina-
Egyafo-
Abirem
Mfantsiman
Municipal
Twifo-
Heman-
Lower
Denkyira
Upper
Denkyira
East
Municipal
Upper
Denkyira
West
A
L
T
E
R
N
A
T
I
V
E
S
Abura-Asebu-
Kwamankese 0.000 0.000 0.000 0.000 0.000 0.000 0.000 0.000 0.000 0.000 0.000 0.000 0.000 0.000 0.000 0.000 0.000
Agona East 0.000 0.000 0.000 0.000 0.000 0.000 0.000 0.000 0.000 0.000 0.000 0.000 0.000 0.000 0.000 0.000 0.000
Agona West
Municipal 0.000 0.000 0.000 0.000 0.000 0.000 0.000 0.000 0.000 0.000 0.000 0.000 0.000 0.000 0.000 0.000 0.000
Ajumako-
Enyan-Essiam 0.000 0.000 0.000 0.000 0.000 0.000 0.000 0.000 0.000 0.000 0.000 0.000 0.000 0.000 0.000 0.000 0.000
Asikuma-
Odoben Brakwa 0.000 0.000 0.000 0.000 0.000 0.000 0.000 0.000 0.000 0.000 0.000 0.000 0.000 0.000 0.000 0.000 0.000
Assin North
Municipal 0.000 0.000 0.000 0.000 0.000 0.000 0.000 0.000 0.000 0.000 0.000 0.000 0.000 0.000 0.000 0.000 0.000
Assin South 0.000 0.000 0.000 0.000 0.000 0.000 0.000 0.000 0.000 0.000 0.000 0.000 0.000 0.000 0.000 0.000 0.000
Cape Coast
Metropolis 0.000 0.000 0.000 0.000 0.000 0.000 0.000 0.000 0.000 0.000 0.000 0.000 0.000 0.000 0.000 0.000 0.000
Effutu
Municipal 0.000 0.000 0.000 0.000 0.000 0.000 0.000 0.000 0.000 0.000 0.000 0.000 0.000 0.000 0.000 0.000 0.000
Ewutu Senya 0.000 0.000 0.000 0.000 0.000 0.000 0.000 0.000 0.000 0.000 0.000 0.000 0.000 0.000 0.000 0.000 0.000
Gomoa East 0.000 0.000 0.000 0.000 0.000 0.000 0.000 0.000 0.000 0.000 0.000 0.000 0.000 0.000 0.000 0.000 0.000
Gomoa West 0.000 0.000 0.000 0.000 0.000 0.000 0.000 0.000 0.000 0.000 0.000 0.000 0.000 0.000 0.000 0.000 0.000
Komenda-
Edina-Egyafo-
Abirem 0.000 0.000 0.000 0.000 0.000 0.000 0.000 0.000 0.000 0.000 0.000 0.000 0.000 0.000 0.000 0.000 0.000
Mfantsiman
Municipal 0.000 0.000 0.000 0.000 0.000 0.000 0.000 0.000 0.000 0.000 0.000 0.000 0.000 0.000 0.000 0.000 0.000
Twifo-Heman-
Lower Denkyira 0.000 0.000 0.000 0.000 0.000 0.000 0.000 0.000 0.000 0.000 0.000 0.000 0.000 0.000 0.000 0.000 0.000
Upper Denkyira
East Municipal 0.000 0.000 0.000 0.000 0.000 0.000 0.000 0.000 0.000 0.000 0.000 0.000 0.000 0.000 0.000 0.000 0.000
Upper Denkyira
West 0.000 0.000 0.000 0.000 0.000 0.000 0.000 0.000 0.000 0.000 0.000 0.000 0.000 0.000 0.000 0.000 0.000
Economic
/Social
Overcrowding
(household
density) 0.500 0.500 0.125 0.500 0.500 0.500 0.500 0.500 0.500 0.500 0.500 0.500 0.500 0.500 0.500 0.500 0.500
Ownership 0.500 0.500 0.875 0.500 0.500 0.500 0.500 0.500 0.500 0.500 0.500 0.500 0.500 0.500 0.500 0.500 0.500
Environ-
mental
Amount of Open
Space 0.875 0.875 0.875 0.875 0.875 0.875 0.875 0.333 0.800 0.875 0.875 0.875 0.875 0.875 0.875 0.875 0.875
Sanitation
Facilities 0.125 0.125 0.125 0.125 0.125 0.125 0.125 0.667 0.200 0.125 0.125 0.125 0.125 0.125 0.125 0.125 0.125
Physical
Dwelling Type 0.081 0.205 0.195 0.594 0.594 0.594 0.758 0.113 0.179 0.195 0.462 0.195 0.462 0.172 0.731 0.333 0.731
Housing
Services 0.135 0.073 0.088 0.249 0.249 0.249 0.151 0.179 0.113 0.088 0.077 0.088 0.077 0.102 0.188 0.528 0.188
Structural
Quality 0.784 0.722 0.717 0.157 0.157 0.157 0.091 0.709 0.709 0.717 0.462 0.717 0.462 0.726 0.081 0.140 0.081

185
CENTRAL
REGION (B)
Economic/Social Environmental Physical
Overcrowding
(household
density) Ownership
Amount
of Open
Space
Sanitation
Facilities
Dwelling
Type
Housing
Services
Structural
Quality
A
L
T
E
R
N
A
T
I
V
E
S
Abura-Asebu-Kwamankese 0.069 0.065 0.062 0.043 0.027 0.030 0.091
Agona East 0.069 0.065 0.062 0.043 0.027 0.020 0.091
Agona West Municipal 0.010 0.065 0.062 0.043 0.027 0.030 0.091
Ajumako-Enyan-Essiam 0.069 0.065 0.062 0.043 0.027 0.030 0.013
Asikuma-Odoben Brakwa 0.069 0.065 0.062 0.043 0.027 0.044 0.013
Assin North Municipal 0.069 0.065 0.062 0.043 0.027 0.044 0.013
Assin South 0.069 0.065 0.062 0.043 0.135 0.046 0.013
Cape Coast Metropolis 0.010 0.009 0.012 0.174 0.027 0.129 0.091
Effutu Municipal 0.010 0.009 0.062 0.174 0.027 0.087 0.091
Ewutu Senya 0.069 0.065 0.062 0.043 0.027 0.030 0.091
Gomoa East 0.069 0.065 0.062 0.043 0.135 0.059 0.091
Gomoa West 0.069 0.065 0.062 0.043 0.027 0.032 0.091
Komenda-Edina-Egyafo-
Abirem 0.069 0.065 0.062 0.043 0.135 0.059 0.091
Mfantsiman Municipal 0.069 0.065 0.062 0.043 0.027 0.059 0.091
Twifo-Heman-Lower Denkyira 0.069 0.065 0.062 0.043 0.135 0.087 0.013
Upper Denkyira East
Municipal 0.069 0.065 0.062 0.043 0.027 0.129 0.013
Upper Denkyira West 0.069 0.065 0.062 0.043 0.135 0.087 0.013
Economic
/Social
Overcrowding (household
density) 0.000 0.000 0.000 0.000 0.000 0.875 0.000
Ownership 0.000 0.000 0.000 0.000 0.000 0.125 0.000
Environmental
Amount of Open Space 0.000 0.000 0.000 0.000 0.000 0.000 0.000
Sanitation Facilities 0.000 0.000 0.000 0.000 0.000 0.000 0.000
Physical
Dwelling Type 0.000 0.000 0.000 0.000 0.000 0.751 0.751
Housing Services 0.000 0.000 0.000 0.000 0.000 0.205 0.044
Structural Quality 0.000 0.000 0.000 0.000 0.000 0.044 0.205

186
EASTERN
REGION (A)
ALTERNATIVES
Akwapem North
Akwapem
South
Municipal
Akyem
Mansa Asuogyaman Atiwa
Birim
Municipal
Birim
North
Birim
South
East
Akim
Municipal Fanteakwa Kwaebibirem
Kwahu
East
Kwahu
North
Kwahu
South
Kwahu
West
Municipal
Lower
Manya
New
Juaben
Municipal
A
L
T
E
R
N
A
T
I
V
E
S
Akwapem
North 0.000 0.000 0.000 0.000 0.000 0.000 0.000 0.000 0.000 0.000 0.000 0.000 0.000 0.000 0.000 0.000 0.000
Akwapem
South
Municipal 0.000 0.000 0.000 0.000 0.000 0.000 0.000 0.000 0.000 0.000 0.000 0.000 0.000 0.000 0.000 0.000 0.000
Akyem
Mansa 0.000 0.000 0.000 0.000 0.000 0.000 0.000 0.000 0.000 0.000 0.000 0.000 0.000 0.000 0.000 0.000 0.000
Asuogyaman 0.000 0.000 0.000 0.000 0.000 0.000 0.000 0.000 0.000 0.000 0.000 0.000 0.000 0.000 0.000 0.000 0.000
Atiwa 0.000 0.000 0.000 0.000 0.000 0.000 0.000 0.000 0.000 0.000 0.000 0.000 0.000 0.000 0.000 0.000 0.000
Birim
Municipal 0.000 0.000 0.000 0.000 0.000 0.000 0.000 0.000 0.000 0.000 0.000 0.000 0.000 0.000 0.000 0.000 0.000
Birim North 0.000 0.000 0.000 0.000 0.000 0.000 0.000 0.000 0.000 0.000 0.000 0.000 0.000 0.000 0.000 0.000 0.000
Birim South 0.000 0.000 0.000 0.000 0.000 0.000 0.000 0.000 0.000 0.000 0.000 0.000 0.000 0.000 0.000 0.000 0.000
East Akim
Municipal 0.000 0.000 0.000 0.000 0.000 0.000 0.000 0.000 0.000 0.000 0.000 0.000 0.000 0.000 0.000 0.000 0.000
Fanteakwa 0.000 0.000 0.000 0.000 0.000 0.000 0.000 0.000 0.000 0.000 0.000 0.000 0.000 0.000 0.000 0.000 0.000
Kwaebibirem 0.000 0.000 0.000 0.000 0.000 0.000 0.000 0.000 0.000 0.000 0.000 0.000 0.000 0.000 0.000 0.000 0.000
Kwahu East 0.000 0.000 0.000 0.000 0.000 0.000 0.000 0.000 0.000 0.000 0.000 0.000 0.000 0.000 0.000 0.000 0.000
Kwahu North 0.000 0.000 0.000 0.000 0.000 0.000 0.000 0.000 0.000 0.000 0.000 0.000 0.000 0.000 0.000 0.000 0.000
Kwahu South 0.000 0.000 0.000 0.000 0.000 0.000 0.000 0.000 0.000 0.000 0.000 0.000 0.000 0.000 0.000 0.000 0.000
Kwahu West
Municipal 0.000 0.000 0.000 0.000 0.000 0.000 0.000 0.000 0.000 0.000 0.000 0.000 0.000 0.000 0.000 0.000 0.000
Lower Manya 0.000 0.000 0.000 0.000 0.000 0.000 0.000 0.000 0.000 0.000 0.000 0.000 0.000 0.000 0.000 0.000 0.000
New Juaben
Municipal 0.000 0.000 0.000 0.000 0.000 0.000 0.000 0.000 0.000 0.000 0.000 0.000 0.000 0.000 0.000 0.000 0.000
Suhum-
Kraboa
Coaltar 0.000 0.000 0.000 0.000 0.000 0.000 0.000 0.000 0.000 0.000 0.000 0.000 0.000 0.000 0.000 0.000 0.000
Upper Manya 0.000 0.000 0.000 0.000 0.000 0.000 0.000 0.000 0.000 0.000 0.000 0.000 0.000 0.000 0.000 0.000 0.000
West Akim
Municipal 0.000 0.000 0.000 0.000 0.000 0.000 0.000 0.000 0.000 0.000 0.000 0.000 0.000 0.000 0.000 0.000 0.000
Yilo Krobo 0.000 0.000 0.000 0.000 0.000 0.000 0.000 0.000 0.000 0.000 0.000 0.000 0.000 0.000 0.000 0.000 0.000
Economic
/Social
Overcrowding
(household
density) 0.500 0.500 0.500 0.500 0.500 0.500 0.500 0.500 0.500 0.500 0.500 0.500 0.500 0.500 0.875 0.875 0.500
Ownership 0.500 0.500 0.500 0.500 0.500 0.500 0.500 0.500 0.500 0.500 0.500 0.500 0.500 0.500 0.125 0.125 0.500
Environ-
mental
Amount of
Open Space 0.875 0.875 0.875 0.875 0.875 0.875 0.875 0.875 0.875 0.875 0.875 0.875 0.875 0.875 0.875 0.875 0.333
Sanitation
Facilities 0.125 0.125 0.125 0.125 0.125 0.125 0.125 0.125 0.125 0.125 0.125 0.125 0.125 0.125 0.125 0.125 0.667
Physical
Dwelling
Type 0.195 0.179 0.528 0.462 0.179 0.172 0.462 0.179 0.113 0.773 0.195 0.179 0.777 0.455 0.179 0.179 0.113
Housing
Services 0.088 0.113 0.333 0.077 0.113 0.102 0.077 0.113 0.179 0.088 0.088 0.113 0.070 0.091 0.113 0.113 0.179
Structural
Quality 0.717 0.709 0.140 0.462 0.709 0.726 0.462 0.709 0.709 0.139 0.717 0.709 0.153 0.455 0.709 0.709 0.709

187
EASTERN
REGION (B)
ALTERNATIVES Economic/Social Environmental Physical
Suhum-
Kraboa
Coaltar
Upper
Manya
West Akim
Municipal
Yilo
Krobo
Overcrowding
(household
density) Ownership
Amount
of Open
Space
Sanitation
Facilities
Dwelling
Type
Housing
Services
Structural
Quality
A
L
T
E
R
N
A
T
I
V
E
S
Akwapem North 0.000 0.000 0.000 0.000 0.050 0.054 0.050 0.042 0.022 0.026 0.063
Akwapem South
Municipal 0.000 0.000 0.000 0.000 0.050 0.054 0.050 0.042 0.022 0.065 0.063
Akyem Mansa 0.000 0.000 0.000 0.000 0.050 0.054 0.050 0.042 0.022 0.065 0.009
Asuogyaman 0.000 0.000 0.000 0.000 0.050 0.054 0.050 0.042 0.110 0.026 0.063
Atiwa 0.000 0.000 0.000 0.000 0.050 0.054 0.050 0.042 0.022 0.065 0.063
Birim Municipal 0.000 0.000 0.000 0.000 0.050 0.054 0.050 0.042 0.022 0.040 0.063
Birim North 0.000 0.000 0.000 0.000 0.050 0.054 0.050 0.042 0.110 0.026 0.063
Birim South 0.000 0.000 0.000 0.000 0.050 0.054 0.050 0.042 0.022 0.063 0.063
East Akim Municipal 0.000 0.000 0.000 0.000 0.050 0.054 0.050 0.042 0.022 0.096 0.063
Fanteakwa 0.000 0.000 0.000 0.000 0.050 0.054 0.050 0.042 0.114 0.022 0.009
Kwaebibirem 0.000 0.000 0.000 0.000 0.050 0.054 0.050 0.042 0.022 0.026 0.063
Kwahu East 0.000 0.000 0.000 0.000 0.050 0.054 0.050 0.042 0.025 0.047 0.064
Kwahu North 0.000 0.000 0.000 0.000 0.050 0.054 0.050 0.042 0.106 0.013 0.009
Kwahu South 0.000 0.000 0.000 0.000 0.050 0.054 0.050 0.047 0.110 0.095 0.063
Kwahu West
Municipal 0.000 0.000 0.000 0.000 0.050 0.008 0.050 0.042 0.027 0.065 0.063
Lower Manya 0.000 0.000 0.000 0.000 0.050 0.008 0.050 0.047 0.022 0.065 0.063
New Juaben
Municipal 0.000 0.000 0.000 0.000 0.007 0.008 0.010 0.154 0.022 0.095 0.063
Suhum-Kraboa
Coaltar 0.000 0.000 0.000 0.000 0.050 0.054 0.050 0.042 0.022 0.018 0.009
Upper Manya 0.000 0.000 0.000 0.000 0.050 0.054 0.050 0.042 0.110 0.018 0.009
West Akim
Municipal 0.000 0.000 0.000 0.000 0.050 0.054 0.050 0.042 0.022 0.026 0.063
Yilo Krobo 0.000 0.000 0.000 0.000 0.050 0.054 0.050 0.042 0.022 0.038 0.009
Economic
/Social
Overcrowding
(household density) 0.500 0.500 0.500 0.500 0.000 0.000 0.000 0.000 0.000 0.875 0.000
Ownership 0.500 0.500 0.500 0.500 0.000 0.000 0.000 0.000 0.000 0.125 0.000
Environmental
Amount of Open
Space 0.875 0.875 0.875 0.875 0.000 0.000 0.000 0.000 0.000 0.000 0.000
Sanitation Facilities 0.125 0.125 0.125 0.125 0.000 0.000 0.000 0.000 0.000 0.000 0.000
Physical
Dwelling Type 0.625 0.773 0.195 0.540 0.000 0.000 0.000 0.000 0.000 0.751 0.751
Housing Services 0.137 0.139 0.088 0.297 0.000 0.000 0.000 0.000 0.000 0.205 0.044
Structural Quality 0.238 0.088 0.717 0.163 0.000 0.000 0.000 0.000 0.000 0.044 0.205

188
NORTHERN
REGION (A)
ALTERNATIVES
Bole
Bunkpurugu
Yonyo Chereponi
East
Gonja
Gonja
Central Gushiegu Karaga Kpandai
Mamprusi
East
Mamprusi
West
Nanumba
North
Nanumba
South Saboba
Savelugu
Nanton
Sawla-
Tuna-
Kalba
Tamale
Metropolis
A
L
T
E
R
N
A
T
I
V
E
S
Bole 0.000 0.000 0.000 0.000 0.000 0.000 0.000 0.000 0.000 0.000 0.000 0.000 0.000 0.000 0.000 0.000
Bunkpurugu
Yonyo 0.000 0.000 0.000 0.000 0.000 0.000 0.000 0.000 0.000 0.000 0.000 0.000 0.000 0.000 0.000 0.000
Chereponi 0.000 0.000 0.000 0.000 0.000 0.000 0.000 0.000 0.000 0.000 0.000 0.000 0.000 0.000 0.000 0.000
East Gonja 0.000 0.000 0.000 0.000 0.000 0.000 0.000 0.000 0.000 0.000 0.000 0.000 0.000 0.000 0.000 0.000
Gonja Central 0.000 0.000 0.000 0.000 0.000 0.000 0.000 0.000 0.000 0.000 0.000 0.000 0.000 0.000 0.000 0.000
Gushiegu 0.000 0.000 0.000 0.000 0.000 0.000 0.000 0.000 0.000 0.000 0.000 0.000 0.000 0.000 0.000 0.000
Karaga 0.000 0.000 0.000 0.000 0.000 0.000 0.000 0.000 0.000 0.000 0.000 0.000 0.000 0.000 0.000 0.000
Kpandai 0.000 0.000 0.000 0.000 0.000 0.000 0.000 0.000 0.000 0.000 0.000 0.000 0.000 0.000 0.000 0.000
Mamprusi
East 0.000 0.000 0.000 0.000 0.000 0.000 0.000 0.000 0.000 0.000 0.000 0.000 0.000 0.000 0.000 0.000
Mamprusi
West 0.000 0.000 0.000 0.000 0.000 0.000 0.000 0.000 0.000 0.000 0.000 0.000 0.000 0.000 0.000 0.000
Nanumba
North 0.000 0.000 0.000 0.000 0.000 0.000 0.000 0.000 0.000 0.000 0.000 0.000 0.000 0.000 0.000 0.000
Nanumba
South 0.000 0.000 0.000 0.000 0.000 0.000 0.000 0.000 0.000 0.000 0.000 0.000 0.000 0.000 0.000 0.000
Saboba 0.000 0.000 0.000 0.000 0.000 0.000 0.000 0.000 0.000 0.000 0.000 0.000 0.000 0.000 0.000 0.000
Savelugu
Nanton 0.000 0.000 0.000 0.000 0.000 0.000 0.000 0.000 0.000 0.000 0.000 0.000 0.000 0.000 0.000 0.000
Sawla-Tuna-
Kalba 0.000 0.000 0.000 0.000 0.000 0.000 0.000 0.000 0.000 0.000 0.000 0.000 0.000 0.000 0.000 0.000
Tamale
Metropolis 0.000 0.000 0.000 0.000 0.000 0.000 0.000 0.000 0.000 0.000 0.000 0.000 0.000 0.000 0.000 0.000
Tolon
Kumbugu 0.000 0.000 0.000 0.000 0.000 0.000 0.000 0.000 0.000 0.000 0.000 0.000 0.000 0.000 0.000 0.000
West Gonja 0.000 0.000 0.000 0.000 0.000 0.000 0.000 0.000 0.000 0.000 0.000 0.000 0.000 0.000 0.000 0.000
Yendi
Municipal 0.000 0.000 0.000 0.000 0.000 0.000 0.000 0.000 0.000 0.000 0.000 0.000 0.000 0.000 0.000 0.000
Zabzugu
Tatali 0.000 0.000 0.000 0.000 0.000 0.000 0.000 0.000 0.000 0.000 0.000 0.000 0.000 0.000 0.000 0.000
Economic
/Social
Overcrowding
(household
density) 0.500 0.500 0.500 0.500 0.500 0.500 0.500 0.500 0.500 0.500 0.500 0.500 0.500 0.500 0.500 0.500
Ownership 0.500 0.500 0.500 0.500 0.500 0.500 0.500 0.500 0.500 0.500 0.500 0.500 0.500 0.500 0.500 0.500
Environ-
mental
Amount of
Open Space 0.875 0.875 0.875 0.875 0.875 0.875 0.875 0.875 0.875 0.875 0.875 0.875 0.875 0.875 0.875 0.800
Sanitation
Facilities 0.125 0.125 0.125 0.125 0.125 0.125 0.125 0.125 0.125 0.125 0.125 0.125 0.125 0.125 0.125 0.200
Physical
Dwelling
Type 0.773 0.429 0.429 0.614 0.777 0.625 0.600 0.600 0.594 0.600 0.625 0.594 0.594 0.600 0.731 0.113
Housing
Services /
Infrastructure 0.088 0.429 0.429 0.117 0.070 0.137 0.200 0.200 0.249 0.200 0.137 0.249 0.249 0.200 0.188 0.179
Structural
Quality 0.139 0.143 0.143 0.268 0.153 0.238 0.200 0.200 0.157 0.200 0.238 0.157 0.157 0.200 0.081 0.709

189
NORTHERN
REGION (B)
ALTERNATIVES Economic/Social Environmental Physical
Tamale
Metropolis
Tolon
Kumbugu
West
Gonja
Yendi
Municipal
Zabzugu
Tatali
Overcrowding
(household
density) Ownership
Amount
of Open
Space
Sanitation
Facilities
Dwelling
Type
Housing
Services
Structural
Quality
A
L
T
E
R
N
A
T
I
V
E
S
Bole 0.000 0.000 0.000 0.000 0.000 0.050 0.050 0.050 0.043 0.156 0.024 0.038
Bunkpurugu
Yonyo 0.000 0.000 0.000 0.000 0.000 0.050 0.050 0.050 0.043 0.031 0.107 0.038
Chereponi 0.000 0.000 0.000 0.000 0.000 0.050 0.050 0.050 0.043 0.031 0.104 0.038
East Gonja 0.000 0.000 0.000 0.000 0.000 0.050 0.050 0.050 0.043 0.031 0.016 0.038
Gonja Central 0.000 0.000 0.000 0.000 0.000 0.050 0.050 0.050 0.043 0.156 0.017 0.038
Gushiegu 0.000 0.000 0.000 0.000 0.000 0.050 0.050 0.050 0.043 0.031 0.023 0.038
Karaga 0.000 0.000 0.000 0.000 0.000 0.050 0.050 0.050 0.043 0.031 0.040 0.038
Kpandai 0.000 0.000 0.000 0.000 0.000 0.050 0.050 0.050 0.043 0.031 0.035 0.038
Mamprusi East 0.000 0.000 0.000 0.000 0.000 0.050 0.050 0.050 0.043 0.031 0.060 0.038
Mamprusi West 0.000 0.000 0.000 0.000 0.000 0.050 0.050 0.050 0.043 0.031 0.040 0.038
Nanumba North 0.000 0.000 0.000 0.000 0.000 0.050 0.050 0.050 0.043 0.031 0.023 0.038
Nanumba South 0.000 0.000 0.000 0.000 0.000 0.050 0.050 0.050 0.043 0.031 0.058 0.038
Saboba 0.000 0.000 0.000 0.000 0.000 0.050 0.050 0.050 0.043 0.031 0.058 0.038
Savelugu Nanton 0.000 0.000 0.000 0.000 0.000 0.050 0.050 0.050 0.043 0.031 0.040 0.038
Sawla-Tuna-Kalba 0.000 0.000 0.000 0.000 0.000 0.050 0.050 0.050 0.043 0.156 0.106 0.038
Tamale Metropolis 0.000 0.000 0.000 0.000 0.000 0.050 0.050 0.050 0.174 0.031 0.127 0.269
Tolon Kumbugu 0.000 0.000 0.000 0.000 0.000 0.050 0.050 0.050 0.043 0.031 0.023 0.038
West Gonja 0.000 0.000 0.000 0.000 0.000 0.050 0.050 0.050 0.043 0.031 0.023 0.038
Yendi Municipal 0.000 0.000 0.000 0.000 0.000 0.050 0.050 0.050 0.043 0.031 0.023 0.038
Zabzugu Tatali 0.000 0.000 0.000 0.000 0.000 0.050 0.050 0.050 0.043 0.031 0.052 0.038
Economic
/Social
Overcrowding
(household
density) 0.500 0.500 0.500 0.500 0.500 0.000 0.000 0.000 0.000 0.000 0.875 0.000
Ownership 0.500 0.500 0.500 0.500 0.500 0.000 0.000 0.000 0.000 0.000 0.125 0.000
Environ-
mental
Amount of Open
Space 0.800 0.875 0.875 0.875 0.875 0.000 0.000 0.000 0.000 0.000 0.000 0.000
Sanitation
Facilities 0.200 0.125 0.125 0.125 0.125 0.000 0.000 0.000 0.000 0.000 0.000 0.000
Physical
Dwelling Type 0.113 0.625 0.625 0.625 0.594 0.000 0.000 0.000 0.000 0.000 0.751 0.751
Housing Services 0.179 0.137 0.137 0.137 0.249 0.000 0.000 0.000 0.000 0.000 0.205 0.044
Structural Quality 0.709 0.238 0.238 0.238 0.157 0.000 0.000 0.000 0.000 0.000 0.044 0.205

190
UPPER EAST
REGION
ALTERNATIVES Economic/Social Environmental Physical
Bawku
Municipal
Bawku
West
Bolgatanga
Municipal Bongo Builsa
Garu
Tempane
Kasena
Nankana
East
Kasena
Nankana
West
Talensi
Nabdam
Overcrowding
(household
density) Ownership
Amount
of Open
Space
Sanitation
Facilities
Dwelling
Type
Housing
Services
Structural
Quality
A
L
T
E
R
N
A
T
I
V
E
S
Bawku
Municipal 0.000 0.000 0.000 0.000 0.000 0.000 0.000 0.000 0.000 0.111 0.111 0.111 0.111 0.111 0.042 0.111
Bawku West 0.000 0.000 0.000 0.000 0.000 0.000 0.000 0.000 0.000 0.111 0.111 0.111 0.111 0.111 0.208 0.111
Bolgatanga
Municipal 0.000 0.000 0.000 0.000 0.000 0.000 0.000 0.000 0.000 0.111 0.111 0.111 0.111 0.111 0.074 0.111
Bongo 0.000 0.000 0.000 0.000 0.000 0.000 0.000 0.000 0.000 0.111 0.111 0.111 0.111 0.111 0.091 0.111
Builsa 0.000 0.000 0.000 0.000 0.000 0.000 0.000 0.000 0.000 0.111 0.111 0.111 0.111 0.111 0.208 0.111
Garu Tempane 0.000 0.000 0.000 0.000 0.000 0.000 0.000 0.000 0.000 0.111 0.111 0.111 0.111 0.111 0.045 0.111
Kasena
Nankana East 0.000 0.000 0.000 0.000 0.000 0.000 0.000 0.000 0.000 0.111 0.111 0.111 0.111 0.111 0.088 0.111
Kasena
Nankana West 0.000 0.000 0.000 0.000 0.000 0.000 0.000 0.000 0.000 0.111 0.111 0.111 0.111 0.111 0.047 0.111
Talensi
Nabdam 0.000 0.000 0.000 0.000 0.000 0.000 0.000 0.000 0.000 0.111 0.111 0.111 0.111 0.111 0.198 0.111
Economic
/Social
Overcrowding
(household
density) 0.500 0.500 0.500 0.500 0.500 0.500 0.500 0.500 0.500 0.000 0.000 0.000 0.000 0.000 0.875 0.000
Ownership 0.500 0.500 0.500 0.500 0.500 0.500 0.500 0.500 0.500 0.000 0.000 0.000 0.000 0.000 0.125 0.000
Environ-
mental
Amount of
Open Space 0.875 0.875 0.875 0.875 0.875 0.875 0.875 0.875 0.875 0.000 0.000 0.000 0.000 0.000 0.000 0.000
Sanitation
Facilities 0.125 0.125 0.125 0.125 0.125 0.125 0.125 0.125 0.125 0.000 0.000 0.000 0.000 0.000 0.000 0.000
Physical
Dwelling Type 0.625 0.429 0.594 0.594 0.429 0.625 0.594 0.625 0.429 0.000 0.000 0.000 0.000 0.000 0.751 0.751
Housing
Services /
Infrastructure 0.137 0.429 0.249 0.249 0.429 0.137 0.249 0.137 0.429 0.000 0.000 0.000 0.000 0.000 0.205 0.044
Structural
Quality 0.238 0.143 0.157 0.157 0.143 0.238 0.157 0.238 0.143 0.000 0.000 0.000 0.000 0.000 0.044 0.205

191
UPPER WEST
REGION
ALTERNATIVES Economic/Social Environmental Physical
Jirapa
Lambussie
Karni Lawra Nadowli
Sissala
East
Sissala
West
Wa
East
Wa
Municipal
Wa
West
Overcrowding
(household
density) Ownership
Amount
of Open
Space
Sanitation
Facilities
Dwelling
Type
Housing
Services
Structural
Adequacy
A
L
T
E
R
N
A
T
I
V
E
S
Jirapa 0.000 0.000 0.000 0.000 0.000 0.000 0.000 0.000 0.000 0.111 0.111 0.111 0.111 0.238 0.058 0.067
Lambussie
Karni 0.000 0.000 0.000 0.000 0.000 0.000 0.000 0.000 0.000 0.111 0.111 0.111 0.111 0.048 0.058 0.067
Lawra 0.000 0.000 0.000 0.000 0.000 0.000 0.000 0.000 0.000 0.111 0.111 0.111 0.111 0.048 0.172 0.067
Nadowli 0.000 0.000 0.000 0.000 0.000 0.000 0.000 0.000 0.000 0.111 0.111 0.111 0.111 0.048 0.172 0.067
Sissala East 0.000 0.000 0.000 0.000 0.000 0.000 0.000 0.000 0.000 0.111 0.111 0.111 0.111 0.048 0.035 0.067
Sissala West 0.000 0.000 0.000 0.000 0.000 0.000 0.000 0.000 0.000 0.111 0.111 0.111 0.111 0.048 0.062 0.067
Wa East 0.000 0.000 0.000 0.000 0.000 0.000 0.000 0.000 0.000 0.111 0.111 0.111 0.111 0.238 0.172 0.067
Wa Municipal 0.000 0.000 0.000 0.000 0.000 0.000 0.000 0.000 0.000 0.111 0.111 0.111 0.111 0.048 0.100 0.467
Wa West 0.000 0.000 0.000 0.000 0.000 0.000 0.000 0.000 0.000 0.111 0.111 0.111 0.111 0.238 0.172 0.067
Economic
/Social
Overcrowding
(household
density) 0.500 0.500 0.500 0.500 0.500 0.500 0.500 0.500 0.500 0.000 0.000 0.000 0.000 0.000 0.875 0.000
Ownership 0.500 0.500 0.500 0.500 0.500 0.500 0.500 0.500 0.500 0.000 0.000 0.000 0.000 0.000 0.125 0.000
Environ-
mental
Amount of
Open Space 0.875 0.875 0.875 0.875 0.875 0.875 0.875 0.875 0.875 0.000 0.000 0.000 0.000 0.000 0.000 0.000
Sanitation
Facilities 0.125 0.125 0.125 0.125 0.125 0.125 0.125 0.125 0.125 0.000 0.000 0.000 0.000 0.000 0.000 0.000
Physical
Dwelling
Type 0.758 0.540 0.429 0.429 0.625 0.594 0.731 0.179 0.731 0.000 0.000 0.000 0.000 0.000 0.751 0.333
Housing
Services 0.151 0.297 0.429 0.429 0.137 0.249 0.188 0.113 0.188 0.000 0.000 0.000 0.000 0.000 0.205 0.333
Structural
Adequacy 0.091 0.163 0.143 0.143 0.238 0.157 0.081 0.709 0.081 0.000 0.000 0.000 0.000 0.000 0.044 0.333

192
VOLTA
REGION (A)
ALTERNATIVES
Adaklu
Anyigbe Akatsi Biakoye
Ho
Municipal
Hohoe
Municipal Jasikan Kadjebi
Keta
Municipal
Ketu
North
Ketu
South
Krachi
East
Krachi
West
Nkwanta
North
Nkwanta
South
North
Dayi
North
Tongu
South
Dayi
South
Tongu
A
L
T
E
R
N
A
T
I
V
E
S
Adaklu
Anyigbe 0.000 0.000 0.000 0.000 0.000 0.000 0.000 0.000 0.000 0.000 0.000 0.000 0.000 0.000 0.000 0.000 0.000 0.000
Akatsi 0.000 0.000 0.000 0.000 0.000 0.000 0.000 0.000 0.000 0.000 0.000 0.000 0.000 0.000 0.000 0.000 0.000 0.000
Biakoye 0.000 0.000 0.000 0.000 0.000 0.000 0.000 0.000 0.000 0.000 0.000 0.000 0.000 0.000 0.000 0.000 0.000 0.000
Ho Municipal 0.000 0.000 0.000 0.000 0.000 0.000 0.000 0.000 0.000 0.000 0.000 0.000 0.000 0.000 0.000 0.000 0.000 0.000
Hohoe
Municipal 0.000 0.000 0.000 0.000 0.000 0.000 0.000 0.000 0.000 0.000 0.000 0.000 0.000 0.000 0.000 0.000 0.000 0.000
Jasikan 0.000 0.000 0.000 0.000 0.000 0.000 0.000 0.000 0.000 0.000 0.000 0.000 0.000 0.000 0.000 0.000 0.000 0.000
Kadjebi 0.000 0.000 0.000 0.000 0.000 0.000 0.000 0.000 0.000 0.000 0.000 0.000 0.000 0.000 0.000 0.000 0.000 0.000
Keta
Municipal 0.000 0.000 0.000 0.000 0.000 0.000 0.000 0.000 0.000 0.000 0.000 0.000 0.000 0.000 0.000 0.000 0.000 0.000
Ketu North 0.000 0.000 0.000 0.000 0.000 0.000 0.000 0.000 0.000 0.000 0.000 0.000 0.000 0.000 0.000 0.000 0.000 0.000
Ketu South 0.000 0.000 0.000 0.000 0.000 0.000 0.000 0.000 0.000 0.000 0.000 0.000 0.000 0.000 0.000 0.000 0.000 0.000
Krachi East 0.000 0.000 0.000 0.000 0.000 0.000 0.000 0.000 0.000 0.000 0.000 0.000 0.000 0.000 0.000 0.000 0.000 0.000
Krachi West 0.000 0.000 0.000 0.000 0.000 0.000 0.000 0.000 0.000 0.000 0.000 0.000 0.000 0.000 0.000 0.000 0.000 0.000
Nkwanta
North 0.000 0.000 0.000 0.000 0.000 0.000 0.000 0.000 0.000 0.000 0.000 0.000 0.000 0.000 0.000 0.000 0.000 0.000
Nkwanta
South 0.000 0.000 0.000 0.000 0.000 0.000 0.000 0.000 0.000 0.000 0.000 0.000 0.000 0.000 0.000 0.000 0.000 0.000
North Dayi 0.000 0.000 0.000 0.000 0.000 0.000 0.000 0.000 0.000 0.000 0.000 0.000 0.000 0.000 0.000 0.000 0.000 0.000
North Tongu 0.000 0.000 0.000 0.000 0.000 0.000 0.000 0.000 0.000 0.000 0.000 0.000 0.000 0.000 0.000 0.000 0.000 0.000
South Dayi 0.000 0.000 0.000 0.000 0.000 0.000 0.000 0.000 0.000 0.000 0.000 0.000 0.000 0.000 0.000 0.000 0.000 0.000
South Tongu 0.000 0.000 0.000 0.000 0.000 0.000 0.000 0.000 0.000 0.000 0.000 0.000 0.000 0.000 0.000 0.000 0.000 0.000
Economic
/Social
Overcrowding
(household
density) 0.500 0.500 0.500 0.500 0.500 0.500 0.500 0.500 0.500 0.500 0.500 0.500 0.500 0.500 0.500 0.500 0.500 0.500
Ownership 0.500 0.500 0.500 0.500 0.500 0.500 0.500 0.500 0.500 0.500 0.500 0.500 0.500 0.500 0.500 0.500 0.500 0.500
Environ-
mental
Amount of
Open Space 0.875 0.875 0.875 0.875 0.875 0.875 0.875 0.875 0.875 0.875 0.875 0.875 0.875 0.875 0.875 0.875 0.875 0.875
Sanitation
Facilities 0.125 0.125 0.125 0.125 0.125 0.125 0.125 0.125 0.125 0.125 0.125 0.125 0.125 0.125 0.125 0.125 0.125 0.125
Physical
Dwelling
Type 0.773 0.773 0.773 0.462 0.758 0.758 0.773 0.455 0.467 0.205 0.784 0.758 0.625 0.773 0.462 0.777 0.773 0.467
Housing
Services 0.088 0.088 0.088 0.077 0.151 0.151 0.088 0.091 0.067 0.073 0.081 0.151 0.137 0.088 0.077 0.070 0.088 0.067
Structural
Adequacy 0.139 0.139 0.139 0.462 0.091 0.091 0.139 0.455 0.467 0.722 0.135 0.091 0.238 0.139 0.462 0.153 0.139 0.467

193
VOLTA
REGION (B)
Economic/Social Environmental Physical
Overcrowding
(household
density) Ownership
Amount of
Open
Space
Sanitation
Facilities
Dwelling
Type
Housing
Services
Structural
Adequacy
A
L
T
E
R
N
A
T
I
V
E
S
Adaklu Anyigbe 0.056 0.056 0.056 0.056 0.061 0.034 0.019
Akatsi 0.056 0.056 0.056 0.056 0.061 0.034 0.019
Biakoye 0.056 0.056 0.056 0.056 0.061 0.034 0.019
Ho Municipal 0.056 0.056 0.056 0.056 0.061 0.109 0.130
Hohoe Municipal 0.056 0.056 0.056 0.056 0.061 0.109 0.019
Jasikan 0.056 0.056 0.056 0.056 0.061 0.068 0.019
Kadjebi 0.056 0.056 0.056 0.056 0.061 0.035 0.019
Keta Municipal 0.056 0.056 0.056 0.056 0.061 0.127 0.130
Ketu North 0.056 0.056 0.056 0.056 0.061 0.034 0.130
Ketu South 0.056 0.056 0.056 0.056 0.012 0.034 0.130
Krachi East 0.056 0.056 0.056 0.056 0.061 0.021 0.019
Krachi West 0.056 0.056 0.056 0.056 0.063 0.091 0.019
Nkwanta North 0.056 0.056 0.056 0.056 0.012 0.060 0.019
Nkwanta South 0.056 0.056 0.056 0.056 0.061 0.034 0.019
North Dayi 0.056 0.056 0.056 0.056 0.061 0.068 0.130
North Tongu 0.056 0.056 0.056 0.056 0.061 0.021 0.019
South Dayi 0.056 0.056 0.056 0.056 0.061 0.051 0.019
South Tongu 0.056 0.056 0.056 0.056 0.061 0.034 0.130
Economic/Social
Overcrowding (household
density) 0.000 0.000 0.000 0.000 0.000 0.875 0.000
Ownership 0.000 0.000 0.000 0.000 0.000 0.125 0.000
Environmental
Amount of Open Space 0.000 0.000 0.000 0.000 0.000 0.000 0.000
Sanitation Facilities 0.000 0.000 0.000 0.000 0.000 0.000 0.000
Physical
Dwelling Type 0.000 0.000 0.000 0.000 0.000 0.751 0.751
Housing Services 0.000 0.000 0.000 0.000 0.000 0.205 0.044
Structural Adequacy 0.000 0.000 0.000 0.000 0.000 0.044 0.205

194
WESTERN
REGION (A)
ALTERNATIVES
Ahanta
West
Aowin/
Suaman Bia Ellembelle Jomoro Juabeso
Mpohor-
Wassa
East
Nzema
East
Prestea
/Huni
Valley
Sefwi
Akontombra
Sefwi
Bibiani-
Ahwiaso
Bekwai
Sefwi
Wiawso
Sekondi-
Takoradi
Metropolis Shama
Tarkwa
Nsuaem
Municipal
Wassa
Amenfi
East
Wassa
Amenfi
West
A
L
T
E
R
N
A
T
I
V
E
S
Ahanta West 0.000 0.000 0.000 0.000 0.000 0.000 0.000 0.000 0.000 0.000 0.000 0.000 0.000 0.000 0.000 0.000 0.000
Aowin/Suaman 0.000 0.000 0.000 0.000 0.000 0.000 0.000 0.000 0.000 0.000 0.000 0.000 0.000 0.000 0.000 0.000 0.000
Bia 0.000 0.000 0.000 0.000 0.000 0.000 0.000 0.000 0.000 0.000 0.000 0.000 0.000 0.000 0.000 0.000 0.000
Ellembelle 0.000 0.000 0.000 0.000 0.000 0.000 0.000 0.000 0.000 0.000 0.000 0.000 0.000 0.000 0.000 0.000 0.000
Jomoro 0.000 0.000 0.000 0.000 0.000 0.000 0.000 0.000 0.000 0.000 0.000 0.000 0.000 0.000 0.000 0.000 0.000
Juabeso 0.000 0.000 0.000 0.000 0.000 0.000 0.000 0.000 0.000 0.000 0.000 0.000 0.000 0.000 0.000 0.000 0.000
Mpohor-Wassa
East 0.000 0.000 0.000 0.000 0.000 0.000 0.000 0.000 0.000 0.000 0.000 0.000 0.000 0.000 0.000 0.000 0.000
Nzema East 0.000 0.000 0.000 0.000 0.000 0.000 0.000 0.000 0.000 0.000 0.000 0.000 0.000 0.000 0.000 0.000 0.000
Prestea/Huni
Valley 0.000 0.000 0.000 0.000 0.000 0.000 0.000 0.000 0.000 0.000 0.000 0.000 0.000 0.000 0.000 0.000 0.000
Sefwi
Akontombra 0.000 0.000 0.000 0.000 0.000 0.000 0.000 0.000 0.000 0.000 0.000 0.000 0.000 0.000 0.000 0.000 0.000
Sefwi Bibiani-
Ahwiaso
Bekwai 0.000 0.000 0.000 0.000 0.000 0.000 0.000 0.000 0.000 0.000 0.000 0.000 0.000 0.000 0.000 0.000 0.000
Sefwi Wiawso 0.000 0.000 0.000 0.000 0.000 0.000 0.000 0.000 0.000 0.000 0.000 0.000 0.000 0.000 0.000 0.000 0.000
Sekondi-
Takoradi
Metropolis 0.000 0.000 0.000 0.000 0.000 0.000 0.000 0.000 0.000 0.000 0.000 0.000 0.000 0.000 0.000 0.000 0.000
Shama 0.000 0.000 0.000 0.000 0.000 0.000 0.000 0.000 0.000 0.000 0.000 0.000 0.000 0.000 0.000 0.000 0.000
Tarkwa
Nsuaem
Municipal 0.000 0.000 0.000 0.000 0.000 0.000 0.000 0.000 0.000 0.000 0.000 0.000 0.000 0.000 0.000 0.000 0.000
Wassa Amenfi
East 0.000 0.000 0.000 0.000 0.000 0.000 0.000 0.000 0.000 0.000 0.000 0.000 0.000 0.000 0.000 0.000 0.000
Wassa Amenfi
West 0.000 0.000 0.000 0.000 0.000 0.000 0.000 0.000 0.000 0.000 0.000 0.000 0.000 0.000 0.000 0.000 0.000
Economic
/Social
Overcrowding
(household
density) 0.500 0.500 0.500 0.500 0.500 0.500 0.500 0.500 0.500 0.500 0.500 0.500 0.125 0.500 0.500 0.500 0.500
Ownership 0.500 0.500 0.500 0.500 0.500 0.500 0.500 0.500 0.500 0.500 0.500 0.500 0.875 0.500 0.500 0.500 0.500
Environ-
mental
Amount of
Open Space 0.875 0.875 0.875 0.875 0.875 0.875 0.875 0.875 0.875 0.875 0.875 0.857 0.333 0.875 0.875 0.875 0.875
Sanitation
Facilities 0.125 0.125 0.125 0.125 0.125 0.125 0.125 0.125 0.125 0.125 0.125 0.143 0.667 0.125 0.125 0.125 0.125
Physical
Dwelling Type 0.455 0.740 0.429 0.113 0.297 0.731 0.758 0.731 0.462 0.740 0.113 0.696 0.113 0.462 0.740 0.758 0.793
Housing
Services 0.091 0.167 0.429 0.179 0.540 0.188 0.151 0.188 0.077 0.167 0.179 0.229 0.179 0.077 0.167 0.151 0.131
Structural
Adequacy 0.455 0.094 0.143 0.709 0.163 0.081 0.091 0.081 0.462 0.094 0.709 0.075 0.709 0.462 0.094 0.091 0.076

195
WESTERN
REGION (B)
Economic/Social Environmental Physical
Overcrowding
(household
density) Ownership
Amount of
Open Space
Sanitation
Facilities
Dwelling
Type
Housing
Services
Structural
Adequacy
A
L
T
E
R
N
A
T
I
V
E
S
Ahanta West 0.062 0.059 0.062 0.050 0.076 0.053 0.118
Aowin/Suaman 0.062 0.059 0.062 0.050 0.076 0.042 0.017
Bia 0.062 0.059 0.062 0.050 0.015 0.070 0.017
Ellembelle 0.062 0.059 0.061 0.050 0.015 0.090 0.118
Jomoro 0.062 0.059 0.062 0.050 0.015 0.090 0.017
Juabeso 0.062 0.059 0.062 0.050 0.076 0.068 0.017
Mpohor-Wassa East 0.062 0.059 0.062 0.050 0.076 0.029 0.017
Nzema East 0.062 0.059 0.062 0.050 0.076 0.055 0.017
Prestea/Huni Valley 0.062 0.059 0.062 0.050 0.076 0.023 0.118
Sefwi Akontombra 0.062 0.059 0.062 0.050 0.076 0.042 0.017
Sefwi Bibiani-Ahwiaso
Bekwai 0.062 0.059 0.062 0.050 0.015 0.090 0.118
Sefwi Wiawso 0.058 0.059 0.062 0.050 0.067 0.130 0.016
Sekondi-Takoradi
Metropolis 0.012 0.059 0.013 0.200 0.033 0.090 0.120
Shama 0.062 0.059 0.062 0.050 0.076 0.034 0.120
Tarkwa Nsuaem
Municipal 0.062 0.059 0.062 0.050 0.076 0.023 0.120
Wassa Amenfi East 0.062 0.059 0.062 0.050 0.076 0.042 0.017
Wassa Amenfi West 0.062 0.059 0.062 0.050 0.076 0.028 0.017
Economic/Social
Overcrowding
(household density) 0.000 0.000 0.000 0.000 0.000 0.875 0.000
Ownership 0.000 0.000 0.000 0.000 0.000 0.125 0.000
Environmental
Amount of Open Space 0.000 0.000 0.000 0.000 0.000 0.000 0.000
Sanitation Facilities 0.000 0.000 0.000 0.000 0.000 0.000 0.000
Physical
Dwelling Type 0.000 0.000 0.000 0.000 0.000 0.751 0.751
Housing Services 0.000 0.000 0.000 0.000 0.000 0.205 0.044
Structural Adequacy 0.000 0.000 0.000 0.000 0.000 0.044 0.205

196
Appendix IV: Curriculum Vitae
Name: Lucia Kafui Hussey
Post-Secondary Western University
Education and London, Ontario, Canada
Degrees: M.A. (Geography)
2012-2014
University of Ghana
Legon-Accra, Ghana
B.A. (Geography and Resource Development)
2006-2010
Honours and Western Graduate Research Scholarship (WGRS),
Awards: Western University
2012-2014
Related Work Teaching Assistant
Experience: University of Western Ontario
2012-2014
Teaching and Research Assistant
University of Ghana
2010-2011