mt lasut 2007-dissertation-ait-th
DESCRIPTION
My doctoral dissertation at Asian Institute of Technology, Thailand (2007)TRANSCRIPT

WASTEWATER MANAGEMENT IN THE CITY OF MANADO, NORTH SULAWESI, INDONESIA
by
Markus Talintukan Lasut
A dissertation submitted in partial fulfillment of the requirement for the degree of Doctor of Technical Science in
Aquaculture and Aquatic Resources Management
Examination Committee: Prof. Ganesh Shivakoti (Chairperson) Dr. Thammarat Koottatep Dr. Wenresti G. Gallardo Dr. Kou Ikejima (External Expert)
External Examiner: Dr. Hans Åke Granmo Department of Marine Ecology, Kristineberg
Marine Research Station, Göteborg University, 450 34 Fiskebäckskil, Sweden
Nationality: Indonesian Previous Degree: Engineer in Fisheries (Aquatic Resources
Management), Sam Ratulangi University, Manado, Indonesia
Master of Science, Århus University, Århus, Denmark
Scholarship Donor: Denmark – AIT Fellowship
Asian Institute of Technology School of Environment, Resources and Development
Thailand December 2007

ii
Acknowledgements This is a dissertation submitted in partial fulfillment of the requirements for the Degree of Doctor of Technical Science in Integrated Tropical Coastal Zone Management (ITCZM) Program, Asian Institute Technology (AIT). This study was supported by the Danish International Development Agency (DANIDA), Denmark, through the AIT, Thailand. Therefore, I extend my gratitude to both institutions.
I am indebted to my present academic advisor, Prof. G. Shivakoti, as the chairperson of my Study Program Committee and Ass. Prof. Dr. K. Ikejima, as former academic advisor and former chairperson of my Study Program Committee, who provide helps and advices during my study, helped to construct my research topic, and helped in preparing my paper for publication.
I wish to thank Ass. Prof. Dr. Thammarat Koottatep, Ass. Prof. Dr. Wenresti G. Gallardo, and Ass. Prof. Dr. K. Ikejima (External Experts) as members of my Study Program Committee, who gave comments, corrections, and advises for my dissertation manuscript.
Thank you Ass. Prof. Dr. Åke Granmo from Gothenburg University, Sweden, who provided himself as the External Examiner of my dissertation, reviewed my dissertation manuscript and gave comments and corrections on it.
I am indebted to Ass. Prof. Dr. Kathe R. Jensen, as my first academic advisor, who kindly gave help during my study, helps to get points of views about my research topic, help in the preparation of my proposal and dissertation manuscripts, and helped in preparing my paper for publication.
I would like to thank Ass. Prof. Dr. Ole Pedersen, as a former member my Study Program Committee, who gave advise during my study.
My special thanks to Prof. (Emeritus) C. Kwei Lin, who was involved in the first period of my study, as well as Ass. Prof. Dr. A. Yakupitiyage and Ass. Prof. Dr. Yang Yi, who provided help during my study.
Thanks to Mrs. Lucia Sukanenya and Mrs. Upa Katchasuwanmanee at the ITCZM-AIT Program Secretariat that always provided help for administrative purposes.
Thanks to the Dean of Faculty of Fisheries and Marine Science, Sam Ratulangi University, which gave support and accommodated me during my non-residential period of study.
Thanks to the Center for Environment and Natural Resources (PPLH-SDA), Sam Ratulangi University, and WWF-Manado, which provided secondary data for my dissertation.
I thank John J. Soucy, MAT, English Language Consultant & Programmer, who edited the English.
Parts of this dissertation are published in: 1. Lasut, M. T., Jensen, K. R., Arai, T. & Miyazaki, N. 2005. An assessment of water
quality along the rivers loading into the Manado Bay, North Sulawesi, Indonesia. Coastal Marine Science 29(2): 124–132.
2. Lasut, M. T., Jensen, K. R., Shivakoti, G. 2007. Analysis of constraints and potentials for wastewater management in the coastal city of Manado, North Sulawesi, Indonesia. Journal of Environmental Management, doi: 10.1016/j.jenvman.2007.06.011.

iii
Abstract Wastewater management in the coastal city of Manado is a matter of great importance to prevent and mitigate pollution of the coastal environment by contaminated wastewater. Prior to formulating a wastewater management plan for the city, a survey of the current wastewater management system of the city was carried out. This survey focused on the community’s environmental knowledge and attitude towards wastewater problems, the condition and capacity of existing wastewater treatment systems and wastewater infrastructure and facilities. Also, the water quality of selected rivers was studied by determining certain indicators. The natural characteristics, socio-economic, and institutional arrangement of the city were also studied. Besides, a comprehensive review of the literature of the impacts of human activities on the coastal area with emphasis on wastewater discharge and urban wastewater management system was also done. Based on the information obtained, constraints and potentials of those aspects were analyzed and strategic actions were formulated for recommendation. To collect primary data, two main research methods were applied: (1) field observation and (2) questionnaire interview (individual and household) surveys. Two study sites (district level), Molas and Wenang, were selected and 145 and 139 individuals and 300 and 304 households respectively were interviewed. Secondary data and information was gathered from the administration of Manado City (city level) as the study area. In addition, three rivers (Bailang, Maasing, and Tondano) within the city were observed for water quality status. The results showed that the status of the community’s environmental knowledge and attitude were potentials for management, but the community’s participation was insufficient. The overall status of the wastewater disposal and treatment systems was in good condition and of adequate capacity, but there were also systems in poor and very poor condition and of inadequate capacity, as well as the wastewater infrastructure and facilities at the house level. Moreover, the three observed rivers showed indicator values exceeding international as well as national levels for pollution. In addition, the natural settings, socio-economics, and institutional arrangements pose a challenge for management. The main conclusions of the study were that constraints are formed by: (1) natural settings, which influence land use changes, (2) the rapid increase of population, (3) the frequency of low-income households, (4) the poor condition and capacity of wastewater disposal and treatment systems, (5) the institutional arrangement of the city government, and (6) the lack or inadequacy of city level regulations and policies. Potentials include (1) the city’s religion and ethnicity, (2) good environmental awareness of the community, (3) government institutions at provincial and national levels, and (4) the establishment of policy measures in Agenda 21 at provincial and national levels. Therefore, four strategic actions are recommended to be included in the plan with appropriate modifications for implementation, such as (1) providing and/or improving on-site wastewater treatment systems and sanitation facilities, (2) improving the local city government’s institutional arrangements, (3) improving the community’s participation, and (4) establishing regulations and enforcement.
iv
Table of Contents
CHAPTER TITLE PAGE Title page i Acknowledgements ii Abstract iii Table of Contents iv List of Tables vi List of Figures viii Acronyms ix Glossary xi 1 Introduction 1 1.1 Background 1 1.2 Wastewater problem in the city of Manado 3 1.3 Rationale of the study 6 1.4 Objectives of the study 6 1.5 Scope of the study 6 2 Literature Review 7 2.1 Definitions and characteristics 7 2.2 Wastewater in coastal and marine areas 9 2.3 Coastal environmental management in Indonesia 14 2.4 Major coastal planning & management techniques 15
3 General Research Methodology 23
3.1 Research approach 23 3.2 Research framework 24 3.3 Research design 26 3.4 Data gathering procedure 29
4 Existing Situation and Condition of Manado City 31 4.1 Natural characteristics 31 4.2 Classification of the city 39 4.3 Socio-economic aspects 40 4.4 Government institutional arrangement 44 4.5 Policies, strategies, and actions 45
5 Community’s Environmental Knowledge and Attitude 47 5.1 Introduction 47 5.2 Research methodology 47 5.3 Results and discussion 50
6 Condition and Capacity of Household Wastewater Treatment Systems
58
6.1 Introduction 58 6.2 Research methodology 58
v
6.3 Results and discussion 60
7 Water Quality Assessment 65 7.1 Introduction 65 7.2 Research methodology 67 7.3 Results and discussion 69
8 Constraints and Potential Aspects and Their Implications 80 8.1 Introduction 80 8.2 Wastewater discharge-related aspect (WRA) 80 8.3 Governmental/administrative-related aspect (GRA) 82 8.4 Community-related aspect (CRA) 83 8.5 Financial aspect 83
9 Suitable Option of Wastewater Management 85 9.1 Objectives and considerations 85 9.2 Strategic actions of wastewater management: a
recommendation 86
10 Conclusions and Recommendations 90
10.1 Conclusions 90 10.2 Recommendations 91
References 93 Appendices 102 Annexes 108

vi
List of Tables NO. TITLE PAGE 2.1 Variation in domestic wastewater composition 92.2 Constituents of wastewater and their impacts on the marine environment 102.3 Some legal tools for controlling coastal and marine pollution and
degradation in Indonesia 16
2.4 Characteristic of collaborative and community-based management 193.1 Selection of the two specific study sites 273.2 Calculated and applied sample size 283.3a Distribution of sample size in Molas District 293.3b Distribution of sample size in Wenang Districts 294.1 Total area of Manado based on land slope condition 314.2 Land use classification of the Manado Area in 1999 364.3 Rivers and predominant land use a long the rivers’ watershed 384.4 Population and density of Manado in 2003 424.5 The result of household surveys on socio-economic parameters 444.6 Number of tourists visiting the Bunaken National Marine Park (BNMP)
in 2001-2006 45
5.1 Degree of knowledge (DK) of community (at household basis) about general environmental issues and issues related to wastewater
51
5.2 Degree of concern (DC) of community (at personal basis) about general environmental conditions and impacts (Topic 1)
52
5.3 Degree of concern (DC) of community (at personal basis) about environmental conditions and impacts related to wastewater discharge (Topic 2)
53
5.4 Community’s (household basis) preference regarding problem solving of environmental issues, including wastewater problems
54
5.5 Community’s preference (personal basis) on problem solving of environmental issue, including wastewater
55
6.1a Distribution of sample size in Molas District (SS 1) used in wastewater treatment system (septic tank) capacity evaluation
59
6.1b Distribution of sample size in Wenang District (SS 2) used in wastewater treatment system (septic tank) capacity evaluation
59
6.2 Criteria for condition and capacity of wastewater treatment system (septic tank) and wastewater infrastructures and facilities (sewer system) used in this present study
61
6.3 Condition, capacity, and presence of residential wastewater treatment system (septic-tank) and wastewater infrastructures and facilities (sewer system).
62
6.4 Pearson’s correlation coefficient (PC) by using the Bivariate Correlations procedure
64
7.1 Characterization and environmental condition (salinity, temperature, and conductivity) of sampling stations during dry (September-October 2002) and wet (January-March 2003) seasons
68
7.2 Concentration of Total coliform (TC), and Escherichia coli (EC) during dry (September-October 2002) and wet (January-March 2003) seasons
75

vii
7.3 Water quality status of the river of Bailang (SB), Maasing (SM), and Tondano (ST)
77
8.1 The slum areas in 3 districts of Manado City in 1999 818.2 Cases of diseases in Manado City in 2002 82
viii
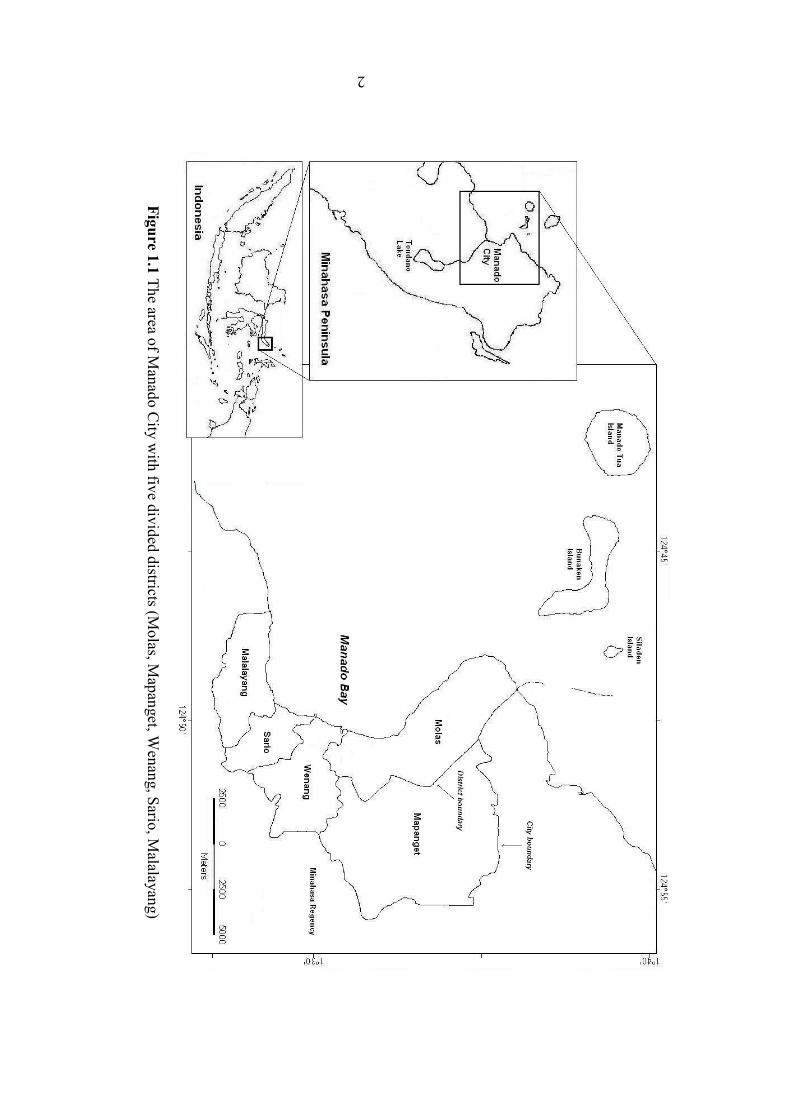
List of Figures NO. TITLE PAGE 1.1 The area of Manado City with five divided districts 21.2 The schematic process of the planning and implementation in integrated
coastal management (ICM) 3
1.3 The schematic diagram of existing situation related to problems, pressures and impacts of wastewater discharge in the coastal area in Manado
5
2.1 Municipal wastewater components 83.1 Scheme of research approach 233.2 Conceptual framework of the study on wastewater management in the
city of Manado, North Sulawesi, Indonesia 25
3.3 Schematic construction of the Study Area and Study Sites 284.1 The area of Manado City 324.2 Topographic condition of Manado City 334.3 Slope gradient of Manado area 344.4 Hydrological condition of Manado City 354.5 Tondano Watershed with Manado City area 374.6 Average annual rainfall (1991-2000) and temperature (1994-2000) 394.7 Bunaken National Marine Park (BNMP) 404.8 Administrative of Manado with 9 districts 415.1 Participation of NGOs in integrated coastal zone management activities 577.1 Map of Indonesia, North Sulawesi Province, Manado City, Study area,
and sampling stations 66
7.2 BOD5 values for 3 rivers in Manado City, SB (a), SM (b), and ST (c) during dry and wet seasons. Stations are shown on Fig. 7.1
70
7.3 NO3- values for 3 rivers in Manado City, SB (a), SM (b), and ST (c)
during dry and wet seasons. Stations are shown on Fig. 7.1 72
7.4 PO43- values for 3 rivers in Manado City, SB (a), SM (b), and ST (c)
during dry and wet seasons. Stations are shown on Fig. 7.1 74
7.5 Concentration of Hg-tot in water (a) and sediment (b) of ST during dry and wet seasons. Stations are shown on Fig. 7.1
76
7.6 Concentration of Hg-tot in water and sediment of ST during dry (a) and wet (b) seasons. Stations are shown on Fig. 7.1
78
7.7 Concentration of Hg-tot accumulated in the marine bivalve Soletellina sp. at the mouth of the river ST
79

ix
Acronyms
ASEAN-MWQC : ASEAN Marine Water Quality Criteria ASL : Above Sea Level AV : Aggregated Values BNMP : Bunaken National Marine Park BOD : Biological Oxygen Demand CAA : City Arrangement Agency CAM : Coastal Area Management CBD : Central Business District CBOs : Community-Based Organizations CE : Cumulative Effects CEO : Community Empowerment Organizations CMB : Cleaning Management Board COD : Chemical Oxygen Demand CRA : Community-Related Aspect DC : Degree of Concern DK : Degree of Knowledge DO : Dissolved Oxygen DWF : Dry-Weather Flow EA : Environmental Assessment EC : Effluent Charges EC : Eschericia coli EEZ : Economic Exclusive Zone EHA : Environmental Health Agency EIA : Environmental Impact Assessment EMB : Environmental Management Board ENCORE : Enrichment of Nutrients on a Coral Reef Experiment ES : Effluent Standards FC : Faecal Coliform GIS : Geographical Information System GPS : Global Positioning System GRA : Governmental/administrative-Related Aspect ICM : Integrated Coastal Management IGR : Indonesian Government Regulation IL : Indonesian Law INS : Indonesian National Standard LGR : Local Government Regulation MB : Manado Bay MC : Manado City MFA : Marine and Fisheries Agency MoE : Ministry of Environment MoF : Ministry of Forestry MPN : Most Probable Number MR : Minahasa Regency N : Nitrogen NAEIM : National Agency for Environmental Impact Management NGOs : Non-Government Organizations OSDS : On-site Sewage Disposal System

x
P : Phosphorous PAEICB : Provincial Agency of Environmental Impact Control Board PC : Pearson’s correlation Coefficient POPs : Persistent Organic Pollutants PS : Public Sector PWA : Public Works Agency RWQS : Receiving Water Quality Standards SA : Study Area SP : Strength of Preference SS : Study Sites TC : Total Coliform TDS : Total Dissolved Solids TSS : Total Suspended Solids UM : Urban Management WQC-GRRI : Water Quality Criteria of Government Regulation of Republic of
Indonesia WRA : Wastewater discharge-Related Aspect WWF : Wet-Weather Flow ASEAN-MWQC : ASEAN Marine Water Quality Criteria ASL : Above Sea Level AV : Aggregated Values BNMP : Bunaken National Marine Park BOD : Biological Oxygen Demand CAA : City Arrangement Agency CAM : Coastal Area Management CBD : Central Business District CBOs : Community-Based Organizations
xi
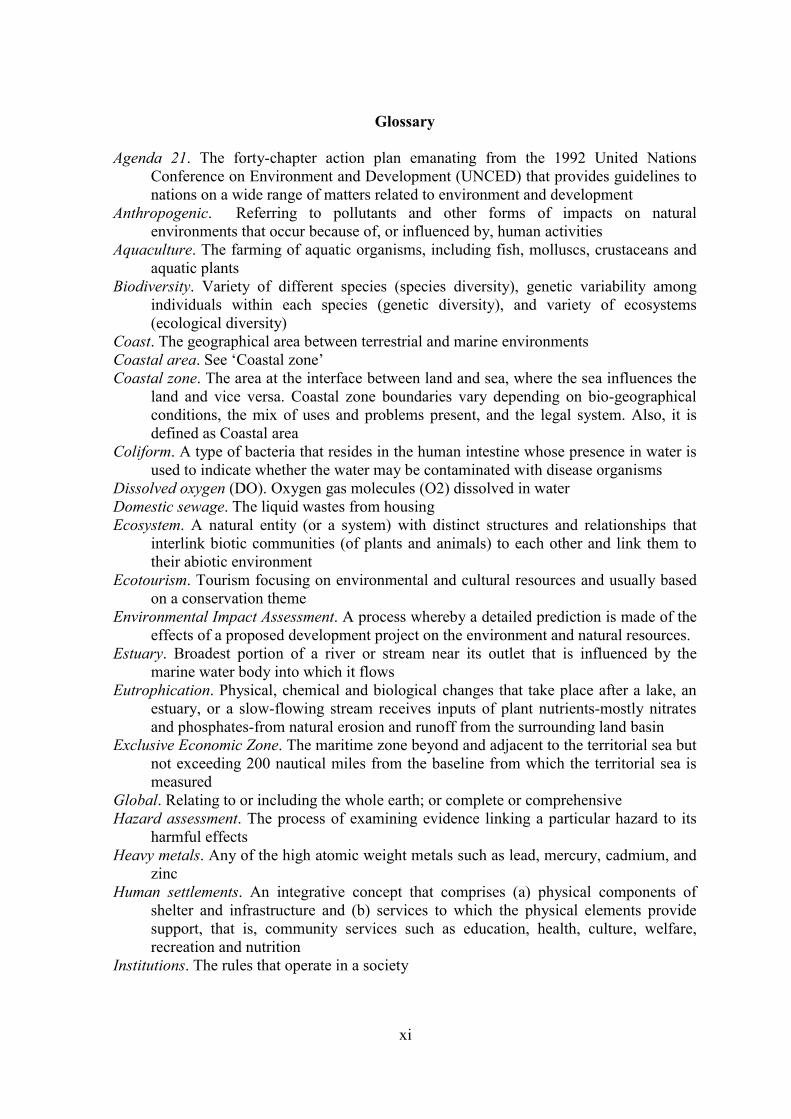
Glossary
Agenda 21. The forty-chapter action plan emanating from the 1992 United Nations
Conference on Environment and Development (UNCED) that provides guidelines to nations on a wide range of matters related to environment and development
Anthropogenic. Referring to pollutants and other forms of impacts on natural environments that occur because of, or influenced by, human activities
Aquaculture. The farming of aquatic organisms, including fish, molluscs, crustaceans and aquatic plants
Biodiversity. Variety of different species (species diversity), genetic variability among individuals within each species (genetic diversity), and variety of ecosystems (ecological diversity)
Coast. The geographical area between terrestrial and marine environments Coastal area. See ‘Coastal zone’ Coastal zone. The area at the interface between land and sea, where the sea influences the
land and vice versa. Coastal zone boundaries vary depending on bio-geographical conditions, the mix of uses and problems present, and the legal system. Also, it is defined as Coastal area
Coliform. A type of bacteria that resides in the human intestine whose presence in water is used to indicate whether the water may be contaminated with disease organisms
Dissolved oxygen (DO). Oxygen gas molecules (O2) dissolved in water Domestic sewage. The liquid wastes from housing Ecosystem. A natural entity (or a system) with distinct structures and relationships that
interlink biotic communities (of plants and animals) to each other and link them to their abiotic environment
Ecotourism. Tourism focusing on environmental and cultural resources and usually based on a conservation theme
Environmental Impact Assessment. A process whereby a detailed prediction is made of the effects of a proposed development project on the environment and natural resources.
Estuary. Broadest portion of a river or stream near its outlet that is influenced by the marine water body into which it flows
Eutrophication. Physical, chemical and biological changes that take place after a lake, an estuary, or a slow-flowing stream receives inputs of plant nutrients-mostly nitrates and phosphates-from natural erosion and runoff from the surrounding land basin
Exclusive Economic Zone. The maritime zone beyond and adjacent to the territorial sea but not exceeding 200 nautical miles from the baseline from which the territorial sea is measured
Global. Relating to or including the whole earth; or complete or comprehensive Hazard assessment. The process of examining evidence linking a particular hazard to its
harmful effects Heavy metals. Any of the high atomic weight metals such as lead, mercury, cadmium, and
zinc Human settlements. An integrative concept that comprises (a) physical components of
shelter and infrastructure and (b) services to which the physical elements provide support, that is, community services such as education, health, culture, welfare, recreation and nutrition
Institutions. The rules that operate in a society

xii
Integrated coastal management (ICM). A continuous and dynamic process by which decisions are made for the sustainable use, development, and protection of coastal and marine areas and resources
Land reclamation. A type of coastal construction activity aimed at gaining land from the sea
Mariculture. The farming of marine finfish, molluscs, crustaceans, and seaweed Mitigation. The prevention, elimination, reduction, or control of a project’s negative
environmental effects by avoiding or minimising the effects Natural resources. Any portion of the environment, such as air, water, soil, botanical and
zoological resources and minerals PAHs. Polycyclic Aromatic Hydrocarbon PCBs. Group of 209 different toxic, oily, synthetic chlorinated hydrocarbon compounds
that can be biologically amplified in food chains and webs Pathogen. An organism that produces diseases Peri-urban areas. Areas are characterized by a mixture of land uses associated with a
range of urban and rural livelihoods Pollutant. A particular chemical or form of energy that can adversely affect the health,
activities, or survival of humans or other living organism Pollution. An undesirable change in the physical, chemical, or biological characteristic of
air, water, soil, or food that can adversely affect the health, activities or survival of humans or other living organism
Precautionary principle. The principle that preventive or remedial action should be taken, on the basis of the best available scientific evidence, to avoid making policy decisions that have irreversible adverse effects on the environment
Risk assessment. A technique to quantify risks Risk management. The task of regulators, involving reviewing the risk data and making
regulatory, decisions based on the evidence Stakeholder. Individuals and groups of individuals (including government and non-
governmental institutions, traditional communities, universities, research institutions, development agencies, banks and donors) with an interest or claim (whether stated or implied) that has the potential of being affected by or affecting a given project and its objectives
Sustainable development. A development that meets the needs of the present without compromising the ability of future generations to meet their own needs
Tropical Area. It refers to low-latitude climate that is characterised by consistently warm and humid conditions
Upland. A term describing land areas sufficiently inland from the shoreline to have limited interaction with the sea
Wastes. Useless or discarded material, as ashes, garbage, sewage, etc or matter excreted from the body, as faeces or urine
Watershed. The total land area that drains directly or indirectly into a particular stream or river
1
Chapter 1 Introduction
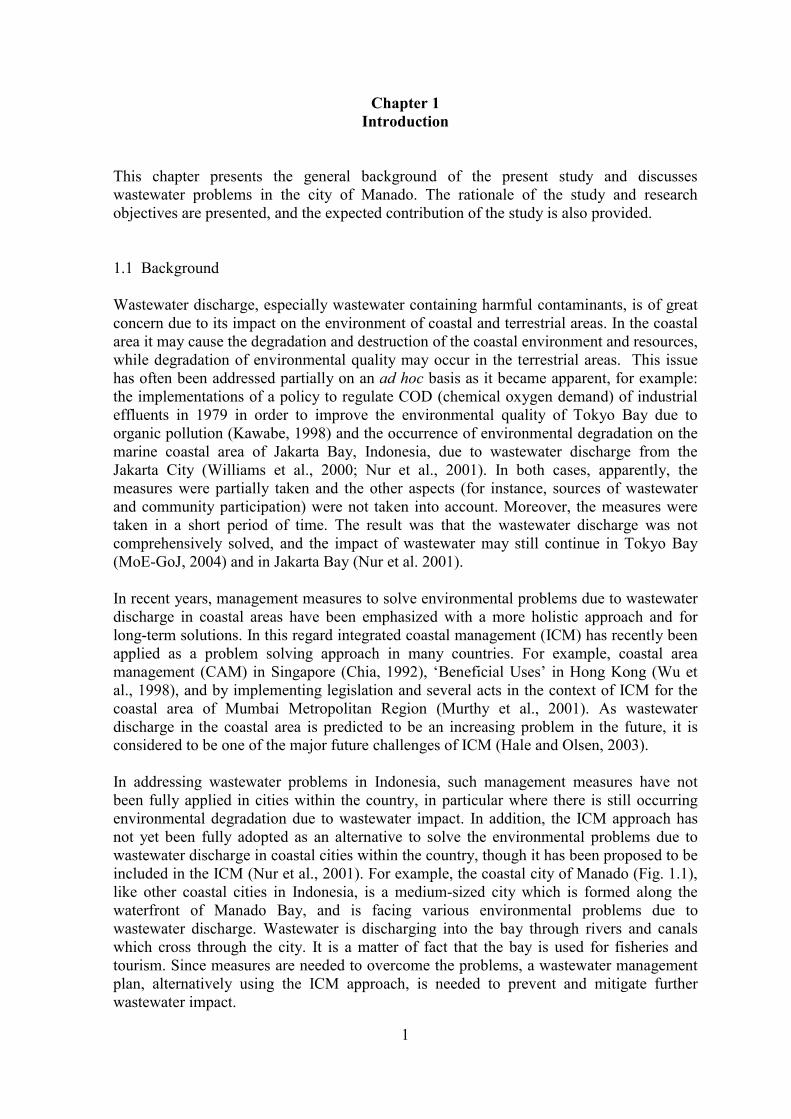
This chapter presents the general background of the present study and discusses wastewater problems in the city of Manado. The rationale of the study and research objectives are presented, and the expected contribution of the study is also provided. 1.1 Background Wastewater discharge, especially wastewater containing harmful contaminants, is of great concern due to its impact on the environment of coastal and terrestrial areas. In the coastal area it may cause the degradation and destruction of the coastal environment and resources, while degradation of environmental quality may occur in the terrestrial areas. This issue has often been addressed partially on an ad hoc basis as it became apparent, for example: the implementations of a policy to regulate COD (chemical oxygen demand) of industrial effluents in 1979 in order to improve the environmental quality of Tokyo Bay due to organic pollution (Kawabe, 1998) and the occurrence of environmental degradation on the marine coastal area of Jakarta Bay, Indonesia, due to wastewater discharge from the Jakarta City (Williams et al., 2000; Nur et al., 2001). In both cases, apparently, the measures were partially taken and the other aspects (for instance, sources of wastewater and community participation) were not taken into account. Moreover, the measures were taken in a short period of time. The result was that the wastewater discharge was not comprehensively solved, and the impact of wastewater may still continue in Tokyo Bay (MoE-GoJ, 2004) and in Jakarta Bay (Nur et al. 2001). In recent years, management measures to solve environmental problems due to wastewater discharge in coastal areas have been emphasized with a more holistic approach and for long-term solutions. In this regard integrated coastal management (ICM) has recently been applied as a problem solving approach in many countries. For example, coastal area management (CAM) in Singapore (Chia, 1992), ‘Beneficial Uses’ in Hong Kong (Wu et al., 1998), and by implementing legislation and several acts in the context of ICM for the coastal area of Mumbai Metropolitan Region (Murthy et al., 2001). As wastewater discharge in the coastal area is predicted to be an increasing problem in the future, it is considered to be one of the major future challenges of ICM (Hale and Olsen, 2003). In addressing wastewater problems in Indonesia, such management measures have not been fully applied in cities within the country, in particular where there is still occurring environmental degradation due to wastewater impact. In addition, the ICM approach has not yet been fully adopted as an alternative to solve the environmental problems due to wastewater discharge in coastal cities within the country, though it has been proposed to be included in the ICM (Nur et al., 2001). For example, the coastal city of Manado (Fig. 1.1), like other coastal cities in Indonesia, is a medium-sized city which is formed along the waterfront of Manado Bay, and is facing various environmental problems due to wastewater discharge. Wastewater is discharging into the bay through rivers and canals which cross through the city. It is a matter of fact that the bay is used for fisheries and tourism. Since measures are needed to overcome the problems, a wastewater management plan, alternatively using the ICM approach, is needed to prevent and mitigate further wastewater impact.
2
Figure 1.1 The area of Manado C
ity with five divided districts (M
olas, Mapanget, W
enang, Sario, Malalayang)
2

3
The need to manage the coastal city of Manado in relation to wastewater discharge is a matter of great importance. However, it should be planned and designed comprehensively prior to implementation. Hence, the present study is focused on the wastewater management of the city by formulating strategic actions prior to designing a management plan in order to improve the wastewater management of the city. In formulating such actions, an important first step is that the status of various aspects associated with the wastewater discharge issues should be identified, described, analyzed and understood comprehensively. In this regard, research, encompassing problem identification, analysis and evaluation, was conducted prior to the formulation. In addition, the ICM approach is used as a basic concept approach in designing this study (Fig. 1.2). 1.2 Wastewater Problem in the City of Manado In Indonesia, many policies, strategies and actions of environmental management related to wastewaters have been formulated at regional (provincial) and national levels in Agenda 21 of North Sulawesi Province (Bapedal-Sulut, 2003) and Agenda 21 of Indonesia (KMNLH, 1996a), respectively. However, at the city level of Manado City, such measures are apparently not available, whereas in fact, wastewater discharge is predicted to increase as the coastal and coast-related inland areas of Manado are being developed for various
PLANNING
Figure 1.2 The schematic process of the planning and implementation in integrated coastal management (ICM) (Adopted from NOAA, 1995).
Problem Identification
Research
Analysis Designing
IMPLEMEN-TATION
Installation
Operation & Maintenance
Monitoring
Enforcement
Financing
Desired product & Services
Evaluation
Present study

4
economic activities. At present, the opportunity to establish such management is more realistic since the Indonesian Law (IL) No. 22 of 1999, concerning autonomy and decentralization, has been implemented since early January 2000. The IL states that a city- or a regency-level of government has its own authority to manage the resources found in their areas including protection and conservation measures. Based on a preliminary observation of the wastewater problem in the city of Manado, there are two main factors acting as driving forces, which may cause the destruction of the coastal ecosystem habitat and the reduction of coastal resources of Manado Bay. They are: increasing population, and development activity (Fig. 1.3). The rapid increase of population in the city of Manado is stimulating the increase of housing settlements and other related infrastructures and facilities. This causes an increase of wastewater-point sources, and may increase the quality and quantity of wastewater discharge from the city. In the end, this situation may have an impact on the environment of the terrestrial and coastal marine areas of the city. The development of economic activities, particularly in the tourism and trade sectors, is increasing in the city. Both sectors, together with education, have been selected by the Manado City’s Council as the ‘sectors of priority’ for development. Many policies are being established and acted upon to accommodate such priorities, especially for economic activities (small- and large-scale). For example, there are plans for the coastal area of Manado to be a centre of business, the so-called ‘central business district’ (CBD). Related to this, various commercial buildings (tourist facilities, shops/malls, cottages, and hotels), transportation (marinas, ports, harbors) and infrastructures are being developed in order to support this development. In contrast, those economic activities will threaten the environment of the terrestrial and coastal areas of the city by increasing wastes and wastewater discharges. With regards to wastewater management in the city of Manado, several issues have been identified that are grouped into the community-related aspect (CRA), the wastewater-related aspect (WRA), and the government/administrative-related aspect (GRA). Those issues encompass community participation, physical and technical aspects, environmental conditions related to discharge wastewater, and policy and program related to wastewater management. The following are descriptions of the issues: 1. At the city-level of Manado, there are no cases where the community has taken an
initiative to prevent and mitigate wastewater problems. On the contrary, they are the source of discharged wastewater. This may be due to a lack of environmental awareness in the community. Therefore, the community’s environmental knowledge and attitude in relation to the wastewater issue are still in question.
2. Household activities that produce wastewater increase as the population increases. This is predicted to have a negative impact on the coastal and marine environment. To prevent and mitigate the impact, adequate physical measures (wastewater treatments, infrastructures and facilities) at household level should be introduced. In order to formulate measures related to this issue, the status of wastewater treatment and facilities at the household level are still in question.
3. Most enterprises and households can freely discharge their wastewater including pollutant-containing wastewater into the coastal environment through sewers, drainage, and river systems. The impact of the discharge to the river systems is still unknown.

5
4. Measures for management and planning (policy, program, etc.) related to wastewater issues have not been established at the city-level of Manado and the institutional structure of the government, seemingly, is not adequate to support the management of this. Therefore, suitable options for wastewater management system and strategic actions to prevent and/or mitigate wastewater impact should be formulated, and government’s institutional structure should be evaluated.
5. The socio-economic status of the city’s residents is unknown; though, low personal incomes for most people are known throughout the country. Hence, the socio-economic status for the city of Manado should be evaluated.
Figure 1.3 The schematic diagram of the existing situation related to problems, pressures and impacts of wastewater discharge in the coastal area in Manado
Rapid population increase
Increasing economic growth
Human activities
Human settlement
Increasing large-& small-scale commercial
enterprises
Tourism & commercial
buildings
Population
Harbor, port infrastructures
Destruction of coastal ecosystem habitats & reduction of coastal
resources of Manado Bay
Development Policy
Increasing wastes & wastewater
discharge

6
1.3 Rationale of the Study Wastewater discharge in the city of Manado should be managed in order to prevent and mitigate its impact on the environment of the terrestrial and the coastal and marine ecosystems of Manado Bay. In such management, various aspects should be taken into account and understood comprehensively as the city has its own characteristics. Therefore, a management plan should be designed based on the city’s characteristics. Prior to the designing, the status of various aspects related to wastewater discharge should be described, evaluated, and analyzed, and primary strategic actions should be formulated. 1.4 Objective of the Study The overall goal of the research is to study the current wastewater management system, identify constraints and potentials of wastewater-related aspects, and formulate strategic actions prior to designing a wastewater management plan, and to improve the management for mitigation and protection measures to address wastewater discharge in the coastal area of Manado City. In order to achieve this goal, several specific topics were studied, which have the following objectives: 1. To describe and assess existing aspects (natural settings and population, socio-
economic aspects, present government institutional structure) related to wastewater management in the city;
2. To evaluate and assess the community’s environmental knowledge and attitude related to wastewater problems in the city;
3. To evaluate and assess the wastewater treatment system (septic tank) and wastewater infrastructures and facilities (sewer system) at households level;
4. To evaluate and assess the water quality of rivers, as wastewater receivers, which cross the city;
5. To analyze the constraint and potential aspects for wastewater management in the city; 6. To formulate strategic actions as a recommendation to improve wastewater
management in the city. 1.5 Scope of the Study This study is limited to domestic wastewater from household activities and urban runoff, while other wastewater sources (for instance, from industrial activity) was not included, as such activity was none in the city of Manado. Besides, the data for domestic wastewater were collected at a house unit/household level in which a household is consisted more than two individuals (parents and their children); and for urban runoff, water samples for analysis were collected at river systems. The study covered the city of Manado, especially at two selected districts Molas and Wenang. The secondary data about districts of Molas and Wenang used in this study were mostly up to 2001 and from 2003 (when the number of districts had changed from 5 to 9). There are several parameters for assessment of water quality. Due to time limitation, budget constraints and limited laboratory equipments and facilities, this study measured BOD5, NO3
-, PO4-3, Eschericia coli and total coliform, and mercury only for environmental
parameters.

7
Chapter 2 Literature Review
This chapter presents the results of a comprehensive literature review on the impacts of human activities to the coastal area with emphasis on wastewater discharge and urban wastewater management systems. It discusses the basic definitions of coastal area and wastewater including their characteristics, impacts of wastewater in the coastal areas, and some coastal planning and management measures related to wastewater. 2.1 Definition and Characteristic 2.1.1 Coastal area ‘Coastal zone’ or ‘coastal area’? Some authors use one or the other of these terms in order to discuss the dynamics of coastal systems. Clark (1992), Hoozemans et al., (1995), and Cicin-Sain & Knecht (1998), use ‘coastal zone’; while Chia (1992), Scialabba (1998), and Kay & Alder (1999) use ‘coastal area’; but Brown (1997) did not mention the terms at all when she discussed integrated coastal management. None of them discussed the use of this unstable term, except that Kay & Alder (1999) briefly stated that ‘zone’ and ‘area’ have little distinction in common English. However, they suggest that ‘zone’ could be implied to mean a planning zone, and they use ‘area’ or simply ‘at the coast’ or ‘on the coast’, except when they quote from original sources which use the term ‘coastal zone’. In the present review the terms are used in the way that Kay & Alder (1999) used them, without any consideration to quotations, i.e. ‘coastal area’ will be used except when referring to planning zones. Coastal areas are defined in many ways by different authors depending on the purpose of the description and their professional background, while there is no internationally accepted definition (ADB, 1991; Hoozemans et al., 1995). The purposes could be oriented towards academic interest for planning and management, and governments for administration, etc. Some definitions from various sources provided are: an interaction between terrestrial and marine components (ADB, 1991); the gradual transitional region forming the boundary between the land and ocean (Kay & Alder, 1999). Ketchum (1972) cf Kay & Alder (1999) defined this area as the band of dry land and adjacent ocean space (water and submerged land) in which terrestrial processes and land uses directly affect oceanic processes and uses, and vice versa. However, the 200 nautical miles limit from land over which coastal nations exert sovereignty [Economic Exclusive Zone (EEZ)] is an international legal definition for the coastal zone (Brown, 1997; Cicin-Sain & Knecht, 1998; Kullenberg, 1999). The coastal area is characterized by three elements, i.e., 1) it contains both land and ocean components; 2) it has land and ocean boundaries that are determined by the degree of influence of the land on the ocean and the ocean on the land; 3) and it is not of uniform width, depth, or height. After the geographical boundaries are used to define the coastal area, all components found inside the area can be characterized. Such specific characteristics have been discussed in detail by ADB (1991), Chia (1992), Hoozemans et al. (1995), Brown (1997) and Scialabba (1998). In addition, urban (city) waterfront is also included (Vallega, 2001).

8
2.1.2 Wastewater Wastewater is sewage, storm-water and water that have been used for various purposes within a community. Most communities generate wastewater from both residential and non-residential sources (Anonymous, 2001a). It contains a mixture of liquid wastes, which consist of domestic wastewater, urban runoff, and effluents from commercial and industrial activities (Fig. 2.1). The non-residential component is generated from a variety of sources, such as offices, businesses, department stores, restaurants, schools, hospitals, farms, manufacturers, and other commercial, industrial, and institutional entities (Anonymous, 2001a & b). Storm-water is a non-residential source; it carries trash and other pollutants from streets, as well as pesticides and fertilizers from yards and fields (Anonymous, 2001b & c).
There are two types of domestic wastewater, i.e., (1) black-water, or wastewater from toilets; (2) and grey-water, which is wastewater from all sources except toilets. Both contain pollutants and disease-causing agents (Anonymous, 2001a). The proportions of liquid and solid parts are about 99.9 and 0.1%, respectively, and the solid part consists of 70% organic (especially protein, carbohydrate, and fat) and 30% in-organic materials (sand particles, salts, and metals) (Kusnoputranto, 1997). Composition of the materials (TDS, TSS, N, P), BOD, COD and coliform bacteria in the domestic wastewater are shown in Table 2.1. The usual BOD values for domestic wastewater range between 100 and 500 mg/l. The number of coliform in domestic wastewater is about 1.9 x 10⁷ per 100ml (Ortiz-Hernandez & Saenz-Morales 1999). Faecal coliform (FC) together with total coliform (TC) is used as indicators for human-generated microbial pollution (Ortiz-Hernandez & Saenz-Morales, 1999; Dionisio, et al. 2000). According to Vandermeulen (1998), FC contamination could be used to assess human pathogens, biotoxins and diseases in the marine environment. The FC is used as an indicator of the level of sewage treatment of coastal communities, bacterial counts in shellfish growing areas and marine bathing beaches, and to decide about closure of shellfish growing areas.
Household activity, hotels,
etc.
Industrial activity
Urban runoff
Black water (toilet)
Grey water (kitchen, bathroom)
Pre-treated & Untreated
Domestic wastewater
Combined sewer
Municipal wastewater
Separated sewer Stormwater drainage
Figure 2.1 Municipal wastewater components (modified from Anonymous, 2001b)

9
Concerning the black-water, such wastewater has specific characteristics. It is generated from daily human activity and may cause diseases in humans. Pathogenic micro-organisms, especially bacteria, may be found in this wastewater (Reed et al,. 1995; Kusnoputranto, 1997). Feachem et al. (1983 cf Kusnoputranto 1997) reported that Klebsiella pneumonia and K. rhinoscleromatis are characteristically found in black-water. Previously, Bacillus coli (the former name of Escherichia coli) were isolated by Escherich in 1885 from choleric faeces (Kusnoputranto, 1997). Table 2.1 Variation in Domestic Wastewater Composition (Veenstra et al., 1997)
Parameter Specific
production (per capita/day)
Concentration (Based on 60 and 250 liters of water consumption per capita/day) (mg/l)
Total dissolved solids (TDS) 100–150 g 400–2,500 Total suspended solids (TSS) 40–80 g 160–1,350 Biological oxygen demand (BOD) 30–60 g 120–1,000 Chemical oxygen demand (COD) 70–150 g 280–2,500 Nitrogen (Kjeldahl-N) 8–12 g 30–200 Total phosphorous (P) 1–3 g 4–50 Faecal coliform 108–109 104–106/100 ml
2.2 Wastewater in Coastal and Marine Areas 2.2.1 Status of wastewater Wastewater entering coastal and marine environments (environment of coastal and marine areas have significant relationships in this regard) carry all components ranging from organic to inorganic, from degradable to un-degradable, and from less to highly toxic, etc. Those components may come from urban and rural areas, and all sites inland (up- and low-land). Because of this, wastewater is considered as an important source of contamination in coastal areas (Ortiz-Hernandez & Saenz-Morales, 1999; Dyer et al., 2003; Ukwe et al., 2003). Wastewater is not a pollutant per se (NOAA, 1995). The wastewater discharged into the environment can be categorized as a pollutant if it destroys the living and non-living constituents in the environment, or reduces the productivity of the environment or dislocates the normal uses of the environment. A pollutant can be defined as a matter and energy discharge into an environment which destroys the living and non-living constituents in the environment and causes harm to humans (Ouano, 1988; Miller, 1996). Tebbutt (1992) considered two types of pollutants, namely (1) conservative, i.e. materials that are not affected by natural processes; and (2) non-conservative, i.e. materials that can be degraded by natural processes, including most organics, some in-organics and many micro-organisms. 2.2.2 Wastewater impact from an ecological aspect Wastewater is mostly water by weight. Other materials make up only a small portion, but can be present in large enough quantities to endanger public health and the environment (Anonymous 2001a, b & c). And, since anything can be flushed out in a toilet, drain, or

10
sewer, many potential pollutants can be found in the wastewater that can cause disease or have detrimental environmental effects. Such wastewater should be of the most concern to communities. Various impacts are caused by wastewater discharge to coastal water (Table 2.2). It may influence dissolved oxygen, dissolved inorganic and organic carbon, and the conductivity of receiving waters (Daniel, et al. 2002). For example, in Chetumal Bay, Quintana Roo, Mexico, the BOD of coastal water reached 32.26 mg/l (mean value) and ranged from 22.61-38.96 mg/l due to wastewater discharge. Standard BOD5 for coastal waters is less than 10 mg/l (Clark, 1996) and usual BOD values for domestic wastewater range between 100 and 500 mg/l. The mean dissolved oxygen (DO) was 2.63 mg/l, with a range from 0.47-3.73 mg/l at the mouth of the discharge. The most important source of water pollution in that area was attributable to wastewater discharges (Ortiz-Hernandez & Saenz-Morales, 1999; Dyer et al., 2003; Ukwe et al., 2003).
Table 2.2 Constituents of Wastewater and Their Impacts on the Marine Environment
(Windom, 1992) Type of Constituent Impact
Solids High levels of suspended solids may cause excessive turbidity and shading of sea grasses and result in sedimentation, which is potentially damaging to benthic habitats and can cause anaerobic conditions at the sea bottom. Fine particles may be associated with toxic organics, metals, and pathogens that adhere to these solids.
Organic matter Biological degradation of organic matter requires oxygen and can deplete available dissolved oxygen. The strength of wastewater is commonly expressed in terms of the biochemical oxygen demand (BOD) parameter. High BOD levels in natural waters can cause hypoxia and anoxia, especially in shallow and enclosed aquatic systems, resulting in fish death and anaerobic conditions. Anaerobic conditions subsequently result in the release of bad odors from the formation of hydrogen sulphide.
Nutrients Nutrients, like nitrogen and phosphorous, increase primary production rates (of oxygen and algal biomass); adverse levels cause nuisance algal blooms (including toxic algal blooms), dieback of corals and sea grasses, and eutrophication that can lead to hypoxia and anoxia, suffocating living resources (fish). Massive die-off of algal matter will result in additional organic matter.
Pathogens Pathogens can cause human illness and possible death. Exposure to pathogens via contact with contaminated water or consumption of contaminated shellfish can result in infection and disease.
Toxic organic chemicals (Persistent organic pollutants, or POPs)
Many toxic materials are suspected carcinogens and mutagens. These materials can concentrate in shellfish and fish tissue, putting humans at risk through consumption. Bioaccumulation affects fish and wildlife at higher levels of the food chain.
Metals Metals in specific forms can be toxic to various marine organisms and humans; shellfish are especially vulnerable in areas with highly contaminated sediment.
Fats, oil, and grease Fats, oil, and grease float on the surface of seawater, interfere with natural aeration, are possibly toxic to aquatic life, destroy coastal vegetation, reduce recreational use of water and beaches, and threaten waterfowl.

11
Tourism activity in coastal areas should also be considered as a source of wastewater. Existence of this activity is associated with several types of impacts, such as environmental, economic and socio-cultural, positive or negative, direct or indirect, immediate or cumulative, short-term or long-term (Wong, 1998). It has been found that such activity is a main cause of a decline in local water quality (Saenger, 1989 cf Clark, 1992). Sewage discharge resulting from tourism activity, particularly if poorly sited or inadequately treated, is the most common source of adverse effects on the biota. For example, in the Caribbean region, less than 10 % of the sewage generated is treated and bacterial levels regularly exceed international standards for recreational contact waters, typically 200 MPN (Most Probable Number) coliform (Clark, 1992). Another study reported that an on-site sewage disposal system (OSDS), for example septic tank, in recreational and tourist areas caused the infection of human enteric pathogen (Cryptosporodium, Giardia and enteroviruses) in Sarasota Bay (Lipp et al., 2001) and Gulf of Guinea (Ukwe et al., 2003). The relationship between the consumption of polluted fish and human health has become more firmly established. Filter-feeding molluscan shellfish concentrate bacteria and viruses such as hepatitis, typhoid, dysentery and cholera, present in untreated discharges of human sewage, along with other particulate materials. The consumption of contaminated shellfish may cause enteric infections, and the transmission of infectious hepatitis through the consumption of raw, sewage-contaminated shellfish is well documented. Dysentery is thought to have been transmitted by the consumption of cockles in Malaysia, and epidemics of typhoid and hepatitis are linked to the consumption of the shellfish contaminated by sewage in Vietnam. Because the decomposition of sewage contaminants competes for oxygen with finfish larvae and shellfish, this may lead to economic losses by reducing the fish production. In the Philippines, for example, the production of mussel and oyster beds in Manila Bay as well as brackish water fishponds north of Manila is thought to be reduced as a result of sewage discharge (Ruddle, 1982). Generally, the effect of urban development and anthropogenic activities (industry, settlement, agriculture, etc.) cause substantial physical changes in coastal waterways through the hardening and reclamation of river banks, alteration of water flow, affected coastal communities, and the diffuse and point-source discharge of pollutants (Ahn & Choi, 1998; Rawlins et al., 1998; Tuncer et al., 1998; Virkanen, 1998; Inglis & Kross, 2000; Dyer et al., 2003; Mallin et al., 2007). However, research on the effect of discharging municipal wastewater to benthic macrofauna and community structure in Futian National Mangrove Reserve concluded that there was no significant effect on total mean biomass and density (particularly of molluscs and crustaceans) (Yu et al., 1997). Pollution of near shore waters adjacent to coastal cities has long been a problem due to the discharge of wastewater. For example Jakarta, Indonesia, like many capital cities in developing countries, has experienced a rapid population and industrial growth, which has caused pollution (metals contamination) in Jakarta Bay (Williams et al., 2000; Nur et al., 2001). This growth, however, has been at a cost, namely the degradation of the coastal environment of Jakarta Bay and adjacent coral reefs (Kepulauan Seribu), primarily from pollution (Kay & Alder 1999). Such land-based pollution is one of the causes of reef degradation and decreased coral biodiversity in other marine coastal areas (Ambon, Jepara, Karimun Jawa Islands, and South Sulawesi) in Indonesia (Edinger et al., 1998). In Hong Kong, sewage and industrial pollution have resulted in a decrease in dissolved oxygen and an increase in nutrients and Escherichia coli in many coastal areas (Wu et al., 1998). It is

12
also the cause of the occurrence of persistent organic contaminants (Connell et al. 1998), and of heavy metal accumulation (Owen & Sandhu, 2000) in the marine areas. Wastewater contains a large number of organic materials and the impact of such materials in coastal water causes euthrophication. Euthrophication is the process of the enrichment of water with plant nutrients, primarily nitrogen and phosphorus that results in the increase of aquatic primary production and leads to visible algal blooms. Such euthrophication is not characterized as an adverse effect on the ecosystem during the first stage, since it has many positive aspects. The impact is the continuous and unlimited increase of the concentration of plant nutrients that can have a negative environmental impact, such as the reduction of oxygen concentration, the change of marine biodiversity, poor water quality, turbidity and an increase of organic matter concentrations (Clark, 1996; Kitsiou & Karydis, 2001). Nutrient enrichment in marine coastal areas, based on the ENCORE (Enrichment of Nutrients on a Coral Reef Experiment) study, may also affect coral reproduction, induce significant biotic responses on reef organisms, affect the calcification rate and linear extension making coral more susceptible to breakage, reduce all coral larval settlements, and affect other activities related to reef organisms (Koop et al., 2001). The occurrence of pollutants in the ecosystem of coastal and marine areas and discharge together with wastewater from urban areas may be influenced by many factors. Two of these are characteristics of the pollutants and prevailing weather in that area. For instance, pesticides and heavy metals may potentially contaminate soil and plants after being discharged to a wastewater disposal site. In this case, the distribution of pesticides in the soil and wastewater was influenced by the solubility of such pesticides so that the higher the solubility the more is present in the water phase (Jiries et al., 2002). Besides, contamination is also influenced by weather (wet or dry). McPherson et al., (2002) investigated the difference in annual pollutant loads between two different weathers, dry [dry-weather flow (DWF)] and wet [wet-weather flow (WWF)]. They indicated that the WWF was the major non-point source of pollutants including trace metals in the Ballona Creek watershed, California, while the DWF contribution is low. However, DWF loads may still be adversely affecting near coastal ecosystems such as wetlands and small estuaries. Buffleben et al. (2002) have also indicated that the WWF carries a significant amount of hazardous metals into the Santa Monica Bay, California as the receiving water area. To understand more about the source, fate, behavior, and effect of chemicals and other pollutants in the environment is an academic challenge. However, it is more that that; it requires understanding of issues that affect and shape the use, regulation and control of thousands of chemicals of commerce (Jones, 2007). 2.2.3 Mitigation of wastewater problems and management Wastewater management is urgently needed in order to prevent and mitigate the wastewater impacts (Engin & Demir, 2006) besides the establishment of pollution monitoring programs (Zhang et al., 2006; Sheppard, 2007). From this point of view, wastewater problem solving measures applied in a coastal area should be put into a more integrated context than the on-site management. As so many different stakeholders, types, sources and impacts of pollutants are involved, the wastewater aspect should be evaluated

13
and analyzed from an integrated point of view [taking all parts of the system, that is the sewer system, wastewater treatment plant, and receiving waters into consideration (Buffleben et al., 2002)]. In this case, communities (including private sectors) and governments should combine their efforts and resources into an integrated management measure (Shatkin, 2007). This could be an option to increase participation for conducting wastewater management. However, institutional and political factors could be barriers to implementing this issue option (Akbar et al., 2007). A certain model of wastewater management system could be applied by a city, whether a centralized or decentralized system. In former times, a centralized system was thought to be easier to be planned and managed. But nowadays, based on some experiences, such a system has deficiencies, in which it is particularly poor at reaching peri-urban areas and, therefore, a decentralized system is adopted as appropriate for such areas (Parkinson and Tayler, 2003). According to Parkinson and Tayler (2003), decentralized systems are more compatible with decentralized approaches to urban management than centralized systems. In a broad sense “… the implications of decentralization on wastewater management systems relate to planning and decision-making, design of physical infrastructure, and management arrangements for operations and maintenance” (Parkinson and Tayler, 2003). A wastewater treatment system is a component of wastewater management; it is important for sustainable wastewater management (Engin & Demir, 2006). Several techniques could be applied; they can be from a direct wastewater treatment system (Reed et al., 1995; Engin & Demir, 2006) to a reused wastewater system (Brown, 1997; Ye et al., 2001; Morgan, 2004; Friedler et al., 2006). Niemczynowicz suggested two possible scenarios for a wastewater treatment system (Kärrman, 2001). Firstly, is the high technology option with continuation, development and complementation of present technology. Secondly, are low-cost, low-energy solutions based on the application of biological systems and the recycling of resources. The second scenario will lead to a less vulnerable and more sustainable society, compared with the first one. Based on Niemczynowicz’s action plan, another two scenarios can be suggested; first is a centralized wastewater treatment system with off-site concentration and storage, second is the decentralized wastewater treatment system with on-site concentration and storage. However, the application of such systems has various implications (Bakir, 2001; Roomratanapun, 2001; Tsagarakis et al., 2001; Al-Sa’ed and Mubarak, 2006). The decentralized wastewater treatment system mainly focuses on an on-site wastewater treatment and disposal system, in which the typical system for individual homes consists of a septic tank and a gravity-operated, subsurface soil absorption system (Reed et al., 1995). This system includes either fully high-tech technology or an in-community participation system. The system provides a simple, low-cost and low maintenance method (Burkhard et al., 2000; Parkinson and Tayler, 2003) and implies managing wastewater as close as is practical to where it is generated and to where its potential beneficial reuse is located. This comprises systems from the smallest single household system to a system with several smaller subsystems for collection, treatment, and reuse for a small community (Bakir, 2001). This system has been applied worldwide in several countries, such as the Middle East and North African countries (Bakir, 2001). However, for small Palestinian communities, the system is unsustainable as it was not appropriate for the community (Al-Sa’ed and Mubarak, 2006).
14
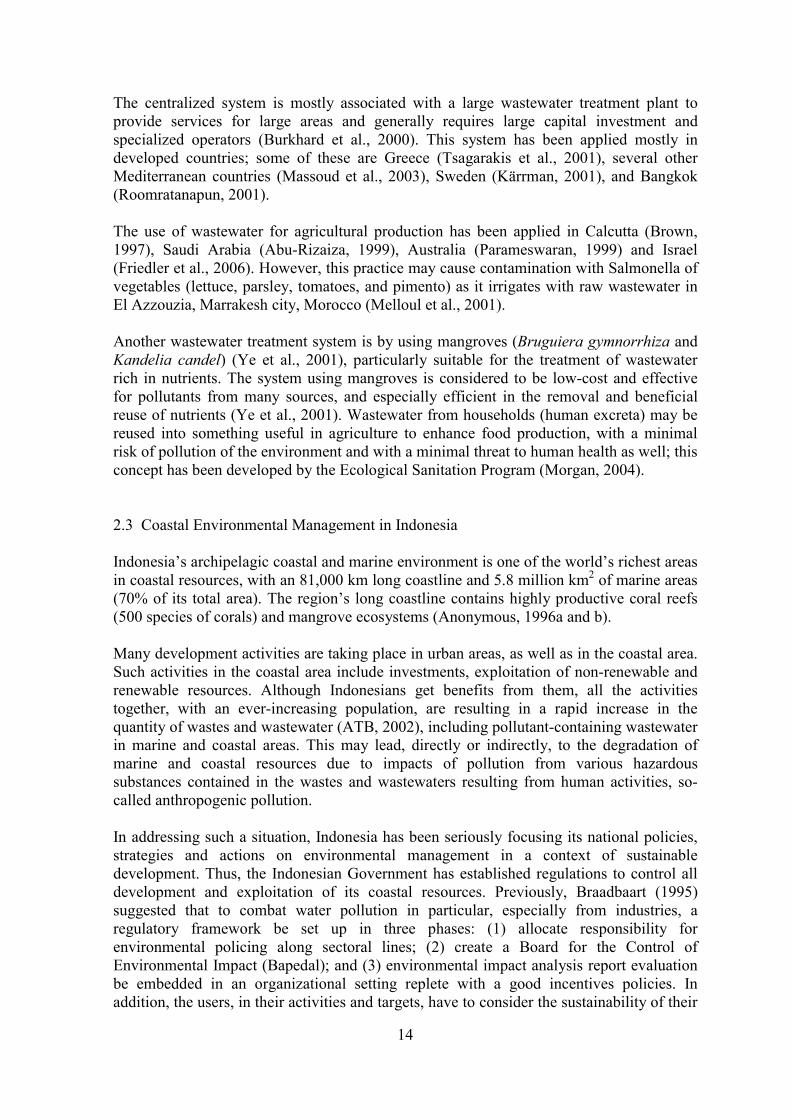
The centralized system is mostly associated with a large wastewater treatment plant to provide services for large areas and generally requires large capital investment and specialized operators (Burkhard et al., 2000). This system has been applied mostly in developed countries; some of these are Greece (Tsagarakis et al., 2001), several other Mediterranean countries (Massoud et al., 2003), Sweden (Kärrman, 2001), and Bangkok (Roomratanapun, 2001). The use of wastewater for agricultural production has been applied in Calcutta (Brown, 1997), Saudi Arabia (Abu-Rizaiza, 1999), Australia (Parameswaran, 1999) and Israel (Friedler et al., 2006). However, this practice may cause contamination with Salmonella of vegetables (lettuce, parsley, tomatoes, and pimento) as it irrigates with raw wastewater in El Azzouzia, Marrakesh city, Morocco (Melloul et al., 2001). Another wastewater treatment system is by using mangroves (Bruguiera gymnorrhiza and Kandelia candel) (Ye et al., 2001), particularly suitable for the treatment of wastewater rich in nutrients. The system using mangroves is considered to be low-cost and effective for pollutants from many sources, and especially efficient in the removal and beneficial reuse of nutrients (Ye et al., 2001). Wastewater from households (human excreta) may be reused into something useful in agriculture to enhance food production, with a minimal risk of pollution of the environment and with a minimal threat to human health as well; this concept has been developed by the Ecological Sanitation Program (Morgan, 2004).
2.3 Coastal Environmental Management in Indonesia Indonesia’s archipelagic coastal and marine environment is one of the world’s richest areas in coastal resources, with an 81,000 km long coastline and 5.8 million km2 of marine areas (70% of its total area). The region’s long coastline contains highly productive coral reefs (500 species of corals) and mangrove ecosystems (Anonymous, 1996a and b). Many development activities are taking place in urban areas, as well as in the coastal area. Such activities in the coastal area include investments, exploitation of non-renewable and renewable resources. Although Indonesians get benefits from them, all the activities together, with an ever-increasing population, are resulting in a rapid increase in the quantity of wastes and wastewater (ATB, 2002), including pollutant-containing wastewater in marine and coastal areas. This may lead, directly or indirectly, to the degradation of marine and coastal resources due to impacts of pollution from various hazardous substances contained in the wastes and wastewaters resulting from human activities, so-called anthropogenic pollution. In addressing such a situation, Indonesia has been seriously focusing its national policies, strategies and actions on environmental management in a context of sustainable development. Thus, the Indonesian Government has established regulations to control all development and exploitation of its coastal resources. Previously, Braadbaart (1995) suggested that to combat water pollution in particular, especially from industries, a regulatory framework be set up in three phases: (1) allocate responsibility for environmental policing along sectoral lines; (2) create a Board for the Control of Environmental Impact (Bapedal); and (3) environmental impact analysis report evaluation be embedded in an organizational setting replete with a good incentives policies. In addition, the users, in their activities and targets, have to consider the sustainability of their

15
utilization of the resources and minimize the impacts on the environment. Major Indonesian coastal and marine resources management issues include the degradation of coral reefs (Anonymous, 1996a and b; ADB, 2000); the increase in phosphate, nitrate and sediment loading of marine estuaries from upstream intensive paddy cultivation; the conversion of intertidal zones to rice paddies; and the incursion of mechanized and technologically sophisticated foreign fishing fleets (KMNLH, 1996 a and b). Regarding sustainable development, Indonesia has developed Indonesia’s Agenda 21 (KMNLH, 1996a). Some action programs have been formulated to improve the quality of the living environment for sustainable development for the future of the 21st century (1998-2020). There are seven priority programs, which have been discussed and proposed for ocean and coastal areas (KMNLH, 1996a); they are: • Integrated planning and resource development in coastal zones; • Monitoring and protecting coastal and marine environments; • Sustainable utilization of marine resources; • Strengthening and empowering coastal communities; • Sustainable development of small islands; • Maintaining security of the Exclusive Economic Zone (EEZ); and • Managing the impacts of climate change and tidal waves. As the priority programs of Agenda 21 are being implemented, coastal and marine resources have been considered for an integrated management system, which involves integration of policies from other concerned sectors. However, enforcement related to the coastal and marine environmental quality standards has been limited because regulation still needs to be implemented as a national legislation. Indonesia has developed significant legislations (legal tools) for environmental standards (Table 2.3), including those for the coastal zones and marine areas, which also include the use of environmental impact assessment (EIA). The process of establishing coastal and marine management reached an important milestone with the recognition of this environment as a new sector in REPELITA (Five Year Development Plan) IV. The marine sector is now officially a key element of Indonesia's present and future economic development, and so the future coastal and marine strategy depends on today's decisions. A program that has been implemented to protect and control the coastal environment is the coastal and marine integrated conservation program (Pantai dan Laut Lestari Terpadu). The program which was implemented in 1996 consists of three packages of working programs, namely (1) cleaning of coastal tourism areas, (2) valuable harbors (harbor zones), and (3) conservation (coral reef and mangrove zones). 2.4 Major Coastal Planning & Management Techniques The absence of management measures that are indicated by the absence of adequate policies, legislation, and public participation in addressing environmental issues may cause further negative impact on the environment and health (Mrayyan and Hamdi, 2006). Therefore, appropriate management measures and techniques should be identified.

16
Table 2.3 Some Legal Tools for Controlling Coastal and Marine Pollution and Degradation in Indonesia
Year Number Concerning 1969 Convention International Convention on Civil Liability for Oil
Pollution Damage, 1969 1972 Convention Prevention Of Marine Pollution by Dumping from
ship and Aircraft, 1972. 1973 Convention International Convention For The Prevention of
Pollution from Ship 1974 GR (Government Regulation) No.
17 Concerning Controlling of Oil and Gas Exploration and Exploitation in the Coastal Zone
1978 Protocol International Convention For the Prevention of Pollution from Ship, 1973
1982 Act No. 4 Concerning Environmental Management 1982 Convention United Nations Conventions on the Law of the sea 1983 Act No. 5 Economic Exclusive Zone 1988 Decree of State Minister for
Population and Environment Guideline for Environmental Quality Standard Establishment
1990 Act No. 5 Conservation of Living Resources and Their Ecosystems
1992 Act No. 21 Concerning Shipping 1992 Act No. 24 Spatial Planning 1993 GR No. 51 Environmental Impact Analysis (revision) 1994 GR No. 19 Management of Dangerous and Toxic Wastes 1995 Environmental Impact
Management Agency (BAPEDAL) Decree of The State Minister For The Environment Number KEP-51/MENLH/10/1995
Liquid waste Standards For Industrial Activities
1996 Decree of State Minister for Environment Number 42
Environmental Quality Standard Liquid Waste for Oil, Gas and Global Warming Activities.
1996 State Ministerial Decree: Kep-42/MENLH/10/1996
Environmental Standard for Liquid Waste for The Oil and Gas Activities and Global Warning : October 1996
1999 GR No. 19 Marine Pollution and Degradation With regards to coastal areas, Kay & Alder (1999) suggested three groups of major approaches for coastal management and planning. They are (a) administrative, (b) social, and (c) technical measures. Those approaches consist of applications, which are each composed of some tools. 2.4.1 Administrative aspect Many countries have adopted laws, decrees, and other regulatory acts to specify the environmental requirements for development activities. In this sense, it is the role of the government to ensure and promote environmental conservation, and therefore, on behalf of society, to set standards for all industrial activities (including public-owned ones), to establish an effective permit or licensing system, and to take measures to ensure that it is adhered to (UNEP, 1992). The following tools are included in the administrative aspect:

17
• Policy and legislation Policy and legislation can be powerful tools for managing the coast, where policy is a basis for decision-making. Anderson et al. (1984, cf Kay & Alder, 1999) suggest a definition of “policy” as a purposive course of action followed by appropriately dealing with a problem. Examples of policies applied in coastal management are: coral reef conservation in Honduras in which they focus on the policy for individual behavior inside the boundaries of the reserve, such as the prohibition of anchoring (facilitated by a successful mooring buoy program that had been previously accomplished), spearfishing, coral collection or destruction, and others (Luttinger, 1997). Other examples are shown in Table 2.3. In 1979 the National Government of Japan concentrated on eliminating the organic contamination problem by implementing a policy to regulate COD from industrial effluents, and added nitrogen and phosphorus levels to the list of effluents to come under regulation in October 1993 (Kawabe, 1998). “Legislation” or “law” is defined through a parliamentary or legislative process and the outcome is often expressed as an ‘Act’ or ‘Law’. It can be defined as “the government of the time’s response to community demands for government action or management of particular issues, areas or activities” (Kay & Alder, 1999). • Guidelines The term of “guidelines” is used to describe a group of documents, which are less prescriptive and or forceful than formal legislation, policies or regulations. It is also used as guidance for decision makers to act upon. • Regulation and enforcement Regulation permits and licenses. Permits and licenses are written approvals from a
government to conduct specified activities in specified areas. The processes and criteria for issuing permits are generally controlled by either policy directions or regulations, or are specified in legislation (Kay & Alder, 1999). In addition, permits can be used in some activities to assist in day-to-day coastal management activities.
Enforcement. Enforcement is a management tool used to effect compliance with acts, regulations, permits, licenses, policies or plans with a legislative basis (Kay & Alder, 1999).
• Incentive instruments The need for incentive instruments for managing marine resources and uses, criteria for evaluating, and principles for instrument design is discussed by Greiner et al. (2000). The authors further state that for a policy evaluation there are three criteria that are commonly applied, namely economic efficiency, equity, and environmental implication. Some principles related to incentives in terms of how they are designed, are user pays and polluter pays; cost sharing; sense of community, ownership, and stewardship; adaptive systems; and ecosystem approach (Greiner et al., 2000).

18
2.4.2 Social aspect • Participation Hildebrand (1997) stated that participation can only be achieved when power is shared. This means that citizens, through community organizations, are, with a government, making planning decisions that have meaningful consequences. Since a ‘bottom-up’ approach is adopted widely in integrated coastal zone management, participation in such management activities has increased. This is because the traditional form of ‘public consultation’ is no longer adequate (Hildebrand, 1997). Who are the actors that will participate in coastal management and planning? Players are the actors who participate in the program and initiatives. They are commonly called ‘stakeholders’ to stress that they have a stake in the future of the coast, either because they live there, earn a living from the exploitation of coastal resources, or it is their job to administer the rules and regulations controlling coastal use. Stakeholders also include vicarious users who may never use or access the coast but still value it, and those who may not reside on the coast but use it for recreation (Kay & Alder, 1999). For a general system, the term ‘stakeholder’ might be those who affect, and/or are affected by, the policies, decisions and actions of the system (Grimble & Chan, 1995). Thus, they can be individuals, communities, social groups or institutions of any size, aggregation or level in society; they include policy makers, planners and administrators in government and other organizations, as well as commercial and subsistence groups (Grimble & Chan, 1995; Clark, 1996; Lee, 1998; Kay & Alder, 1999), coastal residents via community-based organizations (CBOs) and local representative authorities; various economic sectors via cooperatives, federations, and chambers of commerce; conservationists via NGOs; and the state of government via its various public agencies (Jorge, 1997). In regard to the community aspect as a part of an integrated perspective, collaborative and community-based management are powerful tools of participation because they have the potential to help and solve coastal problems at the local level. Both are capable of modifying people’s activities at the source of the problem in a way which can help to meet management objectives, and assist in integrating environmental and resource management activities into people’s everyday lives: where a community makes some resource management decisions that affect their activities (Kay & Alder, 1999). It is implied that collaborative management has a number of common elements, including all stakeholders. The stakeholders have a say in the management and sharing of management responsibility which varies according to specific conditions but the government assumes responsibility for the overall policy coordination; and socio-economic and cultural objectives are an integral part of management (Kay & Alder, 1999). Community-based management uses the "empowered people" concept which provides the responsibility to manage resources. In this case, the community, together with the government, business and other interested parties share an interest in co-managing resources with some decision-making devolved to the community. According to Hildebrand (1997), community-based coastal management represents a new form of partnership between government and community-based organizations. In essence,

19
it is about ‘power sharing’ in the integrated planning and management of the coastal zone. It may be initiated by communities themselves, by government agencies, or with the assistance of non-government organizations (NGOs). However, it is rarely achieved, if the government is reluctant to devolve power. Communities are often viewed as unqualified or too unskilled to take on the responsibility for managing, or communities are reluctant to take on the responsibility for decision-making.
• Capacity building Crawford et al. (1993 cf Kay & Alder, 1999) give a definition for capacity building: it is a term used to describe initiatives that aim to increase the capability of those charged with managing the coast to make sound planning and management decisions. Since the term is also used commonly by international organizations, there are two different kinds of capacity building that focus on supporting and improving coastal management decisions, namely ‘human capacity’ and ‘institutional capacity’. In the coastal management perspective, the former focuses on individual decision makers and coastal managers, while the latter is focused on business, governments, non-governmental groups and communities (Crawford et al., 1993 cf Kay & Alder, 1999; Kay & Alder, 1999). The difference in terms of component items set up for capacity-building program can be seen in Table 2.4. Table 2.4 Characteristic of Collaborative and Community-based Management (Jentolft,
1989 cf Kay & Alder, 1999)
Characteristics Collaborative management Community-based management
Initiative Decentralize Local Organization Formal Informal Leadership Participant Mutual Adjustment Control Decentralize Decentralize Autonomy Some Yes
2.4.3 Technical aspect Technical tools are used for practical approaches, including environmental assessment (environmental impact assessment), risk and hazard assessment, quality criteria and standards, and a potential wastewater treatment (wastewater-fed aquaculture) that are commonly applied in coastal management and planning.
• Environmental Impact Assessment (EIA) One of the most powerful tools in minimizing impacts is a requirement to complete an environmental impact assessment (EIA) (Brown, 1997) for various development activities. Basically, an EIA aims to evaluate the effects of proposed developments and projects on the environment (Hoozemans et al., 1995) by clearly evaluating the environmental consequences of a proposed activity ‘before’ action is taken (Brown, 1997). In this evaluation, the impacts of a single development activity can be estimated and so, they can be prevented in advance.

20
EA, or EIA, has relevance and importance in all activities in coastal development (Hambrey et al., 2000), and it is considered as a management tool rather than as an administrative or regulatory process. In particular it may be used to (1) modify and improve the content or design of a policy, plan or proposal; (2) ensure that resources are used efficiently; (3) enhance the social aspects related to a proposal; (4) identify measures for monitoring and managing impacts; and (5) facilitate informed decision making, especially in relation to sustainability criteria. The essence of EIA is a prediction of the future state of the environment, with and without the development activity (Carpenter & Maragos, 1989). Thus, the EIA is conducted in order to predict the adverse consequences of development on the environment. In Indonesia EIA is compulsory for a development project that has a potential impact on the environment, while it is not in Singapore (Chia, 1998). Since most development projects proceed within a very short time frame, a detailed EIA is often impossible. It is not uncommon that EIA is conducted only a few months before the commencement of work and the development would proceed regardless of the conclusion of the impact assessment (Wu et al., 1998). In coastal waters, like other common development activities, EIA is considered to be a vital tool for sound coral reef conservation to maintain an optimum ecosystem function. Tomascik (1993) has developed a general guideline for such a measure. In addition, there is another evaluation that is always conducted together with or as a complement of EIA; it is ‘cumulative effects’ (CE) assessment. Vestal & Rieser (1995) described the term of CE as the phenomenon of changes in the environment that result from numerous, small-scale alterations. For example, alteration of critical habitats through wetland loss, degradation of water quality from non-point source pollution, and change in salinity of estuarine waters from water dispersion projects. • Risk and Hazard Assessment Risk and Hazard Assessment is considered as one of the control measures to prevent the destruction of coastal areas due to the development of human-generated activities (anthropogenic pressures). However, there are no activities, which have a zero risk. This assessment is concerned with assessing the probability that certain events will take place and assessing the potential adverse impact on people, property, or the environment that these events may have. For example, failures of a chemical refinery on the coast causing damage to the plant itself, and to surrounding residents and the environment through the release of toxic chemicals into near-shore waters. Potential impacts on a coastal region by severe storms are also included (Kay & Alder, 1999). The risk and hazard assessment, like EIA, is always conducted as part of coastal planning and management before the activities are carried out, so all the risks due to the activities are taken into account. Conducting the risk and hazard assessment once it has been identified is called ‘risk management’, and the method of managing risks is called the ‘risk management technique’ (Kay & Alder, 1999). Developing a risk management strategy involves a number of distinct stages. According to Kay & Alder (1999), they are (1) scoping and investigation; (2) analysis; (3) implementation (mitigation); and (4) monitoring.

21
• Quality Criteria and Standards One of the management approaches to control pollution is an environmental management. Environmental management is the art of conserving and improving the quality of the environment by controlling the quality and quantity of waste-loads discharged into it (Ouano, 1988). The environmental control standards are based on the concept of allocating the Assimilative Capacity to the different users for free. The assimilative capacity could be considered a resource owned by the people as represented by the government of the pollution control agency. Quality criteria and standards are one of the tools in environmental management. The criteria and standards that are discussed here include receiving water quality standards, effluent standards and effluent charges, and the precautionary principle. Receiving Water Quality Standards (RWQS). RWQS vary from one country to another
depending on various social, economic, and technical factors. The most well researched and discussed water quality standards are for drinking water, whereas the non-consumptive water quality standards have greater variation especially those developed for the coastal and marine environment. ‘Pollutant’ is usually defined as the quantity of waste-loaded discharge to the environment, which will result in concentrations higher than those allowed by the RWQS. Due to variations in the coastal and marine environment standards, the same quantity of waste-load will have different meaning in different countries (Ouano, 1988). The RWQS is difficult to administer if there are two or more waste discharge sources within the water body. Implementation of the receiving water quality standard calls for extensive monitoring of the waste discharges, the mixing, dilution and purification in the water body. The RWQS favor the waste discharges located upstream as they could utilize completely the assimilative capacity of the water body. The waste discharged down stream will be required to remove all waste-load completely, or relocate or close down.
Environmental (Assimilative) Capacity. Environmental (Assimilative) Capacity can be applied both in sea and freshwater and underlies the calculation of safe discharges of sewage waste to the sea and rivers. The concept is that the environment (marine, river, and lake) has the capacity to tolerate an input of man-made waste without suffering significant damage. That level may be quite small for some wastes, and different areas will have different capacities to dilute and disperse waste to harmless levels (Ouano, 1988; Clark, 1997).
Effluent Standards (ES) and Effluent Charges (EC). ES is derived by dividing the
assimilative capacity among the waste dischargers. The assimilative capacity is treated as a common resource that the effluent standards distribute to the different users. One of the main problems in the development of effluent standards is the tendency to impose the RWQS as ES (Ouano, 1988). For example, the Philippines National Pollution Control Commission implemented the RWQS as ES between 1978 and 1981. As a result waste dischargers were automatically required to remove up to 99.99% of the waste-load. While the effluent standard of 1981 tried to correct the problems related to BOD, the concentration of the other constituents were practically copied from the RWQS of 1978. Even today the required concentrations of copper, zinc, fluoride and

22
other metals are the same as that for ES which makes Philippines standards more stringent than the WHO International Drinking Water Standard of 1972. Some economists involved in environmental management suggested that the allocation of the assimilative capacity would be more efficient if it is carried out using a free market mechanism (Ouano, 1988). The pollution control technology used by the waste generator will not be dictated by the standards but rather by the market forces such as its competitors, demand, and the assimilative capacity available. The pollution control agency monitors the allowable assimilative capacity and sells it to the highest bidder. The winning bidder is allowed to discharge into the water body while the losing bidder will have to store his waste (Ouano, 1988).
Precautionary Principle. The Precautionary Principle was proposed by Germany in 1986 (Clark, 1997) to prevent damaging effects of wastes entering the environment. Where there are threats or serious or irreversible environmental damage, lack of full scientific certainty should not be used as a reason for postponing measures to prevent environmental degradation. The application of the precautionary principle decision should be guided by (a) careful evaluation to avoid, where practicable, serious or irreversible damage to the environment, and (b) an assessment of the risk-weighted consequences of various options (Brown, 1997). In addition, seeking to understand effects of chemicals and pollutants in the environment, requires an understanding of issues that affect and shape the use, regulation, and control of thousands of chemicals of commerce (Jones, 2007).
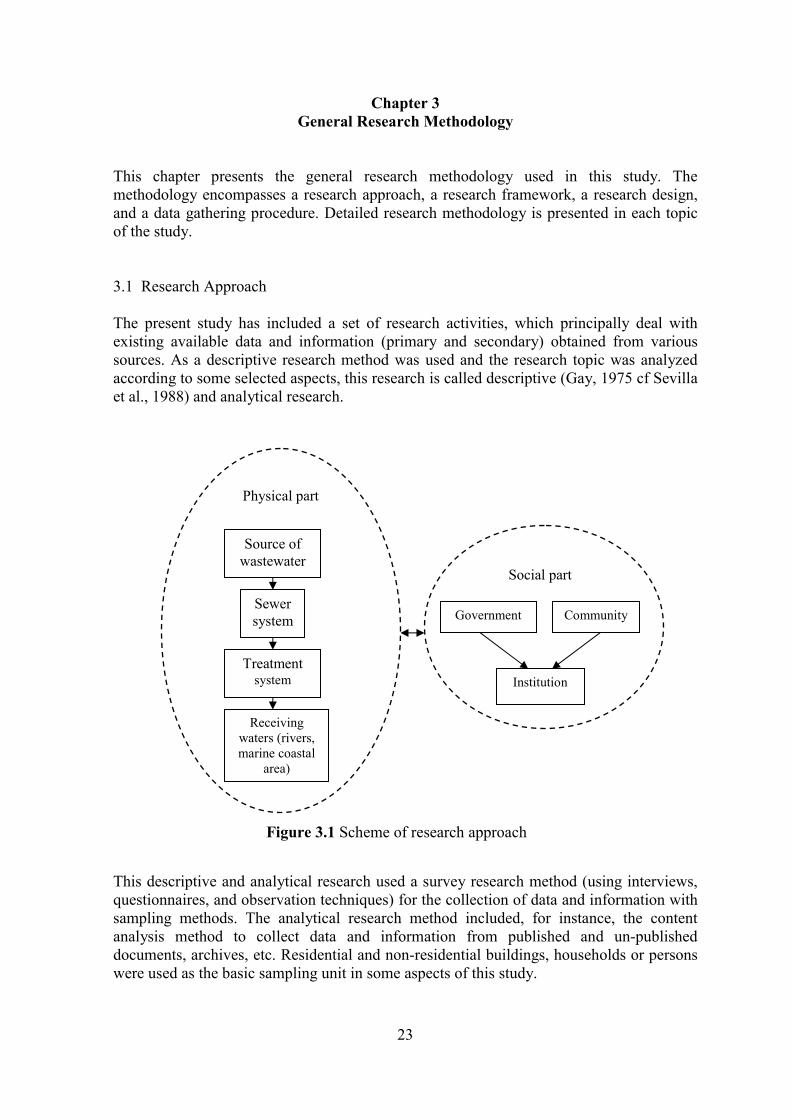
23
Chapter 3 General Research Methodology
This chapter presents the general research methodology used in this study. The methodology encompasses a research approach, a research framework, a research design, and a data gathering procedure. Detailed research methodology is presented in each topic of the study. 3.1 Research Approach The present study has included a set of research activities, which principally deal with existing available data and information (primary and secondary) obtained from various sources. As a descriptive research method was used and the research topic was analyzed according to some selected aspects, this research is called descriptive (Gay, 1975 cf Sevilla et al., 1988) and analytical research.
This descriptive and analytical research used a survey research method (using interviews, questionnaires, and observation techniques) for the collection of data and information with sampling methods. The analytical research method included, for instance, the content analysis method to collect data and information from published and un-published documents, archives, etc. Residential and non-residential buildings, households or persons were used as the basic sampling unit in some aspects of this study.
Social part
Physical part
Source of wastewater
Sewer system
Treatment system
Receiving waters (rivers, marine coastal
area)
Community Government
Institution
Figure 3.1 Scheme of research approach

24
As mentioned before in Chapter 2, a wastewater system should be analyzed and evaluated from an integrated point of view, taking into consideration all parts of the system, i.e. sources of wastewater, sewer systems, wastewater treatment facilities and receiving waters. These parts constitute the physical measure aspect. Being applied in a management context, this physical measure was combined with various social parts (for example community, government, institution) (Fig. 3.1). An integrated system was used as an approach to develop the present research. 3.2 Research Framework Three groups of data were considered as data sources in this study based on the preliminary observation on wastewater problems in the city of Manado; they are 1) the wastewater discharge-related aspect (WRA); 2) the community-related aspect (CRA); and 3) the governmental/administrative-related aspect (GRA). The WRA relates to wastewater discharge, which comprises aspects from the wastewater-related activities at individual houses (e.g. toilets, and septic tanks) to the entire sewer system including wastewater infrastructures and facilities. Natural characteristics can be included in this aspect. The CRA includes a community which is related (Pompeo, 1999; Hauger et al., 2002) to the problem solving approach of wastewater discharge. It could be an individual person, a household, and/or a group forming a community institution. The GRA relates to a government/administrative institution, as it plays an important role in problem solving measures for wastewater discharge. From those groups of data, three selected aspects were studied, such as 1) the community’s environmental knowledge and attitude, 2) wastewater treatment systems and wastewater infrastructures and facilities, and 3) the water quality in the river system. Those are the main aspects in this study. Three associated aspects were also selected; they are 1) the natural settings, 2) the socio-economic aspects, and 3) institutional arrangement & management measures (Fig. 3.2). All aspects (main and associated aspects) were identified, evaluated, assessed, and analyzed prior to formulating strategic actions. Following are the specifications of the main aspect: 1. Status of community’s environmental knowledge and attitude aspects. This study was
conducted to evaluate and analyze the community’s environmental knowledge and attitude related to wastewater issues. Two indicators were evaluated, i.e.:
• Environmental knowledge: knowledge within a community related to general environmental issues and specific environmental issues caused by wastewater.
• Environmental attitude: the attitude of the community related to general environmental issues and environmental issues caused by wastewater. This indicator was assessed through two components, such as 1) community concerns related to general environmental issues and environmental issues caused by wastewater, and 2) community preference concerning solutions of environmental problems related to wastewater.

25
Figure 3.2 Conceptual framework of the study on wastewater management in the city of Manado, North Sulawesi, Indonesia.
Denote:
Aspect of study
Process Provision
Status of water quality (WRA)
Status of wastewater treatment system & facilities
(WRA)
Status of community’s environmental knowledge &
attitude (CRA)
STRATEGIC ACTIONS
WASTEWATER MANAGEMENT PLAN
Constraints & Potentials
• Natural characteristics
(WRA)
• Socio-economic aspect (CRA)
• Institutional arrangement &
management (GRA)
Identification:
Descriptive:Identification, Descriptive, Analytical & Evaluation:
Analytical & Formulation:
I M P L E M E N T A T I O N
Wastewater issues
MAIN ASPECT: ASSOCIATED ASPECT:
(WRA): wastewater discharge-related aspect (CRA): community-related aspect (GRA): government/administrative-related aspect

26
2. Status of wastewater treatment system & facilities aspect. This study was conducted to evaluate wastewater treatment systems at household levels. Two indicators were evaluated, i.e.:
• Wastewater treatment system: the condition and capacity of the wastewater treatment system (septic tanks) was evaluated. This is related to the ‘black water’ part of wastewater.
• Wastewater infrastructure and facilities: the condition of the wastewater infrastructure and facilities was evaluated, including systems for wastewater from kitchens, bathrooms (‘grey water’).
In this study, the factor affecting the condition of the wastewater treatment system was also evaluated. Socio-economic factors (monthly income, level of education, and house status) and the community’s environmental knowledge were predicted to influence the condition of the on-site wastewater treatment system (septic tank) in the city.
3. Status of water quality aspect. This study was conducted to measure and evaluate the
quality of discharged wastewater in the river system. The following indicators were observed:
• Quality of wastewater: Biological Oxygen Demand (BOD), nitrogen (N) and phosphate (total phosphorous), and an amount of fecal coliform.
• Pollutant-containing wastewater: the concentration of mercury (Hg). Mercury was considered in this study because this pollutant is used widely in the upland area around the city of Manado for amalgam gold mining in small-scale industries.
The following are the specifications of the associated aspect:
1. Natural characteristic aspect. The following are the components described:
• Topography: slope and elevation.
• Drainage: rivers, canals and other water-draining areas.
• Climate: precipitation and seasons, etc. 2. Socio-economic aspect. Socio-economic characteristics, population, employment, and
level of education were described in this study. 3. Institutional arrangement and management measure aspects. Besides the management
measures information, the following are the components described:
• Government: role and function, responsibility, and coordination (from local level to national level);
• Policies, strategies, and actions related to wastewater management. 3.3 Research Design A research protocol was designed for this study. The design considers ensuring that this research can be repeated for monitoring and evaluation purposes or for comparison with other cases.

27
3.3.1 Study areas The study area covered the area under the administration of Manado City (Fig. 1.1, p. 3). Two types of study areas were identified:
• Study Area (SA) I: this study area covered the city level (Manado City with all districts).
• Study Area (SA) II: this study area covered the district level. Two districts were selected as specific study sites (SS) because they met the following conditions:
1. The area is close (water-front) to the coastal area, so discharged wastewater can be observed from upland to coastal areas.
2. The area is influenced by the Tondano Watershed. This criterion was used because some parts of the Manado area are included in this watershed and most of the wastewater is brought down to the coastal area through this watershed.
The two specific study sites (SS), which were selected, based on those conditions (Table 3.1) are:
• Study Site (SS) 1: Molas District. The area is a waterfront area within Manado Bay (Fig. 1.1, p. 2). Approximately 5,988 households of this area are included in the Tondano Watershed (JICA, 2000).
• Study Site (SS) 2: Wenang District. The area is a waterfront area within Manado Bay (Fig. 1.1, p. 3). Approximately 15,377 households were included in the Tondano Watershed (JIC,A 2000).
Figure 3.3 gives an overview of how the study areas (SA) and study sites (SS) are interrelated. Table 3.1 Selection of the Two Specific Study Sites
Condition Districts Molas Mapanget Malalayang Wenang Sario The area is close (water-front) to the coastal area
√
X
√
√
√
The area is influenced by the Tondano Watershed (No. of sub-districts)
6
2
X
13
1
The area is influenced by the Tondano Watershed (No. of households)
5,988
1,194
X
15,377
3,937
√: yes, X: no 3.3.2 Sample and sampling design Sample size was calculated by using a formula introduced by Slovin (1960, cf Sevilla et al., 1988): n = N / (1 + N e2); where n is sample size, N is population size, and e is a preferred critical number. Below, descriptions of sample size and sampling design for each study area and site are provided. Table 3.2 shows the calculated and applied sample size for households, individuals/person, and houses used.
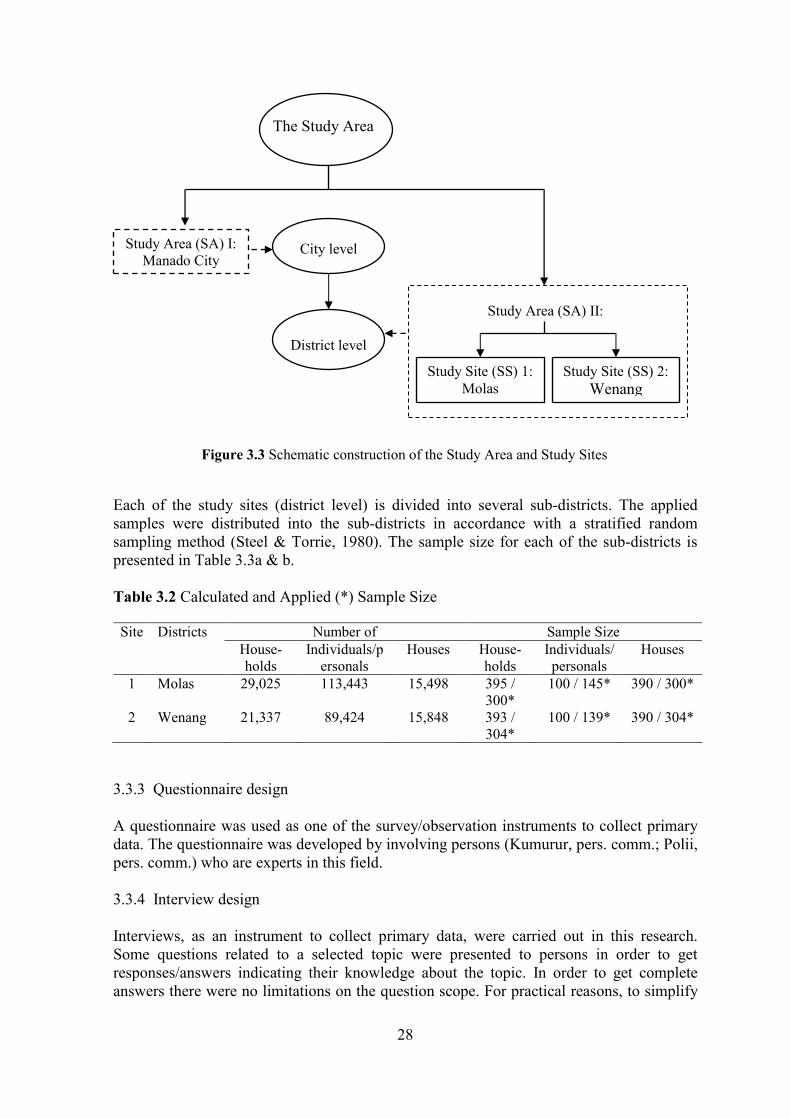
28
Each of the study sites (district level) is divided into several sub-districts. The applied samples were distributed into the sub-districts in accordance with a stratified random sampling method (Steel & Torrie, 1980). The sample size for each of the sub-districts is presented in Table 3.3a & b. Table 3.2 Calculated and Applied (*) Sample Size
Site Districts Number of Sample Size
House-holds
Individuals/personals
Houses House-holds
Individuals/personals
Houses
1 Molas 29,025 113,443 15,498 395 / 300*
100 / 145* 390 / 300*
2 Wenang 21,337 89,424 15,848 393 / 304*
100 / 139* 390 / 304*
3.3.3 Questionnaire design A questionnaire was used as one of the survey/observation instruments to collect primary data. The questionnaire was developed by involving persons (Kumurur, pers. comm.; Polii, pers. comm.) who are experts in this field. 3.3.4 Interview design Interviews, as an instrument to collect primary data, were carried out in this research. Some questions related to a selected topic were presented to persons in order to get responses/answers indicating their knowledge about the topic. In order to get complete answers there were no limitations on the question scope. For practical reasons, to simplify
Figure 3.3 Schematic construction of the Study Area and Study Sites
The Study Area
Study Area (SA) II:
Study Site (SS) 1: Molas
Study Site (SS) 2:Wenang
Study Area (SA) I:Manado City
City level
District level
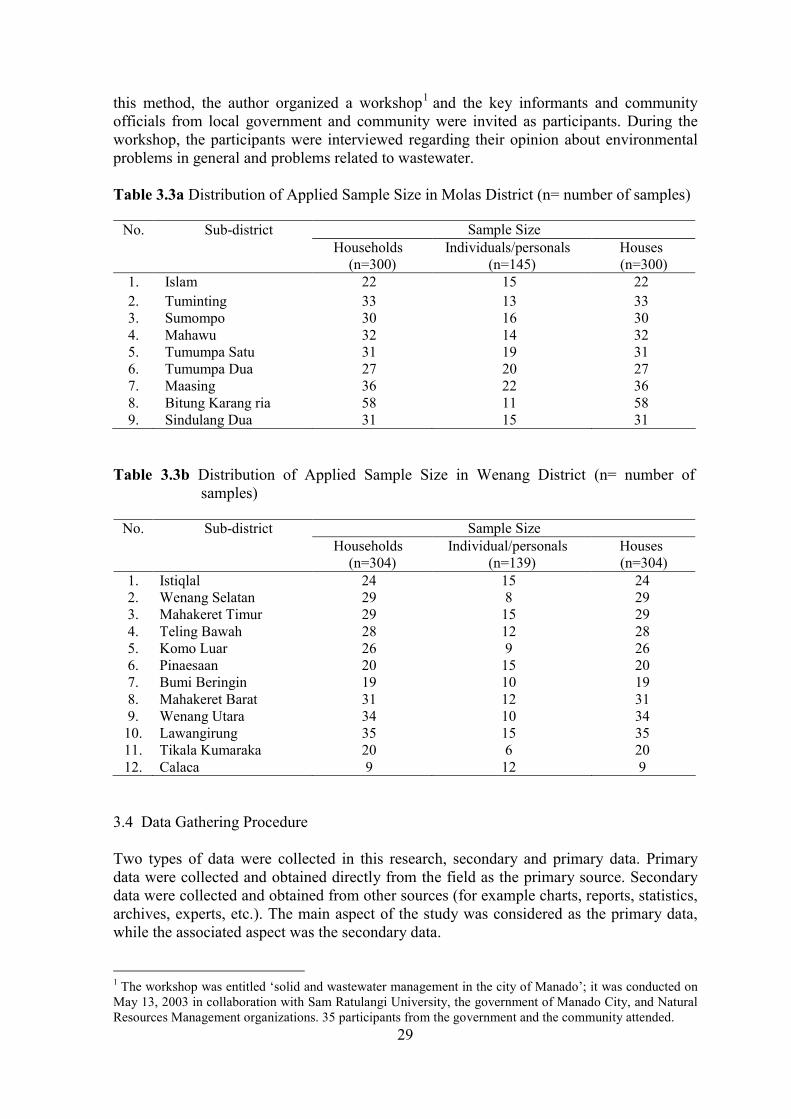
29
this method, the author organized a workshop1 and the key informants and community officials from local government and community were invited as participants. During the workshop, the participants were interviewed regarding their opinion about environmental problems in general and problems related to wastewater. Table 3.3a Distribution of Applied Sample Size in Molas District (n= number of samples)
No. Sub-district Sample Size Households Individuals/personals Houses (n=300) (n=145) (n=300)
1. Islam 22 15 22 2. Tuminting 33 13 33 3. Sumompo 30 16 30 4. Mahawu 32 14 32 5. Tumumpa Satu 31 19 31 6. Tumumpa Dua 27 20 27 7. Maasing 36 22 36 8. Bitung Karang ria 58 11 58 9. Sindulang Dua 31 15 31
Table 3.3b Distribution of Applied Sample Size in Wenang District (n= number of
samples)
No. Sub-district Sample Size Households Individual/personals Houses (n=304) (n=139) (n=304)
1. Istiqlal 24 15 24 2. Wenang Selatan 29 8 29 3. Mahakeret Timur 29 15 29 4. Teling Bawah 28 12 28 5. Komo Luar 26 9 26 6. Pinaesaan 20 15 20 7. Bumi Beringin 19 10 19 8. Mahakeret Barat 31 12 31 9. Wenang Utara 34 10 34
10. Lawangirung 35 15 35 11. Tikala Kumaraka 20 6 20 12. Calaca 9 12 9
3.4 Data Gathering Procedure Two types of data were collected in this research, secondary and primary data. Primary data were collected and obtained directly from the field as the primary source. Secondary data were collected and obtained from other sources (for example charts, reports, statistics, archives, experts, etc.). The main aspect of the study was considered as the primary data, while the associated aspect was the secondary data. 1 The workshop was entitled ‘solid and wastewater management in the city of Manado’; it was conducted on May 13, 2003 in collaboration with Sam Ratulangi University, the government of Manado City, and Natural Resources Management organizations. 35 participants from the government and the community attended.

30
3.4.1 Secondary data collection Available secondary data and information were collected from various sources. For the collection of adequate and appropriate information, a number of organizations were contacted and visited as sources of information. These included national universities (for example Sam Ratulangi University, Manado); international universities (for example Asian Institute of Technology, Thailand); provincial government agencies of North Sulawesi Province; local government agencies (the city of Manado and the Minahasa Regency), including executive and legislative parties; profit-organizations (private companies); non-profit organizations (non-governmental organizations); and others. Information from Internet sources was used as an additional and worldwide source of information. 3.4.2 Primary data collection This research was conducted in two sequenced stages: Pre-Survey (Stage 1) and Main Survey (Stage 2). The Pre-Survey was conducted as a reconnaissance survey in order to adjust the research designed (for instance the study sites, sampling areas, representative sampling), to conduct a pre-test for the questionnaire, and to request permission. The Main Survey was conducted in order to gather data used to identify, analyze, and formulate specific objectives in each of the studies.

31
Chapter 4 General Description of Manado City
This chapter presents a general description of the existing situation and condition of Manado City, including the study sites of Molas and Wenang districts, where such an overview may, directly or not, relate to the wastewater management aspect. Several aspects of natural characteristics (topography, natural settings, land use patterns, climate, and marine coastal areas), classification of the city, socio-economic aspects (population, education, employment, religion and ethnicity, and income), and government institutional arrangement, policies, strategies, and actions, are described. The information and data were obtained from a field survey of the household socio-economic and relevant references (unpublished reports, archives, etc.), as well as government and consultancy reports. Those of land use data were calculated using GIS (ArcView software and satellite imagery SPOT XS4). 4.1 Natural Characteristics Manado, the capital city of North Sulawesi Province, Indonesia, is located at 1°30’-1°40’ N; 124°40’ - 124°50’E. It is a developing coastal city forming a waterfront on Manado Bay (Fig. 4.1) and covers an area of 160.61 km2 (10.5% of the total area of the province). The topographic elevation of land in the area is from 10 to 650 m (ASL: above sea level) with various types of landscapes from low-lying (slope), undulating and hilly to mountainous (Fig. 4.2). Land slopes range from 0 up to >40% (Fig. 4.3). Of this, 12,296.50 ha (76.56%) have a slope of 0-8% and 179.01ha (1.11%) have a slope of >40% (Table 4.1). The topography of Molas (SS 1) is mostly slope and hilly while Wenang (SS 2) is mostly sloping and undulating (BPSKM, 2003). Table 4.1 Total Area of Manado Based on Land Slope Condition
Slope (%) Area (ha) %
0-8 12,296.50 76.56 8-15 1,622.84 10.10 15-25 1,357.22 8.45 25-40 605.51 3.77 >40 179.01 1.11 Total 16,061.08 100.00
The geomorphologic features of the area influences land use, since only flat land of 0-8% slope (only 76.56%) is suitable for proper settlement (housing and commercial activities, and others). Therefore, settlement developments are distributed haphazardly in the city, following the natural settings of topography and slopes, and mostly distributed and concentrated along the coastline.

32
Figure 4.1 The area of Manado C
ity
32

33
Figure 4.2 Topographic condition of Manado C
ity
33

34
Figure 4.3 Slope gradient of M
anado area
34

35
Figure 4.4 Hydrological condition of M
anado City
35

36
The land use of the city in 1999 was classified into 15 categories (Table 4.2). The three largest land use categories were mixed agricultural land (mixture of estate) (69.82%), housing/settlement areas (18.38%), and secondary forests (2.56%). Along the coast of the northern part, there were mangroves with a total area of 1.74 km2 (1.09%). River and canal areas were reported to take up 0.77 km2 (0.48%). Table 4.2 Land Use Classification of the Manado Area in 1999
Land use classification Ha %
1. Mixed agricultural land (mixture of estate) 11,213.74 69.82 2. Housing/Settlement area 2,951.44 18.38 3. Hospitals 13.10 0.08 4. Government land properties 339.72 2.12 5. Commercial/Business area 278.42 1.73 6. Secondary forest 411.17 2.56 7. Golf court 56.19 0.35 8. Sport area 13.22 0.08 9. Vacant (unused/cleared land) & dry fields 334.83 2.08
10. Mangrove 174.27 1.09 11. Natural/semi-natural forest 156.37 0.97 12. Cemetery 4.36 0.03 13. Bush (shrubbery) 21.51 0.13 14. River & canals (water body) 77.03 0.48 15. Road/Boulevard 15.68 0.10
Total 160.61 100.00 The city is traversed by rivers and canals (Fig. 4.4). Six of 21 rivers flowing into Manado Bay (Bailang, Maasing, Malalayang, Sario, Tondano, and Wusa/Paniki rivers) cross through the city with various widths, lengths, and depths. Catchment areas of the rivers and tributaries are predominantly used for various human activities, for instance agriculture, housing, and commercial activities (Table 4.3). This causes the rivers to become narrower since such activities are growing and, therefore, need more space. In addition, the rivers and canals are important components of water and wastewater drainage. The source of water flowing through the rivers, except S. Maasing, is from the upland area outside Minahasa Regency, i.e., from 3 volcanic mountains (Klabat, Lokon, and Mahawu) and a watershed (Tondano watershed) with lake Tondano. The majority of the city area (29.2 km2) is part of this watershed. The number of the city’s people/households, as part of the watershed, is shown in Table 3.1, p. 26. The watershed extends across an area of 510.0 km2 from an elevation of 680 m above sea level (ASL) at the lake of Tondano (covering an area of 46.8 km2), descending gradually towards the northeast to Manado Bay through the Tondano River as the widest river with the highest amount of water (Fig. 4.5). During 1985-1995, the monthly discharge of water from Lake Tondano through the Tondano River ranged from 5 to 22 m3/sec and the yearly average was 14-17 m3/sec. In 1999, the average annual discharge was about 15 m3/sec with maximums and minimums of about 16 m3/sec in January and 13 m3/sec in September, respectively (JICA, 2000).

37
The area of the city is influenced by a tropical climate with two different seasons, dry (May to October) and rainy (November to April). The information collected from the Station of Meteorology & Geophysics, Kayuwatu, Manado, shows that annual precipitation is about 2,000-2,400 mm with a monthly average of 250.8 mm and a maximum and minimum of 407 mm (January) and 75 mm (August) during 1991-2000. The number of days with rain is 90-120 days. Humidity varies from year to year; average humidity in 1997, 1998 and 1999 was 77.08, 86.17 and 85.40%. Average annual temperature (1994-2000) is about 26.11 oC with a maximum and minimum of 26.8 and 25.4 oC, respectively (Fig. 4.6). In 2003, the annual temperature during the daytime was 29.4 to 32.2 oC and during the night-time was 21.6 to 23.2 oC. The maximum air
Figure 4.5 Tondano Watershed with Manado City area
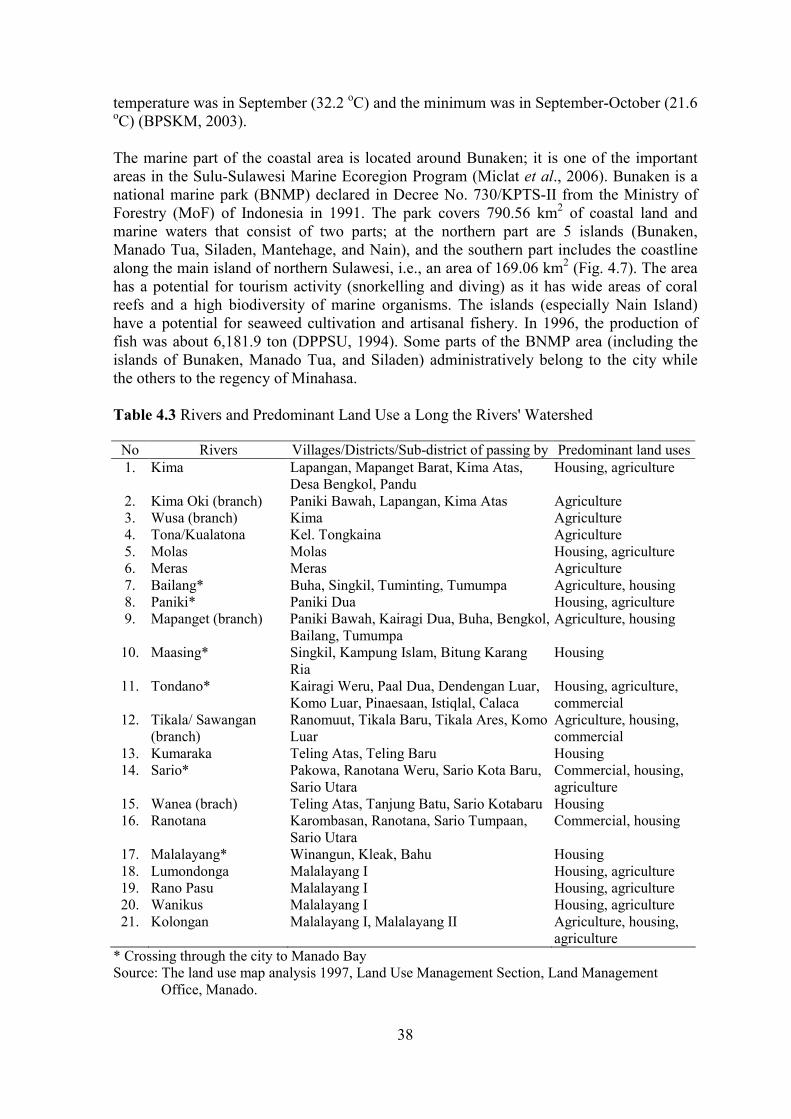
38
temperature was in September (32.2 oC) and the minimum was in September-October (21.6 oC) (BPSKM, 2003). The marine part of the coastal area is located around Bunaken; it is one of the important areas in the Sulu-Sulawesi Marine Ecoregion Program (Miclat et al., 2006). Bunaken is a national marine park (BNMP) declared in Decree No. 730/KPTS-II from the Ministry of Forestry (MoF) of Indonesia in 1991. The park covers 790.56 km2 of coastal land and marine waters that consist of two parts; at the northern part are 5 islands (Bunaken, Manado Tua, Siladen, Mantehage, and Nain), and the southern part includes the coastline along the main island of northern Sulawesi, i.e., an area of 169.06 km2 (Fig. 4.7). The area has a potential for tourism activity (snorkelling and diving) as it has wide areas of coral reefs and a high biodiversity of marine organisms. The islands (especially Nain Island) have a potential for seaweed cultivation and artisanal fishery. In 1996, the production of fish was about 6,181.9 ton (DPPSU, 1994). Some parts of the BNMP area (including the islands of Bunaken, Manado Tua, and Siladen) administratively belong to the city while the others to the regency of Minahasa. Table 4.3 Rivers and Predominant Land Use a Long the Rivers' Watershed
No Rivers Villages/Districts/Sub-district of passing by Predominant land uses1. Kima Lapangan, Mapanget Barat, Kima Atas,
Desa Bengkol, Pandu Housing, agriculture
2. Kima Oki (branch) Paniki Bawah, Lapangan, Kima Atas Agriculture 3. Wusa (branch) Kima Agriculture 4. Tona/Kualatona Kel. Tongkaina Agriculture 5. Molas Molas Housing, agriculture 6. Meras Meras Agriculture 7. Bailang* Buha, Singkil, Tuminting, Tumumpa Agriculture, housing 8. Paniki* Paniki Dua Housing, agriculture 9. Mapanget (branch) Paniki Bawah, Kairagi Dua, Buha, Bengkol,
Bailang, Tumumpa Agriculture, housing
10. Maasing* Singkil, Kampung Islam, Bitung Karang Ria
Housing
11. Tondano* Kairagi Weru, Paal Dua, Dendengan Luar, Komo Luar, Pinaesaan, Istiqlal, Calaca
Housing, agriculture, commercial
12. Tikala/ Sawangan (branch)
Ranomuut, Tikala Baru, Tikala Ares, Komo Luar
Agriculture, housing, commercial
13. Kumaraka Teling Atas, Teling Baru Housing 14. Sario* Pakowa, Ranotana Weru, Sario Kota Baru,
Sario Utara Commercial, housing, agriculture
15. Wanea (brach) Teling Atas, Tanjung Batu, Sario Kotabaru Housing 16. Ranotana Karombasan, Ranotana, Sario Tumpaan,
Sario Utara Commercial, housing
17. Malalayang* Winangun, Kleak, Bahu Housing 18. Lumondonga Malalayang I Housing, agriculture 19. Rano Pasu Malalayang I Housing, agriculture 20. Wanikus Malalayang I Housing, agriculture 21. Kolongan Malalayang I, Malalayang II Agriculture, housing,
agriculture * Crossing through the city to Manado Bay Source: The land use map analysis 1997, Land Use Management Section, Land Management
Office, Manado.

39
4.2 Classification of the City The city of Manado is the capital city of the North Sulawesi Province of Indonesia. It is classified as a medium-sized developing city consisting of urban and rural areas. It consists of 3 categories of areas, such as urban, urban-rural (mixed urban and rural), and rural areas. The classification is based on population density, percentage of households working in agriculture, and access to public facilities that are considered urban (BPSPSU, 2001). Before 1999, the city did not yet have the agglomeration of a big city, but it had a distribution of population at the level of a city and showed the potential to become a city with developing urban areas. Hence, it was designated as a city after 1999 under the Indonesian Law (IL) No. 22, whereas formerly it was as a municipality. A city, as defined by Cappon (1990, cf Haughton and Hunter, 1995), usually requires at least 10,000 residents. In 2005, the population was about 429,000 individuals (BPSKM, 2006). Before 2001, the city administratively consisted of 5 districts (Molas, Wenang, Mapanget, Sario, Malalayang, and Wanea) and 68 sub-districts. Since 2001, it has consisted of 9 districts (Kecamatan) and 87 sub-districts (Kelurahan). The present districts are Bunaken, Malalayang, Mapanget, Sario, Singkil, Tikala, Tuminting, Wanea, and Wenang. The distribution of the districts in the city is shown in Fig. 4.8 where the district of Molas was divided into 3 districts, Tuminting, Bunaken, and Singkil, while the district of Wenang was divided into 2 districts, Wenang and Tikala. In addition, the districts that include rural areas are Malalayang and Mapanget.
0
10
20
30
40
50
Jan Feb Mar Apr May Jun Jul Aug Sep Oct Nov Dec
Rai
nfal
l (cm
)
25
25.5
26
26.5
27
Tem
pera
ture
(oC
)
Rainfall (cm)
Temp (oC)
Figure 4.6 Average annual rainfall (1991-2000) and temperature (1994-2000)

40
4.3 Socio-Economic Aspects Socio-economic aspects are considered closely related to wastewater production and management because a large number of people may generate a large amount of wastewater; also the low economic and social (employment) status of a community may influence the management measures.
Figure 4.7 Bunaken National Marine Park (BNMP)

41
Figure 4.8 Adm
inistrative of Manado w
ith 9 districts
41

42
4.3.1 Social aspect • Population In 1990, the population of Manado was approximately 320,600 individuals, and in 2000 it was 418,000 individuals with 81,892 households. The population growth rate in the city during the years 1990-2000 was 3.40% per year. The population density in 1998 was about 2,637 individuals per km2 comprising 15.15% of North Sulawesi's total population (BPSPSU, 1998) and 2,584 individuals per km2 in 2003 (BPSKM, 2003). The city population grew to 419,688 in 2003, distributed into the districts and sub-districts as shown in Table 4.4. However, in 2005, the population was about 429,000 individuals with 2,656 individuals per km2 of density (BPSKM, 2006). Table 4.4 Population and Density of Manado in 2003
No. Districts Number of sub-districts Population1 Density (individual/ha)
1. Bunaken2 4 8 21,712 4.22. Malalayang 9 54,544 31.7 3. Mapanget 11 49,500 8.44. Sario 7 26,649 183.8 5. Singkil4 9 46,865 120.5 6. Tikala5 12 70,867 42.2 7. Tuminting4 10 49,648 101.5 8. Wanea 9 58,367 521.1 9. Wenang3 5 12 41,536 148.3 Total 87 419,688
1 based on district data 2 4 sub-districts in Bunaken Island and 4 sub-districts in the mainland 3 including small market 4 formerly included in the district of Molas 5 formerly included in the district of Wenang Source: RTI, 2004 In 2000, the ratio between males and females of the city was 1.01:1, likewise in 2005 (BPSKM, 2006). The ratio between the population living in urban and in rural areas was 12.96:1. Moreover, from the survey done in this study, in the Wenang district, the population of 20-60 year olds and >60 years old was 68.1% and 17.4%, respectively, while in the Molas district it was 79.7% and 16.0%, respectively. However, there was no information for 14.5% in Wenang and 4.3% in Molas (Table 4.5). • Education In 1999, 365,988 individuals were educated from primary (elementary) school up to postgraduate university (BPSKM, 2000). There were a number of people at 10 years of age (867 individuals) who had not yet attained any education. Usually, the age of entering preliminary school is 6 years old. The highest number educated individuals were from the high school level (134,061 individuals). From the socio-economic survey of households (for the head of the family) in the study sites of Molas (SS 1) with 304 respondents and Wenang districts (SS 2) with 300 respondents in the two age groups of 20-60 year olds and

43
>60 years old it showed that there were found people (2.6% and 13.3%, respectively) who only graduated from primary school. Most of the people graduated from high school (61.5% and 53.7%, respectively), while for the universities it was 27.3% and 13.7%, respectively. • Employment There were 344,251 persons in the age of employment (>15 years old) in 2003. However, only 157.654 (45.80%) of them were employed (at least 1 hour continuously working per day) of which 31.10% were in the service sector, 30.06% in trade, 12.96% in construction, and 10.86% in transportation and communication sectors (BPSKM, 2003). In 2000 there were only 36,204 individuals unemployed (Mokat, 2003). In Wenang and Molas districts, most of the people worked in the private sector (70.7% and 74.7%, respectively) and as civil servants of government offices (26.0% and 21.7%, respectively) (Table 4.5).
• Religions and ethnicity All Indonesians, according to the constitution, must have their own religion. There are 5 official religions in Indonesia; they are Islam, Christian Protestant, Christian Catholic, Hinduism, and Buddhism. Besides, there are many ethnic groups recorded in Manado, which were distributed among the 5 districts. The ethnic groups are Minahasa, Sangir, Gorontalo, Jawa, Bolaang Mongondow, Bantik, Ambon, Tonsea, and others which includes the Chinese (BPSKM, 2000). 4.3.2 Economic aspect In general, the economic activities of the city are increasing as indicated by the rapid increase in the number of commercial buildings (hotels, restaurants, malls, and others) and tourism activities. The average economic growth of the city was about 22.57% over the period of 1995-2000 (BPSKM, 2000). Agriculture, the manufacturing industry, hotels and restaurant sectors were growing at a stable and significant rate. The increase in the number of industries followed the increase in agriculture production. Tourism is one of the city’s assets for development to increase primary city monetary income. In the period of 1995-2000, tourism grew at an average of 16.15% per year for international tourists with 349,028 individuals, and 42% per year for domestic tourists with 1,714,454 individuals. Although the number of tourists decreased in 1997 due to the economic crisis, domestic tourism increased 22.55% by the end of 2000. The BNMP is one of the most promising assets for the development of a tourism destination (BPSPSU, 1999). However, the increase of economic activities in general is followed by the development of tourism infrastructure and facilities (hotels, restaurants, cottages) (Shatkin, 2007), which may threaten the coastal marine environment, since these activities produce a significant amount of wastewater, especially as most of the infrastructures are built close to the coast. The growing economic activity may improve the monetary income of the city. In general, the annual income per capita of the city during the period of 1993-1997 showed a significant monthly increase from Rp. 1,615,241 to Rp. 1,940,146 (BPSPSU, 1997), while in 2001 it was Rp. 1,824,310. The growth rate of income was 1.80% per year (BPSPSU, 2001). However, this was not enough to support the daily life of a household as 22,515

44
households (27.49%) were categorized as poor in 2000 (Mokat, 2003). For the Molas and Wenang districts (with 304 and 300 respondents, respectively), the proportion of households with incomes under Rp. 1 million per month was quite high (65.5% and 68.7%, respectively) and that with more than Rp. 1 million was low (16.2% and 15.6%, respectively) (Table 4.6). The income is either from their employment in a private company (small-scale economic activity), such as small auto/cycle repair shops and other non-formal sectors, or from their employment as civil servants with the local government. Table 4.5 The Result of Household Surveys on Socio-Economic Parameters (%)
Variables Wenang Districts N=304
Molas Districts N=300
Age group (years): 20-60
>60 No information
68.1 17.4 14.5
79.7 16.0 4.3
Employment: Private company
Civil Servant Unemployed
No information
70.7 26.0 1.6 1.6
74.7 21.7 No data 3.7
Income per montha: <Rp. 1,000,000
>1,000,001 No information
64.5 16.2 19.4
68.7 15.6 15.7
Level of education: Primary school (6-11 years old)
Secondary school (12-14 years old) High school (15-17 years old)
University graduate (>17 years old) No information
2.6 8.2 61.5 27.3 0.3
13.3 19.0 53.7 13.7 0.3
Number of person in a households to be responsible:
0-2 3-4 5-6 7-8
9-10 No information
36.8 36.8 13.5 2.0 1.0 9.9
28.7 40.0 18.3 6.0 1.7 0.3
House status: Owner Family
Rent No information
81.6 0.0 18.4 0.0
82.7 4.7 12.7 0.0
a 1 US$ = Rp. 8,500 4.4 Government Institutional Arrangement Since January 2000, when the Act of the Republic of Indonesia No. 22 of 1999 about local autonomy was implemented, a city or a regency government has been given its own authority to manage the resources found within its borders and also, to rearrange institutions to adequately support management and to produce suitable regulations locally.

45
At the present time, however, the responsibility for waste management is divided among several institutions, and no laws or regulations have been implemented at the local level for wastewater management. In the city of Manado, the Environmental Management Board (EMB) is the only institution responsible for the management of wastewater (liquid waste) and this function is separated from the Cleaning Management Board (CMB) that has the responsibility for the management of solid wastes. Both institutions are under the Mayor's Office. The City Company for the Market is the technical agency responsible for solid waste management within the market area. Table 4.6 Number of Tourists Visiting the Bunaken National Marine Park (BNMP) in
2001-2006
Year Tourism Total International National
2001 5,194 9,872 15,066 2002 8,262 17,435 25,697 2003 8,166 31,017 39,183 2004 9,826 28,178 38,004 2005 10,448 20,587 31,035 2006 10,229 22,050 32,279
Total 52,125 129,139 181,264 Percentage 32 68 100
Source: BNMP (pers. comm) At the provincial level of North Sulawesi, the Provincial Agency of Environmental Impact Control Board (PAEICB) has the function of implementing the coordination of the management and control of pollution, including the marine environment, for the cities and regencies in the province. At the national level, the National Agency for Environmental Impact Management (NAEIM) is responsible for implementing pollution control, including the marine environment, as well as for managing the environmental impact assessment (EIA) process in the country under the supervision of the Ministry of Environment (MoE). Separate ministerial decrees exist on wastewater quality standards for various sectors (industries, hotels, hospitals, petrochemical activities). Integrated Coastal Management (ICM) is the responsibility of the Ministry of Marine Affairs and Fisheries and thus has been focused mainly on natural resource management (Christie, 2005). 4.5 Policies, Strategies, and Actions Some measures of environmental management related to wastes and wastewater have been established at the national level in Agenda 21 of Indonesia (period of 1998-2020) (Anonymous, 1996a), as well as at the provincial level in Agenda 21 of North Sulawesi Province (Bapedal-Sulut, 2003). The strategies for wastewater management at the provincial level mentioned in Agenda 21 of North Sulawesi Province are to increase public service and improve the wastewater treatment facilities. The planned actions to increase the public service include establishing a central wastewater treatment system as a long-term prospective, and improving the current wastewater treatment systems over short and intermediate terms, both for individual and communal facilities. Establishing a central

46
wastewater treatment system with appropriate technology for households in densely populated areas will be included in the future action plan to improve wastewater treatment facilities (Bapedal-Sulut, 2003). However, in the city of Manado few measures have been established, and only in a partial sense, as tactical actions for short-term periods (Tamon, 2003).

47
Chapter 5 Community’s Environmental Knowledge and Attitude
This chapter describes the results of the study on the status of the community’s environmental knowledge and attitude (concern and preference) related to the wastewater discharge of the two selected districts of Molas and Wenang in the city of Manado. The community’s participation and willingness to pay for wastewater management were also discussed. 5.1 Introduction Coastal areas are being threatened by anthropogenic pressures due to land-based activities and pollution-causing wastewater from developmental activities in cities. This situation is a general phenomenon in most tropical developing countries, including Indonesia. One approach to prevent and mitigate such a situation is to involve the local community which can play an important role in the management, for instance community-based coastal management (Hildebrand, 1997). An example of that is a community-based waste management and environmental quality management program applied in the coastal city of Jakarta to prevent and mitigate degradation of the coastal area of Jakarta Bay (Nur et al., 2001). Like other coastal areas in Indonesia, Manado Bay (Fig. 1.1) is facing various environmental problems due to wastewater discharge from the city of Manado. The majority of wastewater from the city is discharged without any treatment; therefore, it is predicted to cause contamination to canals and rivers flowing through the city and cause further impact on the community’s health (Table 4.5). To overcome the problem, improvement to the exiting wastewater management of the city is urgently needed to prevent the wastewater impacts. But, it could not be done if the city’s community has a lack of awareness and is without adequate involvement and participation. This was one of the identified issues related to wastewater management in the city. This study aims to evaluate the community’s environmental knowledge and attitude (concern and preference), and to discuss the community’s participation and willingness to financially contribute to wastewater management in the coastal city of Manado. Findings from this study could be used to formulate recommendations for further measures to improve the current management in the city, and as a case study of how a tropical coastal city in Indonesia can involve the community in addressing wastewater problems. 5.2 Research Methodology This study was conducted in the two study sites (SS) of Molas Districts (SS 1) and Wenang Districts (SS 2) in the city of Manado (Fig. 1.1). The general research methodology and general description of the study area have been presented in Chapter 3 and 4, respectively. This study was set up to evaluate some aspects as seen below:

48
Aspect of study Environmental attitude Basis of study Environmental
knowledge concern preference Household level √ √ Personal level √ √ √: aspect evaluated
5.2.1 Community’s environmental knowledge The environmental knowledge of the communities was described using 'degree of knowledge' (DK), which was assessed by using a questionnaire for interviewing. The data were collected through surveys which were done in households (questions were given to the head of a household). Two topics, consisting of several focus questions, were given to the respondents to be answered. The first topic was ‘knowledge of general issues about environment and pollution; it consisted of 4 focused questions, such as (i) the terminology of ‘'environment' and 'pollution', (ii) pollution in the coastal area, (iii) toxic substances causing pollution, and (iv) why toilets should be used. The second topic was ‘knowledge of environmental issues related to wastewater. This consisted of 3 focus questions, such as (i) pollution of potable water due to wastewater discharge, (ii) wastewater discharge causing disease, and (iii) diseases (example: diarrhoea) caused by wastewater from toilets (Appendix 1). The basic principle of this technique was to find out whether the community 'knows' or 'does not know' the answers of the questions given. The numbers of ‘know’ answers were then counted; the results of each of the focus questions were described as a percentage, and also aggregated values (AV: mean value of the focused question percentages) were also calculated. Then, the DK of each of the topics was measured based on the average percentage of the aggregated values obtained. An ordinal scale was applied to measure the DK which was constructed as follows: Degree of environmental knowledge (DK)
0 - 33% 34 - 66% 67 - 100% Low Middle High
5.2.2 Community’s environmental attitude • Community’s concern The environmental concern of communities was described using ‘degree of concern’ (DC). Two topics were focused, namely (a) the community’s concern about general environmental conditions and impacts, and (b) the community’s concern about environmental conditions and impacts related to wastewater discharge. Six focused questions were arranged for the first topic (point a): (i) solid waste discharge, (ii) toxic waste discharge, (iii) community health conditions, (iv) local environmental conditions, (v) local air pollution, and (vi) environmental destruction in coastal areas. Six focused questions were arranged for the second topic (point b): (i) local potable water pollution, (ii) pollution in coastal areas, (iii) toilet conditions and facilities, (iv) sewerage conditions and

49
facilities, (v) wastewater-caused diseases, and (vi) pollution caused by wastewater discharge (Appd. 2). This aspect was described on a personal level, meaning that questions were given to respondents in person. The DC, described in 5 levels (‘very concerned’, ‘concerned’, ‘somewhat concerned’, ‘less concerned’, and ‘not concerned’), was calculated as percentage answers of respondents. The aggregated value (AV) of each topic as the percentage of the DC was obtained. A graphic rating scale was applied in order to measure the DC. Using this scale people were asked to indicate their concerns with the listed items. As an example: On a scale of 1 to 5, how would you rate your concern about the items listed? (E.g., problems caused by wastewater quality)
Degree of concern (DC) Very high degree of
concern ‘very concerned’
‘concerned’
‘somewhat concerned’
‘less
concerned’
Very low degree of concern
‘not concerned’ 1 2 3 4 5
• Community’s preference The preference of the community was described using ‘strength of preference’ (SP). It was focused on 3 topics, namely (1) related to the government’s responsibility, (2) related to the community’s responsibility, and (3) the responsibility of all parties in the city. The first topic focused on 2 questions, namely (i) the government is the only party that has responsibility, and (ii) no funds should be collected from the community. The second topic focused on 2 questions, namely (i) the community is the only party that has responsibility, and (ii) funds must be collected from the community. The third topic focused on 3 questions, namely (i) all parties must have the responsibility for environmental quality improvement, and (ii) funds can be collected from the community and other parties, and (iii) the government should improve environmental conditions and wastewater treatment facilities (Appd. 1 & 2). This study was conducted on two levels: household and personal. The SP was calculated as the percentage answers of respondents. Aggregated value (AV) of each topic was then calculated. The graphic rating scale was also applied in order to measure the SP. Using this scale people were asked to indicate their preference. Due to different techniques used between the household surveys using interviews and the personal surveys using questionnaires, the preferences are described below: • For household level: On a scale of 1 to 2, how would you rate your strength of preference about the items listed? (E.g., the government may take funds from the community to solve wastewater problem)
Strength of preference (SP) ‘agree’ ‘disagree’
1 2

50
• For personal level: On a scale of 1 to 4, how would you rate your strength of preference about the items listed? (E.g., the government may take funds from the community to solve wastewater problems)
Strength of preference (SP) Very high strength of preference
‘very agree’
‘agree’
‘agree less’ Very low strength of preference
‘disagree’ 1 2 3 4
All the data were collected between August 2002 and June 2003. The data were obtained through interviews with households and individuals using questionnaires covering the selected topics (App. 3 & 4). Sample size was determined according to Slovin (1960, cf. Sevilla et al., 1988) and the stratified random sampling method (Steel and Torrie, 1980) was applied (Table 3.3a & b). In the attitude aspect study, statistical modes were calculated to conclude the results and their statistical significance was analyzed using the Chi-square (χ2)-test (Steel & Torrie, 1980). 5.3 Results and Discussion 5.3.1 Community’s environmental knowledge Table 5.1 shows the degree of knowledge (DK) of the communities in Molas and Wenang districts. On the general issue about the environment and pollution, the DK was at a ‘middle’ degree (AV= 49%) in Wenang and at a ‘low’ degree (AV= 27.3%) in the Molas district. On this topic, the community knowledge on ‘why toilets should be used?’ was ‘high’ for both districts, Wenang (AV= 96.7%) and Molas (AV= 93.0%). This indicates that people in both districts knew enough to use toilets for their personal wastes. At the same time, the DK on the ‘environmental issues related to wastewater’ was ‘high’ in both districts as the AV showed 88.8% for Wenang and 80.0% for Molas. However, the knowledge about wastewater impact on potable water was ‘middle’ (AV= 44.7%) for Wenang and ‘low’ (AV= 29.7%) for Molas. This might be because of a lack of information on the origin of drinking water for their daily consumption. The community’s knowledge on the terminology of ‘environment’ and ‘pollution’ is basic knowledge for the communities to be able to describe what they are facing every day. By knowing these terms, people should realize how important the environment is for their lives and how important it is to keep it clean. The DK seen in these districts probably reflects the environmental condition of the districts. However, it is also closely related with the level of education and how far such information is spread within the community. 5.3.2 Community’s environmental attitude Two aspects of environmental attitudes were measured in the present study, they being the community’s concerns related to general environmental issues and environmental problems caused by wastewater (Topic 1), and community’s preference for solving environmental problems related to wastewater discharges (Topic 2).

51
• Community’s concern The DC of the communities in Molas and Wenang districts is shown in Table 5.2 and 5.3. Based on the statistical mode, the communities in both districts were in the ‘concerned’ level to the Topic 1 with AV of 47.5% in Wenang and 61.4% in Molas districts. However, there were some respondents that had the level of ‘less concerned’ (AV= 3.6% in Wenang and AV= 2.1% in Molas) as well as no response to the questions in Wenang (AV= 0.7%) (Table 5.2). In each of the focus questions, the statistical mode felt the DC of ‘very concerned’, ‘concerned’, and ‘some what concerned’ for the questions of ‘toxic waste discharge’, but it was statistically not significant. A similar result was also shown for Topic 2, which had the AV of 57.6% for Wenang and 56.6% for Molas (Table 5.3). These results reflect the existing situations and conditions of the city’s environment. All the issues (Topic 1 and 2) may influence their daily activities, as the impacts are directed to them. Table 5.1 Degree of Knowledge (DK) of Community (at household level) about General
Environmental Issues and Issues Related to Wastewater
Percentage of answers Topics and focus of questions ‘know’ ‘do not know’
No answer
Topic 1: Knowledge on the general issue of environment and pollution:
• Terminology of ‘'environment' and 'pollution'. • Pollution in coastal area • Toxic substance pollution
• Why toilet should be used
a b a b a b a b
60.2 34.0 45.1 40.7 41.8 20.7 96.7 93.0
39.8 66.0 54.9 59.3 57.9 79.3 3.3 7.0
0.0 0.0 0.0 0.0 0.3 0.0 0.0 0.0
Aggregated value (AV)
a b
49.0 ts 27.3 ss
51.0 ts 72.7 ss
0.0 0.0
Topic 2: Knowledge on environmental issues related to wastewater:
• Pollution of potable water due to wastewater discharge
• Wastewater discharge causes disease • Diseases (example: diarrhoea) were caused by
wastewater from toilet
a b a b a b
44.7 29.7
99.3 98.3 85.9 77.7
55.3 70.3
0.7 1.7
14.1 22.3
0.0 0.0
0.0 0.0 0.0 0.0
Aggregated value (AV) a b
88.8 ss 80.0 ss
11.2 ss 20.0 ss
0.0 0.0
a Wenang district (N=304); b Molas district (N=300); N: respondent ts not significant; ss highly significant Degrees of knowledge (DK): low: 0-33%; middle: 34-66%; high: 67-100%

52
Table 5.2 D
egree of Concern (D
C) of C
omm
unity (at Personal Level) about General Environm
ental Conditions and Im
pacts (Topic 1) Focus of questions
Percentage of answers
No
Mode
1
2 3
4 5
Answ
er
• Solid w
aste discharge •
Toxic waste discharge
• C
omm
unity’s health condition •
Local environmental condition
• Local air pollution
• Environm
ental destruction in coastal areas
a b a b a b a b a b a b
35.3 40.7 23.0 26.9 34.5 34.5 33.8 44.1 20.9 40.7 28.8 50.3
41.7 26.9 18.0 42.8 41.7 36.6 44.6 38.6 38.1 33.8 25.2 26.2
15.8 21.4 25.9 19.3 16.5 17.2 17.3 11.7 23.0 17.9 30.9 15.9
2.9 8.3 15.1 3.4 3.6 6.2 2.2 3.4 11.5 5.5 6.5 6.2
4.3 2.1 13.7 2.1 2.2 2.8 1.4 2.1 5.0 1.4 4.3 1.4
0.0 0.7 4.3 5.5 1.4 2.8 0.7 0.0 1.4 0.7 4.3 0.0
2 ss 1 ss 3 ns 2 ss 2 ss 2 s 2 ss 1 s 2 ss 1 ss 3 ns 1 ss
Aggregated value (A
V)
a b 15.8 23.4
47.5 61.4
32.4 13.1
3.6 2.1
0.0 0.0
0.7 0.0
2ss
2ss
Degree of concern (D
C): 1: ‘very concerned’; 2: ‘concerned’; 3: ‘som
ewhat concerned’; 4: ‘less concerned’; 5: ‘not concerned’
a Wenang D
istrict (N=139); b M
olas District (N
=145) ns not significant; s significant; ss highly significant
52

53
Table 5.3 D
egree of Concern (D
C) of C
omm
unity (at Personal Level) about Environmental C
onditions and Impacts R
elated to Wastew
ater D
ischarge (Topic 2) Focus of questions
Percentage of answers
No
Mode
1
2 3
4 5
Answ
er
• Local potable w
ater pollution •
Pollution in coastal areas •
Toilet facilities condition •
Sewerage facilities condition
• W
astewater-caused diseases
• Pollution caused by w
astewater discharge
a b a b a b a b a b a b
33.1 47.6 28.1 35.9 36.0 40.7 40.3 29.7 32.4 42.8 30.9 24.1
41.7 28.3 28.8 37.9 38.8 35.9 35.3 44.1 41.7 31.7 40.3 38.6
16.5 13.8 29.5 15.2 13.7 15.9 16.5 18.6 22.3 10.3 23.7 22.8
2.2 5.5 8.6 8.3 5.8 2.8 3.6 4.8 0.7 7.6 2.9 8.3
5.8 4.8 2.9 1.4 3.6 4.1 2.9 2.1 2.2 4.8 0.7 3.4
0.7 0.0 2.2 1.4 2.2 0.7 1.4 0.7 0.7 2.8 1.4 2.8
2 ss 1 ss 3 ns 2 ns 2 ns 1 s 1 s 2 ss 2 ss 1 ss 2 ss 2 ss
Aggregated value (A
V)
a b 18.0 20.7
57.6 56.6
20.9 18.6
3.6 3.4
0.0 0.0
0.0 0.7
2 ss 2 ss
Degree of concern (D
C): 1: ‘very concerned’; 2: ‘concerned’; 3: ‘som
ewhat concerned’; 4: ‘less concerned’; 5: ‘not concerned’
A: W
enang District (N
=139); b: Molas D
istrict (N=145)
ns not significant; s significant; ss highly significant
53

54
Table 5.4 C
omm
unity’s (Household Level) Preference regarding Problem
Solving of Environmental Issues, including W
astewater Problem
s Focus of questions
Percentage of answers
No
Modus
1
2 answ
er
Governm
ent’s responsibility: • G
overnment is the only party that has responsibility
• No fund is collected from
comm
unity A
ggregated value
a b a b a b
6.9 4.3
55.9 83.0 5.3 5.0
92.8 94.7 42.8 16.0 94.4 94.3
0.3 1.0 1.3 1.0 0.3 0.7
2ss
2ss
Com
munity’s responsibility:
• Com
munity is the only party that has responsibility
• Funds must be collected from
comm
unity A
ggregated value
a b a b a b
3.6 1.3
65.1 29.0 3.0 0.7
96.1 97.7 33.2 70.0 96.7 98.7
0.3 1.0 1.6 1.0 0.3 0.7
2ss
2ss
All parties’ responsibility:
• All parties m
ust have responsibility for environmental quality
improvem
ent • Funds can be collected from
comm
unity and other parties, and government
will im
prove environmental condition and w
astewater treatm
ent facilities A
ggregated value
a b a b a b
98.7 98.3 71.7 56.3
72.0 56.0
1.0 0.7
27.3 42.7
27.6 43.3
0.3 1.0 1.0 1.0 0.3 0.7
1ss
1ss
1: ‘agree’; 2: ‘disagree’; a: Wenang D
istrict (N=304); b: M
olas District (N
=300); ss highly significant
54
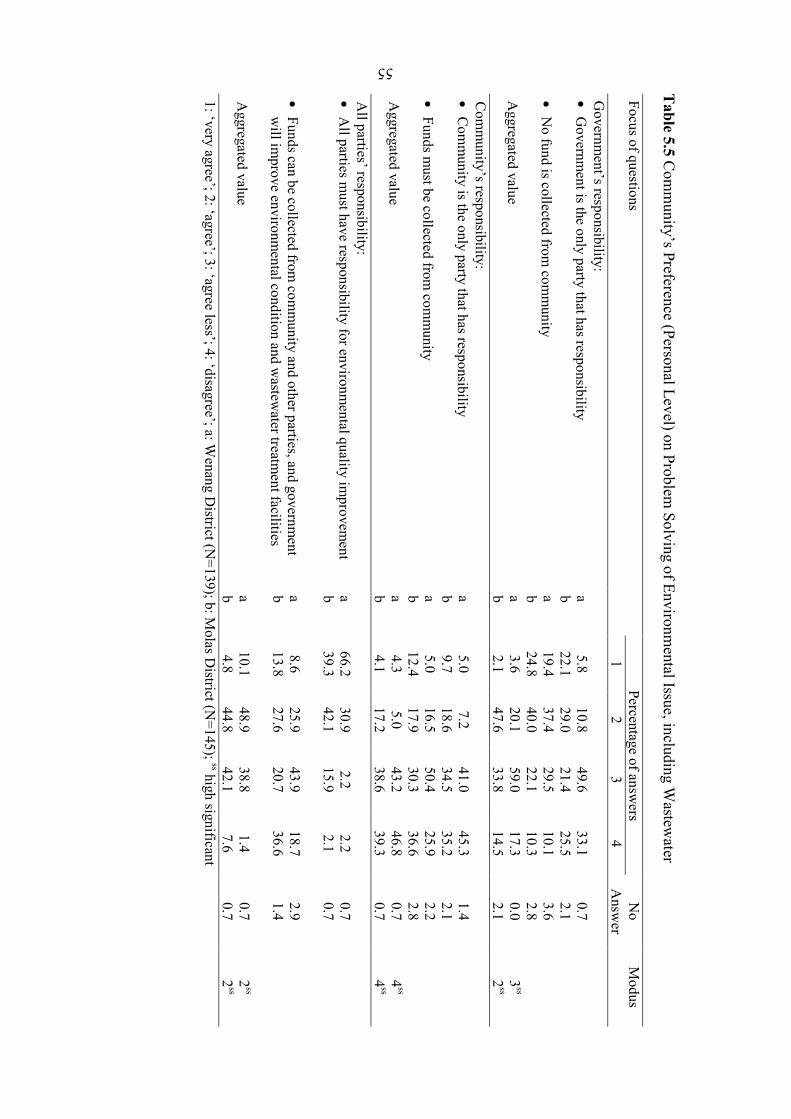
55
Table 5.5 C
omm
unity’s Preference (Personal Level) on Problem Solving of Environm
ental Issue, including Wastew
ater Focus of questions
Percentage of answers
No
Modus
1
2 3
4 A
nswer
G
overnment’s responsibility:
• Governm
ent is the only party that has responsibility • N
o fund is collected from com
munity
Aggregated value
a b a b a b
5.8 22.1 19.4 24.8 3.6 2.1
10.8 29.0 37.4 40.0 20.1 47.6
49.6 21.4 29.5 22.1 59.0 33.8
33.1 25.5 10.1 10.3 17.3 14.5
0.7 2.1 3.6 2.8 0.0 2.1
3ss
2ss
Com
munity’s responsibility:
• Com
munity is the only party that has responsibility
• Funds must be collected from
comm
unity A
ggregated value
a b a b a b
5.0 9.7 5.0
12.4 4.3 4.1
7.2 18.6 16.5 17.9 5.0
17.2
41.0 34.5 50.4 30.3 43.2 38.6
45.3 35.2 25.9 36.6 46.8 39.3
1.4 2.1 2.2 2.8 0.7 0.7
4ss
4ss
All parties’ responsibility:
• All parties m
ust have responsibility for environmental quality im
provement
• Funds can be collected from com
munity and other parties, and governm
ent w
ill improve environm
ental condition and wastew
ater treatment facilities
Aggregated value
a b a b a b
66.2 39.3
8.6 13.8
10.1 4.8
30.9 42.1
25.9 27.6
48.9 44.8
2.2 15.9
43.9 20.7
38.8 42.1
2.2 2.1
18.7 36.6
1.4 7.6
0.7 0.7 2.9 1.4 0.7 0.7
2ss
2ss
1: ‘very agree’; 2: ‘agree’; 3: ‘agree less’; 4: ‘disagree’; a: Wenang D
istrict (N=139); b: M
olas District (N
=145); ss high significant
55
56
• Community’s preference Table 5.4 shows the community’s preference (at the household level) regarding the problem solving of environmental issues, including wastewater problems. People have a positive attitude towards the solving of environmental problems including wastewater as most of the households ‘disagreed’ with the statement that wastewater problems are either fully a government or fully a community responsibility. Most of the households ‘agreed’ (preferred) that all parties (government, community, private sector, etc.) have the same level of responsibility to address wastewater problems. Also, they ‘agreed’ that the government may collect funds from the community for improving the quality of wastewater infrastructure and facilities. Individual (personal) responses to solve the environmental problems including wastewater problems were also positive (Table 5.5). Most people personally preferred that all parties should take responsibility for environmental quality improvement. They also agreed that funds can be collected from the community and other parties for the government to improve environmental conditions and wastewater treatment facilities. 5.3.3 Willingness to be charged (willingness to pay) The implementation of wastewater management cannot be separated from financial aspects. Sources of funds are an issue of whether it is fully from a government (subsidy), fully from a community (tax, retribution), or a combination of those. The household and personal surveys showed that most people agreed to be charged (willingness to pay) to address wastewater problems (Table 5.4 & 5.5). This means that funds can be collected from the community and other parties in the city by the government to improve environmental conditions and wastewater treatment facilities. These situations were probably related to the public awareness that people are concerned with environmental issues and wish to solve environmental issues including wastewater problems. 5.3.4 Community’s participation The participation of the community to be involved in a management program is a matter of importance as they may play a role as one of the subjects in the program. However, participation can only be achieved when power is shared (Hildebrand, 1997). In general, the participation of non-governmental organizations (NGOs) in sustainable development in Indonesia occurs in several ways. They can be involved in collaborations as one of the parties together with government and investors, community empowerment activities, and environmental education (Fig. 5.1). Most of those relationships have been established in coastal zone activities (Kumurur & Lasut, 2002). There are two types of community institutions addressing environmental and developmental issues in the city of Manado. Some institutions are not limited by an area and have free membership [for instance governmental organizations (NGOs)], and other institutions are limited by area and have closed membership [for instance community empowerment organizations (CEOs)]. Both institutions play an important role in the city development, functioning as a partner or giving suggestions to the government. This is

57
mostly the role of an NGO. The CEO, which is established in each of the districts in the city, is a partner of the district’s government for developmental aspects as the government is the sponsor of the institution. In the city of Manado, no cases have been observed in which the community has taken an initiative to prevent and mitigate the wastewater problems, except for spontaneous personal or household initiatives who have taken actions in regards to environmental problems. Moreover, such actions were mostly local, limited to where their homes are located.
Province
City
District
Sub-district
NGOs
INFORMATION
-Technical Assist-Education -Practical
Figure 5.1 Participation of NGOs in integrated coastal zone management activities (modified from Kumurur and Lasut, 2002)

58
Chapter 6 Condition and Capacity of Household Wastewater Treatment Systems
This chapter describes the results of the study of the status of wastewater treatment system conditions and capacities, the condition of wastewater infrastructures and facilities, and factors affecting the conditions of wastewater treatment systems. 6.1 Introduction Wastewater discharges from various sources may have implications for and impacts on the environment of a city. Those implications and impacts are mostly negative and may degrade the quality of the environment and cause various significant environmental problems, for instance the outbreak of wastewater-transmitted diseases (Table 4.5). However, such impacts depend on the quantity and quality of the discharged wastewater and both depend on many factors (e.g. source and type of wastewater discharge). In the city of Manado, untreated wastewater from most household activities (grey water) in most cases, including toilets (black water) in some cases, is discharged directly into Manado Bay through ditches, sewers, canals, and rivers. Besides the presence of wastewater-generating activities (restaurants, hotels, hospitals, garbage disposal, markets, etc.) located close to and along the rivers, the condition will be worse if the households have wastewater treatment systems in a poor or bad condition and of an inadequate capacity, as well as having poor wastewater infrastructures and facilities (sewer system). The condition and capacity of the wastewater treatment system may play a significant role in environmental degradation as well as that of health and hygiene in the coastal area; poor conditions may cause an outbreak of wastewater-transmitted diseases, and unsuitable/poor capacity may cause leaking and spilling of wastewater into the area and further may degrade the environment of the area. The condition and capacity of the residential wastewater treatment systems (septic tanks) and the condition of residential wastewater infrastructures and facilities (sewer systems) in the city of Manado are unknown, regardless of the fact that such information is necessary in the wastewater management of the city. Therefore, this study aims to evaluate the condition and capacity of wastewater treatment systems (septic tanks) and wastewater infrastructures and facilities (sewer systems) at the household level (residential), and to investigate factors (socio-economic characteristics and community’s environmental knowledge) affecting the condition of the wastewater treatment systems (septic tanks). The investigation hypothesizes that the condition and capacity of wastewater treatment systems (septic tank) at household levels were correlated with socio-economic characteristics (household income per month, house status, level of education) and the degree of the community’s environmental knowledge. 6.2 Research Methodology This study was conducted in the two study sites (Molas and Wenang districts) in the city of Manado (Fig. 1.1). All data were collected between August 2002 and June 2003. An individual house (permanent, semi-permanent, or other) was the basic sample unit (Annex
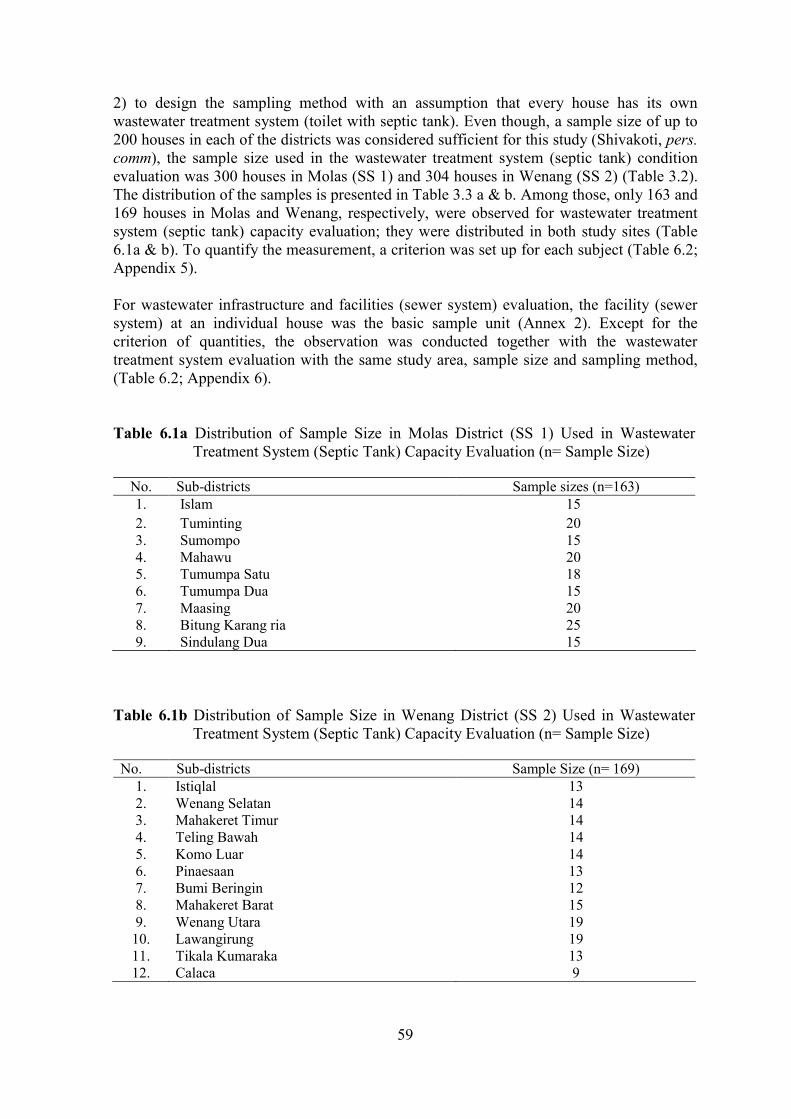
59
2) to design the sampling method with an assumption that every house has its own wastewater treatment system (toilet with septic tank). Even though, a sample size of up to 200 houses in each of the districts was considered sufficient for this study (Shivakoti, pers. comm), the sample size used in the wastewater treatment system (septic tank) condition evaluation was 300 houses in Molas (SS 1) and 304 houses in Wenang (SS 2) (Table 3.2). The distribution of the samples is presented in Table 3.3 a & b. Among those, only 163 and 169 houses in Molas and Wenang, respectively, were observed for wastewater treatment system (septic tank) capacity evaluation; they were distributed in both study sites (Table 6.1a & b). To quantify the measurement, a criterion was set up for each subject (Table 6.2; Appendix 5). For wastewater infrastructure and facilities (sewer system) evaluation, the facility (sewer system) at an individual house was the basic sample unit (Annex 2). Except for the criterion of quantities, the observation was conducted together with the wastewater treatment system evaluation with the same study area, sample size and sampling method, (Table 6.2; Appendix 6). Table 6.1a Distribution of Sample Size in Molas District (SS 1) Used in Wastewater
Treatment System (Septic Tank) Capacity Evaluation (n= Sample Size)
No. Sub-districts Sample sizes (n=163) 1. Islam 15 2. Tuminting 20 3. Sumompo 15 4. Mahawu 20 5. Tumumpa Satu 18 6. Tumumpa Dua 15 7. Maasing 20 8. Bitung Karang ria 25 9. Sindulang Dua 15
Table 6.1b Distribution of Sample Size in Wenang District (SS 2) Used in Wastewater
Treatment System (Septic Tank) Capacity Evaluation (n= Sample Size) No. Sub-districts Sample Size (n= 169)
1. Istiqlal 13 2. Wenang Selatan 14 3. Mahakeret Timur 14 4. Teling Bawah 14 5. Komo Luar 14 6. Pinaesaan 13 7. Bumi Beringin 12 8. Mahakeret Barat 15 9. Wenang Utara 19
10. Lawangirung 19 11. Tikala Kumaraka 13 12. Calaca 9

60
At the same time, socio-economic characteristics (household income per month, house status, level of education) and the community’s environmental knowledge data were obtained through household surveys (family level) along with interviews. The interviews ran using a questionnaire with relevant topics as issues. The way of obtaining the data is mentioned in Chapter 5. The data of the wastewater treatment system and wastewater infrastructure and facility (sewer system) evaluations were presented in percentage to describe their condition and capacity, as well as the data of socio-economic characteristics to describe the characteristics of each aspect. The Chi-square (χ2)-test with 0.5% significance level (Steel & Torrie, 1980) was applied to analyze the significance of the results. The Pearson’s correlation coefficient (PC) using Bivariate Correlations procedure was used to test the correlation between the independent variables (the socio-economic characteristics and the community’s environmental knowledge) and the dependent variable (the condition of wastewater treatment system). The computations were done using the SPSS® computer program. 6.3 Results and Discussion 6.3.1 Condition and capacity of wastewater treatment system (septic tank) In general, most constructions whether residential or commercial, have their own wastewater disposal system for black water (wastewater from toilet), such as a toilet system with a septic tank. A wastewater treatment system for a cluster of homes is setup to serve several households in an area. However, no modern system with proper technology has been adopted for the residential treatment system in this area, only the conventional method with one or two septic tanks using the gravity method. Besides, for low income households, a deep hole, ditch, or river are still used. The latest is considered as the main source of wastewater in the city, as well as toilet and septic tank systems which are in poor condition and have inadequate capacity. The study results on the conditions and capacities of wastewater treatment systems and the presence of septic tanks observed during the present study at household levels in the districts of Molas (SS 1) and Wenang (SS 2), as well as Wanea districts for comparison, are shown in Table 6.3. The condition and capacity of the system varied from very good (vg) to very poor (vp). The ‘very poor’ (the septic-tank is leaking into residential wells and sewers) and ‘poor’ (using an open hole) conditions of septic tanks were observed in both districts as well as the ‘adequate’, ‘good’, and ‘very good’ categories. In this study, a condition is categorised as ‘very good’ if the septic tanks consist of two compartments, have a closed hole (with lid), and are made of concrete or cement. There were also houses without septic tank facilities. The absence of septic tanks in Wenang, Molas, and Wanea districts was found in 16.8%, 25.0%, and 14.7% of the houses, respectively (Table 6.3). In this case, the households probably use the communal septic tank or sewers, canals, or rivers to directly discharge the contents from their toilets. It was observed in the Molas district that most of the public or communally-used toilets have septic tanks in poor condition. This was probably due to a lack of management, especially a lack of finances for maintenance, and the lack of awareness of the users to keep them clean.

61
Table 6.2 C
riteria for Condition and C
apacity of Wastew
ater Treatment System
(Septic Tank) and Wastew
ater Infrastructures and Facilities (Sew
er system) U
sed in This Present Study
Residential septic-tank
C
riteria: C
ondition C
apacity C
ondition of infrastructures and facilities (sewer
system) condition at house level
1. Very poor (V
p): leaking to sew
er
1. With or w
ithout concrete/cement, littering by solid
waste, no running w
ater
2. Poor (Pr): open hole
<1419.38 liters (< 5 years of use) 2. N
o concrete/cement, littering by solid w
aste, running w
ater
3. Adequate (A
q): closed hole, no concrete/ cem
ent 1419.38-1774.23 liters (5 to 10 years of use)
3. With or w
ithout concrete/cement, no littering by
solid waste, no running w
ater
4. Good (G
d): closed hole, concrete/cem
ent, 1 com
partment
>1774.23 liters (10 to 15 years of use) 4. W
ith or without concrete/cem
ent, with or w
ithout littering by solid w
aste, running water
5. Very good (V
g): closed hole, w
ith concrete/cem
ent, 2 com
partments
5. C
oncrete/cement, no littering by solid w
aste, running w
ater.
Standard: 1 bedroom equal 1419.38 litres 1; 1 bedroom
consists of 2 persons 1 Feachem
et al., (1983 cf Kusnoputranto, 1997)
61
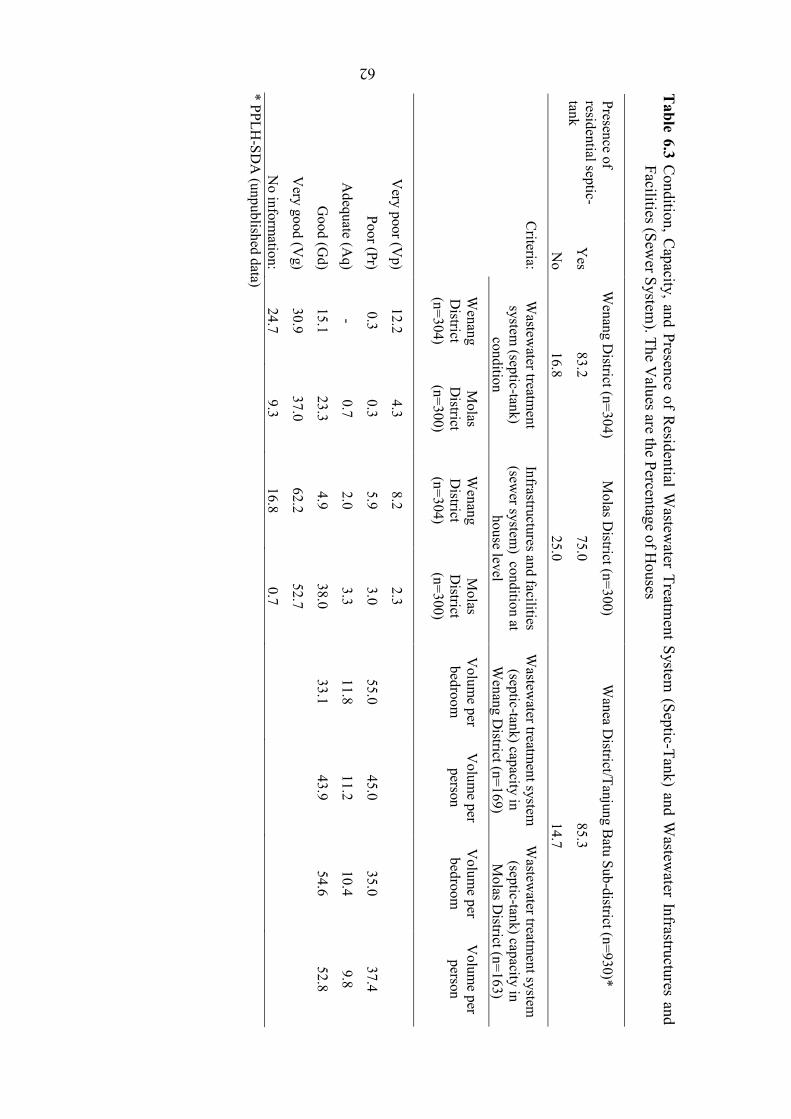
62
Table 6.3 C
ondition, Capacity, and Presence of R
esidential Wastew
ater Treatment System
(Septic-Tank) and Wastew
ater Infrastructures and Facilities (Sew
er System). The V
alues are the Percentage of Houses
W
enang District (n=304)
Molas D
istrict (n=300) W
anea District/Tanjung B
atu Sub-district (n=930)*
Yes
83.2 75.0
85.3
Presence of residential septic-tank
No
16.8 25.0
14.7
Criteria:
Wastew
ater treatment
system (septic-tank)
condition
Infrastructures and facilities (sew
er system) condition at
house level
Wastew
ater treatment system
(septic-tank) capacity in W
enang District (n=169)
Wastew
ater treatment system
(septic-tank) capacity in M
olas District (n=163)
Wenang
District
(n=304)
Molas
District
(n=300)
Wenang
District
(n=304)
Molas
District
(n=300)
Volum
e per bedroom
V
olume per
person V
olume per
bedroom
Volum
e per person
Very poor (V
p) 12.2
4.3 8.2
2.3
Poor (Pr) 0.3
0.3 5.9
3.0 55.0
45.0 35.0
37.4
Adequate (A
q) -
0.7 2.0
3.3 11.8
11.2 10.4
9.8
Good (G
d) 15.1
23.3 4.9
38.0 33.1
43.9 54.6
52.8
Very good (V
g) 30.9
37.0 62.2
52.7
No inform
ation: 24.7
9.3 16.8
0.7
* PPLH
-SDA
(unpublished data)
62

63
Besides these conditions, most of the septic tanks of the city’s houses were categorized as poor, regarding their capacity. The capacity of septic tanks is considered in relation to a non-technical aspect, such as the number of persons using the facility; while the presence of the septic tank is considered to be related to the availability of available space (2x2 m) to a house. One standard to measure the appropriate capacity of a septic tank is to consider that every 2 household occupants equivalent with 1419.38 litres of wastewater (Kusnoputranto, 1997). 6.3.2 Condition of wastewater infrastructure and facilities (sewer system) None of the houses observed during the present study have grey water treatment systems. Seemingly, wastewater from bathrooms, kitchens, and other sources except septic tanks, were not considered by the residents to cause environmental problems. So, they had not considered it necessary to build such treatment facilities. The sewer system at the household level is an open channel system (open system). Table 6.3 shows the condition of infrastructures & facilities (sewer system) at homes in two districts, Wenang and Molas. The conditions varied from very good (vg) to very poor (vp). 62.2% of the houses in Wenang and 52.7% in Molas were with very good systems (concrete/cement, no littering of solid waste, running water conditions). However, the sewer condition was in very poor condition (with or without concrete/cement, littering of solid waste, no running water) in 8.2% of the houses in Wenang and 2.3% in Molas. This poor condition of the sewer systems may block the wastewater discharge (grey water) flowing into the ditches and canals which causes wastewater puddles. It is an unhygienic condition promoting bad odors, rats, mosquitoes and other insects. 6.3.3 Factors affecting the wastewater treatment system condition The socio-economic characteristics (household income, level of education, and house status) of the respondents in the study area, districts of Molas (SS 1) and Wenang (SS 2) are shown in Table 4.5 (p. 42). More than 50% (64.5% in Wenang and 68.7% in Molas) of the respondents had monthly incomes below 1 million Rupiah. Due to this level of income, they were categorized as low-income households. More than 50% of the residents (61.5% in Wenang and 53.7% in Molas) were graduated from the high school. Besides, up to 80% (81.6% in Wenang and 82.7% in Molas) of the respondents were house owners. Table 5.1 shows the degree of knowledge (DK) of the respondents to general environmental issues and issues related to wastewater. The results of the correlation analysis between socio-economic characteristics and the community’s environmental knowledge, on one hand, and the condition and capacity of residential septic tanks on the other hand, showed that the Pearson’s Correlation Coefficient (PC) was negative, except for the correlation between the septic tank condition and the level of education, and for the correlation between the capacity of septic tank and the community’s knowledge on environmental issues related to wastewater were positive (Table 6.4). However, they were statistically not significant. From this result, of the positive correlation, it can be said that the condition of residential septic tanks correlated with the level of education, and the capacity of the septic tanks correlated with the knowledge of environmental issues related to wastewater.

64
Table 6.4 Pearson’s Correlation Coefficient (PC) by using the Bivariate Correlations Procedure
Pearson Correlation (PC) Capacity of
Septic TankCondition
Septic Tank
• Socio-economic aspects: PC -.091 -.021
Sig. (2-tailed) .099 .699Household Income per Month
N 332 332
PC -.044 +.103Sig. (2-tailed) .424 .062*
Level of Education
N 332 332
PC -.022 -.047Sig. (2-tailed) .689 .394
House Status
N 332 332
• Community’s environmental knowledge: PC -.039 -.033
Sig. (2-tailed) .482 .551Knowledge on general issue about environment
& pollutionN 332 332
PC +.017 -.003Sig. (2-tailed) .761* .949
Knowledge on environmental issue related towastewater
N 332 332* Not significant A small number of the houses were furnished with septic tanks in very poor and poor condition (with about 12% in Wenang and 4% in Molas, and about 50% in both districts with poor capacity). But, this situation was not correlated (the PC was negative) with the household income and the status of the respondents. It can be said, although improving the condition and capacity of septic tanks needs higher costs, the higher income, however, was not the guarantee that their septic tank’s condition and capacity would be better. Besides, even though most of the houses in the study sites were owned by the residents themselves (82.7% in Molas and 81.6% in Wenang), this was also not the guarantee for better condition and capacity of their septic tank. Seemingly, other factors than those of the socio-economic aspects mentioned above may have influenced the septic tank’s condition and capacity of the households. One such factor may be a direction from the city’s government to improve their own wastewater facilities. However, the community’s concern for environmental conditions and impacts was voiced in a positive note (Table 5.2 & 5.3).

65
Chapter 7 Water Quality Assessment
This chapter describes the results of the study of the status of the water quality of selected rivers which cross through Manado City. The pollution status of the rivers are presented and discussed. 7.1 Introduction Manado Bay (MB) is located in the western part of Minahasa Peninsular Coastal Waters (Fig. 7.1). The bay creates the waterfront to Manado City (MC), a middle-sized city with a population of approximately 418,000 people in 2000 with a growth rate of 3.04% per year in the last decade according to Mokat (2003), and having a total area of approximately 160.61 km2. The bay receives water from the land through 21 rivers, and six of them [Sungai Bailang (SB), S. Maasing (SM), S. Malalayang (SML), S. Sario (SS), S. Tondano (ST), and S. Wusa/Paniki (SWP)] cross through the city with various widths, lengths, and depths (Fig. 4.4). The sources of water for the rivers are mostly from the hinterland agricultural areas of Minahasa Regency (MR). Since most of the sewerage and drainage of the city connects to those rivers, the rivers and the bay are being threatened by a decrease in the water quality due to untreated city wastewater discharge. Whereas, a good water quality of the bay is significantly important to support the subsistence fishing of the local people, local tourism activities, and marine ecosystems (coral reefs and other important marine biota) of Bunaken Island (the central point of the Marine National Park of Bunaken) that is located at the outer part of the bay (Fig. 7.1). Information about the water quality of the rivers and the bay is a matter of importance. However, almost no published information is available, especially in regards to organic, inorganic, bacteria, and metal, except Lasut (2002) on the metal accumulation in the bay and the unpublished data of BOD5 and bacterial load by the PPLH-SDA Unsrat (2000, unpublished) in several selected rivers conducted in 1999. This lack of published information and data is one of the problems that causes difficulty in formulating management measures in order to overcome further impacts on those rivers and the bay. Most domestic wastewater is discharged, untreated and uncontrolled, directly to the rivers. Also, the rivers are used for waste (garbage) disposal systems and also, except for SM, for the daily activities of people living around the rivers such as washing, bathing, and transportation. Therefore, this study is aimed to assess the water quality, including the existing concentrations and its variations due to space and season. Besides, this may be used as base-line data for further controlling and monitoring, and it may be used as a guideline for responsible agencies to create management measures to mitigate pollution in MB caused by wastewater discharge from land-based sources. With regard to domestic wastewater, since it may consist of a wide range of organic, inorganic, bacterial, metal, and other pollutant-containing substances, most authors have reported that such wastewater has been a major environmental concern in coastal waters (Adingra and Arfi, 1998; Lee and Arega, 1999; Wu, 1999; Lipp et al., 2001). Furthermore, Ortiz-Hernandez and Saenz-Morales (1999) suggested that the most important source of water pollution was attributable to wastewater discharge.
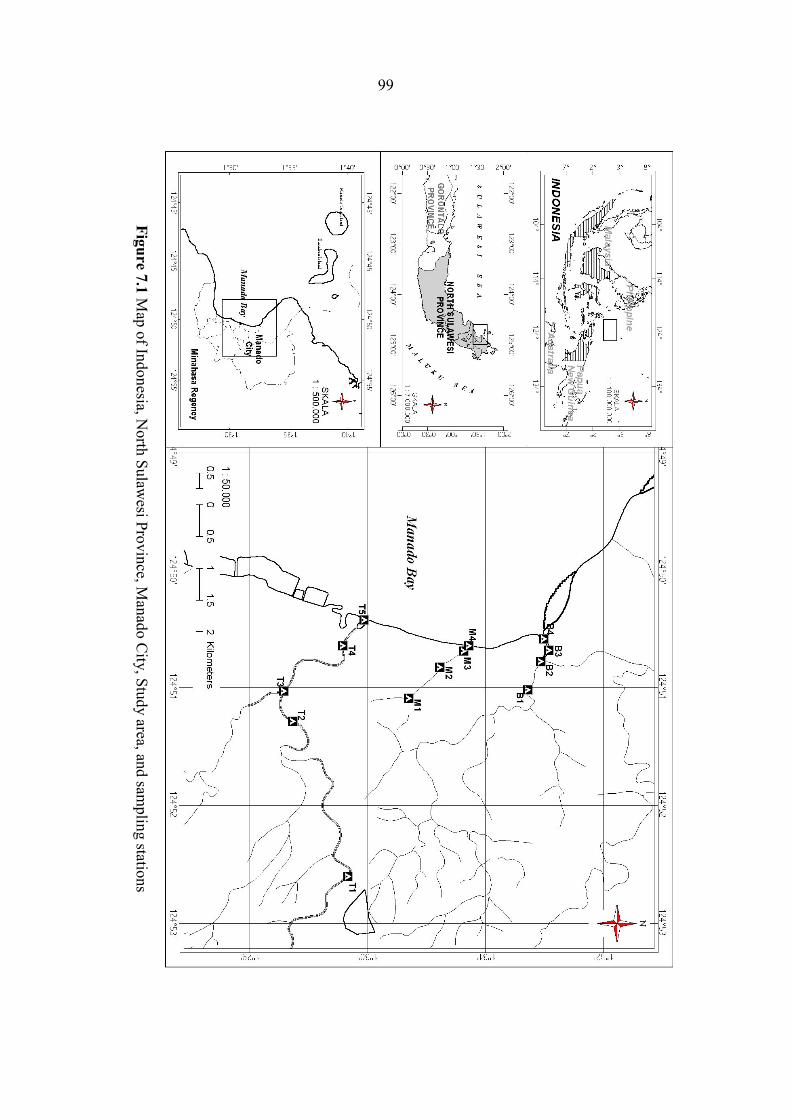
66
Figure 7.1 Map of Indonesia, N
orth Sulawesi Province, M
anado City, Study area, and sam
pling stations
66
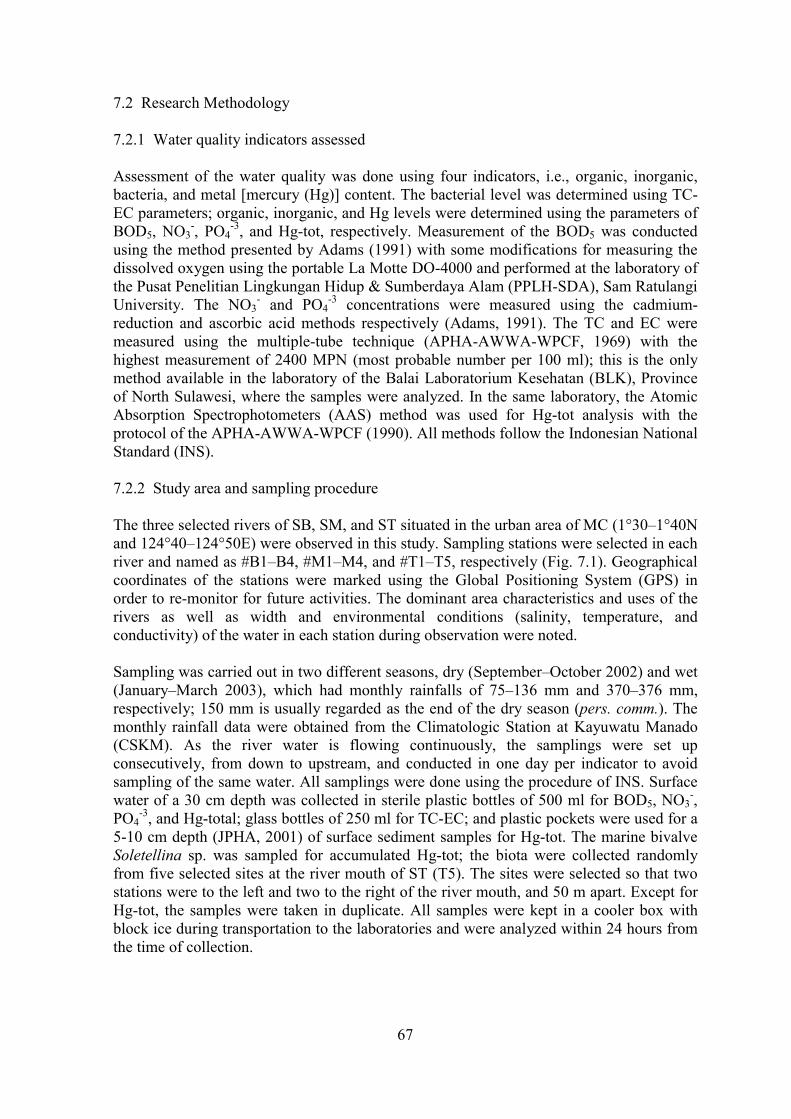
67
7.2 Research Methodology 7.2.1 Water quality indicators assessed Assessment of the water quality was done using four indicators, i.e., organic, inorganic, bacteria, and metal [mercury (Hg)] content. The bacterial level was determined using TC-EC parameters; organic, inorganic, and Hg levels were determined using the parameters of BOD5, NO3
-, PO4-3, and Hg-tot, respectively. Measurement of the BOD5 was conducted
using the method presented by Adams (1991) with some modifications for measuring the dissolved oxygen using the portable La Motte DO-4000 and performed at the laboratory of the Pusat Penelitian Lingkungan Hidup & Sumberdaya Alam (PPLH-SDA), Sam Ratulangi University. The NO3
- and PO4-3 concentrations were measured using the cadmium-
reduction and ascorbic acid methods respectively (Adams, 1991). The TC and EC were measured using the multiple-tube technique (APHA-AWWA-WPCF, 1969) with the highest measurement of 2400 MPN (most probable number per 100 ml); this is the only method available in the laboratory of the Balai Laboratorium Kesehatan (BLK), Province of North Sulawesi, where the samples were analyzed. In the same laboratory, the Atomic Absorption Spectrophotometers (AAS) method was used for Hg-tot analysis with the protocol of the APHA-AWWA-WPCF (1990). All methods follow the Indonesian National Standard (INS). 7.2.2 Study area and sampling procedure The three selected rivers of SB, SM, and ST situated in the urban area of MC (1°30–1°40N and 124°40–124°50E) were observed in this study. Sampling stations were selected in each river and named as #B1–B4, #M1–M4, and #T1–T5, respectively (Fig. 7.1). Geographical coordinates of the stations were marked using the Global Positioning System (GPS) in order to re-monitor for future activities. The dominant area characteristics and uses of the rivers as well as width and environmental conditions (salinity, temperature, and conductivity) of the water in each station during observation were noted. Sampling was carried out in two different seasons, dry (September–October 2002) and wet (January–March 2003), which had monthly rainfalls of 75–136 mm and 370–376 mm, respectively; 150 mm is usually regarded as the end of the dry season (pers. comm.). The monthly rainfall data were obtained from the Climatologic Station at Kayuwatu Manado (CSKM). As the river water is flowing continuously, the samplings were set up consecutively, from down to upstream, and conducted in one day per indicator to avoid sampling of the same water. All samplings were done using the procedure of INS. Surface water of a 30 cm depth was collected in sterile plastic bottles of 500 ml for BOD5, NO3
-, PO4
-3, and Hg-total; glass bottles of 250 ml for TC-EC; and plastic pockets were used for a 5-10 cm depth (JPHA, 2001) of surface sediment samples for Hg-tot. The marine bivalve Soletellina sp. was sampled for accumulated Hg-tot; the biota were collected randomly from five selected sites at the river mouth of ST (T5). The sites were selected so that two stations were to the left and two to the right of the river mouth, and 50 m apart. Except for Hg-tot, the samples were taken in duplicate. All samples were kept in a cooler box with block ice during transportation to the laboratories and were analyzed within 24 hours from the time of collection.

68
Table 7.1 C
haracterization and Environmental C
ondition (Salinity, Temperature, and C
onductivity) of Sampling Stations during D
ry (Septem
ber-October 2002) and W
et (January-March 2003) Seasons
Salinity
a (ppt)
Temperature
a ( oC
) C
onductivitya
(µS) Location
Sampling
station ID
#
Coordinates
(UTM
)Predom
inant land use in surrounding
area
Uses
Approx.
Width
(m)
Dry
Wet
Dry
Wet
Dry
Wet
Bailang
River
B1
51 N 0706427 0167511
MR
A
Transportation 2.5
0.10.1
30.4 27.4
275.8 226.0
B
2 51 N
0706041 0168198
MR
A
Transportation 15
0.20.2
31.9 28.1
470.2 241.0
B
3 51 N
0705652 0168711
R
Toilet 20
10.0 5.1
33.7 28.2
17.9* 8.9*
B
4 51 N
0705099 0168407
MR
A
- 30
17.4 15.5
33.1 28.7
28.6* 26.5*
Maasing
River
M1
51 N 0705989 0166417
R
Toilet, garbage dump
10.3
0.231.6
27.7 538.5
448.5
M
2 51 N
0705622 0166788
R
Public Toilet 2.5
0.50.2
31.7 27.7
982.0 471.0
M
3 51 N
0705404 0167125
R
Garbage dum
p 2
0.50.4
34.0 28.3
1171.0 666.0
M
4 51 N
0705304 0167254
MR
A
- 3
9.020.0
34.2 28.8
15.4* 30.3*
Tondano R
iver T1
51 N 0708992 0165397
R
Transportation, Toilet, w
ashing, bathing 30
0.10.1
30.1 27.4
259.8 252.5
T2
51 N 0706413 0164390
RD
U
Transportation, fish culture, fishing, Toilet, w
ashing 35
0.20.2
28.1 28.1
328.5 315.0
T3
RD
U
Fish culture, fishing, Toilet, w
ashing 35
T4
51 N 0705312 0165354
MR
A
Bathing, w
ashing, Toilet 50
2.10.6
30.4 27.4
4.7* 1.3*
T5
51 N 0704989 0165630
RD
U
- 50
4.11.1
31.1 27.3
9.0* 2.1*
a the average of two values; * m
S; MR
A: m
ix residential and agriculture; R: residential; RD
U: residential (dense urban)
68

69
7.2.3 Statistical analysis A simple statistical computation of one-way analysis of variance (Fowler and Cohen, 1990) was applied to test differences of concentration of each parameter among the rivers and during the seasons. 7.3 Results and Discussion 7.3.1 General characteristic and environmental condition The general characteristics of the observed rivers are shown in Table 7.1. Since the rivers are located in the urban area of MC, the predominant land use in their surrounding area is residential (R), residential in dense urban area (RDU), and residential mixed with agricultural (MRA). Most sewerage and drainage are directly connected to the rivers; such conditions result in rivers full of garbage, coloring, mud, having offensive smells, and bad in visual appearance. During the wet season, the rivers are relatively full of water. In contrast, there is a lack of water during the dry season. The width of the rivers measured at each of the sampling stations is in the range of approximately 2.5–30.0, 1.0–2.5, and 30.0–50.0 m, for SB, SM, and ST, respectively. The salinity values during dry and wet seasons were low at the upstream ends (in the range of 0.1–10.0 ppt) and high at the downstream ends, close to the river mouth (up to 20.0 ppt) where mixing with marine water occurred. Conductivity showed a similar pattern. The water temperature was in the range of 28.1–34.2°C during the dry and 27.3–28.8°C during the wet season (Table 7.1). 7.3.2 Organic matter load The content of organic matter, expressed as BOD5, during the dry and wet seasons in the three selected rivers is shown on Figs. 7.2 (a–c); high values indicated the high concentration of organic matter. The highest concentrations were at sampling stations B1 (21.79 mg/l), M2 (28.20 mg/l), and T3 (15.58 mg/l) during the dry season; and at B2 (8.30 mg/l), M2 (18.36 mg/l), and T4 (5.49 mg/l) during the wet season. These values were most likely attributable to the presence of high amounts of organic matter in domestic wastewater discharged from residences at those sampling stations. During the dry season, the concentrations showed a pattern with slightly higher values at the upstream than the downstream ends. This may be explained by the fact that most of the organic matter was degraded during its passage from the upstream area because the river’s water was flowing slowly due to a lack of water. Conversely, during the wet season, concentrations at the river mouths (downstream) of M4 and T5 were higher than those at the upstream end. This indicates that during the wet season a high amount of organic matter is flushed and dispersed faster than it can be degraded. Most of the material was trapped and degraded in this area and caused the increasing of the BOD5. No statistics could be calculated on data within rivers as samples were only collected in duplicate.

70
0
10
20
30
B1 (upstream ) B2 B3 B4 (downstream )
Sampling stations
BO
D5
(mg/
l)
DryW et
0
10
20
30
M1 (upstream) M2 M3 M4 (downstream)
Sampling stations
BO
D5
(mg/
l)
DryW et
0
5
10
15
20
T1 (upstream) T2 T3 T4 T5 (downstream)
Sampling stations
BO
D5
(mg/
l)
DryW et
Figure 7.2 BOD5 values for 3 rivers in Manado City, SB (a), SM (b), and ST (c) during dry and wet seasons. Stations are shown on Fig. 7.1
The average values of the BOD5 among the rivers showed that SM (19.34 mg/l) > SB (14.78 mg/l) > ST (12.48 mg/l) in the dry season; however, this was not statistically
a
b
c

71
significant (p>0.05). Differences observed during the wet season were statistically significant (p<0.01) and SM (14.11 mg/l) > SB (5.10 mg/l) > ST (4.18 mg/l). Concentrations were higher during the dry season than in the wet season in all rivers. This was probably due to dilution. The values obtained in the present study were higher than those reported by PPLH-SDA Unsrat (1999) where BOD5 in the rivers SB and ST was 7.00 and 16.46 mg/l. However, the actual sampling locations were not reported. The average organic matter flushed into the bay in the dry season (15.30 mg/l of BOD5) was significantly higher than in the wet season (7.52 mg/l of BOD5 ) (p<0.01). These levels may significantly influence the BOD5 concentration of Manado Bay. Ortiz-Hernandez and Saenz-Morales (1999) reported BOD values ranging from 22.61–38.96 mg/l (mean 32.26 mg/l) from Chetumal Bay, Quintana Roo, Mexico, whereas Cheevaporn and Menasveta (2003) reported values between 1.3 and 3.2 mg/l at river mouths in the upper Gulf of Thailand. The standard of acceptable BOD5 for coastal waters is less than 10 mg/l (Clark, 1996, p. 211). In general, BOD5 values for domestic wastewater range between 100 and 500 mg/l (Ortiz-Hernandez and Saenz-Morales, 1999). This indicates that, especially in the dry season, organic load of rivers in Manado City should be reduced. 7.3.3 Inorganic nutrient load Levels of inorganic matter measured as NO3
- concentration are shown in Figs. 7.3(a–c). The highest concentration during the dry season was at sampling stations B1 (2.14 mg/l), M2 (3.46 mg/l), and T2 (3.31 mg/l). During the wet season, the highest concentration was at B3 (2.02 mg/l), M3 (2.30 mg/l), and T2 (2.33 mg/l). The concentration during the dry season was generally high at the upstream and low at the downstream end close to the river mouth for all rivers. This pattern was not evident during the wet season. As the river water flow is slow during the dry season, most of the NO3
- input must have come from the upstream areas beyond the initial sampling station. Moreover, the concentration may have decreased towards the downstream end as the NO3
- was used as a nutrient source for aquatic plants. However, an input apparently occurred at stations M2 and T2 as indicated by increased concentrations. The average NO3
- concentration varied among the rivers at SM (2.37 mg/l) > ST (2.13 mg/l) > SB (1.49 mg/l) during dry season, and ST (1.83 mg/l) > SM (1.46 mg/l) > SB (0.93 mg/l) during wet season; however, this was not statistically significant. In addition, the average level of inorganic matter as NO3
- loaded into the bay during the dry season was not significantly higher (2.01 mg/l) than during the wet season (1.44 mg/l). Concentrations of PO4
-3 (Figs. 7.4a–c) showed a pattern of increase towards the downstream end during the wet season in all rivers. This indicated that there was a significant input from the urban area into the rivers. The highest concentrations in the dry season were found at B2 (2.06 mg/l), M2 (2.98 mg/l), and T2 (1.56 mg/l), and during wet season at B2 (1.81 mg/l), M4 (2.88 mg/l), and T5 (3.52 mg/l), respectively. The average concentration in the river SM was highest during the dry season, and in ST during the wet season; this was statistically significant ( p<0.05). The PO4
-3 loaded into the bay was significantly (p0.05) higher during the wet season (2.20 mg/l) than the dry season (1.71 mg/l).

72
0
1
2
3
B1 (upstream) B2 B3 B4 (downstream)
Sampling stations
NO
3 (m
g/l)
DryW et
0
1
2
3
4
M1 (upstream) M2 M3 M4 (downstream)
Sampling stations
NO
3 (m
g/l)
DryW et
1
2
3
4
T1 (upstream) T2 T3 T4 T5 (downstream)
Sampling stations
NO
3 (m
g/l)
DryW et
Figure 7.3 NO3
- values for 3 rivers in Manado City, SB (a), SM (b), and ST (c) during dry and wet seasons. Stations are shown on Fig. 7.1
Levels of NO3
- and PO4-3 in the 3 rivers were one to two orders of magnitude higher than
those recorded from river mouths discharging into the upper Gulf of Thailand (0.006-0.64 mg/l for NO3
- and 0.09-0.36mg/l for PO4-3) (Cheevaporn and Menasveta, 2003). High
a
b
c

73
nutrient levels (eutrophication) are likely to cause massive algal blooms, possibly with toxic (harmful) algal species, and subsequently oxygen depletions (Cheevaporn and Menasveta, 2003; Mallin et al., 2007). 7.3.4 Bacterial load Bacteria were measured in all the selected rivers. This was indicated by high concentrations of TC and EC, which mostly exceeded the maximum measurable concentration of 2400 MPN (Table 7.2). Concentrations of EC vary within the rivers in the range of 11 to 2400 MPN during the dry season and 15 to 2400 MPN during the wet season. Since the value of 2400 MPN is not an absolute value, no statistical test was applied to test the differences among the rivers and seasons. Previous measurements showed that both E. coli and Vibrio sp. were detected in the river ST (PPLH-SDA Unsrat, 2000, unpublished). The presence of E. coli in recreational and potable waters is a major concern to the general public as elevated levels of E. coli suggest the presence of pathogenic bacteria and viruses (Somarelli et al., 2007). As coliform bacteria are associated exclusively with mammal intestinal tracts (Rees, 1993; Somarelli et al., 2007), the high levels of bacteria must be attributable to the presence of untreated wastewater discharge from toilets or domestic animals, for instance pig husbandry that has been observed in those areas. 7.3.5 Mercury (Hg) load Mercury total (Hg-tot) was the only metal concentration measured in the river ST. The concentration in water and surface sediment slightly varied according to the sampling stations (space) and the season. The level in water during the dry season was low at the upstream and slightly higher at the downstream end close to the river mouth; in contrast, during the wet season it was high at the upstream and much lower at the downstream end (Fig. 7.5a). The high concentration at the upstream sampling stations (T1–T3) during the wet season was perhaps due to the high volume of water bringing suspended, particle-bound mercury from the hinterland area of MR where elemental mercury is used in artisanal gold mining practices (pers. obs.). The concentration decreased when the water mixed with water from a tributary and estuary close to the river mouth at sampling stations T4–T5. The concentration during the dry season was 0.002–0.044 mg/l, with the highest value at station T4 (0.044 mg/l), and 0.013–0.125 mg/l during the wet season, with the highest value at station T1 (0.125 mg/l) (Fig. 7.5a). The average concentration in the wet season (0.081 mg/l) was slightly higher than in the dry season (0.024 mg/l), though this was not statistically significant (p>0.05). The same pattern of slightly higher concentrations at the downstream end was also shown for Hg-tot in surface sediment during both seasons, dry and wet (Fig. 7.5b). The suspended, particle-bound mercury brought out from the hinterland area tends to settle in the areas close to the river mouth (T4 and T5). This was probably the reason why the concentration in the surface sediment at these stations was slightly higher than the others. The concentration during the dry season was 0.047–0.179 mg/kg with the highest at station T5 (0.179 mg/kg), and 0.073–0.185 mg/kg during the wet season with the highest at station T4 (0.185 mg/kg). The average concentration in the dry season (0.133 mg/kg) was slightly higher than in the wet season (0.130 mg/kg) though this was not statistically significant (p>0.05).

74
1
2
B1 (upstream) B2 B3 B4 (downstream)
Sampling stations
PO4
(mg/
l)
Dry
Wet
1
2
3
M1 (upstream) M2 M3 M4 (downstream)Sampling stations
PO4
(mg/
l)
DryW et
1
2
3
4
T1 (upstream) T2 T3 T4 T5 (downstream)Sampling stations
PO4
(mg/
l)
DryWet
Figure 7.4 PO4
3- values for 3 rivers in Manado City, SB (a), SM (b), and ST (c) during dry and wet seasons. Stations are shown on Fig. 7.1
a
b
c

75
Table 7.2 Concentration of Total Coliform (TC), and Escherichia coli (EC) during Dry (September-October 2002) and Wet (January-March 2003) Seasons
Location Sampling TC (MPN)a EC (MPN)a
Station ID # Dry Wet Dry WetBailang B1 1100 >2400 15 >2400River B2 >2400 >2400 23 17 B3 >2400 >2400 >2400 >2400 B4 >2400 >2400 11 >2400
Maasing M1 >2400 >2400 1100 >2400River M2 >2400 >2400 1100 >2400 M3 >2400 >2400 210 >2400 M4 >2400 >2400 23 15
Tondano T1 >2400 >2400 >2400 7.4River T2 >2400 1100 23 240
T3 >2400 >2400 >2400 558 T4 >2400 >2400 >2400 93 T5 >2400 >2400 210 17
a the highest value from the two values MPN (most probable number per 100 ml of sample) Comparing the Hg-tot concentration in the water and in the surface sediment in the two seasons showed that the concentration in the surface sediment was significantly higher (p<0.01) during the dry season, and also (p<0.05) during the wet season than in the water (Figs. 7.6a & b, respectively). Seasonal variations for metals (Al, Cr, and Fe) in water and surface sediment have been reported from Richards Bay Harbor, South Africa (Vermeulen and Wepener, 1999). Cheevaporn and Menasveta (2003) reported mercury concentrations of 0.01-847 µg/l in seawater and 0.003-2.8 µg/g in sediment of the upper Gulf of Thailand. The concentration of Hg-tot accumulated in the bivalve, Soletellina sp., ranged between 0.012 and 0.124 mg/kg. The concentration was higher to the right (North) than to the left (South) of the river mouth (Fig. 7.7). Unfortunately, no statistical test could be applied due to the single measurement obtained from each station. The observed distribution can be explained as water current in the MB runs continuously from South to North. Lasut (2002) reported that Hg-tot which accumulated in gastropods, Littoraria sp. and Nerita sp., from the same area was 0.045 and 0.344 mg/kg, respectively. Marine biota accumulates metals from the sediment. Chen and Chen (1999) reported that grey mullet (Liza macrolepis) accumulated the metals Cd and Cu in their body from contaminated harbor sediment and the liver had levels at least 2–5 times higher than those found in the sediment. In the present study, the concentrations of Hg-tot in the surface sediment and in the bivalves found at the river mouth of ST were of the same magnitude. 7.3.6 Pollution status and challenge to management Based on the observed levels of the above parameters, the status of the rivers must be considered to be in a condition of pollution by organic matter, inorganic nutrients, bacteria, and mercury. The level of BOD5 in all rivers exceeded the WQC-GRRI for water that may be used for recreational activities, fisheries, livestock, and irrigation, while those for NO3
-

76
and Hg-tot exceeded the ASEAN-MWQC for protection of aquatic life and the WQC-GRRI for water that may be used for recreational activities, fisheries, livestock, and irrigation, respectively. The level of PO4
-3 exceeded the WQC-GRRI and the ASEAN-MWQC for the protection of aquatic life in estuaries and coastal areas (Table 7.3). All observed rivers were in the status of pollution with regard to bacterial levels, since the level of TC and EC greatly exceeded those of the International Standard for recreational contact waters, typically 200 MPN coliform (Clark, 1992).
0.00
0.02
0.04
0.06
0.08
0.10
0.12
0.14
T1 T2 T3 T4 T5Sampling stations
Hg-
Tota
l (m
g/l)
Dry
Wet
0.00
0.02
0.04
0.06
0.08
0.10
0.12
0.14
0.16
0.18
0.20
T1 T2 T3 T4 T5
Sampling stations
Hg-
Tota
l (m
g/l)
Dry
Wet
Figure 7.5 Concentration of Hg-tot in water (a) and sediment (b) of ST during dry and wet
seasons. Stations are shown on Fig. 7.1
a
b
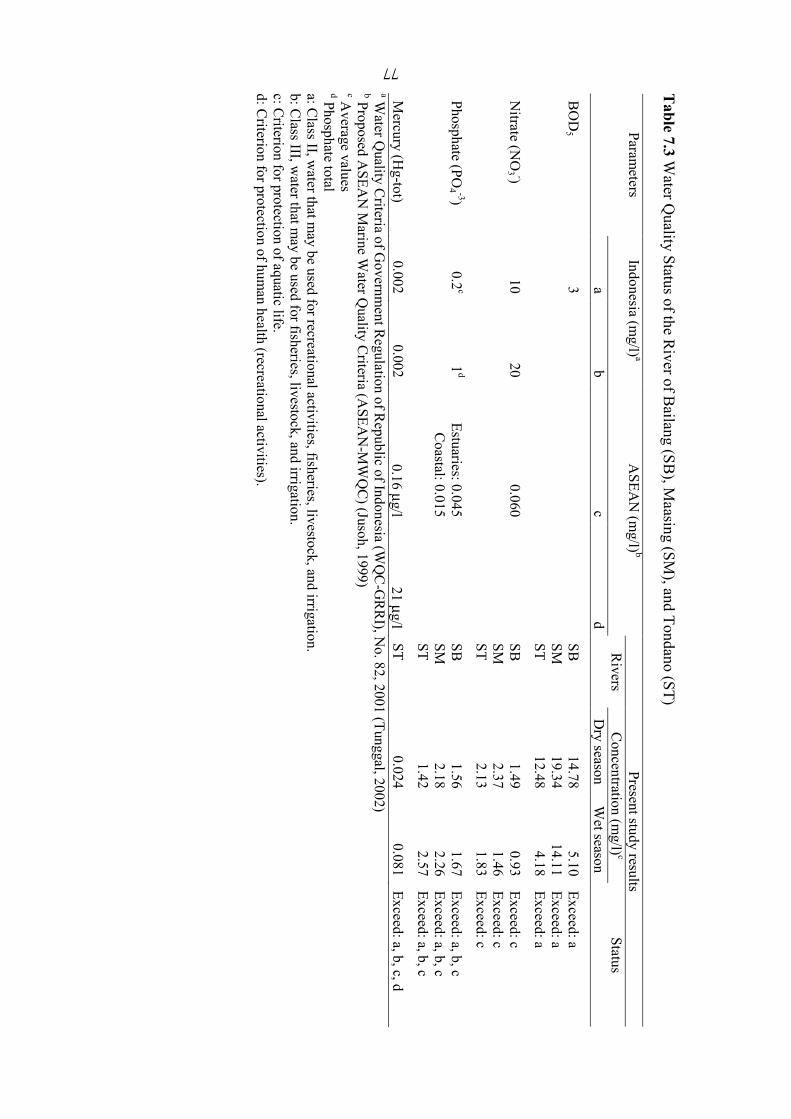
77
Table 7.3 W
ater Quality Status of the R
iver of Bailang (SB
), Maasing (SM
), and Tondano (ST)
Present study results Param
eters Indonesia (m
g/l) a A
SEAN
(mg/l) b
Rivers
Concentration (m
g/l) c Status
a
bc
d
Dry season
Wet season
BO
D5
3
SB
14.78
5.10 Exceed: a
SM
19.34
14.11 Exceed: a
ST
12.48 4.18
Exceed: a
Nitrate (N
O3 -)
10 20
0.060
SB
1.49 0.93
Exceed: c
SM
2.37 1.46
Exceed: c
ST 2.13
1.83 Exceed: c
Phosphate (PO4 -3)
0.2c
1d
Estuaries: 0.045
SB
1.56 1.67
Exceed: a, b, c
C
oastal: 0.015
SM
2.18 2.26
Exceed: a, b, c
ST 1.42
2.57 Exceed: a, b, c
Mercury (H
g-tot) 0.002
0.002 0.16 µg/l
21 µg/l ST
0.024 0.081
Exceed: a, b, c, d a W
ater Quality C
riteria of Governm
ent Regulation of R
epublic of Indonesia (WQ
C-G
RR
I), No. 82, 2001 (Tunggal, 2002)
b Proposed ASEA
N M
arine Water Q
uality Criteria (A
SEAN
-MW
QC
) (Jusoh, 1999) c A
verage values d Phosphate total a: C
lass II, water that m
ay be used for recreational activities, fisheries, livestock, and irrigation. b: C
lass III, water that m
ay be used for fisheries, livestock, and irrigation. c: C
riterion for protection of aquatic life. d: C
riterion for protection of human health (recreational activities).
77

78
0.00
0.02
0.04
0.06
0.08
0.10
0.12
0.14
0.16
0.18
0.20
T1 T2 T3 T4 T5
Sampling stations
Hg-
Tota
l (m
g/l)
Water
Sediment
0.00
0.02
0.04
0.06
0.08
0.10
0.12
0.14
0.16
0.18
0.20
T1 T2 T3 T4 T5
Sampling stations
Hg-
Tota
l (m
g/l)
Water
Sediment
Figure 7.6 Concentration of Hg-tot in water and sediment of ST during dry (a) and wet (b)
seasons. Stations are shown on Fig. 7.1
NOAA (1995) suggested that wastewater is not a pollutant per se. It can be categorized as a pollutant if it has a negative impact on the environment. From our results, obviously, the water quality of the observed rivers was highly problematic. Water quality is significantly impacted by the input of wastewater discharged from residential areas. Therefore, it is extremely important to overcome and mitigate further impact through management. In this regard, a management plan integrating all sectors, and community stakeholders, is an appropriate way, as it will involve all parties who have roles in this problem. As the condition of water in MC is influenced by runoff from hinterland agricultural areas of MR, the management should be trans-boundary, involving the MR authority where the upstream rivers are located. In addition, the other aspects of water temperature and daily maximum water temperature, in particular with aquatic diversity values, should be included in the management (Rivers-Moore and Jewitt, 2007).
a
b

79
0 . 0 0
0 . 0 2
0 . 0 4
0 . 0 6
0 . 0 8
0 . 1 0
0 . 1 2
0 . 1 4
L e f t - 1 0 0 5 0 M id d le 5 0 R ig h t - 1 0 0
P o s i s i t i o n o f s a m p l i n g s i t e a t r i v e r m o u t h ( m e t e r )
Hg-
tota
l (m
g/kg
)
Figure 7.7 Concentration of Hg-tot accumulated in the marine bivalve Soletellina sp. at the
mouth of the river ST

80
Chapter 8 Constraints and Potential Aspects and Their Implications
In the previous chapters, a comprehensive presentation of the current state of several aspects of Manado City in relation to wastewater management through research findings is presented. In this chapter, the constraints and potentials of the findings which are correlated with other aspects, as well as their implications, are discussed. 8.1 Introduction Concerning wastewater management, the city of Manado poses some aspects that can be considered as constraints on one hand, and potentials on the other hand. In general, the aspects are from wastewater discharge-related aspects (WRA), governmental/ administrative-related aspects (GRA), and community-related aspects (CRA). All these general aspects could interconnect to one another and produce several implications which cause more challenges in management. 8.2 Wastewater Discharge-Related Aspect (WRA) 8.2.1 Natural characteristics The natural settings of the city of Manado with various geomorphologic features of land and water drainage of the rivers flowing through the city to Manado Bay pose challenges to be managed in regard to wastewater. Therefore, it was considered as a constraint aspect in regard to wastewater management. Such a condition has made unplanned development and the uncertainty of spatial planning due to such natural condition problems of land use changes in the city, as the development of land reclamation for commercial activities (hotels, restaurants, malls, and other trade buildings) constructed in the coastal area (Kumurur, 2002a). The area was originally set for marine eco-tourism activity purposes as such activities are one of the primary incomes for the city. In addition, this development is likely to cause problems if such activities do not have proper wastewater treatment systems and the discharge of their sewage goes directly into the coastal marine water.
8.2.2 Socio-economic aspects Socio-economic aspects (population, education, employment, and personal and household incomes) are significant aspects for management. The population of the city will continue to grow along with the need for more space for settlement with proper public infrastructures and facilities, including wastewater handling to maintain a healthy environment in the area. The limited amount of suitable land (only 76% is suitable for settlement development due to land slope features) causes the housing and commercial areas to be distributed haphazardly and concentrated in certain areas of the city, mostly along the coast. This condition forces the city to face many environmental problems, such as the haphazard establishment of slum areas, defined by very high densities of population (>250 individuals/0.01 km2). The problems of such areas are run-down housing and generally wretched living conditions with poor conditions of public and sanitation facilities (sewer, wastewater treatment). In 1999, such areas were identified in 3 districts of five in

81
the city (Table 8.1). Therefore, the rapid increase of population was considered as a constraint aspect. Table 8.1 The Slum Areasa in 3 Districts of Manado City in 1999b
Districts Sub-districts Population density
(individuals/0.01 km2) Sario Ranotana Weru 321 Pakowa 264 Tanjung Batu 327 Titiwungen 597 Wenang Komo Luar 626 Mahakeret Barat 274 Lawangirung 254 Molas Karame 419 Ternate Baru 573 Sindulang I 360 Sindulang II 416 Kampung Islam 280 Alung Banua 637 Manado Tua I 356
a >250 individuals/0.01 km2 b Source: Kumurur (2002b) In the city, the low and middle levels of education, i.e. primary or middle school, could be a constraint (Section 4.3.1). Although educated people with higher levels of schooling will ensure that management measures are understood and adapted easily. Moreover, half (54.20%) of those of employment in 2003 (344,251 persons) were unemployed. In addition, the general economic situation and monetary income of the city, though increased, were not enough to support the daily life of 22,515 households (27.49%) which were categorized as poor in 2000 (Mokat, 2003) which is also considered a constraint. In contrast, many religions and ethnicities of people are found in the city. As all of the religions and the ethnicities in general are adherents of maintaining and saving the environment and natural resources for future needs, they can support the effort of environmental management. It can be a positive potential aspect to wastewater management in the city. 8.2.3 Wastewater treatment facilities and infrastructures and water quality status The increase of the economic activities in general followed by the development of tourism infrastructure and facilities (hotels, restaurants, malls, and others) will create a variety of wastewater sources, and may threaten the coastal marine environment and the urban area of the city, since these activities produce a significant amount of wastewater, especially as most of the infrastructures are built close to the coast with improper wastewater treatment facilities. These are considered as point sources of wastewater. The condition and capacity of an on-site wastewater treatment system may play a significant role in avoiding environmental degradation as well as protecting the health and hygiene of humans in the coastal area; conversely, poor conditions may cause an outbreak of wastewater-transmitted diseases, and inadequate capacity may cause the leaking and

82
spilling out of wastewater into the area and may further degrade the environment of the area. The growing population with low household incomes is a big problem for the city. The population pressure encourages the increasing of amounts of wastewater and, due to the low household incomes, most of the housing developments are constructed with poor standards of wastewater disposal and treatment systems, or even without such facilities. Most of the discharged wastewater from household activities has the potential to pollute not only the urban but also the coastal environment because the wastewater always contains high concentrations of human and animal sewage containing micro-organisms, which are pathogenic in humans. Many diseases are water-borne and may be caused by bacteria (e.g. gastroenteritis, typhoid and cholera), viruses (e.g. poliomyelitis and hepatitis) or amoebas (e.g. amoebic dysentery) found in water contaminated by human and animal feces (Haughton and Hunter, 1995; Somarelli et al., 2007). Since the rivers are used for activities such as washing, bathing, fishing, and fish cage culture, the discharge of untreated wastewater poses a threat to community health. The number of cases of wastewater-transmitted diseases observed at the city’s hospitals and the Community Medical Centers in several districts of the city is presented in Table 8.2. Most residences receive a supply of piped, treated freshwater from upland sources, which is considered safe for drinking after boiling. Some residences have their own wells, which in many cases are located too close to septic tanks, open sewers or ditches. With increased economic growth and increased tourism activities, the public demand for improved sanitation levels in the urban areas has also increased (Sukarma and Pollard, 2000). The city of Manado needs to implement a regular water quality monitoring program for the major rivers, especially for indicators of pollution with fecal and pathogenic microorganisms and toxic wastes. Table 8.2 Cases of Diseases in Manado City in 2002a
Districts (sub-districts) Diarrhoea Dermatitis Gastritis Typhoid Molas (Tuminting) Wenang (Tikala Baru) Sario (Ranotana) Malalayang (Bahu)
513 (58b / 48c) 1250
27 288
1618
253 777
196b / 272c 10b,c
City Hospital 1075 2725 a the data were collected at Puskesmas (community’s medical centre) in each district b October-December 2002 c January-April 2003 8.3 Governmental/Administrative-Related Aspect (GRA) 8.3.1 Institutional arrangement The arrangement of government institutions is considered to have aspects acting as constraints. At the city level, it is inadequate if the EMB (Environmental Management Board) is the only institution taking responsibility to address wastewater management in the city whereas the CMB (Cleaning Management Board) focuses only on solid waste management, even if these institutions improve their functions (Section 4.4). Moreover,

83
apparently the EMB has not yet established any regulations. Tsagarakis (2001) suggested that institutional, administrative and managerial factors should be seriously taken into account when planning water and sanitation policies. This could be done, for instance, by involving all waste and wastewater-related institutions and establishing guidelines and regulations. 8.3.2 Planning and management aspects The sewage, except from toilets, is discharged directly into the coastal waters through sewers and shows high concentrations of wastewater indicators and furthermore contains polluting substances (Table 7.3). Effects result from all sources (point and non-point) combined. Hence they are difficult to control. No monitoring system is in place, which may in part be due to the lack of guidelines. The developers or businesses are advised to carry out self-monitoring and controlling procedures based on the impacts identified in their environmental impact analysis. These aspects may easily act as constraints for the management. However, as it is monitoring and control at the source for point sources, it ought to be the simplest way for controlling pollution loads. The non-point sources of wastewater from the hinterland of the regency of Minahasa are predicted to cause significant problems, but they are difficult to measure, control, and monitor. As mentioned previously, no particular guidelines or regulations have been established or authorized by the city, except in a partial sense as a tactical action for a short-term period (Section 4.5). This can be a constraint for management. Fortunately, some policy measures related to environmental management have been established at the provincial level of the North Sulawesi Province (for instance the LGR No. 38 of 2003, concerning Community Based Integrated Coastal and Ocean Management of North Sulawesi Province) as mentioned in Agenda 21 of Indonesia and the North Sulawesi Province. This should be seen as a potential. However, they can also be a constraint, as the city has not yet applied these measures, let alone enforced them. 8.4 Community-Related Aspect (CRA) 8.4.1 Community awareness and participation The community’s environmental knowledge and attitude were fortunate aspects that have potentials for wastewater management in the city (Chapter 5). The community can be asked for their participation, including financial support as most of them are not opposed to this, but it is clear that the government should help them by improving the public infrastructures and facilities for wastewater discharge. However, there have been no observed cases where the community has participated in the management. This is probably because they have not been given this option from the government, and there are no signs that the government intends to help the community by improving such facilities. 8.5 Financial aspect Finances are one of the most important aspects in an environmental planning and management program, whereas lack of financial support means the planning cannot be implemented and fosters instability in running the management. Local budgetary income is
84
the only source of finances for the development of the city. Since such budgetary is allocated for all developmental aspects of the city, lack of finances may be one of the constraints to conducting wastewater management in the city. However, one potential source is that finances may come from the community (community-collected funds) as they prioritized the solution on environmental problems, and wastewater problems in particular, by agreeing to contribute to the funding of these efforts and at the same time the government should improve wastewater and sewerage systems in the city (Table 5.4 and 5.5).

85
Chapter 9 Suitable Option of Wastewater Management
From the previous chapters, the current situation and condition of the city of Manado in regards to wastewater management have been described, identified, and analyzed pointing out their constraints and potentials. Based on such discussions, this chapter presents suitable options for wastewater management for the city of Manado and strategic actions as recommendations to improve an integrated wastewater management of the city. 9.1 Objectives and Considerations Integrated wastewater management in the city of Manado is a priority that must be applied to address environmental degradation due to wastewater discharge in the urban and coastal areas. Integration means that the management should be conducted by all of the city’s parties, such a government, community, and private sectors. In the government/ administrative aspect, the integration also means that the management should be conducted with various related institutions at a same level and/or different levels. Based on the present situation and condition of the city of Manado, the following are general objectives of integrated wastewater management which are suitable for the city of Manado: 1. Protecting environmental health from pollution and the unhygienic conditions of
wastewater; 2. Protecting the water quality of canals, rivers, and coastal areas to support marine life,
fishery and coastal resources; 3. Protecting freshwater resources from wastewater contamination. The formulation of the objectives considered: (1) the characteristics of the area of Manado where the major part of the city is located along a coastal area forming a waterfront, and (2) the dynamics of the city as an urban area. Thus, the wastewater problems should be addressed through integrated coastal management (ICM) measures in combination with urban management (UM). As the environmental condition of the city is closely related to coastal and marine conditions of Manado Bay that has a high production of resources, the coastal environment should be assessed and the planning of the wastewater management should be included in the ICM process. The procedure of such assessment has been suggested by Gourbesville & Thomassin (2000) for Mayotte Island, a highly sensitive coastal area located in the Indian Ocean, and their study can be used as an experience where sustainable wastewater management is being applied. Regarding a wastewater treatment system, the decentralized system provides simple, low-cost and low maintenance methods of treating domestic (household) wastewater (Burkhard et al., 2000). Such a system constitutes a suitable and possible solution to be applied in the city of Manado because a lack of finances is one of the main problems. Several models of a decentralized system have been suggested for small communities, for example in the Middle East and North Africa (Bakir, 2001). These models range from the smallest, single household system to larger systems for a small community. The smallest system is suitable for residential areas, especially those sparsely populated and distributed haphazardly in the city. However, they should only be constructed in sites where soil and groundwater
86
conditions are suitable (Bakir, 2001) as they may otherwise be contaminated. This system is highly suitable since most households have low incomes, barely enough to support their daily lives. A small-scale conventional or modern wastewater treatment plant with low-tech technology that can serve for a cluster of buildings (Engin and Demir, 2006) is suitable for commercial centers (hotels, restaurants, and small industries), institutional buildings (hospitals, laboratories) and garbage dumps in the city. Clustered houses in the city, mostly concentrated along the coastline of Manado Bay, are also suitable for such a system. The system may comprise several small subsystems for collection, treatment and re-use like those applied in the Mediterranean countries where wastewater is managed by way of the re-use or disposal systems (Massoud et al., 2003). The size of each subsystem should be determined administratively based on drainage boundaries and prevailing social and economic conditions (Bakir, 2001). It is important for the success of this type of system that there are clear regulations identifying who will be responsible for the operation and management of such a wastewater treatment plant. Korf, Wilken and Nel presented several models used worldwide that may be suitable for adoption by the city: (1) agency, i.e., the operation and management of wastewater care is implemented by a selected local authority(ies) on an agency or a local basis; (2) privatization, i.e., the plant is fully owned and managed by the private sector; (3) local government, i.e., the facilities are managed by the local authorities and owned by the public; (4) PS & PSP, i.e., the facilities are owned by the public sector (PS), but managed by a private enterprise (PSP) (Tsagarakis et al., 2001; Shatkin, 2007). 9.2 Strategic Actions of Wastewater Management: a Recommendation Mitigation and protection measures to address wastewater discharge should be taken in order to improve the wastewater management in the city of Manado. As the city has its own characteristics which differ from other cities, suitable wastewater management systems are needed besides taking particular strategic actions. The following recommendations can be proposed towards integrated wastewater management in the city. Below, five strategic actions, to be included in the plans for improving the wastewater management, have been suggested for decentralized systems that are suitable for the city of Manado. Some of them are based on the lessons learned from the small communities in the Middle East and North Africa (Bakir 2001): (1) physical and technical measures: providing and improving on-site wastewater treatment systems and sanitation; (2) government’s institutional arrangement: improving the government’s institutional arrangement; (3) regulation, policy and program: establishing regulations and enforcement; (4) community participation: Improving community participation; (5) financial: establishing financial support from the communities. Each of these strategic actions may form constraints to management measures, but they may be used as an entry-point for improving such management. Hence we present below each of the four actions with appropriate modifications for implementation.
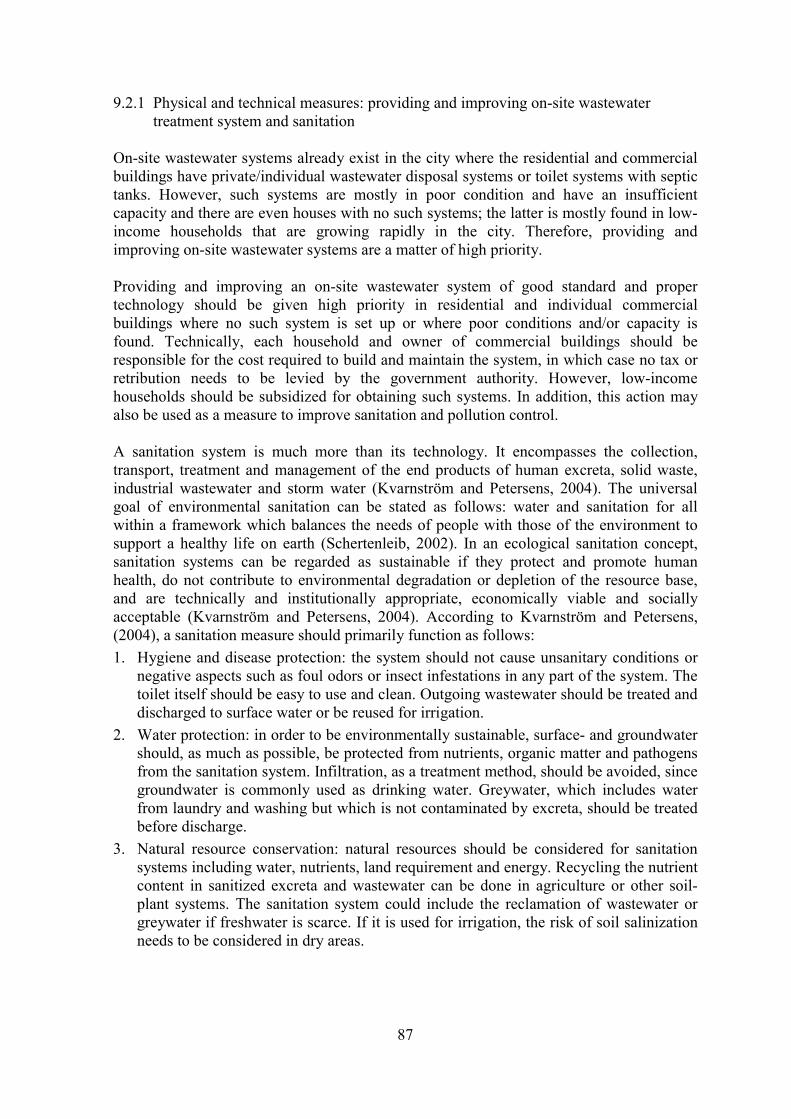
87
9.2.1 Physical and technical measures: providing and improving on-site wastewater treatment system and sanitation
On-site wastewater systems already exist in the city where the residential and commercial buildings have private/individual wastewater disposal systems or toilet systems with septic tanks. However, such systems are mostly in poor condition and have an insufficient capacity and there are even houses with no such systems; the latter is mostly found in low-income households that are growing rapidly in the city. Therefore, providing and improving on-site wastewater systems are a matter of high priority. Providing and improving an on-site wastewater system of good standard and proper technology should be given high priority in residential and individual commercial buildings where no such system is set up or where poor conditions and/or capacity is found. Technically, each household and owner of commercial buildings should be responsible for the cost required to build and maintain the system, in which case no tax or retribution needs to be levied by the government authority. However, low-income households should be subsidized for obtaining such systems. In addition, this action may also be used as a measure to improve sanitation and pollution control. A sanitation system is much more than its technology. It encompasses the collection, transport, treatment and management of the end products of human excreta, solid waste, industrial wastewater and storm water (Kvarnström and Petersens, 2004). The universal goal of environmental sanitation can be stated as follows: water and sanitation for all within a framework which balances the needs of people with those of the environment to support a healthy life on earth (Schertenleib, 2002). In an ecological sanitation concept, sanitation systems can be regarded as sustainable if they protect and promote human health, do not contribute to environmental degradation or depletion of the resource base, and are technically and institutionally appropriate, economically viable and socially acceptable (Kvarnström and Petersens, 2004). According to Kvarnström and Petersens, (2004), a sanitation measure should primarily function as follows: 1. Hygiene and disease protection: the system should not cause unsanitary conditions or
negative aspects such as foul odors or insect infestations in any part of the system. The toilet itself should be easy to use and clean. Outgoing wastewater should be treated and discharged to surface water or be reused for irrigation.
2. Water protection: in order to be environmentally sustainable, surface- and groundwater should, as much as possible, be protected from nutrients, organic matter and pathogens from the sanitation system. Infiltration, as a treatment method, should be avoided, since groundwater is commonly used as drinking water. Greywater, which includes water from laundry and washing but which is not contaminated by excreta, should be treated before discharge.
3. Natural resource conservation: natural resources should be considered for sanitation systems including water, nutrients, land requirement and energy. Recycling the nutrient content in sanitized excreta and wastewater can be done in agriculture or other soil-plant systems. The sanitation system could include the reclamation of wastewater or greywater if freshwater is scarce. If it is used for irrigation, the risk of soil salinization needs to be considered in dry areas.

88
9.2.2 Government’s institutional arrangement: improving government’s institutional arrangement
The existing arrangement of government institutions to support city wastewater management does not function effectively as the EMB is the only party under the Mayor’s Office responsible for wastewater management. Even though the PAEICB may get involved in the management, this party can only act as a coordinator to support the cities and regencies in the province. This then, is considered as a constraint to the management in the present analysis. Therefore, a re-arrangement of the government’s institution is recommended. Due to its complexity, wastewater management should be addressed by all the involved institutions and other associated institutions in coordination with others in the city. For instance, since wastewater management covers both the urban and coastal marine environments, technical agencies of the City Arrangement Agency (CAA) that has responsibility for the city development, and of the Marine and Fisheries Agency (MFA) should be involved as associated institutions. Others, such as technical agencies of the Public Works Agency (PWA) and the Environmental Health Agency (EHA), should be included in the management. The significance of coordinating the management with PWA is that these agencies comprise the technical expertise to improve most of the public facilities, including wastewater disposal and treatment, and the EHA is the institution best equipped to control and monitor the pollution impacts. The PAEICB and NAEIM, operating at provincial and national levels respectively, are considered to be in an appropriate position to coordinate institutions at the city level based on the provisions of Act No. 22, 1999. 9.2.3 Regulation, policy and program: establishing regulations and enforcement The application of suitable technical options of wastewater management in the city should be done in combination with administrative options through the establishment of regulations and law enforcement. The administrative aspects of wastewater management may include establishing requirements and regulations for buildings (residential and commercial) to have proper designs for on-site wastewater systems of adequate standards and established guidelines of a standard system for commercial buildings (hotels, hospitals, shopping centers, and restaurants). High priority should be given to establishing a program for on-site systems improvement with subsidies to low-income households since these often have no facilities at all. Enforcement should be applied with sanctions to parties who disobey the regulations. With regards to sanctions, any party who produces wastewater (hotels, restaurants, small industries, hospitals, and others) must, in accordance with IGR No. 82, 2001 of water quality management and water pollution control, be held responsible so that the discharge will not produce any impact on the receiving water, and if impacts occur, sanctions (administrative, fines, re-establishment or improvement, or punishment) will be imposed according to Act of the Republic of Indonesia No. 23, 1997, of Environmental Management.

89
9.2.4 Community participation: Improving community’s participation Based on the above analysis, community participation in the city is considered to be a potential in regard to supporting wastewater management because environmental awareness is generally good. However, the awareness specifically related to wastewater management is still insufficient. Therefore, it is important that the city government takes actions to increase and improve participation and awareness. Such actions could include distribution of information, establishing wastewater-related programs, capacity building for community institutions (NGOs and CEOs) and community involvement in the controlling and monitoring of wastewater management activities. These activities are important to prevent failures observed elsewhere in the operation of wastewater treatment plants due to theft and vandalism (Tsagarakis et al., 2001). 9.2.5 Financial: establishing financial support from community In addition to the finances for wastewater management coming from the city budget, a potential source may come from other stakeholders/parties, such as the communities and private sectors. The considerations of such stakeholders that should be involved in this aspect are that the stakeholders (for instance: restaurants, small industries, and others) produce and discharge wastewater which may influence and have an impact on the environment. The funding can be collected by applying a retribution or tax to address the wastewater discharge issue. However, all the actions should be done under a legal local government regulation.

90
Chapter 10 Conclusions and Recommendations
10.1 Conclusion The city of Manado is a medium-sized developing city which consists of urban, rural, and mixed urban-rural areas. It is located close to and forms the waterfront of Manado Bay. It consists of various geomorphologic features with several rivers crossing through the city from the hinterland areas of Minahasa Regency to the Manado Bay. This condition is the reason why it lacks land for settlement, which is distributed haphazardly along the coast line of Manado Bay. The economic activity of the city is increasing as indicated by the rapid increase in the number of commercial buildings and tourism activities. But, apparently, the city is facing problems due to the increase of population and the socio-economic aspects due to unemployment and to low-level households with inadequate personal incomes. Therefore, with its natural setting and social-economic conditions, the city is faced with the challenge for integrated wastewater management. Community environmental knowledge and attitude are a significant part of general environmental management. In the city of Manado, this aspect shows a potential for effective environmental management and wastewater management, in particular. However, community participation to prevent and mitigate any wastewater problems is still insufficient. Therefore, it is important that the city government take actions to increase public awareness. Most buildings, residential and commercial, have their own wastewater disposal systems for black water, such as toilet systems with septic tanks, or alternatively, especially for small residences, deep holes, ditches, and rivers. For others there are on-site wastewater systems which serve for a cluster of homes in an area. However, no modern system with proper technology has been adopted for the residential treatment systems in these areas. The systems, more primitive than toilets with septic tanks, are considered as the main source of wastewater in the city, as well as toilet and septic tank systems in poor condition and with inadequate capacity. The condition of residential septic tanks correlated with the level of education, and the capacity of the septic tanks correlated with the knowledge of environmental issues related to wastewater. The water quality of the rivers of Bailang, Maasaing, and Tondano had high levels of BOD5, NO3
-, PO4-3, TC, EC, and Hg-tot concentration. Variations in concentration
occurred among each of the sampling stations and among the rivers, and were affected by the seasons. The poor condition was attributable to the input of wastewater discharged from residential areas in the urban areas of Manado City and from the hinterland agricultural areas of Minahasa Regency. Since some of the concentration levels exceeded the WQC-GRRI and the ASEAN-MWQC limits, they are in a state of pollution that needs to be managed to overcome further impacts on Manado Bay. The present data can be used as a base-line to monitor improvements to prevent further deterioration of the water quality of the rivers running through Manado City. Some of the aspects studied act primarily as constraints and some as potentials to support wastewater management; all of them pose a challenge for designing a wastewater management plan. The constraints are formed by: (1) natural settings, which influence land
91
use changes, (2) the rapid increase of population, (3) the number of low-income households, (4) the poor condition and capacity of wastewater disposal and treatment systems, (5) the institutional arrangement of the government, and (6) the lack or inadequacy of local regulations and policies. Potential strengths and opportunities for improvement include (1) city’s religion and ethnicity, (2) good environmental awareness of the community, (3) government institutions at provincial and national levels, and (4) the established regulations and policy measures of Agenda 21 at provincial and national levels. Five strategic actions were identified for better governance and effective wastewater management including (1) physical and technical measures: providing and improving on-site wastewater treatment systems and sanitation; (2) the government’s institutional arrangement: improving the government’s institutional arrangement; (3) regulations, policies and programs: establishing regulations and enforcements; (4) community participation: improving the community’s participation; (5) financial: establishing financial support from the community. In order to implement these actions, it is important that success lessons learned from community participation and Integrated Coastal Zone Management Models of other successful operation in the cities of developing countries should be considered. It is with this background in mind, the following recommendations are proposed. 10.2 Recommendations Besides the main recommendations presented in Section 9.2 (p. 81), the following recommendations can be proposed regarding wastewater management in the city:
• As the community’s environmental awareness is positive towards wastewater management, an environmental education program should be set up, which should be targeted towards individual households, so that the knowledge of the immediate environment may help in taking steps towards specific improvements, as well as fostering awareness of broader environmental issues. Besides, the community should be involved as the primary subject (together with the government) in the management. Although, they both can play important roles, the community can be a source of finance. The involvement could be done by increasing participation, capabilities and skills, and empowering them in the management.
• Communities and businesses should be informed of the environmental consequences of developmental proposals as a matter of right. Better availability of information is also important to improve decision-making.
• More of the city’s government institutions and agencies are needed to take responsibility in wastewater management. This could be done by enlarging several of the institutions’ functions and duties. For instance, besides the Environmental Management Board, for wastewater management, the Cleaning Management Board and Public Works should take responsibility.
• Considering that the source of wastewater includes the hinterland area of Minahasa Regency, the wastewater management of the city should involve this regency in the integrated and trans-boundary management rather than independent management systems in each area. This will be more effective management.
• Regulations and guidelines (for instance, EIA and criteria and the standard of effluent discharge), as well as their enforcement, for managing the wastewater discharge are

92
needed to be established at the local level of Manado City in line with provincial and national levels.
• The establishment of policies, strategies, and actions as mentioned in Agenda 21 of Indonesia and North Sulawesi Province would be advantageous for the city. Since such measures have not yet been established in the city, it would be wise if the city government adopts and develops these measures to be the policies of the city. However, the city has its own right to choose appropriate measures that are suitable for the area, according to Act 22 of 1999.
• Financial support from all parties in the city (community and private sectors) is needed to be explored.

93
References Abu-Rizaiza, O. S. (1999). Modification of the standards of wastewater reuse in Saudi
Arabia. Water Resource, 33 (11), 2601-2608.
Adams, V. D. (1991). Water & Wastewater Examination Manual. Chapter 5 In Methods for the determination of organics. Lewis Publishers, Michigan, pp. 163–167.
ADB (Asian Development Bank). (1991). Environmental evaluation of coastal zone projects: methods and approaches. ADB Environment Paper No. 8. 72 p.
ADB (Asian Development Bank). (2000). The environment program: recent achievements and a new agenda for the poor. Environment Division, Office of Environment and Social development. Asian Development Bank. 158 p.
Adingra, A. A. & Arfi, R. (1998). Organic and bacterial pollution in the Ebrie Lagoon, Cote d’Ivoire. Marine Pollution Bulletin, 36, 689–695.
Ahn, I-Y. & Choi, J-W. (1998). Macrobenthic communities impacted by anthropogenic activities in an intertidal san flat on the West Coast (Yellow Sea) of Korea. Marine Pollution Bulletin, 36(10), 808-817.
Akbar, H. M. D., Minnery, J. R., van Horen, B. & Smith P. (2007). Community water supply for the urban poor in developing countries: The case of Dhaka, Bangladesh. Habitat International, 31, 24 –35.
Al-Sa’ed, R. & Mubarak. (2006). Sustainability assessment of onsite sanitation facilities in Ramallah-Albireh district with emphasis on technical, socio-cultural and financial aspects. Management of Environmental Quality, 17(2), 140-156.
KMNLH (Kantor Menteri Negara Lingkungan Hidup). (1996a). Agenda 21 Indonesia: Strategi nasional untuk pembangunan berkelanjutan [National Strategic for Sustainable Development]. Publikasi Awal. Kantor Menteri Negara Lingkungan Hidup. Juli, 1996. Jakarta.
KMNLH (Kantor Menteri Negara Lingkungan Hidup). (1996b) Indonesia's marine environment: a summary of policies, strategies, action and issues. Ministry of state for environment. pp. 86. Jakarta.
Anonymous. (2001a). http://pasture.ecn.purdue.edu/~epados/septics/wwater.htm
Anonymous. (2001b). http://www.gpa.unep.org/documents/ihe_cd/
Anonymous. (2001c). http://www.gpa.unep.org/pollute/sewage/chapter1.htm
APHA-AWWA-WPCF. (1969). Bacteriologic examinations. Chapter VII. In Standard Methods for the Examination of Water and Wastewater including Bottom Sediments and Sludges. 12th ed. APHA Inc., New York.
APHA-AWWA-WPCF. (1990). Standard Methods for the Examination of Water and Wastewater. Washington, DC.
ATB (Asian Textile Business). (2002). Indonesia: Damage by industrial wastewater. http://www.allbusiness.com/asia/1115956-2.html, July 6 2007.
Bakir, H. A. (2001). Sustainable wastewater management for small communities in the Middle East and North Africa. Journal of Environmental Management, 61, 319-328.

94
Bapedal-Sulut. (2003). Pengelolaan limbah padat dan cair [Waste and wastewater Management]. In Agenda 21 Sulawesi Utara. Bapedal Propinsi Sulawesi Utara. Manado.
BPSKM. (2000). Kota Manado Dalam Angka 2000 [Statistic of Manado 2000]. Badan Pusat Statistik Kota Manado. Manado.
BPSKM. (2003). Kota Manado Dalam Angka 2003 [Statistic of Manado 2003]. Badan Pusat Statistik Kota Manado. Manado.
BPSKM. (2006). Kota Manado Dalam Angka 2006 [Statistic of Manado 2006]. Badan Pusat Statistik Kota Manado. Manado.
BPSPSU. (1997). Manado Dalam Angka 1997 [Statistic of Manado 1997]. Badan Pusat Statistik Propinsi Sulawesi Utara. Manado.
BPSPSU. (1998). Sulut dalam angka tahun 1998 [Statistic of North Sulawesi Province 1998]. Badan Pusat Statistik Propinsi Sulawesi Utara. Manado.
BPSPSU. (1999). Sulut Dalam Angka Tahun 1999 [Statistic of North Sulawesi Province 1999]. Badan Pusat Statistik Propinsi Sulawesi Utara. Manado.
BPSPSU. (2001). Population of Manado City. Result of the 2000 Population Census. Badan Pusat Statistik Propinsi Sulawesi Utara. Manado.
Braadbaart, O. (1995). Regulatory strategies and rational polluters: industrial wastewater control in Indonesia, 1982-1992. TWPR, 17(4), 439-458.
Brown, B. E. (1997). Integrated coastal management: South Asia. Department of Marine sciences and Coastal Management, University of Newcastle, Newcastle upon Tyne, United Kingdom.
Buffleben, M. S., Zayeed, K., Kimbrough, D., Stenstrom, M. K. & Suffet, I. H. (2002). Evaluation of urban non-point source of runoff of hazardous metals entering Santa Monica Bay, California. Water Science and Technology, 45(9), 263-268.
Burkhard, R., Deletic, A. & Craig, A. (2000). Techniques for water and wastewater management: a review of techniques and their integration in planning. Urban Water, 2, 197-221.
Carpenter, R. A. & Maragos, J. E. (1989). How to assess environmental impacts on tropical islands and coastal areas. Sponsored by Asian development Bank. Environment and Policy Institute, Wast-West Center. 345 p.
Cheevaporn, V. & Menasveta, P. (2003). Water pollution and habitat degradation in the Gulf of Thailand. Marine Pollution Bulletin, 47, 43-51.
Chen, M.-H. & Chen, C.-Y. (1999). Bioaccumulation of sediment-bound heavy metals in grey mullet Liza macrolepis. Marine Pollution Bulletin, 39, 239–244.
Chia, L. S. (1992). Singapore’s urban coastal area: strategies for management. ICLARM Tech. Rep. 31, 99 p.
Chia, L.S. (1998). Coastal management in Singapore: institutional arrangement and implementation. Ocean & Coastal Management, 38, 111-118.
Christie, P. (2005). Is integrated coastal management sustainable? Ocean & Coastal Management, 48, 208-232.

95
Cicin-Sain, B. & Knecht, R. W. (1998). Integrated coastal and ocean management. Concept and practices. Island Press. Washington, D.C. 517 p.
Clark J. R. (1992). Integrated management of coastal zones. FAO Fisheries Technical Paper. No. 327. Rome, FAO. 167 p.
Clark, J. R. (1996). Coastal zone management handbook. Lewis Publsihers. Boca Raton. 694p.
Clark, R. B. (1997). Marine pollution. Forth Edition. Claredon Press, Oxford. 161p.
Connell, D. W., Wu, R. S. S., Richardson, B. J., Leung, K., Lam, P. S. K. & Connell, P. A. (1998). Occurrence of persistent organic contaminants and related substances in Hong Kong marine area: an overview. Marine Pollution Bulletin, 36(5), 736-384.
Daniel, M. H. B., Montebelo, A. A., Bernardes, M. C., Ometto, J. P. H. B., De Camargo, P. B., Krusche, A. V., Ballester, M. V., Victoria, R. L. & Martinelli, L. A. (2002). Effects of urban sewage on dissolved oxygen, dissolved inorganic and organic carbon, and electrical conductivity of small streams along a gradient of urbansation in the Piracicaba river basin. Water, Air, and Soil Pollution, 136, 189-206.
Dionisio, L. P. C., Rheinheimer, G. & Borrego, J. J. (2000). Microbiological pollution of Ria Formosa (south of Portugal). Marine Pollution Bulletin, 40(2), 186-193.
DPPSU. (1994). Pembangunan Sub Sektor Perikanan selama Pelita V dan Program Pelita VI (Fisheries Development Plan). Dinas Perikanan Propinsi Sulawesi Utara, Manado, 1994.
Dyer, S. D., Peng, Ch., McAvoy, D. C., Fendinger, N. J., Masscheleyn, P., Castillo, L. V. & Lim, J. M. U. (2003). The influence of untreated wastewater to aquatic communities in the Balatuin River, The Philippines. Chemosphere, 52, 43 –53.
Edinger, E. N., Jompa, J., Limmon, G. V., Widjatmoko, W. & Risk, M. J. (1998). Reef degradation and coral biodiversity in Indonesia: effects of land-based pollution, destructive fishing practices and changes over time. Marine Pollution Bulletin, 36(8), 617-630.
Engin, G. O. & Demir, I. 2006. Cost analysis of alternative methods for wastewater handling in small communities. Journal of Environmental Management, 79, 357–363.
Fowler, J. & Cohen, L. (1990). Practical Statistics for Field Biology. John Wiley & Sons, England.
Friedler, E., Lahav, O., Jizhaki, H. & Lahav, T. (2006). Study of urban population attitudes towards various wastewater reuse options: Israel as a case study. Journal of Environmental Management, 81, 360 –370.
Gourbesville, Ph. & Thomassin, B. A. (2000). Coastal environment assessment procedure for sustainable wastewater management in tropical islands: the Mayotte example. Ocean & Coastal Management, 43, 997-1014.
Greiner, R., Young, M. D., McDonald, A. D. & Brooks, M. (2000). Incentive instruments for sustainable use of marine resources. Ocean & Coastal Management, 43, 29-50.
Grimble, R. & Chan, M-K. (1995). Stakeholder analysis for natural resource management in developing countries: some practical guidelines for making management more participatory and effective. Natural Resources Forum, 2, 113-124.
96
Hale, L. Z. & Olsen, S. B. (2003). Context and future directions for integrated coastal management. InterCoast, Fall, 31-33.
Hambrey, J., Phillips, M., Chowdhury, M. A. K. & Shivappa, R. B. (2000). Environmental assessment of coastal aquaculture development: an environmental assessment (EA) manual to assist governmental agencies, coastal aquaculture developers, non-governmental organisation (NGOs) and community organisations. SEACAM. 213 p.
Hauger, M. B., Rauch, W., Linde, J. J. & Mikkelsen, P. S. (2002). Cost benefit risk-a concept for management of integrated urban wastewater system. Water Science and Technology, 45(3), 185-193.
Haughton, G. & Hunter, C. (1995). Sustainable cities. Regional Policy and Development Series 7. Regional Studies Association. London.
Hildebrand, L. P. (1997). Introduction to the special issue on community-based coastal management. Ocean & Coastal Management, 36(1-3), 1-9.
Hoozemans, F. J. M., Klein, R. J. T, Kroon, A. & Verhagen, H. J. (1995). The coast in conflict: an interdisciplinary introduction to coastal zone management. The Hague.
Inglis, G. J. & Kross, J. E. (2000). Evidence for systemic changes in the benthic fauna of tropical estuaries as a result of urbanisation. Marine Pollution Bulletin, 41(7-12), 367-376.
JICA (Japan International Co-operation Agency). (2000). The study on critical land and protection forest rehabilitation at Tondano Watershed in the Republic of Indonesia. Progress Report I. Nippom Koei Co., Ltd., Kokusai Kogyo Co., Ltd.
Jiries, A. G., Al Nasir, F. M. & Beese, F. (2002). Pesticide and Heavy Metals Residue in Wastewater, Soil and Plants in Wastewater Disposal Site Near Al-Lajoun Valley, Karak, Jordan. Water, Air, and Soil Pollution, 133(1-4), 97-107.
Jones, K. C. (2007). Sources, fate, behaviour and effects of organic chemicals at the regional and global scale (editorial). Journal of Environmental Monitoring, 9, 500.
Jorge, M. A. (1997). Developing capacity for coastal management in the absence of the government: a case study in the Dominican Republic. Ocean & Coastal Management, 36(1-3), 47-72.
JPHA (Japan Public Health Association). (2001). Preventive measures against environmental mercury pollution and its health effects. Japan Public Health Association, Japan, 112 pp.
Jusoh, M. M. (1999). A contextual framework for the development and use of marine water quality criteria in ASEA. In C. McPherson, P. Chapman, G. Vigers & K. –S. Ong (Eds.), ASEAN Marine Water Quality Criteria: Contextual Framework, Methodology and Criteria for 18 Parameters (pp. I1–I10). ASEAN Marine Environmental Quality Criteria—Working Group (AMEQC-WG), ASEA-Canada Cooperative Programme on Marine Science—Phase II (CPMS-II). EVS Environment Consultant, North Vancouver and Department of Fisheries, Malaysia.
Kärrman, E., (2001). Strategies towards sustainable wastewater management. Urban Water, 3, 63-72.
Kawabe, M. (1998). To enhance the environmental values of Tokyo Bay- a proposition for integrated coastal zone management. Ocean & Coastal Management, 41, 19-39.

97
Kay, R. & Alder, J. (1999). Coastal planning and management. E & FN SPON. London and New York. 375 p.
Kitsiou, D. & Karydis, M. (2001). Marine eutrophication: a proposed data analysis procedure for assessing spatial trends. Environmental Monitoring and Assessment, 68, 297-312.
Koop, K., Booth, D., Broadbent, A., Brodie, J., Bucher, D., Capone, D., et al. (2001). ENCORE: the effect of nutrient enrichment on coral reefs. Synthesis of results and conclusion. Marine Pollution Bulletin, 42(2), 91-120.
Kullenberg, G. (1999). The exclusive economic zone: some perspectives. Ocean & Coastal Management, 42, 849-855.
Kumurur, V. A. & Lasut, M. T. (2002). The participation of NGOs in managing coastal communities: an experience from North Sulawesi, Indonesia. Ekoton, 2(1), 69-72.
Kumurur, V. A. (2002a). Pembangunan, sumberdaya alam dan lingkungan hidup di Kota Manado [development, natural resources, and environment in the city of Manado]. Ekoton Edisi Khusus, 1, 29-38.
Kumurur, V. A. (2002b). Kawasan pemukiman kumuh di Kota Manado dan alternatif solusi untuk meningkatkan kualitas lingkungannya [the slum areas in the city of Manado and alternatives to improve the environmental quality]. Ekoton, 2(2), 129-135.
Kusnoputranto, H. (1997). Air limbah dan ekskreta manusia: aspek kesehatan masyarakat dan pengelolaannya [wastewater and human excrete: community health aspect and management]. Direktorat Jenderal Pendidikan Tinggi, Departemen Pendidikan dan Kebudayaan. Jakarta.162p.
Kvarnström, E. & Petersens, E. (2004). Open Planning of Sanitation Systems. EcoSanRes Fact Sheet 7. EcoSanRes Publication Series. Report 2004-3. Stockholm Environment Institute; Stockholm, Sweden.
Lasut, M.T. (2002). Akumulasi logam pada beberapa jenis biota laut di perairan Semenanjung Minahasa, Sulawesi Utara [Metal accumulation in marine biota at Minahasa Peninsular, North Sulawesi]. Ekoton, 2, 107–115.
Lee, J. (1998). Policy issues and management framework of Chinhae Bay, Republic of Korea. Ocean & Coastal Management, 38, 161-178.
Lee, J. H. W. & Arega, F. (1999). Eutrophication dynamics of Tolo Harbour, Hong Kong. Marine Pollution Bulletin, 39, 187–192.
Lipp, E. K., Farrah, S. A. & Rose, J. B. (2001). Assessment and impact of microbial fecal pollution and human enteric pathogens in a coastal community. Marine Pollution Bulletin, 42(4), 286-293.
Luttinger, N. (1997). Community-based coral reef conservation in the bay islands of Honduras. Ocean & Coastal Management, 36(1-3), 11-22.
Mallin, M. A., Cahoon, L. B., Toothman, B. R., Parsons, D. C., McIver, M. R., Ortwine, M. L. & Harrington, R. N. (2007). Impacts of a raw sewage spill on water and sediment quality in an urbanized estuary. Marine Pollution Bulletin, 54, 81 –88.
Massoud, M. A., Scrimshaw, M. D. & Lester, J. N. (2003). Qualitative assessment of the effectiveness of the Mediterranean action plan: wastewater management in the Mediterranean region. Ocean & Coastal Management, 46, 875-899.

98
McPherson, T. N., Burian, S. J., Turin, H. J., Stenstrom, M. K. & Suffet, I. H. (2002). Comparison of the pollutant loads in dry and wet weather runoff in a southern California urban watershed. Water Science & Technology, 45(9), 255-261.
Melloul, A. A., Hassani, L. & Rafouk, L. (2001). Salmonella contamination of vegetables irrigated with untreated wastewater. World Journal of Microbiology and Biotechnology, 17(2), 207-209.
Miclat, E. F. B., Ingles, J. A. & Dumaup, J. N. B. (2006). Planning across boundaries for the conservation of the Sulu-Sulawesi Marine Ecoregion. Ocean &Coastal Management, 49, 597 –609
Miller, G. T. Jr. (1996). Living in the environment: principles, connections, and solution (Ninth Editions). Wadsworth Publishing Company. New York. 729 p.
MoE-GoJ (Ministry of the Environment-Government of Japan). (2004). Result of FY 2002 Marine Environment Monitoring. Press Release. Available at http://www.env.go.jp/en/press/2004/0906a.html (accessed 25 July 2007).
Mokat, A. (2003). Implementasi kebijakan pemerintah kota terhadap pengelolaan sampah di Kota Manado [implementation of the Manado City’s Government policy on the waste management]. Ekoton Edisi Khusus, 2, 11-17.
Morgan, P. (2004). An Ecological Approach to Sanitation in Africa: A Compilation of Experiences. Aquamor: Harare, Zimbabwe. EcoSanRes Fact Sheet 12.
Mrayyan, B. & Hamdi, M. R. (2006). Management approaches to integrated solid waste in industrialized zones in Jordan:A case of Zarqa City. Waste Management, 26, 195 –205.
Murthy, R. J., Rao, Y. R. & Inamdar, A. B. (2001). Integrated coastal management of Mumbai metropolitan region. Ocean & Coastal Management, 44, 355-369.
NOAA (National Oceanic & Atmospheric Administration). (1995). Analytical & planning for integrated coastal management. A prototype multimedia CD-ROM. Payson Stevens InterNetwork, Inc.
Nur, Y., Fazi, S., Wirjoatmodjo, N. & Han, Q. (2001). Towards wise coastal management practice in a tropical megacity – Jakarta. Ocean & Coastal Management, 44, 335-353.
Ortiz-Hernandez, M. C. & Saenz-Morales, R. (1999). Effect of organic material and distribution of fecal coliforms in Chetumal Bay, Quintana Roo, Mexico. Environemntal Monitoring and Assessment, 55, 423-434.
Ouano, E. A. R. (1988). Training manual on assessment of the quantity & type of land-based pollutant discharges into the marine & coastal environment. 66p.
Owen, R. B. & Sandhu, N. (2000). Heavy metal accumulation and anthropogenic impacts on Tolo Harbour, Hong Kong. Marine Pollution Bulletin, 40(2), 174-180.
Parameswaran, M. (1999). Urban wastewater use in plant biomass production. Resources, Conservation and Recycling, 27, 39-56.
Parkinson, J. & Tayler, K. (2003). Decentralized wastewater management in peri-urban areas in low-income countries. Environment & Urbanization, 15, 75-90.
Pompeo, C.A. (1999). Development of a state policy for sustainable urban drainage. Urban Water, 1, 155-160.

99
Rawlins, B. G., Ferguson, A. J., Chilton, P. J, Arthurton, R. S., Rees, J. G. & Baldock, J. W. (1998). Review of agricultural pollution in the Caribbean with particular emphasis on small island developing states. Marine Pollution Bulletin, 36(9), 658-668.
Reed, S. C., Crites, R. W. & Middlebrooks, E. J. (1995). Natural systems for waste management and treatment. Second Edition. McGraw-Hill, Inc. New York. 434p.
Rees, G. (1993). Health implication of sewage in coastal waters-British case. Marine Pollution Bulletin, 26, 14–19.
Rivers-Moore, N. A. & Jewitt, G. P. W. (2007). Adaptive management and water temperature variability within a South African river system: What are the management options? Journal of Environmental Management, 82, 39 –50.
Roomratanapun, W. (2001). Introducing centralized wastewater treatment in Bangkok: a study of factor determining its acceptability. Habitat International, 25, 359-371.
RTI (Research Triangle Institute). (2004). Improving and expanding solid waste collection in Manado, North Sulawesi, Indonesia. Research Triangle Institute (USA) in association with PT Deserco Development Services. Manado.
Ruddle, K. (1982). Environmental pollution and fishery resources in Souhteast Asian Coastal Waters. In C. Soysa, L. S. Chia & W. L. Collier (Eds.), Man, Land and Sea (pp. 15-35). The Agricultural Development Council, Bangkok.
Schertenleib, R. (2002). Principles and implications of household centred-approach in environmental sanitation. Water and Sanitation for Developing Countries (SANDEC), Swiss Federal Institute for Environmental Science and Technology (EAWAG), Ueberlandstrasse 133, CH-8600 Duebendorf, Switzerland. Copyright 2002 EcoSanRes.
Scialabba, N. (1998). Integrated coastal area management and agriculture, forestry and fisheries. FAO Guidelines. Environment and Natural Resources Service, FAO, Rome. 256p.
Sevilla C. G., Ochave, J. A., Punsalan, T. G., Regala, B. P. & Uriarte, G. G. (1988). An introduction to research methods. Rex Printing Company, Inc. Philippines.
Shatkin, G. (2007). Global cities of the South: Emerging perspectives on growth and inequality. Cities, 24(1), 1–15.
Sheppard, Ch. (2007). Biomonitoring coastal seas –Celebrating the contributions of our first North American editor –Dr.John (Jack)B.Pearce (editorial). Marine Pollution Bulletin, 54, 1–4
Somarelli, J. A., Makarewicz, J. C., Sia, R. & Simon, R. (2007). Wildlife identified as major source of Escherichia coli in agriculturally dominated watersheds by BOX A1R-derived genetic fingerprints. Journal of Environmental Management, 82, 60 –65.
Steel, R. G. D. & Torrie, J. H. (1980). Principles and procedures of statistics. McGraw-Hill, Inc.
Sukarma, R. & Pollard, R. (2000). Indonesia. Overview of sanitation and sewerage experience and policy options. Urban Development Sector Unit, Indonesia Country Management Unit, East Asia and Pacific Region. Available at

100
http://Inweb18.worldbank.org/eap/eap.nsf/Attachments/Water-Ris&Pollard/$file/ 1INDONESIA-sewerage+experience+(final).pdf (accessed 6 January 2006).
Tamon, B. (2003). Pengelolaan limbah (padat dan cair) di Kota Manado [management of wastes (solid and liquid) in the city of Manado]. Ekoton Edisi Khusus, 2, 19-23.
Tebbutt, T. H. Y. (1992). Principles of water quality control. Fourth Edition. Pergamon Press. Oxford. 251 p.
Tomascik, T. (1993). Coral reef ecosystems: environmental management guidelines. Environmental management Development in Indonesia Project (EMDI). 79p.
Tsagarakis, K. P., Mara, D. D., Horan, N. J. & Angelakis, A. N. (2001). Institutional status and structure of wastewater quality management in Greece. Water Policy, 3, 81-99.
Tuncer, G., Karakas, T., Balkas, T. I., Gokcay, C.F., Aygnn, S., Yurteri, C., et al. (1998). Land-based sources of pollution along the black sea coast of Turkey: concentrations and annual loads to the Black Sea. Marine Pollution Bulletin, 36(6), 409-423.
Tunggal, A. Dj. (2002). Peraturan perundang-undangan Lingkungan hidup [Environmental Acts of Indonesia]. Buku VII. Harvarindo, Jakarta.
Ukwe, C. N., Ibe, C. A., Alo, B. I. & Yumkella, K. K. (2003). Achieving a paradigm shift in environmental and living resources management in the Gulf of Guinea: the large marine ecosystem approach. Marine Pollution Bulletin, 47, 219 –225.
UNEP. (1992). From regulation to industry compliance: building institutional capabilities. United Nations Environment Programme. Industry and Environment Programme Activity Centre (IE/PAC). 62p.
Vallega, A. (2001). Urban waterfront facing integrated coastal management. Ocean & Coastal Management, 44, 379-410.
Vandermeulen, H. (1998). The development of marine indicators for coastal zone management. Ocean & Coastal Management, 39, 63-71.
Veenstra S., Alaerts, G. & Bijlsma, M. (1997). Technology Selection. In: Water Pollution Control. Eds. R Helmer & I. Hespanol. E&FN Spon, London.
Vermeulen, L. A. & Wepener, V. (1999). Spatial and temporal variations of metals in Richards Bay Harbour (RBH), South Africa. Marine Pollution Bulletin, 39, 304–307.
Vestal, B. & Rieser, A. (1995). Methodologies and mechanisms for management of cumulative coastal environmental impacts. Part I: Synthesis, with annotated bibliography; Part II: Development and application of a cumulative impacts assessment protocol. NOAA Coastal Ocean Program Decision Analysis Series No. 6. NOAA Coastal Ocean Office, Silver Spring, MD.
Virkanen, J. (1998). Effect of urbanisation on metal deposition in the Bay of Toolonlahti, Southern Finland. Marine Pollution Bulletin, 36(9), 729-738.
Williams, T. M., Rees, J. G. & Setiapermana, D. (2000). Metals and trace organic compounds in sediments and waters of Jakarta Bay and the Pulau Seribu complex, Indonesia. Marine Pollution Bulletin, 40(3), 277-285.
Windom, H. L. (1992). Contamination of the marine environment from land-based sources. Marine Pollution Bulletin, 25, 32-36.

101
Wong, P. P. (1998). Coastal tourism development in Southeast Asia: relevance and lesson for coastal zone management. Ocean & Coastal Management, 38, 89-109.
Wu, R. S. S. (1999). Eutrophication, water borne pathogens and xenobiotic compounds: environmental risks and challenges. Marine Pollution Bulletin, 39, 11–22.
Wu, R. S. S., Cheung, R. Y. H. & Shin, P. K. S. (1998). The ‘beneficial uses’ approach in coastal management in Hong Kong: a compromise between rapid urban development and sustainable development. Ocean & Coastal Management, 41, 89-102.
Ye, Y., Tam, N. F. Y. & Wong, Y. S. (2001). Livestock wastewater treatment by a mangrove pot-cultivation system and the effect of salinity on the nutrient removal efficiency. Marine Pollution Bulletin, 42(6), 513-521.
Yu, R-Q., Chen, G. Z., Wong, Y. S., Tam, N. F. Y. & Lan, C. Y. (1997). Benthic macrofauna of the mangrove swamp treated with municipal wastewater. Hydrobiologia, 347(1-3), 127-137.
Zhang, Z., Zhu, M., Wang, Z. & Wang, J. (2006). Monitoring and managing pollution load in Bohai Sea, PR China. Ocean &Coastal Management, 49, 706 –716

102
Appendices Appendix 1. Aggregation Variables in Environmental Awareness Analysis (Household
Level) No. Variables Issues Focuses
1.1. General environmental issue
Knowledge on general issue about environment and pollution
• Terminology of ‘'environment' and 'pollution'.
• Pollution in coastal area • Toxic substance pollution • Why toilet should be used
1. Knowledge
1.2. Environmental issue related to wastewater
Knowledge on environmental issue related to wastewater
• Pollution on potable water due to wastewater discharge
• Wastewater discharge causes disease
• Diarrhoea disease caused by wastewater from toilet
Government’s responsibility
• Wastewater problem is government’s responsibility
• No need to collect money (retribution, tax, donation) from community
Community’s responsibility
• Wastewater problem is fully community's responsibility
• Government need to collect money (retribution, tax, donation) from community to solve wastewater problem
2. Preference 2.1. Problem solving of environmental issue including wastewater
All parties responsibility
• Wastewater problem is all party’s responsibilities
• Government can collect money (retribution, tax) from community and government should improve public wastewater facilities

103
Appendix 2. Aggregation Variables in Environmental Awareness Analysis (Personal Level)
Variables Sub-variables Issues Focuses 1.1. Concern on
general environmental issue
General environmental condition and impact
o Solid waste discharge o Toxic waste discharge o Community’s health condition o Local environmental condition o Local air pollution o Environmental destruction in
coastal areas
1. Concern
1.2. Concern on environmental issue related with wastewater
Environmental condition and impact related to wastewater discharge
o Local potable water pollution o Pollution in coastal areas. o Toilet facilities and condition. o Sewerage facilities and condition. o Wastewater-caused diseases. o Pollution caused by wastewater
discharge.
Government’s responsibility
o Government is the only party has responsibility
o No fund is collected from community
Community’s responsibility
o Community is the only party has responsibility
o Fund must be collected from community
2. Preference 2.1. Preference on problem solving of environmental issue, including wastewater
All parties have responsibility
o All parties must have responsibility for environmental quality improvement
o Fund can be collected from community and other parties, and government will improve environmental condition and wastewater treatment facilities

104
Appendix 3. List of Questions Used in the Household Survey (at Household Level) done by Interview
a. General questions: Wastewater treatments and facilities
1 Name / age 2 Occupation 3 Number of income 4 Number of person to be responsible 5 Highest achieving education 6 Houses status 7 Number of person lived in the house 8 Number of bedroom 9 Spare space (2x2 m)
10 House construction 11 Bathroom 12 Worry about diseases cause by wastewater discharge 13 Septic tank 14 Septic tank capacity (for black water) 15 Septic tank condition (for black water) 16 Condition of wastewater facilities for grey
b. Special questions: Knowledge
17 Pollution in coastal area 18 Pollution of potable water due to wastewater discharge 19 Toxic substance pollution 20 Why toilet should be used Why toilet should be used 21 Wastewater discharge causes disease 22 Diseases (example: diarrhoea) were caused by wastewater from toilet 23 Terminology of ‘'environment' and 'pollution'
c. Special questions: Preference
24. 25. 26. 27. 28. 29. 30.
31.
Government is the only party has responsibility
No fund is collected from community
Community is the only party has responsibility
Fund must be collected from community
All parties must have responsibility for environmental quality improvement
Fund can be collected from community and other parties, and government will improve environmental condition and wastewater treatment facilities
Polluters must pay for the environmental quality improvement

105
Appendix 4. List of Questions Used in the Personal Survey (at Personal Level) done by using Questionnaire
a. General questions
1. N a me 2. Age 3. Gender 4. Married status 5. Highest achieving education 6. Occupation 7. Number of income 8. Lingkungan 9. Sub-district
10. District 11. House status
b. Special questions: Concern
12. 13. 14. 15. 16. 17. 18. 19. 20. 21. 22. 23.
Solid waste discharge Toxic waste discharge Community’s health condition Local environmental condition Local air pollution Environmental destruction in coastal areas Local potable water pollution Pollution in coastal areas Toilet condition and facilities Sewerage condition and facilities Wastewater-caused diseases Pollution caused by wastewater discharge
c. Special questions: Preference
24. 25. 26. 27. 28. 29. 30.
31.
Government is the only party has responsibility
No fund is collected from community
Community is the only party has responsibility
Fund must be collected from community
All parties must have responsibility for environmental quality improvement
Fund can be collected from community and other parties, and government will improve environmental condition and wastewater treatment facilities
Polluters must pay for the environmental quality improvement

106
Appendix 5. Matrix for Wastewater (Septic Tank) Condition Categories
Condition Leaking to sewer
Open hole
Close hole
No concrete/ cement
Concrete/ cement
(1 compart-ment)
Concrete/ cement
(2 compart-ments)
Leaking to sewer
1 1 1 1 1
Open hole
1 2 2 2
Close hole
1 3 4 5
No concrete/ cement 1 2 3 Concrete/cement (1 compartment)
1 2 4
Concrete/cement (2 compartments)
1 2 5
Denote:
Condition 1: Very poor (leaking to sewer) Condition 2: Poor (open hole) Condition 3: Adequate (closed hole, no concrete/cement) Condition 4: Good (close hole, concrete/cement, 1 compartment) Condition 5: Very good (close hole, concrete/cement, 2 compartments)
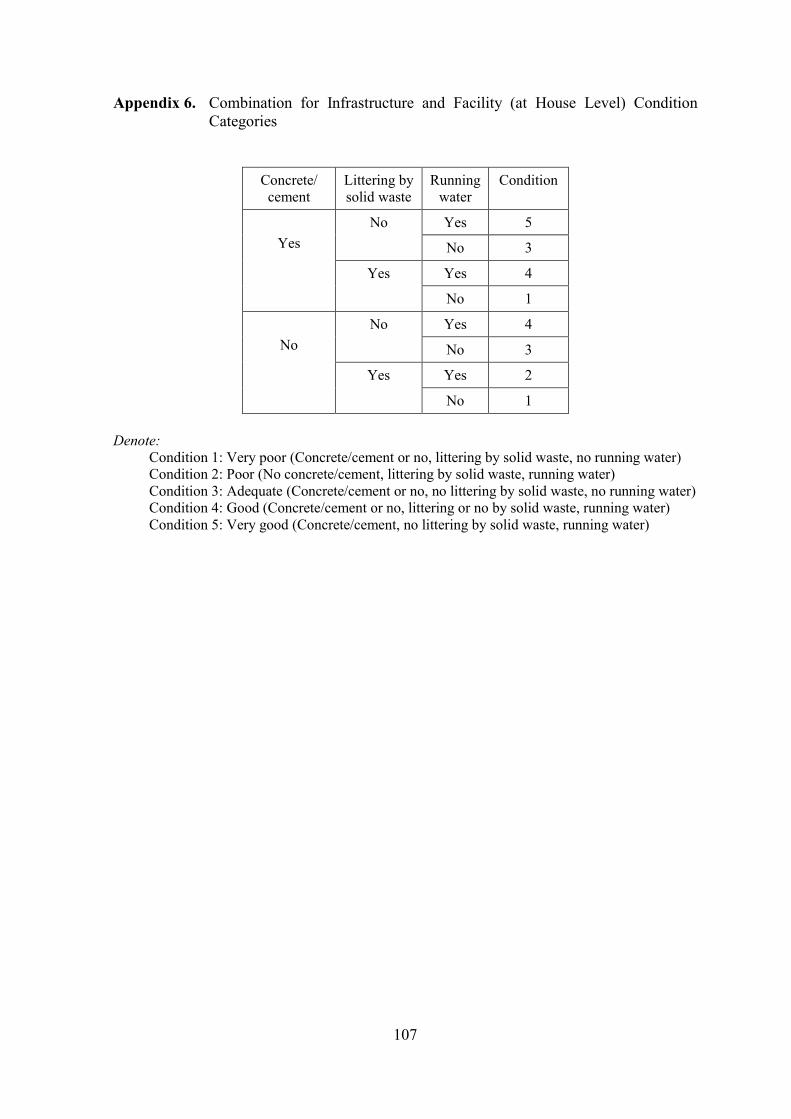
107
Appendix 6. Combination for Infrastructure and Facility (at House Level) Condition Categories
Concrete/ cement
Littering by solid waste
Running water
Condition
Yes 5 No
No 3
Yes 4
Yes
Yes
No 1
Yes 4 No
No 3
Yes 2
No
Yes
No 1 Denote:
Condition 1: Very poor (Concrete/cement or no, littering by solid waste, no running water) Condition 2: Poor (No concrete/cement, littering by solid waste, running water) Condition 3: Adequate (Concrete/cement or no, no littering by solid waste, no running water) Condition 4: Good (Concrete/cement or no, littering or no by solid waste, running water) Condition 5: Very good (Concrete/cement, no littering by solid waste, running water)

108
Annexes Annex 1. An Example of Questionnaire for Environmental Awareness Survey at Personal
Level I. GENERAL QUESTIONS a. Personal identity
N a me : …………………………………… (may not be filled) Age : ……… Years Gender : …. 1. Female …. 2. Male Married status : …. 1. Married …. 2. Not Highest achieving education
: …………………………………………………
Occupation : ………………………………………………… Number of income : Rp. …………….. Weekly or Monthly
b. Address Lingkungan : ………………………………………………… Sub-district : ………………………………………………… District : ………………………………………………… House status : ….. 1. Owner ….. 2. Parents / Relatives ….. 3. Rent Signature : …………………………..
II. CONCERN OF ENVIRONMENTAL ISSUES How would you rate your concern about the items listed below?
1. Solid waste discharge around your home. …… 1 Very concerned
…… 2 Concerned …… 3 Somewhat concerned …… 4 Less concerned …… 5 Not concerned
2. Toxic waste discharge around your home. …… 1 Very concerned
…… 2 Concerned …… 3 Somewhat concerned …… 4 Less concerned …… 5 Not concerned
3. Community’s health condition around your home. …… 1 Very concerned
…… 2 Concerned …… 3 Somewhat concerned …… 4 Less concerned …… 5 Not concerned
4. Environmental condition around your home. …… 1 Very concerned
…… 2 Concerned …… 3 Somewhat concerned …… 4 Less concerned

109
…… 5 Not concerned
5. Air pollution around your home. …… 1 Very concerned
…… 2 Concerned …… 3 Somewhat concerned …… 4 Less concerned …… 5 Not concerned
6. Environmental destruction in coastal areas closed to your home …… 1 Very concerned
…… 2 Concerned …… 3 Somewhat concerned …… 4 Less concerned …… 5 Not concerned
7. Land reclamation in coastal area. …… 1 Very concerned
…… 2 Concerned …… 3 Somewhat concerned …… 4 Less concerned …… 5 Not concerned
8. Pollution in coastal and marine area of Manado Bay. …… 1 Very concerned
…… 2 Concerned …… 3 Somewhat concerned …… 4 Less concerned …… 5 Not concerned
9. Toilet facilities and condition in your home and your neighbors. …… 1 Very concerned
…… 2 Concerned …… 3 Somewhat concerned …… 4 Less concerned …… 5 Not concerned
10. Sewerage facilities and condition close to your home. …… 1 Very concerned
…… 2 Concerned …… 3 Somewhat concerned …… 4 Less concerned …… 5 Not concerned
11. Wastewater-caused diseases (diarrhoea, dermatitis, etc.) around your area. …… 1 Very concerned
…… 2 Concerned …… 3 Somewhat concerned …… 4 Less concerned …… 5 Not concerned
12. Pollution caused by wastewater discharge. …… 1 Very concerned
…… 2 Concerned …… 3 Somewhat concerned …… 4 Less concerned …… 5 Not concerned
13. Local potable water pollution due to wastewater.
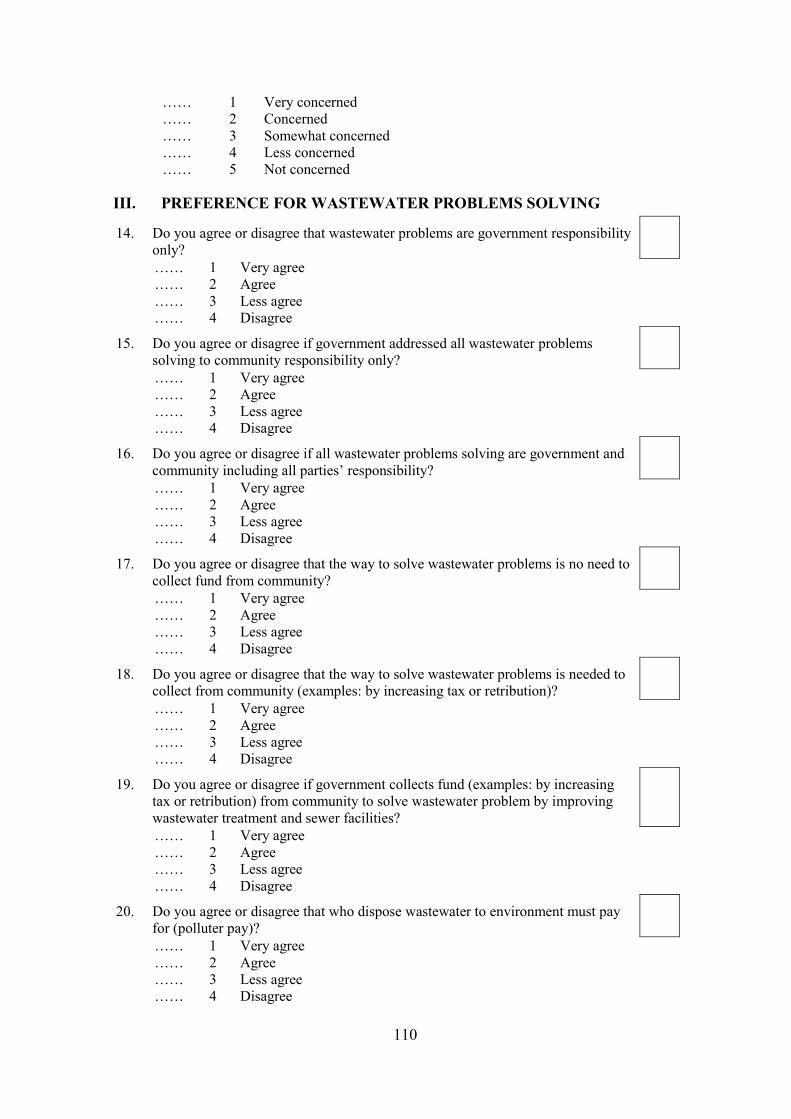
110
…… 1 Very concerned …… 2 Concerned …… 3 Somewhat concerned …… 4 Less concerned …… 5 Not concerned
III. PREFERENCE FOR WASTEWATER PROBLEMS SOLVING
14. Do you agree or disagree that wastewater problems are government responsibility only?
…… 1 Very agree …… 2 Agree …… 3 Less agree …… 4 Disagree
15. Do you agree or disagree if government addressed all wastewater problems solving to community responsibility only?
…… 1 Very agree …… 2 Agree …… 3 Less agree …… 4 Disagree
16. Do you agree or disagree if all wastewater problems solving are government and community including all parties’ responsibility?
…… 1 Very agree …… 2 Agree …… 3 Less agree …… 4 Disagree
17. Do you agree or disagree that the way to solve wastewater problems is no need to collect fund from community?
…… 1 Very agree …… 2 Agree …… 3 Less agree …… 4 Disagree
18. Do you agree or disagree that the way to solve wastewater problems is needed to collect from community (examples: by increasing tax or retribution)?
…… 1 Very agree …… 2 Agree …… 3 Less agree …… 4 Disagree
19. Do you agree or disagree if government collects fund (examples: by increasing tax or retribution) from community to solve wastewater problem by improving wastewater treatment and sewer facilities?
…… 1 Very agree …… 2 Agree …… 3 Less agree …… 4 Disagree
20. Do you agree or disagree that who dispose wastewater to environment must pay for (polluter pay)?
…… 1 Very agree …… 2 Agree …… 3 Less agree …… 4 Disagree

111
Annex 2. Illustration of a House Unit
Sewer
HOUSE UNIT
Bathroom
Toilet
Kitchen
Sewer
Septic tank (2 compartments)
Wastewater Infrastructure &
facilities (at house basis)
Concrete/ cement
Concrete/ cement
Running water