ms. v. dolly kranz ms. angel kozlowski
TRANSCRIPT

Grade 8 Math Acceleration
1
Dr. Thomas L. Rogers Ms. V. Dolly Kranz Ms. Angel Kozlowski
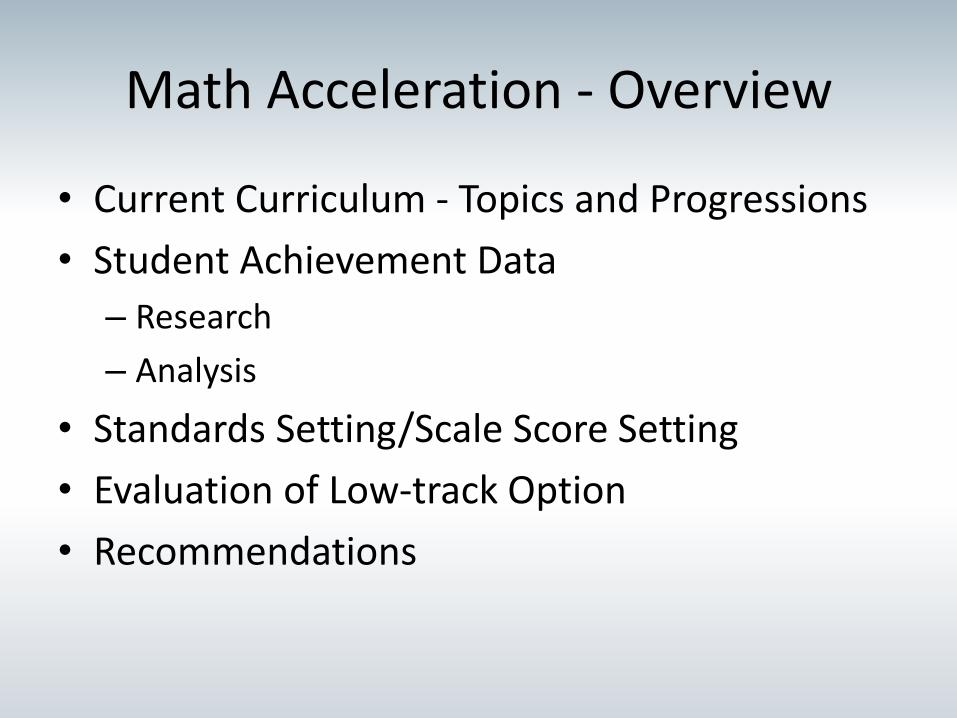
Math Acceleration - Overview
• Current Curriculum - Topics and Progressions
• Student Achievement Data
– Research
– Analysis
• Standards Setting/Scale Score Setting
• Evaluation of Low-track Option
• Recommendations

MATH CC STATE STANDARDS Aligned GRADES K-5
GRADE K GRADE 1 GRADE 2 GRADE 3 GRADE 4 GRADE 5
Counting and Operations Operations Operations Cardinality and Algebraic and Algebraic and Algebraic
Thinking Thinking Thinking
Operations Operations Operations Number and Number and Number and and Algebraic and Algebraic and Algebraic Operations in Operations in Operations in Thinking Thinking Thinking Base Ten Base Ten Base Ten
Number and Number and Number and Number and Number and Number and Operations in Operations in Operations in Operations- Operations- Operations-Base Ten Base Ten Base Ten Fractions Fractions Fractions
Measurement Measurement Measurement Measurement Measurement Measurement and Data and Data and Data and Data and Data and Data
Geometry Geometry Geometry Geometry Geometry Geometry

MATH CC STATE STANDARDS Aligned GRADES 6&7
GRADE 6 GRADE 7
Ratios and Proportional Relationships
Ratios and Proportional Relationships
The Number System
The Number System
Expressions and Equations
Expressions and Equations
Geometry Geometry
Statistics and Probability
Statistics and Probability

TYPICAL PROGRESSION FOR MATH
Math 7 Math 8
Is this good for kids?
As published 2016-2017 SHS Curriculum Manual 14

Advantages of Current Approach
• Students are better prepared for SAT (more Trig in early 11th grade)
• Students have more time in HS schedule for:
– Advanced math (AP Calculus)
– Math electives*
– Other electives (art, music, technology, etc.)
• Differentiation begins at high school
*Additional electives available in Mathematics include AP STATISTICS, ADVANCED MATHEMATICS WITH APPLICATIONS, DISCRETE MATHEMATICS, MATHEMATICAL FUNCTIONS, ADVANCED ALGEBRA, AND APPLIED MATH

Does Waiting Improve Success? No.
RVC Math Acceleration Results
100%
95%
90%
85%
80%
75%
70%
65%
60%
70%
81%
92% 96%
87% 89%
80% 83%
3%
2%
3%
5%
3%
8%
1/2 Accel. Total Accel. 1/2 Accel. Total Accel. 1/2 Accel. Total Accel. 1/2 Accel. Total Accel.
Sequential I Sequential II Sequential III Pre-Calculus
Year 1 Year 2
�urris, �arol (2003) “Providing Mathematics to Heterogeneously Grouped Middle School Students. The Longitudinal Effects on Students of Differing Initial !chievement Levels/” Doctoral Dissertation

Same for “Low !chievers”
RVC Math Acceleration Results - Low Achievers
100%
90%
80%
70%
60%
50%
40%
30%
20%
10%
0%
57%
9%
5%
60%
46% 44%
30% 28% 19% 24%
16%
11% 20%
8% 12% 11%
8%
8%
16%
13%
8% 8%
1/2 Accel. Total Accel. 1/2 Accel. Total Accel. 1/2 Accel. Total Accel. 1/2 Accel. Total Accel.
Sequential I Sequential II Sequential III Pre-Calculus
Year 1 Year 2 Year 3 Year 4
Accelerating Mathematics Achievement Using Heterogeneous Grouping Author(s): Carol Corbett Burris, Jay P. Heubert and Henry M. Levin Source: American Educational Research Journal, Vol. 43, No. 1 (Spring, 2006), pp. 105-136

Does Waiting Improve Success? Research: No.
• Carol Burris (2003, 2006, 2014) • Paula White (Univ. of WI, Madison, 1996) – C+ students down-tracked into slower paced class had 2%
chance of completing higher Math – C+ students tracked into highest math had 91% chance of
completing higher math (As summarized by Burris, C. (2014) p. 48.)
• John M. Peterson (1989) – “Students of the lowest achievement level benefitted more from studying the accelerated curriculum 0 than from the remedial curriculum supposedly designed to meet (their) needs/” (Quoted from �urris, �/ (2014) p/ 47/)

Item Response Theory Le
vel
– Cut points
• 1:2 = standard set
• 2:3 = goal set (same passing rate)
• 3:4 = standard set
• 4:5 = standard set
2014 A1 Raw Score Scaling
5 4 3 2 1
Raw Score
65 85
5 10 15 20 25 30 35 40 45 50 55 60 65 70 75 80 85 0

[Raw Score][Scale Score] Conversion
2014 & 2015 Algebra I CC Conversion Chart
0
10
20
30
40
50
60
70
80
90
100
2014
2015
0 3 6 9 12 15 18 21 24 27 30 33 36 39 42 45 48 51 54 57 60 63 66 69 72 75 78 81 84
Level 1 Level 2 Level 3 Level 4 Level 5
Level 1 Level 2 Level 3 Level 4 Level 5

Regents Exams
Math
• Integrated Algebra Special Administration.
• Al- Regents Exam Workgroup recommendation under review.
• A2- Standard setting this year.
• Focus on the scale (especially at top end) and role of trig.
Social Studies
• Fully educator-driven Global and U.S Exams.
Science
• Gearing up to start redesign.
New York State 1 EDUCATION DEPARTMENT
3 -lo > s~u > •'o•to. h
Source: Presentation by Peter Swerdzewski, Ph.D. Assistant Commissioner of Assessment, Standards, and
Curriculum. NYSCOSS Conference March 7, 2016

General Math 8 Option?
Perceived Pros
• Creates a program with a slower pace and lower expectations
• Students may find pace more manageable
Cons
• Unlikely to result in higher scores in 9th grade
• Creates a segregated track through 11th Grade
• Decides at age 11 which children will not attempt AP Calculus
• Program could be stigmatized
• Breaks up middle school teaching teams

Why are Math and Science Different?
Science
• Courses stand alone – Sequence less important
– Can double up
– Delay doesn’t force track
• No AIS Requirement – Extra help only
• Undergoing significant revision (NGSS)
Math
• Courses are sequential – Foundation important
– Very difficult to double up
– Differentiation forces tracking
• AIS Component – Math lab, workshop, etc.
• Undergoing modest revision (Standards Revision)
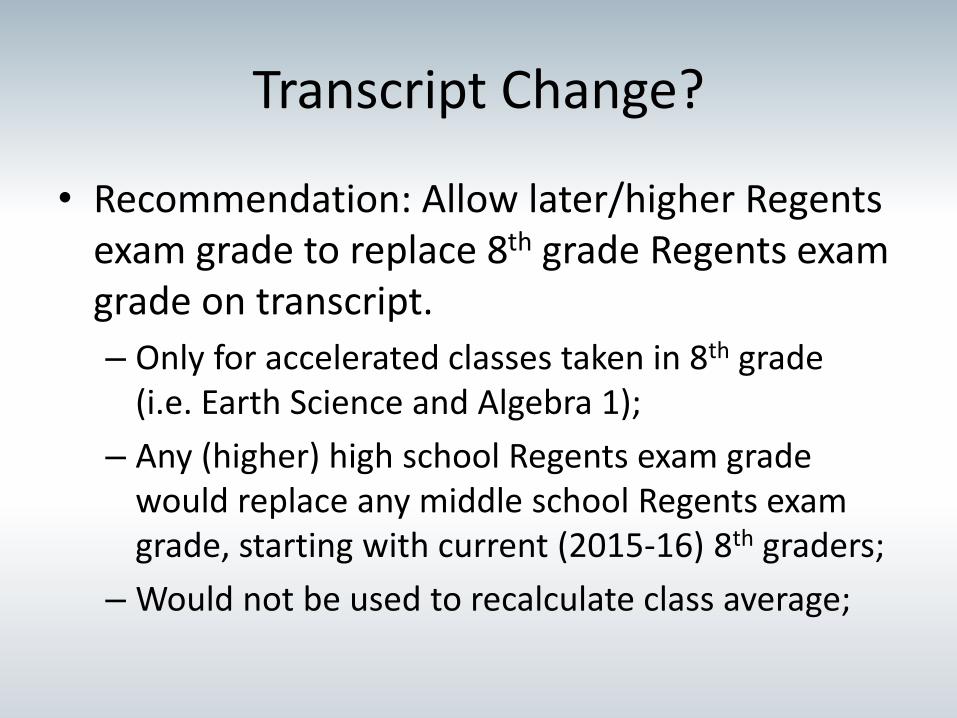
Transcript Change?
• Recommendation: Allow later/higher Regents exam grade to replace 8th grade Regents exam grade on transcript.
– Only for accelerated classes taken in 8th grade (i.e. Earth Science and Algebra 1);
– Any (higher) high school Regents exam grade would replace any middle school Regents exam grade, starting with current (2015-16) 8th graders;
– Would not be used to recalculate class average;

Additional Recommendations
• “Keep building the ramp” – Common Core math instruction began in 2011-12;
– Current 8th graders are first cohort with: • Go Math 6th grade (CC-aligned)
• Big Ideas 7th grade (CC-aligned textbook)
– Continue to review/enhance 6th & 7th grade math curriculum;
• Make all math options available in both HB Thompson & South Woods.
• Review all math sequences after NYSED revises standards.

APPENDIX
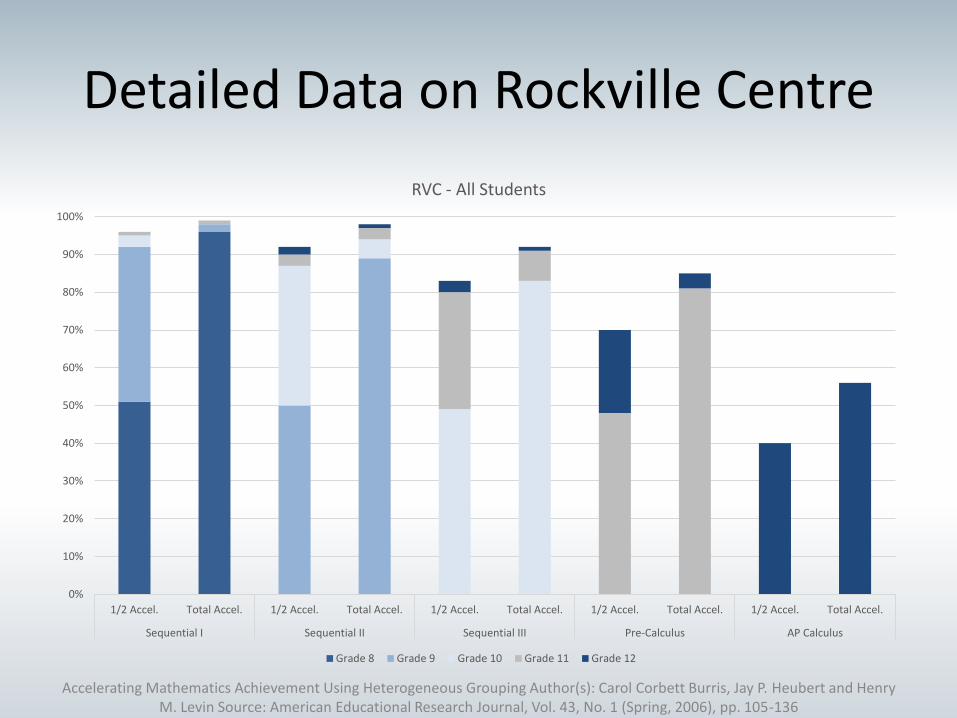
Detailed Data on Rockville Centre
RVC - All Students 100%
90%
80%
70%
60%
50%
40%
30%
20%
10%
0%
1/2 Accel. Total Accel. 1/2 Accel. Total Accel. 1/2 Accel. Total Accel. 1/2 Accel. Total Accel. 1/2 Accel. Total Accel.
Sequential I Sequential II Sequential III Pre-Calculus AP Calculus
Grade 8 Grade 9 Grade 10 Grade 11 Grade 12
Accelerating Mathematics Achievement Using Heterogeneous Grouping Author(s): Carol Corbett Burris, Jay P. Heubert and Henry M. Levin Source: American Educational Research Journal, Vol. 43, No. 1 (Spring, 2006), pp. 105-136
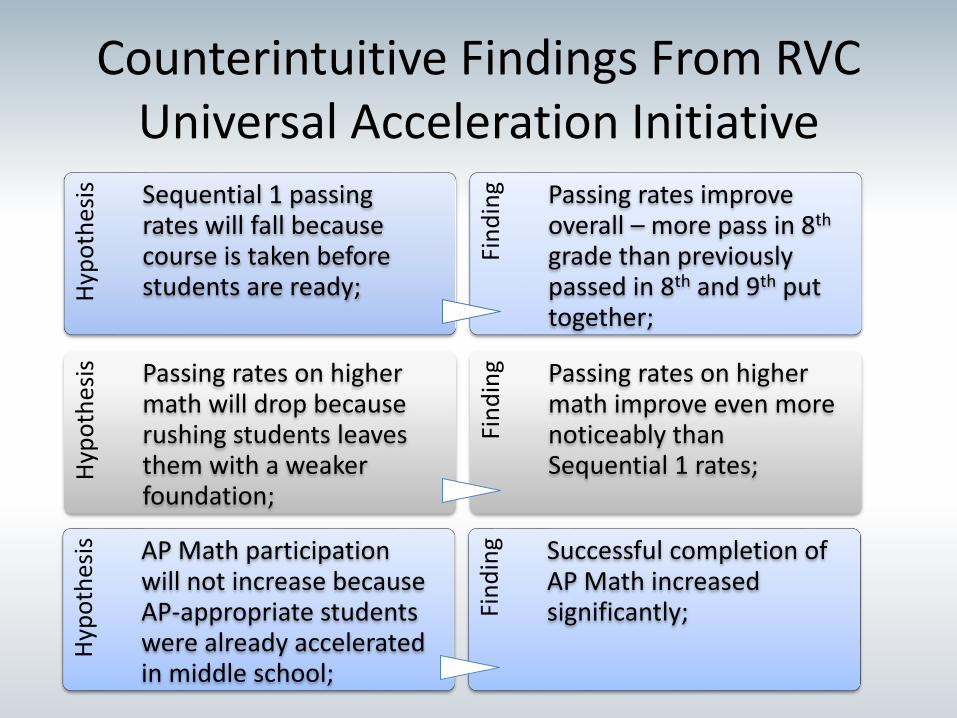
Counterintuitive Findings From RVC Universal Acceleration Initiative
Hyp
oth
esis Sequential 1 passing
rates will fall because course is taken before students are ready;
Fin
din
g Passing rates improve overall – more pass in 8th
grade than previously passed in 8th and 9th put together;
Hyp
oth
esis Passing rates on higher
math will drop because rushing students leaves them with a weaker foundation;
Fin
din
g Passing rates on higher math improve even more noticeably than Sequential 1 rates;
Hyp
oth
esis AP Math participation
will not increase because AP-appropriate students were already accelerated in middle school;
Fin
din
g Successful completion of AP Math increased significantly;
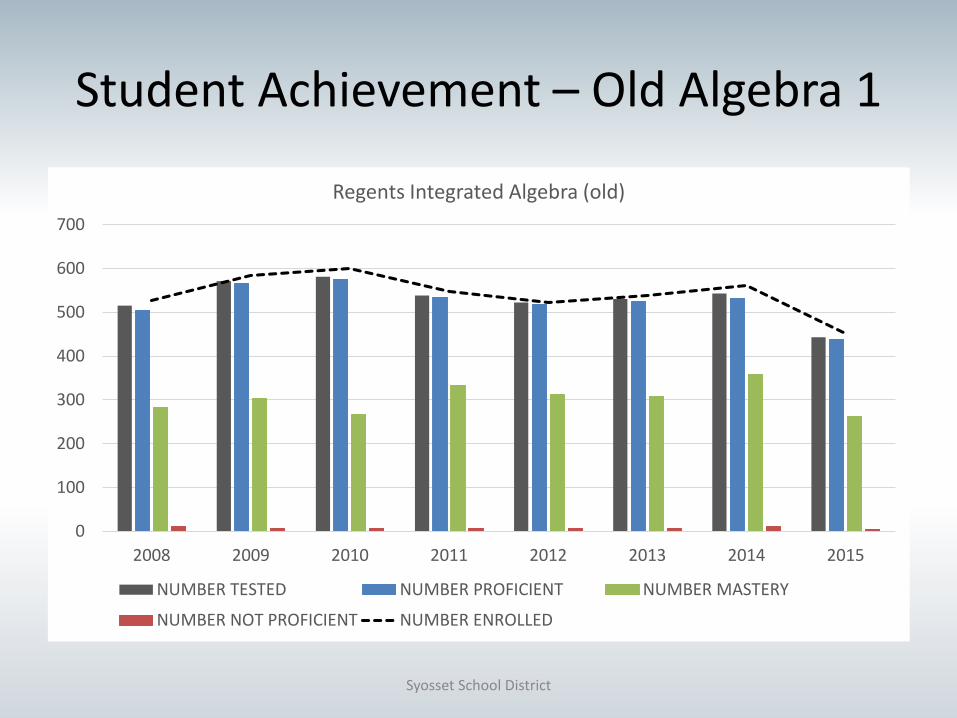
700
Student Achievement – Old Algebra 1
0
100
200
300
400
500
600
Regents Integrated Algebra (old)
2008 2009 2010 2011 2012 2013 2014 2015
NUMBER TESTED NUMBER PROFICIENT NUMBER MASTERY
NUMBER NOT PROFICIENT NUMBER ENROLLED
Syosset School District

600
Student Achievement – New Algebra 1
Regents Algebra 1 (Common Core)
0
100
200
300
400
500
70.0%
Leve
l 5
Leve
l 4
Lev.
5
Leve
l 4
65.0%
2014 2015
NUMBER ENROLLED NUMBER TESTED NUMBER PROFICIENT NUMBER MASTERY NUMBER NOT PROFICIENT
Syosset School District

Algebra 1 (Common Core vs. Old)
0
100
200
300
400
500
600
2012 2013 2014 2014-CC 2015 2015-CC
Algebra 1 Common Core vs. Integrated Algebra
NUMBER TESTED NUMBER PROFICIENT NUMBER MASTERY NUMBER NOT PROFICIENT
Syosset School District

Math Standards History
• 1967 – Math 9, Math 10, Math 11 • 1977 – Sequential I, II, III • 2004 – Math A/Math B • 2005 – Integrated Algebra, Geometry, Alg.2/Trig. – Adopted 2005; assessed in 2007-08
• 2010 – Common Core – Adopted 2010; assessed in 2013-14
• 2016?? – Common Core Review – Commissioner Elia announces review of entire CC Standards- indicates “�ommencement Math” needs adjustment, early grade rigor needs attention.

Bibliography
• �urris, �arol �/, “Providing Mathematics to Heterogeneously Grouped Middle School Students: The Longitudinal Effects on Students of Differing Initial Achievement Levels.” Ed.D. Teachers College, Columbia University, 2003. Print.
• Carol Corbett Burris, Jay P. Heubert and Henry M. Levin/ “!ccelerating Mathematics Achievement Using Heterogeneous Grouping/” American Educational Research Journal, Vol. 43, No. 1 (Spring, 2006), pp. 105-136 https://cxwork.gseis.ucla.edu/pli/14/mp/js/fieldwork-portfolio/docs/burris-research-article-on-tracking Accessed: 4/17/16 9:22 p.m.
• Burris, Carol C., On the Same Track: How Schools Can Join the Twenty-First-Century Struggle Against Resegregation. (2014) Beacon Press. – Peterson, John M/, “Remediation is no Remedy,” Educational Leadership 46,
no.6 (1989): 24-25. – White, Paula !/ et al, “Upgrading the high school Math �urriculum. �ourse-Taking Patterns at Seven High Schools in �alifornia and New York,” Educational Evaluation and Policy Analysis 18 no.4 (1996): 285-307.