mortality- data sources and measures farid najafi md phd school of population health kermanshah...
TRANSCRIPT

Mortality- data sources and Mortality- data sources and measuresmeasures
Farid NajafiFarid NajafiMD PhDMD PhD
School of Population HealthSchool of Population HealthKermanshah University of Medical SciencesKermanshah University of Medical Sciences
OCT 2009OCT 2009

ObjectivesObjectives
To identify appropriate sources for To identify appropriate sources for different types of mortality datadifferent types of mortality data
Understand the importance of using rates Understand the importance of using rates and proportions rather than simple counts and proportions rather than simple counts of fatal eventsof fatal events
IntroductionIntroduction
Mortality data:Mortality data:– Most widely available data for evaluation of Most widely available data for evaluation of
health statushealth status– Easier to obtainEasier to obtain– Unambiguous dataUnambiguous data– More relaiable than morbidity dataMore relaiable than morbidity data

Data sourcesData sources
Vital registrationVital registration
Household surveysHousehold surveys
CensusesCensuses
Surveillance systemsSurveillance systems A vital registeration is the Gold Standard.A vital registeration is the Gold Standard.
Vital RegistrationVital Registration
A legal requirement in most countriesA legal requirement in most countries
A legal requirement that a medical doctor A legal requirement that a medical doctor completes a death certificatecompletes a death certificate
Certificate is then will submit to the local Certificate is then will submit to the local RegistrarRegistrar
Entering the information into a computer Entering the information into a computer filefile
High confidentialityHigh confidentiality
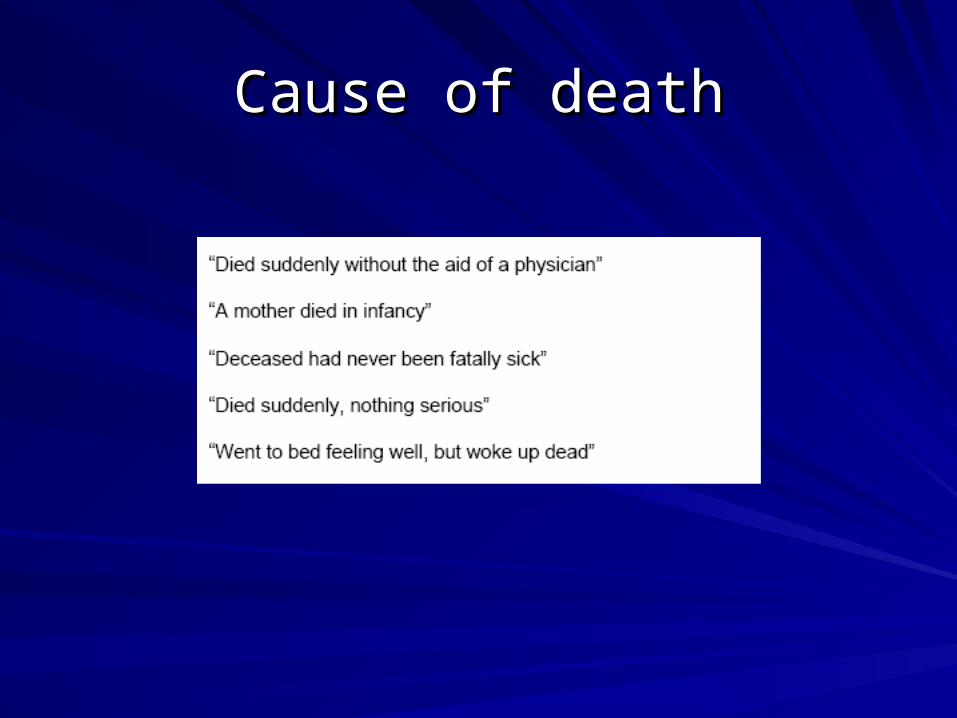
Cause of deathCause of death


Cause of death Cause of death
Several lines:Several lines:– Actual or immediate cause of death or condition Actual or immediate cause of death or condition
directly leading to deathdirectly leading to death– Intermediate or underlying conditions or antecedent Intermediate or underlying conditions or antecedent
causecause– Any other significant condtionsAny other significant condtions UCD defined as the disease that initiate the train of UCD defined as the disease that initiate the train of
events that culminate in the immediate cause of events that culminate in the immediate cause of death, or the circumstances of accident or violence death, or the circumstances of accident or violence which produced the fatal injurywhich produced the fatal injury Prevention of UCD would prevent the death from occuringPrevention of UCD would prevent the death from occuring

ExampleExample
Part 1Part 1– 1(a) upper gastrointestinal haemorrhage1(a) upper gastrointestinal haemorrhage– 1(b) Oesophageal varices1(b) Oesophageal varices– 1© Portal hypertension1© Portal hypertension– 1(d) Cirrhosis liver1(d) Cirrhosis liver
Part 2Part 2– 2 Chronic bronchitis2 Chronic bronchitis
Accuracy of death certificatesAccuracy of death certificates
Several factorsSeveral factors– Physician who completes the death certificatePhysician who completes the death certificate
Depends on different places, different times, their skill, Depends on different places, different times, their skill, diagnostic aids and fashionsdiagnostic aids and fashions
– Type of disease- Type of disease- rapidly fatal condition is likely to recorded accuratelyrapidly fatal condition is likely to recorded accurately
Disease that are easily diagnosed tend to be more Disease that are easily diagnosed tend to be more accurately recordedaccurately recorded
– Use of codes instead of textUse of codes instead of text– Age of death: more tricky in elderlyAge of death: more tricky in elderly

ExampleExample
Comparison of death certificate and Comparison of death certificate and hospital records in the UK: choronic hospital records in the UK: choronic diseases such as diabetes and diseases such as diabetes and hypertension were not recorded as the hypertension were not recorded as the underlying cause of death in more than underlying cause of death in more than half of the patientshalf of the patientsIn an American study, 40% of people who In an American study, 40% of people who died from a stroke had no mention of died from a stroke had no mention of stroke on the death certificate.stroke on the death certificate.
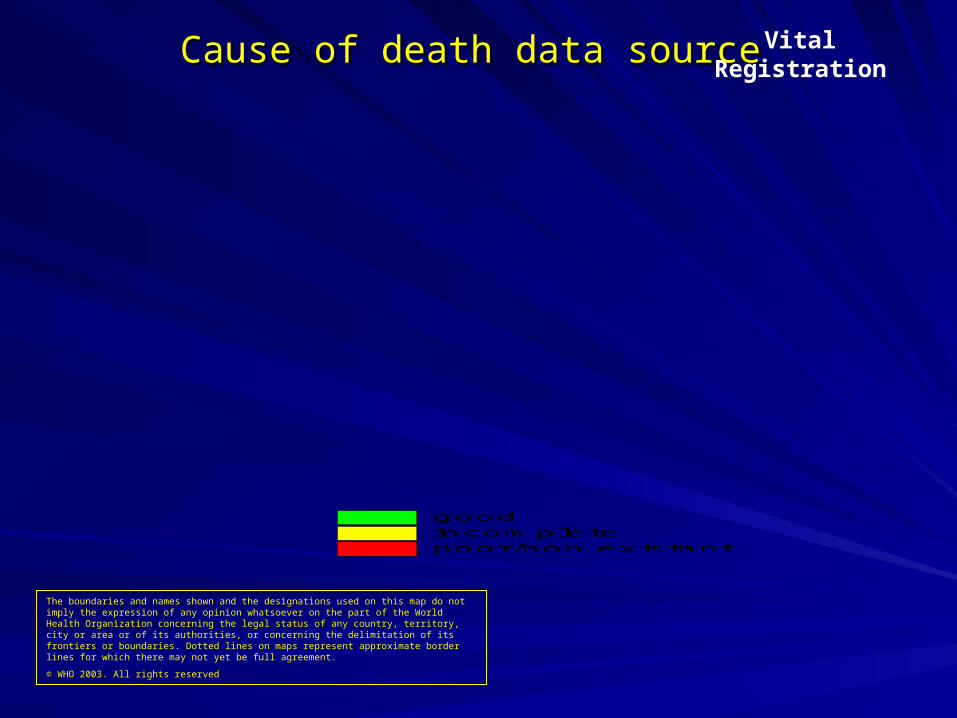
Cause of death data sourceCause of death data source
The boundaries and names shown and the designations used on this map do not imply the expression of any opinion whatsoever on the part of the World Health Organization concerning the legal status of any country, territory, city or area or of its authorities, or concerning the delimitation of its frontiers or boundaries. Dotted lines on maps represent approximate border lines for which there may not yet be full agreement.
© WHO 2003. All rights reserved
goodincompletepoor/non existant
Vital Registration

Population censusesPopulation censusesUsually once every decade (add slide on census in Africa)Usually once every decade (add slide on census in Africa)Mortality related componentsMortality related components
– Retrospective questions onRetrospective questions on individual deaths during preceding 12–36 months, birth histories individual deaths during preceding 12–36 months, birth histories (direct)(direct)
cumulative number of events – children ever born / surviving (indirect)cumulative number of events – children ever born / surviving (indirect) surviving parents / spouse / siblings surviving parents / spouse / siblings
(indirect)(indirect)
– Compilation of HH lists, with follow up ‘surveys of population change’Compilation of HH lists, with follow up ‘surveys of population change’ to assess deaths, pop growth rates, migrationto assess deaths, pop growth rates, migration
– Comparison of aggregate pop data from two or more censusesComparison of aggregate pop data from two or more censuses
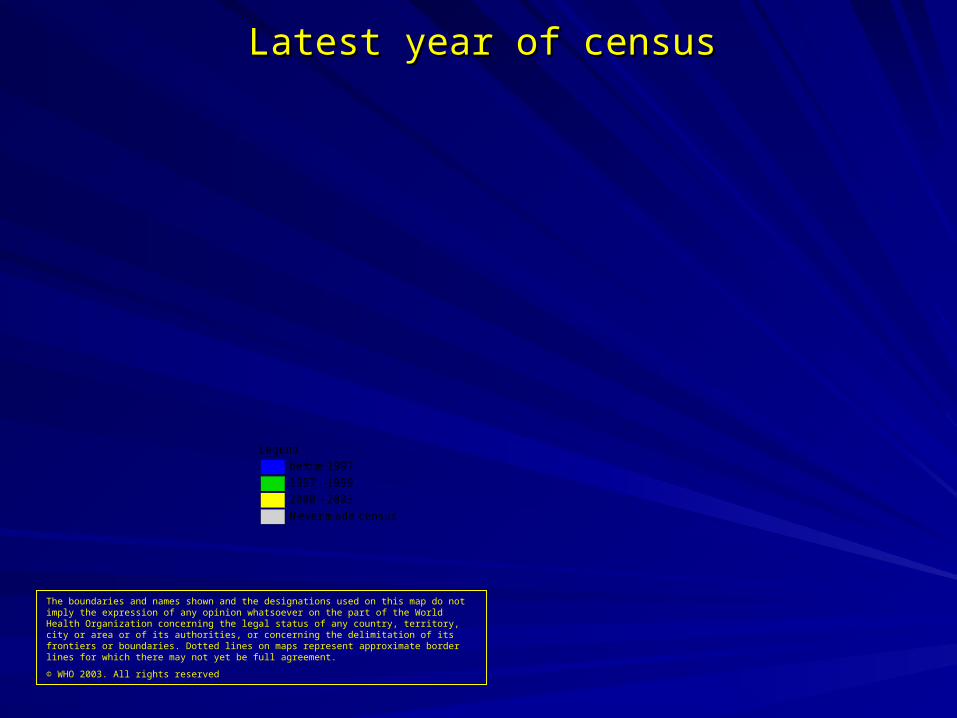
Latest year of censusLatest year of census
The boundaries and names shown and the designations used on this map do not imply the expression of any opinion whatsoever on the part of the World Health Organization concerning the legal status of any country, territory, city or area or of its authorities, or concerning the delimitation of its frontiers or boundaries. Dotted lines on maps represent approximate border lines for which there may not yet be full agreement.
© WHO 2003. All rights reserved
Legendbefore 19971997 - 19992000 - 2003Never made census

Sample registration systemsSample registration systemsAdopted by India, China (diff sampling strategies)Adopted by India, China (diff sampling strategies)
Complete VR costly, difficult to administerComplete VR costly, difficult to administer
In India, combines features of vital registration and censusesIn India, combines features of vital registration and censuses In sample population clustersIn sample population clusters – Fresh sampling following every censusFresh sampling following every census
– Baseline population survey – demographic, SE data, etcBaseline population survey – demographic, SE data, etc
– Continuous monitoring of vital eventsContinuous monitoring of vital events
– Half yearly population enumeration, independent recording of events, followed by Half yearly population enumeration, independent recording of events, followed by
matching, and reconciliation of unmatched eventsmatching, and reconciliation of unmatched events
– Revisions to add verbal autopsy based cause of death ascertainmentRevisions to add verbal autopsy based cause of death ascertainment
– Direct measures of age sp death rates, with measurable sampling errorsDirect measures of age sp death rates, with measurable sampling errors

Demography and Health SurveysDemography and Health Surveys
Nationally representative random sample household survey (5000 Nationally representative random sample household survey (5000 hh)hh)
many modules, costly,high quality data, wealth of informationmany modules, costly,high quality data, wealth of information
Over 60 countries since 1985, approx once every 5 yrs per countryOver 60 countries since 1985, approx once every 5 yrs per country
Focus on maternal and child healthFocus on maternal and child health
Birth histories yield direct estimates of child mortality Birth histories yield direct estimates of child mortality
Sibling survival data for adult mortality in some countriesSibling survival data for adult mortality in some countries
Other uses of DHS data in BoDOther uses of DHS data in BoD
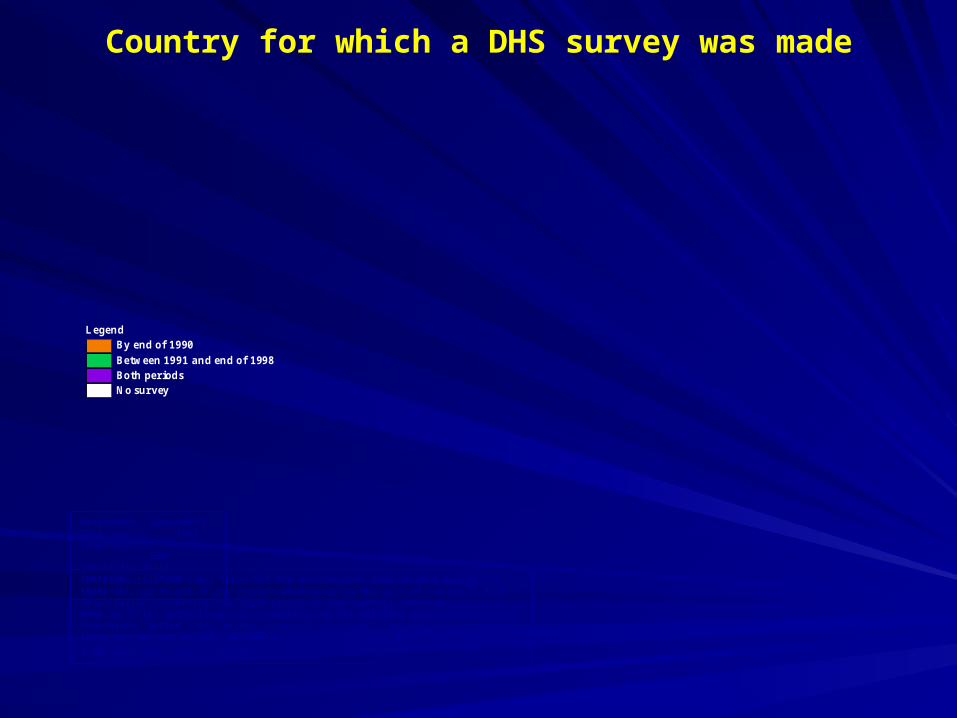
LegendBy end of 1990Between 1991 and end of 1998Both periodsNo survey
Country for which a DHS survey was made
Projection: GeographicData source: ESRI (Boundary)
GBD (mortality data)Operator: Ebener, LozanoThe boundaries and names shown and the designations used on this map do not imply the expression of any opinion whatsoever on the part of the World Health Organization concerning the legal status of any country, territory, city or area or of its authorities, or concerning the delimitation of its frontiers or boundaries. Dotted lines on maps represent approximate border lines for which there may not yet be full agreement.
© WHO 1999. All rights reserved
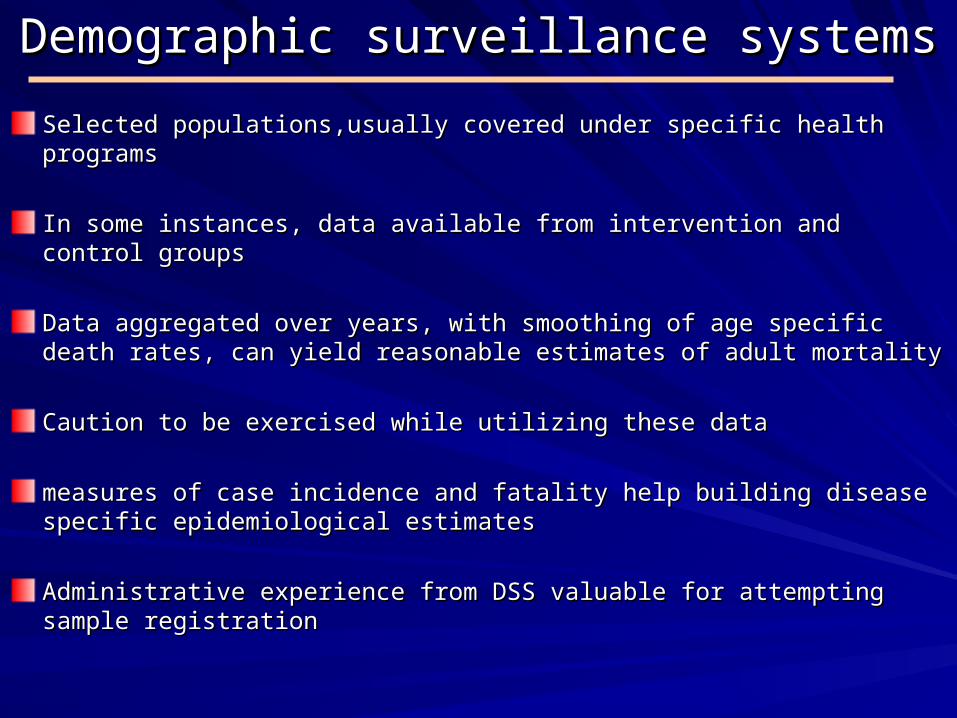
Demographic surveillance systemsDemographic surveillance systems
Selected populations,usually covered under specific health programsSelected populations,usually covered under specific health programs
In some instances, data available from intervention and control groupsIn some instances, data available from intervention and control groups
Data aggregated over years, with smoothing of age specific death rates, can Data aggregated over years, with smoothing of age specific death rates, can yield reasonable estimates of adult mortalityyield reasonable estimates of adult mortality
Caution to be exercised while utilizing these dataCaution to be exercised while utilizing these data
measures of case incidence and fatality help building disease specific measures of case incidence and fatality help building disease specific epidemiological estimatesepidemiological estimates
Administrative experience from DSS valuable for attempting sample Administrative experience from DSS valuable for attempting sample registrationregistration

CountryTotal Population
2002INDEPTH Fieldsite
Population
Botswana 12206430 180000Ethiopia 66038824 35000Gambia 1369940 16400Ghana 20174859 139000Guinea-Bissau 1255756 101000Kenya 31903510 55000Mali 12017740 10000Mozambique 18985579 35000Senegal 9907107 18000South Africa 44201610 146000Uganda 24778979 12000
United Republic of Tanzania 36818687 470000Zambia 10870938 10000
INDEPTH SitesINDEPTH Sites
The boundaries and names shown and the designations used on this map do not imply the expression of any opinion whatsoever on the part of the World Health Organization concerning the legal status of any country, territory, city or area or of its authorities, or concerning the delimitation of its frontiers or boundaries. Dotted lines on maps represent approximate border lines for which there may not yet be full agreement.
© WHO 2003. All rights reserved
Legendnbr of INDEPTH sites/pop.coveredNot INDEPTH sites
LegendCountries with INDEPTH sitesNo INDEPTH sites

Attributes of diff systemsAttributes of diff systems
Criteria Census Vital reg Sample survey
Topical detail (richness and diversity) Moderate Weak Strong
Accuracy Moderate Strong Moderate
Precision (absence of sampling errors) Strong Strong Weak
Timeliness of data Weak Strong Strong
Sub national details Strong Strong Weak
Information on population at risk Strong Weak Strong
Ease of organization in dev countries Moderate Weak Strong

Summary of data sourcesSummary of data sources
Vital registration (1/3Vital registration (1/3rdrd nations, 25% deaths) nations, 25% deaths)
Incomplete VR ( 1/3Incomplete VR ( 1/3rdrd nations, 25 % deaths) nations, 25 % deaths)
Sample Registration (2 nations,33% deaths)Sample Registration (2 nations,33% deaths)
DHS / DSS – (1/4th nations, 16 % deaths)DHS / DSS – (1/4th nations, 16 % deaths)
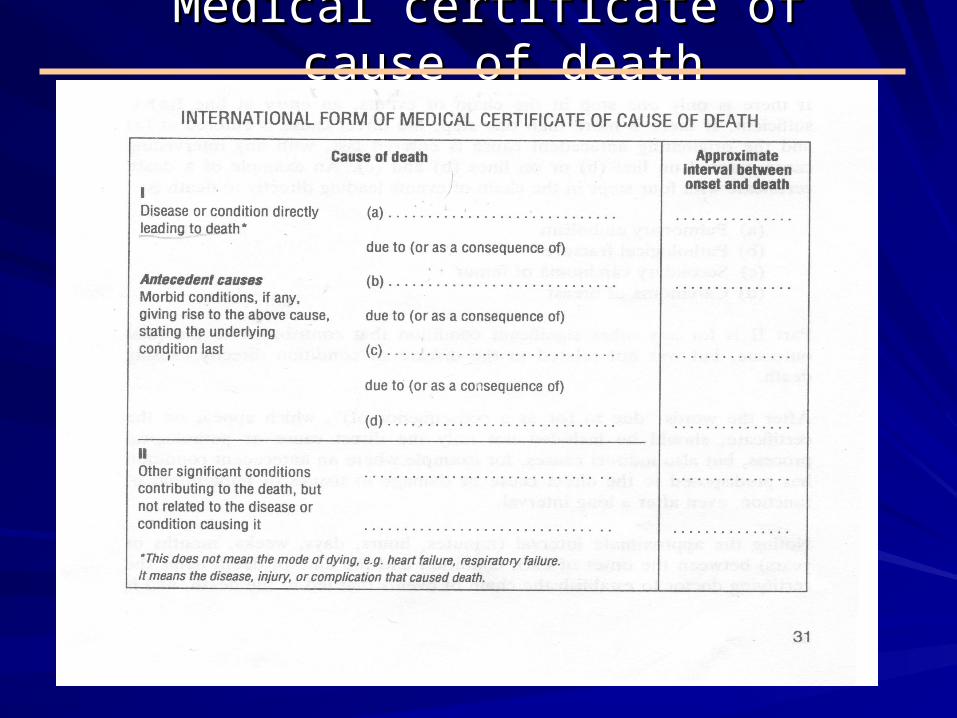
Medical certificate of cause of deathMedical certificate of cause of death

Death certification and ICD codingDeath certification and ICD coding
I.a:I.a: Disease or condition directly leading to death Disease or condition directly leading to death (not (not modemode of dying) of dying)
I.b-x:I.b-x: Antecedent causes. Those morbid conditions Antecedent causes. Those morbid conditions giving rise to the above cause, stating the giving rise to the above cause, stating the underlying condition lastunderlying condition last
II:II: Other significant conditions contributing to Other significant conditions contributing to death, but not related to the disease or condition death, but not related to the disease or condition causing itcausing it
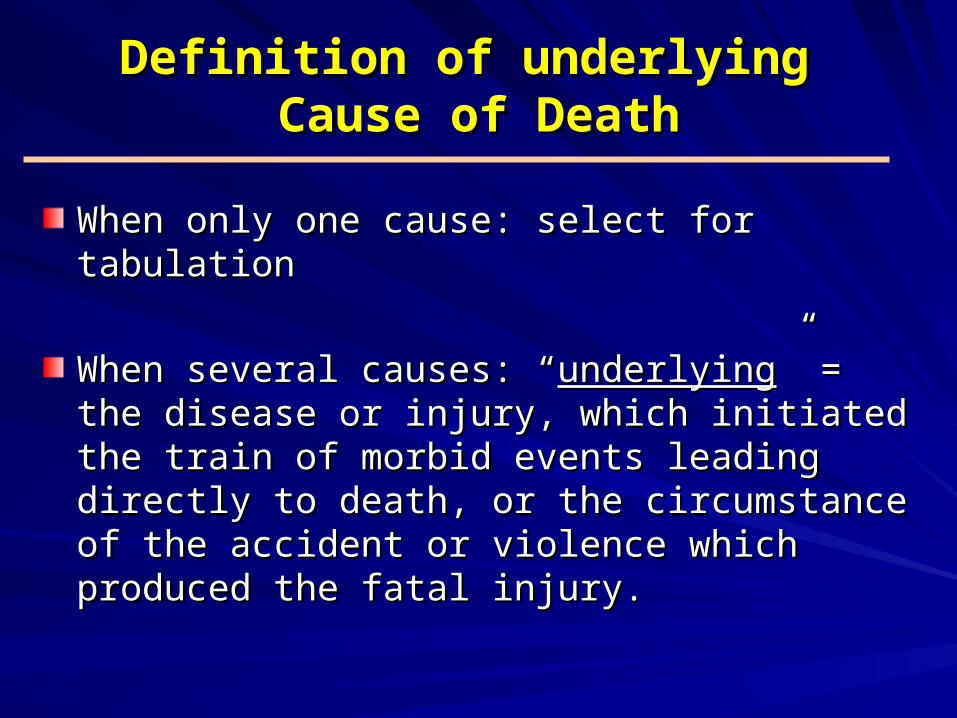
Definition of underlying Definition of underlying Cause of DeathCause of Death
When only one cause: select for tabulationWhen only one cause: select for tabulation
When several causes: “When several causes: “underlyingunderlying” = the disease ” = the disease or injury, which initiated the train of morbid events or injury, which initiated the train of morbid events leading directly to death, or the circumstance of the leading directly to death, or the circumstance of the accident or violence which produced the fatal accident or violence which produced the fatal injury.injury.

Example 1 Example 1
Cardiac arrestCardiac arrest
Congestive heart failureCongestive heart failure
Myocardial infarctionMyocardial infarction
Metastatic lung cancerMetastatic lung cancer
Mode of dying
Ia
Ib
II
Underlying cause of death: Myocardial infarction
Death certification Death certification
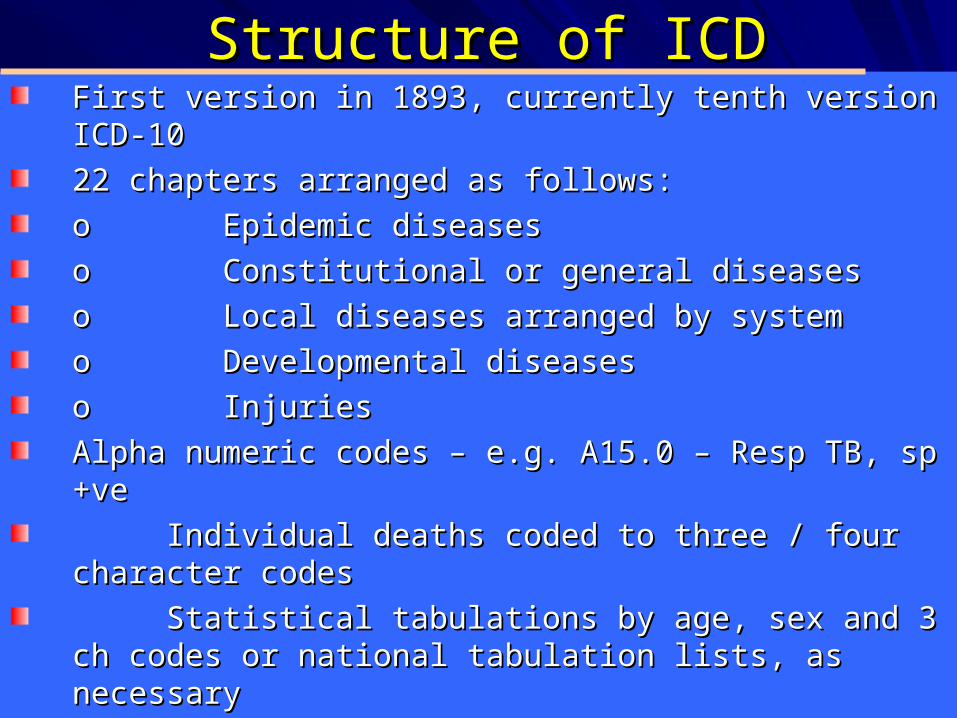
Structure of ICDStructure of ICDFirst version in 1893, currently tenth version ICD-10First version in 1893, currently tenth version ICD-10
22 chapters arranged as follows:22 chapters arranged as follows:
oo Epidemic diseases Epidemic diseases
oo Constitutional or general diseases Constitutional or general diseases
oo Local diseases arranged by system Local diseases arranged by system
oo Developmental diseases Developmental diseases
oo Injuries Injuries
Alpha numeric codes – e.g. A15.0 – Resp TB, sp +veAlpha numeric codes – e.g. A15.0 – Resp TB, sp +ve
Individual deaths coded to three / four character codesIndividual deaths coded to three / four character codes
Statistical tabulations by age, sex and 3 ch codes or Statistical tabulations by age, sex and 3 ch codes or national tabulation lists, as necessarynational tabulation lists, as necessary
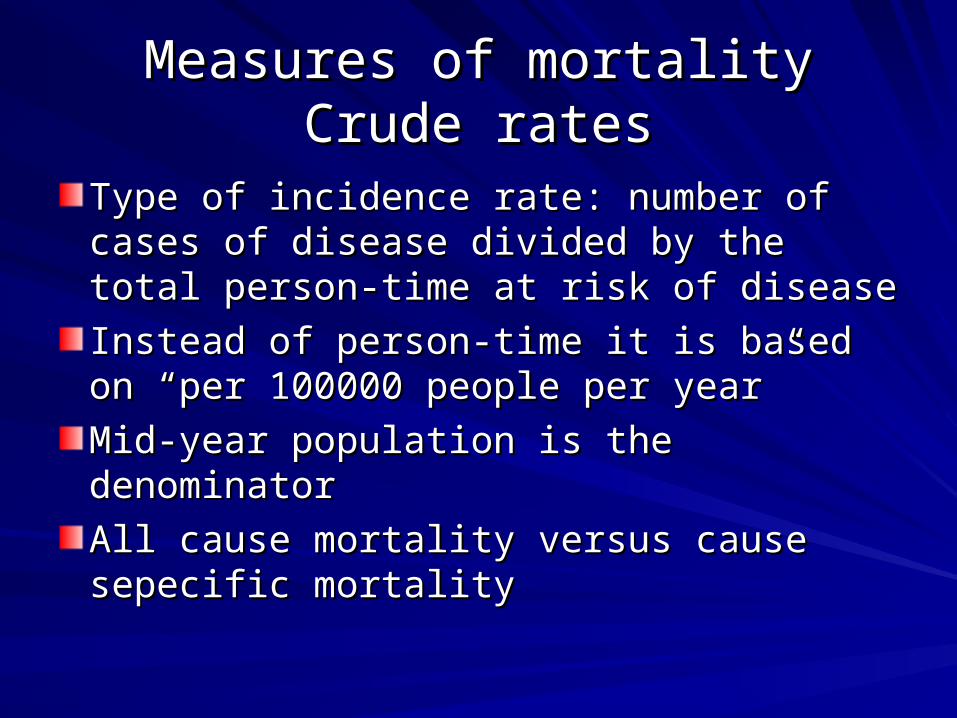
Measures of mortalityMeasures of mortalityCrude ratesCrude rates
Type of incidence rate: number of cases of Type of incidence rate: number of cases of disease divided by the total person-time at disease divided by the total person-time at risk of diseaserisk of disease
Instead of person-time it is based on “per Instead of person-time it is based on “per 100000 people per year”100000 people per year”
Mid-year population is the denominatorMid-year population is the denominator
All cause mortality versus cause sepecific All cause mortality versus cause sepecific mortalitymortality

Exact picture of death from IHD in each country and the burden that each healthsystem needs to cope with

Age-specific rateAge-specific rate
Different population have different age Different population have different age structures and the risk of getting sick structures and the risk of getting sick varies with agevaries with age
Developed countries have older peopleDeveloped countries have older people
Crude rates have little meaning if we try to Crude rates have little meaning if we try to assess the comparative cardiovascular assess the comparative cardiovascular health of theses countrieshealth of theses countries


Standardised ratesStandardised rates
Age-specific is not an efficient method Age-specific is not an efficient method when there are different age stratawhen there are different age strata
Direct standardisiation is an alternative Direct standardisiation is an alternative methodmethod
It is overall incidence if you would have a It is overall incidence if you would have a “standard population“standard population– Age-specific rates in the study populationAge-specific rates in the study population– Age distribution of the standard populationAge distribution of the standard population


Standardized rateStandardized rate
Much better for international comparisonMuch better for international comparison
Standardized rate is lower than crude rate Standardized rate is lower than crude rate in countries with developed population in countries with developed population with older peoplewith older people
Choice of standard population is arbitraryChoice of standard population is arbitrary
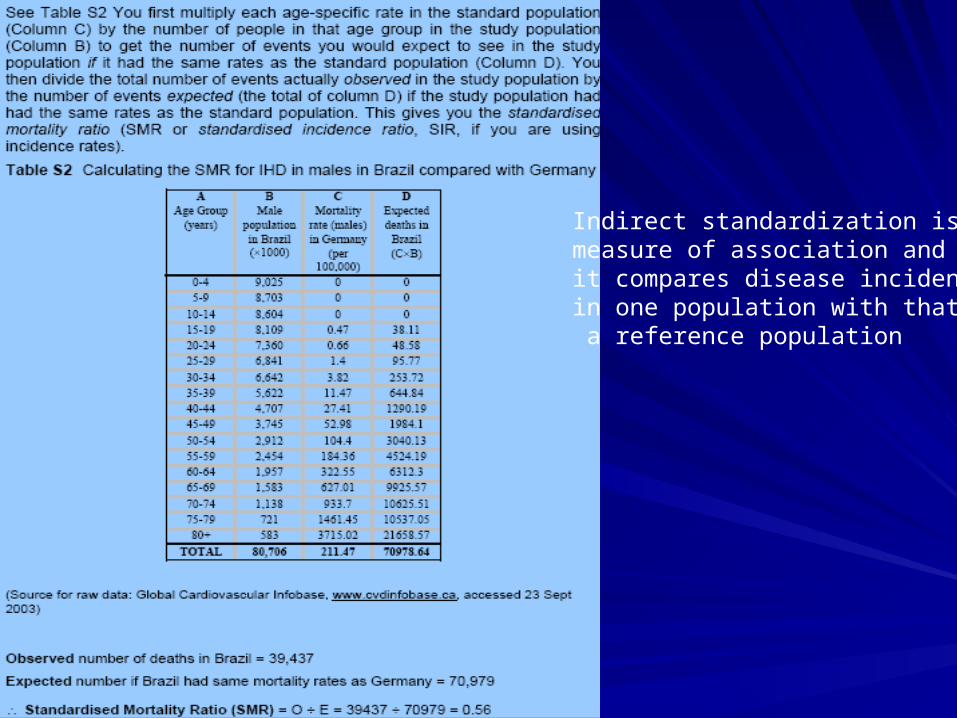
Indirect standardization is measure of association andit compares disease incidencein one population with that in a reference population

Proportional mortality ratio (PMR)Proportional mortality ratio (PMR)
Similar to SMR-relative importance of a Similar to SMR-relative importance of a particular cause of death in a given particular cause of death in a given population to another population. population to another population.
ExampleExample– Death among electrical workers on Death among electrical workers on
construction sites in the USA: 127 of the total construction sites in the USA: 127 of the total of 31068 deaths (0.4%). This is 12 times of 31068 deaths (0.4%). This is 12 times higher than the proportion of such death in higher than the proportion of such death in generel population of USgenerel population of US
Other measuresOther measures
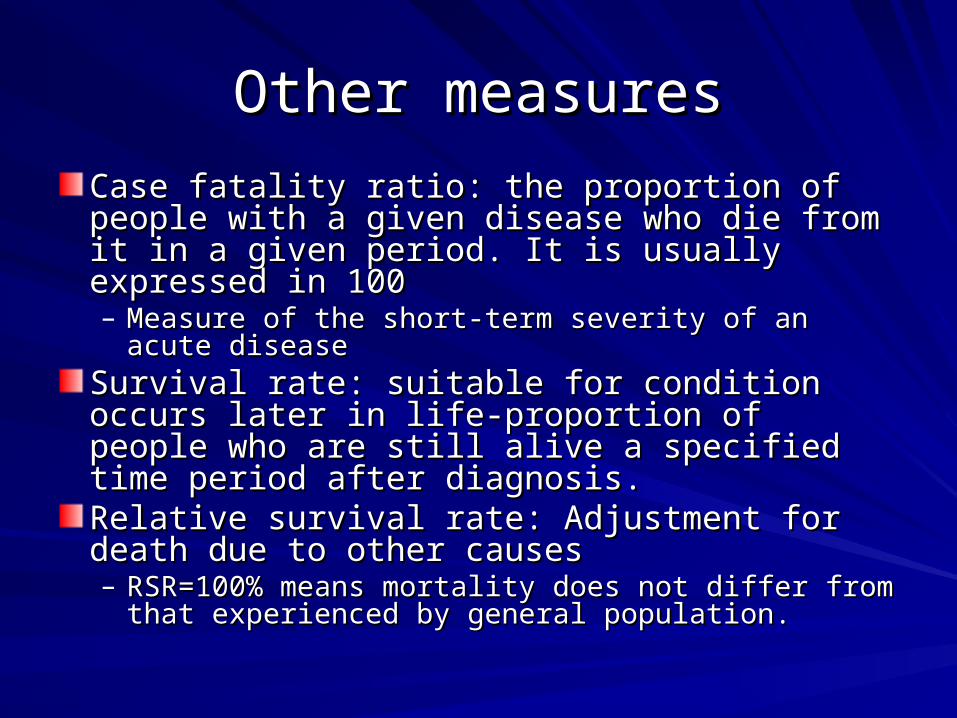
Case fatality ratio: the proportion of people with Case fatality ratio: the proportion of people with a given disease who die from it in a given period. a given disease who die from it in a given period. It is usually expressed in 100It is usually expressed in 100– Measure of the short-term severity of an acute Measure of the short-term severity of an acute
diseasedisease
Survival rate: suitable for condition occurs later Survival rate: suitable for condition occurs later in life-proportion of people who are still alive a in life-proportion of people who are still alive a specified time period after diagnosis.specified time period after diagnosis.Relative survival rate: Adjustment for death due Relative survival rate: Adjustment for death due to other causesto other causes– RSR=100% means mortality does not differ from that RSR=100% means mortality does not differ from that
experienced by general population.experienced by general population.
Other measuresOther measures
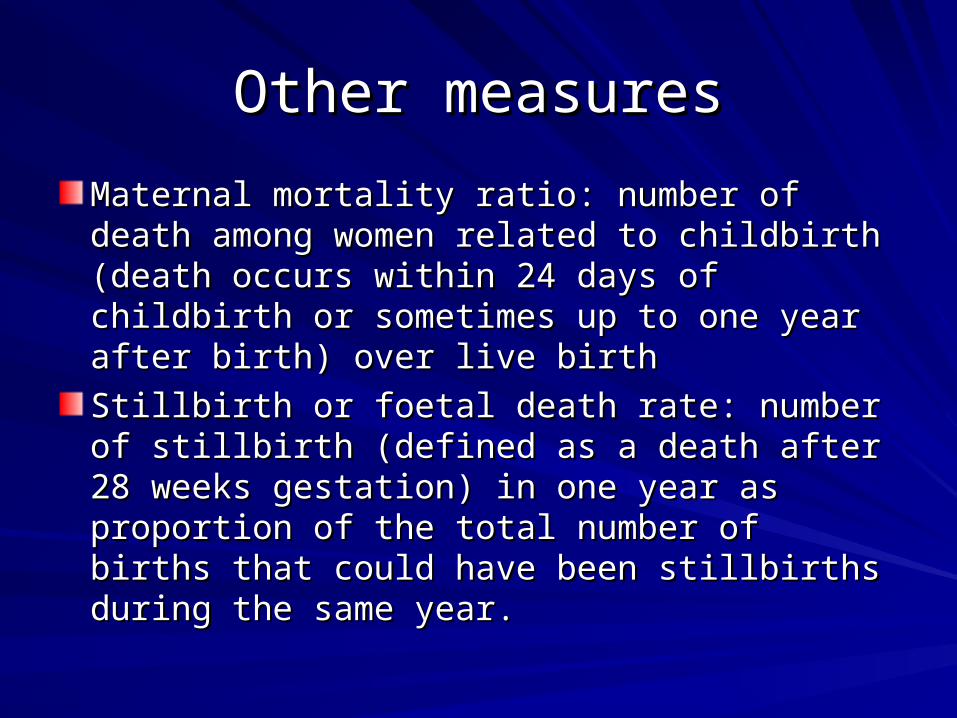
Maternal mortality ratio: number of death among Maternal mortality ratio: number of death among women related to childbirth (death occurs within women related to childbirth (death occurs within 24 days of childbirth or sometimes up to one 24 days of childbirth or sometimes up to one year after birth) over live birthyear after birth) over live birth
Stillbirth or foetal death rate: number of stillbirth Stillbirth or foetal death rate: number of stillbirth (defined as a death after 28 weeks gestation) in (defined as a death after 28 weeks gestation) in one year as proportion of the total number of one year as proportion of the total number of births that could have been stillbirths during the births that could have been stillbirths during the same year.same year.

Other measuresOther measures
Perinatal mortality rate: death after 28 Perinatal mortality rate: death after 28 weeks gestation plus the number of weeks gestation plus the number of deaths within seven days of birth, as a deaths within seven days of birth, as a proportion of the total number of foetal proportion of the total number of foetal deaths and live births.deaths and live births.Neonatal mortality rate: number of deaths Neonatal mortality rate: number of deaths in children aged less than 28 days in a in children aged less than 28 days in a given year, as a proportion of the number given year, as a proportion of the number of live births in the same year.of live births in the same year.

Other measuresOther measures
Infant mortality rate: number of deaths of Infant mortality rate: number of deaths of children aged less than one year in a children aged less than one year in a given year, as a proportion of all live births given year, as a proportion of all live births in the same year.in the same year.
Child death rate: Total number of deaths in Child death rate: Total number of deaths in children aged between one and four in one children aged between one and four in one year over the average number of children year over the average number of children of the same age in the population.of the same age in the population.


Thank youThank you