morphologic and allozyme analyses of european anchovy engraulis
TRANSCRIPT

ISSN: 0001-5113AADRAY
UDC: 597.541:591.1(262.5+262.53+262.4)597.541:591.15(262.5+262.53+262.4)
ACTA ADRIAT.,50(1): 77 - 90, 2009
Morphologic and Allozyme Analyses of European anchovy (Engraulis encrasicolus (L. 1758)) in the Black, Marmara and
Aegean Seas
Zeliha Erdoğan1*, Cemal Turan2 and Hatice Torcu Koç1
1 University of Balıkesir, Faculty of Science and Arts, Department of Biology, 10145, Çağış Campus, Balikesir, Turkey
* Corresponding author, e-mail: [email protected]
2 Fisheries Genetics Laboratory, Faculty of Fisheries, Mustafa Kemal University, 3200, İskenderun, Hatay, Turkey
The morphologic and genetic variations of Engraulis encrasicolus (L. 1758) were studied based on morphometric, meristic and allozyme analyses. Samples were collected throughout the Black, Marmara and Aegean Seas. Discriminant function analysis of both morphometric and meristic char-acters indicated the existence of four morphologically differentiated groups of E. encrasicolus. The Aegean Sea and Marmara Sea samples were the most isolated from all others for morphometric and meristic characters. Genetic analyses indicated great variability but suggested low levels of differen-tiation in the eastern Black Sea samples. However, the low genetic distance between this and other samples suggests the existence of hybridization between the Azov and eastern Black Sea populations. Nonetheless, genetic analysis showed that these levels were significant and the population structure should be analysed using markers able to detect a greater degree of population differentiation.
Key words: population structure, anchovy, Engraulis encrasicolus, morphological variation, allozyme
INTRoDUCTIoN
Marine pelagic fish tend to be distribut-ed over extensive geographic areas where no clear geographic and oceanographic barriers are present. Stocks are distributed over a continuum of environmental conditions, as they migrate and mature at different sizes, spawn at more than one location and period, recruit in different periods and sizes, feed, grow and survive (BEGG et al., 1999). To manage a fishery effectively, it is important to understand the stock structure of a species and how fishing effort and mortality are distributed (GRIMES et al., 1987).
Various stock identification techniques have been employed to elucidate the temporal and spatial discreteness of fish stocks (IHSSEN et al., 1981; MACLEAN & EVANS, 1981; NELSON et al., 1989; PAWSON & JENNINGS, 1996; AYVAZIAN et al., 2004). Morphometrics and meristics are the two types of morphologic characters that have been most frequently used to delineate stocks of a variety of exploited fish species (MURTA, 2000; SILVA, 2003; O’REİLLY & HORN, 2004; TURAN, 2004; TURAN et al., 2006). Allozyme electrophoresis has long been used to discriminate between fish stocks that are genetically isolated to varying extents (AYVAZIAN et al., 2004; RYMAN & UTTER, 1987; AVISE, 1994).

78 ACTA ADRIATICA, 50(1): 77 - 90, 2009
The European anchovy, (Engraulis encra-sicolus (L., 1758)) is a shoaling clupeoid fish, distributed along the eastern Atlantic coast from Scandinavia to western Africa, and also found in the Mediterranean, Black and Azov Seas (WHITE-HEAD et al., 1988). However, recent evidence sug-gested that its distribution may extend as far south as Southern Africa, as well as in a portion of the Indian Ocean (GRANT & BOWEN, 1998; BORSA et al., 2004). As a consequence of its broad distribu-tion and the existence of oceanographic barri-ers, the species may be composed of multiple disjunct populations. There have been a number of population structure analyses of E. encrasi-colus carried out in Mediterranean and Atlantic waters which report morphometric and genetic differences between populations (SPANAKIS et al., 1989; BEMBO et al., 1996a, b; MAGOULAS et al., 1996; PLA et al., 1996; TUDELA, 1999; TUDELA et al., 1999; BOUCHENAK-KHELLADI et al., 2008; SANZ et al., 2008; KRISTOFFERSEN & MAGOULAS, 2008).
Although extensive biological and fisher-ies studies on anchovy have been carried out in Turkish waters (OZDAMAR et al., 1994; DUZ-GUNES & KARACAM, 1989; MUTLU et al., 1993; GOZLER & CILOGLU, 1998; CIHANGIR & USLU, 1992; CIHANGIR, 1994; KIDEYS et al., 1999) there is limited information available on the popula-tion structure of anchovy in Turkish waters. The status of populations of anchovy in Turkish seas was preliminary investigated using morpho-metric characters by TURAN et al. (2004) which revealed a high degree of dissimilarity among the anchovy populations.
In Turkish waters, E. encrasicolus supports a large fishery in the Black Sea and comprises 63% of the total Turkish catch of this species and
represents about 80% of the total fish production in the Black Sea (CIHANGIR & TIRAŞIN, 1991). The relative contribution of E. encrasicolus to local fisheries similarly follows for the Marmara Sea and Aegean Sea. In this context, the evaluation of the exchange of individuals along the Turkish coast is important for fisheries management.
The aims of this study are to (1) examine the population genetic structure of anchovy using allozyme electrophoresis from throughout its range, focusing on the Black Sea, and (2) to com-pare the population structure based on morpho-metric characters using the “Truss network sys-tem” and meristic characters from Turkish seas.
MATERIAL AND METhoDS
Sample
A total of 300 anchovy specimens were collected by commercial fishing vessels from six fishing areas, three from the Black Sea (Trabzon, Sinop, Istanbul), one from the Mar-mara Sea (Bandırma Gulf) and two from the Aegean Sea (Edremit Gulf, Izmir Gulf) between November 2001 and January 2002 (Table 1; Fig. 1). Following the capture, samples were placed individually into plastic bags and were kept deep-frozen (-20 °C) until transportation to the laboratory. Samples of white muscle were removed from individuals and stored at –80 °C until further treatment for allozyme analysis.
Morphometric and meristics
Morphometric and meristic data were col-lected from all samples. Sex was determined
Table 1. Sampling details of E. encrasicolus used in this study
Sampling area Abbreviation Sample size Sex (M/F) Mean STL Range of STL
Eastern Black Sea (Trabzon) BS1 50 28/22 10.48±0.07 9.45-11.7
Central Black Sea (Sinop) BS2 50 16/34 10.04±0.09 8.75-11.35
Western Black Sea (Istanbul) BS3 50 11/39 10.28±0.06 9.35-11.05
Marmara Sea (Bandırma) MS 50 43/7 11.34±0.06 10.5-12.1
Northern Aegean Sea (Edremit) AS1 50 16/34 10.34±0.05 9.5-11.2
Aegean Sea (İzmir) AS2 50 18/32 10.14±0.06 9.15-11.45

79Erdoğan et al.: Morphologic and Allozyme Analyses of the European anchovy
macroscopically whenever possible (Table 1). Morphometric data were collected using the “Truss network system”. Data points were arranged in “trusses” around the fish (Fig. 2), a layout which maximises the number of measure-ments and increases the sensitivity of the analy-sis (STRAUSS & BOOKSTEIN, 1982). Fish were laid out on a piece of polystyrene board and fixed into position by the insertion of pins along the body. This enabled accurate and consistent measurements. Each landmark was obtained by piercing the acetate sheet with a dissecting needle, defining 12 landmarks. Additional data, such as eye diameter (ED), head width (HW), pectoral fin length (PL) and pectoral fin width (PW) were also recorded. Measurements were
made to the nearest 0.01 mm using calipers. Meristic counts were made of six meristic body characters: pectoral (P), anal (A), ventral (V) and dorsal (D) fin rays and upper (UGR) and lower (LGR) gill rakers. All the meristic counts were made under a binocular microscope.
Separate statistical analyses were conducted on the morphometric and meristic data. Char-acter differences among populations were ana-lysed using univariate and multivariate statistics. One-way analysis of variance (ANOVA) was per-formed for the comparison of the morphometric differences between the two sexes. Co-variation of characters was investigated by multivariate analysis of variance (MANOVA). Most of the vari-ability in a set of multivariate characters is due
Fig. 1. Sampling locations of anchovy. Abbreviations of the locations are given in Table 1
Fig. 2. Locations of the 12 landmarks for constructing the truss network on E. encrasicolus illustrated as black dots and morphometric distance measures between the dots as lines

80 ACTA ADRIATICA, 50(1): 77 - 90, 2009
to size (JUNGUERA & PEREZ-GANDARAS, 1993). Thus, shape analysis should be free from the effect of size to avoid misinterpretation of the results (STRAUS, 1985). No significant correla-tions were observed between meristic character-istics and standard length of samples. However, significant correlations were observed between size and morphometric characteristics between the samples. Therefore, transformation of abso-lute measurements to size-independent shape variables was the first step of the analyses. In order to eliminate any variation resulting from allometric growth, all morphometric measure-ments were standardised according to ELLIOTT et al. (1995).
Madj =M (Ls/Lo) b
where M is the original morphometric meas-urement, Madj is the size-adjusted measurement, Lo is the standard length of fish, and Ls is the overall mean of standard length for all fish from all samples for each variable.
The parameter b was estimated for each character from the observed data as the slope of the regression of log M against log Lo, using all specimens.
Correlation coefficients between trans-formed variables and standard length were cal-culated to check if the data transformation was effective in removing the effect of size from the data. The standardised truss measurements showed no significant correlation with standard length. Therefore, the size effect had been suc-cessfully removed with the allometric transfor-mation. Discriminant function analysis (DFA) was used to determine the dissimilarity between populations. The statistical packages SPSS and Statistica for Windows were used for the statisti-cal analyses.
Allozyme
The samples (BS1, Trabzon; BS3 Istan-bul; MS, Bandırma; AS2, Izmir) that showed morphologic differentiation were chosen for genetic analysis. Allozyme analysis was car-ried out employing standard horizontal starch-
gel electrophoresis (MORITZ & HILLS, 1990). Nomenclature for enzyme loci and allele des-ignation follows according to SHAKLEE et al. (1990). After an enzyme screening program, two enzymes comprising two putative loci that produced well-resolved staining patterns con-sistent with known enzyme sub-unit structures were routinely examined. The enzymes used were: glycerol-3-phosphate dehydrogenase (G3PDH*, E.C. 1.1.1.8) and phosphoglucose mutase (PGM*, E.C. 5.4.2.2). Alleles were scored according to their mobility relative to the most commonly observed allele which was designated as *100. A locus is considered polymorphic if the frequency of the most com-mon allele does not exceed 0·99 (P0.99) or 0.95 (P0.95). Nei’s genetic distances were used to estimate genetic relationships between species using the neighbour-joining (SAITOU & NEI, 1987) method. A dendrogram to illustrate the genetic divergence among the examined popu-lations was constructed from genetic distances using the unweighted pair-group method using arithmetic means (UPGMA) (SNEATH & SOKAL, 1973). Robustness of nodes in the neighbour-joining tree was evaluated by bootstrapping over samples (FELSENSTEIN, 1985). All calcula-tions were performed using TFPGAv1.3 (MILL-ER, 1997) and BIOSYS Release 1.7 (SWOFFORD & SELANDER, 1989).
RESULTS
Morphometric
Univariate statistics (ANOVA) showed no statistical differences between males and females for morphometric and meristic vari-ables (P>0.05), so sexes were pooled in further analysis.
In discriminant function analysis, the first canonical function accounted for the largest amount of between–group variability (46%) while the second and third accounted for 23% and 12% respectively. Plotting DF1 and DF2 explained 69% of the between-group variation and revealed clear between-population differ-ences (Fig. 3). The Aegean Sea samples (AS1 &

81Erdoğan et al.: Morphologic and Allozyme Analyses of the European anchovy
AS2) were the most isolated from each other and from all other samples. The western Black Sea sample (BS3) was also clearly separated from the other Black Sea samples, but was closer to the Marmara Sea sample (MS). The middle (BS2) and eastern Black (BS1) sea samples were overlapping together.
The important discriminative characters in distinguishing between the groups for the first and second discriminant functions were from the body height measurements (3-9) (Table 2). Using these morphometric characters each spec-imen could be classified correctly to the original populations with an accuracy of 77% (Table 3). The proportion of those correctly classified into their original group was highest (100%) for the Aegean Sea sample (AS2).
Fig 3. Discriminant function analysis plot with 95% confidence ellipses for morphometric analysis
Table 2. Results of discriminant function analysis (DFA). (variables ordered by activity degrees in distinguishing of populations)
FunctionCharacters DF1 DF2 DF3 DF4 DF5 DF6 DF7
3-9 0.870 -0.110 -0.022 0.072 0.004 0.009 -0.0371-11 0.866 0.121 0.237 -0.086 0.140 0.018 0.0034-8 0.856 -0.146 0.009 0.062 0.013 -0.002 0.0342-10 0.850 0.063 0.066 0.231 0.034 -0.063 -0.0339-10 0.804 -0.100 -0.122 0.062 -0.066 0.081 0.0234-9 0.803 -0.245 -0.126 0.116 -0.052 -0.016 0.0311-12 0.800 0.060 0.240 -0.193 -0.099 0.037 -0.0323-11 0.764 -0.070 -0.090 0.281 -0.168 -0.042 -0.0452-3 0.756 0.066 -0.051 0.191 -0.062 0.022 0.0484-10 0.743 -0.123 -0.025 0.128 -0.204 0.145 -0.0065-9 0.634 0.199 -0.239 -0.131 0.117 0.022 0.0064-5 0.632 0.215 -0.299 -0.073 0.190 -0.001 0.020HW 0.631 -0.570 0.006 -0.264 0.025 -0.024 -0.0292-11 0.618 0.113 0.376 0.064 0.070 0.123 0.11810-11 0.600 0.010 0.023 0.308 -0.068 -0.162 0.1845-8 0.593 0.454 -0.504 -0.163 0.128 -0.002 -0.0201-2 0.585 0.192 0.322 -0.393 -0.063 -0.113 -0.081ED 0.549 0.319 0.284 -0.097 -0.192 -0.193 -0.0262-12 0.517 0.388 0.420 -0.263 -0.148 0.020 -0.0237-8 0.515 0.502 -0.501 -0.204 0.086 -0.008 -0.050PW -0.296 0.838 0.111 0.238 -0.065 0.037 0.008PL 0.645 -0.653 -0.091 -0.140 0.037 -0.026 -0.006
3-10 0.208 0.125 -0.088 0.471 -0.379 0.167 0.17611-12 0.341 0.127 0.143 0.174 0.591 0.002 0.0973-4 0.0455 -0.022 0.134 0.035 0.210 0.857 -0.3165-7 0.0650 0.0262 -0.100 -0.292 -0.230 0.332 0.7558-9 0.0139 -0.06364 0.218 0.248 0.441 -0.152 0.484
82 ACTA ADRIATICA, 50(1): 77 - 90, 2009
Meristics
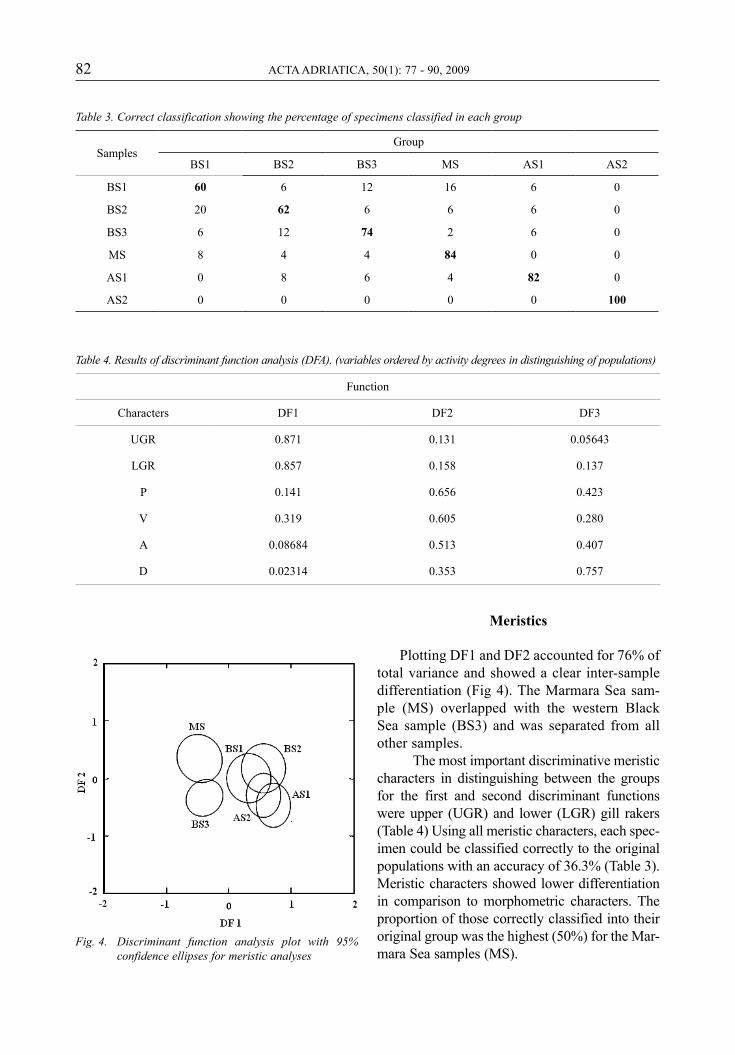
Plotting DF1 and DF2 accounted for 76% of total variance and showed a clear inter-sample differentiation (Fig 4). The Marmara Sea sam-ple (MS) overlapped with the western Black Sea sample (BS3) and was separated from all other samples.
The most important discriminative meristic characters in distinguishing between the groups for the first and second discriminant functions were upper (UGR) and lower (LGR) gill rakers (Table 4) Using all meristic characters, each spec-imen could be classified correctly to the original populations with an accuracy of 36.3% (Table 3). Meristic characters showed lower differentiation in comparison to morphometric characters. The proportion of those correctly classified into their original group was the highest (50%) for the Mar-mara Sea samples (MS).
Table 4. Results of discriminant function analysis (DFA). (variables ordered by activity degrees in distinguishing of populations)
Function
Characters DF1 DF2 DF3
UGR 0.871 0.131 0.05643
LGR 0.857 0.158 0.137
P 0.141 0.656 0.423
V 0.319 0.605 0.280
A 0.08684 0.513 0.407
D 0.02314 0.353 0.757
Fig. 4. Discriminant function analysis plot with 95% confidence ellipses for meristic analyses
Table 3. Correct classification showing the percentage of specimens classified in each group
SamplesGroup
BS1 BS2 BS3 MS AS1 AS2
BS1 60 6 12 16 6 0
BS2 20 62 6 6 6 0
BS3 6 12 74 2 6 0
MS 8 4 4 84 0 0
AS1 0 8 6 4 82 0
AS2 0 0 0 0 0 100

83Erdoğan et al.: Morphologic and Allozyme Analyses of the European anchovy
Table 5. Correct classification showing the percentage of specimens classified in each group
SamplesGroup
BS1 BS2 BS3 MS AS1 AS2
BS1 32 6 12 20 18 12
BS2 14 26 12 14 18 16
BS3 14 0 36 24 10 16
MS 10 6 14 50 6 14
AS1 18 4 8 10 32 28
AS2 16 8 8 10 16 42
Table 6. Allele frequencies at polymorphic loci and genetic diversity parameters in E. encrasicolus
Mean heterozygosity
PopulationMean sample size per
locusMean no. of alleles
per locusDirect count
(Ho)Expected
(HE)
BS115
(0.0)2
(0.0)0.067
(0.000)0.329
(0.041)
BS315
(0.0)1
(0.0)0.000
(0.000)0.000
(0.000)
MS15
(0.0)1
(0.0)0.000
(0.000)0.000
(0.000)
AS215
(0.0)1
(0.0)0.000
(0.000)0.000
(0.000)
Table 7. Frequencis of alleles found fo each locus among the samples of E. encrasicolus
Locus Alleles BS1 BS3 MS AS2
n 15 15 15 115 15
G3PDH100156
0.7670.233
1.0000.000
1.0000.000
1.0000.000
PGM10050
0.8330.167
1.0000.000
1.0000.000
1.0000.000
Allozyme
Two loci, G3PDH and PGM, were polymor-phic in eastern Black Sea (BS1) samples. The mean number of alleles per locus was 2. The values of observed mean heterozygosity (Ho) was 0.067, and the expected mean heterozygosity (He)
was 0.329 (Table 5). These two loci significantly deviated from the Hardy-Weinberg equilibrium (P<0.001). Allelic frequencies for the two scored polymorphic loci are listed in Table 6.
NEI’s (1978) genetic distance (D) between the eastern Black Sea (BS1) and the other samples was found to be 0.024 (Table 7). The eastern

84 ACTA ADRIATICA, 50(1): 77 - 90, 2009
Black Sea population (BS1) appeared to be in genetic differentiation. This differentiation was also clearly illustrated in the dendrogram derived from UPGMA cluster analysis (Fig 5).
DISCUSSIoN
The results obtained from body morphomet-rics and meristics in this work indicate the exist-ence of morphologically differentiated groups of E. encrasicolus in Turkish territorial waters. On the other hand, genetic analysis showed indica-tions of differentiation of the eastern Blacks Sea samples from Trabzon (BS3).
Marmara Sea (MS) samples exhibited a marked separation from all others for both mer-istic and biological characters. On the other hand, there is notable intermingling between the Marmara and neighbouring population from the Black Sea (BS3). The Marmara Sea is the pas-sageway between the Black Sea and Aegean Sea, and currents or water masses play an important role in its environmental conditions (e.g. tem-perature, salinity, food). Most authors agree that environmental conditions play the largest part in
determining morphological variation (WINANS, 1984). Hence the variation observed in Marmara Sea samples (MS) may be attributable to the productivity and temperature differences within this sea, presumably representing growth and development in contrasting waters. Many papers have reported that the final number of struc-tures achieved by meristic attribute is determined by the environmental characteristics prevailing during a critical stage in the development of the individuals, during which they are more phenotypically influenced by the environment (TUDELA, 1999). On the other hand, the detected pattern of phenotypic discreteness between the samples may suggest that the phenetic relation-ship between the populations increases with geographical distance. In Turkish coastal waters, Black Sea anchovy migrates into the Marmara Sea in autumn to overwinter and migrates back into the Black Sea for feeding and spawning in spring (DEMIR, 1974; DANILEVSKY, 1961). It is possible that the Marmara Sea anchovy behave similarly in that they migrate during summer into the Black Sea and spawn along the Turkish coast (GORDINA et al., 1997).
The detected genetic differentiation in two loci for the eastern Black Sea population (BS1) may indicate that there may be a genetically dif-ferent population in Turkish territorial waters. According to some researchers, Azov anchovy migrates through the Kerch Strait between the Azov Sea and the Black Sea for feeding and may form a hybrid with the Black Sea anchovy (GORDINA et al., 1997; CHASHCHIN, 1985). At times of unfavourable food conditions the Black Sea anchovy migrates to the Azov Sea to feed, and in some years it also spawns there (GORDINA et al., 1997; DANILEVSKY, 1960). In a number of preced-
Fig. 5. UPGMA dendrogram showing genetic distance between anchovy samples, based on Nei, 1978. Bootstrap value is given on the node
Table 8. Nei’s (1978) genetic distance (D ) between four populations of anchovy based on allozyme analyses
Population BS1 BS3 MS AS2
BS1
BS3 0.024
MS 0.024 0.000
AS2 0.024 0.000 0.000

85Erdoğan et al.: Morphologic and Allozyme Analyses of the European anchovy
ing papers (DANILEVSKY, 1960; ALTUKHOV, 1974; MARTY, 1980) an overlapping of the ranges of Azov and Black Sea anchovy was noted. In win-ter individuals of both races are frequently fished in the same areas. Even in summer they can both be caught in the Sea of Azov, where juveniles of Black Sea anchovy enter to feed. They also co-inhabit less saline waters in the northwest Black Sea accessible to Azov anchovy (CHASCHIN, 1996). Several researchers have reported popula-tion differences within and between the Black Sea and Azov anchovy. ALTUKHOV et al. (1969) found differences based on immunological anal-yses between the Black Sea and Azov anchovy. KALNIN & KALNINA (1984, 1985) found significant differences between the Azov and Black Sea and suggested that there are two distinct popula-tions of anchovy in the Black Sea. IVANOVA & DOBROVOLOV (2006) found genetic divergence between the Azov and the Black Sea anchovy populations and suggest that Azov and Black Sea anchovy belong to different populations.
In our study, NEI’s (1978) genetic distance (D) between the eastern Black Sea (BS1) and the other samples was found to be 0.024. TUDELA et al. (1999), found genetic homogeneity in anchovy reproducing between southern Catalonia and Tuscan archipelago (genetic distance D less than 0.001), and concluded that they belonged to a single genetic population. This conclusion leads us to suggest an environmental basis for the morphologic differences described in the present study. A high degree of morphologic differences lacking geographical basis and independent of genetic population structure (SPANAKIS et al., 1989; TUDELA, 1999) has also been reported in Engraulis mordax.
In the present study, the observed mean het-erozygosity (Ho) was 0.067 and that was similar to values for E. japonicus. Genotypic propor-tions deviated significantly from the Hardy-Weinberg equilibrium (P<0.001) in the eastern Black Sea (BS1) samples. This may be the result of selective forces against heterozygotes in the system (ARCULEO et al., 2003).
In summary, the observed morphometric and meristic differentiation between the stocks indicate that there is stock structuring of ancho-vy in Turkish territorial waters that is in agree-ment with the previous morphometric study by TURAN et al. (2004) who reported morphometric differences between the Black and Aegean Seas. However, the genetic basis of this dif-ferentiation was not revealed here. This is most probably due to an insufficient number of loci and genetic techniques used in this study. Although the environmental factors may be governing to some degree the potential pheno-typic differentiation of E. encrasicolus popula-tions, the detected pattern of genetic variation in the eastern Black Sea samples (BS1) suggests that there may be a self-recruiting population or sub-species of anchovy in the Black Sea. Given that existing genetic differentiation seems to be weak, it becomes of great importance to use molecular markers with higher polymorphism, such as microsatellites, which have been able to detect a greater degree of population differen-tiation than allozymes (SHAW et al., 1999). Also, in future studies, analysing a higher number of polymorphic enzymes would increase genetic heterogeneity among the anchovy populations, which may support the detected phenotypic dif-ferentiation.
REfERENCES
ALTUKHOV, Y.P., V.V. LIMANSKY, A.N. PAYUSOVA & K.A. TRUVELLER. 1969. Immunogenetic assay of intraspecies differentiation of the Euro-pean anchovy inhabiting the Black Sea and Sea of Azov. Genetica, 5: 50-64.
ALTUKHOV, Y.P. 1974. Population genetics of fish, Pishchivaia Promyshlennost Pres, Mosco (in Russian), 245p.
ARCULEO, M., S. LO BRUTTO, M. SIRNA-TER-RANOVA, T. MAGGIO, L. CANNIZZAROAG-GIO & N. PARRINELLO. 2003. The stock genetic structure of two Sparidae spe-cies, Diplodus vulgaris and Lithognatus mormyrus, in the Mediterranean Sea. Fish Res., 63: 339-347.
AVISE, J.C. 1994. Molecular markers. Natural
86 ACTA ADRIATICA, 50(1): 77 - 90, 2009
History and Evolution, Chapman & Hall, London. pp. 669.
AYVAZIAN, S.G., T.P. BASTOW, J.S. EDMONDS, J. HOW & G.B. NOWARW. 2004. Stock structure of Australian herring (Arripis georgiana) in southwestern Australia. Fish. Res., 67: 39-53.
BEGG, G.A., K.D. FRIEDLAND & J.B. PEARCE. 1999. Stock identification and its role in stock assessment and fisheries management: an overview. Fish. Res., 43:1-8.
BEMBO, D.G., G.R. CARVALHO, N. CINGOLANI, E. ARNERI, G. GIANNETTI & T.J. PITCHER. 1996a. Allozymic and morphometric evidence for two stocks of the European anchovy Engraulis encrasicolus in Adriatic waters. Mar. Biol., 126: 529-538.
BEMBO, D.G., G.R. CARVALHO, N. CINGOLANI & T.J. PITCHER. 1996b. Electrophoretic analysis of stock structure in Northern Mediterranean anchovies, Engraulis encrasicolus. ICES J. Mar. Sci., 53: 115-128.
BORSA, P., A. COLLET & J.D. DURAND. 2004. Nucle-ar-DNA markers confirm the presence of two anchovy species in the Mediterranean. C. R. Biol., 327: 1113-1123.
BOUCHENAK-KHELLADI, Y., J.D. DURAND, A. MAGOULAS & P. BORSA. 2008. Geographic structure of European anchovy: A nuclear-DNA study. J. Sea Res., 59: 269-278.
CHASHCHIN, A.K. 1985. Changes in the popula-tion structure of anchovy Engraulis encra-sicolus of the Azov-Black Sea Basin. J. Ichthyol., 25(5): 9-15.
CHASCHIN, A.K. 1996. The Black Sea populations of anchovy. Sci. Mar., 60: 219-225.
CIHANGIR, B. & E.M. TIRAŞIN. 1991. Assessment of sardine and anchovy fisheries in Turkish waters of the Black Sea, the Sea of Marma-ra, the Aegean Sea and the Mediterranean, International Council for the exploration of the Sea”, CM1991/H:on pelagic fish Com-mitee session, 57-64.
CIHANGIR, B. & B. USLU. 1992. The priliminary study on fecundity of anchovy (Engraulis encrasicolus (L., 1758)) in Aegean Sea. Tr. J. Zool., 16: 301-310.
CIHANGIR, B. 1994. A method for determining the multiple spawner fish (anchovies, sardines) stock during the spawning period: daily egg
production method. Tr. J. Zool., 18:153-160.DANILEVSKY, N.N. 1960. The penetration of the
Black Sea anchovy into the Sea of Azov and concomitant environmental conditions. Tr. NIRO. 18:118-129.
DANILEVSKY, N. N. 1961. Spring migration of the Black Sea anchovy in 1959 and adaptive peculiarities of its spawning populations. Proc Azov-Black Sea Mar Sci Res Inst Fish Oceanogr. 19: 75-87.
DEMIR, N. 1974. The pelagic eggs and larvae of teleostean fishes in Turkish waters. II. Engraulidae. University of İstanbul, Faculty of Science, Ser. B, 39(1-2): 49-66.
DUZGUNES, E. & H. KARACAM. 1989. Investigation on some population parameters and growth characteristics of anchovy (Engraulis encra-sicolus L., 1758) in the Black Sea. Tr. J. Zool., (13): 77-83.
ELLIOT, N.G., K. HASKARD & J.A. KOSLOW. 1995. Morphometric analysis of orange roughy (Hoplostethus atlanticus) off the continental slope of southern Aust. J. Fish Biol., 46: 202-220.
FELSENSTEIN, J., 1985. Confidence limits on phy-logenies: An approach using the bootstrap. Evolution, 39: 783-791.
GORDINA, A.D., V.N. NIKOLSKIY, U. NIERMANN, F. BINGEL & A.A. SUBBOTIN. 1997. New data on the morphological differences of anchovy eggs (Engraulis encrasicolus L.) in the Black Sea. Fish. Res., 31:139-145.
GOZLER, A M. & E. CILOGLU. 1998. A research on some population parametres of european anchovy (Engraulis encrasicolus L., 1758) caught in the Rize- Hopa coasts (in Turk-ish). Eastern Anatolia Ragion III Fisheries Semp. 10-12 June 1998, Erzurum, Turkey, 373-383.
GRANT, W.S. & B.W. BOWEN. 1998. Shallow popu-lation histories in deep evolutionary lineages of marine fishes: insights from sardines and anchovies and lessons for conservation. J. Hered., 89: 415-426.
GRIMES, C.B., A.G. JOHNSON & W.A. FABLE. 1987. Delineation of king mackerel (Scombero-morus cavalla) stocks along the US east coast and in the Gulf of Mexico. In: H.E. Kumpf,

87Erdoğan et al.: Morphologic and Allozyme Analyses of the European anchovy
R.N. Vaught, C.B. Grimes, A.G. Johnson & E.L. Nakamura (Editors). Proceedings of the Stock Identification Workshop, 5-7 Novem-ber 1985, Panama City Beach, FL. NOAA Tech. Memorandum NMFS±SEFC-199. US Government Printing Office, 186-187.
IHSSEN, P.E., H.E. BOOKE, J.M. CASSELMAN, J.M. MCGLADE, N.R.. PAYNE & F.M. UTTER. 1981. Stock Identification: materials and methods. Can. J. Fish. Aquat. Sci., 38: 1838-1855.
IVANOVA, P.P. & I.S. DOBROVOLOV. 2006. Popula-tion-genetic structure on European anchovy (Engraulis encrasicolus, Linnaeus, 1758) (Osteichthyes:Engraulidae) from Mediterra-nean Basin and Atlantic Ocean. Acta Adriat., 47(1): 13-22.
JUNGUERA, S. & G., PEREZ-GANDARAS. 1993. Pop-ulation diversity in Bay of Biscay anchovy (Engraulis encrasicolus L., 1785) as revealed by multivariate analysis of morphometric and meristic characters. ICES J. Mar. Sci., 50: 383-391.
KALNIN, V.V. & O.V. KALNINA. 1984. Gene dif-ferentiation and reletions between the Azov and Black Sea races of the European ancho-vy. Genetika, 20: 309-313.
KALNIN, V.V. & O.V. KALNINA. 1985. Gene dif-ferentiation and reletions between the Azov and Black Sea races of the European ancho-vy. Genetika, 21: 1352-1360.
KIDEYS, A.E., A.D. GORDINA, F. BINGEL & U. NIER-MANN. 1999. The effect of environmental conditions on the distribution of eggs and larvae of anchovy (Engraulis encrasicolus L.) in the Black Sea. ICES J. Mar. Sci., 56: 58-64.
KRISTOFFERSEN, J.B. & A. MAGOULAS. 2008. Population structure of anchovy Engraulis encrasicolus L. in the Mediterranean Sea inferred from multiple methods. Fish. Res., 91:187-195.
MACLEAN, J.A. & D.O. EVANS. 1981. Stock con-cept, discreteness of fish stocks and fisheries management. Can. J. Fish. Aquat. Sci., 38: 1889-1898.
MAGOULAS, A., N. TSIMENIDES & E. ZOUROS. 1996. Mitochondrial DNA phylogeny and the reconstruction of the population history of a species: the case of the European anchovy
(Engraulis encrasicolus). Mol. Cell Biol., 13(1): 178-190.
MARTY, Y.Y. 1980. Migrations of the marine fish, Pishchevaia Promyshlennost Pres, Moscow, 248 p.
MILLER, M.P. 1997. Tools for population genet-ic analyses. A Windows program for the analysis of allozyme and molecular popula-tion genetic data (Version 1.3., Feb 2000). Department of Biological Sciences Northern Arizona University, Flagstaff, AZ, USA.
MORITZ, C. & C. HILLS. 1990. Molecular System-atics: Context and controversies sinauer associates, Sunderland, MA, USA, pp. 1-10.
MURTA, A.G. 2000. Morphological variation of horse mackerel (Trachurus trachurus) in the Iberian and North Africa Atlantic: implica-tions for stock identification. ICES J. Mar. Sci., 57: 1240-1248.
MUTLU, C., E. DUZGUNES & C. SAHIN. 1993. Some populatian parametres of european anchovy (Engraulis encrasicolus L., 1758) in Eastern Black Sea (in Turkish). E. Anatolian Ragion I. Fish. Semp. 23-25 June 1993, Erzurum, Turkey, 423-431.
NELSON, C.S., T.G. NORTHCOTE & C. H. HENDY. 1989. Potential use of oxygen and carbon isotopic composition of otoliths to identify migratory and non-migratory stocks of the New Zealand common smelt: pilot study. N. Z. J. Mar. Freshw. Res., 23: 337-344.
O’REİLLY, K.M. & M.H. HORN. 2004. Phenotypic variation among populations of Atherinops affinis (Atherinopsidae) with insights fom a geometric morphometric analysis. J. Fish. Biol., 64: 1117-1135.
OZDAMAR, E., K. KIHARA, K. SAKURAMATA & I. ERKOYUNCU. 1994. Some biological char-acteristic of european anchovy Engraulis encrasicolus L. in the Black Sea. J. Tokyo Univ. Fish., (81)2: 123-134.
PAWSON, M.G. & S. JENNİNGS. 1996. A critique of methods for stock identification in marine capture fisheries. Fish. Res., 25: 203-217.
PLA, C., S. TUDELA & J.L. GARCIA-MARIN. 1996. Diversity and population structure of the European anchovy in the Mediterranean Sea (Abstract). Sci. Mar., 60(Supl.2): 285-286.
RYMAN, N. & F. UTTER. 1987. Fisheries Manage-

88 ACTA ADRIATICA, 50(1): 77 - 90, 2009
ment, Washington Sea Grant Program. Uni-versity of Washington Press, Sydney, pp. 420.
SAITOU, N. & M. NEI. 1987. The neighbor-joining method: a new method for reconstructing phylogenetic trees. Mol. Biol. Evol. Jul., 4 (4): 406-25.
SANZ, N., J.L. GARCIA-MARIN, J. VINAS, M. ROLDAN & C. PLA. 2008. Spawning groups of European anchovy: population structure and management implications. ICES J. Mar. Sci., 65: 1635-1644.
SHAKLEE, J.B., F.W. ALLENDORF, D.C. MORIZOT & G.S. WHITT. 1990. Gene nomenclature for protein coding loci in fish. Trans. Am. Fish. Soc., 119: 2-15.
SHAW, P., C. TURAN, J. WRIGTH, M. O’CONNELL & G.R. CARVALHO. 1999. Microsatellite DNA analysis of population structure in Atlan-tic herring (Clupea harengus), with direct comparison to allozyme and mtDNA RFLP analyses. Heredity, 83: 490-499.
SILVA, A. 2003. Morphometric variation among sardine (Sardina pilchardus) populations from the northeastern Atlantic and the west-ern Mediterranean. ICES J. Mar. Sci., 60: 1352-1360.
SNEATH, P. H. A. & R.R. SOKAL. 1973. Numerical Taxonomy, San Francisco: W. H. Freeman, pp. 573.
SPANAKIS, E., N. TSIMENIDES & E. ZOUROS. 1989. Genetic differences between populations of sardine, Sardina pilchardus, and anchovy, Engraulis encrasicolus, in the Aegean and Ionian seas. J. Fish. Biol., 35: 417-437.
STRAUSS, R. E. & F. L. BOOKSTEIN. 1982. The Truss: body form reconstruction in morpho-metrics. Syst, Zool., 31: 113-135.
STRAUSS, R.E. 1985. Evolutionary allometry and variation in body form in the South Ameri-
can catfish genus Corydoras (Callichthyi-dae). Syst. Zool., 34: 381-396.
SWOFFORD, D.L. & R. B. SELANDER. 1989. BIO-SYS-1, A computer program for the analysis of alellic variation in population genetics and biochemical systematics. Relase, 1.7.
TUDEALA, S. 1999. Morphological variability in a Mediterranean, genetically homogeneous population of the European anchovy, Engrau-lis encrasicolus. Fish Res, 42:229-243.
TUDELA, S., J.L. GARCIA-MARIN & C. PLA. 1999. Genetic structure of the European anchovy, Engraulis encrasicolus L., in the north-west Mediterranean. J. Exp. Mar. Biol. Ecol., 234: 95-109.
TURAN, C. 2004. Stock Identification of mediter-ranean horse mackerel (Trachurus mediter-raneus ) using morphometric and meristic characters. ICES J. Mar. Sci., 61: 774-781.
TURAN, C., D. ERGUDEN, M. GURLEK, N. BASUSTA & F. TURAN. 2004. Morphometric structur-ing of the anchovy (Engraulis encrasicolus L.) in the Black, Aegean and Northeastern Mediterranean Seas. Turk. J. Vet. Anim. Sci., 28: 865-871.
TURAN, C., M. ORAL, B. ÖZTÜRK & E. DÜZGÜNEŞ. 2006. Morphometric and meristic variation between stocks of Bluefish (Pomatomus saltatarix) in the Black, Marmara, Aegean and Northeastern Mediterranean Seas. Fish. Res., 79: 139-147.
WHITEHEAD, P.J.P., G.J. NELSON & T. WONGRA-TANA. 1988. “FAO Species catalogue”, ver, 7, part: Clupeoid Fishes of the World. FAO Fish. Synop., 125-546.
WINANS, G.A. 1984. Mutivariate morphometric variability in Pasific salmon-technical dem-onstration. Can. J. Fish. Aquat. Sci., 41: 1150-1159.
Received: 12 January 2009
Accepted: 3 April 2009

89Erdoğan et al.: Morphologic and Allozyme Analyses of the European anchovy
Morfološka i analiza alozima europskog inćuna (Engraulis encrasicolus (L. 1758)) u Crnom, Mramornom i Egejskom moru
Zeliha Erdoğan1*, Cemal Turan2 i Hatice Torcu Koç1
1 Sveučilište Balıkesir, Fakultet znanosti i umjetnosti, Odsjek za biologiju, 10145, Çağış Campus, Balikesir, Turska
2 Laboratorij genetike riba, Fakultet ribarstva, Sveučilište Mustafa Kemal, 3200, İskenderun, Hatay, Turska
* Kontakt adresa, e-mail: [email protected]
SAŽETAK
Morfološke i genetske varijacije inćuna, Engraulis encrasicolus (L. 1758), su proučavane na osnovu alozima, te morfometričkih i merističkih karakteristika. Uzorci su prikupljeni u Crnom, Mramornom i Egejskom moru. Analiza morfometričkih i merističkih karakteristika je ukazala na postojanje četiri morfološki različite grupe inćuna (E. Encrasicolus). Primjerci iz Mramornog i Egejskog mora su se značanjno razlikovali od drugih primjeraka zbog morfometričkih i merističkih karakteristika. Genetska analiza ukazuje na veliku varijabilnost, ali i na nizak nivo diferencijacije kod uzoraka iz Crnog mora. Niska genetska udaljenost između ovih i drugih primjeraka ukazuje na postojanje hibridizacije između Azovske i populacije istočnog Crnog mora. Usprkos tome što je genetska analiza pokazala da su ovi niovi značajni, struktura populacije bi se trebala analizirati pomoću markera koji bi otkrili veći stupanj raznolikosti populacije.
Ključne riječi: struktura populacije, inćun, Engraulis encrasicolus, morfološke varijacije, alozimi