morgan stanley - reporte semanal - comité global de inversiones
TRANSCRIPT

Please refer to important information, disclosures and qualifications at the end of this material.
GLOBAL INVESTMENT COMMITTEE AUG. 3, 2015
LISA SHALETT
Head of Investment & Portfolio Strategies Morgan Stanley Wealth Management [email protected] +1 212 296-0335
Upcoming Catalysts Aug. 3 US personal income and spending Aug. 3 ISM manufacturing survey Aug. 3 US construction spending Aug. 3 Euro Zone Markit Manufacturing PMI Aug. 4 US factory orders Aug. 4 Euro Zone PPI Aug. 5 ADP National Employment Survey Aug. 5 ISM nonmanufacturing survey Aug. 6 Germany factory orders Aug. 7 US employment report
What We Are Talking About
• Headwinds to Global Growth Will Shift. Global growth has disappointed so far this year; expected stimulus from lower interest rates and lower oil prices hasn’t materially lifted consumption; interaction between slowing in China, broadening weakness in commodities, volatile currencies and widening credit spreads is suppressing the expected rebound in capital investment; our analysis suggests these dynamics are temporary, delaying but not destroying our reflation thesis. Consider using market volatility to selectively add to equity positions in the US, Japan, Europe, India and to China H-shares.
Headwinds to Global Growth Will Shift
At the beginning of 2015, the Global Investment Committee (GIC) economic forecast revolved around global rebalancing and reflation. We made that call based on the belief that stimulative monetary policies from the European Central Bank (ECB) and Bank of Japan as well as rate cuts from more than 30 other central banks would be more than enough to offset the Federal Reserve’s termination of Quantitative Easing and an eventual rate hike; that a halving of oil prices would be a huge boost to the 88% of global GDP that consumes oil; and that the strengthening of the US dollar and resultant weakening of other currencies would rebalance global growth toward newly competitive exporters.
But the wrap-up of the second-quarter earnings season and the release of second-quarter national GDP reports shows global growth has not played to script. What’s more, we at least would have expected to see momentum building for the second half. Instead, the immediate outlook is muddy, causing many economists to downgrade their full-year forecasts. Consider the US, where the 2.3% second-quarter GDP report was a disappointing rebound from a dismal first-quarter GDP of less than 1%. Rather than channel their gas-pump savings into spending, consumers have increased savings. Solid wage gains, long the promise of a tightening job market, have so far been elusive. In Europe, where a much bigger-than-anticipated monetary stimulus from the ECB lowered sovereign rates, accelerated bank credit growth and drove a rebound in growth, consumer confidence has been short-circuited by political chaos around Greece’s potential exit from the Euro Zone. In Japan, efforts to defeat deflation appear successful—June’s core CPI
The GIC Weekly
For additional insight into market performance, sentiment, macro-economic trends and the GIC’s latest thinking, please see the new GIC ChartBook Weekly Digest. Clients: Ask your Financial Advisor for a copy. Advisors: Follow this link.
Please refer to important information, disclosures and qualifications at the end of this material. Aug. 3, 2015 2
THE GIC WEEKLY
reading was 0.6%—corporate governance reforms reignited the equity culture after two dismal decades and corporate earnings gains have been impressive. Still, a worse-than-forecast slowing in pan-Asia trade is threatening growth.
Then there are the emerging markets. Although we expected China’s growth to materially slow to below the 7% official target, we did not expect that officials there would be distracted by an equity bubble gone bad. As we noted last week (see The GIC Weekly, July 27), the decision by officials to intervene in markets at the same time that they are campaigning to internationalize the renminbi—thus holding their currency peg to the strong US dollar—has exacerbated already tight liquidity conditions. This has forced liquidation of commodities stockpiles, making it nearly impossible to read underlying demand. Finally in emerging markets, already weighed down by high debt, investment outflows and the threat of a Fed rate hike, Brazil is falling deeper into recession and teetering on the edge of a sovereign debt downgrade. Given this backdrop, why hasn’t the GIC given up on the rebalancing-and-reflation thesis?
For starters, we believe a complex confluence of factors have suppressed a powerful supply response in commodities, especially oil. These factors, which include free flowing credit, private equity funding and flexibility of fracking-based capacity, are nearly played out. With energy credit spreads now at cycle wides, the price of West Texas Intermediate oil is retesting cycle lows for the third time and with the prospect of Iranian oil coming to market, we are approaching a true inflection point. While across the industry operating expenses have been cut and planned projects have been scrapped, current production has not yet been hit. In fact, total US crude production is still registering year-over-year gains and the correction in rig counts has reversed. While this has meant that the deepest hit to US GDP has likely already occurred, it also suggests that the 50%-to-60% reduction in corporate earnings just reported is not yet fully played out, either. What is different is that the oil futures term structure out until 2017/2018 is now below $60 per barrel and at five-year lows. Opportunities for producers to hedge and lock in higher prices—as was the case earlier this year—are now gone with the “lower for longer” mentality now baked into the futures market. The implication is that there will be more balance sheet and cash flow pain as hedges roll off. We are thus approaching the point at which production capacity should start to decline.
A second factor is the US dollar. The greenback’s strong appreciation has been a significant headwind for commodities beyond oil and, in turn, has constrained both the earnings of US multinationals and their willingness to invest in capital equipment. As we note in Chart of the Week (see page 3), at
extreme levels the US dollar has been inversely correlated with capital spending. But the rate of change is what matters and while the US dollar is likely to continue to move higher because of divergent central bank policies and the dispersion in real rates, the pace of appreciation is slowing. To us, that means the worst implications for capital spending are likely behind us. At current levels, the broad US trade-weighted dollar as measured by the Fed is at its highest level since 2009 and, at nearly 117, is within seven points of its 40-year high.
Third is our more sanguine view on China. Although recent PMI and leading economic indicators suggest continued economic deterioration, we are closer to the bottom of China’s readjustment phase than the top. Confidence in that view stems from a broader reading of the traditional export and manufacturing data that include rail-freight loading, retail spending, electricity consumption and new credit growth. On all those measures, the growth trend is showing stability to improvement and signals an aggregate economy that while it may not be growing at the 7% reported rate, is likely to be slower than 6.5%. To wit, urban unemployment in China is 4%, wages are rising at a 9% annual rate and retail sales are growing at 15% year over year. Services are up at a 8.4% annual rate while manufacturing is now down at 3.5% on an annualized basis. Central bank rate cuts have just begun and there is room for more. Furthermore, the contagion impacts to other emerging markets who export to China have already been registered with big double-digit declines already absorbed by Korea, India, Taiwan and Japan. Thus global trade growth is likely to already be troughing.
Finally, we are reluctant to give up on the global consumers, who are set to benefit from oil prices that are lower for longer. Although global consumer confidence has taken a hit from drama in Greece and the headlines from China, unemployment in most regions continues to trend downward, balance sheets are healing and inflation is not onerous. With little else to absorb the oil windfalls, we think the excess liquidity will find its way to consumption. This should be especially true in the US as residential investment and housing are strengthening.
Bottom Line: Investors are positioned for disappointing global growth, driving extreme performance dispersion between growth and value stocks and defensives versus cyclicals. Our view is that with little sign of recession and positive developments still visible in leading economic indicators, we have a solid opportunity. Watch stabilization in currencies and commodity prices. Consider using market volatility to selectively add to equity positions in the US, Japan, Europe, India and to China H-shares.
Please refer to important information, disclosures and qualifications at the end of this material. Aug. 3, 2015 3
THE GIC WEEKLY
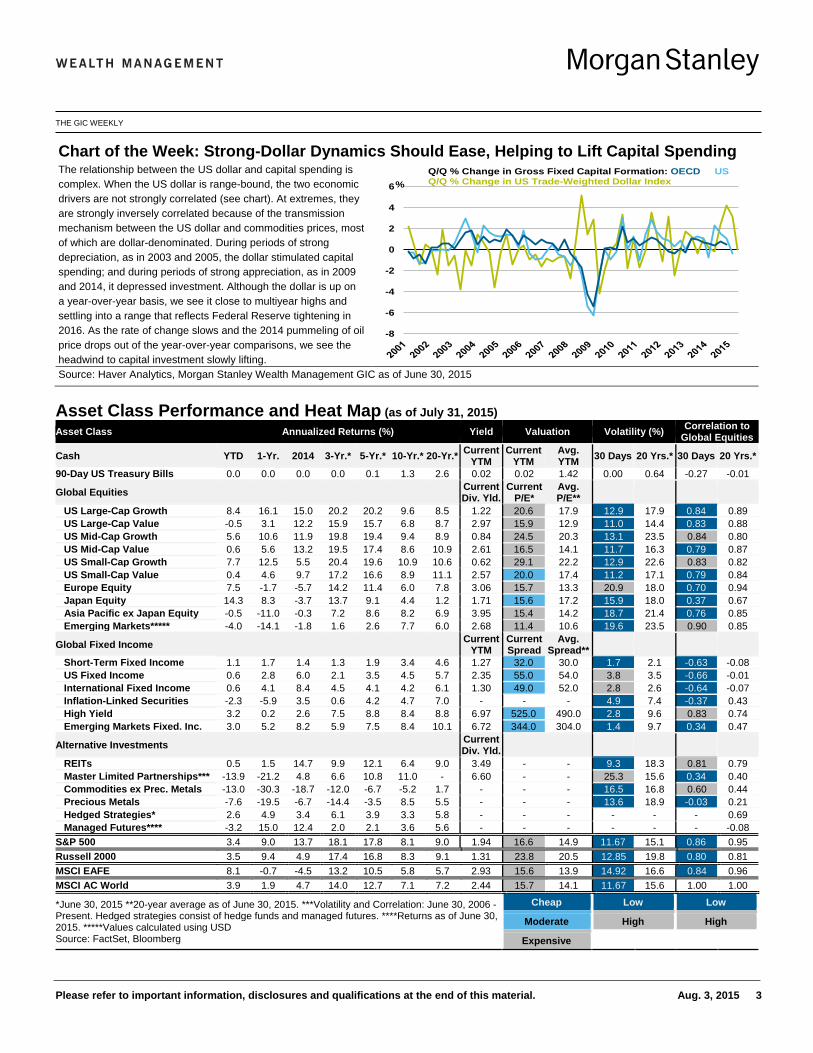
Asset Class Performance and Heat Map (as of July 31, 2015) Asset Class Annualized Returns (%) Yield Valuation Volatility (%) Correlation to
Global Equities
Cash YTD 1-Yr. 2014 3-Yr.* 5-Yr.* 10-Yr.* 20-Yr.* Current YTM
Current YTM
Avg. YTM 30 Days 20 Yrs.* 30 Days 20 Yrs.*
90-Day US Treasury Bills 0.0 0.0 0.0 0.0 0.1 1.3 2.6 0.02 0.02 1.42 0.00 0.64 -0.27 -0.01
Global Equities Current Div. Yld.
Current P/E*
Avg. P/E**
US Large-Cap Growth 8.4 16.1 15.0 20.2 20.2 9.6 8.5 1.22 20.6 17.9 12.9 17.9 0.84 0.89 US Large-Cap Value -0.5 3.1 12.2 15.9 15.7 6.8 8.7 2.97 15.9 12.9 11.0 14.4 0.83 0.88 US Mid-Cap Growth 5.6 10.6 11.9 19.8 19.4 9.4 8.9 0.84 24.5 20.3 13.1 23.5 0.84 0.80 US Mid-Cap Value 0.6 5.6 13.2 19.5 17.4 8.6 10.9 2.61 16.5 14.1 11.7 16.3 0.79 0.87 US Small-Cap Growth 7.7 12.5 5.5 20.4 19.6 10.9 10.6 0.62 29.1 22.2 12.9 22.6 0.83 0.82 US Small-Cap Value 0.4 4.6 9.7 17.2 16.6 8.9 11.1 2.57 20.0 17.4 11.2 17.1 0.79 0.84 Europe Equity 7.5 -1.7 -5.7 14.2 11.4 6.0 7.8 3.06 15.7 13.3 20.9 18.0 0.70 0.94 Japan Equity 14.3 8.3 -3.7 13.7 9.1 4.4 1.2 1.71 15.6 17.2 15.9 18.0 0.37 0.67 Asia Pacific ex Japan Equity -0.5 -11.0 -0.3 7.2 8.6 8.2 6.9 3.95 15.4 14.2 18.7 21.4 0.76 0.85 Emerging Markets***** -4.0 -14.1 -1.8 1.6 2.6 7.7 6.0 2.68 11.4 10.6 19.6 23.5 0.90 0.85
Global Fixed Income Current YTM
Current Spread
Avg. Spread**
Short-Term Fixed Income 1.1 1.7 1.4 1.3 1.9 3.4 4.6 1.27 32.0 30.0 1.7 2.1 -0.63 -0.08 US Fixed Income 0.6 2.8 6.0 2.1 3.5 4.5 5.7 2.35 55.0 54.0 3.8 3.5 -0.66 -0.01 International Fixed Income 0.6 4.1 8.4 4.5 4.1 4.2 6.1 1.30 49.0 52.0 2.8 2.6 -0.64 -0.07 Inflation-Linked Securities -2.3 -5.9 3.5 0.6 4.2 4.7 7.0 - - - 4.9 7.4 -0.37 0.43 High Yield 3.2 0.2 2.6 7.5 8.8 8.4 8.8 6.97 525.0 490.0 2.8 9.6 0.83 0.74 Emerging Markets Fixed. Inc. 3.0 5.2 8.2 5.9 7.5 8.4 10.1 6.72 344.0 304.0 1.4 9.7 0.34 0.47
Alternative Investments Current Div. Yld.
REITs 0.5 1.5 14.7 9.9 12.1 6.4 9.0 3.49 - - 9.3 18.3 0.81 0.79 Master Limited Partnerships*** -13.9 -21.2 4.8 6.6 10.8 11.0 - 6.60 - - 25.3 15.6 0.34 0.40 Commodities ex Prec. Metals -13.0 -30.3 -18.7 -12.0 -6.7 -5.2 1.7 - - - 16.5 16.8 0.60 0.44 Precious Metals -7.6 -19.5 -6.7 -14.4 -3.5 8.5 5.5 - - - 13.6 18.9 -0.03 0.21 Hedged Strategies* 2.6 4.9 3.4 6.1 3.9 3.3 5.8 - - - - - - 0.69 Managed Futures**** -3.2 15.0 12.4 2.0 2.1 3.6 5.6 - - - - - - -0.08 S&P 500 3.4 9.0 13.7 18.1 17.8 8.1 9.0 1.94 16.6 14.9 11.67 15.1 0.86 0.95 Russell 2000 3.5 9.4 4.9 17.4 16.8 8.3 9.1 1.31 23.8 20.5 12.85 19.8 0.80 0.81 MSCI EAFE 8.1 -0.7 -4.5 13.2 10.5 5.8 5.7 2.93 15.6 13.9 14.92 16.6 0.84 0.96 MSCI AC World 3.9 1.9 4.7 14.0 12.7 7.1 7.2 2.44 15.7 14.1 11.67 15.6 1.00 1.00
*June 30, 2015 **20-year average as of June 30, 2015. ***Volatility and Correlation: June 30, 2006 - Present. Hedged strategies consist of hedge funds and managed futures. ****Returns as of June 30, 2015. *****Values calculated using USD Source: FactSet, Bloomberg
Cheap Low Low
Moderate High High
Expensive
Chart of the Week: Strong-Dollar Dynamics Should Ease, Helping to Lift Capital Spending The relationship between the US dollar and capital spending is complex. When the US dollar is range-bound, the two economic drivers are not strongly correlated (see chart). At extremes, they are strongly inversely correlated because of the transmission mechanism between the US dollar and commodities prices, most of which are dollar-denominated. During periods of strong depreciation, as in 2003 and 2005, the dollar stimulated capital spending; and during periods of strong appreciation, as in 2009 and 2014, it depressed investment. Although the dollar is up on a year-over-year basis, we see it close to multiyear highs and settling into a range that reflects Federal Reserve tightening in 2016. As the rate of change slows and the 2014 pummeling of oil price drops out of the year-over-year comparisons, we see the headwind to capital investment slowly lifting.
Source: Haver Analytics, Morgan Stanley Wealth Management GIC as of June 30, 2015
-8
-6
-4
-2
0
2
4
6Q/Q % Change in Gross Fixed Capital Formation: OECD USQ/Q % Change in US Trade-Weighted Dollar Index%

Please refer to important information, disclosures and qualifications at the end of this material. Aug. 3, 2015 4
THE GIC WEEKLY
Morgan Stanley & Co. Forecasts (as of July 31, 2015) Real GDP Growth (%) 10-Yr. Govt.
Bond Yield (%) Headline Inflation (%) Currency Versus US Dollar
2014 2015E 2016E Q4 ’15E Q2 ’16E 2014 2015E 2016E Q3 ’15E Q4 ’15E Q3 ’16E Global 3.4 3.3 3.9 3.5 3.1 3.4 US 2.4 2.5 2.7 2.6 2.9 1.6 0.1 1.8 Euro Zone 0.9 1.4 2.2 0.4 0.2 1.6 1.08 1.05 0.97 UK 3.0 2.7 1.9 2.5 2.8 1.5 0.2 1.5 1.58 1.54 1.49 Japan 0.0 1.0 1.9 0.8 1.3 2.6 0.6 1.3 122 121 124 Emerging Markets 4.8 4.4 5.1 5.1 5.3 4.7 China 7.4 7.0 7.0 3.3 3.2 2.0 1.3 1.8 6.12 6.09 6.07 Source: Morgan Stanley & Co. Research
Macro Factor Heat Map (as of July 31, 2015)
Note: Text in a factor box denotes a color change; US rates went from risk asset positive to neutral as the yield curve flattened; For a further explanation of the chart, see page 8. Source: Morgan Stanley Wealth Management GIC
Market Factor Data Points (for the week ending July 31, 2015)
Positives Negatives
Global Growth
• June US durable goods orders up more than expected • July Chicago PMI improved well beyond expectations • July Richmond Fed manufacturing topped forecast • Texas Fed manufacturing up in July, but still negative • Japan retail sales beat estimate for June
• Second-quarter 2.3% US GDP well below estimates • July US Consumer Confidence fell below estimates • US pending home sales dropped unexpectedly in June • US Employment Cost Index failed to pick up with
annual growth rate at 2.1% in June vs. 2.6% in March • Chinese equites fall even with government intervention
Rates • Fed signals that it’s moving closer to a rate hike • Russia cut interest rates by 50 basis points • Brazil hiked rates 50 basis points
Inflation • June core CPI in Japan better than expected • Euro Zone CPI up in June, services inflation at 1.2%
Sentiment and Flows • German business confidence improved more than expected in July
Source: Morgan Stanley Wealth Management GIC
Economic Growth Rates
Inflation / Deflation Liquidity
Sentiment and Risk Valuation Earnings GIC Conclusion
US 0 0 -1 0 0 0 0 0
Japan 0 -1 0 1 0 0 1 1
Europe 0 0 -1 1 1 0 0 1
China 1 0 0 0 0 0 -1 0
Brazil -1 0 -1 -1 0 1 -1 -1
Risk Asset Positive Neutral Risk Asset
Negative
Range Bound, Looking for
Catalysts
Encouraging Momentum
Positive Catalysts Evident
Non-Consensus
Bulls
Stagflation; Avoid
Curve Flatter
Please refer to important information, disclosures and qualifications at the end of this material. Aug. 3, 2015 5
THE GIC WEEKLY
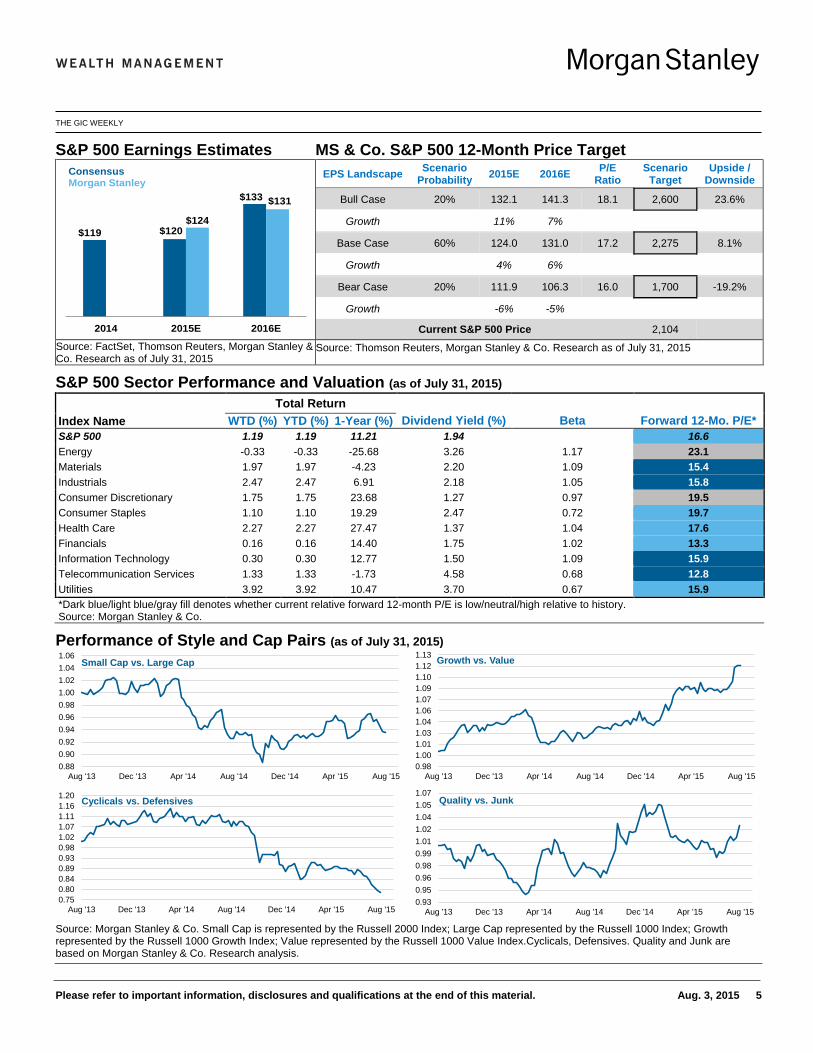
S&P 500 Earnings Estimates MS & Co. S&P 500 12-Month Price Target
EPS Landscape Scenario Probability 2015E 2016E P/E
Ratio Scenario
Target Upside /
Downside
Bull Case 20% 132.1 141.3 18.1 2,600 23.6%
Growth 11% 7%
Base Case 60% 124.0 131.0 17.2 2,275 8.1%
Growth 4% 6%
Bear Case 20% 111.9 106.3 16.0 1,700 -19.2%
Growth -6% -5%
Current S&P 500 Price 2,104
Source: FactSet, Thomson Reuters, Morgan Stanley & Co. Research as of July 31, 2015
Source: Thomson Reuters, Morgan Stanley & Co. Research as of July 31, 2015
S&P 500 Sector Performance and Valuation (as of July 31, 2015)
Index Name Total Return
WTD (%) YTD (%) 1-Year (%) Dividend Yield (%) Beta Forward 12-Mo. P/E* S&P 500 1.19 1.19 11.21 1.94 16.6 Energy -0.33 -0.33 -25.68 3.26 1.17 23.1 Materials 1.97 1.97 -4.23 2.20 1.09 15.4 Industrials 2.47 2.47 6.91 2.18 1.05 15.8 Consumer Discretionary 1.75 1.75 23.68 1.27 0.97 19.5 Consumer Staples 1.10 1.10 19.29 2.47 0.72 19.7 Health Care 2.27 2.27 27.47 1.37 1.04 17.6 Financials 0.16 0.16 14.40 1.75 1.02 13.3 Information Technology 0.30 0.30 12.77 1.50 1.09 15.9 Telecommunication Services 1.33 1.33 -1.73 4.58 0.68 12.8 Utilities 3.92 3.92 10.47 3.70 0.67 15.9 *Dark blue/light blue/gray fill denotes whether current relative forward 12-month P/E is low/neutral/high relative to history. Source: Morgan Stanley & Co.
Performance of Style and Cap Pairs (as of July 31, 2015)
Source: Morgan Stanley & Co. Small Cap is represented by the Russell 2000 Index; Large Cap represented by the Russell 1000 Index; Growth represented by the Russell 1000 Growth Index; Value represented by the Russell 1000 Value Index.Cyclicals, Defensives. Quality and Junk are based on Morgan Stanley & Co. Research analysis.
$119 $120
$133
$124
$131
2014 2015E 2016E
ConsensusMorgan Stanley
0.880.900.920.940.960.981.001.021.041.06
Aug '13 Dec '13 Apr '14 Aug '14 Dec '14 Apr '15 Aug '15
Small Cap vs. Large Cap
0.981.001.011.031.041.061.071.091.101.121.13
Aug '13 Dec '13 Apr '14 Aug '14 Dec '14 Apr '15 Aug '15
Growth vs. Value
0.750.800.840.890.930.981.021.071.111.161.20
Aug '13 Dec '13 Apr '14 Aug '14 Dec '14 Apr '15 Aug '15
Cyclicals vs. Defensives
0.930.950.960.980.991.011.021.041.051.07
Aug '13 Dec '13 Apr '14 Aug '14 Dec '14 Apr '15 Aug '15
Quality vs. Junk

Please refer to important information, disclosures and qualifications at the end of this material. Aug. 3, 2015 6
THE GIC WEEKLY
Fixed Income Weekly Insight: Higher Yields Have Become Available in Higher Quality Bonds During the past month, a significant drop in commodity prices led to greater volatility in the corporate bond market, driving credit spreads wider. Despite correlating with oil and commodity prices directly, spreads on investment grade corporate bonds have significantly underperformed. In fact, this has created an opportunity to pick up high-quality yield. Now, about 12% of the investment grade market yields in excess of 5% (see chart). This suggests it may be a good time to diversify and to upgrade the overall credit quality of a portfolio.
Source: Morgan Stanley & Co. as of June 30, 2015
Government Debt Monitor (as of July 31, 2015) US Global
Yield (%) Total Return (%) Yield (%) Total Return (%)*
Treasury Benchmark Current ΔWTD ΔYTD YTD 10-Year Govt. Bond Current ΔWTD ΔYTD YTD
3-Month 0.07 0.06 0.03 0.01 France 0.94 -0.34 0.12 0.10 2-Year 0.73 0.09 0.06 0.52 Germany 0.65 -0.25 0.11 0.06 5-Year 1.62 -0.04 -0.03 1.17 Japan 0.41 -0.04 0.08 0.05 10-Year 2.26 -0.14 0.09 0.23 Spain 1.90 -0.22 0.30 -1.35 30-Year 2.94 -0.25 0.19 -2.90 UK 1.97 -0.12 0.21 -1.43
2-Yr./10-Yr. Spread (bp) 153 -22.88 2.47 - 3-Month LIBOR 0.30 0.01 0.04 - 10-Yr. TIPS Breakeven (bp) 176 -11.71 8.48 - US Tax Exempt
10-Year AAA Muni 2.19 -0.01 -0.58 0.73
Interest Rate Volatility** (bp) 71 -19.02 2.27 - 10-Yr. Muni/UST Ratio 99.55 4.45 7.52 -
0
2
4
6
8
10
12
14
16
18
20
Jan '12 Jul '12 Jan '13 Jul '13 Jan '14 Jul '14 Jan '15
%Portion of Investment Grade Market With Yield Above 5%
*Global total returns reflect Citigroup 7- to 10-year bond indexes and Muni total returns reflect Barclays Municipal Bond Index Total Return **Interest Rate Volatility measured by Merrill Lynch Option Volatility Estimate (MOVE) Index Source: Bloomberg, Thomson Reuters Municipal Market Data (MMD)
Fixed Income Spread Dashboard Benchmark Returns
Unless stated, indexes utilized are Citi Broad Investment Grade, Citi High Yield, and Citi Global Indexes. *MBS distills high grade agency-rated mortgage-backed securities, a substantial subsector of investment grade indexes **OAS stands for Option-Adjusted Spread or spread over the Treasury. Grey diamond denotes current OAS; blue circle denotes two-year average. Source: Bloomberg, The Yield Book® Software and Services. © 2015 Citigroup Index LLC. All rights reserved. Data as of July 31, 2015
Rich Cheap Index YTD MTD 2014
MBS* 4.17 2.55 21 -3 55 Barclays Aggregate 0.32 0.42 5.97
AAA 4.08 1.54 28 9 34 Barclays US MBS 0.50 0.30 6.08
AA 4.98 1.92 13 3 26 Barclays Municipal 0.73 0.61 9.05
A 6.76 2.97 121 79 121 Investment Grade -0.54 0.20 7.48
BBB 7.33 3.99 207 134 209 High Yield 1.70 -0.86 1.83 BB 4.65 5.40 387 253 451 World Government Bonds (FX) 0.42 1.04 8.47
B 4.03 7.12 575 367 641 Emerging Markets US$ 1.52 0.28 6.95
CCC 3.50 11.12 1,036 664 1,125
Total Returns (%)OAS Range**Past Two Years (bp)
Hig
h Yi
eld
Inve
stm
ent G
rade
OAS (bp)
Yield-to-Worst (%)
Duration(Yrs.)

Please refer to important information, disclosures and qualifications at the end of this material. Aug. 3, 2015 7
THE GIC WEEKLY
*For more about the risks to Master Limited Partnerships (MLPs) and Duration, please see the Risk Considerations section beginning on page 10 of this report. Source: Morgan Stanley Wealth Management Global Investment Committee as of July 31, 2015
Tactical Asset Allocation Reasoning
Global Equities Relative Weight Within Equities
US Equal Weight While US equities have done exceptionally well since the global financial crisis, they still offer attractive upside potential, particularly relative to bonds. We believe the US and global economies continue to heal, making recession neither imminent nor likely in 2015 or 2016. This is constructive for global equities, including the US.
International Equities (Developed Markets)
Overweight We maintain a positive bias for Japanese and European equity markets given the political and structural changes taking place in Japan and our expectation for an improving economic outlook in Europe. European and Japanese central banks are now engaged in much more aggressive monetary policy than the US, while also moving away from fiscal austerity. This should be relatively more stimulative for growth on a rate-of-change basis and lead to continued outperformance in these equity markets.
Emerging Markets Overweight Emerging market (EM) equities have been a mixed bag for the past few years and we expect that to continue. While the broad emerging market equity asset class remains vulnerable to Federal Reserve Bank tightening and US dollar strength, emerging market equities should perform better with a more synchronous global economic recovery and more aggressive central-bank activity outside the US. We think recommend a selective approach, focusing on India, China H-shares, Taiwan and Korea.
Global Fixed Income
Relative Weight Within Fixed
Income
US Investment Grade Underweight We have recommended shorter-duration* (maturities) since March 2013 given the extremely low yields and potential capital losses associated with rising interest rates from such low levels. We have subsequently reduced the size of our overweight in short duration with short-term interest rates now expected to move higher with the Fed’s tightening cycle later this year. Within investment grade, we prefer BBB-rated corporates and A-rated municipals over US Treasuries.
International Investment Grade
Underweight Yields are extremely low globally, leaving very little value in international fixed income, particularly as the global economy begins to recover more broadly. While interest rates are likely to stay low, the offsetting diversification benefits do not warrant much, if any, position, in our view.
Inflation-Protected Securities
Overweight We had been underweight inflation-protected securities since March 2013 given negative real yields across all maturities. However, with deflationary fears having become extreme in the first quarter of 2015, we believe these securities now offer relative value in the context of our forecasted acceleration in global growth and rise in oil prices.
High Yield Overweight The sharp decline in oil prices has created some dislocations in the US high yield market. Broadly speaking, we believe default rates are likely to remain muted as the economy recovers, while corporate and consumer behavior remain conservative. We prefer higher-quality (B to BB) issues and vigilance on security selection at this stage of the credit cycle. With energy-related issues, investors should remain selective.
Emerging Market Bonds
Underweight We remain underweight as the Fed’s rate-hike cycle will likely be a disproportionate headwind for emerging market (EM) debt. Much like EM equities, EM debt exposure should be selective. For investors who want to own EM debt, the GIC recommends US-dollar-denominated debt with a focus on China, India and Mexico.
Alternative Investments
Relative Weight Within Alternative
Investments
REITs Underweight With our expectation for rising interest rates, we believe REITs are now fairly to slightly overvalued, especially relative to other high-yielding asset categories. Therefore, we recently reduced our tactical asset allocation. Non-US REITs should be favored relative to domestic REITs at this point.
Commodities Overweight Most commodities have underperformed in the past few years, with energy leading the charge lower. We believe commodities are likely to perform better for the remainder of 2015 as global growth reaccelerates and the oil market comes into better supply/demand balance.
Master Limited Partnerships*
Equal Weight Master limited partnerships (MLPs) should do better in 2015 if oil prices recover as we expect. With interest rates still low and average yields on MLPs close to 6%, significant relative value has been created in this asset category. We continue to favor midstream assets.
Hedged Strategies (Hedge Funds and Managed Futures)
Equal Weight This asset category can provide uncorrelated exposure to traditional risk-asset markets. It tends to outperform when traditional asset categories are challenged by growth scares and/or interest rate volatility spikes. Within this asset category, we favor event-driven strategies, given our expectation for increased mergers-and-acquisitions activity.
Please refer to important information, disclosures and qualifications at the end of this material. Aug. 3, 2015 8
THE GIC WEEKLY
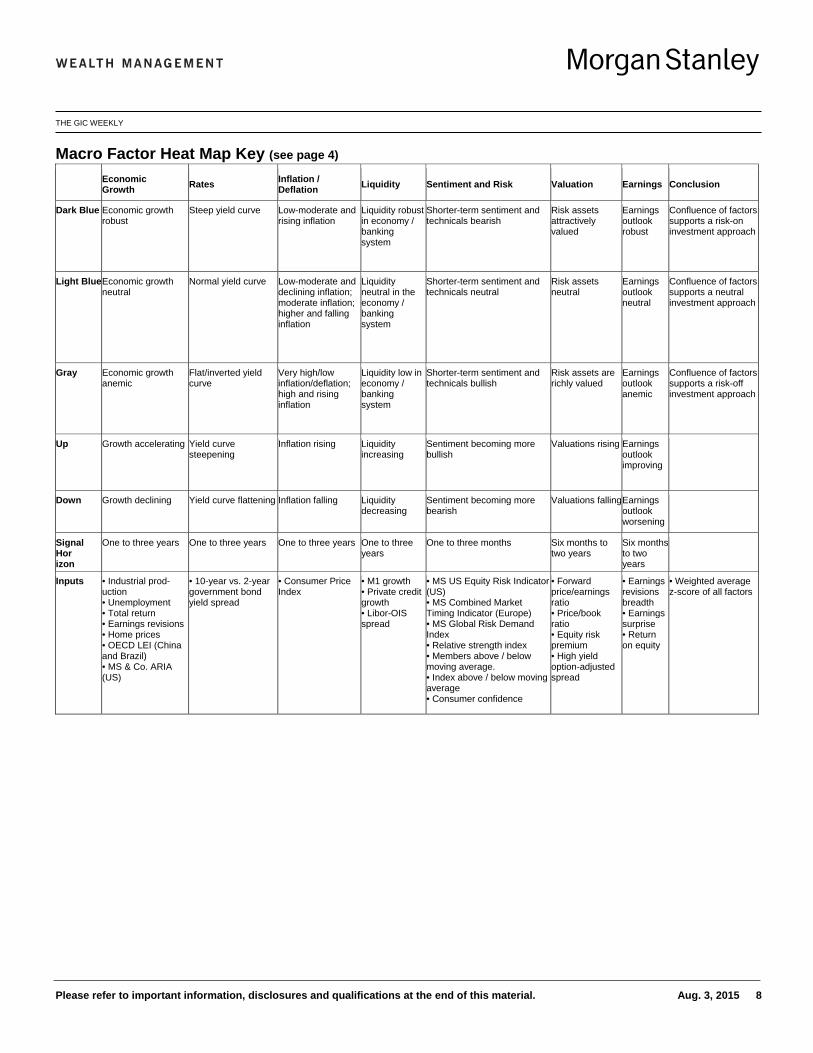
Macro Factor Heat Map Key (see page 4) Economic
Growth Rates Inflation / Deflation Liquidity Sentiment and Risk Valuation Earnings Conclusion
Dark Blue Economic growth robust
Steep yield curve Low-moderate and rising inflation
Liquidity robust in economy / banking system
Shorter-term sentiment and technicals bearish
Risk assets attractively valued
Earnings outlook robust
Confluence of factors supports a risk-on investment approach
Light Blue Economic growth neutral
Normal yield curve Low-moderate and declining inflation; moderate inflation; higher and falling inflation
Liquidity neutral in the economy / banking system
Shorter-term sentiment and technicals neutral
Risk assets neutral
Earnings outlook neutral
Confluence of factors supports a neutral investment approach
Gray Economic growth anemic
Flat/inverted yield curve
Very high/low inflation/deflation; high and rising inflation
Liquidity low in economy / banking system
Shorter-term sentiment and technicals bullish
Risk assets are richly valued
Earnings outlook anemic
Confluence of factors supports a risk-off investment approach
Up Growth accelerating Yield curve steepening
Inflation rising Liquidity increasing
Sentiment becoming more bullish
Valuations rising Earnings outlook improving
Down Growth declining Yield curve flattening Inflation falling Liquidity decreasing
Sentiment becoming more bearish
Valuations falling Earnings outlook worsening
Signal Hor izon
One to three years One to three years One to three years One to three years
One to three months Six months to two years
Six months to two years
Inputs • Industrial prod-uction • Unemployment • Total return • Earnings revisions • Home prices • OECD LEI (China and Brazil) • MS & Co. ARIA (US)
• 10-year vs. 2-year government bond yield spread
• Consumer Price Index
• M1 growth • Private credit growth • Libor-OIS spread
• MS US Equity Risk Indicator (US) • MS Combined Market Timing Indicator (Europe) • MS Global Risk Demand Index • Relative strength index • Members above / below moving average. • Index above / below moving average • Consumer confidence
• Forward price/earnings ratio • Price/book ratio • Equity risk premium • High yield option-adjusted spread
• Earnings revisions breadth • Earnings surprise • Return on equity
• Weighted average z-score of all factors

Please refer to important information, disclosures and qualifications at the end of this material. Aug. 3, 2015 9
THE GIC WEEKLY
Index and Survey Definitions BARCLAYS MUNICIPAL BOND INDEX This is a rules-based, market-value-weighted index engineered for the long-term tax-exempt bond market. BARCLAYS US AGGREGATE BOND INDEX This index tracks US-dollar-denominated investment grade fixed rate bonds. These include US Treasuries, US-government-related, securitized and corporate securities. BARCLAYS US CORPORATE HIGH-YIELD INDEX This index measures the market of US-dollar-denominated, noninvestment grade, fixed-rate, taxable corporate bonds. BARCLAYS US MORTGAGE-BACKED SECURITIES INDEX This is an index which covers the mortgage-backed securities component of the Barclays US Aggregate Bond Index. CITI EMERGING MARKET SOVEREIGN BOND INDEX This index includes Brady bonds and US-dollar-denominated emerging markets sovereign debt issued in the global, Yankee and Eurodollar markets, excluding loans. It comprises debt in Africa, Asia, Europe and Latin America. CITI EURO BROAD INVESTMENT GRADE BOND (EUROBIG) INDEX This is a comprehensive representation of the European investment grade corporate bond market. CITI HIGH YIELD MARKET INDEX This index tracks performance of below-investment -grade debt issued by corporations domiciled in the US and Canada. CITI FRANCE GBI CURRENCY HEDGED 7 TO 10 YEAR USD This index measures the performance of France sovereign bonds in the seven-to-10-year maturity range and is denominated in US dollars. CITI GERMANY GBI CURRENCY HEDGED 7 TO 10 YEAR USD This index measures the performance of Germany sovereign bonds in the seven-to-10-year maturity range and is denominated in US dollars. CITI JAPAN GBI CURRENCY HEDGED 7 TO 10 YEAR USD This index measures the performance of Japan sovereign bonds in the seven-to-10-year maturity range and is denominated in US dollars. CITI SPAIN GBI CURRENCY HEDGED 7 TO 10 YEAR USD This index measures the performance of Spain sovereign bonds in
the seven-to-10-year maturity range and is denominated in US dollars. CITI UK GBI CURRENCY HEDGED 7 TO 10 YEAR USD This index measures the performance of UK sovereign bonds in the seven- to-10-year maturity range and is denominated in US dollars. CITI US BIG CORPORATE BOND INDEX This is a comprehensive representation of the US investment grade corporate bond market. CONFERENCE BOARD CONSUMER CONFIDENCE INDEX This is a proprietary monthly measure of the public's confidence in the health of the US economy. CONSUMER PRICE INDEX This index examines the weighted average of prices of a basket of consumer goods and services. EMPLOYMENT COST INDEX This is a quarterly report from the US Department of Labor that measures the growth of employee compensation (wages and benefits). The index is based on a survey of employer payrolls in the final month of each quarter. MERRILL LYNCH OPTION VOLATILITY ESTIMATE (MOVE) INDEX This is a yield-curve-weighted index of the normalized implied volatility on one-month US Treasury options. MORGAN STANLEY COMBINED MARKET TIMING INDICATOR (CMTI) The CMTI is an average across the Risk, Fundamentals and Composite Valuation Indicators. MORGAN STANLEY EQUITY RISK INDICATOR This is a proprietary sentiment and risk indicator for US equities. MORGAN STANLEY GLOBAL RISK DEMAND INDEX This index tracks risk sentiment as reflected in the relative price movements of seven “risky” assets versus their “safer” counterparts; plus, three volatility indicators. MSCI ALL COUNTRY WORLD INDEX This is a free-float-adjusted market capitalization index that is designed to measure equity market performance in the global developed and emerging markets. MSCI EAFE INDEX This capitalization-weighted index tracks the total return of stocks in 21 developed-market countries in Europe, Australia and the Far East. PURCHASING MANAGERS INDEXES (PMI) These economic indicators are derived
mostly from monthly surveys of private-sector companies. The principal producers of PMIs are Markit Group, which conducts PMIs for more than 30 countries, and the Institute for Supply Management, which conducts PMIs for the US. RICHMOND FEDERAL RESERVE MANFACTURING SURVEY This survey conducted on a monthly basis by the Federal Reserve Bank of Richmond tracks sentiment among manufacturers in the Richmond Fed's district which includes Virginia, Maryland, North and South Carolina, the District of Columbia and most of West Virginia. RUSSELL 1000 INDEX This index measures the performance of the 1,000 largest US companies based on total market capitalization. RUSSELL 1000 GROWTH INDEX This index measures the performance of those Russell 1000 companies with higher price-to-book ratios and higher forecasted growth. RUSSELL 1000 VALUE INDEX This index measures the performance of those Russell 1000 companies with lower price-to-book ratios and lower forecasted growth. RUSSELL 2000 INDEX This index measures the performance of the 2,000 smallest companies in the Russell 3000 Index. RUSSELL 3000 INDEX This index measures the performance of the 3,000 largest US companies based on total market capitalization. TEXAS MANUFACTURING OUTLOOK SURVEY This monthly survey is based on responses from 112 Texas manufacturers who are asked whether output, employment, orders, prices and other indicators increased, decreased or remained unchanged during the previous month. TRADE-WEIGHTED US DOLLAR INDEX This index is a weighted average of the foreign exchange value of the US dollar against a subset of the broad index currencies that circulate widely outside the US. S&P 500 INDEX This capitalization-weighted index includes a representative sample of 500 leading companies in leading industries in the US economy.
Please refer to important information, disclosures and qualifications at the end of this material. Aug. 3, 2015 10
THE GIC WEEKLY
Risk Considerations
MLPs Master Limited Partnerships (MLPs) are limited partnerships or limited liability companies that are taxed as partnerships and whose interests (limited partnership units or limited liability company units) are traded on securities exchanges like shares of common stock. Currently, most MLPs operate in the energy, natural resources or real estate sectors. Investments in MLP interests are subject to the risks generally applicable to companies in the energy and natural resources sectors, including commodity pricing risk, supply and demand risk, depletion risk and exploration risk. Individual MLPs are publicly traded partnerships that have unique risks related to their structure. These include, but are not limited to, their reliance on the capital markets to fund growth, adverse ruling on the current tax treatment of distributions (typically mostly tax deferred), and commodity volume risk. The potential tax benefits from investing in MLPs depend on their being treated as partnerships for federal income tax purposes and, if the MLP is deemed to be a corporation, then its income would be subject to federal taxation at the entity level, reducing the amount of cash available for distribution to the fund which could result in a reduction of the fund’s value. MLPs carry interest rate risk and may underperform in a rising interest rate environment. MLP funds accrue deferred income taxes for future tax liabilities associated with the portion of MLP distributions considered to be a tax-deferred return of capital and for any net operating gains as well as capital appreciation of its investments; this deferred tax liability is reflected in the daily NAV; and, as a result, the MLP fund’s after-tax performance could differ significantly from the underlying assets even if the pre-tax performance is closely tracked.
Duration Duration, the most commonly used measure of bond risk, quantifies the effect of changes in interest rates on the price of a bond or bond portfolio. The longer the duration, the more sensitive the bond or portfolio would be to changes in interest rates. Generally, if interest rates rise, bond prices fall and vice versa. Longer-term bonds carry a longer or higher duration than shorter-term bonds; as such, they would be affected by changing interest rates for a greater period of time if interest rates were to increase. Consequently, the price of a long-term bond would drop significantly as compared to the price of a short-term bond.
International investing entails greater risk, as well as greater potential rewards compared to U.S. investing. These risks include political and economic uncertainties of foreign countries as well as the risk of currency fluctuations. These risks are magnified in countries with emerging markets, since these countries may have relatively unstable governments and less established markets and economies.
Alternative investments which may be referenced in this report, including private equity funds, real estate funds, hedge funds, managed futures funds, and funds of hedge funds, private equity, and managed futures funds, are speculative and entail significant risks that can include losses due to leveraging or other speculative investment practices, lack of liquidity, volatility of returns, restrictions on transferring interests in a fund, potential lack of diversification, absence and/or delay of information regarding valuations and pricing, complex tax structures and delays in tax reporting, less regulation and higher fees than mutual funds and risks associated with the operations, personnel and processes of the advisor.
Managed futures investments are speculative, involve a high degree of risk, use significant leverage, have limited liquidity and/or may be generally illiquid, may incur substantial charges, may subject investors to conflicts of interest, and are usually suitable only for the risk capital portion of an investor’s portfolio. Before investing in any partnership and in order to make an informed decision, investors should read the applicable prospectus and/or offering documents carefully for additional information, including charges, expenses, and risks. Managed futures investments are not intended to replace equities or fixed income securities but rather may act as a complement to these asset categories in a diversified portfolio. Investing in commodities entails significant risks. Commodity prices may be affected by a variety of factors at any time, including but not limited to, (i) changes in supply and demand relationships, (ii) governmental programs and policies, (iii) national and international political and economic events, war and terrorist events, (iv) changes in interest and exchange rates, (v) trading activities in commodities and related contracts, (vi) pestilence, technological change and weather, and (vii) the price volatility of a commodity. In addition, the commodities markets are subject to temporary distortions or other disruptions due to various factors, including lack of liquidity, participation of speculators and government intervention.
Physical precious metals are non-regulated products. Precious metals are speculative investments, which may experience short-term and long term price volatility. The value of precious metals investments may fluctuate and may appreciate or decline, depending on market conditions. If sold in a declining market, the price you receive may be less than your original investment. Unlike bonds and stocks, precious metals do not make interest or dividend payments. Therefore, precious metals may not be suitable for investors who require current income. Precious metals are commodities that should be safely stored, which may impose additional costs on the investor. The Securities Investor Protection Corporation (“SIPC”) provides certain protection for customers’ cash and securities in the event of a brokerage firm’s bankruptcy, other financial difficulties, or if customers’ assets are missing. SIPC insurance does not apply to precious metals or other commodities.
Bonds are subject to interest rate risk. When interest rates rise, bond prices fall; generally the longer a bond's maturity, the more sensitive it is to this risk. Bonds may also be subject to call risk, which is the risk that the issuer will redeem the debt at its option, fully or partially, before the scheduled maturity date. The market value of debt instruments may fluctuate, and proceeds from sales prior to maturity may be more or less than the amount originally invested or the maturity value due to changes in market conditions or changes in the credit quality of the issuer. Bonds are subject to the credit risk of the issuer. This is the risk that the issuer might be unable to make interest and/or principal payments on a timely basis. Bonds are also subject to reinvestment risk, which is the risk that principal and/or interest payments from a given investment may be reinvested at a lower interest rate.

Please refer to important information, disclosures and qualifications at the end of this material. Aug. 3, 2015 11
THE GIC WEEKLY
Bonds rated below investment grade may have speculative characteristics and present significant risks beyond those of other securities, including greater credit risk and price volatility in the secondary market. Investors should be careful to consider these risks alongside their individual circumstances, objectives and risk tolerance before investing in high-yield bonds. High yield bonds should comprise only a limited portion of a balanced portfolio. Interest on municipal bonds is generally exempt from federal income tax; however, some bonds may be subject to the alternative minimum tax (AMT). Typically, state tax-exemption applies if securities are issued within one's state of residence and, if applicable, local tax-exemption applies if securities are issued within one's city of residence. Treasury Inflation Protection Securities’ (TIPS) coupon payments and underlying principal are automatically increased to compensate for inflation by tracking the consumer price index (CPI). While the real rate of return is guaranteed, TIPS tend to offer a low return. Because the return of TIPS is linked to inflation, TIPS may significantly underperform versus conventional U.S. Treasuries in times of low inflation. Principal is returned on a monthly basis over the life of a mortgage-backed security. Principal prepayment can significantly affect the monthly income stream and the maturity of any type of MBS, including standard MBS, CMOs and Lottery Bonds. Yields and average lives are estimated based on prepayment assumptions and are subject to change based on actual prepayment of the mortgages in the underlying pools. The level of predictability of an MBS/CMO’s average life, and its market price, depends on the type of MBS/CMO class purchased and interest rate movements. In general, as interest rates fall, prepayment speeds are likely to increase, thus shortening the MBS/CMO’s average life and likely causing its market price to rise. Conversely, as interest rates rise, prepayment speeds are likely to decrease, thus lengthening average life and likely causing the MBS/CMO’s market price to fall. Some MBS/CMOs may have “original issue discount” (OID). OID occurs if the MBS/CMO’s original issue price is below its stated redemption price at maturity, and results in “imputed interest” that must be reported annually for tax purposes, resulting in a tax liability even though interest was not received. Investors are urged to consult their tax advisors for more information. Asset-backed securities generally decrease in value as a result of interest rate increases, but may benefit less than other fixed-income securities from declining interest rates, principally because of prepayments. Yields are subject to change with economic conditions. Yield is only one factor that should be considered when making an investment decision. Equity securities may fluctuate in response to news on companies, industries, market conditions and general economic environment. Companies paying dividends can reduce or cut payouts at any time. Investing in smaller companies involves greater risks not associated with investing in more established companies, such as business risk, significant stock price fluctuations and illiquidity. Stocks of medium-sized companies entail special risks, such as limited product lines, markets, and financial resources, and greater market volatility than securities of larger, more-established companies. Value investing does not guarantee a profit or eliminate risk. Not all companies whose stocks are considered to be value stocks are able to turn their business around or successfully employ corrective strategies which would result in stock prices that do not rise as initially expected. Growth investing does not guarantee a profit or eliminate risk. The stocks of these companies can have relatively high valuations. Because of these high valuations, an investment in a growth stock can be more risky than an investment in a company with more modest growth expectations. Asset allocation and diversification do not assure a profit or protect against loss in declining financial markets. The indices are unmanaged. An investor cannot invest directly in an index. They are shown for illustrative purposes only and do not represent the performance of any specific investment. The indices selected by Morgan Stanley Wealth Management to measure performance are representative of broad asset classes. Morgan Stanley Smith Barney LLC retains the right to change representative indices at any time. Credit ratings are subject to change. REITs investing risks are similar to those associated with direct investments in real estate: property value fluctuations, lack of liquidity, limited diversification and sensitivity to economic factors such as interest rate changes and market recessions. Because of their narrow focus, sector investments tend to be more volatile than investments that diversify across many sectors and companies. Rebalancing does not protect against a loss in declining financial markets. There may be a potential tax implication with a rebalancing strategy. Investors should consult with their tax advisor before implementing such a strategy. Investing in foreign emerging markets entails greater risks than those normally associated with domestic markets, such as political, currency, economic and market risks. Investing in foreign markets entails greater risks than those normally associated with domestic markets, such as political, currency, economic and market risks. Investing in currency involves additional special risks such as credit, interest rate fluctuations, derivative investment risk, and domestic and foreign inflation rates, which can be volatile and may be less liquid than other securities and more sensitive to the effect of varied economic conditions. In addition, international investing entails greater risk, as well as greater potential rewards compared to U.S. investing. These risks include political and economic uncertainties of foreign countries as well as the risk of currency fluctuations. These risks are magnified in countries with emerging markets, since these countries may have relatively unstable governments and less established markets and economies. Certain securities referred to in this material may not have been registered under the U.S. Securities Act of 1933, as amended, and, if not, may not be offered or sold absent an exemption therefrom. Recipients are required to comply with any legal or contractual restrictions on their purchase, holding, and sale, exercise of rights or performance of obligations under any securities/instruments transaction.
Please refer to important information, disclosures and qualifications at the end of this material. Aug. 3, 2015 12
THE GIC WEEKLY
Disclosures Morgan Stanley Wealth Management is the trade name of Morgan Stanley Smith Barney LLC, a registered broker-dealer in the United States. This material has been prepared for informational purposes only and is not an offer to buy or sell or a solicitation of any offer to buy or sell any security or other financial instrument or to participate in any trading strategy. Past performance is not necessarily a guide to future performance. The author(s) (if any authors are noted) principally responsible for the preparation of this material receive compensation based upon various factors, including quality and accuracy of their work, firm revenues (including trading and capital markets revenues), client feedback and competitive factors. Morgan Stanley Wealth Management is involved in many businesses that may relate to companies, securities or instruments mentioned in this material. This material has been prepared for informational purposes only and is not an offer to buy or sell or a solicitation of any offer to buy or sell any security/instrument, or to participate in any trading strategy. Any such offer would be made only after a prospective investor had completed its own independent investigation of the securities, instruments or transactions, and received all information it required to make its own investment decision, including, where applicable, a review of any offering circular or memorandum describing such security or instrument. That information would contain material information not contained herein and to which prospective participants are referred. This material is based on public information as of the specified date, and may be stale thereafter. We have no obligation to tell you when information herein may change. We make no representation or warranty with respect to the accuracy or completeness of this material. Morgan Stanley Wealth Management has no obligation to provide updated information on the securities/instruments mentioned herein.
The securities/instruments discussed in this material may not be suitable for all investors. The appropriateness of a particular investment or strategy will depend on an investor’s individual circumstances and objectives. Morgan Stanley Wealth Management recommends that investors independently evaluate specific investments and strategies, and encourages investors to seek the advice of a financial advisor. The value of and income from investments may vary because of changes in interest rates, foreign exchange rates, default rates, prepayment rates, securities/instruments prices, market indexes, operational or financial conditions of companies and other issuers or other factors. Estimates of future performance are based on assumptions that may not be realized. Actual events may differ from those assumed and changes to any assumptions may have a material impact on any projections or estimates. Other events not taken into account may occur and may significantly affect the projections or estimates. Certain assumptions may have been made for modeling purposes only to simplify the presentation and/or calculation of any projections or estimates, and Morgan Stanley Wealth Management does not represent that any such assumptions will reflect actual future events. Accordingly, there can be no assurance that estimated returns or projections will be realized or that actual returns or performance results will not materially differ from those estimated herein.
This material should not be viewed as advice or recommendations with respect to asset allocation or any particular investment. This information is not intended to, and should not, form a primary basis for any investment decisions that you may make. Morgan Stanley Wealth Management is not acting as a fiduciary under either the Employee Retirement Income Security Act of 1974, as amended or under section 4975 of the Internal Revenue Code of 1986 as amended in providing this material. Morgan Stanley Smith Barney LLC, its affiliates and Morgan Stanley Financial Advisors do not provide legal or tax advice. Each client should always consult his/her personal tax and/or legal advisor for information concerning his/her individual situation and to learn about any potential tax or other implications that may result from acting on a particular recommendation. This material is disseminated in Australia to “retail clients” within the meaning of the Australian Corporations Act by Morgan Stanley Wealth Management Australia Pty Ltd (A.B.N. 19 009 145 555, holder of Australian financial services license No. 240813).
Morgan Stanley Wealth Management is not incorporated under the People's Republic of China ("PRC") law and the material in relation to this report is conducted outside the PRC. This report will be distributed only upon request of a specific recipient. This report does not constitute an offer to sell or the solicitation of an offer to buy any securities in the PRC. PRC investors must have the relevant qualifications to invest in such securities and must be responsible for obtaining all relevant approvals, licenses, verifications and or registrations from PRC's relevant governmental authorities.
If your financial adviser is based in Australia, Dubai, Germany, Italy, Switzerland or the United Kingdom, then please be aware that this report is being distributed by the Morgan Stanley entity where your financial adviser is located, as follows: Australia: Morgan Stanley Wealth Management Australia Pty Ltd (ABN 19 009 145 555, AFSL No. 240813); Dubai: Morgan Stanley Private Wealth Management Limited (DIFC Branch), regulated by the Dubai Financial Services Authority (the DFSA), and is directed at Professional Clients only, as defined by the DFSA; Germany: Morgan Stanley Private Wealth Management Limited, Munich branch authorized by the Prudential Regulation Authority and regulated by the Financial Conduct Authority and the Bundesanstalt fuer Finanzdienstleistungsaufsicht; Italy: Morgan Stanley Bank International Limited, Milan Branch, authorized by the Prudential Regulation Authority and regulated by the Financial Conduct Authority and the Prudential Regulation Authority, the Banca d'Italia and the Commissione Nazionale per Le Societa' E La Borsa; Switzerland: Bank Morgan Stanley AG regulated by the Swiss Financial Market Supervisory Authority; or United Kingdom: Morgan Stanley Private Wealth Management Ltd, authorized and regulated by the Financial Conduct Authority, approves for the purposes of section 21 of the Financial Services and Markets Act 2000 this material for distribution in the United Kingdom.
Morgan Stanley Wealth Management is not acting as a municipal advisor to any municipal entity or obligated person within the meaning of Section 15B of the Securities Exchange Act (the “Municipal Advisor Rule”) and the opinions or views contained herein are not intended to be, and do not constitute, advice within the meaning of the Municipal Advisor Rule.
This material is disseminated in the United States of America by Morgan Stanley Smith Barney LLC.
Third-party data providers make no warranties or representations of any kind relating to the accuracy, completeness, or timeliness of the data they provide and shall not have liability for any damages of any kind relating to such data.
This material, or any portion thereof, may not be reprinted, sold or redistributed without the written consent of Morgan Stanley Smith Barney LLC.
© 2015 Morgan Stanley Smith Barney LLC. Member SIPC.