morgan stanley light s.a.: overview & brazil utilities ...ri.light.com.br/ptb/7413/light s.a....
TRANSCRIPT

1
Morgan Stanley
Brazil Utilities Corporate Access DayLight S.A.: Overview & Strategy
September, 2018

2
Important Notice
This presentation may include declarations that represent forward-looking statements according to
Brazilian regulations and international movable values. These declarations are based on certain
assumptions and analyses made by the Company in accordance with its experience, the economic
environment, market conditions and future events expected, many of which are out of the Company’s
control. Important factors that can lead to significant differences between the real results and the future
declarations of expectations on events or business-oriented results include the Company’s strategy, the
Brazilian and international economic conditions, technology, financial strategy, developments of the public
service industry, hydrological conditions, conditions of the financial market, uncertainty regarding the
results of its future operations, plain, goals, expectations and intentions, among others, Because of these
factors, the Company’s actual results may significantly differ from those indicated or implicit in the
declarations of expectations on events or future results.
The information and opinions herein do not have to be understood as recommendation to potential
investors, and no investment decision must be based on the veracity, the updated or completeness of this
information or opinions. None of the Company’s assessors or parts related to them or its representatives
will have any responsibility for any losses that can elapse from the use or the contents of this presentation.
This material includes declarations on future events submitted to risks and uncertainties, which are based
on current expectations and projections on future events and trends that can affect the Company’s
businesses. These declarations include projections of economic growth and demand and supply of energy,
in addition to information on competitive position, regulatory environment, potential growth opportunities
and other subjects. Various factors can adversely affect the estimates and assumptions on which these
declarations are based on.

3
SP
76 5
8
RJ
Rio Paraíba
do Sul
4
1 Amazônia Energia
2 Renova
3 Guanhães Energia
4 HPP Ilha dos Pombos
5 SHPP Paracambi
6 Complexo de Lajes
7 HPP Santa Branca
8 HPP Itaocara I
Generation
Light LightComLight SESA A B
25,846 GWh (2017)
Total Billed Market
4.5 mm
Clients
R$ 8.5 bn
Net RAB
31
Municipalities Served
1,028 MW1
Installed Capacity
74
# of HPPs
R$ 207 / MWh3
Average Sales Price
7,243 GWh in 2017
Commercialized Energy
Notes:
1 855 MW of total installed capacity are in full control of the company
2 Proportional to Light’s stake
3 Considers the average price for the 2016-2022 period, net of taxes
4 Considers only HPPs in which Light has full control
11 mm
People Served
11,000 sq. km
Area Coverage
Distribution Generation + Commercialization
686 MWavg2
Assured Energy
1
3
2
Well positioned in distribution & generation segments

4
Light SESA: distribution segment
The distribution segment accounted for 86.8% of Light’s Consolidated Net Revenues and 75% of Adj. EBITDA(4) in
2017
Distribution Concession: Rio de Janeiro
GDP
Population
Accounts billed
Concession until 2026
2rd largest in the Country
2nd biggest, over 16 million of people(3)
4.5 million accounts billed and over 11 million people served
Market Share Analysis (per Volume and RAB)(2,5)
Source: ANEEL
(1) As of 2017
(2) As of June, 2018
(3) 16.7 million of people according to 2017 IBGE and the second largest GDP according to 2015 IBGE data(4) Adjusted EBITDA as EBITDA plus equity in the earnings of subsidiaries, other operating revenue (expenses), provisions and financial assets and liabilities of the sector. EBITDA as net income (loss) for the period plus net financial
result, income tax and social contribution expenses, and depreciation and amortization costs and expenses.
(5) RAB means regulatory asset base. RAB consists of the amount of investments made by energy distribution companies that will be included in the tariffs charged to consumers.
Total Volume (“000 GWh”) (1) Net RAB (R$ bn) (2,5)
32.8
25.1
20.4
19.7
19.7
16.3
14.1
11.0
Eletropaulo
Cemig
CPFL
Light
Copel
Coelba
Celesc
Celg
4th
8.9
8.5
7.4
6.0
6.0
5.2
4.9
3.5
Cemig
Light
Eletropaulo
Enel
Coelba
Copel
CPFL
Celpa
2nd

5
Light Energia: generation segment
Light Energia accounted for 8.2% of Light’s Consolidated Revenues and 16% of Adj. EBITDA(2) in 2017
Generation Plants: Fully Owned
RJ
3
2
1
100% ACL: Free Trading
Energy sold to LightCom
Fixed Price Contracts
Generation: Installed Capacity (GW)-Private Sector Companies (1)
8.3
7.0
3.3
2.7
2.3
2.2
1.6
1.3
1.1
1.1
1.0
CTG
Engie
CPFL
AES Tiete
EDP
Eneva
Neoenergia
Enel
Brookfield
CPFL Renovaveis
Light 11th
Source: (1) ANEEL and Abradee(2) Adjusted EBITDA as EBITDA plus equity in the earnings of subsidiaries, other operating revenue (expenses), provisions and financial assets and liabilities of the sector. EBITDA as net income (loss) for the
period plus net financial result, income tax and social contribution expenses, and depreciation and amortization costs and expenses.
3
Concession until 2026
1 HPP Ilha dos Pombos 187 MW Capacity
2 Complexo de Lajes 612 MW Capacity
HPP Santa Branca 56 MW Capacity
6
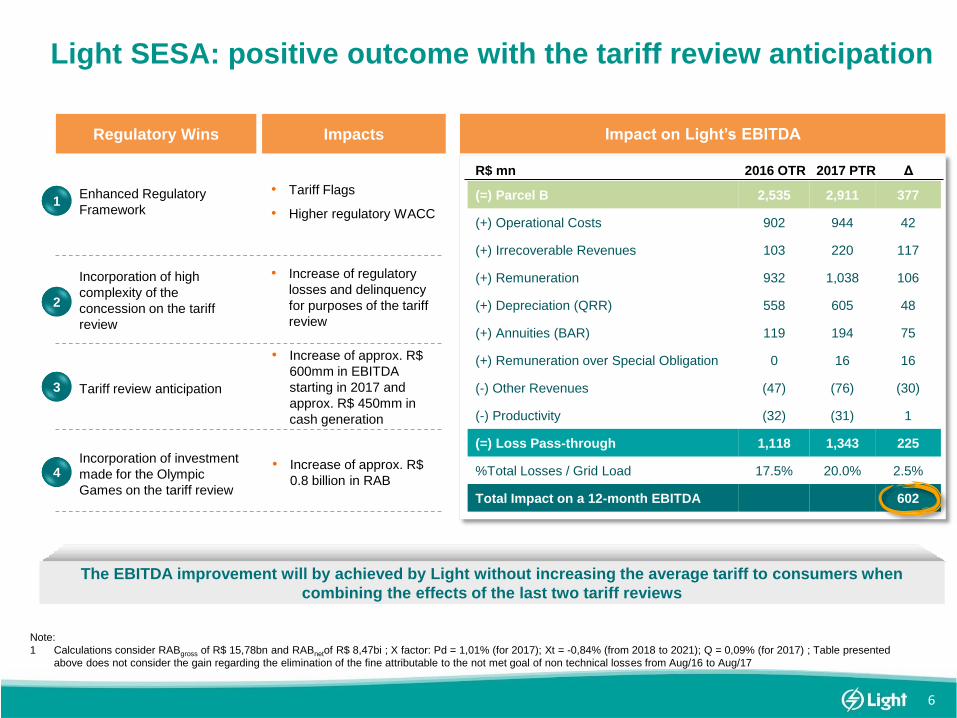
Regulatory Wins Impacts
Enhanced Regulatory
Framework
• Tariff Flags
• Higher regulatory WACC
Incorporation of high
complexity of the
concession on the tariff
review
• Increase of regulatory
losses and delinquency
for purposes of the tariff
review
Tariff review anticipation
• Increase of approx. R$
600mm in EBITDA
starting in 2017 and
approx. R$ 450mm in
cash generation
Incorporation of investment
made for the Olympic
Games on the tariff review
• Increase of approx. R$
0.8 billion in RAB
Impact on Light’s EBITDA
1
2
3
4
(=) Parcel B 2,535 2,911 377
(+) Operational Costs 902 944 42
(+) Irrecoverable Revenues 103 220 117
(+) Remuneration 932 1,038 106
(+) Depreciation (QRR) 558 605 48
(+) Annuities (BAR) 119 194 75
(+) Remuneration over Special Obligation 0 16 16
(-) Other Revenues (47) (76) (30)
(-) Productivity (32) (31) 1
(=) Loss Pass-through 1,118 1,343 225
%Total Losses / Grid Load 17.5% 20.0% 2.5%
Total Impact on a 12-month EBITDA 602
2017 PTR2016 OTR ΔR$ mn
The EBITDA improvement will by achieved by Light without increasing the average tariff to consumers when
combining the effects of the last two tariff reviews
Note:
1 Calculations consider RABgross of R$ 15,78bn and RABnetof R$ 8,47bi ; X factor: Pd = 1,01% (for 2017); Xt = -0,84% (from 2018 to 2021); Q = 0,09% (for 2017) ; Table presented
above does not consider the gain regarding the elimination of the fine attributable to the not met goal of non technical losses from Aug/16 to Aug/17
Light SESA: positive outcome with the tariff review anticipation

7
Covenants agreed with
ANEELCorporate Governance
• Covenants agreed with ANEEL
are more flexible than the
current covenants of debt
Light SESA is a subsidiary of Light S.A.,
company listed at the highest level of
corporate governance in
BM&FBOVESPA
Net Debt
(EBITDA – QRR)
1
(0.8 x SELIC)≤
For 2018:
Net Debt
(EBITDA – QRR)
1
(1.11 x SELIC)≤
For 2019 onwards:
QRR = regulatory depreciation
• Requirement of a High level of
corporate governance
DEC / FEC
(Quality Indicators)
18,15 18,70
12,35 12,61 11,709,14 7,81
11,99 11,399,80
8,23 8,14 8,02 7,84
2012 2013 2014 2015 2016 2017 2018 2019 2020 2021 2022
Actual DEC
ANEEL Results Plan (2016 and 2017) and New Goals 5th amendment (2018onwards)
8,39 8,406,60 6,44 6,48
5,26 4,71
6,36 5,99 6,01 5,72 5,43 5,15 4,86
2012 2013 2014 2015 2016 2017 2018 2019 2020 2021 2022
Actual FEC
ANEEL Results Plan (2016 and 2017) and New Goals 5th amendment (2018onwards)
FEC (times) 12 Months
DEC (hours) 12 Months
Actual Jun//2018
Actual Jun/2018
Light SESA: financial and operational targets agreed with ANEEL

8
Light SESA: diversified concession area with captive costumer base in
Rio de Janeiro metropolitan region
Retail-Focused Distribution Concession in Brazil’s 2nd Largest Metropolitan Area
Consumer ConcentrationConsumed Energy by Client Segment (GWh)
Residential36%
Comercial31%
Industrial19%
Others14%
Residential40%
Comercial18%
Industrial23%
Others19%
Light S.A
All Sector
Top 20 15%
Others 85%
Average Temperature
21
23
25
27
29
31
Jan Feb Mar Apr May Jun Jul Ago Sep Oct Nov Dec
RJ

9
23.92%21.75%
22.98%
16.48%
19.89% 20.62%
2Q16 2Q17 2Q18
Gap Between Real Losses and Regulatory
Target (%)
7.44 p.p. 1.86 p.p. 2.36 p.p.
Difference between actual loss and regulatory target
Changes in total losses 12 months
Light SESA: strategic remodeling of Losses’ Program (1 of 3)
Focus: Loss Reduction in Non-Risk Areas
New Approach to Management of Losses
Regulatory Target
Actual Losses

10
Increase of the Collection Rate
100.2% 97.3%98.2%
Total
99.3%
Retail
101.2% 101.5%
Large Clients
97.7% 100.0%
Public Sector
1S17 1S18
Collection Rate (Considering Overdue Installments)
105.0%
4Q16
98.6%
3Q162Q16 1Q17
97.6% 93.1%104.0%
2Q17
98.3%
3Q17
92.0%
4Q17
97.6%
1Q18
102.8%
2Q18
Total Collection Rate (Considering Overdue Installments)
Light SESA: strategic remodeling of Losses’ Program (2 of 3)
11
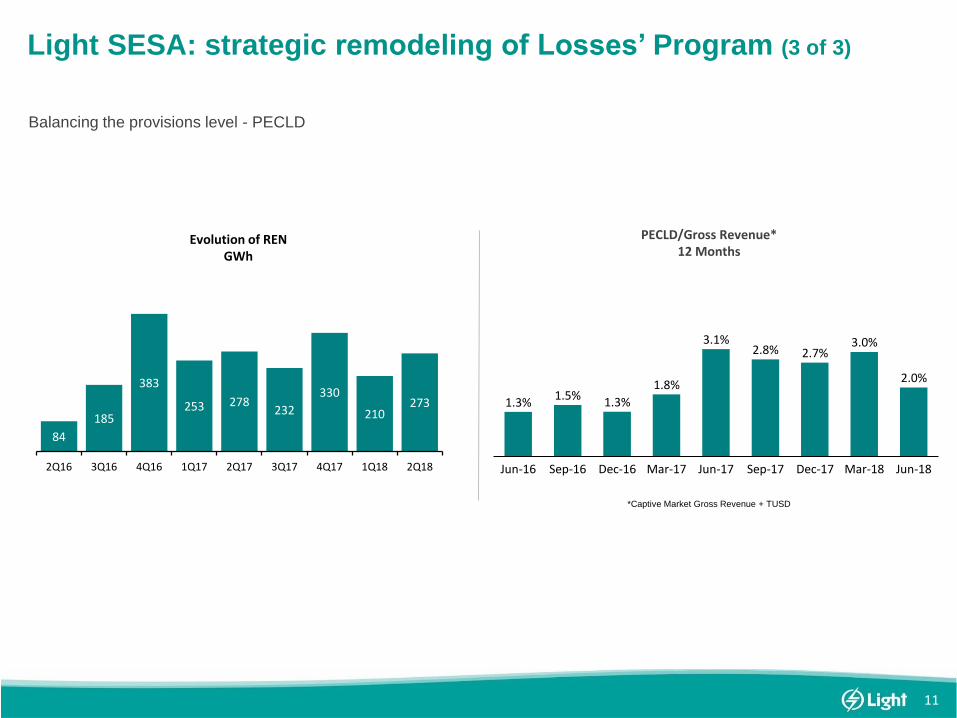
Balancing the provisions level - PECLD
Evolution of RENGWh
84
185
383
253 278232
330
210273
2Q16 3Q16 4Q16 1Q17 2Q17 3Q17 4Q17 1Q18 2Q18
PECLD/Gross Revenue*12 Months
*Captive Market Gross Revenue + TUSD
Jun-16 Dec-16 Mar-17Sep-16 Jun-18Jun-17 Sep-17 Dec-17 Mar-18
1.3%1.5%
1.3%
1.8%
3.1%2.8% 2.7%
3.0%
2.0%
Light SESA: strategic remodeling of Losses’ Program (3 of 3)

12
R$ Millions 1S17 1S18
CVM EBITDA 661 849
(+/-) Equity Income (33) 39
(+/-) Other Operating Revenues (expenses) 74 30
Adjusted EBITDA 702 918
(-) Income Tax and Social Contribution (158) (90)
(-) Interest (362) (240)
(-/+) Accounts Receivable (37) (125)
(-/+) Financial assets and Liabilities of the sector 85 (254)
(-/+) Suppliers 32 (358)
(-/+) Others (254) (3)
Cash From Operations (CFO) 8 (152)
(-) Capex (236) (292)
(-) Minority Investments (119) (60)
Free Cash Flow to Firm (FCFF) (347) (504)
(-) Amortization (59) 806
Free Cash Flow to Equity (FCFE) (406) 302
(-) Dividends - (30)
Reflection of Operational Improvement
Lower Cost of Debt
Reflection of Operational Improvement
Pass through on next Tariff Reviews
1S17 1S18
(77) 102
(432) (250)
Excluding the Financial assets and Liabilities of the sector
Evolution of Free Cash Flow
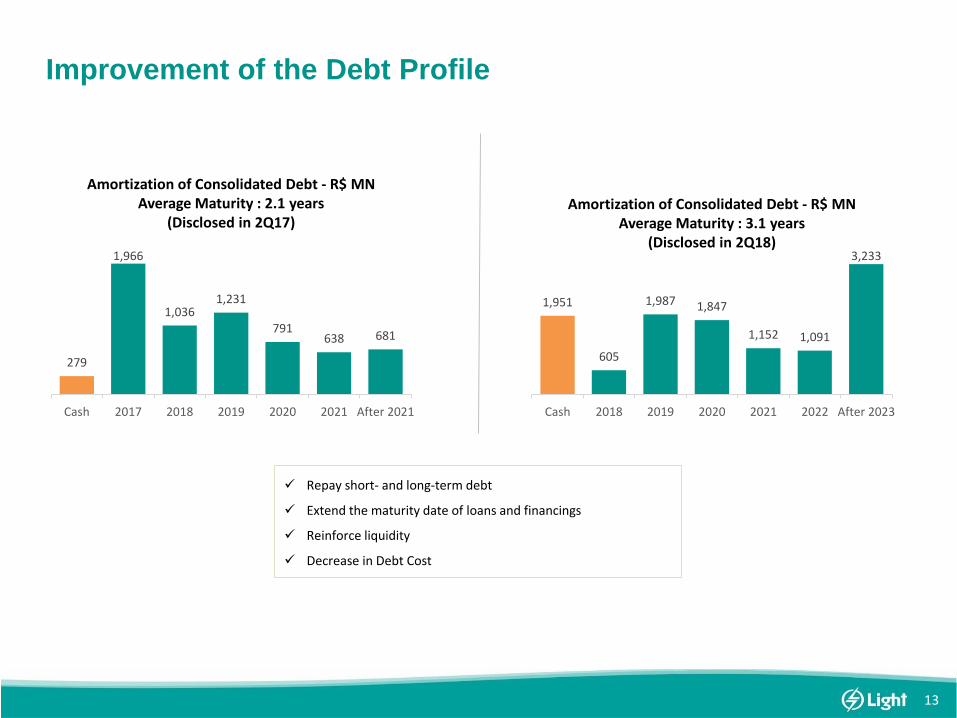
13
279
1,966
1,0361,231
791638 681
Cash 2017 2018 2019 2020 2021 After 2021
Amortization of Consolidated Debt - R$ MNAverage Maturity : 2.1 years
(Disclosed in 2Q17)
1,951
605
1,987 1,847
1,152 1,091
3,233
Cash 2018 2019 2020 2021 2022 After 2023
Amortization of Consolidated Debt - R$ MNAverage Maturity : 3.1 years
(Disclosed in 2Q18)
Repay short- and long-term debt
Extend the maturity date of loans and financings
Reinforce liquidity
Decrease in Debt Cost
Improvement of the Debt Profile
14
Luis Fernando Paroli Santos
CEO, Director of Business Development and Investor Relations
Fernanda Crespo
Head Of Participations and Investor Relations and Energy Business & Power Purchase
+ 55 21 2211 2508
Marcio Loures Penna
Investor Relations Specialist
+ 55 21 2211 2828
ri.light.com.br
Contacts

15
3
2Q18 Operational Highlights
Billed Market- GWh Billed Market- GWh
DEC - Hours (12 months) FEC - Times (12 months)
7,1906,824
7,160
2Q16 2Q17 2Q18
-0.4% 14,806 14,892 14,618
1S16 1S17 1S18
-1.3%
11.46 10.97
7.81
2Q16 2Q17 2Q18
-31.8%
6.30 6.09 4.73
2Q16 2Q17 2Q18
-24.9%
-29.1%
-23.0%
5th ANEEL Addendum = 9.80 hours 5th ANEEL Addendum = 6.01 times
4.9%
-1.8%

16
4
2Q18 Financial Highlights
Net Revenue - R$ MN EBITDA - R$ MN
PMSO - R$ MN Net Debt (R$ MN) andNet Debt/EBITDA - covenants (x)
2,0372,288
2,778
2Q16 2Q17 2Q18
36.4%
200 212
446
2Q16 2Q17 2Q18
123.0%
241
258 248
2Q16 2Q17 2Q18
2.9%
6,059 6,669
7,935
2Q16 2Q17 2Q18
3.98
3.23 3.32
21.5%
110.8%
-3.9%

17
Non Core Assets’
Note:
1 Sale of Alto Sertão III (433 MW) project to Brookfield ongoing. Binding Offer from CEMIG to purchase Chipley (148 MW)
2 PPA in Regulated Contracting Environment
ProjectInstalled Capacity
(MW)Description Shareholders
Light ESCO n/A ► Energy efficiency subsidiary
► Sale agreement signed in March ‘18 with Ecogen
(Mitsui Group)
► Closing subject to conditions precedent
► Light: 100%
Renova
672
► Renewable energy company
► Focus on assets and projects sale 1
► Light: 17.2%
► CEMIG: 36.2%
► Others: 46.6%
Belo Monte
11,223
► Operations started in 2016
► 100% of assured energy (4,571 MWavg) achieved in
Jan '18
► Light: 2.5%
► CEMIG: 7,3%
► Eletrobras Group: 49.9%
► Others: 40.3%
Guanhães
44
► 4 SHPPs located in Minas Gerais
► Winner of ANEEL’s A-5 auction in 20142
► Construction restarted in Nov’17 (conclusion
expected for 2Q19)
► Light: 51%
► CEMIG: 49%
Itaocara
150
► Project will not be implemented
► 70% of PPAs with DisCos cancelled
► Interactions with ANEEL to cancel the concession
► Light: 51%
► CEMIG: 49%
Light S.A.: improved liquidity, FCF and leverage (3 of 3)
Reduction of Exposure to Non Core Assets - Strategic direction to focus on core business