more big challenges ahead - wa
TRANSCRIPT

STATE BUDGET UPDATE More Big Challenges Ahead
November 2014

Washington’s economy is rebounding … but at a very slow pace
2
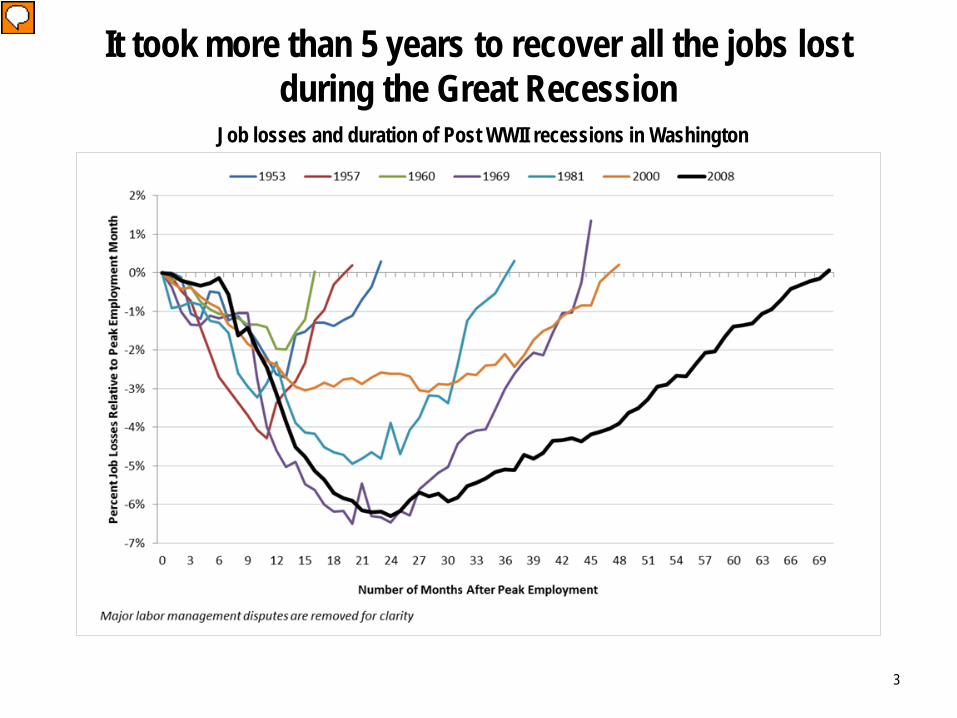
It took more than 5 years to recover all the jobs lost during the Great Recession
3
Job losses and duration of Post WWII recessions in Washington

State revenue collections are also rebounding, but at a much slower pace
than after previous recessions
4

State revenue remains well below historic growth trend
$5,000
$10,000
$15,000
$20,000
$25,000
2001 2002 2003 2004 2005 2006 2007 2008 2009 2010 2011 2012 2013 2014 2015 2016 2017
Total Near General Fund
Total Near General Fund assuming 4.5% growth
Forecast
5

Looking ahead to the 2015–17 budget … It could be more challenging than the
2013–15 budget
6

Why will the 2015–17 budget be so difficult? We solved 2013–15 budget shortfall largely by relying on solutions not available again. For example, we:
Redirected $387 million in capital budget — including $277 million from the Public Works Assistance Account — to cover operating expenses.
Captured $351 million in savings by expanding Medicaid under the Affordable Care Act.
Raised $272 million by temporarily extending the hospital safety net assessment.
The budget includes new revenue — $159 million from the estate tax (Bracken) fix and $99 million in telecom reform savings.
7

The June 2013 forecasts also helped — $230 million in additional revenue
and $229 million in caseload savings.
Even after all that, we once again needed to suspend teacher COLAs, and did not provide state
employee pay raises
And still we fell short of our $1.5 billion target for meeting our basic education obligation
8

State revenue collections are expected to grow by more than $2.5 billion ...
What’s the problem?
9

Preliminary 2015−17 Operating Budget Outlook Near General Fund (GF-State, Education Legacy Trust Account, Opportunity Pathways Account)
Projected Additional Revenue
Projected Additional Spending Needs
$2.8B $750M
Maintenance & Carry Forward Estimated $1.9B
I-1351 $2B
McCleary $1.2B
Pension costs $275M
Debt service $200M
State employee health care $190M
I-732/K-12 salaries $400M
Bargaining $583M
Highest Priority Policy Needs $500M
$2.45B
10

About 2/3 of the budget is protected by constitutional and federal requirements . . . So we must look to the other 1/3 for savings
K-12 Basic Education 42.3%
Debt Service/ Pensions 5.9%
Mandatory Medicaid 10.2%
Other Human Services 13%
Higher Education 9.2%
Corrections 5%
Other 6.5%
Mandatory Services 8%
Unprotected
Protected
11

Some perspective on the structural problem we face in Washington
12

FY 2016 FY 2017 FY 2018 FY 2019
Meeting our statutory education obligations — $5.7 billion needed over next 2 biennia
$760 million
$1.3 billion
$1.7 billion
$2 billion Estimated cost to continue phasing in HB 2776 (McCleary)
Projected cost of Initiative 732 (teacher COLAs)
Projected cost of enrollment and other mandatory increases
13

3.5%
4.0%
4.5%
5.0%
5.5%
6.0%
6.5%
7.0%
7.5%
1983 1987 1991 1995 1999 2003 2007 2011 2015 2019
Fiscal Year
In 1990, GF-S revenue equaled about 7% of total personal income.
If the same were true today, we would have about $15 billion in additional revenue for the current biennium.
Washington State Economic and Revenue Forecast Council, October 2014
Projected
General Fund-State revenue as percentage of Washington personal income
Revenue collections are at historically low levels when compared to overall economy

$50
$70
$90
$110
$130
$150
$170
$190
$210
$230
Alas
kaNo
rth D
akota
New
York
Wyo
ming
Verm
ont
Maine
New
Jerse
yMi
nnes
otaW
iscon
sinW
est V
irgini
aCa
liforn
iaCo
nnec
ticut
Hawa
iiRh
ode I
sland
Delaw
are
Illino
isIow
aOh
ioPe
nnsy
lvania
Nebr
aska
Mass
achu
setts
Kans
asMi
chiga
nNe
w Me
xico
Indian
aAr
kans
asKe
ntuck
yNe
vada
Maryl
and
Color
ado
Oreg
onNo
rth C
aroli
naMi
ssiss
ippi
Utah
WAS
HING
TON
Monta
naLo
uisian
aAr
izona
Texa
sIda
hoNe
w Ha
mpsh
ireGe
orgia
South
Car
olina
Florid
aVi
rgini
aOk
lahom
aMi
ssou
riAl
abam
aTe
nnes
see
South
Dak
ota
In 1995, Washington ranked 11th in state and local tax collections … By 2011, we ranked 35th
State and Local Tax Collections Per $1,000 Personal Income
Fiscal Year 2011
Washington $98.95
Source: Bureau of Economic Analysis and Census Bureau U.S. Department of Commerce
U.S. Average = $108.31
15