moorpark sub-area local capacity alternative study methodology and results ... validation of hourly...
TRANSCRIPT

Moorpark Sub-Area
Local Capacity Alternative Study August 16, 2017

Moorpark Sub-Area Local Capacity Alternative Study August 16, 2017
i
Table of Contents Executive Summary .................................................................................................. 1
Introduction ............................................................................................................... 3
2.1. Background ........................................................................................................ 3
2.2. Overview of the Moorpark Local Capacity Sub-Area .......................................... 5
2.3. Current Projection of Local Capacity Requirements ........................................... 6
Input Data and Assumptions ..................................................................................... 7
3.1. Resource Portfolio and Scenarios Evaluated ..................................................... 7
3.2. Forecast Peak and Hourly Load ......................................................................... 9
3.3. Preferred Resource and Storage Hourly Output Characteristics ...................... 12
3.4. Voltage Stability Area Load Limit ..................................................................... 13
Study Methodology and Results ............................................................................. 15
4.1. Determination of Initial Battery Storage Capacity ............................................. 16
4.2. Hourly Load and Resource Analysis ................................................................ 17
4.3. Validation of Hourly Results in Power Flow ...................................................... 19
4.4. Summary of Study Results ............................................................................... 20
Results for Scenario 1 ............................................................................... 20
Results for Scenario 2 ............................................................................... 21
Results for Scenario 3 ............................................................................... 22
Capital Cost Estimates ........................................................................................... 24
Stakeholder Comments .......................................................................................... 26
Conclusion .............................................................................................................. 29

Moorpark Sub-Area Local Capacity Alternative Study August 16, 2017
ii
List of Tables
Table 1-1 ......................................................................................................................... 3
Table 2-1 ......................................................................................................................... 6
Table 2-2 ......................................................................................................................... 7
Table 3-1 ......................................................................................................................... 8
Table 3-2 ....................................................................................................................... 11
Table 3-3 ....................................................................................................................... 12
Table 3-4 ....................................................................................................................... 13
Table 4-1 ....................................................................................................................... 17
Table 4-2 ....................................................................................................................... 19
Table 4-3 ....................................................................................................................... 21
Table 4-4 ....................................................................................................................... 22
Table 4-5 ....................................................................................................................... 23
Table 5-1 ....................................................................................................................... 25
Table 5-2 ....................................................................................................................... 25
Table 7-1 ....................................................................................................................... 29
Table 7-2 ....................................................................................................................... 30
List of Figures
Figure 2-1 ........................................................................................................................ 5
Figure 3-1 ...................................................................................................................... 10
Figure 3-2 ...................................................................................................................... 14
Figure 3-3 ...................................................................................................................... 15
Figure 4-1 ...................................................................................................................... 16

Moorpark Sub-Area Local Capacity Alternative Study August 16, 2017
1
Executive Summary Pursuant to the California Energy Commission’s (CEC) request in the June 9, 20171 and June 20, 20172 Committee orders, the California Independent System Operator Corporation (ISO) has prepared a study regarding local capacity alternatives to the Puente Power Project (Puente). In the study, the ISO analyzed three portfolios of capacity alternatives that were designed to meet the local capacity requirements (LCR) in the absence of Puente. The study does not, however, address the timing or feasibility for procurement of the alternative resources portfolios, but instead quantifies the amount of preferred resources, energy storage, and/or reactive power devices that would be necessary to meet LCR in the Moorpark sub-area.
The ISO, in consultation with Southern California Edison (SCE), developed three alternative resource scenarios to meet the Moorpark LCR in the absence of Puente. Each of these scenarios begins with a common set of incremental distributed resources that consists of an incremental 80 MW of energy storage enabled demand response resources, 25 MW of incremental photovoltaic (PV) solar/energy storage hybrid resources, and approximately 30 MW of existing slow responding demand response resources coupled with incremental energy storage to enable these resources to meet local area contingencies. This represents an incremental 135 MW of distributed resources that are assumed to be procured or properly enabled in the Moorpark sub-area under all three scenarios.
This 135 MW of incremental distributed resources is not sufficient to meet the local capacity requirements for the Moorpark sub-area. As a result, the ISO studied three scenarios to quantify the amount of additional “grid-connected” resources necessary to meet the applicable reliability criteria.3 The ISO conducts its planning studies to adhere to NERC, WECC, and ISO transmission planning standards as well as the local capacity technical study criteria set out in the ISO tariff4 to ensure adequate local area
1 Committee Order Granting Applicant’s Motion to Exclude the Supplemental Testimony of James H. Caldwell and Accepting the California Independent System Operator’s Offer to Conduct a Special Study (TN#218016) (June 9 Order). 2 Committee Orders Extending the Time for the California ISO Special Study, Denying the City of Oxnard’s Request for Additional Time, Revising the Committee Schedule, and Cancelling the June 28, 2017 Committee Conference (TN#219815) (June 20 Order). 3 The ISO uses North American Electric Reliability Corporation (NERC) reliability standards, Western Electricity Coordinating Council (WECC) regional criteria, ISO planning standards and local capacity technical study criteria set out in the ISO’s tariff (Section 40.3.1.1, Local Capacity Technical Study Criteria). The latter was most relevant in this study. 4 ISO Tariff Section 40.3.1.1 provides that “[t]he Local Capacity Technical Study will determine the minimum amount of Local Capacity Area Resources needed to address the Contingencies identified in Section 40.3.1.2.”

Moorpark Sub-Area Local Capacity Alternative Study August 16, 2017
2
reliability. In this case, the local capacity technical study criteria set out in the ISO tariff to avoid voltage collapse for the contingency events set out in the requirements are the most limiting and are the basis for establishing the volume of required local capacity.
In the Scenarios 1 and 2, the ISO determined the amount of (1) in-front-of-meter (IFOM) battery storage; or (2) dynamic reactive power, respectively, necessary to meet local capacity requirements described above. For Scenario 3, the ISO assumed the Ellwood Generating Facility, a 54 MW gas-fired plant located in the Moorpark sub-area, will retire instead of being refurbished. The ISO then determined the amount of IFOM battery storage that would be necessary under this scenario. The additional “grid-connected” resources needed to meet the local capacity technical study criteria for each of the three scenarios are detailed below:
• Scenario 1 – 125 MW of energy storage resources with a nine hour continuous discharge duration would be necessary to satisfy local capacity requirements consistent with the local capacity technical study criteria.
• Scenario 2 – A 240 Mvar reactive power device would be necessary to satisfy local capacity requirements consistent with local capacity technical study criteria. Unlike Scenario 1 and 2, however, the reactive support does not also provide protection from loss of load through load shedding to avoid thermal overloads; load shedding is not desirable but is permitted under the local capacity technical study criteria in the circumstances being studied.
• Scenario 3 – If the 54 MW Ellwood Generating Facility is retired rather than refurbished, 240 MW of energy storage resources would be necessary to satisfy local capacity requirements consistent with the local capacity technical study criteria. 115 MW of this energy storage capacity would need a five hour continuous discharge duration, 65 MW would need a nine hour continuous discharge duration, and 60 MW would need a ten hour continuous discharge duration.
The ISO also conducted a summary cost comparison of the alternative scenarios based on publicly available information. The ISO’s cost comparison indicates that the estimated capital costs for scenarios 1 and 3 are significantly higher than the estimated capital costs for the Puente project, as shown in Table 1-1 below. The estimated capital costs for scenario 2 is only slightly higher than the Puente project but this scenario does not provide the same level of protection against post-contingency load shedding to mitigate thermal overloads. These costs represent initial installation costs and do not include ongoing operating or maintenance costs, or replacement costs to adjust for shorter expected lifespans of some equipment versus others.

Moorpark Sub-Area Local Capacity Alternative Study August 16, 2017
3
Table 1-1
Capital Cost Estimates of Resource Portfolios
Resource Description Estimated cost (millions)
Scenario 1 Incremental distributed resources plus grid connected battery storage
$805
Scenario 2 Incremental distributed resources plus reactive device $309-$359
Scenario 3
Incremental distributed resources plus grid connected battery storage (if the Ellwood Generating Station is retired)
$1,116
Puente Power Project
262 MW combustion turbine generator $299
Introduction 2.1. Background
The California Public Utilities Commission (CPUC) authorized SCE to enter into a long term resource adequacy power purchase agreement with NRG Oxnard Energy Center, LLC (NRG) for the 262 MW gas-fired Puente facility.5 The project was approved to offset the local capacity requirements in the Moorpark Sub-Area that result from the expected retirement of close to 2000 MW of once-through-cooled (OTC) generation at the end of 2020 due to state policy limiting the use of coastal and estuarine water. NRG subsequently applied to the CEC for certification to construct and operate the Puente facility.
In connection with its consideration of NRG’s application, the CEC accepted the ISO’s offer to study various portfolios of preferred resources6 that could meet the identified need, and indicated that an ISO special study of one or more alternative resource portfolios that considers the parameters and assumptions below would be most useful.
• The necessary resources are in place to meet the reliability need in the Moorpark Sub-Area in 2021 with timely Once-Through Cooling (OTC) compliance;
5 CPUC Decision 16-05-050. 6 To be precise, “preferred resources” as defined in CPUC proceedings applies more specifically to demand response and energy efficiency, with renewable generation and combined heat and power being next in the loading order. The term is used more generally here consistent with the more general use of the resources sought ahead of conventional generation.

Moorpark Sub-Area Local Capacity Alternative Study August 16, 2017
4
• The current OTC compliance deadline(s) for Ormond Beach Units 1 & 2 and Mandalay Units 1 & 2 of December 31, 2020 are not extended and the facilities retire;
• Include presently existing generation, contracted generation, and preferred resources and storage the ISO expects to be on line to meet reliability needs in the Moorpark Sub-Area by 2021; and
• To the extent that it may be helpful in identifying the type and quantity of new preferred resources and storage that could be available by 2021, the ISO may choose to review and consider SCE’s 2015 Preferred Resources Pilot RFO, 2016 Aliso Canyon Energy Storage RFO, and the 2016 Aliso Canyon Design, Build, and Transfer RFP.7
Accordingly, the ISO developed a conceptual study scope based on the parameters and assumptions stipulated in the CEC’s June 9 Order. The study was not initially intended to assess the cost, timing or feasibility of procurement of the alternative resources. The study scope was amended to include a discussion of capital costs based on publicly available information.
Starting with a common base set of assumed incremental distributed resources, the ISO’s fundamental objectives for each preferred resource scenario was to determine the additional amount of grid connected battery storage or dynamic reactive power needed to meet local capacity requirements consistent with the applicable reliability criteria for the Moorpark sub-area. With respect to battery storage, the ISO examined various blocks of battery storage defined by capacity (in MW) amount and discharge duration (in hours). The ISO assessed the minimum additional energy storage discharge capacity required for each block and derived the minimum discharge duration (hours) capability of each block while operating each block at its maximum discharge capacity. In addition, the ISO verified that each energy storage block can be charged during off-peak hours given each block’s charging capacity and minimum charging duration.
The studies performed to reach the objectives for each scenario included: (1) determining the minimum additional energy storage capacity requirement; (2) determining the area voltage stability load limit; (3) performing an hourly load-resource assessment; and (4) validating the resource dispatch determined in the hourly load-resource assessment.
A common base set of incremental distributed preferred resources were assumed in all scenarios and were developed through discussion with SCE staff, relying on their experience with past procurement and knowledge of electricity customer data in the Moorpark sub-area.
7 June 9 Order, p. 4.

Moorpark Sub-Area Local Capacity Alternative Study August 16, 2017
5
The ISO conducted a stakeholder call on June 30, 2017 to present and discuss the Moorpark need, the scope of the ISO study, and the draft base incremental distributed resource assumptions. Stakeholders were provided the opportunity to ask questions during the call and provide written feedback. Written comments were received from a number of parties and have been posted on the ISO’s website.8 The comments and the ISO’s consideration of the feedback are summarized in Section 5 of this report.
This report documents the ISO’s special study of alternative resource portfolios performed for the Moorpark Sub-Area in accordance with the CEC-specified parameters and assumptions.
2.2. Overview of the Moorpark Local Capacity Sub-Area An overview of the Moorpark local capacity Sub-Area is shown in Figure 2-1. The forecasted 2022 Moorpark Sub-Area peak load is 1723 MW.9 This value includes 72 MW of Additional Achievable Energy Efficiency (AAEE) and the impact of 239 MW of behind-the-meter solar photovoltaic generation (BTM PV). Details about the load forecast are presented in Section 3.2.
Figure 2-1
Overview of the Moorpark Sub-Area
8 http://www.caiso.com/Pages/documentsbygroup.aspx?GroupID=7DFD7E72-8C3C-4BD5-9615-3313D0DBE22C. 9 See http://www.energy.ca.gov/2016_energypolicy/documents/2016-12-08_workshop/LSE-BA_Forecasts.php, re-posted on February 27, 2017.

Moorpark Sub-Area Local Capacity Alternative Study August 16, 2017
6
Table 2-1 provides the net qualifying capacity (NQC) of resources expected to be available in the Moorpark Sub-Area in the post 2020 period.
Table 2-1
Available Resources in the Post 2020 Period
Existing generation 2336 MW
Expected Retirements including Mandalay 3 (2076 MW)
Existing and approved preferred resources 30 MW
Available resources in the post 2020 period 290 MW
2.3. Current Projection of Local Capacity Requirements The applicable reliability criteria provide that the most critical contingency in a local area establishes the minimum local capacity requirements. In the Moorpark sub-area, the most critical contingency that sets the minimum local capacity requirements is the loss of the Moorpark–Pardee #3 230 kV line followed by the loss of the Moorpark–Pardee #1 and #2 230 kV lines, which causes voltage collapse. Voltage collapse is not allowed under such a contingency event based on the applicable planning standards.10 The most recent California ISO LCR study; i.e., the 2022 Local Capacity Technical Analysis, established an LCR of 554 MW for the Moorpark Sub-Area.11 Absent Puente and Mandalay Generating Station Unit 3 (Mandalay 3), there will be a 264 MW local capacity deficiency by 2022 in the Moorpark area as shown in Table 2-2. If Mandalay 3 remains in service, the local capacity requirement deficiency in the Moorpark sub-area would be reduced by 130 MW in the near term.12
10 ISO Tariff Section 40.3.1.1(2). 11 http://www.caiso.com/Documents/Final2022Long-TermLocalCapacityTechnicalReport.pdf, at Page 61. 12 The default assumption in long term planning studies for Mandalay 3, which is currently 47 years old, is and has been that it would be retired in accordance with the CPUC 2017 Assumptions and Scenario for Long-Term Planning (Draft) which states: Retirement assumptions are also based on facility age as a proxy for determining a facility's operational life. Similarly to renewable and hydro retirement assumptions, the operational history of non-renewable/hydro facilities will not be considered in this planning cycle. A “Low” level of retirement assumes that “Other” resource types stay online unless there is an announced retirement date. A “Mid” level assumes a retirement schedule based on resource age of 40 years or more. A “High” level assumes a retirement schedule based on resource age of 25 years or more. Facilities which have an existing contract that runs beyond their assumed retirement age shall instead be assumed to operate until the expiration of the contract. Thus, a 38 year old facility in the “Mid” level that has a three year contract should be assumed to retire at 41 years once that contract expires. Commission staff will periodically request confidential procurement data from the utilities to screen for such facilities. “Other” includes all resources whose retirement assumptions are not explicitly described

Moorpark Sub-Area Local Capacity Alternative Study August 16, 2017
7
Table 2-2
Projected Moorpark Sub-Area Local Capacity Deficiency13
2022 LCR 554 MW
Available resources in the post 2020 period 290 MW
Deficiency 264 MW
Input Data and Assumptions 3.1. Resource Portfolio and Scenarios Evaluated
In accordance with the parameters and assumptions the CEC specified, the ISO collaborated with SCE to develop a base set of incremental distributed resources to be coupled with large scale IFOM battery storage and/or a dynamic reactive power device to meet local capacity requirements consistent with the applicable reliability criteria.14 This study assessed the capacity and duration of the IFOM battery storage or dynamic reactive power support needed, in addition to the base set of incremental distributed resources, to meet the applicable reliability criteria. The base set of incremental distributed resources assumed in the study is described in Table 3-1.
above - for example, peaker and cogeneration facilities. The default assumption for planning studies is a “Mid” level of retirement for “Other” resources. 13 The MW amount of resources needed to fill the local capacity deficiency is dependent on a number of factors including location, reactive power capability and output characteristics of the resources. 14 The resource portfolio and scenarios were presented during a stakeholder call on June 30, 2017.
Moorpark Sub-Area Local Capacity Alternative Study August 16, 2017
8
Table 3-1
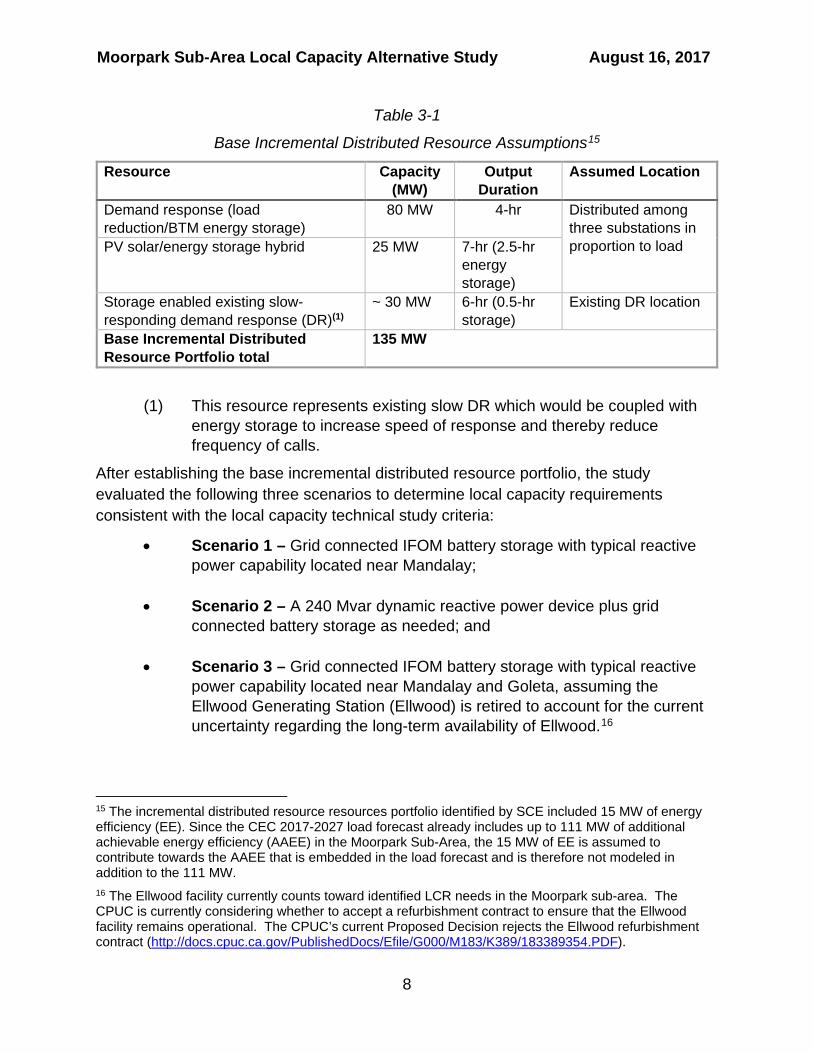
Base Incremental Distributed Resource Assumptions15
Resource Capacity (MW)
Output Duration
Assumed Location
Demand response (load reduction/BTM energy storage)
80 MW 4-hr Distributed among three substations in proportion to load PV solar/energy storage hybrid 25 MW 7-hr (2.5-hr
energy storage)
Storage enabled existing slow-responding demand response (DR)(1)
~ 30 MW 6-hr (0.5-hr storage)
Existing DR location
Base Incremental Distributed Resource Portfolio total
135 MW
(1) This resource represents existing slow DR which would be coupled with energy storage to increase speed of response and thereby reduce frequency of calls.
After establishing the base incremental distributed resource portfolio, the study evaluated the following three scenarios to determine local capacity requirements consistent with the local capacity technical study criteria:
• Scenario 1 – Grid connected IFOM battery storage with typical reactive power capability located near Mandalay;
• Scenario 2 – A 240 Mvar dynamic reactive power device plus grid connected battery storage as needed; and
• Scenario 3 – Grid connected IFOM battery storage with typical reactive power capability located near Mandalay and Goleta, assuming the Ellwood Generating Station (Ellwood) is retired to account for the current uncertainty regarding the long-term availability of Ellwood.16
15 The incremental distributed resource resources portfolio identified by SCE included 15 MW of energy efficiency (EE). Since the CEC 2017-2027 load forecast already includes up to 111 MW of additional achievable energy efficiency (AAEE) in the Moorpark Sub-Area, the 15 MW of EE is assumed to contribute towards the AAEE that is embedded in the load forecast and is therefore not modeled in addition to the 111 MW. 16 The Ellwood facility currently counts toward identified LCR needs in the Moorpark sub-area. The CPUC is currently considering whether to accept a refurbishment contract to ensure that the Ellwood facility remains operational. The CPUC’s current Proposed Decision rejects the Ellwood refurbishment contract (http://docs.cpuc.ca.gov/PublishedDocs/Efile/G000/M183/K389/183389354.PDF).
Moorpark Sub-Area Local Capacity Alternative Study August 16, 2017
9
The ISO modeled resources that incorporate reactive power capability with that capability in testing their adequacy to meet system needs. As the voltage stability concerns primarily establish the requirements for additional resources, both real and reactive power supply in the area play a role in supporting reliability, with the real power being generally more effective than reactive power and both real and reactive power required simultaneously. For example, the Puente plant is expected to provide 262 MW of real power and a minimum reactive power range of 130 Mvar lagging to 88 Mvar leading, meeting the ISO tariff requirement for synchronous generation to provide a reactive power range of 0.90 lag (producing VARs) and 0.95 lead (absorbing VARs) measured at the generator terminals.
When modeling grid connected storage with inverter technology, the ISO modeled those facilities using the range of reactive power support required by the ISO tariff, as that would be the minimum requirement from those asynchronous facilities as a condition of interconnection to the grid. The ISO tariff requirement is 0.95 leading to 0.95 lagging power factor measured at the high side of the generator substation.
In Scenario 2, the ISO tested the effectiveness of additional reactive support by modeling a 240 Mvar reactive support device in the area. This reactive support was incremental to the reactive support provided by other devices. However, this reactive support could be provided by increasing the capacity of the inverters at battery storage facilities to increase the reactive output capability of the inverter while also delivering the required MW output, to provide incremental reactive support beyond the minimum requirement for asynchronous generators. The 240 Mvar assumption was based on both (1) the range of dynamic reactive support provided by other projects recently moving forward in the ISO footprint, the majority of which are synchronous condensers, and (2) being a material but not excessive amount to model to reasonably demonstrate the impact of dynamic reactive support in offsetting other mitigations. The study results are independent of the actual source of reactive power support being provided.
3.2. Forecast Peak and Hourly Load As noted above, the forecasted 1-in-10 year 2022 Moorpark Sub-Area peak load is 1723 MW, which includes 72 MW of Additional Achievable Energy Efficiency (AAEE) and the impact of 239 MW of installed behind-the-meter solar photovoltaic generation (BTM PV).17 The load forecast is based on the California Energy Demand Updated Forecast for 2017-2027 as developed by the CEC; specifically the mid-demand baseline
17 BTM PV information is based on the amount the CEC provided for Big Creek West Zone. http://www.caiso.com/Documents/Final2017-2018StudyPlan.pdf, Table 4.6-2, Page 19.
Moorpark Sub-Area Local Capacity Alternative Study August 16, 2017
10
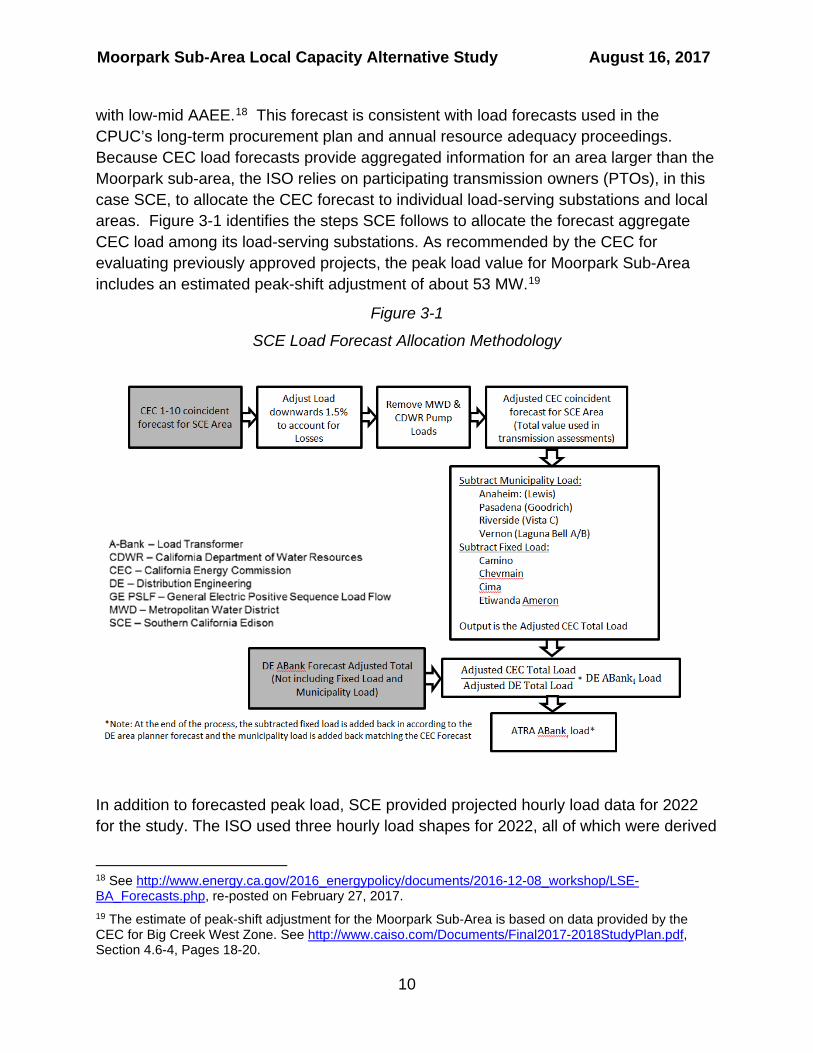
with low-mid AAEE.18 This forecast is consistent with load forecasts used in the CPUC’s long-term procurement plan and annual resource adequacy proceedings. Because CEC load forecasts provide aggregated information for an area larger than the Moorpark sub-area, the ISO relies on participating transmission owners (PTOs), in this case SCE, to allocate the CEC forecast to individual load-serving substations and local areas. Figure 3-1 identifies the steps SCE follows to allocate the forecast aggregate CEC load among its load-serving substations. As recommended by the CEC for evaluating previously approved projects, the peak load value for Moorpark Sub-Area includes an estimated peak-shift adjustment of about 53 MW.19
Figure 3-1
SCE Load Forecast Allocation Methodology
In addition to forecasted peak load, SCE provided projected hourly load data for 2022 for the study. The ISO used three hourly load shapes for 2022, all of which were derived
18 See http://www.energy.ca.gov/2016_energypolicy/documents/2016-12-08_workshop/LSE-BA_Forecasts.php, re-posted on February 27, 2017. 19 The estimate of peak-shift adjustment for the Moorpark Sub-Area is based on data provided by the CEC for Big Creek West Zone. See http://www.caiso.com/Documents/Final2017-2018StudyPlan.pdf, Section 4.6-4, Pages 18-20.

Moorpark Sub-Area Local Capacity Alternative Study August 16, 2017
11
by scaling recorded area load for historical years 2014, 2015 and 2016 to match the forecast 2022 1-in-10 year peak area load. Table 3-2 provides the Moorpark Sub-Area hourly recorded and projected load for the respective peak day.
Table 3-2
Moorpark Sub-Area Hourly Load Forecast for Year 2022
Hour
Moorpark Sub-Area Recorded Hourly Load (MW) (Note 1)
Moorpark Sub-Area Forecast Hourly Load for Year 2022 (MW)
Year 2014 Year 2015 Year 2016 Scaled from 2014
Scaled from 2015
Scaled from 2016
0 910.8 874.0 738.6 1024.4 970.0 867.1 1 844.7 812.7 684.9 950.1 902.0 804.1 2 805.0 768.6 650.3 905.4 853.1 763.4 3 774.9 749.8 633.1 871.6 832.2 743.3 4 761.3 739.5 629.6 856.2 820.8 739.2 5 773.5 755.0 652.3 870.0 837.9 765.9 6 841.3 817.8 709.2 946.2 907.7 832.7 7 921.5 900.8 784.2 1036.4 999.8 920.7 8 1000.2 978.3 846.0 1124.9 1085.8 993.2 9 1092.9 1088.5 943.6 1229.1 1208.1 1107.8
10 1203.6 1207.3 1035.5 1353.6 1339.9 1215.8 11 1306.7 1315.6 1124.7 1469.7 1460.2 1320.4 12 1384.5 1389.6 1207.3 1557.1 1542.3 1417.4 13 1444.3 1457.9 1300.1 1624.4 1618.1 1526.4 14 1494.2 1501.1 1366.4 1680.5 1666.0 1604.2 15 1525.6 1530.7 1418.4 1715.8 1698.8 1665.2 16 1531.5 1552.0 1464.7 1722.5 1722.5 1719.6 17 1504.1 1551.5 1467.2 1691.6 1721.9 1722.5 18 1447.8 1484.0 1423.3 1628.3 1647.1 1671.0 19 1418.3 1424.1 1353.7 1595.1 1580.6 1589.3 20 1418.4 1434.4 1316.8 1595.2 1592.0 1546.0 21 1329.4 1359.7 1220.0 1495.2 1509.1 1432.3 22 1186.0 1225.5 1077.4 1333.9 1360.2 1264.9 23 1037.3 1045.2 933.1 1166.7 1160.0 1095.5
Note 1 - The 2014, 2015, and 2016 peak loads for the Moorpark Sub-Area occurred on 9/15/2014, 9/9/2015 and 9/26/2016, respectively.
While this study was in progress it was discovered that the recorded load data was impacted by actual demand response calls. This means that some of the existing demand response was double counted when it was again used as a resource in the load and resource analysis. The information obtained from SCE, which is provided in Table 3-3, was not available in time for consideration in the analysis and therefore was not reflected in this analysis. Consequently, the results presented in this study tend to slightly underestimate the actual local capacity requirement need, but are not expected to materially alter the results.

Moorpark Sub-Area Local Capacity Alternative Study August 16, 2017
12
Table 3-3
Amount of Double-Counted Existing Demand Response
Demand Response called (MW) HE 9/16/2014 9/9/2015 9/26/2016 15 5.4 0.7 0.0 16 13.0 2.3 0.8 17 14.1 2.3 1.4 18 13.5 2.4 1.1 19 7.7 2.3 0.6
3.3. Preferred Resource and Storage Hourly Output Characteristics
The ISO used the output characteristics of preferred resources and storage summarized in Table 3-4 in the hourly load and resource analysis. For the previously authorized PV resources (5.7 MW), the ISO used available CEC hourly PV output data for a typical peak day (Sept 26, 2022) for Big Creek West Zone to calculate the hourly output. The ISO used the same CEC hourly PV output data to derive the duration of the energy storage component of the PV/energy storage hybrid resource included in the base incremental distributed resource portfolio.20 A battery storage unit is assumed to take 1.2 times as long to charge as it does to discharge per ISO 2017-2018 Transmission Planning Process Unified Planning Assumptions and Study Plan.21
20 As described in Section 3.1 above, the PV solar/energy storage hybrid distributed energy resources is designed to have a 25 MW capacity and 7-hour duration. 21 See http://www.caiso.com/Documents/Final2017-2018StudyPlan.pdf, Table 4.8-5, Page 35.

Moorpark Sub-Area Local Capacity Alternative Study August 16, 2017
13
Table 3-4
Hourly Characteristics of Preferred Resources and Energy Storage
Resource Capacity (MW)
Output characteristics/duration
Charging duration (battery storage)
Solar PV (Procurement approved in CPUC Decision 16-05-050)
5.7 MW (NQC)
Hourly profile N/A
EE (Procurement approved in CPUC Decision 16-05-050)
6 MW Full output during hours 13-21, variable in proportion to load outside those hours
N/A
Existing fast DR 18.1 MW 6 hours N/A Demand response (load reduction/BTM energy storage)
80 MW 4 hours ~5 hours
PV solar/energy storage hybrid 25 MW 7 hours ~3 hours Storage enabled existing slow-responding demand response (DR)
30 MW 6-hr ~ 1 hour
IFOM battery storage – Scenario 1
TBD TBD (initial: 4 hours) TBD (initial: ~5 hours)
IFOM battery storage – Scenario 2
TBD
IFOM battery storage – Scenario 3
TBD
3.4. Voltage Stability Area Load Limit The voltage stability area load limit for the Moorpark area for the critical contingency is determined using the Power-Voltage (P-V) method. In this method the load in the area is increased in small increments until the power flow solution diverges. The analysis is performed with all variable and runtime limited resources excluded in order to determine the limit that dictates dispatch of runtime-limited dispatchable resources and enables accounting for the variability in output of non-dispatchable intermittent resources. The dynamic reactive power device is modeled online in Scenario 2 whereas the Ellwood facility is removed from service in Scenario 3.

Moorpark Sub-Area Local Capacity Alternative Study August 16, 2017
14
Figure 3-2 provides the resulting P-V curves for the three scenarios under the critical contingency with preferred resources and energy storage excluded. In all three scenarios, voltage collapse occurs when the area load is below the forecast peak area load of 1723 MW. The local capacity resources must be dispatched whenever area load exceeds the voltage stability limit. Figure 3-3 shows the area load limit against the area load shapes for the five days around the peak day.
Figure 3-2
Determination of Voltage Stability Area Load Limit

Moorpark Sub-Area Local Capacity Alternative Study August 16, 2017
15
Figure 3-3
Hourly Area load and Voltage Stability Limit
Study Methodology and Results The study is based on power flow analysis coupled with a spreadsheet evaluation of hourly load and resource output. The latter takes into account hourly variation of area load and output of resources such as PV, energy or runtime limitation of resources such as demand response and energy storage, and availability of time windows for energy storage charging, when it acts as load.
The methodology has three parts which were performed for each of the three scenarios and three area load shapes.
Step 1 – Derive an initial estimate of storage battery capacity (MW) for use in the hourly load and resource analysis using power flow analysis of the peak load hour assuming all resources, including runtime limited resources, are online.
Step 2 – Perform hourly load and resource analysis to assess the storage battery duration needed, test and adjust storage battery capacity as needed, and evaluate ability to fully recharge for next day duty.

Moorpark Sub-Area Local Capacity Alternative Study August 16, 2017
16
Step 3 – Validate the hourly load and resource dispatch from previous step using power flow analysis and adjust storage capacity or duration as needed
The details of each step including methodology and results are presented in the next sections.
4.1. Determination of Initial Battery Storage Capacity Step 1 involved performing power flow analysis for the peak load hour using the 2022 summer peak LCR base case as a starting point with the critical contingency applied. The analysis is performed assuming all available resources including energy and run-time limited resources are online. The battery storage MW output and Mvar capability range is decreased in small decrements until the voltage stability point is reached as shown in Figure 4-1.
Figure 4-1
Determination of Initial Battery Storage Capacity

Moorpark Sub-Area Local Capacity Alternative Study August 16, 2017
17
Based on the above results, the battery storage sizes identified in Table 4-1 were used as the initial values for the hourly load and resource analysis and were subject to adjustment as needed based on the results of subsequent steps.
Table 4-1
Initial Battery Storage Capacity
Scenario Minimum Storage Capacity Block Sizes Assumed
Scenario 1 102 MW 1x55 MW, 1x50 MW
Scenario 2 0 N/A Scenario 3 161 MW 1x55 MW,
1x50 MW 1x60 MW
4.2. Hourly Load and Resource Analysis In Step 2, the ISO performed a spreadsheet analysis of peak day and next day requirements based on an hour-by-hour accounting of area load, resources, and imports. This step is necessary because the available resources considered in this study cannot run continuously during every hour of the day. When resources such as demand response, energy storage, solar PV and other hourly limited or variable resources are considered to fill local capacity need, as is the case here, the ISO must ensure that there are sufficient local resources during each hour of the day to meet applicable reliability criteria. The analysis involved:
• Comparing the voltage stability area load limit derived using power flow analysis excluding all variable and time-limited resources with;
• The net hourly area load obtained by subtracting from area load the hourly output of all available non-dispatchable resources; and
• Dispatching sufficient dispatchable resources whenever the net load for a given hour is greater than the load limit, recognizing all resources must be dispatched at the peak load hour and that demand response is to be used last.
Energy storage resources must be charged when area load is sufficiently below the voltage stability area load limit so that the charging load plus area load does not exceed the area load limit. In general, if the area load shape is relatively flat or if the amount of energy storage dependent local capacity resources is too large for the area, there will be times when the resources do not have adequate window to sufficiently recharge

Moorpark Sub-Area Local Capacity Alternative Study August 16, 2017
18
between discharging duties without violating the area load limit. The analysis performed includes assessment of the ability of energy storage resources to fully recharge for next day duty.
The hourly load and resource analysis initially assumed a four hour duration for the IFOM battery storage units determined in the previous step. The duration and in some cases the capacity is increased until the hour-by-hour requirement is met. As noted earlier, the ISO performed the analysis for each scenario and load shape. Results for up to three iterative steps for each case are provided in this report to demonstrate the need for each increase in battery storage duration or capacity.
As an example, the ISO provided the hour-by-hour analysis for Scenario 1 using the 2014 load shape in Table 4-2. The analysis for each of the scenarios and load shapes is provided in Appendix A. The first iteration of the load and resource analysis (shown in the first worksheet below) is based on a four-hour battery storage duration and indicates a local capacity deficiency for a total of seven hours. In this case, no deficiency was identified during the hours of battery charging. The second iteration of the load and resource analysis presented in the second worksheet, which is performed with a battery storage duration of nine hours, does not show a local capacity MW deficiency as can be seen from the values in the third row from last. The last two rows of the worksheet are related to the results of the power flow validation step and are discussed in the next section.

Moorpark Sub-Area Local Capacity Alternative Study August 16, 2017
19
Table 4-2
Hourly Analysis Example for Scenario 1 with 2014 Load Shape
4.3. Validation of Hourly Results in Power Flow In Step 3, the ISO validated the hourly results derived in Step 2 based on power flow modeling. This step is necessary because the spreadsheet load and resource analysis described in the preceding section does not consider reactive power and locational impacts. In this step, the ISO modeled the load and resource dispatch for each hour of the 24-hour period obtained from the hourly load and resource analysis in the power flow model to confirm that the dispatch yielded stable voltages. If the dispatch in any hour failed to yield stable voltages, the ISO increased battery storage capacity until valid results are obtained. The results of this step are provided in the last two rows of the second worksheet presented in Table 4-2 above. The results show which hour (or hours) failed the validation. In the case, the validation failed in hour 13, and the incremental increase in battery storage capacity was 5 MW. In this case, no validation failed due to energy storage charging.
Day 1MW 11 12 13 14 15 16 17 18 19 20 21 22 23 0 1 2 3 4 5 6 7 8 9 10
2022 Scaled Max Hourly Load 1470 1557 1624 1680 1716 1723 1692 1628 1595 1595 1495 1334 1167 1039 964 911 877 867 884 961 1045 1132 1257 1372LTPP 2012 Track 1 - Solar PV 5.7 (NQC) 4.8 5.4 5.4 5.2 4.3 3.0 1.4 0.1 0.0 0.0 0.0 0.0 0.0 0.0 0.0 0.0 0.0 0.0 0.0 0.0 0.3 1.6 3.1 4.3LTPP 2012 Track 1 - EE 6.0 5.1 5.4 6.0 6.0 6.0 6.0 6.0 6.0 6.0 6.0 6.0 4.6 4.1 3.6 3.4 3.2 3.1 3.0 3.1 3.3 3.6 3.9 4.4 4.8Load less LTPP PV & EE 1459.7 1546.3 1613.0 1669.3 1705.5 1713.5 1684.2 1622.2 1589.1 1589.2 1489.2 1329.3 1162.6 1035.5 960.5 907.5 874.2 864.0 881.3 957.4 1040.7 1126.2 1249.6 1362.7Load Serving Capability 1473 1473 1473 1473 1473 1473 1473 1473 1473 1473 1473 1473 1473 1473 1473 1473 1473 1473 1473 1473 1473 1473 1473 1473 1473Remaing Load to Serve (Note 1) (13.3) 73.3 140.0 196.3 232.5 240.5 211.2 149.2 116.1 116.2 16.2 (143.7) (310.4) (437.5) (512.5) (565.5) (598.8) (609.0) (591.7) (515.6) (432.3) (346.8) (223.4) (110.3)
IFOM ES Block 1 - 4hr (at Mandalay) 50.0 0.0 0.0 50.0 50.0 50.0 50.0 0.0 0.0 0.0 0.0 0.0 0.0 0.0 (50.0) (50.0) (50.0) (50.0) (50.0) 0.0 0.0 0.0 0.0 0.0 0.0IFOM ES Block 2 - 4hr (at Mandalay) 55.0 0.0 0.0 0.0 55.0 55.0 55.0 55.0 0.0 0.0 0.0 0.0 0.0 0.0 (55.0) (55.0) (55.0) (55.0) (55.0) 0.0 0.0 0.0 0.0 0.0 0.0
LTPP 2012 Track 1 - IFOM Storage - 4hr 0.5 0.0 0.0 0.0 0.5 0.5 0.5 0.5 0.0 0.0 0.0 0.0 0.0 0.0 (0.5) (0.5) (0.5) (0.5) (0.5) 0.0 0.0 0.0 0.0 0.0 0.0PV/ES Hybrid - 7hr (3hr Max Charge) 25.0 0.0 0.0 0.0 25.0 25.0 25.0 25.0 25.0 25.0 25.0 0.0 0.0 0.0 (25.0) (25.0) (25.0) 0.0 0.0 0.0 0.0 0.0 0.0 0.0 0.0Existing Fast DR - 6hr 18.1 0.0 0.0 0.0 0.0 18.1 18.1 18.1 18.1 18.1 18.1 0.0 0.0 0.0 0.0 0.0 0.0 0.0 0.0 0.0 0.0 0.0 0.0 0.0 0.0DR (LR/ES) - 4hr 80.0 0.0 0.0 0.0 0.0 0.0 80.0 80.0 80.0 80.0 0.0 0.0 0.0 0.0 (80.0) (80.0) (80.0) (80.0) (80.0) 0.0 0.0 0.0 0.0 0.0 0.0Existing Slow DR + ES - 6hr (0.5hr Charge) 30.1 0.0 0.0 0.0 0.0 30.1 30.1 30.1 30.1 30.1 30.1 0.0 0.0 0.0 (30.1) 0.0 0.0 0.0 0.0 0.0 0.0 0.0 0.0 0.0 0.0
Total Preferred Resources & Storage (Note 2) 258.7 0.0 0.0 50.0 130.5 178.7 258.7 208.7 153.2 153.2 73.2 0.0 0.0 0.0 (240.6) (210.5) (210.5) (185.5) (185.5) 0.0 0.0 0.0 0.0 0.0 0.0Local Capacity Deficiency (13.3) 73.3 90.0 65.8 53.8 (18.2) 2.5 (4.0) (37.1) 43.0 16.2 (143.7) (310.4) (196.9) (302.0) (355.0) (413.3) (423.5) (591.7) (515.6) (432.3) (346.8) (223.4) (110.3)
Day 1 MW 11 12 13 14 15 16 17 18 19 20 21 22 23 0 1 2 3 4 5 6 7 8 9 10
2022 Scaled Max Hourly Load 1470 1557 1624 1680 1716 1723 1692 1628 1595 1595 1495 1334 1167 1039 964 911 877 867 884 961 1045 1132 1257 1372LTPP 2012 Track 1 - Solar PV 5.7 (NQC) 4.8 5.4 5.4 5.2 4.3 3.0 1.4 0.1 0.0 0.0 0.0 0.0 0.0 0.0 0.0 0.0 0.0 0.0 0.0 0.0 0.3 1.6 3.1 4.3LTPP 2012 Track 1 - EE 6.0 5.1 5.4 6.0 6.0 6.0 6.0 6.0 6.0 6.0 6.0 6.0 4.6 4.1 3.6 3.4 3.2 3.1 3.0 3.1 3.3 3.6 3.9 4.4 4.8Load less LTPP PV & EE 1459.7 1546.3 1613.0 1669.3 1705.5 1713.5 1684.2 1622.2 1589.1 1589.2 1489.2 1329.3 1162.6 1035.5 960.5 907.5 874.2 864.0 881.3 957.4 1040.7 1126.2 1249.6 1362.7Load Serving Capability 1473 1473 1473 1473 1473 1473 1473 1473 1473 1473 1473 1473 1473 1473 1473 1473 1473 1473 1473 1473 1473 1473 1473 1473 1473Remaing Load to Serve (Note 1) (13.3) 73.3 140.0 196.3 232.5 240.5 211.2 149.2 116.1 116.2 16.2 (143.7) (310.4) (437.5) (512.5) (565.5) (598.8) (609.0) (591.7) (515.6) (432.3) (346.8) (223.4) (110.3)
IFOM ES Block 1 - 9hr (at Mandalay) 55.0 0.0 55.0 55.0 55.0 55.0 55.0 55.0 55.0 55.0 55.0 0.0 0.0 (55.0) (55.0) (55.0) (55.0) (55.0) (55.0) (55.0) (55.0) (55.0) (55.0) (55.0) 0.0IFOM ES Block 2 - 9hr (at Mandalay) 55.0 0.0 0.0 55.0 55.0 55.0 55.0 55.0 55.0 55.0 55.0 55.0 0.0 (55.0) (55.0) (55.0) (55.0) (55.0) (55.0) (55.0) (55.0) (55.0) (55.0) (55.0) 0.0
LTPP 2012 Track 1 - IFOM Storage - 4hr 0.5 0.0 0.0 0.0 0.0 0.0 0.0 0.0 0.0 0.0 0.0 0.0 0.0 0.0 0.0 0.0 0.0 0.0 0.0 0.0 0.0 0.0 0.0 0.0 0.0PV/ES Hybrid - 7hr (3hr Max Charge) 25.0 0.0 25.0 25.0 25.0 25.0 25.0 25.0 25.0 0.0 0.0 0.0 0.0 0.0 (25.0) (25.0) (25.0) 0.0 0.0 0.0 0.0 0.0 0.0 0.0 0.0Existing Fast DR - 6hr 18.1 0.0 0.0 18.1 18.1 18.1 18.1 18.1 18.1 0.0 0.0 0.0 0.0 0.0 0.0 0.0 0.0 0.0 0.0 0.0 0.0 0.0 0.0 0.0 0.0DR (LR/ES) - 4hr 80.0 0.0 0.0 0.0 80.0 80.0 80.0 80.0 0.0 0.0 0.0 0.0 0.0 0.0 (80.0) (80.0) (80.0) (80.0) (80.0) 0.0 0.0 0.0 0.0 0.0 0.0Existing Slow DR + ES - 6hr (0.5hr Charge) 30.1 0.0 0.0 0.0 0.0 30.1 30.1 30.1 30.1 30.1 30.1 0.0 0.0 0.0 (30.1) 0.0 0.0 0.0 0.0 0.0 0.0 0.0 0.0 0.0 0.0
Total Preferred Resources & Storage (Note 2) 263.7 0.0 80.0 153.1 233.1 263.2 263.2 263.2 183.2 140.1 140.1 55.0 0.0 (110.0) (245.1) (215.0) (215.0) (190.0) (190.0) (110.0) (110.0) (110.0) (110.0) (110.0) 0.0Local Capacity Deficiency (Note 3) (13.3) (6.7) (13.1) (36.8) (30.7) (22.7) (52.0) (34.0) (24.0) (23.9) (38.8) (143.7) (200.4) (192.4) (297.5) (350.5) (408.8) (419.0) (481.7) (405.6) (322.3) (236.8) (113.4) (110.3)Power Flow Dispatch Validation (Note 5) FailedIncremental ES Capacity Required (Note 6) 5.0
Table A-1a: 2022 Summer Peak Moorpark Sub-Area Hourly Local Load-Resource Analysis Scenario 1, 2014 Load Shape, Iteration 1 - One 50 MW, 4 hr IFOM Battery Unit & One 55 MW, 4 hr IFOM Battery Unit
Day 2
Table A-1b: 2022 Summer Peak Moorpark Sub-Area Hourly Local Load-Resource AnalysisScenario 1, 2014 Load Shape, Iteration 2 - Two 55 MW, 9 hr IFOM Battery Units
Day 2
Notes - 1. "Remaing Load to Serve" is negative when no additional resources are necessary to serve the load and postive when additional resources are needed.2. "Total Preferred Resources & Storage" represents the aggregate dispatch of preferred resources and ES. Negative numbers represent aggregate ES charging.3. "Local Capacity Deficiency" represents remaining "Remaing Load to Serve" less the "Total Preferred Resources & Storage." When values are positive (RED highlighted cells), there is a load serving deficit.4. The BLUE highlighted cells indicate an ES or preferred resource dispatch (positive number). The GREEN highlighed cells Indicate ES charging (negative number).5. The load, resource dispatch & worst contingency were modeled in power flow to ensure enough resources were dispatced to adequately served the load without causing a voltage collapse. Cases that exhibited a voltage collapse were identified as "Failed".6. "Incremental ES Capacity Required" delineates the additional IFOM ES Block capacity required to serve the load without causing a voltage collapse.

Moorpark Sub-Area Local Capacity Alternative Study August 16, 2017
20
Step 3 establishes the final capacity and duration of battery storage that is necessary to meet local capacity requirements in addition to the base incremental distributed resource portfolio described above.
4.4. Summary of Study Results Results for Scenario 1
Step 1 (Section 4.1) established an initial need for 102 MW of grid-connected energy storage resources for Scenario 1 that the ISO modeled in one 55 MW block and one 50 MW block both of which were initially modeled with a four-hour duration along with the base incremental 135 MW distributed resource portfolio. The Step 2 analysis indicated that limiting the battery storage duration capability to four hours resulted in local capacity deficiencies for up to a total of seven hours with a maximum deficiency of 134 MW during Hour 13 (based on the 2015 load shape). The duration of battery storage units needed to be increased to 9 hours in Iteration 2 to achieve a dispatch in which none of the hours showed any deficiency. The capacity of one unit was also increased by 5 MW to address a deficiency that would otherwise occur on Hour 13 in the analysis performed with the 2015 load shape. Despite these increases, the results of the Step 3 power flow validation for Hour 13 in the case of the 2014 load shape and Hour 13 and 18 in the case of the 2015 load shape failed to yield stable voltages, causing the respective battery storage capacity to be further increased by up to 15 MW. Table 4-3 provides a summary of the results for Scenario 1 for the three load shapes considered. Detailed results are provided in Appendix A, Table A-1 thru Table A-3.

Moorpark Sub-Area Local Capacity Alternative Study August 16, 2017
21
Based on the results, the recommended capacity and duration for the Mandalay battery storage for Scenario 1 are:
• One 65 MW / nine-hour duration
• One 60 MW / nine-hour duration
Table 4-3
Scenario 1 Results Summary
Description
2022 hourly load based on: 2014 2015 2016
Iteration step 1 2 1 2 1 2
Mandalay ES Block 1 - Capacity (MW) 50 55 50 55 50 55 Mandalay ES Block 1 - Duration (hours) 4 9 4 9 4 7 Mandalay ES Block 2 - Capacity (MW) 55 55 55 55 55 55 Mandalay ES Block 2 - Duration (hours) 4 9 4 9 4 4 Total number of hours with remaining local capacity deficiency 7 0 6 0 3 0
Total number of hours failing power flow validation (hours)
Note 1
1
Note 1
2
Note 1
0
Incremental battery storage capacity required in Step 3 to mitigate power flow failure (MW)
5 15 0
Note 1 – The power flow dispatch validation was only performed on iterations that didn’t include a local capacity MW deficiency in the Step 2 analysis
Results for Scenario 2
For Scenario 2, a 240 Mvar reactive power device near Mandalay along with the base incremental 135 MW distributed resource portfolio was considered. The hourly load and resource analysis conducted for this scenario did not indicate any deficiency and none of the hours failed the Step 3 power flow validation. As a result, no grid connected battery storage was found to be needed in addition to the 240 Mvar reactive power device and the base incremental distributed resource portfolio.
In addition, the hourly load and resource analysis showed a local capacity margin as low as 12 MW, which indicates the size of the reactive power device is reasonable. Table 4-4 provides a summary of the results for Scenario 2. Detailed results are provided in Appendix A, Table A-4 thru Table A-6.

Moorpark Sub-Area Local Capacity Alternative Study August 16, 2017
22
Table 4-4
Scenario 2 Results Summary
Description
2022 hourly load based on: 2014 2015 2016
Iteration step 1 2 1 2 1 2
Mandalay ES Block 1 - Capacity (MW) 0 -- 0 -- 0 -- Mandalay ES Block 1 - Duration (hours) 0 -- 0 -- 0 -- Mandalay ES Block 2 - Capacity (MW) 0 -- 0 -- 0 -- Mandalay ES Block 2 - Duration (hours) 0 -- 0 -- 0 -- Total number of hours with remaining local capacity deficiency 0 -- 0 -- 0 --
Total number of hours failing power flow validation (hours) 0 -- 0 -- 0 --
Incremental battery storage capacity required to mitigate power flow failure (MW)
0 -- 0 -- 0 --
Unlike Scenario 1 and 3 and the Puente option, the reactive support does not help in reducing loss of load through load shedding to avoid thermal overloads; load shedding is not desirable but is permitted under the local capacity technical study criteria in the circumstances and limiting contingencies being studied.
Results for Scenario 3
Step 1 (Section 4.1) established a need for 162 MW of grid-connected energy storage resources for Scenario 3 that the ISO modeled in one 60 MW block, one 55 MW block and one 50 MW block along with the base incremental 135 MW distributed resource portfolio. In the first iteration the ISO performed as part of its Step 2 analysis a 4 hour duration was considered. The hourly load and resource analysis results for this iteration using the 2014 load shape indicated local capacity deficiency for nine of the hours evaluated. In Iteration 2, the duration of battery storage units needed to be increased to nine hours for one Mandalay unit and to ten hours for the remaining two units in order to achieve a dispatch in which none of the hours showed any deficiency. Due to the large duration of the battery storage units considered, charging became an issue and, as a result, a third iteration step was conducted in which the Mandalay 10-hour duration unit was broken into two units of five-hour duration each in order to be able to recharge them simultaneously during hours of lowest load.
After all the local capacity deficiencies in the hourly load and resource worksheet were resolved, the load and resource dispatch for each hour was modeled and tested in the Step 3 power flow analysis. The results for Hour 12 failed to yield valid power flow

Moorpark Sub-Area Local Capacity Alternative Study August 16, 2017
23
results causing the aggregate Mandalay battery storage capacity to be increased by 5 MW.
Similar analysis for Scenario 3 was performed using the load shapes from 2015 and 2016. *** provides a summary of the results for Scenario 3 for the three load shapes considered. Detailed results are provided in Appendix A, Table A-7 thru Table A-9.
Based on the results, the recommended capacity and duration for the battery storage units for Scenario 3 are:
• One 65 MW / nine-hour duration (Mandalay)
• One 55 MW / five-hour duration (Mandalay)
• One 60 MW / five-hour duration (Mandalay)
• One 60 MW / ten-hour duration (Goleta)
Table 4-5
Scenario 3 Results Summary
Description
2022 hourly load based on: 2014 2015 2016
Iteration step 1 2 3 1 2 3 1 2
Mandalay ES Block 1 - MW 50 55 55 50 55 55 50 55 Mandalay ES Block 1 - Hours 4 9 9 4 9 9 4 8 Mandalay ES Block 2 - MW 55 55 55 55 55 55 55 55 Mandalay ES Block 2 - Hours 4 10 5 4 10 5 4 8 Mandalay ES Block 3 - MW (Note 3) -- -- 55 -- -- 55 -- -- Mandalay ES Block 3 - Hours (Note 3) -- -- 5 -- -- 5 -- --
Goleta ES Block 2 - MW 60 60 60 60 60 60 60 60 Goleta ES Block 2 - Hours 4 10 10 4 10 10 4 7
Total number of hours with remaining local capacity deficiency 9 3
(Note 2)
1 (Note
4) 9 1
(Note 2) 0 8 0
Total number of hours failing power flow validation (hours)
Note 1
1
Note 1
2 Note
1
0
Incremental battery storage capacity required to mitigate power flow failure in Step 3 (MW)
5 15 0
Note 1 – The power flow dispatch validation was only performed on iterations that didn’t include a local capacity MW deficiency in the Step 2 analysis Note 2 – Some or all hours with deficiencies occurred during charging. Note 3 – To mitigate the charging deficiency, established 3rd ES block at Mandalay. Note 4 – Dispatch passed validation even though load-resource analysis indicates Hour 12 was deficient.

Moorpark Sub-Area Local Capacity Alternative Study August 16, 2017
24
Capital Cost Estimates
As the ISO does not conduct resource procurement, the ISO’s access to cost information is limited to publicly available sources. While the ISO initially did not include development of cost information in the original scope, very high level estimates were subsequently developed based on publicly available information to be helpful and provide a starting point for subsequent discussion in the CEC proceeding. For comparison purposes an estimate for the Puente Power Project is also included. Below are the unit costs that are used to derive the estimates. These costs represent initial installation costs; they do not include ongoing operating or maintenance costs, or replacement costs to adjust for shorter expected lifespans of some equipment versus others.
• Solar PV - $2.65 million per MW22
• Battery storage (Lithium-ion) - $1.94 million per MW (4-hour)23
• Simple cycle CT generator (Merchant) - $1.141 million/MW24
• 240 Mvar dynamic reactive power device - $50.1 - $100 million25
A very high level capital cost estimate for each resource and overall costs for each scenario are presented in Table 5-1 and Table 5-2, respectively.
22 California Energy Commission Consultant Report - San Joaquin Valley Distributed Energy Resource Regional Assessment, Navigant Consulting, Inc., Table 29, Page 41 (July 2016). 23 Ibid. 24 California Energy Commission Draft Staff Report – Estimated Cost of New Renewable and Fossil Generation in California, Table 51, Page 138 (May 2014). 25 The cost of the reactive device is based on the Santiago Synchronous Condenser Project as provided in SCE’s Quarterly Compliance Report (July 2017).

Moorpark Sub-Area Local Capacity Alternative Study August 16, 2017
25
Table 5-1
Capital Cost Estimates of Portfolio Resources
Resource Capacity (MW)
Output Duration (hours)
Estimated cost ($million)
Demand response (load reduction/BTM storage) 80 MW 4 hours
(storage) 155.2
PV solar/energy storage hybrid 25 MW 2.5 hours (storage) 96.6
Storage to enable existing slow-responding demand response 30 MW 0.5 hours
(storage) 7.3
Scenario 1 - IFOM storage battery
65 MW 9 hours 283.7
60 MW 9 hours 261.9 Scenario 2 - Reactive device 240 Mvar Continuous 50.1-100
Scenario 3 - IFOM storage battery (if Ellwood is retired)
65 MW 9 hours 283.7
55 MW 5 hours 133.4
60 MW 5 hours 145.5
60 MW 10 hours 291.1
Table 5-2
Capital Cost Estimates of Resource Portfolios
Resource Description Estimated cost (millions)
Scenario 1 Incremental distributed resources plus IFOM storage battery $805
Scenario 2 Incremental distributed resources plus reactive device $309-$359
Scenario 3 Incremental distributed resources plus IFOM battery storage (if Ellwood is retired)
$1,116
Puente Power Project 262 MW combustion turbine generator $299

Moorpark Sub-Area Local Capacity Alternative Study August 16, 2017
26
Stakeholder Comments The comments received from stakeholders following the June 30, 2017 stakeholder call are summarized below, together with a brief discussion of the ISO’s consideration of those comments. The presentation included a discussion of the Moorpark need, the scope of the ISO study, and draft base incremental distributed resource portfolios. Comments were received from Amber Kinetics, the City of Oxnard, Clean Coalition, Tesla Inc., and Robert Sarvey. All comments received have also been posted on the ISO’s website.
Incremental Distributed Resource Assumptions:
Three parties provided numerous comments and references to other studies suggesting higher levels of incremental distributed resources – demand response, local solar projects, storage, and hybrid projects - be explored. The ISO has reviewed these comments with SCE staff, and did not consider further adjustments to the scenarios necessary. The scenarios address a range of preferred resources including storage, and as the ISO added storage as necessary until reliability requirements were achieved, adding additional scenarios with increased storage in particular is redundant given the study methodology.
Mandalay and Ellwood
Two parties proposed that the study scope expand to consider Mandalay 3 – and one further recommended the potential conversion of 1 and 2 to synchronous condensers – as a bridging solution. While “bridging scenarios” have not been developed, the ISO study has included comment on the impact of retaining Mandalay 3 and of Ellwood on the study results. As noted in the comments, continued operation of the Mandalay plant would offset other needs by 130 MW, whether as a long term or bridging means while other resources are being acquired. As the impacts of reactive power sources are addressed on a generic basis in the ISO study, no specific comment on the viability of converting Mandalay 1 and 2 into synchronous condensers has been developed nor included in the study scope.
Reactive Power from Inverters:
Three parties raised concerns that the potential for reactive support from inverters was not properly being recognized in the ISO study and recommended different study treatment, changes to cost estimating, or further research on the issue. In this report, it has been clarified that the reactive support is required at the same time as the real power requirement, so an increase in the inverter capacity would be required to provide additional reactive support above the real power support being provided. Further, inverters are modeled at the minimum reactive support required from any asynchronous generator connecting to the ISO grid, and any additional reactive support – presumably

Moorpark Sub-Area Local Capacity Alternative Study August 16, 2017
27
to provide the 240 Mvar support identified in Scenario 2 – would need to be incremental to that initial requirement.
Transmission Alternatives:
One party sought to have the ISO reassess transmission alternatives in this study of preferred resources, to consider if further study on a new study plan should be undertaken. As discussed below, transmission alternatives were previously considered in earlier processes and are not within the scope of this study. Further, no new information was provided and the comment requested additional study and delay that reached beyond the study scope agreed upon with the CEC in this process focusing on preferred resources.
Transmission alternatives – including meeting the need exclusively through the use of reactive support devices – formed part of the initial consideration in the ISO’s planning activities and the CPUC proceeding that led to SCE’s selection of the Puente project. As such, the ISO did not offer, nor did the CEC request, specific reconsideration of transmission alternatives in the study the ISO offered to undertake on preferred resources. The context relevant to considering transmission alternatives, and the options that have been considered in the past, are summarized below.
The Ventura area load is served by five 230 kV transmission circuits, with four of these circuits emanating from Pardee 230 kV substation. A single transmission circuit contingency followed by a credible contingency of a common tower transmission outage causes a voltage collapse resulting in loss of up to 2000 MW of Ventura and Santa Barbara area load. An extended outage of Pardee substation due to an earthquake or other disaster would result in the entire Ventura and Santa Barbara area connected by a single transmission circuit coming from Vincent substation. In considering the effectiveness of the Puente project to assess the relative benefit of other mitigations, the Puente project mitigates the overlapping transmission outage and improves load serving capability during an extended outage of Pardee substation.
Transmission upgrades that would mitigate both of these reliability concerns would most likely require a new transmission line not connected to Pardee substation and would require extensive environmental permitting review process at the CPUC for greenfield construction. These options were not pursued further due to the perceived costs and siting challenges at the time.
In addition to meeting the local capacity technical study criteria set out in the ISO’s FERC-approved tariff, the Puente project also provided additional reliability benefits by minimizing the need for load shedding for contingency-driven thermal overloads that the criteria did not require to be mitigated, and provided increased load serving capability under other more extreme events such as the loss of the Pardee substation. Nonetheless, lesser transmission alternatives were considered by the ISO during the

Moorpark Sub-Area Local Capacity Alternative Study August 16, 2017
28
CPUC 2012 LTPP proceedings that marginally met the minimum criteria but did not provide these other reliability benefits, including reactive support options and transmission reconfiguration options.
Reactive support
The ISO considered adding a large amount of reactive support in the analysis performed for the 2012 LTPP proceeding, to reduce the local capacity requirement. (In contrast to the study conducted in this analysis considering a more modestly sized reactive support.)
This alternative - as with the modestly sized reactive support analyzed in this study - was found to significantly mitigate the voltage stability issue, but not address the thermal overload concerns. This alternative would reduce the amount of local generation needed to be dispatched to avoid voltage collapse, but load would need to be shed manually to mitigate the thermal overloads that would also occur. As noted above, the Puente project would result in 262 MW of reduced post-contingency load shedding compared to the reactive support alternative, consistent with the findings of the smaller reactive support project in this study.
Transmission Lines:
Looping in the Vincent-Santa Clara 230 kV line into the Pardee substation was considered. This would add exposure to earthquake damage to the Pardee substation resulting in the loss of all transmission into the Moorpark area. In fact SCE intentionally de-looped this line in the past specifically to reduce this exposure.
A new Pardee-Moorpark line alternative was also considered. This, as well as the reactive support alternative discussed above - would not mitigate the exposure to earthquake damage at Pardee substation. This exposure is currently mitigated by having the Mandalay and Ormond Beach generation. Puente would improve the load serving capability to the Moorpark sub-area during an extended outage of Pardee substation. Given this limitation, further investigation of the extent of the cost and siting concerns was not pursued.
Energy storage Technology:
One party provided comments on flywheel technology as a possible consideration. As the ISO’s study is meant to be technology-neutral for each type of preferred resources, focusing on the characteristics and requirements as opposed to selecting the technology to provide those requirements, this material did not affect the study process.

Moorpark Sub-Area Local Capacity Alternative Study August 16, 2017
29
Load Forecast:
One party questioned the load forecast citing more recent actual loads. The ISO has provided a reference for the forecast used in this study in section 2.2, and relies on CEC and utility load forecast information that takes into account varying weather conditions.
Conclusion This Moorpark Sub-Area Local Capacity Alternative Study indicates that the applicable reliability criteria can be met with a combination of base incremental distributed resources and some combination of energy storage or dynamic reactive support. Table 7-1 and Table 7-2 summarize the amount of incremental distributed resources needed under any of the scenarios studied by the ISO.
Table 7-1
Base Incremental Distributed Resources
Resource Capacity (MW)
Output Duration
Location Studied
Demand response (load reduction/BTM energy storage)
80 MW 4 hours Distributed among three substations in proportion to load PV solar/energy storage hybrid 25 MW 7 hours
Storage enabled existing slow-responding demand response (DR)
30 MW 6 hours (0.5-hr storage)
Existing locations of the DR resources
Preferred resources portfolio total 135 MW
The study evaluated three alternative resource scenarios designed to supplement the incremental distributed resource portfolio and meet the applicable reliability criteria. The three scenarios considered the following resource options:
• Scenario 1 – Grid connected battery storage with reactive power capability located near Mandalay
• Scenario 2 – 240 Mvar dynamic reactive power device plus grid connected battery storage as needed and
• Scenario 3 – Grid connected battery storage with reactive power capability located near Mandalay and Goleta assuming Ellwood is retired given the current the uncertainty regarding the long-term availability of the plant.
The main objective of the ISO’s technical analysis was to assess the capacity and duration of battery storage needed taking in to account the hourly characteristics of area

Moorpark Sub-Area Local Capacity Alternative Study August 16, 2017
30
load, the capability of the transmission system and the variability, runtime-limitation and charging requirements of preferred resources and storage. The analysis was performed using three forecast hourly area load shapes for year 2022 obtained from SCE and the most recent 2022 summer peak LCR base case.
The analysis yielded the following results for the capacity and duration of grid connected battery storage.
Table 7-2
Grid connected storage needed to supplement the base incremental distributed
resources portfolio and meet applicable reliability criteria
Scenario Energy Storage
Capacity (MW)
Energy Storage Output Duration
(hours)
Location studied
Scenario 1 - Energy Storage
65 MW 9 hours Mandalay 60 MW 9 hours
Scenario 2 - 240 Mvar Dynamic Reactive Power 0 MW -- --
Scenario 3 - Energy Storage if Ellwood Retires
65 MW 9 hours Mandalay
55 MW 5 hours
60 MW 5 hours
60 MW 10 hours Goleta
In conclusion, the study results indicate that the applicable reliability criteria can be met through incremental distributed resource additions and grid connected energy storage, albeit at costs reasonably expected to be significantly higher than the Puente project. A combination of incremental distributed resources and additional reactive support can achieve the minimum performance requirements consistent with the applicable reliability criteria at approximately comparable capital costs, but at a lower level of overall reliability and flexibility due to higher levels of potential load shedding necessary to address contingency-driven thermal overloading.
Moorpark Sub-Area Local Capacity Alternative Study August 16, 2017
31
Appendix A – Hourly Load and Resource Analysis Worksheets

Moorpark Sub-Area Local Capacity Alternative Study August 16, 2017
32
Day 1MW 11 12 13 14 15 16 17 18 19 20 21 22 23 0 1 2 3 4 5 6 7 8 9 10
2022 Scaled Max Hourly Load 1470 1557 1624 1680 1716 1723 1692 1628 1595 1595 1495 1334 1167 1039 964 911 877 867 884 961 1045 1132 1257 1372LTPP 2012 Track 1 - Solar PV 5.7 (NQC) 4.8 5.4 5.4 5.2 4.3 3.0 1.4 0.1 0.0 0.0 0.0 0.0 0.0 0.0 0.0 0.0 0.0 0.0 0.0 0.0 0.3 1.6 3.1 4.3LTPP 2012 Track 1 - EE 6.0 5.1 5.4 6.0 6.0 6.0 6.0 6.0 6.0 6.0 6.0 6.0 4.6 4.1 3.6 3.4 3.2 3.1 3.0 3.1 3.3 3.6 3.9 4.4 4.8Load less LTPP PV & EE 1459.7 1546.3 1613.0 1669.3 1705.5 1713.5 1684.2 1622.2 1589.1 1589.2 1489.2 1329.3 1162.6 1035.5 960.5 907.5 874.2 864.0 881.3 957.4 1040.7 1126.2 1249.6 1362.7Load Serving Capability 1473 1473 1473 1473 1473 1473 1473 1473 1473 1473 1473 1473 1473 1473 1473 1473 1473 1473 1473 1473 1473 1473 1473 1473 1473Remaing Load to Serve (Note 1) (13.3) 73.3 140.0 196.3 232.5 240.5 211.2 149.2 116.1 116.2 16.2 (143.7) (310.4) (437.5) (512.5) (565.5) (598.8) (609.0) (591.7) (515.6) (432.3) (346.8) (223.4) (110.3)
IFOM ES Block 1 - 4hr (at Mandalay) 50.0 0.0 0.0 50.0 50.0 50.0 50.0 0.0 0.0 0.0 0.0 0.0 0.0 0.0 (50.0) (50.0) (50.0) (50.0) (50.0) 0.0 0.0 0.0 0.0 0.0 0.0IFOM ES Block 2 - 4hr (at Mandalay) 55.0 0.0 0.0 0.0 55.0 55.0 55.0 55.0 0.0 0.0 0.0 0.0 0.0 0.0 (55.0) (55.0) (55.0) (55.0) (55.0) 0.0 0.0 0.0 0.0 0.0 0.0
LTPP 2012 Track 1 - IFOM Storage - 4hr 0.5 0.0 0.0 0.0 0.5 0.5 0.5 0.5 0.0 0.0 0.0 0.0 0.0 0.0 (0.5) (0.5) (0.5) (0.5) (0.5) 0.0 0.0 0.0 0.0 0.0 0.0PV/ES Hybrid - 7hr (3hr Max Charge) 25.0 0.0 0.0 0.0 25.0 25.0 25.0 25.0 25.0 25.0 25.0 0.0 0.0 0.0 (25.0) (25.0) (25.0) 0.0 0.0 0.0 0.0 0.0 0.0 0.0 0.0Existing Fast DR - 6hr 18.1 0.0 0.0 0.0 0.0 18.1 18.1 18.1 18.1 18.1 18.1 0.0 0.0 0.0 0.0 0.0 0.0 0.0 0.0 0.0 0.0 0.0 0.0 0.0 0.0DR (LR/ES) - 4hr 80.0 0.0 0.0 0.0 0.0 0.0 80.0 80.0 80.0 80.0 0.0 0.0 0.0 0.0 (80.0) (80.0) (80.0) (80.0) (80.0) 0.0 0.0 0.0 0.0 0.0 0.0Existing Slow DR + ES - 6hr (0.5hr Charge) 30.1 0.0 0.0 0.0 0.0 30.1 30.1 30.1 30.1 30.1 30.1 0.0 0.0 0.0 (30.1) 0.0 0.0 0.0 0.0 0.0 0.0 0.0 0.0 0.0 0.0
Total Preferred Resources & Storage (Note 2) 258.7 0.0 0.0 50.0 130.5 178.7 258.7 208.7 153.2 153.2 73.2 0.0 0.0 0.0 (240.6) (210.5) (210.5) (185.5) (185.5) 0.0 0.0 0.0 0.0 0.0 0.0Local Capacity Deficiency (13.3) 73.3 90.0 65.8 53.8 (18.2) 2.5 (4.0) (37.1) 43.0 16.2 (143.7) (310.4) (196.9) (302.0) (355.0) (413.3) (423.5) (591.7) (515.6) (432.3) (346.8) (223.4) (110.3)
Day 1 MW 11 12 13 14 15 16 17 18 19 20 21 22 23 0 1 2 3 4 5 6 7 8 9 10
2022 Scaled Max Hourly Load 1470 1557 1624 1680 1716 1723 1692 1628 1595 1595 1495 1334 1167 1039 964 911 877 867 884 961 1045 1132 1257 1372LTPP 2012 Track 1 - Solar PV 5.7 (NQC) 4.8 5.4 5.4 5.2 4.3 3.0 1.4 0.1 0.0 0.0 0.0 0.0 0.0 0.0 0.0 0.0 0.0 0.0 0.0 0.0 0.3 1.6 3.1 4.3LTPP 2012 Track 1 - EE 6.0 5.1 5.4 6.0 6.0 6.0 6.0 6.0 6.0 6.0 6.0 6.0 4.6 4.1 3.6 3.4 3.2 3.1 3.0 3.1 3.3 3.6 3.9 4.4 4.8Load less LTPP PV & EE 1459.7 1546.3 1613.0 1669.3 1705.5 1713.5 1684.2 1622.2 1589.1 1589.2 1489.2 1329.3 1162.6 1035.5 960.5 907.5 874.2 864.0 881.3 957.4 1040.7 1126.2 1249.6 1362.7Load Serving Capability 1473 1473 1473 1473 1473 1473 1473 1473 1473 1473 1473 1473 1473 1473 1473 1473 1473 1473 1473 1473 1473 1473 1473 1473 1473Remaing Load to Serve (Note 1) (13.3) 73.3 140.0 196.3 232.5 240.5 211.2 149.2 116.1 116.2 16.2 (143.7) (310.4) (437.5) (512.5) (565.5) (598.8) (609.0) (591.7) (515.6) (432.3) (346.8) (223.4) (110.3)
IFOM ES Block 1 - 9hr (at Mandalay) 55.0 0.0 55.0 55.0 55.0 55.0 55.0 55.0 55.0 55.0 55.0 0.0 0.0 (55.0) (55.0) (55.0) (55.0) (55.0) (55.0) (55.0) (55.0) (55.0) (55.0) (55.0) 0.0IFOM ES Block 2 - 9hr (at Mandalay) 55.0 0.0 0.0 55.0 55.0 55.0 55.0 55.0 55.0 55.0 55.0 55.0 0.0 (55.0) (55.0) (55.0) (55.0) (55.0) (55.0) (55.0) (55.0) (55.0) (55.0) (55.0) 0.0
LTPP 2012 Track 1 - IFOM Storage - 4hr 0.5 0.0 0.0 0.0 0.0 0.0 0.0 0.0 0.0 0.0 0.0 0.0 0.0 0.0 0.0 0.0 0.0 0.0 0.0 0.0 0.0 0.0 0.0 0.0 0.0PV/ES Hybrid - 7hr (3hr Max Charge) 25.0 0.0 25.0 25.0 25.0 25.0 25.0 25.0 25.0 0.0 0.0 0.0 0.0 0.0 (25.0) (25.0) (25.0) 0.0 0.0 0.0 0.0 0.0 0.0 0.0 0.0Existing Fast DR - 6hr 18.1 0.0 0.0 18.1 18.1 18.1 18.1 18.1 18.1 0.0 0.0 0.0 0.0 0.0 0.0 0.0 0.0 0.0 0.0 0.0 0.0 0.0 0.0 0.0 0.0DR (LR/ES) - 4hr 80.0 0.0 0.0 0.0 80.0 80.0 80.0 80.0 0.0 0.0 0.0 0.0 0.0 0.0 (80.0) (80.0) (80.0) (80.0) (80.0) 0.0 0.0 0.0 0.0 0.0 0.0Existing Slow DR + ES - 6hr (0.5hr Charge) 30.1 0.0 0.0 0.0 0.0 30.1 30.1 30.1 30.1 30.1 30.1 0.0 0.0 0.0 (30.1) 0.0 0.0 0.0 0.0 0.0 0.0 0.0 0.0 0.0 0.0
Total Preferred Resources & Storage (Note 2) 263.7 0.0 80.0 153.1 233.1 263.2 263.2 263.2 183.2 140.1 140.1 55.0 0.0 (110.0) (245.1) (215.0) (215.0) (190.0) (190.0) (110.0) (110.0) (110.0) (110.0) (110.0) 0.0Local Capacity Deficiency (Note 3) (13.3) (6.7) (13.1) (36.8) (30.7) (22.7) (52.0) (34.0) (24.0) (23.9) (38.8) (143.7) (200.4) (192.4) (297.5) (350.5) (408.8) (419.0) (481.7) (405.6) (322.3) (236.8) (113.4) (110.3)Power Flow Dispatch Validation (Note 5) FailedIncremental ES Capacity Required (Note 6) 5.0
Table A-1a: 2022 Summer Peak Moorpark Sub-Area Hourly Local Load-Resource Analysis Scenario 1, 2014 Load Shape, Iteration 1 - One 50 MW, 4 hr IFOM Battery Unit & One 55 MW, 4 hr IFOM Battery Unit
Day 2
Table A-1b: 2022 Summer Peak Moorpark Sub-Area Hourly Local Load-Resource AnalysisScenario 1, 2014 Load Shape, Iteration 2 - Two 55 MW, 9 hr IFOM Battery Units
Day 2
Notes - 1. "Remaing Load to Serve" is negative when no additional resources are necessary to serve the load and postive when additional resources are needed.2. "Total Preferred Resources & Storage" represents the aggregate dispatch of preferred resources and ES. Negative numbers represent aggregate ES charging.3. "Local Capacity Deficiency" represents remaining "Remaing Load to Serve" less the "Total Preferred Resources & Storage." When values are positive (RED highlighted cells), there is a load serving deficit.4. The BLUE highlighted cells indicate an ES or preferred resource dispatch (positive number). The GREEN highlighed cells Indicate ES charging (negative number).5. The load, resource dispatch & worst contingency were modeled in power flow to ensure enough resources were dispatced to adequately served the load without causing a voltage collapse. Cases that exhibited a voltage collapse were identified as "Failed".6. "Incremental ES Capacity Required" delineates the additional IFOM ES Block capacity required to serve the load without causing a voltage collapse.

Moorpark Sub-Area Local Capacity Alternative Study August 16, 2017
33
Day 1MW 11 12 13 14 15 16 17 18 19 20 21 22 23 0 1 2 3 4 5 6 7 8 9 10
2022 Scaled Max Hourly Load 1460 1542 1618 1666 1699 1723 1722 1647 1581 1592 1509 1360 1160 1068 984 929 896 879 896 969 1060 1155 1248 1343LTPP 2012 Track 1 - Solar PV 5.7 (NQC) 4.8 5.4 5.4 5.2 4.3 3.0 1.4 0.1 0.0 0.0 0.0 0.0 0.0 0.0 0.0 0.0 0.0 0.0 0.0 0.0 0.3 1.6 3.1 4.3LTPP 2012 Track 1 - EE 6.0 5.1 5.4 6.0 6.0 6.0 6.0 6.0 6.0 6.0 6.0 6.0 4.7 4.0 3.7 3.4 3.2 3.1 3.1 3.1 3.4 3.7 4.0 4.3 4.7Load less LTPP PV & EE 1450.3 1531.5 1606.7 1654.8 1688.5 1713.5 1714.5 1641.0 1574.6 1586.0 1503.1 1355.5 1156.0 1064.0 980.4 926.0 892.9 875.6 892.9 965.2 1055.8 1149.7 1240.4 1333.8Load Serving Capability 1473 1473 1473 1473 1473 1473 1473 1473 1473 1473 1473 1473 1473 1473 1473 1473 1473 1473 1473 1473 1473 1473 1473 1473 1473Remaing Load to Serve (Note 1) (22.7) 58.5 133.7 181.8 215.5 240.5 241.5 168.0 101.6 113.0 30.1 (117.5) (317.0) (409.0) (492.6) (547.0) (580.1) (597.4) (580.1) (507.8) (417.2) (323.3) (232.6) (139.2)
IFOM ES Block 1 - 4hr (at Mandalay) 50.0 0.0 0.0 0.0 0.0 50.0 50.0 50.0 50.0 0.0 0.0 0.0 0.0 0.0 (50.0) (50.0) (50.0) (50.0) (50.0) 0.0 0.0 0.0 0.0 0.0 0.0IFOM ES Block 2 - 4hr (at Mandalay) 55.0 0.0 0.0 0.0 55.0 55.0 55.0 55.0 0.0 0.0 0.0 0.0 0.0 0.0 (55.0) (55.0) (55.0) (55.0) (55.0) 0.0 0.0 0.0 0.0 0.0 0.0
LTPP 2012 Track 1 - IFOM Storage - 4hr 0.5 0.0 0.0 0.0 0.5 0.5 0.5 0.5 0.0 0.0 0.0 0.0 0.0 0.0 0.0 0.0 0.0 0.0 0.0 0.0 0.0 0.0 0.0 0.0 0.0PV/ES Hybrid - 7hr (3hr Max Charge) 25.0 0.0 0.0 0.0 25.0 25.0 25.0 25.0 25.0 25.0 25.0 0.0 0.0 0.0 (25.0) (25.0) (25.0) 0.0 0.0 0.0 0.0 0.0 0.0 0.0 0.0Existing Fast DR - 6hr 18.1 0.0 0.0 0.0 0.0 18.1 18.1 18.1 18.1 18.1 18.1 0.0 0.0 0.0 0.0 0.0 0.0 0.0 0.0 0.0 0.0 0.0 0.0 0.0 0.0DR (LR/ES) - 4hr 80.0 0.0 0.0 0.0 0.0 0.0 80.0 80.0 80.0 80.0 0.0 0.0 0.0 0.0 (80.0) (80.0) (80.0) (80.0) (80.0) 0.0 0.0 0.0 0.0 0.0 0.0Existing Slow DR + ES - 6hr (0.5hr Charge) 30.1 0.0 0.0 0.0 0.0 30.1 30.1 30.1 30.1 30.1 30.1 0.0 0.0 0.0 (30.1) 0.0 0.0 0.0 0.0 0.0 0.0 0.0 0.0 0.0 0.0
Total Preferred Resources & Storage (Note 2) 258.7 0.0 0.0 0.0 80.5 178.7 258.7 258.7 203.2 153.2 73.2 0.0 0.0 0.0 (240.1) (210.0) (210.0) (185.0) (185.0) 0.0 0.0 0.0 0.0 0.0 0.0Local Capacity Deficiency (22.7) 58.5 133.7 101.3 36.8 (18.2) (17.2) (35.2) (51.6) 39.8 30.1 (117.5) (317.0) (168.9) (282.6) (337.0) (395.1) (412.4) (580.1) (507.8) (417.2) (323.3) (232.6) (139.2)
Day 1MW 11 12 13 14 15 16 17 18 19 20 21 22 23 0 1 2 3 4 5 6 7 8 9 10
2022 Scaled Max Hourly Load 1460 1542 1618 1666 1699 1723 1722 1647 1581 1592 1509 1360 1160 1068 984 929 896 879 896 969 1060 1155 1248 1343LTPP 2012 Track 1 - Solar PV 5.7 (NQC) 4.8 5.4 5.4 5.2 4.3 3.0 1.4 0.1 0.0 0.0 0.0 0.0 0.0 0.0 0.0 0.0 0.0 0.0 0.0 0.0 0.3 1.6 3.1 4.3LTPP 2012 Track 1 - EE 6.0 5.1 5.4 6.0 6.0 6.0 6.0 6.0 6.0 6.0 6.0 6.0 4.7 4.0 3.7 3.4 3.2 3.1 3.1 3.1 3.4 3.7 4.0 4.3 4.7Load less LTPP PV & EE 1450.3 1531.5 1606.7 1654.8 1688.5 1713.5 1714.5 1641.0 1574.6 1586.0 1503.1 1355.5 1156.0 1064.0 980.4 926.0 892.9 875.6 892.9 965.2 1055.8 1149.7 1240.4 1333.8Load Serving Capability 1473 1473 1473 1473 1473 1473 1473 1473 1473 1473 1473 1473 1473 1473 1473 1473 1473 1473 1473 1473 1473 1473 1473 1473 1473Remaing Load to Serve (Note 1) (22.7) 58.5 133.7 181.8 215.5 240.5 241.5 168.0 101.6 113.0 30.1 (117.5) (317.0) (409.0) (492.6) (547.0) (580.1) (597.4) (580.1) (507.8) (417.2) (323.3) (232.6) (139.2)
IFOM ES Block 1 - 9hr (at Mandalay) 55.0 0.0 55.0 55.0 55.0 55.0 55.0 55.0 55.0 55.0 55.0 0.0 0.0 (55.0) (55.0) (55.0) (55.0) (55.0) (55.0) (55.0) (55.0) (55.0) (55.0) (55.0) 0.0IFOM ES Block 2 - 9hr (at Mandalay) 55.0 0.0 0.0 55.0 55.0 55.0 55.0 55.0 55.0 55.0 55.0 55.0 0.0 (55.0) (55.0) (55.0) (55.0) (55.0) (55.0) (55.0) (55.0) (55.0) (55.0) (55.0) 0.0
LTPP 2012 Track 1 - IFOM Storage - 4hr 0.5 0.0 0.0 0.0 0.0 0.0 0.0 0.0 0.0 0.0 0.0 0.0 0.0 0.0 0.0 0.0 0.0 0.0 0.0 0.0 0.0 0.0 0.0 0.0 0.0PV/ES Hybrid - 7hr (3hr Max Charge) 25.0 0.0 25.0 25.0 25.0 25.0 25.0 25.0 25.0 0.0 0.0 0.0 0.0 0.0 (25.0) (25.0) (25.0) 0.0 0.0 0.0 0.0 0.0 0.0 0.0 0.0Existing Fast DR - 6hr 18.1 0.0 0.0 0.0 0.0 18.1 18.1 18.1 18.1 18.1 18.1 0.0 0.0 0.0 0.0 0.0 0.0 0.0 0.0 0.0 0.0 0.0 0.0 0.0 0.0DR (LR/ES) - 4hr 80.0 0.0 0.0 0.0 80.0 80.0 80.0 80.0 0.0 0.0 0.0 0.0 0.0 0.0 (80.0) (80.0) (80.0) (80.0) (80.0) 0.0 0.0 0.0 0.0 0.0 0.0Existing Slow DR + ES - 6hr (0.5hr Charge) 30.1 0.0 0.0 0.0 0.0 0.0 30.1 30.1 30.1 30.1 30.1 30.1 0.0 0.0 (30.1) 0.0 0.0 0.0 0.0 0.0 0.0 0.0 0.0 0.0 0.0
Total Preferred Resources & Storage (Note 2) 263.7 0.0 80.0 135.0 215.0 233.1 263.2 263.2 183.2 158.2 158.2 85.1 0.0 (110.0) (245.1) (215.0) (215.0) (190.0) (190.0) (110.0) (110.0) (110.0) (110.0) (110.0) 0.0Local Capacity Deficiency (Note 3) (22.7) (21.5) (1.3) (33.2) (17.6) (22.7) (21.7) (15.2) (56.6) (45.2) (55.0) (117.5) (207.0) (163.9) (277.6) (332.0) (390.1) (407.4) (470.1) (397.8) (307.2) (213.3) (122.6) (139.2)Power Flow Dispatch Validation (Note 5) Failed FailedIncremental ES Capacity Required (Note 6) 15.0 5.0
Table A-2a: 2022 Summer Peak Moorpark Sub-Area Hourly Local Load-Resource Analysis Scenario 1, 2015 Load Shape, Iteration 1 - One 50 MW, 4 hr IFOM Battery Unit & One 55 MW, 4 hr IFOM Battery Unit
Day 2
Table A-2b: 2022 Summer Peak Moorpark Sub-Area Hourly Local Load-Resource Analysis Scenario 1, 2015 Load Shape, Iteration 2 - Two 55 MW, 9 hr IFOM Battery Units
Day 2
Notes - 1. "Remaing Load to Serve" is negative when no additional resources are necessary to serve the load and postive when additional resources are needed.2. "Total Preferred Resources & Storage" represents the aggregate dispatch of preferred resources and ES. Negative numbers represent aggregate ES charging.3. "Local Capacity Deficiency" represents remaining "Remaing Load to Serve" less the "Total Preferred Resources & Storage." When values are positive (RED highlighted cells), there is a load serving deficit.4. The BLUE highlighted cells indicate an ES or preferred resource dispatch (positive number). The GREEN highlighed cells Indicate ES charging (negative number).5. The load, resource dispatch & worst contingency were modeled in power flow to ensure enough resources were dispatced to adequately served the load without causing a voltage collapse. Cases that exhibited a voltage collapse were identified as "Failed".6. "Incremental ES Capacity Required" delineates the additional IFOM ES Block capacity required to serve the load without causing a voltage collapse.

Moorpark Sub-Area Local Capacity Alternative Study August 16, 2017
34
Day 1MW 11 12 13 14 15 16 17 18 19 20 21 22 23 0 1 2 3 4 5 6 7 8 9 10
2022 Scaled Max Hourly Load 1320 1417 1526 1604 1665 1720 1723 1671 1589 1546 1432 1265 1095 991 916 860 831 819 838 927 1008 1077 1176 1268LTPP 2012 Track 1 - Solar PV 5.7 (NQC) 4.8 5.4 5.4 5.2 4.3 3.0 1.4 0.1 0.0 0.0 0.0 0.0 0.0 0.0 0.0 0.0 0.0 0.0 0.0 0.0 0.3 1.6 3.1 4.3LTPP 2012 Track 1 - EE 6.0 4.6 4.9 6.0 6.0 6.0 6.0 6.0 6.0 6.0 6.0 6.0 4.4 3.8 3.5 3.2 3.0 2.9 2.9 2.9 3.2 3.5 3.8 4.1 4.4Load less LTPP PV & EE 1311.0 1407.1 1515.0 1593.0 1654.9 1710.6 1715.1 1664.9 1583.3 1540.0 1426.3 1260.5 1091.7 987.3 912.5 856.9 827.7 816.4 834.7 923.9 1004.6 1071.5 1168.8 1258.8Load Serving Capability 1473 1473 1473 1473 1473 1473 1473 1473 1473 1473 1473 1473 1473 1473 1473 1473 1473 1473 1473 1473 1473 1473 1473 1473 1473Remaing Load to Serve (Note 1) (162.0) (65.9) 42.0 120.0 181.9 237.6 242.1 191.9 110.3 67.0 (46.7) (212.5) (381.3) (485.7) (560.5) (616.1) (645.3) (656.6) (638.3) (549.1) (468.4) (401.5) (304.2) (214.2)
IFOM ES Block 1 - 4hr (at Mandalay) 50.0 0.0 0.0 50.0 50.0 50.0 50.0 0.0 0.0 0.0 0.0 0.0 0.0 0.0 (50.0) (50.0) (50.0) (50.0) (50.0) 0.0 0.0 0.0 0.0 0.0 0.0IFOM ES Block 2 - 4hr (at Mandalay) 55.0 0.0 0.0 0.0 55.0 55.0 55.0 55.0 0.0 0.0 0.0 0.0 0.0 0.0 (55.0) (55.0) (55.0) (55.0) (55.0) 0.0 0.0 0.0 0.0 0.0 0.0
LTPP 2012 Track 1 - IFOM Storage - 4hr 0.5 0.0 0.0 0.0 0.5 0.5 0.5 0.5 0.0 0.0 0.0 0.0 0.0 0.0 0.0 0.0 0.0 0.0 0.0 0.0 0.0 0.0 0.0 0.0 0.0PV/ES Hybrid - 7hr (3hr Max Charge) 25.0 0.0 0.0 0.0 25.0 25.0 25.0 25.0 25.0 25.0 25.0 0.0 0.0 0.0 (25.0) (25.0) (25.0) 0.0 0.0 0.0 0.0 0.0 0.0 0.0 0.0Existing Fast DR - 6hr 18.1 0.0 0.0 0.0 0.0 18.1 18.1 18.1 18.1 18.1 18.1 0.0 0.0 0.0 0.0 0.0 0.0 0.0 0.0 0.0 0.0 0.0 0.0 0.0 0.0DR (LR/ES) - 4hr 80.0 0.0 0.0 0.0 0.0 0.0 80.0 80.0 80.0 80.0 0.0 0.0 0.0 0.0 (80.0) (80.0) (80.0) (80.0) (80.0) 0.0 0.0 0.0 0.0 0.0 0.0Existing Slow DR + ES - 6hr (0.5hr Charge) 30.1 0.0 0.0 0.0 0.0 30.1 30.1 30.1 30.1 30.1 30.1 0.0 0.0 0.0 (30.1) 0.0 0.0 0.0 0.0 0.0 0.0 0.0 0.0 0.0 0.0
Total Preferred Resources & Storage (Note 2) 258.7 0.0 0.0 50.0 130.5 178.7 258.7 208.7 153.2 153.2 73.2 0.0 0.0 0.0 (240.1) (210.0) (210.0) (185.0) (185.0) 0.0 0.0 0.0 0.0 0.0 0.0Local Capacity Deficiency (162.0) (65.9) (8.0) (10.5) 3.2 (21.1) 33.4 38.7 (42.9) (6.2) (46.7) (212.5) (381.3) (245.6) (350.5) (406.1) (460.3) (471.6) (638.3) (549.1) (468.4) (401.5) (304.2) (214.2)
Day 1MW 11 12 13 14 15 16 17 18 19 20 21 22 23 0 1 2 3 4 5 6 7 8 9 10
2022 Scaled Max Hourly Load 1320 1417 1526 1604 1665 1720 1723 1671 1589 1546 1432 1265 1095 991 916 860 831 819 838 927 1008 1077 1176 1268LTPP 2012 Track 1 - Solar PV 5.7 (NQC) 4.8 5.4 5.4 5.2 4.3 3.0 1.4 0.1 0.0 0.0 0.0 0.0 0.0 0.0 0.0 0.0 0.0 0.0 0.0 0.0 0.3 1.6 3.1 4.3LTPP 2012 Track 1 - EE 6.0 4.6 4.9 6.0 6.0 6.0 6.0 6.0 6.0 6.0 6.0 6.0 4.4 3.8 3.5 3.2 3.0 2.9 2.9 2.9 3.2 3.5 3.8 4.1 4.4Load less LTPP PV & EE 1311.0 1407.1 1515.0 1593.0 1654.9 1710.6 1715.1 1664.9 1583.3 1540.0 1426.3 1260.5 1091.7 987.3 912.5 856.9 827.7 816.4 834.7 923.9 1004.6 1071.5 1168.8 1258.8Load Serving Capability 1473 1473 1473 1473 1473 1473 1473 1473 1473 1473 1473 1473 1473 1473 1473 1473 1473 1473 1473 1473 1473 1473 1473 1473 1473Remaing Load to Serve (Note 1) (162.0) (65.9) 42.0 120.0 181.9 237.6 242.1 191.9 110.3 67.0 (46.7) (212.5) (381.3) (485.7) (560.5) (616.1) (645.3) (656.6) (638.3) (549.1) (468.4) (401.5) (304.2) (214.2)
IFOM ES Block 1 - 7hr (at Mandalay) 55.0 0.0 0.0 55.0 55.0 55.0 55.0 55.0 55.0 55.0 0.0 0.0 0.0 0.0 (55.0) (55.0) (55.0) (55.0) (55.0) (55.0) (55.0) (55.0) (55.0) 0.0 0.0IFOM ES Block 2 - 4hr (at Mandalay) 55.0 0.0 0.0 0.0 55.0 55.0 55.0 55.0 0.0 0.0 0.0 0.0 0.0 0.0 (55.0) (55.0) (55.0) (55.0) (55.0) 0.0 0.0 0.0 0.0 0.0 0.0
LTPP 2012 Track 1 - IFOM Storage - 4hr 0.5 0.0 0.0 0.0 0.0 0.0 0.0 0.0 0.0 0.0 0.0 0.0 0.0 0.0 0.0 0.0 0.0 0.0 0.0 0.0 0.0 0.0 0.0 0.0 0.0PV/ES Hybrid - 7hr (3hr Max Charge) 25.0 0.0 0.0 0.0 25.0 25.0 25.0 25.0 25.0 25.0 25.0 0.0 0.0 0.0 (25.0) (25.0) (25.0) 0.0 0.0 0.0 0.0 0.0 0.0 0.0 0.0Existing Fast DR - 6hr 18.1 0.0 0.0 0.0 0.0 18.1 18.1 18.1 18.1 18.1 18.1 0.0 0.0 0.0 0.0 0.0 0.0 0.0 0.0 0.0 0.0 0.0 0.0 0.0 0.0DR (LR/ES) - 4hr 80.0 0.0 0.0 0.0 0.0 80.0 80.0 80.0 80.0 0.0 0.0 0.0 0.0 0.0 (80.0) (80.0) (80.0) (80.0) (80.0) 0.0 0.0 0.0 0.0 0.0 0.0Existing Slow DR + ES - 6hr (0.5hr Charge) 30.1 0.0 0.0 0.0 0.0 30.1 30.1 30.1 30.1 30.1 30.1 0.0 0.0 0.0 (30.1) 0.0 0.0 0.0 0.0 0.0 0.0 0.0 0.0 0.0 0.0
Total Preferred Resources & Storage (Note 2) 263.7 0.0 0.0 55.0 135.0 263.2 263.2 263.2 208.2 128.2 73.2 0.0 0.0 0.0 (245.1) (215.0) (215.0) (190.0) (190.0) (55.0) (55.0) (55.0) (55.0) 0.0 0.0Local Capacity Deficiency (Note 3) (162.0) (65.9) (13.0) (15.0) (81.3) (25.6) (21.1) (16.3) (17.9) (6.2) (46.7) (212.5) (381.3) (240.6) (345.5) (401.1) (455.3) (466.6) (583.3) (494.1) (413.4) (346.5) (304.2) (214.2)Power Flow Dispatch Validation (Note 5)Incremental ES Capacity Required (Note 6)
Table A-3a: 2022 Summer Peak Moorpark Sub-Area Hourly Local Load-Resource AnalysisScenario 1, 2016 Load Shape, Iteration 1 - One 50 MW, 4 hr IFOM Battery Unit & One 55 MW, 4 hr IFOM Battery Unit
Day 2
Table A-3b: 2022 Summer Peak Moorpark Sub-Area Hourly Local Load-Resource Analysis Scenario 1, 2016 Load Shape, Iteration 2 - One 55 MW, 7 hr IFOM Battery Unit & One 55 MW, 4 hr IFOM Battery Unit
Day 2
Notes - 1. "Remaing Load to Serve" is negative when no additional resources are necessary to serve the load and postive when additional resources are needed.2. "Total Preferred Resources & Storage" represents the aggregate dispatch of preferred resources and ES. Negative numbers represent aggregate ES charging.3. "Local Capacity Deficiency" represents remaining "Remaing Load to Serve" less the "Total Preferred Resources & Storage." When values are positive (RED highlighted cells), there is a load serving deficit.4. The BLUE highlighted cells indicate an ES or preferred resource dispatch (positive number). The GREEN highlighed cells Indicate ES charging (negative number).5. The load, resource dispatch & worst contingency were modeled in power flow to ensure enough resources were dispatced to adequately served the load without causing a voltage collapse. Cases that exhibited a voltage collapse were identified as "Failed".6. "Incremental ES Capacity Required" delineates the additional IFOM ES Block capacity required to serve the load without causing a voltage collapse.

Moorpark Sub-Area Local Capacity Alternative Study August 16, 2017
35
Day 1MW 11 12 13 14 15 16 17 18 19 20 21 22 23 0 1 2 3 4 5 6 7 8 9 10
2022 Scaled Max Hourly Load 1470 1557 1624 1680 1716 1723 1692 1628 1595 1595 1495 1334 1167 1039 964 911 877 867 884 961 1045 1132 1257 1372LTPP 2012 Track 1 - Solar PV 5.7 (NQC) 4.8 5.4 5.4 5.2 4.3 3.0 1.4 0.1 0.0 0.0 0.0 0.0 0.0 0.0 0.0 0.0 0.0 0.0 0.0 0.0 0.3 1.6 3.1 4.3LTPP 2012 Track 1 - EE 6.0 5.1 5.4 6.0 6.0 6.0 6.0 6.0 6.0 6.0 6.0 6.0 4.6 4.1 3.6 3.4 3.2 3.1 3.0 3.1 3.3 3.6 3.9 4.4 4.8Load less LTPP PV & EE 1459.7 1546.3 1613.0 1669.3 1705.5 1713.5 1684.2 1622.2 1589.1 1589.2 1489.2 1329.3 1162.6 1035.5 960.5 907.5 874.2 864.0 881.3 957.4 1040.7 1126.2 1249.6 1362.7Load Serving Capability 1582 1582 1582 1582 1582 1582 1582 1582 1582 1582 1582 1582 1582 1582 1582 1582 1582 1582 1582 1582 1582 1582 1582 1582 1582Remaing Load to Serve (Note 1) (122.3) (35.7) 31.0 87.3 123.5 131.5 102.2 40.2 7.1 7.2 (92.8) (252.7) (419.4) (546.5) (621.5) (674.5) (707.8) (718.0) (700.7) (624.6) (541.3) (455.8) (332.4) (219.3)
IFOM ES Block 1 - None 0.0 0.0 0.0 0.0 0.0 0.0 0.0 0.0 0.0 0.0 0.0 0.0 0.0 0.0 0.0 0.0 0.0 0.0 0.0 0.0 0.0 0.0 0.0 0.0IFOM ES Block 2 - None 0.0 0.0 0.0 0.0 0.0 0.0 0.0 0.0 0.0 0.0 0.0 0.0 0.0 0.0 0.0 0.0 0.0 0.0 0.0 0.0 0.0 0.0 0.0 0.0
LTPP 2012 Track 1 - IFOM Storage - 4hr 0.5 0.0 0.0 0.0 0.0 0.0 0.0 0.0 0.0 0.0 0.0 0.0 0.0 0.0 0.0 0.0 0.0 0.0 0.0 0.0 0.0 0.0 0.0 0.0 0.0PV/ES Hybrid - 7hr (3hr Max Charge) 25.0 0.0 25.0 25.0 25.0 25.0 25.0 25.0 25.0 0.0 0.0 0.0 0.0 0.0 (25.0) (25.0) (25.0) 0.0 0.0 0.0 0.0 0.0 0.0 0.0 0.0Existing Fast DR - 6hr 18.1 0.0 0.0 18.1 18.1 18.1 18.1 18.1 18.1 0.0 0.0 0.0 0.0 0.0 0.0 0.0 0.0 0.0 0.0 0.0 0.0 0.0 0.0 0.0 0.0DR (LR/ES) - 4hr 80.0 0.0 0.0 0.0 80.0 80.0 80.0 80.0 0.0 0.0 0.0 0.0 0.0 0.0 (80.0) (80.0) (80.0) (80.0) (80.0) 0.0 0.0 0.0 0.0 0.0 0.0Existing Slow DR + ES - 6hr (0.5hr Charge) 30.1 0.0 0.0 0.0 0.0 30.1 30.1 30.1 30.1 30.1 30.1 0.0 0.0 0.0 (30.1) 0.0 0.0 0.0 0.0 0.0 0.0 0.0 0.0 0.0 0.0
Total Preferred Resources & Storage (Note 2) 153.7 0.0 25.0 43.1 123.1 153.2 153.2 153.2 73.2 30.1 30.1 0.0 0.0 0.0 (135.1) (105.0) (105.0) (80.0) (80.0) 0.0 0.0 0.0 0.0 0.0 0.0Local Capacity Deficiency (Note 3) (122.3) (60.7) (12.1) (35.8) (29.7) (21.7) (51.0) (33.0) (23.0) (22.9) (92.8) (252.7) (419.4) (411.4) (516.5) (569.5) (627.8) (638.0) (700.7) (624.6) (541.3) (455.8) (332.4) (219.3)Power Flow Dispatch Validation (Note 5)Incremental ES Capacity Required (Note 6)Notes - 1. "Remaing Load to Serve" is negative when no additional resources are necessary to serve the load and postive when additional resources are needed.2. "Total Preferred Resources & Storage" represents the aggregate dispatch of preferred resources and ES. Negative numbers represent aggregate ES charging.3. "Local Capacity Deficiency" represents remaining "Remaing Load to Serve" less the "Total Preferred Resources & Storage." When values are positive (RED highlighted cells), there is a load serving deficit.4. The BLUE highlighted cells indicate an ES or preferred resource dispatch (positive number). The GREEN highlighed cells Indicate ES charging (negative number).5. The load, resource dispatch & worst contingency were modeled in power flow to ensure enough resources were dispatced to adequately served the load without causing a voltage collapse. Cases that exhibited a voltage collapse were identified as "Failed".6. "Incremental ES Capacity Required" delineates the additional IFOM ES Block capacity required to serve the load without causing a voltage collapse.
Table A-4: 2022 Summer Peak Moorpark Sub-Area Hourly Local Load-Resource AnalysisScenario 2, 2014 Load Shape, Iteration 1 - 240 MVAR VAR Source at Mandalay
Day 2

Moorpark Sub-Area Local Capacity Alternative Study August 16, 2017
36
Day 1MW 11 12 13 14 15 16 17 18 19 20 21 22 23 0 1 2 3 4 5 6 7 8 9 10
2022 Scaled Max Hourly Load 1460 1542 1618 1666 1699 1723 1722 1647 1581 1592 1509 1360 1160 1068 984 929 896 879 896 969 1060 1155 1248 1343LTPP 2012 Track 1 - Solar PV 5.7 (NQC) 4.8 5.4 5.4 5.2 4.3 3.0 1.4 0.1 0.0 0.0 0.0 0.0 0.0 0.0 0.0 0.0 0.0 0.0 0.0 0.0 0.3 1.6 3.1 4.3LTPP 2012 Track 1 - EE 6.0 5.1 5.4 6.0 6.0 6.0 6.0 6.0 6.0 6.0 6.0 6.0 4.7 4.0 3.7 3.4 3.2 3.1 3.1 3.1 3.4 3.7 4.0 4.3 4.7Load less LTPP PV & EE 1450.3 1531.5 1606.7 1654.8 1688.5 1713.5 1714.5 1641.0 1574.6 1586.0 1503.1 1355.5 1156.0 1064.0 980.4 926.0 892.9 875.6 892.9 965.2 1055.8 1149.7 1240.4 1333.8Load Serving Capability 1582 1582 1582 1582 1582 1582 1582 1582 1582 1582 1582 1582 1582 1582 1582 1582 1582 1582 1582 1582 1582 1582 1582 1582 1582Remaing Load to Serve (Note 1) (131.7) (50.5) 24.7 72.8 106.5 131.5 132.5 59.0 (7.4) 4.0 (78.9) (226.5) (426.0) (518.0) (601.6) (656.0) (689.1) (706.4) (689.1) (616.8) (526.2) (432.3) (341.6) (248.2)
IFOM ES Block 1 - None 0.0 0.0 0.0 0.0 0.0 0.0 0.0 0.0 0.0 0.0 0.0 0.0 0.0 0.0 0.0 0.0 0.0 0.0 0.0 0.0 0.0 0.0 0.0 0.0IFOM ES Block 2 - None 0.0 0.0 0.0 0.0 0.0 0.0 0.0 0.0 0.0 0.0 0.0 0.0 0.0 0.0 0.0 0.0 0.0 0.0 0.0 0.0 0.0 0.0 0.0 0.0
LTPP 2012 Track 1 - IFOM Storage - 4hr 0.5 0.0 0.0 0.0 0.0 0.0 0.0 0.0 0.0 0.0 0.0 0.0 0.0 0.0 0.0 0.0 0.0 0.0 0.0 0.0 0.0 0.0 0.0 0.0 0.0PV/ES Hybrid - 7hr (3hr Max Charge) 25.0 0.0 25.0 25.0 25.0 25.0 25.0 25.0 25.0 0.0 0.0 0.0 0.0 0.0 (25.0) (25.0) (25.0) 0.0 0.0 0.0 0.0 0.0 0.0 0.0 0.0Existing Fast DR - 6hr 18.1 0.0 0.0 18.1 18.1 18.1 18.1 18.1 18.1 0.0 0.0 0.0 0.0 0.0 0.0 0.0 0.0 0.0 0.0 0.0 0.0 0.0 0.0 0.0 0.0DR (LR/ES) - 4hr 80.0 0.0 0.0 0.0 80.0 80.0 80.0 80.0 0.0 0.0 0.0 0.0 0.0 0.0 (80.0) (80.0) (80.0) (80.0) (80.0) 0.0 0.0 0.0 0.0 0.0 0.0Existing Slow DR + ES - 6hr (0.5hr Charge) 30.1 0.0 0.0 0.0 0.0 30.1 30.1 30.1 30.1 30.1 30.1 0.0 0.0 0.0 (30.1) 0.0 0.0 0.0 0.0 0.0 0.0 0.0 0.0 0.0 0.0
Total Preferred Resources & Storage (Note 2) 153.7 0.0 25.0 43.1 123.1 153.2 153.2 153.2 73.2 30.1 30.1 0.0 0.0 0.0 (135.1) (105.0) (105.0) (80.0) (80.0) 0.0 0.0 0.0 0.0 0.0 0.0Local Capacity Deficiency (Note 3) (131.7) (75.5) (18.4) (50.3) (46.7) (21.7) (20.7) (14.2) (37.5) (26.1) (78.9) (226.5) (426.0) (382.9) (496.6) (551.0) (609.1) (626.4) (689.1) (616.8) (526.2) (432.3) (341.6) (248.2)Power Flow Dispatch Validation (Note 5)Incremental ES Capacity Required (Note 6)Notes - 1. "Remaing Load to Serve" is negative when no additional resources are necessary to serve the load and postive when additional resources are needed.2. "Total Preferred Resources & Storage" represents the aggregate dispatch of preferred resources and ES. Negative numbers represent aggregate ES charging.3. "Local Capacity Deficiency" represents remaining "Remaing Load to Serve" less the "Total Preferred Resources & Storage." When values are positive (RED highlighted cells), there is a load serving deficit.4. The BLUE highlighted cells indicate an ES or preferred resource dispatch (positive number). The GREEN highlighed cells Indicate ES charging (negative number).5. The load, resource dispatch & worst contingency were modeled in power flow to ensure enough resources were dispatced to adequately served the load without causing a voltage collapse. Cases that exhibited a voltage collapse were identified as "Failed".6. "Incremental ES Capacity Required" delineates the additional IFOM ES Block capacity required to serve the load without causing a voltage collapse.
Table A-5: 2022 Summer Peak Moorpark Sub-Area Hourly Local Load-Resource AnalysisScenario 2, 2015 Load Shape, Iteration 1 - 240 MVAR VAR Source at Mandalay
Day 2

Moorpark Sub-Area Local Capacity Alternative Study August 16, 2017
37
Day 1MW 11 12 13 14 15 16 17 18 19 20 21 22 23 0 1 2 3 4 5 6 7 8 9 10
2022 Scaled Max Hourly Load 1320 1417 1526 1604 1665 1720 1723 1671 1589 1546 1432 1265 1095 991 916 860 831 819 838 927 1008 1077 1176 1268LTPP 2012 Track 1 - Solar PV 5.7 (NQC) 4.8 5.4 5.4 5.2 4.3 3.0 1.4 0.1 0.0 0.0 0.0 0.0 0.0 0.0 0.0 0.0 0.0 0.0 0.0 0.0 0.3 1.6 3.1 4.3LTPP 2012 Track 1 - EE 6.0 4.6 4.9 6.0 6.0 6.0 6.0 6.0 6.0 6.0 6.0 6.0 4.4 3.8 3.5 3.2 3.0 2.9 2.9 2.9 3.2 3.5 3.8 4.1 4.4Load less LTPP PV & EE 1311.0 1407.1 1515.0 1593.0 1654.9 1710.6 1715.1 1664.9 1583.3 1540.0 1426.3 1260.5 1091.7 987.3 912.5 856.9 827.7 816.4 834.7 923.9 1004.6 1071.5 1168.8 1258.8Load Serving Capability 1582 1582 1582 1582 1582 1582 1582 1582 1582 1582 1582 1582 1582 1582 1582 1582 1582 1582 1582 1582 1582 1582 1582 1582 1582Remaing Load to Serve (Note 1) (271.0) (174.9) (67.0) 11.0 72.9 128.6 133.1 82.9 1.3 (42.0) (155.7) (321.5) (490.3) (594.7) (669.5) (725.1) (754.3) (765.6) (747.3) (658.1) (577.4) (510.5) (413.2) (323.2)
IFOM ES Block 1 - None 0.0 0.0 0.0 0.0 0.0 0.0 0.0 0.0 0.0 0.0 0.0 0.0 0.0 0.0 0.0 0.0 0.0 0.0 0.0 0.0 0.0 0.0 0.0 0.0IFOM ES Block 2 - None 0.0 0.0 0.0 0.0 0.0 0.0 0.0 0.0 0.0 0.0 0.0 0.0 0.0 0.0 0.0 0.0 0.0 0.0 0.0 0.0 0.0 0.0 0.0 0.0
LTPP 2012 Track 1 - IFOM Storage - 4hr 0.5 0.0 0.0 0.0 0.0 0.0 0.0 0.0 0.0 0.0 0.0 0.0 0.0 0.0 0.0 0.0 0.0 0.0 0.0 0.0 0.0 0.0 0.0 0.0 0.0PV/ES Hybrid - 7hr (3hr Max Charge) 25.0 0.0 25.0 25.0 25.0 25.0 25.0 25.0 25.0 0.0 0.0 0.0 0.0 0.0 (25.0) (25.0) (25.0) 0.0 0.0 0.0 0.0 0.0 0.0 0.0 0.0Existing Fast DR - 6hr 18.1 0.0 0.0 18.1 18.1 18.1 18.1 18.1 18.1 0.0 0.0 0.0 0.0 0.0 0.0 0.0 0.0 0.0 0.0 0.0 0.0 0.0 0.0 0.0 0.0DR (LR/ES) - 4hr 80.0 0.0 0.0 0.0 0.0 80.0 80.0 80.0 80.0 0.0 0.0 0.0 0.0 0.0 (80.0) (80.0) (80.0) (80.0) (80.0) 0.0 0.0 0.0 0.0 0.0 0.0Existing Slow DR + ES - 6hr (0.5hr Charge) 30.1 0.0 0.0 0.0 0.0 30.1 30.1 30.1 30.1 30.1 30.1 0.0 0.0 0.0 (30.1) 0.0 0.0 0.0 0.0 0.0 0.0 0.0 0.0 0.0 0.0
Total Preferred Resources & Storage (Note 2) 153.7 0.0 25.0 43.1 43.1 153.2 153.2 153.2 153.2 30.1 30.1 0.0 0.0 0.0 (135.1) (105.0) (105.0) (80.0) (80.0) 0.0 0.0 0.0 0.0 0.0 0.0Local Capacity Deficiency (Note 3) (271.0) (199.9) (110.1) (32.1) (80.3) (24.6) (20.1) (70.3) (28.8) (72.1) (155.7) (321.5) (490.3) (459.6) (564.5) (620.1) (674.3) (685.6) (747.3) (658.1) (577.4) (510.5) (413.2) (323.2)Power Flow Dispatch Validation (Note 5)Incremental ES Capacity Required (Note 6)Notes - 1. "Remaing Load to Serve" is negative when no additional resources are necessary to serve the load and postive when additional resources are needed.2. "Total Preferred Resources & Storage" represents the aggregate dispatch of preferred resources and ES. Negative numbers represent aggregate ES charging.3. "Local Capacity Deficiency" represents remaining "Remaing Load to Serve" less the "Total Preferred Resources & Storage." When values are positive (RED highlighted cells), there is a load serving deficit.4. The BLUE highlighted cells indicate an ES or preferred resource dispatch (positive number). The GREEN highlighed cells Indicate ES charging (negative number).5. The load, resource dispatch & worst contingency were modeled in power flow to ensure enough resources were dispatced to adequately served the load without causing a voltage collapse. Cases that exhibited a voltage collapse were identified as "Failed".6. "Incremental ES Capacity Required" delineates the additional IFOM ES Block capacity required to serve the load without causing a voltage collapse.
Table A-6: 2022 Summer Peak Moorpark Sub-Area Hourly Local Load-Resource AnalysisScenario 2, 2016 Load Shape, Iteration 1 - 240 MVAR VAR Source at Mandalay
Day 2

Moorpark Sub-Area Local Capacity Alternative Study August 16, 2017
38
Day 1MW 11 12 13 14 15 16 17 18 19 20 21 22 23 0 1 2 3 4 5 6 7 8 9 10
2022 Scaled Max Hourly Load 1470 1557 1624 1680 1716 1723 1692 1628 1595 1595 1495 1334 1167 1039 964 911 877 867 884 961 1045 1132 1257 1372LTPP 2012 Track 1 - Solar PV 5.7 (NQC) 4.8 5.4 5.4 5.2 4.3 3.0 1.4 0.1 0.0 0.0 0.0 0.0 0.0 0.0 0.0 0.0 0.0 0.0 0.0 0.0 0.3 1.6 3.1 4.3LTPP 2012 Track 1 - EE 6.0 5.1 5.4 6.0 6.0 6.0 6.0 6.0 6.0 6.0 6.0 6.0 4.6 4.1 3.6 3.4 3.2 3.1 3.0 3.1 3.3 3.6 3.9 4.4 4.8Load less LTPP PV & EE 1459.7 1546.3 1613.0 1669.3 1705.5 1713.5 1684.2 1622.2 1589.1 1589.2 1489.2 1329.3 1162.6 1035.5 960.5 907.5 874.2 864.0 881.3 957.4 1040.7 1126.2 1249.6 1362.7Load Serving Capability 1401 1401 1401 1401 1401 1401 1401 1401 1401 1401 1401 1401 1401 1401 1401 1401 1401 1401 1401 1401 1401 1401 1401 1401 1401Remaing Load to Serve (Note 1) 58.7 145.3 212.0 268.3 304.5 312.5 283.2 221.2 188.1 188.2 88.2 (71.7) (238.4) (365.5) (440.5) (493.5) (526.8) (537.0) (519.7) (443.6) (360.3) (274.8) (151.4) (38.3)
IFOM ES Block 1 - 4hr (at Mandalay) 50.0 0.0 0.0 0.0 50.0 50.0 50.0 50.0 0.0 0.0 0.0 0.0 0.0 0.0 (50.0) (50.0) (50.0) (50.0) (50.0) 0.0 0.0 0.0 0.0 0.0 0.0IFOM ES Block 2 - 4hr (at Mandalay) 55.0 0.0 0.0 0.0 55.0 55.0 55.0 55.0 0.0 0.0 0.0 0.0 0.0 0.0 (55.0) (55.0) (55.0) (55.0) (55.0) 0.0 0.0 0.0 0.0 0.0 0.0IFOM ES Block 3 - 4hr (at Ellwood) 60.0 0.0 0.0 0.0 60.0 60.0 60.0 60.0 0.0 0.0 0.0 0.0 0.0 0.0 (60.0) (60.0) (60.0) (60.0) (60.0) 0.0 0.0 0.0 0.0 0.0 0.0LTPP 2012 Track 1 - IFOM Storage - 4hr 0.5 0.0 0.0 0.0 0.5 0.5 0.5 0.5 0.0 0.0 0.0 0.0 0.0 0.0 0.0 0.0 0.0 0.0 0.0 0.0 0.0 0.0 0.0 0.0 0.0PV/ES Hybrid - 7hr (3hr Max Charge) 25.0 0.0 0.0 0.0 25.0 25.0 25.0 25.0 25.0 25.0 25.0 0.0 0.0 0.0 (25.0) (25.0) (25.0) 0.0 0.0 0.0 0.0 0.0 0.0 0.0 0.0Existing Fast DR - 6hr 18.1 0.0 0.0 0.0 0.0 18.1 18.1 18.1 18.1 18.1 18.1 0.0 0.0 0.0 0.0 0.0 0.0 0.0 0.0 0.0 0.0 0.0 0.0 0.0 0.0DR (LR/ES) - 4hr 80.0 0.0 0.0 0.0 0.0 0.0 80.0 80.0 80.0 80.0 0.0 0.0 0.0 0.0 (80.0) (80.0) (80.0) (80.0) (80.0) 0.0 0.0 0.0 0.0 0.0 0.0Existing Slow DR + ES - 6hr (0.5hr Charge) 30.1 0.0 0.0 0.0 0.0 30.1 30.1 30.1 30.1 30.1 30.1 0.0 0.0 0.0 (30.1) 0.0 0.0 0.0 0.0 0.0 0.0 0.0 0.0 0.0 0.0
Total Preferred Resources & Storage (Note 2) 318.7 0.0 0.0 0.0 190.5 238.7 318.7 318.7 153.2 153.2 73.2 0.0 0.0 0.0 (300.1) (270.0) (270.0) (245.0) (245.0) 0.0 0.0 0.0 0.0 0.0 0.0Local Capacity Deficiency 58.7 145.3 212.0 77.8 65.8 (6.2) (35.5) 68.0 34.9 115.0 88.2 (71.7) (238.4) (65.4) (170.5) (223.5) (281.8) (292.0) (519.7) (443.6) (360.3) (274.8) (151.4) (38.3)
Day 1MW 11 12 13 14 15 16 17 18 19 20 21 22 23 0 1 2 3 4 5 6 7 8 9 10
2022 Scaled Max Hourly Load - DR Called 1470 1557 1624 1680 1716 1723 1692 1628 1595 1595 1495 1334 1167 1039 964 911 877 867 884 961 1045 1132 1257 1372LTPP 2012 Track 1 - Solar PV 5.7 (NQC) 4.8 5.4 5.4 5.2 4.3 3.0 1.4 0.1 0.0 0.0 0.0 0.0 0.0 0.0 0.0 0.0 0.0 0.0 0.0 0.0 0.3 1.6 3.1 4.3LTPP 2012 Track 1 - EE 6.0 5.1 5.4 6.0 6.0 6.0 6.0 6.0 6.0 6.0 6.0 6.0 4.6 4.1 3.6 3.4 3.2 3.1 3.0 3.1 3.3 3.6 3.9 4.4 4.8Load less LTPP PV & EE 1459.7 1546.3 1613.0 1669.3 1705.5 1713.5 1684.2 1622.2 1589.1 1589.2 1489.2 1329.3 1162.6 1035.5 960.5 907.5 874.2 864.0 881.3 957.4 1040.7 1126.2 1249.6 1362.7Load Serving Capability 1401 1401 1401 1401 1401 1401 1401 1401 1401 1401 1401 1401 1401 1401 1401 1401 1401 1401 1401 1401 1401 1401 1401 1401 1401Remaing Load to Serve (Note 1) 58.7 145.3 212.0 268.3 304.5 312.5 283.2 221.2 188.1 188.2 88.2 (71.7) (238.4) (365.5) (440.5) (493.5) (526.8) (537.0) (519.7) (443.6) (360.3) (274.8) (151.4) (38.3)
IFOM ES Block 1 - 9hr (at Mandalay) 55.0 0.0 0.0 55.0 55.0 55.0 55.0 55.0 55.0 55.0 55.0 55.0 0.0 (55.0) (55.0) (55.0) (55.0) (55.0) (55.0) (55.0) (55.0) (55.0) (55.0) (44.0) 0.0IFOM ES Block 2 - 10hr (at Mandalay) 55.0 0.0 55.0 55.0 55.0 55.0 55.0 55.0 55.0 55.0 55.0 55.0 0.0 (55.0) (55.0) (55.0) (55.0) (55.0) (55.0) (55.0) (55.0) (55.0) (55.0) (55.0) (55.0)IFOM ES Block 3 - 10hr (at Ellwood) 60.0 60.0 60.0 60.0 60.0 60.0 60.0 60.0 60.0 60.0 60.0 0.0 (60.0) (60.0) (60.0) (60.0) (60.0) (60.0) (60.0) (60.0) (60.0) (60.0) (60.0) (60.0) 0.0LTPP 2012 Track 1 - IFOM Storage - 4hr 0.5 0.0 0.0 0.0 0.0 0.0 0.0 0.0 0.0 0.0 0.0 0.0 0.0 0.0 0.0 0.0 0.0 0.0 0.0 0.0 0.0 0.0 0.0 0.0 0.0PV/ES Hybrid - 7hr (3hr Max Charge) 25.0 0.0 25.0 25.0 25.0 25.0 25.0 25.0 25.0 0.0 0.0 0.0 0.0 0.0 (25.0) (25.0) (25.0) 0.0 0.0 0.0 0.0 0.0 0.0 0.0 0.0Existing Fast DR - 6hr 18.1 0.0 0.0 18.1 18.1 18.1 18.1 18.1 18.1 0.0 0.0 0.0 0.0 0.0 0.0 0.0 0.0 0.0 0.0 0.0 0.0 0.0 0.0 0.0 0.0DR (LR/ES) - 4hr 80.0 0.0 0.0 0.0 80.0 80.0 80.0 80.0 0.0 0.0 0.0 0.0 0.0 0.0 (80.0) (80.0) (80.0) (80.0) (80.0) 0.0 0.0 0.0 0.0 0.0 0.0Existing Slow DR + ES - 6hr (0.5hr Charge) 30.1 0.0 0.0 0.0 0.0 30.1 30.1 30.1 30.1 30.1 30.1 0.0 0.0 0.0 (30.1) 0.0 0.0 0.0 0.0 0.0 0.0 0.0 0.0 0.0 0.0
Total Preferred Resources & Storage (Note 2) 323.7 60.0 140.0 213.1 293.1 323.2 323.2 323.2 243.2 200.1 200.1 110.0 (60.0) (170.0) (305.1) (275.0) (275.0) (250.0) (250.0) (170.0) (170.0) (170.0) (170.0) (159.0) (55.0)Local Capacity Deficiency (1.3) 5.3 (1.1) (24.8) (18.7) (10.7) (40.0) (22.0) (12.0) (11.9) (21.8) (11.7) (68.4) (60.4) (165.5) (218.5) (276.8) (287.0) (349.7) (273.6) (190.3) (104.8) 7.6 16.7Notes - 1. "Remaing Load to Serve" is negative when no additional resources are necessary to serve the load and postive when additional resources are needed.2. "Total Preferred Resources & Storage" represents the aggregate dispatch of preferred resources and ES. Negative numbers represent aggregate ES charging.3. "Local Capacity Deficiency" represents remaining "Remaing Load to Serve" less the "Total Preferred Resources & Storage." When values are positive (RED highlighted cells), there is a load serving deficit.4. The BLUE highlighted cells indicate an ES or preferred resource dispatch (positive number). The GREEN highlighed cells Indicate ES charging (negative number).5. The load, resource dispatch & worst contingency were modeled in power flow to ensure enough resources were dispatced to adequately served the load without causing a voltage collapse. Cases that exhibited a voltage collapse were identified as "Failed".6. "Incremental ES Capacity Required" delineates the additional IFOM ES Block capacity required to serve the load without causing a voltage collapse.
Table A-7a: 2022 Summer Peak Moorpark Sub-Area Hourly Local Load-Resource AnalysisScenario 3, 2014 Load Shape, Iteration 1 - One 50 MW, 4 hr IFOM Battery Unit; One 55 MW, 4 hr IFOM Battery Unit; One 60 MW, 4 hr IFOM Battery Unit; Ellwood Plant Out-of-Service
Day 2
Day 2
Table A-7b: 2022 Summer Peak Moorpark Sub-Area Hourly Local Load-Resource Analysis Scenario 3, 2014 Load Shape, Iteration 2 - One 55 MW, 9 hr IFOM Battery Unit; One 55 MW, 10 hr IFOM Battery Unit; One 60 MW, 10 hr IFOM Battery Unit; Ellwood Plant Out-of-Service

Moorpark Sub-Area Local Capacity Alternative Study August 16, 2017
39
Day 1MW 11 12 13 14 15 16 17 18 19 20 21 22 23 0 1 2 3 4 5 6 7 8 9 10
2022 Scaled Max Hourly Load - DR Called 1470 1557 1624 1680 1716 1723 1692 1628 1595 1595 1495 1334 1167 1039 964 911 877 867 884 961 1045 1132 1257 1372LTPP 2012 Track 1 - Solar PV 5.7 (NQC) 4.8 5.4 5.4 5.2 4.3 3.0 1.4 0.1 0.0 0.0 0.0 0.0 0.0 0.0 0.0 0.0 0.0 0.0 0.0 0.0 0.3 1.6 3.1 4.3LTPP 2012 Track 1 - EE 6.0 5.1 5.4 6.0 6.0 6.0 6.0 6.0 6.0 6.0 6.0 6.0 4.6 4.1 3.6 3.4 3.2 3.1 3.0 3.1 3.3 3.6 3.9 4.4 4.8Load less LTPP PV & EE 1459.7 1546.3 1613.0 1669.3 1705.5 1713.5 1684.2 1622.2 1589.1 1589.2 1489.2 1329.3 1162.6 1035.5 960.5 907.5 874.2 864.0 881.3 957.4 1040.7 1126.2 1249.6 1362.7Load Serving Capability 1401 1401 1401 1401 1401 1401 1401 1401 1401 1401 1401 1401 1401 1401 1401 1401 1401 1401 1401 1401 1401 1401 1401 1401 1401Remaing Load to Serve (Note 1) 58.7 145.3 212.0 268.3 304.5 312.5 283.2 221.2 188.1 188.2 88.2 (71.7) (238.4) (365.5) (440.5) (493.5) (526.8) (537.0) (519.7) (443.6) (360.3) (274.8) (151.4) (38.3)
IFOM ES Block 1 - 9hr (at Mandalay) 55.0 0.0 0.0 55.0 55.0 55.0 55.0 55.0 55.0 55.0 55.0 55.0 0.0 (55.0) (55.0) (55.0) (55.0) (55.0) (55.0) (55.0) (55.0) (55.0) (55.0) (44.0) 0.0IFOM ES Block 2 - 5hr (at Mandalay) 55.0 0.0 55.0 55.0 55.0 55.0 55.0 0.0 0.0 0.0 0.0 0.0 0.0 0.0 0.0 0.0 (55.0) (55.0) (55.0) (55.0) (55.0) (55.0) 0.0 0.0 0.0IFOM ES Block 3 - 5hr (at Mandalay) 55.0 0.0 0.0 0.0 0.0 0.0 0.0 55.0 55.0 55.0 55.0 55.0 0.0 0.0 0.0 0.0 (55.0) (55.0) (55.0) (55.0) (55.0) (55.0) 0.0 0.0 0.0IFOM ES Block 4 - 10hr (at Ellwood) 60.0 60.0 60.0 60.0 60.0 60.0 60.0 60.0 60.0 60.0 60.0 0.0 (60.0) (60.0) (60.0) (60.0) (60.0) (60.0) (60.0) (60.0) (60.0) (60.0) (60.0) (60.0) 0.0LTPP 2012 Track 1 - IFOM Storage - 4hr 0.5 0.0 0.0 0.0 0.0 0.0 0.0 0.0 0.0 0.0 0.0 0.0 0.0 0.0 0.0 0.0 0.0 0.0 0.0 0.0 0.0 0.0 0.0 0.0 0.0PV/ES Hybrid - 7hr (3hr Max Charge) 25.0 0.0 25.0 25.0 25.0 25.0 25.0 25.0 25.0 0.0 0.0 0.0 0.0 0.0 (25.0) (25.0) (25.0) 0.0 0.0 0.0 0.0 0.0 0.0 0.0 0.0Existing Fast DR - 6hr 18.1 0.0 0.0 18.1 18.1 18.1 18.1 18.1 18.1 0.0 0.0 0.0 0.0 0.0 0.0 0.0 0.0 0.0 0.0 0.0 0.0 0.0 0.0 0.0 0.0DR (LR/ES) - 4hr 80.0 0.0 0.0 0.0 80.0 80.0 80.0 80.0 0.0 0.0 0.0 0.0 0.0 0.0 (80.0) (80.0) (80.0) (80.0) (80.0) 0.0 0.0 0.0 0.0 0.0 0.0Existing Slow DR + ES - 6hr (0.5hr Charge) 30.1 0.0 0.0 0.0 0.0 30.1 30.1 30.1 30.1 30.1 30.1 0.0 0.0 0.0 (30.1) 0.0 0.0 0.0 0.0 0.0 0.0 0.0 0.0 0.0 0.0
Total Preferred Resources & Storage (Note 2) 378.7 60.0 140.0 213.1 293.1 323.2 323.2 323.2 243.2 200.1 200.1 110.0 (60.0) (115.0) (250.1) (220.0) (330.0) (305.0) (305.0) (225.0) (225.0) (225.0) (115.0) (104.0) 0.0Local Capacity Deficiency (1.3) 5.3 (1.1) (24.8) (18.7) (10.7) (40.0) (22.0) (12.0) (11.9) (21.8) (11.7) (123.4) (115.4) (220.5) (163.5) (221.8) (232.0) (294.7) (218.6) (135.3) (159.8) (47.4) (38.3)Power Flow Dispatch Validation (Note 5) No Fail FailedIncremental ES Capacity Required (Note 6) 0.0 5.0
Table A-7c: 2022 Summer Peak Moorpark Sub-Area Hourly Local Load-Resource Analysis Scenario 3, 2014 Load Shape, Iteration 3 - One 55 MW, 9 hr IFOM Battery Unit; Two 55 MW, 5 hr IFOM Battery Unit; One 60 MW, 10 hr IFOM Battery Unit; Ellwood Plant Out-of-Service
Day 2
Notes - 1. "Remaing Load to Serve" is negative when no additional resources are necessary to serve the load and postive when additional resources are needed.2. "Total Preferred Resources & Storage" represents the aggregate dispatch of preferred resources and ES. Negative numbers represent aggregate ES charging.3. "Local Capacity Deficiency" represents remaining "Remaing Load to Serve" less the "Total Preferred Resources & Storage." When values are positive (RED highlighted cells), there is a load serving deficit.4. The BLUE highlighted cells indicate an ES or preferred resource dispatch (positive number). The GREEN highlighed cells Indicate ES charging (negative number).5. The load, resource dispatch & wort contingency were modeled in power flow to ensure enough resources were dispatced to adequately served the load without causing a voltage collapse. Cases that exhibited a voltage collapse were identified as "Failed".6. "Incremental ES Capacity Required" delineates the additional IFOM ES Block capacity required to serve the load without causing a voltage collapse.

Moorpark Sub-Area Local Capacity Alternative Study August 16, 2017
40
Day 1MW 11 12 13 14 15 16 17 18 19 20 21 22 23 0 1 2 3 4 5 6 7 8 9 10
2022 Scaled Max Hourly Load 1460 1542 1618 1666 1699 1723 1722 1647 1581 1592 1509 1360 1160 1068 984 929 896 879 896 969 1060 1155 1248 1343LTPP 2012 Track 1 - Solar PV 5.7 (NQC) 4.8 5.4 5.4 5.2 4.3 3.0 1.4 0.1 0.0 0.0 0.0 0.0 0.0 0.0 0.0 0.0 0.0 0.0 0.0 0.0 0.3 1.6 3.1 4.3LTPP 2012 Track 1 - EE 6.0 5.1 5.4 6.0 6.0 6.0 6.0 6.0 6.0 6.0 6.0 6.0 4.7 4.0 3.7 3.4 3.2 3.1 3.1 3.1 3.4 3.7 4.0 4.3 4.7Load less LTPP PV & EE 1450.3 1531.5 1606.7 1654.8 1688.5 1713.5 1714.5 1641.0 1574.6 1586.0 1503.1 1355.5 1156.0 1064.0 980.4 926.0 892.9 875.6 892.9 965.2 1055.8 1149.7 1240.4 1333.8Load Serving Capability 1401 1401 1401 1401 1401 1401 1401 1401 1401 1401 1401 1401 1401 1401 1401 1401 1401 1401 1401 1401 1401 1401 1401 1401 1401Remaing Load to Serve (Note 1) 49.3 130.5 205.7 253.8 287.5 312.5 313.5 240.0 173.6 185.0 102.1 (45.5) (245.0) (337.0) (420.6) (475.0) (508.1) (525.4) (508.1) (435.8) (345.2) (251.3) (160.6) (67.2)
IFOM ES Block 1 - 4hr (at Mandalay) 50.0 0.0 0.0 0.0 50.0 50.0 50.0 50.0 0.0 0.0 0.0 0.0 0.0 0.0 (50.0) (50.0) (50.0) (50.0) (50.0) 0.0 0.0 0.0 0.0 0.0 0.0IFOM ES Block 2 - 4hr (at Mandalay) 55.0 0.0 0.0 0.0 55.0 55.0 55.0 55.0 0.0 0.0 0.0 0.0 0.0 0.0 (55.0) (55.0) (55.0) (55.0) (55.0) 0.0 0.0 0.0 0.0 0.0 0.0IFOM ES Block 3 - 4hr (at Ellwood) 60.0 0.0 0.0 0.0 60.0 60.0 60.0 60.0 0.0 0.0 0.0 0.0 0.0 0.0 (60.0) (60.0) (60.0) (60.0) (60.0) 0.0 0.0 0.0 0.0 0.0 0.0LTPP 2012 Track 1 - IFOM Storage - 4hr 0.5 0.0 0.0 0.0 0.5 0.5 0.5 0.5 0.0 0.0 0.0 0.0 0.0 0.0 0.0 0.0 0.0 0.0 0.0 0.0 0.0 0.0 0.0 0.0 0.0PV/ES Hybrid - 7hr (3hr Max Charge) 25.0 0.0 0.0 0.0 25.0 25.0 25.0 25.0 25.0 25.0 25.0 0.0 0.0 0.0 (25.0) (25.0) (25.0) 0.0 0.0 0.0 0.0 0.0 0.0 0.0 0.0Existing Fast DR - 6hr 18.1 0.0 0.0 0.0 0.0 18.1 18.1 18.1 18.1 18.1 18.1 0.0 0.0 0.0 0.0 0.0 0.0 0.0 0.0 0.0 0.0 0.0 0.0 0.0 0.0DR (LR/ES) - 4hr 80.0 0.0 0.0 0.0 0.0 0.0 80.0 80.0 80.0 80.0 0.0 0.0 0.0 0.0 (80.0) (80.0) (80.0) (80.0) (80.0) 0.0 0.0 0.0 0.0 0.0 0.0Existing Slow DR + ES - 6hr (0.5hr Charge) 30.1 0.0 0.0 0.0 0.0 30.1 30.1 30.1 30.1 30.1 30.1 0.0 0.0 0.0 (30.1) 0.0 0.0 0.0 0.0 0.0 0.0 0.0 0.0 0.0 0.0
Total Preferred Resources & Storage (Note 2) 318.7 0.0 0.0 0.0 190.5 238.7 318.7 318.7 153.2 153.2 73.2 0.0 0.0 0.0 (300.1) (270.0) (270.0) (245.0) (245.0) 0.0 0.0 0.0 0.0 0.0 0.0Local Capacity Deficiency 49.3 130.5 205.7 63.3 48.8 (6.2) (5.2) 86.8 20.4 111.8 102.1 (45.5) (245.0) (36.9) (150.6) (205.0) (263.1) (280.4) (508.1) (435.8) (345.2) (251.3) (160.6) (67.2)
Day 1MW 11 12 13 14 15 16 17 18 19 20 21 22 23 0 1 2 3 4 5 6 7 8 9 10
2022 Scaled Max Hourly Load - DR Called 1460 1542 1618 1666 1699 1723 1722 1647 1581 1592 1509 1360 1160 1068 984 929 896 879 896 969 1060 1155 1248 1343LTPP 2012 Track 1 - Solar PV 5.7 (NQC) 4.8 5.4 5.4 5.2 4.3 3.0 1.4 0.1 0.0 0.0 0.0 0.0 0.0 0.0 0.0 0.0 0.0 0.0 0.0 0.0 0.3 1.6 3.1 4.3LTPP 2012 Track 1 - EE 6.0 5.1 5.4 6.0 6.0 6.0 6.0 6.0 6.0 6.0 6.0 6.0 4.7 4.0 3.7 3.4 3.2 3.1 3.1 3.1 3.4 3.7 4.0 4.3 4.7Load less LTPP PV & EE 1450.3 1531.5 1606.7 1654.8 1688.5 1713.5 1714.5 1641.0 1574.6 1586.0 1503.1 1355.5 1156.0 1064.0 980.4 926.0 892.9 875.6 892.9 965.2 1055.8 1149.7 1240.4 1333.8Load Serving Capability 1401 1401 1401 1401 1401 1401 1401 1401 1401 1401 1401 1401 1401 1401 1401 1401 1401 1401 1401 1401 1401 1401 1401 1401 1401Remaing Load to Serve (Note 1) 49.3 130.5 205.7 253.8 287.5 312.5 313.5 240.0 173.6 185.0 102.1 (45.5) (245.0) (337.0) (420.6) (475.0) (508.1) (525.4) (508.1) (435.8) (345.2) (251.3) (160.6) (67.2)
IFOM ES Block 1 - 9hr (at Mandalay) 55.0 0.0 0.0 55.0 55.0 55.0 55.0 55.0 55.0 55.0 55.0 55.0 0.0 (55.0) (55.0) (55.0) (55.0) (55.0) (55.0) (55.0) (55.0) (55.0) (55.0) (44.0) 0.0IFOM ES Block 2 - 10hr (at Mandalay) 55.0 0.0 55.0 55.0 55.0 55.0 55.0 55.0 55.0 55.0 55.0 55.0 0.0 (55.0) (55.0) (55.0) (55.0) (55.0) (55.0) (55.0) (55.0) (55.0) (55.0) (55.0) (55.0)IFOM ES Block 3 - 10hr (at Ellwood) 60.0 60.0 60.0 60.0 60.0 60.0 60.0 60.0 60.0 60.0 60.0 0.0 (60.0) (60.0) (60.0) (60.0) (60.0) (60.0) (60.0) (60.0) (60.0) (60.0) (60.0) (60.0) 0.0LTPP 2012 Track 1 - IFOM Storage - 4hr 0.5 0.0 0.0 0.0 0.0 0.0 0.0 0.0 0.0 0.0 0.0 0.0 0.0 0.0 0.0 0.0 0.0 0.0 0.0 0.0 0.0 0.0 0.0 0.0 0.0PV/ES Hybrid - 7hr (3hr Max Charge) 25.0 0.0 25.0 25.0 25.0 25.0 25.0 25.0 25.0 0.0 0.0 0.0 0.0 0.0 (25.0) (25.0) (25.0) 0.0 0.0 0.0 0.0 0.0 0.0 0.0 0.0Existing Fast DR - 6hr 18.1 0.0 0.0 18.1 18.1 18.1 18.1 18.1 18.1 0.0 0.0 0.0 0.0 0.0 0.0 0.0 0.0 0.0 0.0 0.0 0.0 0.0 0.0 0.0 0.0DR (LR/ES) - 4hr 80.0 0.0 0.0 0.0 80.0 80.0 80.0 80.0 0.0 0.0 0.0 0.0 0.0 0.0 (80.0) (80.0) (80.0) (80.0) (80.0) 0.0 0.0 0.0 0.0 0.0 0.0Existing Slow DR + ES - 6hr (0.5hr Charge) 30.1 0.0 0.0 0.0 0.0 30.1 30.1 30.1 30.1 30.1 30.1 0.0 0.0 0.0 (30.1) 0.0 0.0 0.0 0.0 0.0 0.0 0.0 0.0 0.0 0.0
Total Preferred Resources & Storage (Note 2) 323.7 60.0 140.0 213.1 293.1 323.2 323.2 323.2 243.2 200.1 200.1 110.0 (60.0) (170.0) (305.1) (275.0) (275.0) (250.0) (250.0) (170.0) (170.0) (170.0) (170.0) (159.0) (55.0)Local Capacity Deficiency (10.7) (9.5) (7.4) (39.3) (35.7) (10.7) (9.7) (3.2) (26.5) (15.1) (7.9) 14.5 (75.0) (31.9) (145.6) (200.0) (258.1) (275.4) (338.1) (265.8) (175.2) (81.3) (1.6) (12.2)Notes - 1. "Remaing Load to Serve" is negative when no additional resources are necessary to serve the load and postive when additional resources are needed.2. "Total Preferred Resources & Storage" represents the aggregate dispatch of preferred resources and ES. Negative numbers represent aggregate ES charging.3. "Local Capacity Deficiency" represents remaining "Remaing Load to Serve" less the "Total Preferred Resources & Storage." When values are positive (RED highlighted cells), there is a load serving deficit.4. The BLUE highlighted cells indicate an ES or preferred resource dispatch (positive number). The GREEN highlighed cells Indicate ES charging (negative number).5. The load, resource dispatch & worst contingency were modeled in power flow to ensure enough resources were dispatced to adequately served the load without causing a voltage collapse. Cases that exhibited a voltage collapse were identified as "Failed".6. "Incremental ES Capacity Required" delineates the additional IFOM ES Block capacity required to serve the load without causing a voltage collapse.
Table A-8a: 2022 Summer Peak Moorpark Sub-Area Hourly Local Load-Resource AnalysisScenario 3, 2015 Load Shape, Iteration 1 - One 50 MW, 4 hr IFOM Battery Unit; One 55 MW, 4 hr IFOM Battery Unit; One 60 MW, 4 hr IFOM Battery Unit; Ellwood Plant Out-of-Service
Day 2
Day 2
Table A-8b: 2022 Summer Peak Moorpark Sub-Area Hourly Local Load-Resource Analysis Scenario 3, 2015 Load Shape, Iteration 2 - One 55 MW, 9 hr IFOM Battery Unit; One 55 MW, 10 hr IFOM Battery Unit; One 60 MW, 10 hr IFOM Battery Unit; Ellwood Plant Out-of-Service

Moorpark Sub-Area Local Capacity Alternative Study August 16, 2017
41
Day 1MW 11 12 13 14 15 16 17 18 19 20 21 22 23 0 1 2 3 4 5 6 7 8 9 10
2022 Scaled Max Hourly Load - DR Called 1460 1542 1618 1666 1699 1723 1722 1647 1581 1592 1509 1360 1160 1068 984 929 896 879 896 969 1060 1155 1248 1343LTPP 2012 Track 1 - Solar PV 5.7 (NQC) 4.8 5.4 5.4 5.2 4.3 3.0 1.4 0.1 0.0 0.0 0.0 0.0 0.0 0.0 0.0 0.0 0.0 0.0 0.0 0.0 0.3 1.6 3.1 4.3LTPP 2012 Track 1 - EE 6.0 5.1 5.4 6.0 6.0 6.0 6.0 6.0 6.0 6.0 6.0 6.0 4.7 4.0 3.7 3.4 3.2 3.1 3.1 3.1 3.4 3.7 4.0 4.3 4.7Load less LTPP PV & EE 1450.3 1531.5 1606.7 1654.8 1688.5 1713.5 1714.5 1641.0 1574.6 1586.0 1503.1 1355.5 1156.0 1064.0 980.4 926.0 892.9 875.6 892.9 965.2 1055.8 1149.7 1240.4 1333.8Load Serving Capability 1401 1401 1401 1401 1401 1401 1401 1401 1401 1401 1401 1401 1401 1401 1401 1401 1401 1401 1401 1401 1401 1401 1401 1401 1401Remaing Load to Serve (Note 1) 49.3 130.5 205.7 253.8 287.5 312.5 313.5 240.0 173.6 185.0 102.1 (45.5) (245.0) (337.0) (420.6) (475.0) (508.1) (525.4) (508.1) (435.8) (345.2) (251.3) (160.6) (67.2)
IFOM ES Block 1 - 9hr (at Mandalay) 55.0 0.0 0.0 55.0 55.0 55.0 55.0 55.0 55.0 55.0 55.0 55.0 0.0 (55.0) (55.0) (55.0) (55.0) (55.0) (55.0) (55.0) (55.0) (55.0) (55.0) (44.0) 0.0IFOM ES Block 2 - 5hr (at Mandalay) 55.0 0.0 55.0 55.0 55.0 55.0 55.0 0.0 0.0 0.0 0.0 0.0 0.0 0.0 0.0 0.0 (55.0) (55.0) (55.0) (55.0) (55.0) (55.0) 0.0 0.0 0.0IFOM ES Block 3 - 5hr (at Mandalay) 55.0 0.0 0.0 0.0 0.0 0.0 0.0 55.0 55.0 55.0 55.0 55.0 0.0 0.0 0.0 0.0 (55.0) (55.0) (55.0) (55.0) (55.0) (55.0) 0.0 0.0 0.0IFOM ES Block 4 - 10hr (at Ellwood) 60.0 60.0 60.0 60.0 60.0 60.0 60.0 60.0 60.0 60.0 60.0 0.0 0.0 (60.0) (60.0) (60.0) (60.0) (60.0) (60.0) (60.0) (60.0) (60.0) (60.0) (60.0) (60.0)LTPP 2012 Track 1 - IFOM Storage - 4hr 0.5 0.0 0.0 0.0 0.0 0.0 0.0 0.0 0.0 0.0 0.0 0.0 0.0 0.0 0.0 0.0 0.0 0.0 0.0 0.0 0.0 0.0 0.0 0.0 0.0PV/ES Hybrid - 7hr (3hr Max Charge) 25.0 0.0 25.0 25.0 25.0 25.0 25.0 25.0 25.0 0.0 0.0 0.0 0.0 0.0 (25.0) (25.0) (25.0) 0.0 0.0 0.0 0.0 0.0 0.0 0.0 0.0Existing Fast DR - 6hr 18.1 0.0 0.0 18.1 18.1 18.1 18.1 18.1 18.1 0.0 0.0 0.0 0.0 0.0 0.0 0.0 0.0 0.0 0.0 0.0 0.0 0.0 0.0 0.0 0.0DR (LR/ES) - 4hr 80.0 0.0 0.0 0.0 80.0 80.0 80.0 80.0 0.0 0.0 0.0 0.0 0.0 0.0 (80.0) (80.0) (80.0) (80.0) (80.0) 0.0 0.0 0.0 0.0 0.0 0.0Existing Slow DR + ES - 6hr (0.5hr Charge) 30.1 0.0 0.0 0.0 0.0 30.1 30.1 30.1 30.1 30.1 30.1 0.0 0.0 0.0 (30.1) 0.0 0.0 0.0 0.0 0.0 0.0 0.0 0.0 0.0 0.0
Total Preferred Resources & Storage (Note 2) 378.7 60.0 140.0 213.1 293.1 323.2 323.2 323.2 243.2 200.1 200.1 110.0 0.0 (115.0) (250.1) (220.0) (330.0) (305.0) (305.0) (225.0) (225.0) (225.0) (115.0) (104.0) (60.0)Local Capacity Deficiency (10.7) (9.5) (7.4) (39.3) (35.7) (10.7) (9.7) (3.2) (26.5) (15.1) (7.9) (45.5) (130.0) (86.9) (200.6) (145.0) (203.1) (220.4) (283.1) (210.8) (120.2) (136.3) (56.6) (7.2)Power Flow Dispatch Validation (Note 5) Failed FailedIncremental ES Capacity Required (Note 6) 10.0 15.0
Table A-8c: 2022 Summer Peak Moorpark Sub-Area Hourly Local Load-Resource AnalysisScenario 3, 2015 Load Shape, Iteration 3 - One 55 MW, 9 hr IFOM Battery Unit; Two 55 MW, 5 hr IFOM Battery Unit; One 60 MW, 10 hr IFOM Battery Unit; Ellwood Plant Out-of-Service
Day 2
Notes - 1. "Remaing Load to Serve" is negative when no additional resources are necessary to serve the load and postive when additional resources are needed.2. "Total Preferred Resources & Storage" represents the aggregate dispatch of preferred resources and ES. Negative numbers represent aggregate ES charging.3. "Local Capacity Deficiency" represents remaining "Remaing Load to Serve" less the "Total Preferred Resources & Storage." When values are positive (RED highlighted cells), there is a load serving deficit.4. The BLUE highlighted cells indicate an ES or preferred resource dispatch (positive number). The GREEN highlighed cells Indicate ES charging (negative number).5. The load, resource dispatch & worst contingency were modeled in power flow to ensure enough resources were dispatced to adequately served the load without causing a voltage collapse. Cases that exhibited a voltage collapse were identified as "Failed".6. "Incremental ES Capacity Required" delineates the additional IFOM ES Block capacity required to serve the load without causing a voltage collapse.

Moorpark Sub-Area Local Capacity Alternative Study August 16, 2017
42
Day 1MW 11 12 13 14 15 16 17 18 19 20 21 22 23 0 1 2 3 4 5 6 7 8 9 10
2022 Scaled Max Hourly Load 1320 1417 1526 1604 1665 1720 1723 1671 1589 1546 1432 1265 1095 991 916 860 831 819 838 927 1008 1077 1176 1268LTPP 2012 Track 1 - Solar PV 5.7 (NQC) 4.8 5.4 5.4 5.2 4.3 3.0 1.4 0.1 0.0 0.0 0.0 0.0 0.0 0.0 0.0 0.0 0.0 0.0 0.0 0.0 0.3 1.6 3.1 4.3LTPP 2012 Track 1 - EE 6.0 4.6 4.9 6.0 6.0 6.0 6.0 6.0 6.0 6.0 6.0 6.0 4.4 3.8 3.5 3.2 3.0 2.9 2.9 2.9 3.2 3.5 3.8 4.1 4.4Load less LTPP PV & EE 1311.0 1407.1 1515.0 1593.0 1654.9 1710.6 1715.1 1664.9 1583.3 1540.0 1426.3 1260.5 1091.7 987.3 912.5 856.9 827.7 816.4 834.7 923.9 1004.6 1071.5 1168.8 1258.8Load Serving Capability 1401 1401 1401 1401 1401 1401 1401 1401 1401 1401 1401 1401 1401 1401 1401 1401 1401 1401 1401 1401 1401 1401 1401 1401 1401Remaing Load to Serve (Note 1) (90.0) 6.1 114.0 192.0 253.9 309.6 314.1 263.9 182.3 139.0 25.3 (140.5) (309.3) (413.7) (488.5) (544.1) (573.3) (584.6) (566.3) (477.1) (396.4) (329.5) (232.2) (142.2)
IFOM ES Block 1 - 4hr (at Mandalay) 50.0 0.0 0.0 0.0 50.0 50.0 50.0 50.0 0.0 0.0 0.0 0.0 0.0 0.0 (50.0) (50.0) (50.0) (50.0) (50.0) 0.0 0.0 0.0 0.0 0.0 0.0IFOM ES Block 2 - 4hr (at Mandalay) 55.0 0.0 0.0 0.0 55.0 55.0 55.0 55.0 0.0 0.0 0.0 0.0 0.0 0.0 (55.0) (55.0) (55.0) (55.0) (55.0) 0.0 0.0 0.0 0.0 0.0 0.0IFOM ES Block 3 - 4hr (at Ellwood) 60.0 0.0 0.0 0.0 60.0 60.0 60.0 60.0 0.0 0.0 0.0 0.0 0.0 0.0 (60.0) (60.0) (60.0) (60.0) (60.0) 0.0 0.0 0.0 0.0 0.0 0.0LTPP 2012 Track 1 - IFOM Storage - 4hr 0.5 0.0 0.0 0.0 0.5 0.5 0.5 0.5 0.0 0.0 0.0 0.0 0.0 0.0 0.0 0.0 0.0 0.0 0.0 0.0 0.0 0.0 0.0 0.0 0.0PV/ES Hybrid - 7hr (3hr Max Charge) 25.0 0.0 0.0 0.0 25.0 25.0 25.0 25.0 25.0 25.0 25.0 0.0 0.0 0.0 (25.0) (25.0) (25.0) 0.0 0.0 0.0 0.0 0.0 0.0 0.0 0.0Existing Fast DR - 6hr 18.1 0.0 0.0 0.0 0.0 18.1 18.1 18.1 18.1 18.1 18.1 0.0 0.0 0.0 0.0 0.0 0.0 0.0 0.0 0.0 0.0 0.0 0.0 0.0 0.0DR (LR/ES) - 4hr 80.0 0.0 0.0 0.0 0.0 0.0 80.0 80.0 80.0 80.0 0.0 0.0 0.0 0.0 (80.0) (80.0) (80.0) (80.0) (80.0) 0.0 0.0 0.0 0.0 0.0 0.0Existing Slow DR + ES - 6hr (0.5hr Charge) 30.1 0.0 0.0 0.0 0.0 30.1 30.1 30.1 30.1 30.1 30.1 0.0 0.0 0.0 (30.1) 0.0 0.0 0.0 0.0 0.0 0.0 0.0 0.0 0.0 0.0
Total Preferred Resources & Storage (Note 2) 318.7 0.0 0.0 0.0 190.5 238.7 318.7 318.7 153.2 153.2 73.2 0.0 0.0 0.0 (300.1) (270.0) (270.0) (245.0) (245.0) 0.0 0.0 0.0 0.0 0.0 0.0Local Capacity Deficiency (90.0) 6.1 114.0 1.5 15.2 (9.1) (4.6) 110.7 29.1 65.8 25.3 (140.5) (309.3) (113.6) (218.5) (274.1) (328.3) (339.6) (566.3) (477.1) (396.4) (329.5) (232.2) (142.2)
Day 1MW 11 12 13 14 15 16 17 18 19 20 21 22 23 0 1 2 3 4 5 6 7 8 9 10
2022 Scaled Max Hourly Load - DR Called 1320 1417 1526 1604 1665 1720 1723 1671 1589 1546 1432 1265 1095 991 916 860 831 819 838 927 1008 1077 1176 1268LTPP 2012 Track 1 - Solar PV 5.7 (NQC) 4.8 5.4 5.4 5.2 4.3 3.0 1.4 0.1 0.0 0.0 0.0 0.0 0.0 0.0 0.0 0.0 0.0 0.0 0.0 0.0 0.3 1.6 3.1 4.3LTPP 2012 Track 1 - EE 6.0 4.6 4.9 6.0 6.0 6.0 6.0 6.0 6.0 6.0 6.0 6.0 4.4 3.8 3.5 3.2 3.0 2.9 2.9 2.9 3.2 3.5 3.8 4.1 4.4Load less LTPP PV & EE 1311.0 1407.1 1515.0 1593.0 1654.9 1710.6 1715.1 1664.9 1583.3 1540.0 1426.3 1260.5 1091.7 987.3 912.5 856.9 827.7 816.4 834.7 923.9 1004.6 1071.5 1168.8 1258.8Load Serving Capability 1401 1401 1401 1401 1401 1401 1401 1401 1401 1401 1401 1401 1401 1401 1401 1401 1401 1401 1401 1401 1401 1401 1401 1401 1401Remaing Load to Serve (Note 1) (90.0) 6.1 114.0 192.0 253.9 309.6 314.1 263.9 182.3 139.0 25.3 (140.5) (309.3) (413.7) (488.5) (544.1) (573.3) (584.6) (566.3) (477.1) (396.4) (329.5) (232.2) (142.2)
IFOM ES Block 1 - 8hr (at Mandalay) 55.0 0.0 0.0 55.0 55.0 55.0 55.0 55.0 55.0 55.0 55.0 0.0 0.0 0.0 (55.0) (55.0) (55.0) (55.0) (55.0) (55.0) (55.0) (55.0) (55.0) (55.0) 0.0IFOM ES Block 2 - 8hr (at Mandalay) 55.0 0.0 0.0 55.0 55.0 55.0 55.0 55.0 55.0 55.0 55.0 0.0 0.0 0.0 (55.0) (55.0) (55.0) (55.0) (55.0) (55.0) (55.0) (55.0) (55.0) (55.0) 0.0IFOM ES Block 3 - 7hr (at Ellwood) 60.0 0.0 0.0 0.0 60.0 60.0 60.0 60.0 60.0 60.0 60.0 0.0 0.0 0.0 (60.0) (60.0) (60.0) (60.0) (60.0) (60.0) (60.0) (60.0) (60.0) 0.0 0.0LTPP 2012 Track 1 - IFOM Storage - 4hr 0.5 0.0 0.0 0.0 0.0 0.0 0.0 0.0 0.0 0.0 0.0 0.0 0.0 0.0 0.0 0.0 0.0 0.0 0.0 0.0 0.0 0.0 0.0 0.0 0.0PV/ES Hybrid - 7hr (3hr Max Charge) 25.0 0.0 25.0 25.0 25.0 25.0 25.0 25.0 25.0 0.0 0.0 0.0 0.0 0.0 (25.0) (25.0) (25.0) 0.0 0.0 0.0 0.0 0.0 0.0 0.0 0.0Existing Fast DR - 6hr 18.1 0.0 0.0 18.1 18.1 18.1 18.1 18.1 18.1 0.0 0.0 0.0 0.0 0.0 0.0 0.0 0.0 0.0 0.0 0.0 0.0 0.0 0.0 0.0 0.0DR (LR/ES) - 4hr 80.0 0.0 0.0 0.0 0.0 80.0 80.0 80.0 80.1 0.0 0.0 0.0 0.0 0.0 (80.0) (80.0) (80.0) (80.0) (80.0) 0.0 0.0 0.0 0.0 0.0 0.0Existing Slow DR + ES - 6hr (0.5hr Charge) 30.1 0.0 0.0 0.0 0.0 0.0 30.1 30.1 30.1 30.1 30.1 30.1 0.0 0.0 (30.1) 0.0 0.0 0.0 0.0 0.0 0.0 0.0 0.0 0.0 0.0
Total Preferred Resources & Storage (Note 2) 323.7 0.0 25.0 153.1 213.1 293.1 323.2 323.2 323.3 200.1 200.1 30.1 0.0 0.0 (305.1) (275.0) (275.0) (250.0) (250.0) (170.0) (170.0) (170.0) (170.0) (110.0) 0.0Local Capacity Deficiency (90.0) (18.9) (39.1) (21.1) (39.2) (13.6) (9.1) (59.4) (17.8) (61.1) (4.8) (140.5) (309.3) (108.6) (213.5) (269.1) (323.3) (334.6) (396.3) (307.1) (226.4) (159.5) (122.2) (142.2)Power Flow Dispatch Validation (Note 5)Incremental ES Capacity Required (Note 6)Notes - 1. "Remaing Load to Serve" is negative when no additional resources are necessary to serve the load and postive when additional resources are needed.2. "Total Preferred Resources & Storage" represents the aggregate dispatch of preferred resources and ES. Negative numbers represent aggregate ES charging.3. "Local Capacity Deficiency" represents remaining "Remaing Load to Serve" less the "Total Preferred Resources & Storage." When values are positive (RED highlighted cells), there is a load serving deficit.4. The BLUE highlighted cells indicate an ES or preferred resource dispatch (positive number). The GREEN highlighed cells Indicate ES charging (negative number).5. The load, resource dispatch & worst contingency were modeled in power flow to ensure enough resources were dispatced to adequately served the load without causing a voltage collapse. Cases that exhibited a voltage collapse were identified as "Failed".6. "Incremental ES Capacity Required" delineates the additional IFOM ES Block capacity required to serve the load without causing a voltage collapse.
Table A-9a: 2022 Summer Peak Moorpark Sub-Area Hourly Local Load-Resource AnalysisScenario 3, 2016 Load Shape, Iteration 1 - One 50 MW, 4 hr IFOM Battery Unit; One 55 MW, 4 hr IFOM Battery Unit; One 60 MW, 4 hr IFOM Battery Unit; Ellwood Plant Out-of-Service
Day 2
Day 2
Table A-9b: 2022 Summer Peak Moorpark Sub-Area Hourly Local Load-Resource Analysis Scenario 3, 2016 Load Shape, Iteration 2 - Two 55 MW, 8 hr IFOM Battery Unit; One 60 MW, 6 hr IFOM Battery Unit; Ellwood Plant Out-of-Service