city of moorpark, california comprehensive annual
TRANSCRIPT
Prepared By:
Finance Department
CITY OF MOORPARK,
CALIFORNIA
COMPREHENSIVE ANNUAL FINANCIAL REPORT
For the Year Ended June 30, 2006

INTRODUCTORY SECTION
CITY OF MOORPARK
COMPREHENSIVE ANNUAL FINANCIAL REPORT
FOR THE YEAR ENDED JUNE 30, 2006
TABLE OF CONTENTS
i
INTRODUCTORY SECTION:
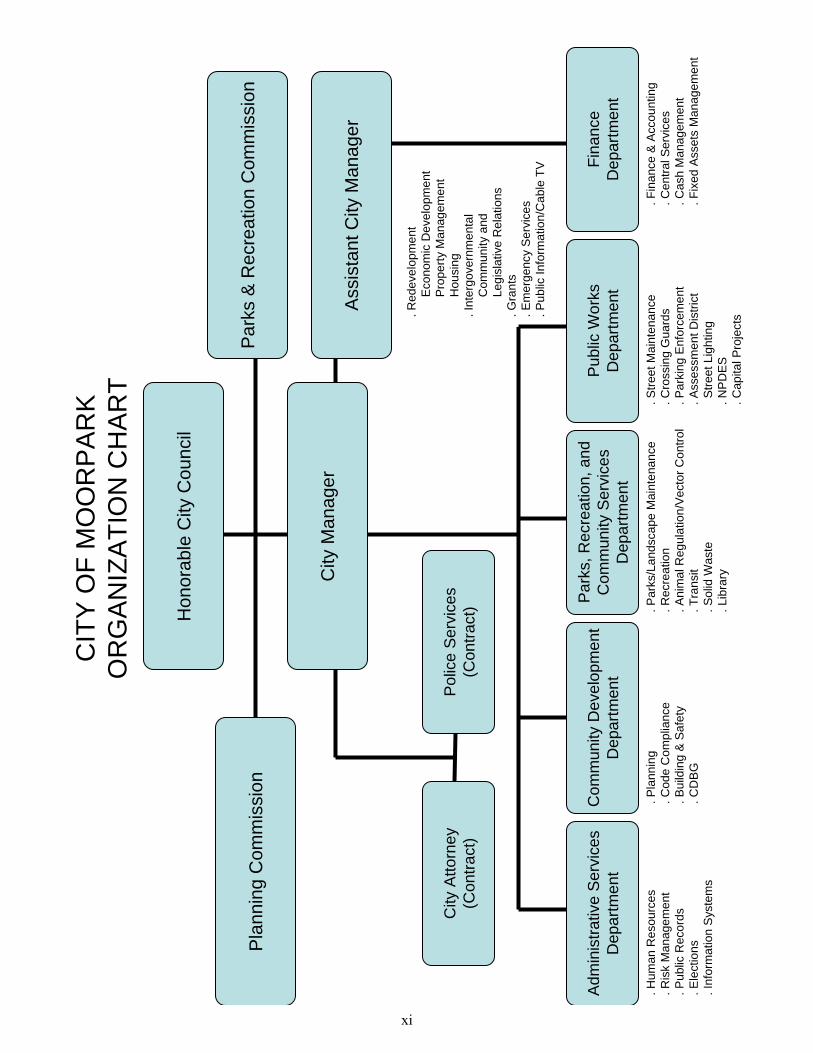
Table of Contents i-iii Transmittal Letter iv Directory of City Officials x Organization Chart xi CSMFO Certificate of Award for Outstanding Financial Reporting xii
FINANCIAL SECTION:
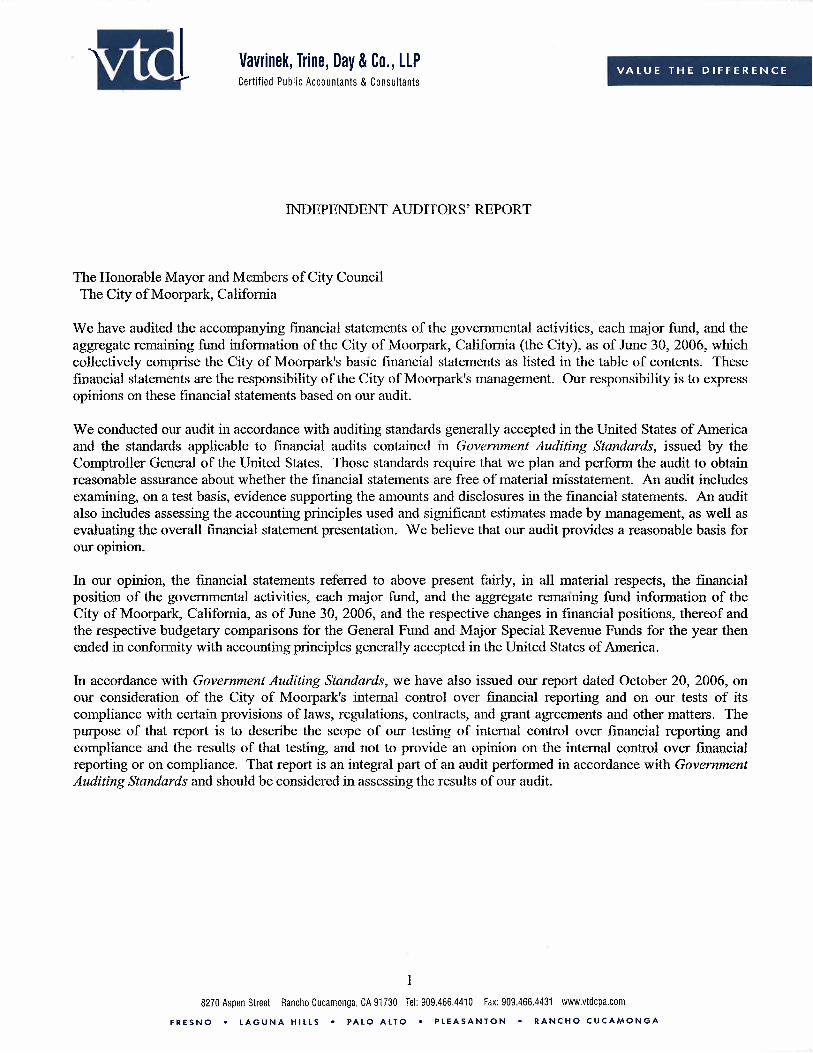
Independent Auditors’ Report 1
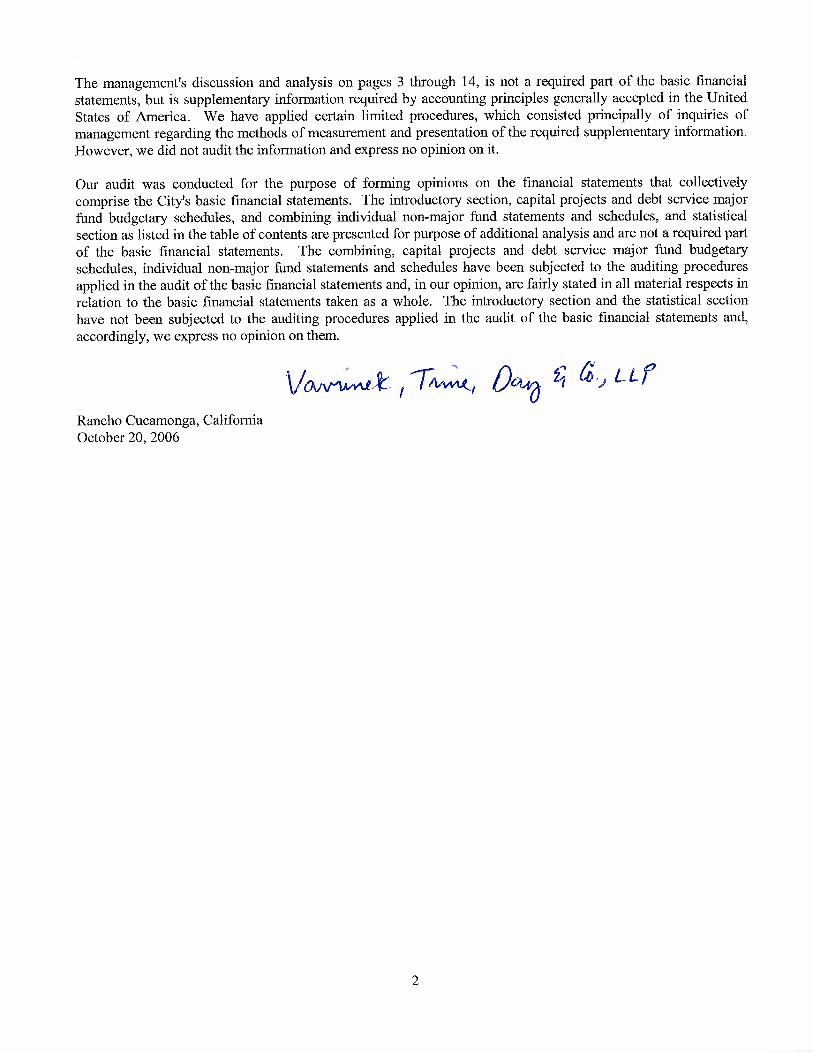
Management’s Discussion and Analysis 3 BASIC FINANCIAL STATEMENTS:
Government-Wide Financial Statements Statement of Net Assets 15 Statement of Activities 16
Fund Financial Statements Governmental Funds
Balance Sheet 17 Reconciliation of the Balance Sheet of Governmental Funds to the Statement of Net Assets 19 Statement of Revenues, Expenditures, and Changes in Fund Balances 20 Reconciliation of the Statement of Revenues, Expenditures, and Changes in Fund Balances of Governmental Funds to the Statement of Activities 22
General Fund Statement of Revenues, Expenditures, and Changes in Fund Balance - Budget and Actual 23 Street and Traffic Safety Development Special Revenue Fund Statement of Revenues, Expenditures, and Changes in Fund Balance - Budget and Actual 24
Community Development Special Revenue Fund Statement of Revenues, Expenditures, and Changes in Fund Balance - Budget and Actual 25
Area of Contribution Special Revenue Fund Statement of Revenues, Expenditures, and Changes in Fund Balance - Budget and Actual 26
Endowment Special Revenue Fund Statement of Revenues, Expenditures, and Changes in Fund Balance - Budget and Actual 27
Park Improvement Special Revenue Fund Statement of Revenues, Expenditures, and Changes in Fund Balance - Budget and Actual 28
CITY OF MOORPARK
COMPREHENSIVE ANNUAL FINANCIAL REPORT
FOR THE YEAR ENDED JUNE 30, 2006
TABLE OF CONTENTS (Continued)
ii
Agency Fund
Statement of Fiduciary Net Assets 29
NOTES TO THE FINANCIAL STATEMENTS 30 REQUIRED SUPPLEMENTARY INFORMATION:
Schedule of Funding Progress 59 SUPPLEMENTARY SCHEDULES: 60
Major Fund Budgetary Comparison Schedules
Schedule of Revenues, Expenditures, and Changes in Fund Balances - Budget and Actual
Police Facilities Fee Fund Capital Projects Fund 61 Redevelopment Agency Capital Projects Fund 62 Redevelopment Agency Debt Service Fund 63
Non-Major Governmental Funds
Combining Balance Sheet 66 Combining Statement of Revenues, Expenditures, and Changes in Fund Balances 68 Schedule of Revenues, Expenditures, and Changes in Fund Balances - Budget and Actual – Special Revenue Funds
Traffic Safety 70 Affordable Housing 71 Assessment District 72 State and Federal Assistance 73 State Gas Tax 74 Low and Moderate Income Housing 75 Local Transportation Transit 76 Solid Waste 77
Schedule of Revenues, Expenditures, and Changes in Fund Balances - Budget and Actual – Capital Projects Funds
City Hall Building 78 Equipment Replacement 79
Agency Fund
Statement of Changes in Net Assets 80
CITY OF MOORPARK
COMPREHENSIVE ANNUAL FINANCIAL REPORT
FOR THE YEAR ENDED JUNE 30, 2006
TABLE OF CONTENTS (Continued)
iii
STATISTICAL SECTION (Unaudited):
Net Assets By Component – Last Four Fiscal Years 81 Changes in Net Assets Governmental Activities – Last Four Fiscal Years 82 Fund Balances of Governmental Funds – Last Four Fiscal Years 83 Changes in Fund Balances of Governmental Funds – Last Four Fiscal Years 84 Assessed Value and Estimated Actual Value of Taxable Property – Last Nine Fiscal Years 85 Direct and Overlapping Property Tax Rates – Last Eight Fiscal Years 86 Principal Property Tax Payers – Current Year and Six Years Ago 87 Property Tax Levies and Collections – Last Ten Fiscal Years 88 Ratios of Outstanding Debt by Type – Last Eight Fiscal Years 89 Ratio of General Bonded Debt Outstanding – Last Eight Fiscal Years 90 Direct and Overlapping Debt 91 Legal Debt Margin Information – Last Eight Fiscal Years 92 Pledged Revenue Coverage – Last Six Fiscal Years 94 Demographic and Economic Statistics – Last Ten Calendar Years 95 Principal Employers – Current Year and Eight Years Ago 96 Full-Time and Part-Time City Employees by Function – Last Seven Fiscal Years 97 Operating Indicators by Function – Last Ten Fiscal Years 98 Capital Asset Statistics by Function – Last Eight Fiscal Years 99

FINANCIAL SECTION
v
statement is effective for fiscal year 2005-06 and has resulted in changes to the statistical section. As such, the City has presented the statistical section with detail information to be in compliance with GASB No. 44 requirements Responsibility for both the accuracy of this data, and the completeness and fairness of its presentation, including all disclosures, rests with the City. To the best of our knowledge and belief, the enclosed data are accurate in all material respects and are reported in a manner that presents fairly the account groups and the financial position and operational results of the City’s various funds and component units. All disclosures necessary to enable the reader to gain an understanding of the City’s activities have been included.
THE REPORTING ENTITY AND ITS SERVICES The financial reporting entity includes all the funds of the City of Moorpark as well as all of its component units. The City of Moorpark is the primary government. The component units are the Moorpark Redevelopment Agency (the RDA), the Moorpark Public Financing Authority and the Moorpark Industrial Development Authority. The City was incorporated in 1983 as a general law city and operates under a Council-Manager form of government. The RDA was formed in 1987 with the objective of providing long-term financing of capital improvements designed to eliminate physical and economic blight in the designated project area. The Moorpark Public Financing Authority was formed in 1993 as a joint powers authority between the City and the RDA in order to provide financial assistance to the City and the RDA by issuing debt and financing the construction of public facilities. The Industrial Development Authority of the City of Moorpark was formed in 1985 pursuant to the California Industrial Development Financing Act (the “Act”). Its purpose is to finance the acquisition and development of certain industrial activities as permitted by the Act and to issue bonds for the purpose of enabling industrial firms to finance the cost of such activities.
PROFILE OF THE CITY OF MOORPARK The City provides a full range of services to its residents with a total regular full-time staff of about 55 and part-time staff of approximately 45 employees. Major services such as police (contracted with Ventura County Sheriff), attorney, development engineering and inspection, building and safety plan check/inspection, transit, street sweeping and landscape maintenance are provided through contractual arrangements. In addition, fire protection is provided by the Ventura County Fire District. The City provides services such as emergency management,
vi
redevelopment, housing, planning, code compliance, recreation programs, vector/animal control, park and facilities maintenance, street maintenance, city engineering, crossing guard and administrative management services with city employees.
HISTORY OF THE CITY OF MOORPARK In 1887, Robert W. Poindexter was granted title to the present site of Moorpark. He named the City after the Moorpark apricot which grew throughout the valley. Poindexter plotted Moorpark city streets and planted Pepper trees in the downtown area. The City of Moorpark was incorporated in 1983 as the tenth city of Ventura County with a Council-Manager form of government. The Mayor is elected at large to serve a two-year term. The four Council Members are elected at large to serve staggered four-year terms. The size of the City was 12.36 square miles with a population of about 10,000 at incorporation and is currently at 12.44 square miles with a population of about 35,801 (source: California Department of Finance). Moorpark is recognized for having the lowest number of serious crimes committed in Ventura County and is one of the safest cities of its size in the United States.
BUDGETARY CONTROL
The City of Moorpark prepares an annual budget consistent with Generally Accepted Accounting Principles (GAAP) for all governmental funds on a modified accrual basis where revenues are recognized when they become measurable and available to finance expenditures of the current period. Expenditures are recorded when the goods or services are received and the liabilities are incurred. Department Directors are responsible, not only to accomplish his/her particular goals within each program, but also to monitor budget allocations consistent to the funding levels adopted by the City Council prior to July 1 of the budget year. In addition, the City maintains budgetary control through the use of an encumbrance accounting system. As purchase orders are issued, corresponding amounts are encumbered for later payments to ensure that budget amounts are not over spent.
INTERNAL CONTROLS The City’s management is responsible for developing and establishing internal control structure to ensure that the assets of the government are protected from loss, theft, misuse and to ensure that adequate accounting data is compiled to allow for the preparation of financial statements in conformity with Generally Accepted Accounting Principles. The internal control structure is designed to provide reasonable assurance, but not absolute, assurance that these objectives are met. The concept of reasonable assurance recognizes that: 1) the cost of a control should not exceed the benefits likely to be derived; and 2) the valuation of the costs and benefits requires estimates and judgments by management.
vii
ANNUAL AUDIT
An independent accounting firm has performed the annual audit of the City’s financial statements for the fiscal year ended June 30, 2006. As part of the annual audit, reviews are made to determine the adequacy of the City’s internal control structure, as well as to determine that the City has complied with certain provisions of laws and regulations. Their examination has been completed and the auditor’s report on the City’s financial statements is included at the beginning of the Financial Section of this report.
AWARD
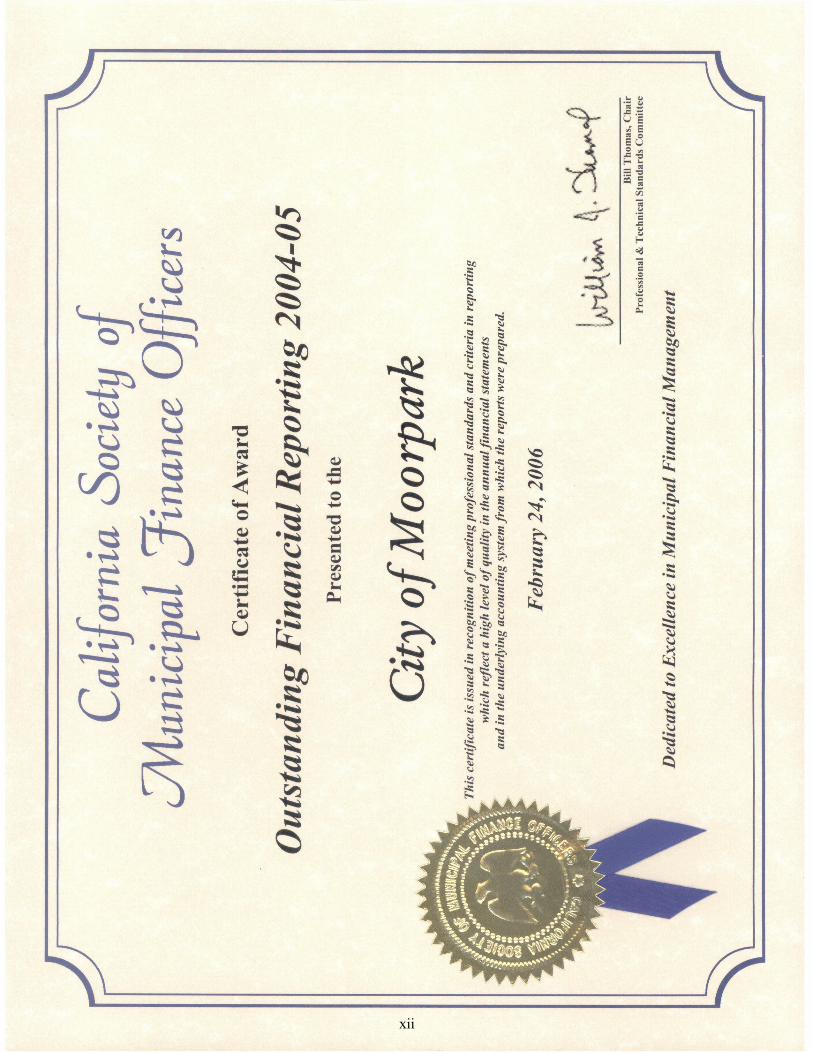
The California Society of Municipal Finance Officers (CSMFO) presented the City of Moorpark with a Certificate of Award for Outstanding Financial Reporting for the Comprehensive Annual Financial Report (CAFR) for the fiscal year ended June 30, 2005. The Certificate of Award is a prestigious state recognition for conformance with high standards for preparation of local government financial reports. The reports must meet requirements outlined in the CSMFO Awards Checklist, satisfying generally accepted accounting principles and applicable legal requirements. The Certificate of Award is valid for a period of one year only. The City will continue to participate in the program by submitting the current CAFR to CSMFO to determine its eligibility for another award.
APPROPRIATION LIMIT
Article XIIIB of Proposition 4, commonly referred to as the “Gann Initiative” was approved by California voters in 1979, which placed limits on the amount of proceeds of taxes that State and Local agencies can appropriate and spend each fiscal year. In addition, voters approved Proposition 111 in 1990 to further increase the accountability of local government in adopting their limits by requiring the governing body to annually adopt, by resolution, an appropriation limit for the upcoming fiscal year. The appropriation limit and the City’s appropriations subject to the limit for the fiscal year 2005-06 amounted to $18,904,696 and $8,061,610, respectively.
CASH MANAGEMENT
The City Treasurer is responsible for investing cash temporarily idle during the year in accordance with the State Government Code and the Investment Policy adopted by the City Council. The City diversified its investment portfolio by utilizing several investment instruments. At fiscal year end June 30, 2006, nearly $54 million (City & RDA combined) was invested with the State Treasurer’s Local Agency Investment Fund (LAIF); approximately $6.6 million in the Ventura County Pool; approximately
viii
$20.8 million in U.S. Treasury and Agency Securities; and $1.6 million was invested in Certificate of Deposits (CDs). The cash management system of the City of Moorpark is designed to monitor revenues and expenditures to ensure the investment of monies to the fullest extent possible. The criteria for selecting investments and the order of priority are (a) safety, (b) liquidity, and (c) yield. The underlying objective of the City’s policy is to obtain the highest interest rate yields and at the same time, ensures that money is available when needed and all deposits are insured by the Federal Deposit Insurance Corporation or collateralized.
CAPITAL ASSETS
In accordance with GASB Statement No. 34, the City has reported all capital assets including infrastructures in the Government-Wide Statement of Net Assets. The City elected to use the basic approach for all infrastructures reporting, whereby depreciation expense and accumulated depreciation has been recorded. Capital assets for the fiscal year ended June 30, 2006 has a net ending balance of $125.2 million.
LONG-TERM LIABILITIES/BONDED LIABILITIES
The City of Moorpark has no outstanding bond or other debt but does have long-term liabilities in an amount of $530,217 at June 30, 2006 for employee compensated absences (accrued leave). The Moorpark Redevelopment Agency (MRA) has the 1999 Tax Allocation Bonds and the 2001 Tax Allocation Bonds outstanding in an amount of $7.3 million and $11.6 million, respectively. The purpose of the 1999 Bonds was to advance refund the Agency’s previously issued 1993 Tax Allocation Bonds. The purpose of these bonds were to finance a portion of the costs of implementing the Redevelopment Plan and fund redevelopment activities within the MRA project area.
RISK MANAGEMENT
The City is a member of the California Joint Powers Insurance Authority (CJPIA) established under the provisions of California Government Code 6500 et seq., consisting of over 100 California public entities. The CJPIA provides risk coverage for its members through the pooling of losses and purchased insurance. The coverage extends to general liability and workers’ compensation administered by the Authority. In addition, the City of Moorpark also participates in the all-risk property protection offered by the Authority. Various control techniques, including safety, ergonomic, harassment and driver awareness training have been implemented to minimize losses.
x
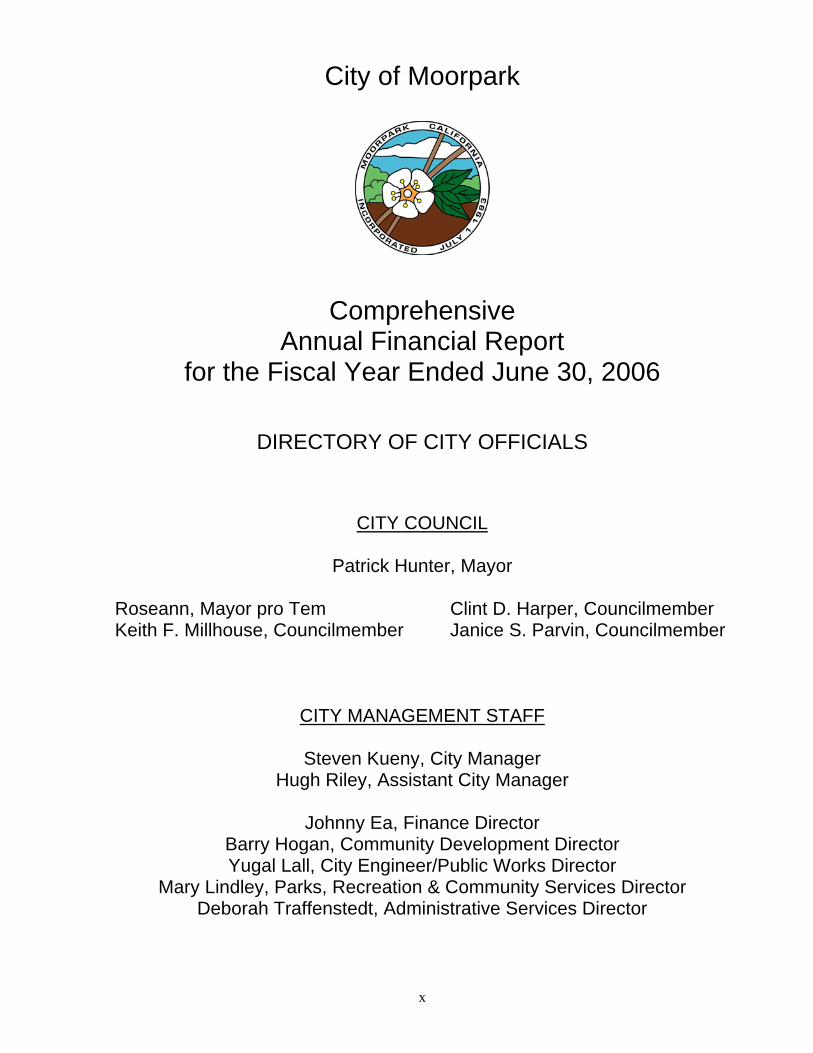
City of Moorpark
Comprehensive Annual Financial Report
for the Fiscal Year Ended June 30, 2006
DIRECTORY OF CITY OFFICIALS
CITY COUNCIL
Patrick Hunter, Mayor
Roseann, Mayor pro Tem Clint D. Harper, Councilmember Keith F. Millhouse, Councilmember Janice S. Parvin, Councilmember
CITY MANAGEMENT STAFF
Steven Kueny, City Manager Hugh Riley, Assistant City Manager
Johnny Ea, Finance Director
Barry Hogan, Community Development Director Yugal Lall, City Engineer/Public Works Director
Mary Lindley, Parks, Recreation & Community Services Director Deborah Traffenstedt, Administrative Services Director
. Fin
ance
& A
ccou
ntin
g. C
entra
l Ser
vice
s. C
ash
Man
agem
ent
. Fix
ed A
sset
s M
anag
emen
t
. Hum
an R
esou
rces
. Ris
k M
anag
emen
t. P
ublic
Rec
ords
. Ele
ctio
ns. I
nfor
mat
ion
Sys
tem
s
. Pla
nnin
g. C
ode
Com
plia
nce
. Bui
ldin
g &
Saf
ety
. CD
BG
. Par
ks/L
ands
cape
Mai
nten
ance
. Rec
reat
ion
. Ani
mal
Reg
ulat
ion/
Vec
tor C
ontro
l. T
rans
it. S
olid
Was
te. L
ibra
ry
. Stre
et M
aint
enan
ce. C
ross
ing
Gua
rds
. Par
king
Enf
orce
men
t. A
sses
smen
t Dis
trict
S
treet
Lig
htin
g . N
PD
ES
. Cap
ital P
roje
cts
Adm
inis
trativ
e S
ervi
ces
Dep
artm
ent
Par
ks, R
ecre
atio
n, a
ndC
omm
unity
Ser
vice
sD
epar
tmen
t
Com
mun
ity D
evel
opm
ent
Dep
artm
ent
Pub
lic W
orks
Dep
artm
ent
Fina
nce
Dep
artm
ent
Pla
nnin
g C
omm
issi
onP
arks
& R
ecre
atio
n C
omm
issi
on
City
Man
ager
Ass
ista
nt C
ity M
anag
er
. Red
evel
opm
ent
Eco
nom
ic D
evel
opm
ent
Prop
erty
Man
agem
ent
Hou
sing
. Int
ergo
vern
men
tal
Com
mun
ity a
nd
Legi
slat
ive
Rel
atio
ns. G
rant
s. E
mer
genc
y S
ervi
ces
. Pub
lic In
form
atio
n/C
able
TV
Polic
e Se
rvic
es(C
ontra
ct)
City
Atto
rney
(Con
tract
)
Hon
orab
le C
ity C
ounc
il
CIT
Y O
F M
OO
RP
AR
KO
RG
AN
IZA
TIO
N C
HA
RT
xi
xii

This page left blank intentionally.
CITY OF MOORPARK MANAGEMENT’S DISCUSSION AND ANALYSIS JUNE 30, 2006 s
3
As management of the City of Moorpark, California (the “City”), we offer readers of the City’s financial statements this narrative overview and analysis of the financial activities of the City (the “Primary Government”) for the fiscal year ended June 30, 2006. It is encouraged that the readers consider the information presented here in conjunction with the accompanying basic financial statements. FINANCIAL HIGHLIGHTS
• The assets of the City exceeded its liabilities at the close of the 2005-06 fiscal year by $193,142,118 (net assets). Of this amount, $26,965,428 is not restricted by external law or administrative action for a specified purpose. The City Council’s approval is required before these funds may be used to meet the City’s ongoing obligations to citizens and creditors.
• The City’s total net assets increased by $20,562,078 during the current fiscal year. The Statement of Net
Assets is presented on page 15. • As of June 30, 2006, the City’s governmental funds (General Fund, Special Revenue Funds, Debt Service
Funds, and Capital Projects Funds) reported combined ending fund balances of $82,969,551 an increase of $12,516,426 from the prior year.
• At the end of the current fiscal year, unreserved fund balance for the General Fund was $18,301,058.
• The City’s total Long – Term Liabilities decreased by $388,745 or 2% during the current fiscal year. The
decrease is attributable to the difference between employee compensated absences addition and the fiscal year’s regularly scheduled debt service payments for the 1999 and 2001 Tax Allocation Bonds.
OVERVIEW OF THE BASIC FINANCIAL STATEMENTS This discussion and analysis is intended to serve as an introduction to the City’s basic financial statements. The City’s basic financial statements comprise three components: 1) Government-wide financial statements 2) Fund financial statements 3) Notes to basic financial statements Other required supplementary information is included in addition to the basic financial statements. Government-Wide Financial Statements. The City has presented its financial statements under the reporting model required by Governmental Accounting Standards Board Statement No. 34 (GASB 34) and its related Statements, GASB 37, 38, and 41. These financial statements are designed to provide readers with a broad overview of the City’s finances, in a manner similar to a private-sector business.
CITY OF MOORPARK MANAGEMENT’S DISCUSSION AND ANALYSIS JUNE 30, 2006 s
4
The government-wide financial statements include the statement of net assets and the statement of activities. The governmental activities of the City include general government, public safety, public services, parks and recreation, debt service, and interest on debt. The City does not have any business-type activities. The statement of net assets presents information on all of the City’s assets and liabilities, with the difference between the two reported as net assets. Over time, increases and decreases in net assets may serve as a useful indicator of whether the financial position of the City is improving or deteriorating. The statement of activities presents information showing how the City’s net assets changed during the most recent fiscal year. All changes in net assets are reported as soon as the underlying event giving rise to the change occurs, regardless of the timing of related cash flows. Thus, revenues and expenses are reported in this statement for some items that will only result in cash flows in future fiscal periods (i.e., uncollected taxes and earned but unused vacation leave). The government-wide financial statements include not only the City of Moorpark as the primary government, but also a legally separate Moorpark Redevelopment Agency, the Moorpark Public Financing Authority, and the Industrial Development Authority of the City of Moorpark. Although legally separate from the City, these component units are blended with the primary government because of their governance or financial relationships to the City. The government-wide financial statements can be found on pages 15 and 16 of this report. Fund Financial Statements. A fund is a grouping of related accounts that is used to maintain control over resources that have been segregated for specific activities or objectives. The City, like other state and local governments, uses fund accounting to ensure and demonstrate compliance with finance-related legal requirements. All of the funds of the City can be divided into two categories: governmental funds and fiduciary funds. Governmental Funds. Governmental Funds are used to account for essentially the same functions reported as governmental activities in the government-wide financial statements. However, unlike the government-wide financial statements, governmental fund financial statements focus on near-term inflows and outflows of spendable resources, as well as on balances of spendable resources available at the end of the fiscal year. Such information may be useful in evaluating the City’s near-term financial requirements. Because the focus of governmental funds is narrower than that of the government-wide financial statements, it is useful to compare the information presented for governmental funds with similar information presented for governmental activities in the government-wide financial statements. By doing so, readers may better understand the long-term impact of the City’s near-term financing decisions. Both the governmental fund balance sheet and the governmental fund statement of revenues, expenditures and changes in fund balances, provide a reconciliation to facilitate this comparison between governmental funds and governmental activities.
CITY OF MOORPARK MANAGEMENT’S DISCUSSION AND ANALYSIS JUNE 30, 2006 s
5
The City maintains 19 individual governmental funds. Information is presented separately in the governmental fund balance sheet and in the governmental fund statement of revenues, expenditures, and changes in fund balances for the General Fund, Street and Traffic Safety, Park Improvement, Community Development, Areas of Contribution, Endowment, Police Facilities Fee, Moorpark Redevelopment Agency (MRA) – Capital Projects, and Moorpark Redevelopment Agency (MRA) – Debt Service. All of which are considered to be major funds. Data from the remaining 10 governmental funds are combined into a single, aggregated presentation. Individual fund data for each of these non-major governmental funds is provided in the form of combining statements in the non-major governmental funds section of this report. The City adopts an annual budget for all its funds. A budgetary comparison statement is provided for all funds with an annually adopted budget to demonstrate compliance with their respective budgets. The budgetary comparison statements are located in the basic financial statements. The non-major governmental fund budgetary comparisons are located in the non-major governmental funds section of the report. Fiduciary Funds. Fiduciary funds, which consist solely of trust and agency funds, are used to account for resources held for the benefit of parties outside the government. Fiduciary funds are not reflected in the government-wide financial statements because the resources of the fund are not available to support the City’s own programs. As the City’s only fiduciary fund, the Agency Fund is custodial in nature and, therefore, the accounting used does not involve the measurement of the results of operations. The basic fiduciary fund financial statement can be found on page 29 of this report. Notes to the Basic Financial Statements. The notes to the basic financial statements provide additional information that is essential to a full understanding of the data provided in the government-wide and fund financial statements. The notes to the basic financial statements can be found on pages 30-58 of this report. GOVERNMENT-WIDE FINANCIAL ANALYSIS The City has continued to present its financial statements under the new reporting model required by GASB 34. A comparative analysis of the government-wide data has been included in this report. As noted earlier, net assets may serve over time as a useful indicator of a government’s financial position. In the case of the City, assets exceeded liabilities by $193,142,118 at the close of the current fiscal year. The City’s, net assets invested in capital assets, net of related debt reflects a positive $108,190,324. As shown on Table 1, the largest portion of the City’s net assets (56%) is its investment in capital assets. The City uses these capital assets to provide services to citizens; consequently, these assets are not available for future spending.
CITY OF MOORPARK MANAGEMENT’S DISCUSSION AND ANALYSIS JUNE 30, 2006 s
6
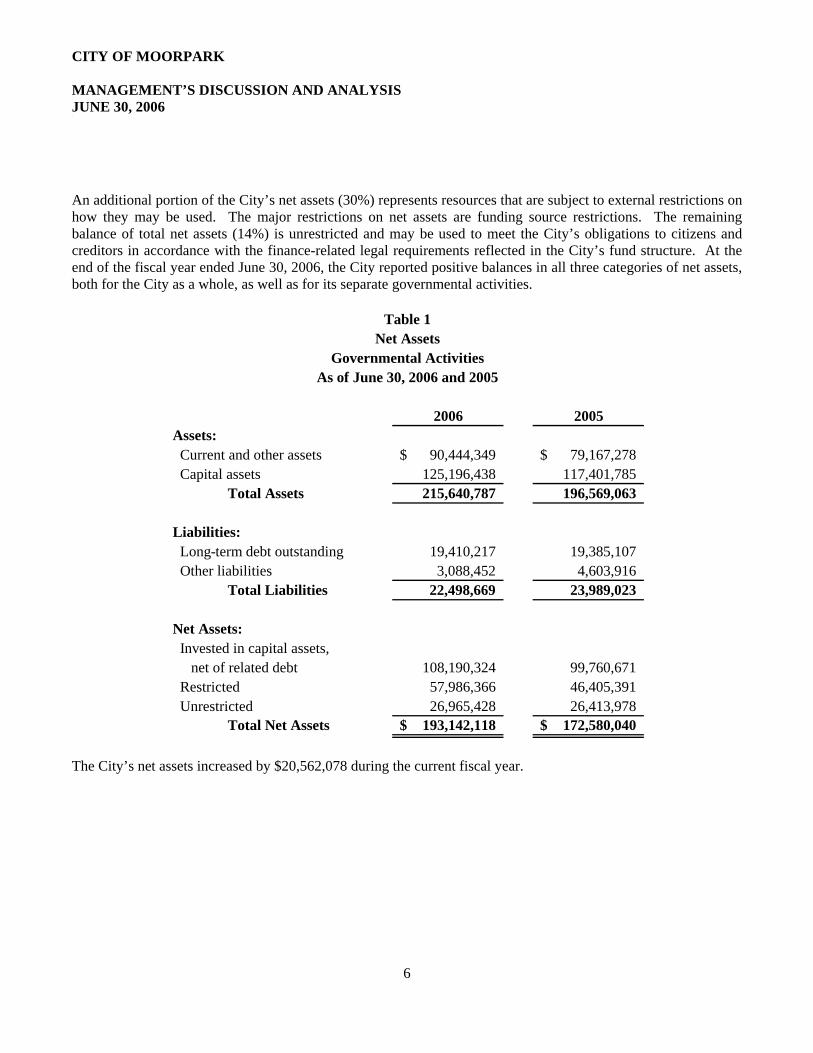
An additional portion of the City’s net assets (30%) represents resources that are subject to external restrictions on how they may be used. The major restrictions on net assets are funding source restrictions. The remaining balance of total net assets (14%) is unrestricted and may be used to meet the City’s obligations to citizens and creditors in accordance with the finance-related legal requirements reflected in the City’s fund structure. At the end of the fiscal year ended June 30, 2006, the City reported positive balances in all three categories of net assets, both for the City as a whole, as well as for its separate governmental activities.
Table 1Net Assets
Governmental ActivitiesAs of June 30, 2006 and 2005
2006 2005Assets: Current and other assets 90,444,349$ 79,167,278$ Capital assets 125,196,438 117,401,785 Total Assets 215,640,787 196,569,063
Liabilities: Long-term debt outstanding 19,410,217 19,385,107 Other liabilities 3,088,452 4,603,916 Total Liabilities 22,498,669 23,989,023
Net Assets: Invested in capital assets, net of related debt 108,190,324 99,760,671 Restricted 57,986,366 46,405,391 Unrestricted 26,965,428 26,413,978 Total Net Assets 193,142,118$ 172,580,040$
The City’s net assets increased by $20,562,078 during the current fiscal year.
CITY OF MOORPARK MANAGEMENT’S DISCUSSION AND ANALYSIS JUNE 30, 2006 s
7
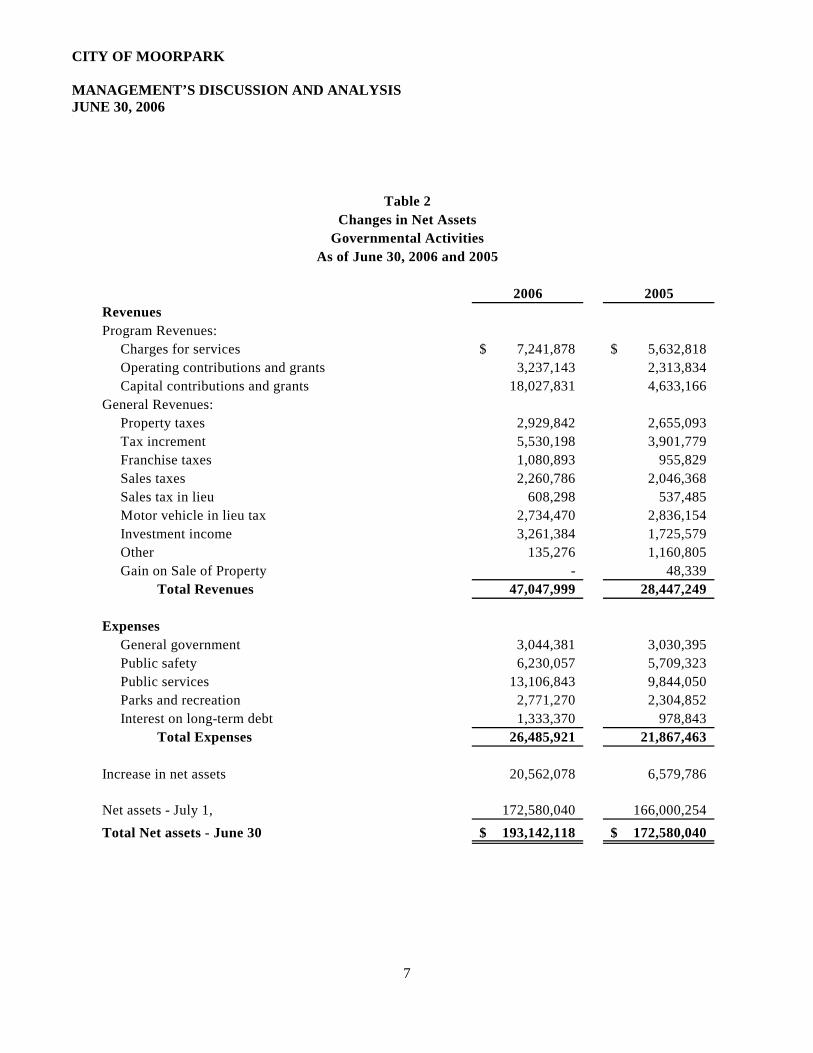
Table 2Changes in Net Assets
Governmental ActivitiesAs of June 30, 2006 and 2005
2006 2005RevenuesProgram Revenues: Charges for services 7,241,878$ 5,632,818$ Operating contributions and grants 3,237,143 2,313,834 Capital contributions and grants 18,027,831 4,633,166 General Revenues: Property taxes 2,929,842 2,655,093 Tax increment 5,530,198 3,901,779 Franchise taxes 1,080,893 955,829 Sales taxes 2,260,786 2,046,368 Sales tax in lieu 608,298 537,485 Motor vehicle in lieu tax 2,734,470 2,836,154 Investment income 3,261,384 1,725,579 Other 135,276 1,160,805 Gain on Sale of Property - 48,339 Total Revenues 47,047,999 28,447,249
Expenses General government 3,044,381 3,030,395 Public safety 6,230,057 5,709,323 Public services 13,106,843 9,844,050 Parks and recreation 2,771,270 2,304,852 Interest on long-term debt 1,333,370 978,843 Total Expenses 26,485,921 21,867,463
Increase in net assets 20,562,078 6,579,786
Net assets - July 1, 172,580,040 166,000,254 Total Net assets - June 30 193,142,118$ 172,580,040$
CITY OF MOORPARK MANAGEMENT’S DISCUSSION AND ANALYSIS JUNE 30, 2006 s
8
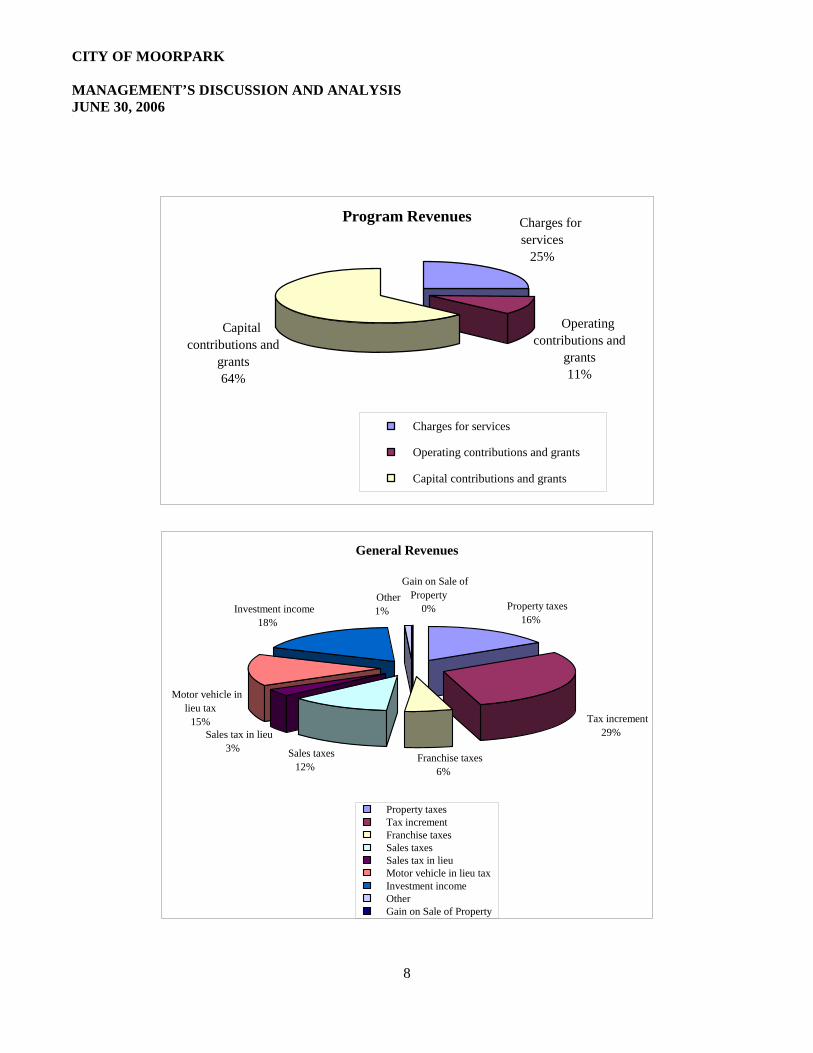
Program Revenues Charges for services
25%
Operating contributions and
grants11%
Capital contributions and
grants64%
Charges for services
Operating contributions and grants
Capital contributions and grants
General Revenues
Property taxes16%
Tax increment29%
Franchise taxes6%
Sales taxes12%
Sales tax in lieu3%
Motor vehicle in lieu tax
15%
Investment income18%
Gain on Sale of Property
0% Other
1%
Property taxes Tax increment Franchise taxes Sales taxes Sales tax in lieu Motor vehicle in lieu tax Investment income Other Gain on Sale of Property
CITY OF MOORPARK MANAGEMENT’S DISCUSSION AND ANALYSIS JUNE 30, 2006 s
9
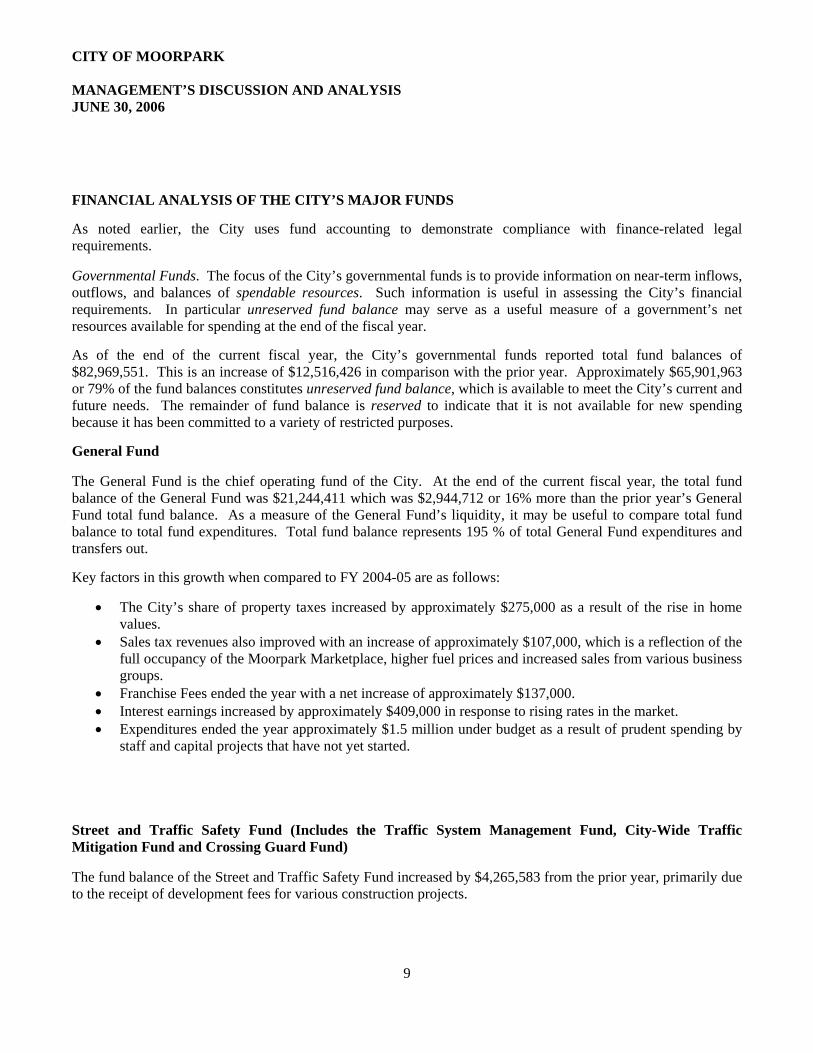
FINANCIAL ANALYSIS OF THE CITY’S MAJOR FUNDS As noted earlier, the City uses fund accounting to demonstrate compliance with finance-related legal requirements. Governmental Funds. The focus of the City’s governmental funds is to provide information on near-term inflows, outflows, and balances of spendable resources. Such information is useful in assessing the City’s financial requirements. In particular unreserved fund balance may serve as a useful measure of a government’s net resources available for spending at the end of the fiscal year. As of the end of the current fiscal year, the City’s governmental funds reported total fund balances of $82,969,551. This is an increase of $12,516,426 in comparison with the prior year. Approximately $65,901,963 or 79% of the fund balances constitutes unreserved fund balance, which is available to meet the City’s current and future needs. The remainder of fund balance is reserved to indicate that it is not available for new spending because it has been committed to a variety of restricted purposes. General Fund The General Fund is the chief operating fund of the City. At the end of the current fiscal year, the total fund balance of the General Fund was $21,244,411 which was $2,944,712 or 16% more than the prior year’s General Fund total fund balance. As a measure of the General Fund’s liquidity, it may be useful to compare total fund balance to total fund expenditures. Total fund balance represents 195 % of total General Fund expenditures and transfers out. Key factors in this growth when compared to FY 2004-05 are as follows:
• The City’s share of property taxes increased by approximately $275,000 as a result of the rise in home values.
• Sales tax revenues also improved with an increase of approximately $107,000, which is a reflection of the full occupancy of the Moorpark Marketplace, higher fuel prices and increased sales from various business groups.
• Franchise Fees ended the year with a net increase of approximately $137,000. • Interest earnings increased by approximately $409,000 in response to rising rates in the market. • Expenditures ended the year approximately $1.5 million under budget as a result of prudent spending by
staff and capital projects that have not yet started.
Street and Traffic Safety Fund (Includes the Traffic System Management Fund, City-Wide Traffic Mitigation Fund and Crossing Guard Fund) The fund balance of the Street and Traffic Safety Fund increased by $4,265,583 from the prior year, primarily due to the receipt of development fees for various construction projects.
CITY OF MOORPARK MANAGEMENT’S DISCUSSION AND ANALYSIS JUNE 30, 2006 s
10
Community Development Fund The fund balance of the Community Development Fund increased by $374,774 from the prior year as a result of increased residential and non-residential development as well as increased public improvement projects. Areas of Contribution Fund The fund balance of the Areas of Contribution Fund increased by $3,736,209 from the prior year, primarily due to development fees received for the Los Angeles AOC and fees for the Tierra Rejada/Spring Road AOC. Endowment Fund The fund balance of the Endowment Fund decreased by $1,090,445 from the prior year, primarily due to the construction of the Corporation Yard to serve Public Works and Parks Maintenance field operations. The facility is expected to be completed by the end of January 2007. Park Improvement Fund (Includes ten (10) various development fee related funds) The fund balance of the Park Improvement Fund increased by $2,334,912 primarily due to savings from various ongoing projects that have not yet been completed. Police Facilities Fund The fund balance of the Police Facilities Fund decreased by $517,741 from the prior year, primarily due to the construction of the final phase of the new Police Services Center. The Police Department moved into the new facility in November of 2005. The major funding source for this new facility is a loan from the Endowment Fund, which currently has an outstanding balance of $7,641,592. In addition, reconciliation will be performed in FY 2006-07 to determine total project costs and the amount the Police Facilities Fund is capable of repaying. The amount of the loan will then be adjusted. Repayments will be made when the Police Facilities Fund collect fees from future development projects. RDA Capital Projects Fund The fund balance of the Redevelopment Agency Capital Projects Fund decreased by $1,738,229 from the previous year mainly due to the acquisition of the High Street Arts Center and the Moorpark Avenue Widening project. RDA Debt Service Fund The fund balance of the Redevelopment Agency Debt Service Fund increased by $25,897 primarily resulting from lower transfers to the RDA Operations Fund of tax increment revenue.
CITY OF MOORPARK MANAGEMENT’S DISCUSSION AND ANALYSIS JUNE 30, 2006 s
11
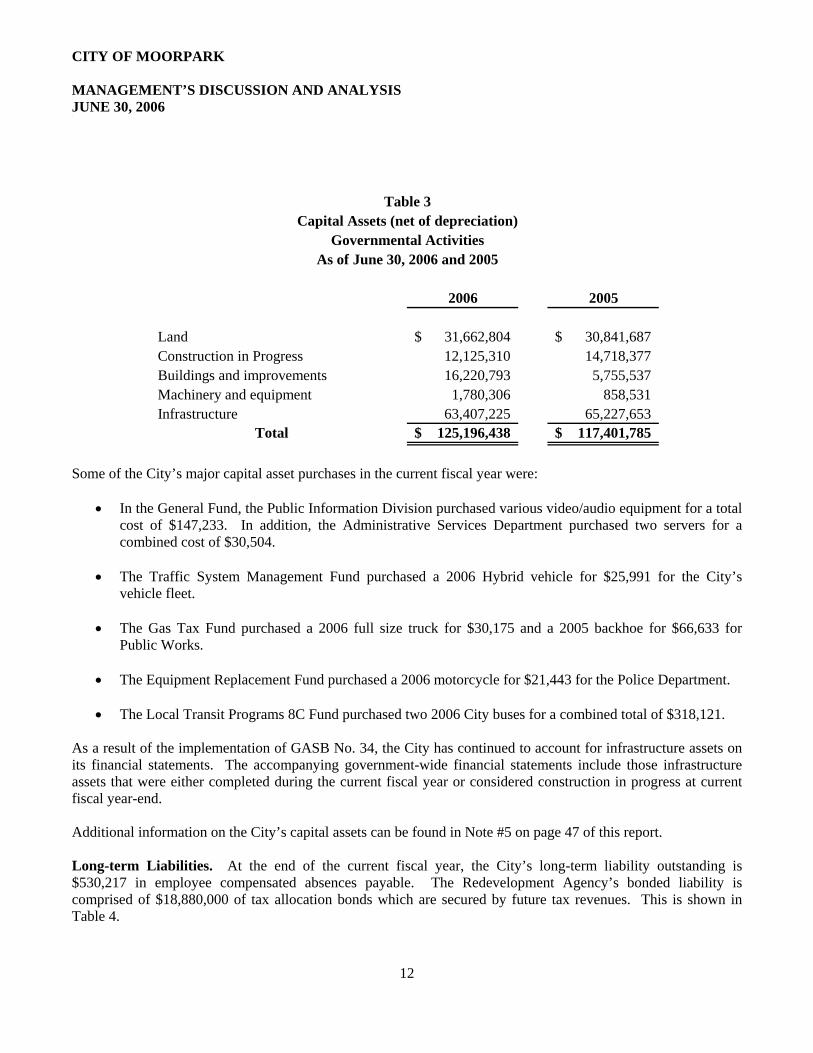
Non-Major Governmental Funds The fund balance of all other Non-Major Governmental Funds (10 funds) increased by $2,180,754 or 21% from the previous fiscal year. This increase is mainly a result of the receipt of development fees for affordable housing; reimbursements for completed projects from ISTEA Federal Grants; and increased in tax increment revenue in the Low and Moderate Income Housing Fund as a result of the rise in assessed property values. General Fund Budgetary Highlights The City adopts annual appropriated operating budgets for its governmental funds (General Fund, Special Revenue Funds, Debt Service Funds, and Capital Project Funds) and reports the results of operation on a budget comparison basis. In preparing its budgets, the City attempts to estimate its revenues using realistic, but conservative, methods so as to budget its expenditure appropriations and activities in a prudent manner. As a result, the City Council adopts budget adjustments during the course of the fiscal year to reflect both changed priorities and availability of additional revenues to allow for expansion of existing programs. During the course of the year, the City Council amended the originally adopted budget to re-appropriate prior year approved projects and expenditures, as well as approving many other adjustments for the current year. The results of the General Fund for the year ended June 30, 2006, were more favorable than anticipated. Revenues were $1.6 million over budget and expenditures and transfers out ended the year $1.5 million under budget. The two largest savings came from General Government ($368,774) and Public Safety ($804,249). Public Safety ended the year with a significant savings primarily due to the inability to staff the 84-hour patrol car that was added. CAPITAL ASSET AND LONG-TERM LIABILITIES Capital Assets. The City’s investment in capital assets as of June 30, 2006, amounted to $125,196,438 (net of accumulated depreciation). This investment, detailed in Table 3, includes land, construction in progress, buildings and improvements, machinery and equipment, and infrastructure. The total increase in the City’s investment in capital assets for the current fiscal year was 6.6%. Buildings and equipment shows a significant increase in 2006 due to the completion of the Police Services Center and as such, the building has been capitalized.
CITY OF MOORPARK MANAGEMENT’S DISCUSSION AND ANALYSIS JUNE 30, 2006 s
12
Table 3Capital Assets (net of depreciation)
Governmental ActivitiesAs of June 30, 2006 and 2005
2006 2005
Land 31,662,804$ 30,841,687$ Construction in Progress 12,125,310 14,718,377 Buildings and improvements 16,220,793 5,755,537 Machinery and equipment 1,780,306 858,531 Infrastructure 63,407,225 65,227,653
Total 125,196,438$ 117,401,785$
Some of the City’s major capital asset purchases in the current fiscal year were:
• In the General Fund, the Public Information Division purchased various video/audio equipment for a total cost of $147,233. In addition, the Administrative Services Department purchased two servers for a combined cost of $30,504.
• The Traffic System Management Fund purchased a 2006 Hybrid vehicle for $25,991 for the City’s
vehicle fleet. • The Gas Tax Fund purchased a 2006 full size truck for $30,175 and a 2005 backhoe for $66,633 for
Public Works. • The Equipment Replacement Fund purchased a 2006 motorcycle for $21,443 for the Police Department.
• The Local Transit Programs 8C Fund purchased two 2006 City buses for a combined total of $318,121.
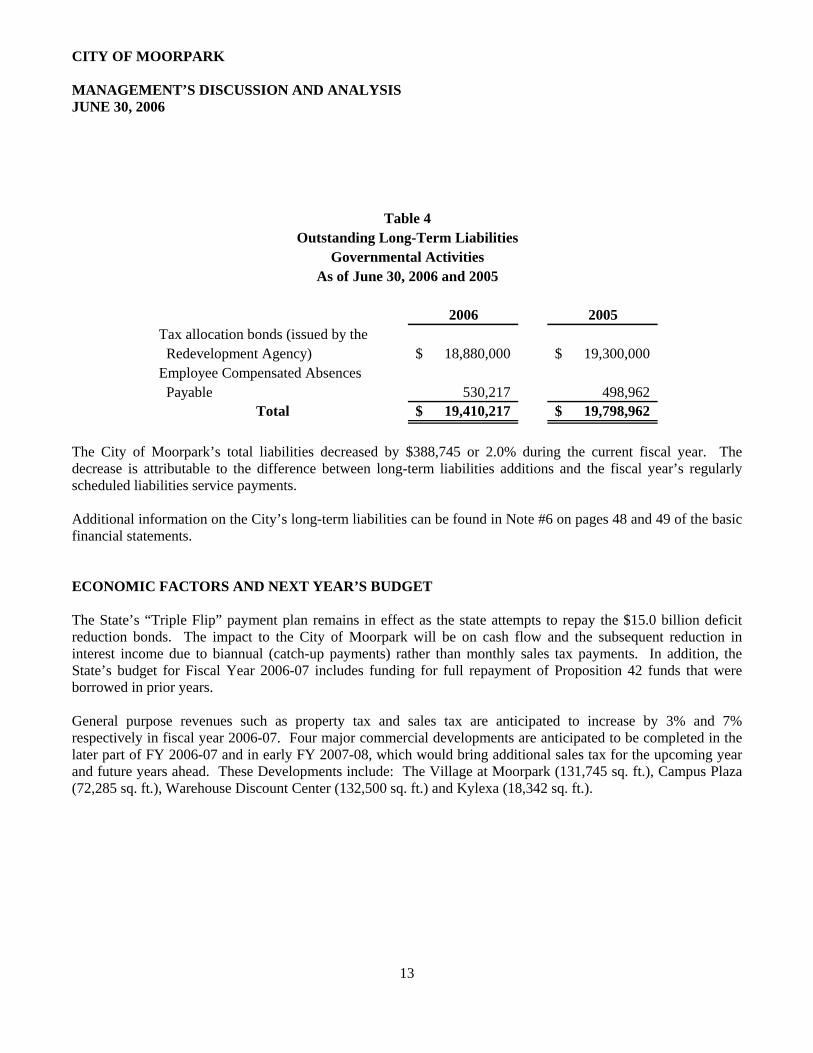
As a result of the implementation of GASB No. 34, the City has continued to account for infrastructure assets on its financial statements. The accompanying government-wide financial statements include those infrastructure assets that were either completed during the current fiscal year or considered construction in progress at current fiscal year-end. Additional information on the City’s capital assets can be found in Note #5 on page 47 of this report. Long-term Liabilities. At the end of the current fiscal year, the City’s long-term liability outstanding is $530,217 in employee compensated absences payable. The Redevelopment Agency’s bonded liability is comprised of $18,880,000 of tax allocation bonds which are secured by future tax revenues. This is shown in Table 4.
CITY OF MOORPARK MANAGEMENT’S DISCUSSION AND ANALYSIS JUNE 30, 2006 s
13
Table 4
Outstanding Long-Term LiabilitiesGovernmental Activities
As of June 30, 2006 and 2005
2006 2005Tax allocation bonds (issued by the Redevelopment Agency) 18,880,000$ 19,300,000$ Employee Compensated Absences Payable 530,217 498,962
Total 19,410,217$ 19,798,962$
The City of Moorpark’s total liabilities decreased by $388,745 or 2.0% during the current fiscal year. The decrease is attributable to the difference between long-term liabilities additions and the fiscal year’s regularly scheduled liabilities service payments. Additional information on the City’s long-term liabilities can be found in Note #6 on pages 48 and 49 of the basic financial statements. ECONOMIC FACTORS AND NEXT YEAR’S BUDGET The State’s “Triple Flip” payment plan remains in effect as the state attempts to repay the $15.0 billion deficit reduction bonds. The impact to the City of Moorpark will be on cash flow and the subsequent reduction in interest income due to biannual (catch-up payments) rather than monthly sales tax payments. In addition, the State’s budget for Fiscal Year 2006-07 includes funding for full repayment of Proposition 42 funds that were borrowed in prior years. General purpose revenues such as property tax and sales tax are anticipated to increase by 3% and 7% respectively in fiscal year 2006-07. Four major commercial developments are anticipated to be completed in the later part of FY 2006-07 and in early FY 2007-08, which would bring additional sales tax for the upcoming year and future years ahead. These Developments include: The Village at Moorpark (131,745 sq. ft.), Campus Plaza (72,285 sq. ft.), Warehouse Discount Center (132,500 sq. ft.) and Kylexa (18,342 sq. ft.).
CITY OF MOORPARK MANAGEMENT’S DISCUSSION AND ANALYSIS JUNE 30, 2006 s
14
Additionally, the City took into consideration the following factors in preparing the budget for fiscal year 2006-07:
• Interest income will show an increase in response to rising interest rates. • Sales tax growth should continue to increase which is a reflection of the full occupancy of the Moorpark
Marketplace and generally having the same tenant mix in FY 2006-07 and occupancy of the other centers referenced above for portions of the year.
• Slight decrease in PERS retirement cost from 11.783% to 11.728% effective July 1, 2006.
• Projections indicate our cost for general liability insurance will decrease by 36% and worker’s
compensation is expected to decrease by 20% when compared to fiscal year 2005-06 actual payments. A priority of the City is to maintain a high quality of services while adopting a balanced budget. As in prior years, the 2006-07 budget as adopted by the City Council is a balanced budget and will serve as a guide in planning for the future.
REQUESTS FOR INFORMATION
This management’s discussion and analysis is designed to provide citizens, taxpayers, customers, investors, and creditors with a general overview of the City’s finances and to demonstrate the City’s accountability for the money it receives. If you have questions or need additional financial information, please contact the Finance Department at City Hall, 799 Moorpark Avenue, Moorpark, CA 93021, or at www.ci.moorpark.ca.us.
s
BASIC FINANCIAL STATEMENTS
s
GOVERNMENT-WIDE FINANCIAL STATEMENTS
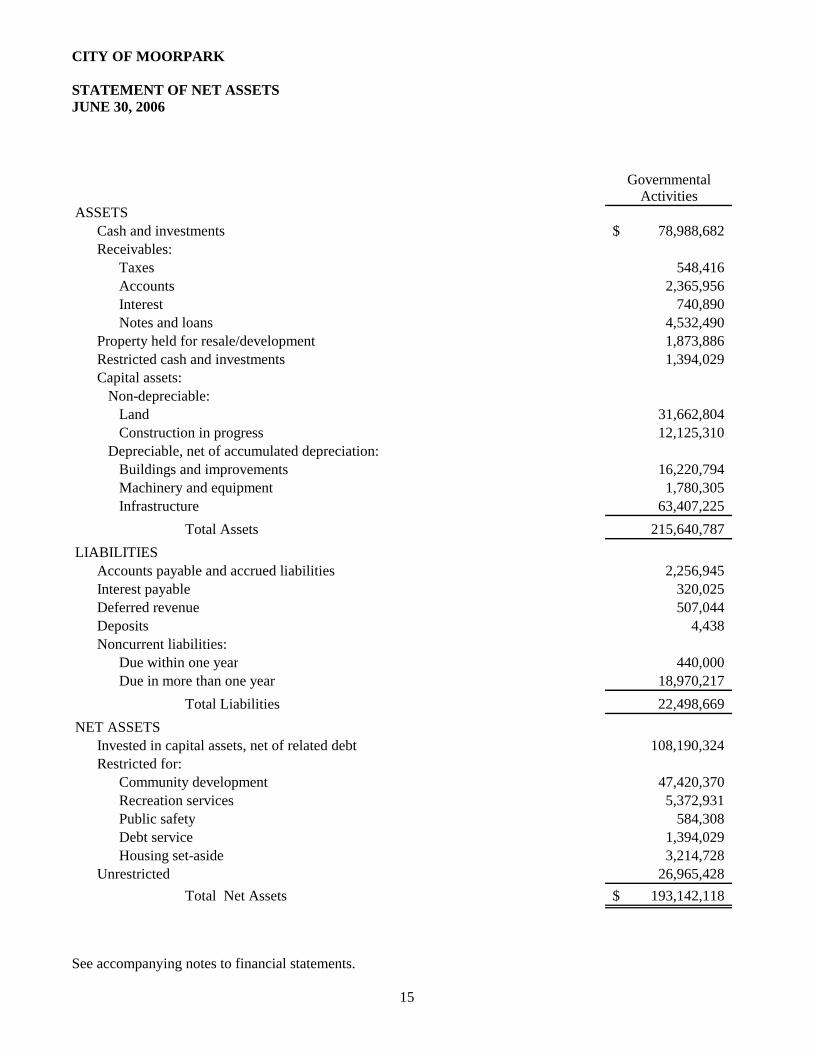
CITY OF MOORPARK STATEMENT OF NET ASSETS JUNE 30, 2006
See accompanying notes to financial statements.
15
GovernmentalActivities
ASSETSCash and investments 78,988,682$ Receivables:
Taxes 548,416 Accounts 2,365,956 Interest 740,890 Notes and loans 4,532,490
Property held for resale/development 1,873,886 Restricted cash and investments 1,394,029 Capital assets:
Non-depreciable:Land 31,662,804 Construction in progress 12,125,310
Depreciable, net of accumulated depreciation:Buildings and improvements 16,220,794 Machinery and equipment 1,780,305 Infrastructure 63,407,225
Total Assets 215,640,787 LIABILITIES
Accounts payable and accrued liabilities 2,256,945 Interest payable 320,025 Deferred revenue 507,044 Deposits 4,438 Noncurrent liabilities:
Due within one year 440,000 Due in more than one year 18,970,217
Total Liabilities 22,498,669 NET ASSETS
Invested in capital assets, net of related debt 108,190,324 Restricted for:
Community development 47,420,370 Recreation services 5,372,931 Public safety 584,308 Debt service 1,394,029 Housing set-aside 3,214,728
Unrestricted 26,965,428 Total Net Assets 193,142,118$
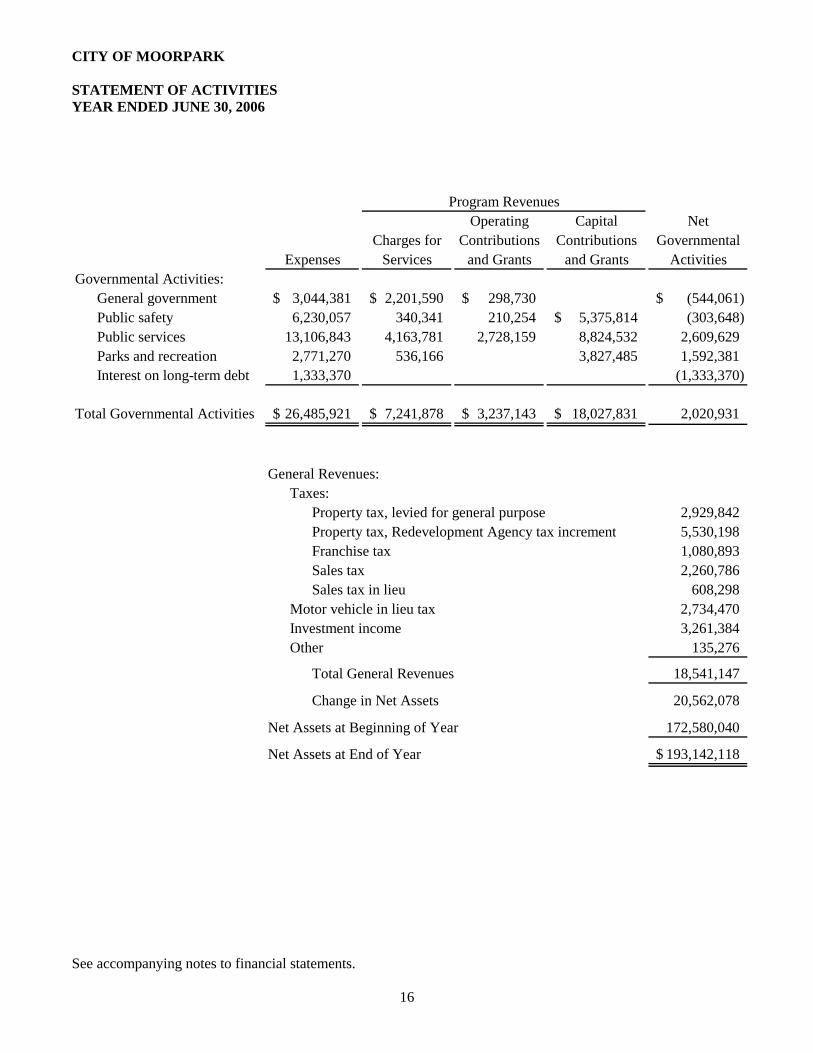
CITY OF MOORPARK STATEMENT OF ACTIVITIES YEAR ENDED JUNE 30, 2006
See accompanying notes to financial statements.
16
Operating Capital NetCharges for Contributions Contributions Governmental
Expenses Services and Grants and Grants ActivitiesGovernmental Activities: General government 3,044,381$ 2,201,590$ 298,730$ (544,061)$ Public safety 6,230,057 340,341 210,254 5,375,814$ (303,648) Public services 13,106,843 4,163,781 2,728,159 8,824,532 2,609,629 Parks and recreation 2,771,270 536,166 3,827,485 1,592,381
Interest on long-term debt 1,333,370 (1,333,370)
Total Governmental Activities 26,485,921$ 7,241,878$ 3,237,143$ 18,027,831$ 2,020,931
General Revenues:Taxes:
Property tax, levied for general purpose 2,929,842 Property tax, Redevelopment Agency tax increment 5,530,198 Franchise tax 1,080,893 Sales tax 2,260,786 Sales tax in lieu 608,298
Motor vehicle in lieu tax 2,734,470 Investment income 3,261,384 Other 135,276
Total General Revenues 18,541,147
Change in Net Assets 20,562,078
Net Assets at Beginning of Year 172,580,040
Net Assets at End of Year 193,142,118$
Program Revenues
s
FUND FINANCIAL STATEMENTS
s
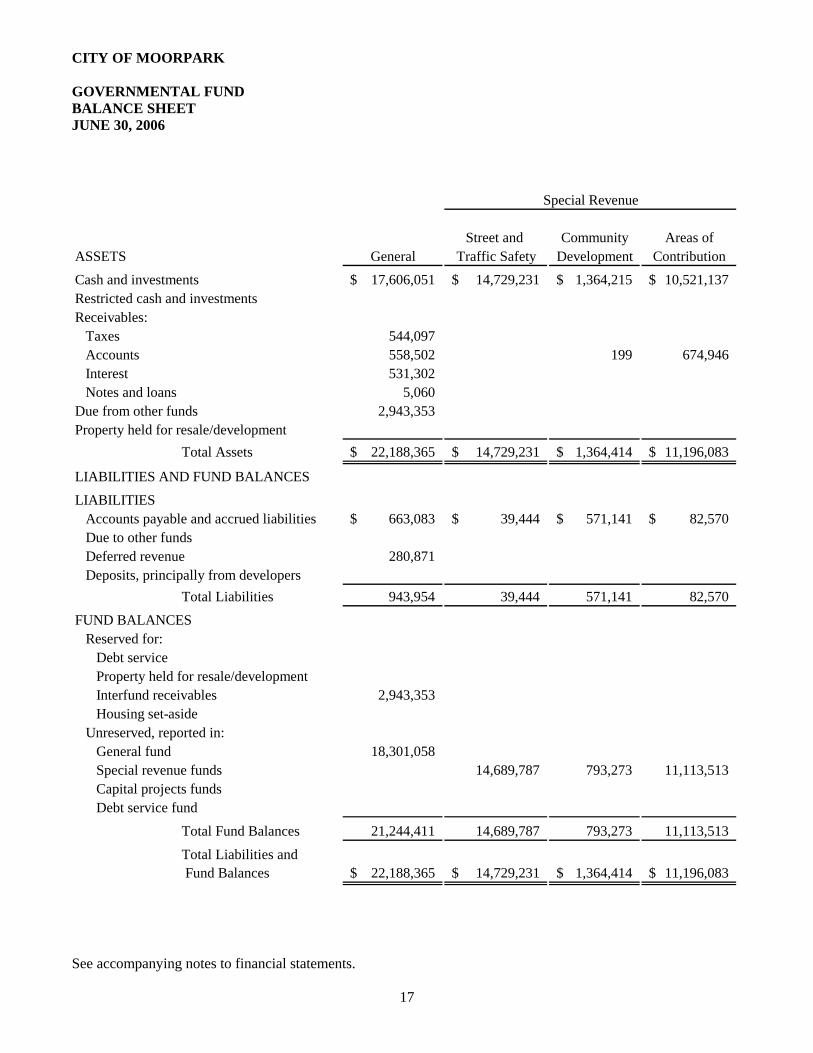
CITY OF MOORPARK GOVERNMENTAL FUND BALANCE SHEET JUNE 30, 2006
See accompanying notes to financial statements.
17
Street and Community Areas ofASSETS General Traffic Safety Development ContributionCash and investments 17,606,051$ 14,729,231$ 1,364,215$ 10,521,137$ Restricted cash and investmentsReceivables: Taxes 544,097 Accounts 558,502 199 674,946 Interest 531,302 Notes and loans 5,060 Due from other funds 2,943,353 Property held for resale/development
Total Assets 22,188,365$ 14,729,231$ 1,364,414$ 11,196,083$
LIABILITIES AND FUND BALANCESLIABILITIES
Accounts payable and accrued liabilities 663,083$ 39,444$ 571,141$ 82,570$ Due to other fundsDeferred revenue 280,871Deposits, principally from developers
Total Liabilities 943,954 39,444 571,141 82,570FUND BALANCES
Reserved for:Debt serviceProperty held for resale/developmentInterfund receivables 2,943,353Housing set-aside
Unreserved, reported in:General fund 18,301,058Special revenue funds 14,689,787 793,273 11,113,513Capital projects fundsDebt service fund
Total Fund Balances 21,244,411 14,689,787 793,273 11,113,513
Total Liabilities and Fund Balances 22,188,365$ 14,729,231$ 1,364,414$ 11,196,083$
Special Revenue
s
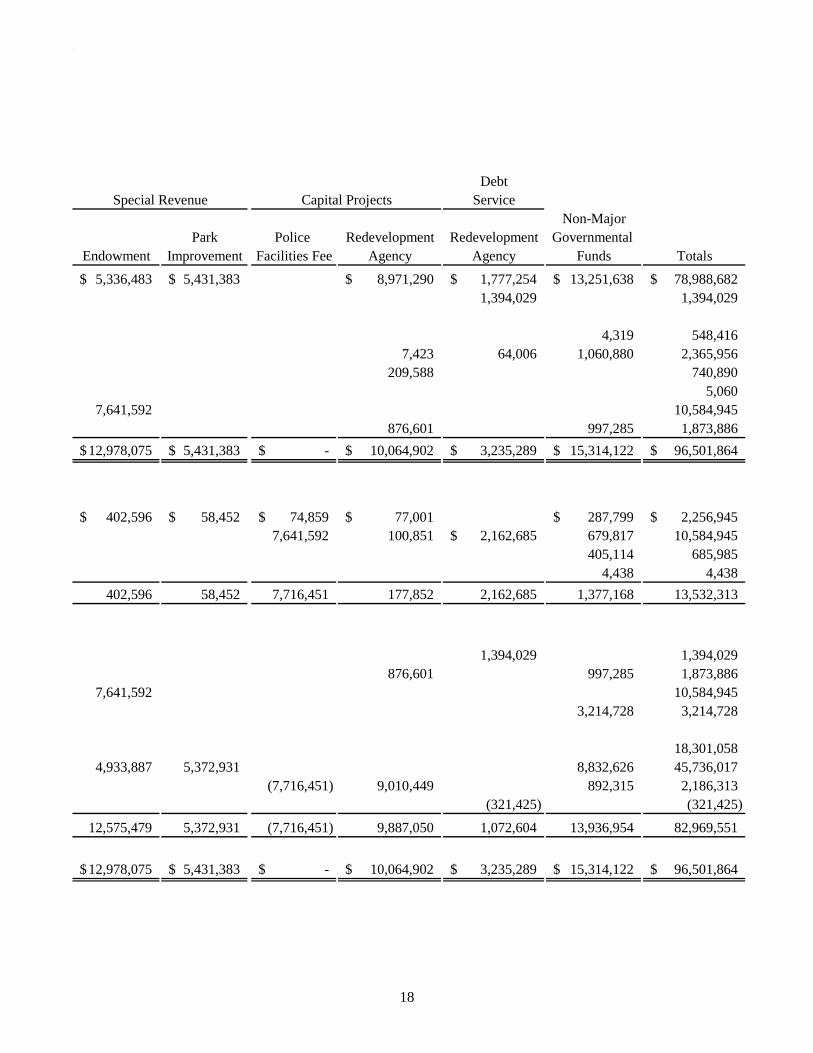
18
DebtService
Non-MajorPark Police Redevelopment Redevelopment Governmental
Endowment Improvement Facilities Fee Agency Agency Funds Totals
5,336,483$ 5,431,383$ 8,971,290$ 1,777,254$ 13,251,638$ 78,988,682$ 1,394,029 1,394,029
4,319 548,4167,423 64,006 1,060,880 2,365,956
209,588 740,890 5,060
7,641,592 10,584,945 876,601 997,285 1,873,886
12,978,075$ 5,431,383$ -$ 10,064,902$ 3,235,289$ 15,314,122$ 96,501,864$
402,596$ 58,452$ 74,859$ 77,001$ 287,799$ 2,256,945$ 7,641,592 100,851 2,162,685$ 679,817 10,584,945
405,114 685,9854,438 4,438
402,596 58,452 7,716,451 177,852 2,162,685 1,377,168 13,532,313
1,394,029 1,394,029876,601 997,285 1,873,886
7,641,592 10,584,9453,214,728 3,214,728
18,301,0584,933,887 5,372,931 8,832,626 45,736,017
(7,716,451) 9,010,449 892,315 2,186,313(321,425) (321,425)
12,575,479 5,372,931 (7,716,451) 9,887,050 1,072,604 13,936,954 82,969,551
12,978,075$ 5,431,383$ -$ 10,064,902$ 3,235,289$ 15,314,122$ 96,501,864$
Capital ProjectsSpecial Revenue
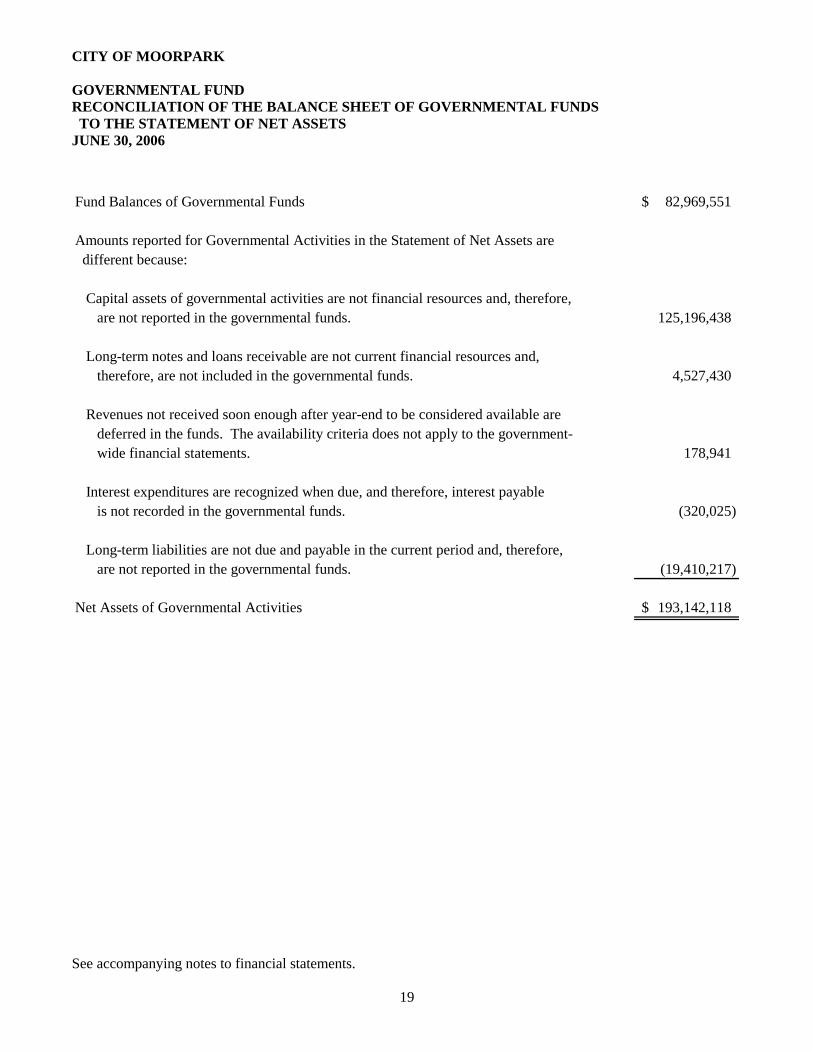
CITY OF MOORPARK GOVERNMENTAL FUND RECONCILIATION OF THE BALANCE SHEET OF GOVERNMENTAL FUNDS TO THE STATEMENT OF NET ASSETS JUNE 30, 2006
See accompanying notes to financial statements.
19
Fund Balances of Governmental Funds 82,969,551$
Amounts reported for Governmental Activities in the Statement of Net Assets are different because:
Capital assets of governmental activities are not financial resources and, therefore,are not reported in the governmental funds. 125,196,438
Long-term notes and loans receivable are not current financial resources and,therefore, are not included in the governmental funds. 4,527,430
Revenues not received soon enough after year-end to be considered available are deferred in the funds. The availability criteria does not apply to the government-wide financial statements. 178,941
Interest expenditures are recognized when due, and therefore, interest payableis not recorded in the governmental funds. (320,025)
Long-term liabilities are not due and payable in the current period and, therefore,are not reported in the governmental funds. (19,410,217)
Net Assets of Governmental Activities 193,142,118$
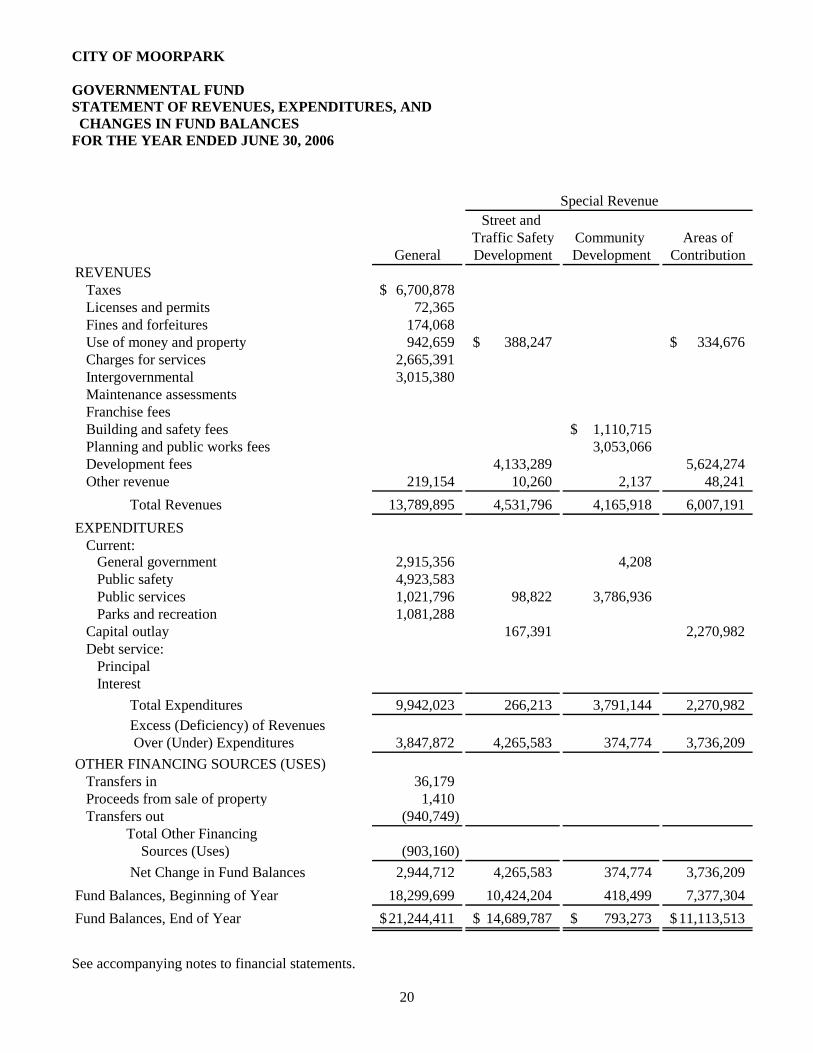
CITY OF MOORPARK GOVERNMENTAL FUND STATEMENT OF REVENUES, EXPENDITURES, AND CHANGES IN FUND BALANCES FOR THE YEAR ENDED JUNE 30, 2006
See accompanying notes to financial statements.
20
Street and Traffic Safety Community Areas of
General Development Development ContributionREVENUES Taxes 6,700,878$ Licenses and permits 72,365 Fines and forfeitures 174,068 Use of money and property 942,659 388,247$ 334,676$ Charges for services 2,665,391 Intergovernmental 3,015,380 Maintenance assessments Franchise fees Building and safety fees 1,110,715$ Planning and public works fees 3,053,066 Development fees 4,133,289 5,624,274 Other revenue 219,154 10,260 2,137 48,241 Total Revenues 13,789,895 4,531,796 4,165,918 6,007,191EXPENDITURES Current: General government 2,915,356 4,208 Public safety 4,923,583 Public services 1,021,796 98,822 3,786,936 Parks and recreation 1,081,288 Capital outlay 167,391 2,270,982 Debt service: Principal Interest Total Expenditures 9,942,023 266,213 3,791,144 2,270,982 Excess (Deficiency) of Revenues Over (Under) Expenditures 3,847,872 4,265,583 374,774 3,736,209OTHER FINANCING SOURCES (USES) Transfers in 36,179 Proceeds from sale of property 1,410 Transfers out (940,749) Total Other Financing
Sources (Uses) (903,160) Net Change in Fund Balances 2,944,712 4,265,583 374,774 3,736,209Fund Balances, Beginning of Year 18,299,699 10,424,204 418,499 7,377,304Fund Balances, End of Year 21,244,411$ 14,689,787$ 793,273$ 11,113,513$
Special Revenue
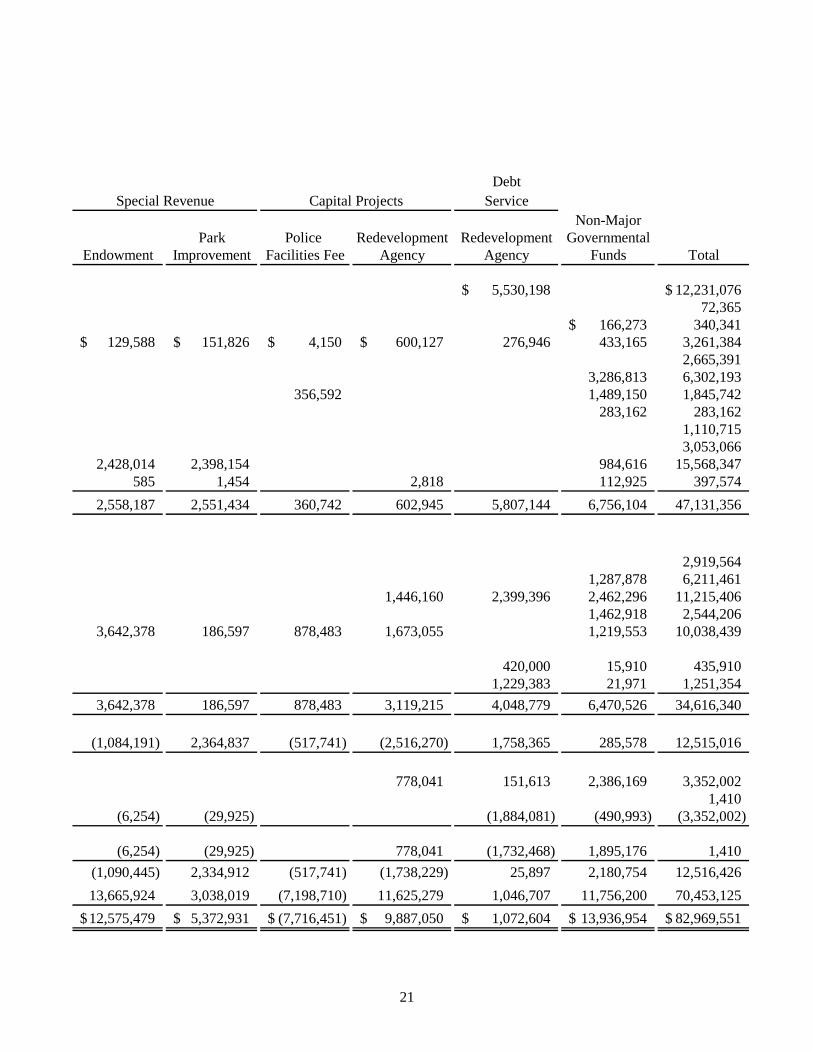
21
DebtService
Non-MajorPark Police Redevelopment Redevelopment Governmental
Endowment Improvement Facilities Fee Agency Agency Funds Total
5,530,198$ 12,231,076$ 72,365
166,273$ 340,341129,588$ 151,826$ 4,150$ 600,127$ 276,946 433,165 3,261,384
2,665,3913,286,813 6,302,193
356,592 1,489,150 1,845,742283,162 283,162
1,110,7153,053,066
2,428,014 2,398,154 984,616 15,568,347585 1,454 2,818 112,925 397,574
2,558,187 2,551,434 360,742 602,945 5,807,144 6,756,104 47,131,356
2,919,5641,287,878 6,211,461
1,446,160 2,399,396 2,462,296 11,215,4061,462,918 2,544,206
3,642,378 186,597 878,483 1,673,055 1,219,553 10,038,439
420,000 15,910 435,9101,229,383 21,971 1,251,354
3,642,378 186,597 878,483 3,119,215 4,048,779 6,470,526 34,616,340
(1,084,191) 2,364,837 (517,741) (2,516,270) 1,758,365 285,578 12,515,016
778,041 151,613 2,386,169 3,352,0021,410
(6,254) (29,925) (1,884,081) (490,993) (3,352,002)
(6,254) (29,925) 778,041 (1,732,468) 1,895,176 1,410(1,090,445) 2,334,912 (517,741) (1,738,229) 25,897 2,180,754 12,516,42613,665,924 3,038,019 (7,198,710) 11,625,279 1,046,707 11,756,200 70,453,12512,575,479$ 5,372,931$ (7,716,451)$ 9,887,050$ 1,072,604$ 13,936,954$ 82,969,551$
Capital ProjectsSpecial Revenue
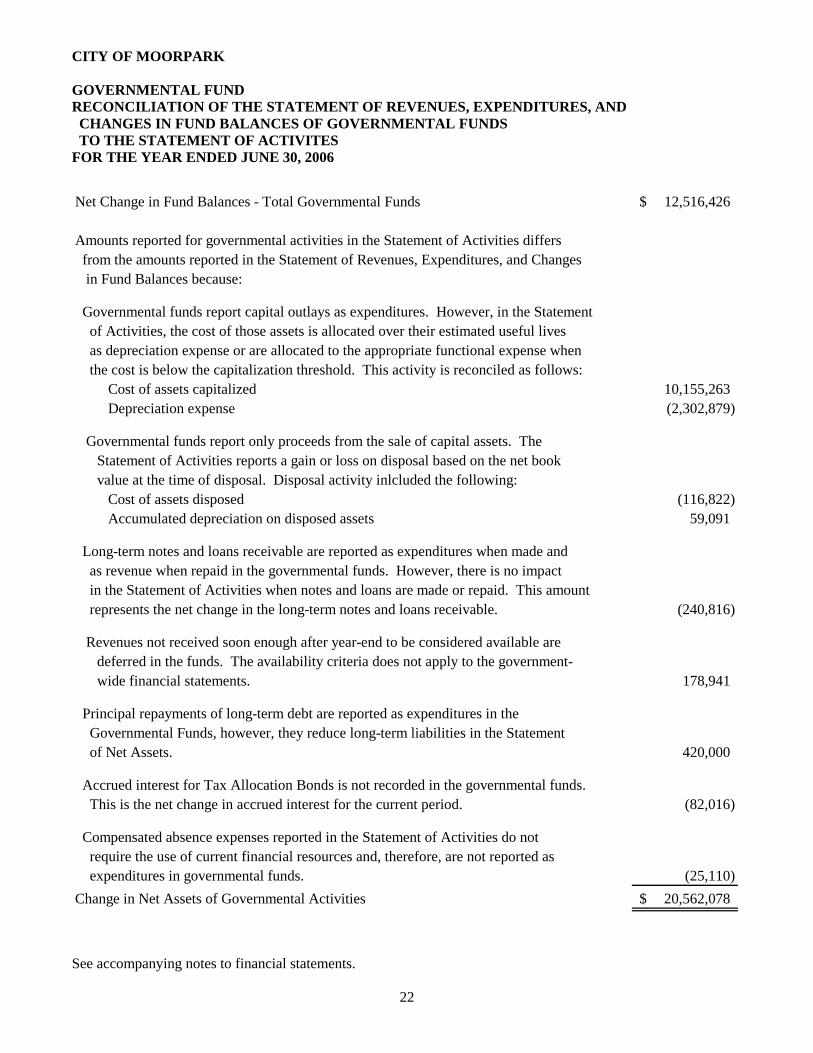
CITY OF MOORPARK GOVERNMENTAL FUND RECONCILIATION OF THE STATEMENT OF REVENUES, EXPENDITURES, AND CHANGES IN FUND BALANCES OF GOVERNMENTAL FUNDS TO THE STATEMENT OF ACTIVITES FOR THE YEAR ENDED JUNE 30, 2006
See accompanying notes to financial statements.
22
Net Change in Fund Balances - Total Governmental Funds 12,516,426$
Amounts reported for governmental activities in the Statement of Activities differs from the amounts reported in the Statement of Revenues, Expenditures, and Changes in Fund Balances because:
Governmental funds report capital outlays as expenditures. However, in the Statement of Activities, the cost of those assets is allocated over their estimated useful lives as depreciation expense or are allocated to the appropriate functional expense when the cost is below the capitalization threshold. This activity is reconciled as follows:
Cost of assets capitalized 10,155,263 Depreciation expense (2,302,879)
Governmental funds report only proceeds from the sale of capital assets. TheStatement of Activities reports a gain or loss on disposal based on the net bookvalue at the time of disposal. Disposal activity inlcluded the following:
Cost of assets disposed (116,822) Accumulated depreciation on disposed assets 59,091
Long-term notes and loans receivable are reported as expenditures when made and as revenue when repaid in the governmental funds. However, there is no impact in the Statement of Activities when notes and loans are made or repaid. This amount represents the net change in the long-term notes and loans receivable. (240,816)
Revenues not received soon enough after year-end to be considered available are deferred in the funds. The availability criteria does not apply to the government-wide financial statements. 178,941
Principal repayments of long-term debt are reported as expenditures in the Governmental Funds, however, they reduce long-term liabilities in the Statement of Net Assets. 420,000
Accrued interest for Tax Allocation Bonds is not recorded in the governmental funds. This is the net change in accrued interest for the current period. (82,016)
Compensated absence expenses reported in the Statement of Activities do not require the use of current financial resources and, therefore, are not reported as expenditures in governmental funds. (25,110) Change in Net Assets of Governmental Activities 20,562,078$
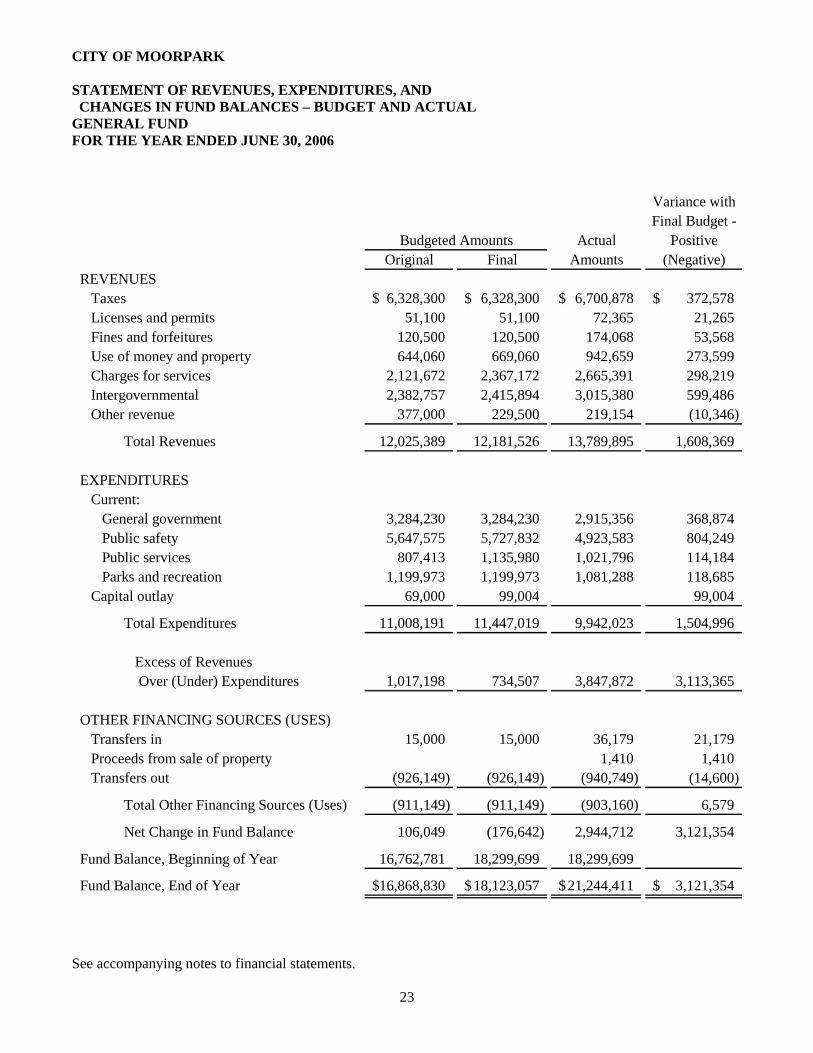
CITY OF MOORPARK STATEMENT OF REVENUES, EXPENDITURES, AND CHANGES IN FUND BALANCES – BUDGET AND ACTUAL GENERAL FUND FOR THE YEAR ENDED JUNE 30, 2006
See accompanying notes to financial statements.
23
Variance withFinal Budget -
Actual PositiveOriginal Final Amounts (Negative)
REVENUES Taxes 6,328,300$ 6,328,300$ 6,700,878$ 372,578$ Licenses and permits 51,100 51,100 72,365 21,265 Fines and forfeitures 120,500 120,500 174,068 53,568 Use of money and property 644,060 669,060 942,659 273,599 Charges for services 2,121,672 2,367,172 2,665,391 298,219 Intergovernmental 2,382,757 2,415,894 3,015,380 599,486 Other revenue 377,000 229,500 219,154 (10,346)
Total Revenues 12,025,389 12,181,526 13,789,895 1,608,369
EXPENDITURES Current: General government 3,284,230 3,284,230 2,915,356 368,874 Public safety 5,647,575 5,727,832 4,923,583 804,249 Public services 807,413 1,135,980 1,021,796 114,184 Parks and recreation 1,199,973 1,199,973 1,081,288 118,685 Capital outlay 69,000 99,004 99,004
Total Expenditures 11,008,191 11,447,019 9,942,023 1,504,996
Excess of Revenues Over (Under) Expenditures 1,017,198 734,507 3,847,872 3,113,365
OTHER FINANCING SOURCES (USES) Transfers in 15,000 15,000 36,179 21,179 Proceeds from sale of property 1,410 1,410 Transfers out (926,149) (926,149) (940,749) (14,600)
Total Other Financing Sources (Uses) (911,149) (911,149) (903,160) 6,579
Net Change in Fund Balance 106,049 (176,642) 2,944,712 3,121,354
Fund Balance, Beginning of Year 16,762,781 18,299,699 18,299,699
Fund Balance, End of Year 16,868,830$ 18,123,057$ 21,244,411$ 3,121,354$
Budgeted Amounts
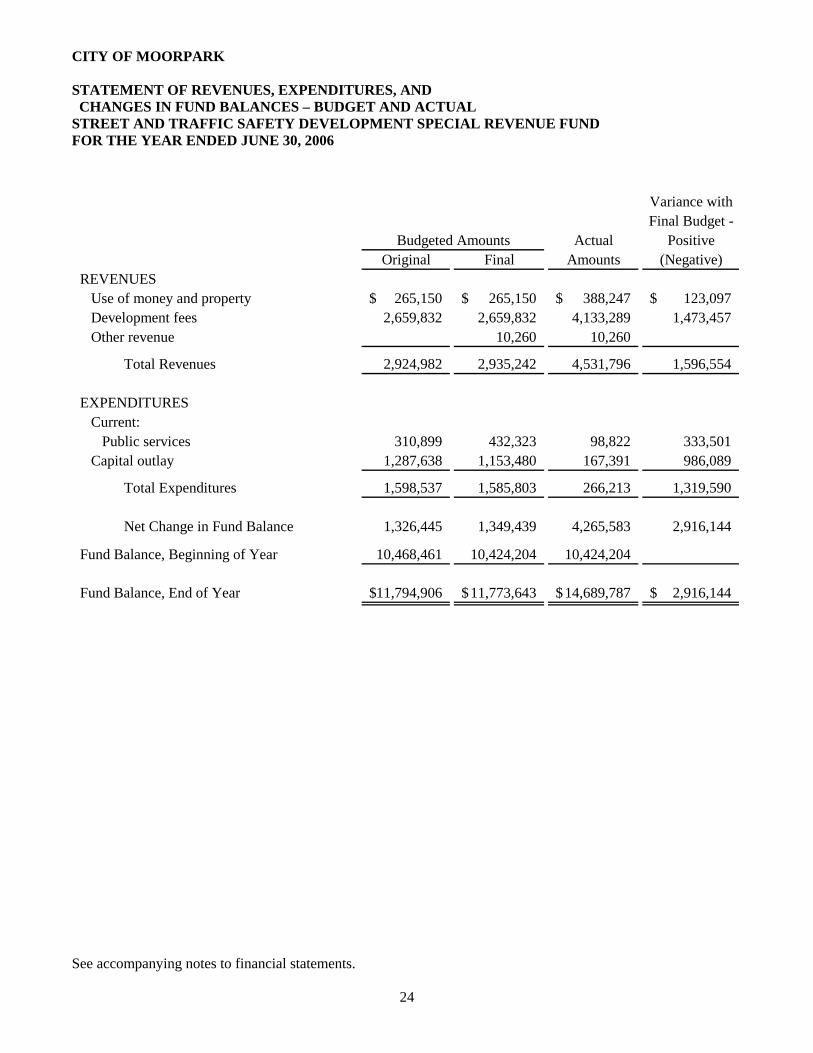
CITY OF MOORPARK STATEMENT OF REVENUES, EXPENDITURES, AND CHANGES IN FUND BALANCES – BUDGET AND ACTUAL STREET AND TRAFFIC SAFETY DEVELOPMENT SPECIAL REVENUE FUND FOR THE YEAR ENDED JUNE 30, 2006
See accompanying notes to financial statements.
24
Variance withFinal Budget -
Actual PositiveOriginal Final Amounts (Negative)
REVENUES Use of money and property 265,150$ 265,150$ 388,247$ 123,097$ Development fees 2,659,832 2,659,832 4,133,289 1,473,457 Other revenue 10,260 10,260
Total Revenues 2,924,982 2,935,242 4,531,796 1,596,554
EXPENDITURES Current: Public services 310,899 432,323 98,822 333,501 Capital outlay 1,287,638 1,153,480 167,391 986,089
Total Expenditures 1,598,537 1,585,803 266,213 1,319,590
Net Change in Fund Balance 1,326,445 1,349,439 4,265,583 2,916,144
Fund Balance, Beginning of Year 10,468,461 10,424,204 10,424,204
Fund Balance, End of Year 11,794,906$ 11,773,643$ 14,689,787$ 2,916,144$
Budgeted Amounts
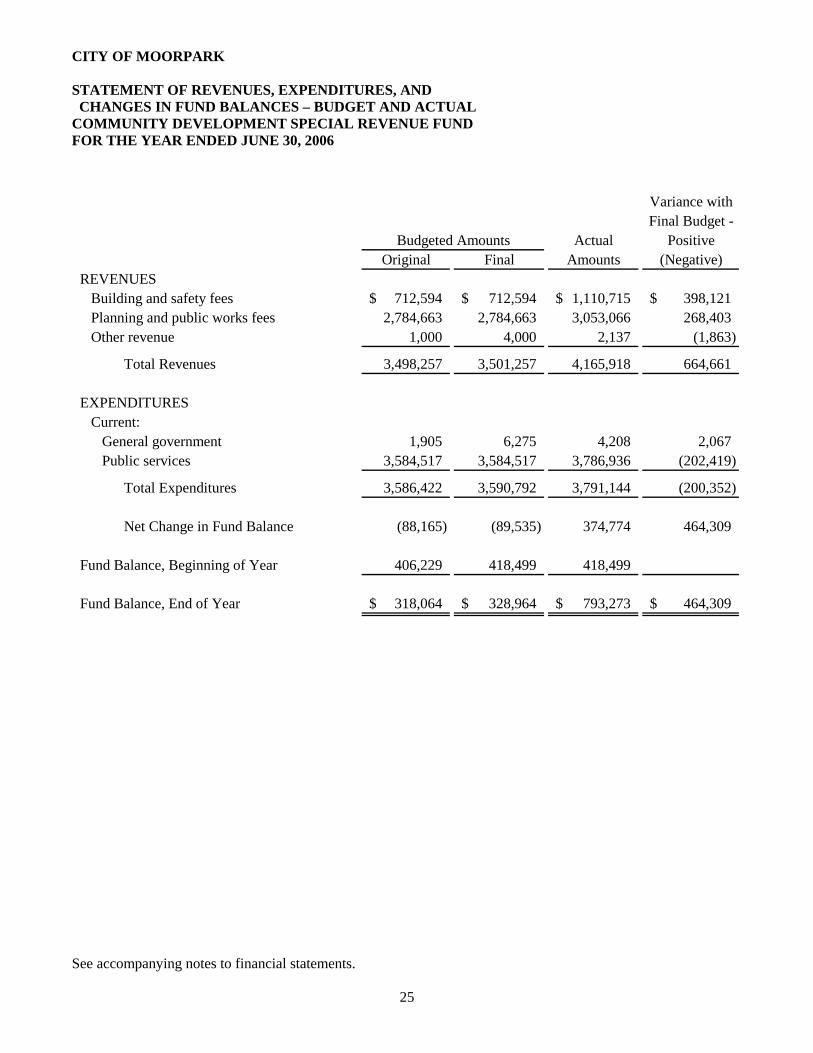
CITY OF MOORPARK STATEMENT OF REVENUES, EXPENDITURES, AND CHANGES IN FUND BALANCES – BUDGET AND ACTUAL COMMUNITY DEVELOPMENT SPECIAL REVENUE FUND FOR THE YEAR ENDED JUNE 30, 2006
See accompanying notes to financial statements.
25
Variance withFinal Budget -
Actual PositiveOriginal Final Amounts (Negative)
REVENUES Building and safety fees 712,594$ 712,594$ 1,110,715$ 398,121$ Planning and public works fees 2,784,663 2,784,663 3,053,066 268,403 Other revenue 1,000 4,000 2,137 (1,863)
Total Revenues 3,498,257 3,501,257 4,165,918 664,661
EXPENDITURES Current: General government 1,905 6,275 4,208 2,067 Public services 3,584,517 3,584,517 3,786,936 (202,419)
Total Expenditures 3,586,422 3,590,792 3,791,144 (200,352)
Net Change in Fund Balance (88,165) (89,535) 374,774 464,309
Fund Balance, Beginning of Year 406,229 418,499 418,499
Fund Balance, End of Year 318,064$ 328,964$ 793,273$ 464,309$
Budgeted Amounts
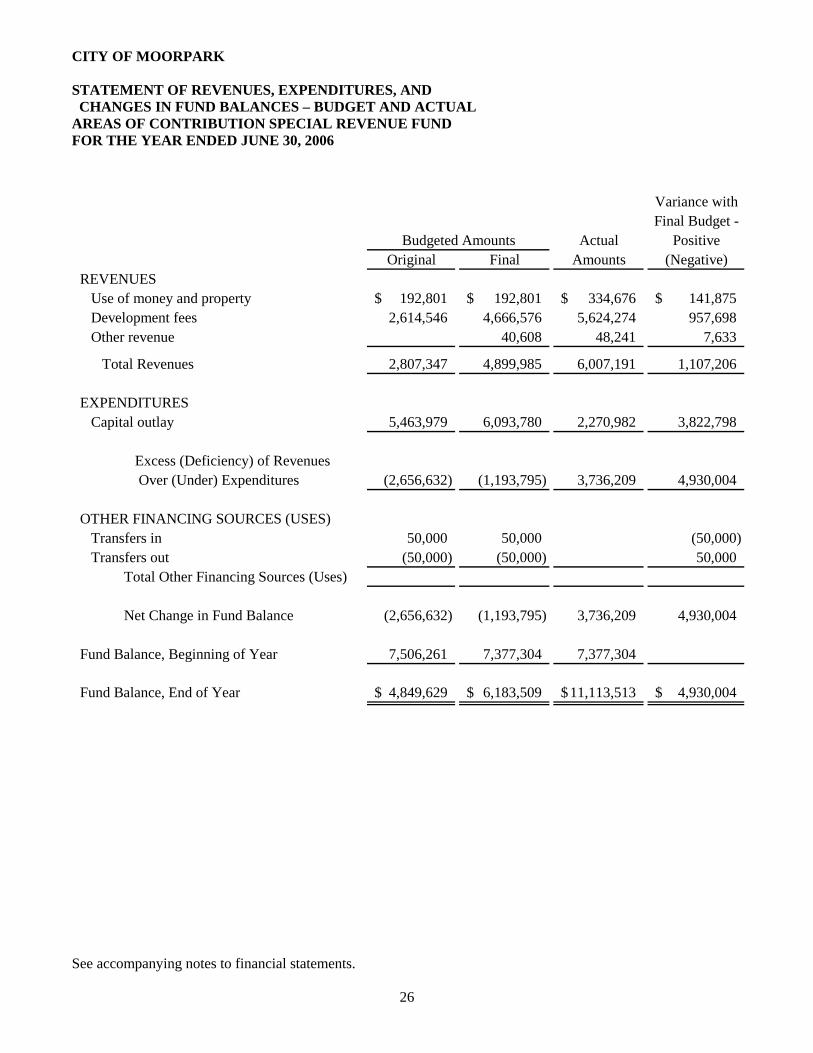
CITY OF MOORPARK STATEMENT OF REVENUES, EXPENDITURES, AND CHANGES IN FUND BALANCES – BUDGET AND ACTUAL AREAS OF CONTRIBUTION SPECIAL REVENUE FUND FOR THE YEAR ENDED JUNE 30, 2006
See accompanying notes to financial statements.
26
Variance withFinal Budget -
Actual PositiveOriginal Final Amounts (Negative)
REVENUES Use of money and property 192,801$ 192,801$ 334,676$ 141,875$ Development fees 2,614,546 4,666,576 5,624,274 957,698 Other revenue 40,608 48,241 7,633
Total Revenues 2,807,347 4,899,985 6,007,191 1,107,206
EXPENDITURES Capital outlay 5,463,979 6,093,780 2,270,982 3,822,798
Excess (Deficiency) of Revenues Over (Under) Expenditures (2,656,632) (1,193,795) 3,736,209 4,930,004
OTHER FINANCING SOURCES (USES) Transfers in 50,000 50,000 (50,000) Transfers out (50,000) (50,000) 50,000
Total Other Financing Sources (Uses)
Net Change in Fund Balance (2,656,632) (1,193,795) 3,736,209 4,930,004
Fund Balance, Beginning of Year 7,506,261 7,377,304 7,377,304
Fund Balance, End of Year 4,849,629$ 6,183,509$ 11,113,513$ 4,930,004$
Budgeted Amounts
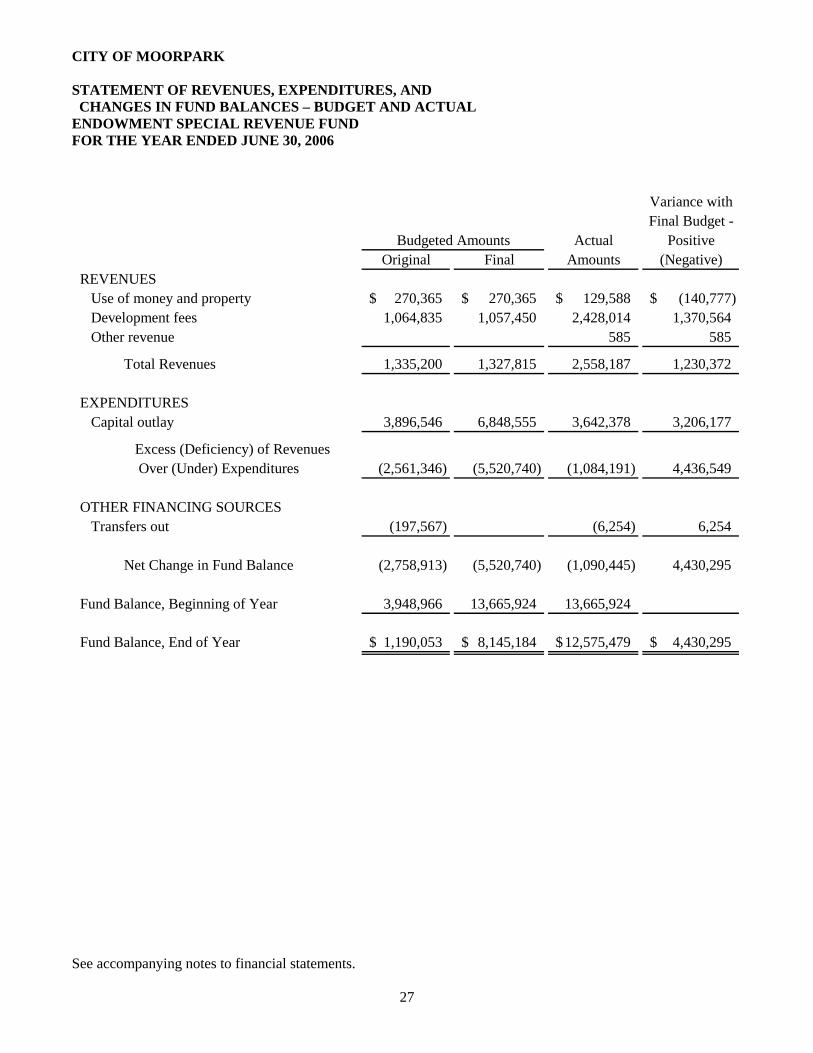
CITY OF MOORPARK STATEMENT OF REVENUES, EXPENDITURES, AND CHANGES IN FUND BALANCES – BUDGET AND ACTUAL ENDOWMENT SPECIAL REVENUE FUND FOR THE YEAR ENDED JUNE 30, 2006
See accompanying notes to financial statements.
27
Variance withFinal Budget -
Actual PositiveOriginal Final Amounts (Negative)
REVENUES Use of money and property 270,365$ 270,365$ 129,588$ (140,777)$ Development fees 1,064,835 1,057,450 2,428,014 1,370,564 Other revenue 585 585
Total Revenues 1,335,200 1,327,815 2,558,187 1,230,372
EXPENDITURES Capital outlay 3,896,546 6,848,555 3,642,378 3,206,177
Excess (Deficiency) of Revenues Over (Under) Expenditures (2,561,346) (5,520,740) (1,084,191) 4,436,549
OTHER FINANCING SOURCES Transfers out (197,567) (6,254) 6,254
Net Change in Fund Balance (2,758,913) (5,520,740) (1,090,445) 4,430,295
Fund Balance, Beginning of Year 3,948,966 13,665,924 13,665,924
Fund Balance, End of Year 1,190,053$ 8,145,184$ 12,575,479$ 4,430,295$
Budgeted Amounts
CITY OF MOORPARK STATEMENT OF REVENUES, EXPENDITURES, AND CHANGES IN FUND BALANCES – BUDGET AND ACTUAL PARK IMPROVEMENT SPECIAL REVENUE FUND FOR THE YEAR ENDED JUNE 30, 2006
See accompanying notes to financial statements.
28
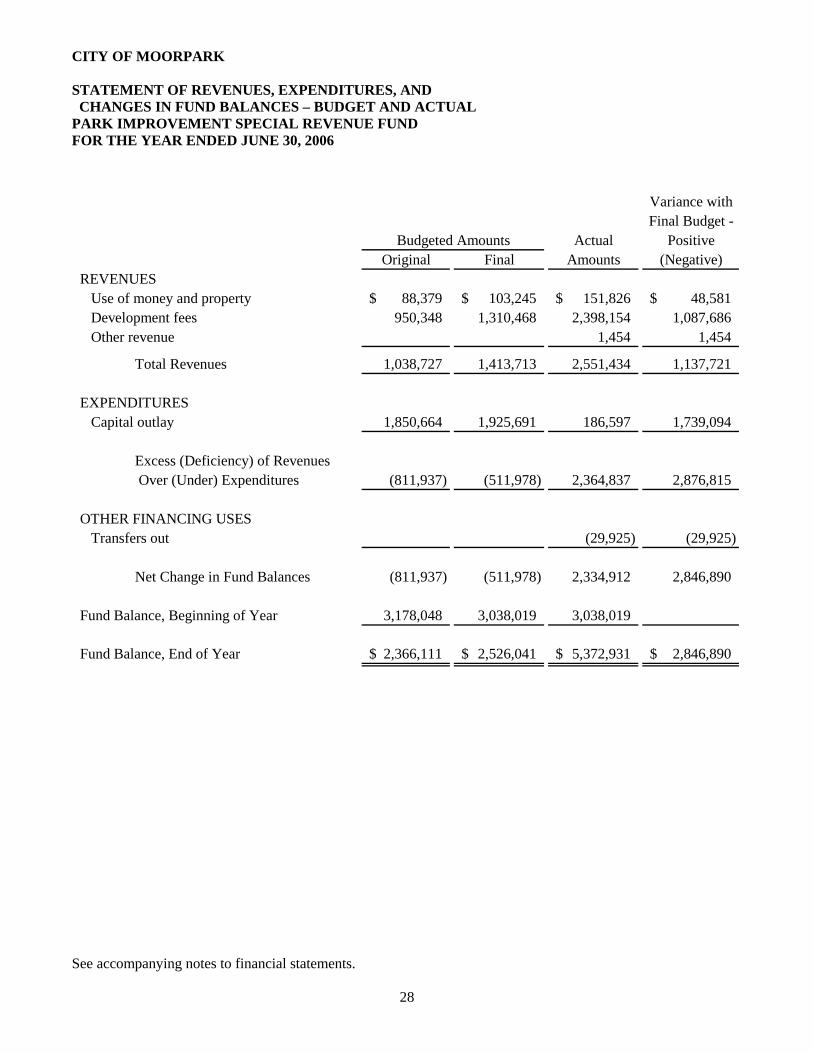
Variance withFinal Budget -
Actual PositiveOriginal Final Amounts (Negative)
REVENUES Use of money and property 88,379$ 103,245$ 151,826$ 48,581$ Development fees 950,348 1,310,468 2,398,154 1,087,686 Other revenue 1,454 1,454
Total Revenues 1,038,727 1,413,713 2,551,434 1,137,721
EXPENDITURES Capital outlay 1,850,664 1,925,691 186,597 1,739,094
Excess (Deficiency) of Revenues Over (Under) Expenditures (811,937) (511,978) 2,364,837 2,876,815
OTHER FINANCING USES Transfers out (29,925) (29,925)
Net Change in Fund Balances (811,937) (511,978) 2,334,912 2,846,890
Fund Balance, Beginning of Year 3,178,048 3,038,019 3,038,019
Fund Balance, End of Year 2,366,111$ 2,526,041$ 5,372,931$ 2,846,890$
Budgeted Amounts
s
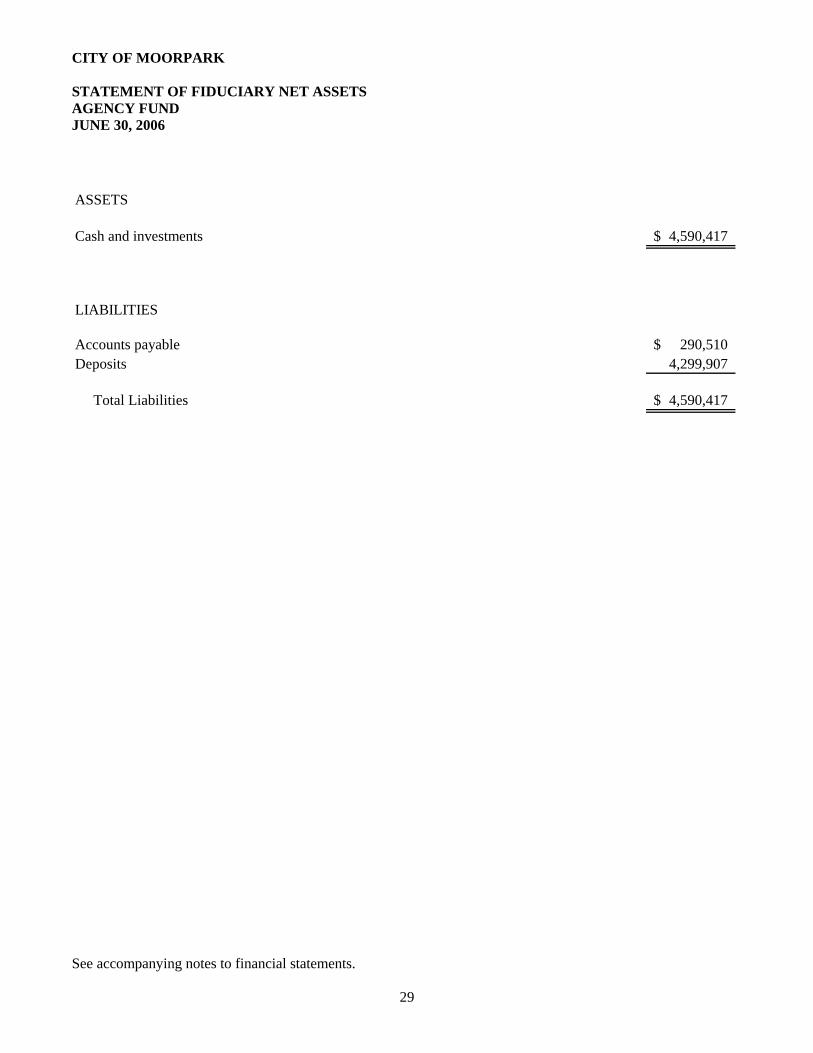
CITY OF MOORPARK STATEMENT OF FIDUCIARY NET ASSETS AGENCY FUND JUNE 30, 2006
See accompanying notes to financial statements.
29
ASSETS
Cash and investments 4,590,417$
LIABILITIES
Accounts payable 290,510$ Deposits 4,299,907
Total Liabilities 4,590,417$

s
NOTES TO FINANCIAL STATEMENTS
CITY OF MOORPARK NOTES TO FINANCIAL STATEMENTS JUNE 30, 2006
30
NOTE #1 – SUMMARY OF SIGNIFICANT ACCOUNTING POLICIES The accounting policies of the City of Moorpark (the City) conform to accounting principles generally accepted in the United States of America as applicable to governments. The Governmental Accounting Standards Board (GASB) is the accepted standard setting body for governmental accounting and financial reporting principles. The following is a summary of the significant policies. A. Reporting Entity
The reporting entity “City of Moorpark” includes the accounts of the City, the Moorpark Redevelopment Agency (the RDA), the Moorpark Public Financing Authority (the PFA), and the Industrial Development Authority of the City of Moorpark (the IDA). The City was incorporated in July 1983 as a general law city and operates under a Council/Manager form of government. The RDA was formed in 1987 pursuant to the State of California Health and Safety Code, Section 33000 entitled “Community Redevelopment Law”. Its purpose is to finance long-term capital improvements designed to eliminate physical and economic blight in a project area. The PFA was formed in 1993 as a joint powers authority between the City and the RDA in order to provide financial assistance to the City and the RDA by issuing debt and financing the construction of public facilities. The IDA was formed in 1985 pursuant to the California Industrial Development Financing Act (the Act). Its purpose is to finance the acquisition and development of certain industrial activities as permitted by the Act and to issue bonds for the purpose of enabling industrial firms to finance the cost of such activities. The criteria used in determining the scope of the reporting entity are based on the provisions of GASB Statement No. 14 (as amended by GASB Statement No. 39). The City of Moorpark is the primary government unit. Component units are those entities which are financially accountable to the primary government, either because the City appoints a voting majority of the component unit’s Board, or because the component unit will provide a financial benefit or impose a financial burden on the City. The City has accounted for the RDA, the PFA, and the IDA as “blended” component units. Despite being legally separate, they are so intertwined with the City, it is in substance, part of the City’s operations. Accordingly, the balances and transactions of the RDA are reported as separate funds in the Special Revenue, Debt Service, and Capital Projects Funds. The PFA and IDA are inactive. The following specific criteria were used in determining that the RDA, the PFA, and the IDA are “blended” component units: 1) The members of the City Council also act as the governing body of the RDA, the PFA, and the IDA.
2) The City, the RDA, the PFA, and the IDA are financially interdependent. The City makes loans to the
RDA for use on redevelopment projects. Available property tax revenues of the RDA will be used to repay the loans from the City.
CITY OF MOORPARK NOTES TO FINANCIAL STATEMENTS JUNE 30, 2006
31
NOTE #1 – SUMMARY OF SIGNIFICANT ACCOUNTING POLICIES, Continued
3) The RDA, the PFA, and the IDA are managed by employees of the City.
The financial statements for the RDA may be obtained at the City’s administrative offices. The PFA and IDA do not issue separate financial statements.
B. Participation in Public Entity Joint Powers Authority The City is a member of the California Joint Powers Insurance Authority (the Authority). The Authority is composed of over 100 California public entities and is organized under a joint powers agreement pursuant to California Government Code 6500 et seq. The purpose of the Authority is to arrange and administer programs for the pooling of self-insured losses, to purchase excess insurance or reinsurance, and to arrange for group-purchased insurance for property and other coverage. The Authority’s pool began covering claims of its members in 1978. Each member government has an elected official as its representative on the Board of Directors. The Board operates through a nine-member Executive Committee. The City does not have an equity interest in the Authority; therefore, no amount has been reported in the Statement of Net Assets. However, the City does have an ongoing financial interest because the City is able to influence the operations of the Authority so that the Authority uses its resources on behalf of the City. Also, an ongoing financial responsibility exists because the Authority is dependent on continued funding from the City. The condensed financial information of the Authority has not been reproduced in this report, but is available from the Authority.
C. Accounting and Reporting Policies
The City has conformed to the pronouncements of the GASB, which are the primary authoritative statements of accounting principles generally accepted in the United States of America applicable to state and local governments. In accordance with GASB Statement No. 20, the City applies all applicable Financial Accounting Standards Board (FASB) pronouncements, as well as those of its predecessors, issued on or before November 30, 1989, unless any such pronouncements contradict GASB pronouncements. GASB Statement No. 42 - In November 2003, the GASB issued Statement No. 42, Accounting and Financial Reporting for Impairment of Capital Assets and for Insurance Recoveries. This statement requires governments to measure, recognize, and disclose the effects of capital asset impairments in their financial statements when it occurs. This statement also clarifies and establishes accounting requirements for insurance recoveries, including those associated with capital asset impairment. This statement is effective for fiscal year 2005-06 and did not have a significant impact on the financial statements. GASB Statement No. 44 - In May 2004, the GASB issued Statement No. 44, Economic Condition Reporting: The Statistical Section, and an amendment of NCGA Statement No. 1. This Statement amends the portions of NCGA Statement 1, Governmental Accounting, and Financial Reporting Principles that guide the preparation of the statistical section. The statistical section presents detailed information, typically in ten-year trends, that assists users in utilizing the basic financial statements, notes to basic financial statements, and required supplementary information to assess the economic condition of a government. This statement is effective for fiscal year 2005-06 and has resulted in changes to the statistical section.
CITY OF MOORPARK NOTES TO FINANCIAL STATEMENTS JUNE 30, 2006
32
NOTE #1 – SUMMARY OF SIGNIFICANT ACCOUNTING POLICIES, Continued
GASB Statement No. 46 - In December 2004, the GASB issued Statement No. 46, Net assets Restricted By Enabling Legislation, an amendment of GASB No. 34. This statement clarifies that a legally enforceable enabling legislation restriction is one that a party external to a government can compel a government to honor. Accordingly, it clarifies the determination of restricted net assets within the statement of net assets. This statement is effective for fiscal year 2005-06 and did not have a significant impact on the financial statements. GASB Statement No. 47 - In June 2005, the GASB issued Statement No. 47, Accounting for Termination Benefits. This statement establishes accounting standards for termination benefits. This statement is effective for fiscal year 2005-06 and did not have a significant impact on the financial statements.
D. Description of Funds The accounts of the City are organized on the basis of funds, each of which is considered a separate accounting entity. The operations of each fund are accounted for with a separate set of self-balancing accounts that comprise its assets, liabilities, fund equity, revenues, and expenditures. The following are types of funds used: Governmental Fund Types • General Fund – Used to account for all financial resources except those required to be accounted for in
another fund. • Special Revenue Funds – Used to account for the proceeds of specific revenue sources that are restricted
by law or administrative action for specified purposes.
• Debt Service Fund – The debt service fund is used to account for property tax increment revenue and related interest income. Disbursements from this fund consist mainly of principal and interest on indebtedness.
• Capital Projects Funds – Used to account for financial resources used for the construction of specific
capital projects.
Fiduciary Fund Type
• Agency Funds – Used to account for assets held by the City as an agent for individuals, private organizations, other governments and/or other funds.
E. Basis of Accounting and Measurement Focus
Government–Wide Financial Statements The City’s Government-Wide Financial Statements include a Statement of Net Assets and a Statement of Activities. These statements present summaries of Governmental Activities for the City.
CITY OF MOORPARK NOTES TO FINANCIAL STATEMENTS JUNE 30, 2006
33
NOTE #1 – SUMMARY OF SIGNIFICANT ACCOUNTING POLICIES, Continued
These statements are presented on an “economic resources” measurement focus and the accrual basis of accounting. Accordingly, all of the City’s assets and liabilities, including capital assets and infrastructure as well as long-term debt, are included in the accompanying Statement of Net Assets. The Statement of Activities presents changes in net assets. Under the accrual basis of accounting, revenues are recognized in the period in which they are earned while expenditures are recognized in the period in which the liability is incurred. The Statement of Activities demonstrates the degree to which the direct expenditures of a given function are offset by program revenues. Direct expenditures are those that are clearly identifiable with a specific function. The types of transactions reported as program revenues for the City are reported in three categories: 1) charges for services, 2) operating contributions and grants, and 3) capital grants and contributions. Charges for services include revenues from customers or applicants who purchase, use, or directly benefit from goods, services, or privileges provided by a given function. Operating contributions and grants include revenues restricted to meeting the requirements of a particular operating function and may include state shared revenues and grants. Capital contributions and grants include revenues restricted to meeting the requirements of a particular capital function and may include grants and developer fees. Taxes and other items not properly included among program revenues are reported instead as general revenues. Certain eliminations have been made as prescribed by GASB Statement No. 34 in regards to interfund activities, payables, and receivables. All internal balances in the government-wide financial statements have been eliminated.
Governmental Fund Financial Statements Governmental fund financial statements include a Balance Sheet and Statement of Revenues, Expenditures, and Changes in Fund Balances for all major governmental funds and aggregated non-major funds. An accompanying schedule is presented to reconcile and explain the differences in fund balances as presented in these statements to the net assets presented in the Government-Wide Financial Statements. The City has presented all major funds that met qualifications of GASB Statement No. 34. In addition, the City has included funds that are significant to the City as major funds. All governmental funds are accounted for on a spending or “current financial resources” measurement focus and the modified accrual basis of accounting. Accordingly, only current assets and current liabilities are included on the Balance Sheets. The Statement of Revenues, Expenditures, and Changes in Fund Balances present increases (revenues and other financing sources) and decreases (expenditures and other financing uses) in fund balances. Revenues are recognized in the accounting period in which they become susceptible to accrual, that is, when they become both measurable and available to finance expenditures of the current period. “Measurable” means that the amount of the transaction can be determined, and “available” means collectible within the current period or soon enough thereafter to be used to pay liabilities of the current period. Accrued revenues include property taxes received within 60 days after year-end taxpayer assessed taxes such as sales taxes, and earnings on investments. Grant funds earned but not received are recorded as a receivable, and grant funds received before the revenue recognition criteria have been met are reported as deferred revenues. Expenditures are recorded when the fund liability is incurred, if measurable, except for unmatured interest on general long-term debt, which is recognized when due.
CITY OF MOORPARK NOTES TO FINANCIAL STATEMENTS JUNE 30, 2006
34
NOTE #1 – SUMMARY OF SIGNIFICANT ACCOUNTING POLICIES, Continued
The City reports the following major governmental funds:
The General Fund is the government’s primary operating fund. It accounts for all financial resources of the City, except those required to be accounted for in another fund.
The Street and Traffic Safety Special Revenue Fund is used to account for fees used for street maintenance, right-of-way acquisition and street construction.
The Community Development Special Revenue Fund is used to account for fees used in planning, building and safety, and engineering services relating to community development.
The Areas of Contribution Special Revenue Fund is used to account for fees used for street and related improvements to specific project areas and fund infrastructure enhancements as a result of additional development.
The Endowment Special Revenue Fund is used to account for funds received by the City for certain development projects or other sources directed by the City Council to be held for the purpose of one-time capital expenditure of community-wide benefit due to the impact of additional development.
The Park Improvement Special Revenue Fund is used to account for State and County grants used for acquisition of open space and park improvements. The Police Facilities Fee Capital Projects Fund is used to account for the funds used to build the new police facility. The RDA Capital Projects Fund is used to account for the funds used for the RDA’s capital improvement projects.
The RDA Debt Service Fund is used to account for the accumulation of resources for, and the payment of principal and interest on the RDA’s debt and other long-term obligations. The City has presented all major funds as required by GASB Statement No. 34. In addition, the City has presented the Community Development, Areas of Contribution, and Park Improvement Special Revenue Funds as major based on their significance to the City as a whole.
Fiduciary Fund Financial Statements Fiduciary Fund Financial Statements include a Statement of Net Assets. The fiduciary fund is used to report assets held in a trustee or agency capacity for others and therefore are not available to support City programs. Since these assets are being held for the benefit of a third party, these funds are not incorporated into the government-wide statements.
CITY OF MOORPARK NOTES TO FINANCIAL STATEMENTS JUNE 30, 2006
35
NOTE #1 – SUMMARY OF SIGNIFICANT ACCOUNTING POLICIES, Continued
The City’s only fiduciary fund is an agency fund, which uses the accrual basis of accounting to account for amounts held for individuals, private organizations, other governments, and/or other funds. The agency fund is custodial in nature (assets equal liabilities) and therefore does not involve measurement of results of operations.
F. Budgetary Accounting
Annual budgets are adopted on a basis consistent with GAAP for all governmental funds. All annual appropriations lapse at fiscal year-end. Throughout the year, the City Council made several supplementing budgetary adjustments to the General Fund, Special Revenue Funds, Capital Projects Funds, and Debt Service Fund. These adjustments resulted in a net appropriation increase of $8,914,345. This increase resulted primarily from rebudgeted projects and amounts carried over from Fiscal Year 2004-2005 as continuing appropriations.
Under Article XIIIB of the California Constitution (the Gann Spending Limitation Initiative), the City is restricted as to the amount of annual appropriations from the proceeds of taxes, and if proceeds of taxes exceed allowed appropriations, the excess must either be refunded to the State Controller, returned to the taxpayers through revised tax rates or revised fee schedules, or an excess in one year may be offset against a deficit in the following year. For the fiscal year ended June 30, 2006, based on calculations by City Management, proceeds of taxes did not exceed related appropriations.
G. Investments
The City has adopted the provisions of Governmental Accounting Standards Board (GASB) Statement No. 31, Accounting and Financial Reporting for Certain Investments and External Pools, which require governmental entities to report certain investments at fair value in the balance sheet and recognize the corresponding change in the fair value of investments in the year in which the change occurred. In accordance with GASB Statement No. 31, the City has adjusted certain investments to fair value (when material). Investments are included within the financial statement classifications of “Cash and investments” and “Restricted cash and investments” and are stated at fair value, (see Note #2).
H. Property Held for Resale/Development
Property held for resale in the Low and Moderate Income Housing Special Revenue Fund and the Capital Projects Fund represent land and buildings purchased by the Agency. Such property is valued at the lower of cost or estimated net realizable value (as determined by a disposition and development agreement between the Agency and a developer) and has been offset by a reservation of fund balance to indicate that assets constitute future capital projects and are not available spendable resources. The balance outstanding at June 30, 2006, was $1,873,886. In addition, the Agency owns other properties totaling $5,504,481, which are classified as capital assets, and as such, are not recorded in the fund.
CITY OF MOORPARK NOTES TO FINANCIAL STATEMENTS JUNE 30, 2006
36
NOTE #1 – SUMMARY OF SIGNIFICANT ACCOUNTING POLICIES, Continued I. Capital Assets
Capital assets, which include land, machinery and equipment (vehicles, computers, etc.), buildings and improvements, and infrastructure assets (street systems, storm drains, sewer systems, etc.), are reported in Governmental Activities column of the Government-wide Financial Statements. Capital assets are defined by the City as all land; buildings and improvements with an initial individual cost of more than $10,000; vehicles, computers and equipment with an initial individual cost of more than $5,000; and improvements and infrastructure assets with costs of more than $100,000. Such assets are recorded at historical cost or estimated historical cost if purchased or constructed. Donated or annexed capital assets are recorded at estimated market value at the date of donation or annexation.
The costs of normal maintenance and repairs that do not add to the value of the asset or materially extend assets lives are not capitalized. Depreciation is recorded in the Government-wide Financial Statements on a straight-line basis over the useful life of the assets as follows:
Buildings and improvements 25 to 50 yearsVehicles, computers, and equipment 3 to 20 yearsInfrastructure Assets
Roadway Network 7 to 100 yearsDrain Network 20 to 100 yearsParks and Recreation Network 50 years
J. Deferred Revenue
Deferred revenue is recorded for monies collected in advance that have not been earned. In the fund financial statements revenue is also deferred when the availability criteria has not been met. As of June 30, 2006, the total unearned revenue amounted to $507,044 and unavailable revenue amounted to $178, 941.
K. Long-Term Debt
In the government-wide financial statements, long-term debt and other long-term obligations are reported as liabilities in the statement of net assets. Bonds payable are reported net of the applicable bond premium or discount. Bond issuance costs are reported as deferred charges and amortized over the term of the related debt. In the fund financial statements, governmental fund types recognize bond premiums and discounts, as well as bond issuance costs, during the current period. The face amounts of debt issuances are reported as other financing sources. Issuance costs, whether or not withheld from the actual net proceeds received, are reported as debt service expenditures.
CITY OF MOORPARK NOTES TO FINANCIAL STATEMENTS JUNE 30, 2006
37
NOTE #1 – SUMMARY OF SIGNIFICANT ACCOUNTING POLICIES, Continued L. Employee Compensated Absences
City employees may receive from 20 to 30 days vacation time or annual leave each year, depending upon length of service. An employee may accumulate earned vacation time up to a maximum of 760 hours or annual leave up to a maximum of 784 hours and admin leave up to a maximum of 120 hours, depending on position. Upon termination, employees are paid the full value of their unused annual leave, administrative leave, vacation time, and a portion of sick leave per management benefits resolution and City’s MOA. There is no fixed payment schedule for employee compensated absences. Employees receive vacation and sick leave or annual leave, but not both categories.
M. Property Taxes
The duties of assessing and collecting property taxes are performed by the Ventura County (the County) Assessor and Tax Collector, respectively. The City receives an allocation of property taxes collected by the County with respect to property located within the City limits equal to 7.40% of the one percent State levy. The Redevelopment Agency receives incremental property taxes on property within its project area over the base-assessed valuation at the date the project area was established. Tax levies cover the period from July 1 to June 30 of each year. All tax liens are attached annually on the first day in January preceding the fiscal year for which the taxes are levied. Taxes are levied on both real and personal property, as it exists on that date.
Secured property taxes are levied against real property and are due and payable in two equal installments. The first installment is due on November 1 and becomes delinquent if not paid by December 10. The second installment is due on February 1 and becomes delinquent if not paid by April 10. Unsecured personal property taxes are due on July 1 each year. These taxes become delinquent if not paid by August 31.
N. Claims and Judgments
When it is probable that a claim liability has been incurred, and the amount of the loss can be reasonably estimated, the City records the estimated loss, net of any insurance coverage under its self-insurance program. At June 30, 2006, in the opinion of the City Attorney, the City had no material claims, which require loss provisions in the financial statements. Small claims and judgments are recorded as expenditures when paid.
The City’s self-insurance program is administered through the California Joint Powers Authority (the CJPIA), which is described in Note #11. The CJPIA is a public entity risk pool, which is accounted for under the provisions of GASB Statement No. 10. Claim losses recorded in the CJPIA include both current claims and Incurred But Not Reported claims (IBNR). Deposits to the CJPIA are recorded by the City as insurance expenditures in the General Fund when paid. These deposits are subject to retrospective adjustment. Favorable claims experience result in a refund of deposits from the CJPIA and such refunds, if any, are recorded as a reduction of insurance expenditures in the year received. Adverse claims experience result in the payment of additional deposits and such deposits, if any, are recorded as insurance expenditures when paid.
CITY OF MOORPARK NOTES TO FINANCIAL STATEMENTS JUNE 30, 2006
38
NOTE #1 – SUMMARY OF SIGNIFICANT ACCOUNTING POLICIES, Continued O. Deferred Compensation
In October 1997, GASB Statement No. 32, Accounting and Financial Reporting for Internal Revenue Code Section 457 Deferred Compensation Plans, was issued. This Statement establishes accounting and financial reporting standards for Internal Revenue Code (IRC) section 457 deferred compensation plans of state and local governments. Pursuant to the IRC 457 subsection (g); all amounts of compensation deferred under the plan, all property, or rights are solely the property and rights of the employee and beneficiaries of the Plan. Deferred compensation funds are not subject to the claims of the City’s general creditors. The City has established an eligible deferred compensation plan in accordance with subsection (g) of the IRC Section 457. Under the provisions of this Statement, it is no longer considered appropriate to report the Section 457 plan in the City’s financial statements.
P. New Pronouncements GASB Statement No. 43 - In April 2004, the GASB issued Statement No. 43, Financial Reporting for Postemployment Benefit Plans Other Than Pension Plans. This statement establishes accounting and financial reporting standards for plans that provide postemployment benefits other than pension benefits (known as other postemployment benefits or OPEB). This statement is not effective until June 30, 2007. This statement is not expected to have a significant impact on the financial statements of the City. GASB Statement No. 45 - In June 2004, the GASB issued Statement No. 45, Accounting and Financial Reporting by Employers for Postemployment Benefits Other Than Pensions. This Statement establishes standards for the measurement, recognition, and display of OPEB expense/expenditures and related liabilities (assets), note disclosures, and, if applicable, required supplementary information (RSI) in the financial reports of state and local governmental employers. This statement is not effective until June 30, 2008. The City has not determined its effect on the financial statements.
Q. Estimates The preparation of financial statements in conformity with accounting principles generally accepted in the United States of America requires management to make estimates and assumptions that effect certain reported amounts and disclosures. Accordingly, actual results could differ from those estimates.
R. Use of Restricted Resources
When both restricted and unrestricted resources are available for use, it is the City’s policy to use restricted resources first, and then unrestricted resources as they are needed.
CITY OF MOORPARK NOTES TO FINANCIAL STATEMENTS JUNE 30, 2006
39
NOTE #2 – CASH AND INVESTMENTS
Cash and investments at June 30, 2006, consisted of the following:
City Treasury DepositsDemand deposits 548,411$ Cash on hand 1,100
Total City Treasury Deposits 549,511
City Treasury InvestmentsCertificates of Deposit 1,599,000 LAIF 53,946,924 Ventura County Pool 6,649,994 U.S. Treasury Obligations 5,922,900 U.S. Agency Securities 14,910,770
Total City Treasury Investments 83,029,588
Cash and Investments With Fiscal AgentMoney Markets 38,255Guaranteed Investment Contracts 1,355,774
Total Cash and Investments With Fiscal Agent 1,394,029 Total Cash and Investments 84,973,128$
Cash and investments are reported in the basic financial statements as follows:
Statement of Statement of Net Assets Fiduciary Net Assets
GovernmentalActivities Agency Fund Total
Cash and Investments 78,988,682$ 4,590,417$ 83,579,099$ Restricted cash and investments 1,394,029 1,394,029
Total 80,382,711$ 4,590,417$ 84,973,128$
The City follows the practice of pooling cash and investments of all funds, except for funds required to be held by fiscal agents under the provisions of bond indentures. Interest income earned on pooled cash and investments is allocated on a quarterly basis to the various funds based on average daily cash and investment balances. Interest income from cash and investments with fiscal agents is credited directly to the related fund.
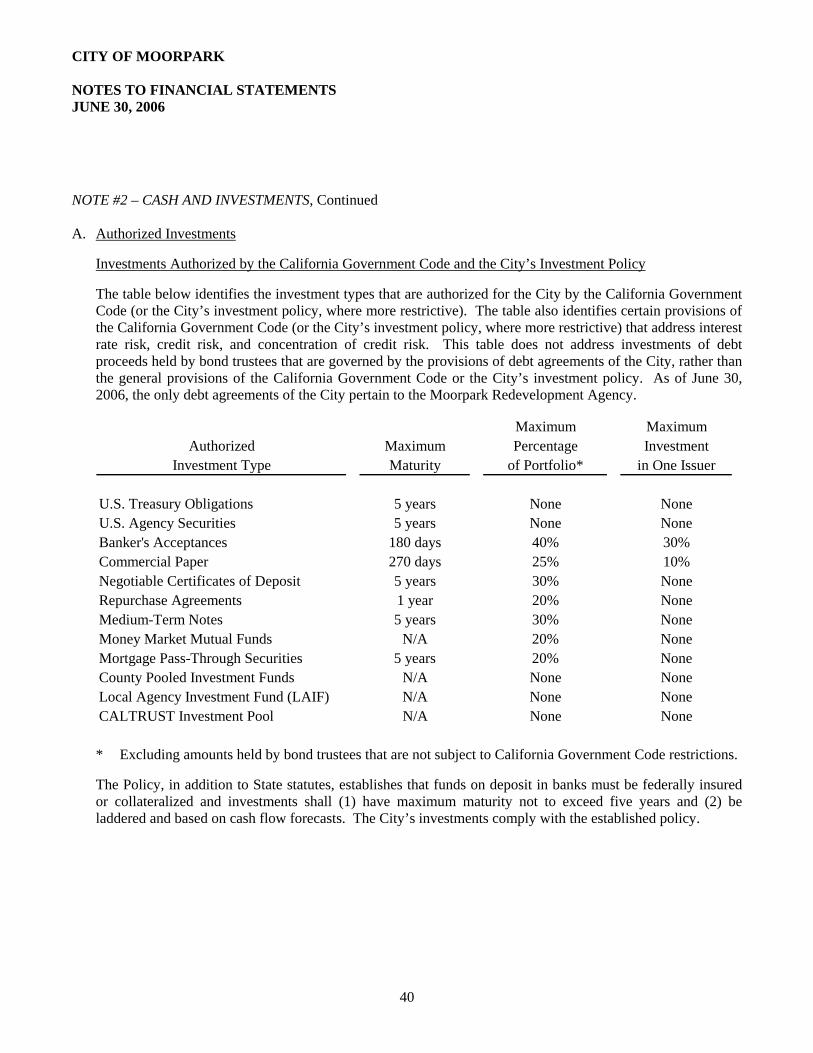
CITY OF MOORPARK NOTES TO FINANCIAL STATEMENTS JUNE 30, 2006
40
NOTE #2 – CASH AND INVESTMENTS, Continued A. Authorized Investments
Investments Authorized by the California Government Code and the City’s Investment Policy
The table below identifies the investment types that are authorized for the City by the California Government Code (or the City’s investment policy, where more restrictive). The table also identifies certain provisions of the California Government Code (or the City’s investment policy, where more restrictive) that address interest rate risk, credit risk, and concentration of credit risk. This table does not address investments of debt proceeds held by bond trustees that are governed by the provisions of debt agreements of the City, rather than the general provisions of the California Government Code or the City’s investment policy. As of June 30, 2006, the only debt agreements of the City pertain to the Moorpark Redevelopment Agency.
Maximum Maximum
Authorized Maximum Percentage InvestmentInvestment Type Maturity of Portfolio* in One Issuer
U.S. Treasury Obligations 5 years None NoneU.S. Agency Securities 5 years None NoneBanker's Acceptances 180 days 40% 30%Commercial Paper 270 days 25% 10%Negotiable Certificates of Deposit 5 years 30% NoneRepurchase Agreements 1 year 20% NoneMedium-Term Notes 5 years 30% NoneMoney Market Mutual Funds N/A 20% NoneMortgage Pass-Through Securities 5 years 20% NoneCounty Pooled Investment Funds N/A None NoneLocal Agency Investment Fund (LAIF) N/A None NoneCALTRUST Investment Pool N/A None None
* Excluding amounts held by bond trustees that are not subject to California Government Code restrictions.
The Policy, in addition to State statutes, establishes that funds on deposit in banks must be federally insured or collateralized and investments shall (1) have maximum maturity not to exceed five years and (2) be laddered and based on cash flow forecasts. The City’s investments comply with the established policy.
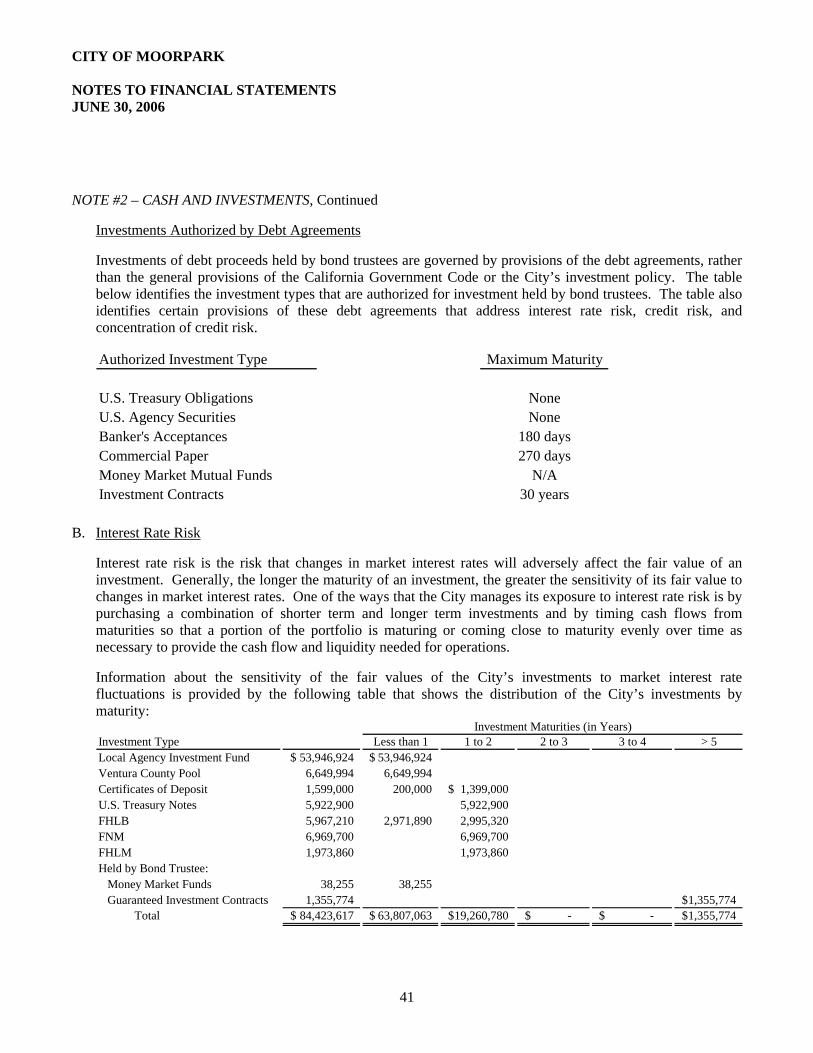
CITY OF MOORPARK NOTES TO FINANCIAL STATEMENTS JUNE 30, 2006
41
NOTE #2 – CASH AND INVESTMENTS, Continued
Investments Authorized by Debt Agreements
Investments of debt proceeds held by bond trustees are governed by provisions of the debt agreements, rather than the general provisions of the California Government Code or the City’s investment policy. The table below identifies the investment types that are authorized for investment held by bond trustees. The table also identifies certain provisions of these debt agreements that address interest rate risk, credit risk, and concentration of credit risk.
Authorized Investment Type Maximum Maturity
U.S. Treasury Obligations NoneU.S. Agency Securities NoneBanker's Acceptances 180 daysCommercial Paper 270 daysMoney Market Mutual Funds N/AInvestment Contracts 30 years
B. Interest Rate Risk
Interest rate risk is the risk that changes in market interest rates will adversely affect the fair value of an investment. Generally, the longer the maturity of an investment, the greater the sensitivity of its fair value to changes in market interest rates. One of the ways that the City manages its exposure to interest rate risk is by purchasing a combination of shorter term and longer term investments and by timing cash flows from maturities so that a portion of the portfolio is maturing or coming close to maturity evenly over time as necessary to provide the cash flow and liquidity needed for operations.
Information about the sensitivity of the fair values of the City’s investments to market interest rate fluctuations is provided by the following table that shows the distribution of the City’s investments by maturity:
Investment Type Less than 1 1 to 2 2 to 3 3 to 4 > 5Local Agency Investment Fund 53,946,924$ 53,946,924$ Ventura County Pool 6,649,994 6,649,994 Certificates of Deposit 1,599,000 200,000 1,399,000$ U.S. Treasury Notes 5,922,900 5,922,900 FHLB 5,967,210 2,971,890 2,995,320 FNM 6,969,700 6,969,700 FHLM 1,973,860 1,973,860 Held by Bond Trustee:
Money Market Funds 38,255 38,255 Guaranteed Investment Contracts 1,355,774 1,355,774$
Total 84,423,617$ 63,807,063$ 19,260,780$ -$ -$ 1,355,774$
Investment Maturities (in Years)
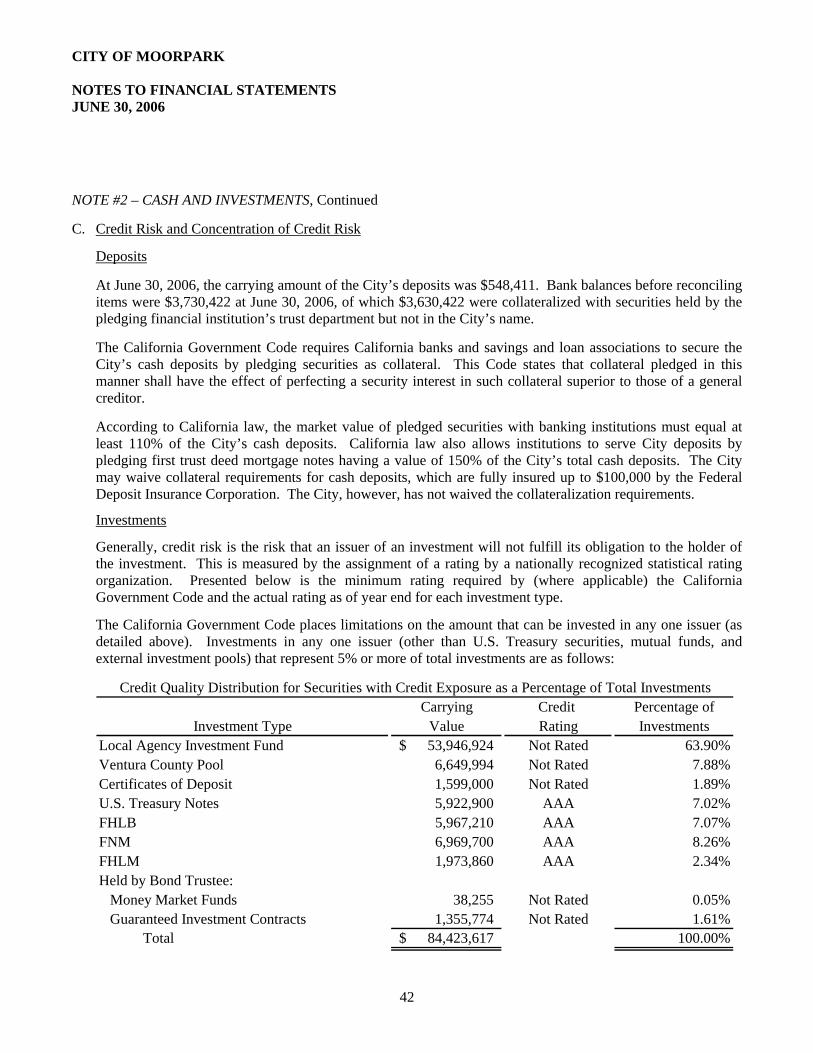
CITY OF MOORPARK NOTES TO FINANCIAL STATEMENTS JUNE 30, 2006
42
NOTE #2 – CASH AND INVESTMENTS, Continued C. Credit Risk and Concentration of Credit Risk
Deposits
At June 30, 2006, the carrying amount of the City’s deposits was $548,411. Bank balances before reconciling items were $3,730,422 at June 30, 2006, of which $3,630,422 were collateralized with securities held by the pledging financial institution’s trust department but not in the City’s name.
The California Government Code requires California banks and savings and loan associations to secure the City’s cash deposits by pledging securities as collateral. This Code states that collateral pledged in this manner shall have the effect of perfecting a security interest in such collateral superior to those of a general creditor.
According to California law, the market value of pledged securities with banking institutions must equal at least 110% of the City’s cash deposits. California law also allows institutions to serve City deposits by pledging first trust deed mortgage notes having a value of 150% of the City’s total cash deposits. The City may waive collateral requirements for cash deposits, which are fully insured up to $100,000 by the Federal Deposit Insurance Corporation. The City, however, has not waived the collateralization requirements.
Investments
Generally, credit risk is the risk that an issuer of an investment will not fulfill its obligation to the holder of the investment. This is measured by the assignment of a rating by a nationally recognized statistical rating organization. Presented below is the minimum rating required by (where applicable) the California Government Code and the actual rating as of year end for each investment type.
The California Government Code places limitations on the amount that can be invested in any one issuer (as detailed above). Investments in any one issuer (other than U.S. Treasury securities, mutual funds, and external investment pools) that represent 5% or more of total investments are as follows:
Carrying Credit Percentage ofInvestment Type Value Rating Investments
Local Agency Investment Fund 53,946,924$ Not Rated 63.90%Ventura County Pool 6,649,994 Not Rated 7.88%Certificates of Deposit 1,599,000 Not Rated 1.89%U.S. Treasury Notes 5,922,900 AAA 7.02%FHLB 5,967,210 AAA 7.07%FNM 6,969,700 AAA 8.26%FHLM 1,973,860 AAA 2.34%Held by Bond Trustee:
Money Market Funds 38,255 Not Rated 0.05%Guaranteed Investment Contracts 1,355,774 Not Rated 1.61%
Total 84,423,617$ 100.00%
Credit Quality Distribution for Securities with Credit Exposure as a Percentage of Total Investments
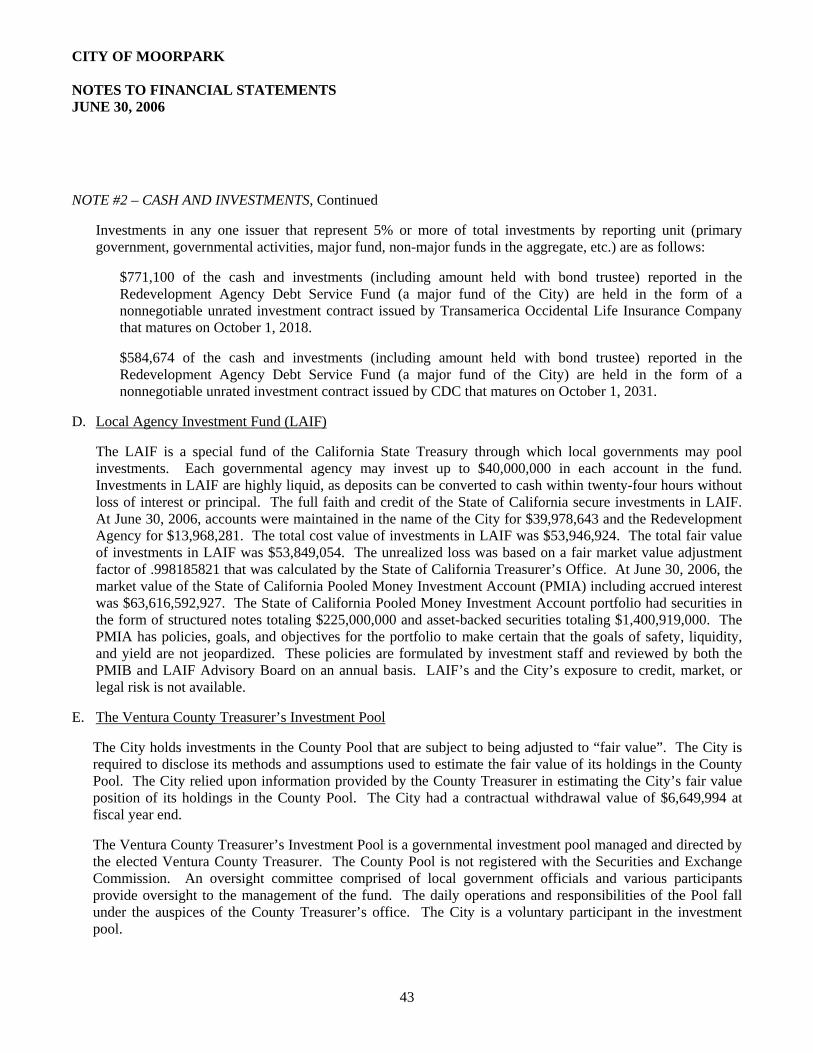
CITY OF MOORPARK NOTES TO FINANCIAL STATEMENTS JUNE 30, 2006
43
NOTE #2 – CASH AND INVESTMENTS, Continued
Investments in any one issuer that represent 5% or more of total investments by reporting unit (primary government, governmental activities, major fund, non-major funds in the aggregate, etc.) are as follows:
$771,100 of the cash and investments (including amount held with bond trustee) reported in the Redevelopment Agency Debt Service Fund (a major fund of the City) are held in the form of a nonnegotiable unrated investment contract issued by Transamerica Occidental Life Insurance Company that matures on October 1, 2018.
$584,674 of the cash and investments (including amount held with bond trustee) reported in the Redevelopment Agency Debt Service Fund (a major fund of the City) are held in the form of a nonnegotiable unrated investment contract issued by CDC that matures on October 1, 2031.
D. Local Agency Investment Fund (LAIF)
The LAIF is a special fund of the California State Treasury through which local governments may pool investments. Each governmental agency may invest up to $40,000,000 in each account in the fund. Investments in LAIF are highly liquid, as deposits can be converted to cash within twenty-four hours without loss of interest or principal. The full faith and credit of the State of California secure investments in LAIF. At June 30, 2006, accounts were maintained in the name of the City for $39,978,643 and the Redevelopment Agency for $13,968,281. The total cost value of investments in LAIF was $53,946,924. The total fair value of investments in LAIF was $53,849,054. The unrealized loss was based on a fair market value adjustment factor of .998185821 that was calculated by the State of California Treasurer’s Office. At June 30, 2006, the market value of the State of California Pooled Money Investment Account (PMIA) including accrued interest was $63,616,592,927. The State of California Pooled Money Investment Account portfolio had securities in the form of structured notes totaling $225,000,000 and asset-backed securities totaling $1,400,919,000. The PMIA has policies, goals, and objectives for the portfolio to make certain that the goals of safety, liquidity, and yield are not jeopardized. These policies are formulated by investment staff and reviewed by both the PMIB and LAIF Advisory Board on an annual basis. LAIF’s and the City’s exposure to credit, market, or legal risk is not available.
E. The Ventura County Treasurer’s Investment Pool
The City holds investments in the County Pool that are subject to being adjusted to “fair value”. The City is required to disclose its methods and assumptions used to estimate the fair value of its holdings in the County Pool. The City relied upon information provided by the County Treasurer in estimating the City’s fair value position of its holdings in the County Pool. The City had a contractual withdrawal value of $6,649,994 at fiscal year end.
The Ventura County Treasurer’s Investment Pool is a governmental investment pool managed and directed by the elected Ventura County Treasurer. The County Pool is not registered with the Securities and Exchange Commission. An oversight committee comprised of local government officials and various participants provide oversight to the management of the fund. The daily operations and responsibilities of the Pool fall under the auspices of the County Treasurer’s office. The City is a voluntary participant in the investment pool.
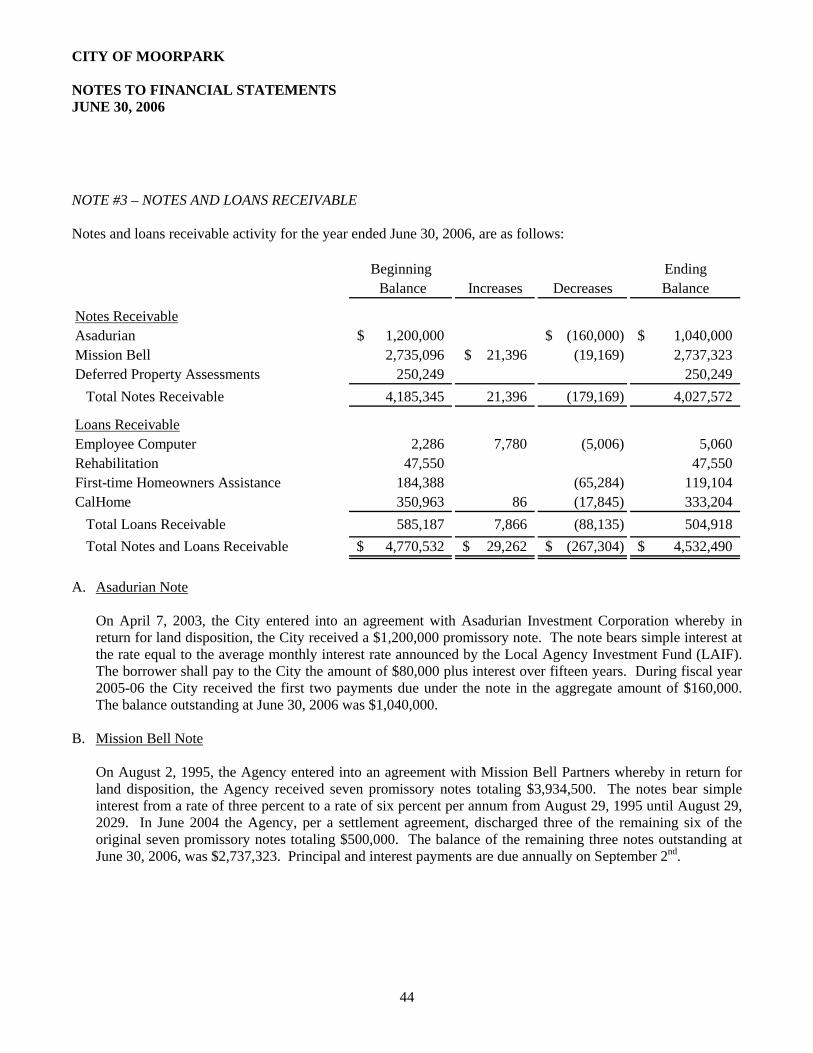
CITY OF MOORPARK NOTES TO FINANCIAL STATEMENTS JUNE 30, 2006
44
NOTE #3 – NOTES AND LOANS RECEIVABLE Notes and loans receivable activity for the year ended June 30, 2006, are as follows:
Beginning Ending Balance Increases Decreases Balance
Notes ReceivableAsadurian 1,200,000$ (160,000)$ 1,040,000$ Mission Bell 2,735,096 21,396$ (19,169) 2,737,323 Deferred Property Assessments 250,249 250,249
Total Notes Receivable 4,185,345 21,396 (179,169) 4,027,572
Loans ReceivableEmployee Computer 2,286 7,780 (5,006) 5,060 Rehabilitation 47,550 47,550 First-time Homeowners Assistance 184,388 (65,284) 119,104 CalHome 350,963 86 (17,845) 333,204
Total Loans Receivable 585,187 7,866 (88,135) 504,918Total Notes and Loans Receivable 4,770,532$ 29,262$ (267,304)$ 4,532,490$
A. Asadurian Note
On April 7, 2003, the City entered into an agreement with Asadurian Investment Corporation whereby in return for land disposition, the City received a $1,200,000 promissory note. The note bears simple interest at the rate equal to the average monthly interest rate announced by the Local Agency Investment Fund (LAIF). The borrower shall pay to the City the amount of $80,000 plus interest over fifteen years. During fiscal year 2005-06 the City received the first two payments due under the note in the aggregate amount of $160,000. The balance outstanding at June 30, 2006 was $1,040,000.
B. Mission Bell Note
On August 2, 1995, the Agency entered into an agreement with Mission Bell Partners whereby in return for land disposition, the Agency received seven promissory notes totaling $3,934,500. The notes bear simple interest from a rate of three percent to a rate of six percent per annum from August 29, 1995 until August 29, 2029. In June 2004 the Agency, per a settlement agreement, discharged three of the remaining six of the original seven promissory notes totaling $500,000. The balance of the remaining three notes outstanding at June 30, 2006, was $2,737,323. Principal and interest payments are due annually on September 2nd.
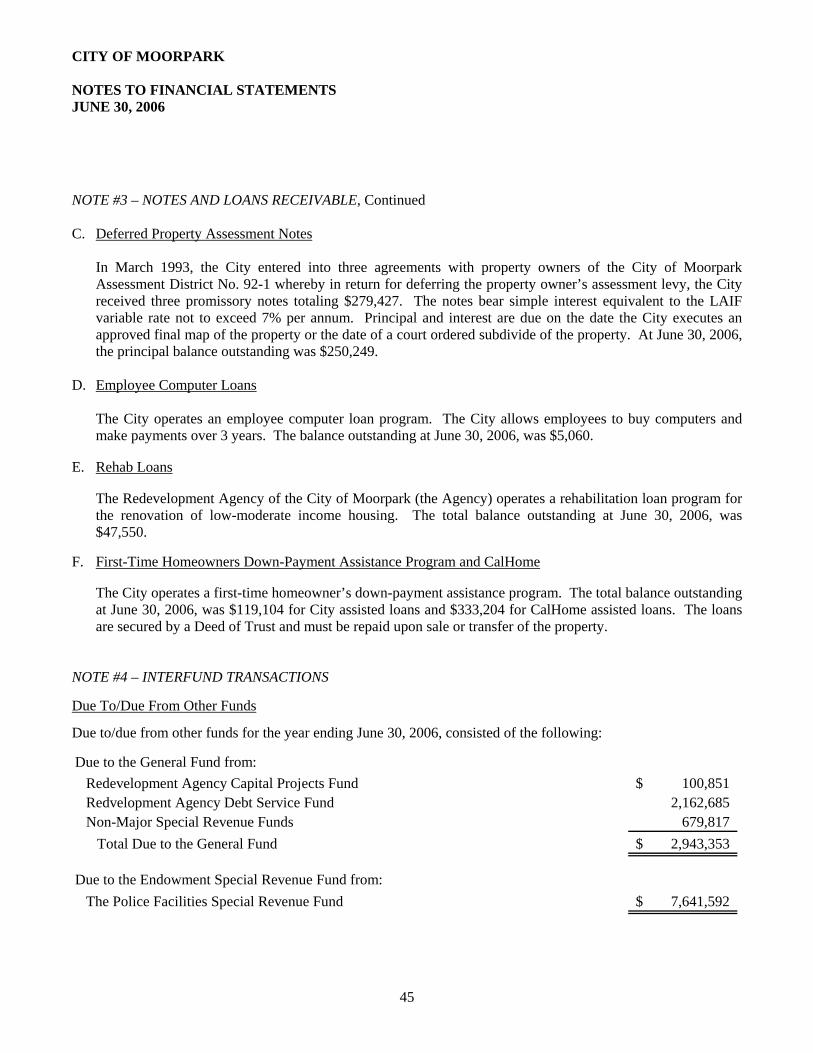
CITY OF MOORPARK NOTES TO FINANCIAL STATEMENTS JUNE 30, 2006
45
NOTE #3 – NOTES AND LOANS RECEIVABLE, Continued C. Deferred Property Assessment Notes
In March 1993, the City entered into three agreements with property owners of the City of Moorpark Assessment District No. 92-1 whereby in return for deferring the property owner’s assessment levy, the City received three promissory notes totaling $279,427. The notes bear simple interest equivalent to the LAIF variable rate not to exceed 7% per annum. Principal and interest are due on the date the City executes an approved final map of the property or the date of a court ordered subdivide of the property. At June 30, 2006, the principal balance outstanding was $250,249.
D. Employee Computer Loans The City operates an employee computer loan program. The City allows employees to buy computers and make payments over 3 years. The balance outstanding at June 30, 2006, was $5,060.
E. Rehab Loans
The Redevelopment Agency of the City of Moorpark (the Agency) operates a rehabilitation loan program for the renovation of low-moderate income housing. The total balance outstanding at June 30, 2006, was $47,550.
F. First-Time Homeowners Down-Payment Assistance Program and CalHome
The City operates a first-time homeowner’s down-payment assistance program. The total balance outstanding at June 30, 2006, was $119,104 for City assisted loans and $333,204 for CalHome assisted loans. The loans are secured by a Deed of Trust and must be repaid upon sale or transfer of the property.
NOTE #4 – INTERFUND TRANSACTIONS Due To/Due From Other Funds Due to/due from other funds for the year ending June 30, 2006, consisted of the following: Due to the General Fund from:
Redevelopment Agency Capital Projects Fund 100,851$ Redvelopment Agency Debt Service Fund 2,162,685 Non-Major Special Revenue Funds 679,817
Total Due to the General Fund 2,943,353$
Due to the Endowment Special Revenue Fund from:The Police Facilities Special Revenue Fund 7,641,592$
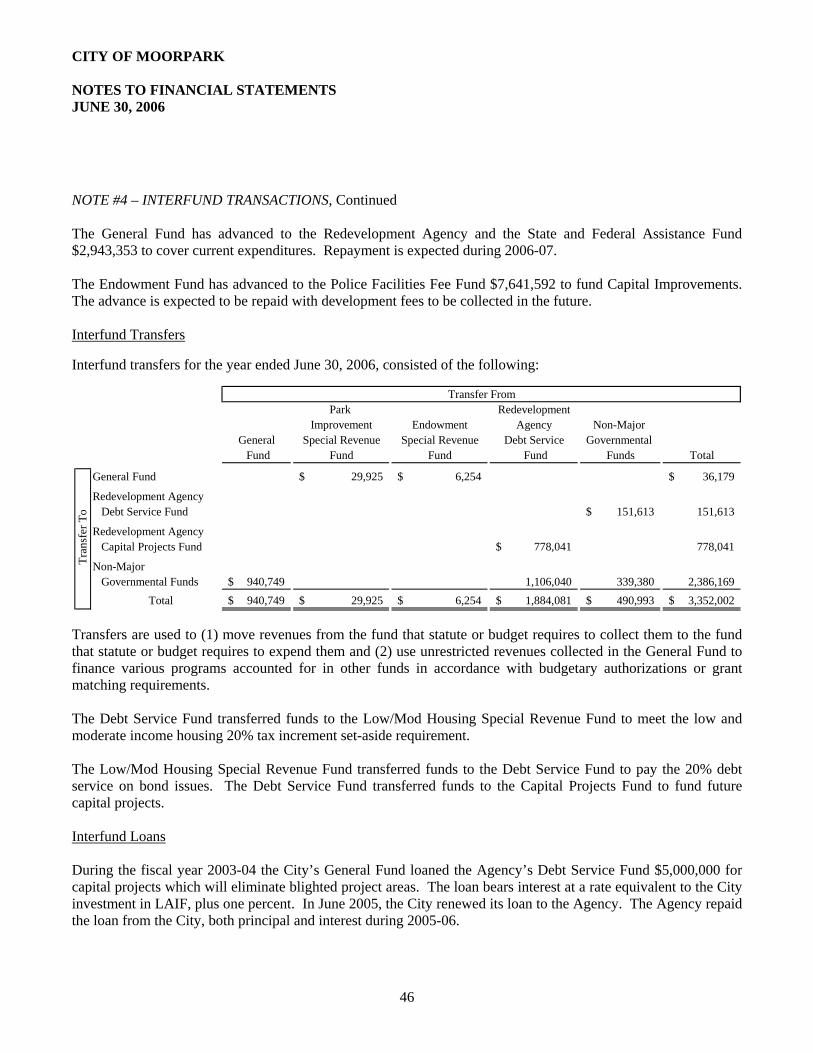
CITY OF MOORPARK NOTES TO FINANCIAL STATEMENTS JUNE 30, 2006
46
NOTE #4 – INTERFUND TRANSACTIONS, Continued The General Fund has advanced to the Redevelopment Agency and the State and Federal Assistance Fund $2,943,353 to cover current expenditures. Repayment is expected during 2006-07. The Endowment Fund has advanced to the Police Facilities Fee Fund $7,641,592 to fund Capital Improvements. The advance is expected to be repaid with development fees to be collected in the future. Interfund Transfers Interfund transfers for the year ended June 30, 2006, consisted of the following:
Park RedevelopmentImprovement Endowment Agency Non-Major
General Special Revenue Special Revenue Debt Service Governmental Fund Fund Fund Fund Funds Total
General Fund 29,925$ 6,254$ 36,179$
Redevelopment AgencyDebt Service Fund 151,613$ 151,613
Redevelopment AgencyCapital Projects Fund 778,041$ 778,041
Non-Major Governmental Funds 940,749$ 1,106,040 339,380 2,386,169
Total 940,749$ 29,925$ 6,254$ 1,884,081$ 490,993$ 3,352,002$
Tra
nsfe
r To
Transfer From
Transfers are used to (1) move revenues from the fund that statute or budget requires to collect them to the fund that statute or budget requires to expend them and (2) use unrestricted revenues collected in the General Fund to finance various programs accounted for in other funds in accordance with budgetary authorizations or grant matching requirements. The Debt Service Fund transferred funds to the Low/Mod Housing Special Revenue Fund to meet the low and moderate income housing 20% tax increment set-aside requirement. The Low/Mod Housing Special Revenue Fund transferred funds to the Debt Service Fund to pay the 20% debt service on bond issues. The Debt Service Fund transferred funds to the Capital Projects Fund to fund future capital projects. Interfund Loans During the fiscal year 2003-04 the City’s General Fund loaned the Agency’s Debt Service Fund $5,000,000 for capital projects which will eliminate blighted project areas. The loan bears interest at a rate equivalent to the City investment in LAIF, plus one percent. In June 2005, the City renewed its loan to the Agency. The Agency repaid the loan from the City, both principal and interest during 2005-06.
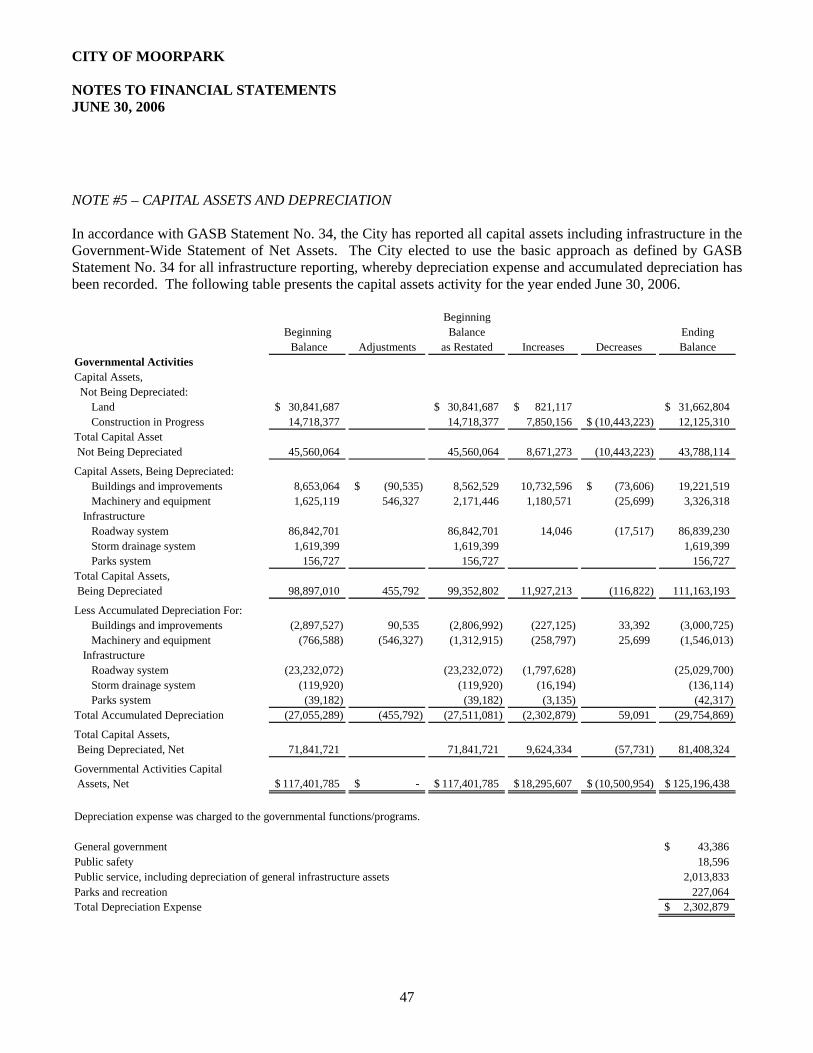
CITY OF MOORPARK NOTES TO FINANCIAL STATEMENTS JUNE 30, 2006
47
NOTE #5 – CAPITAL ASSETS AND DEPRECIATION In accordance with GASB Statement No. 34, the City has reported all capital assets including infrastructure in the Government-Wide Statement of Net Assets. The City elected to use the basic approach as defined by GASB Statement No. 34 for all infrastructure reporting, whereby depreciation expense and accumulated depreciation has been recorded. The following table presents the capital assets activity for the year ended June 30, 2006.
BeginningBeginning Balance Ending Balance Adjustments as Restated Increases Decreases Balance
Governmental ActivitiesCapital Assets, Not Being Depreciated:
Land 30,841,687$ 30,841,687$ 821,117$ 31,662,804$ Construction in Progress 14,718,377 14,718,377 7,850,156 (10,443,223)$ 12,125,310
Total Capital Asset Not Being Depreciated 45,560,064 45,560,064 8,671,273 (10,443,223) 43,788,114
Capital Assets, Being Depreciated:Buildings and improvements 8,653,064 (90,535)$ 8,562,529 10,732,596 (73,606)$ 19,221,519 Machinery and equipment 1,625,119 546,327 2,171,446 1,180,571 (25,699) 3,326,318
InfrastructureRoadway system 86,842,701 86,842,701 14,046 (17,517) 86,839,230 Storm drainage system 1,619,399 1,619,399 1,619,399 Parks system 156,727 156,727 156,727
Total Capital Assets, Being Depreciated 98,897,010 455,792 99,352,802 11,927,213 (116,822) 111,163,193
Less Accumulated Depreciation For:Buildings and improvements (2,897,527) 90,535 (2,806,992) (227,125) 33,392 (3,000,725) Machinery and equipment (766,588) (546,327) (1,312,915) (258,797) 25,699 (1,546,013)
InfrastructureRoadway system (23,232,072) (23,232,072) (1,797,628) (25,029,700) Storm drainage system (119,920) (119,920) (16,194) (136,114) Parks system (39,182) (39,182) (3,135) (42,317)
Total Accumulated Depreciation (27,055,289) (455,792) (27,511,081) (2,302,879) 59,091 (29,754,869)
Total Capital Assets, Being Depreciated, Net 71,841,721 71,841,721 9,624,334 (57,731) 81,408,324
Governmental Activities Capital Assets, Net 117,401,785$ -$ 117,401,785$ 18,295,607$ (10,500,954)$ 125,196,438$
Depreciation expense was charged to the governmental functions/programs.
General government 43,386$ Public safety 18,596 Public service, including depreciation of general infrastructure assets 2,013,833 Parks and recreation 227,064 Total Depreciation Expense 2,302,879$
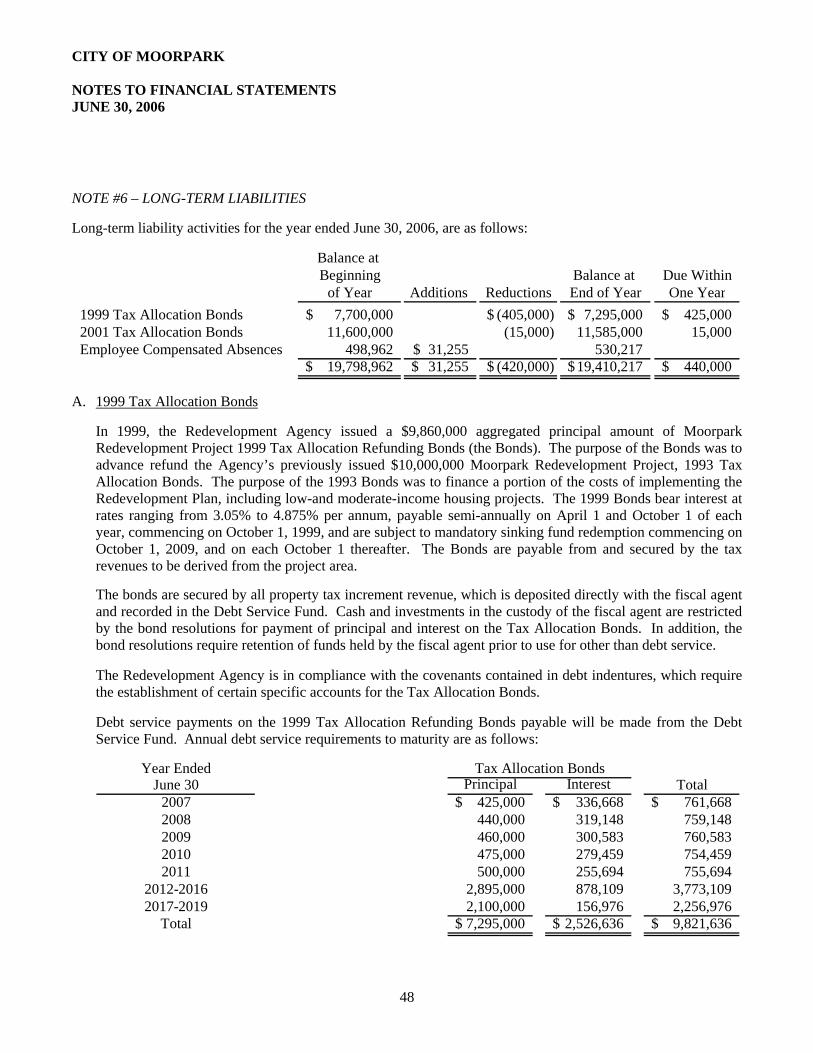
CITY OF MOORPARK NOTES TO FINANCIAL STATEMENTS JUNE 30, 2006
48
NOTE #6 – LONG-TERM LIABILITIES Long-term liability activities for the year ended June 30, 2006, are as follows:
Balance at Beginning Balance at Due Within
of Year Additions Reductions End of Year One Year1999 Tax Allocation Bonds 7,700,000$ (405,000)$ 7,295,000$ 425,000$ 2001 Tax Allocation Bonds 11,600,000 (15,000) 11,585,000 15,000 Employee Compensated Absences 498,962 31,255$ 530,217
19,798,962$ 31,255$ (420,000)$ 19,410,217$ 440,000$
A. 1999 Tax Allocation Bonds
In 1999, the Redevelopment Agency issued a $9,860,000 aggregated principal amount of Moorpark Redevelopment Project 1999 Tax Allocation Refunding Bonds (the Bonds). The purpose of the Bonds was to advance refund the Agency’s previously issued $10,000,000 Moorpark Redevelopment Project, 1993 Tax Allocation Bonds. The purpose of the 1993 Bonds was to finance a portion of the costs of implementing the Redevelopment Plan, including low-and moderate-income housing projects. The 1999 Bonds bear interest at rates ranging from 3.05% to 4.875% per annum, payable semi-annually on April 1 and October 1 of each year, commencing on October 1, 1999, and are subject to mandatory sinking fund redemption commencing on October 1, 2009, and on each October 1 thereafter. The Bonds are payable from and secured by the tax revenues to be derived from the project area.
The bonds are secured by all property tax increment revenue, which is deposited directly with the fiscal agent and recorded in the Debt Service Fund. Cash and investments in the custody of the fiscal agent are restricted by the bond resolutions for payment of principal and interest on the Tax Allocation Bonds. In addition, the bond resolutions require retention of funds held by the fiscal agent prior to use for other than debt service.
The Redevelopment Agency is in compliance with the covenants contained in debt indentures, which require the establishment of certain specific accounts for the Tax Allocation Bonds.
Debt service payments on the 1999 Tax Allocation Refunding Bonds payable will be made from the Debt Service Fund. Annual debt service requirements to maturity are as follows:
Year EndedJune 30 Principal Interest Total
2007 425,000$ 336,668$ 761,668$ 2008 440,000 319,148 759,148 2009 460,000 300,583 760,583 2010 475,000 279,459 754,459 2011 500,000 255,694 755,694
2012-2016 2,895,000 878,109 3,773,109 2017-2019 2,100,000 156,976 2,256,976
Total 7,295,000$ 2,526,636$ 9,821,636$
Tax Allocation Bonds
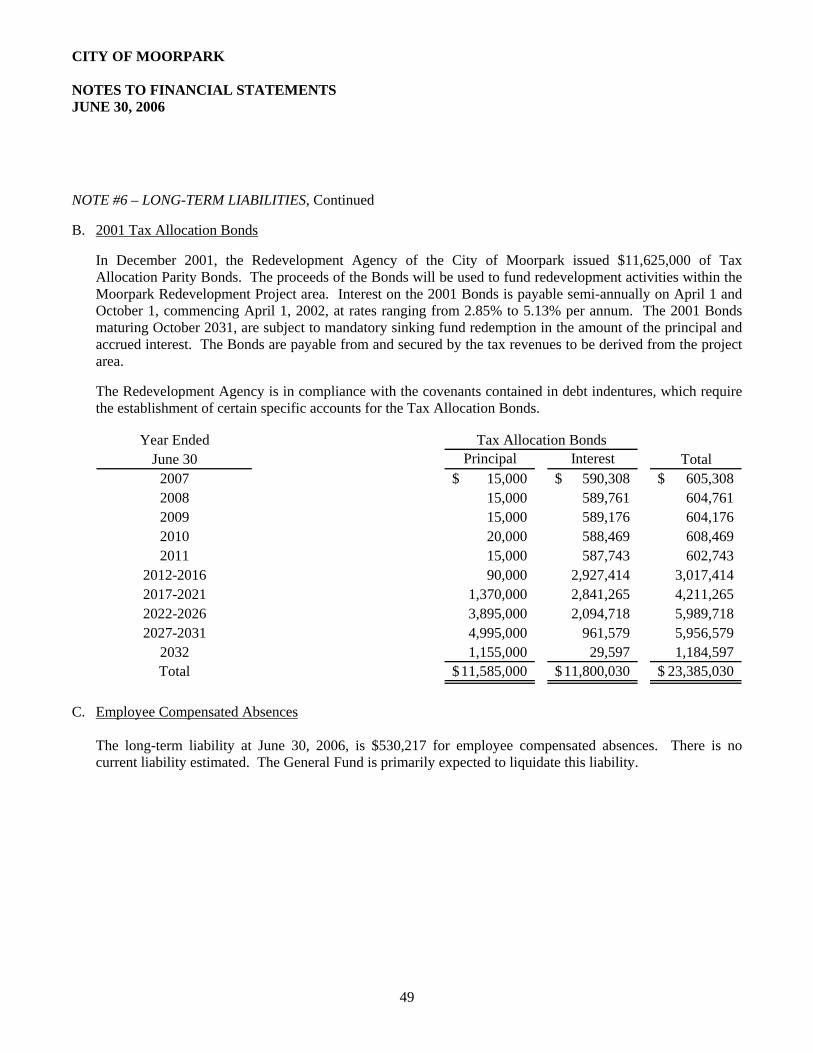
CITY OF MOORPARK NOTES TO FINANCIAL STATEMENTS JUNE 30, 2006
49
NOTE #6 – LONG-TERM LIABILITIES, Continued B. 2001 Tax Allocation Bonds
In December 2001, the Redevelopment Agency of the City of Moorpark issued $11,625,000 of Tax Allocation Parity Bonds. The proceeds of the Bonds will be used to fund redevelopment activities within the Moorpark Redevelopment Project area. Interest on the 2001 Bonds is payable semi-annually on April 1 and October 1, commencing April 1, 2002, at rates ranging from 2.85% to 5.13% per annum. The 2001 Bonds maturing October 2031, are subject to mandatory sinking fund redemption in the amount of the principal and accrued interest. The Bonds are payable from and secured by the tax revenues to be derived from the project area. The Redevelopment Agency is in compliance with the covenants contained in debt indentures, which require the establishment of certain specific accounts for the Tax Allocation Bonds.
Year EndedJune 30 Principal Interest Total
2007 15,000$ 590,308$ 605,308$ 2008 15,000 589,761 604,761 2009 15,000 589,176 604,176 2010 20,000 588,469 608,469 2011 15,000 587,743 602,743
2012-2016 90,000 2,927,414 3,017,414 2017-2021 1,370,000 2,841,265 4,211,265 2022-2026 3,895,000 2,094,718 5,989,718 2027-2031 4,995,000 961,579 5,956,579
2032 1,155,000 29,597 1,184,597 Total 11,585,000$ 11,800,030$ 23,385,030$
Tax Allocation Bonds
C. Employee Compensated Absences
The long-term liability at June 30, 2006, is $530,217 for employee compensated absences. There is no current liability estimated. The General Fund is primarily expected to liquidate this liability.
CITY OF MOORPARK NOTES TO FINANCIAL STATEMENTS JUNE 30, 2006
50
NOTE #7 – AGREEMENTS WITH VARIOUS TAXING AGENCIES The Moorpark Redevelopment Agency has entered into five (5) agreements for allocation and distribution of tax increment revenues: The first agreement is with the County of Ventura, Ventura County Library District, Ventura County Fire Protection District, and Ventura County Flood Control District (collectively, the “County Taxing Entities”), which provide for the Agency to retain 100% of the County Taxing Entities share (55.82%) of annual tax increment revenues up to $1,750,000. For annual tax increment revenue in excess of $1,750,000, the Agency shall distribute 55.82% of such revenues to the County on behalf of the County Taxing Entities. The County Taxing Entities have agreed to defer payments in the initial years of the Redevelopment Plan, and consequently, the parties agree that the County Taxing Entities may receive payments in any single fiscal year in excess of the amount of tax revenues the County Taxing Entities would otherwise be entitled to, but for the adoption of the Redevelopment Plan. Additionally, the agreement calls for the Agency to receive a $1,000,000 payment from the tax increment disbursed to the County pursuant to the agreement, by December 31, 2008, if and only if the Agency’s annual debt statements which are filed with the County Auditor-Controller from fiscal year 1993-94 to fiscal year 2008-09 list debts in an amount equal to or in excess of the maximum tax increment available to the Agency in each of such fiscal years. The second agreement is with the City of Moorpark Vector Control, formerly known as the Moorpark Mosquito Abatement District and states that the City of Moorpark Vector Control shall receive 87.5% of its share (1.53%) of annual tax increment revenue. The City of Moorpark Vector Control has agreed to contribute its pro rata share of the Agency’s required annual payment to the Agency. The third agreement is with the Moorpark Unified School District (the School District), and states that the School District shall receive, after the Agency has satisfied debt service payments to bond or note holders or to the holder of any other instruments of Agency indebtedness (provided such indebtedness is not reasonably foreseeable to impair the Agency’s obligation under the agreement), the School District’s share (33.41%) of tax increment revenues generated by an annual two percent increase in assessed valuation, and beginning in fiscal year 1995-96, 14% of the School District’s share of annual tax increment revenue. Additionally, the agreement calls for the Agency to make a one-time $750,000 payment to the School District as a contribution to a new school district maintenance facility. This payment was made by the Agency in August of 1999. Per the agreement between the School District and the RDA of the City of Moorpark, the distributions to the School District shall be expended for the following purposes at school sites in the incorporated boundaries of the City:
1. Telephone systems for new buildings; 2. Computer hardware and educational systems; 3. Land acquisition; 4. Books; and 5. School buildings and facilities and related capital improvements and modernization projects (collectively
“public works”); such public works may include design, inspection and administration costs, but not School District overhead or salary/benefits for regular School District employees.
The Agency may pre-approve other proposed expenditures that are submitted in writing by the School District.
CITY OF MOORPARK NOTES TO FINANCIAL STATEMENTS JUNE 30, 2006
51
NOTE #7 – AGREEMENTS WITH VARIOUS TAXING AGENCIES, Continued The fourth agreement is with the Ventura County Community College District (the Community College District), and states that the Community College District will receive, after the Agency has satisfied debt service payments to bond or note holders or to the holders of any other instruments of Agency indebtedness (provided such indebtedness is not reasonably foreseeable to impair the Agency’s obligation under the agreement), the Community College District’s share (5.81%) of tax increment revenues generated by an annual two percent increase in assessed valuation, and, beginning in fiscal year 1993-94, 14% of the Community College District’s share of annual tax increment revenue. The fifth agreement is with the Ventura County Superintendent of Schools Office (the Superintendent), and states that the Superintendent shall receive its share (2.49%) of tax increment revenues generated by an annual two percent increase in assessed valuation. NOTE #8 – RETIREMENT PLAN A. Plan Description
The City’s defined benefit pension plan (the Plan) provides retirement and disability benefits, annual cost-of-living adjustments, and death benefits to plan members and beneficiaries. The Plan is part of the Public Agency portion of the California Public Employees Retirement System (CalPERS), and agent-multiple-employer plan administered by CalPERS, which acts as a common investment and administrative agent for participating public employers within the State of California. A menu of benefit provisions as well as other requirements are established by State statutes within the Public Employees’ Retirement Law. The City of Moorpark selects optional benefits through local ordinance. CalPERS issues a separate comprehensive annual financial report. Copies of CalPERS’ annual financial report may be obtained from the CalPERS Executive Office – 400 P. Street, Sacramento, CA 95814.
All full-time City employees and the City Council are eligible to participate in the Plan. Part-time employees appointed to a term of one year or longer and who work an average of 20 hours per week are also eligible to participate. Other part-time non-benefited hourly employees do not participate in the Plan. (Effective January 1, 1992, such part-time employees participate in a defined deferred compensation program). Related benefits vest after five years of service. Upon five years of service, employees who retire at or after age 50 are entitled to receive an annual retirement benefit.
The benefit is payable monthly for life, in an amount that varies from 1.426% at age 50 to 2% at age 55 to a maximum of 2.418% at age 63, of the employees’ average of the three highest year’s salary for each year of credited service. The Plan also provides death and disability benefits.
CITY OF MOORPARK NOTES TO FINANCIAL STATEMENTS JUNE 30, 2006
52
NOTE #8 – RETIREMENT PLAN, Continued B. Funding Policy
Active plan members in the Plan are required to contribute 7.00% of their covered salary. The City makes the contribution required of City employees on their behalf. The City is also required to contribute the actuarially determined remaining amounts necessary to fund the benefits for its members. The actuarial methods and assumptions used are those adopted by the CalPERS Board of Administration. The required employer contribution rate for the fiscal year ended June 30, 2006, was 11.783%. The contribution requirements of the plan members are established by State statute and the employer contribution rate is established and may be amended by CalPERS.
C. Annual Pension Cost
For the year ended June 30, 2006, the City’s annual pension cost and its actual contributions were $426,533. Also, contributions made directly from employees were zero, but on behalf of the employees the City contributed a total of $276,541. The General Fund paid approximately 55% and other City funds paid approximately 45% of the total PERS contributions. The required contribution for the year ended June 30, 2006, was determined as part of the June 30, 2003, actuarial valuation using the entry age normal actuarial cost method with the contributions determined as a percent of pay. The actuarial assumptions included: (a) 7.75% investment rate of return (net of administrative expenses); (b) projected salary increases that vary by duration of service ranging from 3.25% to 14.45% for miscellaneous members: and; (c) zero percent cost-of-living adjustment. Both (a) and (b) include an inflation component of 3.0%. The actuarial value of Miscellaneous Plan’s assets was determined using a technique that smoothes the effect of short-term volatility in the market value of investments over a two to five year period depending on the size of investment gains and/or losses. Miscellaneous Plan’s unfunded actuarial accrued liability (or excess assets) is being amortized as a level percentage of projected payroll on a closed basis. The remaining amortization period at June 30, 2006, was one year.
Three-Year Trend Information
Fiscal Year EndingAnnual Pension Cost
(APC)Percentage of APC
ContributedNet Pension Obligation
6/30/2004 126,573$ 100% $06/30/2005 279,434$ 100% $06/30/2006 426,533$ 100% $0
CITY OF MOORPARK NOTES TO FINANCIAL STATEMENTS JUNE 30, 2006
53
NOTE #9 – CONDUIT DEBT – REVENUE BONDS The City sponsored a revenue bond program during the year ended June 30, 1985, under which $20,000,000 of Single-Family Residential Mortgage Revenue Bonds were issued. The Single-Family Mortgage program is designed to provide funds to acquire mortgage loans on single-family residences located in the City. These bonds are secured by a pledge of all loans receivable advanced from the bond proceeds by the trustee, First Interstate Bank of California, and are serviced from payments on the loans to the Trustee. During the year ended June 30, 1995, the outstanding mortgages in this program were sold, the proceeds were used to establish an irrevocable trust to defease the bonds at April 1, 1995, and the program was discontinued. The City Council, serving as the Industrial Development Authority of the City of Moorpark, issued $9,300,000 of Industrial Revenue Bonds during the year ended June 30, 1986. The bonds were issued to finance the development and construction of manufacturing facilities for the Kavlico Corporation. These bonds are secured by a standby letter of credit issued by Bank of America. Bank of New York serves as the Trustee for these bonds. These bonds were completely repaid during 2005-06. The City of Moorpark Mobile Home Park Revenue Bonds (Villa Del Arroyo) Series 2000 A and the City of Moorpark Mobile Home Park Subordinate Revenue Bonds (Villa Del Arroyo) Series 2000 B were issued in the amounts of $12,740,000 and $2,635,000 respectively. Both issuances were dated May 19, 2000. The Series A bonds were issued to fund a loan to Augusta Homes, a California non-profit public benefit corporation, to finance the acquisition of the Villa Del Arroyo Mobile Home Park. The Series B bonds were issued for the same purpose but are subordinate to the Series A bonds. The total bonds outstanding at June 30, 2006, total $14,145,000. The City of Moorpark Multifamily Housing Revenue Bonds (Vintage Crest Senior Apartment Project) 2002 Series A were issued in the amount of $16,000,000. The issuance was dated December 1, 2002. The Series A Bonds were issued to fund a loan to Vintage Crest Senior Apartment L.P., a California Limited Partnership, to finance the Vintage Crest Senior Housing Project. The bonds outstanding at June 30, 2006, totaled $15,850,088. Each of the bond programs described above do not constitute an indebtedness of the City, and there is neither a legal nor a moral obligation on the part of the City to make payments on such bonds from any source other than the revenues and assets pledged therefore. The programs are completely administered by the Trustees without any involvement by the City. Accordingly, these programs and the bonds issued thereunder have been excluded from the accompanying basic financial statements.
CITY OF MOORPARK NOTES TO FINANCIAL STATEMENTS JUNE 30, 2006
54
NOTE #10 – SPECIAL ASSESSMENT BONDS A. Mission Bell Plaza AD 92-1
On April 1, 1994, the City sponsored the issuance of special assessment bonds to finance certain capital improvements for the Mission Bell Plaza project. These bonds, totaling $2,595,000, of which $735,000 and $1,475,000 mature in 2013 and 2023, respectively, were issued under the 1915 Improvement Bond Act and are obligations against the properties in the assessment district. The special assessment, which is collected with other property related taxes as part of the secured property tax bill for properties in the assessment district, will be forwarded to an independent bank that serves as the paying agent. These bonds do not constitute an indebtedness of the City, and the City is not liable for their repayment. Accordingly, these special assessment bonds payable have been excluded from the accompanying basic financial statements. The unpaid principal balance on such bonds is $1,680,000 at June 30, 2006.
B. Community Facilities District No. 97-1 On July 1, 1997, the City issued bonds to finance the acquisition and construction of public improvements within the City of Moorpark Community Facilities District No. 97-1. These bonds, totaling $7,645,000, were issued pursuant to the Mello-Roos Community Facilities Act of 1982. The bonds mature on September 1, 2027 with interest payable at rates ranging from 4.4% to 6% per annum on March 1 and September 1 of each year commencing March 1, 1998. The City is not liable under any circumstance for the repayment of the debt, but is only acting as agent for the property owners in collecting the assessments and special taxes, forwarding collections to fiscal agents to pay the bondholders and initiating foreclosure proceedings, if appropriate. Accordingly, these bonds payable have been excluded from the accompanying general-purpose financial statements. The unpaid principal balance is $6,780,000 at June 30, 2006.
NOTE #11 – RISK MANAGEMENT A. Description of Self-Insurance Pool Pursuant to Joint Powers Agreement
The City is a member of the California Joint Powers Insurance Authority (the Authority). The Authority is composed of over 100 California public entities and is organized under a joint powers agreement pursuant to California Government Code 6500 et seq. The purpose of the Authority is to arrange and administer programs for the pooling of self-insured losses, to purchase excess insurance or reinsurance, and to arrange for group-purchased insurance for property and other coverages. The Authority’s pool began covering claims of its members in 1978. Each member government has an elected official as its representative on the Board of Directors. The Board operates through a nine-member Executive Committee.
CITY OF MOORPARK NOTES TO FINANCIAL STATEMENTS JUNE 30, 2006
55
NOTE #11 – RISK MANAGEMENT, Continued B. Self-Insurance Programs of the Authority
General Liability: Each member government pays a primary deposit to cover estimated losses for a fiscal year (claims year). Six months after the close of a fiscal year, outstanding claims are valued. A retrospective deposit computation is then made for each open claims year. Costs are spread to members as follows: the first $30,000 of each occurrence is charged directly to the member; costs from $30,001 to $750,000 are pooled based on a member’s share of costs under $30,000; costs from $50,001 to $5,000,000 are pooled based on payroll. Costs of covered claims above $5,000,000 are currently paid by reinsurance. The protection for each member is $50,000,000 per occurrence and $50,000,000 annual aggregate.
Workers’ Compensation: The City of Moorpark also participates in the workers’ compensation pool administered by the Authority. Members retain the first $50,000 of each claim. Claims are pooled separately between public safety and non-public safety. Loss development reserves are allocated by pool and by loss layer ($0 - $100,000 allocated by retained amount and $100,000 to $2,000,000 by payroll). Losses from $50,000 to $100,000 and the loss development reserve associated with losses up to $100,000 are pooled based on the member’s share of losses under $50,000. Losses from $100,000 to $2,000,000 are pooled based on payroll. Costs in excess of $50,000,000 are pooled among the Members based on payroll. Administrative expenses are paid from the Authority’s investment earnings.
C. Purchased Insurance
The City of Moorpark participates in the all-risk property protection program of the Authority. This insurance protection is underwritten by several insurance companies. The City of Moorpark property is currently insured according to a schedule of covered property submitted by the City of Moorpark to the Authority. Total all-risk property insurance coverage is $11,019,343. There is a $5,000 per loss deductible. Premiums for the coverage are paid annually and are not subject to retroactive adjustments.
D. Earthquake and Flood Insurance The City of Moorpark purchased earthquake and flood insurance on a portion of its property. The earthquake insurance is part of the property protection insurance program of the Authority. The City of Moorpark property currently has earthquake protection in the amount of $8,240,521. There is a deductible of five percent of the value with a minimum deduction of $100,000. Premiums for the coverage are paid annually and are not subject to retroactive adjustments.
E. Adequacy of Protection During the past three fiscal (claims) years none of the above programs of protection have had settlements or judgments that exceeded pooled or insured coverage. There have been no significant reductions in pooled or insured liability coverage from coverage in the prior year.
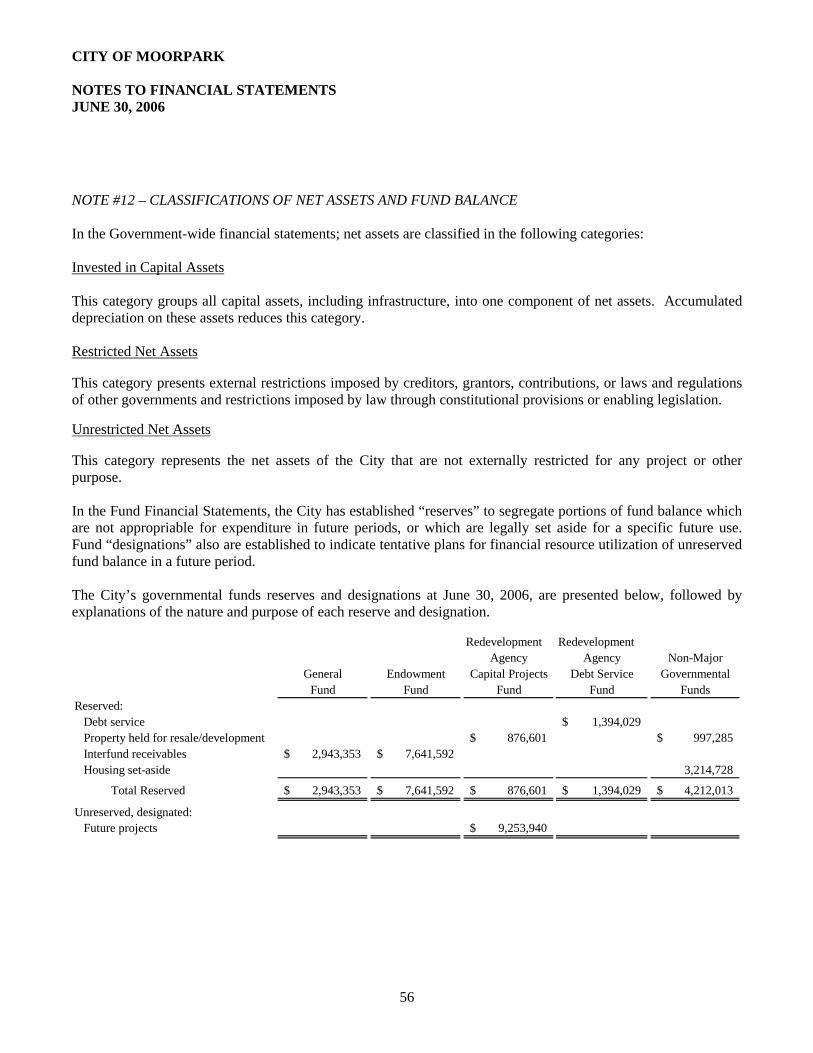
CITY OF MOORPARK NOTES TO FINANCIAL STATEMENTS JUNE 30, 2006
56
NOTE #12 – CLASSIFICATIONS OF NET ASSETS AND FUND BALANCE In the Government-wide financial statements; net assets are classified in the following categories: Invested in Capital Assets This category groups all capital assets, including infrastructure, into one component of net assets. Accumulated depreciation on these assets reduces this category. Restricted Net Assets This category presents external restrictions imposed by creditors, grantors, contributions, or laws and regulations of other governments and restrictions imposed by law through constitutional provisions or enabling legislation. Unrestricted Net Assets This category represents the net assets of the City that are not externally restricted for any project or other purpose. In the Fund Financial Statements, the City has established “reserves” to segregate portions of fund balance which are not appropriable for expenditure in future periods, or which are legally set aside for a specific future use. Fund “designations” also are established to indicate tentative plans for financial resource utilization of unreserved fund balance in a future period. The City’s governmental funds reserves and designations at June 30, 2006, are presented below, followed by explanations of the nature and purpose of each reserve and designation.
Redevelopment Redevelopment Agency Agency Non-Major
General Endowment Capital Projects Debt Service GovernmentalFund Fund Fund Fund Funds
Reserved:Debt service 1,394,029$ Property held for resale/development 876,601$ 997,285$ Interfund receivables 2,943,353$ 7,641,592$ Housing set-aside 3,214,728
Total Reserved 2,943,353$ 7,641,592$ 876,601$ 1,394,029$ 4,212,013$
Unreserved, designated:Future projects 9,253,940$
CITY OF MOORPARK NOTES TO FINANCIAL STATEMENTS JUNE 30, 2006
57
NOTE #12 – CLASSIFICATIONS OF NET ASSETS AND FUND BALANCE, Continued A. Reserved for Debt Service
These funds are reserved for restricted debt proceeds. B. Reserved for Property Held for Resale/Development
These funds are reserved for property purchased by the City to be sold or otherwise used for the development of the Redevelopment Agency Project Areas.
C. Reserved for Housing Set-Aside
These funds are for the development of low and moderate-income housing. D. Reserved for Interfund Receivables
These funds are reserved since the assets are not available for immediate appropriation. E. Unreserved, Designated for Future Projects
These funds have been designated for future capital projects. F. Deficit Fund Balance
The following fund had a deficit at June 30, 2006: Police Facilities Fee Capital Projects Fund (7,716,451)$
The deficit will be made up through future police facilities assessment fees.
NOTE #13 – EXPENDITURES IN EXCESS OF APPROPRIATIONS The following fund has expenditures in excess of the budget in the following amount for the year ended June 30, 2006: Community Development Special Revenue Fund 200,352$ Redevelopment Agency Debt Service Fund 907,803$
The $200,352 of expenditures in excess of the budget in the Community Development Fund is mainly due to the increase in building and safety activities. As such, revenue received for these activities also increased in the fund. The variance in the RDA Debt Service Fund of $907,803 is mainly a result of the required tax increment pass-through payments that were higher than budgeted reflecting the increase in property tax revenue received.
CITY OF MOORPARK NOTES TO FINANCIAL STATEMENTS JUNE 30, 2006
58
NOTE #14 – COMMITMENTS AND CONTINGENCIES A. Commitments
The City has contracts with the County of Ventura for various services, most notably law enforcement. These service contracts are renegotiated annually and cancelable by the City or the County on May 31 of each year after 30 days notice has been given. These are based on an hourly rate and adjusted throughout the fiscal year.
B. Contingencies
There are certain legal actions pending against the City which management considers incident to normal operations, some of which seek substantial monetary damages. In the opinion of management, after consultation with counsel, the ultimate resolution of such actions is not expected to have a significant effect on the financial position or the results of operations of the City. The City has received State and Federal funds for specific purposes that are subject to review by the grantor agencies. Although such audits could generate expenditure disallowances under the terms of the grants, it is believed that any disallowed amounts will not be material.
REQUIRED SUPPLEMENTARY INFORMATION
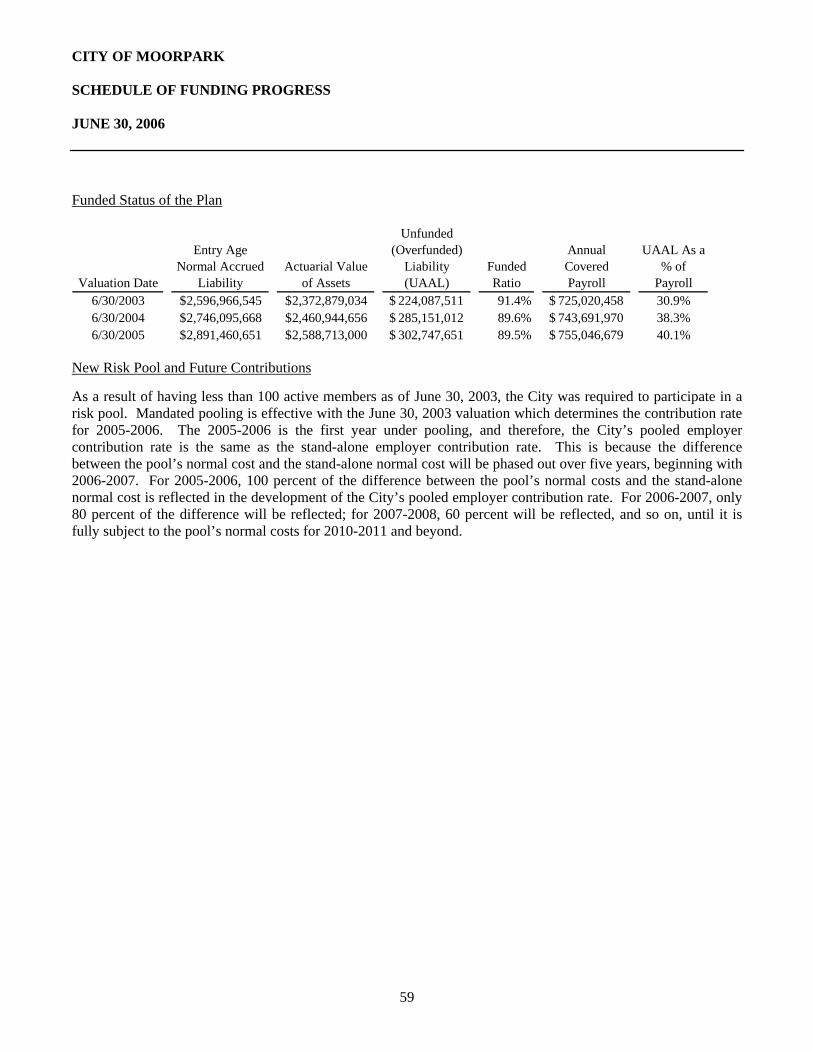
CITY OF MOORPARK SCHEDULE OF FUNDING PROGRESS JUNE 30, 2006
59
Funded Status of the Plan
Valuation Date
Entry Age Normal Accrued
LiabilityActuarial Value
of Assets
Unfunded (Overfunded)
Liability (UAAL)
Funded Ratio
Annual Covered Payroll
UAAL As a % of
Payroll6/30/2003 2,596,966,545$ 2,372,879,034$ 224,087,511$ 91.4% 725,020,458$ 30.9%6/30/2004 2,746,095,668$ 2,460,944,656$ 285,151,012$ 89.6% 743,691,970$ 38.3%6/30/2005 2,891,460,651$ 2,588,713,000$ 302,747,651$ 89.5% 755,046,679$ 40.1%
New Risk Pool and Future Contributions As a result of having less than 100 active members as of June 30, 2003, the City was required to participate in a risk pool. Mandated pooling is effective with the June 30, 2003 valuation which determines the contribution rate for 2005-2006. The 2005-2006 is the first year under pooling, and therefore, the City’s pooled employer contribution rate is the same as the stand-alone employer contribution rate. This is because the difference between the pool’s normal cost and the stand-alone normal cost will be phased out over five years, beginning with 2006-2007. For 2005-2006, 100 percent of the difference between the pool’s normal costs and the stand-alone normal cost is reflected in the development of the City’s pooled employer contribution rate. For 2006-2007, only 80 percent of the difference will be reflected; for 2007-2008, 60 percent will be reflected, and so on, until it is fully subject to the pool’s normal costs for 2010-2011 and beyond.

SUPPLEMENTARY SCHEDULES
CITY OF MOORPARK
JUNE 30, 2006
MAJOR FUND BUDGETARY COMPARISON SCHEDULES
60
Budgetary comparison statements are presented as part of the basic financial statements for the General Fund and all Major Special Revenue Funds as provided for by GASB Statement No. 34. The budgetary comparison schedules for the remaining major funds are presented to aid in additional analysis and are not a required part of the basic financial statements.
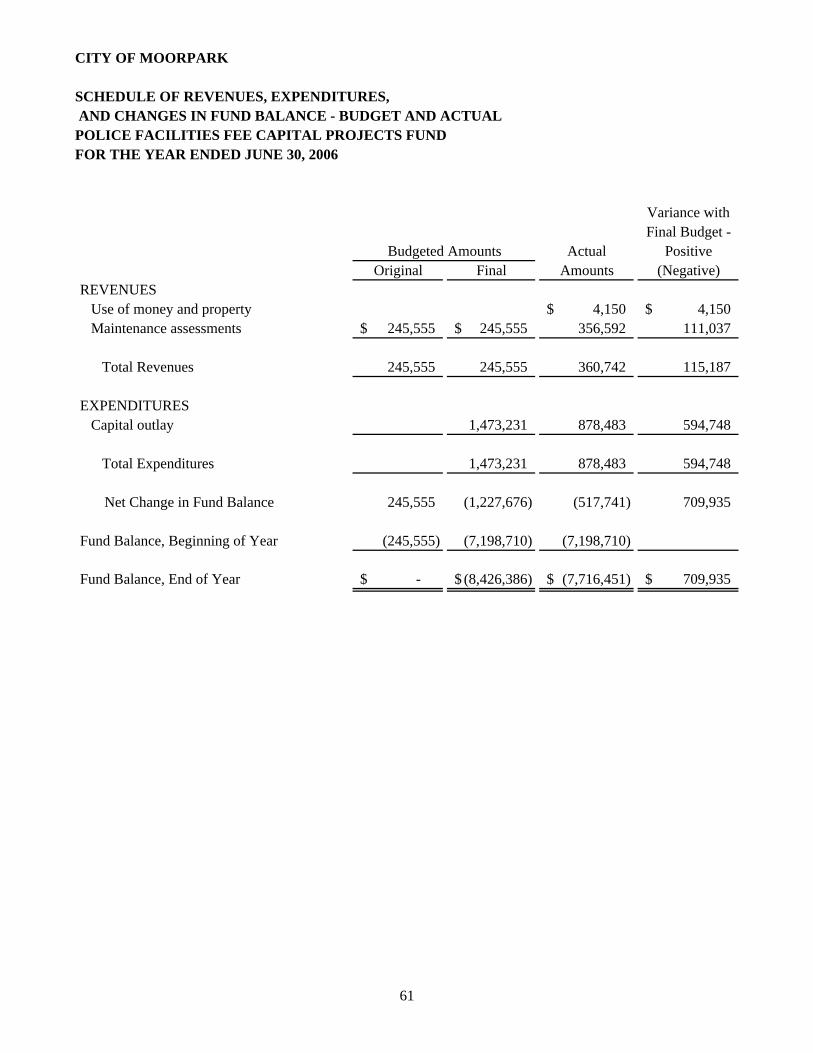
CITY OF MOORPARK
SCHEDULE OF REVENUES, EXPENDITURES, AND CHANGES IN FUND BALANCE - BUDGET AND ACTUALPOLICE FACILITIES FEE CAPITAL PROJECTS FUNDFOR THE YEAR ENDED JUNE 30, 2006
Variance withFinal Budget -
Actual PositiveOriginal Final Amounts (Negative)
REVENUES Use of money and property 4,150$ 4,150$ Maintenance assessments 245,555$ 245,555$ 356,592 111,037
Total Revenues 245,555 245,555 360,742 115,187
EXPENDITURES Capital outlay 1,473,231 878,483 594,748
Total Expenditures 1,473,231 878,483 594,748
Net Change in Fund Balance 245,555 (1,227,676) (517,741) 709,935
Fund Balance, Beginning of Year (245,555) (7,198,710) (7,198,710)
Fund Balance, End of Year -$ (8,426,386)$ (7,716,451)$ 709,935$
Budgeted Amounts
61
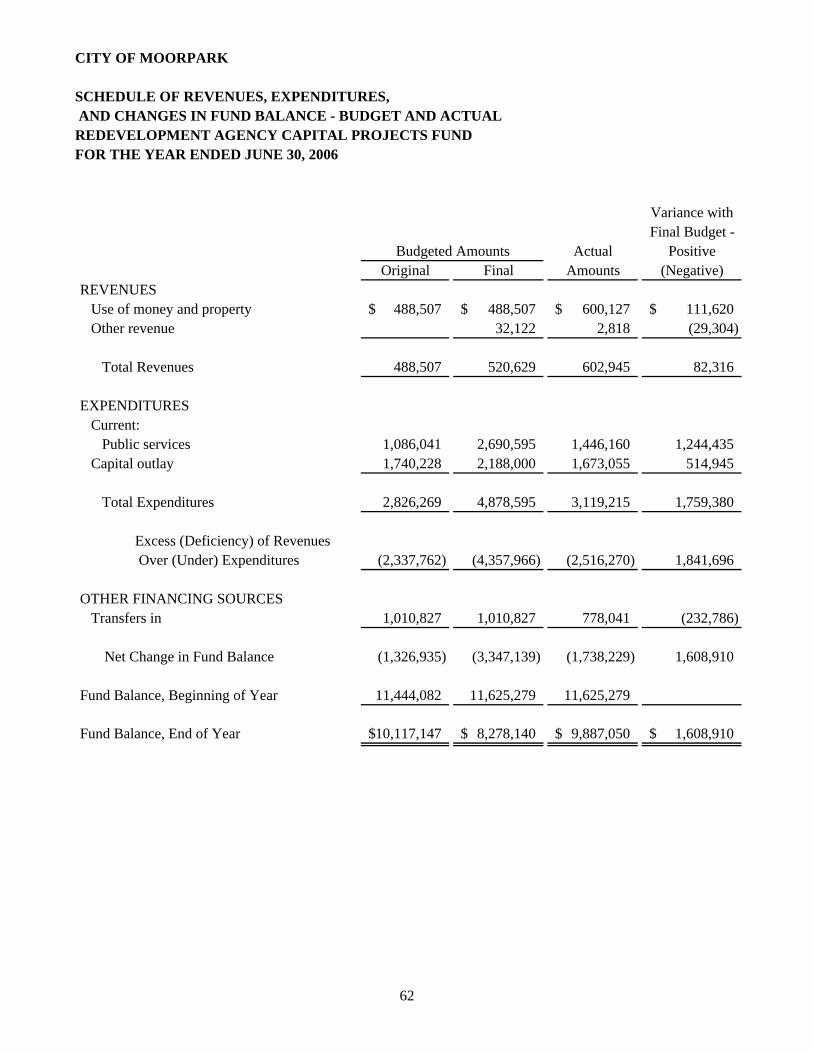
CITY OF MOORPARK
SCHEDULE OF REVENUES, EXPENDITURES, AND CHANGES IN FUND BALANCE - BUDGET AND ACTUALREDEVELOPMENT AGENCY CAPITAL PROJECTS FUNDFOR THE YEAR ENDED JUNE 30, 2006
Variance withFinal Budget -
Actual PositiveOriginal Final Amounts (Negative)
REVENUES Use of money and property 488,507$ 488,507$ 600,127$ 111,620$ Other revenue 32,122 2,818 (29,304)
Total Revenues 488,507 520,629 602,945 82,316
EXPENDITURES Current: Public services 1,086,041 2,690,595 1,446,160 1,244,435 Capital outlay 1,740,228 2,188,000 1,673,055 514,945
Total Expenditures 2,826,269 4,878,595 3,119,215 1,759,380
Excess (Deficiency) of Revenues Over (Under) Expenditures (2,337,762) (4,357,966) (2,516,270) 1,841,696
OTHER FINANCING SOURCES Transfers in 1,010,827 1,010,827 778,041 (232,786)
Net Change in Fund Balance (1,326,935) (3,347,139) (1,738,229) 1,608,910
Fund Balance, Beginning of Year 11,444,082 11,625,279 11,625,279
Fund Balance, End of Year 10,117,147$ 8,278,140$ 9,887,050$ 1,608,910$
Budgeted Amounts
62
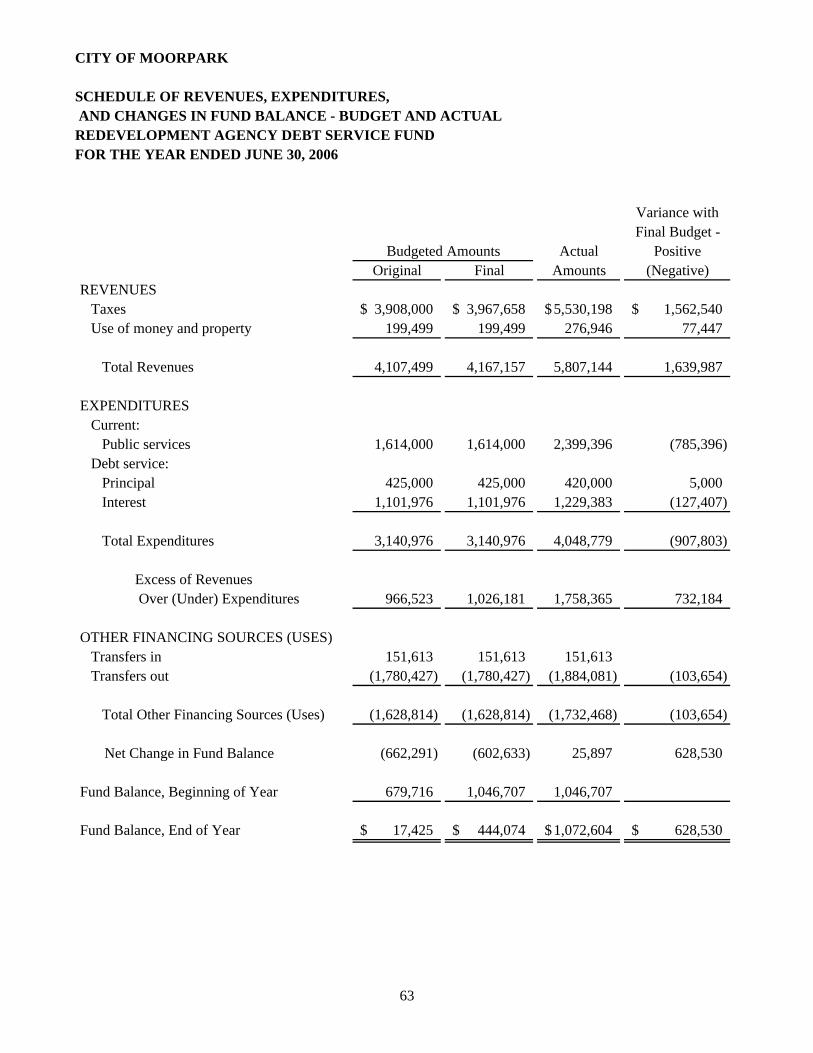
CITY OF MOORPARK
SCHEDULE OF REVENUES, EXPENDITURES, AND CHANGES IN FUND BALANCE - BUDGET AND ACTUALREDEVELOPMENT AGENCY DEBT SERVICE FUNDFOR THE YEAR ENDED JUNE 30, 2006
Variance withFinal Budget -
Actual PositiveOriginal Final Amounts (Negative)
REVENUES Taxes 3,908,000$ 3,967,658$ 5,530,198$ 1,562,540$ Use of money and property 199,499 199,499 276,946 77,447
Total Revenues 4,107,499 4,167,157 5,807,144 1,639,987
EXPENDITURES Current: Public services 1,614,000 1,614,000 2,399,396 (785,396) Debt service: Principal 425,000 425,000 420,000 5,000 Interest 1,101,976 1,101,976 1,229,383 (127,407)
Total Expenditures 3,140,976 3,140,976 4,048,779 (907,803)
Excess of Revenues Over (Under) Expenditures 966,523 1,026,181 1,758,365 732,184
OTHER FINANCING SOURCES (USES) Transfers in 151,613 151,613 151,613 Transfers out (1,780,427) (1,780,427) (1,884,081) (103,654)
Total Other Financing Sources (Uses) (1,628,814) (1,628,814) (1,732,468) (103,654)
Net Change in Fund Balance (662,291) (602,633) 25,897 628,530
Fund Balance, Beginning of Year 679,716 1,046,707 1,046,707
Fund Balance, End of Year 17,425$ 444,074$ 1,072,604$ 628,530$
Budgeted Amounts
63
CITY OF MOORPARK
JUNE 30, 2006
NON-MAJOR GOVERNMENTAL FUNDS
64
Special Revenues Fund Descriptions Traffic Safety Fund The Traffic Safety Fund is used to account for revenues collected from traffic fines and forfeitures, which is used for crossing guards and parking enforcement. Affordable Housing Fund (City) The Affordable Housing Fund is used to account for grants used for development of affordable housing units. Assessment District Fund The Assessment District Fund is used to account for funds received by the City for maintenance of community-wide landscaping. State and Federal Assistance Fund The State and Federal Assistance Fund is used to account for Federal and State grants used for the construction of streets and related improvements and help fund law enforcement. State Gas Tax Fund The State Gas Tax Fund is used to account for fees used for street maintenance, right-of-way acquisition and street construction. Low and Moderate Income Housing Fund (MRA) The Low and Moderate Income Housing Fund is used to account for the receipt of 20% of the gross tax increment allocation, which is restricted for use on projects that increase or preserve the supply of low and moderate income housing in accordance with Health and Safety Code Section 33334. Local Transportation Transit Fund The Local Transportation Transit Fund is used to account for fees used in local transportation and street projects that help relieve traffic congestion programs and development. Solid Waste Fund The Solid Waste Fund is used to account for fees used on programs that promote resource, recycling, composting, and proper disposal of hazardous household waste.
CITY OF MOORPARK
JUNE 30, 2006
NON-MAJOR GOVERNMENTAL FUNDS (Continued)
65
Capital Projects Fund Descriptions City Hall Building Fund The City Hall Building Fund is used to account for the funds used to build the new Civic Center Complex. Equipment Replacement Fund The Equipment Replacement Fund is used to account for the funds used to replace city equipment and vehicles.
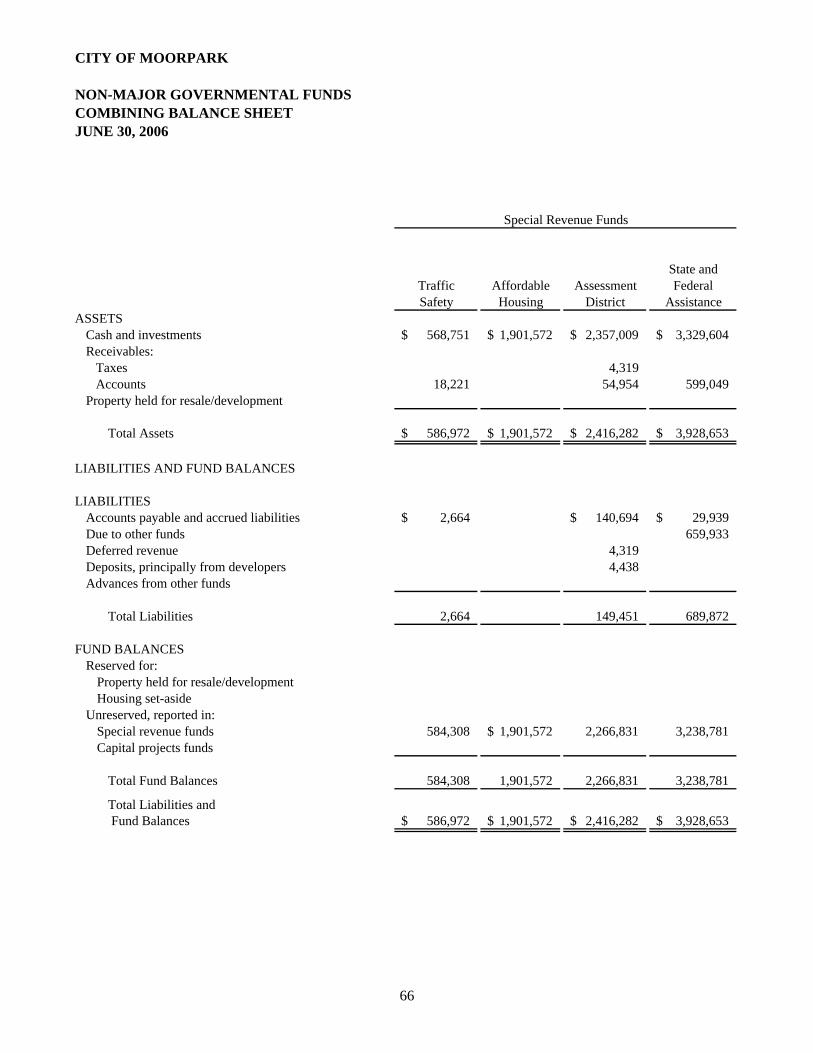
CITY OF MOORPARK
NON-MAJOR GOVERNMENTAL FUNDSCOMBINING BALANCE SHEETJUNE 30, 2006
State andTraffic Affordable Assessment FederalSafety Housing District Assistance
ASSETSCash and investments 568,751$ 1,901,572$ 2,357,009$ 3,329,604$ Receivables: Taxes 4,319 Accounts 18,221 54,954 599,049Property held for resale/development
Total Assets 586,972$ 1,901,572$ 2,416,282$ 3,928,653$
LIABILITIES AND FUND BALANCES
LIABILITIESAccounts payable and accrued liabilities 2,664$ 140,694$ 29,939$ Due to other funds 659,933Deferred revenue 4,319Deposits, principally from developers 4,438Advances from other funds
Total Liabilities 2,664 149,451 689,872
FUND BALANCESReserved for:
Property held for resale/developmentHousing set-aside
Unreserved, reported in:Special revenue funds 584,308 1,901,572$ 2,266,831 3,238,781 Capital projects funds
Total Fund Balances 584,308 1,901,572 2,266,831 3,238,781
Total Liabilities and Fund Balances 586,972$ 1,901,572$ 2,416,282$ 3,928,653$
Special Revenue Funds
66
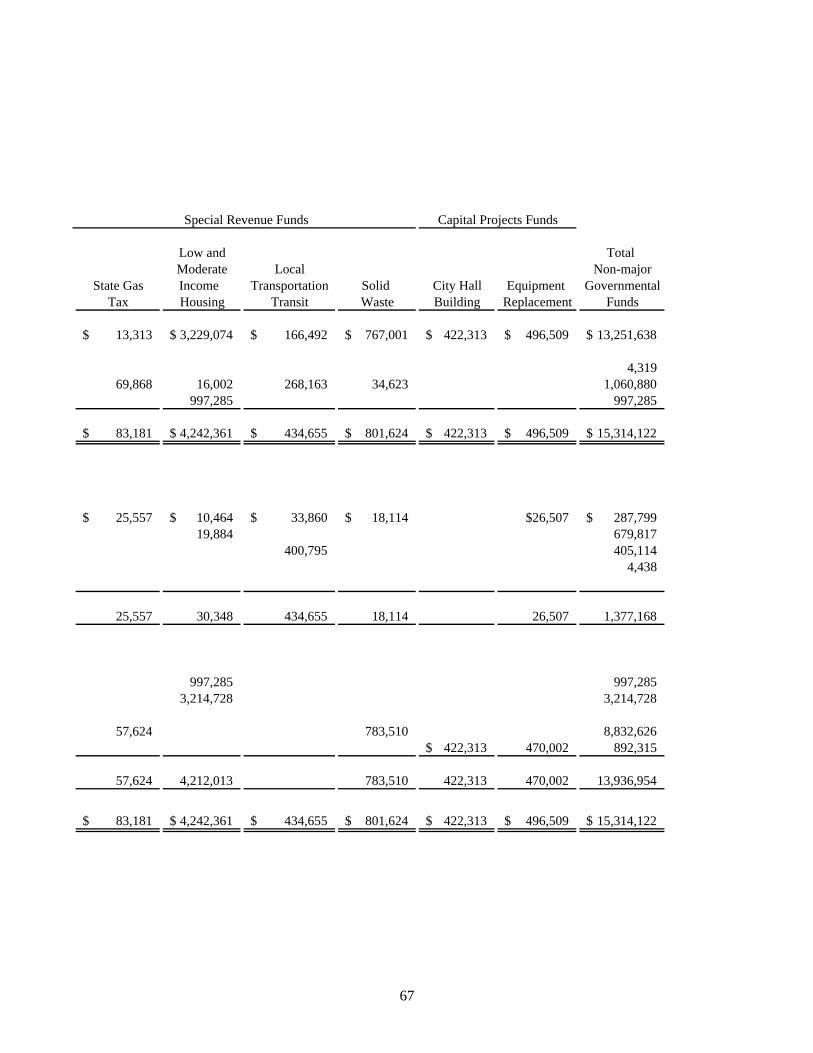
Low and Total Moderate Local Non-major
State Gas Income Transportation Solid City Hall Equipment GovernmentalTax Housing Transit Waste Building Replacement Funds
13,313$ 3,229,074$ 166,492$ 767,001$ 422,313$ 496,509$ 13,251,638$
4,31969,868 16,002 268,163 34,623 1,060,880
997,285 997,285
83,181$ 4,242,361$ 434,655$ 801,624$ 422,313$ 496,509$ 15,314,122$
25,557$ 10,464$ 33,860$ 18,114$ $26,507 287,799$ 19,884 679,817
400,795 405,1144,438
25,557 30,348 434,655 18,114 26,507 1,377,168
997,285 997,2853,214,728 3,214,728
57,624 783,510 8,832,626 422,313$ 470,002 892,315
57,624 4,212,013 783,510 422,313 470,002 13,936,954
83,181$ 4,242,361$ 434,655$ 801,624$ 422,313$ 496,509$ 15,314,122$
Capital Projects FundsSpecial Revenue Funds
67
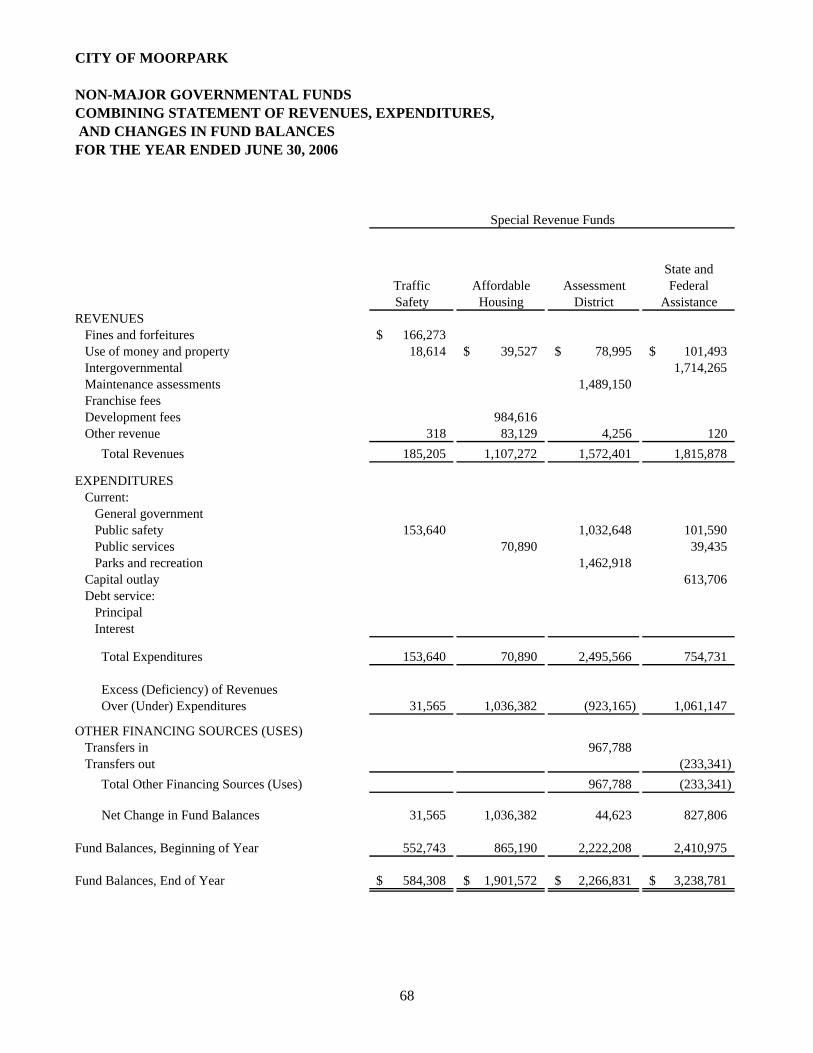
CITY OF MOORPARK
NON-MAJOR GOVERNMENTAL FUNDSCOMBINING STATEMENT OF REVENUES, EXPENDITURES, AND CHANGES IN FUND BALANCESFOR THE YEAR ENDED JUNE 30, 2006
State andTraffic Affordable Assessment Federal
Safety Housing District AssistanceREVENUES Fines and forfeitures 166,273$ Use of money and property 18,614 39,527$ 78,995$ 101,493$ Intergovernmental 1,714,265 Maintenance assessments 1,489,150 Franchise fees Development fees 984,616 Other revenue 318 83,129 4,256 120 Total Revenues 185,205 1,107,272 1,572,401 1,815,878
EXPENDITURES Current: General government Public safety 153,640 1,032,648 101,590 Public services 70,890 39,435 Parks and recreation 1,462,918 Capital outlay 613,706 Debt service: Principal Interest
Total Expenditures 153,640 70,890 2,495,566 754,731
Excess (Deficiency) of Revenues Over (Under) Expenditures 31,565 1,036,382 (923,165) 1,061,147
OTHER FINANCING SOURCES (USES) Transfers in 967,788 Transfers out (233,341) Total Other Financing Sources (Uses) 967,788 (233,341)
Net Change in Fund Balances 31,565 1,036,382 44,623 827,806
Fund Balances, Beginning of Year 552,743 865,190 2,222,208 2,410,975
Fund Balances, End of Year 584,308$ 1,901,572$ 2,266,831$ 3,238,781$
Special Revenue Funds
68
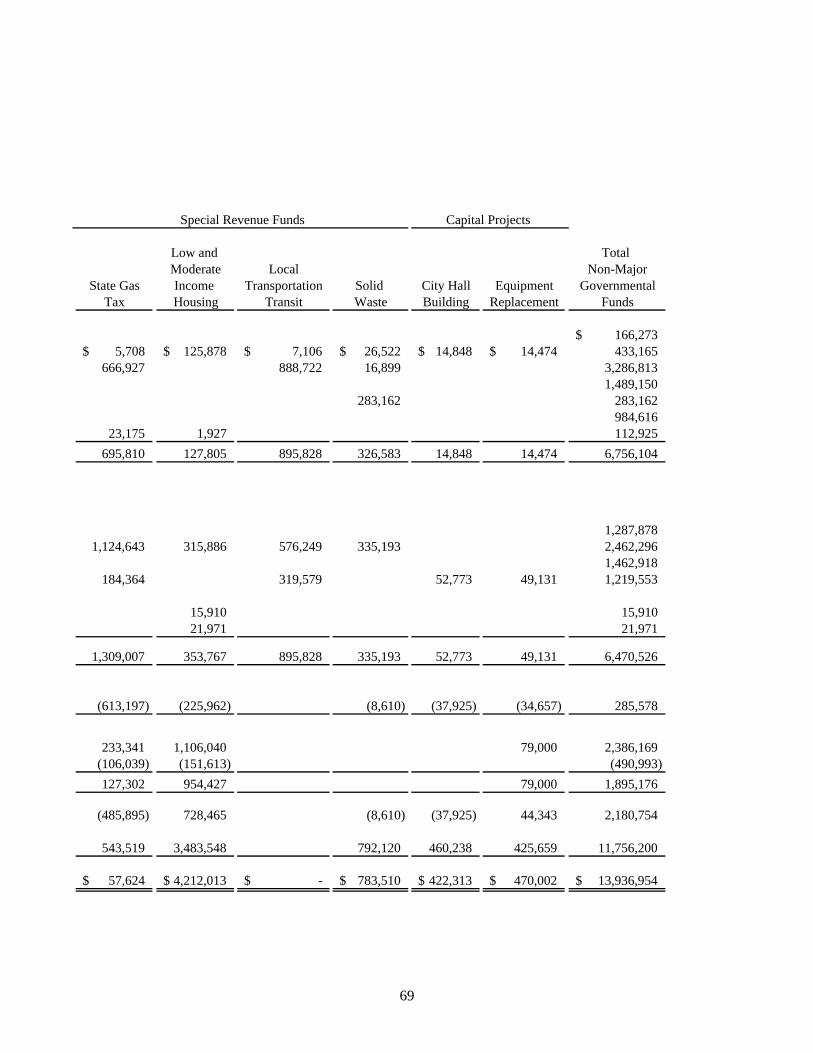
Low and Total Moderate Local Non-Major
State Gas Income Transportation Solid City Hall Equipment GovernmentalTax Housing Transit Waste Building Replacement Funds
166,273$ 5,708$ 125,878$ 7,106$ 26,522$ 14,848$ 14,474$ 433,165
666,927 888,722 16,899 3,286,8131,489,150
283,162 283,162984,616
23,175 1,927 112,925695,810 127,805 895,828 326,583 14,848 14,474 6,756,104
1,287,8781,124,643 315,886 576,249 335,193 2,462,296
1,462,918184,364 319,579 52,773 49,131 1,219,553
15,910 15,91021,971 21,971
1,309,007 353,767 895,828 335,193 52,773 49,131 6,470,526
(613,197) (225,962) (8,610) (37,925) (34,657) 285,578
233,341 1,106,040 79,000 2,386,169(106,039) (151,613) (490,993)127,302 954,427 79,000 1,895,176
(485,895) 728,465 (8,610) (37,925) 44,343 2,180,754
543,519 3,483,548 792,120 460,238 425,659 11,756,200
57,624$ 4,212,013$ -$ 783,510$ 422,313$ 470,002$ 13,936,954$
Capital ProjectsSpecial Revenue Funds
69
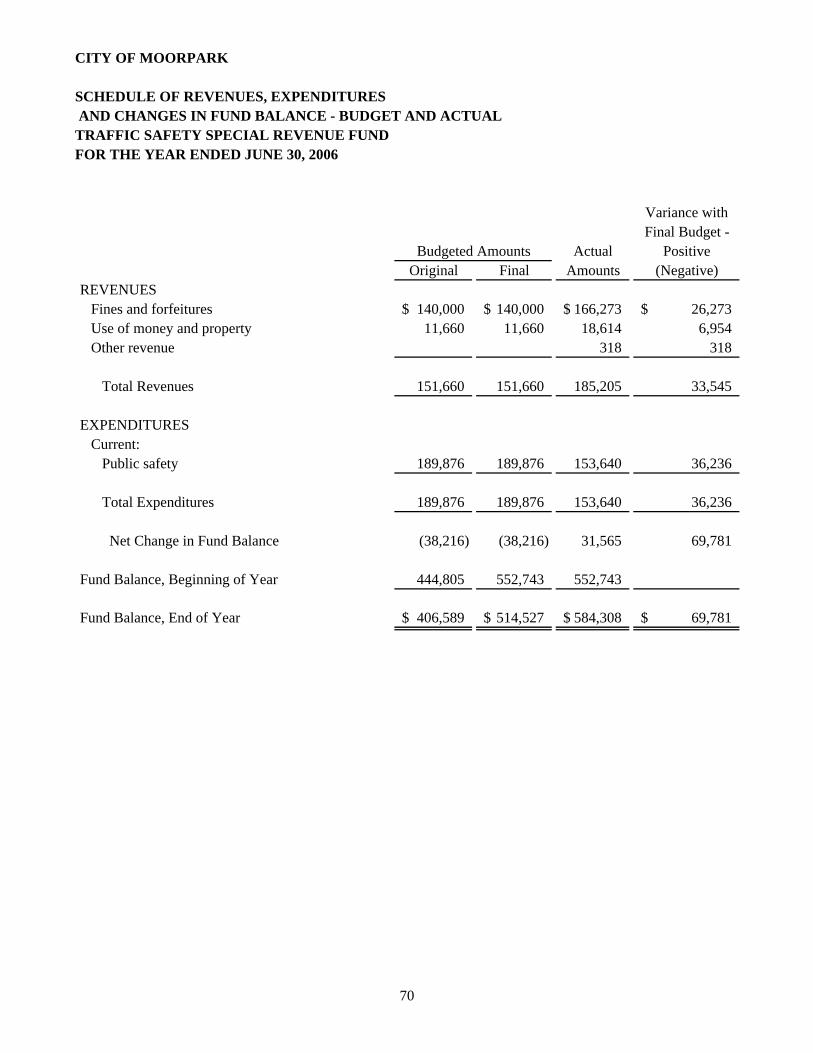
CITY OF MOORPARK
SCHEDULE OF REVENUES, EXPENDITURES AND CHANGES IN FUND BALANCE - BUDGET AND ACTUALTRAFFIC SAFETY SPECIAL REVENUE FUND FOR THE YEAR ENDED JUNE 30, 2006
Variance withFinal Budget -
Actual PositiveOriginal Final Amounts (Negative)
REVENUES Fines and forfeitures 140,000$ 140,000$ 166,273$ 26,273$ Use of money and property 11,660 11,660 18,614 6,954 Other revenue 318 318
Total Revenues 151,660 151,660 185,205 33,545
EXPENDITURES Current: Public safety 189,876 189,876 153,640 36,236
Total Expenditures 189,876 189,876 153,640 36,236
Net Change in Fund Balance (38,216) (38,216) 31,565 69,781
Fund Balance, Beginning of Year 444,805 552,743 552,743
Fund Balance, End of Year 406,589$ 514,527$ 584,308$ 69,781$
Budgeted Amounts
70
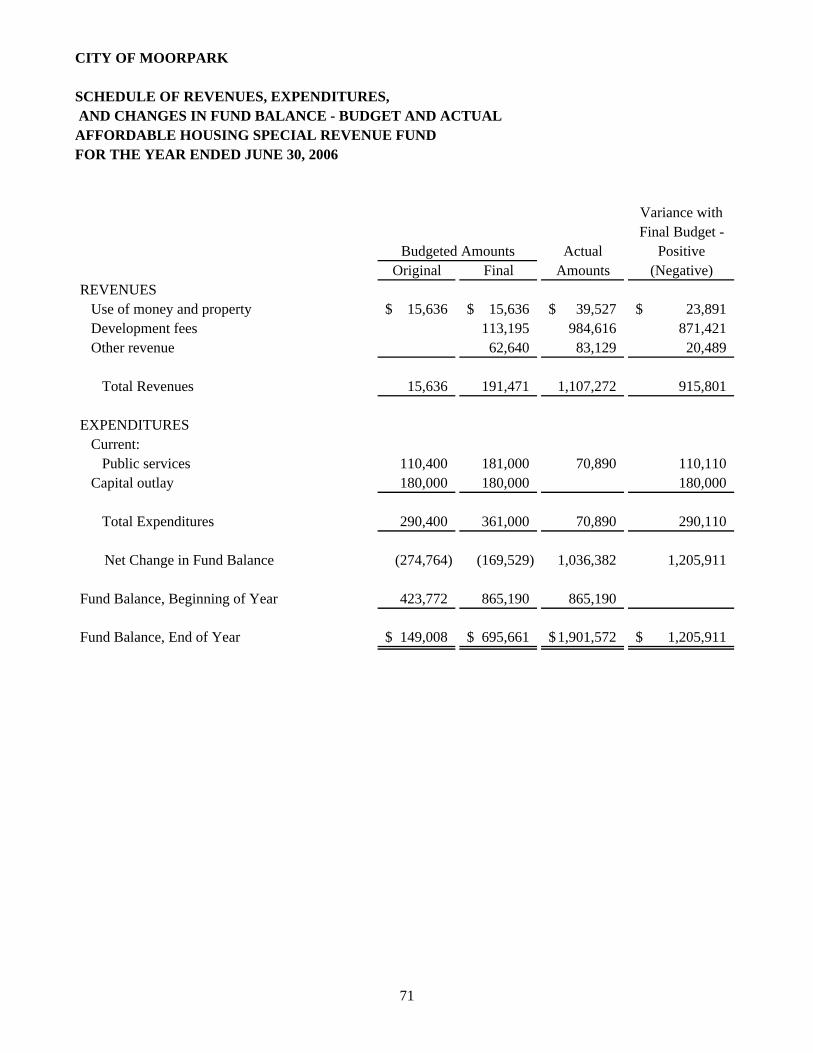
CITY OF MOORPARK
SCHEDULE OF REVENUES, EXPENDITURES, AND CHANGES IN FUND BALANCE - BUDGET AND ACTUALAFFORDABLE HOUSING SPECIAL REVENUE FUND FOR THE YEAR ENDED JUNE 30, 2006
Variance withFinal Budget -
Actual PositiveOriginal Final Amounts (Negative)
REVENUES Use of money and property 15,636$ 15,636$ 39,527$ 23,891$ Development fees 113,195 984,616 871,421 Other revenue 62,640 83,129 20,489
Total Revenues 15,636 191,471 1,107,272 915,801
EXPENDITURES Current: Public services 110,400 181,000 70,890 110,110 Capital outlay 180,000 180,000 180,000
Total Expenditures 290,400 361,000 70,890 290,110
Net Change in Fund Balance (274,764) (169,529) 1,036,382 1,205,911
Fund Balance, Beginning of Year 423,772 865,190 865,190
Fund Balance, End of Year 149,008$ 695,661$ 1,901,572$ 1,205,911$
Budgeted Amounts
71
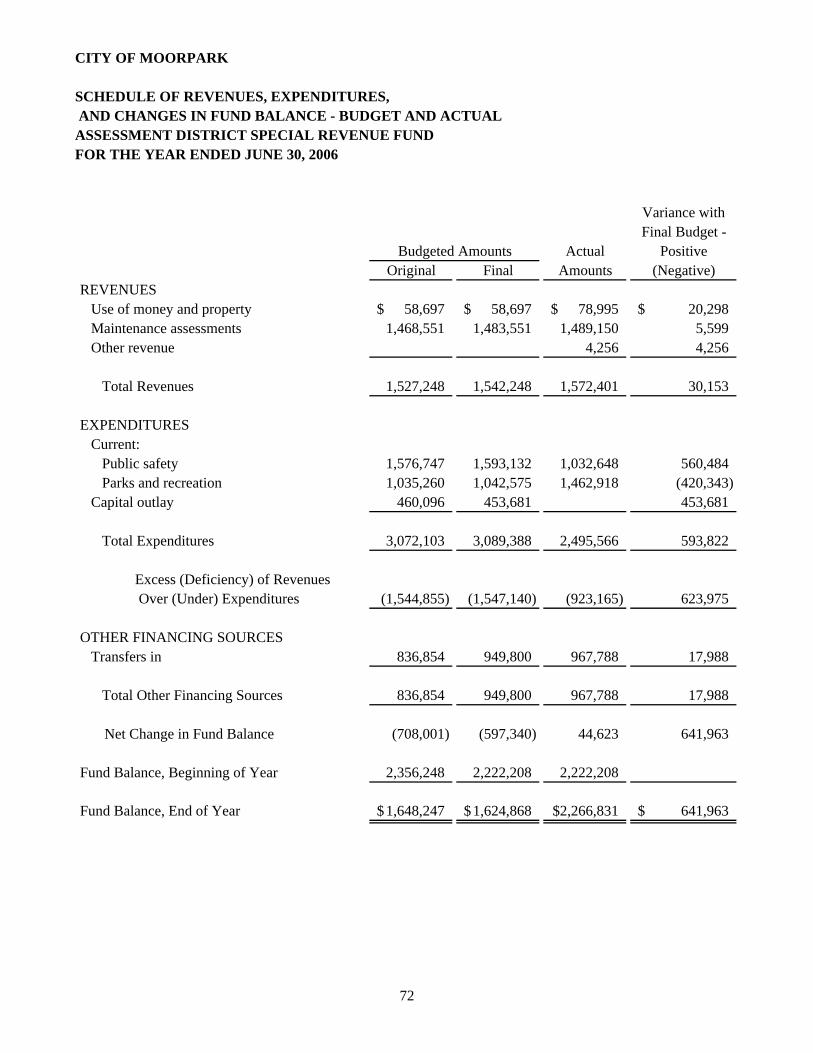
CITY OF MOORPARK
SCHEDULE OF REVENUES, EXPENDITURES, AND CHANGES IN FUND BALANCE - BUDGET AND ACTUALASSESSMENT DISTRICT SPECIAL REVENUE FUND FOR THE YEAR ENDED JUNE 30, 2006
Variance withFinal Budget -
Actual PositiveOriginal Final Amounts (Negative)
REVENUES Use of money and property 58,697$ 58,697$ 78,995$ 20,298$ Maintenance assessments 1,468,551 1,483,551 1,489,150 5,599 Other revenue 4,256 4,256
Total Revenues 1,527,248 1,542,248 1,572,401 30,153
EXPENDITURES Current: Public safety 1,576,747 1,593,132 1,032,648 560,484 Parks and recreation 1,035,260 1,042,575 1,462,918 (420,343) Capital outlay 460,096 453,681 453,681
Total Expenditures 3,072,103 3,089,388 2,495,566 593,822
Excess (Deficiency) of Revenues Over (Under) Expenditures (1,544,855) (1,547,140) (923,165) 623,975
OTHER FINANCING SOURCES Transfers in 836,854 949,800 967,788 17,988
Total Other Financing Sources 836,854 949,800 967,788 17,988
Net Change in Fund Balance (708,001) (597,340) 44,623 641,963
Fund Balance, Beginning of Year 2,356,248 2,222,208 2,222,208
Fund Balance, End of Year 1,648,247$ 1,624,868$ $2,266,831 641,963$
Budgeted Amounts
72
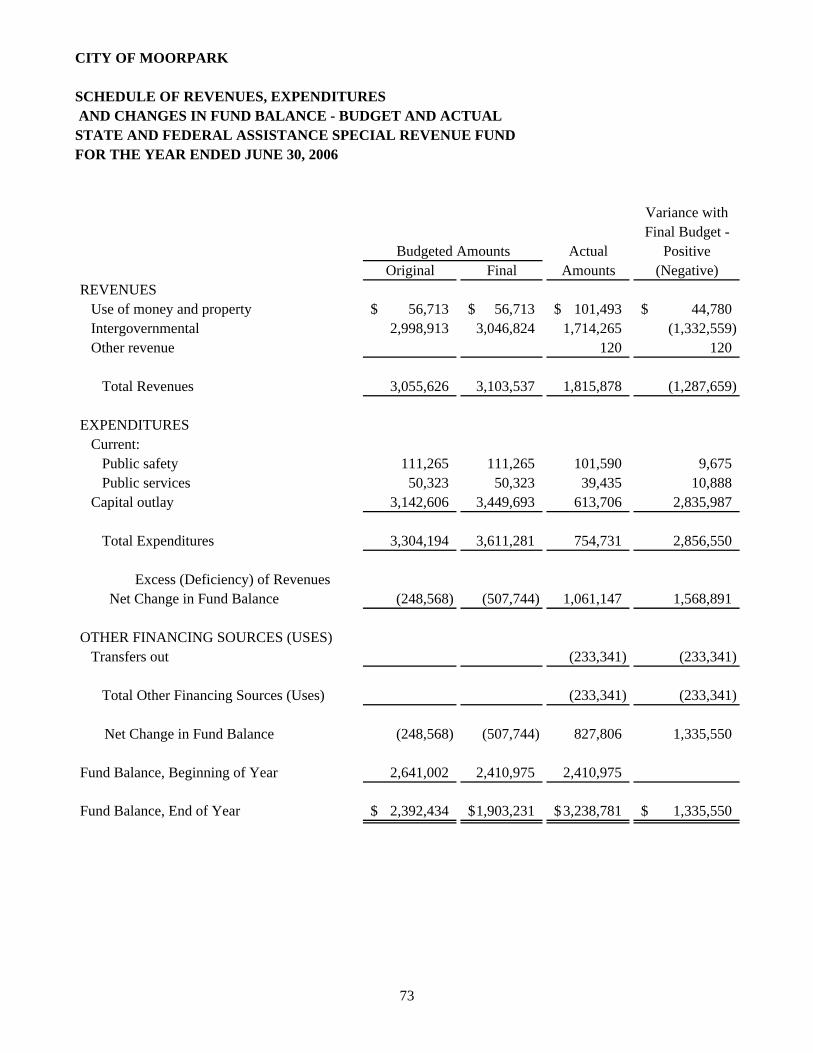
CITY OF MOORPARK
SCHEDULE OF REVENUES, EXPENDITURES AND CHANGES IN FUND BALANCE - BUDGET AND ACTUALSTATE AND FEDERAL ASSISTANCE SPECIAL REVENUE FUND FOR THE YEAR ENDED JUNE 30, 2006
Variance withFinal Budget -
Actual PositiveOriginal Final Amounts (Negative)
REVENUES Use of money and property 56,713$ 56,713$ 101,493$ 44,780$ Intergovernmental 2,998,913 3,046,824 1,714,265 (1,332,559) Other revenue 120 120
Total Revenues 3,055,626 3,103,537 1,815,878 (1,287,659)
EXPENDITURES Current: Public safety 111,265 111,265 101,590 9,675 Public services 50,323 50,323 39,435 10,888 Capital outlay 3,142,606 3,449,693 613,706 2,835,987
Total Expenditures 3,304,194 3,611,281 754,731 2,856,550
Excess (Deficiency) of Revenues Net Change in Fund Balance (248,568) (507,744) 1,061,147 1,568,891
OTHER FINANCING SOURCES (USES) Transfers out (233,341) (233,341)
Total Other Financing Sources (Uses) (233,341) (233,341)
Net Change in Fund Balance (248,568) (507,744) 827,806 1,335,550
Fund Balance, Beginning of Year 2,641,002 2,410,975 2,410,975
Fund Balance, End of Year 2,392,434$ 1,903,231$ 3,238,781$ 1,335,550$
Budgeted Amounts
73
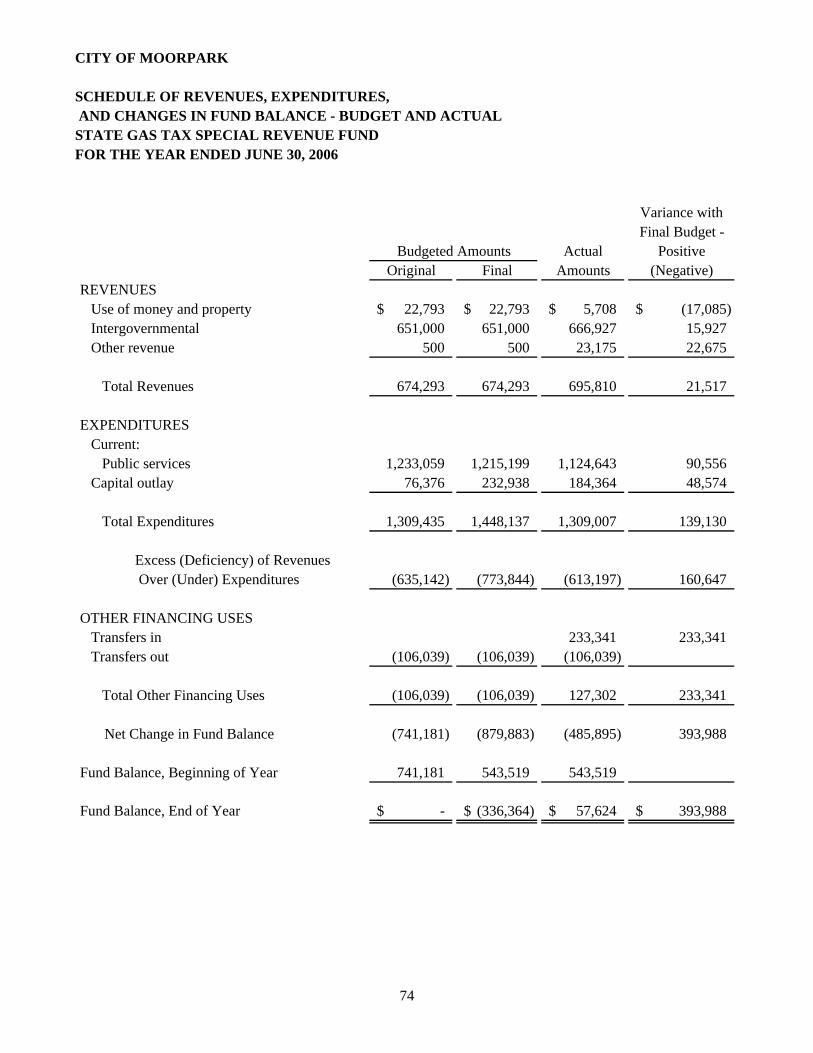
CITY OF MOORPARK
SCHEDULE OF REVENUES, EXPENDITURES, AND CHANGES IN FUND BALANCE - BUDGET AND ACTUALSTATE GAS TAX SPECIAL REVENUE FUND FOR THE YEAR ENDED JUNE 30, 2006
Variance withFinal Budget -
Actual PositiveOriginal Final Amounts (Negative)
REVENUES Use of money and property 22,793$ 22,793$ 5,708$ (17,085)$ Intergovernmental 651,000 651,000 666,927 15,927 Other revenue 500 500 23,175 22,675
Total Revenues 674,293 674,293 695,810 21,517
EXPENDITURES Current: Public services 1,233,059 1,215,199 1,124,643 90,556 Capital outlay 76,376 232,938 184,364 48,574
Total Expenditures 1,309,435 1,448,137 1,309,007 139,130
Excess (Deficiency) of Revenues Over (Under) Expenditures (635,142) (773,844) (613,197) 160,647
OTHER FINANCING USES Transfers in 233,341 233,341 Transfers out (106,039) (106,039) (106,039)
Total Other Financing Uses (106,039) (106,039) 127,302 233,341
Net Change in Fund Balance (741,181) (879,883) (485,895) 393,988
Fund Balance, Beginning of Year 741,181 543,519 543,519
Fund Balance, End of Year -$ (336,364)$ 57,624$ 393,988$
Budgeted Amounts
74
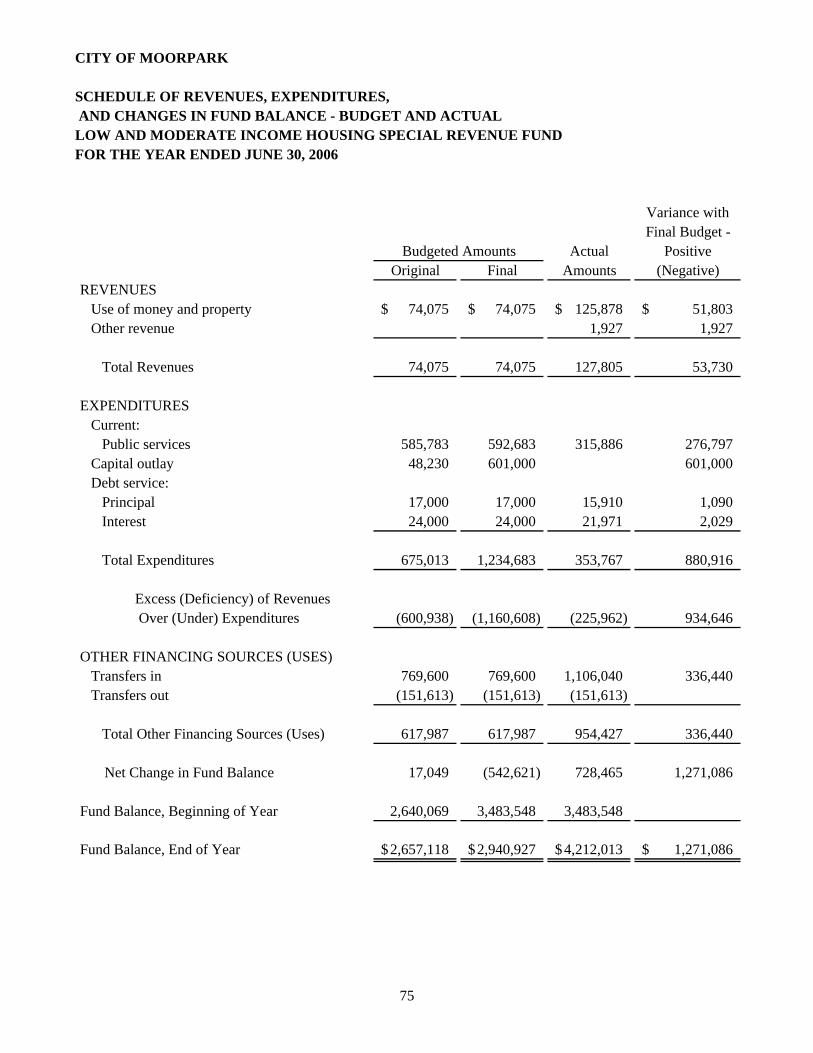
CITY OF MOORPARK
SCHEDULE OF REVENUES, EXPENDITURES, AND CHANGES IN FUND BALANCE - BUDGET AND ACTUALLOW AND MODERATE INCOME HOUSING SPECIAL REVENUE FUND FOR THE YEAR ENDED JUNE 30, 2006
Variance withFinal Budget -
Actual PositiveOriginal Final Amounts (Negative)
REVENUES Use of money and property 74,075$ 74,075$ 125,878$ 51,803$ Other revenue 1,927 1,927
Total Revenues 74,075 74,075 127,805 53,730
EXPENDITURES Current: Public services 585,783 592,683 315,886 276,797 Capital outlay 48,230 601,000 601,000 Debt service: Principal 17,000 17,000 15,910 1,090 Interest 24,000 24,000 21,971 2,029
Total Expenditures 675,013 1,234,683 353,767 880,916
Excess (Deficiency) of Revenues Over (Under) Expenditures (600,938) (1,160,608) (225,962) 934,646
OTHER FINANCING SOURCES (USES) Transfers in 769,600 769,600 1,106,040 336,440 Transfers out (151,613) (151,613) (151,613)
Total Other Financing Sources (Uses) 617,987 617,987 954,427 336,440
Net Change in Fund Balance 17,049 (542,621) 728,465 1,271,086
Fund Balance, Beginning of Year 2,640,069 3,483,548 3,483,548
Fund Balance, End of Year 2,657,118$ 2,940,927$ 4,212,013$ 1,271,086$
Budgeted Amounts
75
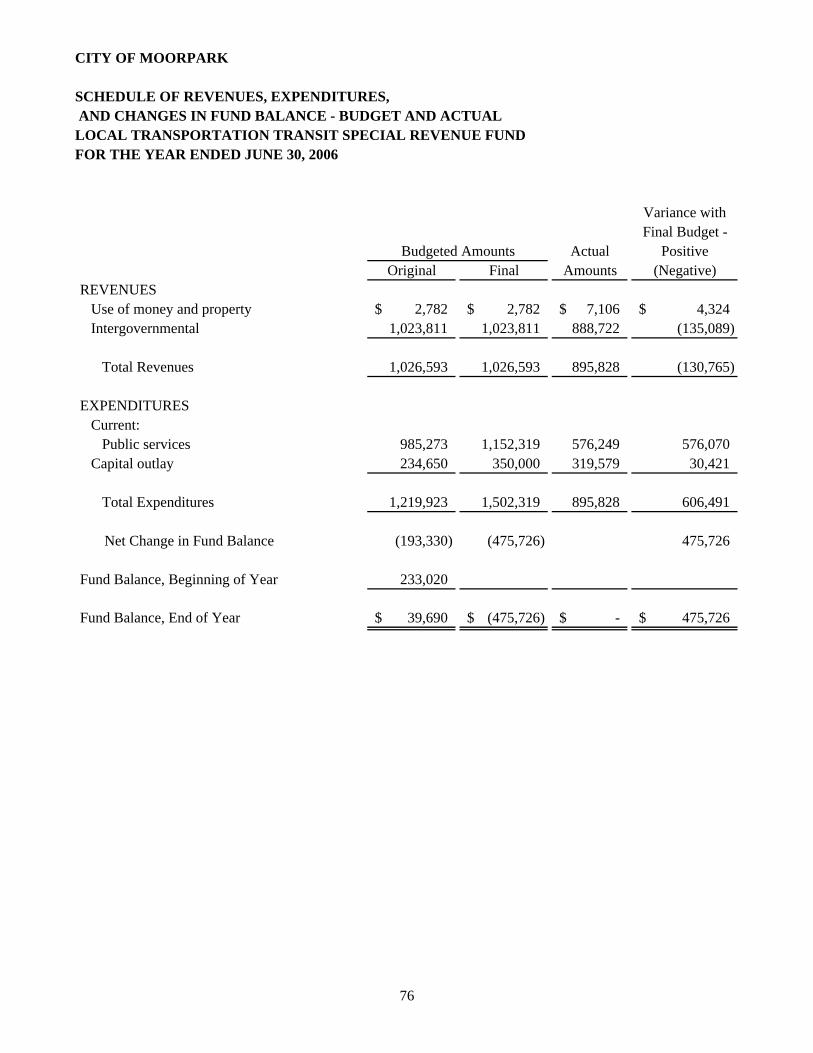
CITY OF MOORPARK
SCHEDULE OF REVENUES, EXPENDITURES, AND CHANGES IN FUND BALANCE - BUDGET AND ACTUALLOCAL TRANSPORTATION TRANSIT SPECIAL REVENUE FUND FOR THE YEAR ENDED JUNE 30, 2006
Variance withFinal Budget -
Actual PositiveOriginal Final Amounts (Negative)
REVENUES Use of money and property 2,782$ 2,782$ 7,106$ 4,324$ Intergovernmental 1,023,811 1,023,811 888,722 (135,089)
Total Revenues 1,026,593 1,026,593 895,828 (130,765)
EXPENDITURES Current: Public services 985,273 1,152,319 576,249 576,070 Capital outlay 234,650 350,000 319,579 30,421
Total Expenditures 1,219,923 1,502,319 895,828 606,491
Net Change in Fund Balance (193,330) (475,726) 475,726
Fund Balance, Beginning of Year 233,020
Fund Balance, End of Year 39,690$ (475,726)$ -$ 475,726$
Budgeted Amounts
76
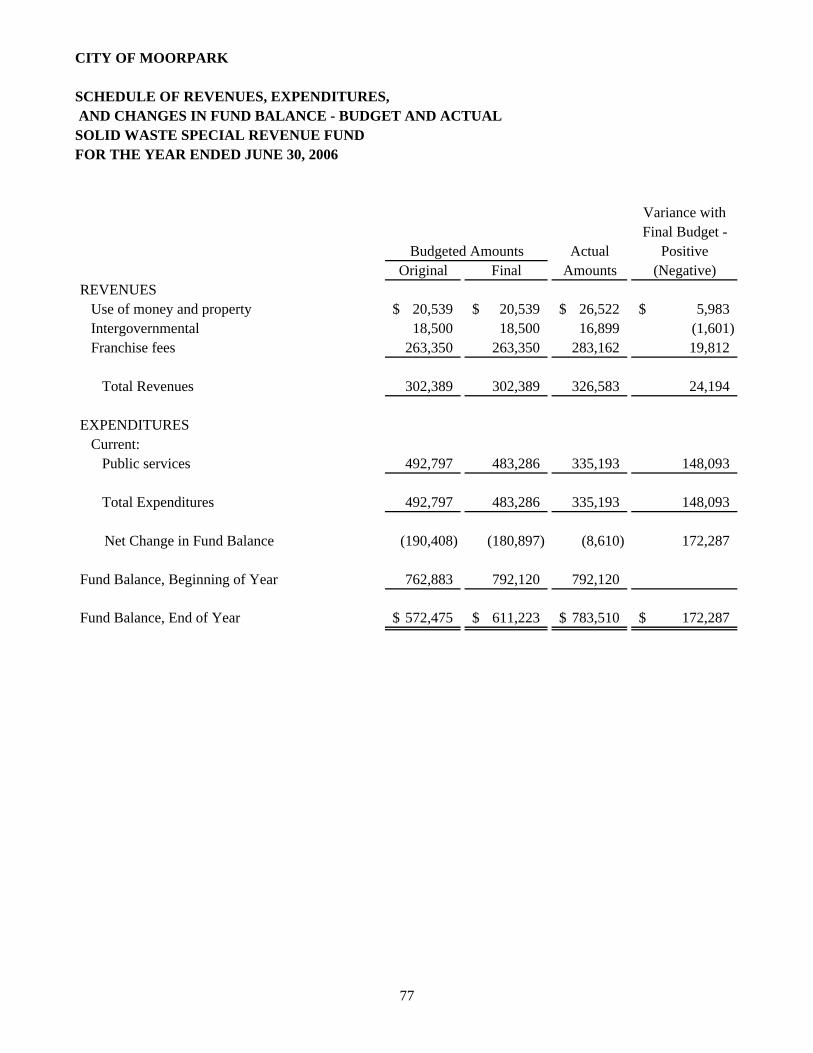
CITY OF MOORPARK
SCHEDULE OF REVENUES, EXPENDITURES, AND CHANGES IN FUND BALANCE - BUDGET AND ACTUALSOLID WASTE SPECIAL REVENUE FUND FOR THE YEAR ENDED JUNE 30, 2006
Variance withFinal Budget -
Actual PositiveOriginal Final Amounts (Negative)
REVENUES Use of money and property 20,539$ 20,539$ 26,522$ 5,983$ Intergovernmental 18,500 18,500 16,899 (1,601) Franchise fees 263,350 263,350 283,162 19,812
Total Revenues 302,389 302,389 326,583 24,194
EXPENDITURES Current: Public services 492,797 483,286 335,193 148,093
Total Expenditures 492,797 483,286 335,193 148,093
Net Change in Fund Balance (190,408) (180,897) (8,610) 172,287
Fund Balance, Beginning of Year 762,883 792,120 792,120
Fund Balance, End of Year 572,475$ 611,223$ 783,510$ 172,287$
Budgeted Amounts
77
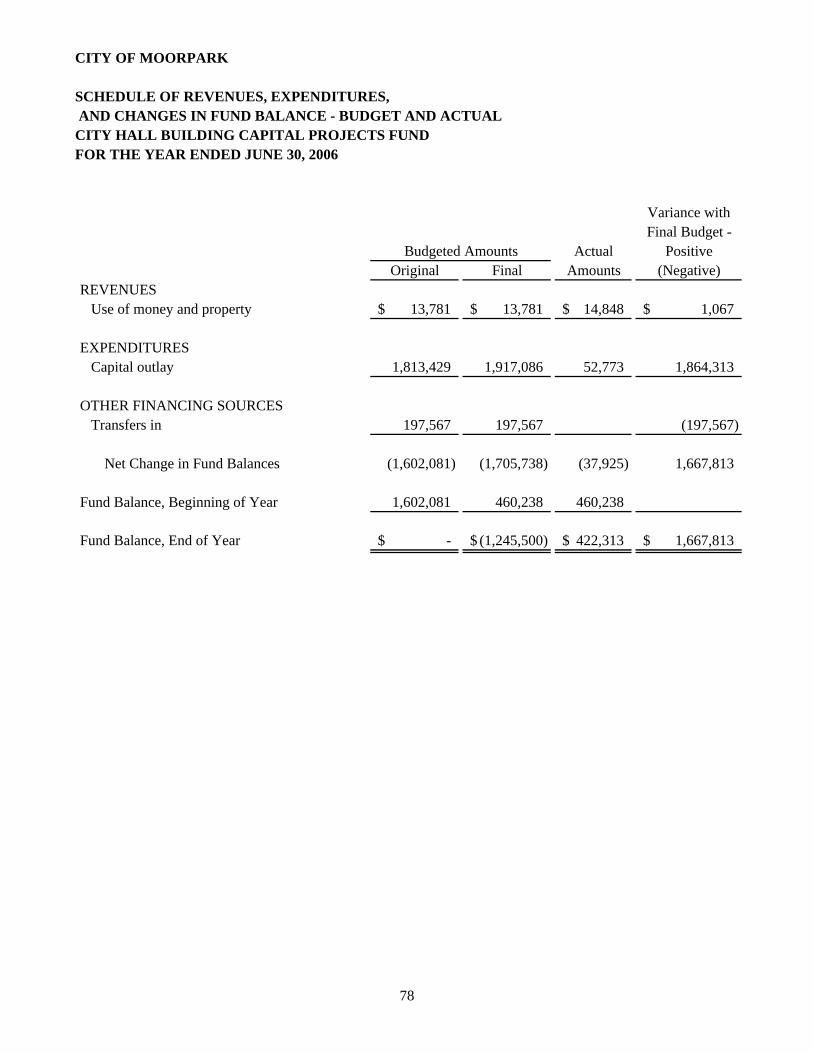
CITY OF MOORPARK
SCHEDULE OF REVENUES, EXPENDITURES, AND CHANGES IN FUND BALANCE - BUDGET AND ACTUALCITY HALL BUILDING CAPITAL PROJECTS FUNDFOR THE YEAR ENDED JUNE 30, 2006
Variance withFinal Budget -
Actual PositiveOriginal Final Amounts (Negative)
REVENUES Use of money and property 13,781$ 13,781$ 14,848$ 1,067$
EXPENDITURES Capital outlay 1,813,429 1,917,086 52,773 1,864,313
OTHER FINANCING SOURCES Transfers in 197,567 197,567 (197,567)
Net Change in Fund Balances (1,602,081) (1,705,738) (37,925) 1,667,813
Fund Balance, Beginning of Year 1,602,081 460,238 460,238
Fund Balance, End of Year -$ (1,245,500)$ 422,313$ 1,667,813$
Budgeted Amounts
78
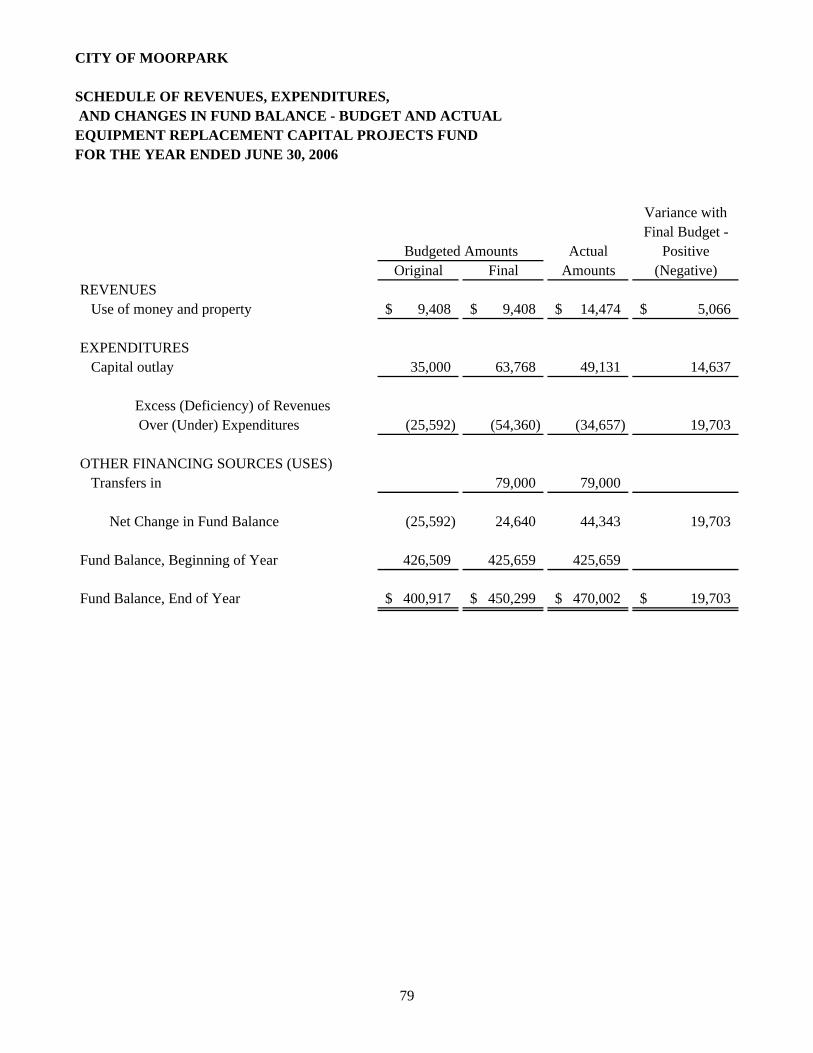
CITY OF MOORPARK
SCHEDULE OF REVENUES, EXPENDITURES, AND CHANGES IN FUND BALANCE - BUDGET AND ACTUALEQUIPMENT REPLACEMENT CAPITAL PROJECTS FUNDFOR THE YEAR ENDED JUNE 30, 2006
Variance withFinal Budget -
Actual PositiveOriginal Final Amounts (Negative)
REVENUES Use of money and property 9,408$ 9,408$ 14,474$ 5,066$
EXPENDITURES Capital outlay 35,000 63,768 49,131 14,637
Excess (Deficiency) of Revenues Over (Under) Expenditures (25,592) (54,360) (34,657) 19,703
OTHER FINANCING SOURCES (USES) Transfers in 79,000 79,000
Net Change in Fund Balance (25,592) 24,640 44,343 19,703
Fund Balance, Beginning of Year 426,509 425,659 425,659
Fund Balance, End of Year 400,917$ 450,299$ 470,002$ 19,703$
Budgeted Amounts
79
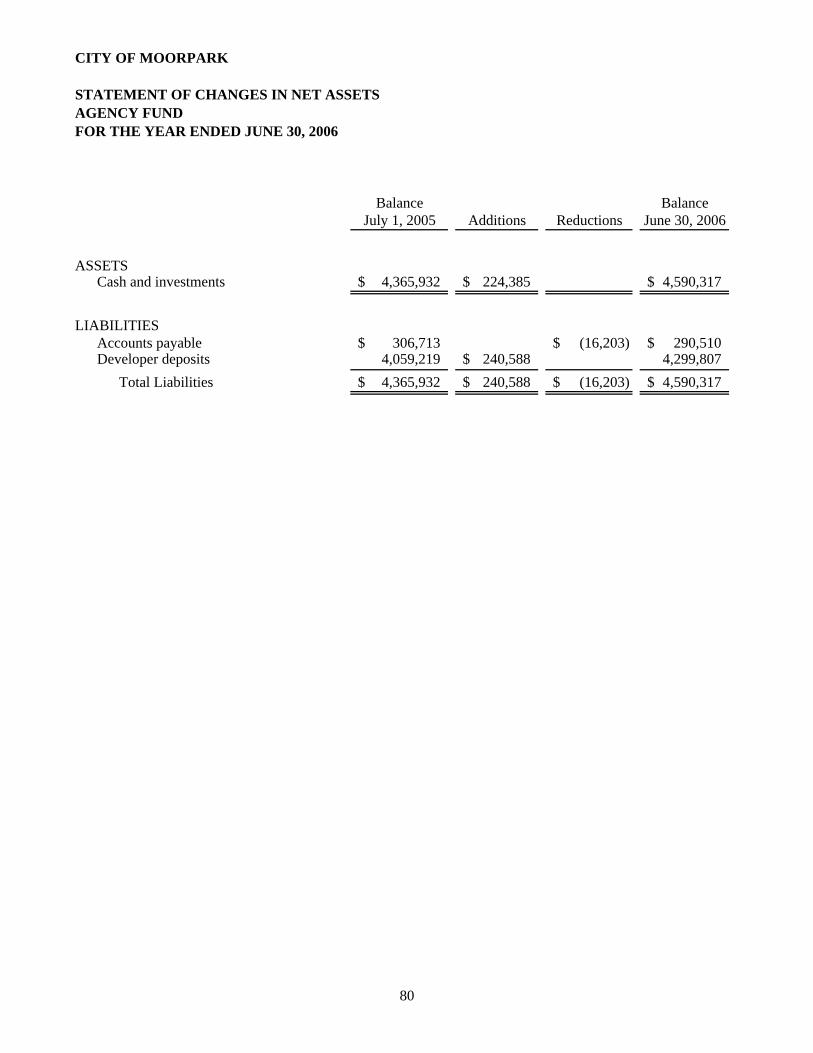
CITY OF MOORPARK
STATEMENT OF CHANGES IN NET ASSETSAGENCY FUNDFOR THE YEAR ENDED JUNE 30, 2006
Balance BalanceJuly 1, 2005 Additions Reductions June 30, 2006
ASSETS Cash and investments 4,365,932$ 224,385$ 4,590,317$
LIABILITIES Accounts payable 306,713$ (16,203)$ 290,510$ Developer deposits 4,059,219 240,588$ 4,299,807
Total Liabilities 4,365,932$ 240,588$ (16,203)$ 4,590,317$
80
STATISTICAL SECTION
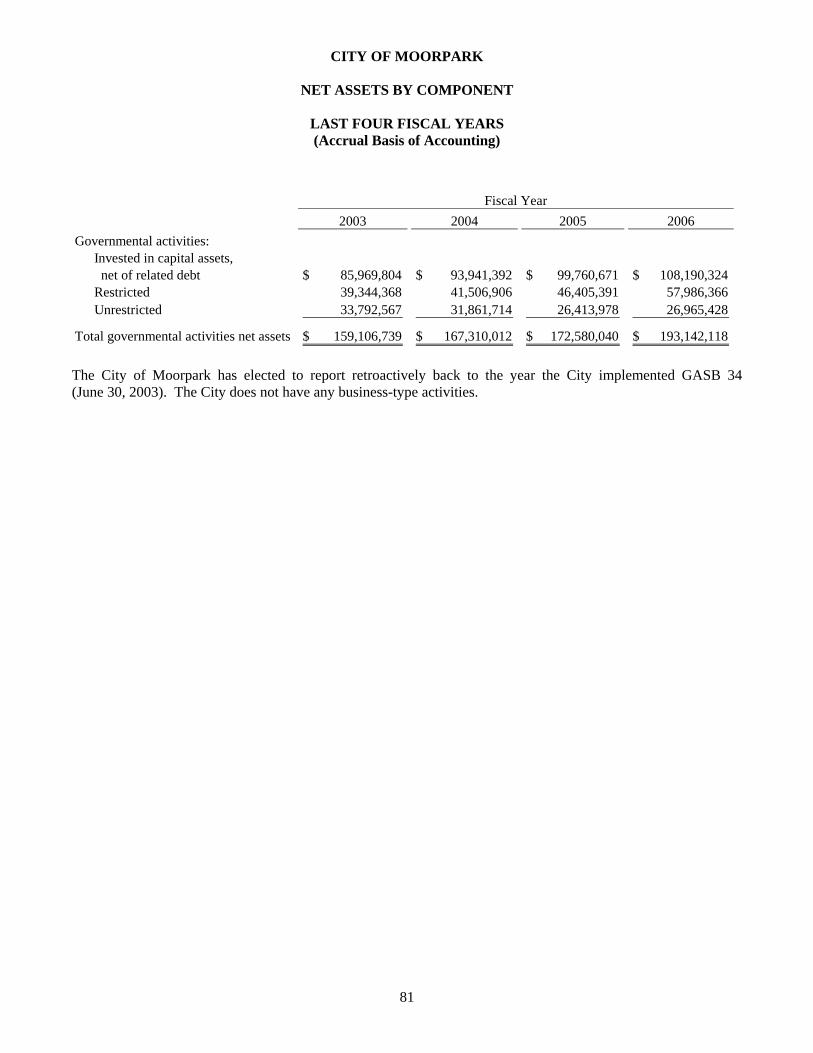
CITY OF MOORPARK
NET ASSETS BY COMPONENT
LAST FOUR FISCAL YEARS (Accrual Basis of Accounting)
81
2003 2004 2005 2006Governmental activities:
Invested in capital assets, net of related debt 85,969,804$ 93,941,392$ 99,760,671$ 108,190,324$ Restricted 39,344,368 41,506,906 46,405,391 57,986,366 Unrestricted 33,792,567 31,861,714 26,413,978 26,965,428
Total governmental activities net assets 159,106,739$ 167,310,012$ 172,580,040$ 193,142,118$
Fiscal Year
The City of Moorpark has elected to report retroactively back to the year the City implemented GASB 34 (June 30, 2003). The City does not have any business-type activities.
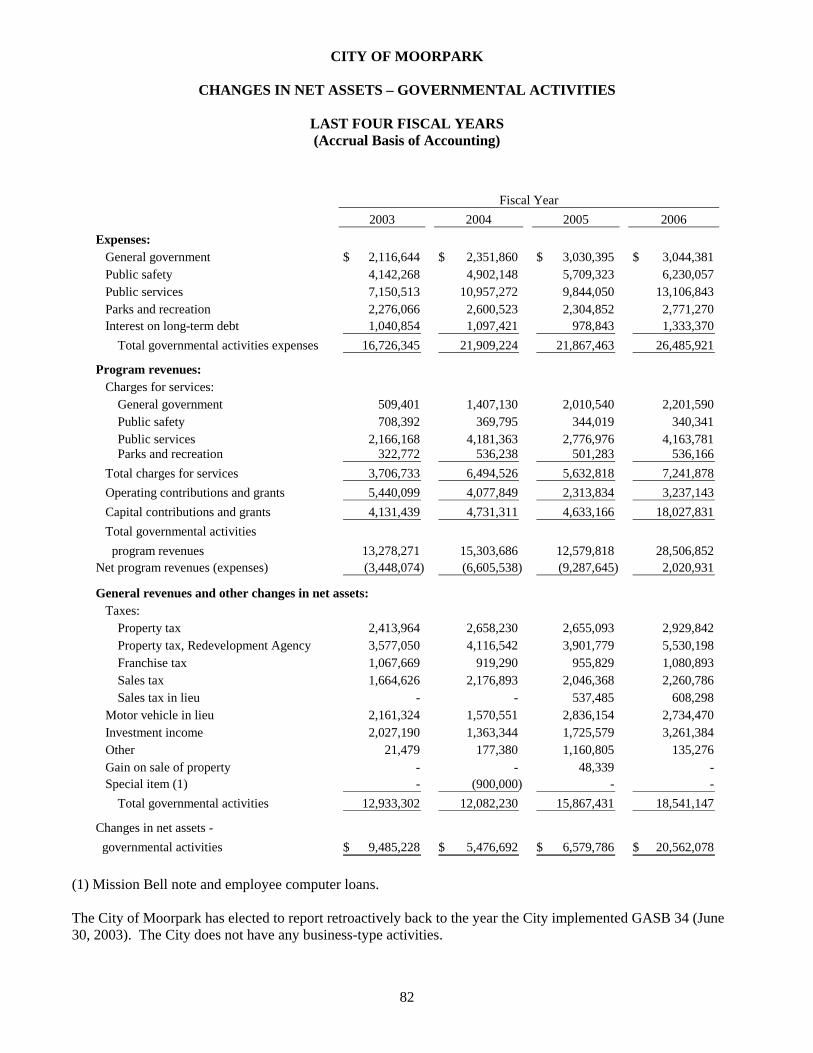
CITY OF MOORPARK
CHANGES IN NET ASSETS – GOVERNMENTAL ACTIVITIES
LAST FOUR FISCAL YEARS (Accrual Basis of Accounting)
82
2003 2004 2005 2006Expenses:
General government 2,116,644$ 2,351,860$ 3,030,395$ 3,044,381$ Public safety 4,142,268 4,902,148 5,709,323 6,230,057 Public services 7,150,513 10,957,272 9,844,050 13,106,843 Parks and recreation 2,276,066 2,600,523 2,304,852 2,771,270 Interest on long-term debt 1,040,854 1,097,421 978,843 1,333,370
Total governmental activities expenses 16,726,345 21,909,224 21,867,463 26,485,921
Program revenues:Charges for services:
General government 509,401 1,407,130 2,010,540 2,201,590 Public safety 708,392 369,795 344,019 340,341 Public services 2,166,168 4,181,363 2,776,976 4,163,781 Parks and recreation 322,772 536,238 501,283 536,166
Total charges for services 3,706,733 6,494,526 5,632,818 7,241,878 Operating contributions and grants 5,440,099 4,077,849 2,313,834 3,237,143 Capital contributions and grants 4,131,439 4,731,311 4,633,166 18,027,831 Total governmental activities program revenues 13,278,271 15,303,686 12,579,818 28,506,852
Net program revenues (expenses) (3,448,074) (6,605,538) (9,287,645) 2,020,931
General revenues and other changes in net assets:Taxes:
Property tax 2,413,964 2,658,230 2,655,093 2,929,842 Property tax, Redevelopment Agency 3,577,050 4,116,542 3,901,779 5,530,198 Franchise tax 1,067,669 919,290 955,829 1,080,893 Sales tax 1,664,626 2,176,893 2,046,368 2,260,786 Sales tax in lieu - - 537,485 608,298
Motor vehicle in lieu 2,161,324 1,570,551 2,836,154 2,734,470 Investment income 2,027,190 1,363,344 1,725,579 3,261,384 Other 21,479 177,380 1,160,805 135,276 Gain on sale of property - - 48,339 - Special item (1) - (900,000) - -
Total governmental activities 12,933,302 12,082,230 15,867,431 18,541,147
Changes in net assets - governmental activities 9,485,228$ 5,476,692$ 6,579,786$ 20,562,078$
Fiscal Year
(1) Mission Bell note and employee computer loans. The City of Moorpark has elected to report retroactively back to the year the City implemented GASB 34 (June 30, 2003). The City does not have any business-type activities.
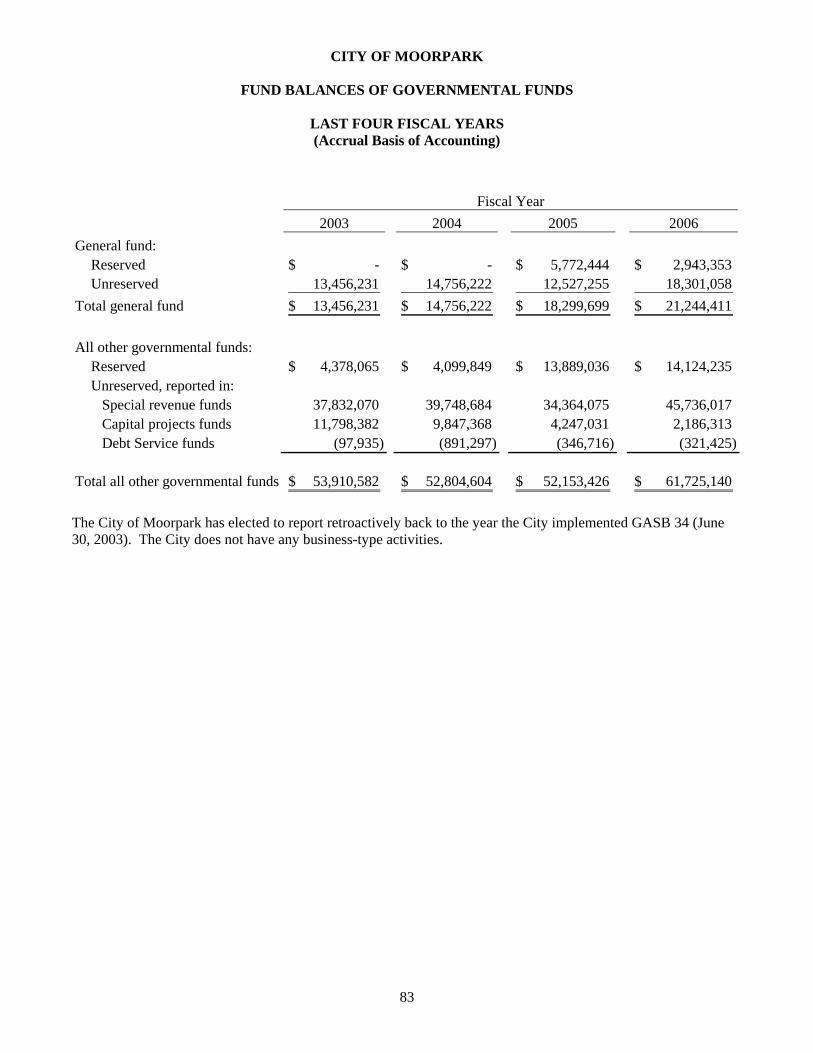
CITY OF MOORPARK
FUND BALANCES OF GOVERNMENTAL FUNDS
LAST FOUR FISCAL YEARS (Accrual Basis of Accounting)
83
2003 2004 2005 2006General fund:
Reserved -$ -$ 5,772,444$ 2,943,353$ Unreserved 13,456,231 14,756,222 12,527,255 18,301,058
Total general fund 13,456,231$ 14,756,222$ 18,299,699$ 21,244,411$
All other governmental funds:Reserved 4,378,065$ 4,099,849$ 13,889,036$ 14,124,235$ Unreserved, reported in:
Special revenue funds 37,832,070 39,748,684 34,364,075 45,736,017 Capital projects funds 11,798,382 9,847,368 4,247,031 2,186,313 Debt Service funds (97,935) (891,297) (346,716) (321,425)
Total all other governmental funds 53,910,582$ 52,804,604$ 52,153,426$ 61,725,140$
Fiscal Year
The City of Moorpark has elected to report retroactively back to the year the City implemented GASB 34 (June 30, 2003). The City does not have any business-type activities.
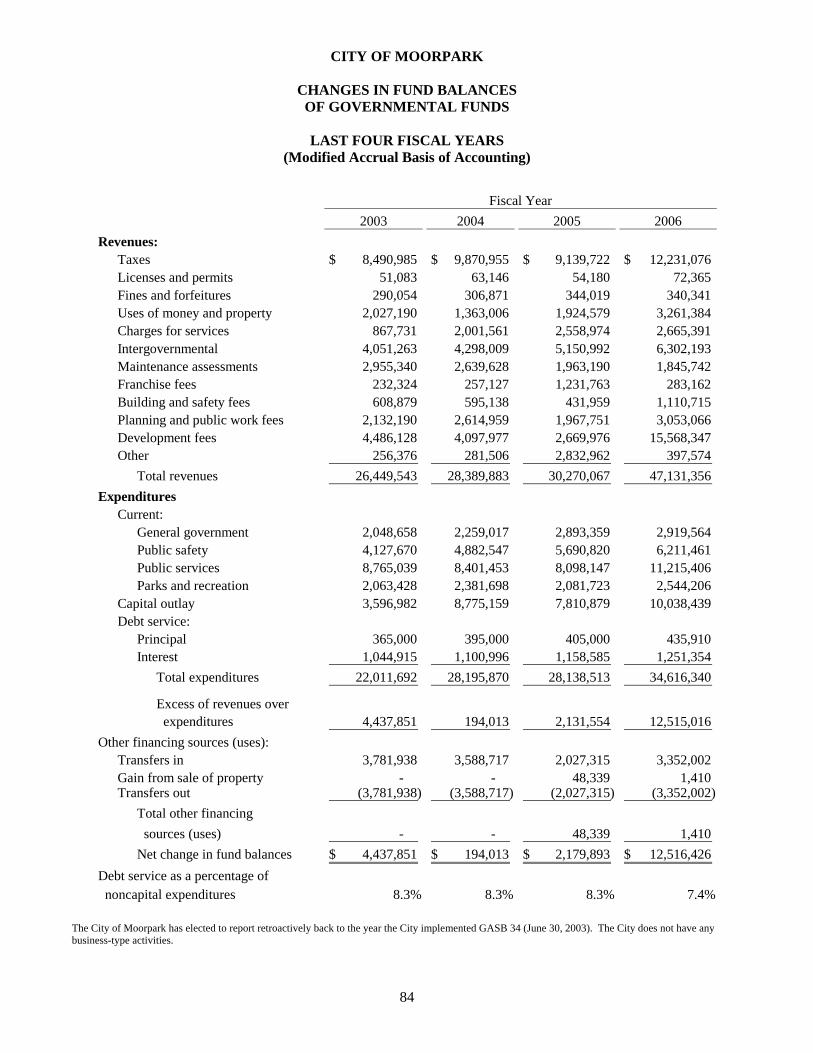
CITY OF MOORPARK
CHANGES IN FUND BALANCES OF GOVERNMENTAL FUNDS
LAST FOUR FISCAL YEARS
(Modified Accrual Basis of Accounting)
84
2003 2004 2005 2006Revenues:
Taxes 8,490,985$ 9,870,955$ 9,139,722$ 12,231,076$ Licenses and permits 51,083 63,146 54,180 72,365 Fines and forfeitures 290,054 306,871 344,019 340,341 Uses of money and property 2,027,190 1,363,006 1,924,579 3,261,384 Charges for services 867,731 2,001,561 2,558,974 2,665,391 Intergovernmental 4,051,263 4,298,009 5,150,992 6,302,193 Maintenance assessments 2,955,340 2,639,628 1,963,190 1,845,742 Franchise fees 232,324 257,127 1,231,763 283,162 Building and safety fees 608,879 595,138 431,959 1,110,715 Planning and public work fees 2,132,190 2,614,959 1,967,751 3,053,066 Development fees 4,486,128 4,097,977 2,669,976 15,568,347 Other 256,376 281,506 2,832,962 397,574
Total revenues 26,449,543 28,389,883 30,270,067 47,131,356 Expenditures
Current:General government 2,048,658 2,259,017 2,893,359 2,919,564 Public safety 4,127,670 4,882,547 5,690,820 6,211,461 Public services 8,765,039 8,401,453 8,098,147 11,215,406 Parks and recreation 2,063,428 2,381,698 2,081,723 2,544,206
Capital outlay 3,596,982 8,775,159 7,810,879 10,038,439 Debt service:
Principal 365,000 395,000 405,000 435,910 Interest 1,044,915 1,100,996 1,158,585 1,251,354
Total expenditures 22,011,692 28,195,870 28,138,513 34,616,340
Excess of revenues over expenditures 4,437,851 194,013 2,131,554 12,515,016
Other financing sources (uses):Transfers in 3,781,938 3,588,717 2,027,315 3,352,002 Gain from sale of property - - 48,339 1,410 Transfers out (3,781,938) (3,588,717) (2,027,315) (3,352,002)
Total other financing sources (uses) - - 48,339 1,410 Net change in fund balances 4,437,851$ 194,013$ 2,179,893$ 12,516,426$
Debt service as a percentage of noncapital expenditures 8.3% 8.3% 8.3% 7.4%
Fiscal Year
The City of Moorpark has elected to report retroactively back to the year the City implemented GASB 34 (June 30, 2003). The City does not have any business-type activities.
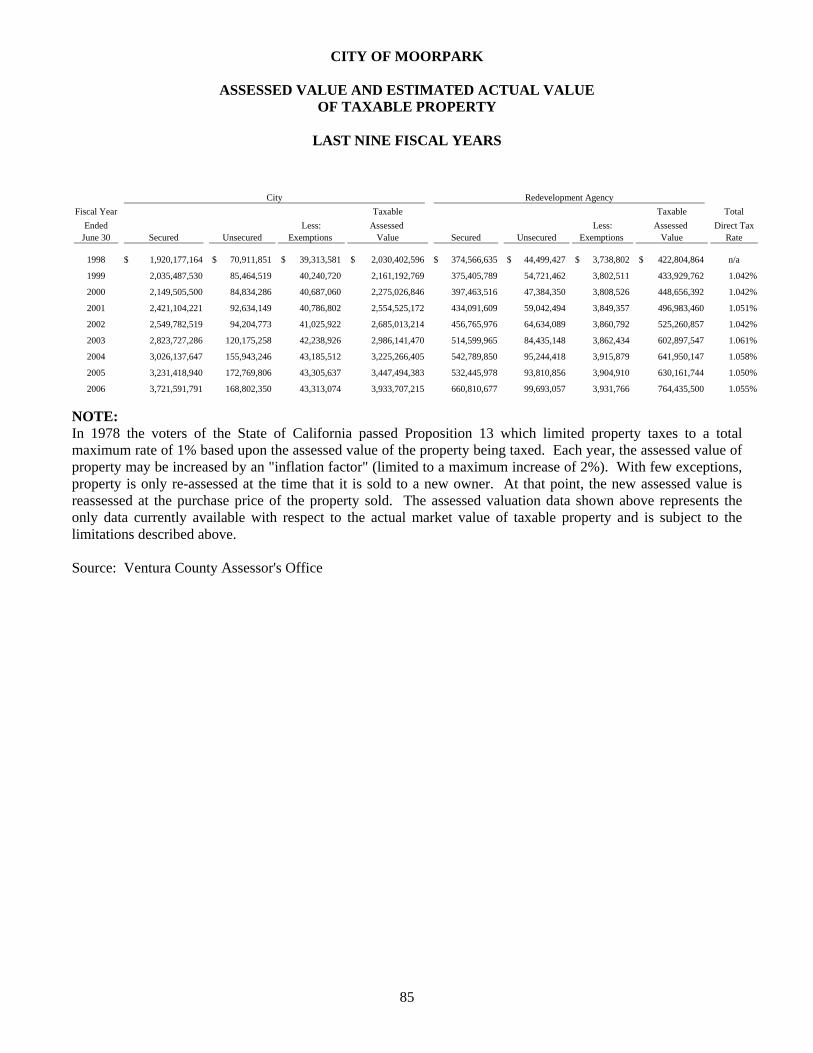
CITY OF MOORPARK
ASSESSED VALUE AND ESTIMATED ACTUAL VALUE OF TAXABLE PROPERTY
LAST NINE FISCAL YEARS
85
Fiscal Year Taxable Taxable TotalEnded Less: Assessed Less: Assessed Direct Tax
June 30 Secured Unsecured Exemptions Value Secured Unsecured Exemptions Value Rate
1998 1,920,177,164$ 70,911,851$ 39,313,581$ 2,030,402,596$ 374,566,635$ 44,499,427$ 3,738,802$ 422,804,864$ n/a
1999 2,035,487,530 85,464,519 40,240,720 2,161,192,769 375,405,789 54,721,462 3,802,511 433,929,762 1.042%
2000 2,149,505,500 84,834,286 40,687,060 2,275,026,846 397,463,516 47,384,350 3,808,526 448,656,392 1.042%
2001 2,421,104,221 92,634,149 40,786,802 2,554,525,172 434,091,609 59,042,494 3,849,357 496,983,460 1.051%
2002 2,549,782,519 94,204,773 41,025,922 2,685,013,214 456,765,976 64,634,089 3,860,792 525,260,857 1.042%
2003 2,823,727,286 120,175,258 42,238,926 2,986,141,470 514,599,965 84,435,148 3,862,434 602,897,547 1.061%
2004 3,026,137,647 155,943,246 43,185,512 3,225,266,405 542,789,850 95,244,418 3,915,879 641,950,147 1.058%
2005 3,231,418,940 172,769,806 43,305,637 3,447,494,383 532,445,978 93,810,856 3,904,910 630,161,744 1.050%
2006 3,721,591,791 168,802,350 43,313,074 3,933,707,215 660,810,677 99,693,057 3,931,766 764,435,500 1.055%
City Redevelopment Agency
NOTE: In 1978 the voters of the State of California passed Proposition 13 which limited property taxes to a total maximum rate of 1% based upon the assessed value of the property being taxed. Each year, the assessed value of property may be increased by an "inflation factor" (limited to a maximum increase of 2%). With few exceptions, property is only re-assessed at the time that it is sold to a new owner. At that point, the new assessed value is reassessed at the purchase price of the property sold. The assessed valuation data shown above represents the only data currently available with respect to the actual market value of taxable property and is subject to the limitations described above. Source: Ventura County Assessor's Office
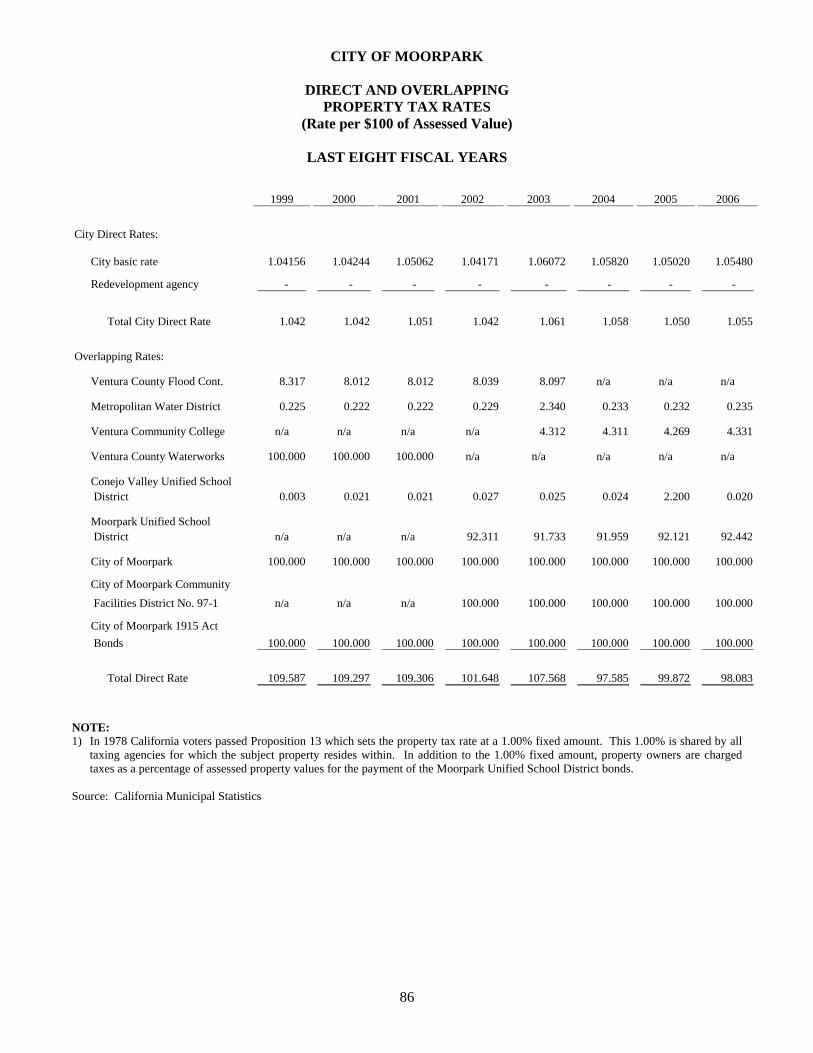
CITY OF MOORPARK
DIRECT AND OVERLAPPING PROPERTY TAX RATES
(Rate per $100 of Assessed Value)
LAST EIGHT FISCAL YEARS
86
1999 2000 2001 2002 2003 2004 2005 2006
City Direct Rates:
City basic rate 1.04156 1.04244 1.05062 1.04171 1.06072 1.05820 1.05020 1.05480
Redevelopment agency - - - - - - - -
Total City Direct Rate 1.042 1.042 1.051 1.042 1.061 1.058 1.050 1.055
Overlapping Rates:
Ventura County Flood Cont. 8.317 8.012 8.012 8.039 8.097 n/a n/a n/a
Metropolitan Water District 0.225 0.222 0.222 0.229 2.340 0.233 0.232 0.235
Ventura Community College n/a n/a n/a n/a 4.312 4.311 4.269 4.331
Ventura County Waterworks 100.000 100.000 100.000 n/a n/a n/a n/a n/a
Conejo Valley Unified School District 0.003 0.021 0.021 0.027 0.025 0.024 2.200 0.020
Moorpark Unified School District n/a n/a n/a 92.311 91.733 91.959 92.121 92.442
City of Moorpark 100.000 100.000 100.000 100.000 100.000 100.000 100.000 100.000
City of Moorpark Community Facilities District No. 97-1 n/a n/a n/a 100.000 100.000 100.000 100.000 100.000
City of Moorpark 1915 Act Bonds 100.000 100.000 100.000 100.000 100.000 100.000 100.000 100.000
Total Direct Rate 109.587 109.297 109.306 101.648 107.568 97.585 99.872 98.083
NOTE: 1) In 1978 California voters passed Proposition 13 which sets the property tax rate at a 1.00% fixed amount. This 1.00% is shared by all
taxing agencies for which the subject property resides within. In addition to the 1.00% fixed amount, property owners are charged taxes as a percentage of assessed property values for the payment of the Moorpark Unified School District bonds.
Source: California Municipal Statistics
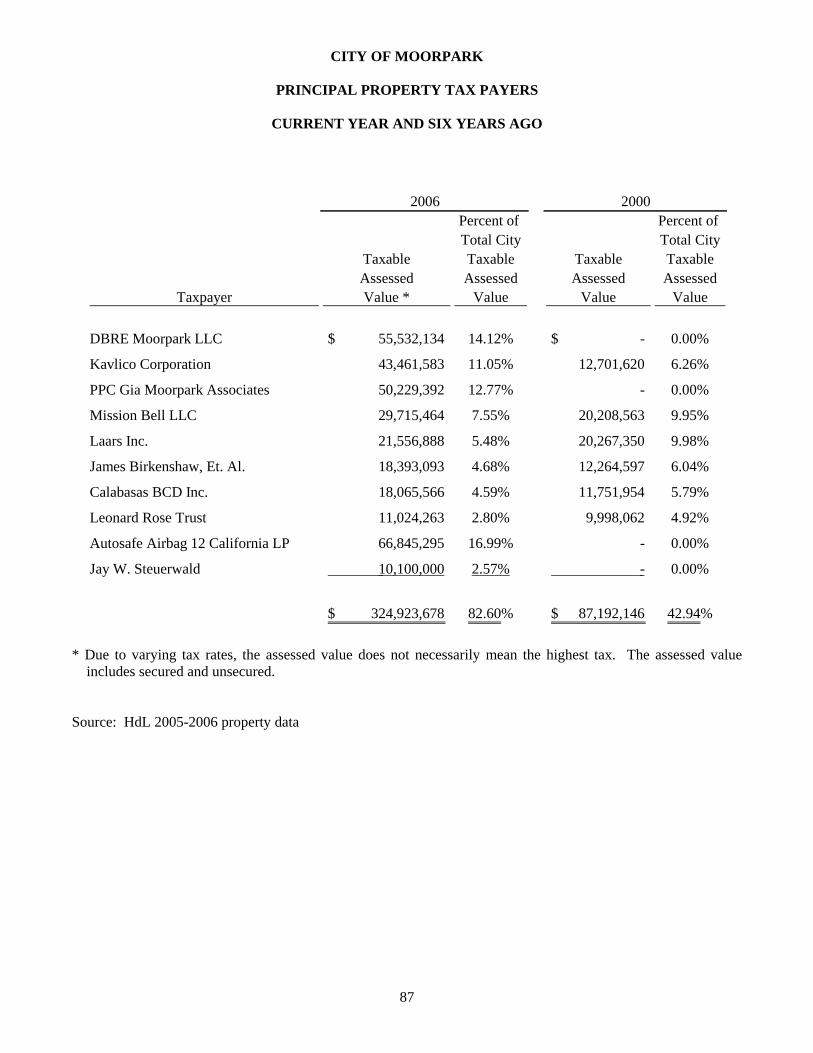
CITY OF MOORPARK
PRINCIPAL PROPERTY TAX PAYERS
CURRENT YEAR AND SIX YEARS AGO
87
Percent of Percent of Total City Total City
Taxable Taxable Taxable TaxableAssessed Assessed Assessed Assessed
Taxpayer Value * Value Value Value
DBRE Moorpark LLC 55,532,134$ 14.12% -$ 0.00%
Kavlico Corporation 43,461,583 11.05% 12,701,620 6.26%
PPC Gia Moorpark Associates 50,229,392 12.77% - 0.00%
Mission Bell LLC 29,715,464 7.55% 20,208,563 9.95%
Laars Inc. 21,556,888 5.48% 20,267,350 9.98%
James Birkenshaw, Et. Al. 18,393,093 4.68% 12,264,597 6.04%
Calabasas BCD Inc. 18,065,566 4.59% 11,751,954 5.79%
Leonard Rose Trust 11,024,263 2.80% 9,998,062 4.92%
Autosafe Airbag 12 California LP 66,845,295 16.99% - 0.00%
Jay W. Steuerwald 10,100,000 2.57% - 0.00%
324,923,678$ 82.60% 87,192,146$ 42.94%
2006 2000
* Due to varying tax rates, the assessed value does not necessarily mean the highest tax. The assessed value includes secured and unsecured. Source: HdL 2005-2006 property data
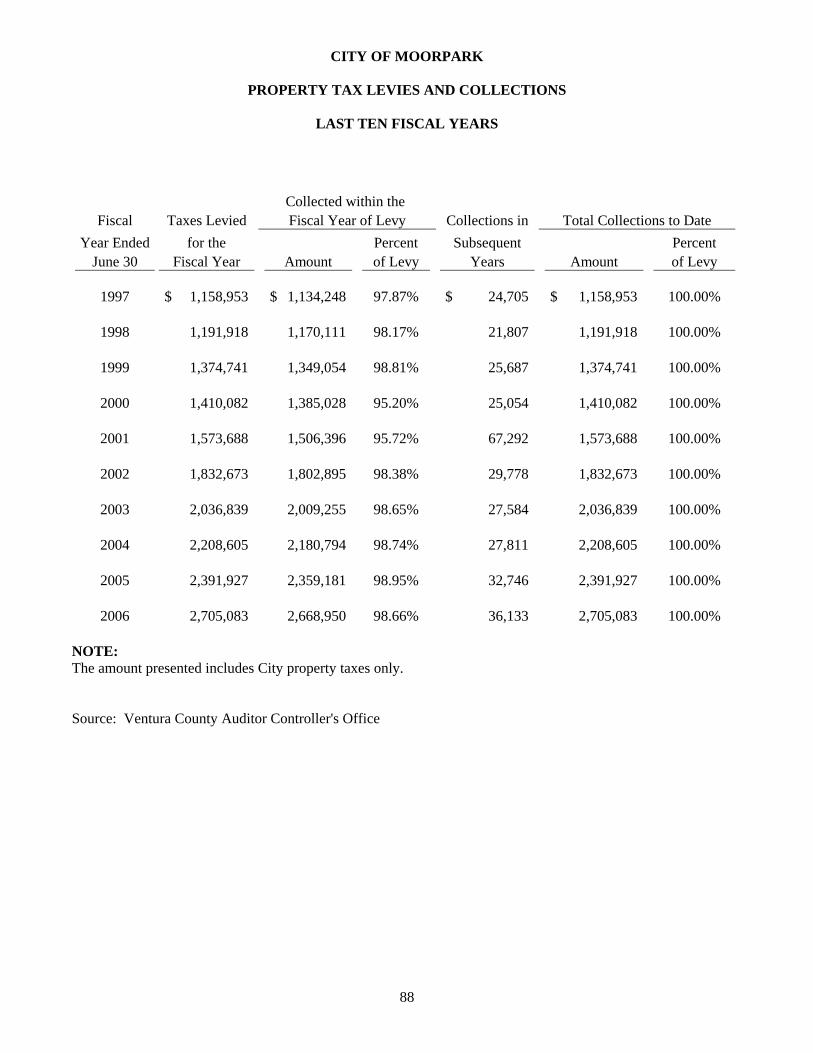
CITY OF MOORPARK
PROPERTY TAX LEVIES AND COLLECTIONS
LAST TEN FISCAL YEARS
88
Fiscal Taxes Levied Collections inYear Ended for the Percent Subsequent Percent
June 30 Fiscal Year Amount of Levy Years Amount of Levy
1997 1,158,953$ 1,134,248$ 97.87% 24,705$ 1,158,953$ 100.00%
1998 1,191,918 1,170,111 98.17% 21,807 1,191,918 100.00%
1999 1,374,741 1,349,054 98.81% 25,687 1,374,741 100.00%
2000 1,410,082 1,385,028 95.20% 25,054 1,410,082 100.00%
2001 1,573,688 1,506,396 95.72% 67,292 1,573,688 100.00%
2002 1,832,673 1,802,895 98.38% 29,778 1,832,673 100.00%
2003 2,036,839 2,009,255 98.65% 27,584 2,036,839 100.00%
2004 2,208,605 2,180,794 98.74% 27,811 2,208,605 100.00%
2005 2,391,927 2,359,181 98.95% 32,746 2,391,927 100.00%
2006 2,705,083 2,668,950 98.66% 36,133 2,705,083 100.00%
Collected within the Fiscal Year of Levy Total Collections to Date
NOTE: The amount presented includes City property taxes only. Source: Ventura County Auditor Controller's Office
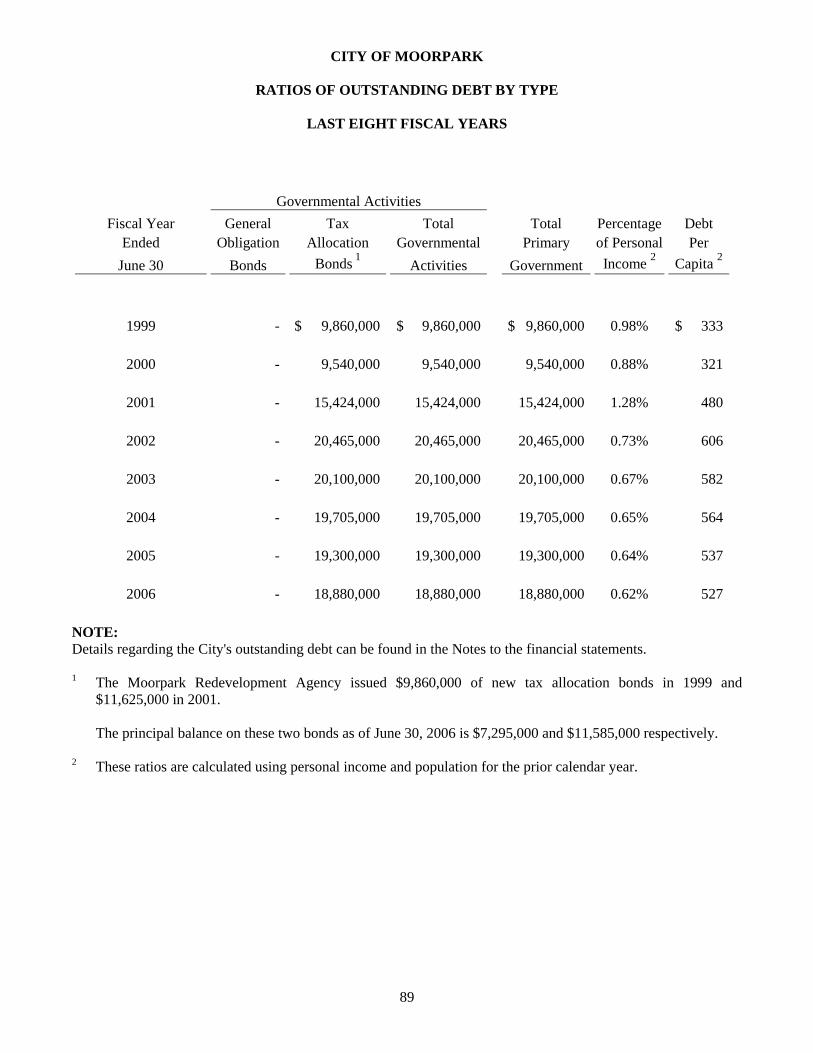
CITY OF MOORPARK
RATIOS OF OUTSTANDING DEBT BY TYPE
LAST EIGHT FISCAL YEARS
89
Fiscal Year General Tax Total Total Percentage DebtEnded Obligation Allocation Governmental Primary of Personal Per
June 30 Bonds Bonds 1Activities Government Income 2 Capita 2
1999 - 9,860,000$ 9,860,000$ 9,860,000$ 0.98% 333$
2000 - 9,540,000 9,540,000 9,540,000 0.88% 321
2001 - 15,424,000 15,424,000 15,424,000 1.28% 480
2002 - 20,465,000 20,465,000 20,465,000 0.73% 606
2003 - 20,100,000 20,100,000 20,100,000 0.67% 582
2004 - 19,705,000 19,705,000 19,705,000 0.65% 564
2005 - 19,300,000 19,300,000 19,300,000 0.64% 537
2006 - 18,880,000 18,880,000 18,880,000 0.62% 527
Governmental Activities
NOTE: Details regarding the City's outstanding debt can be found in the Notes to the financial statements. 1 The Moorpark Redevelopment Agency issued $9,860,000 of new tax allocation bonds in 1999 and
$11,625,000 in 2001.
The principal balance on these two bonds as of June 30, 2006 is $7,295,000 and $11,585,000 respectively. 2 These ratios are calculated using personal income and population for the prior calendar year.
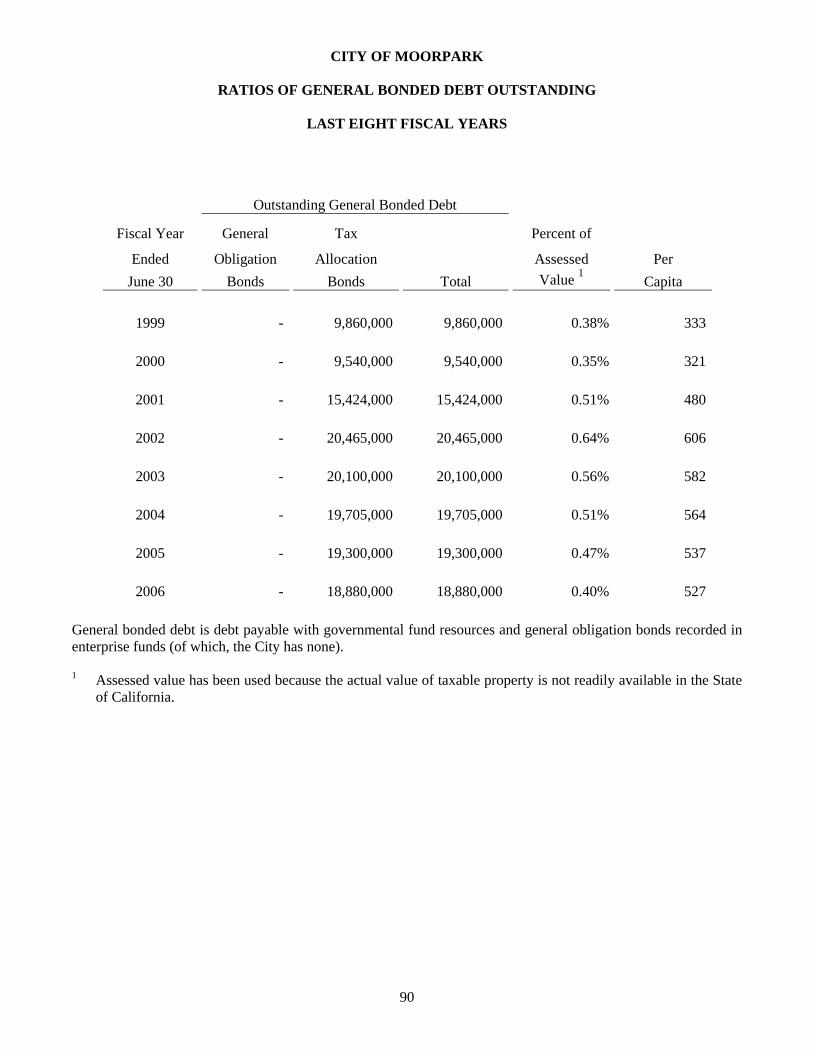
CITY OF MOORPARK
RATIOS OF GENERAL BONDED DEBT OUTSTANDING
LAST EIGHT FISCAL YEARS
90
Fiscal Year General Tax Percent of
Ended Obligation Allocation Assessed PerJune 30 Bonds Bonds Total Value 1 Capita
1999 - 9,860,000 9,860,000 0.38% 333
2000 - 9,540,000 9,540,000 0.35% 321
2001 - 15,424,000 15,424,000 0.51% 480
2002 - 20,465,000 20,465,000 0.64% 606
2003 - 20,100,000 20,100,000 0.56% 582
2004 - 19,705,000 19,705,000 0.51% 564
2005 - 19,300,000 19,300,000 0.47% 537
2006 - 18,880,000 18,880,000 0.40% 527
Outstanding General Bonded Debt
General bonded debt is debt payable with governmental fund resources and general obligation bonds recorded in enterprise funds (of which, the City has none). 1 Assessed value has been used because the actual value of taxable property is not readily available in the State
of California.
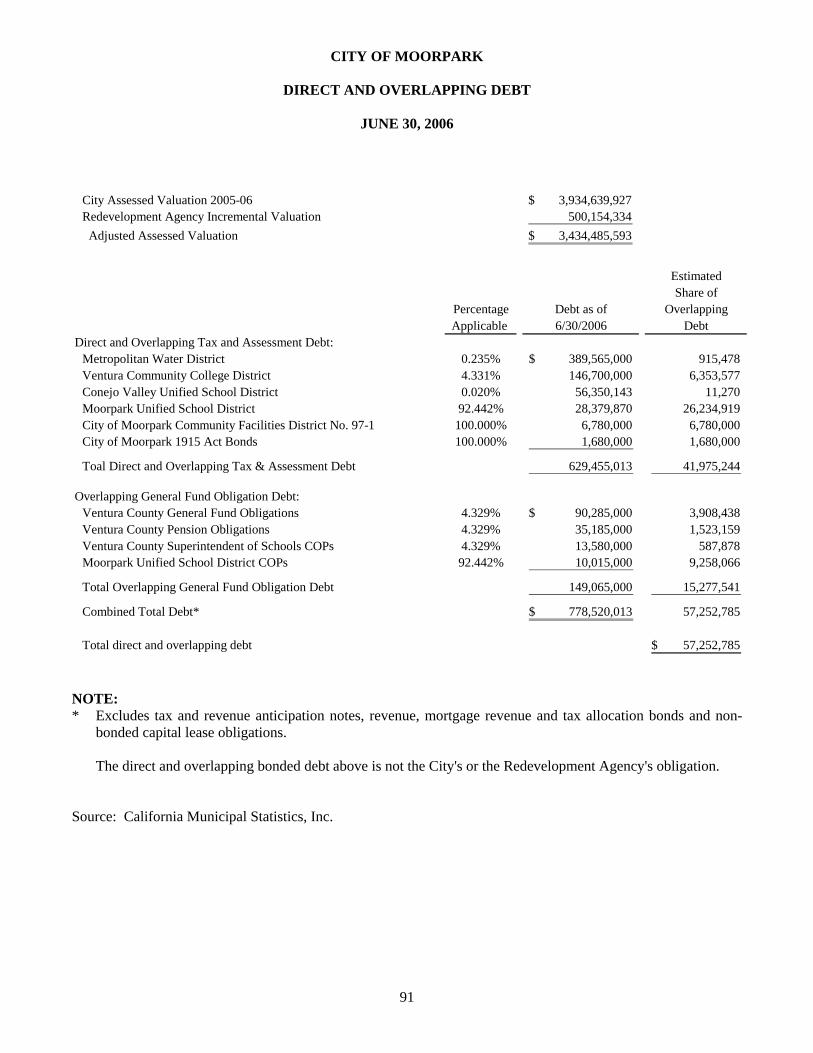
CITY OF MOORPARK
DIRECT AND OVERLAPPING DEBT
JUNE 30, 2006
91
City Assessed Valuation 2005-06 3,934,639,927$ Redevelopment Agency Incremental Valuation 500,154,334 Adjusted Assessed Valuation 3,434,485,593$
EstimatedShare of
Percentage Debt as of OverlappingApplicable 6/30/2006 Debt
Direct and Overlapping Tax and Assessment Debt:Metropolitan Water District 0.235% 389,565,000$ 915,478 Ventura Community College District 4.331% 146,700,000 6,353,577 Conejo Valley Unified School District 0.020% 56,350,143 11,270 Moorpark Unified School District 92.442% 28,379,870 26,234,919 City of Moorpark Community Facilities District No. 97-1 100.000% 6,780,000 6,780,000 City of Moorpark 1915 Act Bonds 100.000% 1,680,000 1,680,000
Toal Direct and Overlapping Tax & Assessment Debt 629,455,013 41,975,244
Overlapping General Fund Obligation Debt:Ventura County General Fund Obligations 4.329% 90,285,000$ 3,908,438 Ventura County Pension Obligations 4.329% 35,185,000 1,523,159 Ventura County Superintendent of Schools COPs 4.329% 13,580,000 587,878 Moorpark Unified School District COPs 92.442% 10,015,000 9,258,066
Total Overlapping General Fund Obligation Debt 149,065,000 15,277,541
Combined Total Debt* 778,520,013$ 57,252,785
Total direct and overlapping debt 57,252,785$
NOTE: * Excludes tax and revenue anticipation notes, revenue, mortgage revenue and tax allocation bonds and non-
bonded capital lease obligations.
The direct and overlapping bonded debt above is not the City's or the Redevelopment Agency's obligation. Source: California Municipal Statistics, Inc.
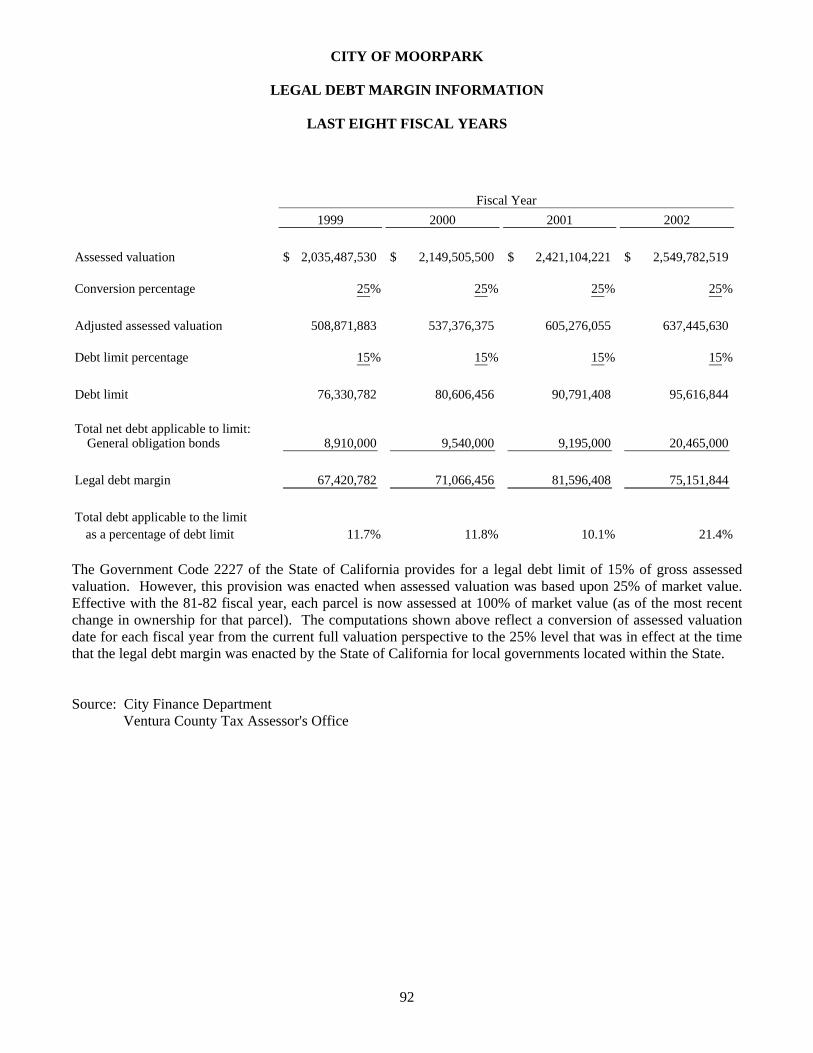
CITY OF MOORPARK
LEGAL DEBT MARGIN INFORMATION
LAST EIGHT FISCAL YEARS
92
1999 2000 2001 2002
Assessed valuation 2,035,487,530$ 2,149,505,500$ 2,421,104,221$ 2,549,782,519$
Conversion percentage 25% 25% 25% 25%
Adjusted assessed valuation 508,871,883 537,376,375 605,276,055 637,445,630
Debt limit percentage 15% 15% 15% 15%
Debt limit 76,330,782 80,606,456 90,791,408 95,616,844
Total net debt applicable to limit:General obligation bonds 8,910,000 9,540,000 9,195,000 20,465,000
Legal debt margin 67,420,782 71,066,456 81,596,408 75,151,844
Total debt applicable to the limit as a percentage of debt limit 11.7% 11.8% 10.1% 21.4%
Fiscal Year
The Government Code 2227 of the State of California provides for a legal debt limit of 15% of gross assessed valuation. However, this provision was enacted when assessed valuation was based upon 25% of market value. Effective with the 81-82 fiscal year, each parcel is now assessed at 100% of market value (as of the most recent change in ownership for that parcel). The computations shown above reflect a conversion of assessed valuation date for each fiscal year from the current full valuation perspective to the 25% level that was in effect at the time that the legal debt margin was enacted by the State of California for local governments located within the State. Source: City Finance Department
Ventura County Tax Assessor's Office
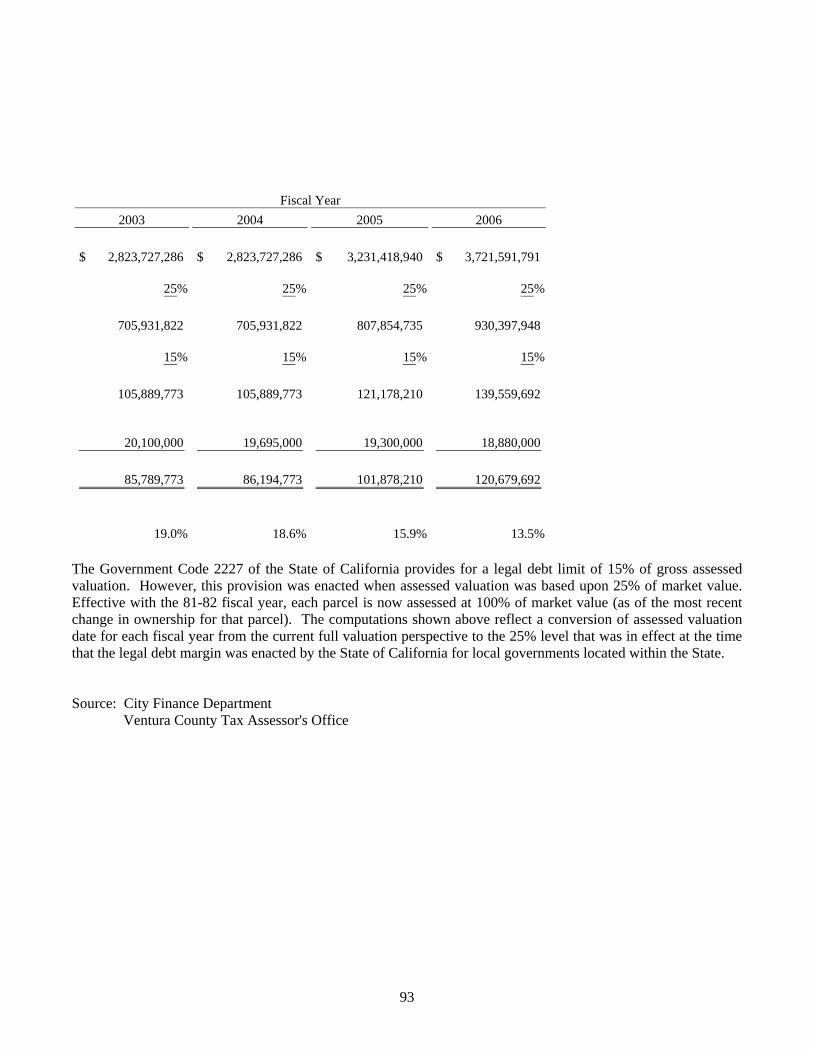
93
2003 2004 2005 2006
2,823,727,286$ 2,823,727,286$ 3,231,418,940$ 3,721,591,791$
25% 25% 25% 25%
705,931,822 705,931,822 807,854,735 930,397,948
15% 15% 15% 15%
105,889,773 105,889,773 121,178,210 139,559,692
20,100,000 19,695,000 19,300,000 18,880,000
85,789,773 86,194,773 101,878,210 120,679,692
19.0% 18.6% 15.9% 13.5%
Fiscal Year
The Government Code 2227 of the State of California provides for a legal debt limit of 15% of gross assessed valuation. However, this provision was enacted when assessed valuation was based upon 25% of market value. Effective with the 81-82 fiscal year, each parcel is now assessed at 100% of market value (as of the most recent change in ownership for that parcel). The computations shown above reflect a conversion of assessed valuation date for each fiscal year from the current full valuation perspective to the 25% level that was in effect at the time that the legal debt margin was enacted by the State of California for local governments located within the State. Source: City Finance Department
Ventura County Tax Assessor's Office
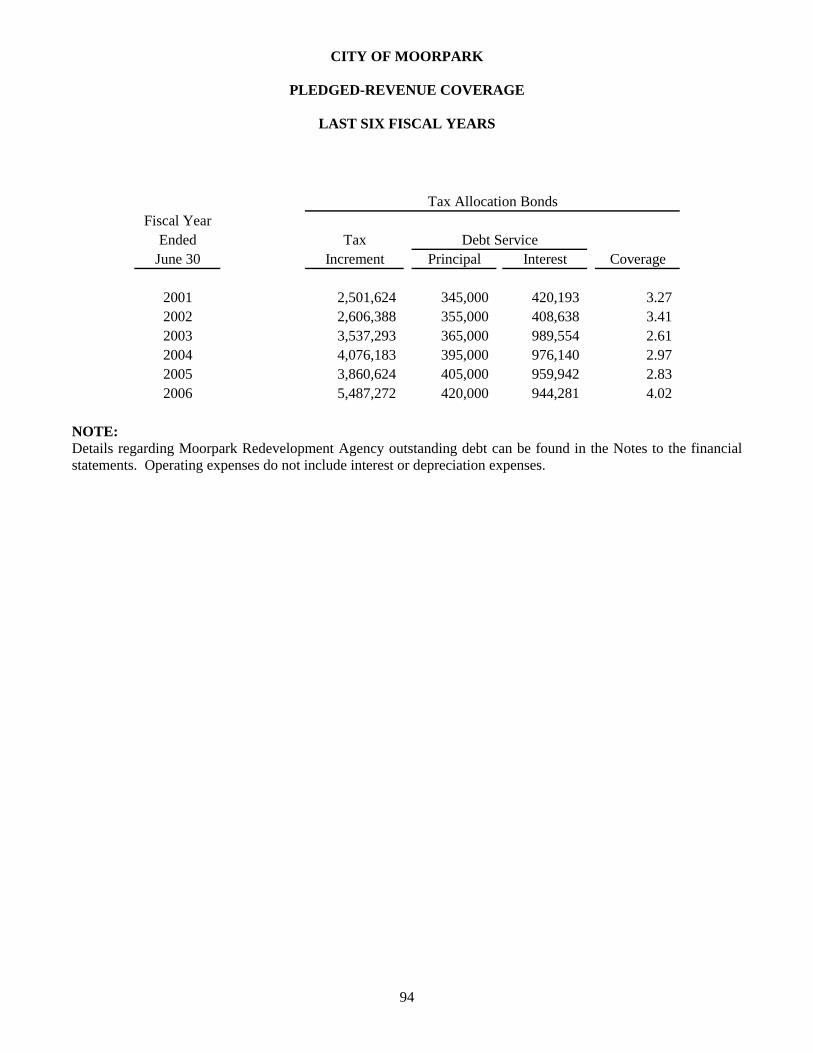
CITY OF MOORPARK
PLEDGED-REVENUE COVERAGE
LAST SIX FISCAL YEARS
94
Fiscal YearEnded Tax
June 30 Increment Principal Interest Coverage
2001 2,501,624 345,000 420,193 3.27 2002 2,606,388 355,000 408,638 3.41 2003 3,537,293 365,000 989,554 2.61 2004 4,076,183 395,000 976,140 2.97 2005 3,860,624 405,000 959,942 2.83 2006 5,487,272 420,000 944,281 4.02
Tax Allocation Bonds
Debt Service
NOTE: Details regarding Moorpark Redevelopment Agency outstanding debt can be found in the Notes to the financial statements. Operating expenses do not include interest or depreciation expenses.
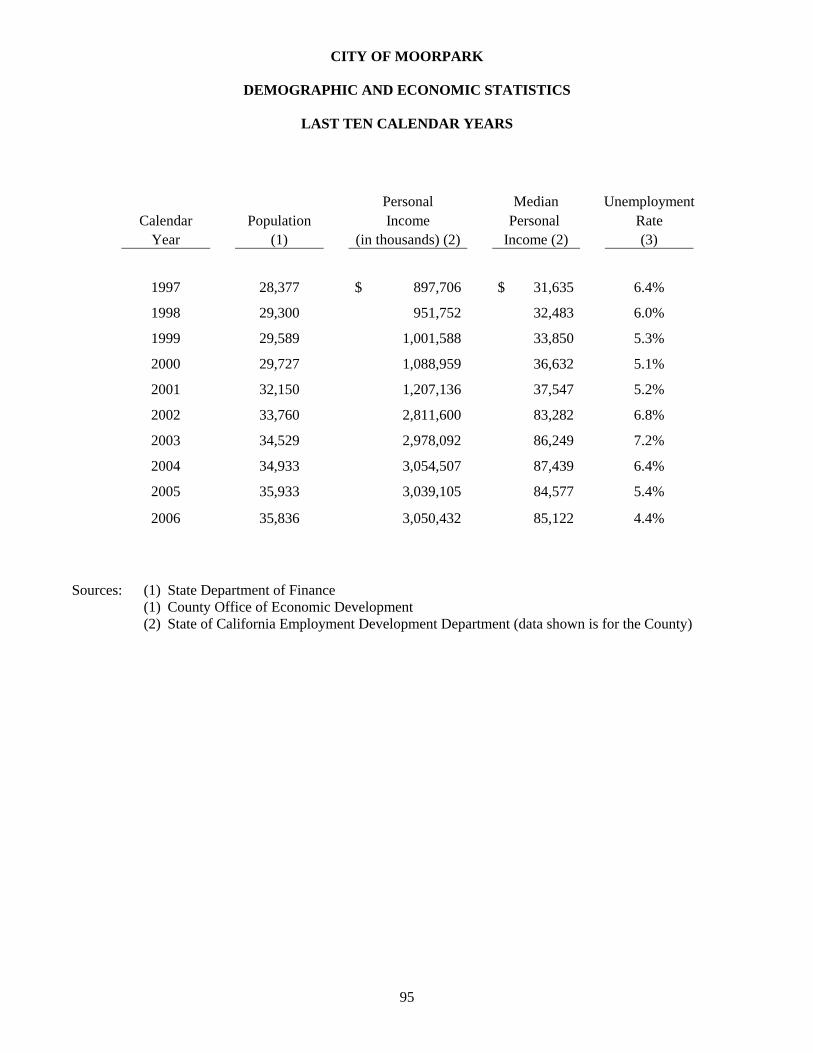
CITY OF MOORPARK
DEMOGRAPHIC AND ECONOMIC STATISTICS
LAST TEN CALENDAR YEARS
95
Personal Median UnemploymentCalendar Population Income Personal Rate
Year (1) (in thousands) (2) Income (2) (3)
1997 28,377 897,706$ 31,635$ 6.4%
1998 29,300 951,752 32,483 6.0%
1999 29,589 1,001,588 33,850 5.3% 2000 29,727 1,088,959 36,632 5.1% 2001 32,150 1,207,136 37,547 5.2% 2002 33,760 2,811,600 83,282 6.8% 2003 34,529 2,978,092 86,249 7.2% 2004 34,933 3,054,507 87,439 6.4% 2005 35,933 3,039,105 84,577 5.4%
2006 35,836 3,050,432 85,122 4.4%
Sources: (1) State Department of Finance
(1) County Office of Economic Development (2) State of California Employment Development Department (data shown is for the County)
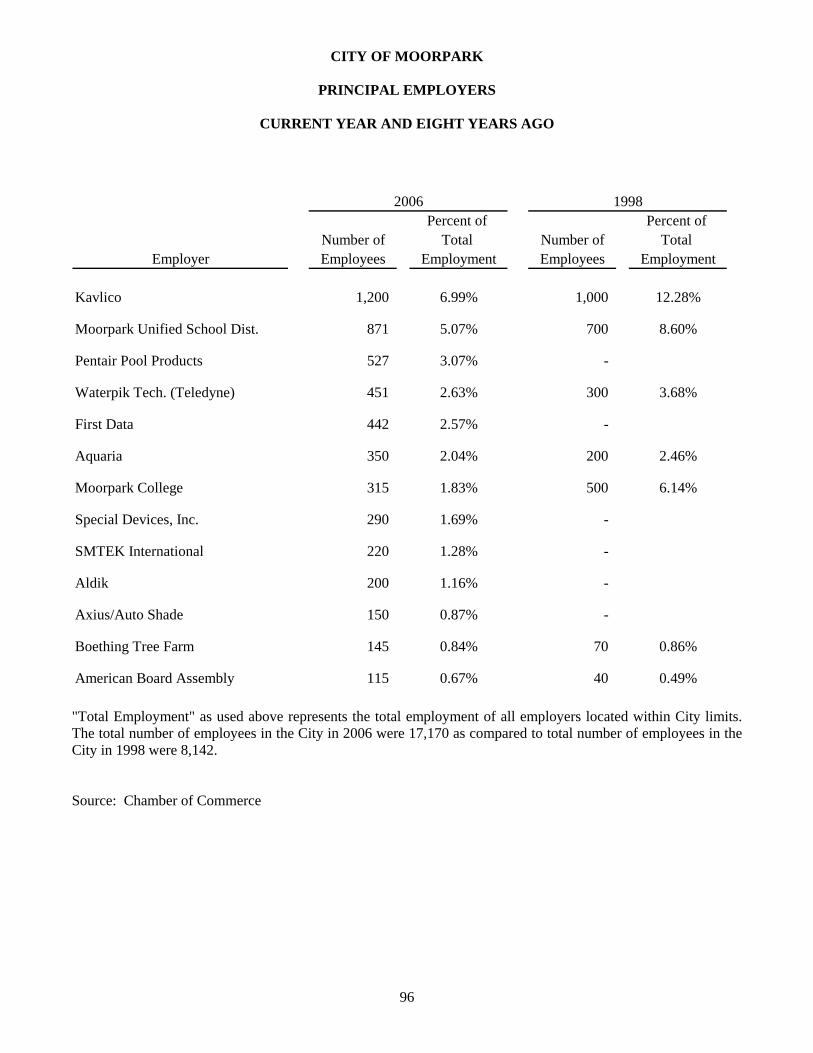
CITY OF MOORPARK
PRINCIPAL EMPLOYERS
CURRENT YEAR AND EIGHT YEARS AGO
96
Percent of Percent of Number of Total Number of Total
Employer Employees Employment Employees Employment
Kavlico 1,200 6.99% 1,000 12.28%
Moorpark Unified School Dist. 871 5.07% 700 8.60%
Pentair Pool Products 527 3.07% -
Waterpik Tech. (Teledyne) 451 2.63% 300 3.68%
First Data 442 2.57% -
Aquaria 350 2.04% 200 2.46%
Moorpark College 315 1.83% 500 6.14%
Special Devices, Inc. 290 1.69% -
SMTEK International 220 1.28% -
Aldik 200 1.16% -
Axius/Auto Shade 150 0.87% -
Boething Tree Farm 145 0.84% 70 0.86%
American Board Assembly 115 0.67% 40 0.49%
2006 1998
"Total Employment" as used above represents the total employment of all employers located within City limits. The total number of employees in the City in 2006 were 17,170 as compared to total number of employees in the City in 1998 were 8,142. Source: Chamber of Commerce
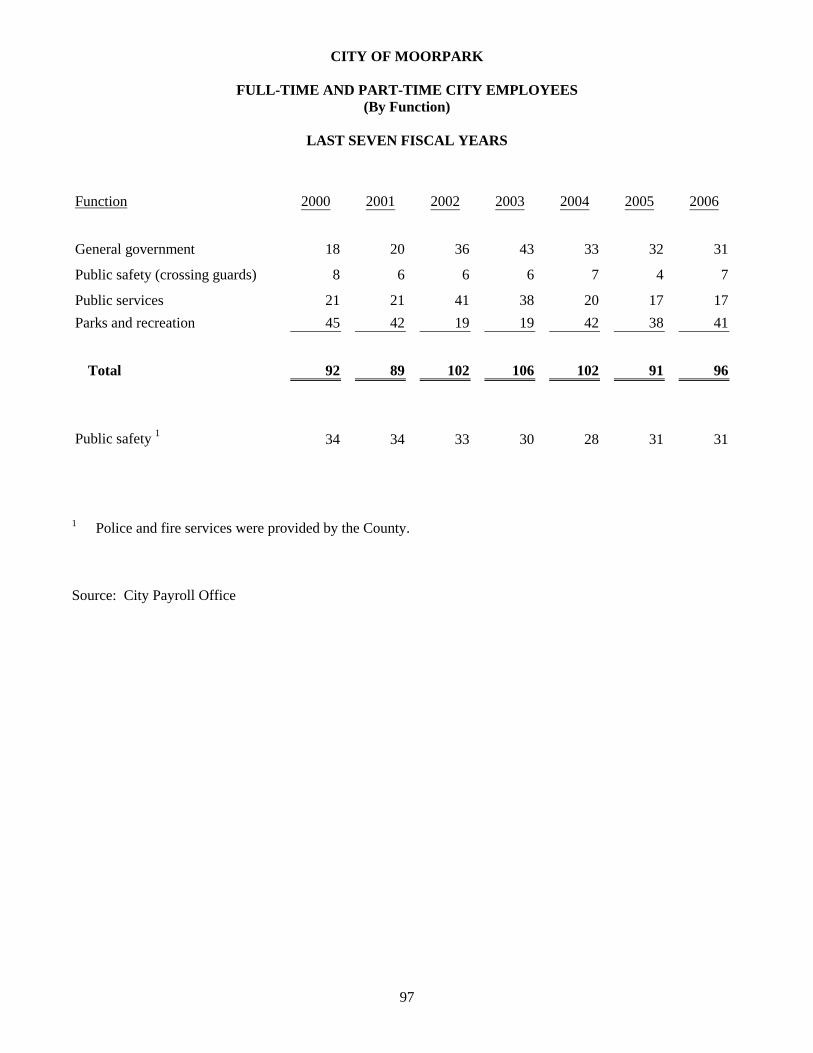
CITY OF MOORPARK
FULL-TIME AND PART-TIME CITY EMPLOYEES (By Function)
LAST SEVEN FISCAL YEARS
97
Function 2000 2001 2002 2003 2004 2005 2006
General government 18 20 36 43 33 32 31
Public safety (crossing guards) 8 6 6 6 7 4 7
Public services 21 21 41 38 20 17 17 Parks and recreation 45 42 19 19 42 38 41
Total 92 89 102 106 102 91 96
Public safety 1 34 34 33 30 28 31 31
1 Police and fire services were provided by the County. Source: City Payroll Office
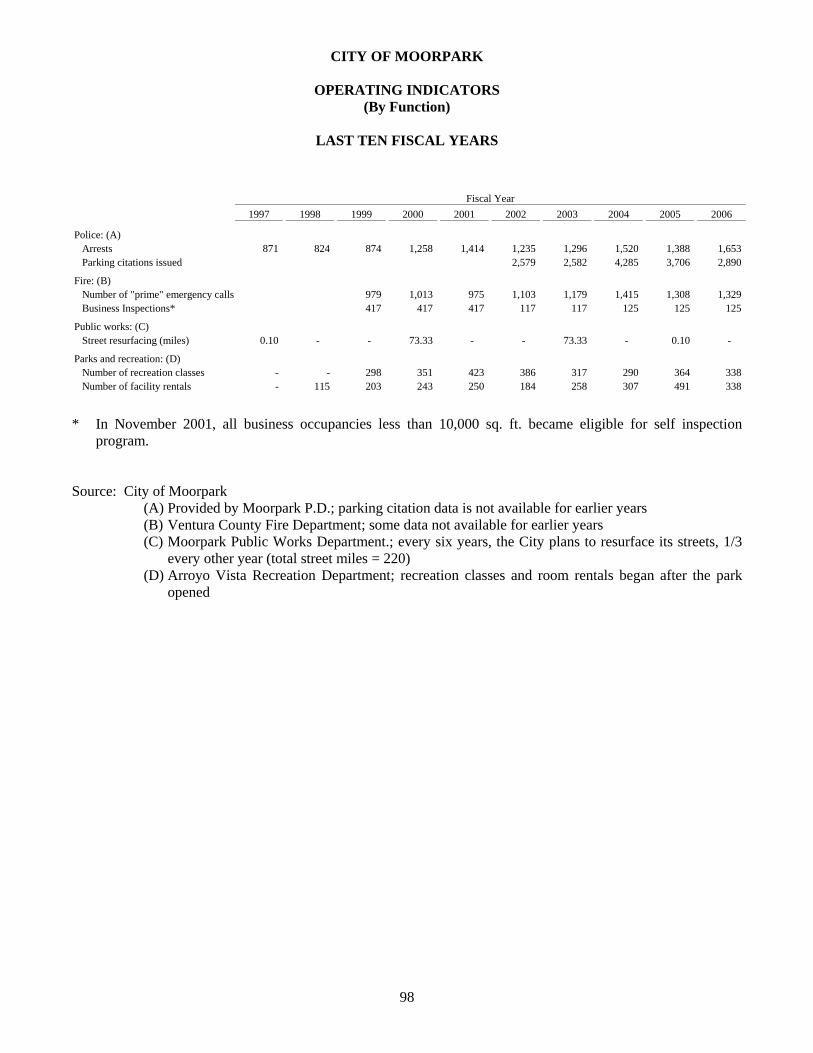
CITY OF MOORPARK
OPERATING INDICATORS (By Function)
LAST TEN FISCAL YEARS
98
1997 1998 1999 2000 2001 2002 2003 2004 2005 2006
Police: (A)Arrests 871 824 874 1,258 1,414 1,235 1,296 1,520 1,388 1,653 Parking citations issued 2,579 2,582 4,285 3,706 2,890
Fire: (B)Number of "prime" emergency calls 979 1,013 975 1,103 1,179 1,415 1,308 1,329 Business Inspections* 417 417 417 117 117 125 125 125
Public works: (C) Street resurfacing (miles) 0.10 - - 73.33 - - 73.33 - 0.10 -
Parks and recreation: (D)Number of recreation classes - - 298 351 423 386 317 290 364 338 Number of facility rentals - 115 203 243 250 184 258 307 491 338
Fiscal Year
* In November 2001, all business occupancies less than 10,000 sq. ft. became eligible for self inspection
program. Source: City of Moorpark
(A) Provided by Moorpark P.D.; parking citation data is not available for earlier years (B) Ventura County Fire Department; some data not available for earlier years (C) Moorpark Public Works Department.; every six years, the City plans to resurface its streets, 1/3
every other year (total street miles = 220) (D) Arroyo Vista Recreation Department; recreation classes and room rentals began after the park
opened
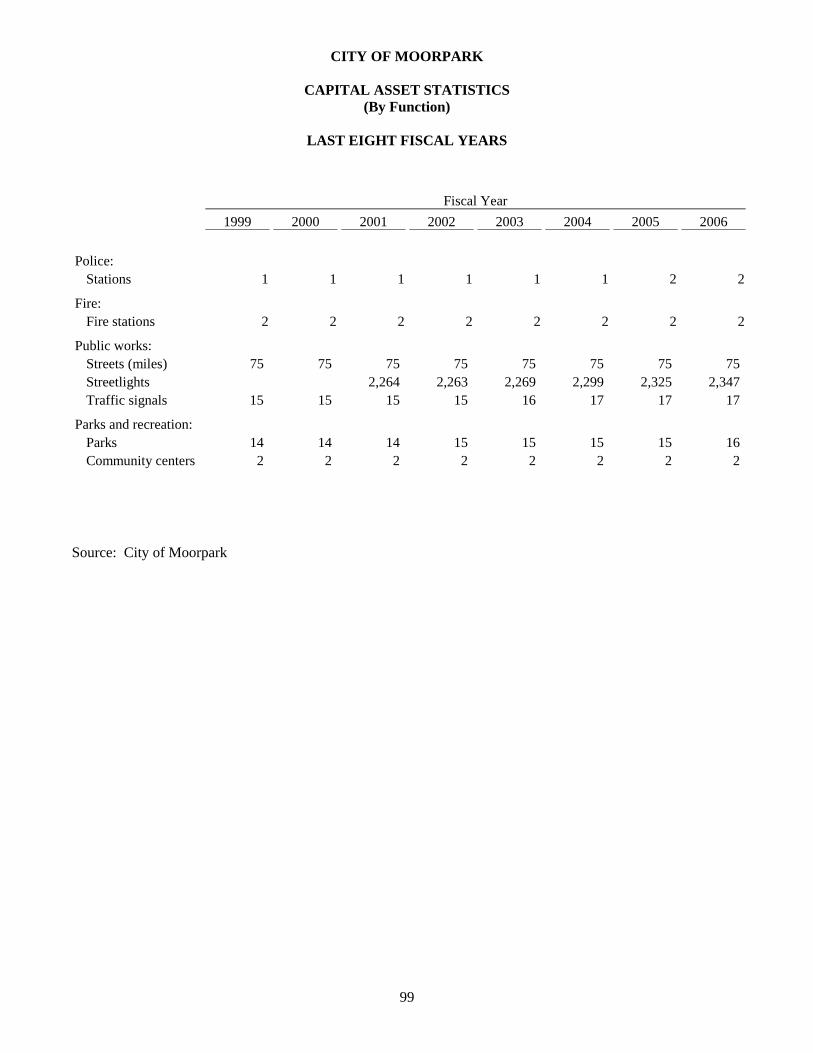
CITY OF MOORPARK
CAPITAL ASSET STATISTICS (By Function)
LAST EIGHT FISCAL YEARS
99
1999 2000 2001 2002 2003 2004 2005 2006
Police:Stations 1 1 1 1 1 1 2 2
Fire:Fire stations 2 2 2 2 2 2 2 2
Public works:Streets (miles) 75 75 75 75 75 75 75 75 Streetlights 2,264 2,263 2,269 2,299 2,325 2,347 Traffic signals 15 15 15 15 16 17 17 17
Parks and recreation:Parks 14 14 14 15 15 15 15 16 Community centers 2 2 2 2 2 2 2 2
Fiscal Year
Source: City of Moorpark